Bolivia Country Study on Urban Development Opportunities Client: Swiss Agency for Development and Cooperation – SDC, Bolivia Consultant: Roberto Tejada Ponce April 2017 Contents Executive Summary i 1. Country Context and Urbanization Process 1.1 Characteristics of urbanization, urban growth and poverty in Bolivia 1 1.2 Trends of urban development in Bolivia 4 1.3 National legal and institutional influence on urban development 7 1.4 Rural-urban linkages in poverty reduction 9 1.5 Poverty related challenges related to urbanization processes in Bolivia 11 2. Other Donors, main actors, and SDC’s Activities on Urban Development 2.1. Other donors and main actors’ interventions in urban development 13 2.2. Rate of success in other donor and main actors’ interventions 14 2.3. Unaddressed issues and challenges 15 2.4. SDC’s strategy reach on urban issues 15 2.5. Assessment of SDC’s interventions 18 2.6. Opportunities in urban development for SDC 19 3. Recommendations 3.1. Recommended areas of action for SDC 20 3.2 Recommended fields of action related to SECO’s main areas of expertise 20 3.3. Recommendations to integrate urban dev. in the new cooperation strategy 21 References 27 Annexes 28

Welcome message from author
This document is posted to help you gain knowledge. Please leave a comment to let me know what you think about it! Share it to your friends and learn new things together.
Transcript
Bolivia Country Study on Urban Development Opportunities
Client: Swiss Agency for Development and Cooperation – SDC, Bolivia
Consultant: Roberto Tejada Ponce
April 2017
Contents
Executive Summary i
1. Country Context and Urbanization Process
1.1 Characteristics of urbanization, urban growth and poverty in Bolivia 1
1.2 Trends of urban development in Bolivia 4
1.3 National legal and institutional influence on urban development 7
1.4 Rural-urban linkages in poverty reduction 9
1.5 Poverty related challenges related to urbanization processes in Bolivia 11
2. Other Donors, main actors, and SDC’s Activities on Urban Development
2.1. Other donors and main actors’ interventions in urban development 13
2.2. Rate of success in other donor and main actors’ interventions 14
2.3. Unaddressed issues and challenges 15
2.4. SDC’s strategy reach on urban issues 15
2.5. Assessment of SDC’s interventions 18
2.6. Opportunities in urban development for SDC 19
3. Recommendations
3.1. Recommended areas of action for SDC 20
3.2 Recommended fields of action related to SECO’s main areas of expertise 20
3.3. Recommendations to integrate urban dev. in the new cooperation strategy 21
References 27
Annexes 28

2
List of Tables
1 - Systems of Cities in Bolivia
2 - Labor Income and Informality
3 - Stages in Urban Development
4 - Prioritization of Urban Topics
5 - Main Programs with Urban Relevance Implemented by Donors
6 - Urban Relevance of Programs under SDC Bolivia Cooperation Strategy
7 - Urban Assessment of Programs under SDC Bolivia Cooperation Strategy
8 - Prioritized Areas per New Dispatch
List of Graphs
1 - Urbanization and Growth
2 - Change in Age Composition in Urban and Rural Areas
3 - Population Gains and Losses
4 - Poverty Projection
5 - Evolution of Urban and Rural Poverty
6 - Poverty by Age Group
7 - Urban and Rural Population - Projections
8 - From Rural to Urban in the Central Axis
9 - The Population-based Urban Process
10 - Urban Growth vs. Geographical Density: Case of Riberalta
11 - Rates of Participation in the Labor Market
12 - Stages in Urban Development
13 - Quality Gaps Within Served Population
14 - Opportunity Framework for Youth
15 - SDC’s Stock in Urban Development
16 - Suggested Adjustment to SDC’s Strategic Approach
17 - Suggested Approach to Implement an Urban Strategy
i
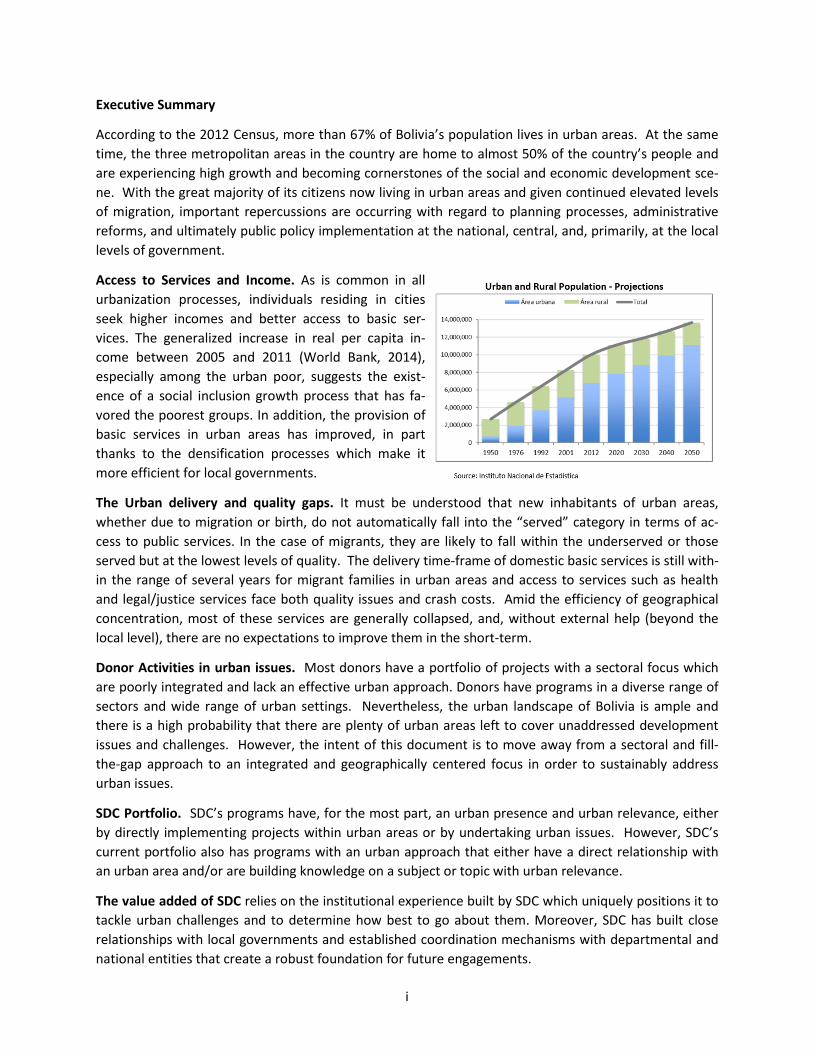
Executive Summary
According to the 2012 Census, more than 67% of Bolivia’s population lives in urban areas. At the same
time, the three metropolitan areas in the country are home to almost 50% of the country’s people and
are experiencing high growth and becoming cornerstones of the social and economic development sce-
ne. With the great majority of its citizens now living in urban areas and given continued elevated levels
of migration, important repercussions are occurring with regard to planning processes, administrative
reforms, and ultimately public policy implementation at the national, central, and, primarily, at the local
levels of government.
Access to Services and Income. As is common in all
urbanization processes, individuals residing in cities
seek higher incomes and better access to basic ser-
vices. The generalized increase in real per capita in-
come between 2005 and 2011 (World Bank, 2014),
especially among the urban poor, suggests the exist-
ence of a social inclusion growth process that has fa-
vored the poorest groups. In addition, the provision of
basic services in urban areas has improved, in part
thanks to the densification processes which make it
more efficient for local governments.
The Urban delivery and quality gaps. It must be understood that new inhabitants of urban areas,
whether due to migration or birth, do not automatically fall into the “served” category in terms of ac-
cess to public services. In the case of migrants, they are likely to fall within the underserved or those
served but at the lowest levels of quality. The delivery time-frame of domestic basic services is still with-
in the range of several years for migrant families in urban areas and access to services such as health
and legal/justice services face both quality issues and crash costs. Amid the efficiency of geographical
concentration, most of these services are generally collapsed, and, without external help (beyond the
local level), there are no expectations to improve them in the short-term.
Donor Activities in urban issues. Most donors have a portfolio of projects with a sectoral focus which
are poorly integrated and lack an effective urban approach. Donors have programs in a diverse range of
sectors and wide range of urban settings. Nevertheless, the urban landscape of Bolivia is ample and
there is a high probability that there are plenty of urban areas left to cover unaddressed development
issues and challenges. However, the intent of this document is to move away from a sectoral and fill-
the-gap approach to an integrated and geographically centered focus in order to sustainably address
urban issues.
SDC Portfolio. SDC’s programs have, for the most part, an urban presence and urban relevance, either
by directly implementing projects within urban areas or by undertaking urban issues. However, SDC’s
current portfolio also has programs with an urban approach that either have a direct relationship with
an urban area and/or are building knowledge on a subject or topic with urban relevance.
The value added of SDC relies on the institutional experience built by SDC which uniquely positions it to
tackle urban challenges and to determine how best to go about them. Moreover, SDC has built close
relationships with local governments and established coordination mechanisms with departmental and
national entities that create a robust foundation for future engagements.
ii
Recommendations. The assistance landscape of urban projects is wide open, both geographically and
thematically, providing SDC the opportunity to focus on the most relevant topics: Governance in the
provision of public services, Decent work, and Vulnerabilities as a result of climate change, including Risk
Mitigation.
To successfully implement a portfolio with an urban approach, SDC must shift approaches and reach out
to build new alliances to generate impact in urban, peri urban and rural areas. Therefore, a change in
paradigm is required to evolve from the current sectoral approach to an integrated one that responds to
the nature of urban issues.
SDC’s Upcoming Strategy. To adopt an urban approach, SDC must opt for a progressive and differenti-
ated approach that will identify partners and stakeholders in the prioritized urban areas. The Strategy
should establish a specific subset of objectives and indicators for the urban approach, as the current and
future domains coincide with urban priorities.
Selection of Urban Areas. The general criteria and approach in selecting where SDC should direct its
assistance must be based on a set of criteria that includes poverty levels (both in urban and connected
peri-urban and rural areas), opportunities for rural-urban linkages, population size, the overall availabil-
ity and magnitude of financial resources, and its areas of cooperation strength. Given that SDC has ongo-
ing operations in Bolivia and that the new Strategy will provide continuity to its programs, it is advisable
to maintain the current geographical presence.
An Initial Approach. A qualitative analysis1 of SDC’s thematic expertise and geographical presence aims
to maximize the implementation of current programs with urban relevance in urban areas, plus other
variables identifying opportunities to work, primarily in Oruro, Sucre and Potosí. Tarija and Trinidad
could also be considered as strategic options. Additionally, a set of small2 urban areas3 with a combina-
tion of high population growth and high levels of poverty where SDC already has programs under im-
plementation may be considered for a regional intervention focusing on those with geographical prox-
imity.
Operational Recommendations. In addition to establishing a Strategic Plan and Monitoring and Evalua-
tion tools for an urban approach, SDC must establish an organizational framework for the coordination
of activities and the definition of impact chains to minimize risks and maximize results.
Portfolio and project objectives. SDC’s urban approach must be integrated and focus on Access to Pub-
lic Services4 and on Employment and Income Generation. Climate Change and Resilience should be
mandatory crosscutting themes in every urban program, with a special focus on Environmental Impact
Mitigation and Urban Risk Reduction. Additionally, mainstreaming food supply into the thematic area of
employment and income generation is recommended, as is mainstreaming sustainable access to safe
drinking water into the provision of public services.
Partnerships. Alliances with local stakeholders, grassroots organizations, national sectoral entities, and
local governments are imperative to build constructive relationships over time.
1 The qualitative analysis has been prepared for discussion purposes, as a more detailed quantitative analysis with
more variables and exact criteria should be used for actual design and implementation of an urban approach 2 With population between 20 to 100 thousand
3 Yapacaní, San Julián, Ascensión de Guarayos, Entre Ríos and Puerto Villarroel
4 with an emphasis on justice, gender and youth, human rights, equal opportunities and citizenship
1
1. Country Context and Urbanization Process
1.1 Characteristics of urbanization, urban growth and poverty in Bolivia
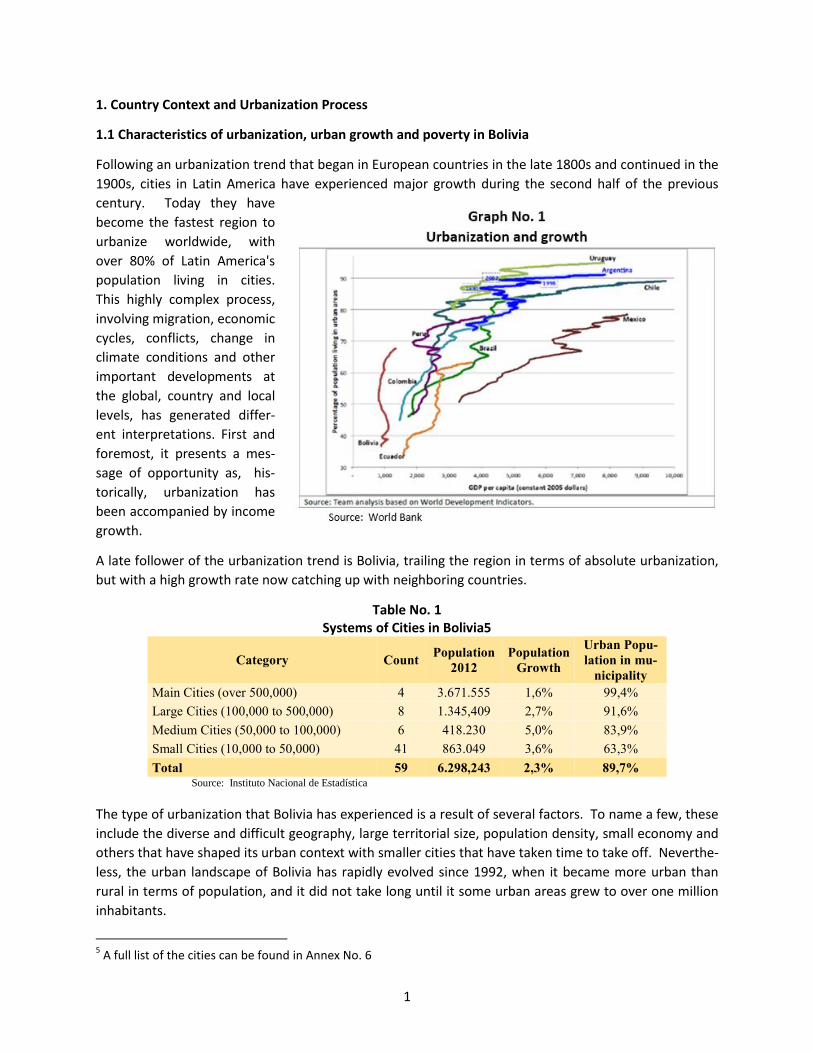
Following an urbanization trend that began in European countries in the late 1800s and continued in the
1900s, cities in Latin America have experienced major growth during the second half of the previous
century. Today they have
become the fastest region to
urbanize worldwide, with
over 80% of Latin America's
population living in cities.
This highly complex process,
involving migration, economic
cycles, conflicts, change in
climate conditions and other
important developments at
the global, country and local
levels, has generated differ-
ent interpretations. First and
foremost, it presents a mes-
sage of opportunity as, his-
torically, urbanization has
been accompanied by income
growth.
A late follower of the urbanization trend is Bolivia, trailing the region in terms of absolute urbanization,
but with a high growth rate now catching up with neighboring countries.
Table No. 1 Systems of Cities in Bolivia5
Category Count Population
2012
Population
Growth
Urban Popu-
lation in mu-
nicipality
Main Cities (over 500,000) 4 3.671.555 1,6% 99,4%
Large Cities (100,000 to 500,000) 8 1.345,409 2,7% 91,6%
Medium Cities (50,000 to 100,000) 6 418.230 5,0% 83,9%
Small Cities (10,000 to 50,000) 41 863.049 3,6% 63,3%
Total 59 6.298,243 2,3% 89,7% Source: Instituto Nacional de Estadística
The type of urbanization that Bolivia has experienced is a result of several factors. To name a few, these
include the diverse and difficult geography, large territorial size, population density, small economy and
others that have shaped its urban context with smaller cities that have taken time to take off. Neverthe-
less, the urban landscape of Bolivia has rapidly evolved since 1992, when it became more urban than
rural in terms of population, and it did not take long until it some urban areas grew to over one million
inhabitants.
5 A full list of the cities can be found in Annex No. 6
2
While there is not a definite consensus on how cities should be grouped, Table No. 1 above proposes a
scale to differentiate cities by population size. At first glance, it would be reasonable to conclude that
the larger cities are growing more slowly and have reached their rate of urbanization has probably
yielded. More interestingly, cities with populations under 100,000 are growing faster and still have
room for further urbanization. The table does not show, however, that many of these smaller cities are
in fact part of larger metropolitan areas of over a million.
Metropolitan areas in Bolivia now account for almost 50% of the population in the country, experiencing
high growth in the periphery primarily due to internal migration and progressively becoming corner-
stones of the development process of the country. The characteristics of most other cities in Bolivia,
such as border and capital cities, are determined primarily by the geographical and political conditions
that affect their growth (or lack thereof), by the economy, and by living conditions.
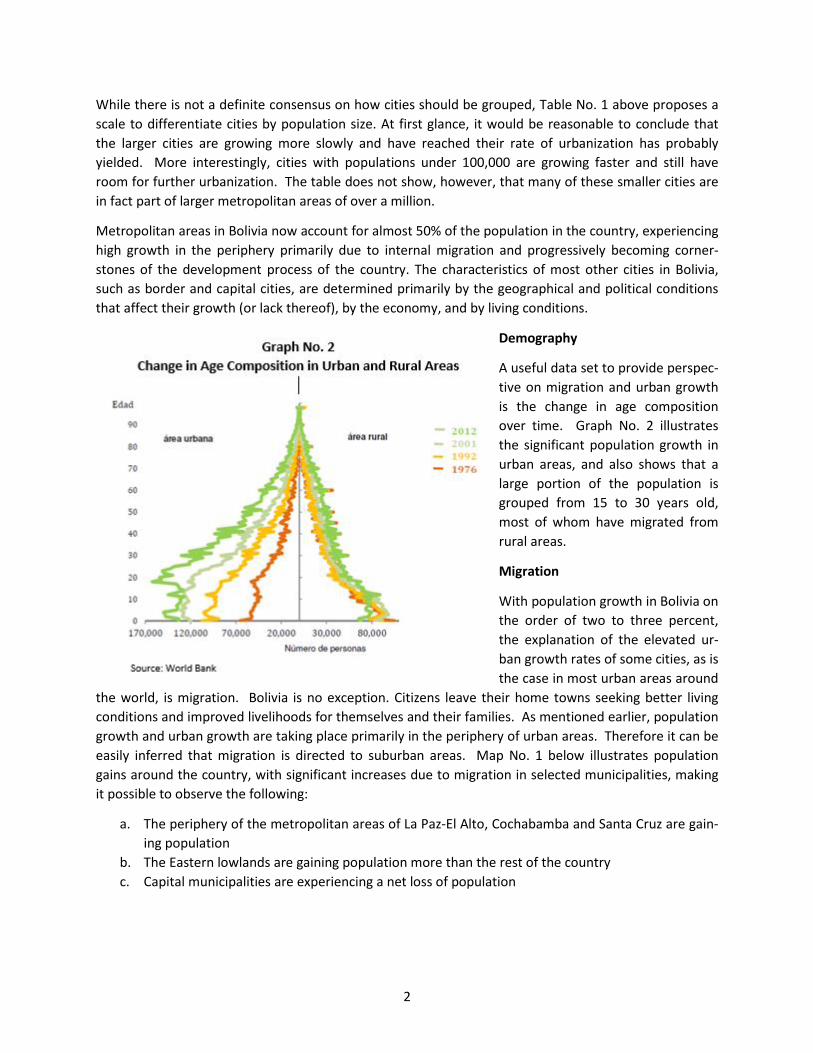
Demography
A useful data set to provide perspec-
tive on migration and urban growth
is the change in age composition
over time. Graph No. 2 illustrates
the significant population growth in
urban areas, and also shows that a
large portion of the population is
grouped from 15 to 30 years old,
most of whom have migrated from
rural areas.
Migration
With population growth in Bolivia on
the order of two to three percent,
the explanation of the elevated ur-
ban growth rates of some cities, as is
the case in most urban areas around
the world, is migration. Bolivia is no exception. Citizens leave their home towns seeking better living
conditions and improved livelihoods for themselves and their families. As mentioned earlier, population
growth and urban growth are taking place primarily in the periphery of urban areas. Therefore it can be
easily inferred that migration is directed to suburban areas. Map No. 1 below illustrates population
gains around the country, with significant increases due to migration in selected municipalities, making
it possible to observe the following:
a. The periphery of the metropolitan areas of La Paz-El Alto, Cochabamba and Santa Cruz are gain-
ing population
b. The Eastern lowlands are gaining population more than the rest of the country
c. Capital municipalities are experiencing a net loss of population
3
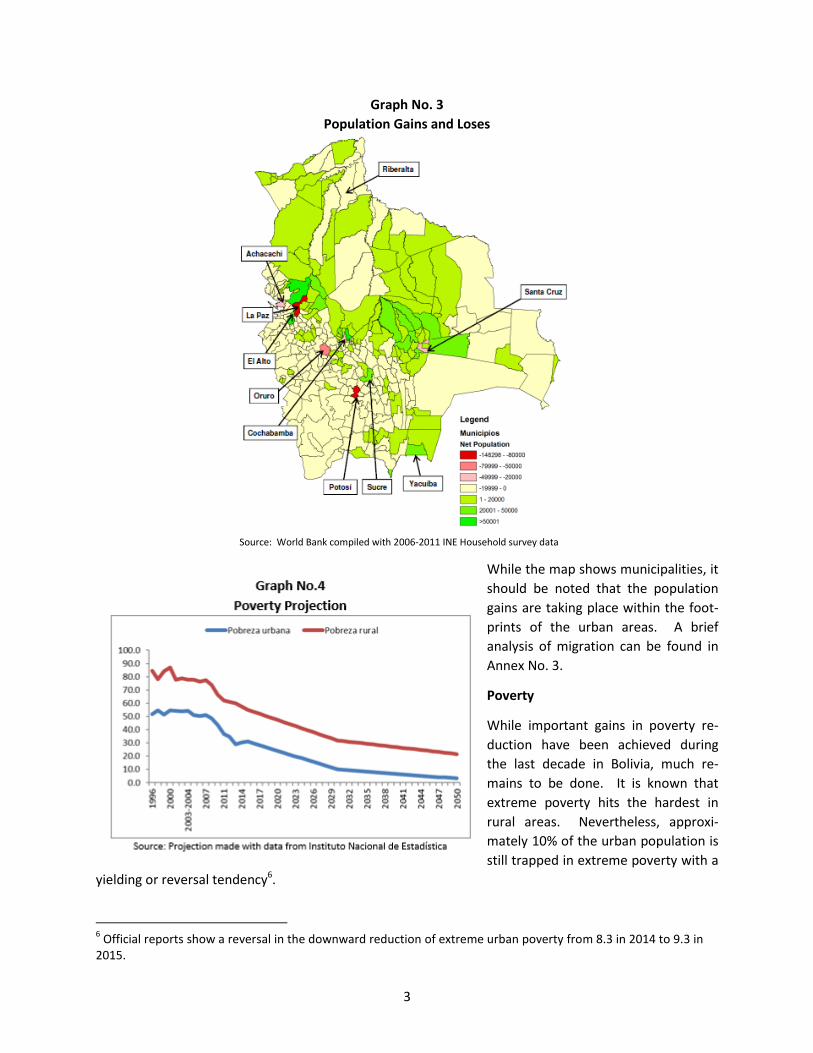
Graph No. 3
Population Gains and Loses
Source: World Bank compiled with 2006-2011 INE Household survey data
While the map shows municipalities, it
should be noted that the population
gains are taking place within the foot-
prints of the urban areas. A brief
analysis of migration can be found in
Annex No. 3.
Poverty
While important gains in poverty re-
duction have been achieved during
the last decade in Bolivia, much re-
mains to be done. It is known that
extreme poverty hits the hardest in
rural areas. Nevertheless, approxi-
mately 10% of the urban population is
still trapped in extreme poverty with a
yielding or reversal tendency6.
6 Official reports show a reversal in the downward reduction of extreme urban poverty from 8.3 in 2014 to 9.3 in
2015.
4
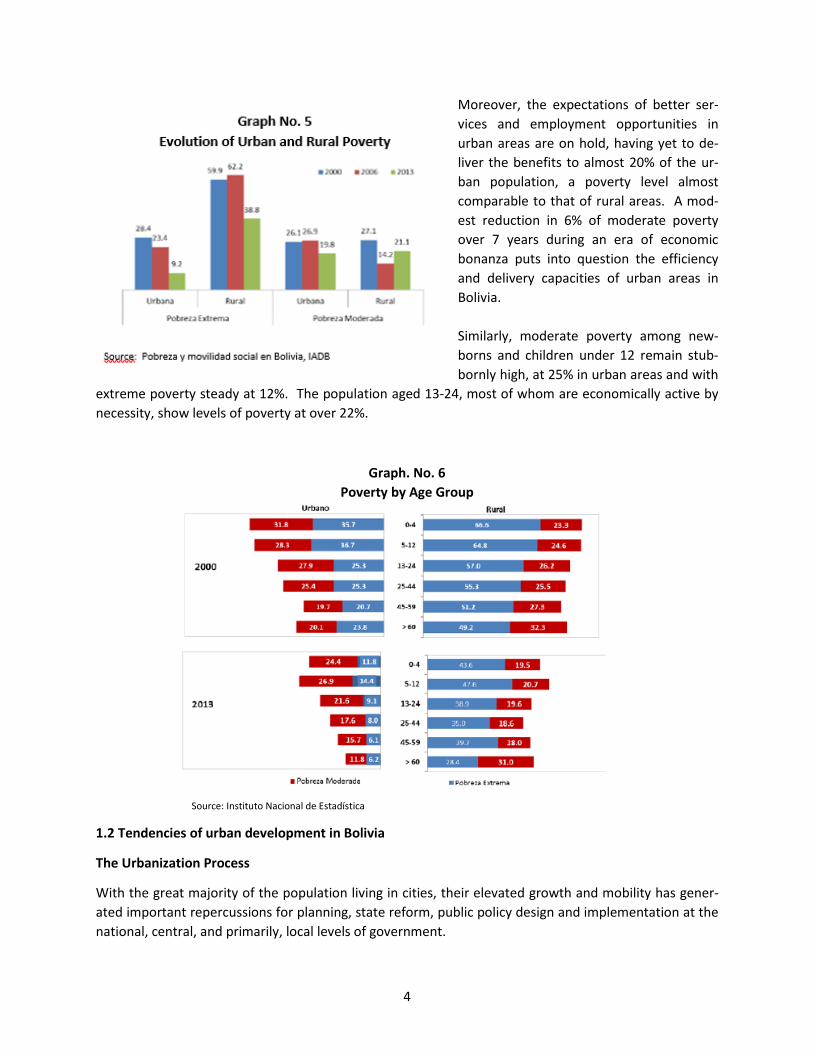
Moreover, the expectations of better ser-
vices and employment opportunities in
urban areas are on hold, having yet to de-
liver the benefits to almost 20% of the ur-
ban population, a poverty level almost
comparable to that of rural areas. A mod-
est reduction in 6% of moderate poverty
over 7 years during an era of economic
bonanza puts into question the efficiency
and delivery capacities of urban areas in
Bolivia.
Similarly, moderate poverty among new-
borns and children under 12 remain stub-
bornly high, at 25% in urban areas and with
extreme poverty steady at 12%. The population aged 13-24, most of whom are economically active by
necessity, show levels of poverty at over 22%.
Graph. No. 6
Poverty by Age Group
Source: Instituto Nacional de Estadística
1.2 Tendencies of urban development in Bolivia
The Urbanization Process
With the great majority of the population living in cities, their elevated growth and mobility has gener-
ated important repercussions for planning, state reform, public policy design and implementation at the
national, central, and primarily, local levels of government.
5
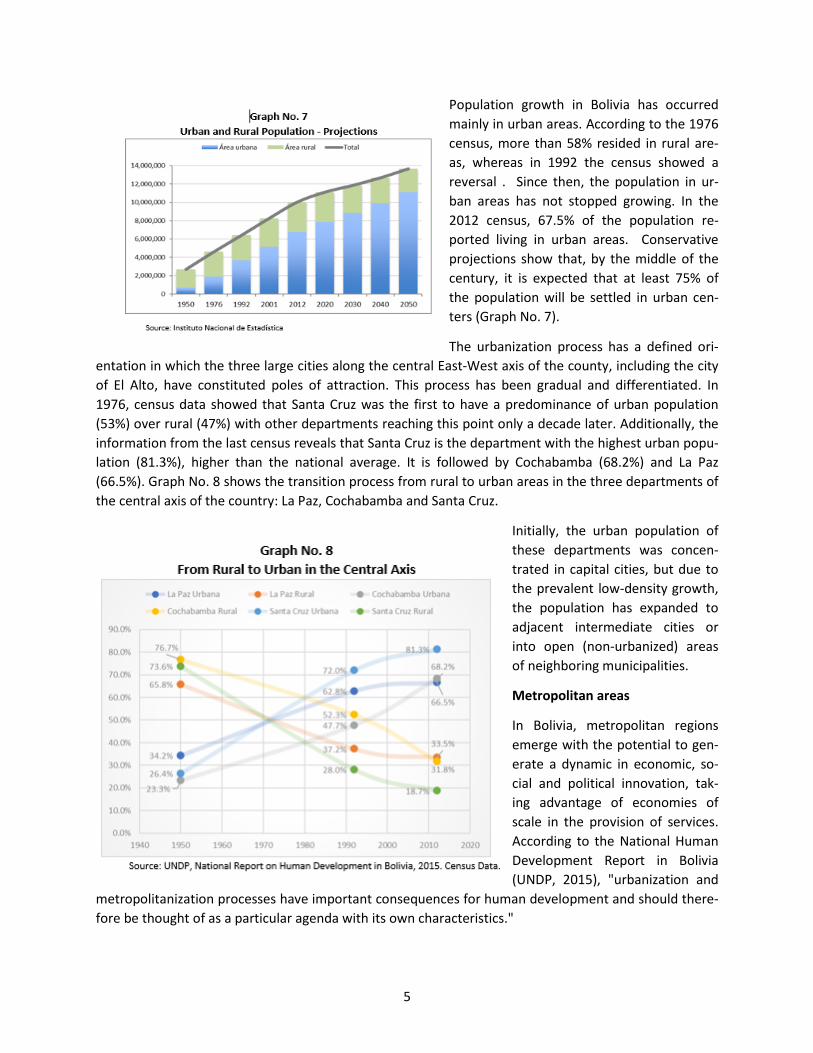
Population growth in Bolivia has occurred
mainly in urban areas. According to the 1976
census, more than 58% resided in rural are-
as, whereas in 1992 the census showed a
reversal . Since then, the population in ur-
ban areas has not stopped growing. In the
2012 census, 67.5% of the population re-
ported living in urban areas. Conservative
projections show that, by the middle of the
century, it is expected that at least 75% of
the population will be settled in urban cen-
ters (Graph No. 7).
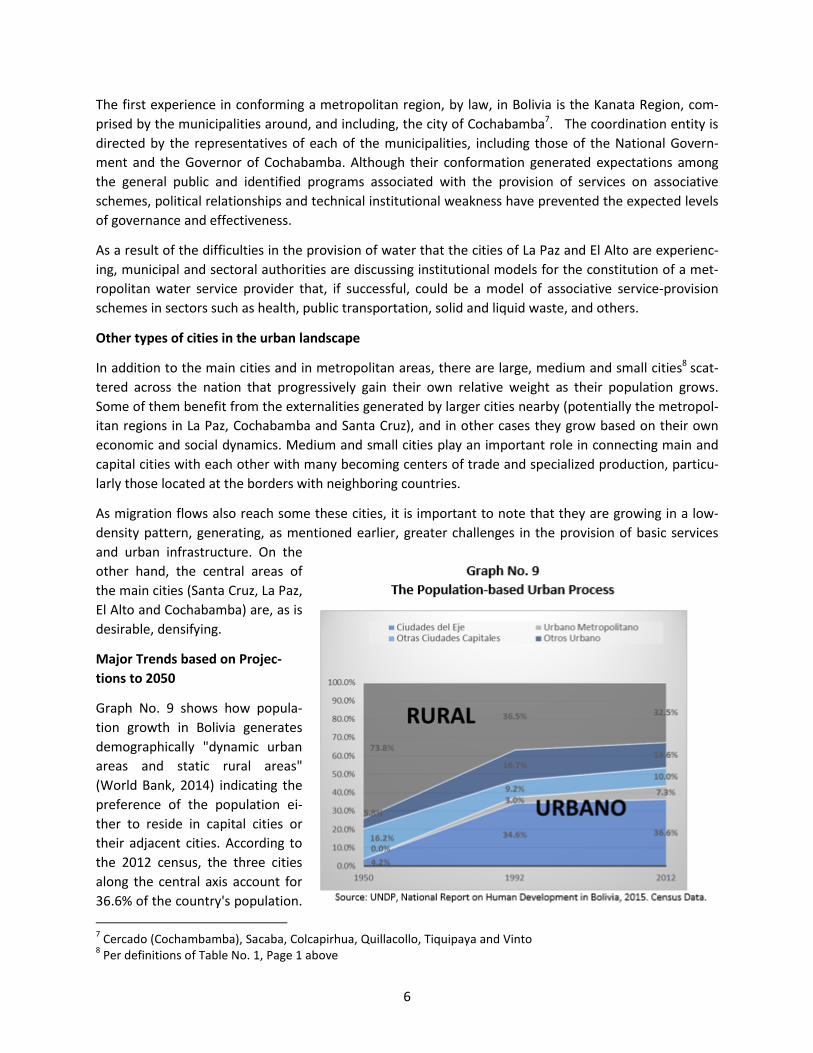
The urbanization process has a defined ori-
entation in which the three large cities along the central East-West axis of the county, including the city
of El Alto, have constituted poles of attraction. This process has been gradual and differentiated. In
1976, census data showed that Santa Cruz was the first to have a predominance of urban population
(53%) over rural (47%) with other departments reaching this point only a decade later. Additionally, the
information from the last census reveals that Santa Cruz is the department with the highest urban popu-
lation (81.3%), higher than the national average. It is followed by Cochabamba (68.2%) and La Paz
(66.5%). Graph No. 8 shows the transition process from rural to urban areas in the three departments of
the central axis of the country: La Paz, Cochabamba and Santa Cruz.
Initially, the urban population of
these departments was concen-
trated in capital cities, but due to
the prevalent low-density growth,
the population has expanded to
adjacent intermediate cities or
into open (non-urbanized) areas
of neighboring municipalities.
Metropolitan areas
In Bolivia, metropolitan regions
emerge with the potential to gen-
erate a dynamic in economic, so-
cial and political innovation, tak-
ing advantage of economies of
scale in the provision of services.
According to the National Human
Development Report in Bolivia
(UNDP, 2015), "urbanization and
metropolitanization processes have important consequences for human development and should there-
fore be thought of as a particular agenda with its own characteristics."
6
The first experience in conforming a metropolitan region, by law, in Bolivia is the Kanata Region, com-
prised by the municipalities around, and including, the city of Cochabamba7. The coordination entity is
directed by the representatives of each of the municipalities, including those of the National Govern-
ment and the Governor of Cochabamba. Although their conformation generated expectations among
the general public and identified programs associated with the provision of services on associative
schemes, political relationships and technical institutional weakness have prevented the expected levels
of governance and effectiveness.
As a result of the difficulties in the provision of water that the cities of La Paz and El Alto are experienc-
ing, municipal and sectoral authorities are discussing institutional models for the constitution of a met-
ropolitan water service provider that, if successful, could be a model of associative service-provision
schemes in sectors such as health, public transportation, solid and liquid waste, and others.
Other types of cities in the urban landscape
In addition to the main cities and in metropolitan areas, there are large, medium and small cities8 scat-
tered across the nation that progressively gain their own relative weight as their population grows.
Some of them benefit from the externalities generated by larger cities nearby (potentially the metropol-
itan regions in La Paz, Cochabamba and Santa Cruz), and in other cases they grow based on their own
economic and social dynamics. Medium and small cities play an important role in connecting main and
capital cities with each other with many becoming centers of trade and specialized production, particu-
larly those located at the borders with neighboring countries.
As migration flows also reach some these cities, it is important to note that they are growing in a low-
density pattern, generating, as mentioned earlier, greater challenges in the provision of basic services
and urban infrastructure. On the
other hand, the central areas of
the main cities (Santa Cruz, La Paz,
El Alto and Cochabamba) are, as is
desirable, densifying.
Major Trends based on Projec-
tions to 2050
Graph No. 9 shows how popula-
tion growth in Bolivia generates
demographically "dynamic urban
areas and static rural areas"
(World Bank, 2014) indicating the
preference of the population ei-
ther to reside in capital cities or
their adjacent cities. According to
the 2012 census, the three cities
along the central axis account for
36.6% of the country's population.
7 Cercado (Cochambamba), Sacaba, Colcapirhua, Quillacollo, Tiquipaya and Vinto
8 Per definitions of Table No. 1, Page 1 above
7
If the adjacent cities that conform the metropolitan areas are included, the urban footprint reaches
43.9%. When adding the remaining capital cities, this percentage rises to 53.9%, and to 67.5% when the
rest of the urban population is included.
As is common in all urbanization processes, individuals residing in cities seek higher incomes and better
access to basic services. The generalized increase in real per capita income between 2005 and 2011
(World Bank, 2014), especially among the urban poor, suggests the existence of a social inclusion growth
process that has favored the poorest groups. In addition, the provision of basic services in urban areas
has improved, in part, due to the densification processes which make it more efficient for local govern-
ments to provide services.
In this context, the growing process of urban expansion and/or densification generates challenges and
opportunities for national and local governments in the implementation of policies to achieve govern-
ance and institutional capacities for better basic services, promotion and job creation, and environmen-
tal protection. Furthermore, the prevalent poverty rates and the high vulnerability to natural disasters
due to climate change must be considered transversally in the design and implementation of public poli-
cies.
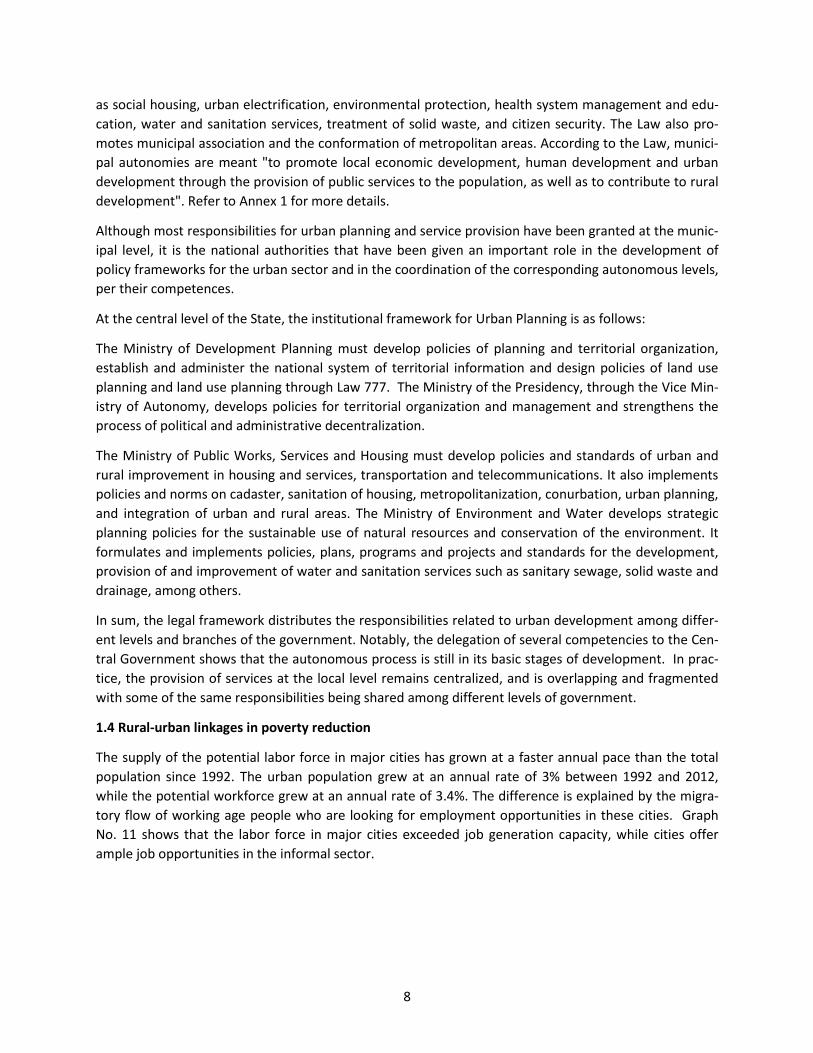
Graph. No. 10
Urban Growth vs. Geographical Density: the Case of Riberalta
Source: World Bank. 2014
The most important urban development is the type of growth some cities are currently experiencing. For
example, Riberalta (shown above) is expanding outward in a low-density pattern, providing further chal-
lenges to local government to plan and provide basic services, contrary to the desired densification that
reduces the cost of service delivery, urban mobility costs, and environmental impact, among others.
1.3 National legal and institutional influence on urban development
The Political Constitution of the State (CPE in Spanish) approved in 2008 created a compounded State, in
which several levels of government with legislative authority are recognized. Furthermore, constitution-
al text and the Law of Autonomies and Decentralization (2010) defined the competences and scope for
national, departmental, municipal and native indigenous autonomies.
In the realm of urban development, the Law establishes the Central Level exclusive competences includ-
ing the design of national planning policy and territorial organization, tax transfer systems and the terri-
torial tax domains. For the departmental, municipal and native indigenous autonomies, it establishes
exclusive competences in territorial planning and its implementation within its jurisdiction, and the pro-
vision of public services to its citizens. There are also several shared and concurrent competencies, such
8
as social housing, urban electrification, environmental protection, health system management and edu-
cation, water and sanitation services, treatment of solid waste, and citizen security. The Law also pro-
motes municipal association and the conformation of metropolitan areas. According to the Law, munici-
pal autonomies are meant "to promote local economic development, human development and urban
development through the provision of public services to the population, as well as to contribute to rural
development". Refer to Annex 1 for more details.
Although most responsibilities for urban planning and service provision have been granted at the munic-
ipal level, it is the national authorities that have been given an important role in the development of
policy frameworks for the urban sector and in the coordination of the corresponding autonomous levels,
per their competences.
At the central level of the State, the institutional framework for Urban Planning is as follows:
The Ministry of Development Planning must develop policies of planning and territorial organization,
establish and administer the national system of territorial information and design policies of land use
planning and land use planning through Law 777. The Ministry of the Presidency, through the Vice Min-
istry of Autonomy, develops policies for territorial organization and management and strengthens the
process of political and administrative decentralization.
The Ministry of Public Works, Services and Housing must develop policies and standards of urban and
rural improvement in housing and services, transportation and telecommunications. It also implements
policies and norms on cadaster, sanitation of housing, metropolitanization, conurbation, urban planning,
and integration of urban and rural areas. The Ministry of Environment and Water develops strategic
planning policies for the sustainable use of natural resources and conservation of the environment. It
formulates and implements policies, plans, programs and projects and standards for the development,
provision of and improvement of water and sanitation services such as sanitary sewage, solid waste and
drainage, among others.
In sum, the legal framework distributes the responsibilities related to urban development among differ-
ent levels and branches of the government. Notably, the delegation of several competencies to the Cen-
tral Government shows that the autonomous process is still in its basic stages of development. In prac-
tice, the provision of services at the local level remains centralized, and is overlapping and fragmented
with some of the same responsibilities being shared among different levels of government.
1.4 Rural-urban linkages in poverty reduction
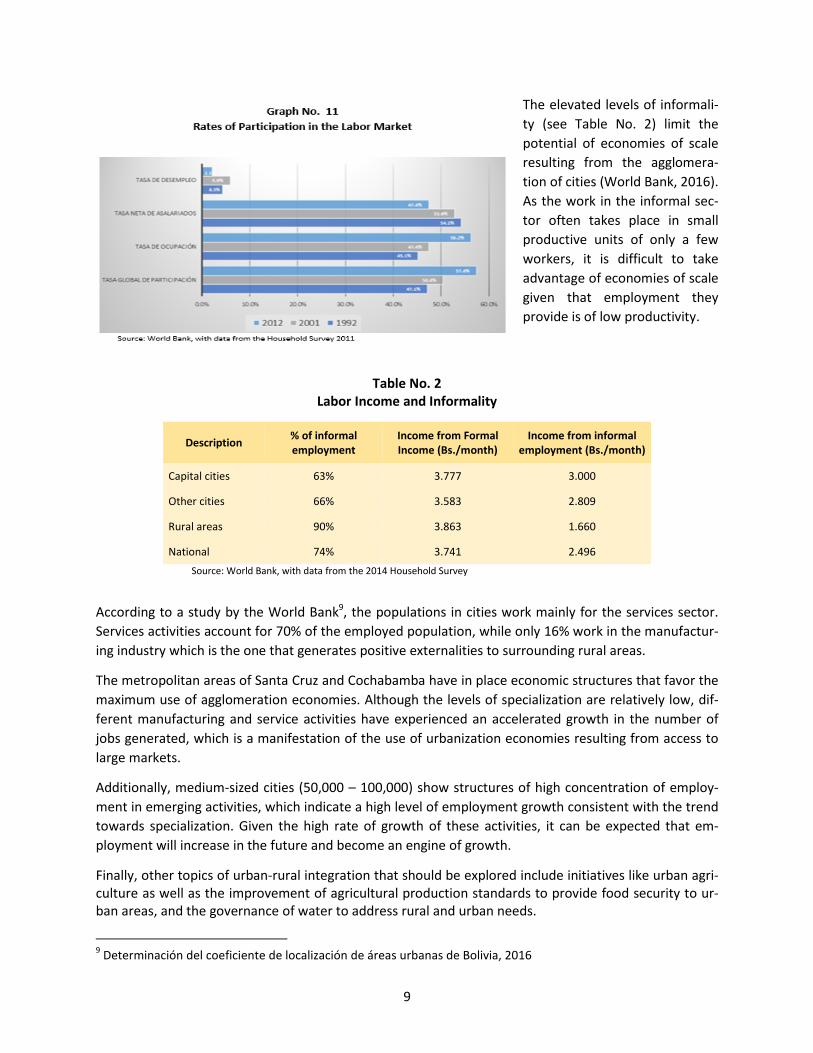
The supply of the potential labor force in major cities has grown at a faster annual pace than the total
population since 1992. The urban population grew at an annual rate of 3% between 1992 and 2012,
while the potential workforce grew at an annual rate of 3.4%. The difference is explained by the migra-
tory flow of working age people who are looking for employment opportunities in these cities. Graph
No. 11 shows that the labor force in major cities exceeded job generation capacity, while cities offer
ample job opportunities in the informal sector.
9
The elevated levels of informali-
ty (see Table No. 2) limit the
potential of economies of scale
resulting from the agglomera-
tion of cities (World Bank, 2016).
As the work in the informal sec-
tor often takes place in small
productive units of only a few
workers, it is difficult to take
advantage of economies of scale
given that employment they
provide is of low productivity.
Table No. 2
Labor Income and Informality
Description % of informal employment
Income from Formal Income (Bs./month)
Income from informal employment (Bs./month)
Capital cities 63% 3.777 3.000
Other cities 66% 3.583 2.809
Rural areas 90% 3.863 1.660
National 74% 3.741 2.496
Source: World Bank, with data from the 2014 Household Survey
According to a study by the World Bank9, the populations in cities work mainly for the services sector.
Services activities account for 70% of the employed population, while only 16% work in the manufactur-
ing industry which is the one that generates positive externalities to surrounding rural areas.
The metropolitan areas of Santa Cruz and Cochabamba have in place economic structures that favor the
maximum use of agglomeration economies. Although the levels of specialization are relatively low, dif-
ferent manufacturing and service activities have experienced an accelerated growth in the number of
jobs generated, which is a manifestation of the use of urbanization economies resulting from access to
large markets.
Additionally, medium-sized cities (50,000 – 100,000) show structures of high concentration of employ-
ment in emerging activities, which indicate a high level of employment growth consistent with the trend
towards specialization. Given the high rate of growth of these activities, it can be expected that em-
ployment will increase in the future and become an engine of growth.
Finally, other topics of urban-rural integration that should be explored include initiatives like urban agri-culture as well as the improvement of agricultural production standards to provide food security to ur-ban areas, and the governance of water to address rural and urban needs.
9 Determinación del coeficiente de localización de áreas urbanas de Bolivia, 2016
10
In sum, the metropolitan regions of Santa Cruz and Cochabamba10 and medium-sized cities have eco-
nomic activities in industry and services with positive externalities in surrounding rural areas, a win-win
situation that have the potential to be enhanced in order to better incorporate greater migration levels.
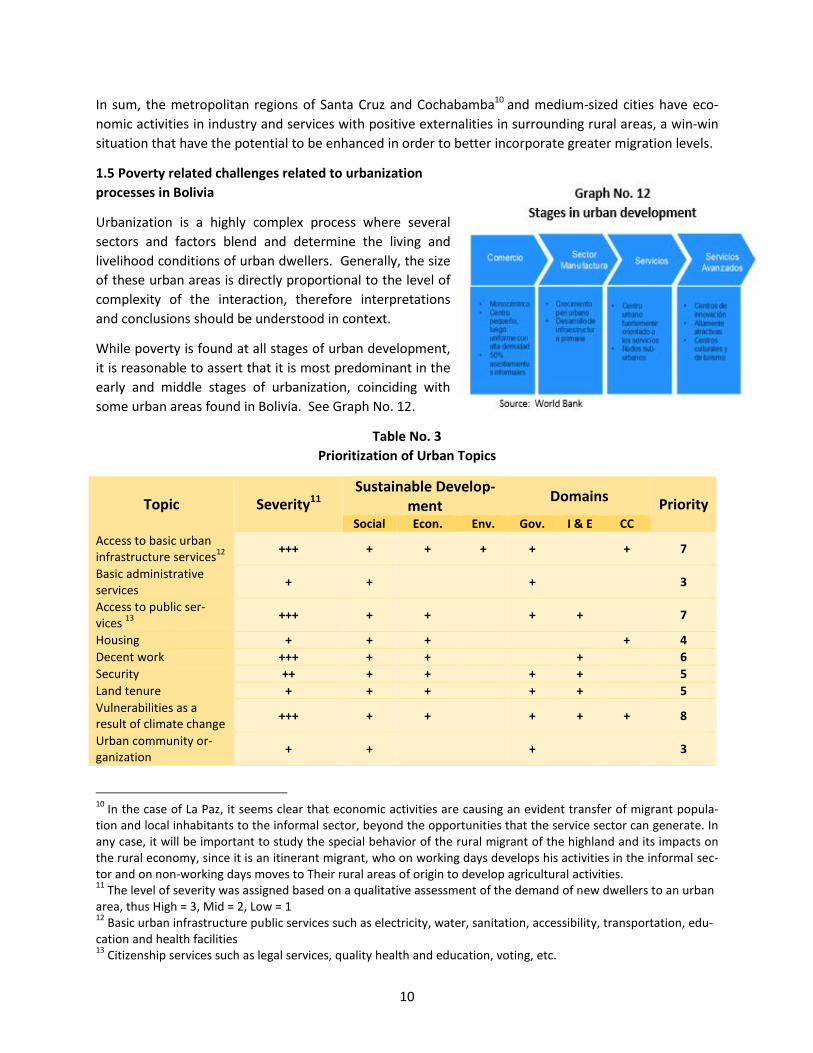
1.5 Poverty related challenges related to urbanization
processes in Bolivia
Urbanization is a highly complex process where several
sectors and factors blend and determine the living and
livelihood conditions of urban dwellers. Generally, the size
of these urban areas is directly proportional to the level of
complexity of the interaction, therefore interpretations
and conclusions should be understood in context.
While poverty is found at all stages of urban development,
it is reasonable to assert that it is most predominant in the
early and middle stages of urbanization, coinciding with
some urban areas found in Bolivia. See Graph No. 12.
Table No. 3
Prioritization of Urban Topics
Topic Severity11 Sustainable Develop-
ment Domains
Priority Social Econ. Env. Gov. I & E CC
Access to basic urban infrastructure services
12
+++ + + + + + 7
Basic administrative services
+ + + 3
Access to public ser-vices
13
+++ + + + + 7
Housing + + + + 4
Decent work +++ + + + 6
Security ++ + + + + 5
Land tenure + + + + + 5
Vulnerabilities as a result of climate change
+++ + + + + + 8
Urban community or-ganization
+ + + 3
10
In the case of La Paz, it seems clear that economic activities are causing an evident transfer of migrant popula-tion and local inhabitants to the informal sector, beyond the opportunities that the service sector can generate. In any case, it will be important to study the special behavior of the rural migrant of the highland and its impacts on the rural economy, since it is an itinerant migrant, who on working days develops his activities in the informal sec-tor and on non-working days moves to Their rural areas of origin to develop agricultural activities. 11
The level of severity was assigned based on a qualitative assessment of the demand of new dwellers to an urban area, thus High = 3, Mid = 2, Low = 1 12
Basic urban infrastructure public services such as electricity, water, sanitation, accessibility, transportation, edu-cation and health facilities 13
Citizenship services such as legal services, quality health and education, voting, etc.
11
Urbanization processes bring along poverty-related issues that can be best addressed by prioritizing
them through a sustainable development lens and SDC’s strategic domains.
Prioritization
From table No. 3 above, the topics likely to have the greatest impact on citizens in poverty conditions
are, initially, access to basic services, access to public services, decent work and support to climate
change. There are also other factors that must be considered to understand the urban dynamics in de-
livering better living conditions and livelihood to citizens, outlined as follows.
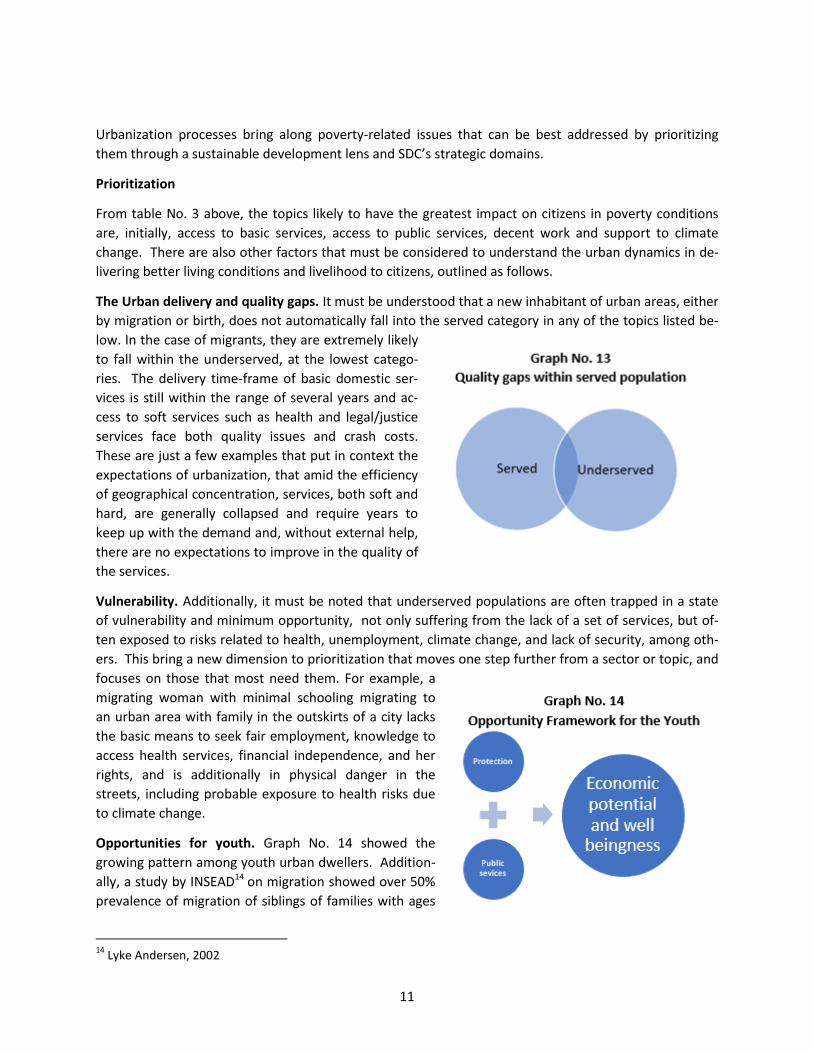
The Urban delivery and quality gaps. It must be understood that a new inhabitant of urban areas, either
by migration or birth, does not automatically fall into the served category in any of the topics listed be-
low. In the case of migrants, they are extremely likely
to fall within the underserved, at the lowest catego-
ries. The delivery time-frame of basic domestic ser-
vices is still within the range of several years and ac-
cess to soft services such as health and legal/justice
services face both quality issues and crash costs.
These are just a few examples that put in context the
expectations of urbanization, that amid the efficiency
of geographical concentration, services, both soft and
hard, are generally collapsed and require years to
keep up with the demand and, without external help,
there are no expectations to improve in the quality of
the services.
Vulnerability. Additionally, it must be noted that underserved populations are often trapped in a state
of vulnerability and minimum opportunity, not only suffering from the lack of a set of services, but of-
ten exposed to risks related to health, unemployment, climate change, and lack of security, among oth-
ers. This bring a new dimension to prioritization that moves one step further from a sector or topic, and
focuses on those that most need them. For example, a
migrating woman with minimal schooling migrating to
an urban area with family in the outskirts of a city lacks
the basic means to seek fair employment, knowledge to
access health services, financial independence, and her
rights, and is additionally in physical danger in the
streets, including probable exposure to health risks due
to climate change.
Opportunities for youth. Graph No. 14 showed the
growing pattern among youth urban dwellers. Addition-
ally, a study by INSEAD14 on migration showed over 50%
prevalence of migration of siblings of families with ages
14
Lyke Andersen, 2002

12
likely to be around those in the 15-25 bracket, a group both economically active and highly vulnerable,
and therefore in need of public services to unlock its economic potential.
Ability and capacity to change. Another factor for prioritization is the ability to generate change in ur-
ban areas through external support and the willingness of stakeholders to change, which requires spe-
cial conditions to overcome the momentum generated by the sheer mass of urban dynamics.
Therefore, the prioritized topics and the presented factors for consideration should provide the initial
grounds for formulating a strategy that is directed to the greatest opportunities to improve living condi-
tions of urban dwellers.
2. Other Donors and SDC’s Activities in Urban Development
2.1. Other donors’ interventions and main actors in urban development
Table No. 5 includes a synthesis of Programs and Projects that donors implemented in sectors corre-
sponding to urban development. For greater detail please refer to Annex 2.
Table. No. 5 Main Programs with Urban Relevance Implemented by Donors
Sector
Donor Type and size of
city15
AECID
EU
IADB
PNUD
UNICEF
CAF
KOICA
DANIDA
ASDI
JICA
GIZ
KfW
Word
Bank
Main L M S
Urban Infrastructure + +
Water and Sanitation + + + +
Health + + +
Education + + + +
Risk Reduction + +
Energy + +
Justice + + +
Productive Development + +
Social Assistance + +
Public Management + +
Water Resources + + + +
Health +
15
Main, Large, Medium and Small
13
The main actors in urban development are municipal governments with urban areas within their juris-
dictions16 which, by constitutional and legal mandate, are responsible for the social and economic de-
velopment of their territories. This responsibility is, for the most part, assumed only partially due to the
lack of technical, human, and financial resources at this level. Nevertheless, it is at the local level where
urban issues and opportunities can be addressed best with, when necessary, the support of National
and departmental governments, and donor support.
The Central Government, through its sectoral ministries with a variety of policies and objectives17, im-
plements several programs directed towards the provision of basic services and the construction of in-
frastructure and social housing. While many of them address public service delivery gaps, it is important
to note that the programs have a sectoral approach often directed also to rural areas, and not designed
to resolve real urban issues.
Other actors in urban development include Departmental Governments that consistently lack sufficient
resources to implement programs or projects in urban areas, but at least have the power to convene
actors and coordinate development actions, particularly on issues and challenges that involve more than
one municipality.
2.2. Rate of success in other donors and main actors’ interventions
Most donors have a portfolio of projects with a sectoral focus that are poorly integrated and do not
have an effective urban approach. A general assessment of the urban effectiveness of these programs
follows.
No donor has a comprehensive program to support urban development. All of them intervene
with a strictly sectoral vision or limited geographical scope, and in several cases through isolated
interventions, which puts into question their results and impacts.
Noteworthy is that most interventions are done through the ministries at the central level,
which have defined strictly sectoral policies and therefore do not perceive the need for articula-
tion of interventions for urban development.
Only one program has been identified under the responsibility of the Ministry of Public Works,
responsible for issuing guidelines for urban development. The Municipal Management Im-
provement Program - Support to the cadastral management and its interconnection with the na-
tional tax administration is financed by the IADB, whose execution is carried out with municipal
governments of capital cities has yet to generate the desired outcomes.
The contribution to urban development of the Neighborhood Improvement Programs imple-
mented by the World Bank and the IADB, has been widely recognized. The most significant con-
tribution has been the integrality of the interventions. Additionally, this approach has evolved
into the development of urban policies based on urban centralities, which several municipal
governments of the most important urban centers of the country intend to replicate.
16
As reported by INE, there are more than one hundred municipalities with urban areas with populations over two-thousand 17
As set by the Plan Nacional de Desarrollo Económico y Social (PDES) and the Agenda Patriótica 2025

14
Municipal governments have been successful only in proportion to their technical capacity and the
availability of financial resources, and are often unable to spend even their reduced budgets in programs
and projects addressing citizens’ demands.
The Central Government has been marginally successful in addressing urban issues. Even though it has
invested boldly in the provision of infrastructure, from basic services, health, and education to transpor-
tation and housing, it has a poor record of coordination with municipalities. Through this limited ap-
proach, local governments not only end up with the responsibility of the sustainability of any physical
asset, but also remain accountable for its social and economic value.
Finally, Departmental Governments have had no success in coordinating efforts among actors in, for
example, metropolitan areas, where results are limited to meetings with almost no relationship to con-
crete actions outside the discussions.
2.3. Unaddressed issues and challenges
Table No. 5 above confirms that donors have programs in diverse sectors and urban settings. However,
the urban landscape of Bolivia is ample and there is a high likelihood that there are plenty of urban are-
as in which unaddressed issues and challenges remain. It is the intent of this document to move away
from a sectoral and fill-the-gap approach to an integrated and geographically centered focus in order to
sustainably address urban issues. This will be further developed in the upcoming sections.
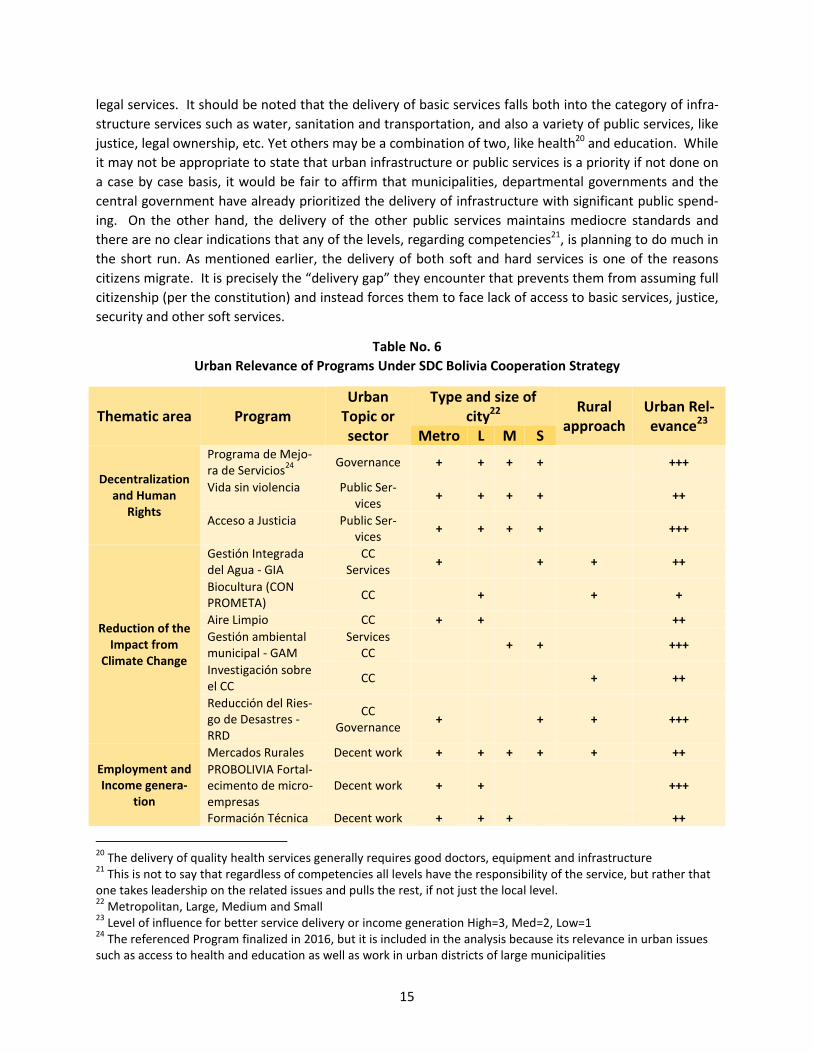
2.4. SDC’s strategy reach on urban issues
The rich cooperation portfolio of SDC Bolivia, reaching up to 183 municipalities, is comprised of three
areas of cooperation, namely: Decentralization and Human Rights, Reduction of the Impact from Climate
Change and Employment and Income Generation. Just by inspection, the “urban” angle of these three
areas could coincide completely with urban issues or topics, limited, in principle, only by their geograph-
ical targeting and/or population reach. Nevertheless, there are yet different perspectives in assessing
the urban relevance of a cooperation program or activity that go beyond, as they should, the geograph-
ical scope of the intervention. Therefore, the urban relevance considers two factors:
Type of city, as per Table No.5, above
Level of thematic link to priority urban topics
The assessment also includes a qualification of “Rural Approach” indicating that the activity may be
aimed at rural areas and/or beneficiaries, which does not necessarily negatively affect its urban rele-
vance. The relevance is therefore assigned given the geographical interdependence18 and connection
between rural and urban areas and the relevance of the subject to urban topics, independent of wheth-
er the activity is rural or urban19.
The area of Decentralization and Human Rights shows high relevance over urban topics and issues. This
is because it highly correlates to the governance of high priority topics, such as access to basic social and
18
A good example for this is Climate-Change related work in water basins, that, while geographically outside an urban area, it may benefit the reservoirs of one downstream. 19
Even if a project is completely focused on rural areas, there is potentially significant knowledge accumulated by the project that could later be applied to focus upon or solve urban issues. Additionally, there could also be a clear urban benefit from the activity such as improving or protecting agricultural production.
15
legal services. It should be noted that the delivery of basic services falls both into the category of infra-
structure services such as water, sanitation and transportation, and also a variety of public services, like
justice, legal ownership, etc. Yet others may be a combination of two, like health20 and education. While
it may not be appropriate to state that urban infrastructure or public services is a priority if not done on
a case by case basis, it would be fair to affirm that municipalities, departmental governments and the
central government have already prioritized the delivery of infrastructure with significant public spend-
ing. On the other hand, the delivery of the other public services maintains mediocre standards and
there are no clear indications that any of the levels, regarding competencies21, is planning to do much in
the short run. As mentioned earlier, the delivery of both soft and hard services is one of the reasons
citizens migrate. It is precisely the “delivery gap” they encounter that prevents them from assuming full
citizenship (per the constitution) and instead forces them to face lack of access to basic services, justice,
security and other soft services.
Table No. 6
Urban Relevance of Programs Under SDC Bolivia Cooperation Strategy
Thematic area Program Urban
Topic or sector
Type and size of city22
Rural approach
Urban Rel-evance23
Metro L M S
Decentralization and Human
Rights
Programa de Mejo-ra de Servicios
24
Governance + + + + +++
Vida sin violencia Public Ser-vices
+ + + + ++
Acceso a Justicia Public Ser-vices
+ + + + +++
Reduction of the Impact from
Climate Change
Gestión Integrada del Agua - GIA
CC Services
+ + + ++
Biocultura (CON PROMETA)
CC + + +
Aire Limpio CC + + ++
Gestión ambiental municipal - GAM
Services CC
+ + +++
Investigación sobre el CC
CC + ++
Reducción del Ries-go de Desastres - RRD
CC Governance
+ + + +++
Employment and Income genera-
tion
Mercados Rurales Decent work + + + + + ++
PROBOLIVIA Fortal-ecimento de micro-empresas
Decent work + + +++
Formación Técnica Decent work + + + ++
20
The delivery of quality health services generally requires good doctors, equipment and infrastructure 21
This is not to say that regardless of competencies all levels have the responsibility of the service, but rather that one takes leadership on the related issues and pulls the rest, if not just the local level. 22
Metropolitan, Large, Medium and Small 23
Level of influence for better service delivery or income generation High=3, Med=2, Low=1 24
The referenced Program finalized in 2016, but it is included in the analysis because its relevance in urban issues such as access to health and education as well as work in urban districts of large municipalities

16
Thematic area Program Urban
Topic or sector
Type and size of city22
Rural approach
Urban Rel-evance23
Profesional Microseguro Agríco-la
Rural + +
The fact that some of the activities in Decentralization and Human Rights have targeted youth using
health, education and employment criteria makes its relevance even higher, as this is the age group that
has shown the greatest increase in population in urban areas. The inclusion of social programs such as
violence against women also aims to establish social services currently absent from any government
level or branch. Finally, the ample urban reach, in terms of the number of municipalities, raises the
question of whether the several relatively small projects or interventions really have the potential for
sustainable urban impact.
The area of Reduction of the Impact of Climate Change is comprised of a large portfolio in very large
geographical regions with programs that encompass the complex relationship of climate change effects
with everything from livelihoods in rural areas to governance and services in urban realms. While pro-
grams like Integrated Water Management and Disaster Risk Reduction are primarily focused on rural
areas, their effects lie positively in small urban areas, but also in large metropolitan areas, making it,
from an urban perspective, relevant not only for addressing climate, environmental and public services
issues, but also for gathering important knowledge to tackle similar issues in other places. Furthermore,
the Municipal Environmental management program goes a step further and supports local governments
to fix solid waste deficiencies, addressing both an environmental issue and a public service concern.
Rural-focused programs like Biocultura appear to be focused on improving farmers’ livelihoods , but also
provide important links to markets in urban areas as well as metropolitan regions, making them urban
relevant. Likewise, the Climate Change Research activity has a rural focus, but the relevance of its find-
ings could very well indirectly benefit urban areas or, at the very least, generate knowledge that could
be applied to solve urban issues related to vulnerabilities to Climate Change. Last but not least in the
group, the Clean Air Initiative has a direct focus on monitoring air quality in urban areas, generating
awareness among citizens and working with local governments to implement and support initiatives
directly aimed at reducing urban pollution, such as their support of public transportation and efforts to
limit/control vehicle emissions, among other initiatives.
The second reason for migration to urban areas is employment and income generation. Therefore, pro-
grams like Professional Technical Training and Micro and Small Business Support (PROBOLIVIA) have
high urban relevance, as they directly bridge the labor gap between supply and demand for labor in
urban areas. Moreover, these programs also attempt to improve the quality of employment by em-
powering local and newly arrived citizens. Noteworthy are the programs of Rural Markets and the agri-
cultural micro-insurance. While they are directly focused on rural areas, the markets they support are
predominantly in urban realms.
In sum, SDC’s programs have, for
the most part, an urban presence
and urban relevance, either by di-
rectly implementing projects within
urban areas or by undertaking urban
issues. However, SDC’s current
17
portfolio also has programs with an urban approach that either have a direct relationship with an urban
area and/or are building knowledge on a subject or topic with urban relevance. This means that the
stock built by SDC uniquely positions it to tackle urban challenges. This position is further strengthened
by the great stock of knowledge SDC possesses to help it determine how best to go about addressing
these challenges.
2.5. Assessment of SDC’s interventions
Overall, a rapid assessment provides that most of SDC’s programs are poised to generate an impact rela-
tive to the objectives that have been established for them. However, to assess their relevance for an
urban approach, the criteria must assess the fitness of each of the programs and their strengths and
weaknesses in order to attain specific and sustainable urban development results.
Without a proper evaluation, SDC´s rich and complex portfolio would be difficult and potentially inaccu-
rate to assess in terms of how successful it has been. Nevertheless, it is possible to provide an indication
of how well positioned SDC Bolivia is to tackle urban challenges. The general premise is that to generate
impact on urban projects you need the capacity to generate critical mass.
An overall assessment of the positioning of SDC Bolivia’s programs is rather positive, as they have either:
Worked in urban areas
Generated capacities in local governments and supported policy-making in departmental
and national entities
Generated know-how or urban relevance
The horizontal reading of Table No. 7 shows relative success in this mix of interventions and provides a
reference of how deeply each of the programs has worked with urban approaches, which is not to say
that they have, or have not, been successful programs on their own. Nor does it mean that any given
program intended to work on urban issues or approaches specifically when it was conceived. As stated
before, this is an assessment of the level of positioning to gauge each program’s potential to tackle ur-
ban issues with a more focused approach.
The vertical reading of Table No. 7 provides a perhaps more interesting assessment of the particular
strengths of each of the programs and a first glimpse of what an urban focus would mean.
Urban Focus. For the most part, activities have either been conceived to work within urban areas or not.
Nevertheless, it is remarkable that some have been drawn to spend time and resources in urban areas
to link and assure the success of their interventions.
Critical Mass. The sheer mass of population, economics and social culture in Urban areas generate a
single and significant momentum, like a vector that is not to be changed unless our intervention reaches
a critical mass both in volume and time to generate sustainable change. Overall, SDC’s interventions
have been timid and are unlikely to attain impacts that are either of significance or sustainable.
Urban Know-how. SDC’s activities have worked on urban issues and in urban areas, so have proportion-
ally gained important knowledge on how best to address some of them. Important stock has been built
that could be treated as an externality, rather than as a product or, much less, as an objective. This
helps SDC to better position itself to work with an urban lens.
18
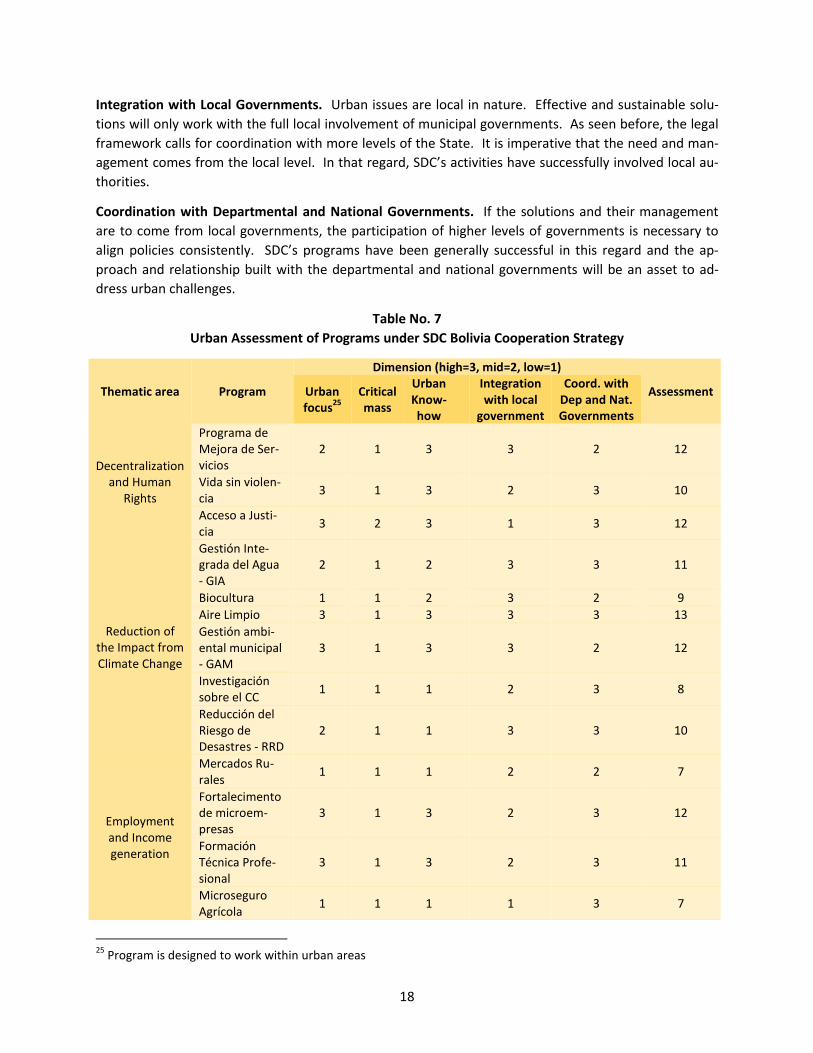
Integration with Local Governments. Urban issues are local in nature. Effective and sustainable solu-
tions will only work with the full local involvement of municipal governments. As seen before, the legal
framework calls for coordination with more levels of the State. It is imperative that the need and man-
agement comes from the local level. In that regard, SDC’s activities have successfully involved local au-
thorities.
Coordination with Departmental and National Governments. If the solutions and their management
are to come from local governments, the participation of higher levels of governments is necessary to
align policies consistently. SDC’s programs have been generally successful in this regard and the ap-
proach and relationship built with the departmental and national governments will be an asset to ad-
dress urban challenges.
Table No. 7
Urban Assessment of Programs under SDC Bolivia Cooperation Strategy
Thematic area Program
Dimension (high=3, mid=2, low=1)
Assessment Urban focus
25
Critical mass
Urban Know- how
Integration with local
government
Coord. with Dep and Nat. Governments
Decentralization and Human
Rights
Programa de Mejora de Ser-vicios
2 1 3
3 2 12
Vida sin violen-cia
3 1 3
2 3 10
Acceso a Justi-cia
3 2 3
1 3 12
Reduction of the Impact from Climate Change
Gestión Inte-grada del Agua - GIA
2 1 2
3 3 11
Biocultura 1 1 2 3 2 9
Aire Limpio 3 1 3 3 3 13
Gestión ambi-ental municipal - GAM
3 1 3
3 2 12
Investigación sobre el CC
1 1 1
2 3 8
Reducción del Riesgo de Desastres - RRD
2 1 1
3 3 10
Employment and Income generation
Mercados Ru-rales
1 1 1
2 2 7
Fortalecimento de microem-presas
3 1 3
2 3 12
Formación Técnica Profe-sional
3 1 3
2 3 11
Microseguro Agrícola
1 1 1
1 3 7
25
Program is designed to work within urban areas
19
2.6. Opportunities on urban development for SDC
SDC’s advantages are integration and the opportunity to change the approach of how to sustainably
work with urban areas. This will be developed further in the upcoming sections.

20
3. Recommendations
3.1. Recommended fields of action for SDC
While Table No. 3 identified the priority fields of action for potential SCD intervention, it is important to
assess the relevance of the intervention of donors and other actors. Table No. 5 provides a summary of
sectors covered by donor; however, the geographical dimension (all urban areas in the country, not
shown for practical purposes) related to each of those interventions, briefly summarized on the right
side of the table, indicates that there are plenty of unattended regions, cities and sectors that SDC could
support. Therefore, the assistance landscape is wide open, both geographically and thematically,
providing SDC with the opportunity to focus on the most relevant topics. Thus, the recommended urban
priority topics are:
Governance in the provision of public services
Decent work
Vulnerabilities as a result from climate change, including Risk Mitigation
Strategically, SDC’s may opt for a development approach to provide assistance through pilot projects
that not only seek to generate sustainable impact at the local level, but also lessons that could potential-
ly be replicated in other urban areas. The overarching objective being to generate the greatest possible
learning in urban development to formulate public policy at the central level to support the implemen-
tation of programs and investments in urban areas.
3.2. Recommended fields of action related to SECO’s main fields of expertise
Almost without exception, cities of all types and those within metropolitan areas have been surpassed in
on or both management capacity and financing capabilities of the demands for services, which have
increased significantly specially over the past decade.
Municipal governments in Bolivia, have progressively learned to address the issues around the provision
of infrastructure for services such as water, sanitation, transportation and other of the kind, yet they
struggle with three main hurdles:
Financing (from increasing revenue to the provision of sustainable services)
Quality of the services provided (much of the served population may count as served, but with
poor continuity, low quality of services, etc.) in areas such as
o Urban Planning and management
o Sanitation
✓ Solid waste management
✓ Urban mobility
Urban resilience to Climate Change
These may be potential areas for SECO to step in and support local governments to improve the reach
and quality of the services they provide. In order to make this support effective and sustainable it would
be highly desirable to work in partnership with SDC and other donors (such as the World Bank, IADB
and/or CAF), to use this type of support as an incentive to implement improvements of the provision of
soft services which tend to follow outside the local government lens and are often beyond the reach of
national entities.
2
3.3. Recommended areas of action for SDC focusing on poverty reduction and sustainable
development
To successfully implement a portfolio with an urban approach, SDC must shift approaches, and reach
out to form new alliances to generate impact in urban, peri urban and rural areas. Therefore, a change
in paradigm is required to evolve from the current sectoral approach to an integrated one that responds
to the nature of the urban issues.
Nevertheless, the current strategic scenario indicates that SDC faces a programmatic reduction on the
order of 25% and is expected to reduce to only 10 programs. As most existing projects will continue until
2019 and the strategy is not expected to change significantly, the proposed urban approach focuses
geographically on medium to large poor cities in the same thematic areas in the current strategy.
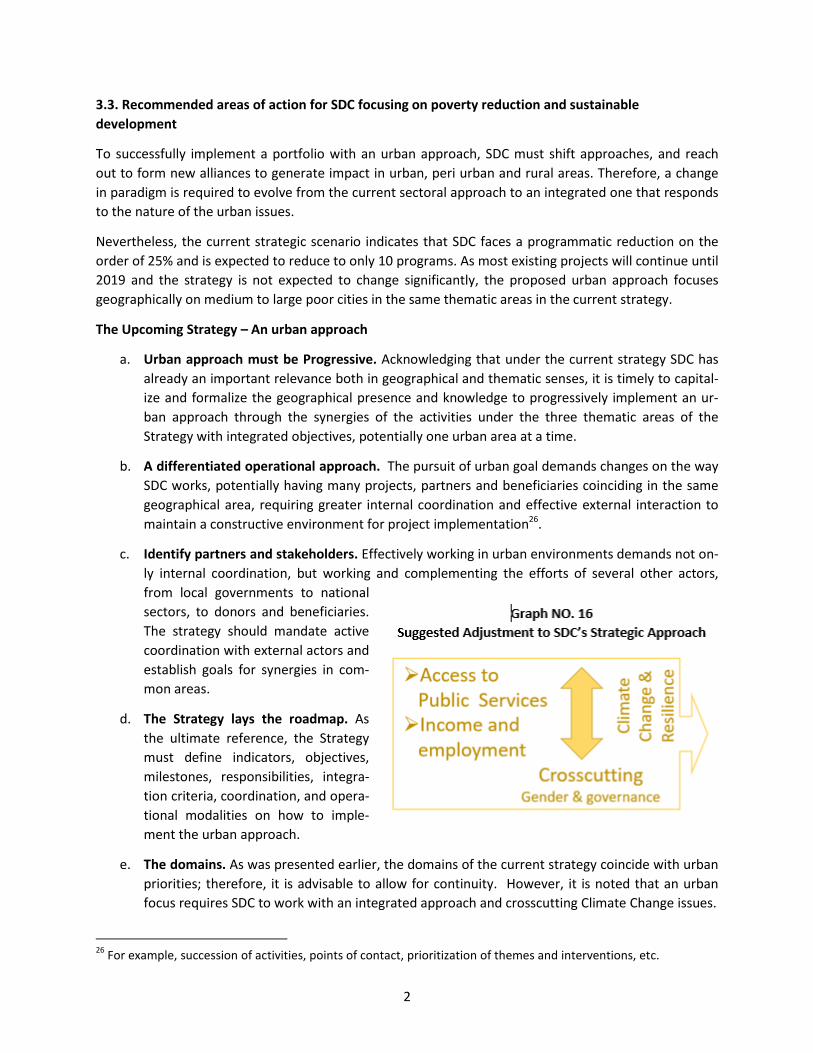
The Upcoming Strategy – An urban approach
a. Urban approach must be Progressive. Acknowledging that under the current strategy SDC has
already an important relevance both in geographical and thematic senses, it is timely to capital-
ize and formalize the geographical presence and knowledge to progressively implement an ur-
ban approach through the synergies of the activities under the three thematic areas of the
Strategy with integrated objectives, potentially one urban area at a time.
b. A differentiated operational approach. The pursuit of urban goal demands changes on the way
SDC works, potentially having many projects, partners and beneficiaries coinciding in the same
geographical area, requiring greater internal coordination and effective external interaction to
maintain a constructive environment for project implementation26.
c. Identify partners and stakeholders. Effectively working in urban environments demands not on-
ly internal coordination, but working and complementing the efforts of several other actors,
from local governments to national
sectors, to donors and beneficiaries.
The strategy should mandate active
coordination with external actors and
establish goals for synergies in com-
mon areas.
d. The Strategy lays the roadmap. As
the ultimate reference, the Strategy
must define indicators, objectives,
milestones, responsibilities, integra-
tion criteria, coordination, and opera-
tional modalities on how to imple-
ment the urban approach.
e. The domains. As was presented earlier, the domains of the current strategy coincide with urban
priorities; therefore, it is advisable to allow for continuity. However, it is noted that an urban
focus requires SDC to work with an integrated approach and crosscutting Climate Change issues.
26
For example, succession of activities, points of contact, prioritization of themes and interventions, etc.
3
Implementation of SDC’s Urban Approach
With the mandate of the strategy laid out, SDC must begin a process to select where, what and with
whom to work. SDC must also make some operational adjustments of how to carry out the assistance.
Selection of Urban Areas
The general criteria and approach in selecting where SDC should direct its assistance must be based on
poverty levels (both in urban and in closed-by, connected peri-urban and rural areas), opportunities for
rural-urban linkages, the size of the urban area, the availability of resources, and its areas of strength.
Given that SDC has ongoing operations in Bolivia and that the new Strategy will provide continuity to the
current programs, it is advisable to maintain the current geographical focus. Furthermore, a progressive
implementation and the limited funding available indicate that its geographical focus may initially lie
with medium to large cities and selected smaller cities. The focus on poverty is generally located in sub-
urban areas, which frequently have commercial links with rural areas, and which can generate potential
externalities27.
The selection criteria for intervention should also consider the diversification of risks to achieve impacts,
given the level of uncertainty when implementing technical assistance programs in weak public entities.
Risk diversification can be achieved by working in several territorial entities over the period of the Strat-
egy. Initially, if the budget is limited and/or SDC deems it necessary to work only in a few urban areas, it
is advisable to select those where SDC has presence and has developed technical capacity. This is inher-
ently an iterative process that involves at least the variables mentioned above, which includes an as-
sessment of the capacities, demand and will of local governments and of other local and national stake-
holders. It is advisable that SDC initiate this process after approval of its new Strategy.
An Initial Approach
A qualitative analysis28 of SDC’s thematic expertise and geographical presence aims to include the most
relevant factors of its current programs with urban relevance in urban areas and other variables, from
poverty to the potential synergies between programs, existence of markets for rural production and the
presence of other donors and the scale of urban areas to SDC’s assistance capacity. Please refer to An-
nex 7 for more details.
The result of this exercise identifies opportunities for working in Oruro, Sucre and Potosí. While Tarija
does not show a significant level of poverty, it should be included in the recommendations as poverty
data for the study comes from the 2012 census and the urban dynamics and migration since then have
likely raised the figure to or beyond the 20% threshold. While Trinidad falls out of the formal geograph-
ical scope of SDC in Bolivia, there are SDC programs currently being implemented and it could be con-
27
Migrants to urban areas are mostly young citizens in search of better incomes and services which generates pressure in the labor market and an increased demand for services to municipal budgets. However, at the same time, the growing population in cities generate larger markets for rural products and therefore there is a potential for improvement of income. In the long term, these urban-rural relations also lead to the transfer of knowledge and technology that will facilitate greater productivity, better rural incomes and the provision of public services. 28
The qualitative analysis has been prepared for discussion purposes, as a more detailed quantitative analysis with more variables and exact criteria should be used for actual design and implementation of an urban program or approach.
4
sidered an additional alternative. Finally, it is worth noting some small29 urban areas30 with the difficult
combination of high population growth and high levels of poverty where SDC already has programs un-
der implementation and in which it may consider a regional intervention in a set of these smaller cities
with geographical proximity.
A gradual approach supporting urban areas will allow SDC to capitalize on the geographical integration
and knowledge gathered through its programs, including the close links with local government and na-
tional entities. The benefits of an urban approach are largely proportional to size and scale, that is, larg-
er urban areas, such as metropolitan areas, offer greater opportunities but also higher risks. Thus, the
most reasonable approach for SDC to take is in smaller urban areas, which are in as much need and simi-
lar potential amid proportionally smaller cities, such as the ones recommended. The size of SDC’s budg-
et, presence, knowledge, and integrated approach will progressively provide the confidence to later
expand to more urban areas, including larger ones, as well as the satisfaction of achieving sustainable
changes in the medium term.
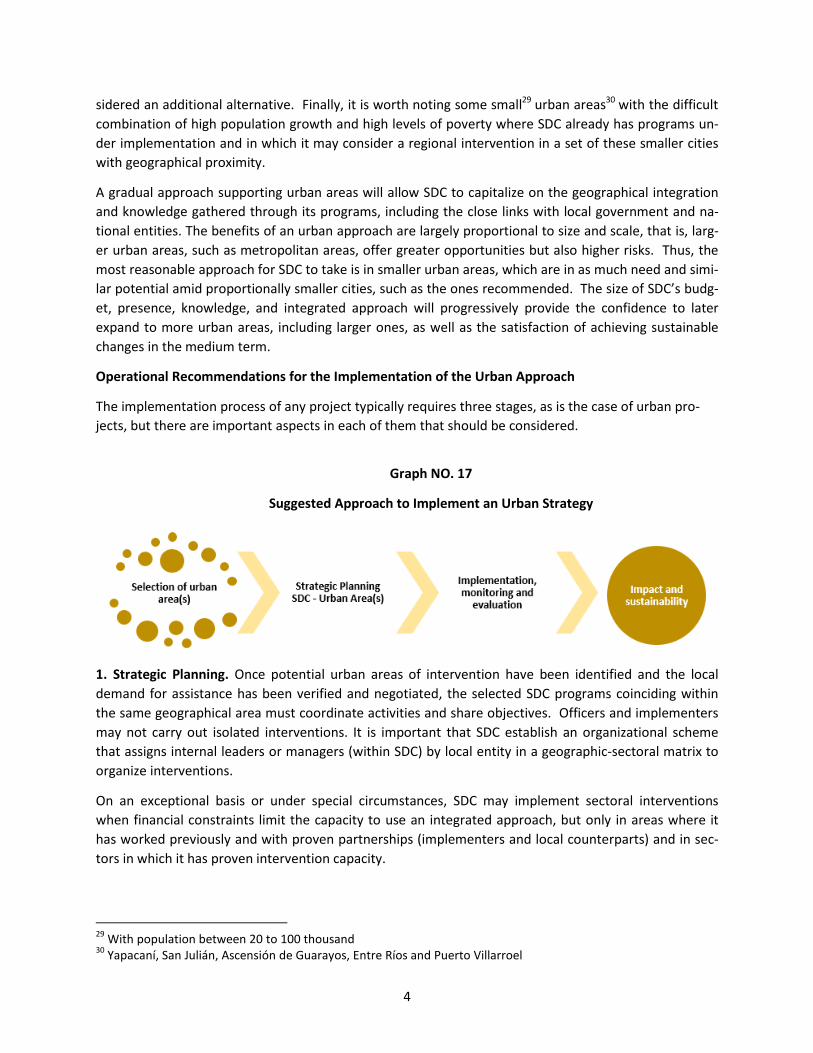
Operational Recommendations for the Implementation of the Urban Approach
The implementation process of any project typically requires three stages, as is the case of urban pro-
jects, but there are important aspects in each of them that should be considered.
Graph NO. 17
Suggested Approach to Implement an Urban Strategy
1. Strategic Planning. Once potential urban areas of intervention have been identified and the local
demand for assistance has been verified and negotiated, the selected SDC programs coinciding within
the same geographical area must coordinate activities and share objectives. Officers and implementers
may not carry out isolated interventions. It is important that SDC establish an organizational scheme
that assigns internal leaders or managers (within SDC) by local entity in a geographic-sectoral matrix to
organize interventions.
On an exceptional basis or under special circumstances, SDC may implement sectoral interventions
when financial constraints limit the capacity to use an integrated approach, but only in areas where it
has worked previously and with proven partnerships (implementers and local counterparts) and in sec-
tors in which it has proven intervention capacity.
29
With population between 20 to 100 thousand 30
Yapacaní, San Julián, Ascensión de Guarayos, Entre Ríos and Puerto Villarroel
5
2. Intervention, Monitoring and Evaluation. SDC must establish an organizational framework for the
definition of impact chains and monitoring systems to minimize risks and maximize results. Additionally,
an integrated approach and intervention requires generating multi-sectoral and multi-territorial spaces
for M&E for the allocation and control of resources. Additionally, local governments must be engaged
and supported to implement monitoring systems for measuring progress in levels of governance, service
delivery and ownership. This may also require generating open discussion mechanisms to evaluate insti-
tutional performance and decision making to achieve results.
3. Achievement of Impacts and Sustainability. The achievement of impact and sustainability with inte-
grated and joint interventions requires the evaluation of the initial chain of impacts. This implies devel-
oping processes of evaluation of results, effects and impacts, and the identification and systematization
of good practices and practices to be improved31. While this is standard practice in project implementa-
tion, when working in urban areas, it is an objective in itself, due to the high complexity of urban sys-
tems, multiple stakeholders and scale of services.
The evolution of the portfolio and project objectives
SDC must be Integrated and focused. A portfolio in which the most prevalent urban issues addressed
through several atomized projects faces the risks of not solving all them and just settling for temporary
improvements. Therefore, SDC’s portfolio may evolve primarily on:
Access to public services32
Employment and income generation
It may be tempting to wish for more detail on, for example, which services should be focused on, or
even which sectors or industries to focus on employment, but the change in a territorial approach man-
dates that SDC must first focus on where and then identify the issues that need to be addressed within
the two recommended areas.
Climate Change and Resilience should be mandatory crosscutting themes on every urban program. No
urban area is to be spared from the effects from climate change, big or small. Moreover, urban areas in
developing countries are especially vulnerable facing shortages to the supply of basic services, risks to
families and properties, food supply and environmental degradation. Therefore, a special focus is rec-
ommended for:
• Environmental impact mitigation
• Urban risk reduction
Additionally, it is ideal to mainstream food supply into the thematic area of employment and income
generation, and to mainstream sustainable access to safe drinking water into the provision of public
services. Finally, of great relevance in urban areas because of the elevated number of citizens in situa-
tion of vulnerability and within the “urban delivery gap” mentioned earlier, are gender and governance,
which should be mandatory crosscutting themes.
31
Must be complemented with closure strategies, based on actions aimed at the sustainability of the achieved changes, including transferring to counterparts’ processes, good practices, and tools. 32
With emphasis to justice, gender and youth, human rights, equal opportunities and citizenship
6
Potential for Partnerships
Making alliances is not new to SDC, as most of its activities are implemented by third parties in collabo-
ration with local governments, grassroots organizations, national sectoral entities, etc. Nevertheless, as
it aims to generate impact in urban environments, it is all about scale, as challenges tend to require time
and enormous resources to overcome negative tendencies with big momentum associated with thou-
sands of citizens.
This document maintains that to achieve sustainable impacts, the assistance must be focused on local
governments, must be integrated or multi-sectoral, and need to reach sufficient critical mass to gener-
ate sustainable change. If SDC is not in a position to orchestrate this scenario, it must seek partnerships
with other actors who are. The urban development landscape is rather sparse in Bolivia as the Central
Government does not have specific development policies for these geographical areas. Therefore SDC
may have to piece together available local and national actors to reach the necessary critical mass. Be-
cause of their size, the World Bank, IADB, and CAF are among those that approach urban development
from an integrated perspective, but their programs have limited reach and will not always have the
same geographical priorities as SDC. Nevertheless, they are a rich source of knowledge open to all.
While other donors tend to act on a sectoral basis and others are may even have high urban relevance,
SDC will have to act as the champion to create urban synergies with their programs.
The single most important partners are therefore local governments, with whom it is possible to build
constructive relationships over time, finding common ground and generating sustainability in areas of
common interest. By providing feedback and working with the Central Government on specific urban
issues, SDC will progressively gain the know-how to focus more of its attention on these geographical
areas and to find them as both object and vehicle to implement its development objectives.

7
References
1. Informe de Desarrollo Humano de Bolivia, El Rostro de Bolivia - Transformación Social y
Metropolización, PNUD, 2016
2. Pobreza y movilidad social en la última década, BID, 2015
3. Ciudad sin frontera – La multilocalidad urbana-rural en Bolivia, Cielo y Antequera, 2012
4. Bolivia Seguridad Alimentaria y pobreza urbana, Fundación Alternativas, 2015
5. Tendencias urbanas en Bolivia: oportunidades y Desafíos, Banco Mundial, 2014
6. Efectos de la migración (rural-urbana). Caso: educación trabajo, Eduardo Valencia Flores, sin fecha
7. Migración Rural-Urbana en Bolivia: Ventajas y Desventajas, Lykke E. Andersen, 2002
8. Urbanization & Migration in the Developing World, University of Minnesota, 2015
9. World Cities Report 2016, Urbanization and Development: Emerging Futures, UN Habitat, 2016
10. Integrating the three dimensions of sustainable development, United Nations, 2015
8
Annexes
Annex 1 – Urban Competencies of Territorial Entities
Annex 2 – Donor Mapping in Urban Topics
Annex 3 – Migration
Annex 4 – Views on the Draft Issue Paper’s Recommendation to SDC to Intervene in Urban Contexts
Annex 5 – Urban Population, Migration and Access to Services
Annex 6 – Urban and SDC’s Municipalities
Annex 7 – Prioritization of Urban Areas
Annex 8 – Map of Bolivia Showing Main Urban Areas
Annex 9 – Presentation for discussion: Bolivia Country Study on Urban Development Opportunities
Annex 10 – TORs Bolivia Country Study on Urban Development Opportunities
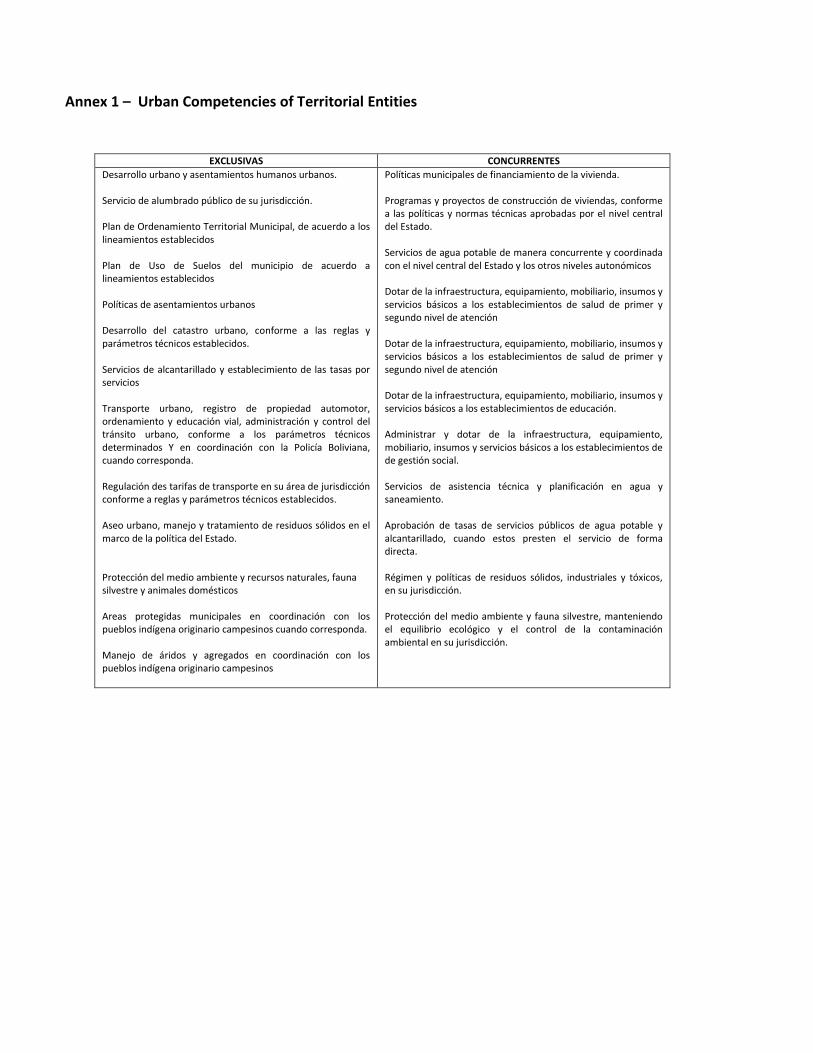
Annex 1 – Urban Competencies of Territorial Entities
EXCLUSIVAS CONCURRENTES
Desarrollo urbano y asentamientos humanos urbanos. Servicio de alumbrado público de su jurisdicción. Plan de Ordenamiento Territorial Municipal, de acuerdo a los lineamientos establecidos Plan de Uso de Suelos del municipio de acuerdo a lineamientos establecidos Políticas de asentamientos urbanos Desarrollo del catastro urbano, conforme a las reglas y parámetros técnicos establecidos. Servicios de alcantarillado y establecimiento de las tasas por servicios Transporte urbano, registro de propiedad automotor, ordenamiento y educación vial, administración y control del tránsito urbano, conforme a los parámetros técnicos determinados Y en coordinación con la Policía Boliviana, cuando corresponda. Regulación des tarifas de transporte en su área de jurisdicción conforme a reglas y parámetros técnicos establecidos. Aseo urbano, manejo y tratamiento de residuos sólidos en el marco de la política del Estado. Protección del medio ambiente y recursos naturales, fauna silvestre y animales domésticos Areas protegidas municipales en coordinación con los pueblos indígena originario campesinos cuando corresponda. Manejo de áridos y agregados en coordinación con los pueblos indígena originario campesinos
Políticas municipales de financiamiento de la vivienda. Programas y proyectos de construcción de viviendas, conforme a las políticas y normas técnicas aprobadas por el nivel central del Estado. Servicios de agua potable de manera concurrente y coordinada con el nivel central del Estado y los otros niveles autonómicos Dotar de la infraestructura, equipamiento, mobiliario, insumos y servicios básicos a los establecimientos de salud de primer y segundo nivel de atención Dotar de la infraestructura, equipamiento, mobiliario, insumos y servicios básicos a los establecimientos de salud de primer y segundo nivel de atención
Dotar de la infraestructura, equipamiento, mobiliario, insumos y servicios básicos a los establecimientos de educación. Administrar y dotar de la infraestructura, equipamiento, mobiliario, insumos y servicios básicos a los establecimientos de de gestión social. Servicios de asistencia técnica y planificación en agua y saneamiento. Aprobación de tasas de servicios públicos de agua potable y alcantarillado, cuando estos presten el servicio de forma directa. Régimen y políticas de residuos sólidos, industriales y tóxicos, en su jurisdicción. Protección del medio ambiente y fauna silvestre, manteniendo el equilibrio ecológico y el control de la contaminación ambiental en su jurisdicción.
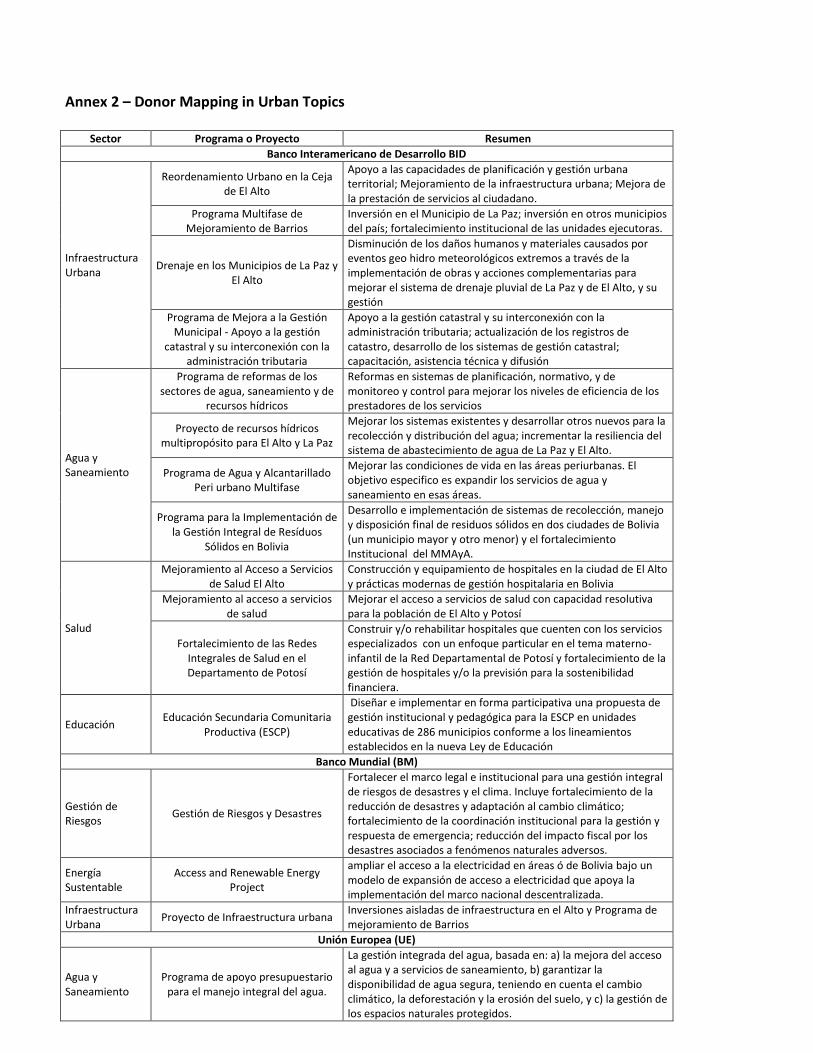
Annex 2 – Donor Mapping in Urban Topics
Sector Programa o Proyecto Resumen
Banco Interamericano de Desarrollo BID
Infraestructura Urbana
Reordenamiento Urbano en la Ceja de El Alto
Apoyo a las capacidades de planificación y gestión urbana territorial; Mejoramiento de la infraestructura urbana; Mejora de la prestación de servicios al ciudadano.
Programa Multifase de Mejoramiento de Barrios
Inversión en el Municipio de La Paz; inversión en otros municipios del país; fortalecimiento institucional de las unidades ejecutoras.
Drenaje en los Municipios de La Paz y El Alto
Disminución de los daños humanos y materiales causados por eventos geo hidro meteorológicos extremos a través de la implementación de obras y acciones complementarias para mejorar el sistema de drenaje pluvial de La Paz y de El Alto, y su gestión
Programa de Mejora a la Gestión Municipal - Apoyo a la gestión
catastral y su interconexión con la administración tributaria
Apoyo a la gestión catastral y su interconexión con la administración tributaria; actualización de los registros de catastro, desarrollo de los sistemas de gestión catastral; capacitación, asistencia técnica y difusión
Agua y Saneamiento
Programa de reformas de los sectores de agua, saneamiento y de
recursos hídricos
Reformas en sistemas de planificación, normativo, y de monitoreo y control para mejorar los niveles de eficiencia de los prestadores de los servicios
Proyecto de recursos hídricos multipropósito para El Alto y La Paz
Mejorar los sistemas existentes y desarrollar otros nuevos para la recolección y distribución del agua; incrementar la resiliencia del sistema de abastecimiento de agua de La Paz y El Alto.
Programa de Agua y Alcantarillado Peri urbano Multifase
Mejorar las condiciones de vida en las áreas periurbanas. El objetivo especifico es expandir los servicios de agua y saneamiento en esas áreas.
Programa para la Implementación de la Gestión Integral de Resíduos
Sólidos en Bolivia
Desarrollo e implementación de sistemas de recolección, manejo y disposición final de residuos sólidos en dos ciudades de Bolivia (un municipio mayor y otro menor) y el fortalecimiento Institucional del MMAyA.
Salud
Mejoramiento al Acceso a Servicios de Salud El Alto
Construcción y equipamiento de hospitales en la ciudad de El Alto y prácticas modernas de gestión hospitalaria en Bolivia
Mejoramiento al acceso a servicios de salud
Mejorar el acceso a servicios de salud con capacidad resolutiva para la población de El Alto y Potosí
Fortalecimiento de las Redes Integrales de Salud en el Departamento de Potosí
Construir y/o rehabilitar hospitales que cuenten con los servicios especializados con un enfoque particular en el tema materno-infantil de la Red Departamental de Potosí y fortalecimiento de la gestión de hospitales y/o la previsión para la sostenibilidad financiera.
Educación Educación Secundaria Comunitaria
Productiva (ESCP)
Diseñar e implementar en forma participativa una propuesta de gestión institucional y pedagógica para la ESCP en unidades educativas de 286 municipios conforme a los lineamientos establecidos en la nueva Ley de Educación
Banco Mundial (BM)
Gestión de Riesgos
Gestión de Riesgos y Desastres
Fortalecer el marco legal e institucional para una gestión integral de riesgos de desastres y el clima. Incluye fortalecimiento de la reducción de desastres y adaptación al cambio climático; fortalecimiento de la coordinación institucional para la gestión y respuesta de emergencia; reducción del impacto fiscal por los desastres asociados a fenómenos naturales adversos.
Energía Sustentable
Access and Renewable Energy Project
ampliar el acceso a la electricidad en áreas ó de Bolivia bajo un modelo de expansión de acceso a electricidad que apoya la implementación del marco nacional descentralizada.
Infraestructura Urbana
Proyecto de Infraestructura urbana Inversiones aisladas de infraestructura en el Alto y Programa de mejoramiento de Barrios
Unión Europea (UE)
Agua y Saneamiento
Programa de apoyo presupuestario para el manejo integral del agua.
La gestión integrada del agua, basada en: a) la mejora del acceso al agua y a servicios de saneamiento, b) garantizar la disponibilidad de agua segura, teniendo en cuenta el cambio climático, la deforestación y la erosión del suelo, y c) la gestión de los espacios naturales protegidos.
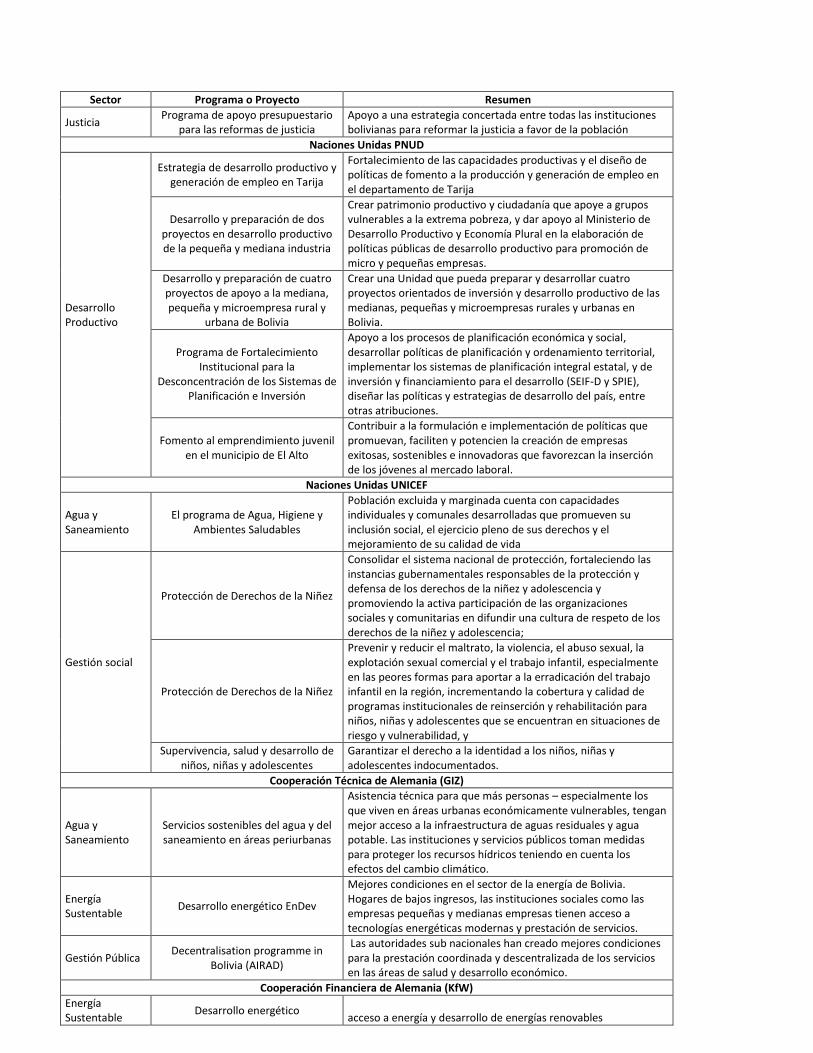
Sector Programa o Proyecto Resumen
Justicia Programa de apoyo presupuestario
para las reformas de justicia Apoyo a una estrategia concertada entre todas las instituciones bolivianas para reformar la justicia a favor de la población
Naciones Unidas PNUD
Desarrollo Productivo
Estrategia de desarrollo productivo y generación de empleo en Tarija
Fortalecimiento de las capacidades productivas y el diseño de políticas de fomento a la producción y generación de empleo en el departamento de Tarija
Desarrollo y preparación de dos proyectos en desarrollo productivo de la pequeña y mediana industria
Crear patrimonio productivo y ciudadanía que apoye a grupos vulnerables a la extrema pobreza, y dar apoyo al Ministerio de Desarrollo Productivo y Economía Plural en la elaboración de políticas públicas de desarrollo productivo para promoción de micro y pequeñas empresas.
Desarrollo y preparación de cuatro proyectos de apoyo a la mediana, pequeña y microempresa rural y
urbana de Bolivia
Crear una Unidad que pueda preparar y desarrollar cuatro proyectos orientados de inversión y desarrollo productivo de las medianas, pequeñas y microempresas rurales y urbanas en Bolivia.
Programa de Fortalecimiento Institucional para la
Desconcentración de los Sistemas de Planificación e Inversión
Apoyo a los procesos de planificación económica y social, desarrollar políticas de planificación y ordenamiento territorial, implementar los sistemas de planificación integral estatal, y de inversión y financiamiento para el desarrollo (SEIF-D y SPIE), diseñar las políticas y estrategias de desarrollo del país, entre otras atribuciones.
Fomento al emprendimiento juvenil en el municipio de El Alto
Contribuir a la formulación e implementación de políticas que promuevan, faciliten y potencien la creación de empresas exitosas, sostenibles e innovadoras que favorezcan la inserción de los jóvenes al mercado laboral.
Naciones Unidas UNICEF
Agua y Saneamiento
El programa de Agua, Higiene y Ambientes Saludables
Población excluida y marginada cuenta con capacidades individuales y comunales desarrolladas que promueven su inclusión social, el ejercicio pleno de sus derechos y el mejoramiento de su calidad de vida
Gestión social
Protección de Derechos de la Niñez
Consolidar el sistema nacional de protección, fortaleciendo las instancias gubernamentales responsables de la protección y defensa de los derechos de la niñez y adolescencia y promoviendo la activa participación de las organizaciones sociales y comunitarias en difundir una cultura de respeto de los derechos de la niñez y adolescencia;
Protección de Derechos de la Niñez
Prevenir y reducir el maltrato, la violencia, el abuso sexual, la explotación sexual comercial y el trabajo infantil, especialmente en las peores formas para aportar a la erradicación del trabajo infantil en la región, incrementando la cobertura y calidad de programas institucionales de reinserción y rehabilitación para niños, niñas y adolescentes que se encuentran en situaciones de riesgo y vulnerabilidad, y
Supervivencia, salud y desarrollo de niños, niñas y adolescentes
Garantizar el derecho a la identidad a los niños, niñas y adolescentes indocumentados.
Cooperación Técnica de Alemania (GIZ)
Agua y Saneamiento
Servicios sostenibles del agua y del saneamiento en áreas periurbanas
Asistencia técnica para que más personas – especialmente los que viven en áreas urbanas económicamente vulnerables, tengan mejor acceso a la infraestructura de aguas residuales y agua potable. Las instituciones y servicios públicos toman medidas para proteger los recursos hídricos teniendo en cuenta los efectos del cambio climático.
Energía Sustentable
Desarrollo energético EnDev
Mejores condiciones en el sector de la energía de Bolivia. Hogares de bajos ingresos, las instituciones sociales como las empresas pequeñas y medianas empresas tienen acceso a tecnologías energéticas modernas y prestación de servicios.
Gestión Pública Decentralisation programme in
Bolivia (AIRAD)
Las autoridades sub nacionales han creado mejores condiciones para la prestación coordinada y descentralizada de los servicios en las áreas de salud y desarrollo económico.
Cooperación Financiera de Alemania (KfW)
Energía Sustentable
Desarrollo energético acceso a energía y desarrollo de energías renovables

Sector Programa o Proyecto Resumen
Agua y Saneamiento
Servicios sostenibles del agua y del saneamiento en áreas periurbanas
Mejorar las condiciones de vida en las áreas periurbanas. El objetivo especifico es expandir los servicios de agua y saneamiento en esas áreas
Corporación Andina de Fomento (CAF)
Recursos Hídricos
PROGRAMA DE AGUA, SANEAMIENTO, RESIDUOS SOLIDOS Y
DRENAJE PLUVIAL - PROASRED En estudio
Agua y Saneamiento
Programas Mas Inversión para Agua MIAGUA
Sistemas de agua segura en poblaciones rurales y ciudades intermedias
Cooperación Española (AECID)
Agua y Saneamiento
Fondo Español - Agua y Saneamiento Zonas Periféricas
Inversión para el tratamiento y distribución de agua potable, como también la recolección y el tratamiento de los residuos de agua en la áreas peri urbanas. Asistencia técnica para los operadores para el conocimiento del criterio financiero y operacional.
Gestión Pública Programa de Apoyo a Autonomías Apoyo al Plan Nacional de Descentralización con Autonomía del Ministerio de Autonomía boliviano
Gestión Pública Programa de Apoyo al sistema
Asociativo Municipal
Apoyo a la participación y propuesta del modelo autonómico descentralizado por parte de los municipios del país, asociados en la Federación de Asociaciones Municipales de Bolivia, FAM.
Educación Apoyo presupuestario al sector
educación
La subvención al gobierno en función del plan sectorial buscando en todo momento que los recursos financieros, respondan a una política, un plan de actuación y un plan de gasto único, bajo el liderazgo del gobierno.
Salud Programa de atención móvil sanitaria
en Bolivia (Fase II)
Respuesta a las emergencias pre hospitalarias y sistema de referencias de pacientes críticos en el medio urbano priorizado. Gestión local descentralizada para la planificación e implementación del sistema de atención móvil, con la participación de organizaciones comunitarias locales (sector salud, sector social y gobierno municipal)
Cooperación del Japón (JICA)
Agua y Saneamiento
Ampliación sistema de agua Mejoramiento de sistemas de agua potable en Cochabamba, Beni y Pando
Gestión de Riesgos
Gestión de Riesgos y Desastres Sistema de Asistencia de Emergencia para Alivio de Desastres
Educación Mejoras Infraestructura en
Educación Proyecto de Construcción de Infraestructuras Educativas de los Municipios de Potosí y Sucre
Cooperación de Suecia (ASDI)
Educación Apoyo presupuestario al sector
educación
Apoyo presupuestario al plan sectorial buscando en todo momento que los recursos financieros, respondan a una política, un plan de actuación y un plan de gasto único, bajo el liderazgo del gobierno.
Recursos Hídricos
Recursos naturales, medio ambiente y cambio climático
Plan Nacional de Cuencas y sistemas descentralizados de saneamiento
Agua y Saneamiento
Servicios sostenibles del agua y del saneamiento en áreas periurbanas
Apoyo presupuestarios para el incremento del acceso sostenible al agua segura y a la disposición adecuada de excretas.
Cooperación de Dinamarca (DANIDA)
Justicia Ejercicio de los derechos y el acceso
a la justicia
Transformar su sistema judicial, modernizarlo, procurar sea accesible, y democrático y transparente, y, lograr la confianza de sus ciudadanos en el sistema.
Desarrollo Productivo y Empleo
Crecimiento económico inclusivo y sostenible
Programa se llama JIWASA* (*vocablo aymara que en español significa “todos nosotros”) asistirá con el 70% del financiamiento a las Pymes en los rubros de alimentos, textiles, metal mecánica, carpintería y cuero, con una contraparte local del 30%, focalizando su accionar en superar obstáculos comunes como la estandarización de los productos y la productividad de las Pymes.
Energía Sustentable
La gestión sostenible de los recursos naturales y el cambio climático
Planta de energía solar para la ciudad de Cobija
Cooperación de Bélgica
Recursos Hídricos
Asistencia técnica a programas de recursos hídricos y agua
Plan Nacional de Cuencas y asistencia técnica al sector agua y saneamiento

Sector Programa o Proyecto Resumen
Cooperación Coreana (KOICA)
Salud Infraestructura en salud
Construcción de dos hospitales de tercer nivel en las ciudades de Oruro y El Alto
Agua y saneamiento
Servicios sostenibles del agua y del saneamiento
Sistema de agua potable en el municipio cruceño de Ascensión de Guarayos
Annex 3 – Migration The country's migratory patterns have varied significantly over the last 40 years, and are having a notable
impact on the demographic distribution between rural and urban areas. Various factors have changed the
population composition of the country, generating very dynamic urban areas and demographically static
rural areas. Population size and composition in urban and rural areas make it possible to appreciate a
broad-based pyramidal structure, with a gradual increase in the young population as characteristic
features of a process of moderate demographic transition (UNFPA, 2010). In rural areas, between 1976
and 2012, the volume and composition of the population has remained stable and there is even a slight
reduction in the population under 15 years of age during the last decade. In urban areas, on the contrary,
from 2001 to 2012, the urban population under 15 years of age continued to grow, while the population
between 20 and 40 years in urban areas increased by more than 25% (or 35,000 people more for each
age).
About 65% of internal migrants in Bolivia have moved from the countryside to the city or between capital
cities. According to the 2012 census, between seven and eight out of every one hundred homes in Bolivia
changed their place of residence during the last five years; 57 per cent of migrant households reside in
departmental capital cities and 9 per cent in intermediate cities with more than 20,000 inhabitants. The
two most frequent types of migration are: households that originate in rural areas and are destined for
capital cities (29%) and households that move from one capital city to another capital city (22%).
The sustained decline of the rural population in relative terms is due to several factors of expulsion that
have been present. First, rural areas have a historical legacy of inequality in land distribution and access,
as two types of production are present: one is associated with the agrarian exploitation of large tracts of
land, which today Is related to development models based on the productive and export potential of the
large agricultural properties, and the other linked to small rural property, usually in the hands of peasants,
with a productive and technological backwardness. In this context, small rural property is dedicated to
subsistence activities, in a scenario of difficult and expensive access to basic, educational, health services
and information and communication technologies, reasons for which, particularly the young and old
population To work, she feels obliged to migrate to mainly urban areas.
This phenomenon may lead to an advance in the process of demographic aging in rural areas, a
phenomenon not yet clearly perceived in Bolivia. Migration from the countryside to the city has a
significant impact on rural areas, both in moderating their growth and in the aging of the population. As
the population that migrates from rural to urban areas is mostly of working age, the expected result is
premature aging of the countryside (ECLAC, 2012)
From an economic perspective, rural settlements close to cities would benefit from positive externalities
that may promote greater agricultural development, given the direct integration with growing consumer
markets. This integration approach aims to generate linkages from the urban centers to the rural
environment through the growing demand for agricultural goods, with urban and rural counterparts in the
provision of services and infrastructure and the transfer of remittances generated by the migrant
population. As an indirect benefit, agriculture, in regions with profitable agricultural exploitation, can
improve its productivity, achieving better prices for its products and better remuneration for work.
However, it is necessary to study in detail and collect information to verify if the pattern of urban
development in Bolivia, differentiated regions, effectively contributes to promote this rural development
and evaluate that it is necessary to promote, so that the potential benefits materialize.
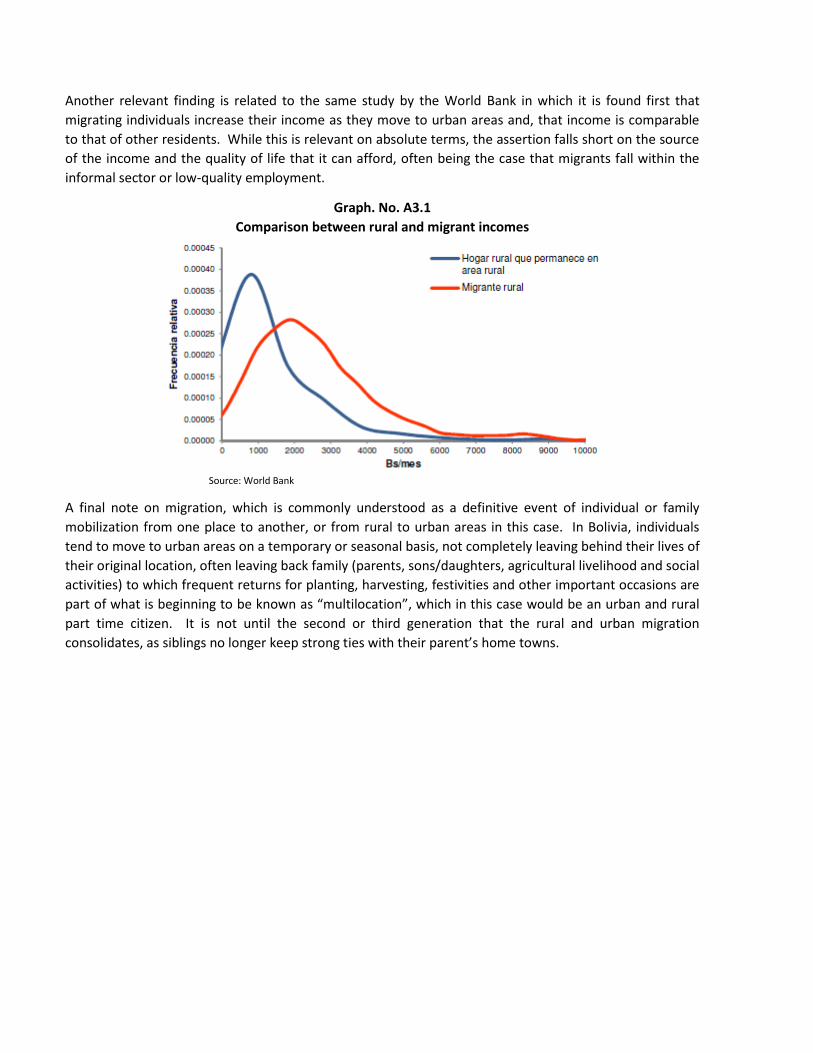
Another relevant finding is related to the same study by the World Bank in which it is found first that
migrating individuals increase their income as they move to urban areas and, that income is comparable
to that of other residents. While this is relevant on absolute terms, the assertion falls short on the source
of the income and the quality of life that it can afford, often being the case that migrants fall within the
informal sector or low-quality employment.
Graph. No. A3.1
Comparison between rural and migrant incomes
Source: World Bank
A final note on migration, which is commonly understood as a definitive event of individual or family
mobilization from one place to another, or from rural to urban areas in this case. In Bolivia, individuals
tend to move to urban areas on a temporary or seasonal basis, not completely leaving behind their lives of
their original location, often leaving back family (parents, sons/daughters, agricultural livelihood and social
activities) to which frequent returns for planting, harvesting, festivities and other important occasions are
part of what is beginning to be known as “multilocation”, which in this case would be an urban and rural
part time citizen. It is not until the second or third generation that the rural and urban migration
consolidates, as siblings no longer keep strong ties with their parent’s home towns.
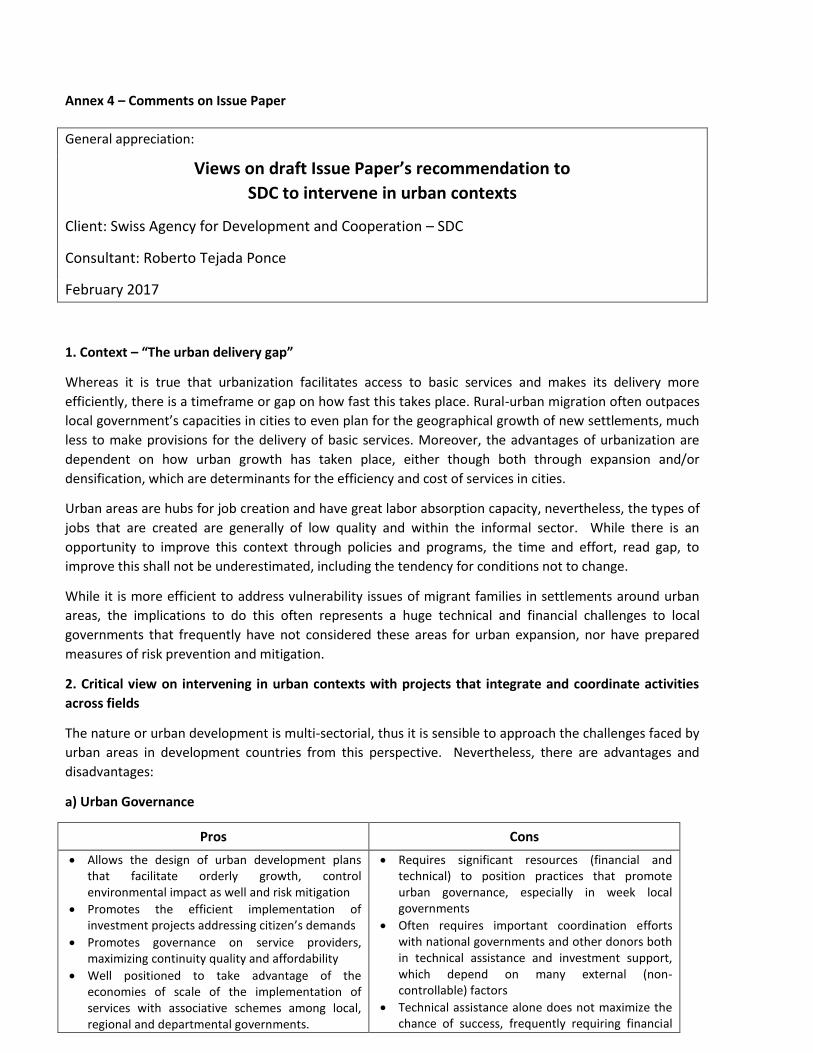
Annex 4 – Comments on Issue Paper
General appreciation:
Views on draft Issue Paper’s recommendation to
SDC to intervene in urban contexts
Client: Swiss Agency for Development and Cooperation – SDC
Consultant: Roberto Tejada Ponce
February 2017
1. Context – “The urban delivery gap”
Whereas it is true that urbanization facilitates access to basic services and makes its delivery more
efficiently, there is a timeframe or gap on how fast this takes place. Rural-urban migration often outpaces
local government’s capacities in cities to even plan for the geographical growth of new settlements, much
less to make provisions for the delivery of basic services. Moreover, the advantages of urbanization are
dependent on how urban growth has taken place, either though both through expansion and/or
densification, which are determinants for the efficiency and cost of services in cities.
Urban areas are hubs for job creation and have great labor absorption capacity, nevertheless, the types of
jobs that are created are generally of low quality and within the informal sector. While there is an
opportunity to improve this context through policies and programs, the time and effort, read gap, to
improve this shall not be underestimated, including the tendency for conditions not to change.
While it is more efficient to address vulnerability issues of migrant families in settlements around urban
areas, the implications to do this often represents a huge technical and financial challenges to local
governments that frequently have not considered these areas for urban expansion, nor have prepared
measures of risk prevention and mitigation.
2. Critical view on intervening in urban contexts with projects that integrate and coordinate activities
across fields
The nature or urban development is multi-sectorial, thus it is sensible to approach the challenges faced by
urban areas in development countries from this perspective. Nevertheless, there are advantages and
disadvantages:
a) Urban Governance
Pros Cons
Allows the design of urban development plans that facilitate orderly growth, control environmental impact as well and risk mitigation
Promotes the efficient implementation of investment projects addressing citizen’s demands
Promotes governance on service providers, maximizing continuity quality and affordability
Well positioned to take advantage of the economies of scale of the implementation of services with associative schemes among local, regional and departmental governments.
Requires significant resources (financial and technical) to position practices that promote urban governance, especially in week local governments
Often requires important coordination efforts with national governments and other donors both in technical assistance and investment support, which depend on many external (non-controllable) factors
Technical assistance alone does not maximize the chance of success, frequently requiring financial

Can optimize customer service with decentralized schemes through sub-municipal services
support incentives
b) Economic development and decent employment
Pros Cons
Generates high interest from local governments to undertake this type of activities, but the rate of success has been varied so far
1
Availability of several successful practices that could be applied on north-south and south-south schemes
Generates awareness and support on local authorities who recognize that the evolution from a production economy to that of services requires better planned and orderly growth of cities, by densification and not by expansion
Facilitates the application of gender and inclusion policies, among other crosscutting themes
Requires significant efforts (technical and financial) to position successful programs
Faces absence of a minimal technical and even administrative capacity of local actors and decision makers which undermine the potential pace of implementation and results
Requires a set of incentives, being access to financing the most effective, to improve the chance of success, leaving technical assistance with limited capacity to change views and behavior
c) Environmentally sustainable and resilient urban development
Pros Cons
Allows for crosscutting approaches on environmental sustainability, climate change and risk management
Generates impact at the local level through the implementation of existing laws and regulations that often only apply on the national level
Complements governance and economic development (fields) through the implementation of sustainable development and resilient approaches in subnational governments
Requires significant efforts (technical and financial) to position successful programs,
Requires financial incentives to improve the chance of success
The overall assessment indicates that the advantages for a sectorial approach merit for SDC to opt for
such alternative. It must be bared that the coordination and integration in the fields of governance2,
employment3 and sustainable urban growth implicitly requires s significant effort for implementation
having an impact on the required financially and institutional resources will be greater to achieve results.
In addition, such approach also requires geographical focus to achieve economies of scales to support the
implementation services like solid waste management, water and/or transport. Furthermore, given that
the key to success is concentration and not dispersion4 of efforts, the available resources, including those
coordinated with other donors, must be must be proportional to the size of the urban areas to be
supported5 to have some level of effectiveness.
1 This is, in general terms. SDC’s own (and extensive) experience in the field may have yield different results
2 Governance should focus on improving service provision, regulation, planning and investment management
3 Economic development should focus on incentives to promote the supply and demand for employment.
4 When supporting urban areas, the gains and externalities are in the sum of lines of actions (such as the suggested
three areas) rather than isolated sectorial support. 5 Which may include rural areas
Finally, support to urban areas must be applied in all three areas6, given the high level of complementarity,
and perhaps most importantly, the interdependency, that they have. The contrary could diminish the
chance of any success given that a critical mass of support must be reached for change to take place.
Overall comments to the draft issue Paper
A.1 On exclusive urbanization. It is worthwhile noting that, some municipalities, are comprised of urban
and rural areas, the first covering a small area, but with the bulk of the population and the second large
land areas but sparsely populated. Nevertheless, local authorities tend to focus more on the needs of
citizens in urban areas without linking economic and social growth in surrounding rural areas.
A.2 On the role of secondary cities (non-primary) or intermediate cities. The relevance of this category
of cities should be carefully analyzed before considering its relevance within an urban development
strategy. For example, from a migration perspective, are these cities receiving or generating migrants?
Are citizens using them as a mid-point before moving to the big metropolitan areas? The answer to these
and other related questions will define if an urban growth strategy (or support to) needs to include them,
or just focus where the real growth and issues take place.
A.3 On making urbanization and cities more inclusive. The proposed actions are all highly desirable and
strategic, but the core of the challenge is the resources to make them happen. Local governments are
trapped in non-action given their limited resources and the size of the challenges, having to prioritize
investing fractions of what is needed to move towards the suggested direction. It should be
complemented with the means to do this, streamlined access to finance protected from political bias and
focused on specific sectors/actions.
A.4 On making economic growth more equitable. It should be carefully analyzed if job creation and
income improvement is part of an urban development strategy o, instead, the result of a healthy urban
development that facilitates business creation, entrepreneurship, and growth within a livable space that
generates opportunities for all.
A.5 On the need for substantive action. Interventions, in all institutional, technical, programmatic and
financial resources, must be pertinent to the scale of the issues they are planning to influence, change or
solve.
6 Including planning, investment management, and other crosscutting areas.
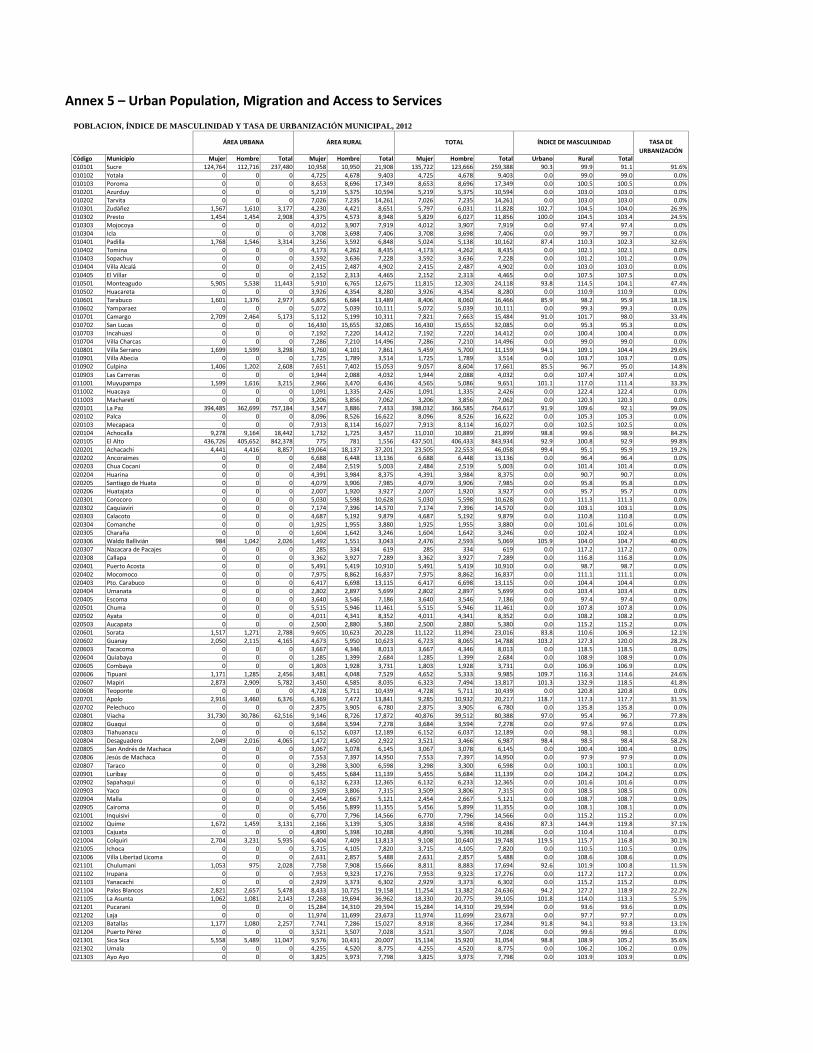
Annex 5 – Urban Population, Migration and Access to Services
POBLACION, ÍNDICE DE MASCULINIDAD Y TASA DE URBANIZACIÓN MUNICIPAL, 2012
ÁREA URBANA
ÁREA RURAL
TOTAL
ÍNDICE DE MASCULINIDAD
TASA DE
URBANIZACIÓN Código Municipio Mujer Hombre Total Mujer Hombre Total Mujer Hombre Total Urbano Rural Total 010101 Sucre 124,764 112,716 237,480 10,958 10,950 21,908 135,722 123,666 259,388 90.3 99.9 91.1 91.6%
010102 Yotala 0 0 0 4,725 4,678 9,403 4,725 4,678 9,403 0.0 99.0 99.0 0.0% 010103 Poroma 0 0 0 8,653 8,696 17,349 8,653 8,696 17,349 0.0 100.5 100.5 0.0% 010201 Azurduy 0 0 0 5,219 5,375 10,594 5,219 5,375 10,594 0.0 103.0 103.0 0.0% 010202 Tarvita 0 0 0 7,026 7,235 14,261 7,026 7,235 14,261 0.0 103.0 103.0 0.0% 010301 Zudáñez 1,567 1,610 3,177 4,230 4,421 8,651 5,797 6,031 11,828 102.7 104.5 104.0 26.9% 010302 Presto 1,454 1,454 2,908 4,375 4,573 8,948 5,829 6,027 11,856 100.0 104.5 103.4 24.5% 010303 Mojocoya 0 0 0 4,012 3,907 7,919 4,012 3,907 7,919 0.0 97.4 97.4 0.0% 010304 Icla 0 0 0 3,708 3,698 7,406 3,708 3,698 7,406 0.0 99.7 99.7 0.0% 010401 Padilla 1,768 1,546 3,314 3,256 3,592 6,848 5,024 5,138 10,162 87.4 110.3 102.3 32.6% 010402 Tomina 0 0 0 4,173 4,262 8,435 4,173 4,262 8,435 0.0 102.1 102.1 0.0% 010403 Sopachuy 0 0 0 3,592 3,636 7,228 3,592 3,636 7,228 0.0 101.2 101.2 0.0% 010404 Villa Alcalá 0 0 0 2,415 2,487 4,902 2,415 2,487 4,902 0.0 103.0 103.0 0.0%
010405 El Villar 0 0 0 2,152 2,313 4,465 2,152 2,313 4,465 0.0 107.5 107.5 0.0% 010501 Monteagudo 5,905 5,538 11,443 5,910 6,765 12,675 11,815 12,303 24,118 93.8 114.5 104.1 47.4% 010502 Huacareta 0 0 0 3,926 4,354 8,280 3,926 4,354 8,280 0.0 110.9 110.9 0.0% 010601 Tarabuco 1,601 1,376 2,977 6,805 6,684 13,489 8,406 8,060 16,466 85.9 98.2 95.9 18.1% 010602 Yamparaez 0 0 0 5,072 5,039 10,111 5,072 5,039 10,111 0.0 99.3 99.3 0.0% 010701 Camargo 2,709 2,464 5,173 5,112 5,199 10,311 7,821 7,663 15,484 91.0 101.7 98.0 33.4% 010702 San Lucas 0 0 0 16,430 15,655 32,085 16,430 15,655 32,085 0.0 95.3 95.3 0.0% 010703 Incahuasi 0 0 0 7,192 7,220 14,412 7,192 7,220 14,412 0.0 100.4 100.4 0.0% 010704 Villa Charcas 0 0 0 7,286 7,210 14,496 7,286 7,210 14,496 0.0 99.0 99.0 0.0% 010801 Villa Serrano 1,699 1,599 3,298 3,760 4,101 7,861 5,459 5,700 11,159 94.1 109.1 104.4 29.6% 010901 Villa Abecia 0 0 0 1,725 1,789 3,514 1,725 1,789 3,514 0.0 103.7 103.7 0.0% 010902 Culpina 1,406 1,202 2,608 7,651 7,402 15,053 9,057 8,604 17,661 85.5 96.7 95.0 14.8%
010903 Las Carreras 0 0 0 1,944 2,088 4,032 1,944 2,088 4,032 0.0 107.4 107.4 0.0% 011001 Muyupampa 1,599 1,616 3,215 2,966 3,470 6,436 4,565 5,086 9,651 101.1 117.0 111.4 33.3% 011002 Huacaya 0 0 0 1,091 1,335 2,426 1,091 1,335 2,426 0.0 122.4 122.4 0.0% 011003 Macharetí 0 0 0 3,206 3,856 7,062 3,206 3,856 7,062 0.0 120.3 120.3 0.0% 020101 La Paz 394,485 362,699 757,184 3,547 3,886 7,433 398,032 366,585 764,617 91.9 109.6 92.1 99.0% 020102 Palca 0 0 0 8,096 8,526 16,622 8,096 8,526 16,622 0.0 105.3 105.3 0.0% 020103 Mecapaca 0 0 0 7,913 8,114 16,027 7,913 8,114 16,027 0.0 102.5 102.5 0.0% 020104 Achocalla 9,278 9,164 18,442 1,732 1,725 3,457 11,010 10,889 21,899 98.8 99.6 98.9 84.2% 020105 El Alto 436,726 405,652 842,378 775 781 1,556 437,501 406,433 843,934 92.9 100.8 92.9 99.8% 020201 Achacachi 4,441 4,416 8,857 19,064 18,137 37,201 23,505 22,553 46,058 99.4 95.1 95.9 19.2% 020202 Ancoraimes 0 0 0 6,688 6,448 13,136 6,688 6,448 13,136 0.0 96.4 96.4 0.0% 020203 Chua Cocani 0 0 0 2,484 2,519 5,003 2,484 2,519 5,003 0.0 101.4 101.4 0.0%
020204 Huarina 0 0 0 4,391 3,984 8,375 4,391 3,984 8,375 0.0 90.7 90.7 0.0% 020205 Santiago de Huata 0 0 0 4,079 3,906 7,985 4,079 3,906 7,985 0.0 95.8 95.8 0.0% 020206 Huatajata 0 0 0 2,007 1,920 3,927 2,007 1,920 3,927 0.0 95.7 95.7 0.0% 020301 Corocoro 0 0 0 5,030 5,598 10,628 5,030 5,598 10,628 0.0 111.3 111.3 0.0% 020302 Caquiaviri 0 0 0 7,174 7,396 14,570 7,174 7,396 14,570 0.0 103.1 103.1 0.0% 020303 Calacoto 0 0 0 4,687 5,192 9,879 4,687 5,192 9,879 0.0 110.8 110.8 0.0% 020304 Comanche 0 0 0 1,925 1,955 3,880 1,925 1,955 3,880 0.0 101.6 101.6 0.0% 020305 Charaña 0 0 0 1,604 1,642 3,246 1,604 1,642 3,246 0.0 102.4 102.4 0.0% 020306 Waldo Ballivián 984 1,042 2,026 1,492 1,551 3,043 2,476 2,593 5,069 105.9 104.0 104.7 40.0% 020307 Nazacara de Pacajes 0 0 0 285 334 619 285 334 619 0.0 117.2 117.2 0.0% 020308 Callapa 0 0 0 3,362 3,927 7,289 3,362 3,927 7,289 0.0 116.8 116.8 0.0%
020401 Puerto Acosta 0 0 0 5,491 5,419 10,910 5,491 5,419 10,910 0.0 98.7 98.7 0.0% 020402 Mocomoco 0 0 0 7,975 8,862 16,837 7,975 8,862 16,837 0.0 111.1 111.1 0.0% 020403 Pto. Carabuco 0 0 0 6,417 6,698 13,115 6,417 6,698 13,115 0.0 104.4 104.4 0.0% 020404 Umanata 0 0 0 2,802 2,897 5,699 2,802 2,897 5,699 0.0 103.4 103.4 0.0% 020405 Escoma 0 0 0 3,640 3,546 7,186 3,640 3,546 7,186 0.0 97.4 97.4 0.0% 020501 Chuma 0 0 0 5,515 5,946 11,461 5,515 5,946 11,461 0.0 107.8 107.8 0.0% 020502 Ayata 0 0 0 4,011 4,341 8,352 4,011 4,341 8,352 0.0 108.2 108.2 0.0% 020503 Aucapata 0 0 0 2,500 2,880 5,380 2,500 2,880 5,380 0.0 115.2 115.2 0.0% 020601 Sorata 1,517 1,271 2,788 9,605 10,623 20,228 11,122 11,894 23,016 83.8 110.6 106.9 12.1% 020602 Guanay 2,050 2,115 4,165 4,673 5,950 10,623 6,723 8,065 14,788 103.2 127.3 120.0 28.2% 020603 Tacacoma 0 0 0 3,667 4,346 8,013 3,667 4,346 8,013 0.0 118.5 118.5 0.0% 020604 Quiabaya 0 0 0 1,285 1,399 2,684 1,285 1,399 2,684 0.0 108.9 108.9 0.0%
020605 Combaya 0 0 0 1,803 1,928 3,731 1,803 1,928 3,731 0.0 106.9 106.9 0.0% 020606 Tipuani 1,171 1,285 2,456 3,481 4,048 7,529 4,652 5,333 9,985 109.7 116.3 114.6 24.6% 020607 Mapiri 2,873 2,909 5,782 3,450 4,585 8,035 6,323 7,494 13,817 101.3 132.9 118.5 41.8% 020608 Teoponte 0 0 0 4,728 5,711 10,439 4,728 5,711 10,439 0.0 120.8 120.8 0.0% 020701 Apolo 2,916 3,460 6,376 6,369 7,472 13,841 9,285 10,932 20,217 118.7 117.3 117.7 31.5% 020702 Pelechuco 0 0 0 2,875 3,905 6,780 2,875 3,905 6,780 0.0 135.8 135.8 0.0% 020801 Viacha 31,730 30,786 62,516 9,146 8,726 17,872 40,876 39,512 80,388 97.0 95.4 96.7 77.8% 020802 Guaqui 0 0 0 3,684 3,594 7,278 3,684 3,594 7,278 0.0 97.6 97.6 0.0% 020803 Tiahuanacu 0 0 0 6,152 6,037 12,189 6,152 6,037 12,189 0.0 98.1 98.1 0.0% 020804 Desaguadero 2,049 2,016 4,065 1,472 1,450 2,922 3,521 3,466 6,987 98.4 98.5 98.4 58.2% 020805 San Andrés de Machaca 0 0 0 3,067 3,078 6,145 3,067 3,078 6,145 0.0 100.4 100.4 0.0% 020806 Jesús de Machaca 0 0 0 7,553 7,397 14,950 7,553 7,397 14,950 0.0 97.9 97.9 0.0%
020807 Taraco 0 0 0 3,298 3,300 6,598 3,298 3,300 6,598 0.0 100.1 100.1 0.0% 020901 Luribay 0 0 0 5,455 5,684 11,139 5,455 5,684 11,139 0.0 104.2 104.2 0.0% 020902 Sapahaqui 0 0 0 6,132 6,233 12,365 6,132 6,233 12,365 0.0 101.6 101.6 0.0% 020903 Yaco 0 0 0 3,509 3,806 7,315 3,509 3,806 7,315 0.0 108.5 108.5 0.0% 020904 Malla 0 0 0 2,454 2,667 5,121 2,454 2,667 5,121 0.0 108.7 108.7 0.0% 020905 Cairoma 0 0 0 5,456 5,899 11,355 5,456 5,899 11,355 0.0 108.1 108.1 0.0% 021001 Inquisivi 0 0 0 6,770 7,796 14,566 6,770 7,796 14,566 0.0 115.2 115.2 0.0% 021002 Quime 1,672 1,459 3,131 2,166 3,139 5,305 3,838 4,598 8,436 87.3 144.9 119.8 37.1% 021003 Cajuata 0 0 0 4,890 5,398 10,288 4,890 5,398 10,288 0.0 110.4 110.4 0.0% 021004 Colquiri 2,704 3,231 5,935 6,404 7,409 13,813 9,108 10,640 19,748 119.5 115.7 116.8 30.1% 021005 Ichoca 0 0 0 3,715 4,105 7,820 3,715 4,105 7,820 0.0 110.5 110.5 0.0%
021006 Villa Libertad Licoma 0 0 0 2,631 2,857 5,488 2,631 2,857 5,488 0.0 108.6 108.6 0.0% 021101 Chulumani 1,053 975 2,028 7,758 7,908 15,666 8,811 8,883 17,694 92.6 101.9 100.8 11.5% 021102 Irupana 0 0 0 7,953 9,323 17,276 7,953 9,323 17,276 0.0 117.2 117.2 0.0% 021103 Yanacachi 0 0 0 2,929 3,373 6,302 2,929 3,373 6,302 0.0 115.2 115.2 0.0% 021104 Palos Blancos 2,821 2,657 5,478 8,433 10,725 19,158 11,254 13,382 24,636 94.2 127.2 118.9 22.2% 021105 La Asunta 1,062 1,081 2,143 17,268 19,694 36,962 18,330 20,775 39,105 101.8 114.0 113.3 5.5% 021201 Pucarani 0 0 0 15,284 14,310 29,594 15,284 14,310 29,594 0.0 93.6 93.6 0.0% 021202 Laja 0 0 0 11,974 11,699 23,673 11,974 11,699 23,673 0.0 97.7 97.7 0.0% 021203 Batallas 1,177 1,080 2,257 7,741 7,286 15,027 8,918 8,366 17,284 91.8 94.1 93.8 13.1% 021204 Puerto Pérez 0 0 0 3,521 3,507 7,028 3,521 3,507 7,028 0.0 99.6 99.6 0.0% 021301 Sica Sica 5,558 5,489 11,047 9,576 10,431 20,007 15,134 15,920 31,054 98.8 108.9 105.2 35.6% 021302 Umala 0 0 0 4,255 4,520 8,775 4,255 4,520 8,775 0.0 106.2 106.2 0.0%
021303 Ayo Ayo 0 0 0 3,825 3,973 7,798 3,825 3,973 7,798 0.0 103.9 103.9 0.0%
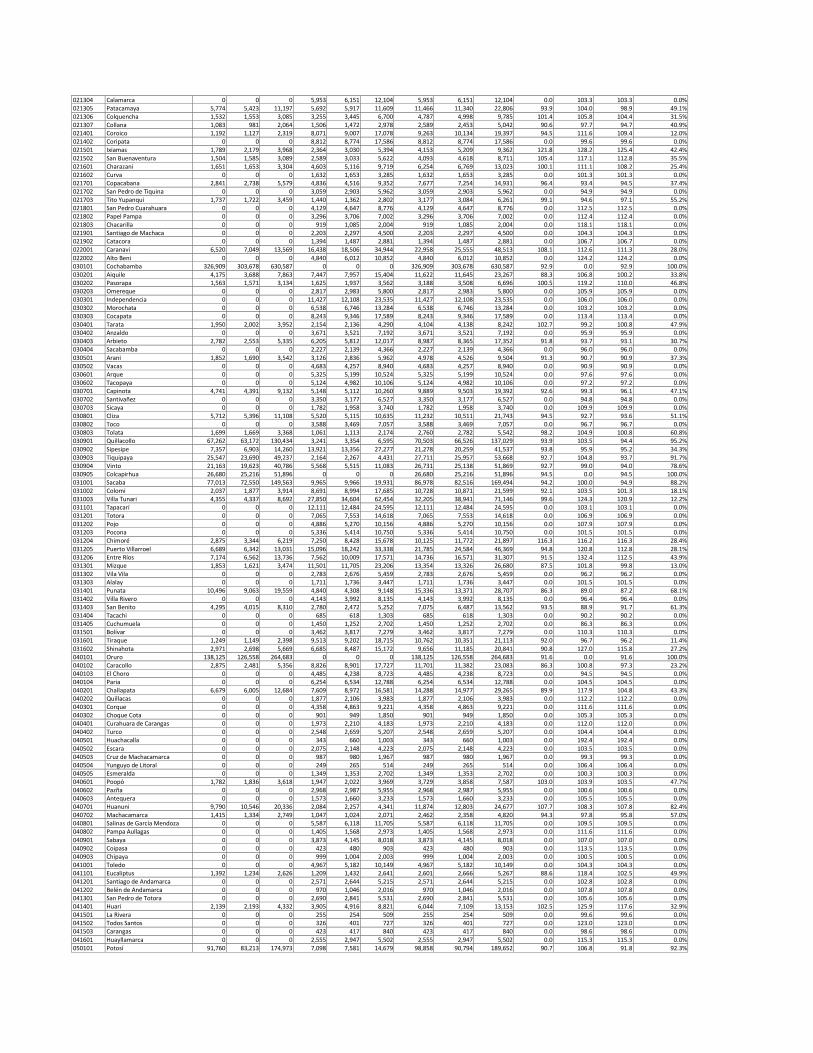
021304 Calamarca 0 0 0 5,953 6,151 12,104 5,953 6,151 12,104 0.0 103.3 103.3 0.0% 021305 Patacamaya 5,774 5,423 11,197 5,692 5,917 11,609 11,466 11,340 22,806 93.9 104.0 98.9 49.1% 021306 Colquencha 1,532 1,553 3,085 3,255 3,445 6,700 4,787 4,998 9,785 101.4 105.8 104.4 31.5% 021307 Collana 1,083 981 2,064 1,506 1,472 2,978 2,589 2,453 5,042 90.6 97.7 94.7 40.9% 021401 Coroico 1,192 1,127 2,319 8,071 9,007 17,078 9,263 10,134 19,397 94.5 111.6 109.4 12.0% 021402 Coripata 0 0 0 8,812 8,774 17,586 8,812 8,774 17,586 0.0 99.6 99.6 0.0% 021501 Ixiamas 1,789 2,179 3,968 2,364 3,030 5,394 4,153 5,209 9,362 121.8 128.2 125.4 42.4%
021502 San Buenaventura 1,504 1,585 3,089 2,589 3,033 5,622 4,093 4,618 8,711 105.4 117.1 112.8 35.5% 021601 Charazani 1,651 1,653 3,304 4,603 5,116 9,719 6,254 6,769 13,023 100.1 111.1 108.2 25.4% 021602 Curva 0 0 0 1,632 1,653 3,285 1,632 1,653 3,285 0.0 101.3 101.3 0.0% 021701 Copacabana 2,841 2,738 5,579 4,836 4,516 9,352 7,677 7,254 14,931 96.4 93.4 94.5 37.4% 021702 San Pedro de Tiquina 0 0 0 3,059 2,903 5,962 3,059 2,903 5,962 0.0 94.9 94.9 0.0% 021703 Tito Yupanqui 1,737 1,722 3,459 1,440 1,362 2,802 3,177 3,084 6,261 99.1 94.6 97.1 55.2% 021801 San Pedro Cuarahuara 0 0 0 4,129 4,647 8,776 4,129 4,647 8,776 0.0 112.5 112.5 0.0% 021802 Papel Pampa 0 0 0 3,296 3,706 7,002 3,296 3,706 7,002 0.0 112.4 112.4 0.0% 021803 Chacarilla 0 0 0 919 1,085 2,004 919 1,085 2,004 0.0 118.1 118.1 0.0% 021901 Santiago de Machaca 0 0 0 2,203 2,297 4,500 2,203 2,297 4,500 0.0 104.3 104.3 0.0% 021902 Catacora 0 0 0 1,394 1,487 2,881 1,394 1,487 2,881 0.0 106.7 106.7 0.0% 022001 Caranavi 6,520 7,049 13,569 16,438 18,506 34,944 22,958 25,555 48,513 108.1 112.6 111.3 28.0%
022002 Alto Beni 0 0 0 4,840 6,012 10,852 4,840 6,012 10,852 0.0 124.2 124.2 0.0% 030101 Cochabamba 326,909 303,678 630,587 0 0 0 326,909 303,678 630,587 92.9 0.0 92.9 100.0% 030201 Aiquile 4,175 3,688 7,863 7,447 7,957 15,404 11,622 11,645 23,267 88.3 106.8 100.2 33.8% 030202 Pasorapa 1,563 1,571 3,134 1,625 1,937 3,562 3,188 3,508 6,696 100.5 119.2 110.0 46.8% 030203 Omereque 0 0 0 2,817 2,983 5,800 2,817 2,983 5,800 0.0 105.9 105.9 0.0% 030301 Independencia 0 0 0 11,427 12,108 23,535 11,427 12,108 23,535 0.0 106.0 106.0 0.0% 030302 Morochata 0 0 0 6,538 6,746 13,284 6,538 6,746 13,284 0.0 103.2 103.2 0.0% 030303 Cocapata 0 0 0 8,243 9,346 17,589 8,243 9,346 17,589 0.0 113.4 113.4 0.0% 030401 Tarata 1,950 2,002 3,952 2,154 2,136 4,290 4,104 4,138 8,242 102.7 99.2 100.8 47.9% 030402 Anzaldo 0 0 0 3,671 3,521 7,192 3,671 3,521 7,192 0.0 95.9 95.9 0.0% 030403 Arbieto 2,782 2,553 5,335 6,205 5,812 12,017 8,987 8,365 17,352 91.8 93.7 93.1 30.7% 030404 Sacabamba 0 0 0 2,227 2,139 4,366 2,227 2,139 4,366 0.0 96.0 96.0 0.0%
030501 Arani 1,852 1,690 3,542 3,126 2,836 5,962 4,978 4,526 9,504 91.3 90.7 90.9 37.3% 030502 Vacas 0 0 0 4,683 4,257 8,940 4,683 4,257 8,940 0.0 90.9 90.9 0.0% 030601 Arque 0 0 0 5,325 5,199 10,524 5,325 5,199 10,524 0.0 97.6 97.6 0.0% 030602 Tacopaya 0 0 0 5,124 4,982 10,106 5,124 4,982 10,106 0.0 97.2 97.2 0.0% 030701 Capinota 4,741 4,391 9,132 5,148 5,112 10,260 9,889 9,503 19,392 92.6 99.3 96.1 47.1% 030702 Santivañez 0 0 0 3,350 3,177 6,527 3,350 3,177 6,527 0.0 94.8 94.8 0.0% 030703 Sicaya 0 0 0 1,782 1,958 3,740 1,782 1,958 3,740 0.0 109.9 109.9 0.0% 030801 Cliza 5,712 5,396 11,108 5,520 5,115 10,635 11,232 10,511 21,743 94.5 92.7 93.6 51.1% 030802 Toco 0 0 0 3,588 3,469 7,057 3,588 3,469 7,057 0.0 96.7 96.7 0.0% 030803 Tolata 1,699 1,669 3,368 1,061 1,113 2,174 2,760 2,782 5,542 98.2 104.9 100.8 60.8% 030901 Quillacollo 67,262 63,172 130,434 3,241 3,354 6,595 70,503 66,526 137,029 93.9 103.5 94.4 95.2%
030902 Sipesipe 7,357 6,903 14,260 13,921 13,356 27,277 21,278 20,259 41,537 93.8 95.9 95.2 34.3% 030903 Tiquipaya 25,547 23,690 49,237 2,164 2,267 4,431 27,711 25,957 53,668 92.7 104.8 93.7 91.7% 030904 Vinto 21,163 19,623 40,786 5,568 5,515 11,083 26,731 25,138 51,869 92.7 99.0 94.0 78.6% 030905 Colcapirhua 26,680 25,216 51,896 0 0 0 26,680 25,216 51,896 94.5 0.0 94.5 100.0% 031001 Sacaba 77,013 72,550 149,563 9,965 9,966 19,931 86,978 82,516 169,494 94.2 100.0 94.9 88.2% 031002 Colomi 2,037 1,877 3,914 8,691 8,994 17,685 10,728 10,871 21,599 92.1 103.5 101.3 18.1% 031003 Villa Tunari 4,355 4,337 8,692 27,850 34,604 62,454 32,205 38,941 71,146 99.6 124.3 120.9 12.2% 031101 Tapacarí 0 0 0 12,111 12,484 24,595 12,111 12,484 24,595 0.0 103.1 103.1 0.0% 031201 Totora 0 0 0 7,065 7,553 14,618 7,065 7,553 14,618 0.0 106.9 106.9 0.0% 031202 Pojo 0 0 0 4,886 5,270 10,156 4,886 5,270 10,156 0.0 107.9 107.9 0.0% 031203 Pocona 0 0 0 5,336 5,414 10,750 5,336 5,414 10,750 0.0 101.5 101.5 0.0% 031204 Chimoré 2,875 3,344 6,219 7,250 8,428 15,678 10,125 11,772 21,897 116.3 116.2 116.3 28.4%
031205 Puerto Villarroel 6,689 6,342 13,031 15,096 18,242 33,338 21,785 24,584 46,369 94.8 120.8 112.8 28.1% 031206 Entre Ríos 7,174 6,562 13,736 7,562 10,009 17,571 14,736 16,571 31,307 91.5 132.4 112.5 43.9% 031301 Mizque 1,853 1,621 3,474 11,501 11,705 23,206 13,354 13,326 26,680 87.5 101.8 99.8 13.0% 031302 Vila Vila 0 0 0 2,783 2,676 5,459 2,783 2,676 5,459 0.0 96.2 96.2 0.0% 031303 Alalay 0 0 0 1,711 1,736 3,447 1,711 1,736 3,447 0.0 101.5 101.5 0.0% 031401 Punata 10,496 9,063 19,559 4,840 4,308 9,148 15,336 13,371 28,707 86.3 89.0 87.2 68.1% 031402 Villa Rivero 0 0 0 4,143 3,992 8,135 4,143 3,992 8,135 0.0 96.4 96.4 0.0% 031403 San Benito 4,295 4,015 8,310 2,780 2,472 5,252 7,075 6,487 13,562 93.5 88.9 91.7 61.3% 031404 Tacachi 0 0 0 685 618 1,303 685 618 1,303 0.0 90.2 90.2 0.0% 031405 Cuchumuela 0 0 0 1,450 1,252 2,702 1,450 1,252 2,702 0.0 86.3 86.3 0.0% 031501 Bolívar 0 0 0 3,462 3,817 7,279 3,462 3,817 7,279 0.0 110.3 110.3 0.0% 031601 Tiraque 1,249 1,149 2,398 9,513 9,202 18,715 10,762 10,351 21,113 92.0 96.7 96.2 11.4%
031602 Shinahota 2,971 2,698 5,669 6,685 8,487 15,172 9,656 11,185 20,841 90.8 127.0 115.8 27.2% 040101 Oruro 138,125 126,558 264,683 0 0 0 138,125 126,558 264,683 91.6 0.0 91.6 100.0% 040102 Caracollo 2,875 2,481 5,356 8,826 8,901 17,727 11,701 11,382 23,083 86.3 100.8 97.3 23.2% 040103 El Choro 0 0 0 4,485 4,238 8,723 4,485 4,238 8,723 0.0 94.5 94.5 0.0% 040104 Paria 0 0 0 6,254 6,534 12,788 6,254 6,534 12,788 0.0 104.5 104.5 0.0% 040201 Challapata 6,679 6,005 12,684 7,609 8,972 16,581 14,288 14,977 29,265 89.9 117.9 104.8 43.3% 040202 Quillacas 0 0 0 1,877 2,106 3,983 1,877 2,106 3,983 0.0 112.2 112.2 0.0% 040301 Corque 0 0 0 4,358 4,863 9,221 4,358 4,863 9,221 0.0 111.6 111.6 0.0% 040302 Choque Cota 0 0 0 901 949 1,850 901 949 1,850 0.0 105.3 105.3 0.0% 040401 Curahuara de Carangas 0 0 0 1,973 2,210 4,183 1,973 2,210 4,183 0.0 112.0 112.0 0.0% 040402 Turco 0 0 0 2,548 2,659 5,207 2,548 2,659 5,207 0.0 104.4 104.4 0.0% 040501 Huachacalla 0 0 0 343 660 1,003 343 660 1,003 0.0 192.4 192.4 0.0%
040502 Escara 0 0 0 2,075 2,148 4,223 2,075 2,148 4,223 0.0 103.5 103.5 0.0% 040503 Cruz de Machacamarca 0 0 0 987 980 1,967 987 980 1,967 0.0 99.3 99.3 0.0% 040504 Yunguyo de Litoral 0 0 0 249 265 514 249 265 514 0.0 106.4 106.4 0.0% 040505 Esmeralda 0 0 0 1,349 1,353 2,702 1,349 1,353 2,702 0.0 100.3 100.3 0.0% 040601 Poopó 1,782 1,836 3,618 1,947 2,022 3,969 3,729 3,858 7,587 103.0 103.9 103.5 47.7% 040602 Pazña 0 0 0 2,968 2,987 5,955 2,968 2,987 5,955 0.0 100.6 100.6 0.0% 040603 Antequera 0 0 0 1,573 1,660 3,233 1,573 1,660 3,233 0.0 105.5 105.5 0.0% 040701 Huanuni 9,790 10,546 20,336 2,084 2,257 4,341 11,874 12,803 24,677 107.7 108.3 107.8 82.4% 040702 Machacamarca 1,415 1,334 2,749 1,047 1,024 2,071 2,462 2,358 4,820 94.3 97.8 95.8 57.0% 040801 Salinas de García Mendoza 0 0 0 5,587 6,118 11,705 5,587 6,118 11,705 0.0 109.5 109.5 0.0% 040802 Pampa Aullagas 0 0 0 1,405 1,568 2,973 1,405 1,568 2,973 0.0 111.6 111.6 0.0%
040901 Sabaya 0 0 0 3,873 4,145 8,018 3,873 4,145 8,018 0.0 107.0 107.0 0.0% 040902 Coipasa 0 0 0 423 480 903 423 480 903 0.0 113.5 113.5 0.0% 040903 Chipaya 0 0 0 999 1,004 2,003 999 1,004 2,003 0.0 100.5 100.5 0.0% 041001 Toledo 0 0 0 4,967 5,182 10,149 4,967 5,182 10,149 0.0 104.3 104.3 0.0% 041101 Eucaliptus 1,392 1,234 2,626 1,209 1,432 2,641 2,601 2,666 5,267 88.6 118.4 102.5 49.9% 041201 Santiago de Andamarca 0 0 0 2,571 2,644 5,215 2,571 2,644 5,215 0.0 102.8 102.8 0.0% 041202 Belén de Andamarca 0 0 0 970 1,046 2,016 970 1,046 2,016 0.0 107.8 107.8 0.0% 041301 San Pedro de Totora 0 0 0 2,690 2,841 5,531 2,690 2,841 5,531 0.0 105.6 105.6 0.0% 041401 Huari 2,139 2,193 4,332 3,905 4,916 8,821 6,044 7,109 13,153 102.5 125.9 117.6 32.9% 041501 La Rivera 0 0 0 255 254 509 255 254 509 0.0 99.6 99.6 0.0% 041502 Todos Santos 0 0 0 326 401 727 326 401 727 0.0 123.0 123.0 0.0% 041503 Carangas 0 0 0 423 417 840 423 417 840 0.0 98.6 98.6 0.0%
041601 Huayllamarca 0 0 0 2,555 2,947 5,502 2,555 2,947 5,502 0.0 115.3 115.3 0.0% 050101 Potosí 91,760 83,213 174,973 7,098 7,581 14,679 98,858 90,794 189,652 90.7 106.8 91.8 92.3%
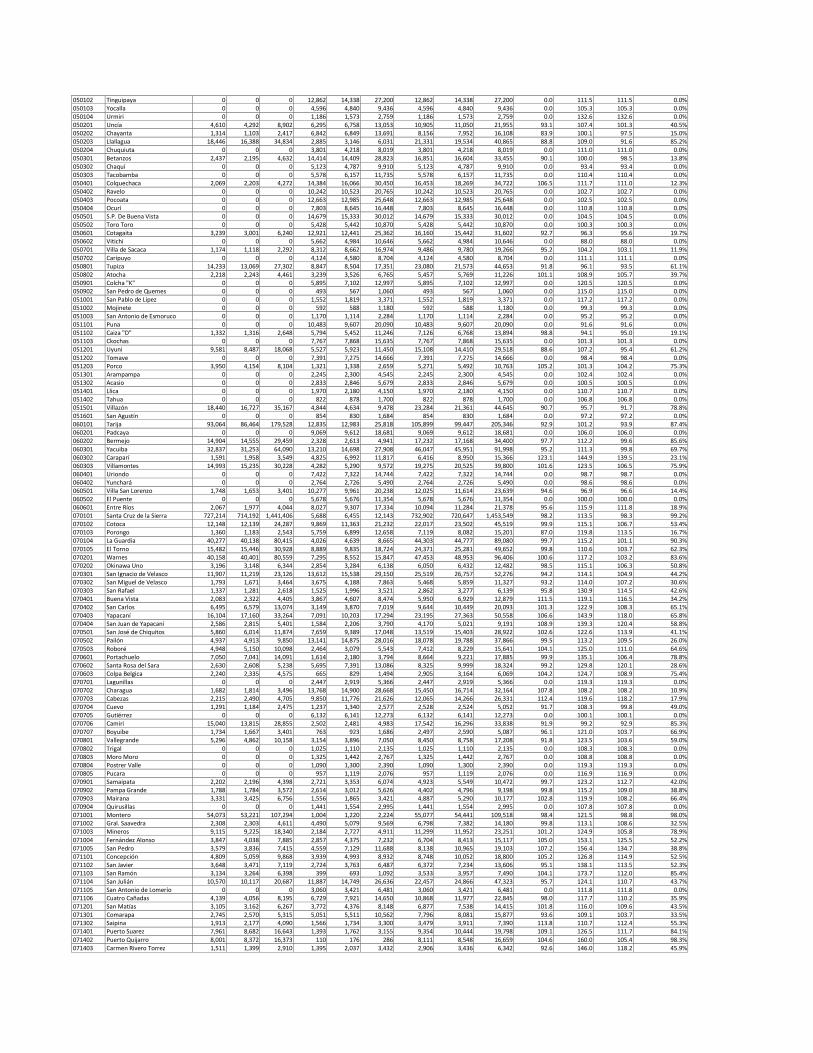
050102 Tinguipaya 0 0 0 12,862 14,338 27,200 12,862 14,338 27,200 0.0 111.5 111.5 0.0% 050103 Yocalla 0 0 0 4,596 4,840 9,436 4,596 4,840 9,436 0.0 105.3 105.3 0.0% 050104 Urmiri 0 0 0 1,186 1,573 2,759 1,186 1,573 2,759 0.0 132.6 132.6 0.0% 050201 Uncía 4,610 4,292 8,902 6,295 6,758 13,053 10,905 11,050 21,955 93.1 107.4 101.3 40.5% 050202 Chayanta 1,314 1,103 2,417 6,842 6,849 13,691 8,156 7,952 16,108 83.9 100.1 97.5 15.0% 050203 Llallagua 18,446 16,388 34,834 2,885 3,146 6,031 21,331 19,534 40,865 88.8 109.0 91.6 85.2% 050204 Chuquiuta 0 0 0 3,801 4,218 8,019 3,801 4,218 8,019 0.0 111.0 111.0 0.0%
050301 Betanzos 2,437 2,195 4,632 14,414 14,409 28,823 16,851 16,604 33,455 90.1 100.0 98.5 13.8% 050302 Chaquí 0 0 0 5,123 4,787 9,910 5,123 4,787 9,910 0.0 93.4 93.4 0.0% 050303 Tacobamba 0 0 0 5,578 6,157 11,735 5,578 6,157 11,735 0.0 110.4 110.4 0.0% 050401 Colquechaca 2,069 2,203 4,272 14,384 16,066 30,450 16,453 18,269 34,722 106.5 111.7 111.0 12.3% 050402 Ravelo 0 0 0 10,242 10,523 20,765 10,242 10,523 20,765 0.0 102.7 102.7 0.0% 050403 Pocoata 0 0 0 12,663 12,985 25,648 12,663 12,985 25,648 0.0 102.5 102.5 0.0% 050404 Ocurí 0 0 0 7,803 8,645 16,448 7,803 8,645 16,448 0.0 110.8 110.8 0.0% 050501 S.P. De Buena Vista 0 0 0 14,679 15,333 30,012 14,679 15,333 30,012 0.0 104.5 104.5 0.0% 050502 Toro Toro 0 0 0 5,428 5,442 10,870 5,428 5,442 10,870 0.0 100.3 100.3 0.0% 050601 Cotagaita 3,239 3,001 6,240 12,921 12,441 25,362 16,160 15,442 31,602 92.7 96.3 95.6 19.7% 050602 Vitichi 0 0 0 5,662 4,984 10,646 5,662 4,984 10,646 0.0 88.0 88.0 0.0% 050701 Villa de Sacaca 1,174 1,118 2,292 8,312 8,662 16,974 9,486 9,780 19,266 95.2 104.2 103.1 11.9%
050702 Caripuyo 0 0 0 4,124 4,580 8,704 4,124 4,580 8,704 0.0 111.1 111.1 0.0% 050801 Tupiza 14,233 13,069 27,302 8,847 8,504 17,351 23,080 21,573 44,653 91.8 96.1 93.5 61.1% 050802 Atocha 2,218 2,243 4,461 3,239 3,526 6,765 5,457 5,769 11,226 101.1 108.9 105.7 39.7% 050901 Colcha "K" 0 0 0 5,895 7,102 12,997 5,895 7,102 12,997 0.0 120.5 120.5 0.0% 050902 San Pedro de Quemes 0 0 0 493 567 1,060 493 567 1,060 0.0 115.0 115.0 0.0% 051001 San Pablo de Lipez 0 0 0 1,552 1,819 3,371 1,552 1,819 3,371 0.0 117.2 117.2 0.0% 051002 Mojinete 0 0 0 592 588 1,180 592 588 1,180 0.0 99.3 99.3 0.0% 051003 San Antonio de Esmoruco 0 0 0 1,170 1,114 2,284 1,170 1,114 2,284 0.0 95.2 95.2 0.0% 051101 Puna 0 0 0 10,483 9,607 20,090 10,483 9,607 20,090 0.0 91.6 91.6 0.0% 051102 Caiza "D" 1,332 1,316 2,648 5,794 5,452 11,246 7,126 6,768 13,894 98.8 94.1 95.0 19.1% 051103 Ckochas 0 0 0 7,767 7,868 15,635 7,767 7,868 15,635 0.0 101.3 101.3 0.0% 051201 Uyuni 9,581 8,487 18,068 5,527 5,923 11,450 15,108 14,410 29,518 88.6 107.2 95.4 61.2%
051202 Tomave 0 0 0 7,391 7,275 14,666 7,391 7,275 14,666 0.0 98.4 98.4 0.0% 051203 Porco 3,950 4,154 8,104 1,321 1,338 2,659 5,271 5,492 10,763 105.2 101.3 104.2 75.3% 051301 Arampampa 0 0 0 2,245 2,300 4,545 2,245 2,300 4,545 0.0 102.4 102.4 0.0% 051302 Acasio 0 0 0 2,833 2,846 5,679 2,833 2,846 5,679 0.0 100.5 100.5 0.0% 051401 Llica 0 0 0 1,970 2,180 4,150 1,970 2,180 4,150 0.0 110.7 110.7 0.0% 051402 Tahua 0 0 0 822 878 1,700 822 878 1,700 0.0 106.8 106.8 0.0% 051501 Villazón 18,440 16,727 35,167 4,844 4,634 9,478 23,284 21,361 44,645 90.7 95.7 91.7 78.8% 051601 San Agustín 0 0 0 854 830 1,684 854 830 1,684 0.0 97.2 97.2 0.0% 060101 Tarija 93,064 86,464 179,528 12,835 12,983 25,818 105,899 99,447 205,346 92.9 101.2 93.9 87.4% 060201 Padcaya 0 0 0 9,069 9,612 18,681 9,069 9,612 18,681 0.0 106.0 106.0 0.0% 060202 Bermejo 14,904 14,555 29,459 2,328 2,613 4,941 17,232 17,168 34,400 97.7 112.2 99.6 85.6%
060301 Yacuiba 32,837 31,253 64,090 13,210 14,698 27,908 46,047 45,951 91,998 95.2 111.3 99.8 69.7% 060302 Caraparí 1,591 1,958 3,549 4,825 6,992 11,817 6,416 8,950 15,366 123.1 144.9 139.5 23.1% 060303 Villamontes 14,993 15,235 30,228 4,282 5,290 9,572 19,275 20,525 39,800 101.6 123.5 106.5 75.9% 060401 Uriondo 0 0 0 7,422 7,322 14,744 7,422 7,322 14,744 0.0 98.7 98.7 0.0% 060402 Yunchará 0 0 0 2,764 2,726 5,490 2,764 2,726 5,490 0.0 98.6 98.6 0.0% 060501 Villa San Lorenzo 1,748 1,653 3,401 10,277 9,961 20,238 12,025 11,614 23,639 94.6 96.9 96.6 14.4% 060502 El Puente 0 0 0 5,678 5,676 11,354 5,678 5,676 11,354 0.0 100.0 100.0 0.0% 060601 Entre Ríos 2,067 1,977 4,044 8,027 9,307 17,334 10,094 11,284 21,378 95.6 115.9 111.8 18.9% 070101 Santa Cruz de la Sierra 727,214 714,192 1,441,406 5,688 6,455 12,143 732,902 720,647 1,453,549 98.2 113.5 98.3 99.2% 070102 Cotoca 12,148 12,139 24,287 9,869 11,363 21,232 22,017 23,502 45,519 99.9 115.1 106.7 53.4% 070103 Porongo 1,360 1,183 2,543 5,759 6,899 12,658 7,119 8,082 15,201 87.0 119.8 113.5 16.7% 070104 La Guardia 40,277 40,138 80,415 4,026 4,639 8,665 44,303 44,777 89,080 99.7 115.2 101.1 90.3%
070105 El Torno 15,482 15,446 30,928 8,889 9,835 18,724 24,371 25,281 49,652 99.8 110.6 103.7 62.3% 070201 Warnes 40,158 40,401 80,559 7,295 8,552 15,847 47,453 48,953 96,406 100.6 117.2 103.2 83.6% 070202 Okinawa Uno 3,196 3,148 6,344 2,854 3,284 6,138 6,050 6,432 12,482 98.5 115.1 106.3 50.8% 070301 San Ignacio de Velasco 11,907 11,219 23,126 13,612 15,538 29,150 25,519 26,757 52,276 94.2 114.1 104.9 44.2% 070302 San Miguel de Velasco 1,793 1,671 3,464 3,675 4,188 7,863 5,468 5,859 11,327 93.2 114.0 107.2 30.6% 070303 San Rafael 1,337 1,281 2,618 1,525 1,996 3,521 2,862 3,277 6,139 95.8 130.9 114.5 42.6% 070401 Buena Vista 2,083 2,322 4,405 3,867 4,607 8,474 5,950 6,929 12,879 111.5 119.1 116.5 34.2% 070402 San Carlos 6,495 6,579 13,074 3,149 3,870 7,019 9,644 10,449 20,093 101.3 122.9 108.3 65.1% 070403 Yapacaní 16,104 17,160 33,264 7,091 10,203 17,294 23,195 27,363 50,558 106.6 143.9 118.0 65.8% 070404 San Juan de Yapacaní 2,586 2,815 5,401 1,584 2,206 3,790 4,170 5,021 9,191 108.9 139.3 120.4 58.8% 070501 San José de Chiquitos 5,860 6,014 11,874 7,659 9,389 17,048 13,519 15,403 28,922 102.6 122.6 113.9 41.1% 070502 Pailón 4,937 4,913 9,850 13,141 14,875 28,016 18,078 19,788 37,866 99.5 113.2 109.5 26.0%
070503 Roboré 4,948 5,150 10,098 2,464 3,079 5,543 7,412 8,229 15,641 104.1 125.0 111.0 64.6% 070601 Portachuelo 7,050 7,041 14,091 1,614 2,180 3,794 8,664 9,221 17,885 99.9 135.1 106.4 78.8% 070602 Santa Rosa del Sara 2,630 2,608 5,238 5,695 7,391 13,086 8,325 9,999 18,324 99.2 129.8 120.1 28.6% 070603 Colpa Belgica 2,240 2,335 4,575 665 829 1,494 2,905 3,164 6,069 104.2 124.7 108.9 75.4% 070701 Lagunillas 0 0 0 2,447 2,919 5,366 2,447 2,919 5,366 0.0 119.3 119.3 0.0% 070702 Charagua 1,682 1,814 3,496 13,768 14,900 28,668 15,450 16,714 32,164 107.8 108.2 108.2 10.9% 070703 Cabezas 2,215 2,490 4,705 9,850 11,776 21,626 12,065 14,266 26,331 112.4 119.6 118.2 17.9% 070704 Cuevo 1,291 1,184 2,475 1,237 1,340 2,577 2,528 2,524 5,052 91.7 108.3 99.8 49.0% 070705 Gutiérrez 0 0 0 6,132 6,141 12,273 6,132 6,141 12,273 0.0 100.1 100.1 0.0% 070706 Camiri 15,040 13,815 28,855 2,502 2,481 4,983 17,542 16,296 33,838 91.9 99.2 92.9 85.3% 070707 Boyuibe 1,734 1,667 3,401 763 923 1,686 2,497 2,590 5,087 96.1 121.0 103.7 66.9% 070801 Vallegrande 5,296 4,862 10,158 3,154 3,896 7,050 8,450 8,758 17,208 91.8 123.5 103.6 59.0%
070802 Trigal 0 0 0 1,025 1,110 2,135 1,025 1,110 2,135 0.0 108.3 108.3 0.0% 070803 Moro Moro 0 0 0 1,325 1,442 2,767 1,325 1,442 2,767 0.0 108.8 108.8 0.0% 070804 Postrer Valle 0 0 0 1,090 1,300 2,390 1,090 1,300 2,390 0.0 119.3 119.3 0.0% 070805 Pucara 0 0 0 957 1,119 2,076 957 1,119 2,076 0.0 116.9 116.9 0.0% 070901 Samaipata 2,202 2,196 4,398 2,721 3,353 6,074 4,923 5,549 10,472 99.7 123.2 112.7 42.0% 070902 Pampa Grande 1,788 1,784 3,572 2,614 3,012 5,626 4,402 4,796 9,198 99.8 115.2 109.0 38.8% 070903 Mairana 3,331 3,425 6,756 1,556 1,865 3,421 4,887 5,290 10,177 102.8 119.9 108.2 66.4% 070904 Quirusillas 0 0 0 1,441 1,554 2,995 1,441 1,554 2,995 0.0 107.8 107.8 0.0% 071001 Montero 54,073 53,221 107,294 1,004 1,220 2,224 55,077 54,441 109,518 98.4 121.5 98.8 98.0% 071002 Gral. Saavedra 2,308 2,303 4,611 4,490 5,079 9,569 6,798 7,382 14,180 99.8 113.1 108.6 32.5% 071003 Mineros 9,115 9,225 18,340 2,184 2,727 4,911 11,299 11,952 23,251 101.2 124.9 105.8 78.9%
071004 Fernández Alonso 3,847 4,038 7,885 2,857 4,375 7,232 6,704 8,413 15,117 105.0 153.1 125.5 52.2% 071005 San Pedro 3,579 3,836 7,415 4,559 7,129 11,688 8,138 10,965 19,103 107.2 156.4 134.7 38.8% 071101 Concepción 4,809 5,059 9,868 3,939 4,993 8,932 8,748 10,052 18,800 105.2 126.8 114.9 52.5% 071102 San Javier 3,648 3,471 7,119 2,724 3,763 6,487 6,372 7,234 13,606 95.1 138.1 113.5 52.3% 071103 San Ramón 3,134 3,264 6,398 399 693 1,092 3,533 3,957 7,490 104.1 173.7 112.0 85.4% 071104 San Julián 10,570 10,117 20,687 11,887 14,749 26,636 22,457 24,866 47,323 95.7 124.1 110.7 43.7% 071105 San Antonio de Lomerío 0 0 0 3,060 3,421 6,481 3,060 3,421 6,481 0.0 111.8 111.8 0.0% 071106 Cuatro Cañadas 4,139 4,056 8,195 6,729 7,921 14,650 10,868 11,977 22,845 98.0 117.7 110.2 35.9% 071201 San Matías 3,105 3,162 6,267 3,772 4,376 8,148 6,877 7,538 14,415 101.8 116.0 109.6 43.5% 071301 Comarapa 2,745 2,570 5,315 5,051 5,511 10,562 7,796 8,081 15,877 93.6 109.1 103.7 33.5% 071302 Saipina 1,913 2,177 4,090 1,566 1,734 3,300 3,479 3,911 7,390 113.8 110.7 112.4 55.3% 071401 Puerto Suarez 7,961 8,682 16,643 1,393 1,762 3,155 9,354 10,444 19,798 109.1 126.5 111.7 84.1%
071402 Puerto Quijarro 8,001 8,372 16,373 110 176 286 8,111 8,548 16,659 104.6 160.0 105.4 98.3% 071403 Carmen Rivero Torrez 1,511 1,399 2,910 1,395 2,037 3,432 2,906 3,436 6,342 92.6 146.0 118.2 45.9%
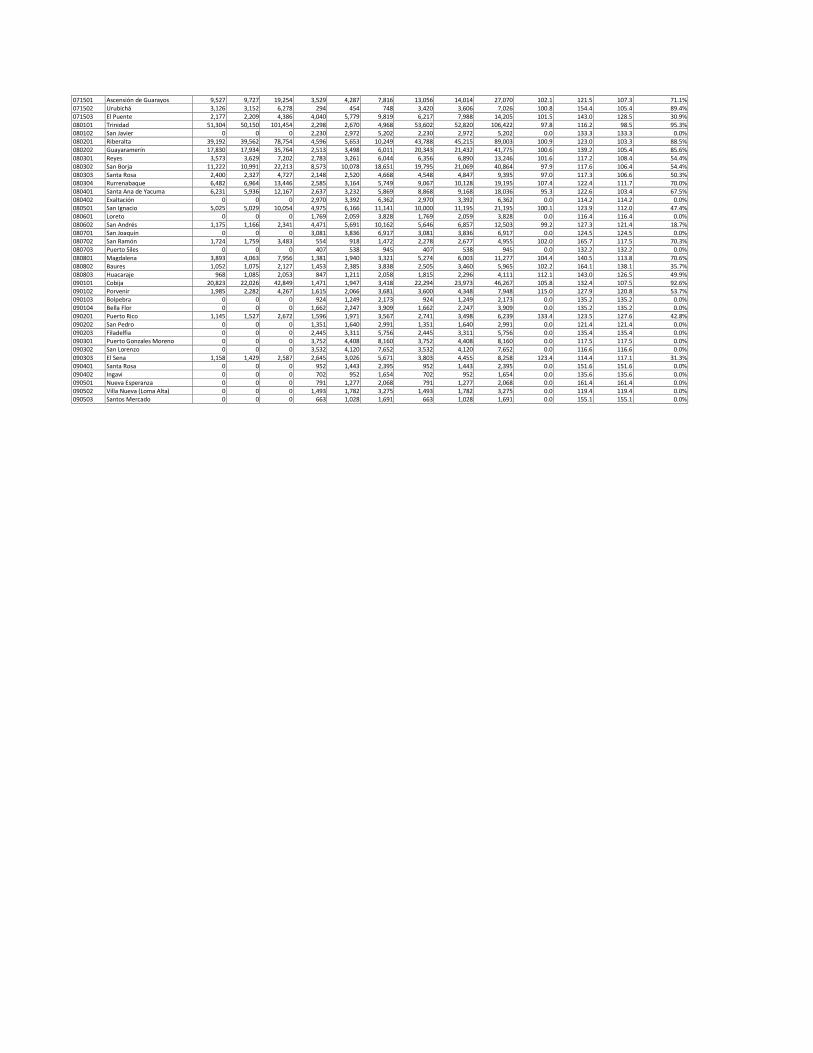
071501 Ascensión de Guarayos 9,527 9,727 19,254 3,529 4,287 7,816 13,056 14,014 27,070 102.1 121.5 107.3 71.1% 071502 Urubichá 3,126 3,152 6,278 294 454 748 3,420 3,606 7,026 100.8 154.4 105.4 89.4% 071503 El Puente 2,177 2,209 4,386 4,040 5,779 9,819 6,217 7,988 14,205 101.5 143.0 128.5 30.9% 080101 Trinidad 51,304 50,150 101,454 2,298 2,670 4,968 53,602 52,820 106,422 97.8 116.2 98.5 95.3% 080102 San Javier 0 0 0 2,230 2,972 5,202 2,230 2,972 5,202 0.0 133.3 133.3 0.0% 080201 Riberalta 39,192 39,562 78,754 4,596 5,653 10,249 43,788 45,215 89,003 100.9 123.0 103.3 88.5% 080202 Guayaramerín 17,830 17,934 35,764 2,513 3,498 6,011 20,343 21,432 41,775 100.6 139.2 105.4 85.6%
080301 Reyes 3,573 3,629 7,202 2,783 3,261 6,044 6,356 6,890 13,246 101.6 117.2 108.4 54.4% 080302 San Borja 11,222 10,991 22,213 8,573 10,078 18,651 19,795 21,069 40,864 97.9 117.6 106.4 54.4% 080303 Santa Rosa 2,400 2,327 4,727 2,148 2,520 4,668 4,548 4,847 9,395 97.0 117.3 106.6 50.3% 080304 Rurrenabaque 6,482 6,964 13,446 2,585 3,164 5,749 9,067 10,128 19,195 107.4 122.4 111.7 70.0% 080401 Santa Ana de Yacuma 6,231 5,936 12,167 2,637 3,232 5,869 8,868 9,168 18,036 95.3 122.6 103.4 67.5% 080402 Exaltación 0 0 0 2,970 3,392 6,362 2,970 3,392 6,362 0.0 114.2 114.2 0.0% 080501 San Ignacio 5,025 5,029 10,054 4,975 6,166 11,141 10,000 11,195 21,195 100.1 123.9 112.0 47.4% 080601 Loreto 0 0 0 1,769 2,059 3,828 1,769 2,059 3,828 0.0 116.4 116.4 0.0% 080602 San Andrés 1,175 1,166 2,341 4,471 5,691 10,162 5,646 6,857 12,503 99.2 127.3 121.4 18.7% 080701 San Joaquín 0 0 0 3,081 3,836 6,917 3,081 3,836 6,917 0.0 124.5 124.5 0.0% 080702 San Ramón 1,724 1,759 3,483 554 918 1,472 2,278 2,677 4,955 102.0 165.7 117.5 70.3% 080703 Puerto Siles 0 0 0 407 538 945 407 538 945 0.0 132.2 132.2 0.0%
080801 Magdalena 3,893 4,063 7,956 1,381 1,940 3,321 5,274 6,003 11,277 104.4 140.5 113.8 70.6% 080802 Baures 1,052 1,075 2,127 1,453 2,385 3,838 2,505 3,460 5,965 102.2 164.1 138.1 35.7% 080803 Huacaraje 968 1,085 2,053 847 1,211 2,058 1,815 2,296 4,111 112.1 143.0 126.5 49.9% 090101 Cobija 20,823 22,026 42,849 1,471 1,947 3,418 22,294 23,973 46,267 105.8 132.4 107.5 92.6% 090102 Porvenir 1,985 2,282 4,267 1,615 2,066 3,681 3,600 4,348 7,948 115.0 127.9 120.8 53.7% 090103 Bolpebra 0 0 0 924 1,249 2,173 924 1,249 2,173 0.0 135.2 135.2 0.0% 090104 Bella Flor 0 0 0 1,662 2,247 3,909 1,662 2,247 3,909 0.0 135.2 135.2 0.0% 090201 Puerto Rico 1,145 1,527 2,672 1,596 1,971 3,567 2,741 3,498 6,239 133.4 123.5 127.6 42.8% 090202 San Pedro 0 0 0 1,351 1,640 2,991 1,351 1,640 2,991 0.0 121.4 121.4 0.0% 090203 Filadelfia 0 0 0 2,445 3,311 5,756 2,445 3,311 5,756 0.0 135.4 135.4 0.0% 090301 Puerto Gonzales Moreno 0 0 0 3,752 4,408 8,160 3,752 4,408 8,160 0.0 117.5 117.5 0.0% 090302 San Lorenzo 0 0 0 3,532 4,120 7,652 3,532 4,120 7,652 0.0 116.6 116.6 0.0%
090303 El Sena 1,158 1,429 2,587 2,645 3,026 5,671 3,803 4,455 8,258 123.4 114.4 117.1 31.3% 090401 Santa Rosa 0 0 0 952 1,443 2,395 952 1,443 2,395 0.0 151.6 151.6 0.0% 090402 Ingavi 0 0 0 702 952 1,654 702 952 1,654 0.0 135.6 135.6 0.0% 090501 Nueva Esperanza 0 0 0 791 1,277 2,068 791 1,277 2,068 0.0 161.4 161.4 0.0% 090502 Villa Nueva (Loma Alta) 0 0 0 1,493 1,782 3,275 1,493 1,782 3,275 0.0 119.4 119.4 0.0% 090503 Santos Mercado 0 0 0 663 1,028 1,691 663 1,028 1,691 0.0 155.1 155.1 0.0%
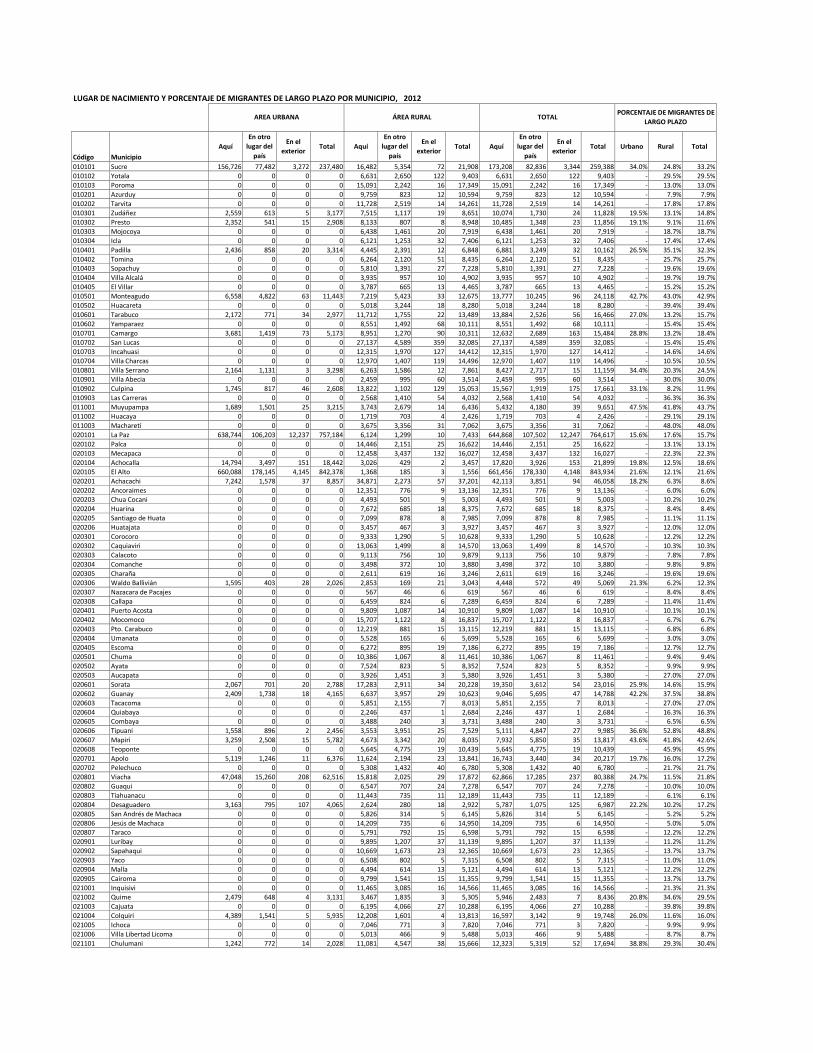
LUGAR DE NACIMIENTO Y PORCENTAJE DE MIGRANTES DE LARGO PLAZO POR MUNICIPIO, 2012
AREA URBANA
ÁREA RURAL
TOTAL PORCENTAJE DE MIGRANTES DE
LARGO PLAZO
Código
Municipio
Aquí
En otro
lugar del
país
En el
exterior
Total
Aquí
En otro
lugar del
país
En el
exterior
Total
Aquí
En otro
lugar del
país
En el
exterior
Total
Urbano
Rural
Total
010101 Sucre 156,726 77,482 3,272 237,480 16,482 5,354 72 21,908 173,208 82,836 3,344 259,388 34.0% 24.8% 33.2%
010102 Yotala 0 0 0 0 6,631 2,650 122 9,403 6,631 2,650 122 9,403 - 29.5% 29.5%
010103 Poroma 0 0 0 0 15,091 2,242 16 17,349 15,091 2,242 16 17,349 - 13.0% 13.0%
010201 Azurduy 0 0 0 0 9,759 823 12 10,594 9,759 823 12 10,594 - 7.9% 7.9%
010202 Tarvita 0 0 0 0 11,728 2,519 14 14,261 11,728 2,519 14 14,261 - 17.8% 17.8%
010301 Zudáñez 2,559 613 5 3,177 7,515 1,117 19 8,651 10,074 1,730 24 11,828 19.5% 13.1% 14.8%
010302 Presto 2,352 541 15 2,908 8,133 807 8 8,948 10,485 1,348 23 11,856 19.1% 9.1% 11.6%
010303 Mojocoya 0 0 0 0 6,438 1,461 20 7,919 6,438 1,461 20 7,919 - 18.7% 18.7%
010304 Icla 0 0 0 0 6,121 1,253 32 7,406 6,121 1,253 32 7,406 - 17.4% 17.4%
010401 Padilla 2,436 858 20 3,314 4,445 2,391 12 6,848 6,881 3,249 32 10,162 26.5% 35.1% 32.3%
010402 Tomina 0 0 0 0 6,264 2,120 51 8,435 6,264 2,120 51 8,435 - 25.7% 25.7% 010403 Sopachuy 0 0 0 0 5,810 1,391 27 7,228 5,810 1,391 27 7,228 - 19.6% 19.6%
010404 Villa Alcalá 0 0 0 0 3,935 957 10 4,902 3,935 957 10 4,902 - 19.7% 19.7%
010405 El Villar 0 0 0 0 3,787 665 13 4,465 3,787 665 13 4,465 - 15.2% 15.2%
010501 Monteagudo 6,558 4,822 63 11,443 7,219 5,423 33 12,675 13,777 10,245 96 24,118 42.7% 43.0% 42.9%
010502 Huacareta 0 0 0 0 5,018 3,244 18 8,280 5,018 3,244 18 8,280 - 39.4% 39.4%
010601 Tarabuco 2,172 771 34 2,977 11,712 1,755 22 13,489 13,884 2,526 56 16,466 27.0% 13.2% 15.7%
010602 Yamparaez 0 0 0 0 8,551 1,492 68 10,111 8,551 1,492 68 10,111 - 15.4% 15.4%
010701 Camargo 3,681 1,419 73 5,173 8,951 1,270 90 10,311 12,632 2,689 163 15,484 28.8% 13.2% 18.4%
010702 San Lucas 0 0 0 0 27,137 4,589 359 32,085 27,137 4,589 359 32,085 - 15.4% 15.4%
010703 Incahuasi 0 0 0 0 12,315 1,970 127 14,412 12,315 1,970 127 14,412 - 14.6% 14.6%
010704 Villa Charcas 0 0 0 0 12,970 1,407 119 14,496 12,970 1,407 119 14,496 - 10.5% 10.5%
010801 Villa Serrano 2,164 1,131 3 3,298 6,263 1,586 12 7,861 8,427 2,717 15 11,159 34.4% 20.3% 24.5% 010901 Villa Abecia 0 0 0 0 2,459 995 60 3,514 2,459 995 60 3,514 - 30.0% 30.0%
010902 Culpina 1,745 817 46 2,608 13,822 1,102 129 15,053 15,567 1,919 175 17,661 33.1% 8.2% 11.9%
010903 Las Carreras 0 0 0 0 2,568 1,410 54 4,032 2,568 1,410 54 4,032 - 36.3% 36.3%
011001 Muyupampa 1,689 1,501 25 3,215 3,743 2,679 14 6,436 5,432 4,180 39 9,651 47.5% 41.8% 43.7%
011002 Huacaya 0 0 0 0 1,719 703 4 2,426 1,719 703 4 2,426 - 29.1% 29.1%
011003 Macharetí 0 0 0 0 3,675 3,356 31 7,062 3,675 3,356 31 7,062 - 48.0% 48.0%
020101 La Paz 638,744 106,203 12,237 757,184 6,124 1,299 10 7,433 644,868 107,502 12,247 764,617 15.6% 17.6% 15.7%
020102 Palca 0 0 0 0 14,446 2,151 25 16,622 14,446 2,151 25 16,622 - 13.1% 13.1%
020103 Mecapaca 0 0 0 0 12,458 3,437 132 16,027 12,458 3,437 132 16,027 - 22.3% 22.3%
020104 Achocalla 14,794 3,497 151 18,442 3,026 429 2 3,457 17,820 3,926 153 21,899 19.8% 12.5% 18.6%
020105 El Alto 660,088 178,145 4,145 842,378 1,368 185 3 1,556 661,456 178,330 4,148 843,934 21.6% 12.1% 21.6%
020201 Achacachi 7,242 1,578 37 8,857 34,871 2,273 57 37,201 42,113 3,851 94 46,058 18.2% 6.3% 8.6%
020202 Ancoraimes 0 0 0 0 12,351 776 9 13,136 12,351 776 9 13,136 - 6.0% 6.0% 020203 Chua Cocani 0 0 0 0 4,493 501 9 5,003 4,493 501 9 5,003 - 10.2% 10.2%
020204 Huarina 0 0 0 0 7,672 685 18 8,375 7,672 685 18 8,375 - 8.4% 8.4%
020205 Santiago de Huata 0 0 0 0 7,099 878 8 7,985 7,099 878 8 7,985 - 11.1% 11.1%
020206 Huatajata 0 0 0 0 3,457 467 3 3,927 3,457 467 3 3,927 - 12.0% 12.0%
020301 Corocoro 0 0 0 0 9,333 1,290 5 10,628 9,333 1,290 5 10,628 - 12.2% 12.2%
020302 Caquiaviri 0 0 0 0 13,063 1,499 8 14,570 13,063 1,499 8 14,570 - 10.3% 10.3%
020303 Calacoto 0 0 0 0 9,113 756 10 9,879 9,113 756 10 9,879 - 7.8% 7.8%
020304 Comanche 0 0 0 0 3,498 372 10 3,880 3,498 372 10 3,880 - 9.8% 9.8%
020305 Charaña 0 0 0 0 2,611 619 16 3,246 2,611 619 16 3,246 - 19.6% 19.6%
020306 Waldo Ballivián 1,595 403 28 2,026 2,853 169 21 3,043 4,448 572 49 5,069 21.3% 6.2% 12.3%
020307 Nazacara de Pacajes 0 0 0 0 567 46 6 619 567 46 6 619 - 8.4% 8.4%
020308 Callapa 0 0 0 0 6,459 824 6 7,289 6,459 824 6 7,289 - 11.4% 11.4% 020401 Puerto Acosta 0 0 0 0 9,809 1,087 14 10,910 9,809 1,087 14 10,910 - 10.1% 10.1%
020402 Mocomoco 0 0 0 0 15,707 1,122 8 16,837 15,707 1,122 8 16,837 - 6.7% 6.7%
020403 Pto. Carabuco 0 0 0 0 12,219 881 15 13,115 12,219 881 15 13,115 - 6.8% 6.8%
020404 Umanata 0 0 0 0 5,528 165 6 5,699 5,528 165 6 5,699 - 3.0% 3.0%
020405 Escoma 0 0 0 0 6,272 895 19 7,186 6,272 895 19 7,186 - 12.7% 12.7%
020501 Chuma 0 0 0 0 10,386 1,067 8 11,461 10,386 1,067 8 11,461 - 9.4% 9.4%
020502 Ayata 0 0 0 0 7,524 823 5 8,352 7,524 823 5 8,352 - 9.9% 9.9%
020503 Aucapata 0 0 0 0 3,926 1,451 3 5,380 3,926 1,451 3 5,380 - 27.0% 27.0%
020601 Sorata 2,067 701 20 2,788 17,283 2,911 34 20,228 19,350 3,612 54 23,016 25.9% 14.6% 15.9%
020602 Guanay 2,409 1,738 18 4,165 6,637 3,957 29 10,623 9,046 5,695 47 14,788 42.2% 37.5% 38.8%
020603 Tacacoma 0 0 0 0 5,851 2,155 7 8,013 5,851 2,155 7 8,013 - 27.0% 27.0%
020604 Quiabaya 0 0 0 0 2,246 437 1 2,684 2,246 437 1 2,684 - 16.3% 16.3% 020605 Combaya 0 0 0 0 3,488 240 3 3,731 3,488 240 3 3,731 - 6.5% 6.5%
020606 Tipuani 1,558 896 2 2,456 3,553 3,951 25 7,529 5,111 4,847 27 9,985 36.6% 52.8% 48.8%
020607 Mapiri 3,259 2,508 15 5,782 4,673 3,342 20 8,035 7,932 5,850 35 13,817 43.6% 41.8% 42.6%
020608 Teoponte 0 0 0 0 5,645 4,775 19 10,439 5,645 4,775 19 10,439 - 45.9% 45.9%
020701 Apolo 5,119 1,246 11 6,376 11,624 2,194 23 13,841 16,743 3,440 34 20,217 19.7% 16.0% 17.2%
020702 Pelechuco 0 0 0 0 5,308 1,432 40 6,780 5,308 1,432 40 6,780 - 21.7% 21.7%
020801 Viacha 47,048 15,260 208 62,516 15,818 2,025 29 17,872 62,866 17,285 237 80,388 24.7% 11.5% 21.8%
020802 Guaqui 0 0 0 0 6,547 707 24 7,278 6,547 707 24 7,278 - 10.0% 10.0%
020803 Tiahuanacu 0 0 0 0 11,443 735 11 12,189 11,443 735 11 12,189 - 6.1% 6.1%
020804 Desaguadero 3,163 795 107 4,065 2,624 280 18 2,922 5,787 1,075 125 6,987 22.2% 10.2% 17.2%
020805 San Andrés de Machaca 0 0 0 0 5,826 314 5 6,145 5,826 314 5 6,145 - 5.2% 5.2%
020806 Jesús de Machaca 0 0 0 0 14,209 735 6 14,950 14,209 735 6 14,950 - 5.0% 5.0% 020807 Taraco 0 0 0 0 5,791 792 15 6,598 5,791 792 15 6,598 - 12.2% 12.2%
020901 Luribay 0 0 0 0 9,895 1,207 37 11,139 9,895 1,207 37 11,139 - 11.2% 11.2%
020902 Sapahaqui 0 0 0 0 10,669 1,673 23 12,365 10,669 1,673 23 12,365 - 13.7% 13.7%
020903 Yaco 0 0 0 0 6,508 802 5 7,315 6,508 802 5 7,315 - 11.0% 11.0%
020904 Malla 0 0 0 0 4,494 614 13 5,121 4,494 614 13 5,121 - 12.2% 12.2%
020905 Cairoma 0 0 0 0 9,799 1,541 15 11,355 9,799 1,541 15 11,355 - 13.7% 13.7%
021001 Inquisivi 0 0 0 0 11,465 3,085 16 14,566 11,465 3,085 16 14,566 - 21.3% 21.3%
021002 Quime 2,479 648 4 3,131 3,467 1,835 3 5,305 5,946 2,483 7 8,436 20.8% 34.6% 29.5%
021003 Cajuata 0 0 0 0 6,195 4,066 27 10,288 6,195 4,066 27 10,288 - 39.8% 39.8%
021004 Colquiri 4,389 1,541 5 5,935 12,208 1,601 4 13,813 16,597 3,142 9 19,748 26.0% 11.6% 16.0%
021005 Ichoca 0 0 0 0 7,046 771 3 7,820 7,046 771 3 7,820 - 9.9% 9.9%
021006 Villa Libertad Licoma 0 0 0 0 5,013 466 9 5,488 5,013 466 9 5,488 - 8.7% 8.7%
021101 Chulumani 1,242 772 14 2,028 11,081 4,547 38 15,666 12,323 5,319 52 17,694 38.8% 29.3% 30.4%
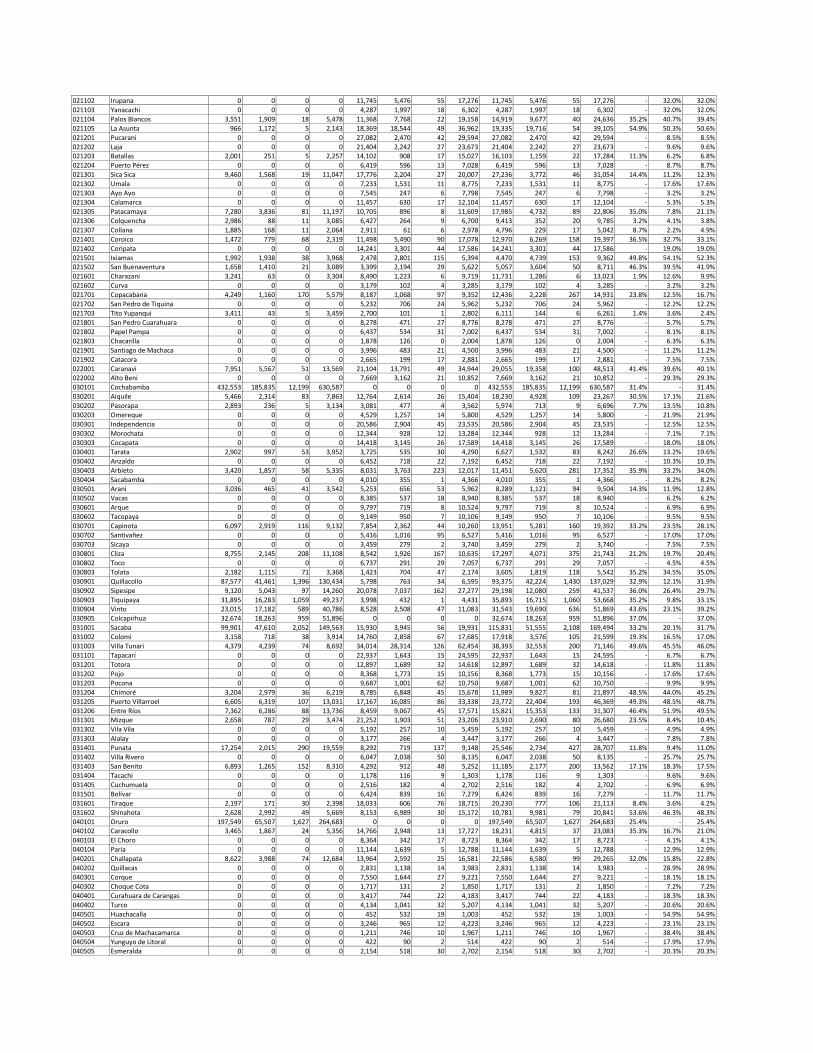
021102 Irupana 0 0 0 0 11,745 5,476 55 17,276 11,745 5,476 55 17,276 - 32.0% 32.0%
021103 Yanacachi 0 0 0 0 4,287 1,997 18 6,302 4,287 1,997 18 6,302 - 32.0% 32.0%
021104 Palos Blancos 3,551 1,909 18 5,478 11,368 7,768 22 19,158 14,919 9,677 40 24,636 35.2% 40.7% 39.4%
021105 La Asunta 966 1,172 5 2,143 18,369 18,544 49 36,962 19,335 19,716 54 39,105 54.9% 50.3% 50.6%
021201 Pucarani 0 0 0 0 27,082 2,470 42 29,594 27,082 2,470 42 29,594 - 8.5% 8.5%
021202 Laja 0 0 0 0 21,404 2,242 27 23,673 21,404 2,242 27 23,673 - 9.6% 9.6% 021203 Batallas 2,001 251 5 2,257 14,102 908 17 15,027 16,103 1,159 22 17,284 11.3% 6.2% 6.8%
021204 Puerto Pérez 0 0 0 0 6,419 596 13 7,028 6,419 596 13 7,028 - 8.7% 8.7%
021301 Sica Sica 9,460 1,568 19 11,047 17,776 2,204 27 20,007 27,236 3,772 46 31,054 14.4% 11.2% 12.3%
021302 Umala 0 0 0 0 7,233 1,531 11 8,775 7,233 1,531 11 8,775 - 17.6% 17.6%
021303 Ayo Ayo 0 0 0 0 7,545 247 6 7,798 7,545 247 6 7,798 - 3.2% 3.2%
021304 Calamarca 0 0 0 0 11,457 630 17 12,104 11,457 630 17 12,104 - 5.3% 5.3%
021305 Patacamaya 7,280 3,836 81 11,197 10,705 896 8 11,609 17,985 4,732 89 22,806 35.0% 7.8% 21.1%
021306 Colquencha 2,986 88 11 3,085 6,427 264 9 6,700 9,413 352 20 9,785 3.2% 4.1% 3.8%
021307 Collana 1,885 168 11 2,064 2,911 61 6 2,978 4,796 229 17 5,042 8.7% 2.2% 4.9%
021401 Coroico 1,472 779 68 2,319 11,498 5,490 90 17,078 12,970 6,269 158 19,397 36.5% 32.7% 33.1%
021402 Coripata 0 0 0 0 14,241 3,301 44 17,586 14,241 3,301 44 17,586 - 19.0% 19.0%
021501 Ixiamas 1,992 1,938 38 3,968 2,478 2,801 115 5,394 4,470 4,739 153 9,362 49.8% 54.1% 52.3% 021502 San Buenaventura 1,658 1,410 21 3,089 3,399 2,194 29 5,622 5,057 3,604 50 8,711 46.3% 39.5% 41.9%
021601 Charazani 3,241 63 0 3,304 8,490 1,223 6 9,719 11,731 1,286 6 13,023 1.9% 12.6% 9.9%
021602 Curva 0 0 0 0 3,179 102 4 3,285 3,179 102 4 3,285 - 3.2% 3.2%
021701 Copacabana 4,249 1,160 170 5,579 8,187 1,068 97 9,352 12,436 2,228 267 14,931 23.8% 12.5% 16.7%
021702 San Pedro de Tiquina 0 0 0 0 5,232 706 24 5,962 5,232 706 24 5,962 - 12.2% 12.2%
021703 Tito Yupanqui 3,411 43 5 3,459 2,700 101 1 2,802 6,111 144 6 6,261 1.4% 3.6% 2.4%
021801 San Pedro Cuarahuara 0 0 0 0 8,278 471 27 8,776 8,278 471 27 8,776 - 5.7% 5.7%
021802 Papel Pampa 0 0 0 0 6,437 534 31 7,002 6,437 534 31 7,002 - 8.1% 8.1%
021803 Chacarilla 0 0 0 0 1,878 126 0 2,004 1,878 126 0 2,004 - 6.3% 6.3%
021901 Santiago de Machaca 0 0 0 0 3,996 483 21 4,500 3,996 483 21 4,500 - 11.2% 11.2%
021902 Catacora 0 0 0 0 2,665 199 17 2,881 2,665 199 17 2,881 - 7.5% 7.5%
022001 Caranavi 7,951 5,567 51 13,569 21,104 13,791 49 34,944 29,055 19,358 100 48,513 41.4% 39.6% 40.1% 022002 Alto Beni 0 0 0 0 7,669 3,162 21 10,852 7,669 3,162 21 10,852 - 29.3% 29.3%
030101 Cochabamba 432,553 185,835 12,199 630,587 0 0 0 0 432,553 185,835 12,199 630,587 31.4% - 31.4%
030201 Aiquile 5,466 2,314 83 7,863 12,764 2,614 26 15,404 18,230 4,928 109 23,267 30.5% 17.1% 21.6%
030202 Pasorapa 2,893 236 5 3,134 3,081 477 4 3,562 5,974 713 9 6,696 7.7% 13.5% 10.8%
030203 Omereque 0 0 0 0 4,529 1,257 14 5,800 4,529 1,257 14 5,800 - 21.9% 21.9%
030301 Independencia 0 0 0 0 20,586 2,904 45 23,535 20,586 2,904 45 23,535 - 12.5% 12.5%
030302 Morochata 0 0 0 0 12,344 928 12 13,284 12,344 928 12 13,284 - 7.1% 7.1%
030303 Cocapata 0 0 0 0 14,418 3,145 26 17,589 14,418 3,145 26 17,589 - 18.0% 18.0%
030401 Tarata 2,902 997 53 3,952 3,725 535 30 4,290 6,627 1,532 83 8,242 26.6% 13.2% 19.6%
030402 Anzaldo 0 0 0 0 6,452 718 22 7,192 6,452 718 22 7,192 - 10.3% 10.3%
030403 Arbieto 3,420 1,857 58 5,335 8,031 3,763 223 12,017 11,451 5,620 281 17,352 35.9% 33.2% 34.0%
030404 Sacabamba 0 0 0 0 4,010 355 1 4,366 4,010 355 1 4,366 - 8.2% 8.2% 030501 Arani 3,036 465 41 3,542 5,253 656 53 5,962 8,289 1,121 94 9,504 14.3% 11.9% 12.8%
030502 Vacas 0 0 0 0 8,385 537 18 8,940 8,385 537 18 8,940 - 6.2% 6.2%
030601 Arque 0 0 0 0 9,797 719 8 10,524 9,797 719 8 10,524 - 6.9% 6.9%
030602 Tacopaya 0 0 0 0 9,149 950 7 10,106 9,149 950 7 10,106 - 9.5% 9.5%
030701 Capinota 6,097 2,919 116 9,132 7,854 2,362 44 10,260 13,951 5,281 160 19,392 33.2% 23.5% 28.1%
030702 Santivañez 0 0 0 0 5,416 1,016 95 6,527 5,416 1,016 95 6,527 - 17.0% 17.0%
030703 Sicaya 0 0 0 0 3,459 279 2 3,740 3,459 279 2 3,740 - 7.5% 7.5%
030801 Cliza 8,755 2,145 208 11,108 8,542 1,926 167 10,635 17,297 4,071 375 21,743 21.2% 19.7% 20.4%
030802 Toco 0 0 0 0 6,737 291 29 7,057 6,737 291 29 7,057 - 4.5% 4.5%
030803 Tolata 2,182 1,115 71 3,368 1,423 704 47 2,174 3,605 1,819 118 5,542 35.2% 34.5% 35.0%
030901 Quillacollo 87,577 41,461 1,396 130,434 5,798 763 34 6,595 93,375 42,224 1,430 137,029 32.9% 12.1% 31.9%
030902 Sipesipe 9,120 5,043 97 14,260 20,078 7,037 162 27,277 29,198 12,080 259 41,537 36.0% 26.4% 29.7%
030903 Tiquipaya 31,895 16,283 1,059 49,237 3,998 432 1 4,431 35,893 16,715 1,060 53,668 35.2% 9.8% 33.1% 030904 Vinto 23,015 17,182 589 40,786 8,528 2,508 47 11,083 31,543 19,690 636 51,869 43.6% 23.1% 39.2%
030905 Colcapirhua 32,674 18,263 959 51,896 0 0 0 0 32,674 18,263 959 51,896 37.0% - 37.0%
031001 Sacaba 99,901 47,610 2,052 149,563 15,930 3,945 56 19,931 115,831 51,555 2,108 169,494 33.2% 20.1% 31.7%
031002 Colomi 3,158 718 38 3,914 14,760 2,858 67 17,685 17,918 3,576 105 21,599 19.3% 16.5% 17.0%
031003 Villa Tunari 4,379 4,239 74 8,692 34,014 28,314 126 62,454 38,393 32,553 200 71,146 49.6% 45.5% 46.0%
031101 Tapacarí 0 0 0 0 22,937 1,643 15 24,595 22,937 1,643 15 24,595 - 6.7% 6.7%
031201 Totora 0 0 0 0 12,897 1,689 32 14,618 12,897 1,689 32 14,618 - 11.8% 11.8%
031202 Pojo 0 0 0 0 8,368 1,773 15 10,156 8,368 1,773 15 10,156 - 17.6% 17.6%
031203 Pocona 0 0 0 0 9,687 1,001 62 10,750 9,687 1,001 62 10,750 - 9.9% 9.9%
031204 Chimoré 3,204 2,979 36 6,219 8,785 6,848 45 15,678 11,989 9,827 81 21,897 48.5% 44.0% 45.2%
031205 Puerto Villarroel 6,605 6,319 107 13,031 17,167 16,085 86 33,338 23,772 22,404 193 46,369 49.3% 48.5% 48.7%
031206 Entre Ríos 7,362 6,286 88 13,736 8,459 9,067 45 17,571 15,821 15,353 133 31,307 46.4% 51.9% 49.5% 031301 Mizque 2,658 787 29 3,474 21,252 1,903 51 23,206 23,910 2,690 80 26,680 23.5% 8.4% 10.4%
031302 Vila Vila 0 0 0 0 5,192 257 10 5,459 5,192 257 10 5,459 - 4.9% 4.9%
031303 Alalay 0 0 0 0 3,177 266 4 3,447 3,177 266 4 3,447 - 7.8% 7.8%
031401 Punata 17,254 2,015 290 19,559 8,292 719 137 9,148 25,546 2,734 427 28,707 11.8% 9.4% 11.0%
031402 Villa Rivero 0 0 0 0 6,047 2,038 50 8,135 6,047 2,038 50 8,135 - 25.7% 25.7%
031403 San Benito 6,893 1,265 152 8,310 4,292 912 48 5,252 11,185 2,177 200 13,562 17.1% 18.3% 17.5%
031404 Tacachi 0 0 0 0 1,178 116 9 1,303 1,178 116 9 1,303 - 9.6% 9.6%
031405 Cuchumuela 0 0 0 0 2,516 182 4 2,702 2,516 182 4 2,702 - 6.9% 6.9%
031501 Bolívar 0 0 0 0 6,424 839 16 7,279 6,424 839 16 7,279 - 11.7% 11.7%
031601 Tiraque 2,197 171 30 2,398 18,033 606 76 18,715 20,230 777 106 21,113 8.4% 3.6% 4.2%
031602 Shinahota 2,628 2,992 49 5,669 8,153 6,989 30 15,172 10,781 9,981 79 20,841 53.6% 46.3% 48.3%
040101 Oruro 197,549 65,507 1,627 264,683 0 0 0 0 197,549 65,507 1,627 264,683 25.4% - 25.4% 040102 Caracollo 3,465 1,867 24 5,356 14,766 2,948 13 17,727 18,231 4,815 37 23,083 35.3% 16.7% 21.0%
040103 El Choro 0 0 0 0 8,364 342 17 8,723 8,364 342 17 8,723 - 4.1% 4.1%
040104 Paria 0 0 0 0 11,144 1,639 5 12,788 11,144 1,639 5 12,788 - 12.9% 12.9%
040201 Challapata 8,622 3,988 74 12,684 13,964 2,592 25 16,581 22,586 6,580 99 29,265 32.0% 15.8% 22.8%
040202 Quillacas 0 0 0 0 2,831 1,138 14 3,983 2,831 1,138 14 3,983 - 28.9% 28.9%
040301 Corque 0 0 0 0 7,550 1,644 27 9,221 7,550 1,644 27 9,221 - 18.1% 18.1%
040302 Choque Cota 0 0 0 0 1,717 131 2 1,850 1,717 131 2 1,850 - 7.2% 7.2%
040401 Curahuara de Carangas 0 0 0 0 3,417 744 22 4,183 3,417 744 22 4,183 - 18.3% 18.3%
040402 Turco 0 0 0 0 4,134 1,041 32 5,207 4,134 1,041 32 5,207 - 20.6% 20.6%
040501 Huachacalla 0 0 0 0 452 532 19 1,003 452 532 19 1,003 - 54.9% 54.9%
040502 Escara 0 0 0 0 3,246 965 12 4,223 3,246 965 12 4,223 - 23.1% 23.1%
040503 Cruz de Machacamarca 0 0 0 0 1,211 746 10 1,967 1,211 746 10 1,967 - 38.4% 38.4% 040504 Yunguyo de Litoral 0 0 0 0 422 90 2 514 422 90 2 514 - 17.9% 17.9%
040505 Esmeralda 0 0 0 0 2,154 518 30 2,702 2,154 518 30 2,702 - 20.3% 20.3%

040601 Poopó 2,731 860 27 3,618 3,191 770 8 3,969 5,922 1,630 35 7,587 24.5% 19.6% 21.9%
040602 Pazña 0 0 0 0 4,386 1,556 13 5,955 4,386 1,556 13 5,955 - 26.3% 26.3%
040603 Antequera 0 0 0 0 2,142 1,076 15 3,233 2,142 1,076 15 3,233 - 33.7% 33.7%
040701 Huanuni 13,039 7,251 46 20,336 2,958 1,380 3 4,341 15,997 8,631 49 24,677 35.9% 31.9% 35.2%
040702 Machacamarca 1,909 807 33 2,749 1,520 548 3 2,071 3,429 1,355 36 4,820 30.6% 26.6% 28.9%
040801 Salinas de García Mendoza 0 0 0 0 8,721 2,962 22 11,705 8,721 2,962 22 11,705 - 25.5% 25.5% 040802 Pampa Aullagas 0 0 0 0 2,535 433 5 2,973 2,535 433 5 2,973 - 14.7% 14.7%
040901 Sabaya 0 0 0 0 5,135 2,775 108 8,018 5,135 2,775 108 8,018 - 36.0% 36.0%
040902 Coipasa 0 0 0 0 618 271 14 903 618 271 14 903 - 31.6% 31.6%
040903 Chipaya 0 0 0 0 1,868 111 24 2,003 1,868 111 24 2,003 - 6.7% 6.7%
041001 Toledo 0 0 0 0 8,499 1,624 26 10,149 8,499 1,624 26 10,149 - 16.3% 16.3%
041101 Eucaliptus 1,737 886 3 2,626 2,280 361 0 2,641 4,017 1,247 3 5,267 33.9% 13.7% 23.7%
041201 Santiago de Andamarca 0 0 0 0 4,614 596 5 5,215 4,614 596 5 5,215 - 11.5% 11.5%
041202 Belén de Andamarca 0 0 0 0 1,510 499 7 2,016 1,510 499 7 2,016 - 25.1% 25.1%
041301 San Pedro de Totora 0 0 0 0 5,010 509 12 5,531 5,010 509 12 5,531 - 9.4% 9.4%
041401 Huari 3,399 912 21 4,332 7,506 1,294 21 8,821 10,905 2,206 42 13,153 21.5% 14.9% 17.1%
041501 La Rivera 0 0 0 0 320 185 4 509 320 185 4 509 - 37.1% 37.1%
041502 Todos Santos 0 0 0 0 551 176 0 727 551 176 0 727 - 24.2% 24.2% 041503 Carangas 0 0 0 0 732 91 17 840 732 91 17 840 - 12.9% 12.9%
041601 Huayllamarca 0 0 0 0 4,946 541 15 5,502 4,946 541 15 5,502 - 10.1% 10.1%
050101 Potosí 138,390 34,243 2,340 174,973 12,036 2,514 129 14,679 150,426 36,757 2,469 189,652 20.9% 18.0% 20.7%
050102 Tinguipaya 0 0 0 0 24,988 2,191 21 27,200 24,988 2,191 21 27,200 - 8.1% 8.1%
050103 Yocalla 0 0 0 0 7,368 2,013 55 9,436 7,368 2,013 55 9,436 - 21.9% 21.9%
050104 Urmiri 0 0 0 0 2,526 212 21 2,759 2,526 212 21 2,759 - 8.4% 8.4%
050201 Uncía 6,383 2,502 17 8,902 11,296 1,745 12 13,053 17,679 4,247 29 21,955 28.3% 13.5% 19.5%
050202 Chayanta 1,467 941 9 2,417 10,955 2,722 14 13,691 12,422 3,663 23 16,108 39.3% 20.0% 22.9%
050203 Llallagua 23,310 11,405 119 34,834 4,831 1,189 11 6,031 28,141 12,594 130 40,865 33.1% 19.9% 31.1%
050204 Chuquiuta 0 0 0 0 6,797 1,221 1 8,019 6,797 1,221 1 8,019 - 15.2% 15.2%
050301 Betanzos 2,917 1,581 134 4,632 25,482 3,152 189 28,823 28,399 4,733 323 33,455 37.0% 11.6% 15.1%
050302 Chaquí 0 0 0 0 8,356 1,429 125 9,910 8,356 1,429 125 9,910 - 15.7% 15.7% 050303 Tacobamba 0 0 0 0 10,686 1,004 45 11,735 10,686 1,004 45 11,735 - 8.9% 8.9%
050401 Colquechaca 3,192 1,067 13 4,272 26,721 3,582 147 30,450 29,913 4,649 160 34,722 25.3% 12.2% 13.9%
050402 Ravelo 0 0 0 0 17,763 2,970 32 20,765 17,763 2,970 32 20,765 - 14.5% 14.5%
050403 Pocoata 0 0 0 0 22,579 3,013 56 25,648 22,579 3,013 56 25,648 - 12.0% 12.0%
050404 Ocurí 0 0 0 0 14,242 2,192 14 16,448 14,242 2,192 14 16,448 - 13.4% 13.4%
050501 S.P. De Buena Vista 0 0 0 0 26,193 3,772 47 30,012 26,193 3,772 47 30,012 - 12.7% 12.7%
050502 Toro Toro 0 0 0 0 8,800 2,027 43 10,870 8,800 2,027 43 10,870 - 19.0% 19.0%
050601 Cotagaita 4,008 2,182 50 6,240 21,306 3,592 464 25,362 25,314 5,774 514 31,602 35.8% 16.0% 19.9%
050602 Vitichi 0 0 0 0 8,848 1,649 149 10,646 8,848 1,649 149 10,646 - 16.9% 16.9%
050701 Villa de Sacaca 1,568 713 11 2,292 13,930 3,028 16 16,974 15,498 3,741 27 19,266 31.6% 17.9% 19.6%
050702 Caripuyo 0 0 0 0 7,158 1,544 2 8,704 7,158 1,544 2 8,704 - 17.8% 17.8%
050801 Tupiza 16,995 9,896 411 27,302 11,883 5,107 361 17,351 28,878 15,003 772 44,653 37.8% 31.5% 35.3% 050802 Atocha 2,178 2,260 23 4,461 2,986 3,752 27 6,765 5,164 6,012 50 11,226 51.2% 55.9% 54.0%
050901 Colcha "K" 0 0 0 0 7,695 5,134 168 12,997 7,695 5,134 168 12,997 - 40.8% 40.8%
050902 San Pedro de Quemes 0 0 0 0 641 326 93 1,060 641 326 93 1,060 - 39.5% 39.5%
051001 San Pablo de Lipez 0 0 0 0 2,439 856 76 3,371 2,439 856 76 3,371 - 27.6% 27.6%
051002 Mojinete 0 0 0 0 991 131 58 1,180 991 131 58 1,180 - 16.0% 16.0%
051003 San Antonio de Esmoruco 0 0 0 0 1,925 304 55 2,284 1,925 304 55 2,284 - 15.7% 15.7%
051101 Puna 0 0 0 0 17,439 2,307 344 20,090 17,439 2,307 344 20,090 - 13.2% 13.2%
051102 Caiza "D" 1,501 1,065 82 2,648 8,832 2,220 194 11,246 10,333 3,285 276 13,894 43.3% 21.5% 25.6%
051103 Ckochas 0 0 0 0 13,915 1,617 103 15,635 13,915 1,617 103 15,635 - 11.0% 11.0%
051201 Uyuni 8,885 8,795 388 18,068 7,233 4,174 43 11,450 16,118 12,969 431 29,518 50.8% 36.8% 45.4%
051202 Tomave 0 0 0 0 10,460 4,134 72 14,666 10,460 4,134 72 14,666 - 28.7% 28.7%
051203 Porco 3,957 4,121 26 8,104 1,815 819 25 2,659 5,772 4,940 51 10,763 51.2% 31.7% 46.4%
051301 Arampampa 0 0 0 0 3,602 931 12 4,545 3,602 931 12 4,545 - 20.7% 20.7% 051302 Acasio 0 0 0 0 4,573 1,099 7 5,679 4,573 1,099 7 5,679 - 19.5% 19.5%
051401 Llica 0 0 0 0 2,565 1,556 29 4,150 2,565 1,556 29 4,150 - 38.2% 38.2%
051402 Tahua 0 0 0 0 1,348 347 5 1,700 1,348 347 5 1,700 - 20.7% 20.7%
051501 Villazón 17,906 14,886 2,375 35,167 6,968 2,171 339 9,478 24,874 17,057 2,714 44,645 49.1% 26.5% 44.3%
051601 San Agustín 0 0 0 0 1,407 265 12 1,684 1,407 265 12 1,684 - 16.4% 16.4%
060101 Tarija 120,553 55,765 3,210 179,528 18,609 6,575 634 25,818 139,162 62,340 3,844 205,346 32.9% 27.9% 32.2%
060201 Padcaya 0 0 0 0 11,787 6,620 274 18,681 11,787 6,620 274 18,681 - 36.9% 36.9%
060202 Bermejo 17,478 11,364 617 29,459 2,291 2,617 33 4,941 19,769 13,981 650 34,400 40.7% 53.6% 42.5%
060301 Yacuiba 37,942 25,009 1,139 64,090 14,715 12,139 1,054 27,908 52,657 37,148 2,193 91,998 40.8% 47.3% 42.8%
060302 Caraparí 1,245 2,285 19 3,549 5,716 6,021 80 11,817 6,961 8,306 99 15,366 64.9% 51.6% 54.7%
060303 Villamontes 17,231 12,331 666 30,228 5,015 4,511 46 9,572 22,246 16,842 712 39,800 43.0% 47.6% 44.1%
060401 Uriondo 0 0 0 0 10,851 3,695 198 14,744 10,851 3,695 198 14,744 - 26.4% 26.4% 060402 Yunchará 0 0 0 0 4,012 1,410 68 5,490 4,012 1,410 68 5,490 - 26.9% 26.9%
060501 Villa San Lorenzo 2,354 969 78 3,401 14,067 5,858 313 20,238 16,421 6,827 391 23,639 30.8% 30.5% 30.5%
060502 El Puente 0 0 0 0 8,602 2,669 83 11,354 8,602 2,669 83 11,354 - 24.2% 24.2%
060601 Entre Ríos 2,662 1,337 45 4,044 11,505 5,698 131 17,334 14,167 7,035 176 21,378 34.2% 33.6% 33.7%
070101 Santa Cruz de la Sierra 1,040,068 368,372 32,966 1,441,406 8,613 3,166 364 12,143 1,048,681 371,538 33,330 1,453,549 27.8% 29.1% 27.9%
070102 Cotoca 19,028 5,013 246 24,287 14,361 6,699 172 21,232 33,389 11,712 418 45,519 21.7% 32.4% 26.6%
070103 Porongo 1,442 759 342 2,543 9,499 3,015 144 12,658 10,941 3,774 486 15,201 43.3% 25.0% 28.0%
070104 La Guardia 56,695 22,617 1,103 80,415 6,244 2,175 246 8,665 62,939 24,792 1,349 89,080 29.5% 27.9% 29.3%
070105 El Torno 19,958 10,686 284 30,928 11,012 7,567 145 18,724 30,970 18,253 429 49,652 35.5% 41.2% 37.6%
070201 Warnes 54,720 24,948 891 80,559 10,866 4,900 81 15,847 65,586 29,848 972 96,406 32.1% 31.4% 32.0%
070202 Okinawa Uno 5,153 992 199 6,344 4,418 1,576 144 6,138 9,571 2,568 343 12,482 18.8% 28.0% 23.3%
070301 San Ignacio de Velasco 17,468 5,313 345 23,126 19,361 9,400 389 29,150 36,829 14,713 734 52,276 24.5% 33.6% 29.5% 070302 San Miguel de Velasco 2,804 644 16 3,464 6,624 1,230 9 7,863 9,428 1,874 25 11,327 19.1% 15.8% 16.8%
070303 San Rafael 2,159 438 21 2,618 2,976 515 30 3,521 5,135 953 51 6,139 17.5% 15.5% 16.4%
070401 Buena Vista 2,800 1,567 38 4,405 4,774 3,624 76 8,474 7,574 5,191 114 12,879 36.4% 43.7% 41.2%
070402 San Carlos 9,075 3,880 119 13,074 4,662 2,296 61 7,019 13,737 6,176 180 20,093 30.6% 33.6% 31.6%
070403 Yapacaní 20,141 12,836 287 33,264 8,597 8,617 80 17,294 28,738 21,453 367 50,558 39.5% 50.3% 43.2%
070404 San Juan de Yapacaní 3,590 1,575 236 5,401 1,971 1,803 16 3,790 5,561 3,378 252 9,191 33.5% 48.0% 39.5%
070501 San José de Chiquitos 8,485 3,293 96 11,874 11,009 4,671 1,368 17,048 19,494 7,964 1,464 28,922 28.5% 35.4% 32.6%
070502 Pailón 5,867 3,864 119 9,850 14,852 9,890 3,274 28,016 20,719 13,754 3,393 37,866 40.4% 47.0% 45.3%
070503 Roboré 7,254 2,762 82 10,098 3,381 2,107 55 5,543 10,635 4,869 137 15,641 28.2% 39.0% 32.0%
070601 Portachuelo 11,947 1,945 199 14,091 2,486 1,277 31 3,794 14,433 3,222 230 17,885 15.2% 34.5% 19.3%
070602 Santa Rosa del Sara 4,042 1,169 27 5,238 6,549 6,466 71 13,086 10,591 7,635 98 18,324 22.8% 50.0% 42.2%
070603 Colpa Belgica 2,730 1,818 27 4,575 986 499 9 1,494 3,716 2,317 36 6,069 40.3% 34.0% 38.8% 070701 Lagunillas 0 0 0 0 3,112 2,240 14 5,366 3,112 2,240 14 5,366 - 42.0% 42.0%
070702 Charagua 2,242 1,234 20 3,496 20,299 6,135 2,234 28,668 22,541 7,369 2,254 32,164 35.9% 29.2% 29.9%
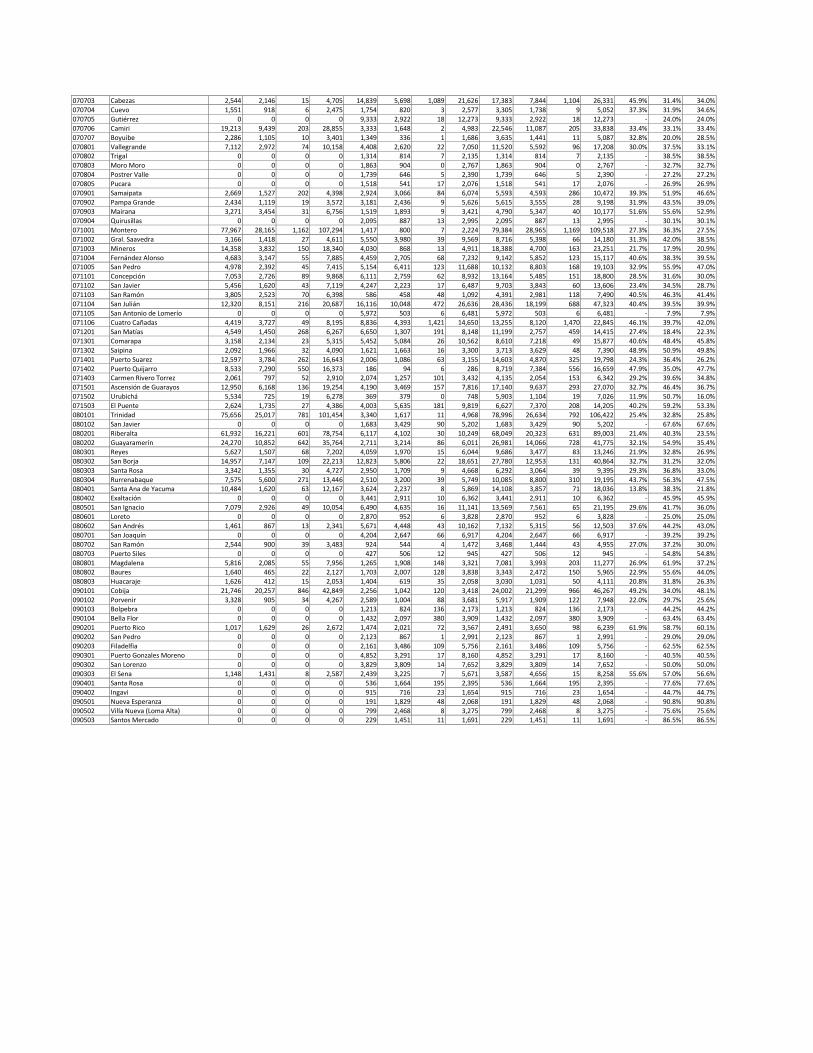
070703 Cabezas 2,544 2,146 15 4,705 14,839 5,698 1,089 21,626 17,383 7,844 1,104 26,331 45.9% 31.4% 34.0%
070704 Cuevo 1,551 918 6 2,475 1,754 820 3 2,577 3,305 1,738 9 5,052 37.3% 31.9% 34.6%
070705 Gutiérrez 0 0 0 0 9,333 2,922 18 12,273 9,333 2,922 18 12,273 - 24.0% 24.0%
070706 Camiri 19,213 9,439 203 28,855 3,333 1,648 2 4,983 22,546 11,087 205 33,838 33.4% 33.1% 33.4%
070707 Boyuibe 2,286 1,105 10 3,401 1,349 336 1 1,686 3,635 1,441 11 5,087 32.8% 20.0% 28.5%
070801 Vallegrande 7,112 2,972 74 10,158 4,408 2,620 22 7,050 11,520 5,592 96 17,208 30.0% 37.5% 33.1% 070802 Trigal 0 0 0 0 1,314 814 7 2,135 1,314 814 7 2,135 - 38.5% 38.5%
070803 Moro Moro 0 0 0 0 1,863 904 0 2,767 1,863 904 0 2,767 - 32.7% 32.7%
070804 Postrer Valle 0 0 0 0 1,739 646 5 2,390 1,739 646 5 2,390 - 27.2% 27.2%
070805 Pucara 0 0 0 0 1,518 541 17 2,076 1,518 541 17 2,076 - 26.9% 26.9%
070901 Samaipata 2,669 1,527 202 4,398 2,924 3,066 84 6,074 5,593 4,593 286 10,472 39.3% 51.9% 46.6%
070902 Pampa Grande 2,434 1,119 19 3,572 3,181 2,436 9 5,626 5,615 3,555 28 9,198 31.9% 43.5% 39.0%
070903 Mairana 3,271 3,454 31 6,756 1,519 1,893 9 3,421 4,790 5,347 40 10,177 51.6% 55.6% 52.9%
070904 Quirusillas 0 0 0 0 2,095 887 13 2,995 2,095 887 13 2,995 - 30.1% 30.1%
071001 Montero 77,967 28,165 1,162 107,294 1,417 800 7 2,224 79,384 28,965 1,169 109,518 27.3% 36.3% 27.5%
071002 Gral. Saavedra 3,166 1,418 27 4,611 5,550 3,980 39 9,569 8,716 5,398 66 14,180 31.3% 42.0% 38.5%
071003 Mineros 14,358 3,832 150 18,340 4,030 868 13 4,911 18,388 4,700 163 23,251 21.7% 17.9% 20.9%
071004 Fernández Alonso 4,683 3,147 55 7,885 4,459 2,705 68 7,232 9,142 5,852 123 15,117 40.6% 38.3% 39.5% 071005 San Pedro 4,978 2,392 45 7,415 5,154 6,411 123 11,688 10,132 8,803 168 19,103 32.9% 55.9% 47.0%
071101 Concepción 7,053 2,726 89 9,868 6,111 2,759 62 8,932 13,164 5,485 151 18,800 28.5% 31.6% 30.0%
071102 San Javier 5,456 1,620 43 7,119 4,247 2,223 17 6,487 9,703 3,843 60 13,606 23.4% 34.5% 28.7%
071103 San Ramón 3,805 2,523 70 6,398 586 458 48 1,092 4,391 2,981 118 7,490 40.5% 46.3% 41.4%
071104 San Julián 12,320 8,151 216 20,687 16,116 10,048 472 26,636 28,436 18,199 688 47,323 40.4% 39.5% 39.9%
071105 San Antonio de Lomerío 0 0 0 0 5,972 503 6 6,481 5,972 503 6 6,481 - 7.9% 7.9%
071106 Cuatro Cañadas 4,419 3,727 49 8,195 8,836 4,393 1,421 14,650 13,255 8,120 1,470 22,845 46.1% 39.7% 42.0%
071201 San Matías 4,549 1,450 268 6,267 6,650 1,307 191 8,148 11,199 2,757 459 14,415 27.4% 18.4% 22.3%
071301 Comarapa 3,158 2,134 23 5,315 5,452 5,084 26 10,562 8,610 7,218 49 15,877 40.6% 48.4% 45.8%
071302 Saipina 2,092 1,966 32 4,090 1,621 1,663 16 3,300 3,713 3,629 48 7,390 48.9% 50.9% 49.8%
071401 Puerto Suarez 12,597 3,784 262 16,643 2,006 1,086 63 3,155 14,603 4,870 325 19,798 24.3% 36.4% 26.2%
071402 Puerto Quijarro 8,533 7,290 550 16,373 186 94 6 286 8,719 7,384 556 16,659 47.9% 35.0% 47.7% 071403 Carmen Rivero Torrez 2,061 797 52 2,910 2,074 1,257 101 3,432 4,135 2,054 153 6,342 29.2% 39.6% 34.8%
071501 Ascensión de Guarayos 12,950 6,168 136 19,254 4,190 3,469 157 7,816 17,140 9,637 293 27,070 32.7% 46.4% 36.7%
071502 Urubichá 5,534 725 19 6,278 369 379 0 748 5,903 1,104 19 7,026 11.9% 50.7% 16.0%
071503 El Puente 2,624 1,735 27 4,386 4,003 5,635 181 9,819 6,627 7,370 208 14,205 40.2% 59.2% 53.3%
080101 Trinidad 75,656 25,017 781 101,454 3,340 1,617 11 4,968 78,996 26,634 792 106,422 25.4% 32.8% 25.8%
080102 San Javier 0 0 0 0 1,683 3,429 90 5,202 1,683 3,429 90 5,202 - 67.6% 67.6%
080201 Riberalta 61,932 16,221 601 78,754 6,117 4,102 30 10,249 68,049 20,323 631 89,003 21.4% 40.3% 23.5%
080202 Guayaramerín 24,270 10,852 642 35,764 2,711 3,214 86 6,011 26,981 14,066 728 41,775 32.1% 54.9% 35.4%
080301 Reyes 5,627 1,507 68 7,202 4,059 1,970 15 6,044 9,686 3,477 83 13,246 21.9% 32.8% 26.9%
080302 San Borja 14,957 7,147 109 22,213 12,823 5,806 22 18,651 27,780 12,953 131 40,864 32.7% 31.2% 32.0%
080303 Santa Rosa 3,342 1,355 30 4,727 2,950 1,709 9 4,668 6,292 3,064 39 9,395 29.3% 36.8% 33.0%
080304 Rurrenabaque 7,575 5,600 271 13,446 2,510 3,200 39 5,749 10,085 8,800 310 19,195 43.7% 56.3% 47.5% 080401 Santa Ana de Yacuma 10,484 1,620 63 12,167 3,624 2,237 8 5,869 14,108 3,857 71 18,036 13.8% 38.3% 21.8%
080402 Exaltación 0 0 0 0 3,441 2,911 10 6,362 3,441 2,911 10 6,362 - 45.9% 45.9%
080501 San Ignacio 7,079 2,926 49 10,054 6,490 4,635 16 11,141 13,569 7,561 65 21,195 29.6% 41.7% 36.0%
080601 Loreto 0 0 0 0 2,870 952 6 3,828 2,870 952 6 3,828 - 25.0% 25.0%
080602 San Andrés 1,461 867 13 2,341 5,671 4,448 43 10,162 7,132 5,315 56 12,503 37.6% 44.2% 43.0%
080701 San Joaquín 0 0 0 0 4,204 2,647 66 6,917 4,204 2,647 66 6,917 - 39.2% 39.2%
080702 San Ramón 2,544 900 39 3,483 924 544 4 1,472 3,468 1,444 43 4,955 27.0% 37.2% 30.0%
080703 Puerto Siles 0 0 0 0 427 506 12 945 427 506 12 945 - 54.8% 54.8%
080801 Magdalena 5,816 2,085 55 7,956 1,265 1,908 148 3,321 7,081 3,993 203 11,277 26.9% 61.9% 37.2%
080802 Baures 1,640 465 22 2,127 1,703 2,007 128 3,838 3,343 2,472 150 5,965 22.9% 55.6% 44.0%
080803 Huacaraje 1,626 412 15 2,053 1,404 619 35 2,058 3,030 1,031 50 4,111 20.8% 31.8% 26.3%
090101 Cobija 21,746 20,257 846 42,849 2,256 1,042 120 3,418 24,002 21,299 966 46,267 49.2% 34.0% 48.1%
090102 Porvenir 3,328 905 34 4,267 2,589 1,004 88 3,681 5,917 1,909 122 7,948 22.0% 29.7% 25.6% 090103 Bolpebra 0 0 0 0 1,213 824 136 2,173 1,213 824 136 2,173 - 44.2% 44.2%
090104 Bella Flor 0 0 0 0 1,432 2,097 380 3,909 1,432 2,097 380 3,909 - 63.4% 63.4%
090201 Puerto Rico 1,017 1,629 26 2,672 1,474 2,021 72 3,567 2,491 3,650 98 6,239 61.9% 58.7% 60.1%
090202 San Pedro 0 0 0 0 2,123 867 1 2,991 2,123 867 1 2,991 - 29.0% 29.0%
090203 Filadelfia 0 0 0 0 2,161 3,486 109 5,756 2,161 3,486 109 5,756 - 62.5% 62.5%
090301 Puerto Gonzales Moreno 0 0 0 0 4,852 3,291 17 8,160 4,852 3,291 17 8,160 - 40.5% 40.5%
090302 San Lorenzo 0 0 0 0 3,829 3,809 14 7,652 3,829 3,809 14 7,652 - 50.0% 50.0%
090303 El Sena 1,148 1,431 8 2,587 2,439 3,225 7 5,671 3,587 4,656 15 8,258 55.6% 57.0% 56.6%
090401 Santa Rosa 0 0 0 0 536 1,664 195 2,395 536 1,664 195 2,395 - 77.6% 77.6%
090402 Ingavi 0 0 0 0 915 716 23 1,654 915 716 23 1,654 - 44.7% 44.7%
090501 Nueva Esperanza 0 0 0 0 191 1,829 48 2,068 191 1,829 48 2,068 - 90.8% 90.8%
090502 Villa Nueva (Loma Alta) 0 0 0 0 799 2,468 8 3,275 799 2,468 8 3,275 - 75.6% 75.6% 090503 Santos Mercado 0 0 0 0 229 1,451 11 1,691 229 1,451 11 1,691 - 86.5% 86.5%
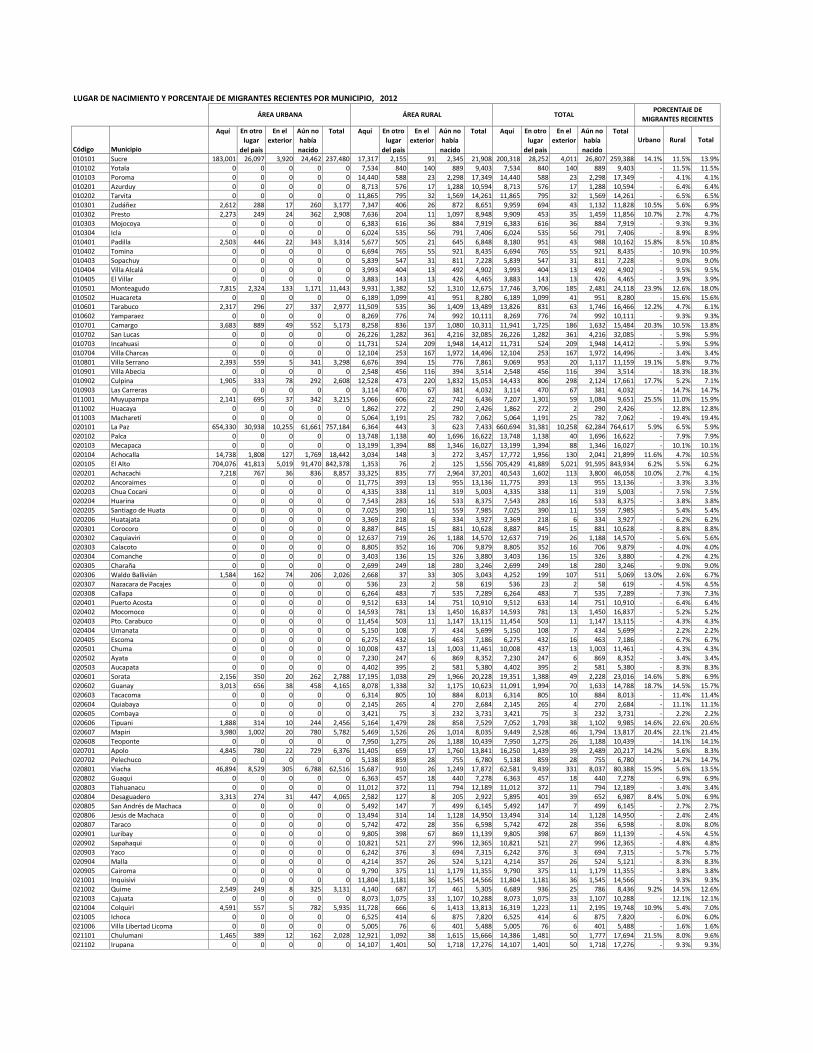
LUGAR DE NACIMIENTO Y PORCENTAJE DE MIGRANTES RECIENTES POR MUNICIPIO, 2012
ÁREA URBANA ÁREA RURAL TOTAL PORCENTAJE DE
MIGRANTES RECIENTES
Código
Municipio
Aquí En otro
lugar
del pais
En el
exterior
Aún no
había
nacido
Total Aquí En otro
lugar
del pais
En el
exterior
Aún no
había
nacido
Total Aquí En otro
lugar
del pais
En el
exterior
Aún no
había
nacido
Total Urbano
Rural
Total
010101 Sucre 183,001 26,097 3,920 24,462 237,480 17,317 2,155 91 2,345 21,908 200,318 28,252 4,011 26,807 259,388 14.1% 11.5% 13.9%
010102 Yotala 0 0 0 0 0 7,534 840 140 889 9,403 7,534 840 140 889 9,403 - 11.5% 11.5%
010103 Poroma 0 0 0 0 0 14,440 588 23 2,298 17,349 14,440 588 23 2,298 17,349 - 4.1% 4.1%
010201 Azurduy 0 0 0 0 0 8,713 576 17 1,288 10,594 8,713 576 17 1,288 10,594 - 6.4% 6.4% 010202 Tarvita 0 0 0 0 0 11,865 795 32 1,569 14,261 11,865 795 32 1,569 14,261 - 6.5% 6.5%
010301 Zudáñez 2,612 288 17 260 3,177 7,347 406 26 872 8,651 9,959 694 43 1,132 11,828 10.5% 5.6% 6.9%
010302 Presto 2,273 249 24 362 2,908 7,636 204 11 1,097 8,948 9,909 453 35 1,459 11,856 10.7% 2.7% 4.7%
010303 Mojocoya 0 0 0 0 0 6,383 616 36 884 7,919 6,383 616 36 884 7,919 - 9.3% 9.3%
010304 Icla 0 0 0 0 0 6,024 535 56 791 7,406 6,024 535 56 791 7,406 - 8.9% 8.9%
010401 Padilla 2,503 446 22 343 3,314 5,677 505 21 645 6,848 8,180 951 43 988 10,162 15.8% 8.5% 10.8%
010402 Tomina 0 0 0 0 0 6,694 765 55 921 8,435 6,694 765 55 921 8,435 - 10.9% 10.9%
010403 Sopachuy 0 0 0 0 0 5,839 547 31 811 7,228 5,839 547 31 811 7,228 - 9.0% 9.0%
010404 Villa Alcalá 0 0 0 0 0 3,993 404 13 492 4,902 3,993 404 13 492 4,902 - 9.5% 9.5%
010405 El Villar 0 0 0 0 0 3,883 143 13 426 4,465 3,883 143 13 426 4,465 - 3.9% 3.9%
010501 Monteagudo 7,815 2,324 133 1,171 11,443 9,931 1,382 52 1,310 12,675 17,746 3,706 185 2,481 24,118 23.9% 12.6% 18.0%
010502 Huacareta 0 0 0 0 0 6,189 1,099 41 951 8,280 6,189 1,099 41 951 8,280 - 15.6% 15.6% 010601 Tarabuco 2,317 296 27 337 2,977 11,509 535 36 1,409 13,489 13,826 831 63 1,746 16,466 12.2% 4.7% 6.1%
010602 Yamparaez 0 0 0 0 0 8,269 776 74 992 10,111 8,269 776 74 992 10,111 - 9.3% 9.3%
010701 Camargo 3,683 889 49 552 5,173 8,258 836 137 1,080 10,311 11,941 1,725 186 1,632 15,484 20.3% 10.5% 13.8%
010702 San Lucas 0 0 0 0 0 26,226 1,282 361 4,216 32,085 26,226 1,282 361 4,216 32,085 - 5.9% 5.9%
010703 Incahuasi 0 0 0 0 0 11,731 524 209 1,948 14,412 11,731 524 209 1,948 14,412 - 5.9% 5.9%
010704 Villa Charcas 0 0 0 0 0 12,104 253 167 1,972 14,496 12,104 253 167 1,972 14,496 - 3.4% 3.4%
010801 Villa Serrano 2,393 559 5 341 3,298 6,676 394 15 776 7,861 9,069 953 20 1,117 11,159 19.1% 5.8% 9.7%
010901 Villa Abecia 0 0 0 0 0 2,548 456 116 394 3,514 2,548 456 116 394 3,514 - 18.3% 18.3%
010902 Culpina 1,905 333 78 292 2,608 12,528 473 220 1,832 15,053 14,433 806 298 2,124 17,661 17.7% 5.2% 7.1%
010903 Las Carreras 0 0 0 0 0 3,114 470 67 381 4,032 3,114 470 67 381 4,032 - 14.7% 14.7%
011001 Muyupampa 2,141 695 37 342 3,215 5,066 606 22 742 6,436 7,207 1,301 59 1,084 9,651 25.5% 11.0% 15.9%
011002 Huacaya 0 0 0 0 0 1,862 272 2 290 2,426 1,862 272 2 290 2,426 - 12.8% 12.8%
011003 Macharetí 0 0 0 0 0 5,064 1,191 25 782 7,062 5,064 1,191 25 782 7,062 - 19.4% 19.4% 020101 La Paz 654,330 30,938 10,255 61,661 757,184 6,364 443 3 623 7,433 660,694 31,381 10,258 62,284 764,617 5.9% 6.5% 5.9%
020102 Palca 0 0 0 0 0 13,748 1,138 40 1,696 16,622 13,748 1,138 40 1,696 16,622 - 7.9% 7.9%
020103 Mecapaca 0 0 0 0 0 13,199 1,394 88 1,346 16,027 13,199 1,394 88 1,346 16,027 - 10.1% 10.1%
020104 Achocalla 14,738 1,808 127 1,769 18,442 3,034 148 3 272 3,457 17,772 1,956 130 2,041 21,899 11.6% 4.7% 10.5%
020105 El Alto 704,076 41,813 5,019 91,470 842,378 1,353 76 2 125 1,556 705,429 41,889 5,021 91,595 843,934 6.2% 5.5% 6.2%
020201 Achacachi 7,218 767 36 836 8,857 33,325 835 77 2,964 37,201 40,543 1,602 113 3,800 46,058 10.0% 2.7% 4.1%
020202 Ancoraimes 0 0 0 0 0 11,775 393 13 955 13,136 11,775 393 13 955 13,136 - 3.3% 3.3%
020203 Chua Cocani 0 0 0 0 0 4,335 338 11 319 5,003 4,335 338 11 319 5,003 - 7.5% 7.5%
020204 Huarina 0 0 0 0 0 7,543 283 16 533 8,375 7,543 283 16 533 8,375 - 3.8% 3.8%
020205 Santiago de Huata 0 0 0 0 0 7,025 390 11 559 7,985 7,025 390 11 559 7,985 - 5.4% 5.4%
020206 Huatajata 0 0 0 0 0 3,369 218 6 334 3,927 3,369 218 6 334 3,927 - 6.2% 6.2%
020301 Corocoro 0 0 0 0 0 8,887 845 15 881 10,628 8,887 845 15 881 10,628 - 8.8% 8.8% 020302 Caquiaviri 0 0 0 0 0 12,637 719 26 1,188 14,570 12,637 719 26 1,188 14,570 - 5.6% 5.6%
020303 Calacoto 0 0 0 0 0 8,805 352 16 706 9,879 8,805 352 16 706 9,879 - 4.0% 4.0%
020304 Comanche 0 0 0 0 0 3,403 136 15 326 3,880 3,403 136 15 326 3,880 - 4.2% 4.2%
020305 Charaña 0 0 0 0 0 2,699 249 18 280 3,246 2,699 249 18 280 3,246 - 9.0% 9.0%
020306 Waldo Ballivián 1,584 162 74 206 2,026 2,668 37 33 305 3,043 4,252 199 107 511 5,069 13.0% 2.6% 6.7%
020307 Nazacara de Pacajes 0 0 0 0 0 536 23 2 58 619 536 23 2 58 619 - 4.5% 4.5%
020308 Callapa 0 0 0 0 0 6,264 483 7 535 7,289 6,264 483 7 535 7,289 - 7.3% 7.3%
020401 Puerto Acosta 0 0 0 0 0 9,512 633 14 751 10,910 9,512 633 14 751 10,910 - 6.4% 6.4%
020402 Mocomoco 0 0 0 0 0 14,593 781 13 1,450 16,837 14,593 781 13 1,450 16,837 - 5.2% 5.2%
020403 Pto. Carabuco 0 0 0 0 0 11,454 503 11 1,147 13,115 11,454 503 11 1,147 13,115 - 4.3% 4.3%
020404 Umanata 0 0 0 0 0 5,150 108 7 434 5,699 5,150 108 7 434 5,699 - 2.2% 2.2%
020405 Escoma 0 0 0 0 0 6,275 432 16 463 7,186 6,275 432 16 463 7,186 - 6.7% 6.7% 020501 Chuma 0 0 0 0 0 10,008 437 13 1,003 11,461 10,008 437 13 1,003 11,461 - 4.3% 4.3%
020502 Ayata 0 0 0 0 0 7,230 247 6 869 8,352 7,230 247 6 869 8,352 - 3.4% 3.4%
020503 Aucapata 0 0 0 0 0 4,402 395 2 581 5,380 4,402 395 2 581 5,380 - 8.3% 8.3%
020601 Sorata 2,156 350 20 262 2,788 17,195 1,038 29 1,966 20,228 19,351 1,388 49 2,228 23,016 14.6% 5.8% 6.9%
020602 Guanay 3,013 656 38 458 4,165 8,078 1,338 32 1,175 10,623 11,091 1,994 70 1,633 14,788 18.7% 14.5% 15.7%
020603 Tacacoma 0 0 0 0 0 6,314 805 10 884 8,013 6,314 805 10 884 8,013 - 11.4% 11.4%
020604 Quiabaya 0 0 0 0 0 2,145 265 4 270 2,684 2,145 265 4 270 2,684 - 11.1% 11.1%
020605 Combaya 0 0 0 0 0 3,421 75 3 232 3,731 3,421 75 3 232 3,731 - 2.2% 2.2%
020606 Tipuani 1,888 314 10 244 2,456 5,164 1,479 28 858 7,529 7,052 1,793 38 1,102 9,985 14.6% 22.6% 20.6%
020607 Mapiri 3,980 1,002 20 780 5,782 5,469 1,526 26 1,014 8,035 9,449 2,528 46 1,794 13,817 20.4% 22.1% 21.4%
020608 Teoponte 0 0 0 0 0 7,950 1,275 26 1,188 10,439 7,950 1,275 26 1,188 10,439 - 14.1% 14.1%
020701 Apolo 4,845 780 22 729 6,376 11,405 659 17 1,760 13,841 16,250 1,439 39 2,489 20,217 14.2% 5.6% 8.3% 020702 Pelechuco 0 0 0 0 0 5,138 859 28 755 6,780 5,138 859 28 755 6,780 - 14.7% 14.7%
020801 Viacha 46,894 8,529 305 6,788 62,516 15,687 910 26 1,249 17,872 62,581 9,439 331 8,037 80,388 15.9% 5.6% 13.5%
020802 Guaqui 0 0 0 0 0 6,363 457 18 440 7,278 6,363 457 18 440 7,278 - 6.9% 6.9%
020803 Tiahuanacu 0 0 0 0 0 11,012 372 11 794 12,189 11,012 372 11 794 12,189 - 3.4% 3.4%
020804 Desaguadero 3,313 274 31 447 4,065 2,582 127 8 205 2,922 5,895 401 39 652 6,987 8.4% 5.0% 6.9%
020805 San Andrés de Machaca 0 0 0 0 0 5,492 147 7 499 6,145 5,492 147 7 499 6,145 - 2.7% 2.7%
020806 Jesús de Machaca 0 0 0 0 0 13,494 314 14 1,128 14,950 13,494 314 14 1,128 14,950 - 2.4% 2.4%
020807 Taraco 0 0 0 0 0 5,742 472 28 356 6,598 5,742 472 28 356 6,598 - 8.0% 8.0%
020901 Luribay 0 0 0 0 0 9,805 398 67 869 11,139 9,805 398 67 869 11,139 - 4.5% 4.5%
020902 Sapahaqui 0 0 0 0 0 10,821 521 27 996 12,365 10,821 521 27 996 12,365 - 4.8% 4.8%
020903 Yaco 0 0 0 0 0 6,242 376 3 694 7,315 6,242 376 3 694 7,315 - 5.7% 5.7%
020904 Malla 0 0 0 0 0 4,214 357 26 524 5,121 4,214 357 26 524 5,121 - 8.3% 8.3%
020905 Cairoma 0 0 0 0 0 9,790 375 11 1,179 11,355 9,790 375 11 1,179 11,355 - 3.8% 3.8% 021001 Inquisivi 0 0 0 0 0 11,804 1,181 36 1,545 14,566 11,804 1,181 36 1,545 14,566 - 9.3% 9.3%
021002 Quime 2,549 249 8 325 3,131 4,140 687 17 461 5,305 6,689 936 25 786 8,436 9.2% 14.5% 12.6%
021003 Cajuata 0 0 0 0 0 8,073 1,075 33 1,107 10,288 8,073 1,075 33 1,107 10,288 - 12.1% 12.1%
021004 Colquiri 4,591 557 5 782 5,935 11,728 666 6 1,413 13,813 16,319 1,223 11 2,195 19,748 10.9% 5.4% 7.0%
021005 Ichoca 0 0 0 0 0 6,525 414 6 875 7,820 6,525 414 6 875 7,820 - 6.0% 6.0%
021006 Villa Libertad Licoma 0 0 0 0 0 5,005 76 6 401 5,488 5,005 76 6 401 5,488 - 1.6% 1.6%
021101 Chulumani 1,465 389 12 162 2,028 12,921 1,092 38 1,615 15,666 14,386 1,481 50 1,777 17,694 21.5% 8.0% 9.6%
021102 Irupana 0 0 0 0 0 14,107 1,401 50 1,718 17,276 14,107 1,401 50 1,718 17,276 - 9.3% 9.3%

021103 Yanacachi 0 0 0 0 0 5,045 658 18 581 6,302 5,045 658 18 581 6,302 - 11.8% 11.8%
021104 Palos Blancos 4,163 676 8 631 5,478 14,936 1,912 35 2,275 19,158 19,099 2,588 43 2,906 24,636 14.1% 11.5% 12.1%
021105 La Asunta 1,484 384 9 266 2,143 28,637 2,874 34 5,417 36,962 30,121 3,258 43 5,683 39,105 20.9% 9.2% 9.9%
021201 Pucarani 0 0 0 0 0 25,666 1,107 44 2,777 29,594 25,666 1,107 44 2,777 29,594 - 4.3% 4.3%
021202 Laja 0 0 0 0 0 20,949 715 28 1,981 23,673 20,949 715 28 1,981 23,673 - 3.4% 3.4%
021203 Batallas 1,955 114 5 183 2,257 13,348 372 28 1,279 15,027 15,303 486 33 1,462 17,284 5.7% 2.9% 3.3% 021204 Puerto Pérez 0 0 0 0 0 6,145 326 16 541 7,028 6,145 326 16 541 7,028 - 5.3% 5.3%
021301 Sica Sica 9,350 486 31 1,180 11,047 17,404 653 35 1,915 20,007 26,754 1,139 66 3,095 31,054 5.2% 3.8% 4.3%
021302 Umala 0 0 0 0 0 7,200 808 17 750 8,775 7,200 808 17 750 8,775 - 10.3% 10.3%
021303 Ayo Ayo 0 0 0 0 0 6,919 146 5 728 7,798 6,919 146 5 728 7,798 - 2.1% 2.1%
021304 Calamarca 0 0 0 0 0 10,804 291 27 982 12,104 10,804 291 27 982 12,104 - 2.9% 2.9%
021305 Patacamaya 8,275 1,436 93 1,393 11,197 10,191 373 18 1,027 11,609 18,466 1,809 111 2,420 22,806 15.6% 3.7% 9.4%
021306 Colquencha 2,656 110 18 301 3,085 5,944 143 5 608 6,700 8,600 253 23 909 9,785 4.6% 2.4% 3.1%
021307 Collana 1,751 92 11 210 2,064 2,696 14 3 265 2,978 4,447 106 14 475 5,042 5.6% 0.6% 2.6%
021401 Coroico 1,643 412 62 202 2,319 13,922 1,494 73 1,589 17,078 15,565 1,906 135 1,791 19,397 22.4% 10.1% 11.6%
021402 Coripata 0 0 0 0 0 14,796 972 43 1,775 17,586 14,796 972 43 1,775 17,586 - 6.4% 6.4%
021501 Ixiamas 2,478 931 30 529 3,968 3,680 951 10 753 5,394 6,158 1,882 40 1,282 9,362 27.9% 20.7% 23.8%
021502 San Buenaventura 2,101 562 30 396 3,089 4,153 660 30 779 5,622 6,254 1,222 60 1,175 8,711 22.0% 14.2% 17.0% 021601 Charazani 2,859 19 0 426 3,304 8,235 353 8 1,123 9,719 11,094 372 8 1,549 13,023 0.7% 4.2% 3.3%
021602 Curva 0 0 0 0 0 2,836 45 2 402 3,285 2,836 45 2 402 3,285 - 1.6% 1.6%
021701 Copacabana 4,308 619 151 501 5,579 7,954 660 40 698 9,352 12,262 1,279 191 1,199 14,931 15.2% 8.1% 10.7%
021702 San Pedro de Tiquina 0 0 0 0 0 5,116 468 33 345 5,962 5,116 468 33 345 5,962 - 8.9% 8.9%
021703 Tito Yupanqui 3,213 15 5 226 3,459 2,629 25 0 148 2,802 5,842 40 5 374 6,261 0.6% 0.9% 0.8%
021801 San Pedro Cuarahuara 0 0 0 0 0 7,938 169 62 607 8,776 7,938 169 62 607 8,776 - 2.8% 2.8%
021802 Papel Pampa 0 0 0 0 0 6,039 321 40 602 7,002 6,039 321 40 602 7,002 - 5.6% 5.6%
021803 Chacarilla 0 0 0 0 0 1,772 33 4 195 2,004 1,772 33 4 195 2,004 - 2.0% 2.0%
021901 Santiago de Machaca 0 0 0 0 0 3,824 355 23 298 4,500 3,824 355 23 298 4,500 - 9.0% 9.0%
021902 Catacora 0 0 0 0 0 2,540 55 11 275 2,881 2,540 55 11 275 2,881 - 2.5% 2.5%
022001 Caranavi 10,098 2,143 51 1,277 13,569 28,737 2,108 47 4,052 34,944 38,835 4,251 98 5,329 48,513 17.8% 7.0% 10.1%
022002 Alto Beni 0 0 0 0 0 9,025 566 10 1,251 10,852 9,025 566 10 1,251 10,852 - 6.0% 6.0% 030101 Cochabamba 505,675 47,664 14,793 62,455 630,587 0 0 0 0 0 505,675 47,664 14,793 62,455 630,587 11.0% - 11.0%
030201 Aiquile 5,861 972 172 858 7,863 12,993 577 74 1,760 15,404 18,854 1,549 246 2,618 23,267 16.3% 4.8% 8.7%
030202 Pasorapa 2,698 138 17 281 3,134 2,972 237 4 349 3,562 5,670 375 21 630 6,696 5.4% 7.5% 6.5%
030203 Omereque 0 0 0 0 0 4,718 390 54 638 5,800 4,718 390 54 638 5,800 - 8.6% 8.6%
030301 Independencia 0 0 0 0 0 19,290 1,251 69 2,925 23,535 19,290 1,251 69 2,925 23,535 - 6.4% 6.4%
030302 Morochata 0 0 0 0 0 11,172 513 42 1,557 13,284 11,172 513 42 1,557 13,284 - 4.7% 4.7%
030303 Cocapata 0 0 0 0 0 13,982 1,161 100 2,346 17,589 13,982 1,161 100 2,346 17,589 - 8.3% 8.3%
030401 Tarata 3,113 415 123 301 3,952 3,576 207 62 445 4,290 6,689 622 185 746 8,242 14.7% 7.0% 10.8%
030402 Anzaldo 0 0 0 0 0 6,166 218 8 800 7,192 6,166 218 8 800 7,192 - 3.5% 3.5%
030403 Arbieto 3,967 671 99 598 5,335 9,114 1,501 285 1,117 12,017 13,081 2,172 384 1,715 17,352 16.3% 16.4% 16.3%
030404 Sacabamba 0 0 0 0 0 3,746 138 10 472 4,366 3,746 138 10 472 4,366 - 3.8% 3.8%
030501 Arani 2,998 156 61 327 3,542 5,170 219 86 487 5,962 8,168 375 147 814 9,504 6.7% 5.6% 6.0% 030502 Vacas 0 0 0 0 0 7,748 272 58 862 8,940 7,748 272 58 862 8,940 - 4.1% 4.1%
030601 Arque 0 0 0 0 0 8,642 287 11 1,584 10,524 8,642 287 11 1,584 10,524 - 3.3% 3.3%
030602 Tacopaya 0 0 0 0 0 8,487 434 11 1,174 10,106 8,487 434 11 1,174 10,106 - 5.0% 5.0%
030701 Capinota 7,042 824 189 1,077 9,132 8,286 768 73 1,133 10,260 15,328 1,592 262 2,210 19,392 12.6% 9.2% 10.8%
030702 Santivañez 0 0 0 0 0 5,351 464 135 577 6,527 5,351 464 135 577 6,527 - 10.1% 10.1%
030703 Sicaya 0 0 0 0 0 3,163 65 18 494 3,740 3,163 65 18 494 3,740 - 2.6% 2.6%
030801 Cliza 8,936 622 368 1,182 11,108 8,960 481 229 965 10,635 17,896 1,103 597 2,147 21,743 10.0% 7.3% 8.7%
030802 Toco 0 0 0 0 0 6,380 86 73 518 7,057 6,380 86 73 518 7,057 - 2.4% 2.4%
030803 Tolata 2,530 430 103 305 3,368 1,702 248 37 187 2,174 4,232 678 140 492 5,542 17.4% 14.3% 16.2%
030901 Quillacollo 103,556 10,632 2,499 13,747 130,434 5,558 228 50 759 6,595 109,114 10,860 2,549 14,506 137,029 11.3% 4.8% 10.9%
030902 Sipesipe 10,628 1,647 178 1,807 14,260 21,520 2,451 266 3,040 27,277 32,148 4,098 444 4,847 41,537 14.7% 11.2% 12.4%
030903 Tiquipaya 38,196 4,853 1,229 4,959 49,237 3,666 81 5 679 4,431 41,862 4,934 1,234 5,638 53,668 13.7% 2.3% 12.8%
030904 Vinto 29,821 5,513 741 4,711 40,786 8,889 852 71 1,271 11,083 38,710 6,365 812 5,982 51,869 17.3% 9.4% 15.6% 030905 Colcapirhua 40,830 4,896 1,102 5,068 51,896 0 0 0 0 0 40,830 4,896 1,102 5,068 51,896 12.8% - 12.8%
031001 Sacaba 115,922 14,979 3,017 15,645 149,563 15,770 1,876 102 2,183 19,931 131,692 16,855 3,119 17,828 169,494 13.4% 11.1% 13.2%
031002 Colomi 3,111 308 93 402 3,914 14,512 871 94 2,208 17,685 17,623 1,179 187 2,610 21,599 11.4% 6.2% 7.2%
031003 Villa Tunari 5,879 1,594 116 1,103 8,692 46,642 7,225 245 8,342 62,454 52,521 8,819 361 9,445 71,146 22.5% 13.8% 14.9%
031101 Tapacarí 0 0 0 0 0 21,131 527 43 2,894 24,595 21,131 527 43 2,894 24,595 - 2.6% 2.6%
031201 Totora 0 0 0 0 0 12,211 549 31 1,827 14,618 12,211 549 31 1,827 14,618 - 4.5% 4.5%
031202 Pojo 0 0 0 0 0 8,241 529 55 1,331 10,156 8,241 529 55 1,331 10,156 - 6.6% 6.6%
031203 Pocona 0 0 0 0 0 9,138 389 93 1,130 10,750 9,138 389 93 1,130 10,750 - 5.0% 5.0%
031204 Chimoré 4,331 1,126 41 721 6,219 11,798 1,646 75 2,159 15,678 16,129 2,772 116 2,880 21,897 21.2% 12.7% 15.2%
031205 Puerto Villarroel 8,928 2,230 126 1,747 13,031 25,763 3,526 152 3,897 33,338 34,691 5,756 278 5,644 46,369 20.9% 12.5% 14.8%
031206 Entre Ríos 9,978 1,789 105 1,864 13,736 13,403 2,194 80 1,894 17,571 23,381 3,983 185 3,758 31,307 16.0% 14.5% 15.1%
031301 Mizque 2,617 420 59 378 3,474 19,271 654 80 3,201 23,206 21,888 1,074 139 3,579 26,680 15.5% 3.7% 5.3% 031302 Vila Vila 0 0 0 0 0 4,589 78 11 781 5,459 4,589 78 11 781 5,459 - 1.9% 1.9%
031303 Alalay 0 0 0 0 0 2,877 134 13 423 3,447 2,877 134 13 423 3,447 - 4.9% 4.9%
031401 Punata 16,532 726 464 1,837 19,559 7,818 274 215 841 9,148 24,350 1,000 679 2,678 28,707 6.7% 5.9% 6.5%
031402 Villa Rivero 0 0 0 0 0 5,916 1,215 122 882 8,135 5,916 1,215 122 882 8,135 - 18.4% 18.4%
031403 San Benito 6,843 453 246 768 8,310 4,337 328 101 486 5,252 11,180 781 347 1,254 13,562 9.3% 9.0% 9.2%
031404 Tacachi 0 0 0 0 0 1,153 36 7 107 1,303 1,153 36 7 107 1,303 - 3.6% 3.6%
031405 Cuchumuela 0 0 0 0 0 2,327 85 5 285 2,702 2,327 85 5 285 2,702 - 3.7% 3.7%
031501 Bolívar 0 0 0 0 0 6,185 278 19 797 7,279 6,185 278 19 797 7,279 - 4.6% 4.6%
031601 Tiraque 2,006 62 47 283 2,398 16,249 215 104 2,147 18,715 18,255 277 151 2,430 21,113 5.2% 1.9% 2.3%
031602 Shinahota 3,941 959 68 701 5,669 11,437 1,800 57 1,878 15,172 15,378 2,759 125 2,579 20,841 20.7% 14.0% 15.8%
040101 Oruro 211,887 21,067 2,511 29,218 264,683 0 0 0 0 0 211,887 21,067 2,511 29,218 264,683 10.0% - 10.0%
040102 Caracollo 4,027 582 45 702 5,356 14,674 1,292 24 1,737 17,727 18,701 1,874 69 2,439 23,083 13.5% 8.2% 9.4% 040103 El Choro 0 0 0 0 0 7,619 204 41 859 8,723 7,619 204 41 859 8,723 - 3.1% 3.1%
040104 Paria 0 0 0 0 0 11,010 488 19 1,271 12,788 11,010 488 19 1,271 12,788 - 4.4% 4.4%
040201 Challapata 8,919 2,038 124 1,603 12,684 13,842 969 48 1,722 16,581 22,761 3,007 172 3,325 29,265 19.5% 6.8% 12.3%
040202 Quillacas 0 0 0 0 0 3,058 484 25 416 3,983 3,058 484 25 416 3,983 - 14.3% 14.3%
040301 Corque 0 0 0 0 0 7,506 760 53 902 9,221 7,506 760 53 902 9,221 - 9.8% 9.8%
040302 Choque Cota 0 0 0 0 0 1,627 60 5 158 1,850 1,627 60 5 158 1,850 - 3.8% 3.8%
040401 Curahuara de Carangas 0 0 0 0 0 3,279 486 39 379 4,183 3,279 486 39 379 4,183 - 13.8% 13.8%
040402 Turco 0 0 0 0 0 4,097 528 92 490 5,207 4,097 528 92 490 5,207 - 13.1% 13.1%
040501 Huachacalla 0 0 0 0 0 518 393 22 70 1,003 518 393 22 70 1,003 - 44.5% 44.5%
040502 Escara 0 0 0 0 0 3,441 309 15 458 4,223 3,441 309 15 458 4,223 - 8.6% 8.6%
040503 Cruz de Machacamarca 0 0 0 0 0 1,555 155 14 243 1,967 1,555 155 14 243 1,967 - 9.8% 9.8%
040504 Yunguyo de Litoral 0 0 0 0 0 428 29 2 55 514 428 29 2 55 514 - 6.8% 6.8% 040505 Esmeralda 0 0 0 0 0 2,152 135 39 376 2,702 2,152 135 39 376 2,702 - 7.5% 7.5%
040601 Poopó 2,696 410 58 454 3,618 3,172 534 17 246 3,969 5,868 944 75 700 7,587 14.8% 14.8% 14.8%
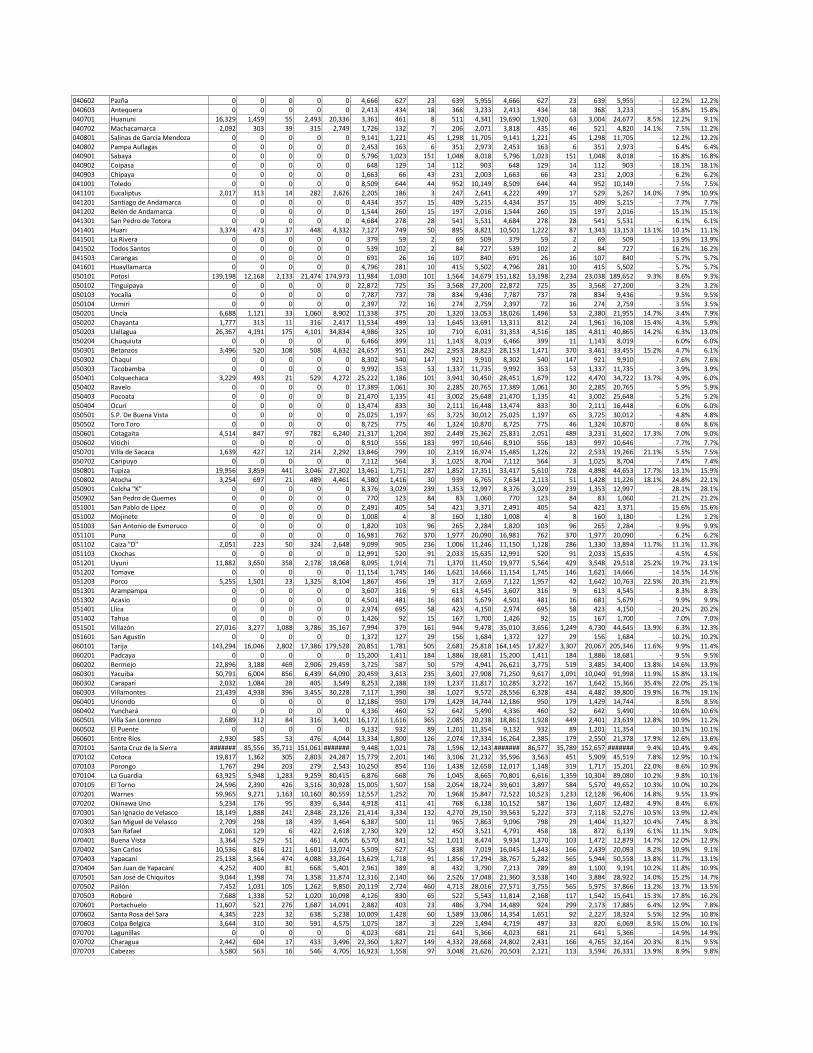
040602 Pazña 0 0 0 0 0 4,666 627 23 639 5,955 4,666 627 23 639 5,955 - 12.2% 12.2%
040603 Antequera 0 0 0 0 0 2,413 434 18 368 3,233 2,413 434 18 368 3,233 - 15.8% 15.8%
040701 Huanuni 16,329 1,459 55 2,493 20,336 3,361 461 8 511 4,341 19,690 1,920 63 3,004 24,677 8.5% 12.2% 9.1%
040702 Machacamarca 2,092 303 39 315 2,749 1,726 132 7 206 2,071 3,818 435 46 521 4,820 14.1% 7.5% 11.2%
040801 Salinas de García Mendoza 0 0 0 0 0 9,141 1,221 45 1,298 11,705 9,141 1,221 45 1,298 11,705 - 12.2% 12.2%
040802 Pampa Aullagas 0 0 0 0 0 2,453 163 6 351 2,973 2,453 163 6 351 2,973 - 6.4% 6.4% 040901 Sabaya 0 0 0 0 0 5,796 1,023 151 1,048 8,018 5,796 1,023 151 1,048 8,018 - 16.8% 16.8%
040902 Coipasa 0 0 0 0 0 648 129 14 112 903 648 129 14 112 903 - 18.1% 18.1%
040903 Chipaya 0 0 0 0 0 1,663 66 43 231 2,003 1,663 66 43 231 2,003 - 6.2% 6.2%
041001 Toledo 0 0 0 0 0 8,509 644 44 952 10,149 8,509 644 44 952 10,149 - 7.5% 7.5%
041101 Eucaliptus 2,017 313 14 282 2,626 2,205 186 3 247 2,641 4,222 499 17 529 5,267 14.0% 7.9% 10.9%
041201 Santiago de Andamarca 0 0 0 0 0 4,434 357 15 409 5,215 4,434 357 15 409 5,215 - 7.7% 7.7%
041202 Belén de Andamarca 0 0 0 0 0 1,544 260 15 197 2,016 1,544 260 15 197 2,016 - 15.1% 15.1%
041301 San Pedro de Totora 0 0 0 0 0 4,684 278 28 541 5,531 4,684 278 28 541 5,531 - 6.1% 6.1%
041401 Huari 3,374 473 37 448 4,332 7,127 749 50 895 8,821 10,501 1,222 87 1,343 13,153 13.1% 10.1% 11.1%
041501 La Rivera 0 0 0 0 0 379 59 2 69 509 379 59 2 69 509 - 13.9% 13.9%
041502 Todos Santos 0 0 0 0 0 539 102 2 84 727 539 102 2 84 727 - 16.2% 16.2%
041503 Carangas 0 0 0 0 0 691 26 16 107 840 691 26 16 107 840 - 5.7% 5.7% 041601 Huayllamarca 0 0 0 0 0 4,796 281 10 415 5,502 4,796 281 10 415 5,502 - 5.7% 5.7%
050101 Potosí 139,198 12,168 2,133 21,474 174,973 11,984 1,030 101 1,564 14,679 151,182 13,198 2,234 23,038 189,652 9.3% 8.6% 9.3%
050102 Tinguipaya 0 0 0 0 0 22,872 725 35 3,568 27,200 22,872 725 35 3,568 27,200 - 3.2% 3.2%
050103 Yocalla 0 0 0 0 0 7,787 737 78 834 9,436 7,787 737 78 834 9,436 - 9.5% 9.5%
050104 Urmiri 0 0 0 0 0 2,397 72 16 274 2,759 2,397 72 16 274 2,759 - 3.5% 3.5%
050201 Uncía 6,688 1,121 33 1,060 8,902 11,338 375 20 1,320 13,053 18,026 1,496 53 2,380 21,955 14.7% 3.4% 7.9%
050202 Chayanta 1,777 313 11 316 2,417 11,534 499 13 1,645 13,691 13,311 812 24 1,961 16,108 15.4% 4.3% 5.9%
050203 Llallagua 26,367 4,191 175 4,101 34,834 4,986 325 10 710 6,031 31,353 4,516 185 4,811 40,865 14.2% 6.3% 13.0%
050204 Chuquiuta 0 0 0 0 0 6,466 399 11 1,143 8,019 6,466 399 11 1,143 8,019 - 6.0% 6.0%
050301 Betanzos 3,496 520 108 508 4,632 24,657 951 262 2,953 28,823 28,153 1,471 370 3,461 33,455 15.2% 4.7% 6.1%
050302 Chaquí 0 0 0 0 0 8,302 540 147 921 9,910 8,302 540 147 921 9,910 - 7.6% 7.6%
050303 Tacobamba 0 0 0 0 0 9,992 353 53 1,337 11,735 9,992 353 53 1,337 11,735 - 3.9% 3.9% 050401 Colquechaca 3,229 493 21 529 4,272 25,222 1,186 101 3,941 30,450 28,451 1,679 122 4,470 34,722 13.7% 4.9% 6.0%
050402 Ravelo 0 0 0 0 0 17,389 1,061 30 2,285 20,765 17,389 1,061 30 2,285 20,765 - 5.9% 5.9%
050403 Pocoata 0 0 0 0 0 21,470 1,135 41 3,002 25,648 21,470 1,135 41 3,002 25,648 - 5.2% 5.2%
050404 Ocurí 0 0 0 0 0 13,474 833 30 2,111 16,448 13,474 833 30 2,111 16,448 - 6.0% 6.0%
050501 S.P. De Buena Vista 0 0 0 0 0 25,025 1,197 65 3,725 30,012 25,025 1,197 65 3,725 30,012 - 4.8% 4.8%
050502 Toro Toro 0 0 0 0 0 8,725 775 46 1,324 10,870 8,725 775 46 1,324 10,870 - 8.6% 8.6%
050601 Cotagaita 4,514 847 97 782 6,240 21,317 1,204 392 2,449 25,362 25,831 2,051 489 3,231 31,602 17.3% 7.0% 9.0%
050602 Vitichi 0 0 0 0 0 8,910 556 183 997 10,646 8,910 556 183 997 10,646 - 7.7% 7.7%
050701 Villa de Sacaca 1,639 427 12 214 2,292 13,846 799 10 2,319 16,974 15,485 1,226 22 2,533 19,266 21.1% 5.5% 7.5%
050702 Caripuyo 0 0 0 0 0 7,112 564 3 1,025 8,704 7,112 564 3 1,025 8,704 - 7.4% 7.4%
050801 Tupiza 19,956 3,859 441 3,046 27,302 13,461 1,751 287 1,852 17,351 33,417 5,610 728 4,898 44,653 17.7% 13.1% 15.9%
050802 Atocha 3,254 697 21 489 4,461 4,380 1,416 30 939 6,765 7,634 2,113 51 1,428 11,226 18.1% 24.8% 22.1% 050901 Colcha "K" 0 0 0 0 0 8,376 3,029 239 1,353 12,997 8,376 3,029 239 1,353 12,997 - 28.1% 28.1%
050902 San Pedro de Quemes 0 0 0 0 0 770 123 84 83 1,060 770 123 84 83 1,060 - 21.2% 21.2%
051001 San Pablo de Lipez 0 0 0 0 0 2,491 405 54 421 3,371 2,491 405 54 421 3,371 - 15.6% 15.6%
051002 Mojinete 0 0 0 0 0 1,008 4 8 160 1,180 1,008 4 8 160 1,180 - 1.2% 1.2%
051003 San Antonio de Esmoruco 0 0 0 0 0 1,820 103 96 265 2,284 1,820 103 96 265 2,284 - 9.9% 9.9%
051101 Puna 0 0 0 0 0 16,981 762 370 1,977 20,090 16,981 762 370 1,977 20,090 - 6.2% 6.2%
051102 Caiza "D" 2,051 223 50 324 2,648 9,099 905 236 1,006 11,246 11,150 1,128 286 1,330 13,894 11.7% 11.1% 11.3%
051103 Ckochas 0 0 0 0 0 12,991 520 91 2,033 15,635 12,991 520 91 2,033 15,635 - 4.5% 4.5%
051201 Uyuni 11,882 3,650 358 2,178 18,068 8,095 1,914 71 1,370 11,450 19,977 5,564 429 3,548 29,518 25.2% 19.7% 23.1%
051202 Tomave 0 0 0 0 0 11,154 1,745 146 1,621 14,666 11,154 1,745 146 1,621 14,666 - 14.5% 14.5%
051203 Porco 5,255 1,501 23 1,325 8,104 1,867 456 19 317 2,659 7,122 1,957 42 1,642 10,763 22.5% 20.3% 21.9%
051301 Arampampa 0 0 0 0 0 3,607 316 9 613 4,545 3,607 316 9 613 4,545 - 8.3% 8.3%
051302 Acasio 0 0 0 0 0 4,501 481 16 681 5,679 4,501 481 16 681 5,679 - 9.9% 9.9% 051401 Llica 0 0 0 0 0 2,974 695 58 423 4,150 2,974 695 58 423 4,150 - 20.2% 20.2%
051402 Tahua 0 0 0 0 0 1,426 92 15 167 1,700 1,426 92 15 167 1,700 - 7.0% 7.0%
051501 Villazón 27,016 3,277 1,088 3,786 35,167 7,994 379 161 944 9,478 35,010 3,656 1,249 4,730 44,645 13.9% 6.3% 12.3%
051601 San Agustín 0 0 0 0 0 1,372 127 29 156 1,684 1,372 127 29 156 1,684 - 10.2% 10.2%
060101 Tarija 143,294 16,046 2,802 17,386 179,528 20,851 1,781 505 2,681 25,818 164,145 17,827 3,307 20,067 205,346 11.6% 9.9% 11.4%
060201 Padcaya 0 0 0 0 0 15,200 1,411 184 1,886 18,681 15,200 1,411 184 1,886 18,681 - 9.5% 9.5%
060202 Bermejo 22,896 3,188 469 2,906 29,459 3,725 587 50 579 4,941 26,621 3,775 519 3,485 34,400 13.8% 14.6% 13.9%
060301 Yacuiba 50,791 6,004 856 6,439 64,090 20,459 3,613 235 3,601 27,908 71,250 9,617 1,091 10,040 91,998 11.9% 15.8% 13.1%
060302 Caraparí 2,032 1,084 28 405 3,549 8,253 2,188 139 1,237 11,817 10,285 3,272 167 1,642 15,366 35.4% 22.0% 25.1%
060303 Villamontes 21,439 4,938 396 3,455 30,228 7,117 1,390 38 1,027 9,572 28,556 6,328 434 4,482 39,800 19.9% 16.7% 19.1%
060401 Uriondo 0 0 0 0 0 12,186 950 179 1,429 14,744 12,186 950 179 1,429 14,744 - 8.5% 8.5%
060402 Yunchará 0 0 0 0 0 4,336 460 52 642 5,490 4,336 460 52 642 5,490 - 10.6% 10.6% 060501 Villa San Lorenzo 2,689 312 84 316 3,401 16,172 1,616 365 2,085 20,238 18,861 1,928 449 2,401 23,639 12.8% 10.9% 11.2%
060502 El Puente 0 0 0 0 0 9,132 932 89 1,201 11,354 9,132 932 89 1,201 11,354 - 10.1% 10.1%
060601 Entre Ríos 2,930 585 53 476 4,044 13,334 1,800 126 2,074 17,334 16,264 2,385 179 2,550 21,378 17.9% 12.6% 13.6%
070101 Santa Cruz de la Sierra ####### 85,556 35,711 151,061 ####### 9,448 1,021 78 1,596 12,143 ####### 86,577 35,789 152,657 ####### 9.4% 10.4% 9.4%
070102 Cotoca 19,817 1,362 305 2,803 24,287 15,779 2,201 146 3,106 21,232 35,596 3,563 451 5,909 45,519 7.8% 12.9% 10.1%
070103 Porongo 1,767 294 203 279 2,543 10,250 854 116 1,438 12,658 12,017 1,148 319 1,717 15,201 22.0% 8.6% 10.9%
070104 La Guardia 63,925 5,948 1,283 9,259 80,415 6,876 668 76 1,045 8,665 70,801 6,616 1,359 10,304 89,080 10.2% 9.8% 10.1%
070105 El Torno 24,596 2,390 426 3,516 30,928 15,005 1,507 158 2,054 18,724 39,601 3,897 584 5,570 49,652 10.3% 10.0% 10.2%
070201 Warnes 59,965 9,271 1,163 10,160 80,559 12,557 1,252 70 1,968 15,847 72,522 10,523 1,233 12,128 96,406 14.8% 9.5% 13.9%
070202 Okinawa Uno 5,234 176 95 839 6,344 4,918 411 41 768 6,138 10,152 587 136 1,607 12,482 4.9% 8.4% 6.6%
070301 San Ignacio de Velasco 18,149 1,888 241 2,848 23,126 21,414 3,334 132 4,270 29,150 39,563 5,222 373 7,118 52,276 10.5% 13.9% 12.4%
070302 San Miguel de Velasco 2,709 298 18 439 3,464 6,387 500 11 965 7,863 9,096 798 29 1,404 11,327 10.4% 7.4% 8.3% 070303 San Rafael 2,061 129 6 422 2,618 2,730 329 12 450 3,521 4,791 458 18 872 6,139 6.1% 11.1% 9.0%
070401 Buena Vista 3,364 529 51 461 4,405 6,570 841 52 1,011 8,474 9,934 1,370 103 1,472 12,879 14.7% 12.0% 12.9%
070402 San Carlos 10,536 816 121 1,601 13,074 5,509 627 45 838 7,019 16,045 1,443 166 2,439 20,093 8.2% 10.9% 9.1%
070403 Yapacaní 25,138 3,564 474 4,088 33,264 13,629 1,718 91 1,856 17,294 38,767 5,282 565 5,944 50,558 13.8% 11.7% 13.1%
070404 San Juan de Yapacaní 4,252 400 81 668 5,401 2,961 389 8 432 3,790 7,213 789 89 1,100 9,191 10.2% 11.8% 10.9%
070501 San José de Chiquitos 9,044 1,398 74 1,358 11,874 12,316 2,140 66 2,526 17,048 21,360 3,538 140 3,884 28,922 14.0% 15.2% 14.7%
070502 Pailón 7,452 1,031 105 1,262 9,850 20,119 2,724 460 4,713 28,016 27,571 3,755 565 5,975 37,866 13.2% 13.7% 13.5%
070503 Roboré 7,688 1,338 52 1,020 10,098 4,126 830 65 522 5,543 11,814 2,168 117 1,542 15,641 15.3% 17.8% 16.2%
070601 Portachuelo 11,607 521 276 1,687 14,091 2,882 403 23 486 3,794 14,489 924 299 2,173 17,885 6.4% 12.9% 7.8%
070602 Santa Rosa del Sara 4,345 223 32 638 5,238 10,009 1,428 60 1,589 13,086 14,354 1,651 92 2,227 18,324 5.5% 12.9% 10.8%
070603 Colpa Belgica 3,644 310 30 591 4,575 1,075 187 3 229 1,494 4,719 497 33 820 6,069 8.5% 15.0% 10.1%
070701 Lagunillas 0 0 0 0 0 4,023 681 21 641 5,366 4,023 681 21 641 5,366 - 14.9% 14.9% 070702 Charagua 2,442 604 17 433 3,496 22,360 1,827 149 4,332 28,668 24,802 2,431 166 4,765 32,164 20.3% 8.1% 9.5%
070703 Cabezas 3,580 563 16 546 4,705 16,923 1,558 97 3,048 21,626 20,503 2,121 113 3,594 26,331 13.9% 8.9% 9.8%
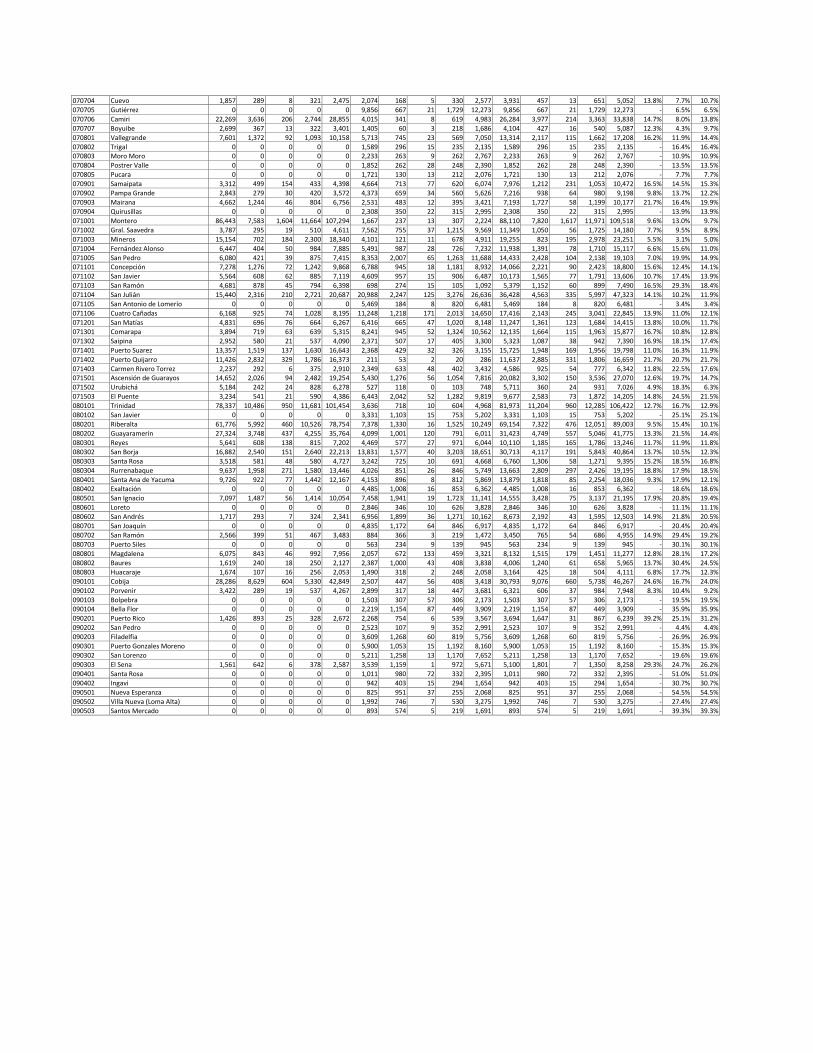
070704 Cuevo 1,857 289 8 321 2,475 2,074 168 5 330 2,577 3,931 457 13 651 5,052 13.8% 7.7% 10.7%
070705 Gutiérrez 0 0 0 0 0 9,856 667 21 1,729 12,273 9,856 667 21 1,729 12,273 - 6.5% 6.5%
070706 Camiri 22,269 3,636 206 2,744 28,855 4,015 341 8 619 4,983 26,284 3,977 214 3,363 33,838 14.7% 8.0% 13.8%
070707 Boyuibe 2,699 367 13 322 3,401 1,405 60 3 218 1,686 4,104 427 16 540 5,087 12.3% 4.3% 9.7%
070801 Vallegrande 7,601 1,372 92 1,093 10,158 5,713 745 23 569 7,050 13,314 2,117 115 1,662 17,208 16.2% 11.9% 14.4%
070802 Trigal 0 0 0 0 0 1,589 296 15 235 2,135 1,589 296 15 235 2,135 - 16.4% 16.4% 070803 Moro Moro 0 0 0 0 0 2,233 263 9 262 2,767 2,233 263 9 262 2,767 - 10.9% 10.9%
070804 Postrer Valle 0 0 0 0 0 1,852 262 28 248 2,390 1,852 262 28 248 2,390 - 13.5% 13.5%
070805 Pucara 0 0 0 0 0 1,721 130 13 212 2,076 1,721 130 13 212 2,076 - 7.7% 7.7%
070901 Samaipata 3,312 499 154 433 4,398 4,664 713 77 620 6,074 7,976 1,212 231 1,053 10,472 16.5% 14.5% 15.3%
070902 Pampa Grande 2,843 279 30 420 3,572 4,373 659 34 560 5,626 7,216 938 64 980 9,198 9.8% 13.7% 12.2%
070903 Mairana 4,662 1,244 46 804 6,756 2,531 483 12 395 3,421 7,193 1,727 58 1,199 10,177 21.7% 16.4% 19.9%
070904 Quirusillas 0 0 0 0 0 2,308 350 22 315 2,995 2,308 350 22 315 2,995 - 13.9% 13.9%
071001 Montero 86,443 7,583 1,604 11,664 107,294 1,667 237 13 307 2,224 88,110 7,820 1,617 11,971 109,518 9.6% 13.0% 9.7%
071002 Gral. Saavedra 3,787 295 19 510 4,611 7,562 755 37 1,215 9,569 11,349 1,050 56 1,725 14,180 7.7% 9.5% 8.9%
071003 Mineros 15,154 702 184 2,300 18,340 4,101 121 11 678 4,911 19,255 823 195 2,978 23,251 5.5% 3.1% 5.0%
071004 Fernández Alonso 6,447 404 50 984 7,885 5,491 987 28 726 7,232 11,938 1,391 78 1,710 15,117 6.6% 15.6% 11.0%
071005 San Pedro 6,080 421 39 875 7,415 8,353 2,007 65 1,263 11,688 14,433 2,428 104 2,138 19,103 7.0% 19.9% 14.9% 071101 Concepción 7,278 1,276 72 1,242 9,868 6,788 945 18 1,181 8,932 14,066 2,221 90 2,423 18,800 15.6% 12.4% 14.1%
071102 San Javier 5,564 608 62 885 7,119 4,609 957 15 906 6,487 10,173 1,565 77 1,791 13,606 10.7% 17.4% 13.9%
071103 San Ramón 4,681 878 45 794 6,398 698 274 15 105 1,092 5,379 1,152 60 899 7,490 16.5% 29.3% 18.4%
071104 San Julián 15,440 2,316 210 2,721 20,687 20,988 2,247 125 3,276 26,636 36,428 4,563 335 5,997 47,323 14.1% 10.2% 11.9%
071105 San Antonio de Lomerío 0 0 0 0 0 5,469 184 8 820 6,481 5,469 184 8 820 6,481 - 3.4% 3.4%
071106 Cuatro Cañadas 6,168 925 74 1,028 8,195 11,248 1,218 171 2,013 14,650 17,416 2,143 245 3,041 22,845 13.9% 11.0% 12.1%
071201 San Matías 4,831 696 76 664 6,267 6,416 665 47 1,020 8,148 11,247 1,361 123 1,684 14,415 13.8% 10.0% 11.7%
071301 Comarapa 3,894 719 63 639 5,315 8,241 945 52 1,324 10,562 12,135 1,664 115 1,963 15,877 16.7% 10.8% 12.8%
071302 Saipina 2,952 580 21 537 4,090 2,371 507 17 405 3,300 5,323 1,087 38 942 7,390 16.9% 18.1% 17.4%
071401 Puerto Suarez 13,357 1,519 137 1,630 16,643 2,368 429 32 326 3,155 15,725 1,948 169 1,956 19,798 11.0% 16.3% 11.9%
071402 Puerto Quijarro 11,426 2,832 329 1,786 16,373 211 53 2 20 286 11,637 2,885 331 1,806 16,659 21.7% 20.7% 21.7%
071403 Carmen Rivero Torrez 2,237 292 6 375 2,910 2,349 633 48 402 3,432 4,586 925 54 777 6,342 11.8% 22.5% 17.6% 071501 Ascensión de Guarayos 14,652 2,026 94 2,482 19,254 5,430 1,276 56 1,054 7,816 20,082 3,302 150 3,536 27,070 12.6% 19.7% 14.7%
071502 Urubichá 5,184 242 24 828 6,278 527 118 0 103 748 5,711 360 24 931 7,026 4.9% 18.3% 6.3%
071503 El Puente 3,234 541 21 590 4,386 6,443 2,042 52 1,282 9,819 9,677 2,583 73 1,872 14,205 14.8% 24.5% 21.5%
080101 Trinidad 78,337 10,486 950 11,681 101,454 3,636 718 10 604 4,968 81,973 11,204 960 12,285 106,422 12.7% 16.7% 12.9%
080102 San Javier 0 0 0 0 0 3,331 1,103 15 753 5,202 3,331 1,103 15 753 5,202 - 25.1% 25.1%
080201 Riberalta 61,776 5,992 460 10,526 78,754 7,378 1,330 16 1,525 10,249 69,154 7,322 476 12,051 89,003 9.5% 15.4% 10.1%
080202 Guayaramerín 27,324 3,748 437 4,255 35,764 4,099 1,001 120 791 6,011 31,423 4,749 557 5,046 41,775 13.3% 21.5% 14.4%
080301 Reyes 5,641 608 138 815 7,202 4,469 577 27 971 6,044 10,110 1,185 165 1,786 13,246 11.7% 11.9% 11.8%
080302 San Borja 16,882 2,540 151 2,640 22,213 13,831 1,577 40 3,203 18,651 30,713 4,117 191 5,843 40,864 13.7% 10.5% 12.3%
080303 Santa Rosa 3,518 581 48 580 4,727 3,242 725 10 691 4,668 6,760 1,306 58 1,271 9,395 15.2% 18.5% 16.8%
080304 Rurrenabaque 9,637 1,958 271 1,580 13,446 4,026 851 26 846 5,749 13,663 2,809 297 2,426 19,195 18.8% 17.9% 18.5%
080401 Santa Ana de Yacuma 9,726 922 77 1,442 12,167 4,153 896 8 812 5,869 13,879 1,818 85 2,254 18,036 9.3% 17.9% 12.1% 080402 Exaltación 0 0 0 0 0 4,485 1,008 16 853 6,362 4,485 1,008 16 853 6,362 - 18.6% 18.6%
080501 San Ignacio 7,097 1,487 56 1,414 10,054 7,458 1,941 19 1,723 11,141 14,555 3,428 75 3,137 21,195 17.9% 20.8% 19.4%
080601 Loreto 0 0 0 0 0 2,846 346 10 626 3,828 2,846 346 10 626 3,828 - 11.1% 11.1%
080602 San Andrés 1,717 293 7 324 2,341 6,956 1,899 36 1,271 10,162 8,673 2,192 43 1,595 12,503 14.9% 21.8% 20.5%
080701 San Joaquín 0 0 0 0 0 4,835 1,172 64 846 6,917 4,835 1,172 64 846 6,917 - 20.4% 20.4%
080702 San Ramón 2,566 399 51 467 3,483 884 366 3 219 1,472 3,450 765 54 686 4,955 14.9% 29.4% 19.2%
080703 Puerto Siles 0 0 0 0 0 563 234 9 139 945 563 234 9 139 945 - 30.1% 30.1%
080801 Magdalena 6,075 843 46 992 7,956 2,057 672 133 459 3,321 8,132 1,515 179 1,451 11,277 12.8% 28.1% 17.2%
080802 Baures 1,619 240 18 250 2,127 2,387 1,000 43 408 3,838 4,006 1,240 61 658 5,965 13.7% 30.4% 24.5%
080803 Huacaraje 1,674 107 16 256 2,053 1,490 318 2 248 2,058 3,164 425 18 504 4,111 6.8% 17.7% 12.3%
090101 Cobija 28,286 8,629 604 5,330 42,849 2,507 447 56 408 3,418 30,793 9,076 660 5,738 46,267 24.6% 16.7% 24.0%
090102 Porvenir 3,422 289 19 537 4,267 2,899 317 18 447 3,681 6,321 606 37 984 7,948 8.3% 10.4% 9.2%
090103 Bolpebra 0 0 0 0 0 1,503 307 57 306 2,173 1,503 307 57 306 2,173 - 19.5% 19.5% 090104 Bella Flor 0 0 0 0 0 2,219 1,154 87 449 3,909 2,219 1,154 87 449 3,909 - 35.9% 35.9%
090201 Puerto Rico 1,426 893 25 328 2,672 2,268 754 6 539 3,567 3,694 1,647 31 867 6,239 39.2% 25.1% 31.2%
090202 San Pedro 0 0 0 0 0 2,523 107 9 352 2,991 2,523 107 9 352 2,991 - 4.4% 4.4%
090203 Filadelfia 0 0 0 0 0 3,609 1,268 60 819 5,756 3,609 1,268 60 819 5,756 - 26.9% 26.9%
090301 Puerto Gonzales Moreno 0 0 0 0 0 5,900 1,053 15 1,192 8,160 5,900 1,053 15 1,192 8,160 - 15.3% 15.3%
090302 San Lorenzo 0 0 0 0 0 5,211 1,258 13 1,170 7,652 5,211 1,258 13 1,170 7,652 - 19.6% 19.6%
090303 El Sena 1,561 642 6 378 2,587 3,539 1,159 1 972 5,671 5,100 1,801 7 1,350 8,258 29.3% 24.7% 26.2%
090401 Santa Rosa 0 0 0 0 0 1,011 980 72 332 2,395 1,011 980 72 332 2,395 - 51.0% 51.0%
090402 Ingavi 0 0 0 0 0 942 403 15 294 1,654 942 403 15 294 1,654 - 30.7% 30.7%
090501 Nueva Esperanza 0 0 0 0 0 825 951 37 255 2,068 825 951 37 255 2,068 - 54.5% 54.5%
090502 Villa Nueva (Loma Alta) 0 0 0 0 0 1,992 746 7 530 3,275 1,992 746 7 530 3,275 - 27.4% 27.4%
090503 Santos Mercado 0 0 0 0 0 893 574 5 219 1,691 893 574 5 219 1,691 - 39.3% 39.3%
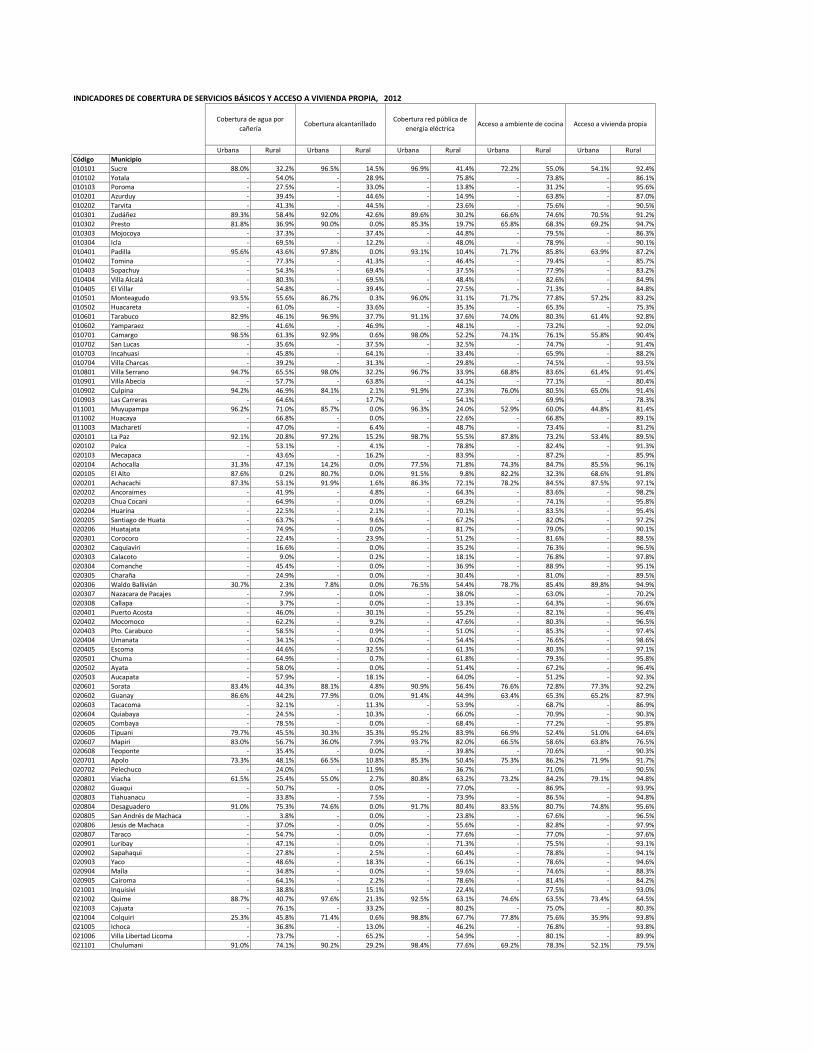
INDICADORES DE COBERTURA DE SERVICIOS BÁSICOS Y ACCESO A VIVIENDA PROPIA, 2012
Cobertura de agua por
cañería
Cobertura alcantarillado
Cobertura red pública de
energía eléctrica
Acceso a ambiente de cocina
Acceso a vivienda propia
Urbana Rural Urbana Rural Urbana Rural Urbana Rural Urbana Rural
Código Municipio 010101 Sucre 88.0% 32.2% 96.5% 14.5% 96.9% 41.4% 72.2% 55.0% 54.1% 92.4%
010102 Yotala - 54.0% - 28.9% - 75.8% - 73.8% - 86.1% 010103 Poroma - 27.5% - 33.0% - 13.8% - 31.2% - 95.6%
010201 Azurduy - 39.4% - 44.6% - 14.9% - 63.8% - 87.0%
010202 Tarvita - 41.3% - 44.5% - 23.6% - 75.6% - 90.5%
010301 Zudáñez 89.3% 58.4% 92.0% 42.6% 89.6% 30.2% 66.6% 74.6% 70.5% 91.2%
010302 Presto 81.8% 36.9% 90.0% 0.0% 85.3% 19.7% 65.8% 68.3% 69.2% 94.7%
010303 Mojocoya - 37.3% - 37.4% - 44.8% - 79.5% - 86.3%
010304 Icla - 69.5% - 12.2% - 48.0% - 78.9% - 90.1%
010401 Padilla 95.6% 43.6% 97.8% 0.0% 93.1% 10.4% 71.7% 85.8% 63.9% 87.2%
010402 Tomina - 77.3% - 41.3% - 46.4% - 79.4% - 85.7%
010403 Sopachuy - 54.3% - 69.4% - 37.5% - 77.9% - 83.2%
010404 Villa Alcalá - 80.3% - 69.5% - 48.4% - 82.6% - 84.9%
010405 El Villar - 54.8% - 39.4% - 27.5% - 71.3% - 84.8% 010501 Monteagudo 93.5% 55.6% 86.7% 0.3% 96.0% 31.1% 71.7% 77.8% 57.2% 83.2%
010502 Huacareta - 61.0% - 33.6% - 35.3% - 65.3% - 75.3%
010601 Tarabuco 82.9% 46.1% 96.9% 37.7% 91.1% 37.6% 74.0% 80.3% 61.4% 92.8%
010602 Yamparaez - 41.6% - 46.9% - 48.1% - 73.2% - 92.0%
010701 Camargo 98.5% 61.3% 92.9% 0.6% 98.0% 52.2% 74.1% 76.1% 55.8% 90.4%
010702 San Lucas - 35.6% - 37.5% - 32.5% - 74.7% - 91.4%
010703 Incahuasi - 45.8% - 64.1% - 33.4% - 65.9% - 88.2%
010704 Villa Charcas - 39.2% - 31.3% - 29.8% - 74.5% - 93.5%
010801 Villa Serrano 94.7% 65.5% 98.0% 32.2% 96.7% 33.9% 68.8% 83.6% 61.4% 91.4%
010901 Villa Abecia - 57.7% - 63.8% - 44.1% - 77.1% - 80.4%
010902 Culpina 94.2% 46.9% 84.1% 2.1% 91.9% 27.3% 76.0% 80.5% 65.0% 91.4%
010903 Las Carreras - 64.6% - 17.7% - 54.1% - 69.9% - 78.3%
011001 Muyupampa 96.2% 71.0% 85.7% 0.0% 96.3% 24.0% 52.9% 60.0% 44.8% 81.4% 011002 Huacaya - 66.8% - 0.0% - 22.6% - 66.8% - 89.1%
011003 Macharetí - 47.0% - 6.4% - 48.7% - 73.4% - 81.2%
020101 La Paz 92.1% 20.8% 97.2% 15.2% 98.7% 55.5% 87.8% 73.2% 53.4% 89.5%
020102 Palca - 53.1% - 4.1% - 78.8% - 82.4% - 91.3%
020103 Mecapaca - 43.6% - 16.2% - 83.9% - 87.2% - 85.9%
020104 Achocalla 31.3% 47.1% 14.2% 0.0% 77.5% 71.8% 74.3% 84.7% 85.5% 96.1%
020105 El Alto 87.6% 0.2% 80.7% 0.0% 91.5% 9.8% 82.2% 32.3% 68.6% 91.8%
020201 Achacachi 87.3% 53.1% 91.9% 1.6% 86.3% 72.1% 78.2% 84.5% 87.5% 97.1%
020202 Ancoraimes - 41.9% - 4.8% - 64.3% - 83.6% - 98.2%
020203 Chua Cocani - 64.9% - 0.0% - 69.2% - 74.1% - 95.8%
020204 Huarina - 22.5% - 2.1% - 70.1% - 83.5% - 95.4%
020205 Santiago de Huata - 63.7% - 9.6% - 67.2% - 82.0% - 97.2% 020206 Huatajata - 74.9% - 0.0% - 81.7% - 79.0% - 90.1%
020301 Corocoro - 22.4% - 23.9% - 51.2% - 81.6% - 88.5%
020302 Caquiaviri - 16.6% - 0.0% - 35.2% - 76.3% - 96.5%
020303 Calacoto - 9.0% - 0.2% - 18.1% - 76.8% - 97.8%
020304 Comanche - 45.4% - 0.0% - 36.9% - 88.9% - 95.1%
020305 Charaña - 24.9% - 0.0% - 30.4% - 81.0% - 89.5%
020306 Waldo Ballivián 30.7% 2.3% 7.8% 0.0% 76.5% 54.4% 78.7% 85.4% 89.8% 94.9%
020307 Nazacara de Pacajes - 7.9% - 0.0% - 38.0% - 63.0% - 70.2%
020308 Callapa - 3.7% - 0.0% - 13.3% - 64.3% - 96.6%
020401 Puerto Acosta - 46.0% - 30.1% - 55.2% - 82.1% - 96.4%
020402 Mocomoco - 62.2% - 9.2% - 47.6% - 80.3% - 96.5%
020403 Pto. Carabuco - 58.5% - 0.9% - 51.0% - 85.3% - 97.4% 020404 Umanata - 34.1% - 0.0% - 54.4% - 76.6% - 98.6%
020405 Escoma - 44.6% - 32.5% - 61.3% - 80.3% - 97.1%
020501 Chuma - 64.9% - 0.7% - 61.8% - 79.3% - 95.8%
020502 Ayata - 58.0% - 0.0% - 51.4% - 67.2% - 96.4%
020503 Aucapata - 57.9% - 18.1% - 64.0% - 51.2% - 92.3%
020601 Sorata 83.4% 44.3% 88.1% 4.8% 90.9% 56.4% 76.6% 72.8% 77.3% 92.2%
020602 Guanay 86.6% 44.2% 77.9% 0.0% 91.4% 44.9% 63.4% 65.3% 65.2% 87.9%
020603 Tacacoma - 32.1% - 11.3% - 53.9% - 68.7% - 86.9%
020604 Quiabaya - 24.5% - 10.3% - 66.0% - 70.9% - 90.3%
020605 Combaya - 78.5% - 0.0% - 68.4% - 77.2% - 95.8%
020606 Tipuani 79.7% 45.5% 30.3% 35.3% 95.2% 83.9% 66.9% 52.4% 51.0% 64.6%
020607 Mapiri 83.0% 56.7% 36.0% 7.9% 93.7% 82.0% 66.5% 58.6% 63.8% 76.5% 020608 Teoponte - 35.4% - 0.0% - 39.8% - 70.6% - 90.3%
020701 Apolo 73.3% 48.1% 66.5% 10.8% 85.3% 50.4% 75.3% 86.2% 71.9% 91.7%
020702 Pelechuco - 24.0% - 11.9% - 36.7% - 71.0% - 90.5%
020801 Viacha 61.5% 25.4% 55.0% 2.7% 80.8% 63.2% 73.2% 84.2% 79.1% 94.8%
020802 Guaqui - 50.7% - 0.0% - 77.0% - 86.9% - 93.9%
020803 Tiahuanacu - 33.8% - 7.5% - 73.9% - 86.5% - 94.8%
020804 Desaguadero 91.0% 75.3% 74.6% 0.0% 91.7% 80.4% 83.5% 80.7% 74.8% 95.6%
020805 San Andrés de Machaca - 3.8% - 0.0% - 23.8% - 67.6% - 96.5%
020806 Jesús de Machaca - 37.0% - 0.0% - 55.6% - 82.8% - 97.9%
020807 Taraco - 54.7% - 0.0% - 77.6% - 77.0% - 97.6%
020901 Luribay - 47.1% - 0.0% - 71.3% - 75.5% - 93.1%
020902 Sapahaqui - 27.8% - 2.5% - 60.4% - 78.8% - 94.1% 020903 Yaco - 48.6% - 18.3% - 66.1% - 78.6% - 94.6%
020904 Malla - 34.8% - 0.0% - 59.6% - 74.6% - 88.3%
020905 Cairoma - 64.1% - 2.2% - 78.6% - 81.4% - 84.2%
021001 Inquisivi - 38.8% - 15.1% - 22.4% - 77.5% - 93.0%
021002 Quime 88.7% 40.7% 97.6% 21.3% 92.5% 63.1% 74.6% 63.5% 73.4% 64.5%
021003 Cajuata - 76.1% - 33.2% - 80.2% - 75.0% - 80.3%
021004 Colquiri 25.3% 45.8% 71.4% 0.6% 98.8% 67.7% 77.8% 75.6% 35.9% 93.8%
021005 Ichoca - 36.8% - 13.0% - 46.2% - 76.8% - 93.8%
021006 Villa Libertad Licoma - 73.7% - 65.2% - 54.9% - 80.1% - 89.9%
021101 Chulumani 91.0% 74.1% 90.2% 29.2% 98.4% 77.6% 69.2% 78.3% 52.1% 79.5%
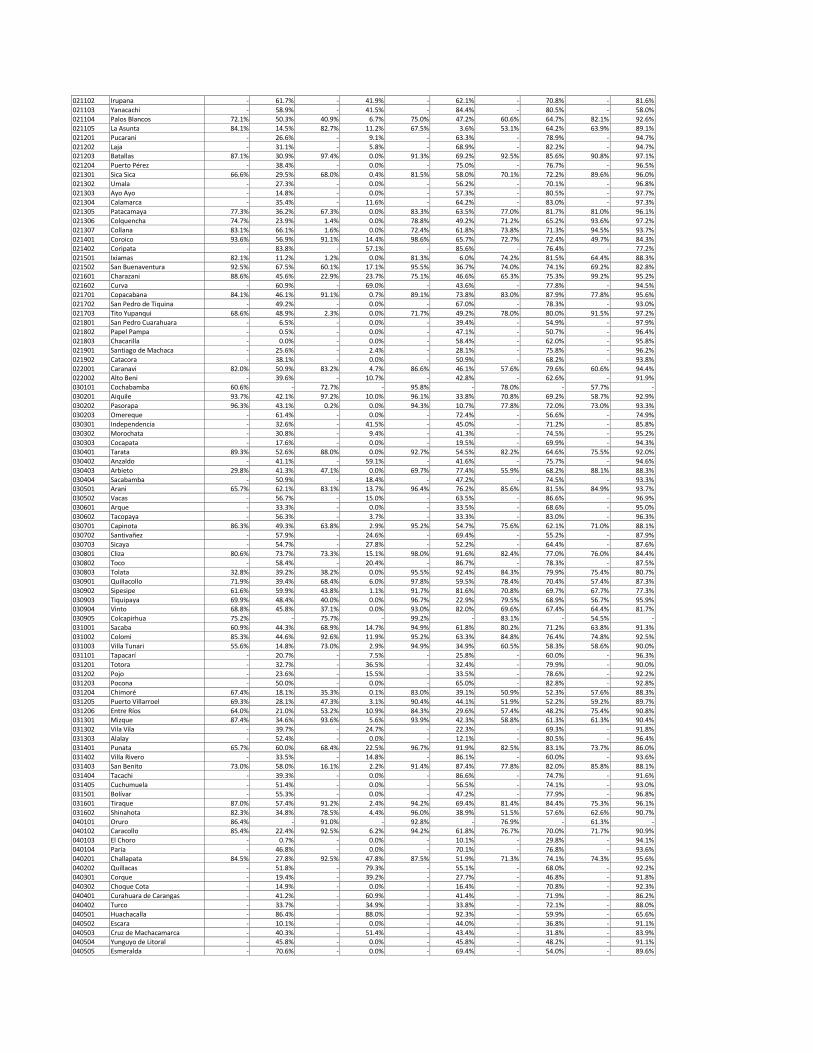
021102 Irupana - 61.7% - 41.9% - 62.1% - 70.8% - 81.6%
021103 Yanacachi - 58.9% - 41.5% - 84.4% - 80.5% - 58.0%
021104 Palos Blancos 72.1% 50.3% 40.9% 6.7% 75.0% 47.2% 60.6% 64.7% 82.1% 92.6%
021105 La Asunta 84.1% 14.5% 82.7% 11.2% 67.5% 3.6% 53.1% 64.2% 63.9% 89.1%
021201 Pucarani - 26.6% - 9.1% - 63.3% - 78.9% - 94.7%
021202 Laja - 31.1% - 5.8% - 68.9% - 82.2% - 94.7% 021203 Batallas 87.1% 30.9% 97.4% 0.0% 91.3% 69.2% 92.5% 85.6% 90.8% 97.1%
021204 Puerto Pérez - 38.4% - 0.0% - 75.0% - 76.7% - 96.5%
021301 Sica Sica 66.6% 29.5% 68.0% 0.4% 81.5% 58.0% 70.1% 72.2% 89.6% 96.0%
021302 Umala - 27.3% - 0.0% - 56.2% - 70.1% - 96.8%
021303 Ayo Ayo - 14.8% - 0.0% - 57.3% - 80.5% - 97.7%
021304 Calamarca - 35.4% - 11.6% - 64.2% - 83.0% - 97.3%
021305 Patacamaya 77.3% 36.2% 67.3% 0.0% 83.3% 63.5% 77.0% 81.7% 81.0% 96.1%
021306 Colquencha 74.7% 23.9% 1.4% 0.0% 78.8% 49.2% 71.2% 65.2% 93.6% 97.2%
021307 Collana 83.1% 66.1% 1.6% 0.0% 72.4% 61.8% 73.8% 71.3% 94.5% 93.7%
021401 Coroico 93.6% 56.9% 91.1% 14.4% 98.6% 65.7% 72.7% 72.4% 49.7% 84.3%
021402 Coripata - 83.8% - 57.1% - 85.6% - 76.4% - 77.2%
021501 Ixiamas 82.1% 11.2% 1.2% 0.0% 81.3% 6.0% 74.2% 81.5% 64.4% 88.3% 021502 San Buenaventura 92.5% 67.5% 60.1% 17.1% 95.5% 36.7% 74.0% 74.1% 69.2% 82.8%
021601 Charazani 88.6% 45.6% 22.9% 23.7% 75.1% 46.6% 65.3% 75.3% 99.2% 95.2%
021602 Curva - 60.9% - 69.0% - 43.6% - 77.8% - 94.5%
021701 Copacabana 84.1% 46.1% 91.1% 0.7% 89.1% 73.8% 83.0% 87.9% 77.8% 95.6%
021702 San Pedro de Tiquina - 49.2% - 0.0% - 67.0% - 78.3% - 93.0%
021703 Tito Yupanqui 68.6% 48.9% 2.3% 0.0% 71.7% 49.2% 78.0% 80.0% 91.5% 97.2%
021801 San Pedro Cuarahuara - 6.5% - 0.0% - 39.4% - 54.9% - 97.9%
021802 Papel Pampa - 0.5% - 0.0% - 47.1% - 50.7% - 96.4%
021803 Chacarilla - 0.0% - 0.0% - 58.4% - 62.0% - 95.8%
021901 Santiago de Machaca - 25.6% - 2.4% - 28.1% - 75.8% - 96.2%
021902 Catacora - 38.1% - 0.0% - 50.9% - 68.2% - 93.8%
022001 Caranavi 82.0% 50.9% 83.2% 4.7% 86.6% 46.1% 57.6% 79.6% 60.6% 94.4% 022002 Alto Beni - 39.6% - 10.7% - 42.8% - 62.6% - 91.9%
030101 Cochabamba 60.6% - 72.7% - 95.8% - 78.0% - 57.7% -
030201 Aiquile 93.7% 42.1% 97.2% 10.0% 96.1% 33.8% 70.8% 69.2% 58.7% 92.9%
030202 Pasorapa 96.3% 43.1% 0.2% 0.0% 94.3% 10.7% 77.8% 72.0% 73.0% 93.3%
030203 Omereque - 61.4% - 0.0% - 72.4% - 56.6% - 74.9%
030301 Independencia - 32.6% - 41.5% - 45.0% - 71.2% - 85.8%
030302 Morochata - 30.8% - 9.4% - 41.3% - 74.5% - 95.2%
030303 Cocapata - 17.6% - 0.0% - 19.5% - 69.9% - 94.3%
030401 Tarata 89.3% 52.6% 88.0% 0.0% 92.7% 54.5% 82.2% 64.6% 75.5% 92.0%
030402 Anzaldo - 41.1% - 59.1% - 41.6% - 75.7% - 94.6%
030403 Arbieto 29.8% 41.3% 47.1% 0.0% 69.7% 77.4% 55.9% 68.2% 88.1% 88.3%
030404 Sacabamba - 50.9% - 18.4% - 47.2% - 74.5% - 93.3% 030501 Arani 65.7% 62.1% 83.1% 13.7% 96.4% 76.2% 85.6% 81.5% 84.9% 93.7%
030502 Vacas - 56.7% - 15.0% - 63.5% - 86.6% - 96.9%
030601 Arque - 33.3% - 0.0% - 33.5% - 68.6% - 95.0%
030602 Tacopaya - 56.3% - 3.7% - 33.3% - 83.0% - 96.3%
030701 Capinota 86.3% 49.3% 63.8% 2.9% 95.2% 54.7% 75.6% 62.1% 71.0% 88.1%
030702 Santivañez - 57.9% - 24.6% - 69.4% - 55.2% - 87.9%
030703 Sicaya - 54.7% - 27.8% - 52.2% - 64.4% - 87.6%
030801 Cliza 80.6% 73.7% 73.3% 15.1% 98.0% 91.6% 82.4% 77.0% 76.0% 84.4%
030802 Toco - 58.4% - 20.4% - 86.7% - 78.3% - 87.5%
030803 Tolata 32.8% 39.2% 38.2% 0.0% 95.5% 92.4% 84.3% 79.9% 75.4% 80.7%
030901 Quillacollo 71.9% 39.4% 68.4% 6.0% 97.8% 59.5% 78.4% 70.4% 57.4% 87.3%
030902 Sipesipe 61.6% 59.9% 43.8% 1.1% 91.7% 81.6% 70.8% 69.7% 67.7% 77.3%
030903 Tiquipaya 69.9% 48.4% 40.0% 0.0% 96.7% 22.9% 79.5% 68.9% 56.7% 95.9% 030904 Vinto 68.8% 45.8% 37.1% 0.0% 93.0% 82.0% 69.6% 67.4% 64.4% 81.7%
030905 Colcapirhua 75.2% - 75.7% - 99.2% - 83.1% - 54.5% -
031001 Sacaba 60.9% 44.3% 68.9% 14.7% 94.9% 61.8% 80.2% 71.2% 63.8% 91.3%
031002 Colomi 85.3% 44.6% 92.6% 11.9% 95.2% 63.3% 84.8% 76.4% 74.8% 92.5%
031003 Villa Tunari 55.6% 14.8% 73.0% 2.9% 94.9% 34.9% 60.5% 58.3% 58.6% 90.0%
031101 Tapacarí - 20.7% - 7.5% - 25.8% - 60.0% - 96.3%
031201 Totora - 32.7% - 36.5% - 32.4% - 79.9% - 90.0%
031202 Pojo - 23.6% - 15.5% - 33.5% - 78.6% - 92.2%
031203 Pocona - 50.0% - 0.0% - 65.0% - 82.8% - 92.8%
031204 Chimoré 67.4% 18.1% 35.3% 0.1% 83.0% 39.1% 50.9% 52.3% 57.6% 88.3%
031205 Puerto Villarroel 69.3% 28.1% 47.3% 3.1% 90.4% 44.1% 51.9% 52.2% 59.2% 89.7%
031206 Entre Ríos 64.0% 21.0% 53.2% 10.9% 84.3% 29.6% 57.4% 48.2% 75.4% 90.8% 031301 Mizque 87.4% 34.6% 93.6% 5.6% 93.9% 42.3% 58.8% 61.3% 61.3% 90.4%
031302 Vila Vila - 39.7% - 24.7% - 22.3% - 69.3% - 91.8%
031303 Alalay - 52.4% - 0.0% - 12.1% - 80.5% - 96.4%
031401 Punata 65.7% 60.0% 68.4% 22.5% 96.7% 91.9% 82.5% 83.1% 73.7% 86.0%
031402 Villa Rivero - 33.5% - 14.8% - 86.1% - 60.0% - 93.6%
031403 San Benito 73.0% 58.0% 16.1% 2.2% 91.4% 87.4% 77.8% 82.0% 85.8% 88.1%
031404 Tacachi - 39.3% - 0.0% - 86.6% - 74.7% - 91.6%
031405 Cuchumuela - 51.4% - 0.0% - 56.5% - 74.1% - 93.0%
031501 Bolívar - 55.3% - 0.0% - 47.2% - 77.9% - 96.8%
031601 Tiraque 87.0% 57.4% 91.2% 2.4% 94.2% 69.4% 81.4% 84.4% 75.3% 96.1%
031602 Shinahota 82.3% 34.8% 78.5% 4.4% 96.0% 38.9% 51.5% 57.6% 62.6% 90.7%
040101 Oruro 86.4% - 91.0% - 92.8% - 76.9% - 61.3% - 040102 Caracollo 85.4% 22.4% 92.5% 6.2% 94.2% 61.8% 76.7% 70.0% 71.7% 90.9%
040103 El Choro - 0.7% - 0.0% - 10.1% - 29.8% - 94.1%
040104 Paria - 46.8% - 0.0% - 70.1% - 76.8% - 93.6%
040201 Challapata 84.5% 27.8% 92.5% 47.8% 87.5% 51.9% 71.3% 74.1% 74.3% 95.6%
040202 Quillacas - 51.8% - 79.3% - 55.1% - 68.0% - 92.2%
040301 Corque - 19.4% - 39.2% - 27.7% - 46.8% - 91.8%
040302 Choque Cota - 14.9% - 0.0% - 16.4% - 70.8% - 92.3%
040401 Curahuara de Carangas - 41.2% - 60.9% - 41.4% - 71.9% - 86.2%
040402 Turco - 33.7% - 34.9% - 33.8% - 72.1% - 88.0%
040501 Huachacalla - 86.4% - 88.0% - 92.3% - 59.9% - 65.6%
040502 Escara - 10.1% - 0.0% - 44.0% - 36.8% - 91.1%
040503 Cruz de Machacamarca - 40.3% - 51.4% - 43.4% - 31.8% - 83.9% 040504 Yunguyo de Litoral - 45.8% - 0.0% - 45.8% - 48.2% - 91.1%
040505 Esmeralda - 70.6% - 0.0% - 69.4% - 54.0% - 89.6%
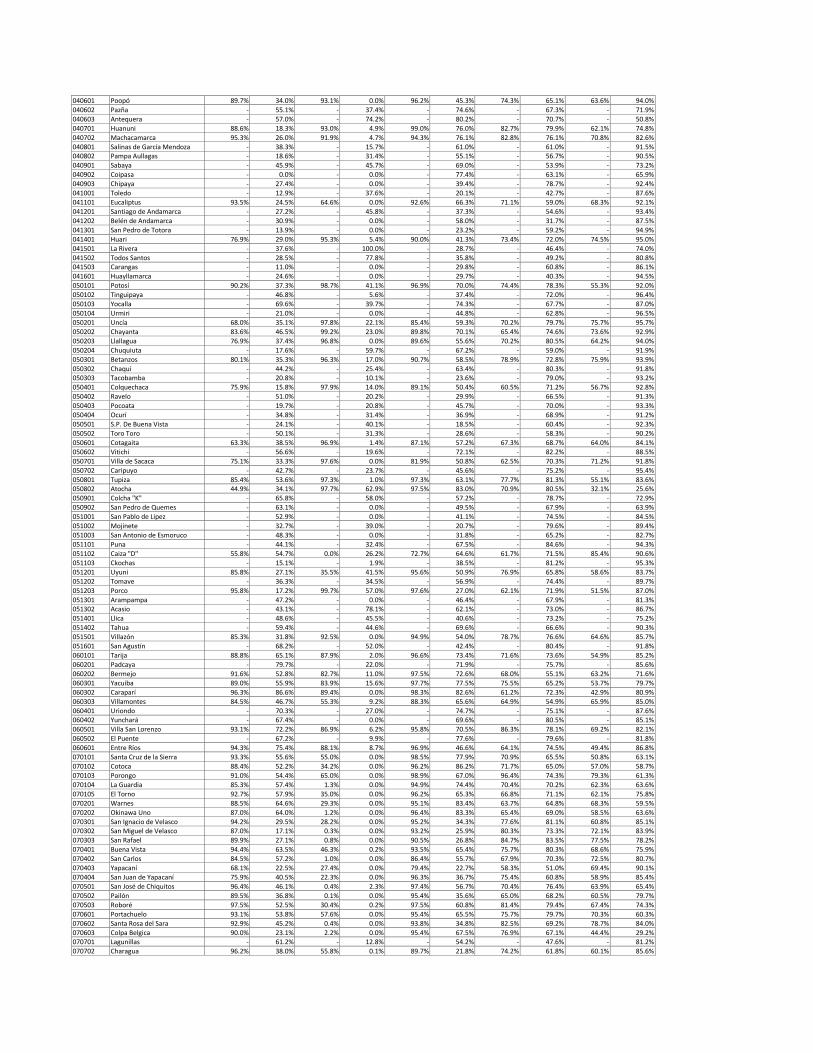
040601 Poopó 89.7% 34.0% 93.1% 0.0% 96.2% 45.3% 74.3% 65.1% 63.6% 94.0%
040602 Pazña - 55.1% - 37.4% - 74.6% - 67.3% - 71.9%
040603 Antequera - 57.0% - 74.2% - 80.2% - 70.7% - 50.8%
040701 Huanuni 88.6% 18.3% 93.0% 4.9% 99.0% 76.0% 82.7% 79.9% 62.1% 74.8%
040702 Machacamarca 95.3% 26.0% 91.9% 4.7% 94.3% 76.1% 82.8% 76.1% 70.8% 82.6%
040801 Salinas de García Mendoza - 38.3% - 15.7% - 61.0% - 61.0% - 91.5% 040802 Pampa Aullagas - 18.6% - 31.4% - 55.1% - 56.7% - 90.5%
040901 Sabaya - 45.9% - 45.7% - 69.0% - 53.9% - 73.2%
040902 Coipasa - 0.0% - 0.0% - 77.4% - 63.1% - 65.9%
040903 Chipaya - 27.4% - 0.0% - 39.4% - 78.7% - 92.4%
041001 Toledo - 12.9% - 37.6% - 20.1% - 42.7% - 87.6%
041101 Eucaliptus 93.5% 24.5% 64.6% 0.0% 92.6% 66.3% 71.1% 59.0% 68.3% 92.1%
041201 Santiago de Andamarca - 27.2% - 45.8% - 37.3% - 54.6% - 93.4%
041202 Belén de Andamarca - 30.9% - 0.0% - 58.0% - 31.7% - 87.5%
041301 San Pedro de Totora - 13.9% - 0.0% - 23.2% - 59.2% - 94.9%
041401 Huari 76.9% 29.0% 95.3% 5.4% 90.0% 41.3% 73.4% 72.0% 74.5% 95.0%
041501 La Rivera - 37.6% - 100.0% - 28.7% - 46.4% - 74.0%
041502 Todos Santos - 28.5% - 77.8% - 35.8% - 49.2% - 80.8% 041503 Carangas - 11.0% - 0.0% - 29.8% - 60.8% - 86.1%
041601 Huayllamarca - 24.6% - 0.0% - 29.7% - 40.3% - 94.5%
050101 Potosí 90.2% 37.3% 98.7% 41.1% 96.9% 70.0% 74.4% 78.3% 55.3% 92.0%
050102 Tinguipaya - 46.8% - 5.6% - 37.4% - 72.0% - 96.4%
050103 Yocalla - 69.6% - 39.7% - 74.3% - 67.7% - 87.0%
050104 Urmiri - 21.0% - 0.0% - 44.8% - 62.8% - 96.5%
050201 Uncía 68.0% 35.1% 97.8% 22.1% 85.4% 59.3% 70.2% 79.7% 75.7% 95.7%
050202 Chayanta 83.6% 46.5% 99.2% 23.0% 89.8% 70.1% 65.4% 74.6% 73.6% 92.9%
050203 Llallagua 76.9% 37.4% 96.8% 0.0% 89.6% 55.6% 70.2% 80.5% 64.2% 94.0%
050204 Chuquiuta - 17.6% - 59.7% - 67.2% - 59.0% - 91.9%
050301 Betanzos 80.1% 35.3% 96.3% 17.0% 90.7% 58.5% 78.9% 72.8% 75.9% 93.9%
050302 Chaquí - 44.2% - 25.4% - 63.4% - 80.3% - 91.8% 050303 Tacobamba - 20.8% - 10.1% - 23.6% - 79.0% - 93.2%
050401 Colquechaca 75.9% 15.8% 97.9% 14.0% 89.1% 50.4% 60.5% 71.2% 56.7% 92.8%
050402 Ravelo - 51.0% - 20.2% - 29.9% - 66.5% - 91.3%
050403 Pocoata - 19.7% - 20.8% - 45.7% - 70.0% - 93.3%
050404 Ocurí - 34.8% - 31.4% - 36.9% - 68.9% - 91.2%
050501 S.P. De Buena Vista - 24.1% - 40.1% - 18.5% - 60.4% - 92.3%
050502 Toro Toro - 50.1% - 31.3% - 28.6% - 58.3% - 90.2%
050601 Cotagaita 63.3% 38.5% 96.9% 1.4% 87.1% 57.2% 67.3% 68.7% 64.0% 84.1%
050602 Vitichi - 56.6% - 19.6% - 72.1% - 82.2% - 88.5%
050701 Villa de Sacaca 75.1% 33.3% 97.6% 0.0% 81.9% 50.8% 62.5% 70.3% 71.2% 91.8%
050702 Caripuyo - 42.7% - 23.7% - 45.6% - 75.2% - 95.4%
050801 Tupiza 85.4% 53.6% 97.3% 1.0% 97.3% 63.1% 77.7% 81.3% 55.1% 83.6% 050802 Atocha 44.9% 34.1% 97.7% 62.9% 97.5% 83.0% 70.9% 80.5% 32.1% 25.6%
050901 Colcha "K" - 65.8% - 58.0% - 57.2% - 78.7% - 72.9%
050902 San Pedro de Quemes - 63.1% - 0.0% - 49.5% - 67.9% - 63.9%
051001 San Pablo de Lipez - 52.9% - 0.0% - 41.1% - 74.5% - 84.5%
051002 Mojinete - 32.7% - 39.0% - 20.7% - 79.6% - 89.4%
051003 San Antonio de Esmoruco - 48.3% - 0.0% - 31.8% - 65.2% - 82.7%
051101 Puna - 44.1% - 32.4% - 67.5% - 84.6% - 94.3%
051102 Caiza "D" 55.8% 54.7% 0.0% 26.2% 72.7% 64.6% 61.7% 71.5% 85.4% 90.6%
051103 Ckochas - 15.1% - 1.9% - 38.5% - 81.2% - 95.3%
051201 Uyuni 85.8% 27.1% 35.5% 41.5% 95.6% 50.9% 76.9% 65.8% 58.6% 83.7%
051202 Tomave - 36.3% - 34.5% - 56.9% - 74.4% - 89.7%
051203 Porco 95.8% 17.2% 99.7% 57.0% 97.6% 27.0% 62.1% 71.9% 51.5% 87.0%
051301 Arampampa - 47.2% - 0.0% - 46.4% - 67.9% - 81.3% 051302 Acasio - 43.1% - 78.1% - 62.1% - 73.0% - 86.7%
051401 Llica - 48.6% - 45.5% - 40.6% - 73.2% - 75.2%
051402 Tahua - 59.4% - 44.6% - 69.6% - 66.6% - 90.3%
051501 Villazón 85.3% 31.8% 92.5% 0.0% 94.9% 54.0% 78.7% 76.6% 64.6% 85.7%
051601 San Agustín - 68.2% - 52.0% - 42.4% - 80.4% - 91.8%
060101 Tarija 88.8% 65.1% 87.9% 2.0% 96.6% 73.4% 71.6% 73.6% 54.9% 85.2%
060201 Padcaya - 79.7% - 22.0% - 71.9% - 75.7% - 85.6%
060202 Bermejo 91.6% 52.8% 82.7% 11.0% 97.5% 72.6% 68.0% 55.1% 63.2% 71.6%
060301 Yacuiba 89.0% 55.9% 83.9% 15.6% 97.7% 77.5% 75.5% 65.2% 53.7% 79.7%
060302 Caraparí 96.3% 86.6% 89.4% 0.0% 98.3% 82.6% 61.2% 72.3% 42.9% 80.9%
060303 Villamontes 84.5% 46.7% 55.3% 9.2% 88.3% 65.6% 64.9% 54.9% 65.9% 85.0%
060401 Uriondo - 70.3% - 27.0% - 74.7% - 75.1% - 87.6% 060402 Yunchará - 67.4% - 0.0% - 69.6% - 80.5% - 85.1%
060501 Villa San Lorenzo 93.1% 72.2% 86.9% 6.2% 95.8% 70.5% 86.3% 78.1% 69.2% 82.1%
060502 El Puente - 67.2% - 9.9% - 77.6% - 79.6% - 81.8%
060601 Entre Ríos 94.3% 75.4% 88.1% 8.7% 96.9% 46.6% 64.1% 74.5% 49.4% 86.8%
070101 Santa Cruz de la Sierra 93.3% 55.6% 55.0% 0.0% 98.5% 77.9% 70.9% 65.5% 50.8% 63.1%
070102 Cotoca 88.4% 52.2% 34.2% 0.0% 96.2% 86.2% 71.7% 65.0% 57.0% 58.7%
070103 Porongo 91.0% 54.4% 65.0% 0.0% 98.9% 67.0% 96.4% 74.3% 79.3% 61.3%
070104 La Guardia 85.3% 57.4% 1.3% 0.0% 94.9% 74.4% 70.4% 70.2% 62.3% 63.6%
070105 El Torno 92.7% 57.9% 35.0% 0.0% 96.2% 65.3% 66.8% 71.1% 62.1% 75.8%
070201 Warnes 88.5% 64.6% 29.3% 0.0% 95.1% 83.4% 63.7% 64.8% 68.3% 59.5%
070202 Okinawa Uno 87.0% 64.0% 1.2% 0.0% 96.4% 83.3% 65.4% 69.0% 58.5% 63.6%
070301 San Ignacio de Velasco 94.2% 29.5% 28.2% 0.0% 95.2% 34.3% 77.6% 81.1% 60.8% 85.1% 070302 San Miguel de Velasco 87.0% 17.1% 0.3% 0.0% 93.2% 25.9% 80.3% 73.3% 72.1% 83.9%
070303 San Rafael 89.9% 27.1% 0.8% 0.0% 90.5% 26.8% 84.7% 83.5% 77.5% 78.2%
070401 Buena Vista 94.4% 63.5% 46.3% 0.2% 93.5% 65.4% 75.7% 80.3% 68.6% 75.9%
070402 San Carlos 84.5% 57.2% 1.0% 0.0% 86.4% 55.7% 67.9% 70.3% 72.5% 80.7%
070403 Yapacaní 68.1% 22.5% 27.4% 0.0% 79.4% 22.7% 58.3% 51.0% 69.4% 90.1%
070404 San Juan de Yapacaní 75.9% 40.5% 22.3% 0.0% 96.3% 36.7% 75.4% 60.8% 58.9% 85.4%
070501 San José de Chiquitos 96.4% 46.1% 0.4% 2.3% 97.4% 56.7% 70.4% 76.4% 63.9% 65.4%
070502 Pailón 89.5% 36.8% 0.1% 0.0% 95.4% 35.6% 65.0% 68.2% 60.5% 79.7%
070503 Roboré 97.5% 52.5% 30.4% 0.2% 97.5% 60.8% 81.4% 79.4% 67.4% 74.3%
070601 Portachuelo 93.1% 53.8% 57.6% 0.0% 95.4% 65.5% 75.7% 79.7% 70.3% 60.3%
070602 Santa Rosa del Sara 92.9% 45.2% 0.4% 0.0% 93.8% 34.8% 82.5% 69.2% 78.7% 84.0%
070603 Colpa Belgica 90.0% 23.1% 2.2% 0.0% 95.4% 67.5% 76.9% 67.1% 44.4% 29.2% 070701 Lagunillas - 61.2% - 12.8% - 54.2% - 47.6% - 81.2%
070702 Charagua 96.2% 38.0% 55.8% 0.1% 89.7% 21.8% 74.2% 61.8% 60.1% 85.6%
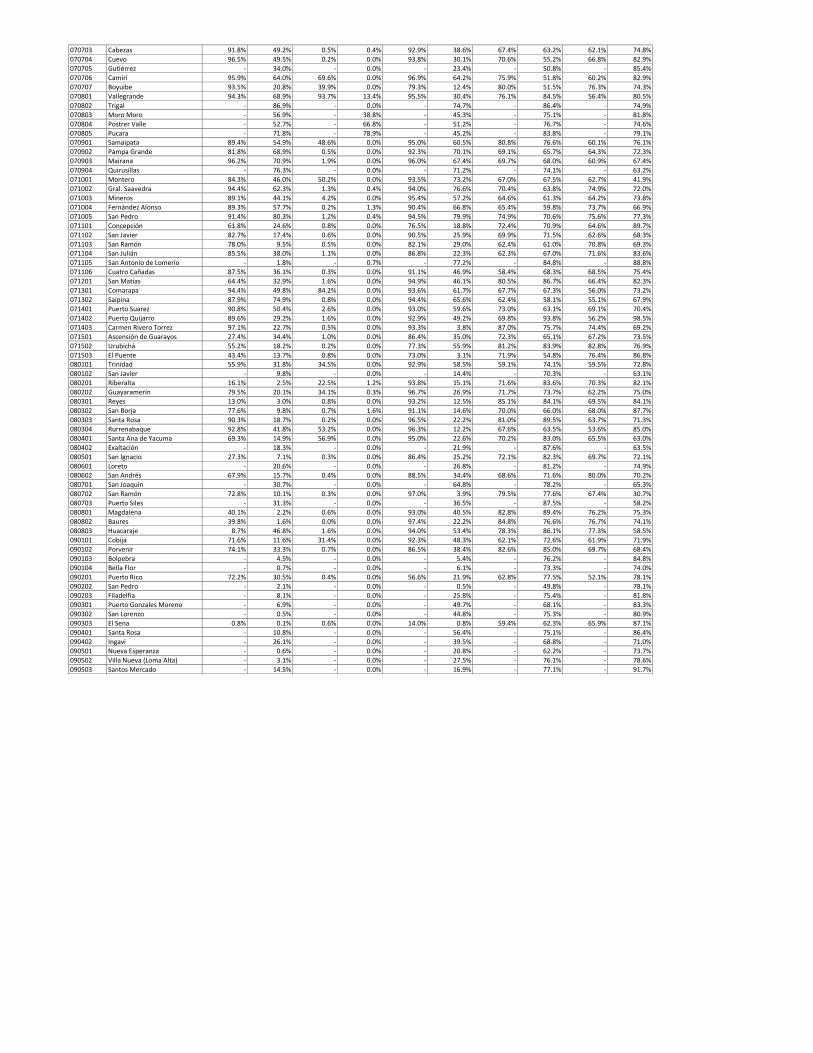
070703 Cabezas 91.8% 49.2% 0.5% 0.4% 92.9% 38.6% 67.4% 63.2% 62.1% 74.8%
070704 Cuevo 96.5% 49.5% 0.2% 0.0% 93.8% 30.1% 70.6% 55.2% 66.8% 82.9%
070705 Gutiérrez - 34.0% - 0.0% - 23.4% - 50.8% - 85.4%
070706 Camiri 95.9% 64.0% 69.6% 0.0% 96.9% 64.2% 75.9% 51.8% 60.2% 82.9%
070707 Boyuibe 93.5% 20.8% 39.9% 0.0% 79.3% 12.4% 80.0% 51.5% 76.3% 74.3%
070801 Vallegrande 94.3% 68.9% 93.7% 13.4% 95.5% 30.4% 76.1% 84.5% 56.4% 80.5%
070802 Trigal - 86.9% - 0.0% - 74.7% - 86.4% - 74.9%
070803 Moro Moro - 56.9% - 38.8% - 45.3% - 75.1% - 81.8%
070804 Postrer Valle - 52.7% - 66.8% - 51.2% - 76.7% - 74.6%
070805 Pucara - 71.8% - 78.9% - 45.2% - 83.8% - 79.1% 070901 Samaipata 89.4% 54.9% 48.6% 0.0% 95.0% 60.5% 80.8% 76.6% 60.1% 76.1%
070902 Pampa Grande 81.8% 68.9% 0.5% 0.0% 92.3% 70.1% 69.1% 65.7% 64.3% 72.3%
070903 Mairana 96.2% 70.9% 1.9% 0.0% 96.0% 67.4% 69.7% 68.0% 60.9% 67.4%
070904 Quirusillas - 76.3% - 0.0% - 71.2% - 74.1% - 63.2%
071001 Montero 84.3% 46.0% 50.2% 0.0% 93.5% 73.2% 67.0% 67.5% 62.7% 41.9%
071002 Gral. Saavedra 94.4% 62.3% 1.3% 0.4% 94.0% 76.6% 70.4% 63.8% 74.9% 72.0%
071003 Mineros 89.1% 44.1% 4.2% 0.0% 95.4% 57.2% 64.6% 61.3% 64.2% 73.8%
071004 Fernández Alonso 89.3% 57.7% 0.2% 1.3% 90.4% 66.8% 65.4% 59.8% 73.7% 66.9%
071005 San Pedro 91.4% 80.3% 1.2% 0.4% 94.5% 79.9% 74.9% 70.6% 75.6% 77.3%
071101 Concepción 61.8% 24.6% 0.8% 0.0% 76.5% 18.8% 72.4% 70.9% 64.6% 89.7%
071102 San Javier 82.7% 17.4% 0.6% 0.0% 90.5% 25.9% 69.9% 71.5% 62.6% 68.3%
071103 San Ramón 78.0% 9.5% 0.5% 0.0% 82.1% 29.0% 62.4% 61.0% 70.8% 69.3% 071104 San Julián 85.5% 38.0% 1.1% 0.0% 86.8% 22.3% 62.3% 67.0% 71.6% 83.6%
071105 San Antonio de Lomerío - 1.8% - 0.7% - 77.2% - 84.8% - 88.8%
071106 Cuatro Cañadas 87.5% 36.1% 0.3% 0.0% 91.1% 46.9% 58.4% 68.3% 68.5% 75.4%
071201 San Matías 64.4% 32.9% 1.6% 0.0% 94.9% 46.1% 80.5% 86.7% 66.4% 82.3%
071301 Comarapa 94.4% 49.8% 84.2% 0.0% 93.6% 61.7% 67.7% 67.3% 56.0% 73.2%
071302 Saipina 87.9% 74.9% 0.8% 0.0% 94.4% 65.6% 62.4% 58.1% 55.1% 67.9%
071401 Puerto Suarez 90.8% 50.4% 2.6% 0.0% 93.0% 59.6% 73.0% 63.1% 69.1% 70.4%
071402 Puerto Quijarro 89.6% 29.2% 1.6% 0.0% 92.9% 49.2% 69.8% 93.8% 56.2% 98.5%
071403 Carmen Rivero Torrez 97.1% 22.7% 0.5% 0.0% 93.3% 3.8% 87.0% 75.7% 74.4% 69.2%
071501 Ascensión de Guarayos 27.4% 34.4% 1.0% 0.0% 86.4% 35.0% 72.3% 65.1% 67.2% 73.5%
071502 Urubichá 55.2% 18.2% 0.2% 0.0% 77.3% 55.9% 81.2% 83.9% 82.8% 76.9%
071503 El Puente 43.4% 13.7% 0.8% 0.0% 73.0% 3.1% 71.9% 54.8% 76.4% 86.8% 080101 Trinidad 55.9% 31.8% 34.5% 0.0% 92.9% 58.5% 59.1% 74.1% 59.5% 72.8%
080102 San Javier - 9.8% - 0.0% - 14.4% - 70.3% - 63.1%
080201 Riberalta 16.1% 2.5% 22.5% 1.2% 93.8% 15.1% 71.6% 83.6% 70.3% 82.1%
080202 Guayaramerín 79.5% 20.1% 34.1% 0.3% 96.7% 26.9% 71.7% 73.7% 62.2% 75.0%
080301 Reyes 13.0% 3.0% 0.8% 0.0% 93.2% 12.5% 85.1% 84.1% 69.5% 84.1%
080302 San Borja 77.6% 9.8% 0.7% 1.6% 91.1% 14.6% 70.0% 66.0% 68.0% 87.7%
080303 Santa Rosa 90.3% 18.7% 0.2% 0.0% 96.5% 22.2% 81.0% 89.5% 63.7% 71.3%
080304 Rurrenabaque 92.8% 41.8% 53.2% 0.0% 96.3% 12.2% 67.6% 63.5% 53.6% 85.0%
080401 Santa Ana de Yacuma 69.3% 14.9% 56.9% 0.0% 95.0% 22.6% 70.2% 83.0% 65.5% 63.0%
080402 Exaltación - 18.3% - 0.0% - 21.9% - 87.6% - 63.5%
080501 San Ignacio 27.3% 7.1% 0.3% 0.0% 86.4% 25.2% 72.1% 82.3% 69.7% 72.1%
080601 Loreto - 20.6% - 0.0% - 26.8% - 81.2% - 74.9% 080602 San Andrés 67.9% 15.7% 0.4% 0.0% 88.5% 34.4% 68.6% 71.6% 80.0% 70.2%
080701 San Joaquín - 30.7% - 0.0% - 64.8% - 78.2% - 65.3%
080702 San Ramón 72.8% 10.1% 0.3% 0.0% 97.0% 3.9% 79.5% 77.6% 67.4% 30.7%
080703 Puerto Siles - 31.3% - 0.0% - 36.5% - 87.5% - 58.2%
080801 Magdalena 40.1% 2.2% 0.6% 0.0% 93.0% 40.5% 82.8% 89.4% 76.2% 75.3%
080802 Baures 39.8% 1.6% 0.0% 0.0% 97.4% 22.2% 84.8% 76.6% 76.7% 74.1%
080803 Huacaraje 8.7% 46.8% 1.6% 0.0% 94.0% 53.4% 78.3% 86.1% 77.3% 58.5%
090101 Cobija 71.6% 11.6% 31.4% 0.0% 92.3% 48.3% 62.1% 72.6% 61.9% 71.9%
090102 Porvenir 74.1% 33.3% 0.7% 0.0% 86.5% 38.4% 82.6% 85.0% 69.7% 68.4%
090103 Bolpebra - 4.5% - 0.0% - 5.4% - 76.2% - 84.8%
090104 Bella Flor - 0.7% - 0.0% - 6.1% - 73.3% - 74.0%
090201 Puerto Rico 72.2% 30.5% 0.4% 0.0% 56.6% 21.9% 62.8% 77.5% 52.1% 78.1%
090202 San Pedro - 2.1% - 0.0% - 0.5% - 49.8% - 78.1% 090203 Filadelfia - 8.1% - 0.0% - 25.8% - 75.4% - 81.8%
090301 Puerto Gonzales Moreno - 6.9% - 0.0% - 49.7% - 68.1% - 83.3%
090302 San Lorenzo - 0.5% - 0.0% - 44.8% - 75.3% - 80.9%
090303 El Sena 0.8% 0.1% 0.6% 0.0% 14.0% 0.8% 59.4% 62.3% 65.9% 87.1%
090401 Santa Rosa - 10.8% - 0.0% - 56.4% - 75.1% - 86.4%
090402 Ingavi - 26.1% - 0.0% - 39.5% - 68.8% - 71.0%
090501 Nueva Esperanza - 0.6% - 0.0% - 20.8% - 62.2% - 73.7%
090502 Villa Nueva (Loma Alta) - 3.1% - 0.0% - 27.5% - 76.1% - 78.6%
090503 Santos Mercado - 14.5% - 0.0% - 16.9% - 77.1% - 91.7%
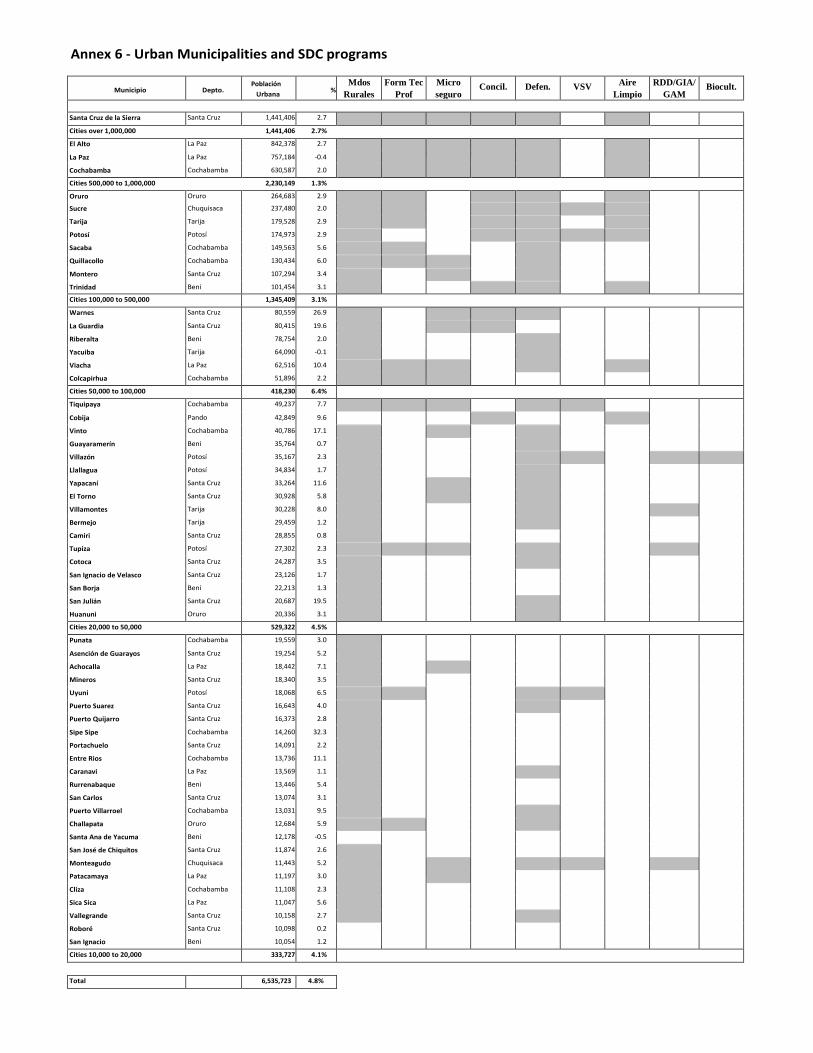
Annex 6 - Urban Municipalities and SDC programs
Municipio
Depto. Población
Urbana
% Mdos
Rurales
Form Tec
Prof
Micro
seguro Concil. Defen. VSV
Aire
Limpio
RDD/GIA/
GAM Biocult.
Santa Cruz de la Sierra Santa Cruz 1,441,406 2.7 Cities over 1,000,000 1,441,406 2.7% El Alto La Paz 842,378 2.7 La Paz La Paz 757,184 -0.4
Cochabamba Cochabamba 630,587 2.0
Cities 500,000 to 1,000,000 2,230,149 1.3% Oruro Oruro 264,683 2.9 Sucre Chuquisaca 237,480 2.0 Tarija Tarija 179,528 2.9 Potosí Potosí 174,973 2.9 Sacaba Cochabamba 149,563 5.6 Quillacollo Cochabamba 130,434 6.0 Montero Santa Cruz 107,294 3.4 Trinidad Beni 101,454 3.1 Cities 100,000 to 500,000 1,345,409 3.1% Warnes Santa Cruz 80,559 26.9 La Guardia Santa Cruz 80,415 19.6 Riberalta Beni 78,754 2.0 Yacuiba Tarija 64,090 -0.1
Viacha La Paz 62,516 10.4 Colcapirhua Cochabamba 51,896 2.2 Cities 50,000 to 100,000 418,230 6.4% Tiquipaya Cochabamba 49,237 7.7 Cobija Pando 42,849 9.6 Vinto Cochabamba 40,786 17.1 Guayaramerín Beni 35,764 0.7 Villazón Potosí 35,167 2.3 Llallagua Potosí 34,834 1.7 Yapacaní Santa Cruz 33,264 11.6 El Torno Santa Cruz 30,928 5.8
Villamontes Tarija 30,228 8.0 Bermejo Tarija 29,459 1.2 Camiri Santa Cruz 28,855 0.8 Tupiza Potosí 27,302 2.3 Cotoca Santa Cruz 24,287 3.5 San Ignacio de Velasco Santa Cruz 23,126 1.7 San Borja Beni 22,213 1.3
San Julián Santa Cruz 20,687 19.5 Huanuni Oruro 20,336 3.1
Cities 20,000 to 50,000 529,322 4.5% Punata Cochabamba 19,559 3.0 Asención de Guarayos Santa Cruz 19,254 5.2
Achocalla La Paz 18,442 7.1 Mineros Santa Cruz 18,340 3.5 Uyuni Potosí 18,068 6.5 Puerto Suarez Santa Cruz 16,643 4.0 Puerto Quijarro Santa Cruz 16,373 2.8 Sipe Sipe Cochabamba 14,260 32.3
Portachuelo Santa Cruz 14,091 2.2
Entre Rios Cochabamba 13,736 11.1
Caranavi La Paz 13,569 1.1 Rurrenabaque Beni 13,446 5.4 San Carlos Santa Cruz 13,074 3.1
Puerto Villarroel Cochabamba 13,031 9.5 Challapata Oruro 12,684 5.9 Santa Ana de Yacuma Beni 12,178 -0.5 San José de Chiquitos Santa Cruz 11,874 2.6 Monteagudo Chuquisaca 11,443 5.2 Patacamaya La Paz 11,197 3.0 Cliza Cochabamba 11,108 2.3 Sica Sica La Paz 11,047 5.6
Vallegrande Santa Cruz 10,158 2.7 Roboré Santa Cruz 10,098 0.2 San Ignacio Beni 10,054 1.2
Cities 10,000 to 20,000 333,727 4.1% Total 6,535,723 4.8%
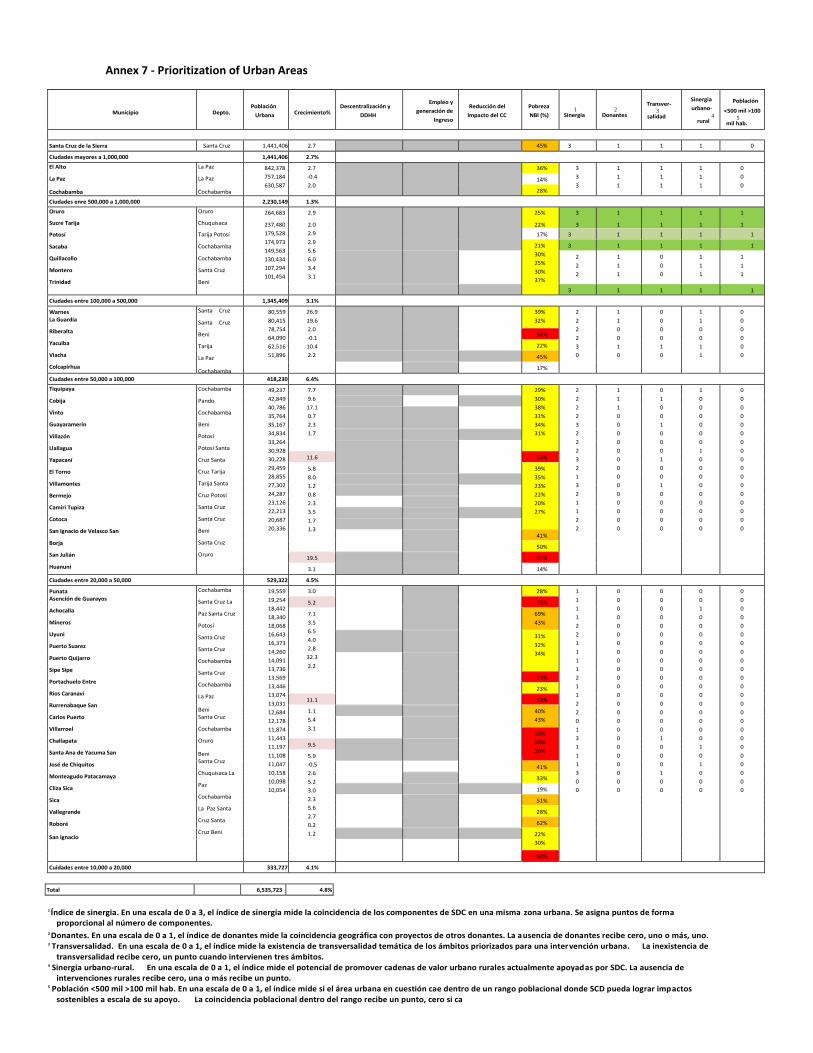
Annex 7 - Prioritization of Urban Areas
Municipio
Depto.
Población
Urbana
Crecimiento%
Descentralización y
DDHH
Empleo y
generación de
Ingreso
Reducción del
Impacto del CC
Pobreza
NBI (%)
1
Sinergia
2
Donantes
Transver-
3 salidad
Sinergia
urbano- 4
rural
Población
<500 mil >100 5
mil hab.
Santa Cruz de la Sierra Santa Cruz 1,441,406 2.7 45% 3 1 1 1 0
Ciudades mayores a 1,000,000 1,441,406 2.7% El Alto
La Paz
Cochabamba
La Paz
La Paz
Cochabamba
842,378
757,184
630,587
2.7
-0.4
2.0
36% 3
3
3
1
1
1
1
1
1
1
1
1
0
0
0 14%
28%
Ciudades enre 500,000 a 1,000,000 2,230,149 1.3% Oruro
Sucre Tarija
Potosí
Sacaba
Quillacollo
Montero
Trinidad
Oruro
Chuquisaca
Tarija Potosí
Cochabamba
Cochabamba
Santa Cruz
Beni
264,683
237,480
179,528
174,973
149,563
130,434
107,294
101,454
2.9
2.0
2.9
2.9
5.6
6.0
3.4
3.1
25%
22%
3
3
1
1
1
1
1
1
1
1
17% 3 1 1 1 1
21%
30%
25%
30%
37%
3 1 1 1 1
2
2
2
1
1
1
0
0
0
1
1
1
1
1
1
3 1 1 1 1
Ciudades entre 100,000 a 500,000 1,345,409 3.1% Warnes La Guardia
Riberalta
Yacuiba
Viacha
Colcapirhua
Santa Cruz
Santa Cruz
Beni
Tarija
La Paz
Cochabamba
80,559
80,415
78,754
64,090
62,516
51,896
26.9
19.6
2.0
-0.1
10.4
2.2
39%
32%
2
2
2
2
3
0
1
1
0
0
1
0
0
0
0
0
1
0
1
1
0
0
1
1
0
0
0
0
0
0
54%
22%
45%
17%
Ciudades entre 50,000 a 100,000 418,230 6.4% Tiquipaya
Cobija
Vinto
Guayaramerín
Villazón
Llallagua
Yapacaní
El Torno
Villamontes
Bermejo
Camiri Tupiza
Cotoca
San Ignacio de Velasco San
Borja
San Julián
Huanuni
Cochabamba
Pando
Cochabamba
Beni
Potosí
Potosí Santa
Cruz Santa
Cruz Tarija
Tarija Santa
Cruz Potosí
Santa Cruz
Santa Cruz
Beni
Santa Cruz
Oruro
49,237
42,849
40,786
35,764
35,167
34,834
33,264
30,928
30,228
29,459
28,855
27,302
24,287
23,126
22,213
20,687
20,336
7.7
9.6
17.1
0.7
2.3
1.7
29%
30%
38%
31%
34%
31%
2
2
2
2
3
2
2
2
3
2
1
3
2
1
1
2
2
1
1
1
0
0
0
0
0
0
0
0
0
0
0
0
0
0
0
1
0
0
1
0
0
0
1
0
0
1
0
0
0
0
0
1
0
0
0
0
0
0
1
0
0
0
0
0
0
0
0
0
0
0
0
0
0
0
0
0
0
0
0
0
0
0
0
0
0
11.6 56%
5.8
8.0
1.2
0.8
2.3
3.5
1.7
1.3
39%
35%
23%
22%
20%
27%
41%
50%
19.5 62%
3.1 14%
Ciudades entre 20,000 a 50,000 529,322 4.5% Punata Asención de Guarayos
Achocalla
Mineros
Uyuni
Puerto Suarez
Puerto Quijarro
Sipe Sipe
Portachuelo Entre
Rios Caranavi
Rurrenabaque San
Carlos Puerto
Villarroel
Challapata
Santa Ana de Yacuma San
José de Chiquitos
Monteagudo Patacamaya
Cliza Sica
Sica
Vallegrande
Roboré
San Ignacio
Cochabamba
Santa Cruz La
Paz Santa Cruz
Potosí
Santa Cruz
Santa Cruz
Cochabamba
Santa Cruz
Cochabamba
La Paz
Beni Santa Cruz
Cochabamba
Oruro
Beni Santa Cruz
Chuquisaca La
Paz
Cochabamba
La Paz Santa
Cruz Santa
Cruz Beni
19,559
19,254
18,442
18,340
18,068
16,643
16,373
14,260
14,091
13,736
13,569
13,446
13,074
13,031
12,684
12,178
11,874
11,443
11,197
11,108
11,047
10,158
10,098
10,054
3.0 28% 1
1
1
1
2
2
1
1
1
1
2
1
1
2
2
0
1
3
1
1
1
3
0
0
0
0
0
0
0
0
0
0
0
0
0
0
0
0
0
0
0
0
0
0
0
0
0
0
0
0
0
0
0
0
0
0
0
0
0
0
0
0
0
0
0
1
0
0
0
1
0
0
0
0
1
0
0
0
0
0
0
0
0
0
0
0
0
0
0
0
1
0
1
0
0
0
0
0
0
0
0
0
0
0
0
0
0
0
0
0
0
0
0
0
0
0
0
0
0
0
5.2 73%
7.1
3.5
6.5
4.0
2.8
32.3
2.2
69%
43%
31%
32%
34%
53%
23%
11.1 53%
1.1
5.4
3.1
40%
43%
50%
50%
50% 9.5 5.9
-0.5
2.6
5.2
3.0
2.3
5.6
2.7
0.2
1.2
41%
33%
19%
51%
28%
62%
22%
30%
60%
Cuidades entre 10,000 a 20,000 333,727 4.1%
Total 6,535,723 4.8%
1 Índice de sinergia. En una escala de 0 a 3, el índice de sinergia mide la coincidencia de los componentes de SDC en una misma zona urbana. Se asigna puntos de forma proporcional al número de componentes.
2 Donantes. En una escala de 0 a 1, el índice de donantes mide la coincidencia geográfica con proyectos de otros donantes. La ausencia de donantes recibe cero, uno o más, uno. 3 Transversalidad. En una escala de 0 a 1, el índice mide la existencia de transversalidad temática de los ámbitos priorizados para una intervención urbana. La inexistencia de
transversalidad recibe cero, un punto cuando intervienen tres ámbitos. 4 Sinergia urbano-rural. En una escala de 0 a 1, el índice mide el potencial de promover cadenas de valor urbano rurales actualmente apoyadas por SDC. La ausencia de
intervenciones rurales recibe cero, una o más recibe un punto. 5 Población <500 mil >100 mil hab. En una escala de 0 a 1, el índice mide si el área urbana en cuestión cae dentro de un rango poblacional donde SCD pueda lograr impactos
sostenibles a escala de su apoyo. La coincidencia poblacional dentro del rango recibe un punto, cero si ca

Annex 8 – Map of Bolivia showing principal urban areas

Annex 9 – Presentation for discussion: Bolivia Country Study on Urban Development Opportunities
Bolivia Country Study on
Urban Development
Opportunities

Presentation for internal discussion
March 31, 2017
Contents
✓ Introduction
✓ Urban development in Bolivia
✓ Stocktaking of activities in urban development
✓ Other donors
✓ Actors
✓ SDC Bolivia
✓ Recommendations
✓ Q&A
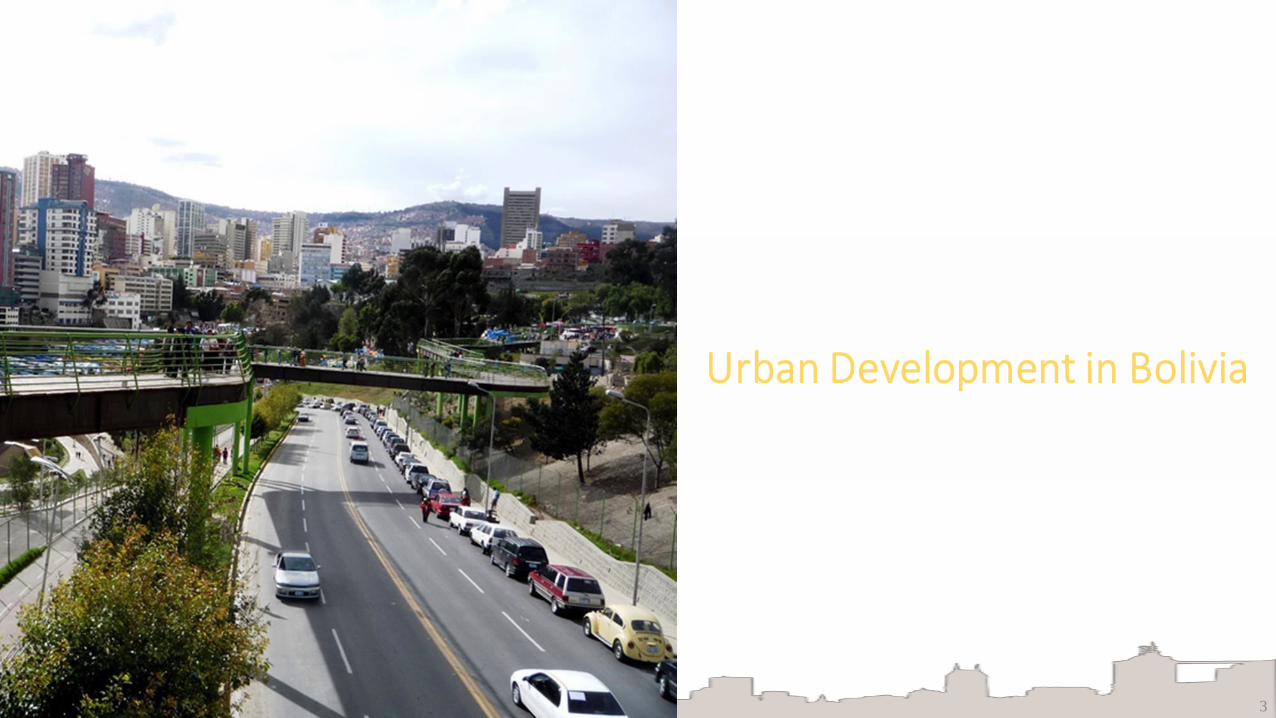
3
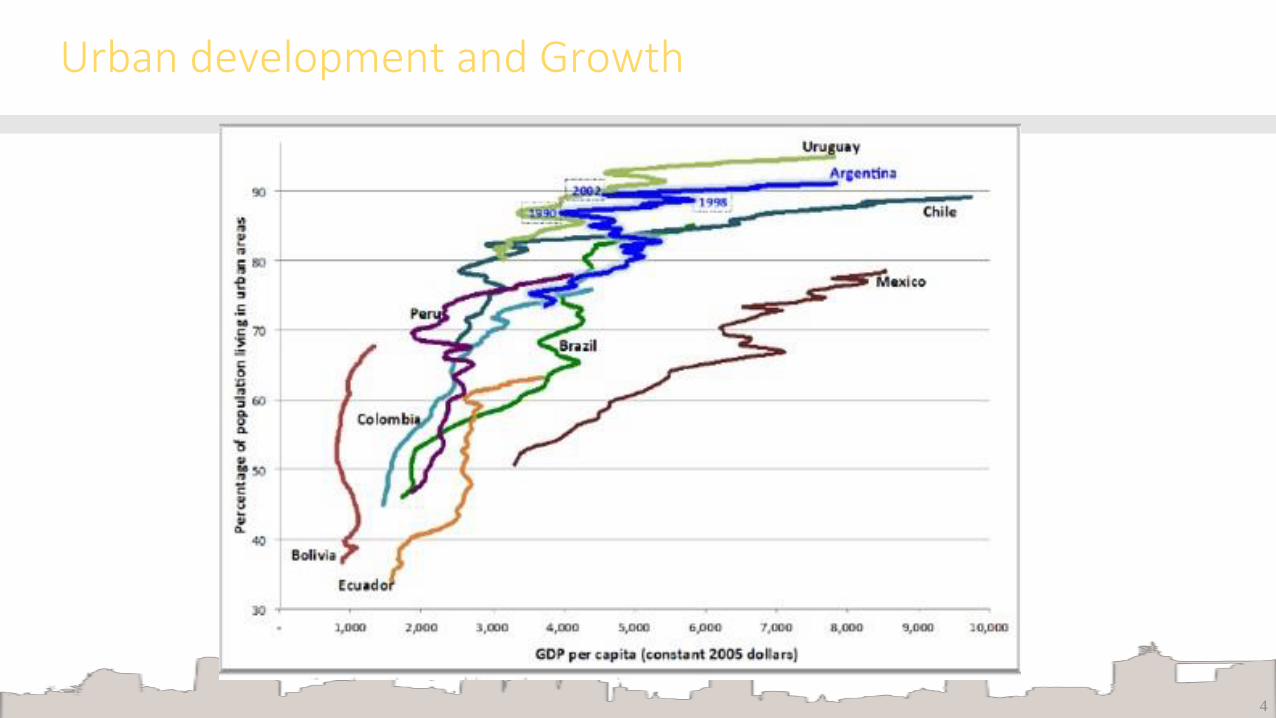
Urban development and Growth
4
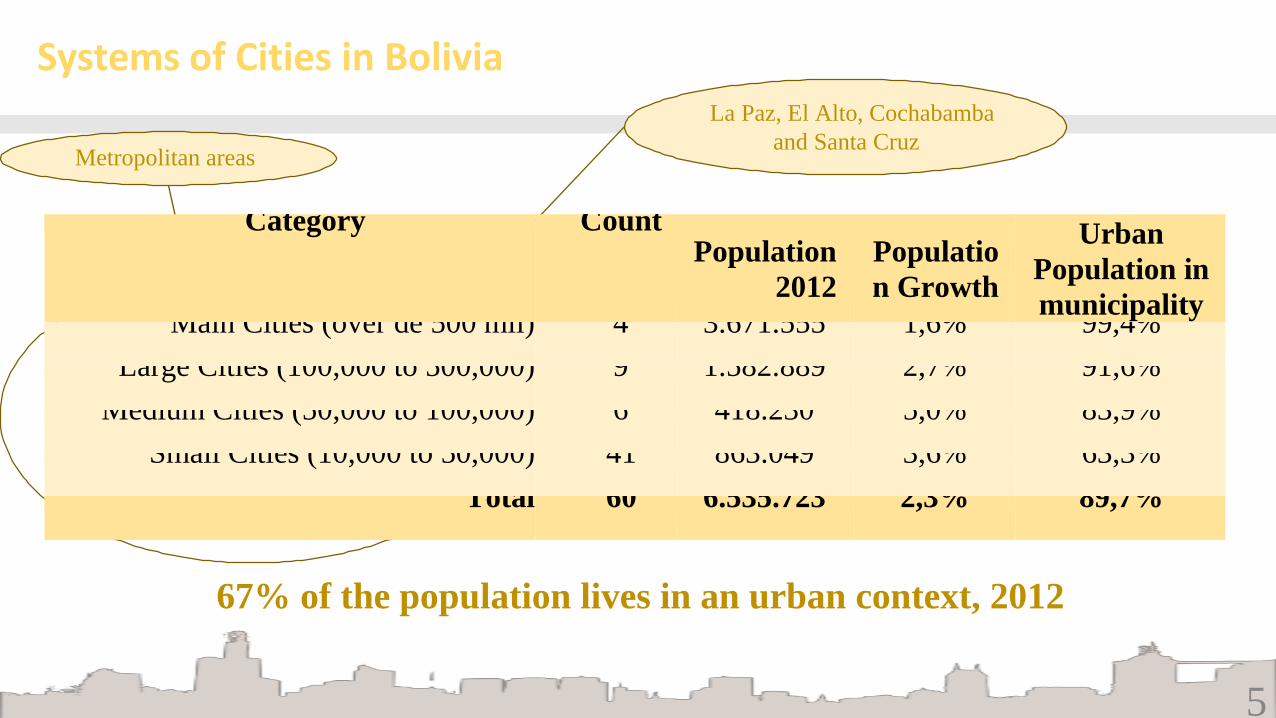
5
Systems of Cities in Bolivia
Metropolitan areas
La Paz, El Alto, Cochabamba
and Santa Cruz
Category Count
Population
2012
Populatio
n Growth
Urban
Population in
municipality Main Cities (over de 500 mil) 4 3.671.555 1,6% 99,4%
Large Cities (100,000 to 500,000) 9 1.582.889 2,7% 91,6%
Medium Cities (50,000 to 100,000) 6 418.230 5,0% 83,9%
Small Cities (10,000 to 50,000) 41 863.049 3,6% 63,3%
Total 60 6.535.723 2,3% 89,7%
67% of the population lives in an urban context, 2012
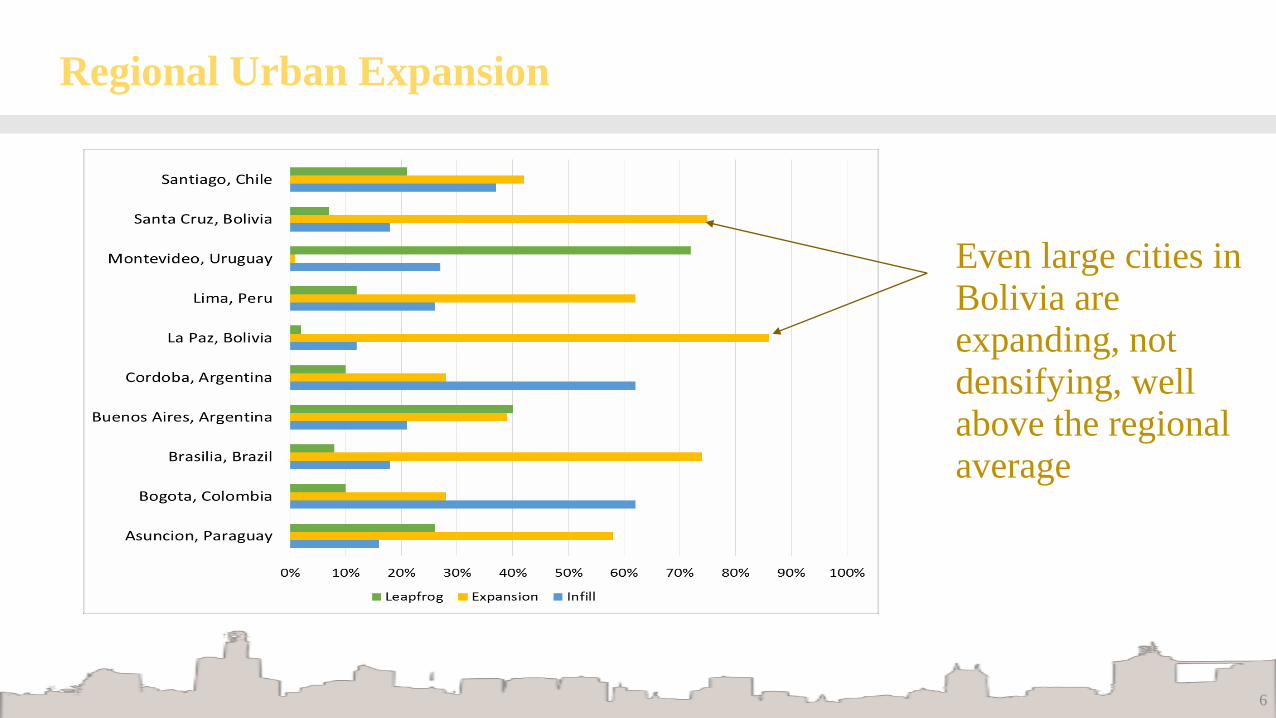
Regional Urban Expansion Patterns
6
Even large cities in Bolivia are expanding, not densifying, well above the regional average
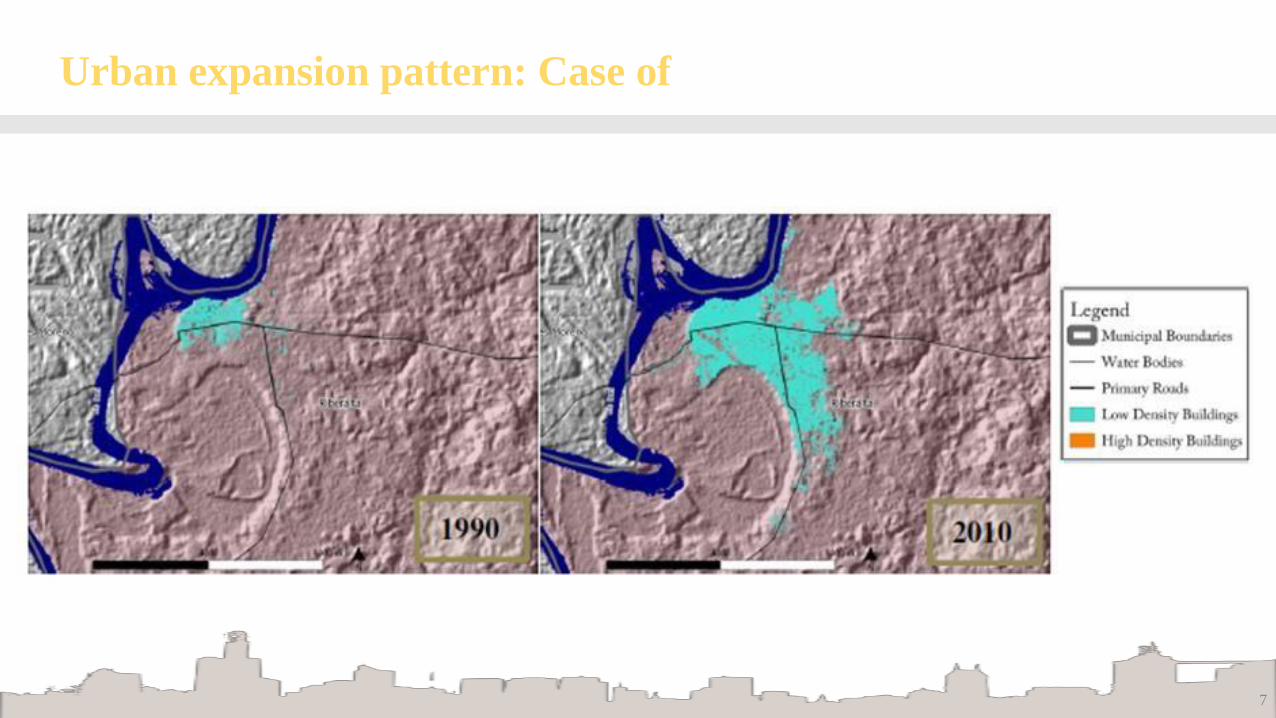
Urban expansion pattern: Case of Riberalta
7
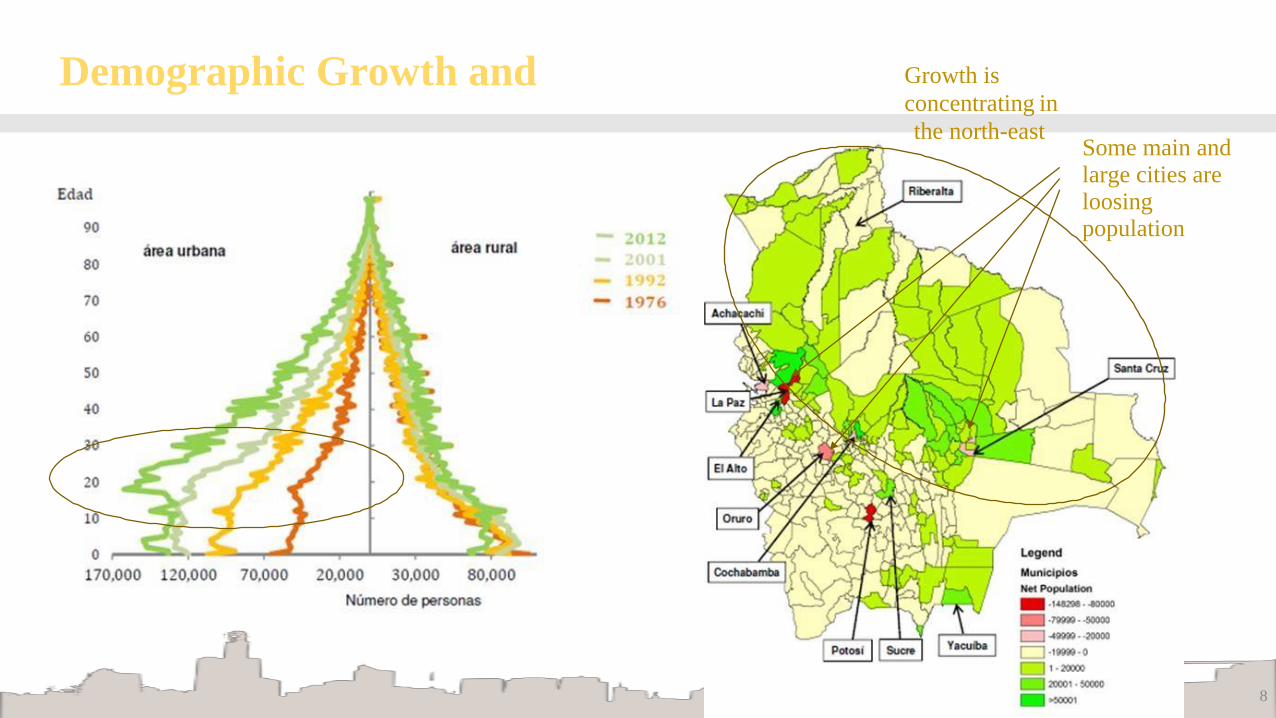
Demographic Growth and Migration
Growth is
concentrating in
the north-east Some main and large cities are loosing population
8
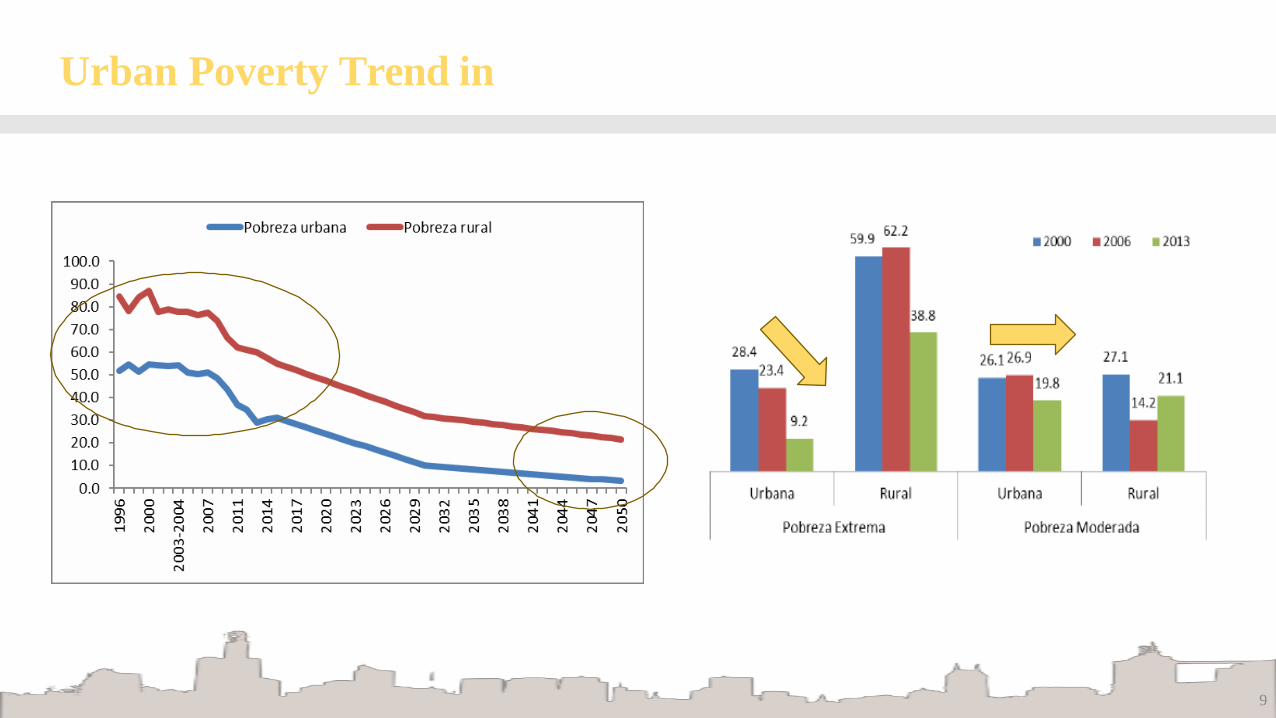
Urban Poverty Trend in Bolivia
9

Recommended Fields of Action for SCD Bolivia
Topics measured against:
✓ Severity ✓ Sustainable development
✓ Domains of SDC current strategy
Priority Topics
✓ Access to basic urban infrastructure services
✓ Access to public services ✓ Decent Work ✓ Vulnerabilities as a result of Climate
Change
10
Developmen
Domains Priorit
y
Topic
Severity1
Access to basic urban infrastructure services2
+++
Basic administrative
services +
Access to public
services 3
+++
Housing +
Decent work +++
Security ++
Land tenure +
Vulnerabilities as a result of climate change
+++
Urban community organization
+
Social Econ. Env. Gov. I & E CC
+ + + + + 7
+ + 3
+ + + + 7
+ + + 4
+ + + 6
+ + + + 5
+ + + + 5
+ + + + + 8
+ + 3
Stocktaking of Donors, Main Actors and SDC’s
activities
11

Effectiveness of Service Delivery and the Urban Delivery Gap
Urban delivery gap
12
Access to only a few services
Arrival to
city
Tim
e
Full citizenship
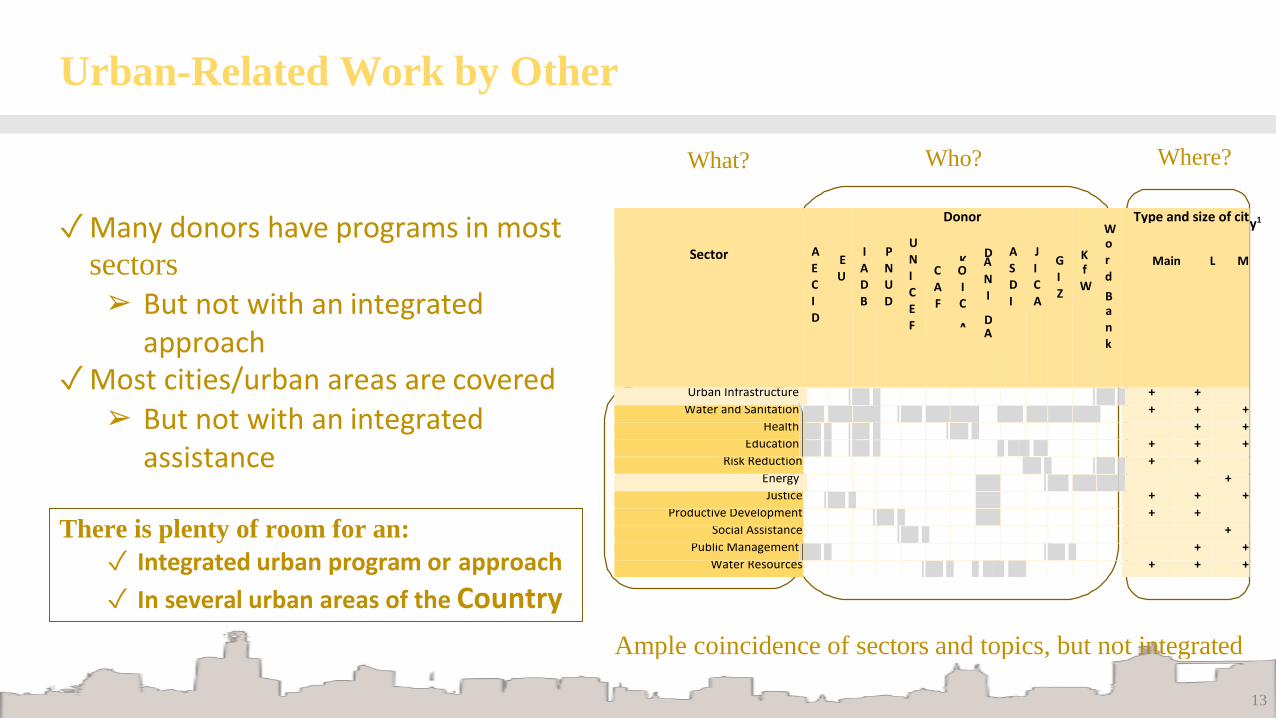
Urban-Related Work by Other Donors
Ample coincidence of sectors and topics, but not integrated
13
What? Who? Where?
✓ Many donors have programs in most y1
sectors
➢ But not with an integrated approach
✓ Most cities/urban areas are covered ➢ But not with an integrated
assistance
There is plenty of room for an:
✓ Integrated urban program or approach
✓ In several urban areas of the Country
Sector
A
E C I
D
E U
I
A D
B
P
N U
D
U
N I C
E F
Donor
K D
C O A
A I N
F C
I
A D A
A
S D
I
J
I C
A
G I
Z
K f
W
W o r
d
B a n
k
Type and size of cit
Main L M
Urban Infrastructure + + Water and Sanitation + + +
Health + +
Education + + +
Risk Reduction + + Energy +
Justice + + +
Productive Development + + Social Assistance +
Public Management + +
Water Resources + + +
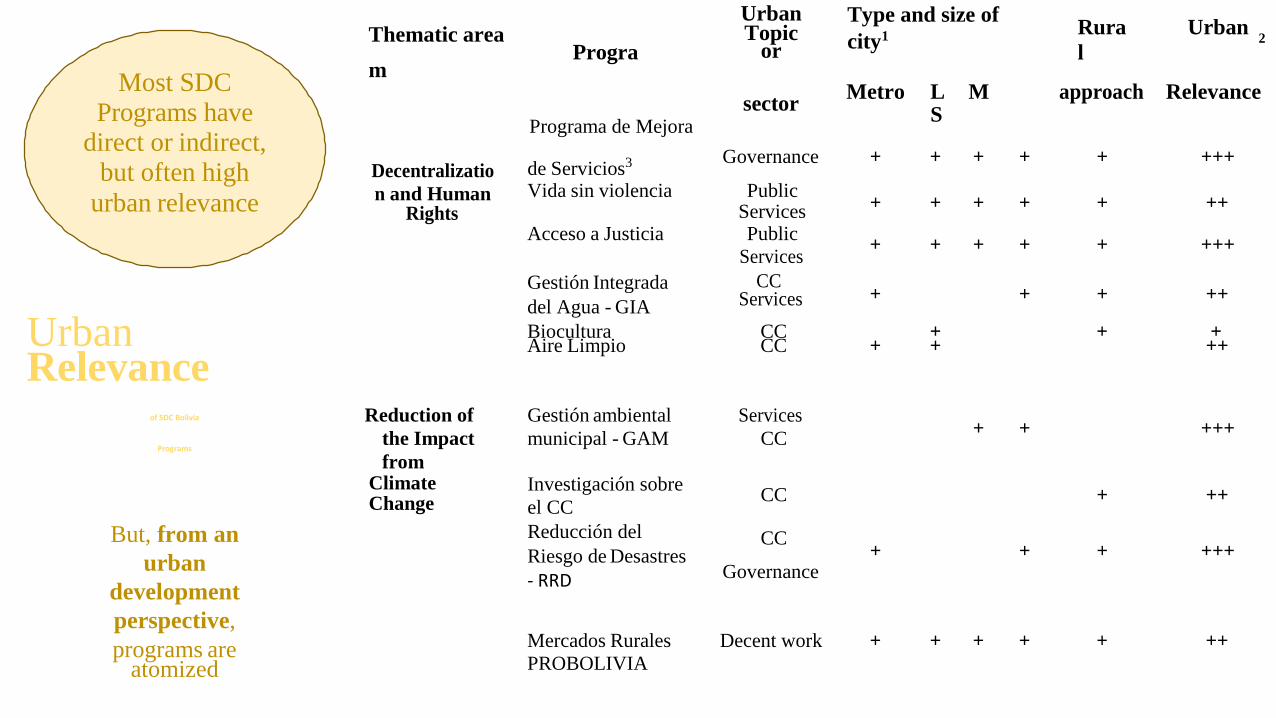
Thematic area Program
Urban Topic
or
Type and size of
city1
Rura
l
Urban 2
Programa de Mejora sector
Metro L M S
approach Relevance
Decentralizatio
n and Human Rights
de Servicios3 Governance + + + + + +++
Vida sin violencia Public + + + + + ++
Services
Acceso a Justicia Public
Services + + + + + +++
Gestión Integrada
del Agua - GIA
CC Services + + + ++
Urban Relevance
Biocultura CC + + + Aire Limpio CC + + ++
of SDC Bolivia
Programs
Reduction of
the Impact
from
Gestión ambiental
municipal - GAM
Services
CC
+ + +++
But, from an
urban
development
perspective,
Climate Change
Investigación sobre
el CC
Reducción del
Riesgo de Desastres
- RRD
CC + ++
CC
+ + + +++ Governance
programs are atomized
Mercados Rurales Decent work + + + + + ++
PROBOLIVIA
Most SDC
Programs have direct or indirect,
but often high
urban relevance
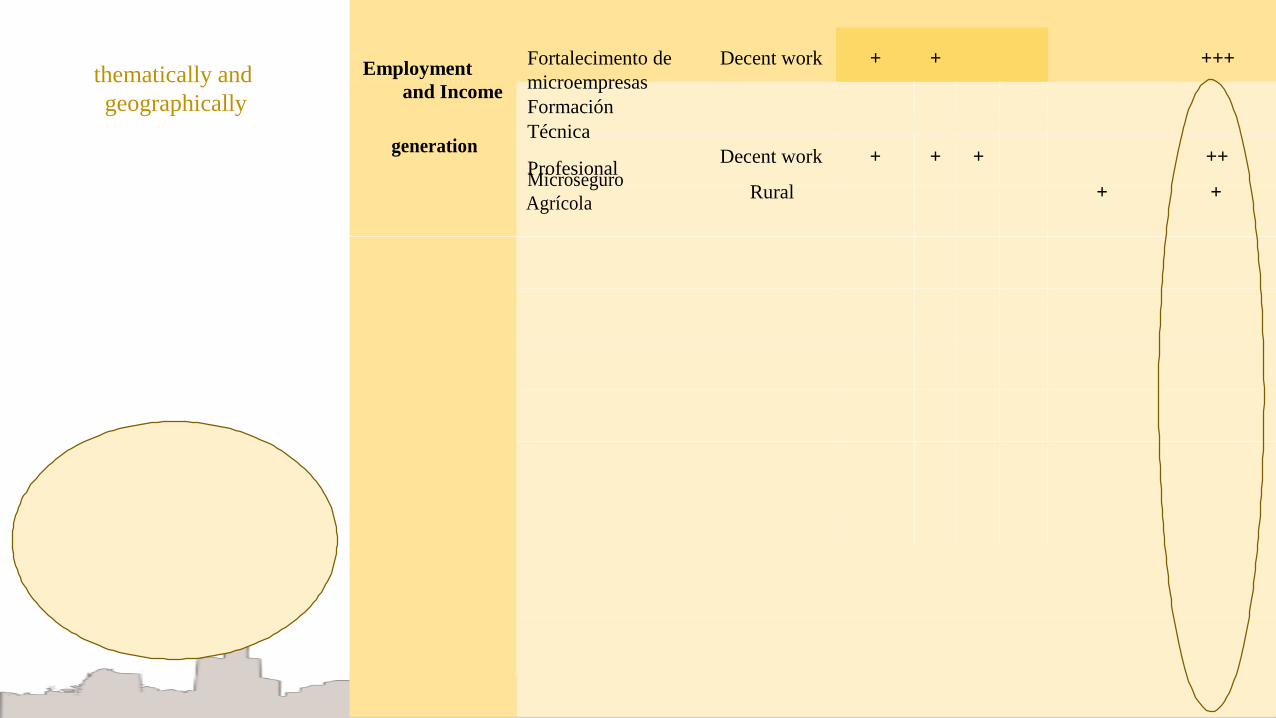
14
thematically and
geographically
Employment
and Income
Fortalecimento de
microempresas
Formación
Técnica
Decent work + + +++
generation
Profesional Decent work + + + ++
Microseguro
Agrícola Rural + +
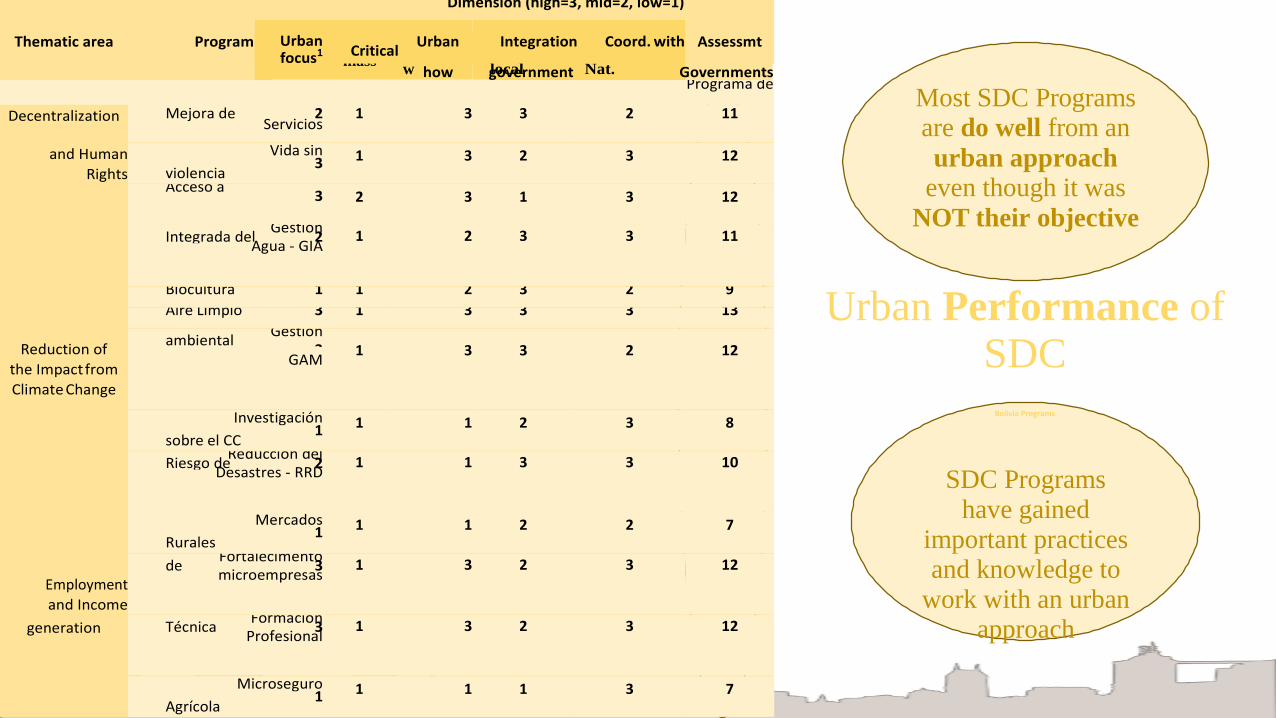
Justicia
mass Kno
w
with
local
Dep and
Nat. Most SDC Programs are do well from an
urban approach even though it was
NOT their objective
municipal
-
Urban Performance of SDC
Bolivia Programs
SDC Programs have gained
important practices and knowledge to
work with an urban approach
Dimension (high=3, mid=2, low=1)
Thematic area Program Urban focus1
Critical
Urban Integration Coord. with Assessmt
how government Governments Programa de
Decentralization Mejora de 2
Servicios 1 3 3 2 11
and Human
Rights
Vida sin
violencia 3
1 3 2 3 12
Acceso a 3
2 3 1 3 12
Gestión Integrada del 2
Agua - GIA
1
2
3
3
11
Biocultura 1 1 2 3 2 9
Aire Limpio 3 1 3 3 3 13
Reduction of
the Impact from
Climate Change
Gestión ambiental
3
GAM
1
3
3
2
12
Investigación
sobre el CC 1
1 1 2 3 8
Reducción del Riesgo de 2
Desastres - RRD
1
1
3
3
10
Mercados
Rurales 1
1 1 2 2 7
Employment
and Income
Fortalecimento de 3
microempresas
1
3
2
3
12
generation Formación
Técnica 3 Profesional
1
3
2
3
12
Microseguro
Agrícola 1
1 1 1 3 7

Recommendations
16
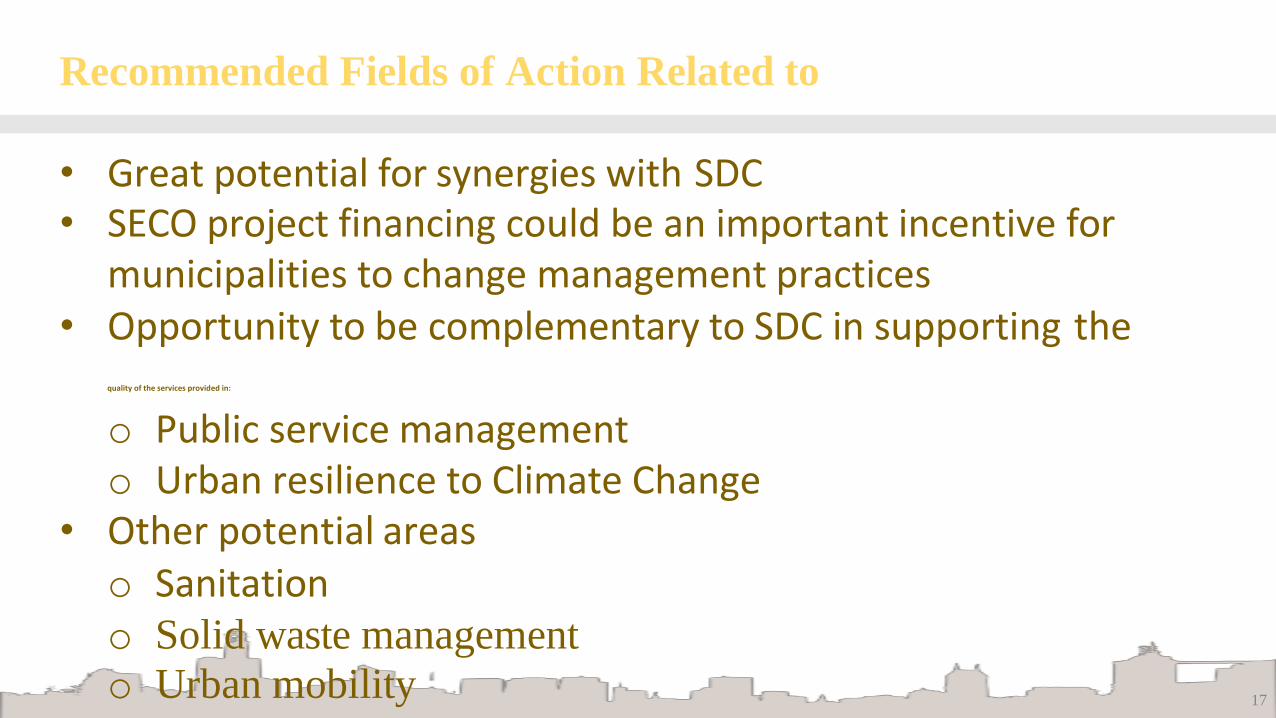
Recommended Fields of Action Related to SECO
o Solid waste management
o Urban mobility 17
• Great potential for synergies with SDC • SECO project financing could be an important incentive for
municipalities to change management practices • Opportunity to be complementary to SDC in supporting the
quality of the services provided in:
o Public service management o Urban resilience to Climate Change
• Other potential areas o Sanitation
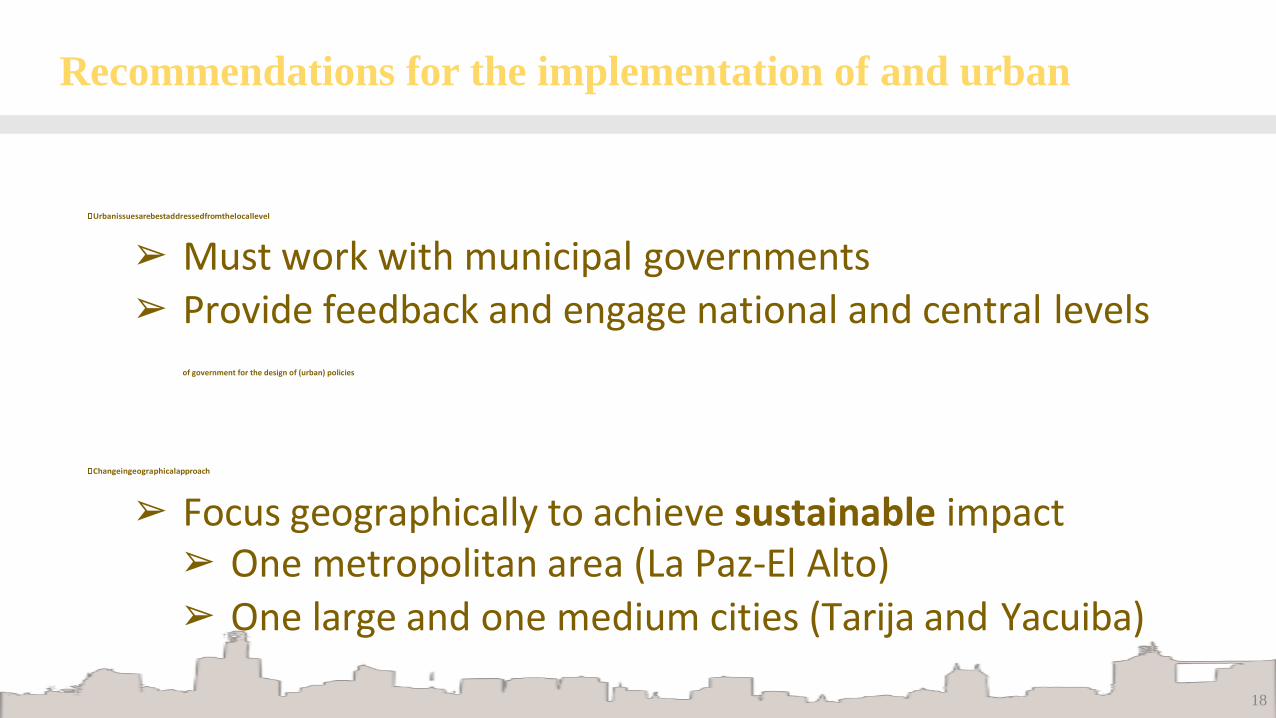
Recommendations for the implementation of and urban approach
18
Urban issues are best addressed from the local level
➢ Must work with municipal governments
➢ Provide feedback and engage national and central levels of government for the design of (urban) policies
Change in geographical approach
➢ Focus geographically to achieve sustainable impact ➢ One metropolitan area (La Paz-El Alto)
➢ One large and one medium cities (Tarija and Yacuiba)
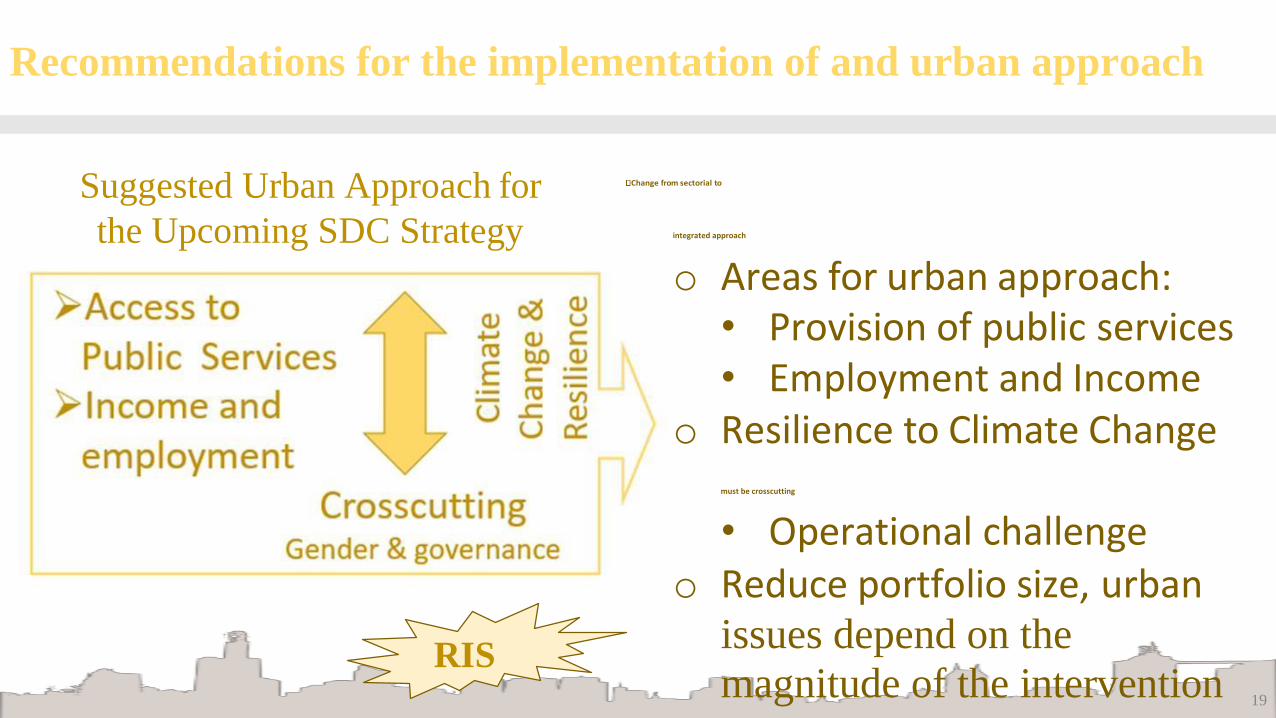
Recommendations for the implementation of and urban approach (2)
RISKS
issues depend on the
magnitude of the intervention 19
Suggested Urban Approach for
the Upcoming SDC Strategy
Change from sectorial to
integrated approach
o Areas for urban approach: • Provision of public services • Employment and Income
o Resilience to Climate Change must be crosscutting
• Operational challenge o Reduce portfolio size, urban
20
Discussion / Q&A
21
Thank you
Annex 10 – TORs Bolivia Country Study on Urban Development Opportunities
Country study Bolivia: Urban Development Opportunities
Terms of Reference
General background information on the study
By 2050, the world’s population will increase by 2.3 billion people. Growth will take place exclusively in urban areas, mostly in Asia and Africa. While urbanization offers opportunities to reduce poverty, especially rapid urban growth means as well big challenges for the cities in terms of accommodating the additional, especially the poor, marginalized people. The number of people living in informal settlements is expected to increase a lot, especially in Sub-Saharan Africa and some Asian regions. By 2040, more poor people will be living in urban than in rural areas.
Today, the Swiss Agency for Development and Cooperation (SDC) is mainly active in rural areas, only a modest part going into urban contexts and development (cf. light-mapping of SDC / SECO activities done in 2016). In contrast to this, from the 80ies till the early years of 2000, SDC still had a specialist department on “Industry, Vocational Skills Development and Urbanization” and country programs with strong urban development components like in Vietnam or in Western Africa (with the concept of the “villes moyennes”). This focus got lost due to internal reforms in the years 2000. But in view of the above mentioned global trends, it is evident that urban and peri-urban development becomes increasingly important for development cooperation (including humanitarian aid). On the other hand, the State Secretariat for Economic Affairs (SECO) as the second Swiss public entity implementing cooperation projects, has already nowadays a clear focus on urban contexts, e.g. with the financing of cities’ infrastructure.
In 2015, the Sustainable Development Goals (SDGs) were adopted, including SDG 11 on inclusive, safe, resilient and sustainable cities. And last autumn, the new Urban Agenda was determined during the Habitat III conference in Quito. In this context, SDC is reflecting on its long-term positioning to contribute to this agenda, to face the new challenges and to work increasingly in (peri-)urban contexts. In 2016, an SDC working group elaborated a draft issue paper (in consultation) with recommendations on SDC’s positioning in urban contexts. The preliminary recommendations (cf. chapter 3 of the draft issue paper) propose that SDC engages more actively and more systematically in peri-urban and urban contexts, thus contributing to an inclusive and sustainable urbanization process. It is proposed to connect to existing SDC experiences and to build on the potential of dynamic rural-urban linkages to fight national poverty, putting individuals at the center. It is as well recommended to focus on functional territorial areas covering connected urban, peri-urban and rural areas, with a specific focus on smaller and medium sized cities. The recommended thematic focus areas of work are a) urban governance, b) economic inclusion and c) environmentally sustainable and resilient urban development.
The case studies are a next step to validate and deepen these reflections on a concrete country level, implying several thematic SDC networks. The studies will provide inputs for several purposes: For the elaboration of SDC country strategies and the development of country portfolios, for strategic SDC management decisions and for learning at SDC and beyond.
Bolivia: The strategic orientation of the country program (2013 – 2017) in Bolivia has three priority domains: Decentralization and Human Rights (D&HH.RR), Climate Change (CC) and Employment & Income (E&I). There are two mainstreaming topics: gender and governance. The SDC projects are working with different levels of governments and municipalities (rural, peri-urban, urban) and addressing poverty from different points of view in each domain.
In the first trimester or 2017 it is expected to have an internal discussion about the country priorities that will be considered in the next Country Strategy (2018 -2021). So far, the mentioned domains will probably remain7, but the project portfolio will be prioritized regarding the country budget constraints and the problems that Bolivia is now facing in peri-urban and urban areas.
Objective of the country study: The country study shall deliver answers to the following leading questions (which are further specified in the questions and report outline just below):
a) What are major issues and challenges in urban and peri-urban development where Development Cooperation in general and SDC specifically can make a difference?
b) How to connect best to existing SDC experiences in Bolivia when working increasingly in urban and peri-urban contexts, how to work on functional rural-(peri)-urban areas?
c) How to integrate the peri urban and urban lens into the upcoming cooperation strategy, how to adapt the existing project portfolio?
Specific questions of the country study / outline of the report
1. Country context / Urbanization process
1.1. What are main characteristics of urbanization, urban growth and poverty? (urbanization rate over time, demography, reasons of migration, poverty rates rural/urban, inequalities)
1.2. What are the tendencies of urban development in Bolivia until 2030 and 2050?
1.3. What national framework has a major influence on urban development? E.g. urban / peri-urban development strategies; national economic policies; public management mechanisms on metropolitan / regional level; migration strategies; decentralization processes with legal / administrative competencies and financial resources attributed to local authorities.
1.4. What role do cities / rural-urban linkages have in poverty reduction in the country? E.g. with regard to the potential of value chains for agricultural products, high-growth economic sectors that utilize inputs and/or labor from rural areas What are some relevant opportunities to reduce national poverty with regard to cities and rural-urban linkages? Where information is available, identify potential high-growth industries that utilize inputs and/or labor from rural areas), migration and changes in employment generation.
1.5. What are the main poverty-related challenges of the urbanization process (with a focus on the three most important challenges, describing linkages to other topics and to the priority domains of the upcoming cooperation strategy)? E.g. land tenure, housing, access to basic social services, basic administrative services, access to legal services and alternatives, decent work, security, protection, vulnerabilities as a result of climate change, urban community organization, etc. Consider the three dimensions of sustainable development as a “reading grid” / tool for this analysis.
7 The E&I domain will probably go deeper on the economic development.
2. Stocktaking of other donors’, main actors’ and SDC’s activities
2.1. What are other donors’ and main actors (i.e. municipalities, Ministry of Autonomy etc.) engagements to address the above mentioned biggest challenges of (peri-)urban development? Description of thematic and geographical areas of work and of targeted type / size of cities.
2.2. What areas of other donors’ and main actors’ interventions were for what reasons generally successful, what areas of interventions were less successful?
2.3. What are unaddressed issues and challenges?
2.4. Where do SDC’s activities reach out to (peri-) urban contexts within the three domains of the Country Cooperation Strategy? Description of thematic and geographical areas of work and of targeted type / size of cities.
2.5. What areas of SDC’s interventions were for what reasons generally successful, what areas of interventions were less successful?
2.6. Does SDC address some of the issues and challenges not yet covered by other donors / actors – and which are still left out?
3. Reflections / recommendations
3.1. What are recommended fields of action for SDC, in view of poverty reduction leverage and overall sustainable development in the country? Proposal of thematic priorities (with reference to the new dispatch
8 but focused on the three domains
of the Country Strategy, geographical areas, city categories, functional areas, with a clear indication of value added of SDC (gaps, experiences).
Sub-question: Which of the identified recommended fields of action could be linked with SECO’s main fields of expertise?
3.2. What are the three main recommendations to integrate the topic in the domains of the upcoming cooperation strategy and / or to adapt / develop the project portfolio?
3.3. General appreciation: What are your views on the draft Issue Paper’s recommendation to SDC to intervene in urban contexts with projects that integrate or coordinate activities in the three fields of a) urban governance, b) economic development / decent employment as well as c) environmentally sustainable and resilient urban development? --> the answer to this point is to be covered in an annex to the report, with a maximum 2 pages (deadline for this annex to be shared with SDC: 24 February) (SDC’s draft Issue Paper, to be shared with the expert, recommends on pages 8 – 10 working in urban areas in an integrated / coordinated way encompassing the three mentioned fields. The feasibility needs to be checked, indicating pros and cons)
Geographical scope of study: The study is done on a country level, and should put a focus on Metropolitan regions (La Paz, Cochabamba, Santa Cruz), the capital cities and main cities from 10.000 inhabitants and up. The report shall contain a city categorization (e.g. small, intermediate, big cities, with indication of the respective population sizes). The study is to be done on a country level, considering this city categorization as an analytical grid / tool for the three mentioned chapters of the study.
Basic documentation to be shared with consultant
Draft Issue Paper “SDC’s future engagement in urban contexts” (version 16/12/2016)
8 The thematic priorities of the new dispatch to parliament are: climate change and environment; food security and
nutrition; water; migration; health; basic education and vocational skills development; employment and economic development; peace promotion, conflict prevention and human rights; gender equality; governance.
Preliminary results of the lightmapping SDC / SECO (version 22/07/2016)
Country Strategy Bolivia 2013 – 2017
Report on the Mid-Term-Review Country Strategy Bolivia.
Portfolio information: Credit proposal and / or project documentation of each SDC, Humanitarian Aid and SECO project in Bolivia and of relevant regional SDC / HA initiatives.
Basic documentation to be considered by the consultant (links to the respective documents to be annexed in the report)
Comunidades Urbanas, Ministerio de Obras Públicas, 2016
Plan Nacional de Desarrollo 2016 – 2020
Informe Nacional Sobre Desarrollo Humano en Bolivia: El nuevo rostro de Bolivia – Transformación Social y Metropolización, UNDP, 2016
Tendencias Urbanas en Bolivia: Oportunidades y desafíos, World Bank, 2014
Plan de Acción Área Metropolitana de Cochabamba Sostenible, IADB, 2013
Ley 777 del Sistema de Planificación Integral Estatal - SPIE
Lineamientos para la elaboración de Planes Territoriales de Desarrollo Integral – PTDI, Ministerio de Planificación del Desarrollo, 2016
INE: Official Statistics and reports (census 2012).
Supporting Sustainable Urbanization in Bolivia, World Bank, 201
Other official reports from multilateral and bilateral donors related to the topic of urbanization in Bolivia.
Methodology
TOR chapter 1 (context): Mainly desk studies of existing documents and statistical information; interviews with main stakeholders, e.g. government representatives of ministries, municipalities and “gobernaciones”, private sector, etc. TOR chapter 2 (stocktaking): Desk studies; interviews with SDC personnel (i.e. National Program Officers) and main donors active in urban areas; targeted field visits to SDC projects and interviews with their project coordinators and other local authorities.
TOR chapter 3 (recommendations): Analytical work, interviews with relevant stakeholders to be coordinated with the National Program Officer in Bolivia.
Time frame: February - March 2017
Activities / deliverables
Language of deliverables (documents, presentations): English
By 7th February 2017: Delivery of work-plan with proposal of detailed report outline (on the basis of the TOR / outline indicated above, with indication of pages),
From 13 to 24 February 2017: Desk study work, interviews and field trips, By 10 March 2017: Delivery of analytical draft report (maximum 15 pages, evenly distributed on the three main chapters context, stocktaking and recommendations; explaining tables and graphics are highly appreciated, the most important ones to be included in the main text, the rest in the annexes),
By 17 March 2017: Presentation of results at the Swiss Cooperation Office / Embassy (in form of a concise PPT presentation with hard data, main charts and recommendations), with discussion of the results and a feedback on the report,
By 24 March 2017: Adaptation / finalization of the report.
Skype presentation / exchange with accompanying “urbanization” group in Switzerland in April and October (exact dates to be confirmed).
Related Documents