ORIGINAL RESEARCH ARTICLE published: 13 March 2014 doi: 10.3389/fnins.2014.00049 BOLD fMRI signal characteristics of S1- and S2-SSFP at 7 Tesla Pål E. Goa 1,2 * † , Peter J. Koopmans 2,3† , Benedikt A. Poser 2,3† , Markus Barth 2,3 and David G. Norris 2,3,4 1 MI-Lab, Department of Medical Imaging, St. Olavs University Hospital, Trondheim, Norway 2 Erwin L. Hahn Institute of Magnetic Resonance Imaging, University Duisburg-Essen, Essen, Germany 3 Centre for Cognitive Neuroimaging, Donders Institute for Brain, Cognition and Behaviour, Radboud University Nijmegen, Nijmegen, Netherlands 4 MIRAInstitute for Biomedical Technology and Technical Medicine, Universityof Twente, Enschede, Netherlands Edited by: Nikolaus Weiskopf, University College London, UK Reviewed by: Xi-Nian Zuo, Chinese Academy of Sciences, China Nikolaus Weiskopf, University College London, UK *Correspondence: Pål E. Goa, Department of Physics, Norwegian University of Science and Technology, N-7491 Trondheim, Norway e-mail: [email protected] † Present address: Pål E. Goa, Department of Physics, Norwegian University of Science and Technology, Trondheim, Norway; Peter J. Koopmans, Nuffield Department of Clinical Neurosciences, FMRIB Centre, University of Oxford, Oxford, UK; Benedikt A. Poser, Department of Cognitive Neuroscience, Maastricht Brain Imaging Centre, Maastricht University, Maastricht, Netherlands Object: To compare the BOLD fMRI signal characteristics at in the cortex and on the pial surface for a non-balanced steady-state free precession sequence (nb-SSFP) at 7T. Materials and Methods: A multi-echo nb-SSFP sequence was used for high resolution fMRI at 7T. Two S1 (S + ) echoes at different echo times were acquired together with an S2 (S − ) echo. The primary visual cortex (V1) was examined using a reversing checkerboard paradigm at an isotropic resolution of 0.75 mm, with 35 volumes acquired and a total scan time of 27 min. Results: Significant activation was observed in all subjects for all three acquired echoes. For the S1 signal at the longer TE, the activation induced signal change was about 4% in the cortex and 10% at the cortical surface, while for S2 the corresponding values were 3 and 5%. Conclusion: For both S1 and S2 data, the BOLD signal peaks at the pial surface. The large pial surface signal change in S2 may be caused by dynamic averaging around post-capillary vessels embedded within CSF. This is made possible by the long diffusion times of the pathways contributing to the S2 signal and the relatively high diffusion coefficient of CSF. The results indicate that S2-SSFP might not be a suited alternative to spin-echo for high-resolution fMRI at 7T. Keywords: 7T, BOLD, fMRI, steady-state free precession, visual cortex INTRODUCTION At high magnetic field strengths such as 7T, T2-weighted sequences are attractive for use in blood oxygenation level- dependent (BOLD) functional MRI (Duong et al., 2002; Yacoub et al., 2003; Olman et al., 2010; Barth and Poser, 2011; Norris, 2012) for two reasons. On the one hand extravascular static dephasing around large draining veins is refocused and does not contribute to the T2-weighted signal, while on the other hand the intravascular signal is small as a result of the short T2 of venous blood at 7 T (Lee et al., 1999; Duong et al., 2003; Yacoub et al., 2005). The dominant contribution to the BOLD contrast in T2-weighted fMRI at 7 T is therefore, expected to be the extravascular dynamic averaging around small vessels, resulting in a BOLD signal mainly from the parenchyma. The use of spin-echo (SE) based sequences at high field has two drawbacks compared to gradient-echo (GE): the much higher radio frequency (rf) power deposition that often limits the achiev- able volume coverage and/or requires longer repetition times (TR); and the sensitivity to B1 inhomogeneities. Slice multi- plexing (Larkman et al., 2001; Feinberg et al., 2010; Moeller et al., 2010) combined with PINS rf pulses (Norris et al., 2011) offers a potential solution to the SAR problem, while parallel transmit technology (Setsompop et al., 2008) would provide better B1 homogeneity. Non-balanced steady-state free preces- sion (nb-SSFP) has been proposed as an alternative sequence for T2-weighted BOLD fMRI at high field strength (Barth et al., 2010). Nb-SSFP is interesting because of its low rf power depo- sition and negligible image distortion. It furthermore offers the possibility of simultaneously acquiring the S2 signal together with the S1 signal which respectively resemble the SE and GE signal characteristics. However, an important downside with the nb- SSFP sequence is the low temporal resolution, if only one GE is acquired per TR-interval. The signal contrast in nb-SSFP differs both from conventional GE and balanced SSFP (Miller et al., 2006). The two different sig- nal types acquired, S1 and S2, have significantly different contrast behavior. The S2 signal, which appears just before each rf pulse, is composed of a sum of SE and stimulated-echo pathways formed by previous excitation pulses. The youngest pathway in S2 is a SE with TE equal to twice the TR of the sequence. The S1 signal appears immediately after the excitation pulse and is composed of a freshly excited FID together with older pathways which it shares with the S2 signal. Hence an S2 image has a SE like contrast, while www.frontiersin.org March 2014 | Volume 8 | Article 49 | 1

Welcome message from author
This document is posted to help you gain knowledge. Please leave a comment to let me know what you think about it! Share it to your friends and learn new things together.
Transcript

ORIGINAL RESEARCH ARTICLEpublished: 13 March 2014
doi: 10.3389/fnins.2014.00049
BOLD fMRI signal characteristics of S1- and S2-SSFP at7 TeslaPål E. Goa1,2*†, Peter J. Koopmans2,3†, Benedikt A. Poser2,3†, Markus Barth2,3 and David G. Norris2,3,4
1 MI-Lab, Department of Medical Imaging, St. Olavs University Hospital, Trondheim, Norway2 Erwin L. Hahn Institute of Magnetic Resonance Imaging, University Duisburg-Essen, Essen, Germany3 Centre for Cognitive Neuroimaging, Donders Institute for Brain, Cognition and Behaviour, Radboud University Nijmegen, Nijmegen, Netherlands4 MIRA Institute for Biomedical Technology and Technical Medicine, University of Twente, Enschede, Netherlands
Edited by:
Nikolaus Weiskopf, UniversityCollege London, UK
Reviewed by:
Xi-Nian Zuo, Chinese Academy ofSciences, ChinaNikolaus Weiskopf, UniversityCollege London, UK
*Correspondence:
Pål E. Goa, Department of Physics,Norwegian University of Scienceand Technology, N-7491 Trondheim,Norwaye-mail: [email protected]†Present address:
Pål E. Goa, Department of Physics,Norwegian University of Scienceand Technology, Trondheim,Norway;Peter J. Koopmans, NuffieldDepartment of ClinicalNeurosciences, FMRIB Centre,University of Oxford, Oxford, UK;Benedikt A. Poser, Department ofCognitive Neuroscience, MaastrichtBrain Imaging Centre, MaastrichtUniversity, Maastricht, Netherlands
Object: To compare the BOLD fMRI signal characteristics at in the cortex and on the pialsurface for a non-balanced steady-state free precession sequence (nb-SSFP) at 7 T.
Materials and Methods: A multi-echo nb-SSFP sequence was used for high resolutionfMRI at 7 T. Two S1 (S+) echoes at different echo times were acquired together with anS2 (S−) echo. The primary visual cortex (V1) was examined using a reversing checkerboardparadigm at an isotropic resolution of 0.75 mm, with 35 volumes acquired and a total scantime of 27 min.
Results: Significant activation was observed in all subjects for all three acquired echoes.For the S1 signal at the longer TE, the activation induced signal change was about 4% inthe cortex and 10% at the cortical surface, while for S2 the corresponding values were 3and 5%.
Conclusion: For both S1 and S2 data, the BOLD signal peaks at the pial surface. The largepial surface signal change in S2 may be caused by dynamic averaging around post-capillaryvessels embedded within CSF. This is made possible by the long diffusion times of thepathways contributing to the S2 signal and the relatively high diffusion coefficient ofCSF. The results indicate that S2-SSFP might not be a suited alternative to spin-echo forhigh-resolution fMRI at 7 T.
Keywords: 7T, BOLD, fMRI, steady-state free precession, visual cortex
INTRODUCTIONAt high magnetic field strengths such as 7 T, T2-weightedsequences are attractive for use in blood oxygenation level-dependent (BOLD) functional MRI (Duong et al., 2002; Yacoubet al., 2003; Olman et al., 2010; Barth and Poser, 2011; Norris,2012) for two reasons. On the one hand extravascular staticdephasing around large draining veins is refocused and doesnot contribute to the T2-weighted signal, while on the otherhand the intravascular signal is small as a result of the shortT2 of venous blood at 7 T (Lee et al., 1999; Duong et al.,2003; Yacoub et al., 2005). The dominant contribution tothe BOLD contrast in T2-weighted fMRI at 7 T is therefore,expected to be the extravascular dynamic averaging aroundsmall vessels, resulting in a BOLD signal mainly from theparenchyma.
The use of spin-echo (SE) based sequences at high field hastwo drawbacks compared to gradient-echo (GE): the much higherradio frequency (rf) power deposition that often limits the achiev-able volume coverage and/or requires longer repetition times(TR); and the sensitivity to B1 inhomogeneities. Slice multi-plexing (Larkman et al., 2001; Feinberg et al., 2010; Moelleret al., 2010) combined with PINS rf pulses (Norris et al., 2011)
offers a potential solution to the SAR problem, while paralleltransmit technology (Setsompop et al., 2008) would providebetter B1 homogeneity. Non-balanced steady-state free preces-sion (nb-SSFP) has been proposed as an alternative sequencefor T2-weighted BOLD fMRI at high field strength (Barth et al.,2010). Nb-SSFP is interesting because of its low rf power depo-sition and negligible image distortion. It furthermore offers thepossibility of simultaneously acquiring the S2 signal together withthe S1 signal which respectively resemble the SE and GE signalcharacteristics. However, an important downside with the nb-SSFP sequence is the low temporal resolution, if only one GE isacquired per TR-interval.
The signal contrast in nb-SSFP differs both from conventionalGE and balanced SSFP (Miller et al., 2006). The two different sig-nal types acquired, S1 and S2, have significantly different contrastbehavior. The S2 signal, which appears just before each rf pulse, iscomposed of a sum of SE and stimulated-echo pathways formedby previous excitation pulses. The youngest pathway in S2 is aSE with TE equal to twice the TR of the sequence. The S1 signalappears immediately after the excitation pulse and is composed ofa freshly excited FID together with older pathways which it shareswith the S2 signal. Hence an S2 image has a SE like contrast, while
www.frontiersin.org March 2014 | Volume 8 | Article 49 | 1

Goa et al. BOLD nb-SSFP signal at 7T
an S1 image, usually dominated by the fresh FID, has a GE likecontrast.
The purpose of this study is to explore the potential of nb-SSFPfor high-resolution BOLD fMRI at 7 T. An important motivationfor this work comes from our previous study using 3D S2-SSFPwhich was performed at a coarser spatial resolution (Barth et al.,2010), and showed a high level of similarity between S2-SSFP acti-vation patterns and those recorded for SE EPI. In the absenceof a gold standard for brain activation studies a high resolutionstudy should shed some light on the origin of the signal changes,their underlying contrast mechanisms, and potential future usesof nb-SSFP. Specifically, fMRI of the primary visual cortex (V1) at0.75 mm isotropic resolution is used to compare the signal char-acteristics of S1 and S2 inside the cortex and at the pial surface,extracted from the simultaneously acquired S1 echoes at two dif-ferent TE values and the S2 signal. The techniques used herein aretoo slow for use in fMRI studies: if it were desired to use the S2 sig-nal then the current GE readout would probably best be replacedby a “spiral-in” acquisition. This study does however give insightinto both the relative sensitivities of the S1 and S2 signals as well asthe contrast mechanisms underlying S1 and S2 activation inducedsignal changes.
MATERIALS AND METHODSMRI SEQUENCE AND fMRI ACQUISITIONSA 3D multi-echo non-balanced SSFP sequence was implementedon a Siemens Magnetom 7 T whole-body scanner (SiemensHealthcare, Erlangen, Germany). The pulse sequence diagram isshown in Figure 1. The sequence allows acquisition of one ormore S1-echoes followed by a single S2-echo within each TR. Aspoiler gradient was applied between the S1 and S2 echoes toensure separation of the signals. To boost sensitivity, a custom-built 7-channel surface receive coil array (Orzada et al., 2010)covering the occipital lobe was inserted into the vendor provided8-channel T/R headcoil (Rapid Biomedical, Rimpar, Germany).Both coils were used for signal reception. Eight subjects werescanned after informed consent was given according to the guide-lines of the local ethics committee.
After acquisition of a 3-axis localizer, B0-shimming was per-formed using a 3D field map calculated from a GRE double echosequence. A B1-mapping sequence was used to calculate the cor-rect reference rf amplitude in a chosen volume of interest of5 × 5 × 5 cm centered in the occipital lobe. A sagittal HASTEscan was acquired to accurately identify the calcarine sulcus asa localizer for V1.
The functional 3D acquisition slab consisted of 24 slices witha slice thickness 0.75 mm, axially oriented and tilted toward thecoronal plane to align the slab with the calcarine sulcus. In-planematrix size was 256 × 256 voxels permitting an isotropic voxelsize of 0.75 mm. Other sequence parameters were: FA = 25◦,BW = 160 Hz/pix, left-right phase-encoding, inplane GRAPPAacceleration factor 4, TR = 27.6 ms, TE1 = 7 ms (S1), TE2 =17 ms (S1) and TE3 = 23.6 ms (S2). Volume TR = 47 s, numberof volumes = 35, of which 18 in the reference (“OFF”) condition(black screen, fixation point) interleaved with 17 volumes wherea black/white checkerboard reversing at 7.5 Hz was shown (“ON”condition). The total resulting functional scan time was 27 min.
FIGURE 1 | Sequence diagram. The multi-echo non-balanced SSFP for thecase of two S1 echoes followed by a single S2 echo as used in the currentstudy.
A total of eight subjects were examined, for seven of thesethe functional scan was followed by an anatomical reference scanusing an MP2RAGE sequence (Marques et al., 2010) which hadidentical orientation, slice thickness and in-plane resolution as thefunctional scan, but 80 slices to facilitate analysis in FreeSurfer(Dale et al., 1999; Fischl et al., 1999). Parameters were: TI1 =1000 ms, TI2 = 3300 ms, TR = 8250 ms, echo spacing = 7 ms,FA = 4◦, BW = 190 Hz/pix. For one subject, the anatomical ref-erence scans were obtained on a 3T system (TIM TRIO, SiemensHealthcare, Erlangen, Germany) using the product 32-channelhead receive coil and an MPRAGE sequence with parametersTI = 1100 ms, TR = 2300 ms, FA = 10◦ and BW = 130 Hz/px.
For identification of the primary visual cortex V1, retino-topic mapping was performed with a conventional 2D GE-EPIsequence on six subjects at 7T, using a rotating 22.5◦ dual-wedge(one per hemifield) stimulus of reversing red–green checkerboard(Engel et al., 1997). This dual-wedge rotated clockwise advancingin steps of 22.5◦ every 5 volumes. The same volume was scannedwith the GE-EPI sequence as was acquired during the MP2RAGEusing a 2D GE-EPI sequence (20 slices, 64 × 64 matrix, 3 mmisotropic resolution). Other parameters were: TE = 25 ms, FA =50◦, volume TR = 1000 ms, 505 volumes. For two of the subjects,retinotopy scans had previously been obtained at 3 T with similaracquisition parameters.
POST PROCESSINGInitial postprocessing steps for the nb-SSFP data includedphase correction using the navigator method described by Goaet al. (2013), realignment of functional series and coregistrationwith the structural T1-weighted reference volume using SPM8(Wellcome Centre for Neuroimaging, London, UK). Despitethe high spatial resolution no subjects had to be excludedfrom the analysis due to excessive motion during the scan.The motion parameters were (population mean ± SD): abso-lute translation = 0.24 ± 0.15 mm, absolute rotation = 0.21 ±0.11◦. Because of the long volume TR, we also estimated the
Frontiers in Neuroscience | Brain Imaging Methods March 2014 | Volume 8 | Article 49 | 2
Goa et al. BOLD nb-SSFP signal at 7T
motion during the acquisition of a single volume by calculat-ing the differential motion parameters between each volumeand taking the population average. This average “intra-TR”motion was: 0.07 ± 0.02 mm translation and 0.07 ± 0.03◦ rota-tion. For visualization of activation maps, voxelwise t-scoreswere calculated and thresholded at t = 2.3 after applying anisotropic Gaussian smoothing filter (SD = 0.65 voxels) for milddenoising.
CORTICAL DEPTH BINSFor detailed analysis of the signal at different cortical depths, thestructural data were segmented using Freesurfer (Dale et al., 1999;Fischl et al., 1999). The tissue classification was used to extractprofiles perpendicular to the cortical surface from white matter,through gray matter and to the pial surface, using the proce-dure described by Koopmans et al. (2011). Voxels experiencingsignificant changes in blood flow between the “OFF” and “ON”conditions were identified on the basis of the activation inducedphase-changes in the first S1 echo and removed from further anal-ysis. For one subject the phase images were not suitable for bloodflow masking and the profile data were excluded from furtheranalysis. Residual small-scale coregistration errors between thestructural and functional scans for each subject were taken intoaccount by realigning the sampled through-cortical profiles witheach other. For each profile the position of the maximum gradientof the S2 signal (corresponding to the gray matter—CSF bound-ary) was detected and for all profiles these points were aligned.Only profiles were included for which such a gradient peak wasdetected less than 10% away from the original position as definedby the Freesurfer segmentation. This differs from the procedure in(Koopmans et al., 2011) where two edges in the functional profileswere detectable and both alignment and scaling were performed.Cortical profiles (N = 1082 ± 506, mean ± SD) were successfullyextracted from seven subjects. Since the anatomical informationavailable in the nb-SSFP images allowed reliable detection of onlythe CSF-GM boundary on individual profiles, we could not estab-lish sufficient accuracy of the profile alignment to analyse the dataon a full layer-specific level. High quality profiles for laminar anal-ysis that we have previously demonstrated (Koopmans et al., 2010,2011) rely on the accurate detection of both the CSF-GM bound-ary and the GM-WM boundary in order to realign and rescale theprofiles. The residual spatial broadening of profiles in the currentdata is expected to increase gradually from the CSF-GM bound-ary toward the GM-WM boundary. A worst-case estimate of thewidth of this broadening can be found from the variation in cor-tical thickness within V1. From our own freesurfer data this wasestimated to around 0.6 mm or 30% of the average V1 corticalthickness. Hence all further analysis on the data was performedafter classifying the profiles into four bins; deep GM, middle GM,upper GM, and pial surface.
SIGNAL CHANGESThe signal changes for each echo and subject were calculatedusing the signal intensity averaged across the activated state “ON”and resting state “OFF” volumes, both in absolute terms:
�S = SOn − SOff (1)
and in percentage of the “OFF” condition signal in each bin:
�S = 100∗ [SOn − SOff
]/SOff . (2)
This is done to illustrate the differences between these two waysof stating the BOLD signal amplitude. In simulations, the rela-tive (or percentage) BOLD signal is usually used, while in thecontext of comparing (and possibly summing) the BOLD sig-nal amplitude from different tissues and compartments in vivo,the absolute signal change in each compartment is more rele-vant. Also, depending on the noise characteristics of the imagedata, the relative or absolute signal change correlates best with thestatistical value for the activation.
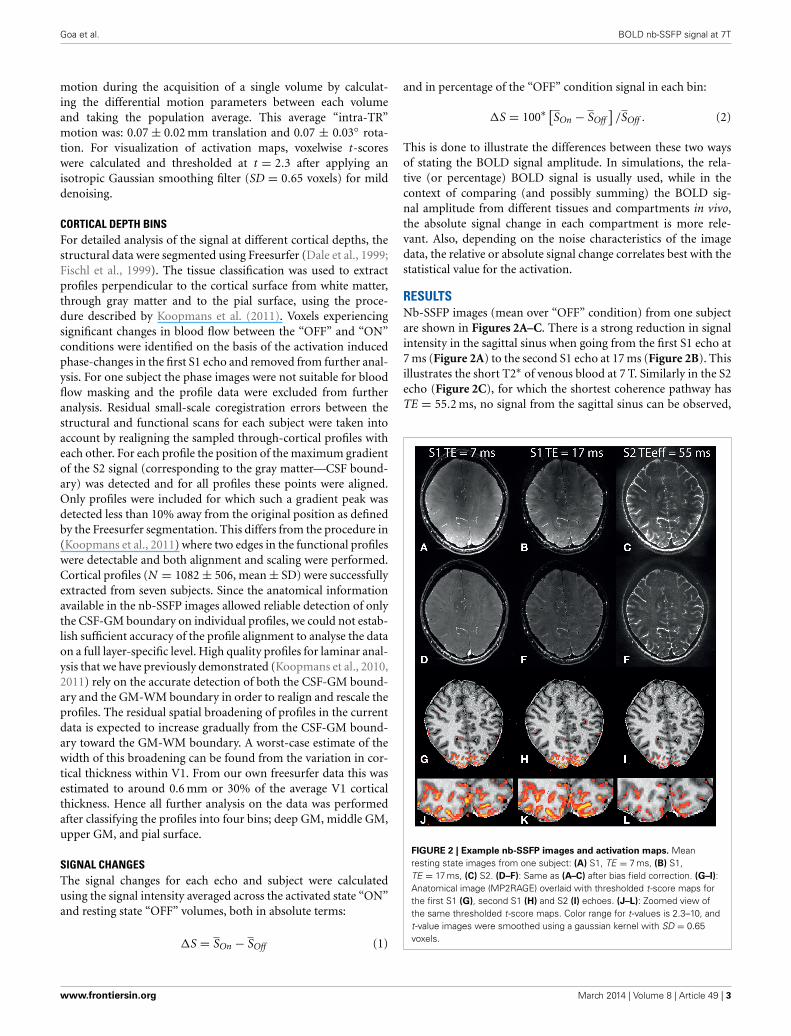
RESULTSNb-SSFP images (mean over “OFF” condition) from one subjectare shown in Figures 2A–C. There is a strong reduction in signalintensity in the sagittal sinus when going from the first S1 echo at7 ms (Figure 2A) to the second S1 echo at 17 ms (Figure 2B). Thisillustrates the short T2∗ of venous blood at 7 T. Similarly in the S2echo (Figure 2C), for which the shortest coherence pathway hasTE = 55.2 ms, no signal from the sagittal sinus can be observed,
FIGURE 2 | Example nb-SSFP images and activation maps. Meanresting state images from one subject: (A) S1, TE = 7 ms, (B) S1,TE = 17 ms, (C) S2. (D–F): Same as (A–C) after bias field correction. (G–I):Anatomical image (MP2RAGE) overlaid with thresholded t-score maps forthe first S1 (G), second S1 (H) and S2 (I) echoes. (J–L): Zoomed view ofthe same thresholded t-score maps. Color range for t-values is 2.3–10, andt-value images were smoothed using a gaussian kernel with SD = 0.65voxels.
www.frontiersin.org March 2014 | Volume 8 | Article 49 | 3
Goa et al. BOLD nb-SSFP signal at 7T
while CSF with its long T2 is still bright. For better visibility, theintensity in the S2 image has been scaled up by a factor of 3 rela-tive to the two S1 echoes due to the much lower S2 signal intensity.Bias field corrected images are shown in Figures 2D–F, whichcompensate for the effects of B1-transmission inhomogeneity atthe center of the brain, and the fall-off in receiver sensitivity withdistance from the occipital coil.
Smoothed and thresholded t-score maps (t = 2.3) are shownoverlaid on the coregistered T1-weighted images in Figures 2G–L.Significantly activated voxels are observed for all three echoes, andwith a similar activation pattern. In general the t-values are higherfor S1 compared to S2, and the highest t-values are observed inthe long –TE S1 echo.
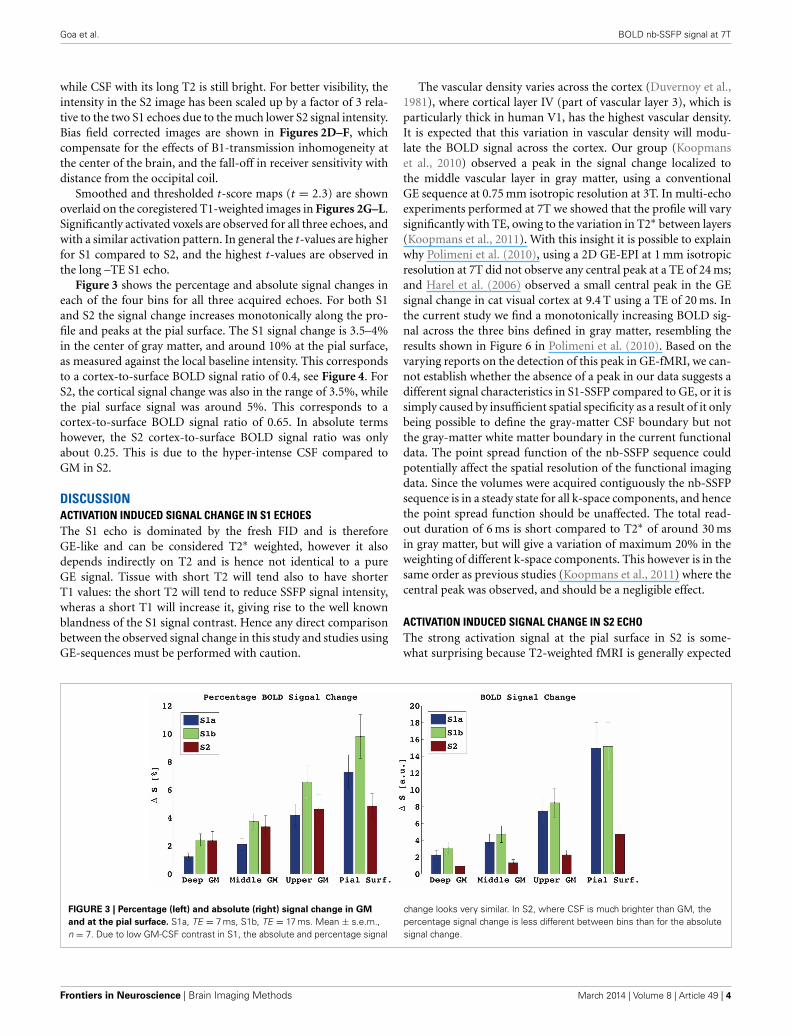
Figure 3 shows the percentage and absolute signal changes ineach of the four bins for all three acquired echoes. For both S1and S2 the signal change increases monotonically along the pro-file and peaks at the pial surface. The S1 signal change is 3.5–4%in the center of gray matter, and around 10% at the pial surface,as measured against the local baseline intensity. This correspondsto a cortex-to-surface BOLD signal ratio of 0.4, see Figure 4. ForS2, the cortical signal change was also in the range of 3.5%, whilethe pial surface signal was around 5%. This corresponds to acortex-to-surface BOLD signal ratio of 0.65. In absolute termshowever, the S2 cortex-to-surface BOLD signal ratio was onlyabout 0.25. This is due to the hyper-intense CSF compared toGM in S2.
DISCUSSIONACTIVATION INDUCED SIGNAL CHANGE IN S1 ECHOESThe S1 echo is dominated by the fresh FID and is thereforeGE-like and can be considered T2∗ weighted, however it alsodepends indirectly on T2 and is hence not identical to a pureGE signal. Tissue with short T2 will tend also to have shorterT1 values: the short T2 will tend to reduce SSFP signal intensity,wheras a short T1 will increase it, giving rise to the well knownblandness of the S1 signal contrast. Hence any direct comparisonbetween the observed signal change in this study and studies usingGE-sequences must be performed with caution.
The vascular density varies across the cortex (Duvernoy et al.,1981), where cortical layer IV (part of vascular layer 3), which isparticularly thick in human V1, has the highest vascular density.It is expected that this variation in vascular density will modu-late the BOLD signal across the cortex. Our group (Koopmanset al., 2010) observed a peak in the signal change localized tothe middle vascular layer in gray matter, using a conventionalGE sequence at 0.75 mm isotropic resolution at 3T. In multi-echoexperiments performed at 7T we showed that the profile will varysignificantly with TE, owing to the variation in T2∗ between layers(Koopmans et al., 2011). With this insight it is possible to explainwhy Polimeni et al. (2010), using a 2D GE-EPI at 1 mm isotropicresolution at 7T did not observe any central peak at a TE of 24 ms;and Harel et al. (2006) observed a small central peak in the GEsignal change in cat visual cortex at 9.4 T using a TE of 20 ms. Inthe current study we find a monotonically increasing BOLD sig-nal across the three bins defined in gray matter, resembling theresults shown in Figure 6 in Polimeni et al. (2010). Based on thevarying reports on the detection of this peak in GE-fMRI, we can-not establish whether the absence of a peak in our data suggests adifferent signal characteristics in S1-SSFP compared to GE, or it issimply caused by insufficient spatial specificity as a result of it onlybeing possible to define the gray-matter CSF boundary but notthe gray-matter white matter boundary in the current functionaldata. The point spread function of the nb-SSFP sequence couldpotentially affect the spatial resolution of the functional imagingdata. Since the volumes were acquired contiguously the nb-SSFPsequence is in a steady state for all k-space components, and hencethe point spread function should be unaffected. The total read-out duration of 6 ms is short compared to T2∗ of around 30 msin gray matter, but will give a variation of maximum 20% in theweighting of different k-space components. This however is in thesame order as previous studies (Koopmans et al., 2011) where thecentral peak was observed, and should be a negligible effect.
ACTIVATION INDUCED SIGNAL CHANGE IN S2 ECHOThe strong activation signal at the pial surface in S2 is some-what surprising because T2-weighted fMRI is generally expected
FIGURE 3 | Percentage (left) and absolute (right) signal change in GM
and at the pial surface. S1a, TE = 7 ms, S1b, TE = 17 ms. Mean ± s.e.m.,n = 7. Due to low GM-CSF contrast in S1, the absolute and percentage signal
change looks very similar. In S2, where CSF is much brighter than GM, thepercentage signal change is less different between bins than for the absolutesignal change.
Frontiers in Neuroscience | Brain Imaging Methods March 2014 | Volume 8 | Article 49 | 4

Goa et al. BOLD nb-SSFP signal at 7T
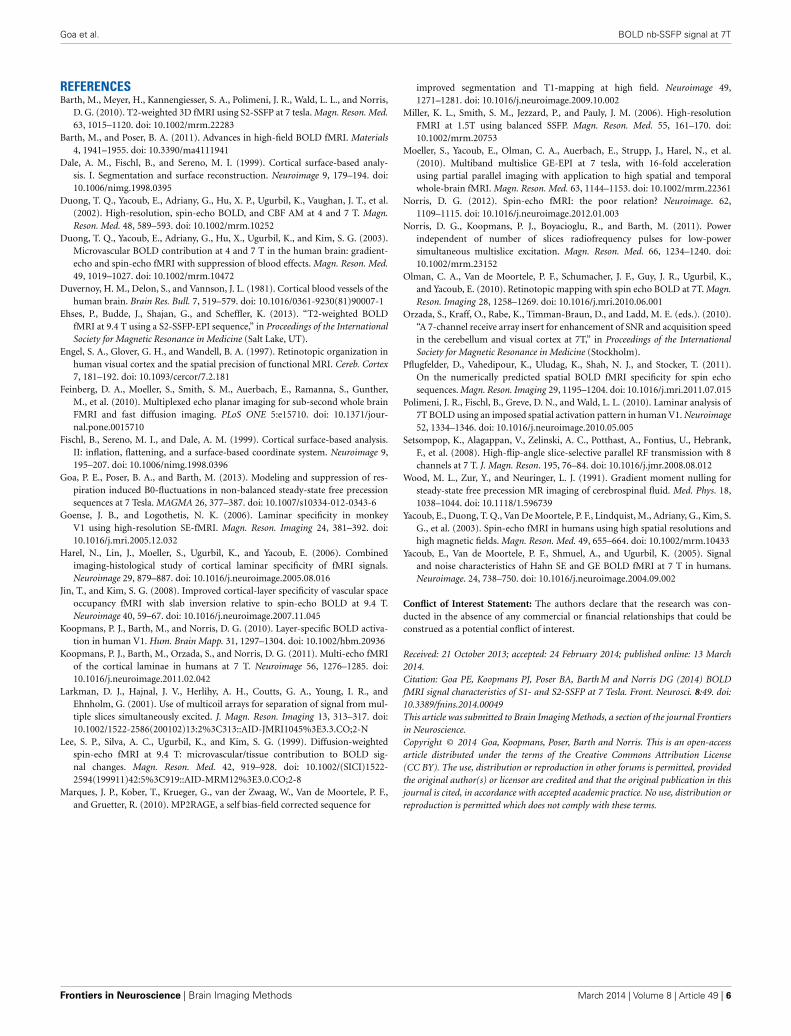
FIGURE 4 | Activation induced signal change in GM vs. at the Pial surface. The ratio of the absolute signal change in the cortex vs. at the pial surface isvery similar for S1 and S2, contrary to what is expected from a T2-weighted vs. a T2∗-weighted signal.
to be less sensitive to the contribution from large veins, sincethe static dephasing surrounding them should no longer con-tribute to the contrast. However, recent simulations suggest thatthe contribution from pial vessels embedded in CSF is less sup-pressed in SE-fMRI at 7 T than previously believed (Pflugfelderet al., 2011). A pial surface peak has previously been observedin SE-fMRI at high field strength. Goense et al (Goense andLogothetis, 2006) found a surface peak in monkey V1 at 4.7 T.There, the amplitude of the peak varied with the duration of theEPI readout, strongly suggesting the surface peak was caused bythe T2∗-weighting induced by the finite EPI-readout duration inSE-EPI and not by T2 changes. At short EPI readouts of 7.7 ms thesurface peak disappeared. Harel et al. (2006) observed a surfacepeak in cat visual cortex at 9.4 T with an EPI readout of 22.4 ms,comparable to the results for the same EPI readout duration in(Goense and Logothetis, 2006). The work by Jin and Kim (2008),in contrast reports a flat SE-EPI signal change through all layersof the cortex, although on the basis of known vascular densityprofiles (Duvernoy et al., 1981) and SE contrast mechanisms, apeak should be expected at vascular layer 3. In our study the read-out duration of each echo is about 6 ms, which is short comparedto the EPI readouts used in previous studies. On the other handthe S2 echo is acquired asymmetrically, in the sense that the cen-ter of k-space is acquired 4 ms before the center of the refocusingS2 echo which forms at the center of the following RF pulse. Inaddition, the readout itself was asymmetric. These factors make adirect comparison to the centered EPI-readout used in the above-mentioned studies difficult. However, it is plausible that the pialsurface peak is at least partly due to residual T2∗ contrast causedby both the finite readout duration and its asymmetry.
The S2 SSFP signal differs from a conventional SE sequence interms of its summation of different signals. In particular, not onlythe “youngest” or shortest SE contributes to the signal, but olderand longer pathways of both spin echoes and stimulated echoesexist with additional time for diffusion to occur. In a recent paper(Goa et al., 2013) we estimate the effective lifetime of the S2 sig-nal to about 0.3 s for relaxation times and sequence parametersrelevant to the ones used in the current study. In addition, the dif-fusion coefficient in CSF is a factor 3–4 larger than in gray matter.Put together, this results in an effective diffusion length for the
S2 signal in CSF of about 70 µm. The diameter of the collectingveins toward and at the pial surface range from 20 to 200 µm(Duvernoy et al., 1981), so an extravascular contribution fromdynamic averaging around post-capillary vessels is very likely, inparticular for the “oldest” parts of the S2 SSFP signal.
STABILITY OF THE S2 SIGNALThe S2 signal is sensitive to the effects of flow and motion becausenumerous coherence pathways contribute to the signal, and thefirst moments of the read and slice gradients are non-zero. Thishas the consequence, that moving to a higher spatial resolution,as was done in this study, will increase this sensitivity. As werecorded both S1 and S2 signals in the current study it was notpossible here to desensitize the S2-signal to motion. In an experi-mental design in which only the S2 signal should be measured thiswould be possible using gradient moment nulling (Wood et al.,1991), if an EPI or spiral readout were to be used then this couldin theory also be motion nulled. In the current paper there was avery low level of subject motion, and the signal from larger vesselswas excluded from the analysis. Hence the general conclusions ofthis paper are largely unaffected by motion, however this could bean important consideration were S2 signals to be considered forroutine use in fMRI.
CONCLUSIONWe have demonstrated the capability of multi-echo nb-SSFP forhigh-resolution BOLD-fMRI at 7 T, with simultaneous acqui-sition of S1 and S2 signals. Activation induced signal changeswere observed in both the S1 and the S2 signals. The activationresults suggest that the functional contrast of S1 and S2 nb-SSFPare not equivalent to GE and SE, respectively. In particular, theratio between the BOLD signal originating from within the cor-tex vs. on the cortical surface, are almost the same for S1 andS2. This indicates that S2-SSFP might not be a suited alternativeto SE for fMRI at 7 T. A non-equivalence between the S2 signaland that of SE EPI was recently reported for 9.4 T in humans(Ehses et al., 2013). We attribute the large S2 BOLD signal atthe cortical surface to dynamic averaging around post capillaryvessels within the CSF due to long diffusion times for the S2signal.
www.frontiersin.org March 2014 | Volume 8 | Article 49 | 5
Goa et al. BOLD nb-SSFP signal at 7T
REFERENCESBarth, M., Meyer, H., Kannengiesser, S. A., Polimeni, J. R., Wald, L. L., and Norris,
D. G. (2010). T2-weighted 3D fMRI using S2-SSFP at 7 tesla. Magn. Reson. Med.63, 1015–1120. doi: 10.1002/mrm.22283
Barth, M., and Poser, B. A. (2011). Advances in high-field BOLD fMRI. Materials4, 1941–1955. doi: 10.3390/ma4111941
Dale, A. M., Fischl, B., and Sereno, M. I. (1999). Cortical surface-based analy-sis. I. Segmentation and surface reconstruction. Neuroimage 9, 179–194. doi:10.1006/nimg.1998.0395
Duong, T. Q., Yacoub, E., Adriany, G., Hu, X. P., Ugurbil, K., Vaughan, J. T., et al.(2002). High-resolution, spin-echo BOLD, and CBF AM at 4 and 7 T. Magn.Reson. Med. 48, 589–593. doi: 10.1002/mrm.10252
Duong, T. Q., Yacoub, E., Adriany, G., Hu, X., Ugurbil, K., and Kim, S. G. (2003).Microvascular BOLD contribution at 4 and 7 T in the human brain: gradient-echo and spin-echo fMRI with suppression of blood effects. Magn. Reson. Med.49, 1019–1027. doi: 10.1002/mrm.10472
Duvernoy, H. M., Delon, S., and Vannson, J. L. (1981). Cortical blood vessels of thehuman brain. Brain Res. Bull. 7, 519–579. doi: 10.1016/0361-9230(81)90007-1
Ehses, P., Budde, J., Shajan, G., and Scheffler, K. (2013). “T2-weighted BOLDfMRI at 9.4 T using a S2-SSFP-EPI sequence,” in Proceedings of the InternationalSociety for Magnetic Resonance in Medicine (Salt Lake, UT).
Engel, S. A., Glover, G. H., and Wandell, B. A. (1997). Retinotopic organization inhuman visual cortex and the spatial precision of functional MRI. Cereb. Cortex7, 181–192. doi: 10.1093/cercor/7.2.181
Feinberg, D. A., Moeller, S., Smith, S. M., Auerbach, E., Ramanna, S., Gunther,M., et al. (2010). Multiplexed echo planar imaging for sub-second whole brainFMRI and fast diffusion imaging. PLoS ONE 5:e15710. doi: 10.1371/jour-nal.pone.0015710
Fischl, B., Sereno, M. I., and Dale, A. M. (1999). Cortical surface-based analysis.II: inflation, flattening, and a surface-based coordinate system. Neuroimage 9,195–207. doi: 10.1006/nimg.1998.0396
Goa, P. E., Poser, B. A., and Barth, M. (2013). Modeling and suppression of res-piration induced B0-fluctuations in non-balanced steady-state free precessionsequences at 7 Tesla. MAGMA 26, 377–387. doi: 10.1007/s10334-012-0343-6
Goense, J. B., and Logothetis, N. K. (2006). Laminar specificity in monkeyV1 using high-resolution SE-fMRI. Magn. Reson. Imaging 24, 381–392. doi:10.1016/j.mri.2005.12.032
Harel, N., Lin, J., Moeller, S., Ugurbil, K., and Yacoub, E. (2006). Combinedimaging-histological study of cortical laminar specificity of fMRI signals.Neuroimage 29, 879–887. doi: 10.1016/j.neuroimage.2005.08.016
Jin, T., and Kim, S. G. (2008). Improved cortical-layer specificity of vascular spaceoccupancy fMRI with slab inversion relative to spin-echo BOLD at 9.4 T.Neuroimage 40, 59–67. doi: 10.1016/j.neuroimage.2007.11.045
Koopmans, P. J., Barth, M., and Norris, D. G. (2010). Layer-specific BOLD activa-tion in human V1. Hum. Brain Mapp. 31, 1297–1304. doi: 10.1002/hbm.20936
Koopmans, P. J., Barth, M., Orzada, S., and Norris, D. G. (2011). Multi-echo fMRIof the cortical laminae in humans at 7 T. Neuroimage 56, 1276–1285. doi:10.1016/j.neuroimage.2011.02.042
Larkman, D. J., Hajnal, J. V., Herlihy, A. H., Coutts, G. A., Young, I. R., andEhnholm, G. (2001). Use of multicoil arrays for separation of signal from mul-tiple slices simultaneously excited. J. Magn. Reson. Imaging 13, 313–317. doi:10.1002/1522-2586(200102)13:2%3C313::AID-JMRI1045%3E3.3.CO;2-N
Lee, S. P., Silva, A. C., Ugurbil, K., and Kim, S. G. (1999). Diffusion-weightedspin-echo fMRI at 9.4 T: microvascular/tissue contribution to BOLD sig-nal changes. Magn. Reson. Med. 42, 919–928. doi: 10.1002/(SICI)1522-2594(199911)42:5%3C919::AID-MRM12%3E3.0.CO;2-8
Marques, J. P., Kober, T., Krueger, G., van der Zwaag, W., Van de Moortele, P. F.,and Gruetter, R. (2010). MP2RAGE, a self bias-field corrected sequence for
improved segmentation and T1-mapping at high field. Neuroimage 49,1271–1281. doi: 10.1016/j.neuroimage.2009.10.002
Miller, K. L., Smith, S. M., Jezzard, P., and Pauly, J. M. (2006). High-resolutionFMRI at 1.5T using balanced SSFP. Magn. Reson. Med. 55, 161–170. doi:10.1002/mrm.20753
Moeller, S., Yacoub, E., Olman, C. A., Auerbach, E., Strupp, J., Harel, N., et al.(2010). Multiband multislice GE-EPI at 7 tesla, with 16-fold accelerationusing partial parallel imaging with application to high spatial and temporalwhole-brain fMRI. Magn. Reson. Med. 63, 1144–1153. doi: 10.1002/mrm.22361
Norris, D. G. (2012). Spin-echo fMRI: the poor relation? Neuroimage. 62,1109–1115. doi: 10.1016/j.neuroimage.2012.01.003
Norris, D. G., Koopmans, P. J., Boyacioglu, R., and Barth, M. (2011). Powerindependent of number of slices radiofrequency pulses for low-powersimultaneous multislice excitation. Magn. Reson. Med. 66, 1234–1240. doi:10.1002/mrm.23152
Olman, C. A., Van de Moortele, P. F., Schumacher, J. F., Guy, J. R., Ugurbil, K.,and Yacoub, E. (2010). Retinotopic mapping with spin echo BOLD at 7T. Magn.Reson. Imaging 28, 1258–1269. doi: 10.1016/j.mri.2010.06.001
Orzada, S., Kraff, O., Rabe, K., Timman-Braun, D., and Ladd, M. E. (eds.). (2010).“A 7-channel receive array insert for enhancement of SNR and acquisition speedin the cerebellum and visual cortex at 7T,” in Proceedings of the InternationalSociety for Magnetic Resonance in Medicine (Stockholm).
Pflugfelder, D., Vahedipour, K., Uludag, K., Shah, N. J., and Stocker, T. (2011).On the numerically predicted spatial BOLD fMRI specificity for spin echosequences. Magn. Reson. Imaging 29, 1195–1204. doi: 10.1016/j.mri.2011.07.015
Polimeni, J. R., Fischl, B., Greve, D. N., and Wald, L. L. (2010). Laminar analysis of7T BOLD using an imposed spatial activation pattern in human V1. Neuroimage52, 1334–1346. doi: 10.1016/j.neuroimage.2010.05.005
Setsompop, K., Alagappan, V., Zelinski, A. C., Potthast, A., Fontius, U., Hebrank,F., et al. (2008). High-flip-angle slice-selective parallel RF transmission with 8channels at 7 T. J. Magn. Reson. 195, 76–84. doi: 10.1016/j.jmr.2008.08.012
Wood, M. L., Zur, Y., and Neuringer, L. J. (1991). Gradient moment nulling forsteady-state free precession MR imaging of cerebrospinal fluid. Med. Phys. 18,1038–1044. doi: 10.1118/1.596739
Yacoub, E., Duong, T. Q., Van De Moortele, P. F., Lindquist, M., Adriany, G., Kim, S.G., et al. (2003). Spin-echo fMRI in humans using high spatial resolutions andhigh magnetic fields. Magn. Reson. Med. 49, 655–664. doi: 10.1002/mrm.10433
Yacoub, E., Van de Moortele, P. F., Shmuel, A., and Ugurbil, K. (2005). Signaland noise characteristics of Hahn SE and GE BOLD fMRI at 7 T in humans.Neuroimage. 24, 738–750. doi: 10.1016/j.neuroimage.2004.09.002
Conflict of Interest Statement: The authors declare that the research was con-ducted in the absence of any commercial or financial relationships that could beconstrued as a potential conflict of interest.
Received: 21 October 2013; accepted: 24 February 2014; published online: 13 March2014.Citation: Goa PE, Koopmans PJ, Poser BA, Barth M and Norris DG (2014) BOLDfMRI signal characteristics of S1- and S2-SSFP at 7 Tesla. Front. Neurosci. 8:49. doi:10.3389/fnins.2014.00049This article was submitted to Brain Imaging Methods, a section of the journal Frontiersin Neuroscience.Copyright © 2014 Goa, Koopmans, Poser, Barth and Norris. This is an open-accessarticle distributed under the terms of the Creative Commons Attribution License(CC BY). The use, distribution or reproduction in other forums is permitted, providedthe original author(s) or licensor are credited and that the original publication in thisjournal is cited, in accordance with accepted academic practice. No use, distribution orreproduction is permitted which does not comply with these terms.
Frontiers in Neuroscience | Brain Imaging Methods March 2014 | Volume 8 | Article 49 | 6
Related Documents