Marcel Dekker, Inc. New York • Basel TM Industrial Boilers and Heat Recovery Steam Generators Design, Applications, and Calculations V. Ganapathy ABCO Industries Abilene, Texas, U.S.A. Copyright © 2003 Marcel Dekker, Inc.

Welcome message from author
This document is posted to help you gain knowledge. Please leave a comment to let me know what you think about it! Share it to your friends and learn new things together.
Transcript

Marcel Dekker, Inc. New York • BaselTM
Industrial Boilers and Heat RecoverySteam GeneratorsDesign, Applications, and Calculations
V. GanapathyABCO IndustriesAbilene, Texas, U.S.A.
Copyright © 2003 Marcel Dekker, Inc.
ISBN: 0-8247-0814-8
This book is printed on acid-free paper.
Headquarters
Marcel Dekker, Inc.
270 Madison Avenue, New York, NY 10016
tel: 212-696-9000; fax: 212-685-4540
Eastern Hemisphere Distribution
Marcel Dekker, AG
Hutgasse 4, Postfach 812, CH-4001 Basel, Switzerland
tel: 41-61-260-6300; fax: 41-61-260-6333
World Wide Web
http:==www.dekker.com
The publisher offers discounts on this book when ordered in bulk quantities. For more infor-
mation, write to Special Sales=Professional Marketing at the headquarters address above.
Copyright # 2003 by Marcel Dekker, Inc. All Rights Reserved.
Neither this book nor any part may be reproduced or transmitted in any form or by any
means, electronic or mechanical, including photocopying, microfilming, and recording, or
by any information storage and retrieval system, without permission in writing from the
publisher.
Current printing (last digit):
10 9 8 7 6 5 4 3 2 1
PRINTED IN THE UNITED STATES OF AMERICA
Copyright © 2003 Marcel Dekker, Inc.

To all professionals involved in steam generation
and energy conservation.
Copyright © 2003 Marcel Dekker, Inc.

Preface
The role of boilers and heat recovery steam generators (HRSGs) in the industrial
economy has been profound. Boilers form the backbone of power plants,
cogeneration systems, and combined cycle plants. There are few process
plants, refineries, chemical plants, or electric utilities that do not have a steam
plant. Steam is the most convenient working fluid for industrial processing,
heating, chilling, and power generation applications. Fossil fuels will continue to
be the dominant energy providers for years to come.
This book is about steam generators, HRSGs, and related systems. There
are several excellent books on steam generation and boilers, and each has been
successful in emphasizing certain aspects of boilers and related topics such as
mechanical design details, metallurgy, corrosion, constructional aspects, main-
tenance, or operational issues. This book is aimed at providing a different
perspective on steam generators and is biased toward thermal and process
design aspects of package boilers and HRSGs. (The terms ‘‘waste heat boiler’’
and ‘‘HRSG’’ are used in the same context.) My emphasis on thermal engineering
aspects of steam generators reinforced by hundreds of worked-out real-life
examples pertaining to boilers, HRSGs, and related systems will be of interest
to engineers involved in a broad field of steam generator–related activities such as
consulting, design, performance evaluation, and operation.
Copyright © 2003 Marcel Dekker, Inc.
During the last three decades I have had the opportunity to design hundreds
of package boilers and several hundred waste heat boilers that are in operation in
the U.S. and abroad. Based on my experience in reviewing numerous specifica-
tions of boilers and HRSGs, I feel that consultants, plant engineers, contractors,
and decision makers involved in planning and developing steam plants often do
not appreciate some of the important and subtle aspects of design and perfor-
mance of steam generators.
� Many engineers still feel that by raising the exit gas temperature in boilers
with economizers, one can avoid acid dew point concerns. It is the feed water
temperature—not the gas temperature—that determines the tube wall
temperature (and hence the corrosion potential).
� Softened water is sometimes suggested for attemperation for steam tempera-
ture control, even though it will add solids to steam that can cause problems
such as deposition of solids in superheaters and steam turbines.
� To operate steam plants more efficiently, plant engineers should be able to
understand and appreciate the part load characteristics of boilers and HRSGs.
However while specifying boilers and HRSGs, often only the performance at
100% load is stressed.
� HRSG steam generation and temperature profiles cannot be arbitrarily arrived
at, as pinch and approach points determine this. For example, I have seen
several specifications call for a 300�F exit gas temperature from a single
pressure unfired gas turbine HRSG generating saturated steam at 600 psig
using feedwater at about 230�F. A simple analysis reveals that only about
340–350�F is thermodynamically feasible.
� Supplementary firing in gas turbine HRSGs is an efficient way to generate
steam compared with steam generation in a packaged boiler. The book explains
why this is so, with examples in Chapters 1 and 8. Cogeneration engineers can
make use of this information to minimize fuel costs in their plants.
� A few waste heat boiler specifications provide the flue gas flow in volumetric
units instead of mass units, leading to confusion. Lack of information on
molecular weight or gas pressure can lead to incorrect evaluation of density
and hence the mass flow. Also, volume of flue gas is often given in cfm (cubic
feet per minute) and one is not sure whether it is acfm (actual cubic feet per
minute) or scfm (standard cubic feet per minute). The difference in mass flow
can be significant depending on the basis.
� Although flue gas analysis affects gas specific heat, heat transfer, boiler duty,
and temperature profiles, these data are often not given in specifications for
waste heat boilers. For example, the ratio of specific heats of flue gases from
combustion of natural gas and fuel oil is about 3.5%, which is not insignif-
icant. This is due to the 18% volume of water vapor in natural gas products of
combustion versus 12% in fuel oil combustion products.
Copyright © 2003 Marcel Dekker, Inc.
� A few consultants select boilers and HRSGs based on surface area, although
it can vary significantly based on tube geometry or fin configuration. With
finned tubes, as can be seen from several examples in this book, the variation
in surface areas could be in the range of 200–300% for the same duty.
� Operating cost due to fuel consumption or gas pressure drop across heating
surfaces is often ignored by many consultants in their evaluation and only
initial costs are compared while purchasing steam generators or HRSGs,
resulting in a poor selection for the end user. A few plants are now realizing
that the items of steam plant equipment they purchased years ago based on low
initial costs are draining their cash reserves through costly fuel and electricity
bills and hence are scrambling to improve their design and performance.
� Many engineers are not aware of recent developments in oil- and gas-fired
packaged boilers and are still specifying boilers using refractory lined furnace
walls and floors!
� Plant engineers often assume that a boiler designed for 600 psig, for example,
can be operated at 200 psig and at the same capacity. The potential problems
associated with significant changes in steam pressure and specific volume in
boiler operation are discussed in Chapters 1 and 3.
� Condensing exchangers are being considered in boilers and HRSGs not only
for improvement in efficiency but also to recover and recycle the water in the
flue gases, which is a precious commodity in some places.
� Emission control methods such as flue gas recirculation increase the mass
flow of flue gases through the boiler; yet standard boilers are being selected
that can be expensive to operate in terms of fan power consumption. Many are
not aware of the advantages of custom-designed boilers, which can cost less
to own and operate.
� A few steam plant professionals do not appreciate the relation between boiler
efficiencies and higher and lower heating values, and thus specify values that
are either impossible to accomplish or too inefficient.
As a result of this ‘‘knowledge=information gap’’ in process engineering
aspects of boilers or HRSG, the end user may need to settle for a product with
substandard performance and high costs. This book elaborates on various design
and performance aspects of steam generators and heat recovery boilers so that
anyone involved with them will become more informed and ask the right
questions during the early stages of development of any steam plant project.
This will give the best chance of selecting the steam generator with the right
design and parameters. Even a tiny improvement in design, efficiency, operating
costs, or performance goes a long way in easing the ‘‘energy crunch.’’
The first four chapters describe some of the recent trends in power
generation systems, a few aspects of steam generator and HRSG design and
performance, and the impact of emissions on boilers in general. The remaining
Copyright © 2003 Marcel Dekker, Inc.

chapters deal with calculations that should be of interest to steam plant engineers.
I authored the Steam Plant Calculations Manual (Marcel Dekker, Inc.) several
years ago and had been thinking of adding more examples to this work for quite
some time. This book builds on that foundation.
Chapter 1 is an introductory discussion of power plants and describes some
of the recent developments in power systems such as the supercritical Rankine
cycle, the Kalina cycle, the Cheng cycle, and the integrated coal gasification and
combined cycle (IGCC) plant that is fast becoming a reality.
The second chapter describes heat recovery systems in various industries.
The role of the HRSG in sulfur recovery plants, sulfuric acid plants, gas turbine
plants, hydrogen plants, and incineration systems is elaborated.
Chapter 3, on steam generators, describes the latest trends in custom-
designed package boilers and the limitations of standard boilers developed
decades ago. Emission regulations have resulted in changes in boiler operating
parameters such as higher excess air and FGR rates that impact boiler perfor-
mance significantly. It should be noted that there can be several designs for a
boiler simply because the emission levels are different, although the steam
parameters may be identical. If an SCR system is required, it necessitates the
addition of a gas bypass system, adding to the cost and complexity of boiler
design. These are explained through quantitative and practical examples.
Chapter 4, on emissions, describes the various methods used in boilers and
HRSGs to limit NOx and CO and how their designs are impacted. For example,
the HRSG evaporator may have to be split up to accommodate the selective
catalytic reduction (SCR) system; gas bypass dampers may have to be used in
packaged steam generators to achieve the optimal gas temperature at the catalyst
for NOx conversion at various loads. Flue gas recirculation (FGR) adds to the fan
power consumption if the standard boiler is not redesigned. It may also affect the
boiler efficiency through higher exit gas temperature due to the larger mass flow
of flue gases. Other methods for emission control, such as steam injection and
burner modifications, are also addressed.
Chapters 4–8, which present calculations pertaining to various aspects of
boilers and HRSGs and their auxiliaries, elaborate on the second edition of the
Steam Plant Calculations book. Several examples have also been added. Chapter
5 deals with calculations such as conversion of mass to volumetric flowrates,
energy utilization from boiler blowdown, general ASME code calculations, and
life cycle costing methods. (ASME has been updating the allowable stress values
for several boiler materials and one should use the latest data.) Also provided are
ABMA and ASME guidelines on boiler water, for evaluating the blowdown or
estimating the steam for deaeration. Life cycle costing is explained through a few
examples.
Chapter 6 deals with combustion calculations, boiler efficiency, and
emission conversion calculations. Simplified combustion calculation procedures
Copyright © 2003 Marcel Dekker, Inc.

such as the MM Btu method are explained. Often boiler efficiency is cited on a
Higher Heating Value basis, while a few engineers use the Lower Heating Value
basis. The relation between the two is illustrated. The ASME PTC 4.1 method of
calculating heat losses for estimating boiler efficiency is elaborated, and simpli-
fied equations for boiler efficiency are presented. Examples illustrate the relation
between oxygen in turbine exhaust gases and fuel input. Correlations for dew
point of various acid vapors are given with examples.
Chapter 7 explains boiler circulation calculations in both fire tube and water
tube boilers. Fluid flow in blowoff and blowdown lines, which involve two-phase
flow calculations, can be estimated by using the procedures shown. The problem
of flow instability in boiling circuits is explained, along with measures to
minimize this concern, such as use of orifices at the inlet to the tubes.
Calculations involving orifices and safety valves should also be of interest to
plant engineers.
Chapter 8 on heat transfer has over 65 examples of sizing, off-design
performance calculations pertaining to boilers, superheaters, economizers,
HRSGs, and air heaters. Tube wall temperature calculations and calculations
with finned tubes for insulation performance will help engineers understand the
design concepts better and even question the boiler supplier. HRSG temperature
profiles are also explained, with methods described for evaluating off-design
HRSG performance.
The last chapter deals with pumps, fans, and turbines and examples show
the effect of a few important variables on their performance. The impact of air
density on boiler fan operation is illustrated, and the effect of elevation and
temperature on flow and head are explained. With flue gas recirculation being
used in almost all boilers, the effect of density on the volume is important to
understand. The effect of inlet air temperature on Brayton cycle efficiency is also
explained and plant engineers will appreciate the need for inlet air-cooling in
summer months in large gas turbine plants. The efficiency of cogeneration is
explained, as are also power output calculations using steam turbines.
A simple quiz is given at the end of the book. Its purpose is to recapitulate
important aspects of boiler and HRSG performance discussed in the book.
In sum, the book will be a valuable addition to anyone involved in steam
plants, cogeneration systems, or combined cycle plants. Many examples are based
on my personal experience and hence, the conclusions drawn do not reflect the
views of any organization. It is possible, due to lack of information on my part or
to the rapid developments in steam plant engineering and technology, that I have
expressed some views that may not be current or may be against the grain; if so, I
express my regrets. I would appreciate readers bringing these to my attention. The
calculations have been checked to the best of my ability; however if there are
errors, I apologize and would appreciate your feedback. It is my fervent hope that
Copyright © 2003 Marcel Dekker, Inc.

this book will be the constant companion of professionals involved in the steam
generation industry.
I would like to thank ABCO Industries for allowing me to reproduce
several of the drawings and photographs of boilers and HRSGs. I also thank other
sources that have provided me with information on recent developments on
various technologies.
V. Ganapathy
Copyright © 2003 Marcel Dekker, Inc.
Contents
Preface
1 Steam and Power Systems
2 Heat Recovery Boilers
3 Steam Generators
4 Emission Control in Boilers and HRSGs
5 Basic Steam Plant Calculations
6 Fuels, Combustion, and Efficiency of Boilers and Heaters
7 Fluid Flow, Valve Sizing, and Pressure Drop Calculations
8 Heat Transfer Equipment Design and Performance
9 Fans, Pumps, and Steam Turbines
Copyright © 2003 Marcel Dekker, Inc.

Appendix 1: A Quiz on Boilers and HRSGs
Appendix 2: Conversion Factors
Appendix 3: Tables
Glossary
Bibliography
Copyright © 2003 Marcel Dekker, Inc.

1
Steam and Power Systems
INTRODUCTION
Basic human needs can be met only through industrial growth, which depends to
a great extent on energy supply. The large increase in population during the last
few decades and the spurt in industrial growth have placed tremendous burden on
the electrical utility industry and process plants producing chemicals, fertilizers,
petrochemicals, and other essential commodities, resulting in the need for
additional capacity in the areas of power and steam generation throughout the
world. Steam is used in nearly every industry, and it is well known that steam
generators and heat recovery boilers are vital to power and process plants. It is no
wonder that with rising fuel and energy costs engineers in these fields are working
on innovative methods to generate electricity, improve energy utilization in these
plants, recover energy efficiently from various waste gas sources, and simulta-
neously minimize the impact these processes have on environmental pollution
and the emission of harmful gases to the atmosphere. This chapter briefly
addresses the status of various power generation systems and the role played
by steam generators and heat recovery equipment.
Several technologies are available for power generation such as gas turbine
based combined cycles, nuclear power, wind energy, tidal waves, and fuel cells, to
mention a few. Figure 1.1 shows the efficiency of a few types of power systems.
Copyright © 2003 Marcel Dekker, Inc.
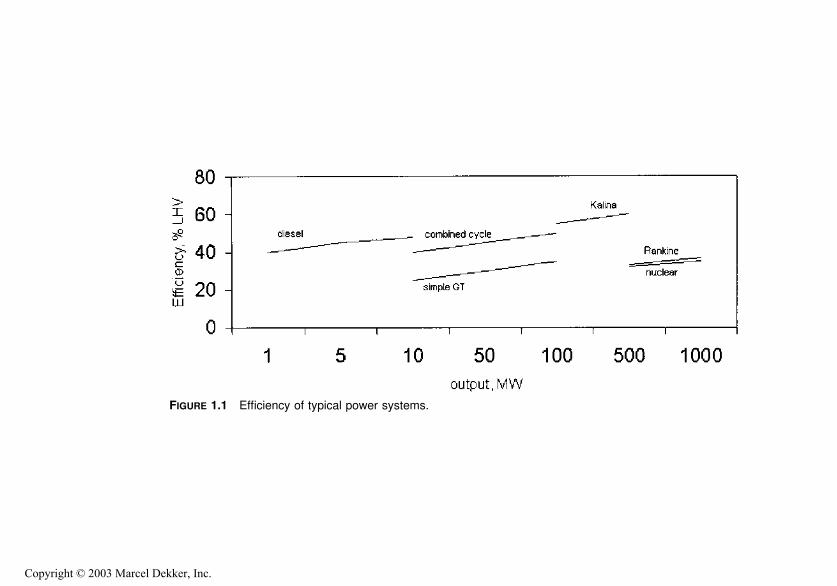
FIGURE 1.1 Efficiency of typical power systems.
Copyright © 2003 Marcel Dekker, Inc.

About 40% of the world’s power is, however, generated by using boilers fired with
pulverized coal and steam turbines operating on the Rankine cycle. Large
pulverized coal fired and circulating fluidized bed supercritical pressure units
are being considered as candidates for power plant capacity addition, though
several issues such as solid particle erosion, metallurgy of pressure parts,
maintenance costs, and start-up concerns remain. It may be noted that in
Europe and Japan supercritical units are more widespread than in the United
States.
In spite of escalation in natural gas prices, gas turbine capacity has
increased by leaps and bounds during the last decade. Today’s combined cycle
plants are rated in thousands of megawatts, unlike similar plants decades ago
when 100MW was considered a very high rating. Steam pressure and tempera-
ture ratings for heat recovery steam generators (HRSGs) in combined cycle plants
have also increased, from 1000 psig a decade or so ago to about 2400 psig.
Reheaters, which improve the Rankine cycle efficiency and are generally used in
utility boilers, are also finding a place in HRSGs. Complex multipressure,
multimodule HRSGs are being engineered and built to maximize energy
recovery.
Repowering existing steam power plants typically 30 years or older with
modern gas turbines brings new useful life in addition to offering a few
advantages such as improved efficiency and lower emissions. A few variations
of this concept are shown in Fig. 1.2. In boiler repowering, the gas turbine
exhaust is used as combustion air for the boiler. Owing to the size of such plants,
solid fuel firing may be feasible and perhaps economical. Another option is to
increase the power output of the steam turbine by not using the extraction steam
for feedwater heating, which is performed by the turbine exhaust gases in the
HRSG. The exhaust gases can also generate steam with parameters in the HRSG
similar to these of the original coal-fired boiler plant, which can be taken out of
service. Because gas turbines typically use premium fuels, the emissions of NOx,
CO2, and SOx are also reduced in these repowering projects. It may be noted that
the various HRSG options discussed above are challenging to design and build,
because numerous parameters are site-specific and cost factors vary from case to
case.
Significant advances have been made in research and development of
alternative methods of coal utilization such as fluidized bed combustion and
gasification; integrated coal gasification and combined cycle (IGCC) plants are
not research projects any longer. A few commercial plants are in operation
throughout the world. Figure 1.3 shows a typical plant layout.
Research into working fluids for power generation have also led to new
concepts and efficient power generation systems such as the Kalina cycle (Fig.
1.4), which uses a mixture of ammonia and water as the working fluid in Rankine
cycle mode. The use of organic vapor cycles in low temperature energy recovery
Copyright © 2003 Marcel Dekker, Inc.
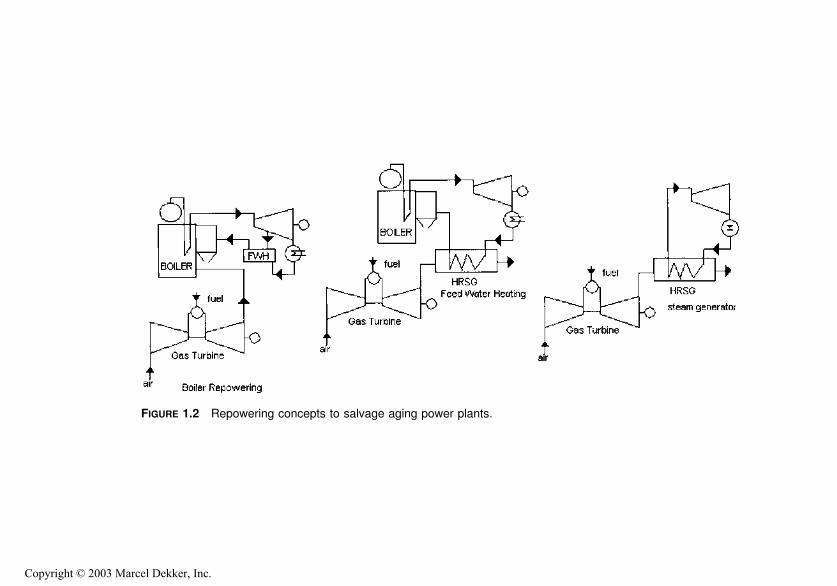
FIGURE 1.2 Repowering concepts to salvage aging power plants.
Copyright © 2003 Marcel Dekker, Inc.

applications is also widespread. Gas turbine technology is being continuously
improved to develop advanced cycles such as the intercooled aero derivative
(ICAD), humid air turbine (HAT), and Cheng cycle. We have come a long way
from the 35% efficiency level of the Rankine cycle to the 60% level in combined
cycle plants.
Heat sources in industrial processes can be at very high temperatures,
1000–2500�F, or very low, on the order of 250–500�F, and applications have beendeveloped to recover as much energy from these effluents as possible in order to
improve the overall energy utilization. Heat recovery steam generators form an
important part of these systems. (Note: The terms waste heat boiler, heat recovery
boiler, and heat recovery steam generator are used synonymously). Waste gas
streams sometimes heat industrial heat transfer fluids, but in nearly 90% of the
applications steam is generated, that is used for either process or power generation
via steam turbines.
Condensing heat exchangers are used in boilers and in HRSGs when
economically viable to recover a significant amount of energy from flue gases that
are often below the acid and water dew points. The condensing water removes
acid vapors present in the gas stream along with particulates if any. In certain
process plants, energy recovery and pollution control go hand in hand for
economic and environmental reasons. Though expensive, condensing economi-
zers, in addition to improving the efficiency of the plant, help conserve water, a
precious commodity in some areas. See Chapter 3 for a discussion on condensing
exchangers.
FIGURE 1.3 Wabash integrated coal gasification and combined cycle plant.
Copyright © 2003 Marcel Dekker, Inc.

Today if we walk into any chemical plant, refinery, cogeneration plant,
combined cycle plant, or conventional power plant, we can see the ubiquitous
steam generators and heat recovery boilers, because steam is needed virtually
everywhere for process and power generation. Boiler and HRSG designs are
being continuously improved to meet the challenges of higher efficiency and
lower emissions and to handle special requirements if any. For example, one of
the requirements for auxiliary boilers in large combined cycle plants is quick
start-up; packaged boilers generating saturated or superheated steam are required
to come up from hot standby condition to 100% capacity in a few minutes if the
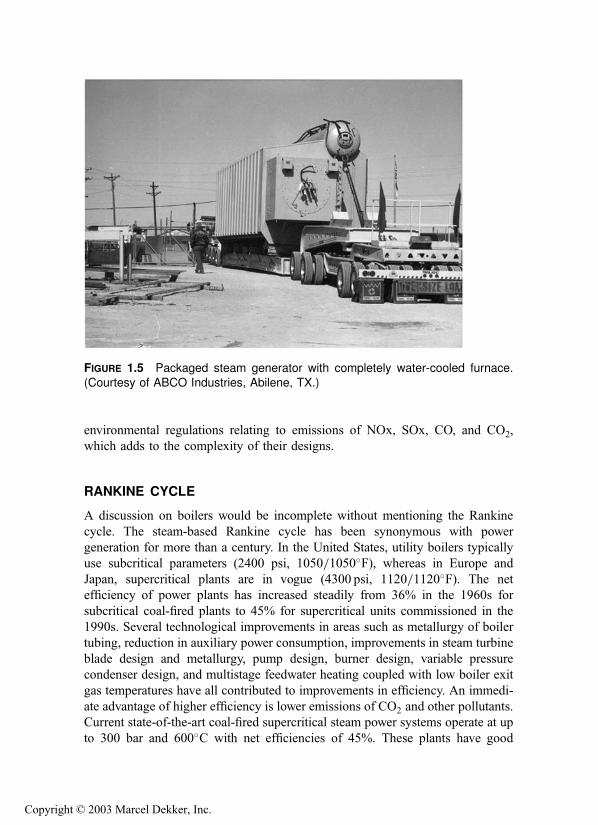
gas turbine trips. Packaged boilers with completely water-cooled furnaces (Fig.
1.5) are better suited for this application than refractory-lined boilers. In addition
to generating power or steam efficiently, today’s plants must also meet strict
FIGURE 1.4 Kalina cycle scheme at Canoga Park, CA. 1, HRVG; 2, turbine; 3,flash tank; 4, final preheater; 5, HP preheater; 6, second recuperator; 7, vaporizer;8, HP preheater; 9, first recuperator; 10, LP preheater; 11, HP condenser; 12, LP
condenser; 13, cooling water; t, throttling device; p, pump.
Copyright © 2003 Marcel Dekker, Inc.
environmental regulations relating to emissions of NOx, SOx, CO, and CO2,
which adds to the complexity of their designs.
RANKINE CYCLE
A discussion on boilers would be incomplete without mentioning the Rankine
cycle. The steam-based Rankine cycle has been synonymous with power
generation for more than a century. In the United States, utility boilers typically
use subcritical parameters (2400 psi, 1050=1050�F), whereas in Europe and
Japan, supercritical plants are in vogue (4300 psi, 1120=1120�F). The net
efficiency of power plants has increased steadily from 36% in the 1960s for
subcritical coal-fired plants to 45% for supercritical units commissioned in the
1990s. Several technological improvements in areas such as metallurgy of boiler
tubing, reduction in auxiliary power consumption, improvements in steam turbine
blade design and metallurgy, pump design, burner design, variable pressure
condenser design, and multistage feedwater heating coupled with low boiler exit
gas temperatures have all contributed to improvements in efficiency. An immedi-
ate advantage of higher efficiency is lower emissions of CO2 and other pollutants.
Current state-of-the-art coal-fired supercritical steam power systems operate at up
to 300 bar and 600�C with net efficiencies of 45%. These plants have good
FIGURE 1.5 Packaged steam generator with completely water-cooled furnace.
(Courtesy of ABCO Industries, Abilene, TX.)
Copyright © 2003 Marcel Dekker, Inc.

efficiencies even at partial load compared to subcritical units, and plant costs are
comparable to those of subcritical units. At 75% load, for example, the efficiency
reduction in a supercritical unit is about 2% compared to 4% for subcritical units.
At 50% load, the reduction is 5.5–8% for supercritical versus 10–11% for
subcritical. These units are of once-through design. Cycle efficiencies of 36%
in the 1960s (160 bar, 540=540�C) rose to about 40% in 1985 and to 43–45% in
1990. These gains have been made through [1–3]
Increases in the main and reheat steam temperatures and main steam
pressure, including transitions to supercritical conditions
Changes in cycle configuration, including increases in the number of reheat
stages and the number of feedwater heaters
Changes in condenser pressure and lowering of the exit gas temperature
from the boiler (105–115�C)Reductions in auxiliary power consumption through design and develop-
ment
Improvements in the performance of various types of equipment such as
turbines and pumps, as mentioned above
One of the concerns with the steam-based Rankine cycle is that a higher
steam temperature is required with higher steam pressure to minimize the
moisture in the steam after expansion. Moisture impacts the turbine performance
negatively through wear, deposit formation, and possible blockage of the steam
path. As can be seen in Fig. 1.6, a higher steam pressure for the same temperature
FIGURE 1.6 T–S diagram showing expansion of steam.
Copyright © 2003 Marcel Dekker, Inc.

results in higher moisture after expansion. Hence steam temperatures have been
increasing along with pressures, adding to metallurgical concerns. This implies a
need for higher boiler tube wall thickness and materials with higher stress values
at high temperatures. Multistage reheating minimizes the moisture concern after
expansion; however, this adds to the complexity of the boiler and HRSG design.
Also with HRSGs, the steam-based Rankine cycle limits the effectiveness of heat
recovery, because steam boils at constant temperature and significant energy is
lost, which brings us to the Kalina cycle.
KALINA CYCLE
A recent development in power generation technology is the Kalina cycle, which
basically follows the Rankine cycle concept except that the working fluid is 70%
ammonia–water mixture. It has the potential to be 10–15% more efficient than the
Rankine cycle and uses conventional materials of construction, making the
technology viable. Figure 1.4 shows the scheme of the demonstration plant at
Canoga Park, CA, which has been in operation since 1995 [4–6]. In the typical
steam–water-based Rankine cycle, the loss associated with the working fluid in
the condensing system is large; also, the heat is added for the most part at
constant temperature; hence there are large energy losses, resulting in low cycle
efficiency.
In the Kalina cycle, heat is added and rejected at varying temperatures
(Fig. 1.7a), which reduces these losses. The steam–water mixture boils or
condenses at constant temperature, whereas the ammonia–water mixture has
varying boiling and condensing temperatures and thus closely matches the
temperature profiles of the heat sources. The distillation condensation subsystem
(DCSS) changes the concentration of the working fluid, enabling condensation of
the vapor from the turbine to occur at a lower pressure. The DCSS brings the
mixture concentration back to the 70% level at the desired high inlet pressure
before entering the heat recovery vapor generator (HRVG). The HRVG is similar
in design to an HRSG.
The ammonia–water mixtures have many basic features unlike those of
either ammonia or water, which can be used to advantage:
1. The ammonia–water mixture has a varying boiling and condensing
temperature, which enables the fluid to extract more energy from the
hot stream by matching the hot source better than a system with a
constant boiling and condensing temperature. This results in significant
energy recovery from hot gas streams, particularly those at low
temperatures, such as the geothermal heat source of Fig. 1.7b. By
changing the working fluid concentration from 70% to about 45%,
condensation of the vapor is enabled at a lower pressure, thus
Copyright © 2003 Marcel Dekker, Inc.

recovering additional energy from the vapor in the turbine with lower
energy losses at the condenser system. As can be seen in Fig. 1.7b, the
energy recovered with a steam system is very low, whereas the
ammonia–water mixture is able to recover a large fraction of the
available energy from the hot exhaust gases. A steam plant would have
to use a multiple-pressure system to recover the same fraction of
energy, but this increases the complexity and cost of the steam plant.
The lower the temperature of the gas entering the boiler, the better is
the Kalina system compared to the steam system.
2. The thermophysical properties of an ammonia–water mixture can be
altered by changing the ammonia concentration. Thus, even at high
ambient temperatures, the cooling system can be effective, unlike in a
steam Rankine system, where the condenser efficiency drops off as the
cooling water temperature or ambient temperature increases. The
Kalina cycle can also generate more power at lower cooling water
temperatures than a steam Rankine cycle.
FIGURE 1.7 (a) Cycle diagram: Kalina vs. steam Rankine systems. (b) Tempera-
ture profiles of (left) Kalina and (right) steam heat recovery systems.
Copyright © 2003 Marcel Dekker, Inc.
3. The ammonia–water mixture has thermophysical properties that cause
mixed fluid temperatures to change without a change in heat content.
The temperature of water or ammonia does not change without a
change in energy.
4. Water freezes at 32�F, whereas pure ammonia freezes at �108�F.Ammonia–water solutions have very low freezing temperatures. Hence
at low ambient temperatures, the Kalina plant can generate more power
without raising concerns about freezing.
5. The condensing pressure of an ammonia–water mixture is high, on the
order of 2 bar compared to 0.1 bar in a steam Rankine system, resulting
in lower specific volumes of the mixture at the turbine exhaust and
consequently smaller turbine blades. The expansion ratio in the turbine
is about 10 times smaller. This reduces the cost of the turbine
condenser system. With steam systems, the condenser pressure is
already at a low value, on the order of 1 psia; hence further lowering
would be expensive and not worth the cost.
6. The losses associated with the cooling system are smaller due to the
lower condensing duty, and hence the cooling system components can
be smaller and the environmental impact less.
Example of a Kalina System
A 3MW plant has been in operation in California for more than a decade. In this
plant, 31,450 lb=h of ammonia vapor enters the turbine at 1600 psia, 960�F and
exhausts at 21 psia. The ammonia concentration varies throughout the system.
The main working fluid in the HRVG is at 70% concentration, whereas at the
condenser it is at 42%. The leaner fluid has a lower vapor pressure, which allows
for additional turbine expansion and greater work output. The ability to vary this
concentration enables the performance to be varied and improved irrespective of
the cooling water temperature.
Following the expansion in the turbine, the vapor is at too low a pressure to
be completely condensed at the available coolant temperature. Increasing the
pressure would increase the temperature and hence reduce the power output. Here
is where the DCSS comes in. The DCSS enables condensing to be achieved in
two stages, first forming an intermediate mixture leaner than 70% and condensing
it, then pumping the intermediate mixture to higher pressure, reforming the
working mixture, and condensing it as shown in Fig. 1.4. In the process of
reforming the mixture (back to 70%), additional energy is recovered from the
exhaust stream, which increases the power output. Calculations show that the
power output can be increased by 10–15% in the DCSS compared to the Rankine
system based on a steam–water mixture.
Copyright © 2003 Marcel Dekker, Inc.

The HRVG for the Kalina cycle is a simple once-through steam generator
with an inlet for the 70% ammonia liquid mixture, which is converted into vapor
at the other end. The vapor-side pressure drop is large, on the order of hundreds
of pounds per square inch due to the two-phase boiling process. Conventional
materials such as carbon and alloy steels are adequate for the HRVG components.
Studies have been made on large combined cycle plants using the Kalina
cycle concept. Using an ABB 13E gas turbine, 227MW can be generated at a
heat rate of 6460 Btu=kWh (52.8%). This system produces an additional
12.1MW compared to a two-pressure steam bottoming cycle. Though the cost
details are not made available, it is felt that they are comparable on the basis of
dollars per kilowatt.
Several variations of the Kalina cycle have been studied. One of the options
for power generation cycles is shown in Fig. 1.8. It employs a reheat turbine. A
cooling stage is included between the high pressure and intermediate turbines.
First the vapor is superheated in the HRVG and expanded in the high pressure
stage. Then it is reheated in the HRVG and expanded in the intermediate stage to
generate more power. At this point the superheat remaining in the vapor is
removed to vaporize a portion of the working fluid, which has been preheated in
the economizer section. This additional vapor is then combined with the vapor
generated in the HRVG and then superheated. The cooled vapor is then expanded
in the low pressure stage. These heat exchanges enable the working fluid to
recover more energy from the exhaust gas stream. A 4.5MW Kalina system is in
operation in Japan that uses energy recovered from a municipal incineration heat
recovery system, and a 2MW plant using geothermal energy is in operation in
FIGURE 1.8 Kalina system to improve energy recovery in a combined cycle plant.
Copyright © 2003 Marcel Dekker, Inc.

Iceland. It may be noted that as the temperature of the heat source is reduced, the
Kalina system offers more efficiency than a steam or organic vapor system.
ORGANIC RANKINE CYCLE
The Rankine cycle is a thermodynamic cycle used to generate electricity in many
power stations and is the practical approach to the Carnot cycle. Superheated
steam is generated in a boiler, then expanded in a steam turbine. The turbine
drives a generator to convert the work into electricity. The remaining steam is
then condensed and recycled as feedwater to the boiler. A disadvantage of using
the water–steam mixture is that superheated steam has to be generated; otherwise
the moisture content after expansion might be too high, which would erode the
turbine blades. Organic substances that can be used below a temperature of 400�Cdo not have to be overheated. For many organic compounds superheating is not
necessary, resulting in a more efficient cycle. In a heat recovery system, it may be
shown that if the degree of superheating is reduced, more steam can be generated
and hence more energy can be recovered from the heat source as shown in
Q8.36.* The working fluid superheats as the pressure is reduced, unlike steam,
which becomes wet during the expansion process. Organic fluids also have low
freezing points and hence even at low temperatures there is no freezing. The ratio
of latent heat to sensible heat allows for greater heat recovery than in steam
systems.
An Organic Rankine Cycle (ORC) can make use of low temperature waste
heat such as geothermal heat to generate electricity. At these low temperatures a
steam cycle would be inefficient, because of the enormous volume of low
pressure steam, which would require very voluminous and costly piping resulting
in inefficient plants. Small-scale ORCs have been used commercially or as pilot
plants in the last two decades. Several organic compounds have been used in
ORCs (e.g., CFCs, Freon, isopentane, or ammonia) to match the temperature of
the available waste heat. Waste heat temperatures can be as low as 70–80�C. Theefficiency of an ORC is estimated to be between 10% and 20%, depending on
temperature levels. To minimize costs and energy losses it is necessary to locate
an ORC near the heat source. It is also necessary to condense the working vapor;
therefore, a cooling medium should be available on site. These site characteristics
will limit the potential application. Condensing pressure is higher than atmo-
spheric, so there is no need for vacuum equipment. ORC is expensive on the basis
of cost per kilowatt-hour compared to other systems, but the main advantage is
that it can generate power from low temperature heat sources. ORC plants can
also be of large capacity. A 14 MW power plant using Flurinol 85 as the working
*Q8.36 refers to the Q and A section in Chapter 8. This nomenclature will be used throughout.
Copyright © 2003 Marcel Dekker, Inc.
fluid is in operation in Japan, using the energy recovered from the effluents of
a sintering plant. The low boiling point and low latent heat of this fluid compared
to steam help recover a significantly greater amount of energy from the hot
gases.
COMBINED CYCLE AND COGENERATION PLANTS
Gas turbine plants operate in both combined cycle and cogeneration mode (Fig.
1.9). Figure 1.10 shows the arrangement of an unfired HRSG used in such plants.
Large combined cycle plants with thousands of megawatts in capacity are being
built today. Chemical plants, refineries, and process plants use HRSGs in
cogeneration mode to supply steam for various purposes. The combined cycle
plant with a gas turbine exhausting into an HRSG that supplies steam to a steam
turbine is the most efficient electric generating system available today. It exhibits
lower capital costs than fossil power plants. Table 1.1 shows the average cost of a
gas turbine. The HRSG price ranges from about $80 to $130 per kilowatt.
Combining the Brayton and Rankine cycles results in efficiencies significantly
above the 40% level, which was an upper limit of large coal-fired utility plants
built 30–50 years ago. Distillate oils and natural gas are typically fired in the gas
turbines. Combined cycle plants have a number of advantages:
Modular designs enable increases in plant capacity as time passes.
These plants have short start-up periods. They come on-line in a couple of
hours from the cold.
Combined cycle plants can be built within 12–20 months, unlike a large
utility plant, which takes 3–4 years.
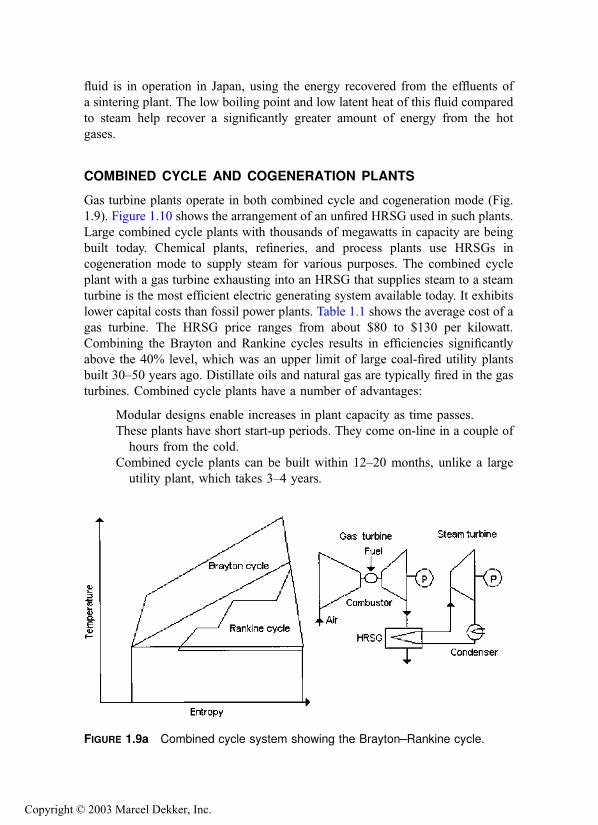
FIGURE 1.9a Combined cycle system showing the Brayton–Rankine cycle.
Copyright © 2003 Marcel Dekker, Inc.

Advances in gas turbine technology and cooling systems can be made use
of to improve the overall system efficiency. We are close to 60% LHV
efficiency with recent developments such as high pressure, multiple-
pressure steam systems and reheat steam cycles.
Emissions of NOx and CO for plants burning natural gas are in single-digit
plants per million (ppm).
Cooling water requirements are low due to higher efficiency and the small
ratio of Rankine cycle power to total power output. The Brayton cycle
portion does not require cooling water.
Large-capacity additions are feasible. Today’s combined cycle plant is rated
in thousands of megawatts, which is otherwise feasible only with coal-
fired power plants.
Recent developments in gas turbine technology such as closed steam
cooling of blades enable firing temperatures to be increased, thus increasing
the simple cycle efficiency. Every 100�F increase in firing temperature increases
the turbine power output by 10% and gives a 4% gain in simple cycle efficiency.
In large systems, an HRSG with three pressure levels and reheat is used,
FIGURE 1.9b Cogeneration systems.
Copyright © 2003 Marcel Dekker, Inc.

FIGURE 1.10 Unfired HRSG in a gas turbine plant.
Copyright © 2003 Marcel Dekker, Inc.

increasing the plant efficiency to 55% LHV. Table 1.2 presents data for a few
systems that are being commercially offered. The data are typical only.
In spite of all the advantages mentioned, it should be noted that the output
of a gas turbine decreases significantly as the ambient temperature increases. The
lower density of warm air reduces the mass flow through the turbine and the
exhaust gas flow through the HRSG, which in turn reduces its steam generation
and hence the steam turbine power output. Unfortunately, hot weather also
corresponds to peak electrical loads in many areas of the world. Hence a few
methods are used to improve the gas turbine power output in summer. The three
most common methods of increasing the gas turbine (GT) output are [7]
Injection of steam into the gas turbine
Precooling of the inlet air
Supplementary firing in the HRSG
Steam Injection
Injecting steam into the gas turbine has been a strategy adopted by turbine users
for a long time to increase its power output. The increased mass flow coupled
with the higher thermal conductivity and specific heat of the exhaust gases (due to
the higher percent by volume of water vapor) generates more power in the gas
turbine and higher steam output in the HRSG. The Cheng cycle, discussed later,
is a good example of this technique. Besides increasing the power output, it
reduces the turbine NOx levels.
Precooling of the Inlet Air
Evaporative cooling boosts the output of the gas turbine by increasing the density
and mass flow of the air. Water sprayed into the inlet air stream cools the air to
TABLE 1.1 Gas Turbine Pricing
Machine size (MW) Cost ($=kW)
1–2 600–6505 400–450
50 275–300150 180–190250 175–185
260–340 175–180
Note: A host of factors affect pricing, and the
above numbers give an idea only and should be
used with caution.
Source: Ref. 14.
Copyright © 2003 Marcel Dekker, Inc.

TABLE 1.2 Typical Combined Cycle Plants
System
Simple cycle data 7FA 9FA 6FA W501F
Simple cycle output, kW 159,000 226,500 70,140 187,000Simple cycle heat rate (LHV) 9500 9570 9980 9235Simple cycle efficiency, % LHV 35.9 35.7 34.2 36.9
Pressure ratio 14.7 14.7 14.6 15Firing temperature, �F 2350 2350 2350 —Exhaust gas flow, lb=h 3,387,000 4,877,000 1,591,000 1,645,200
Exhaust gas temperature, �F 1093 1093 1107 1008HRSG system 3 press, reheat 3 press, reheat 3 press, reheat Multipress, reheat1�GT net output, MW 241.4 348.5 108.4 274
Net heat rate (LHV), Btu=kWh 6260 6220 6455 61501�GT net efficiency, % 54.5 54.8 52.8 55.52�GT net output, MW 483.2 700.8 219.3 550
2�GT net heat rate, Btu=kWh 6250 6190 6385 61202�GT net efficiency, % 54.6 55.1 53.4 55.8
Source: Ref. 9.
Copyright © 2003 Marcel Dekker, Inc.

near its wet bulb temperature. The effectiveness of the evaporative cooling
systems is limited by the relative humidity of the air. At 95�F dry bulb
temperature and 60% relative humidity, an 85% effective evaporative cooler
can alter the air inlet temperature and moisture content to 85�F dry bulb and 92%
humidity, respectively. This boosts the gas turbine output and the HRSG steam
generation (due to the larger gas mass flow). The incremental cost of this system
is about $180=kW. The cost of treated water, which is lost to the atmosphere,
must also be considered in evaluating this system. The effectiveness of the same
system in less humid conditions, say 95�F and 40% relative humidity, is much
higher. The same evaporative cooler can reduce the inlet air temperature to 75�Fdry bulb and 88% humidity. The combined cycle plant output increases by 7%,
and the heat rate by about 1.9%. With evaporative coolers, the air cannot be
cooled below the wet bulb temperature, so chillers are used for this purpose.
Chillers can be mechanical or absorption systems. Water is the refrigerant,
and lithium bromide (LiBr) is the absorber in single-effect LiBr absorption
systems. A low grade heat source such as low pressure steam drives the
absorption process, which produces chilled water. Absorbers draw little electrical
power and are well suited to cogeneration plants where steam is readily available.
Sometimes the HRSG generates the low pressure steam required for chilling, or it
can be taken from some low pressure steam header. Unlike mechanical chillers,
the efficiency of an absorber is unchanged as its load is decreased. Chilled water
output is limited to around 44�F, yielding inlet air at 52�F.A mechanical chiller can easily reduce the temperature of GT inlet air from
95�F to 60�F dry bulb and achieve 100% humidity. This increases the plant
output by 8.9% but also degrades the net combined cycle heat rate by 0.8% and
results in a 1.5 in. WC inlet air pressure drop due to the heat exchanger located at
the chilling section. Costs could be about $165=kW. Absorption systems are more
complex than mechanical chillers.
Off-peak thermal storage is another method of chilling inlet air. A portion
of the plant’s electrical or thermal output is used to make ice or cool water during
lean periods. During peak periods, the chilling system is turned off and the stored
ice is used to chill the inlet air.
The performance of HRSGs with varying ambient temperatures is
discussed later. One can appreciate from the example why inlet air cooling is
necessary, particularly in locations where ambient temperatures are very high.
Improvements in Gas Turbines
In order to handle the high firing temperatures, in the range of 2500–2600�F, gasturbine suppliers are doing research and development work on turbine blades for
protection against corrosion and thermal stresses. Thermal barrier coatings have
been used on turbine blades for several years. The base high alloy material
Copyright © 2003 Marcel Dekker, Inc.

ensures the mechanical integrity, while the coatings protect against oxidation and
corrosion as well as reducing the blade surface temperature. The rotating blades
are manufactured by using single-crystal casting technology, which allows the
chemical composition of the alloys to be modified to improve their resistance to
fatigue and creep. Thermal barrier coatings comprise two layers: the outer
ceramic layer, which prevents flow of heat into the turbine blade, and a metallic
bond coating, which is a nickel- or cobalt-based material.
General Electric uses closed loop steam cooling for the blades in its quest
for higher firing temperatures. This unique cooling system allows the turbine to
fire a higher temperature, around 2600�F, for higher performance. Earlier designs
were cooled by compressor discharge air, which causes a large temperature drop
in the first-stage nozzle. Cooling with steam systems has been found to be more
effective because it picks up heat for use in the steam turbine, transforming what
was waste heat to usable heat. In conventional gas turbines, compressor air is also
used to cool rotational and stationary components downstream of the stage 1
nozzle. This is called chargeable air because it reduces performance. In advanced
systems, this air is replaced by steam, which enhances performance by 2% and
increases the gas turbine output because all the compressor air can be channeled
through the turbine path to do useful work in the turbine as well as in the HRSG
[9]. The high pressure steam from the HRSG is expanded through the steam
turbine’s high pressure section. The exhaust steam from this turbine section is
then split. One part is returned to the HRSG while the other is combined with the
intermediate pressure steam and used for cooling in the gas turbine. Steam is used
to cool the stationary and rotational parts of the turbine. In turn, the heat
transferred from the gas turbine increases the steam temperature to approximately
reheat temperature. The gas turbine cooling steam is mixed with the reheat steam
from the HRSG and introduced into the intermediate pressure steam turbine
section [8].
COAL-BASED SYSTEMS
Though combined cycle plants based on natural gas (Fig. 1.9a) are widely used,
with the increasing cost of natural gas several coal gasification technologies are
gaining acceptance. The technology is proven, and there are several plants in
operation throughout the world. The advantages of integrated coal gasification
combined cycle (IGCC) are
Ability to use of low grade fuels such as coal and biomass.
High efficiency, about 7–8% higher than conventional coal-based plants. A
net efficiency of 45% is not impossible. With improvements in gasifica-
tion and gas turbine technologies, the efficiency can reach 50% by 2010.
Copyright © 2003 Marcel Dekker, Inc.

Fuel flexibility. The combined cycle portion of the plant can be fueled by
natural gas, oil, or coal. A plant can switch from gas to coal as gas
becomes unavailable or very expensive. Most gasifiers can handle
different grades of coal. Gas turbine combustors can also handle
different fuels with different heating values and gas analysis from low
to high Btu.
Low SO2, NOx, and CO2 emissions. In an IGCC, 90% of the coal’s sulfur is
removed before combustion. NOx is reduced by 90%, as is also the CO2
on lb=kWh basis. The coal gas is purified before combustion, unlike in a
conventional coal-fired plant, where the flue gases are cleaned. Hence the
quantity of effluent to be handled is much smaller. The composition of
the fuel gas also allows for better chemistry while cleaning.
Low water consumption due to higher efficiency and lower heat losses.
Marketable by-products such as sulfur, sulfuric acid, and carbon dioxide.
Awide range of technologies such as fixed bed, fluidized bed, and entrained
bed gasification.
Ability to make use of advances in gas turbine technology.
Availability of IGCC plants, which has been in excess of 90% and is
improving.
Higher gas turbine power output possible due to about 14% larger mass
flow of flue gases at the same combustion temperature compared to
natural gas.
Decreasing installation costs due to advances in technology. $1000=kWwill be achievable in the near future. Unit sizes range from 100 to
500MW.
In an IGCC, coal is gasified in a gasifier by using steam and either air or
oxygen to generate a low or high Btu gas, which is cleaned and fired in a gas
turbine combustor. There are three processes for gasifying coal: fixed bed,
fluidized bed, and entrained bed. Figure 1.3 shows an IGCC plant. Typically,
coal is gasified in the gasifier at pressure using steam, oxygen or air, and coal. The
coal gas is cooled in a synthesis gas cooler, which also generates steam or
superheats the steam generated elsewhere. It is then cleaned in a gas cleaning
system, where the particulates and sulfur are removed. Hot gas cleaning methods
are also being developed, which can improve the efficiency of the system even
more. The clean coal gas is fired in the gas turbine combustor. The exhaust gases
generate high pressure steam for the steam turbine and also for gasification. A
portion of the air from the gas turbine compressor is also sent to the gasifier.
There are several plants in operation throughout the world. In the United States
the Wabash River plant, which began operation in 1995 (Fig. 1.3) generates
262MW using the Destec process for gasification, which uses an entrained flow
Copyright © 2003 Marcel Dekker, Inc.

oxygen-blown gasifier. Coal is slurried, combined with 95% pure oxygen, and
injected into the first stage of the gasifier, which operates at 400 psig and 2600�F.The coal slurry undergoes a partial oxidation reaction at temperatures that bring
the coal’s ash above its melting point. From the gasifier the fluidized ash falls
through a tap hole at the bottom. The synthesis gas flows into the second stage,
where additional coal slurry is injected. At this stage the coal is pyrolyzed in an
endothermic reaction with the hot synthesis gas. This enhances the heating value
of the synthesis gas.
After leaving the second stage the synthesis gas flows into a gas cooler,
which is a waste heat boiler that generates high pressure saturated steam at
1600 psia. After cooling, any remaining particulates are removed in a hot=dryfilter. Further cooling of gas takes place in a series of exchangers. It is scrubbed to
remove chlorides and passed through a catalyst that hydrolyzes the carbonyl
sulfide into hydrogen sulfide. The H2S is removed by an acid gas removal system.
A marketable elemental sulfur is produced as a by-product. Finally the sweet gas
is moisturized and preheated before being sent to the gas turbine. The power
block consists of a GE 192 MW MS7001A gas turbine, The exhaust gases
generate steam in the HRSG, which generates power via a steam turbine. This is
presently the largest gasification repowering project. The heat rate is around
8910Btu=kWh (HHV) with SO2 emissions around 0.1 lb=MM Btu, NOx 0.15,
and particulates below detectable limits [10].
Coal will remain a major fuel, more so with the significant run-up in the
price of gas, and IGCC plants have earned a permanent place in power generation
technology. The heat exchanger and the HRSG are designed to meet the special
requirements of this process. Oxygen-blown gasification has dominated commer-
cial gasification processes, because these plants produce chemicals based on
synthesis gas (H2 and CO) and premium fuels. Air-blown gasifiers, which
generate low Btu gas, are also widely used in the industry. Air-blown gasification
produces a gas in which the desirable chemical reactants are diluted by massive
amounts of nitrogen. The gasifier capacity is cut in half when it is air-blown. The
efficiency of conversion of feed to fuel gas is higher with oxygen-blown
gasification. The air-blown gasification produces over twice as much gas as is
generated by oxygen-blown operation; hence investment costs for air-blown
systems and cleanup systems are higher. Cleanup costs are also higher because
the partial pressures of the pollutants are higher in air-blown system raw gas.
Compression costs are lower because the mass flow of an oxygen-blown system is
smaller by 20–40%.
The Sierra Pacific Power Company’s Pinon-Pine project employs an air-
blown system and a fluidized bed gasification process that uses low sulfur coal,
most of which is captured in the bed itself by the use of limestone injection
methods. A low Btu gas is generated, on the order of 130Btu=scf.
Copyright © 2003 Marcel Dekker, Inc.

EFFECT OF AMBIENT TEMPERATURE ON HRSGPERFORMANCE
The power output of a gas turbine without inlet air temperature cooling or
conditioning suffers at high ambient temperature owing to the effect of lower air
density, which in turn reduces the mass flow of air. The power output could drop
by as much as 15–25% between the coldest and hottest temperatures. The exhaust
gas flow, temperature, and gas analysis also vary with ambient temperature, which
affects the HRSG performance. Table 1.3 shows the data for a typical LM 5000
gas turbine.
Naturally, the performance of an unfired HRSG behind the gas turbine
would be affected by the changes in exhaust gas flow and temperature. Using the
‘‘HRSGS’’ program (see Chap. 2), one can evaluate the HRSG performance
under varying ambient conditions; the results are shown in Fig. 1.11. One can see
the large variation in the HRSG performance between summer and winter
months. In order to minimize the effect of ambient temperature on power
output, several methods are resorted to, such as the use of evaporative coolers,
mechanical chillers, absorption chillers, and thermal storage systems as discussed
above.
EFFECT OF GAS TURBINE LOAD ON HRSGPERFORMANCE
Generally gas turbines perform poorly at low loads, which affect not only their
[11, 12] performance but also that of the HRSG located behind them. Because of
the low exit gas temperature at lower loads, the HRSG generates less steam and
also has the potential for steaming in the economizer. Table 1.4 shows the exhaust
flow and temperature of a small gas turbine as a function of load. It should be
noted that the data are typical, presented to illustrate the point that at low gas
TABLE 1.3 Gas Turbine Performance at Selected Ambient Temperatures
20�F 40�F 60�F 80�F 100�F 120�F
Power, kW 38,150 38,600 35,020 30,820 27,360 24,040Heat rate, Btu=kWh 9,384 9,442 9,649 9,960 10,257 10,598Exhaust temp, �F 734 780 797 820 843 870
Exhaust flow, lb=h 1,123,200 1,094,400 1,029,600 950,400 878,400 810,000Vol% CO2 2.7 2.9 2.8 2.8 2.7 2.7
H2O 7.6 8.2 8.5 9.2 10.5 12.8
O2 14.6 14.3 14.3 14.2 14.0 13.7N2 75.1 74.7 74.4 73.8 72.8 70.8
Copyright © 2003 Marcel Dekker, Inc.
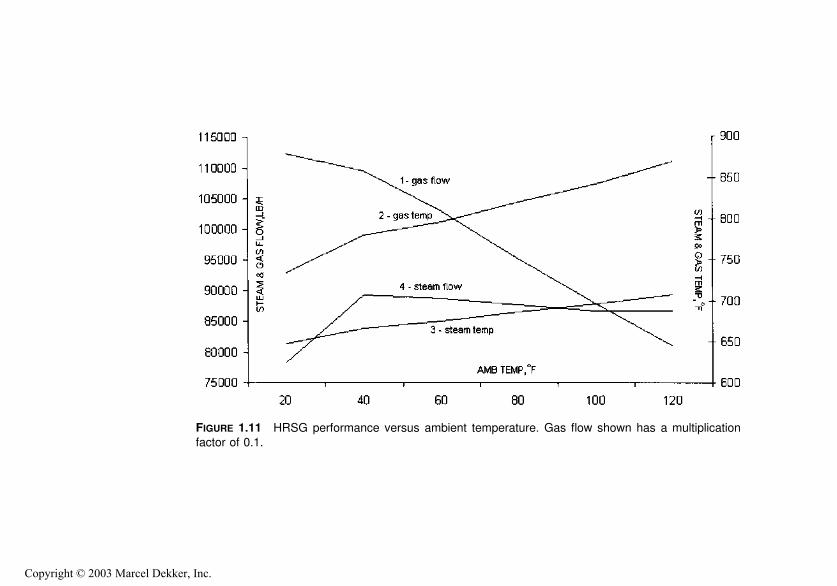
FIGURE 1.11 HRSG performance versus ambient temperature. Gas flow shown has a multiplicationfactor of 0.1.
Copyright © 2003 Marcel Dekker, Inc.

turbine loads the HRSG performance will be poor. Note that at low loads the
exhaust temperature is lower but the mass flow changes little.
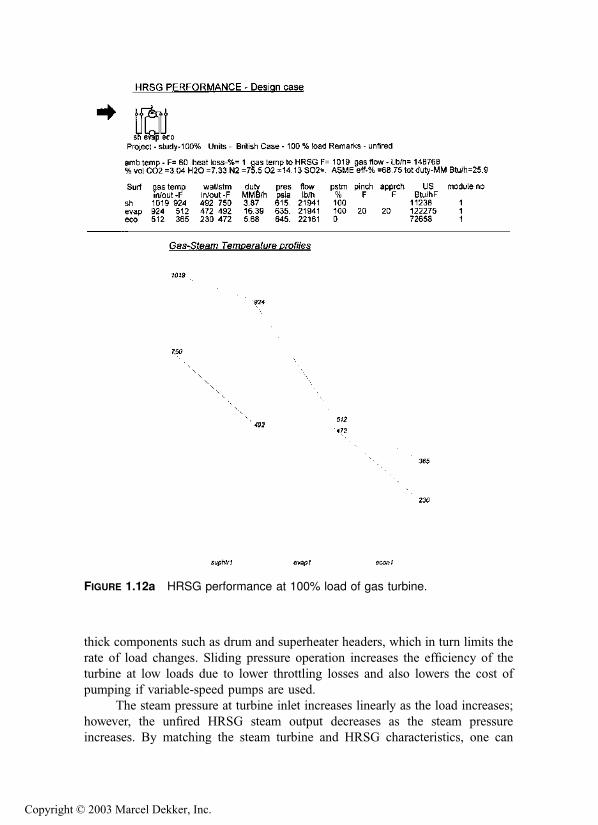
The HRSG performance at 100% and 40% loads is given in Figs. 1.12a and
1.12b. The HRSG was designed for the 100% case, and its performance was
checked at 40% load using the ‘‘HRSGS’’ program. It may be seen that the
economizer generates some steam. Also, the exit gas temperature from the HRSG
at low load is very high compared to the normal case. This is due to the fact that
less steam is generated in the evaporator and hence the flow through the
economizer is also small, resulting in only a small gas temperature drop; the
heat sink at the economizer is not large enough to cool the gases to a low
temperature. Thus it is recommended that the HRSG not be operated at low loads
of the gas turbine for long durations. If it is absolutely required, then a gas bypass
damper should be used, or methods suggested in Q8.41, may be tried to minimize
economizer steaming.
EFFECT OF STEAM PRESSURE ON HRSG PERFORMANCE
Combined cycle plants today operate in sliding pressure mode; if extraction steam
is desired at a given pressure for process reasons, then a constant pressure may be
required at the steam turbine inlet. Typically the steam pressure is allowed to float
by keeping the turbine throttling valves fully open and ensuring full arc
admission. The load range over which sliding operation is allowed varies from
about 40% or 50% to 100%. Large variations in steam pressure affect the specific
volume of steam, which in turn affects the velocity and pressure drop through
superheater tubes and pipes, valves, etc. Large variations in steam pressure also
affect the saturation temperature at the drum and hence thermal stresses across
TABLE 1.4 Typical Gas Turbine Performance at Low Loads
Load (%)
10 20 30 40 100
Generator kW 415 830 1244 1659 4147Heat rate, Btu=kWh 48,605 28,595 21,960 18,649 12,882Efficiency, % 7 12 15.54 18.3 26.5
Exhaust gas, lb=h 147,960 148,068 148,170 148,320 148,768Exhaust temp, �F 562 612 662 712 1019Vol% CO2 1.18 1.38 1.59 1.79 3.04
H2O 3.76 4.14 4.53 4.93 7.33
O2 18.18 17.78 17.28 16.88 14.13N2 76.9 76.7 76.6 76.4 75.5
Copyright © 2003 Marcel Dekker, Inc.
thick components such as drum and superheater headers, which in turn limits the
rate of load changes. Sliding pressure operation increases the efficiency of the
turbine at low loads due to lower throttling losses and also lowers the cost of
pumping if variable-speed pumps are used.
The steam pressure at turbine inlet increases linearly as the load increases;
however, the unfired HRSG steam output decreases as the steam pressure
increases. By matching the steam turbine and HRSG characteristics, one can
FIGURE 1.12a HRSG performance at 100% load of gas turbine.
Copyright © 2003 Marcel Dekker, Inc.

arrive at the operating points at various loads. Because of the large variations that
occur in drum pressure during sliding pressure operation, the drum level controls
should be pressure-compensated.
As an example, using the HRSG simulation program, the effect of steam
pressure on a single-pressure unfired HRSG was evaluated; the results are shown
in Table 1.5. Note that when multiple-pressure HRSGs are involved, the
FIGURE 1.12b HRSG performance at 40% load of gas turbine.
Copyright © 2003 Marcel Dekker, Inc.

performance of a given module is affected by the module preceding it, so unless
the configuration is known it is difficult to make generalized observations.
In the case for which data are given in Table 1.5, the HRSG was designed to
generate steam at 1000 psia and 800�F and the off-design performance was
evaluated at selected pressures.
The steam flow decreases as the pressure increases due to the higher
saturation temperature, which limits the temperature profiles.
The exit gas temperature increases as the pressure increases, again due to
the higher saturation temperature.
The steam temperature does not vary by much.
The duty or energy absorbed by steam decreases as pressure increases due
to the higher exit gas temperature.
AUXILIARY FIRING IN HRSGs
Supplementary firing is an efficient way to increase the steam generation in
HRSGs. Additional steam in the HRSG is generated at an efficiency of nearly
100% as shown in Q8.38. Typically, HRSGs in combined cycle plants are unfired
and those in cogeneration plants are fired. The merits of auxiliary firing in
HRSGs are discussed in Q8.38. Figure 1.13 shows the arrangement of a
supplementary-fired HRSG, which can handle a firing temperature of about
1600�F. Typically, oil or natural gas is the fuel used. Figure 1.14 shows a furnace-
fired HRSG, which can be fired up to 3000�F. The superheater is shielded from
the flame by a screen section. The furnace should be large enough to enclose the
flame. In furnace-fired HRSGs even a solid fuel can be fired and the HRSG
design approaches that of a conventional steam generator. Water-cooled
membrane walls ensure that the casing is kept cool. A large amount of steam
can be generated in this system. Table 1.6 compares the features of unfired,
supplementary-fired, and furnace-fired HRSGs.
TABLE 1.5 Effect of Steam Pressure on HRSG Performancea
Pressure (psia)
400 600 800 1000
Steam flow, lb=h 69,900 68,225 67,320 66,800Steam temp, �F 799 802 800 800Exit gas temp, �F 354 373 388 401
Duty, MM Btu=h 85.2 82.9 81.0 79.6
aFeedwater temperature¼230�F, heat loss¼1%, blowdown¼ 1%.
Copyright © 2003 Marcel Dekker, Inc.

FIGURE 1.13 Multipressure supplementary-fired HRSG.
Copyright © 2003 Marcel Dekker, Inc.

Combined Cycle Plants and Fired HRSGs
It is generally believed that combined cycle plant efficiencies with fired HRSGs
are lower than those with unfired HRSGs. The reason is not the poor performance
of the HRSG. In fact, a fired HRSG by itself is efficient. However, the large losses
associated with the Rankine cycle, particularly when the steam turbine power is a
large fraction of the overall power output, distorts the results slightly as the
following example shows.
FIGURE 1.14a Furnace-fired HRSG arrangement.
FIGURE 1.14b Photograph of a furnace-fired ABCO HRSG in a cogenerationplant.
Copyright © 2003 Marcel Dekker, Inc.
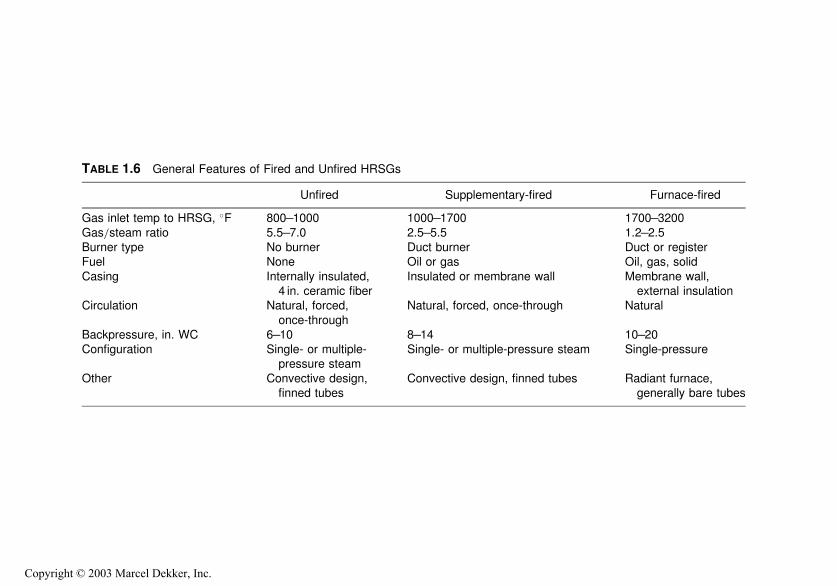
TABLE 1.6 General Features of Fired and Unfired HRSGs
Unfired Supplementary-fired Furnace-fired
Gas inlet temp to HRSG, �F 800–1000 1000–1700 1700–3200
Gas=steam ratio 5.5–7.0 2.5–5.5 1.2–2.5Burner type No burner Duct burner Duct or registerFuel None Oil or gas Oil, gas, solid
Casing Internally insulated,4 in. ceramic fiber
Insulated or membrane wall Membrane wall,external insulation
Circulation Natural, forced,
once-through
Natural, forced, once-through Natural
Backpressure, in. WC 6–10 8–14 10–20Configuration Single- or multiple-
pressure steamSingle- or multiple-pressure steam Single-pressure
Other Convective design,finned tubes
Convective design, finned tubes Radiant furnace,generally bare tubes
Copyright © 2003 Marcel Dekker, Inc.

Example 1
A combined cycle plant uses a fired HRSG. The gas turbine used is LM 5000. At
59�F,
Exhaust gas flow¼ 1,030,000 lb=h at 800�F.Gas analysis, vol%: CO2 ¼ 2.8, H2O¼ 8.5, N2 ¼ 74.4, O2 ¼ 14.3
Power output¼ 35MW; heat rate¼ 9649Btu=kWh
Steam turbine data:
Inlet pressure¼ 650 psia at 750�FExhaust pressure¼ 1 psia
Efficiency¼ 80%, dropping off by 2–3% at 40% load.
HRSG data:
230�F feedwater, 2% blowdown, 1% heat loss
Steam is generated at 665 psia and 750�F.
The HRSG generates 84,400 lb=h in the unfired mode and a maximum of
186,500 lb=h when fired up to 1200�F. The HRSG performance was simulated by
using the HRSGS program. The system efficiency in both cogeneration and
combined cycle mode are calculated as follows:
Gas turbine fuel input ¼ 35;000� 9649 ¼ 337:71 MM Btu/h,
lower heating value (LHV) basis.
Cogeneration mode efficiency at 900�F, from first principles (or
fundamentals)¼ð35� 3:413þ 129:9Þ
337:71þ 29:6� 100 ¼ 67:9%
where 129.9MM Btu=h is the HRSG output and 29.6MM Btu=h is the HRSG
burner input in LHV (lower heating value basis).
Combined cycle mode efficiency:
ð35þ 12:1Þ � 3:413
337:71þ 29:6� 100 ¼ 43:8%
where 12.1 MW is the power output from the steam turbine.
Table 1.7 shows the results at various HRSG firing temperatures.
Cogeneration plant efficiency improves with firing in the HRSG as
discussed earlier. The combined cycle plant efficiency drops only because of
the lower efficiency of the Rankine system as the proportion of power from the
Rankine cycle increases. The HRSG, as can be seen, is efficient in the fired mode
with a slightly lower stack gas temperature.
Copyright © 2003 Marcel Dekker, Inc.

Generating Steam Efficiently in Cogeneration Plants
Today’s cogeneration plants have both HRSGs and packaged steam generators. To
generate a desired quantity of steam efficiently, the load vs. efficiency character-
istics of both the HRSG and steam generator should be known. Although the
generation of steam with the least fuel input is the objective, it may not always be
feasible, for reasons of plant loading, availability or maintenance, However the
information is helpful for planning purposes [13].
To explain the concept, an HRSG and a packaged boiler both capable of
generating up to 100,000 lb=h of 400 psig saturated steam on natural gas are
considered. In order to understand how the cogeneration system performs, one
should know how the HRSG and the steam generator perform as a function of
load. Figure 1.15 shows the load vs. efficiency characteristics of both the HRSG
and packaged boiler. The following points may be noted.
1. The exit gas temperature from the HRSG decreases as the steam
generation is increased. This is due to the fact that the gas flow remains
the same while the steam flow increases, thus providing a larger heat
sink at the economizer as discussed earlier. On the other hand, the exit
gas temperature from the steam generator increases as the load
increases because a larger quantity of flue gas is handled by a given
heat transfer surface.
2. The ASME HRSG efficiency increases as firing increases as explained
in Q8.38. The range between the lowest and highest load is significant.
The steam generator efficiency increases slightly with load, peaks
around 60–75%, and drops off. The variation between 25% and 100%
loads is marginal. This is due to the combination of exit gas losses and
casing heat losses. The casing loss is nearly unchanged with load in
Btu=h but increases as a percentage of total loss at lower loads. The
TABLE 1.7 Cogeneration and Combined Cycle Efficiency with Fired HRSG
Gas inlettemp (�F)
HRSG exit
gas temp(�F)
Boilerdutya
Burnerdutyb
Turbine
power(MW)
Cogen.
effic.(%)
Comb.
cycle effic.(%)
Steam(lb=h)
800 435 99.8 0 9.2 64.9 44.7 84,400900 427 129.9 29.6 12.1 67.9 43.8 109,7001000 423 160.0 59.1 15.3 70.4 43.2 135,200
1100 420 190.4 90.7 18.2 72.3 42.4 160,9601200 418 221.0 121.0 21.1 74.2 41.75 186,500
aBoiler duty is the energy absorbed by steam, MM Btu=h.bBurner duty is the fuel input to HRSG, MM Btu=h, LHV basis.
Copyright © 2003 Marcel Dekker, Inc.

flue gas heat loss is lower at lower loads due to the lower exit gas
temperature and mass flow.
Performance calculations were done at loads ranging from 25% to 100% for
both the steam generator and the HRSG. Results are presented in Tables 1.8 and
FIGURE 1.15 Load versus efficiency characteristics of HRSG and steamgenerator.
TABLE 1.8 Steam Generator Performance at Various Loadsa
Load (%)
25 50 75 100
Steam flow, lb=h 25,000 50,000 75,000 100,000Excess air, % 30 10 10 10Duty, MM Btu=h 25.4 50.8 76.3 101.6
Flue gas, lb=h 30,140 50,600 76,150 101,750Exit gas temp, �F 265 280 300 320Dry gas loss, % 3.93 3.56 3.91 4.27
Air moisture, % 0.1 0.09 0.1 0.11Fuel moisture, % 10.43 10.49 10.58 10.66Casing loss, % 2.00 1.0 0.7 0.5Efficiency, HHV % 83.54 84.86 84.7 84.46
Efficiency, LHV % 92.58 94.05 93.87 93.60Fuel, MM Btu=h (LHV) 27.5 54.0 81.3 108.6
aSteam pressure¼400psig; feedwater¼ 230�F, blowdown¼5%.
Fuel: natural gas. C1 ¼ 97;C2 ¼ 2;C3 ¼ 1 vol%
Copyright © 2003 Marcel Dekker, Inc.
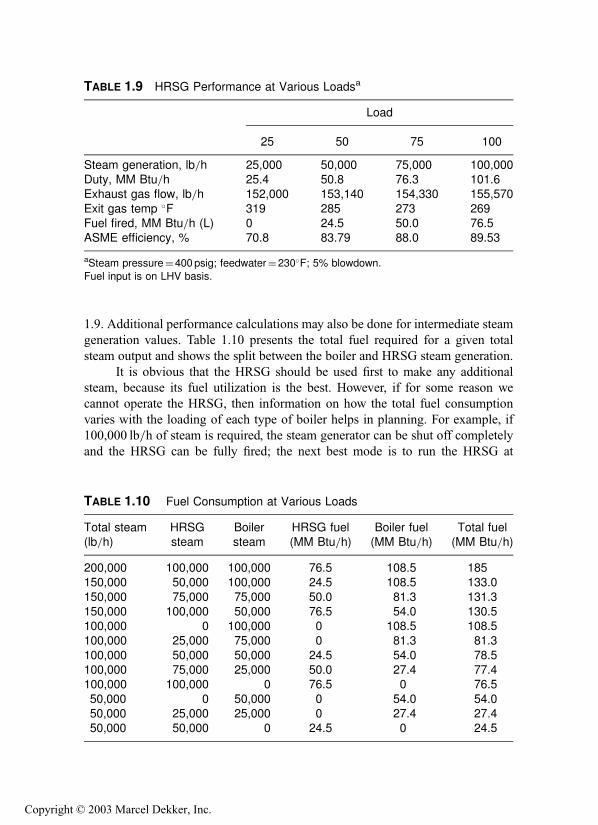
1.9. Additional performance calculations may also be done for intermediate steam
generation values. Table 1.10 presents the total fuel required for a given total
steam output and shows the split between the boiler and HRSG steam generation.
It is obvious that the HRSG should be used first to make any additional
steam, because its fuel utilization is the best. However, if for some reason we
cannot operate the HRSG, then information on how the total fuel consumption
varies with the loading of each type of boiler helps in planning. For example, if
100,000 lb=h of steam is required, the steam generator can be shut off completely
and the HRSG can be fully fired; the next best mode is to run the HRSG at
TABLE 1.10 Fuel Consumption at Various Loads
Total steam(lb=h)
HRSGsteam
Boilersteam
HRSG fuel(MM Btu=h)
Boiler fuel(MM Btu=h)
Total fuel(MM Btu=h)
200,000 100,000 100,000 76.5 108.5 185150,000 50,000 100,000 24.5 108.5 133.0
150,000 75,000 75,000 50.0 81.3 131.3150,000 100,000 50,000 76.5 54.0 130.5100,000 0 100,000 0 108.5 108.5100,000 25,000 75,000 0 81.3 81.3
100,000 50,000 50,000 24.5 54.0 78.5100,000 75,000 25,000 50.0 27.4 77.4100,000 100,000 0 76.5 0 76.5
50,000 0 50,000 0 54.0 54.050,000 25,000 25,000 0 27.4 27.450,000 50,000 0 24.5 0 24.5
TABLE 1.9 HRSG Performance at Various Loadsa
Load
25 50 75 100
Steam generation, lb=h 25,000 50,000 75,000 100,000Duty, MM Btu=h 25.4 50.8 76.3 101.6Exhaust gas flow, lb=h 152,000 153,140 154,330 155,570
Exit gas temp �F 319 285 273 269Fuel fired, MM Btu=h (L) 0 24.5 50.0 76.5ASME efficiency, % 70.8 83.79 88.0 89.53
aSteam pressure¼400psig; feedwater¼ 230�F; 5% blowdown.
Fuel input is on LHV basis.
Copyright © 2003 Marcel Dekker, Inc.

75,000 lb=h and the boiler at 25,000 lb=h or in that range. A similar table may be
prepared if there are multiple units in the plant, and by studying the various
combinations a plan for efficient fuel utilization can be developed. Note that a
typical packaged boiler generates steam at about 92% efficiency on LHV basis,
whereas it is nearly 100% if the same amount of fuel (gas or oil) is fired in an
HRSG.
Cogeneration Plant Applications
The steam parameters of combined cycle and cogeneration plants differ signifi-
cantly.
Combined cycle plants typically use unfired HRSGs and generate multiple-
pressure-level steam with a complex arrangement of heating surfaces to
maximize energy recovery. Fired HRSGs in combined cycle plants are
often the exception to the rule owing to their impact on cycle efficiency
as discussed above.
In cogeneration plants, a large amount of steam is required and hence
supplementary or furnace-fired HRSGs are common. With a high gas
inlet temperature, a single-pressure HRSG can often cool the gases to a
reasonably low temperature, so single-pressure steam generation is often
adequate.
In cogeneration plants, saturated steam is often imported from other boilers
to the HRSG to be superheated; steam may also be exported from the
HRSG to other plants.
Combined cycle plant HRSGs often operate at steady loads, cogeneration
plant steam demand often fluctuates and is a function of the process.
Given below is an example of an HRSG simulation in a cogeneration
plant. Note the effect on steam temperature with and without the export
steam.
Example 2
Exhaust gas flow from a gas turbine is 250,000 lb=h at 1000�F. Gas analysis inpercent by volume (vol %) is CO2 ¼ 3, H2O¼ 7, N2 ¼ 75, and O2 ¼ 15. Super-
heated steam is generated at 600 psia at 875�F, and about 20,000 lb=h of saturated
steam is required for process, which is taken off the steam drum. Predict the
HRSG gas=steam profiles. Use 20�F pinch and approach points, 230�F feedwater,
and 1% blowdown and heat loss.
In the off-design mode, process steam is not required. Steam pressure is
650 psia. Determine the HRSG performance. Steam temperature is uncontrolled.
Copyright © 2003 Marcel Dekker, Inc.

Solution. The design mode run is shown in Fig. 1.16a. The evaporator
generates 37,883 lb=h, and 17,883 lb=h is sent through the superheater as
20,000 lb=h is taken off for process from the drum.
In the off-design mode, almost all of the steam, 35,270 lb=h, is sent throughthe superheater. As a result the steam temperature is lower, only 749�F, as shownin Fig. 1.16b. Note that without the program it would be tedious to perform this
FIGURE 1.16a Performance of a HRSG with process steam use.
Copyright © 2003 Marcel Dekker, Inc.

calculation, because we have no idea of the exit gas temperature in the design
mode.
COMBINED CYCLE PLANT HRSG SIMULATION
The HRSG simulation concept is helpful in predicting the performance of an
HRSG at various modes of operation. The HRSG need not be designed to
perform this study. Figure 1.17a shows a multiple-pressure HRSG used in a
combined cycle plant with nine modules. Module 1 superheater is fed by module
3, which consists of a superheater, evaporator, and economizer. Module 2 is a
reheater. Module 7 evaporator feeds module 4 superheater. Module 5 economizer
FIGURE 1.16b Performance of the HRSG when process steam is not required.
Copyright © 2003 Marcel Dekker, Inc.

FIGURE 1.17a HRSG scheme in a combined cycle plant. Modules 1, 3, and 5 are
HP sections. Modules 6, 8, and 9 are LP sections. Modules 4 and 7 are IPsections. Module 2 is a reheater.
FIGURE 1.17b Temperature profiles and performance of the HRSG.
Copyright © 2003 Marcel Dekker, Inc.

feeds module 2, and module 9 evaporator feeds module 6 superheater. Module 8
economizer feeds both modules 5 and 7.
The HRSGS program can be used to arrive at the design case performance
as shown in Fig 1.17b. The US value (product of overall heat transfer coefficient
and surface area) for each surface is also shown. One may also use this
information to predict the HRSG performance at other off-design cases and
study, for example, the effect of steam pressure or the feedwater temperature on
the HRSG performance.
IMPROVING HRSG PERFORMANCE
By nature, HRSGs are inefficient, particularly the unfired units, because of the
large gas mass flow associated with the low exit gas temperature from the gas
turbine. The large mass flow forces one to use a boiler with a large cross section,
though the steam generation may not be compatible with the size of the HRSG.
The low ratio of steam to gas flow (15–18%) also results in a small heat sink at
the economizer leading to higher stack gas temperature. Hence single-pressure
units are inefficient. In addition,
1 Gas=steam temperature profiles are dictated by the steam pressure and
steam temperature, unlike in a steam generator, where one can easily
attain about 300�F stack gas temperature in a single-pressure unit even
with high steam pressures on the order of 2000–2500 psi. In a single-
pressure HRSG, the exit gas temperature is a function of the steam
pressure and temperature. With 600 psig steam superheated to 700�F, itis difficult to get the economizer exit gas temperature below 380�F in an
unfired HRSG.
2 The higher the steam pressure, the lower the exit gas temperature
(single-pressure unit). This point is explained under HRSG simulation:
see Q8.36.
3 The higher the steam temperature, the lower the steam generation and
the higher the exit gas temperature. This is due to the smaller amount of
steam generated with higher steam temperature and hence a smaller
heat sink at the economizer.
4 Partial load operation of a gas turbine also results in poor HRSG
performance, as shown above.
So how can we improve the HRSG performance? There are several options.
Designs with Low Pinch and Approach Points
Pinch and approach points determine HRSG temperature profiles. If we have to
work with only a single-pressure HRSG and there is no additional heat recovery
Copyright © 2003 Marcel Dekker, Inc.

equipment such as a deaerator coil or condensate heater, we can use low pinch
and approach points to maximize steam generation. However, the surface area
requirements increase due to the low log-mean temperatures in the evaporator and
economizer, which adds to the cost of the HRSG slightly and increases the gas
pressure drop. The major components of the HRSG such as controls and
instrumentation, drum size, casing, and insulation do not change in a big way,
and the additional cost of heating surfaces may not be that significant if we look
at the overall picture. However, an economic evaluation may be done as shown in
Q8.40.
Fired HRSGs
The advantages of fired HRSGs were discussed earlier. Firing increases the steam
generation and lowers the HRSG exit gas temperature with a fuel utilization of
nearly 100%. The additional fuel fired increases the HRSG duty by the same
amount compared to, say, 92% in a steam generator.
Using Secondary Surfaces
Because single-pressure HRSGs are not very efficient, one may consider adding
secondary surfaces such as as a deaerator coil or condensate heater or a heat
exchanger as shown in Fig. 1.18 to lower the stack gas temperature.
Multiple-Pressure HRSGs
Before going into this option, one should clearly understand when multiple-
pressure options are justified. From the discussion on HRSG simulation, it can be
seen that the exit gas temperature in an HRSG depends on the steam pressure and
temperature. The higher the steam pressure, the higher the exit gas temperature.
Hence when high pressure steam is generated, it will not be possible to cool the
exhaust gases to an economically justifiable level with a single-pressure HRSG.
Hence multiple-pressure steam generation is warranted. Also, one can maximize
energy recovery by doing several things such as rearranging heat transfer
surfaces, splitting up economizers, superheaters, and evaporators so that the
gas temperature profiles match the steam and water temperatures and no large
imbalance exists between the gas and steam temperatures. This can be done by
using a program such as the HRSGS program (see Q8.37). In small HRSGs,
multiple-pressure steam generation may not often be viable due to the complexity
of the HRSG design and cost.
Copyright © 2003 Marcel Dekker, Inc.
zyed
Texte surligné
zyed
Texte surligné

FIGURE 1.18a Secondary surfaces to improve HRSG efficiency. 1, turbine; 2, deaerator; 3, HRSG; 4,mixing tank; 5, pump; 6, deaerator coil; 7, condenser; 8, heat exchange; 9, condensate heater.
Copyright © 2003 Marcel Dekker, Inc.

FIGURE 1.18b Continued
Copyright © 2003 Marcel Dekker, Inc.

HIPPS
Several teams of large companies in the United States are developing a coal-fired
high performance system, also called HIPPS. In this combined cycle plant, a fluid
bed air-blown pyrolyzer converts coal into fuel gas and char. The char is fired in a
high temperature advanced furnace, which heats up both air for a gas turbine and
steam for a steam turbine. The air is heated to 1400�F. The gas turbine combustor
raises the air temperature to 2350�F and generates power in the gas turbine. High
pressure steam is also generated in the HRSG [11].
CHENG CYCLE
One of the variations in cogeneration systems using gas turbines is the Cheng
cycle. This system is ideal for plants with varying electrical and steam loads. It
consists of a gas turbine with an HRSG, which has a superheater, evaporator, and
economizer (Fig. 1.19). A duct burner is located between the superheater and
evaporator. The HRSG generates saturated steam, which is superheated in the
superheater and injected into the gas turbine, which increases its electrical power
output significantly. The figure shows an Allison 501K machine, which normally
generates 3.5MW, in injection mode about 6MW. The superheater is capable of
running dry, that is, without steam. When only process steam is required,
saturated steam from the evaporator is used. When additional process steam is
required, the duct burner is fired. Hence the HRSG can operate in a variety of
modes and at various points as shown in the figure by varying the amount of
steam injected into the gas turbine and by varying the amount of fuel fired in the
duct burner. Thus the plant can vary the ratio of power to process steam
significantly according to the cost of fuel or electricity and thus optimize the
overall efficiency. Cogeneration plants with fluctuating steam and power demands
are ideal candidates for the Cheng cycle. The system’s proven success in small-
scale plants is now being applied to midsized gas turbines ranging from
50 to 125MW. Cheng cycle systems are in operation in over 50 installations
worldwide.
HAT CYCLE
Another concept that is being studied is the humidified air turbine (HAT) cycle.
This is an intercooled, regenerated cycle with a saturator that adds a considerable
amount of moisture to the compressor discharge as shown in Fig. 1.20. The
combustor inlet contains 20–40% water vapor, depending on whether the fuel is
natural gas or gasified coal gas. The intercooling reduces the compressor work,
while the water vapor in the exhaust gases increases the turbine output. Capital
cost is lowered by the absence of steam turbine and condenser system. The gas
Copyright © 2003 Marcel Dekker, Inc.
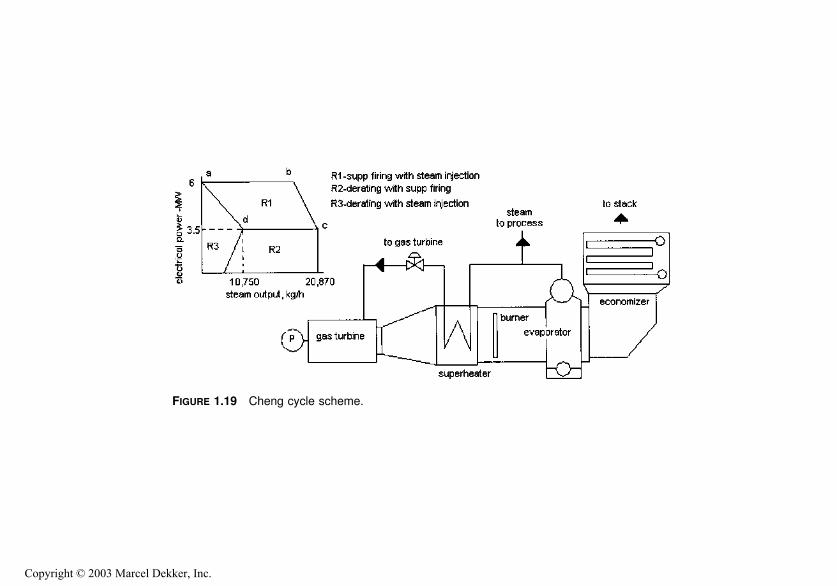
FIGURE 1.19 Cheng cycle scheme.
Copyright © 2003 Marcel Dekker, Inc.

turbine combustor design is modified to handle the large amount of water vapor
in the incoming air. Cycle efficiency is expected to be in the range of 55% LHV
with a significant increase in power output.
DIESEL ENGINE HEAT RECOVERY
Diesel engines are widely used as sources of power when an electrical utility
supply is not available. They may be fired on gaseous or liquid fuels. They are
mostly employed in low and medium power cogeneration units, typically 50 kW
to 10MW for natural gas firing, 50 kW to 50MW for diesel, and 2.5–50MW for
heavy fuel oils. They are widely used in countries where the electricity supply is
not reliable. Diesel plants have several advantages and features:
Medium-sized reciprocating engines have substantially higher electrical
efficiencies than gas turbines of similar size (34–40% vs. 25–30%).
Partial load efficiencies are also higher.
They require lower fuel gas pressure for operation—20–40 psig compared
to 180–400 psig for gas turbines.
Electrical power output is less sensitive to ambient air temperature. The
output of a gas turbine drops off at higher ambient temperatures as
discussed above.
Capital costs are higher than these for gas turbines by 10–25%. Operating
and maintenance costs are also higher, but diesel engines can be used on
heavy fuel oils, so fuel costs are lower. Developing countries use diesel
engine sets for on-site power needs because the power supply is not
dependable in many locations.
In applications calling for high power to heat recovery, hot water or low-
pressure steam, reciprocating engines are preferred to gas turbines. A
lower exhaust gas temperature (650–800�F) makes them less suitable for
high pressure heat recovery systems than gas turbines; also, the exhaust
FIGURE 1.20 HAT cycle scheme. A, intercooler; B, aftercooler; C, recuperator.
Copyright © 2003 Marcel Dekker, Inc.
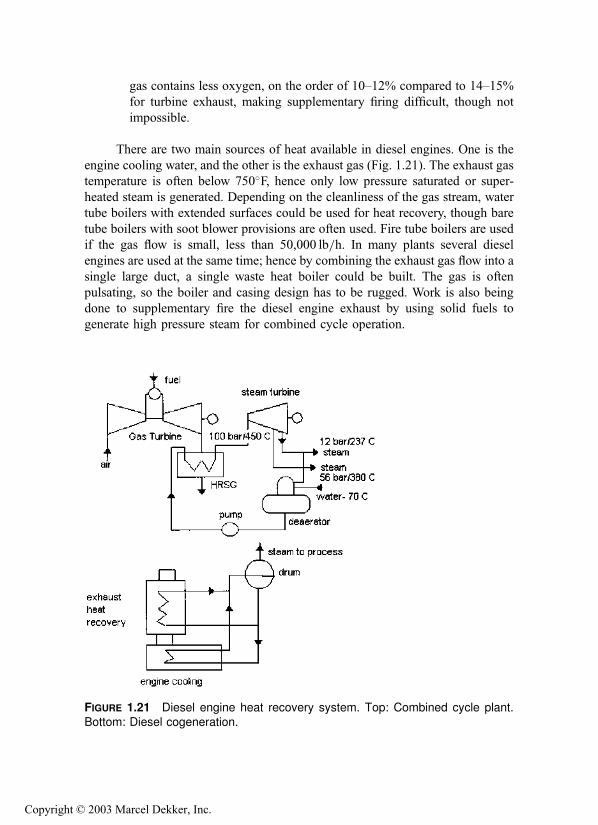
gas contains less oxygen, on the order of 10–12% compared to 14–15%
for turbine exhaust, making supplementary firing difficult, though not
impossible.
There are two main sources of heat available in diesel engines. One is the
engine cooling water, and the other is the exhaust gas (Fig. 1.21). The exhaust gas
temperature is often below 750�F, hence only low pressure saturated or super-
heated steam is generated. Depending on the cleanliness of the gas stream, water
tube boilers with extended surfaces could be used for heat recovery, though bare
tube boilers with soot blower provisions are often used. Fire tube boilers are used
if the gas flow is small, less than 50,000 lb=h. In many plants several diesel
engines are used at the same time; hence by combining the exhaust gas flow into a
single large duct, a single waste heat boiler could be built. The gas is often
pulsating, so the boiler and casing design has to be rugged. Work is also being
done to supplementary fire the diesel engine exhaust by using solid fuels to
generate high pressure steam for combined cycle operation.
FIGURE 1.21 Diesel engine heat recovery system. Top: Combined cycle plant.Bottom: Diesel cogeneration.
Copyright © 2003 Marcel Dekker, Inc.

REFERENCES
1. JB Kitto. Developments in pulverized coal-fired boiler technology. Presented to
Missouri Valley Electric Association Engineering Conference, Apr 10–12, 1996,
Kansas City.
2. Supercritical Steam Power Cycles for Power Generation Applications. Report, Dept of
Trade & Industry, London, UK, Jan 1999.
3. I Stambler. Kalina bottoming cycle 3.2MW demo plant rated 26.9% efficiency. Gas
Turbine World, March-April 1992.
4. J Corman. Kalina cycle looks good for combined cycle generation. Modern Power
Systems Review, July 1995.
5. A Kalina. Kalina cycle promises improved efficiency. MPS Review, January 1987.
6. Editor. Enhancing gas turbine performance. Power, September 1995.
7. Boswell. Choose best options for enhancing combined cycle output. Power, Septem-
ber 1993.
8. GE Report. Advanced Technology Combined Cycles. General Electric Corp, October
2000.
9. Editor. Advanced gas turbines provide high efficiency and low emission. Power
Engineering, March 1994.
10. US Dept of Energy. Clean Coal Technology Report—Wabash River Coal Gasification
Repowering Project, November 1996.
11. V Ganapathy. Understand boiler performance characteristics. Hydrocarbon Proces-
sing, August 1994.
12. V Ganapathy. Heat-recovery steam generators: understand the basics. Chemical
Engineering Progress, August 1996.
13. V Ganapathy. Efficiently generate steam from cogeneration plants. Chemical Engi-
neering, May 1997.
14. D Franus. The gas turbine powered electrical power generation market 2001–2010.
Cogeneration and On-Site Power Production, July–August 2001.
Copyright © 2003 Marcel Dekker, Inc.
2
Heat Recovery Boilers
INTRODUCTION
Heat recovery boilers, also known as waste heat recovery boilers or heat recovery
steam generators (HRSGs), form an inevitable part of chemical plants, refineries,
power plants, and process systems. They are classified in several ways, as can be
seen in Fig. 2.1, according to the application, the type of boiler used, whether the
flue gas is used for process or mainly for energy recovery, cleanliness of the gas,
and boiler configuration, to mention a few. The main classification is based on
whether the boiler is used for process purposes or for energy recovery. Process
waste heat boilers are used to cool waste gas streams from a given inlet
temperature to a desired exit temperature for further processing purposes. An
example can be found in the chemical industry in a sulfuric acid or hydrogen
plant where the gas stream is cooled to a particular gas temperature and then
taken to a reactor for further processing. The exit gas temperature from the boiler
is an important parameter affecting the downstream process reactions and hence
is controlled by using a gas bypass system. Steam generation is of secondary
importance in such plants. In energy recovery applications, on the other hand, the
gas is cooled as much as possible while avoiding low temperature corrosion.
Examples can be found in gas turbine exhaust heat recovery or flue gas heat
Copyright © 2003 Marcel Dekker, Inc.
zyed
Texte surligné

FIGURE 2.1 Classification of waste heat boilers.
Copyright © 2003 Marcel Dekker, Inc.

recovery from incinerators, furnaces, and kilns. The objective here is to maximize
energy recovery.
If the gas stream is clean, water tube boilers with extended surfaces may be
used. In solid or liquid waste incineration applications, the gas is generally dirty
and may contain corrosive compounds, acid vapors, ash, and particulates. If the
ash contains compounds of sodium, potassium, or nonferrous metals, slagging is
likely on heat transfer surfaces if these compounds become molten. In these
cases, bare tube boilers with provision for cleaning the tubes with soot blowers or
a rapping mechanism are used. A water-cooled furnace, which cools the gas
stream to a temperature below the ash melting temperature and hence minimizes
slagging on the convective surfaces, may also be necessary.
Generally if the gas inlet temperature is high, say above 1400�F, a single-
pressure heat recovery system is adequate to cool the gases to about 300–350�F.In gas turbine exhaust heat recovery applications with a low inlet gas temperature
to the HRSG of 900–1000�F, a single-pressure heat recovery system cannot cool
the gases adequately and a multipressure steam system is often required.
In the United States HRSGs are generally of natural circulation design,
whereas in Europe it is very common to see once-through and forced circulation
designs. The features of these boilers are discussed later.
Flue gas analysis is important to the design of the boiler. A large amount of
water vapor or hydrogen increases the specific heat and thermal conductivity of
the gas and hence the boiler duty and heat flux. For example, the reformed gas in
hydrogen plants has a large volume of hydrogen and water vapor, which increases
the heat transfer coefficient by 500–800% compared to typical flue gases. Hence
heat flux is of concern in these types of boilers. Hydrogen chloride (HCl) vapor in
the flue gases indicates corrosive potential, particularly if a superheater operating
at high metal temperatures, say exceeding 900�F, is present. The presence of
sulfur trioxide (SO3) vapor and HCl also suggests low temperature corrosion
problems due to their low acid dew points. Flue gas pressure in waste heat boilers
is typically atmospheric or a few inches of water column (in. WC) above or below
atmospheric pressure; however, there are applications such as the use of a
reformed gas boiler or synthesis gas boiler in hydrogen or ammonia plants
where the gas pressure could be as high as 300–1500 psig (see Chap. 8, Table
8.46). Fire tube boilers are generally preferred for these applications, though
special water tube boiler designed with heat transfer surfaces located inside
pressure vessels have been built.
A common classification of boilers is based on whether the gas flows
inside or outside the tubes. In fire tube boilers, the flue gases flow inside the tubes
(Fig. 2.2), whereas in water tube boilers, the gas flows outside the tubes as
shown in Fig. 2.3. The features of each type are discussed in the following
section.
Copyright © 2003 Marcel Dekker, Inc.
zyed
Texte surligné
zyed
Texte surligné
zyed
Texte surligné

FIGURE 2.2 Fire tube waste heat boiler with superheater and economizer. (Courtesy of ABCO Industries, Abilene,
TX.)
Copyright © 2003 Marcel Dekker, Inc.
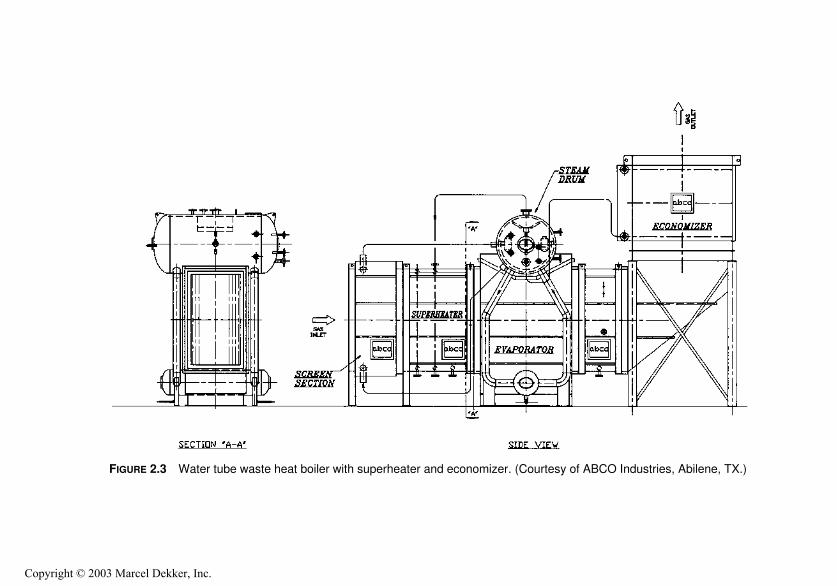
FIGURE 2.3 Water tube waste heat boiler with superheater and economizer. (Courtesy of ABCO Industries, Abilene, TX.)
Copyright © 2003 Marcel Dekker, Inc.
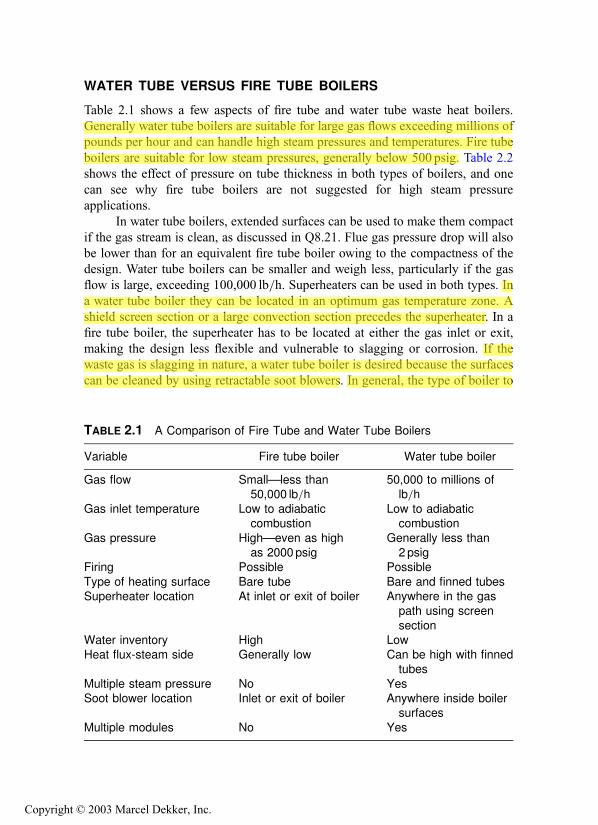
WATER TUBE VERSUS FIRE TUBE BOILERS
Table 2.1 shows a few aspects of fire tube and water tube waste heat boilers.
Generally water tube boilers are suitable for large gas flows exceeding millions of
pounds per hour and can handle high steam pressures and temperatures. Fire tube
boilers are suitable for low steam pressures, generally below 500 psig. Table 2.2
shows the effect of pressure on tube thickness in both types of boilers, and one
can see why fire tube boilers are not suggested for high steam pressure
applications.
In water tube boilers, extended surfaces can be used to make them compact
if the gas stream is clean, as discussed in Q8.21. Flue gas pressure drop will also
be lower than for an equivalent fire tube boiler owing to the compactness of the
design. Water tube boilers can be smaller and weigh less, particularly if the gas
flow is large, exceeding 100,000 lb=h. Superheaters can be used in both types. In
a water tube boiler they can be located in an optimum gas temperature zone. A
shield screen section or a large convection section precedes the superheater. In a
fire tube boiler, the superheater has to be located at either the gas inlet or exit,
making the design less flexible and vulnerable to slagging or corrosion. If the
waste gas is slagging in nature, a water tube boiler is desired because the surfaces
can be cleaned by using retractable soot blowers. In general, the type of boiler to
TABLE 2.1 A Comparison of Fire Tube and Water Tube Boilers
Variable Fire tube boiler Water tube boiler
Gas flow Small—less than50,000 lb=h
50,000 to millions oflb=h
Gas inlet temperature Low to adiabaticcombustion
Low to adiabaticcombustion
Gas pressure High—even as highas 2000 psig
Generally less than2 psig
Firing Possible Possible
Type of heating surface Bare tube Bare and finned tubesSuperheater location At inlet or exit of boiler Anywhere in the gas
path using screen
sectionWater inventory High LowHeat flux-steam side Generally low Can be high with finned
tubes
Multiple steam pressure No YesSoot blower location Inlet or exit of boiler Anywhere inside boiler
surfaces
Multiple modules No Yes
Copyright © 2003 Marcel Dekker, Inc.
zyed
Texte surligné
zyed
Texte surligné
zyed
Texte surligné
zyed
Texte surligné

be used for a particular case is determined by the experience of the manufacturer.
Sometimes a combination of fire and water tube boilers is used to suit special
needs.
HEAT RECOVERY IN SULFUR PLANTS
A sulfur plant forms an important part of a gas processing system in a refinery.
Sulfur is present in natural gas as hydrogen sulfide (H2S); it is the by-product of
processing natural gas and refining high sulfur crude oils. For process and
combustion applications, the sulfur in the natural gas has to be removed. Sulfur
recovery refers to the conversion of hydrogen sulfide to elemental sulfur. The
most common process for sulfur removal is the Claus process, which recovers
about 95–97% of the hydrogen sulfide in the feedstream. Waste heat boilers are
an important part of this process (Fig. 2.4).
The Claus process used today is a modification of a process first used in
1883, in which H2S was reacted over a catalyst with air to form elemental sulfur
and water. The reaction is expressed as
H2Sþ 1=2O2 �! Sþ H2O
Control of this exothermic reaction was difficult, and sulfur recovery efficiency
was low. Modifications later included burning one third of the H2S to produce
sulfur dioxide, SO2, which is reacted with the remaining H2S to produce
elemental sulfur. This process consists of multistage catalytic oxidation of
hydrogen sulfide according to the reactions
2H2Sþ 3O2 ! 2SO2 þ 2H2Oþ heat
2H2Sþ O2 ! 2Sþ 2H2O
Each catalytic stage consists of a gas reheater, a catalyst chamber, and a
condenser as shown in Fig. 2.4.
TABLE 2.2 Tube Thickness vs. Steam Pressure—ASME Sec 1
Tube thicknessa
(in.)
External pressure
(psig)
Internal pressure
(psig)
0.105 575 1147
0.120 686 13390.135 800 15330.150 921 1730
0.180 1172 2137
a2 in. OD, SA 178a and SA 192 carbon steel tubes at 700�F.
Copyright © 2003 Marcel Dekker, Inc.
zyed
Texte surligné
zyed
Texte surligné
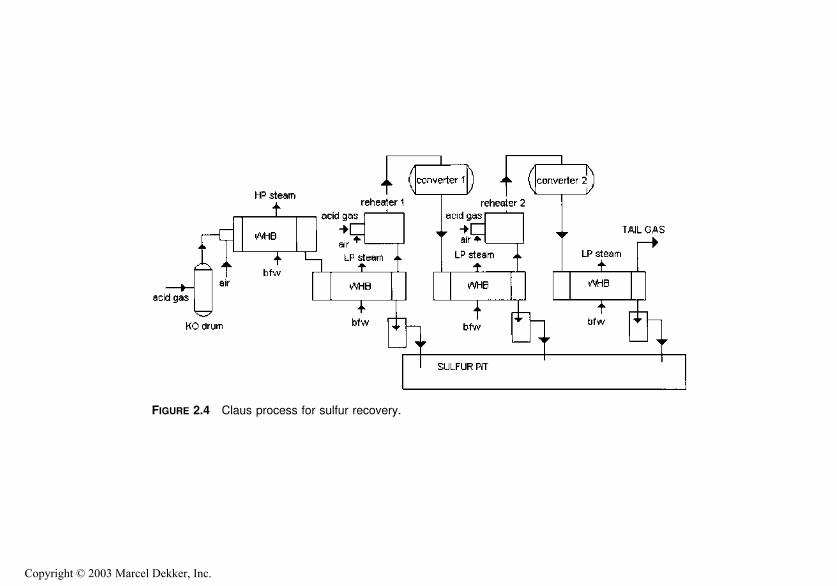
FIGURE 2.4 Claus process for sulfur recovery.
Copyright © 2003 Marcel Dekker, Inc.

In addition to the oxidation of H2S to SO2 and the reaction of SO2 with
H2S in the reaction furnace, many other side reactions occur, such as
CO2 þ H2S ! COS þ H2O
COSþ H2S ! CS2 þ H2O
2COS ! CO2 þ CS2
The gas stream contains CO2;H2S; SO2;H2;CH4, and water vapor in
addition to various species of sulfur. The duty of the boiler behind the sulfur
combustor includes both sensible heat from cooling of the gas stream from
2600�F to about 650�F and the duty associated with the transformation of various
species of sulfur. The reaction furnace normally operates at 1800–2800�F, and theflue gases are cooled in a waste heat boiler (Fig. 2.5), in which saturated steam at
about 600 psig is generated. This is typically of two-gas-pass design, though
single-pass designs have been used. The gas is cooled to about 1200�F in the first
pass and finally to about 650�F in the two-pass boiler.
Figure 2.6 shows the boiler for a large sulfur recovery plant, which consists
of two separate shells for each pass connected to a common steam drum. The
steam drum is external to the boiler. The external downcomer and riser system
ensures adequate cooling of the tubes and the tube sheet, which is refractory-
lined; ferrules are also used for further protection of the tube sheet. Ferrules are
generally made of ceramic material and are used to transfer the heat from the hot
flue gases (at about 2800�F) to the tubes, which are cooled by water. The
refractory on the tube sheet, which is about 4 in. thick and made of a high grade,
high density castable, lowers the tube sheet temperature at the hot end and thus
limits the thermal stress across it. The inlet gas chamber is also refractory-lined.
The casing is kept above 350–400�F through a combination of internal and
external insulation to minimize concerns regarding acid dew point corrosion. This
is often referred to as ‘‘hot casing.’’ Q8.56 discusses this concept. The exit gas
chamber is externally insulated, as are also the drum, downcomer, riser pipes, and
exchanger. The high pressure saturated steam, which is generated at about 600–
650 psig, is purified by using steam drum internals and sent for process use.
About 65–70% of the sulfur is removed in the boiler as liquid sulfur by using
heated drains.
Though the boiler generally operates above the sulfur dew point, some
sulfur may condense at partial loads and during transient start-up or shutdown
mode. The cooled gases exiting the exchanger are reheated to maintain acceptable
reaction rates and to ensure that process gases remain above the sulfur dew point
and are sent to the catalyst beds for further conversion as shown in Fig. 2.4. The
catalytic reactors using alumina or bauxite catalysts operate at lower tempera-
tures, ranging from 200 to 315�C. Because this reaction represents an equilibrium
chemical reaction, it is not possible for a Claus plant to convert all of the
Copyright © 2003 Marcel Dekker, Inc.

FIGURE 2.5 Waste heat boiler for sulfur recovery plant. (Courtesy of ABCO Industries, Abilene, TX.)
Copyright © 2003 Marcel Dekker, Inc.
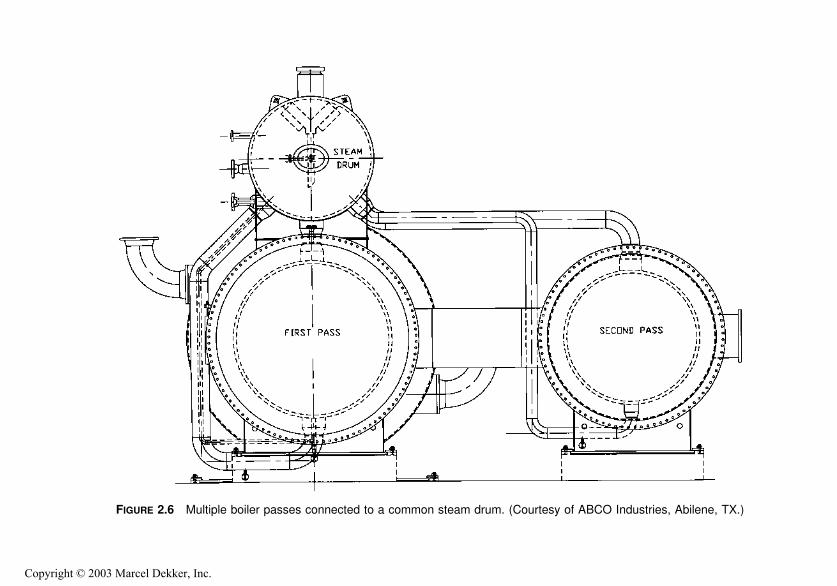
FIGURE 2.6 Multiple boiler passes connected to a common steam drum. (Courtesy of ABCO Industries, Abilene, TX.)
Copyright © 2003 Marcel Dekker, Inc.

incoming sulfur to elemental sulfur. Therefore two or more stages are used. Each
catalytic stage can recover one half to two-thirds of the incoming sulfur. Acid gas
is also introduced at each catalyst stage as shown. The gas stream from each stage
is cooled in another low pressure boiler, called the sulfur condenser, which
condenses some of the sulfur. These gas streams generate low pressure steam at
about 50–70 psig in the sulfur condenser.
If the flue gas quantity is small, a single-shell fire tube boiler handles all the
streams from the reactors (Fig. 2.7). Each stage has its own gas inlet and exit
connections. The outlet gas temperatures of these exchangers are around 330–
360�F. From the condenser of the final catalytic stage the process stream passes
on to some form of tail gas treatment process. The tail gas contains H2S; SO2,
sulfur vapor, and traces of other sulfur compounds and is further treated
downstream and vented.
SULFURIC ACID PLANT HEAT RECOVERY
Sulfuric acid is an important chemical that is manufactured using the contact
process. Heat recovery plays a significant role in this system, whose main
objective, is to cool the gas stream to a desired temperature for further processing.
FIGURE 2.7 Sulfur condenser. (Courtesy of ABCO Industries, Abilene, TX.)
Copyright © 2003 Marcel Dekker, Inc.
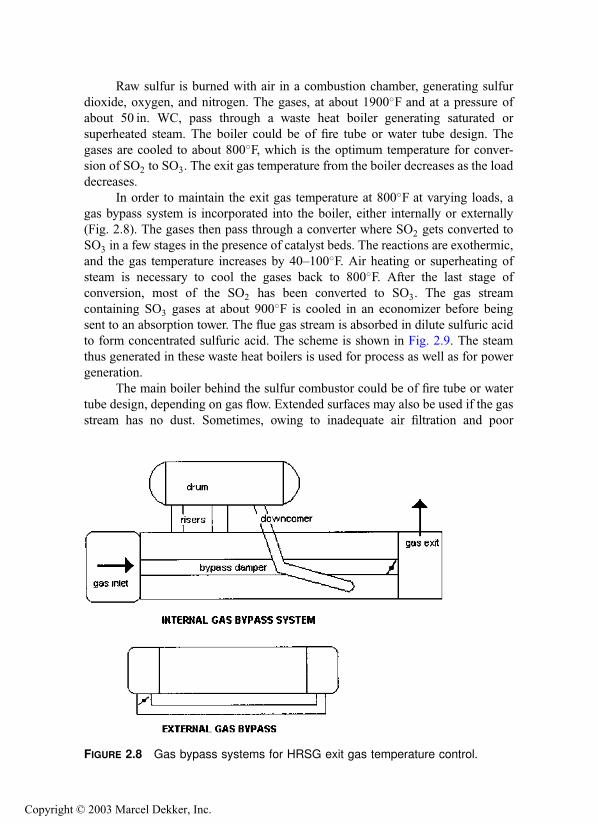
Raw sulfur is burned with air in a combustion chamber, generating sulfur
dioxide, oxygen, and nitrogen. The gases, at about 1900�F and at a pressure of
about 50 in. WC, pass through a waste heat boiler generating saturated or
superheated steam. The boiler could be of fire tube or water tube design. The
gases are cooled to about 800�F, which is the optimum temperature for conver-
sion of SO2 to SO3. The exit gas temperature from the boiler decreases as the load
decreases.
In order to maintain the exit gas temperature at 800�F at varying loads, a
gas bypass system is incorporated into the boiler, either internally or externally
(Fig. 2.8). The gases then pass through a converter where SO2 gets converted to
SO3 in a few stages in the presence of catalyst beds. The reactions are exothermic,
and the gas temperature increases by 40–100�F. Air heating or superheating of
steam is necessary to cool the gases back to 800�F. After the last stage of
conversion, most of the SO2 has been converted to SO3. The gas stream
containing SO3 gases at about 900�F is cooled in an economizer before being
sent to an absorption tower. The flue gas stream is absorbed in dilute sulfuric acid
to form concentrated sulfuric acid. The scheme is shown in Fig. 2.9. The steam
thus generated in these waste heat boilers is used for process as well as for power
generation.
The main boiler behind the sulfur combustor could be of fire tube or water
tube design, depending on gas flow. Extended surfaces may also be used if the gas
stream has no dust. Sometimes, owing to inadequate air filtration and poor
FIGURE 2.8 Gas bypass systems for HRSG exit gas temperature control.
Copyright © 2003 Marcel Dekker, Inc.

combustion, particulates are present in the flue gases, which could preclude the
use of finned tubes. One has to be concerned about the casing design because of
the possibility of sulfur condensation and corrosion. Soot blowing is not
recommended, because it affects the gas analysis and adds moisture to the flue
gases and may cause acid condensation.
Water-cooled furnace designs have an advantage in that the casing operates
at the saturation temperature of steam, hence acid corrosion is unlikely. The main
concern in sulfuric acid plants is corrosion due to acid condensation from
moisture reacting with SO3. This is minimized by starting up and shutting
down the plants on clean fuels if possible and avoiding frequent start-ups and
shutdowns, which induce a cooler environment for possible acid condensation
over the exchanger or economizer tubes. The boiler and exchanger casings must
also be maintained above the dew point by using a ‘‘hot casing’’ design, which
reduces the heat loss to the surroundings while at the same time keeping the
casing hot, above 350–400�F, as required. Boilers may be kept in hot standby if
frequent shutdowns and start-ups are likely.
The feedwater temperature as it enters the economizer has to be high, often
above 320�F, to minimize acid dew point corrosion because the gas contains SO3.
Carbon steel tubes with continuously welded solid fins have been used in several
plants in the United States, whereas in Europe and Asia cast iron gilled tubes
shrunk over carbon steel tubes are widely used. In a few projects, the sulfur
deposits found their way between the gilled iron rings and the tubes and caused
corrosion problems. The choice of tube materials is based on the preference and
experience of the end user and the boiler supplier.
FIGURE 2.9 Scheme of a sulfuric acid plant. 1, sulfur combustion furnace; 2,waste heat boiler; 3, contact apparatus; 4, superheater; 5, economizer; 6,absorption tower.
Copyright © 2003 Marcel Dekker, Inc.

The internal gas bypass system increases the shell diameter compared to the
external bypass system. The bypass pipe also cools the gases to some extent, so
the damper is not exposed to the high temperature gases as in the external bypass
system, where the damper is located in a refractory-lined pipe and handles the hot
inlet gases. Operability and maintenance of the damper are important aspects of
boiler operation. Both internal and external gas bypass systems have been used in
the industry.
In fire tube boilers, ferrules and the refractory lining on the tube sheet
protect the tube sheet from the hot gases. An external steam drum with down-
comers and risers ensures adequate circulation of the steam–water mixture inside
the shell.
HEAT RECOVERY IN HYDROGEN PLANTS
Hydrogen and ammonia are valuable chemicals in various processes. The steam
reforming process is widely used to produce hydrogen from fossil fuels such as
natural gas, oil, or even coal as shown in Fig. 2.10. There are several variations of
the process, but basically the steam reforming process converts a mixture of
hydrocarbons and steam into hydrogen, methane, and carbon dioxide in the
presence of nickel catalyst inside tubes. Before entering the reformer, the natural
gas has to be desulfurized in order to protect the reformer tubes and catalysts
from sulfur poisoning. The desulfurized gas is mixed with process steam,
preheated to about 500�C in the flue gas boiler, then sent through the tubes of
the reformer. Reactions occur inside the tubes of the reformer at 800–950�C.
FIGURE 2.10 Steam reforming process in hydrogen plants. 1, natural gas; 2,
sulfur removal; 3, reformer; 4, reformed gas boiler; 5, flue gas boiler; 6, shiftconverter; 7, air preheater; 8, air; 9, CO2 removal and methanation; 10, PressureSwing Adsorption (PSA); 11, H2 product; 12, stack; 13, CO2 by-product.
Copyright © 2003 Marcel Dekker, Inc.

Reforming pressures range from 20 to 40 atm, depending on the process
equipment supplier.
CnHm þ nH2O ! nCOþ ðm=2þ nÞH2
CH4 þ H2O Ð COþ 3H2
COþ H2O Ð CO2 þ H2
The overall reaction is highly endothermic, so the reaction heat has to be provided
from outside by firing fuel such as natural gas or naphtha outside the tubes. This
generates flue gases, typically at 1800�F and atmospheric pressure, that are used
to generate high pressure superheated steam in a water tube waste heat boiler,
generally referred to as a flue gas boiler. The flue gases also preheat the steam–
fuel mixture and air.
In some processes the effluents of the primary reformer are led to the
secondary reformer, where they are mixed with preheated air. Chemical reactions
occur, and the catalysts convert the methane partly to hydrogen. The effluent from
the reformer, called reformed gas, is at a high gas pressure, typically 20–40 atm,
and contains hydrogen, water vapor, methane, carbon dioxide, and carbon
monoxide. This gas stream is then cooled from about 1600�F to 600�F in a
reformed gas boiler, which is generally an elevated drum fire tube boiler (Fig.
2.11) with provision for gas bypass control to maintain the exit gas temperature
constant at all loads. The exit gas temperature from the boiler decreases as the
duty of the boiler decreases, and the bypass valve adjusts the flow between the
incoming hot gases and the cool exit gases to maintain a constant exit gas
temperature at all loads. The cooled gases then enter a shift converter, where CO
is converted to CO2 in the presence of catalyst and steam. Additional hydrogen is
also produced. The exothermic reaction raises the gas temperature to about 800�F.The CO content is reduced from about 13% to 3%. Awaste heat boiler referred to
as a converted gas boiler cools the gas stream before it enters the next stage of
conversion, where CO is reduced to less than 0.3%. The next stage is the
methanator, in which catalysts convert traces of CO and CO2 to methane and
water vapor. The H2;CO, and unreacted methane are then separated. This
produces a gas stream that can be recycled to process feed and produce hydrogen
of 98–99% purity that is further purified by the pressure swing adsorption
method. In older plants carbon dioxide is removed in a liquid absorption system
and finally the gas goes through a methanation step to remove residual traces of
carbon oxides.
In large plants, the flue gas and reformed gas boilers are separate units but
have a common steam system, whereas in small hydrogen plants these boilers can
be combined into a single module. The flue gas boiler is a water tube unit; the
reformed and converted gas boilers are fire tube units connected to the same
steam drum. The flue gas boiler contains various heating surfaces such as the feed
Copyright © 2003 Marcel Dekker, Inc.

preheat coil, evaporator, superheater, economizer, and air heater. The casing is
refractory-lined, and extended surfaces are used where feasible because the gas
stream is generally clean. The steam generated in the reformed gas boiler is often
combined with the saturated steam generated in the flue gas boiler and then
superheated in the superheater of the flue gas boiler. This is a substantial quantity
of steam (often referred to as import steam), so the performance of the super-
heater must be checked for cases when the import steam quantity diminishes or is
reduced to zero for various reasons.
The reformed gas boiler, which handles gases containing a large volume of
hydrogen and water at high pressure, operates at high heat flux; the heat transfer
coefficient with reformed gases is about 6–8 times higher than those of typical
flue gases from combustion of natural gas; see Q8.64. Hence the heat flux at the
inlet to the reformed gas boiler is limited to less than 100,000 Btu=ft2h to
minimize concerns about vapor formation over the tubes and possible departure
from nucleate boiling conditions (DNB). The gas properties for typical reformed
gas and flue gases are listed in Table 8.45 (Chap. 8). The higher thermal
conductivity and specific heat and lower viscosity coupled with higher mass
FIGURE 2.11 Reformed gas boiler with internal gas bypass system. (Courtesy ofABCO Industries, Abilene, TX.)
Copyright © 2003 Marcel Dekker, Inc.

flow per tube leads to higher heat transfer rates and hence higher heat flux in
reformed gas boilers. Note that the heat transfer coefficient is proportional to
specific heat
viscosity
� �0:4
� ðthermal conductivityÞ0:6
as discussed in Q8.02.
Generally fire tube boilers are ideal for high gas pressures, though a few
European suppliers have built water tube designs for this application.
GAS TURBINE HRSGs
Gas turbine–based combined cycle and cogeneration plants are springing up
throughout the world. The advantages of gas turbine plants are discussed in
Chapter 1. Though gas turbine exhaust is used to heat industrial heat transfer
fluids and gases, the emphasis here will be on steam generation. Gas turbine
exhaust is clean; therefore water tube boilers with extended surfaces are the
natural choice for heat recovery applications. It is also relevant here to mention
briefly a few peculiar aspects of gas turbine exhaust gases in order to understand
the design features of HRSGs better.
As discussed in Chapter 1, gas turbine combustor temperature is limited to
about 2400–2500�F for metallurgical reasons. Therefore a large amount of
compressed air is used to cool the flame, which in turn increases the exhaust
gas flow from the turbine. After expansion in the turbine, the gas exits at about
1000�F and at a few inches of water column above atmospheric pressure. The
exhaust gas contains about 6–10% by volume (vol%) of water vapor and about 14
vol% of oxygen. Gas turbines that are heavily injected with steam have a different
exhaust gas analysis, which is discussed later. The large amount of oxygen in the
exhaust gases enables fuel to be fired in the exhaust gases without the addition of
air; the higher gas inlet temperature to the HRSG in turn generates more steam in
the HRSG. Because of these large ratio of gas to steam flow compared to steam
generators, HRSGs are huge in comparison. For example, the cross section of an
unfired HRSG generating, say, 100,000 lb=h of steam will be about 6 times as
large as that of a packaged boiler generating the same amount of steam.
Another important aspect of gas turbine HRSGs is that the exhaust gas flow
remains nearly constant, and increasing the gas inlet temperature through
auxiliary fuel firing increases the steam generation. Unlike in a conventional
steam generator, the ratio of gas to steam flow in an HRSG varies significantly
with steam generation. This in turn affects the gas and steam temperature profiles
in the HRSG.
A water–steam mixture boils at a constant temperature at a given steam
pressure; hence the gas temperature distribution across the HRSG surfaces is
influenced by the saturation temperature of steam. Generally, the lower the gas
Copyright © 2003 Marcel Dekker, Inc.
zyed
Texte surligné
zyed
Texte surligné
zyed
Texte surligné
zyed
Texte surligné

inlet temperature to the HRSG, the lower will be the steam generation and the
higher the exit gas temperature. This is due to fact that the heat sink in the form of
an economizer does not have the ability to bring the exhaust gas stream to a lower
temperature. In order to cool the gas stream to a reasonably low temperature, on
the order of 250–300�F, multiple-pressure steam generation is usually required.
Heat recovery stream generators are generally of the water tube type with
extended surfaces. This makes their design compact. Because of the large duty
and low log-mean temperature differences at the various heating surfaces, plain
tubes cannot serve the purpose effectively. The resulting HRSG design would be
huge and uneconomical; the gas pressure drop also would be very high. One
exception is the furnace-fired HRSG, which is very close in design to a
conventional steam generator operating at much higher log-mean temperature
differences; bare tubes may be used in this case. Fire tube boilers are rare in gas
turbine heat recovery applications because they use plain tubes, which makes
them large and unwieldy. They are sometimes used behind small gas turbines,
often less than 3MW in size, for generating low pressure saturated steam for use
in chillers.
HRSGs AND CIRCULATION
Heat recovery steam generators are generally categorized according to the type of
circulation system used, which could be natural, forced, or once-through as
illustrated in Fig. 2.12. Natural circulation units have vertical tubes and horizontal
gas flow orientation, whereas the forced circulation HRSG uses horizontal tubes
and gases flow in the vertical direction. Once-through units can have either a
horizontal or vertical gas flow path. In natural circulation units, the difference in
density between water and steam drives the steam–water mixture through the
evaporator tubes and risers and back to the steam drum. In forced circulation
units, a pump is used to drive the steam–water mixture through the horizontal
evaporator tubes. At the steam drum, steam separates from the steam–water
mixture and dry saturated steam flows through the superheater. In once-through
designs, there is no circulation system. Water enters at one end and leaves as
steam at the other end of the tube bundle.
In Europe, vertical gas flow forced circulation units are common. These
require a circulation pump for maintaining flow through the evaporator tubes. A
recent design in Belgium has natural circulation with vertical gas flow. The
pressure drop through the evaporator tubes is limited by using an adequate
number of streams or parallel paths.
Once-Through Units
A once-through HRSG (called an OTSG) does not have a steam drum like a
natural or forced circulation unit (Fig. 2.12). An OTSG is simply made up of
serpentine coils like an economizer. Because water is converted to steam inside
Copyright © 2003 Marcel Dekker, Inc.
zyed
Texte surligné

FIGURE 2.12 HRSGs with different type of circulation systems: (a) Naturalcirculation, (b) forced circulation. (c) Once-through.
Copyright © 2003 Marcel Dekker, Inc.
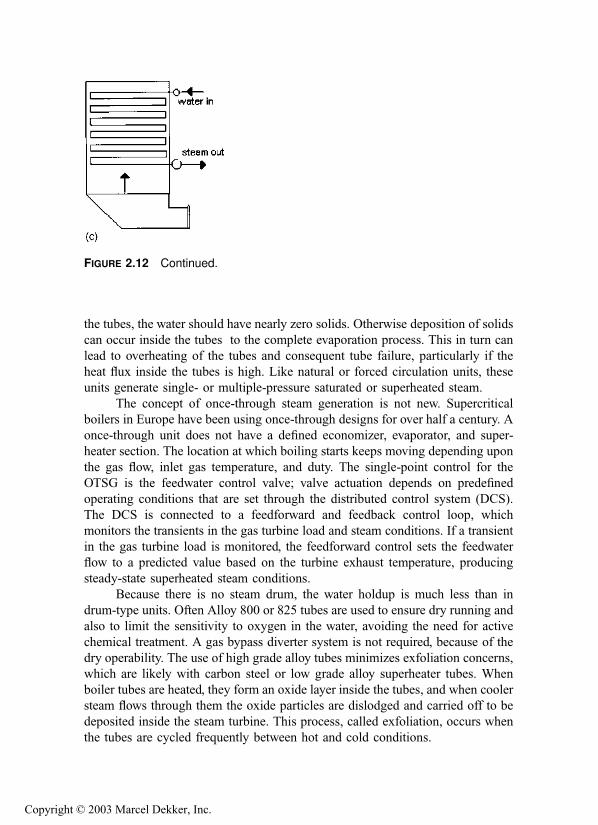
the tubes, the water should have nearly zero solids. Otherwise deposition of solids
can occur inside the tubes to the complete evaporation process. This in turn can
lead to overheating of the tubes and consequent tube failure, particularly if the
heat flux inside the tubes is high. Like natural or forced circulation units, these
units generate single- or multiple-pressure saturated or superheated steam.
The concept of once-through steam generation is not new. Supercritical
boilers in Europe have been using once-through designs for over half a century. A
once-through unit does not have a defined economizer, evaporator, and super-
heater section. The location at which boiling starts keeps moving depending upon
the gas flow, inlet gas temperature, and duty. The single-point control for the
OTSG is the feedwater control valve; valve actuation depends on predefined
operating conditions that are set through the distributed control system (DCS).
The DCS is connected to a feedforward and feedback control loop, which
monitors the transients in the gas turbine load and steam conditions. If a transient
in the gas turbine load is monitored, the feedforward control sets the feedwater
flow to a predicted value based on the turbine exhaust temperature, producing
steady-state superheated steam conditions.
Because there is no steam drum, the water holdup is much less than in
drum-type units. Often Alloy 800 or 825 tubes are used to ensure dry running and
also to limit the sensitivity to oxygen in the water, avoiding the need for active
chemical treatment. A gas bypass diverter system is not required, because of the
dry operability. The use of high grade alloy tubes minimizes exfoliation concerns,
which are likely with carbon steel or low grade alloy superheater tubes. When
boiler tubes are heated, they form an oxide layer inside the tubes, and when cooler
steam flows through them the oxide particles are dislodged and carried off to be
deposited inside the steam turbine. This process, called exfoliation, occurs when
the tubes are cycled frequently between hot and cold conditions.
FIGURE 2.12 Continued.
Copyright © 2003 Marcel Dekker, Inc.

Once-through units can also be started up or shut down very fast compared
to natural or forced circulation boilers, because the weight of steel and holdup of
water are much smaller. On the flip side, the steam pressure decay when the gas
turbine trips is likely to be faster than in designs that have much larger metal heat
and a large water inventory. It must be kept in mind that a typical gas turbine
HRSG can generally be started up in 80–100min from cold, so the saving in
start-up time may not be a significant issue unless the unit is designed for frequent
cycling. There are also a few advantages of once-through units such as absence of
downcomer and riser piping and drum and related material costs and fabrication
concerns. From the heat transfer viewpoint there should not be much of a
difference between once-through units and the natural or forced circulation units;
hence the cross section and size of the HRSG or the areas of various heating
surfaces should all be nearly the same. The flow configuration of the heating
surfaces is generally counterflow except for the evaporator, which could be in
parallel flow as in forced circulation units.
The two-phase steam-side pressure drop in the evaporator tubes is,
however, quite large and could be in the range of a few hundred psi, which is
an operating cost and must be considered in evaluating the design. In the natural
and forced circulation unit, there is no additional pressure loss associated with the
evaporator circuit, because the circulation system handles the losses and the static
head available or the circulating pump balances this loss, considering other losses
associated with the downcomer, evaporator tubes, and riser piping.
Another type of once-through unit is used in oil fields for secondary oil
recovery operations (Fig. 2.13). These generate high pressure steam ranging from
1500 to 3000 psig at 80% quality for injection into used oil fields in order to
recover additional oil. The steam pressure depends on the depth at which oil is
available. The hot, wet steam dislodges the viscous layers of oil in the ground
beneath, and thus more oil is recovered. This HRSG is also of once-through
design, with water entering at one end of the coil and leaving as wet steam at the
FIGURE 2.13 HRSG used in oil field applications.
Copyright © 2003 Marcel Dekker, Inc.
other. Because of concerns with departure from nucleate boiling (DNB), the final
portions of the coil are in parallel flow and not in counterflow and are located
behind tubes having lower steam quality. This feature helps to lower the heat flux
inside the tubes where the quality of steam is high. The allowable heat flux to
avoid DNB decreases as the steam quality increases, hence this measure. The
feedwater in these generators is generally of poor quality and has high solids
content, exceeding thousands of ppm of salts, because the water is taken from the
fields nearby and basic, inexpensive softening methods are used in its treatment.
Because sodium salts are soluble in water, the 80% quality steam, which still has
20% water, is often adequate to ensure that the salts are disolved and are not
deposited inside the tubes during the evaporation process. Single-stream designs,
in which a single tube handles the entire steam flow, are used for up to
100,000 lb=h capacity, whereas with higher steam flows, multiple streams are
employed. Due to instability problems associated with two-phase boiling of fluids
with multiple streams, a flow resistance at the inlet to each stream in the form of
orifices or control valves, as explained in Q7.36, is used. Because water at
ambient temperature is often used as feedwater, a heat exchanger is used to
preheat the incoming water, using the hotter water at the exit of the economizer
portion to minimize acid dew point concerns.
Natural and Forced Circulation HRSGs
Figures 2.12b and 2.12c show the arrangement of natural and forced circulation
HRSGs. In the natural circulation unit the differential head between the cold
water in the downcomer circuit and the hotter, less dense mixture in the riser
tubes drives the steam–water mixture through the evaporator tubes. The circula-
tion ratio (CR), which is discussed in Q7.29, is typically on the order of 8–20
depending on the system, the layout, and the size of downcomers, evaporator
tubes, and risers. The forced circulation units are sized for a particular CR,
typically 3–6. The circulation pumps provide the additional differential head to
ensure flow through the evaporator tubes. The following are some of the features
of these types of HRSGs.
1. Natural circulation units do not require a pump for maintaining
circulation through the evaporator tubes. The circulation is ensured
through natural gravity principles. The use of circulating pumps in
forced circulation units involves an operational and maintenance cost,
and their failure for some reason such as power outage or pump failure
could shut down the HRSG.
2. The water boils inside vertical tubes in natural circulation units, and the
steam bubbles formed move upward, which is the natural path for
them; hence the tube walls are completely wetted by water. As a result,
tube failures are rare, whereas with horizontal tubes there is a
Copyright © 2003 Marcel Dekker, Inc.
zyed
Texte surligné
zyed
Texte surligné
imporatant natural vs forced circulation

difference in temperature between the top and bottom portions of the
tubes, which could cause thermal fatigue. Also, if the steam–water
mixture velocity is not high enough, the vapor can separate from the
water inside the horizontal tubes, leading to steam blanketing and
possibly overheating the tubes. This is a possibility when the heat flux
inside the evaporator tubes is high, for example, in fired conditions,
particularly when a high fin density is used for the evaporator tubes.
3. Natural circulation units can tolerate higher heat flux, generally 50–
80% more than horizontal tube designs due to the vertical configura-
tion of the tubes. Also, in the event of nonuniform gas temperature or
heat flux across the cross section (which is often likely due to
maldistribution of gas flow), the tube receiving the higher heat flux
in a natural circulation unit has a higher circulation ratio or higher
steam–water mixture flow. This is due to the greater differential in fluid
densities between the more dense fluid in the downcomer circuit and
the less dense fluid inside the evaporator tubes, which is helpful and
evens out flow imbalances. In a forced circulation unit, all the
evaporator tubes receive the same steam–water flow, irrespective of
their location, unless special efforts are taken to design the orifice in
each tube as in controlled circulation utility boilers. Therefore severe
gas-side flow and temperature maldistributions can lead to the possi-
bility of tube failures or overheating in some tubes.
4. Natural circulation units require more real estate than forced circulation
units, because heating surfaces are laid out one behind the other. The
floor space occupied often runs into a few hundred square feet,
particularly with multipressure units with catalysts for NOx and CO
reduction. In forced circulation units the floor space may be small but
the height of the HRSG will be large, requiring a large amount of
supporting structural steel, ladders, and platforms.
5. During warm starts, the vertical, readily drainable superheater–reheater
arrangement in natural circulation designs eliminates concerns over
condensate carryover and impingement on hot headers and piping,
which would result in thermal stresses at the headers.
6. The horizontal gas flow configuration of natural circulation HRSG
provides an easy way to water wash the highly soluble ammonia
compounds formed downstream of the SCR when operating with a
sulfur-bearing fuel. A major deficiency of forced circulation or once-
through units with their vertical gas path arrangement is the lack of a
procedure to water wash deposits from heat transfer surfaces down-
stream of the SCR without damage to the SCR catalysts.
7. During start-up and low load periods, steam bubbles generated in the
economizer section have to flow down in the counterflow direction in
Copyright © 2003 Marcel Dekker, Inc.

once-through and forced circulation units, which is not their natural
path. To overcome steaming concerns, the feedwater control is some-
times located between the economizer and the evaporator. This
increases the design pressure of the economizer. A safety valve is
also required at the economizer.
8. The casing design for forced circulation units is typically ‘‘hot,’’ that is,
it is insulated on the outside. Hence the designer is required to use
alloy steel material for the casing, and one has to evaluate the impact of
thermal expansion.
Despite their differences and the pros and cons, all three types of HRSGs
are used throughout the world. Selection is generally based on the experience of
the plant managers, their consultants, and the end users.
INCINERATION APPLICATIONS
In chemical and industrial plants, several by-products are generated in solid,
liquid, and gaseous forms that have to be safely destroyed to prevent potential
environmental damage. These by-products come from petroleum refining and
petrochemical, pharmaceutical, paper and pulp, and plastics production. Small
quantities of by-products are stored in drums and placed in landfills, but the most
effective method of rapidly destroying a high percentage of hydrocarbon
contaminants is to oxidize the organic materials at elevated temperatures
(1500–1800�C). For some vapor streams, effective destruction of contaminants
can be achieved at lower temperatures. The carbon and hydrogen in the waste are
converted to CO2 and H2O. If the gas stream contains sulfur or chlorine or similar
substances they must be recovered or removed before venting the flue gases to the
atmosphere according to local air quality regulations. Particulates are also
generated that have to be removed.
The process of thermal oxidation of fumes, liquids, and gaseous wastes is
often carried out in thermal oxidizers or incinerators. If the waste stream has a
low heating value or low concentration, often natural gas or liquid fuels are fired
alongside to improve the combustion process. In order to destroy most of the
pollutants, incineration is carried out at temperatures ranging from 1500 to
1800�F with proper residence times, typically 1–2 s. The exhaust gas stream
contains a significant amount of energy and is recovered in the form of steam in
waste heat boilers.
If the gas stream is greater than 100,000 lb=h and clean, then a water tube
boiler with extended surfaces is the ideal choice. Fire tube boilers are also used in
incineration plants if the gas is not likely to cause slagging. A superheater and
economizer may also be used in fire tube boilers as shown in Fig. 2.2. Because of
Copyright © 2003 Marcel Dekker, Inc.
the high gas temperature at the inlet to the boiler, 1500–2000�F, the superheater
is often located downstream of the boiler as shown. The superheater steam
temperature cannot be very high, obviously, with such an arrangement; it is
typically 500–550�F depending on the steam pressure. The disadvantage of the
fire tube design is that it is difficult to have two fire tube boilers with a superheater
in between such as can be done with water tube designs. Hence we have to live
with a steam temperature that is slightly lower than those feasible with water tube
designs. Locating the superheater at the gas inlet can lead to corrosion due to the
presence of corrosive gases in the gas stream.
Bare and finned tubes are used in the design of water tube boilers,
depending upon the cleanliness of the gas, its fouling tendencies, and the gas
temperature. Simple two-drum designs, such as those shown in Chapter 8 in Fig.
8.3, in which the steam drum and mud drum are connected by plain or finned
tubes rolled into the steam and mud drums, are common. This design can have
either a refractory-lined casing or a water-cooled casing. With the refractory-lined
design, casing corrosion is a possibility if the gas stream contains corrosive acid
vapors that can seep through the refractory. Access doors or lanes can be easily
incorporated into this design. The water-cooled casing operates at the saturation
temperature of steam and ensures that corrosion concerns are minimal. The two-
drum crossflow design is suitable for small capacities, generally about 50,000–
75,000 lb=h of steam. When the amount of steam generated is much greater say
above 100,000 lb=h, an elevated steam drum with external downcomers and risers
may be justified. The steam drum should have the volume or holdup to handle a
few minutes of residence time from normal level to empty. Some plants require
this residence time to be 3–4min, and a few plants require 10–12min. In large
plants, multiple evaporators are connected to a common steam drum and
circulation system.
Figure 2.3 shows a water tube boiler consisting of a screen section,
followed by a two-stage superheater with interstage attemperation, an evaporator,
and an economizer that is used in large incineration projects handling clean
effluents. The screen section is similar to the shield section used in a fired heater
and protects the superheater from the hot gases and from external radiation from
the incinerator flame. A minimum of four rows are required to absorb the external
radiation from the cavity or flame, as discussed in Q8.09. The evaporator and the
screen sections are in parallel and are connected to the same steam drum by
external downcomers and risers. If the gas enters at a temperature in excess of
1500�F, the screen section is often designed with bare tubes. The superheater may
or may not have fins, depending on the steam and tube wall temperatures. The
evaporator has finned surfaces, which can vary from a low fin density section at
the inlet (two fins per inch) to a high fin density section (four to five fins per inch)
as the gas is cooled. This is done to minimize the heat flux inside the tubes and
also to minimize fin tip temperatures.
Copyright © 2003 Marcel Dekker, Inc.
The economizer uses a fin density of four to six fins per inch. The tubes of
all the sections are generally vertical with horizontal gas flow, as in gas turbine
HRSG plants. Superheaters are of T11, T22, or T91 material if the tube wall
temperatures are close to 1000–1100�F.In plants with large steam requirements, energy from the waste gas stream
is augmented by firing natural gas or fuel oil. In these designs, a D-type boiler
(Fig. 2.14) is an ideal choice. The burner is fitted at the front wall of the boiler
and fires into a water-cooled furnace; the waste gas stream enters the convection
bank, mixes with the furnace flue gases, then flows through the convection and
economizer sections. A superheater can be located in the convection bank behind
screen tubes. If the flue gases are clean, extended surfaces may be used in the
cooler sections of the convection bank.
Various modes of operation have to be considered in these boilers,
particularly if a superheater is used. If the waste gas stream supply is cut off,
the steam generation is reduced. Hence the total steam flow is reduced which
affects the steam temperature and the superheater tube wall temperatures. In some
cases only the waste gas stream is used, and in some other modes only the burner
is fired for generating steam. All these different cases generate different quantities
of steam and flue gases at different temperatures that enter the convection section;
hence the superheater performance has to be evaluated carefully in all these
modes. The furnace pressure is maintained at nearly zero, and an induced draft
fan handles the flow of the flue gases from the burner and the waste gas stream.
The forced draft fan just handles the combustion air to the burner.
Figure 2.15 is the schematic of a waste heat boiler for a dirty gas from a
carbon black incineration system. A D-type boiler was also used for this
application. The hot gas coming in at about 2100�F is cooled in the furnace
and then enters the convection bank. A screen section with widely spaced bare
tubes helps to minimize slagging concerns with ash particulates that have low
melting temperatures. A retractable blower also helps to clean the front end. As
the gas cools, the tube spacing can be closer.
Slagging is a serious concern when flue gases containing ash particulates
with low melting point salts are used in heat recovery applications. The slag is a
rocklike deposit that forms on cool surfaces such as tubes and solidifies as soon
as it is formed. Retractable blowers can help minimize this problem but cannot
eliminate it completely. The wide tube spacing ensures that tubes are not bridged
by the molten mass of deposits, thus preventing the flow of gases. Ash particles, if
any, are collected in hoppers located beneath the convection bank.
FOULING IN WASTE HEAT BOILERS
Fouling is a serious concern in both fire tube and water tube boilers, particularly
with dirty gas streams. It affects not only the waste heat boiler performance but
Copyright © 2003 Marcel Dekker, Inc.

FIGURE 2.14 D-type waste heat boiler for operation with burner and waste heat. (Courtesy of ABCOIndustries, Abilene, TX.)
Copyright © 2003 Marcel Dekker, Inc.

FIGURE 2.15 Waste heat boiler in carbon black plant. (Courtesy of ABCOIndustries, Abilene, TX.)
Copyright © 2003 Marcel Dekker, Inc.

also equipment such as scrubbers downstream of the boiler. When fouling sets in,
the steam generation decreases and the gas pressure drop increases over a period
of time. There are a few ways to infer if the fouling has become severe:
1. The exit gas temperature from the boiler will increase over a period of
time; if, say, the normal exit gas temperature from the convection bank
is 550�F and we observe 570–600�F for the same load, then we can
infer that fouling has set in. Fouling deposits build up over heat transfer
surfaces (whether inside or outside), and the fouling factor increases
exponentially and then tapers off as shown in Fig. 2.16. With periodic
cleaning some of the deposits are removed, which decreases the fouling
factor, but a base layer builds up and increases the exit gas temperature
and decreases the boiler duty. A complete shutdown and cleaning may
help restore the original boiler performance or close to it.
2. The gas pressure drop across the convection section increases. If the
fan power consumption increases over a period of time, then one can
infer that there is some blockage of the gas path and that fouling has set
in.
3. Steam generation naturally decreases with fouling.
4. Superheated steam temperature, if a superheater is present, has to be
looked at carefully, because fouling in different sections may be
different, and one cannot conclude that there is fouling at a given
surface without having data on the gas inlet and exit temperatures and
steam inlet and exit temperatures and flows. Sometimes steam-side
fouling is caused by deposition of salts from steam. Steam-side fouling
can increase the tube wall temperatures and cause overheating as
discussed in Q8.13. Steam-side fouling is more critical in finned
water tube boilers, as discussed in Q8.24.
One has to shut down the boiler and perform an investigation if fouling is
severe. Normal fouling may be acceptable between maintenance shutdowns. Heat
transfer calculations backed up with field data and tube wall temperature
FIGURE 2.16 Fouling in waste heat boilers versus time.
Copyright © 2003 Marcel Dekker, Inc.

measurements can also show if the fouling is on the gas side or steam side or
both. With gas-side fouling the tube wall temperatures will not increase, whereas
with steam-side fouling the tube wall temperatures can increase significantly.
With a combination of gas- and steam-side fouling, the measurement of operating
data on each side, followed by elaborate calculations, can reveal the extent of
fouling.
Because both fire tube and water tube boilers are used in HRSGs, a few
guidelines on their sizing are in order.
FIRE TUBE BOILER DESIGN CONSIDERATIONS
The sizing procedures for fire tube boilers are discussed in Q8.10. It may be noted
that the tube size plays a significant role in minimizing the length of the boiler.
With small gas flows, one may consider multi-gas-pass design, which can reduce
the overall length. Tube sizes vary from 1.5 to 2.5 in. OD; smaller tubes generally
have lower tube wall temperatures and also require less surface area and shorter
tube length. Hence a comparison of surface areas of two or more designs should
be made with caution. Heat fluxes are quite low in fire tube boilers owing to low
gas-side heat transfer coefficients, an exception being gas streams in hydrogen
plants, as discussed earlier. SA 178a carbon steel tubes are typically used for
evaporators handling common flue gases. In reformed gas applications, T11 or
T22 tubes are preferred. Gas pressure drop can range from 3 to 6 in. WC in flue
gas heat recovery boilers and about 1 psi in high gas pressure applications such as
reformed gas boilers.
Boiler circulation may be checked using methods discussed in Q7.32. With
poor water quality, fouling and scale formation are of concern, and tube wall
temperatures can increase significantly with scale thickness as discussed in
Q8.13.
Elevated steam drum design is generally used if the steam purity has to be
less than 1 ppm. External downcomers and risers help cool the tubes and tube
sheet by circulating the water–steam mixture over them. If the flue gas
temperature is below 1500�F, then an elevated drum design may be dispensed
with and a single-shell fire tube boiler may be used. The steam purity without
internals is low, on the order of 5–15 ppm, which may be adequate for low
pressure process heating applications.
Owing to the large inventory of water, fire tube boilers respond slowly to
load changes compared with water tube units. However, the pressure decay on
loss of heat input will also be smaller.
WATER TUBE BOILER DESIGN CONSIDERATIONS
The design procedure for waste heat boilers is quite involved. With a given set of
inlet gas conditions such as flow and temperature, we have to see how the various
Copyright © 2003 Marcel Dekker, Inc.

heating surfaces respond. The surfaces could consist of bare or finned tubes. The
superheater could have one or more stages; a screen section may or may not be
used. Import steam could come from another boiler to be superheated in the
boiler in question, or saturated steam may be drawn off the steam drum for
deaeration or process purposes. The feedwater temperature or steam pressure
could vary depending on plant facilities.
Before attempting to evaluate the performance of a complete waste heat
boiler, one must first know how to obtain the performance of individual
components such as the superheater, evaporator, and economizer by using the
number of transfer units (NTU) method or through trial and error. This is
discussed in Q8.29 and Q8.30. Once we know how to evaluate the performance
of each surface, evaluating the overall performance of a waste heat boiler is
simple. Figure 2.17 shows the logic for a simple waste heat boiler consisting of a
superheater, evaporator, and economizer. A few iterations may be required,
because we have to first assume a steam flow and completely solve all the
other sections and then check on whether the assumed steam flow was fine. A
FIGURE 2.17 Logic used for evaluating HRSG performance.
Copyright © 2003 Marcel Dekker, Inc.

computer program is required, because these calculations become tedious with
two-stage superheaters with attemperation, a combination of bare and finned
tubes in evaporators, and the use of import or export steam, to mention a few
variables. Also the incinerator may operate at different combinations of gas flows,
temperatures, and gas analysis. The performance has to be checked at different
operating points before finalizing it.
Figure 2.18 shows the printout of results for a water tube waste heat boiler
for a gas turbine exhaust consisting of a furnace section, a screen section, a two-
stage superheater, an evaporator consisting of bare and finned tubes, and a finned
tube economizer. In the unfired mode this HRSG makes about 45,000 lb=h of
steam. The turbine exhaust enters the HRSG at 980�F, which is raised to 2175�Fby the burner located at the HRSG inlet to generate 150,000 lb=h of steam at
620 psig and 750�F. The oxygen content has decreased from 15% to 8.39% by
volume and the burner duty is 123MM Btu=h on LHV basis. The gas
temperature drops to 2063�F in the furnace section and is cooled to 1852�F in
the screen section before entering the superheater. The gas pressure drop in the
HRSG is about 6 in. WC. To this must be added the burner, selective catalytic
reduction (SCR), and duct losses. The printout also shows the tube wall
temperatures, fin tip temperatures, heat transfer coefficients at various sections
both inside and outside the tubes, and the gas- and steam=water-side pressure
drops. The amount of spray water used for attemperation is also computed.
Several variables can be changed to check the effect on performance. The
evaporator uses different fin configurations. This is done to minimize the heat
flux inside the evaporator tubes and also the tube wall and fin tip temperatures.
The boiler duty is 177MM Btu=h. The fuel used is typically natural gas.
Boiler tube sizes typically range from 1.5 to 2.5 in. and fin density can vary
from 2 to 6 fins=in. depending upon the design. Bare tube boilers are used in dirtygas applications. Sometimes multipass designs offer a compact design. Whereas
with finned tubes, both in-line and staggered arrangements are used, an in-line
arrangement is generally used with bare tubes because it is inefficient to use a
staggered arrangement, as discussed in Q8.22. Tube spacing can vary depending
on gas velocity, dirtiness of the gas stream, and heat transfer considerations. A
radiant furnace is also used if the incoming gas is at a high temperature and has
the potential to cause slagging problems. Superheaters can be of bare tube or
finned tube design, depending upon the gas temperature and cleanliness.
Generally a low fin density is preferred for superheaters owing to the low heat
transfer coefficient inside tubes, as discussed in Q8.22 and Q8.27. Superheater
tubes can be vertical or horizontal depending on size or layout considerations.
Economizers are of bare tube design in dirty gas applications and use finned tubes
in clean gas applications. In sulfuric acid plants, a few suppliers use cast iron
gilled tubes.
Copyright © 2003 Marcel Dekker, Inc.

FIGURE 2.18 Printout of HRSG performance.
Copyright © 2003 Marcel Dekker, Inc.

PREDICTING HRSG DESIGN AND OFF-DESIGNPERFORMANCE USING HRSG SIMULATION
It is possible to predict the performance of water tube HRSGs in clean gas
applications by using a simulation process instead of physically designing the
unit. Thus anyone familiar with heat balances such as consultants and those
planning cogeneration or combined cycle plants can obtain a good idea of the
performance of the HRSG under various modes of operation. This information
may be used to arrive at the HRSG configuration and optimize the major
parameters for the steam system. Several ‘‘what if ’’ scenarios may be looked
at. The performance of an existing HRSG may also be evaluated to see if its
performance is reasonable, as discussed in Q8.45. Though simulation may be
used for any clean gas convective type of HRSG, it is particularly useful in gas
turbine applications, because the HRSG designs involving multiple-pressure,
multiple-module designs are more complex as discussed in Chapter 1.
Because of the large amount of exhaust gases and the low inlet gas
temperature of an HRSG, one cannot arbitrarily assume an exit gas temperature
and compute the steam generation. The problem of evaluating steam generation
and temperature profiles gets complicated further as it is not often possible to
recover a substantial amount of energy from the exhaust gases with steam at a
single pressure level. Multiple-pressure steam generation with split modules
alone can optimize energy recovery, makes the task of performing energy balance
calculations very tedious. Gas and steam temperature profiles and hence energy
balance in an HRSG are governed by what are called pinch and approach points
(Fig. 2.17) Q8.34 and Q8.37 explain this in greater detail.
Basically, we estimate the term UA, the product of the overall heat transfer
coefficient and the surface area, for each heating surface in the design mode and
then correct it for the effect of gas flow, temperature, and analysis. Using this
corrected UA, one can use the NTU method to evaluate the performance of any
exchanger and then the overall performance.
The HRSGS Program
I have developed a simulation program called HRSGS to perform these complex
design and off-design performance calculations. Basically the desired HRSG
configuration is built up by using the six basic modules shown in Fig. 2.19. By
using the common economizer or common superheater concept, one can config-
ure complex multiple-pressure HRSGs, as shown in the examples in the figure.
Up to 10 modules or nine pressure levels can be evaluated. The program
automatically arrives at the firing temperature and the fuel requirement if the
desired steam quantity is known with both turbine exhaust and fresh air cases. It
checks for steaming in the economizer and handles import or export steam from
evaporators as illustrated by a few examples in Chapter 1 (See p. 26 and 36). It
Copyright © 2003 Marcel Dekker, Inc.

FIGURE 2.19 How basic modules may be combined to arrive at complex HRSG configurations.
Copyright © 2003 Marcel Dekker, Inc.

computes the ASME efficiency and prints out the US values for each surface in
the design and off-design modes as shown in several examples in Chap. 1.
The simulation program is generally used for convective-type HRSGs and
waste heat boilers, which operate on clean gas streams. If a radiant furnace is
used, there will be some variation between the actual and predicted values.
Because of the large fouling factors involved in dirty gas applications, the heat
transfer coefficients cannot be corrected for off-design conditions accurately;
hence there will be some deviation between predicted and actual performance if
this is used in, say, municipal waste applications. For more information about the
program, please contact the author at [email protected] or visit the web
site http://vganapathy.tripod.com/boilers.html.
SPECIFYING WASTE HEAT BOILERS
The following points may be considered while developing specifications for heat
recovery applications.
1. Because there are numerous applications of heat recovery, it is always
good practice to start off the specifications by describing the process
that generates the flue gases, because that gives an idea of the nature
of the gas stream. With a clean gas stream, finned tubes could be used
to make the boiler design compact, whereas a dirty gas with slagging
potential must have bare tubes, with provision for cleaning the
surfaces. Process gas applications such as hydrogen plants or sulfuric
acid plant boilers require exit gas temperature control systems.
2. Desired steam purity should be mentioned, particularly if the steam
generated is used in a gas or steam turbine. Also, based on load
swings, one could arrive at the proper size for the steam drum.
3. The extent of optimization required and the cost of fuel, electricity,
and steam should be indicated. For example, simply stating the inlet
gas conditions and steam parameters may not be adequate. If design
A cools the gas to, say, 450�F and design B cools it to, say, 400�F by
using a larger boiler at higher cost, how is this to be evaluated? Also,
if for the same steam parameters, one design has 6 in. WC pressure
drop and another has 4 in. WC, is there any way to evaluate operating
costs? Such an indication in the specifications will help the designer
to review the design and balance the installed and operating costs.
4. Space availability and layout considerations should be indicated.
Sometimes a boiler is built before the builder finds out that it has
to be located inside a building that has already been constructed.
5. The steam system should be clearly described. Often only the makeup
water conditions are given without an indication of where the steam to
Copyright © 2003 Marcel Dekker, Inc.

the deaerator comes from. If the steam is taken from the boiler itself,
then the design is likely to be affected, particularly if a superheater is
present. Hence a scheme showing the complete steam–water system
for the plant will be helpful. In waste heat boilers, sometimes import
steam from another source is superheated in the boiler. This affects
the superheater and boiler performance, particularly when the import
steam supply is reduced or cut off.
6. Often feedwater is used for desuperheating steam to control its
temperature. This water should have zero solids and should preferably
be demineralized. Softened water will add solids to the steam if used
directly as spray, so one may have problems with solid deposits,
fouling, and overheating of superheater tubes and possible deposition
of solids in the steam turbine blades. If demineralized water is not
available and that is so stated up front, the designer could come up
with a sweet water condensing system to obtain the desired spray
water for steam temperature control (see Chap. 3). The feedwater
analysis is also important because it affects blowdown rates.
7. Gas flow should be stated in mass units. Often volumetric units are
given and the writer of the specifications has no idea if it is actual
cubic feet per minute or standard cubic feet per minute; then without
the gas analysis, it is difficult to evaluate the density or the mass flow.
The ratio between standard and actual cubic feet per minute of flue
gas could be nearly 4 depending on the gas temperature. The problem
is resolved if the flue gas mass flow is given in pounds per hour or
kilograms per hour.
8. Flue gas analysis is important. We have seen that the presence of
water vapor or hydrogen in flue gases increases the heat transfer
coefficient and also affects the specific heat and temperature profiles
of the gas. The presence of corrosive gases such as hydrogen chloride,
sulfur trioxide, and chlorine suggests the possibility of corrosion. The
boiler duty for the same gas temperature drop and mass flow could be
different if one designer assumes a particular flue gas analysis and
another designer assumes another. Hence flue gas analysis should be
stated as well as the gas pressure. High gas pressure, on the order of
even 1–2 psi, affects the casing design and cost.
9. With HRSGs, one should perform a temperature profile analysis
before arriving at the steam generation values. As shown in Q8.36,
assuming an exit gas temperature and computing HRSG duty or
steam generation on that basis can lead to errors.
10. Emission levels of NOx;CO, and other pollutants required at the exit
of the HRSG or waste heat boiler should be stated. In such cases,
information on pollutants in the incoming gases should also be given.
Copyright © 2003 Marcel Dekker, Inc.

11. Fuel analysis should be provided for a fired HRSG or boiler. Also, the
cost of fuel helps to determine if a design can be optimized by using a
larger boiler and smaller fuel consumption or vice versa.
12. If the boiler is likely to operate for a short period only or weekly or is
being cycled, then this information should also be given. Frequent
cycling requires some considerations in the design to minimize
fatigue stresses. Provisions for keeping the boiler warm during shut-
down may also be necessary.
In addition, local code requirements, site ambient conditions, and constructional
features, if any, should be mentioned.
REFERENCES
1. V Ganapathy. Simulation aids cogeneration system analysis. Chemical Engineering
Progress, October 1993.
2. VGanapathy. Evaluating gas turbine heat recovery boilers. Chemical Engineering, Dec
7, 1987.
3. V Ganapathy. Evaluating waste heat boiler systems. Plant Engineering, Nov 22, 1990.
4. V Ganapathy. HRSG features and applications. Heating, Piping, Air-Conditioning,
January 1989.
5. V Ganapathy. Simplify HRSG evaluation. Hydrocarbon Processing, March 1990.
6. VGanapathy. Fouling—the silent heat transfer thief. Hydrocarbon Processing, October
1992.
Copyright © 2003 Marcel Dekker, Inc.
3
Steam Generators
INTRODUCTION
Steam generators, or boilers as they are often called, form an essential part of any
power plant or cogeneration system. The steam-based Rankine cycle has been
synonymous with power generation for centuries. Though steam parameters such
as pressure and temperature have been steadily increasing during the last several
decades, the function of the boiler remains the same, namely, to generate steam at
the desired conditions efficiently and with low operating costs. Low pressure
steam is used in cogeneration plants for heating or process applications, and high
pressure superheated steam is used for generating power via steam turbines.
Steam is used in a variety of ways in process industries, so boilers form an
important part of the plant utilities. In addition to efficiency and operating costs,
another factor that has introduced several changes in the design of boilers and
associated systems is the stringent emission regulations in various parts of the
world. As discussed in Chapter 5, the limits on emissions of NOx;CO; SOx, andparticulates have impacted the design and features of steam generators and steam
plants, not to mention their costs. Today’s cogeneration systems and power plants
resemble chemical plants with NOx; SOx, and particulate control systems
forming a major portion of the plant equipment. Oil- and gas-fired packaged
boilers used in cogeneration and combined cycle plants have also undergone
significant changes during the last few decades. Selective catalytic reduction
Copyright © 2003 Marcel Dekker, Inc.

systems (SCRs) are used even in packaged boilers for NOx control, adding to
their complexity and costs.
Steam pressure and temperature ratings of large utility boilers have been
increasing in order to improve overall plant efficiency. Several supercritical plants
have been built during the last decade. There have been improvements in the
design of packaged boilers too. Figure 3.1 shows the general arrangement of a
packaged steam generator. The standard refractory-lined packaged boilers of the
last century are being slowly replaced by custom-designed boilers with comple-
tely water-cooled furnaces (Fig. 3.2). The air heater that was once an integral part
of oil- and gas-fired boilers is now replaced by the economizer, which helps to
FIGURE 3.1 Package water tube boiler. (Courtesy of ABCO Industries, Abilene,TX.)
Copyright © 2003 Marcel Dekker, Inc.

lower NOx levels. To improve efficiency, a few plants are even considering the
use of condensing economizers.
Though pulverized coal–fired boilers form the backbone of utility plants,
fluidized bed boilers are finding increasing application when it comes to handling
solid fuels with varying moisture, ash, and heating values; they also generate
lower emissions of NOx and SOx. Oil- and gas-fired fire tube boilers (Fig. 3.3)
are widely used in small process plants for generating low pressure saturated
steam. Though different types of boilers are mentioned in this chapter, the
emphasis is on the oil- and gas-fired packaged water tube steam generator, which
is fast becoming a common sight in every cogeneration and combined cycle plant.
BOILER CLASSIFICATION
The terms boiler and steam generator are often used in the same context. Boilers
may be classified into several categories as follows:
By Application: Utility, marine, or industrial boiler. Utility boilers are the
large steam generators used in power plants generating 500–1000MWof
FIGURE 3.2 Completely water-cooled furnace design. (Courtesy of ABCO Indus-
tries, Abilene, TX.)
Copyright © 2003 Marcel Dekker, Inc.

FIGURE 3.3a Fire tube boiler—wetback design.
Copyright © 2003 Marcel Dekker, Inc.
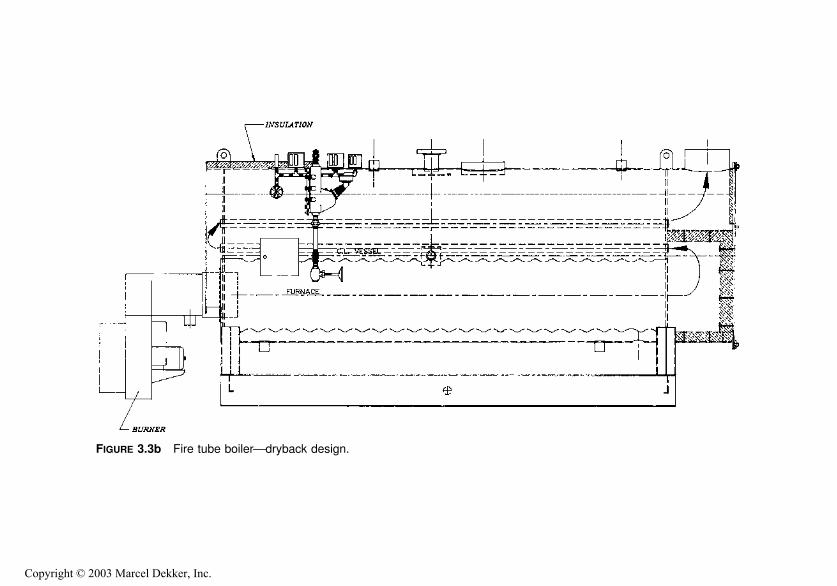
FIGURE 3.3b Fire tube boiler—dryback design.
Copyright © 2003 Marcel Dekker, Inc.

electricity. They are generally fired with pulverized coal, though fluidized
bed boilers are popping up in some plants. Utility boilers generate high
pressure, high temperature superheated and reheat steam; typical para-
meters are 2400 psig, 1000=1000�F. A few utility boilers generate
supercritical steam at pressures in excess of 3500 psig, 1100=1100=1100�F. Double reheat cycles are also in operation. Industrial boilers
used in cogeneration plants generate low pressure steam at 150 psig to
superheated steam at 1500 psig at temperatures ranging from 700 to
1000�F.By Pressure: Low to medium pressure, high pressure, and supercritical
pressure. Process plants need low to medium pressure steam in the range
of 150–1500 psig, which is generated by field-erected or packaged
boilers, whereas large utility boilers generate high pressure (above
2000 psig) and supercritical pressure steam.
By Circulation Method: Natural, controlled, once-through, or combined
circulation. Figure 3.4 illustrates these concepts. Natural circulation is
widely used for up to 2400 psig steam pressure. There is no operating
cost incurred for ensuring circulation through the furnace tubes, because
gravity aids the circulation process. Controlled and combined circulation
boilers use pumps to ensure circulation of a steam–water mixture
through the evaporator tubes. Supercritical boilers are of the once-
through type. It may be noted that once-through designs can be
employed at any pressure, whereas supercritical pressure boilers must
be of a once-through design.
By Firing Method: Stoker, cyclone furnace, fluidized bed, register burner,
fixed or moving grate.
By Construction: Field-erected or shop-assembled. Large industrial and
utility boilers are field-erected, whereas small packaged fire tube boilers
up to 90,000 lb=h capacity and water tube boilers up to 250,000 lb=h are
generally assembled in the shop. Depending on shipping dimensions,
these capacities could vary slightly.
By Slag Removal Method: Dry or wet bottom, applicable to solid-fuel-fired
boilers.
By Heat Source and Fuel: Solid, gaseous, or liquid fuels, waste fuel or
waste heat. Waste heat boilers are discussed in Chapter 2. The type of
fuel used has a significant impact on boiler size. For example, coal-fired
boiler furnaces are large, because a long residence time is required for
coal combustion, whereas oil- and gas-fired boilers can be smaller, as
shown in Fig. 3.5.
According to Whether Steam is Generated Inside or Outside the Boiler
Tubes: Fire tube boilers (Fig. 3.3), in which steam is generated outside
the tubes, are used in small plants up to a capacity of about 60,000 lb=h
Copyright © 2003 Marcel Dekker, Inc.

FIGURE 3.4 Boiler circulation methods. (a) Natural; (b) forced circulation; (c)once-through; (d) once-through with superimposed circulation. 1, Economizer; 2,
furnace; 3, superheater; 4, drum; 5, orifice; 6, circulating pumps; 7, separator.
FIGURE 3.5 The impact of fuel on furnace size.
Copyright © 2003 Marcel Dekker, Inc.

of saturated steam at 300 psig or less; they typically fire oil or gaseous
fuels. Water tube boilers, in which steam is generated inside the tubes,
can burn any fuel, be of any size, and operate at any pressure but are
generally economical above 50,000 lb=h capacity. See Chap. 2 for a
comparison between fire tube and water tube waste heat boilers.
STEAM PRESSURE AND BOILER DESIGN
The energy absorbed by steam is distributed among feedwater heating (sensible
heat), boiling (latent heat), superheating, and reheating functions. The distribution
ratios are a function of steam pressure, as can be seen from steam tables or from
Fig. 3.6. If the latent heat is large as in low pressure steam, a large furnace is
required for the boiler; as the pressure of steam increases, the latent heat portion
decreases and the superheat and reheat energy absorption increases. The boiler
design accordingly varies with large surface areas required for the superheaters
and reheaters and a small furnace with little or no convective evaporator surface
in particular. The sensible heat, which is absorbed in the economizer, is also high
at high pressure. The distribution of energy among the various surfaces—the
furnace, evaporator, superheater, reheater, and economizer—is somewhat flexible,
as will be shown later, but it must be emphasized that steam pressure plays a
significant role in determining the sizes of these surfaces.
FIGURE 3.6 Distribution of energy in boilers as a function of steam pressure.
Copyright © 2003 Marcel Dekker, Inc.

In natural circulation units the density differential between the cooler water
in the downcomers and the less dense steam–water mixture in the riser tubes of
the furnace provides the hydraulic head for circulation of the steam–water
mixture through the evaporator tubes. The circulation ratio, CR, which is the
ratio of the mixture flow to steam flow, could be in the range of 6–8 in high
pressure boilers. In packaged boilers operating at low steam pressure, say 150–
1000 psig, the CR could be higher, ranging from 10 to 20. Note that we are
referring to an average value. The circulation ratio will differ for each parallel
circuit, depending on its length, tube size, heat flux, and static head available, as
discussed in Q7.29. The controlled circulation boiler is operated at a slightly
higher steam pressure, around 2500–2600 psig, and flow is ensured through the
furnace tubes by a circulating pump; which forces the boiler water through each
circuit. The circulation ratio is preselected in the range of about 2–4. This is done
to reduce the operating cost associated with the circulating pumps; also, the use
of carefully selected orifices ensures the flow of the steam–water mixture through
each circuit. Hence a low CR is used in these systems. The once-through unit
with superimposed circulation requires the circulating pump during start-up and
at low loads when flow through the circuits is not high and later switches to the
once-through mode at higher loads.
PACKAGED STEAM GENERATORS
Packaged boilers are widely used in cogeneration and even in combined cycle
plants as auxiliary boilers providing steam for turbine sealing and steam for
other uses when the gas turbine trips and the HRSG is not in operation.
These boilers are generally shop-assembled and custom-designed. Typically,
boilers of up to 250,000 lb=h capacity can be shop-assembled and larger units
are field-erected. Steam parameters vary from 150 psig saturated to 1500 psig,
1000�F. They typically burn natural gas, distillate fuel oils, and even heavy
residual oils. Widely used methods for NOx control are low-NOx burners, flue
gas recirculation, and selective catalytic reduction systems (SCRs). Carbon
monoxide catalysts are also used if required. Emission control methods are
discussed in Chapter 4.
Packaged boilers could be further classified as D, A, or O-type depending
on their construction, as shown in Fig. 3.7. In the A- and O-type boilers, the flue
gases exit the furnace and then make a 180� turn, split up into two parallel paths,
and flow through the convection section, then recombine to flow through the
economizer. Using a convective superheater in this type of boiler is tricky,
because it has to be split into two halves. A radiant design may be located at the
furnace exit, but it operates in a harsh environment as discussed later.
D-type boilers are widely used in industry. The flue gases generated in the
furnace travel though the furnace, make a turn, and go through the convection
Copyright © 2003 Marcel Dekker, Inc.

FIGURE 3.7 A-, D-, and O-type boiler configurations. 1, Burner; 2, steam drum; 3, mud drum.
Copyright © 2003 Marcel Dekker, Inc.
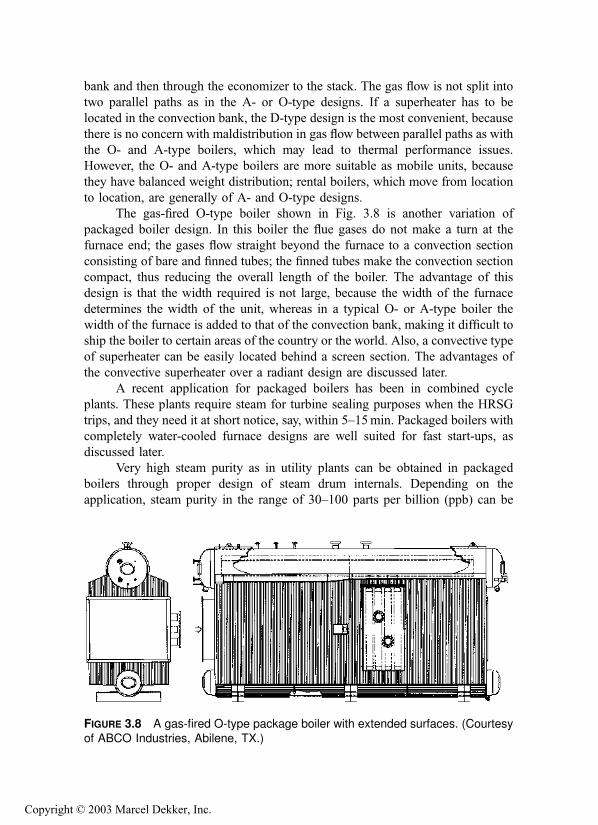
bank and then through the economizer to the stack. The gas flow is not split into
two parallel paths as in the A- or O-type designs. If a superheater has to be
located in the convection bank, the D-type design is the most convenient, because
there is no concern with maldistribution in gas flow between parallel paths as with
the O- and A-type boilers, which may lead to thermal performance issues.
However, the O- and A-type boilers are more suitable as mobile units, because
they have balanced weight distribution; rental boilers, which move from location
to location, are generally of A- and O-type designs.
The gas-fired O-type boiler shown in Fig. 3.8 is another variation of
packaged boiler design. In this boiler the flue gases do not make a turn at the
furnace end; the gases flow straight beyond the furnace to a convection section
consisting of bare and finned tubes; the finned tubes make the convection section
compact, thus reducing the overall length of the boiler. The advantage of this
design is that the width required is not large, because the width of the furnace
determines the width of the unit, whereas in a typical O- or A-type boiler the
width of the furnace is added to that of the convection bank, making it difficult to
ship the boiler to certain areas of the country or the world. Also, a convective type
of superheater can be easily located behind a screen section. The advantages of
the convective superheater over a radiant design are discussed later.
A recent application for packaged boilers has been in combined cycle
plants. These plants require steam for turbine sealing purposes when the HRSG
trips, and they need it at short notice, say, within 5–15min. Packaged boilers with
completely water-cooled furnace designs are well suited for fast start-ups, as
discussed later.
Very high steam purity as in utility plants can be obtained in packaged
boilers through proper design of steam drum internals. Depending on the
application, steam purity in the range of 30–100 parts per billion (ppb) can be
FIGURE 3.8 A gas-fired O-type package boiler with extended surfaces. (Courtesyof ABCO Industries, Abilene, TX.)
Copyright © 2003 Marcel Dekker, Inc.
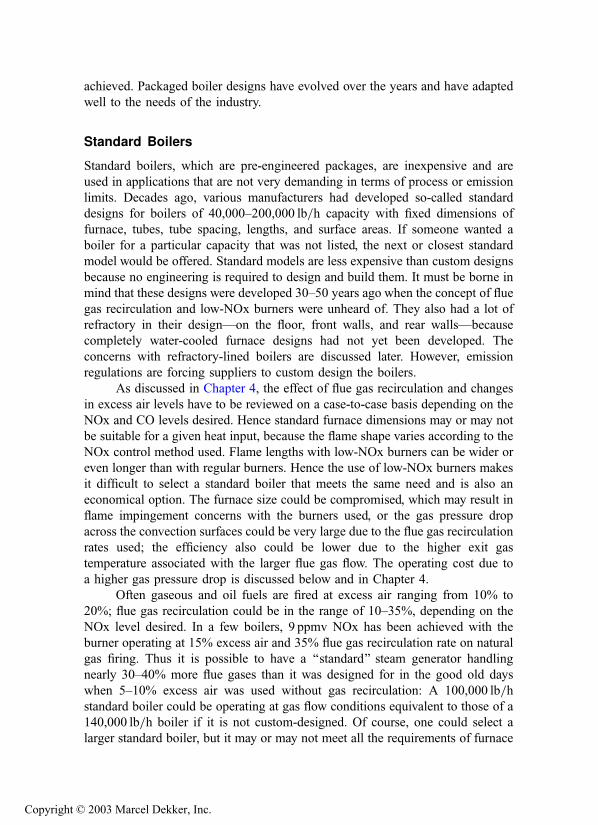
achieved. Packaged boiler designs have evolved over the years and have adapted
well to the needs of the industry.
Standard Boilers
Standard boilers, which are pre-engineered packages, are inexpensive and are
used in applications that are not very demanding in terms of process or emission
limits. Decades ago, various manufacturers had developed so-called standard
designs for boilers of 40,000–200,000 lb=h capacity with fixed dimensions of
furnace, tubes, tube spacing, lengths, and surface areas. If someone wanted a
boiler for a particular capacity that was not listed, the next or closest standard
model would be offered. Standard models are less expensive than custom designs
because no engineering is required to design and build them. It must be borne in
mind that these designs were developed 30–50 years ago when the concept of flue
gas recirculation and low-NOx burners were unheard of. They also had a lot of
refractory in their design—on the floor, front walls, and rear walls—because
completely water-cooled furnace designs had not yet been developed. The
concerns with refractory-lined boilers are discussed later. However, emission
regulations are forcing suppliers to custom design the boilers.
As discussed in Chapter 4, the effect of flue gas recirculation and changes
in excess air levels have to be reviewed on a case-to-case basis depending on the
NOx and CO levels desired. Hence standard furnace dimensions may or may not
be suitable for a given heat input, because the flame shape varies according to the
NOx control method used. Flame lengths with low-NOx burners can be wider or
even longer than with regular burners. Hence the use of low-NOx burners makes
it difficult to select a standard boiler that meets the same need and is also an
economical option. The furnace size could be compromised, which may result in
flame impingement concerns with the burners used, or the gas pressure drop
across the convection surfaces could be very large due to the flue gas recirculation
rates used; the efficiency also could be lower due to the higher exit gas
temperature associated with the larger flue gas flow. The operating cost due to
a higher gas pressure drop is discussed below and in Chapter 4.
Often gaseous and oil fuels are fired at excess air ranging from 10% to
20%; flue gas recirculation could be in the range of 10–35%, depending on the
NOx level desired. In a few boilers, 9 ppmv NOx has been achieved with the
burner operating at 15% excess air and 35% flue gas recirculation rate on natural
gas firing. Thus it is possible to have a ‘‘standard’’ steam generator handling
nearly 30–40% more flue gases than it was designed for in the good old days
when 5–10% excess air was used without gas recirculation: A 100,000 lb=hstandard boiler could be operating at gas flow conditions equivalent to those of a
140,000 lb=h boiler if it is not custom-designed. Of course, one could select a
larger standard boiler, but it may or may not meet all the requirements of furnace
Copyright © 2003 Marcel Dekker, Inc.

dimensions, because developers of standard boilers generally increase furnace
lengths for higher capacity but not the width or height, due to shipping
constraints, particularly when the capacity is large. However, standard boilers
are useful where one is not concerned about optimizing all the parameters such as
efficiency, gas pressure drop, and emission levels and low initial cost is a primary
objective.
Packaged steam generators of today are custom-designed with an eye on
operating costs and emissions. The furnace design also has undergone major
design innovations, the completely water-cooled furnace (Fig. 3.2) being one of
them. This design offers several advantages over the refractory-lined boilers
designed decades ago.
Advantages of Water-Cooled Furnaces
Water-cooled furnaces have a number of advantages over other types:
1. The front, rear, and side walls are completely water-cooled and are of
membrane construction, resulting in a leakproof enclosure for the
flame, as shown in Fig. 3.2. The entire furnace expands and contracts
uniformly, thus avoiding casing expansion problems. When refractory
is used on the front, side, or rear walls, the sealing between the hotter
membrane walls and the cooler outer casing is a concern and hot gases
can sometimes leak from the furnace to the outside. This can cause
corrosion of the casing, particularly if oil fuels are fired.
2. Problems associated with refractory maintenance are eliminated. Also,
there is no need for annual shutdown of the boiler plant to inspect the
refractory or repair it, thus lowering the cost of owning the boiler.
3. Fast boiler start-up rates are difficult with refractory-lined boilers
because of the possibility of causing cracks in the refractory. However,
with completely water-cooled furnaces, start-up rates are limited only
by thermal stresses in the drums and are generally quicker. The tubes
may be welded to the drums instead of being rolled if the start-ups are
frequent. With boilers maintained in hot standby conditions using
steam-heated coils located in the mud drum, even 10–15min start-ups
are feasible. With a separate small burner whose capacity is 6–8% of
the total heat input in operation during boiler standby conditions, the
boiler can be maintained at pressure and can be ramped up to generate
100% steam within 3–5min.
4. Heat release rate on an area basis is lower for the water-cooled furnace
by about 7–15% compared to the refractory-lined boiler. Some gas-
fired boilers designed decades ago still use refractory on the floor;
replacing this with a water-cooled floor will increase the effective
heating surface of the furnace and lower the heat flux inside the tubes
Copyright © 2003 Marcel Dekker, Inc.

even further. The furnace exit gas temperature also decrease slightly
due to the increased effective cooling surface of the furnace. A lower
furnace exit gas temperature decreases the radiant energy transferred to
a superheater located at the furnace exit and thus reduces the potential
for superheater tube failures. A lower area heat release also helps
reduce NOx, as can be seen from the correlations developed by a few
burner suppliers.
5. Reradiation from the refractory on the front wall, side walls, and a floor
increases the flame temperatures locally, which results in higher NOx
formation. Of the total NOx generated by the burner, a significant
amount of NOx is formed at the burner flame base, so providing a
cooler environment for the flame near the burner helps minimize NOx
to some extent.
6. Circulation was one of the concerns about the use of refractory on the
floor of even gas-fired boilers because the D tubes are longer than
partition tubes of the dividing wall. Heat fluxes in packaged boilers are
generally low compared to those of utility boilers. To further protect
the floor and roof tubes, a small inclination to the horizontal is used;
also, considering the low steam pressure, tube-side velocities, heat flux,
and steam quality, departure from nucleate boiling (DNB) has never
been an issue, as evidenced by the operation of hundreds of boilers at
pressures as high as 1000–1500 psig. The tube-side velocities are also
adequate to ensure that steam bubbles do not separate from the water.
Hence refractory is not required on the floor or front or rear walls for
oil and gas firing.
7. Packaged boilers use economizers as the heat recovery equipment
instead of air heaters, which only serve to increase the flame tempera-
ture, thus increasing the NOx formation. The gas- and air-side pressure
drops are also higher with air heaters, thus adding to the fan size and
power consumption. The heat flux inside the furnace tubes is also
reduced owing to the smaller furnace duty.
Custom-Designed Boilers
Custom-designed boilers, as the term implies, are designed from scratch. Based
on discussions with the burner supplier and the level of NOx and CO desired, one
first selects the type of burner to be used and the emission control strategy. A few
options could be considered:
Use a large amount of flue gas recirculation (FGR) and a low cost burner,
which results in higher operating costs; one may use a large boiler with a
wide convection bank to minimize gas pressure drop.
Use an expensive burner, which uses fuel or air staging methods and
requires little or no flue gas recirculation. A few burners can guarantee
Copyright © 2003 Marcel Dekker, Inc.

about 20–30 ppmv NOx (at 3% oxygen dry) on gas firing. Installation
and operating costs associated with FGR are minimized.
One can also consider the possibility of using a selective catalytic reduction
(SCR) system along with a less expensive burner, which has a low to nil
FGR rate.
Steam injection may also be looked into, and the cost of steam versus FGR
may be compared.
Depending on the NOx and CO levels desired and the fuel analysis, the
solution may vary from case to case, and no obvious solution exists for every
situation. Thus one arrives at the best option from an emission control viewpoint
and then starts developing the boiler design using the excess air and FGR rates for
the fuels in consideration; the furnace dimensions to avoid flame impingement
on the furnace walls are then arrived at. Assuming a specific exit gas temperature,
the boiler efficiency calculations are done to arrive at the air and flue gas flow
rates and the amount of flue gas recirculated. This is followed by an evaluation of
furnace performance and design of the heating surfaces. The exit gas temperature
from the economizer is arrived at and compared with the assumed value;
efficiency is recalculated using the computed exit gas temperature, and revised
air and flue gas flows are obtained. (Air and flue gas quantities depend on the
amount of fuel fired, which in turn depends on efficiency.) Another iteration
starting from the furnace is done to fine-tune the performance. The superheater
performance is evaluated at various loads to determine whether the surface areas
are adequate.
If different fuels are fired, these calculations are carried out for all the fuels.
Efforts are then made to reduce the fuel consumption and also lower the fan
power consumption, which are recurring expenses, by fine-tuning the design
of the evaporator and economizer. A large economizer may be used to improve
the boiler efficiency if the duration of operation warrants it. The designer also has
the ability to change the dimensions of the convection section—for example, the
number of tubes wide, length, tube spacing, or even tube diameter—to come up
with low gas pressure drop and hence low fan operating cost as shown below.
Based on partial load performance and gas temperature profiles, bypass dampers
may be required if an SCR system is used. Hence it is likely that the steam
parameters of several boilers could be the same but the designs different due to
the emission control strategy used and degree of custom designing. A computer
program is used to perform these tedious calculations.
Example 1
A 150,000 lb=h boiler firing standard natural gas and generating saturated steam
at 285 psig with 230�F feedwater uses 15% excess air and 15% flue gas
recirculation. The exit gas temperature is 323�F. Compare the performance of a
standard boiler with that of a custom-designed unit. The flue gas flow through the
Copyright © 2003 Marcel Dekker, Inc.

boiler is 184,300 lb=h. With 80�F ambient temperature, the efficiency is 83.38%
HHV.
The results of the calculations are shown in Table 3.1. The following points
may be noted from this table:
1. The efficiency is the same in both designs because the exit gas
temperature and excess air are the same. Also, the furnace dimensions
are the same. Hence the furnace exit gas temperature is the same in
both designs.
2. The convection sections are different. In the standard boiler, we used a
standard tube spacing of 4 in. In the custom-designed unit, we reduced
the surface area significantly by using fewer rows and also made the
convection bank tube transverse spacing 5 in. This reduces the gas
pressure drop in the convection bank by 4 in. WC. It also reduces the
duty of the evaporator section, as can be seen by the higher exit gas
temperature of 683�F versus 550�F.3. We added a few more rows to the economizer in the custom-designed
unit and made its tubes longer to obtain the same exit gas temperature
and also to handle the additional duty. Economizer steaming is not a
TABLE 3.1 Reducing Boiler Gas Pressure Drop Through Custom Designing
Item Standard boiler Custom boiler
Furnace length�width
� height
32 ft� 7 ft� 11 ft 32 ft� 7 ft� 11 ft
Furnace exit gas temp,�F
2167 2167
Gas temp leavingevaporator, �F
550 683
Exit gas temperature,�F
323 323
Boiler surface area, ft2 8,920 6,710Economizer area, ft2 10,076 14,107
Geometry Evaporator Economizer Evaporator Economizer
Tubes=row 16 18 12 18No. of rows deep 96 12 96 14Effective length, ft 10 10 10 12Gas pressure drop,
in. WC
11.0 1.7 7.0 1.6
Transverse pitch, in. 4 4 5 4
Copyright © 2003 Marcel Dekker, Inc.

concern in packaged boilers due to the small ratio of flue gas to steam
flows (this aspect is discussed later). Hence we can absorb more energy
in the economizer, which is a less expensive heating surface than the
evaporator. The overall gas pressure drop saving of 4 in. WC results in
a saving of 31 kW in fan power consumption (see Example 9.06b for
fan power calculation). If energy costs 7 cents=kWh, for 8000 h of
operation per year the annual saving is
31� 0:07� 8000 ¼ $17;360:
This is not an insignificant amount. Simply by manipulating the tube
spacing of the convection bank, we have dramatically reduced the fan
power consumption and the size of the fan. Also the boiler cost for the
two designs should be nearly the same because the increase in
economizer cost is offset by the smaller number of evaporator tubes,
which reduces the material costs as well as labor costs. To improve the
energy transfer in evaporators one can also use finned tubes if the
boiler is fired with natural gas or distillate fuels. For example, if we
desire good efficiency but do not want an economizer because of, say,
shorter duration of operation or corrosion concerns, we may consider
using extended surfaces in the convection bank to lower the evaporator
exit gas temperature by about 40–100�F, which improves the efficiency
by 1–2.5% compared to a standard boiler.
4. Another important point is that surface areas should be looked at with
caution. One should not purchase boilers based on surface areas, which
is still unfortunately being done. It is possible to distribute energy
among the furnace, evaporator, and economizer in several ways and
come up with the same overall efficiency and fan power consumption
and yet have significantly different surface areas as shown in Tables 3.1
and 3.2.
Comparing Surface Areas
Example 2
This example illustrates the point that surface areas can be misleading. A boiler
generates 100,000 lb=h of saturated steam at 300 psig. Feedwater is at 230�F, andblowdown is 2%. Standard natural gas at 10% excess air is fired. Boiler
duty¼ 100.8MM Btu=h, efficiency¼ 84.3% HHV, furnace backpressure
¼ 7 in. WC
It is seen from Table 3.2 that boiler 2 has about 10% more surface area than
boiler 1 but the overall performance is the same for both boilers in terms of
operating costs such as fuel consumption and fan power consumption. Also the
Copyright © 2003 Marcel Dekker, Inc.
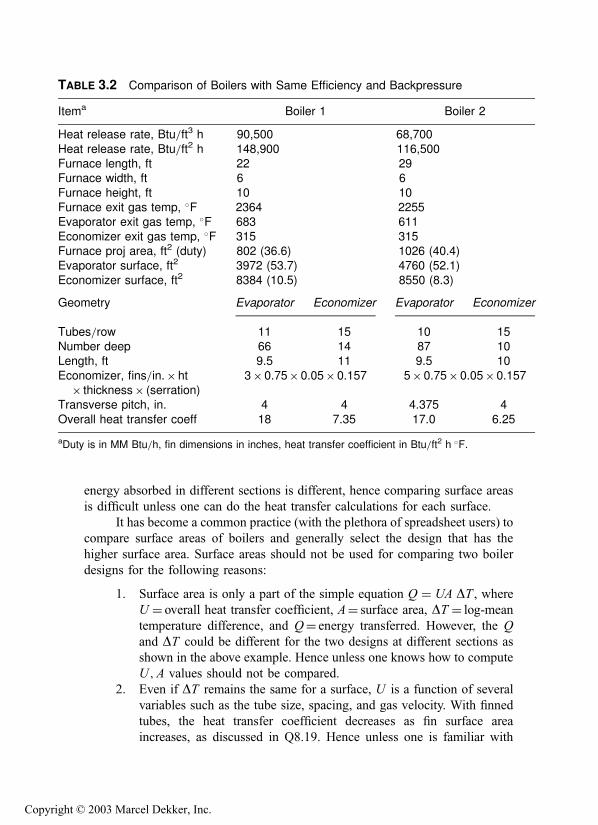
energy absorbed in different sections is different, hence comparing surface areas
is difficult unless one can do the heat transfer calculations for each surface.
It has become a common practice (with the plethora of spreadsheet users) to
compare surface areas of boilers and generally select the design that has the
higher surface area. Surface areas should not be used for comparing two boiler
designs for the following reasons:
1. Surface area is only a part of the simple equation Q ¼ UA DT , whereU ¼ overall heat transfer coefficient, A¼ surface area, DT ¼ log-mean
temperature difference, and Q¼ energy transferred. However, the Q
and DT could be different for the two designs at different sections as
shown in the above example. Hence unless one knows how to compute
U ;A values should not be compared.
2. Even if DT remains the same for a surface, U is a function of several
variables such as the tube size, spacing, and gas velocity. With finned
tubes, the heat transfer coefficient decreases as fin surface area
increases, as discussed in Q8.19. Hence unless one is familiar with
TABLE 3.2 Comparison of Boilers with Same Efficiency and Backpressure
Itema Boiler 1 Boiler 2
Heat release rate, Btu=ft3 h 90,500 68,700
Heat release rate, Btu=ft2 h 148,900 116,500Furnace length, ft 22 29Furnace width, ft 6 6
Furnace height, ft 10 10Furnace exit gas temp, �F 2364 2255Evaporator exit gas temp, �F 683 611
Economizer exit gas temp, �F 315 315Furnace proj area, ft2 (duty) 802 (36.6) 1026 (40.4)Evaporator surface, ft2 3972 (53.7) 4760 (52.1)
Economizer surface, ft2 8384 (10.5) 8550 (8.3)
Geometry Evaporator Economizer Evaporator Economizer
Tubes=row 11 15 10 15Number deep 66 14 87 10Length, ft 9.5 11 9.5 10
Economizer, fins=in.� ht� thickness� (serration)
3� 0.75� 0.05� 0.157 5�0.75� 0.05� 0.157
Transverse pitch, in. 4 4 4.375 4
Overall heat transfer coeff 18 7.35 17.0 6.25
aDuty is in MM Btu=h, fin dimensions in inches, heat transfer coefficient in Btu=ft2 h �F.
Copyright © 2003 Marcel Dekker, Inc.

all these issues, a simplistic tabulation of surface areas can be
misleading.
EFFECT OF STEAM PRESSURE ON BOILER DESIGN ANDPERFORMANCE
Another example of custom designing is shown in Example 3. In this example,
we are asked to design a boiler for a lower pressure of operation for the first few
years with the idea of operating at a higher steam pressure after that.
Example 3
An interesting requirement was placed on the design of a boiler. The 175,000 lb=hboiler was to generate steam at 150 psig and 680�F for the first few years and then
operate at 650 psig and 760�F. The piping and superheater changes had to be
minimal when the time came for modifications.
Operating a steam generator at two different pressures is a challenging task,
particularly when a superheater is present. The reason is that the large difference
in specific volume of steam affects the steam velocity inside the superheater tubes
and the steam-side pressure drop, which in turn affect the flow distribution inside
the tubes. The ratio of specific volume between the 150 and 650 psig steam is
about 4. Hence for the same steam output, we could have a 4 times higher steam
velocity at the lower pressure if the flow per tube were the same. Also, if the
pressure drop at 650 psig were, say, 30 psi, it would be about 120 psi at the lower
operating pressure if flow per tube were the same. Hence it was decided to
manipulate the streams and steam flows as shown in Fig. 3.9.
In the low pressure operation, there would be two inlets to the superheater
from opposite ends of the headers as shown in Fig. 3.9a. This would make the
velocity and pressure drop inside the tubes more reasonable. The total length of
tubing traveled by steam in the low pressure option would be nearly half that of
the high pressure case, which also reduces the pressure drop. Part of the steam is
in parallel flow and part in counterflow. At high gas temperatures, as in this case,
the difference in performance between parallel and counterflow superheaters is
marginal.
In the high pressure case, all the steam flows through the superheater tubes
in counterflow. Because the specific volume is small, the steam can flow as shown
with a reasonable steam velocity and without increasing the pressure drop. The
performance in both, cases is shown in Table 3.3. Thus with a minimal amount of
reworking, the piping could be changed when high pressure operation is begun.
The superheater per se was untouched, and only the nozzle connections were
redone. This boiler will be in operation for several years. If custom designing
were not done, the capacity at low pressure mode would have to be limited to
Copyright © 2003 Marcel Dekker, Inc.
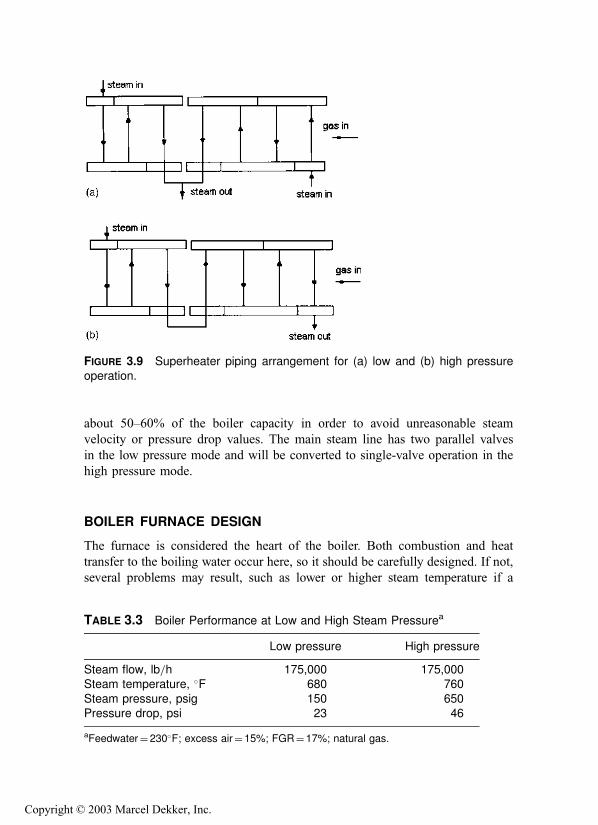
about 50–60% of the boiler capacity in order to avoid unreasonable steam
velocity or pressure drop values. The main steam line has two parallel valves
in the low pressure mode and will be converted to single-valve operation in the
high pressure mode.
BOILER FURNACE DESIGN
The furnace is considered the heart of the boiler. Both combustion and heat
transfer to the boiling water occur here, so it should be carefully designed. If not,
several problems may result, such as lower or higher steam temperature if a
FIGURE 3.9 Superheater piping arrangement for (a) low and (b) high pressure
operation.
TABLE 3.3 Boiler Performance at Low and High Steam Pressurea
Low pressure High pressure
Steam flow, lb=h 175,000 175,000Steam temperature, �F 680 760
Steam pressure, psig 150 650Pressure drop, psi 23 46
aFeedwater¼ 230�F; excess air¼ 15%; FGR¼17%; natural gas.
Copyright © 2003 Marcel Dekker, Inc.
superheater is used; the heat flux should be such as to avoid from DNB concerns.
Circulation inside the tubes should be good. There could be incomplete
combustion, which leads to lower efficiency and, coupled with a poor burner
design, higher emissions of NOx and CO. Also, the flame should not impinge on
the walls of the furnace enclosure. Hence it is always good practice to discuss
emission control needs with potential burner suppliers who can model the flame
shape and ensure that the furnace dimensions used can avoid flame impingement
issues while ensuring the desired emission levels.
In boilers fired with fuels that produce ash, the furnace is sized so that the
furnace exit gas temperature is below the ash softening temperature. This is to
avoid potential slagging problems at the turnaround section. Slag or molten
deposits from various salts and compounds in the ash can cause corrosion
damage and also affect heat transfer to the surfaces. The gas pressure drop
across the convection section is also increased when the flow path is blocked by
slag deposits.
One of the parameters used in furnace sizing is the area heat release rate.
This is the net heat input to the boiler divided by the effective projected area. This
factor determines the furnace absorption and hence the duty and heat flux inside
the tubes. Typically it varies from 100,000 to 200,000Btu=ft2 h for oil- and gas-
fired boilers and from 70,000 to 120,000 Btu=ft2 h for coal-fired units.
The volumetric heat release rate is another parameter, which is obtained by
dividing the net heat input by the furnace volume. This is indicative of the
residence time of the flue gases in the furnace and varies from 15,000 to
30,000Btu=ft3 h for coal-fired boilers. For oil and gaseous fuels it is not as
significant a parameter as for fuels that are difficult to burn such as solid fuels.
However, this parameter ranges from 60,000 to 130,000Btu=ft3 h for typical
packaged oil- and gas-fired boilers.
From the steam side, the circulation of the steam-water mixture in the tubes
should be good. As discussed in Q7.30, several variables affect circulation,
including static head available, steam pressure, tube size, and steam generation.
The circulation is said to be adequate when the heat flux does not cause DNB
conditions for the steam quality in consideration. Packaged boilers have a low
static head, unlike field-erected industrial boilers, and also have longer furnace
tubes. However, packaged boilers operate at low pressures, on the order of 200–
1200 psig, unlike large utility boilers, which operate at 2400–2600 psig, and
circulation is better at lower pressures.
Today’s boilers use completely welded membrane walls for the furnace
enclosure (Fig. 3.2). Earlier designs were of tangent tube construction or had
refractory behind the tubes (Fig. 3.10). With the refractory-lined casing, it is
difficult to maintain a leakproof enclosure between the refractory walls and the
water-cooled tubes, as a result flue gases can leak to the atmosphere, leading to
corrosion, at the casing interfaces, particularly on oil firing. Balanced draft
Copyright © 2003 Marcel Dekker, Inc.
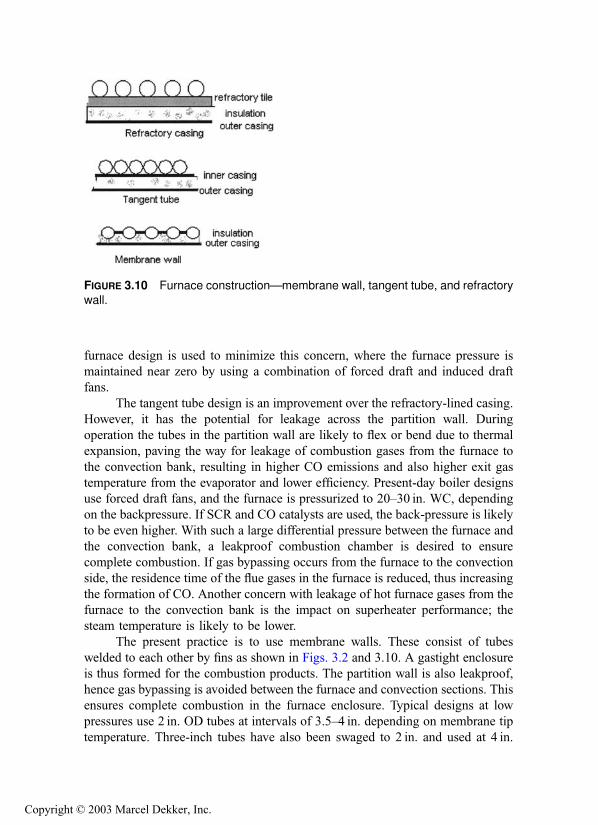
furnace design is used to minimize this concern, where the furnace pressure is
maintained near zero by using a combination of forced draft and induced draft
fans.
The tangent tube design is an improvement over the refractory-lined casing.
However, it has the potential for leakage across the partition wall. During
operation the tubes in the partition wall are likely to flex or bend due to thermal
expansion, paving the way for leakage of combustion gases from the furnace to
the convection bank, resulting in higher CO emissions and also higher exit gas
temperature from the evaporator and lower efficiency. Present-day boiler designs
use forced draft fans, and the furnace is pressurized to 20–30 in. WC, depending
on the backpressure. If SCR and CO catalysts are used, the back-pressure is likely
to be even higher. With such a large differential pressure between the furnace and
the convection bank, a leakproof combustion chamber is desired to ensure
complete combustion. If gas bypassing occurs from the furnace to the convection
side, the residence time of the flue gases in the furnace is reduced, thus increasing
the formation of CO. Another concern with leakage of hot furnace gases from the
furnace to the convection bank is the impact on superheater performance; the
steam temperature is likely to be lower.
The present practice is to use membrane walls. These consist of tubes
welded to each other by fins as shown in Figs. 3.2 and 3.10. A gastight enclosure
is thus formed for the combustion products. The partition wall is also leakproof,
hence gas bypassing is avoided between the furnace and convection sections. This
ensures complete combustion in the furnace enclosure. Typical designs at low
pressures use 2 in. OD tubes at intervals of 3.5–4 in. depending on membrane tip
temperature. Three-inch tubes have also been swaged to 2 in. and used at 4 in.
FIGURE 3.10 Furnace construction—membrane wall, tangent tube, and refractory
wall.
Copyright © 2003 Marcel Dekker, Inc.

pitch. This ensures a lower membrane temperature as well as reasonable ligament
efficiency in the steam and mud drums. At pressures up to 700–750 psig,
membranes using 2 in. tubes on 4 in. pitch have been found to be adequate due
to the combination of low heat flux in the furnace and low saturation temperature,
as evidenced by the operation of several hundred boilers. The 1 in. long
membrane with appropriate thickness does not result in excessive fin tip
temperatures or thermal stress concerns. At higher pressures, one may use
0.5 in.� 0.75 in. long membranes. Figure 3.11 shows how fin tip temperatures
vary with heat flux and membrane length.
The furnace process is extremely complicated, because today’s burners have
to deal with various aspects of burner designs such as staged fuel or staged air
combustion, flue gas recirculation, and other NOx control methods; hence
furnace performance should be arrived at on the basis of experience, field data,
and calculations. The furnace exit gas temperature is the most important variable
in this evaluation and is a function of heat input, flue gas recirculation rate, type
of fuel used, effective cooling surface available, and excess air used. A gas-fired
flame has less luminosity than an oil flame, so the furnace exit temperature is
higher, as shown in Fig. 3.12. A coal-fired flame has an even higher furnace exit
gas temperature. An oil flame is more luminous and the furnace absorbs more
energy, resulting in higher heat flux in the furnace tubes.
Energy Absorbed by the Furnace
The energy transferred to the furnace is obtained from the equation
Q ¼ Ape1e2sðT 4g � T4
wÞ ¼ Wf LHV�Wghe
FIGURE 3.11 Relating fin tip temperature to heat flux in membrane wall furnace.
Copyright © 2003 Marcel Dekker, Inc.

where
Q¼ energy transferred to the furnace, Btu=hTg ¼ average gas temperature in the furnace, �Rhe ¼ enthalpy of flue gases corresponding to the furnace exit gas
temperature Te, Btu=lbTw ¼ average furnace wall temperature, �RAp ¼ effective projected area of the furnace, ft2
s¼ radiation constant
e1; e2 ¼ emissivity of flame and wall, respectively
LHV¼ lower heating value of the fuel, Btu=lbWf ;Wg ¼ fuel and flue gas quantity, lb=h
The emissivity of the flame may be determined by using methods discussed
in Q8.08. The effective projected area includes the water-cooled surfaces and the
opening to the furnace exit plane. If refractory is used on part of the surfaces, a
correction factor of 0.3–0.5 has to be used for its effectiveness. Once the furnace
duty is arrived at, the heat flux inside the tube may be estimated. Heat flux inside
the tubes is a very important parameter because it affects the boiling process.
Example 4
Determine the energy absorbed by the packaged boiler furnace firing natural gas
for which data are given in Table 3.4. At 100% load, boiler duty or energy
absorbed by steam¼ 118.71MM Btu=h. Flue gas flow¼ 125,246 lb=h at 100%
load.
FIGURE 3.12 Furnace outlet temperature for gas and oil firing.
Copyright © 2003 Marcel Dekker, Inc.

The net heat input to the furnace is
118:71� 0:992
0:9273¼ 127 MM Btu=h
where 0.992¼ 17 heat losses, and 0.9273 is the boiler efficiency on LHV basis.
Net heat input
Effective furnace area¼ 127� 106
1169¼ 108;900 Btu=ft2 h
TABLE 3.4 Boiler Performance—Gas Firinga
Load (%)
25 50 75 100
Boiler duty, MM Btu=h 29.14 50.09 89.03 118.71Excess air, % 30 15 15 15
Fuel input, MM Btu=h 34.68 69.79 105.69 141.89Heat rel rate, Btu=ft3 h 16,055 32,310 48,931 65,691Heat rel rate, Btu=ft2 h 29,646 59,660 90,349 121,297
Steam flow, lb=h 25,000 50,000 75,000 100,000Steam temperature, �F 711 740 750 750Economizer exit water
temp, �F328 334 356 374
Boiler exit gas temp, �F 525 587 666 739Economizer exit gastemp, �F
254 271 298 327
Air flow, lb=h 32,954 58,665 88,843 119,275Flue gas, lb=h 34,413 61,602 93,290 125,246Dry gas loss, % 3.71 3.58 4.08 4.62
Air moisture loss, % 0.1 0.1 0.1 0.12Fuel moisture loss, % 10.48 10.55 10.67 10.79Casing loss, % 1.2 0.6 0.4 0.3
Margin, % 0.5 0.5 0.5 0.5Efficiency, % HHV 84.01 84.67 84.24 83.66Efficiency, % LHV 93.12 93.85 93.37 92.73Furnace back pressure,
in. WC
0.8 2.61 6.21 11.49
aSteam pressure 500 psig; feedwater 230�F, blowdown 1%, amb temp 80�F; RH 60%, fuel-
standard natural gas. Flue gas analysis (vol%): CO2 ¼ 8:29, H2O ¼ 18:17, N2 ¼ 71,
0:07;O2 ¼ 2:46. Boiler furnace projected area¼1169 ft2, furnace width¼7.5 ft, length¼ 32 ft,
height¼9 ft.
Copyright © 2003 Marcel Dekker, Inc.

The furnace exit gas temperature from Fig. 3.12 is 2235�F. It may be shown that
the enthalpy of the flue gases at 2235�F is 661.4 Btu=lb based on the flue gas
analysis. (See Appendix, Table A8.)
The furnace duty from (5)¼ 127� 106 � 125; 246� 661:4 ¼ 44:2MM
Btu=h.The average heat flux based on projected area is
44:2� 106
1169¼ 37;810 Btu=ft2 h
However, what is of significance is the heat flux inside the boiler tubes, not the
heat flux on a projected area basis. We can relate these two parameters as follows:
qpSt ¼ qcðpd=2þ 2hÞwhere
qp ¼ heat flux on projected area basis
St ¼ transverse pitch of membrane walls, in.
qc ¼ heat flux on circumferential area basis, Btu=ft2 hd¼OD of furnace tubes
h¼membrane height, in.
Once qc is obtained, we can relate it to qi, the heat flux inside the tubes, as
follows:
qcd ¼ qidi
where di ¼ tube inner diameter, in. Simplifying
qi ¼qpStðd=diÞpd=2þ 2h
In our example, qp ¼ 37;810 Btu=ft2 h, St ¼ 4 in:; h ¼ 1 in:; d ¼ 2,
di ¼ 1:706 in. Then
qi ¼37;810� ð2=1:706Þ � 4
3:14� 2=2þ 2� 1¼ 34;500 Btu=ft2 h
Note that if we did the same calculation for oil firing, the heat flux would be
higher, because the furnace exit gas temperature is lower. Heat flux inside tubes is
an important parameter, because allowable heat fluxes are limited by circulation
rates. Large heat flux inside tubes can lead to departure from nucleate boiling
conditions.
Estimating Fin Tip Temperatures
Fin tip temperatures in boilers of membrane wall design depend on several factors
such as cleanliness of the water or tube-side fouling, fin geometry, and heat flux,
Copyright © 2003 Marcel Dekker, Inc.

which is a function of the load and gas temperature. Assuming that membranes
are longitudinal fins heated from one side, the following equation may be used to
determine the fin tip temperature:
tg � tb
coshðmhÞ ¼ tg � tt
where
tg ¼ gas temperature, �Ftb ¼ fin base temperature, �F
Due to the high boiling heat transfer coefficients, on the order of 3000–
10,000 Btu=ft2 h�F, fin base temperatures will be a few degrees higher
than saturation temperature, assuming that tube-side fouling is mini-
mal.
tt ¼ fin tip temperature, �Fh¼membrane height, in. (see Fig. 3.11)
m¼ ðhgC=KAÞ0:5
where
hg ¼ gas-side heat transfer coefficient, Btu=ft2 h�FC¼ perimeter of fin cross section¼ 2bþ L in. (for heating from one side)
where b¼ fin thickness and L¼ fin length or furnace length
K ¼ fin thermal conductivity, Btu=ft h�FA¼ cross-section of fin¼ bL
C=A for long fins ¼ ð2bþ LÞ=bL ¼ L=bL ¼ 1=b
Example 5
In a boiler furnace, gas temperature at one location is 2200�F. The gas-side heat
transfer coefficient is estimated to be 30Btu=ft2 h�F. Fin height¼ 0.5 in. fin
thickness¼ 0.375 in. Fin base temperature is 600�F. Thermal conductivity of fin
is 20Btu=ft h�F. Determine the fin tip temperature.
Solution: Using the above equation, we have
Tg ¼ 2200�F; tb ¼ 600�F; hg ¼ 30; h ¼ 0:5 in:; b ¼ 0:375 in:;
K ¼ 20
mh ¼ 0:5
12
30� 12
20� 0:25
� �0:5
¼ 0:3536 or coshð0:3536Þ ¼ 1:063
Tt ¼ 2200� 2200� 600
1:063¼ 695�F
Copyright © 2003 Marcel Dekker, Inc.

THE BOILING PROCESS
When thermal energy is applied to furnace tubes, the process of boiling is
initiated. However, the fluid leaving the furnace tubes and going back to the steam
drum is not 100% steam but is a mixture of water and steam. The ratio of the
mixture flow to steam generated is known as the circulation ratio, CR. Typically
the steam quality in the furnace tubes is 5–8%, which means that it is mostly
water, which translates into a CR in the range from about 20 to 12. CR is the
inverse of steam quality. Circulation calculations and the importance of heat
fluxes are discussed in Q7.29.
Nucleate boiling is the process generally preferred in boilers. In this
process, the steam bubbles generated by the thermal energy are removed by
the flow of the mixture inside the tubes at the same rate, so the tubes are kept
cool. Boiling heat transfer coefficients are very high, on the order of 5000–
8000Btu=ft2 h �F as discussed in Q8.46. When the intensity of thermal energy or
heat flux exceeds a value known as the critical heat flux, then the process of
nucleate boiling is disrupted. The bubbles formed inside the tubes are not
removed adequately by the cooler water; the bubbles interfere with the flow of
water and form a film of superheated steam inside the tubes, which has a lower
heat transfer coefficient and can therefore increase the tube wall temperatures
significantly as illustrated in Fig. 3.13. It is the designer’s job to ensure that we are
FIGURE 3.13 Boiling process and DNB in boiler tubes.
Copyright © 2003 Marcel Dekker, Inc.

never close to critical heat flux conditions. Generally, packaged boilers operate at
low pressures compared to utility boilers and therefore DNB is generally not a
concern. The actual heat fluxes range from 40,000 to 70,000Btu=ft2 h, while
critical heat flux could be in excess of 250,000Btu=ft2 h. However, one has to
perform circulation calculations on all the parallel circuits in the boiler, particu-
larly the front wall, which is exposed to the flame, to ensure that there is adequate
flow in each tube. In the ABCO D-type boiler, carefully sized orifices are used to
limit the flow of mixture through the D headers while ensuring flow through all
the tubes in the front wall. Ribbed or rifled tubes are sometimes used as
evaporator tubes. These tubes ensure that the wetting of the tube periphery is
better than in plain tubes. They have spiral grooves cut into their inner wall
surface. The swirl flow induced by the ribbed tubes not only forces more water
outward onto the tube walls but also promotes general mixing between the phases
to counteract the gravitational stratification effects in a nonvertical tube. Ribbed
or twisted tubes can handle a much higher heat flux, often 50% higher than plain
tubes. They are expensive to use but offer a safety net in regions of high heat flux,
particularly in very high pressure boilers.
In fire tube boilers, the critical heat flux may be estimated as shown in
Q8.47. Again owing to the low pressure of steam, the allowable heat flux to avoid
DNB is much higher than the actual values; hence tube failures are rare unless
tube deposits or scale formation is severe. As discussed later in this chapter,
maintaining good boiler water chemistry, ensuring proper blowdown, and adding
chemicals to maintain proper alkalinity and pH in the boiler should minimize
scale formation and thus prevent tube failures.
BOILER EFFICIENCY CALCULATIONS
The boiler efficiency is an important variable that is impacted by the type of fuel,
its analysis, the exit gas temperature, excess air used, and ambient reference
conditions. The major losses due to flue gases and the method of computing
efficiency are discussed in Q6.19. With rising fuel costs, plant engineers should
try to aim for higher efficiency if the plant is base-loaded and operates
continuously. Often less efficient and less expensive units are purchased owing
to lack of funds, and this practice should be reviewed. One should look at the
long-term benefits to the end user. Similarly, the fan operating costs should also
be evaluated. A design with high gas pressure drop in the boiler may be less
expensive, but if one considers the long-term operating costs, it may not be the
better choice.
Table 3.5 shows the effect of excess air and exit gas temperatures on boiler
efficiency and cost of operation. It is important to operate at as low an excess of
air as possible; however, as discussed in Chapter 4, limits on NOx and CO may
force the burners to use higher values of excess air.
Copyright © 2003 Marcel Dekker, Inc.

As shown in Tables 3.4 and 3.7, the efficiency of packaged boilers varies
with load. This information may be used as a planning tool as discussed,
particularly when the plant has HRSGs in addition to steam generators.
Combination Firing
Boiler efficiency calculations are done using ASME PTC 4.1 methods, as shown
in Q6.19. When a combination of fuels is fired, the calculations can be involved.
The results from a program developed are shown in Fig. 3.14. They show the
performance of a boiler firing two different fuels at the same time. Based on the
exit gas temperature and measured or predicted oxygen for the flue gas mixture,
one can simulate the excess air and obtain the performance with individual fuels
first and then obtain the combined effect on air and gas flows, flue gas analysis,
combustion temperatures, heat losses, and efficiency.
BURNERS
The fuel burner is an important component of any boiler. Burner designs have
undergone several iterations during the last decade. Burner suppliers such as
Coen and Todd are offering burners that result in single-digit NOx emissions and
very low CO levels, competing with the SCR system presently used in the
industry for single-digit NOx emissions. However, these burners use a large
amount of flue gas recirculation, and flame stability at low loads is a concern.
Development work is going on to improve on these results. Fuel or air staging and
TABLE 3.5 Effect of Excess Air and Exit Gas Temperature on Efficiencya
Excess air (%)
5 20 5 20
Exit gas temp, �F 300 300 400 400Vol% CO2 9 7.97 9 7.97
H2O 19.57 17.56 19.57 17.56N2 70.53 71.31 70.53 71.31O2 0.89 3.16 0.89 3.16
Efficiency, % HHV 84.81 84.22 82.64 81.79% LHV 94.11 93.46 91.71 90.70
Flue gas, lb=h 96,160 110,000 98,680 113,210
Annual fuel cost, MM$=yr 2.854 2.873 2.928 2.959
a Steam flow¼100,000 lb=h, 300psig sat, feedwater temp¼ 230�F, 2% blowdown, ambient
temp¼ 80�F, relative humidity¼60%, boiler duty¼100.8MM Btu=h, fuel cost¼$3=MM Btu.
Copyright © 2003 Marcel Dekker, Inc.

steam injection are the other methods used by burner suppliers to control NOx.
Today single burners are used for capacities up to 300–350MM Btu=h on gas or
oil firing.
Often more than one fuel is fired in the burner. When different gaseous
fuels are fired in a burner, the fuel gas pressure has to be adjusted at the burner
inlet to ensure proper fuel flow.
Example 6
Let us say that a burner is firing 5MM Btu=h on LHV basis using a fuel of lower
heating value, 1400Btu=ft3, and molecular weight 25.8 at a pressure of 30 psig.
Assuming the nozzles remain the same, what should be done when a fuel of
FIGURE 3.14 Efficiency calculations for simultaneous firing of fuels.
Copyright © 2003 Marcel Dekker, Inc.

heating value 700Btu=ft3 whose molecular weight is 11.6 is fired, the duty being
the same?
Solution: The gas pressure should be adjusted; otherwise it would be
difficult to control the heat input. The pressure drop across the nozzles is related
to the flow of fuel as follows (Subscripts 1 and 2 refer to fuels 1 and 2):
DP1 ¼ KW 2=MW ¼ KQ2MW
where Q¼volumetric flow
W ¼mass flow
MW¼molecular weight
K is a constant¼ 30=Q21 MW
Basically we are converting the pressure drop equation from mass to
volumetric flow.
Because the heat input by both fuels is the same,
Q1 LHV1 ¼ Q2 LHV2
where LHV is the lower heating value of the fuel, Btu=ft3.
DP2 ¼30
Q21 MW1
Q22 MW2
Rewriting Q2 in terms of Q1 and simplifying, we have
DP2 ¼ 30� 700
1400
� �2
� 25:8
11:6¼ 17 psi
Thus we should have a lower fuel gas pressure to ensure the same heat input.
COMBUSTION CONTROLS
The function of a combustion control system is to ensure that the steam
generation matches the steam demand. When the demand exceeds the supply,
the steam pressure will decrease and vice versa. Although a few utility boilers
generate steam at sliding pressures, packaged boilers typically generate steam at
fixed pressure. The control system immediately adjusts the fuel input to maintain
the steam pressure. The following methods are typically used for combustion
control.
Single-Point Positioning: This is a simple and safe system for combustion
control. A common jackshaft is modulated by a power unit based on
variations in drum pressure and is mechanically linked to both the fuel
control value and the air control damper. This system is limited to small
boilers, typically below 100,000 lb=h, that have an integral fan mounted
Copyright © 2003 Marcel Dekker, Inc.
on top of the wind-box and are fired by a single fuel of nearly constant
heating value. Fuel heating values should not vary, and only one fuel can
be fired at a time. When low CO values are desired such as less than
70 ppmv, an oxygen trim is added.
Parallel Positioning System: This system is used on large boilers where a
remote fan supplies air to the wind-box. It has separate pneumatic power
units for controlling air and fuel.
Full Metering with Cross Limiting: This system is expensive but is
recommended for accurate air=fuel ratios, for keeping oxygen levels
optimized, and for its firing precision. Fuel and air flows are measured
continuously and are adjusted as required to maintain the desired air=fuelratio. Air leads on load increases, and fuel leads on load decreases. This
system allows simultaneous firing of two or more fuels. When emission
levels are stringent and a large flue gas recirculation rate is used, this
method is used and offers better control over the combustion process.
As far as the boiler is concerned, a three-element-level control system is
generally used to control the drum water level. Other controls would include
steam temperature and master pressure control. Figure 3.15a and 3.15b show
typical schemes of gas-side and steam-side instrumentation and controls, respec-
tively, used in packaged boilers.
FAN SELECTION
Packaged steam generators of today use a single fan for up to 250,000 lb=h of
steam. The furnaces of oil- and gas-fired boilers are pressurized, hence the fan
parameters should be selected with care. Estimating the flow or head inaccurately
can force the fan to operate in an unstable region or result in the horsepower being
too high and the operation inefficient. The density of air should be accurately
estimated, so elevation and ambient temperature conditions should be considered.
In some cold locations, a steam–air preheat coil is used to preheat the air before it
enters the fan, and this adds to the pressure drop. When flue gas recirculation is
required, usually the flue gases from the boiler exit are sucked in by the fan,
which handles the resistance of the entire system. The density of the mixed air is
lower, owing to the higher temperature of the air mixed with the flue gases. The
fan should be selected for the lowest density case, as explained in Q9.06, because
the mass flow of air is important for combustion and not the volumetric flow. The
effect of gas density on fan performance is shown in Fig. 3.16a.
Large margins on flow and head should not be specified, because this leads
to oversizing of the fan and can force the fan operating point to the extreme right
of the curve in Fig. 3.16b, where the horsepower can be extremely high; a lot of
energy is also wasted. Inlet vane control is typically used for controlling the flow
Copyright © 2003 Marcel Dekker, Inc.

FIGURE 3.15a Scheme of boiler controls—gas side. (Courtesy of ABCO Industries, Abilene, TX.)
Copyright © 2003 Marcel Dekker, Inc.

FIGURE 3.15b Scheme of boiler controls—steam side. (Courtesy of ABCO Industries, Abilene, TX.)
Copyright © 2003 Marcel Dekker, Inc.

of air; this system typically operates stably between 20% and 100% vane opening,
which does not translate into a large flow difference, as can be seen from Fig.
3.16c. Hence a small margin on flow and head is preferred—about 15% margin
on flow and 20–25% on head is adequate; otherwise one may have to use a
variable-speed drive or frequency modulation for control, which is expensive.
Underestimating the fan head can also cause the fan to operate in the unstable
FIGURE 3.16 (a) Fan performance and range of operation. (b) Effect of system
resistance on fan horsepower. (c) Effect of vane position on flow reduction in fans.
Copyright © 2003 Marcel Dekker, Inc.

region as shown in Fig. 3.16a. Curve 2 in Fig. 3.16b is the estimated curve, and
the actual curve 1 is to the left, close to the unstable region with positive slope. It
also delivers less flow than required. The fan operating point must preferably be
in the negatively sloping portion of the head versus flow curve; otherwise the fan
could operate in the unstable region, causing surges and vibration. The flue gas
recirculation lines must be properly sized; typical air and flue gas velocity in
ducts is about 40 ft=s.The flue gas recirculation line is usually connected to the fan inlet in gas
and distillate oil–fired boilers. This increases the size of the forced draft fan. The
higher gas pressure drop in the boiler due to the increased mass flow should also
be considered when selecting the fan. A separate recirculation fan is used
occasionally when heavy fuel oils containing sulfur are fired and the flue gases
are admitted into the burner wind-box. If the flue gases were allowed to mix with
the cold air at the fan inlet, the mixture temperature could fall below the acid dew
point, possibly leading to corrosion.
The fan inlet duct and downstream ductwork must have proper flow
distribution. Pulsations and duct vibrations are likely if the inlet airflow to the
fan blades is not smooth and the maldistribution in velocity is large. Similarly, the
ductwork between the fan and wind-box should be designed to minimize flow
maldistribution to ensure proper airflow to the burner.
SUPERHEATERS
The superheater is an important component of a packaged boiler. The degree of
superheat could be very high, with steam temperatures up to 1000�F, or as low as
FIGURE 3.16 Continued.
Copyright © 2003 Marcel Dekker, Inc.
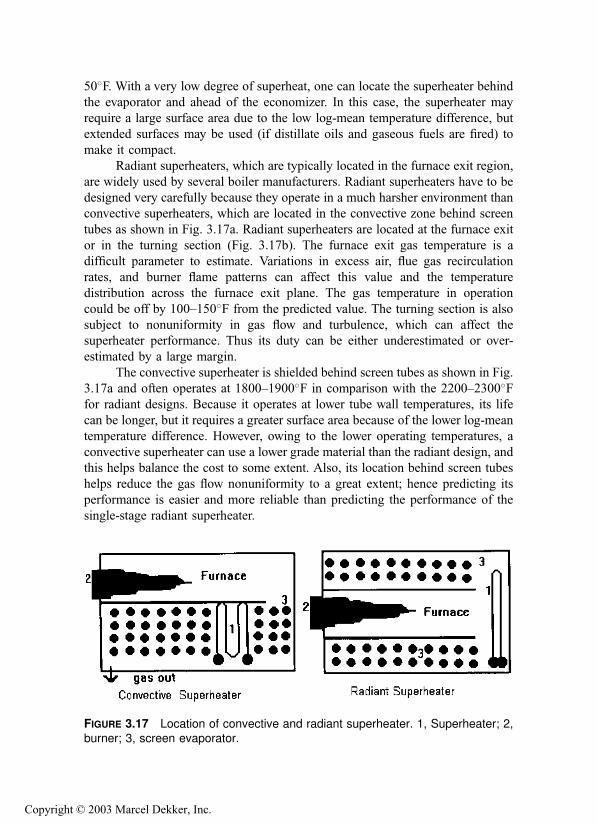
50�F. With a very low degree of superheat, one can locate the superheater behind
the evaporator and ahead of the economizer. In this case, the superheater may
require a large surface area due to the low log-mean temperature difference, but
extended surfaces may be used (if distillate oils and gaseous fuels are fired) to
make it compact.
Radiant superheaters, which are typically located in the furnace exit region,
are widely used by several boiler manufacturers. Radiant superheaters have to be
designed very carefully because they operate in a much harsher environment than
convective superheaters, which are located in the convective zone behind screen
tubes as shown in Fig. 3.17a. Radiant superheaters are located at the furnace exit
or in the turning section (Fig. 3.17b). The furnace exit gas temperature is a
difficult parameter to estimate. Variations in excess air, flue gas recirculation
rates, and burner flame patterns can affect this value and the temperature
distribution across the furnace exit plane. The gas temperature in operation
could be off by 100–150�F from the predicted value. The turning section is also
subject to nonuniformity in gas flow and turbulence, which can affect the
superheater performance. Thus its duty can be either underestimated or over-
estimated by a large margin.
The convective superheater is shielded behind screen tubes as shown in Fig.
3.17a and often operates at 1800–1900�F in comparison with the 2200–2300�Ffor radiant designs. Because it operates at lower tube wall temperatures, its life
can be longer, but it requires a greater surface area because of the lower log-mean
temperature difference. However, owing to the lower operating temperatures, a
convective superheater can use a lower grade material than the radiant design, and
this helps balance the cost to some extent. Also, its location behind screen tubes
helps reduce the gas flow nonuniformity to a great extent; hence predicting its
performance is easier and more reliable than predicting the performance of the
single-stage radiant superheater.
FIGURE 3.17 Location of convective and radiant superheater. 1, Superheater; 2,burner; 3, screen evaporator.
Copyright © 2003 Marcel Dekker, Inc.

Several boilers operate at partial loads of less than 60% for large periods.
The radiant superheater, by its nature, absorbs more enthalpy at lower loads,
hence the steam temperature increases at lower loads. Convective heat transfer
depends on mass flow of flue gases, so as the load decreases, the gas flow and
temperature decrease at the superheater region, and therefore the steam tempera-
ture and the tube wall temperatures drop with load. Also if at 100% load the
steam-side pressure drop in a radiant superheater is 50 psi, then at 30%, it will be
about 5 psi, which can lead to concerns about steam flow distribution through the
tubes when it is receiving more radiant energy per unit mass of steam. Coupled
with nonuniform gas flow distribution at low loads and low gas velocities, the
radiant superheater poses several concerns about its tube wall temperatures and
hence its life.
The convective superheater is located behind several rows of screen tubes
that shield it from furnace radiation. Gas flow entering the superheater is well
mixed; hence it is easier to predict its performance and tube wall temperatures. As
mentioned earlier, its surface area requirement may be more, but one is assured of
low tube wall temperatures and hence longer life.
The steam temperature in a convective superheater generally decreases as
the load falls off, whereas in a radiant design it remains within a small range over
a larger load range. Hence the convective design has to be sized to ensure that the
required steam temperature is achieved at the lowest load, which can increase its
size and cost.
The choice of whether to use a radiant or a convective superheater is based
on the experience of the supplier. Because the surface area requirements are
significantly different due to the different log-mean temperature differences, this
is yet another reason that a comparison of surface areas can be misleading.
If heavy oil is fired in the boiler, the problems associated with slagging and
high temperature corrosion pose concerns for the longevity and operability of
radiant superheaters as discussed below, so convective superheater designs are
preferred in such cases. Packaged boilers use limited space compared to utility or
field-erected boilers; with high gas velocities and slagging potential in the furnace
exit region, the radiant design is vulnerable. Even with a convective superheater
design, care should be taken to use retractable soot blowers, and there should be
adequate space provided for cleaning and maintenance.
Steam Temperature Control
The steam temperature in packaged boilers is often controlled from 60% to 100%
load by using a two-stage superheater design with interstage attemperation as
shown in Fig. 3.18. Steam temperature can also be maintained from 10% to
100%; however, this calls for a much larger superheater surface area. Deminer-
alized water should be used for attemperation, because it does not add solids to
Copyright © 2003 Marcel Dekker, Inc.

the steam. The solids in the feedwater used for attemperation should be in the
same range as the final steam purity desired, which could be as low as
30–100 ppb. If solids are deposited inside the superheater, the tubes can
become overheated, particularly if operated at high loads and high heat flux
conditions. The convective superheaters are generally oversized at 100% load as
explained earlier. The quantity of water spray is larger at higher load. In the
radiant design, the steam temperature remains nearly flat over the load range
because the radiant component of energy increases at lower loads and decreases at
higher loads. Thus many radiant superheaters do not use a two-stage design.
However, reviewing other concerns such as possible overheating of tubes and
higher tube wall temperatures, the choice is left to the user.
When demineralized water is not available, a portion of the saturated steam
from the drum is taken and cooled in a heat exchanger, preheating the feedwater
as shown in Fig. 3.18. The condensed water is then sprayed into the attemperator
between the two stages of the superheater. Often, in order to balance the pressure
drops in the two parallel paths, a resistance is introduced into each path or the
exchanger is located vertically up, say 30–40 ft above the boiler, to provide
additional head for the spray water control valve operation.
Spraying downstream of the superheater for steam temperature control is
not recommended, because the steam temperature at the superheater exit increases
with load, thus increasing the superheater tube wall temperature, which can lead
to tube failures. For example, if 800�F is the final steam temperature desired, the
steam temperature at the superheater exit may run as high as 875–925�F, whichwill diminish the life of the tubes over a period of time. Also, the water droplets
FIGURE 3.18 Steam temperature control methods.
Copyright © 2003 Marcel Dekker, Inc.
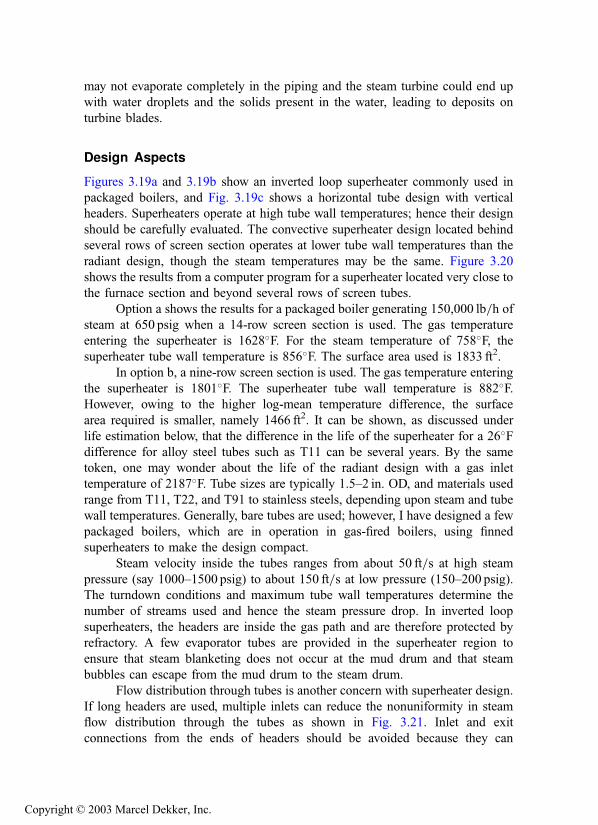
may not evaporate completely in the piping and the steam turbine could end up
with water droplets and the solids present in the water, leading to deposits on
turbine blades.
Design Aspects
Figures 3.19a and 3.19b show an inverted loop superheater commonly used in
packaged boilers, and Fig. 3.19c shows a horizontal tube design with vertical
headers. Superheaters operate at high tube wall temperatures; hence their design
should be carefully evaluated. The convective superheater design located behind
several rows of screen section operates at lower tube wall temperatures than the
radiant design, though the steam temperatures may be the same. Figure 3.20
shows the results from a computer program for a superheater located very close to
the furnace section and beyond several rows of screen tubes.
Option a shows the results for a packaged boiler generating 150,000 lb=h of
steam at 650 psig when a 14-row screen section is used. The gas temperature
entering the superheater is 1628�F. For the steam temperature of 758�F, thesuperheater tube wall temperature is 856�F. The surface area used is 1833 ft2.
In option b, a nine-row screen section is used. The gas temperature entering
the superheater is 1801�F. The superheater tube wall temperature is 882�F.However, owing to the higher log-mean temperature difference, the surface
area required is smaller, namely 1466 ft2. It can be shown, as discussed under
life estimation below, that the difference in the life of the superheater for a 26�Fdifference for alloy steel tubes such as T11 can be several years. By the same
token, one may wonder about the life of the radiant design with a gas inlet
temperature of 2187�F. Tube sizes are typically 1.5–2 in. OD, and materials used
range from T11, T22, and T91 to stainless steels, depending upon steam and tube
wall temperatures. Generally, bare tubes are used; however, I have designed a few
packaged boilers, which are in operation in gas-fired boilers, using finned
superheaters to make the design compact.
Steam velocity inside the tubes ranges from about 50 ft=s at high steam
pressure (say 1000–1500 psig) to about 150 ft=s at low pressure (150–200 psig).
The turndown conditions and maximum tube wall temperatures determine the
number of streams used and hence the steam pressure drop. In inverted loop
superheaters, the headers are inside the gas path and are therefore protected by
refractory. A few evaporator tubes are provided in the superheater region to
ensure that steam blanketing does not occur at the mud drum and that steam
bubbles can escape from the mud drum to the steam drum.
Flow distribution through tubes is another concern with superheater design.
If long headers are used, multiple inlets can reduce the nonuniformity in steam
flow distribution through the tubes as shown in Fig. 3.21. Inlet and exit
connections from the ends of headers should be avoided because they can
Copyright © 2003 Marcel Dekker, Inc.
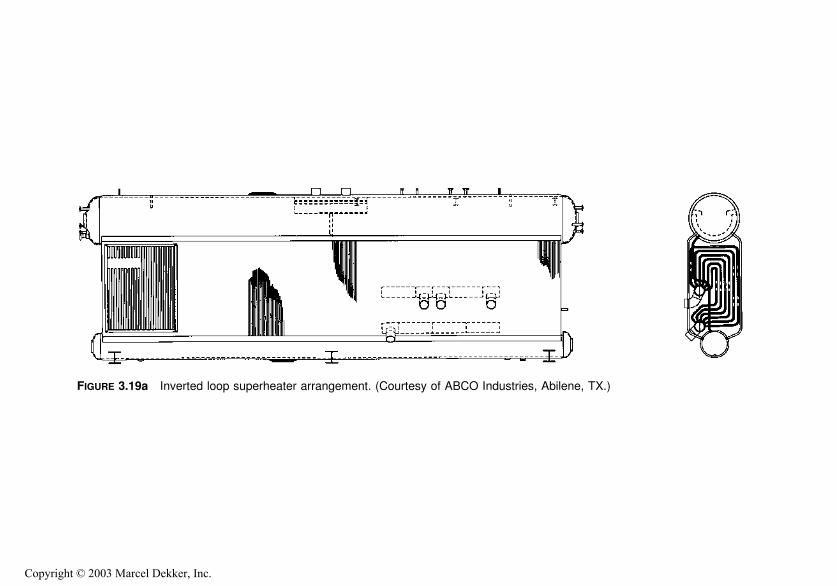
FIGURE 3.19a Inverted loop superheater arrangement. (Courtesy of ABCO Industries, Abilene, TX.)
Copyright © 2003 Marcel Dekker, Inc.

result in flow distribution problems. In arrangement 1, the inlet and exit
connections are on opposite ends, causing the greatest difference in static
pressure at the ends of the headers, and should be avoided. Arrangement 2 is
better than 1 because the flow distribution is more uniform. However, arrange-
ment 3 is preferred, because the central inlet and exit reduce the differential static
pressure values by one-fourth, so the flow maldistribution is minimal.
FIGURE 3.19b An inverted loop superheater. (Courtesy of ABCO Industries,
Abilene, TX.)
Copyright © 2003 Marcel Dekker, Inc.

FIGURE 3.19c Horizontal tube superheater arrangement. (Courtesy of ABCO
Industries, Abilene, TX.)
Copyright © 2003 Marcel Dekker, Inc.
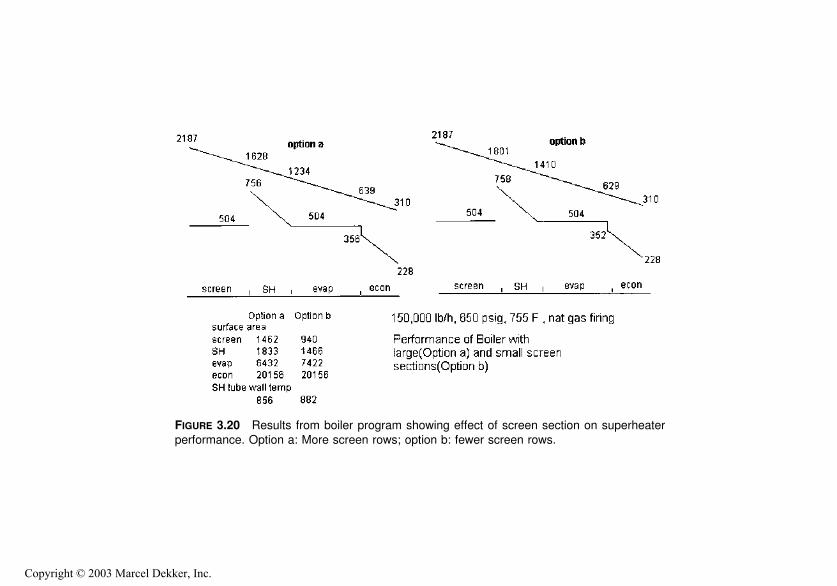
FIGURE 3.20 Results from boiler program showing effect of screen section on superheaterperformance. Option a: More screen rows; option b: fewer screen rows.
Copyright © 2003 Marcel Dekker, Inc.

Two temperatures are of significance in the design of superheater tubes.
One is the tube midwall temperature, which is used to evaluate the tube thickness
per ASME code. (The published ASME stress values have increased during the
last few years and therefore the latest information on stress values should be used
in calculating the tube thickness.) The outer wall temperature determines the
maximum allowable operating temperature, sometimes known as the oxidation
limit. Table 3.6 gives typical maximum allowable temperatures for a few
materials.
One can vary the tube thickness to handle the design pressure, but if the
outermost tube temperature gets close to the oxidation limit, we have to review
FIGURE 3.21 Flow nonuniformity due to header arrangements.
TABLE 3.6 Maximum Allowable Temperatures
Material Composition Temp (�F)
SA 178A (erw) Carbon steel 950SA 178C (erw) Carbon steel 950
SA 192 (seamless) Carbon steel 950SA 210A1 Carbon steel 950SA 210C Carbon steel 950
SA 213-T11 1.25Cr-0.5Mo-Si 1050SA 213-T22 2.25Cr-1Mo 1125SA 213-T91 9Cr-1Mo-V 1200SA 213-TP304H 18Cr-8Ni 1400
SA 213-TP347H 18Cr-10Ni-Cb 1400SA 213-TP321H 18Cr-10Ni-Ti 1400SB 407-800H 33Ni-21Cr-42Fe 1500
Copyright © 2003 Marcel Dekker, Inc.

the design. In large superheaters, different materials and tubes of different sizes
may be used at different sections, depending on the tube midwall and outer wall
temperatures. In all these calculations one has to consider the nonuniformity in
gas flow, gas temperature across the cross section, and steam flow distribution
through the tubes. Because of their shorter lengths, a few tubes could have higher
flow and starve the longer tubes.
Life Estimation
High alloy steel tubes used in superheaters and reheaters, unlike carbon steel, fail
by creep rupture. Creep refers to the permanent deformation of tubes that are
operated at high temperatures. Carbon steel tubes operate in the elastic range
where allowable stresses are based on yield stresses, whereas alloy tubes operate
in the creep-rupture range, where allowable stresses are based on rupture strength.
The life of superheater tubes is an important datum that helps plant engineers plan
tube replacements or schedule maintenance work. When a new superheater tube
is placed in service, it starts forming a layer of oxide scale on the inside. This
layer gradually increases in thickness and also increases the tube wall tempera-
ture. Therefore, to predict the life of the tubes, information on the corrosion or the
formation of the oxide layer is necessary. The corrosion of oxide formation also
reduces the actual thickness of the tubes and increases the stresses in the tubes
over time even if the pressure and temperature are the same. The data on oxide
formation were once obtained by cutting tube samples and examining them but
are now obtained through nondestructive methods. There are also methods to
relate the oxide layer thickness with tube mean wall temperatures over a period of
time.
Creep data are available for different materials in the form of the Larson
Miller parameter, LMP. This relates the rupture stress value to temperature T and
the remaining lifetime t, in hours.
LMP ¼ ðT þ 460Þð20þ log tÞ
Every tube in operation has an LMP value that increases with time. LMP can be
related to stress values and the relationship then used to predict remaining life.
However, there are charts that give what is called the minimum and the average
rupture stress versus LMP, and one can compute different life times with the
different values. Also, it can be seen that even a few degrees difference, say 10�Fin metal temperatures, can change the lifetime by a large amount, which shows
how complex and difficult it is to interpret the results. Figure 3.22 shows the
relationships between LMP and minimum rupture stress values for T11 and T22
materials.
Copyright © 2003 Marcel Dekker, Inc.

Example 7
Assume that a superheater of T11 material operates at 1000�F and at a hoop stressof 6000 psi. What is the predicted time to failure? From Fig. 3.22, the LMP at
6000 is 36,800.
Solution: From the above equation, we can see that
36; 800 ¼ ð1460Þð20þ log tÞ; or t ¼ 160;500 h
If a tube had operated at this temperature for 50,000 h, its life consumed would be
50,000=160,500¼ 0.31, or 0.69 of its life would remain. If after this period of
50,000 h, it operated at, say, 1020�F and at the same stress level, then
36;800 ¼ ð1480Þð20þ log tÞ; or t ¼ 73;250 h
and the number of operating hours at this temperature would be 0.69� 73,250¼50,728 h.
One can see from the above how sensitive these numbers are to tempera-
tures and stress values. Hence we have to interpret the results with caution backed
up by operational experience. Simplistic approaches to replacement of tube
bundles are not recommended. It should also be noted that if the average rupture
stress is used instead of the minimum value, the lifetime would be much higher,
casting more uncertainty in these calculations.
FIGURE 3.22 Larson–Miller parameters for T11 and T22 materials.
Copyright © 2003 Marcel Dekker, Inc.

ECONOMIZERS
Economizers are used as heat recovery equipment in packaged boilers instead of
air heaters because of NOx concerns as discussed in Chapter 4. They are also less
expensive and have lower gas pressure drops across them. Economizers for gas
firing typically use serrated fins at four to five fins per inch. For distillate fuel,
about 4 fins=in, solid fins are preferred. For heavy oil, bare tubes or a maximum
of 2–3 fins=in. are used, depending upon the dirtiness of the flue gas and the ash
content of the fuel.
Economizers are generally of vertical gas flow and counterflow configura-
tion with horizontal tubes as shown in Fig. 3.23. The water-side velocity ranges
from 3 to 7 ft=s. Small packaged boilers, below 40,000 lb=h capacity, use circular
economizers that can be fitted into the stack. Another variation is the horizontal
gas flow configuration with vertical headers and horizontal tubes.
Generally, steaming in the economizer is not a concern, as discussed earlier.
Feedwater temperatures of 230–320�F are common, depending on acid dew point
concerns. The feedwater is sometimes preheated in a steam–water exchanger if
the deaerator delivers a lower feedwater temperature than that desired to avoid
acid corrosion in the case of oil-fired boilers.
BOILER PERFORMANCE ASPECTS
Plant engineers are interested in knowing how a given boiler performs at various
loads. The variables affecting its performance are the fuel, amount of excess air,
FGR rate, and steam parameters. Tables 3.4 and 3.7 show how boiler performance
varies with load on gas and oil firing. Figure 3.24 shows the results in graph form.
The following observations can be made:
1. As the load increases, the boiler exit gas temperature increases. This is
due to the larger flue gas mass flow transferring energy to a given
heating surface. The water temperature leaving the economizer is
higher at loads owing to the higher gas temperature entering the
economizer. The approach point (difference between saturation and
water temperature entering evaporator) is lower at higher loads.
Steaming in the economizer is not a concern in steam generators
because the approach point is quite large at full load and increases at
lower loads. The ratio of gas flow to steam generation is maintained at
1.2–1.3 at various loads. Hence the economizer does not absorb more
energy at low loads as in the case of HRSGs.
2. The boiler efficiency increases as the load increases, peaks at about 50–
70% of load, then drops off. The two major variables affecting the heat
losses are the casing heat losses and heat loss due to flue gases. Q6.24
discusses this calculation. As the load increases, the flue gas heat losses
Copyright © 2003 Marcel Dekker, Inc.
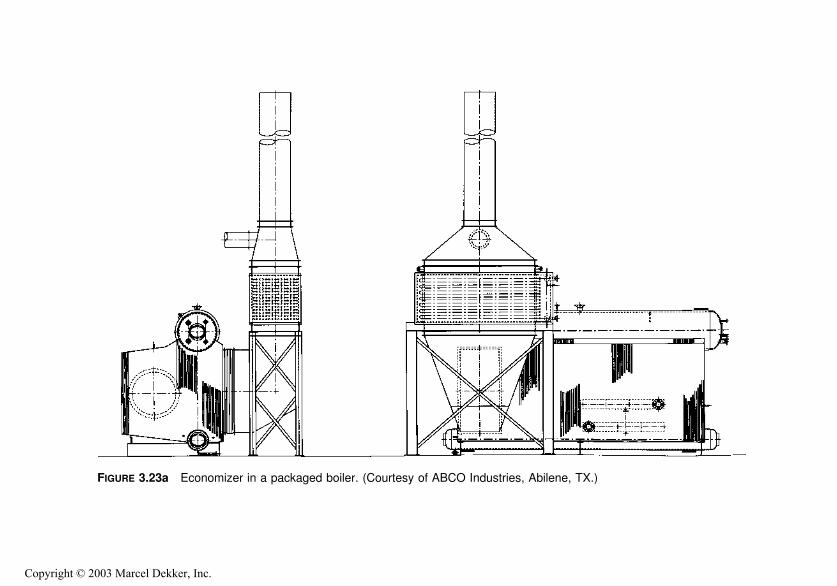
FIGURE 3.23a Economizer in a packaged boiler. (Courtesy of ABCO Industries, Abilene, TX.)
Copyright © 2003 Marcel Dekker, Inc.

increase due to the higher exit gas temperature. The casing loss
decreases as a percentage but, as explained in Q6.24, in terms of
Btu=h it remains the same because the evaporator operates at saturation
temperature, so heat losses in Btu=h are unaffected by boiler load
except if ambient temperature or wind velocity changes. Thus the
combination of these losses results in a parabolic shape for efficiency
as a function of load.
3. The steam temperature generally increases with load owing to the
convective nature of the superheater. If a radiant design were used, it
would decrease slightly at higher loads.
4. It may also be seen that the gas temperature leaving the evaporator
decreases as the load decreases. If an SCR is used between the
evaporator and the economizer, the gas temperature should be main-
tained in the range of typically 650–780�F; hence one may have to use
a gas bypass system to obtain a higher gas temperature at low loads.
Chapter 4 shows the arrangement of dampers to achieve this purpose.
5. The steam temperature on oil firing is lower than that in gas firing. This
is due to the better absorption of energy from the oil flames in the
FIGURE 3.23b Photo of an economizer. (Courtesy of ABCO Industries, Abilene,
TX.)
Copyright © 2003 Marcel Dekker, Inc.
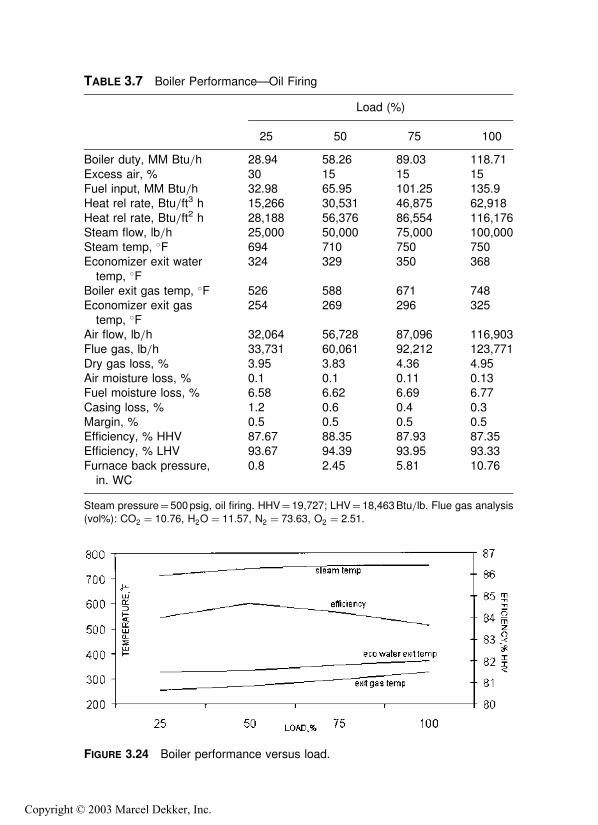
TABLE 3.7 Boiler Performance—Oil Firing
Load (%)
25 50 75 100
Boiler duty, MM Btu=h 28.94 58.26 89.03 118.71
Excess air, % 30 15 15 15Fuel input, MM Btu=h 32.98 65.95 101.25 135.9Heat rel rate, Btu=ft3 h 15,266 30,531 46,875 62,918
Heat rel rate, Btu=ft2 h 28,188 56,376 86,554 116,176Steam flow, lb=h 25,000 50,000 75,000 100,000Steam temp, �F 694 710 750 750Economizer exit water
temp, �F324 329 350 368
Boiler exit gas temp, �F 526 588 671 748Economizer exit gas
temp, �F254 269 296 325
Air flow, lb=h 32,064 56,728 87,096 116,903Flue gas, lb=h 33,731 60,061 92,212 123,771
Dry gas loss, % 3.95 3.83 4.36 4.95Air moisture loss, % 0.1 0.1 0.11 0.13Fuel moisture loss, % 6.58 6.62 6.69 6.77
Casing loss, % 1.2 0.6 0.4 0.3Margin, % 0.5 0.5 0.5 0.5Efficiency, % HHV 87.67 88.35 87.93 87.35Efficiency, % LHV 93.67 94.39 93.95 93.33
Furnace back pressure,in. WC
0.8 2.45 5.81 10.76
Steam pressure¼ 500psig, oil firing. HHV¼ 19,727; LHV¼ 18,463Btu=lb. Flue gas analysis
(vol%): CO2 ¼ 10:76, H2O ¼ 11:57, N2 ¼ 73:63, O2 ¼ 2:51.
FIGURE 3.24 Boiler performance versus load.
Copyright © 2003 Marcel Dekker, Inc.
furnace, which results in a lower furnace exit gas temperature and
lower gas temperature at the superheater in oil firing. Hence the steam
temperature is lower. However, if we wanted to maintain the same
steam temperature on both oil and gas firing, we would have to size the
superheater so that it makes the steam temperature in the oil-firing case
and then control it in gas firing by attemperation.
Performance Without an Economizer
If we look at Table 3.4 for performance of a boiler at, say, 100% load, we see that
the gas temperature leaving the evaporator is 739�F and leaving the economizer it
is 327�F. Now if the economizer is removed from service, can we assume that the
exit gas temperature will still be 739�F? The answer is No, for the following
reasons:
1. The boiler efficiency drops significantly, by at least (7397 327)=40¼10.3%. Hence the efficiency will be at best 83.667 10.3¼ 73.36%
HHV.
2. The boiler fuel input increases by this ratio. The new heat input is
(118.71=0.7336)¼ 161.8MM Btu=h versus (118.71=0.8366)¼141.9MM Btu=h. Hence the flue gas flow, which is proportional to
heat input, will be higher by 161.8=141.9¼ 1.14 or 14%, or about
1.14� 125,246¼ 142,800 lb=h.3. The furnace heat input and heat release rate will also be higher due to
the lower efficiency and hence higher furnace exit gas temperature. The
combination of higher gas flow and higher gas inlet temperature to
the convection bank will increase the exit gas temperature from the
evaporator from 739�F to a slightly higher value. Therefore another
iteration will have to be performed to arrive at the exit gas temperature
based on the revised efficiency and fuel input. The exit gas temperature
could be close to 770–780�F.4. Because of the larger flue gas flow and higher operating temperature in
the evaporator bank, the gas pressure drop will also be higher; it could
be as much as in the earlier case or even more. Hence, the assumption
that removing the economizer will reduce the total gas pressure drop is
incorrect. One has to do the performance calculations before arriving
at any conclusion.
Why the Economizer Does Not Steam in Packaged Boilers
Unlike HRSGs, packaged boilers, fortunately, do not have to deal with the issue
of steaming. The reason is illustrated in Fig. 3.25, which shows the temperature
Copyright © 2003 Marcel Dekker, Inc.

profiles of the economizer of the boiler whose performance is given above and an
HRSG.
Because of the small ratio of gas to water flow in packaged boilers, the
temperature drop of the flue gas has to be large for a given water temperature
increase. If the water temperature increases by, say, 145�F, the gas temperature
drop is given by
1:23� 0:286� ðT1 � T2Þ ¼ 145
or
T1 � T2 ¼ 412�F
whereas in an unfired HRSG, the gas temperature drop of only 105�F accom-
plishes a water temperature increase of 248�F! Thus it is easy for the water to
reach saturation temperature in HRSGs. Thus in spite of the fact that the gas
entering temperature is quite large in packaged boilers (due to the high furnace
exit gas temperature), the water temperature does not increase significantly.
If the water temperature approach is large at 100% load, it will be even
larger at partial loads, because the gas temperature entering the economizer
decreases.
Performance with Oil Firing
Steam generators have been fired with both distillate fuel oils and residual oils.
The design of the boiler does not change much for distillate oil firing compared to
gas firing. The fouling factor used is moderately higher, 0.003–0.005 ft2 h �F=Btu,compared to 0.001 ft2 h �F=Btu for gas firing; rotary soot blowers located at either
end of the convection section are adequate for cleaning the surfaces for distillate
oil firing. With heavy fuel oils, retractable soot blowers are required. Economizers
FIGURE 3.25 Economizer temperature pick-up in boiler versus HRSG.
Copyright © 2003 Marcel Dekker, Inc.

also use rotary blowers in oil-fired applications. Solid fin tubes of a fin density of
three or four per inch may be used if distillate fuels are used, but if heavy oil is
fired it is preferable to use bare tubes or at best 2–3 fins=in. The emissions of
NOx will be higher on the basis of fuel-bound nitrogen, because it can contribute
to nearly 50% of the total NOx. Flue gas recirculation has less effect on NOx in
oil firing than in gas firing.
With residual fuel oil firing, there are several aspects to be considered.
1. High temperature corrosion due to the formation of salts of sodium and
vanadium in the ash has been a serious problem in with heavy oil
boilers fired. The furnace exit region is a potentially dirty zone prone to
deposition of molten ash on heating surfaces. The use of superheaters
in such regions presents serious performance concerns. Retractable
steam soot blowers are required, with access lanes for cleaning. Tubes
should preferentially be widely spaced at the gas inlet region to avoid
bridging of tubes by slag. Vanadium content in fuel oil ash should be
restricted to about 100 ppm to minimize corrosion potential.
2. Superheater materials used in heavy oil firing applications should
consider the high temperature corrosion problems associated with
sodium and vanadium salts. The metallurgy of the tubes should be
T22 or even higher if the tube wall temperature exceeds 1000�F. Alarge corrosion allowance on tube thickness is also preferred. This is
yet another reason for preferring a convective superheater design to a
radiant superheater.
3. Steam temperatures with oil firing will be lower than on gas firing as
discussed above.
4. Furnace heat flux will be higher in oil firing than in gas firing.
Therefore one has to check the circulation and the furnace design.
5. One of the problems with firing a fuel containing sulfur is the
formation of sulfur dioxide and its conversion to sulfur trioxide in
the presence of catalysts such as vanadium, which is present in fuel oil
ash. Sulfur trioxide combines with water vapor to form sulfuric acid
vapor, which can condense on surfaces whose temperature falls below
the acid dew point. Q6.25 illustrates the estimation of dew points of
various acid vapors. Sulfuric acid dew points can vary from 200 to
270�F depending on the amount of sulfur in the fuel. If the tube wall
temperature of the economizer or air heater falls below the acid dew
point, condensation and hence corrosion due to the acid vapor are
likely. I have seen a few specifications where a parallel flow arrange-
ment was suggested for the economizer to minimize acid dew point
corrosion. Because the feedwater temperature governs the tube wall
temperature and not the flue gas temperature, only maintaining a high
Copyright © 2003 Marcel Dekker, Inc.
water temperature avoids this problem, as shown in Q6.25c. One could
use steam to preheat the feedwater or use the water from the exit of the
economizer to preheat the incoming water in a heat exchanger.
Experience and research show that acid corrosion potential is maxi-
mum not at the dew point but at slightly lower values, about 15–20�Cbelow the dew point. Hence one may use a feedwater temperature even
slightly lower than the dew point of the acid vapor in order to recover
more energy from the waste gas stream. In waste heat boiler econo-
mizers, other acid vapors such as hydrochloric acid or hydrobromic
acid may be present. The dew points of these are much lower than that
of sulfuric acid, as discussed in Q6.25, so care must be taken in the
design of economizers or air heaters in heat recovery applications.
Table 3.7 shows the boiler performance with distillate oil firing. The
efficiency on LHV basis is nearly the same as for gas firing, but on HHV basis
there is a difference. The flue gas analysis with 15% excess air is shown. The flue
gases have less water vapor but more carbon dioxide than flue gases from natural
gas combustion.
Effect of FGR on Boiler Performance
Flue gas recirculation is widely used as a method of NOx control because it
reduces the flame temperature and thus lowers NOx formation as discussed in
Chapter 4. The effect of FGR on boiler performance is quite significant. Not only
is the gas temperature profile across the boiler different, but the steam tempera-
ture and gas pressure drop are also affected.
Table 3.8 shows the performance of a 150,000 lb=h boiler with and without
FGR. The following points may be noted:
1. The flue gas quantity increases with FGR; hence the backpressure
increases at all loads.
2. The steam temperature is higher with FGR in both 100% and 50% load
cases, but the difference is greater at low loads.
3. The furnace exit gas temperature is lower with FGR, and the gas
temperature across the superheater is higher at 50% load than at 100%.
Thus load plays a big role in the temperature profiles.
4. The efficiency naturally drops due to the higher stack gas temperature
at both 100% and 50% loads.
Relating FGR and Oxygen in the Wind-Box
Flue gas recirculation affects the oxygen in the wind-box by diluting it. One may
measure the oxygen values to evaluate the FGR rate used.
Copyright © 2003 Marcel Dekker, Inc.

Example 8
A boiler firing natural gas at 15% excess air uses 119,275 lb=h of combustion air,
and about 14,000 lb=h of flue gases is recirculated. Determine the oxygen levels
in the wind-box. Let us assume that the air is dry and is 77% by weight nitrogen
and 23% oxygen. Then the amount of nitrogen in air¼ 0.77� 119,275¼91,842 lb=h, and that of oxygen¼ 27,433 lb=h.
The flue gas analysis (vol%) is CO2 ¼ 8:29;H2O ¼ 18:17;N2 ¼ 71:07,and O2 ¼ 2:47.
To convert to percent by weight (wt%) basis, first obtain the molecular
weight:
MW ¼ ð8:29� 44þ 18:17� 18þ 71:07� 28þ 2:47� 32Þ=100 ¼ 27:61
% CO2 ¼ 8:29� 44=27:61 ¼ 13:21
Similarly, H2O ¼ 11:84 wt%;N2 ¼ 72:07, and O2 ¼ 2:88.
TABLE 3.8 Effect of FGR on Boiler Performance
Load (%)
100 100 50 50
Excess air, % 15 15 15 15FGR, % 0 15 0 15
Combustion, temp, �F 3,230 2,880 3,230 2,880Furnace exit temp, �F 2,350 2,188 2,007 1,956Gas temp to superheater, �F 1,695 1,630 1,323 1,334
Gas temp to evaporator, �F 1,250 1,240 944 973Gas temp to economizer, �F 630 645 543 555Gas temp leaving
economizer, �F300 315 263 270
Flue gas flow, lb=h 185,500 215,000 88,900 104,000Efficiency, % HHV 84.26 83.9 85.1 84.9Steam flow, lb=h 150,000 150,000 75,000 75,000
Steam temp, �F 748 756 686 711Economizer exit watertemp, �F
338 355 318 333
Boiler backpressure,in. WC
6.2 7.8 2.0 2.5
Feedwater temp, �F 228 228 228 228
Fuel: standard natural gas; 1% blowdown; steam pressure¼650psig.
Copyright © 2003 Marcel Dekker, Inc.

The individual constituents in the mixture of 14,000 þ 119,275¼133,275 lb=h of gases are
CO2 ¼ 0:1321� 14;000 ¼ 1849:4 lb=h
H2O ¼ 0:1184� 14;000 ¼ 1658 lb=h
N2 ¼ 91;843þ 0:7207� 14;000 ¼ 101;922 lb=h
O2 ¼ 27;433þ 0:0288� 14;000 ¼ 27;836 lb=h
Converting this to percent by volume basis as we did earlier, we have
CO2 ¼ 0:9 vol %;H2O ¼ 1:98;N2 ¼ 78:37; and O2 ¼ 18:75
SOOT BLOWING
Soot blowing is often resorted to in coal-fired or heavy oil–fired boilers. In
packaged boilers, both steam and air have been used as the blowing media, and
both have been effective with heavy oil firing. Rotary blowers are sometimes used
with distillate oil firing. Steam-blowing systems must have a minimum blowing
pressure of 170–200 psig to be effective. The steam system must be warmed up
prior to blowing to minimize condensation. The steam must be dry. Increasing the
capacity of a steam system is easier than increasing that of an air system. With an
air system, the additional capacity of the compressor must be considered. Also,
because steam has a higher heat transfer coefficient than air, more air is required
for cooling the lances in high gas temperature regions compared to steam.
Moisture droplets in steam can cause erosion of tubes, and often tube shields are
required to protect the tubes. The intensity of the retractable blower jet is more
than that of the rotary blower jet, and its blowing radius is larger, thus cleaning
more surface area. However, one must be concerned about the erosion or wear on
the tubes.
Sonic cleaning has been tried on a few boilers. In this system, low
frequency high energy sound waves are produced when compressed air enters
a sound generator and forces a diaphragm to flex. The resulting sound waves
cause particulate deposits to resonate and dislodge from the surfaces. Once
dislodged, they are removed by gravity or by the flowing gases. Typical
frequencies range from 75 to 33Hz. Sticky particles are difficult to clean. The
nondirectional nature of the sound waves minimizes accumulation in blind spots
where soot blowers are ineffective. Piping work is minimal. Sonic blowers operate
on plant air at 40–90 psi and sound off for 10 s every 10–20min.
Copyright © 2003 Marcel Dekker, Inc.

WATER CHEMISTRY, CARRY OVER, AND STEAM PURITY
Good water chemistry is important for minimizing corrosion and the formation of
scale in boilers. Steam-side cleanliness should be maintained in water tube as well
as fire tube boilers. Plant engineers should do the following on a regular basis:
1. Maintain proper boiler water chemistry in the drum according to
ABMA or ASME guidelines by using proper continuous blowdown
rates. The calculation procedure for the blowdown rate based on
feedwater and boiler water analysis is given in Q5.17.
2. Ensure that the feedwater analysis is fine and that there are no sudden
changes in its conductivity or solids content.
3. Check steam purity to ensure that there are no sudden changes in its
value. A sudden change may indicate carryover.
4. Watch superheated steam temperatures, particularly in boilers with
large load swings. If slugs of water get carried into the steam during
large load swings, the deposits are left behind after evaporation,
potentially leading to tube failure. An indication of slugging, which
is likely in boilers with small drums, is a sudden decrease in steam
temperatures due to entrainment of water in the steam.
In the process of evaporating water to form steam, scale and sludge deposits
form on the heated surfaces of a boiler tube. The chemical substances in the water
concentrate in a film at the evaporation surface; the water displacing the bubbles
of steam readily dissolves the soluble solids at the point of evaporation. Insoluble
substances settle on the tube surfaces, forming a scale and leading to an increase
in tube wall temperatures. Calcium bicarbonate, for example, decomposes in the
boiler water to form calcium carbonate, carbon dioxide, and water. Calcium
carbonate has limited solubility and will agglomerate at the heated surface to
form a scale. Blowdown helps remove some of the deposits. Calcium sulfate is
more soluble than calcium carbonate and will deposit as a heat-deterrent scale.
Most scale-forming substances have a decreasing solubility in water with an
increase in temperature.
In boilers that receive some hardness in the makeup water, deposits are
generally compounds of calcium, sulfate, silica, magnesium, and phosphate.
Depending on tube temperatures and heat flux and the solubility of these
compounds as a function of temperature, these compounds can form deposits
inside the boiler tubes. These scales, along with sludge and oils, form an
insulating layer inside tubes at locations where the heat flux is intense. Alkalinity
and pH of the water also affect the scale formation. Salts such as calcium sulfate
and calcium phosphate deposit preferentially in hot regions. Boilers are consid-
ered generally clean if the deposits are less than 15mg=cm2. Boilers having more
than 40mg=cm2 are considered very dirty. The least soluble compounds deposit
Copyright © 2003 Marcel Dekker, Inc.
first when boiling starts. Calcium carbonate deposits quickly, forming a white
friable deposit. Magnesium phosphate is a binder that can produce very hard,
adherent deposits. Insoluble silicates are present in many boilers. The presence of
sodium hydroxide, phosphate, or sulfate may be considered proof that complete
evaporation has occurred in the tubes, because these are easily soluble salts.
Sludge or easily removable deposits accumulate at the bottom of the tubes
in the mud drum and should be removed by intermittent blowdown, generally
once per shift. Based on conductivity readings, the frequency may be increased or
decreased. Continuous blowdown is usually taken from the steam drum a few
inches from above the waterline, where the concentration of solids is the highest.
Any boiler water treatment program should be reviewed with a water
chemistry consultant, because this program can vary on a case-to-case basis.
Generally the objective is to add chemicals to prevent scale formation caused by
feedwater hardness constituents such as calcium and magnesium compounds and
to provide pH control in the boiler to enhance maintenance of a protective oxide
film on boiler water surfaces. There are methods such a phosphate-hydroxide,
coordinated phosphate, chelant treatment, and polymer treatment methods. In
medium and low pressure boilers, all these methods have been used.
Carryover of impurities with steam is a major concern in boilers having
superheaters and also if steam is used in a steam turbine. Carryover results from
both ineffective mechanical separation methods and vaporous carryover of certain
salts. Vaporous carryover is a function of steam density and can be controlled
only by controlling the boiler water solids, whereas mechanical carryover is
governed by the efficiency of the steam separators used. Total solids carryover in
steam is the sum of mechanical and vaporous carryover of impurities.
The steam purity requirements for saturated steam turbines are not
stringent. Because the saturated steam begins to condense on the first stage of
the turbine, water-soluble contaminants carried with the steam do not form
deposits. Unless the steam is contaminated with solid particles or acidic gases, its
purity does not significantly affect the turbine performance. However, there can
be erosion concerns due to water droplets moving at high speeds.
With superheated steam, steam purity is critical to the turbine. Salts that are
soluble in superheated steam may condense or precipitate and adhere to the metal
surfaces as the steam is cooled when it expands. Deposition from steam can cause
turbine valves to stick. Reduced efficiency and turbine imbalance are the other
concerns. Deposition and corrosion occur in the ‘‘salt zone’’ just above the
saturation line and on surfaces in the wet steam zone. The solubility of all low
volatility impurities such as salts, hydroxides, silicon dioxide, and metal oxides
decreases as steam expands in the turbine and is lowest at the saturation line. The
moisture formed has the ability to dissolve most of the salts and carry them
downstream. The critical region for deposition in turbines operating on super-
heated steam is the blade row located just upward of the Wilson line.
Copyright © 2003 Marcel Dekker, Inc.

Mechanical carryover results from entrainment of small droplets of boiler
water in the separated steam. Because the entrained water droplets contain the
same concentration and proportions of solids as in the boiler water, the steam will
also contain these solids as a function of its moisture content.
Foaming in the boiler water will also result in carryover. Common causes
are excessive boiler water solids, excessive alkalinity, or the presence of organic
matter such as oil. Continuous blowdown should be done to maintain the boiler
water concentration below the ASME=ABMA levels.
Unlike mechanical carryover, vaporous carryover is selective because it
depends on the solubility of the salts in steam. Silica is an example of a
contaminant that has this tendency, particularly at high steam pressures, above
700 psig. Boiler water of a higher pH helps minimize the carryover. Drum
internals (Fig. 3.26) serve to remove moisture from the steam as it leaves the
drum and enters the superheater. Generally the belly pan collects the steam–water
mixture from the riser tubes and directs it inside the drum, where a chevron
separator consisting of multiple vanes with tortuous paths separates the moisture
from the steam. The mass flow of the mixture is the circulation ratio times the
steam generation. Hence the belly pan width must be sized to handle the flow of
this mixture. The steam purity required depends on the application. Saturated
steam used in process heating applications can have a large carryover of solids, as
much as 3–5 ppm. Drum internals need not be elaborate in these cases. A few
steam turbine suppliers demand steam purity in the range of parts per billion for
superheated steam, whereas some accept even 100 ppb total dissolved solids.
FIGURE 3.26 Arrangement of steam drum internals.
Copyright © 2003 Marcel Dekker, Inc.

Restrictions are also placed on sodium and silica in steam. Typical silica levels are
20 ppb. By maintaining proper boiler water chemistry as suggested in Q5.17, per
ABMA and ASME, one can ensure that the steam purity is acceptable. Main-
taining an alkaline condition (pH about 10–11.5) in the boiler water minimizes
corrosion in the boiler; however, the alkalinity should also not exceed 700 ppm
CaCO3. Above this level chemical reactions liberate CO2 into steam, which
results in the corrosion of steam and return lines.
As far as the feedwater is concerned, proper deaeration and the removal of
oxygen by chemical methods helps. Demineralized water is required if it is used
for attemperation to control the steam temperature. Once-through steam genera-
tors and HRSGs need zero solids because complete evaporation of water occurs
inside the tubes. Dissolved oxygen is the factor most responsible for the corrosion
of steel surfaces in contact with water. Oxygen should be less than 5–7 ppb to
minimize these concerns. Chemicals such as hydrazine or sodium sulfite are
added to minimize oxygen corrosion.
Scale formation can affect the tube wall temperatures in fire tube as well as
water tube boilers; as discussed above.
A few plants do not spend sufficient money on water treatment facilities.
Table 3.9 shows how a large amount of blowdown increases the cost of operation
and why it pays to invest in a good water treatment system. Corrosion and steam
purity problems result in additional costs, which cannot be quantified because
they lead to unscheduled maintenance. The additional amount of fuel fired to
generate the same amount of steam is significant over a period of time. I have
seen blowdown on the order of 15–20% in a few refineries.
TABLE 3.9 Cost of Blowdowna
Steam flow, lb=h 100,000 100,000Steam pressure, psig 300 850
Steam temperature, �F Sat 850Feedwater temperature, �F 230 230
Blowdown, % 2 10 2 10
Boiler duty, MM Btu=h 100.8 102.4 123.1 125.7
Heat input, MM Btu=h 121.5 123.4 148.4 151.5Flash steam recovery, % 20 33Additional cost, $=y 36,480 49,850
a Boiler efficiency¼83% HHV; fuel cost¼$3=MM Btu. Operating for 8000h=y.
Copyright © 2003 Marcel Dekker, Inc.

FIRE TUBE BOILERS
Packaged fire tube boilers (Fig. 3.3) generate low pressure saturated steam,
generally below 300 psig. Above this pressure, the thickness of the corrugated
central furnace (referred to as Morrison pipe) becomes larger and it is difficult to
make the corrugations. The corrugations help to reduce the thickness of the
furnace, which operates at a high metal temperature because it contains the flame.
The corrugations also help to handle the thermal expansion differences between
the furnace and the smaller tubes in the second and third passes, which operate at
lower tube wall temperatures. Note that the tube sheets are fixed at the ends of the
tubes, and without this flexibility large stresses would be introduced into the tube
sheets and the tubes. The thickness of a tube subjected to external pressure is
higher than that subjected to internal pressure, as shown in Table 2.2. Fire tube
boilers are typically rated in boiler horsepower (BHP); Q5.08 shows how one can
relate BHP to steam generation. Often these boilers do not need an economizer,
because the exit gas temperature, due to the low pressure of steam, is around 400–
450�F. However, an economizer is used when high efficiency is desired.
The number of passes on the tube side depends upon the supplier. Typically
three to four passes are used. In the wetback design the turnaround section is
immersed in the water, so the hot gases leaving the furnace do not contact the
refractory as in the dryback design, which is less expensive to build. However, the
wetback design has fewer problems with refractory maintenance than the dryback
design. Wet or water-cooled rear doors are also available that minimize refractory
maintenance concerns in dryback boilers. The typical gas temperature at the
furnace exit is about 2000–2200�F, hence the turnaround section with refractory
often requires maintenance.
Oil and gaseous fuels are generally fired in packaged fire tube boilers. Solid
fuels such as wood shavings have also been fired. The boiler capacity has been
limited to about 80,000 lb=h, because it becomes more expensive to build these
boilers as shop-assembled units as the capacity increases. The heat transfer
coefficient with gas flowing inside the tubes is generally less than when it flows
outside the tubes; hence fire tube boilers are large compared to water tube
designs. They are considered economical below 50,000 lb=h of steam. It is
generally difficult to install a superheater in these designs. NOx control methods
such as flue gas recirculation or the use of low-NOx burners have also been used
with these boilers. Due to the large amount of water inventory compared to
equivalent water tube designs, these boilers take a little longer to start up. Steam
purity is generally poor, because the steam is mainly used in heating applications
where steam purity is not a concern and therefore no drum internals are used.
Often single-shell fire tube boilers such as those shown in Fig. 3.3 generate steam
with 3–15 ppm purity. Elevated drums have been used on fire tube boilers to
Copyright © 2003 Marcel Dekker, Inc.
obtain steam with a very high purity if required. The design would be similar to
the elevated drum waste heat boiler discussed in Chapter 2.
When it comes to generating superheated steam, a water tube boiler has
more options, because the superheater can be placed within a bank of tubes or in
the radiant section or beyond the convection section as discussed above. However,
in the case of a fire tube boiler, the options are limited; a possible location is
between the tube passes, but the gas temperatures there are either too high or too
low, making it difficult to design a reasonable superheater. Therefore, packaged
fire tube boilers generally generate saturated steam.
The water inventory in a fire tube boiler is generally larger, thus requiring a
longer start-up period. Heating surfaces can be cleaned by using retractable or
rotary blowers at any location in a water tube boiler, whereas in a fire tube, access
for cleaning is available either at the turnaround section or at the tube sheet ends.
AIR HEATERS
Air heaters are used in a few waste heat boilers for preheating combustion air.
Incineration plants and reformer furnaces also use preheated air. Decades ago
they were used in boilers that fired solid, liquid, and gaseous fuels. However, with
NOx limitations for all kinds of fuels, they are now used only if the combustion of
the fuel warrants it. If the gaseous fuel has a low heating value or if the solid fuel
has a significant amount of moisture, then hot air is required for drying the fuel
and also to ensure combustion with a stable flame. A gas to gas heater, which is
similar to an air heater, is also used in incineration heat recovery plants where
waste fuel is heated by the flue gases from the incinerator before entering the
thermal or catalytic incinerator. In gas-fired or liquid fuel–fired packaged boilers,
air heaters are not generally used. An economizer is the main heat recovery
equipment. There are several types of air heaters, including tubular, regenerative,
and heat pipes, the latter being a recent development. In all these heat exchangers,
air is preheated by using hot flue gases from the boiler or heater. The flue gases
could flow outside or inside the tubes. If the flue gases contain dust or ash
particles, it is preferable to make them flow inside the tubes so that the shell or
casing is not fouled, because it is more difficult to clean the exterior surfaces. The
air takes a multipass route outside the tubes as shown in Fig. 3.27. Q8.28 shows
the sizing procedures.
One of the concerns with air heaters is low temperature corrosion at the
cold end. The tube wall temperature or the plate temperature at the cold end falls
below the acid dew point of the flue gases if the incoming air temperature is low.
Also, tube wall and plate temperatures are lower at lower loads because of their
low heat transfer coefficients. Steam is often used to increase the incoming air
temperature and thus mitigate this concern.
Copyright © 2003 Marcel Dekker, Inc.

There are two types of regenerative air heaters, one in which the heater
matrix rotates, and one in which the connecting air and flue gas duct work rotate.
The first type is called the Ljungstrom air heater. The energy from the hot flue
gases is transferred to a slowly rotating matrix made of enamel or alloy=carbonsteel material, which absorbs the heat and then transfers it to the cold air as it
rotates. The elements are contained in baskets, which makes cleaning or
replacement easier. Regenerative air heaters are more compact than tubular air
heaters, which are heavy and occupy a lot of space. The gas- and air-side pressure
drops are high in both these types of air heaters, adding to the fan power
consumption. Due to the low heat transfer coefficients of air and flue gases and a
low log-mean temperature difference (LMTD), surface area requirements are
large for air heaters. However, a lot of surface area can be packed into each basket
of a regenerative air heater, so they are more compact than the tubular heater.
One of the problems with regenerative air heaters is the leakage of air from
the flue gas side that affects the power consumption and efficiency of the fan.
Though the leakage may be low, on the order of 5–10% depending upon the seal
design, it is significant in large plants. In tubular air heaters, failure of the tubes or
expansion joints could result in leakage from the air side to the gas side, but this
is minimal.
FIGURE 3.27 (a) Rotary regenerative air heater. (b) Tubular air heater.
Copyright © 2003 Marcel Dekker, Inc.
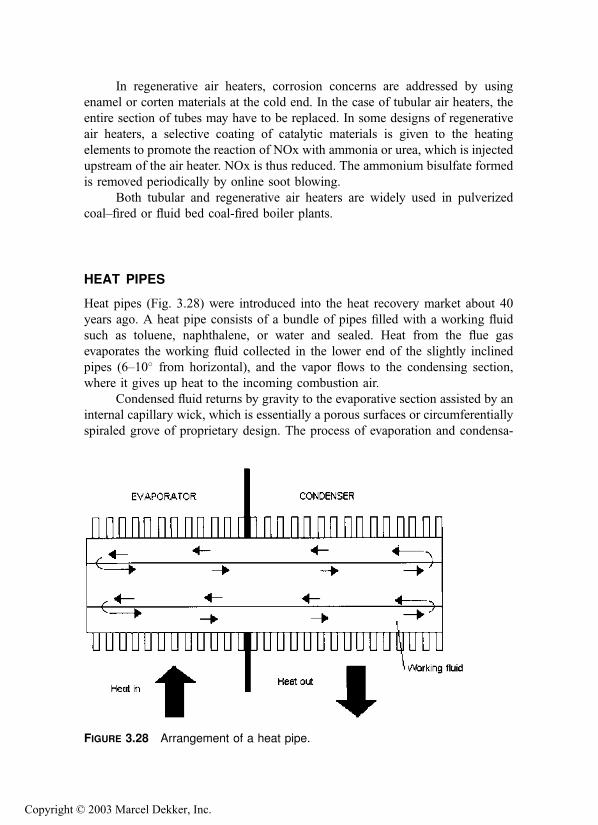
In regenerative air heaters, corrosion concerns are addressed by using
enamel or corten materials at the cold end. In the case of tubular air heaters, the
entire section of tubes may have to be replaced. In some designs of regenerative
air heaters, a selective coating of catalytic materials is given to the heating
elements to promote the reaction of NOx with ammonia or urea, which is injected
upstream of the air heater. NOx is thus reduced. The ammonium bisulfate formed
is removed periodically by online soot blowing.
Both tubular and regenerative air heaters are widely used in pulverized
coal–fired or fluid bed coal-fired boiler plants.
HEAT PIPES
Heat pipes (Fig. 3.28) were introduced into the heat recovery market about 40
years ago. A heat pipe consists of a bundle of pipes filled with a working fluid
such as toluene, naphthalene, or water and sealed. Heat from the flue gas
evaporates the working fluid collected in the lower end of the slightly inclined
pipes (6–10� from horizontal), and the vapor flows to the condensing section,
where it gives up heat to the incoming combustion air.
Condensed fluid returns by gravity to the evaporative section assisted by an
internal capillary wick, which is essentially a porous surfaces or circumferentially
spiraled grove of proprietary design. The process of evaporation and condensa-
FIGURE 3.28 Arrangement of a heat pipe.
Copyright © 2003 Marcel Dekker, Inc.

tion continues as long as there is a temperature difference between the air and flue
gases.
In a typical design, there is a divider plate at the middle of the tube that
supports the tube and also maintains a seal between the hot flue gases and the
cold air. Pipe surfaces are finned to make the heat transfer surfaces compact.
Finned surfaces are used because the heat transfer coefficient inside the tubes is
very high due to the condensation and evaporation. Fin density is based on
cleanliness of the gas stream.
Heat pipes offer several advantages over conventional air heaters:
1. They are compact and weigh less than other air heaters due to the use
of extended surfaces.
2. They have zero leakage because the pipes are stationary and the divider
plate is welded to the tubes.
3. No auxiliary power is needed, because heat pipes do not need a power
source to operate.
4. Maintenance is low because there are no rotating parts.
5. They have low corrosion potential. Owing to the isothermal behavior
of the pipes, the minimum tube metal temperature is higher than in
other types of exchangers. By selecting proper working fluids, it is
possible to maintain the cold end above the acid dew point. The tubes
also operate at constant temperature along their entire length because
of the phase transfer process.
6. They undergo only low stresses because the tubes are fixed at the
midpoint and are allowed to expand at either end.
7. Individual pipe failure does not appreciably affect the overall perfor-
mance of the unit.
8. Gas- and air-side pressure drops are generally lower than in tubular or
regenerative air heaters owing to the compactness of the design.
CONDENSING HEAT EXCHANGERS
The conventional design of economizers and air heaters ensures that cold end
corrosion due to condensing sulfuric acid or water vapor does not occur because
the minimum tube wall temperature is maintained above the dew points.
However, owing to this design philosophy, a significant amount of energy is
lost or not recovered in boilers and HRSGs. The condensing heat exchanger is
designed to allow for the condensation of acid and water vapor over the heat
transfer surfaces, thus recovering a significant amount of sensible and latent heat
from the flue gases. The efficiency of a boiler plant with a condensing heat
recovery system can be close to 99%. With natural gas firing, the partial pressure
of water vapor is about 18%, whereas with oil fuels it is about 12%. With the
Copyright © 2003 Marcel Dekker, Inc.

condensation of this water vapor, significant improvement in efficiency can be
obtained by using oil-fired boilers as shown in Fig. 3.29. Due to the improvement
in the overall efficiency of the boiler or HRSG, the emissions of CO2, NOx and
CO are also reduced.
Unlike conventional economizers and air heaters, which maintain tempera-
tures above 270–300�F to prevent condensation, the condensing exchanger can
operate with water or air at ambient temperatures. Hence condensate or makeup
water at 60–80�F or so can be directly used to be heated up by the flue gases,
whereas in a noncondensing exchanger the lowest feedwater temperature would
vary from 230 to 270�F. Hence the exit flue gas temperature can be around 100–
130�F versus 270–300�F. Because the exchanger tube surface and the exhaust
section of the exchanger are below the dew point of water vapor, a rain of
condensate is produced through dropwise condensation of the water vapor. This
condensate passes around the tube array, carrying particulates and acids that have
been scrubbed and washed from the tubes. A few designs handle the problem of
heat recovery and scrubbing at the same time to remove particulates and acid
gases from the waste gas stream from incineration plants.
The condensing exchanger consists of specially designed tubes coated with
a 0.015 in. extruded layer of FEP Teflon. The inside surfaces of the heat
exchanger are covered with a 0.06 in. thick sheet of PTFE Teflon. During
fabrication, the tubes are pushed through extruded tube seals in the Teflon-
covered tube sheet to form a resilient Teflon-to-Teflon seal. This ensures that all
heat exchanger surfaces exposed to the flue gases are protected against acid
corrosion. To protect the Teflon, the inlet gas temperature is limited to about
500�F. The tubes are generally made of Alloy C70600, which protects them
FIGURE 3.29 Efficiency improvement in oil and gas firing using a condensingexchanger.
Copyright © 2003 Marcel Dekker, Inc.

against acid corrosion. The tube sheet and casing are coated with Teflon to
prevent corrosion. The sub dew point condensing exchanger uses bare tubes due
to the coating required and hence is larger than a finned tube bundle for the same
duty.
Potential applications also include recovery of water from the gas turbine
exhaust for recycle, reducing the amount of fresh makeup water required. The
water could be redirected with proper treatment into the steam–water injection
system for reducing NOx emissions. Cheng cycle systems, in which a large
amount of steam is injected into a gas turbine, are also candidates for condensing
exchangers.
GLASS EXCHANGERS
Borosilicate glass (Pyrex) tubing has been used in heat recovery applications
because it is most resistant to chemical attack and presents no corrosion
problems. Fouling is minimal due to the smoothness of the surfaces. These
tubes also have a low coefficient of expansion and are resistant to thermal shock,
which makes them suitable as heat exchanger tubes. However, the temperature
limit is about 500�F, and the pressure limit is also low, on the order of 60 psig or
less. The thermal conductivity is lower than that of carbon steel, by about one-
third; however, because the tube wall thickness is low, the wall resistance to heat
transfer is also low. Thus, compared to carbon steel tubes the overall heat transfer
coefficient is lower by only a small margin. Flue gas to water heat recovery has
been accomplished by using glass exchangers.
SPECIFYING PACKAGED BOILERS
The following process data should be specified as a minimum.
1. Steam parameters such as flow, pressure, temperature, and feedwater
temperature. If saturated steam is taken from the boiler for deaeration
or for NOx control, fuel oil heating, etc., it should be so stated. If the
makeup water flow is 100%, the deaeration steam could be in the range
of 15% of the steam generation and therefore not an insignificant
amount.
2. If superheated steam is required, the steam temperature control range
should be specified. Generally the steam temperature can be main-
tained from 50 to 100%. A larger range requires a larger superheater.
Also, if several fuels were fired, the steam temperature would vary as
discussed above.
3. Analysis of feedwater entering the economizer should be stated so that
the blowdown requirements can be evaluated. An example is given in
Copyright © 2003 Marcel Dekker, Inc.

Q5.17. In some refinery projects, I have seen very poor feedwater
being used, which results in 10% to even 20% blowdown, which is a
tremendous waste of energy; it also affects the boiler duty and heat
input significantly. Heat input, in turn, affects the flue gas quantity and
gas pressure drop.
4. Emission limits of NOx and CO should be stated up front because they
affect the burner design as well as the furnace design, the flue gas
recirculation rates, and therefore the entire boiler design and perfor-
mance. The use of SCR may also have to be looked into, and the cost
implications are significant.
5. Fuels used and their analysis should be stated. Standard natural gas or
fuel oil may not have significant variations in analysis within the
United States, but for projects overseas the fuel analysis is important.
Some natural gas fuels overseas contain a large percentage of hydrogen
sulfide, which can cause acid dew point problems. Gaseous fuels
should have the analysis in percent by volume and not in percent by
weight, whereas liquid and solid fuels should have the analysis in
percent by weight.
6. Surface areas should not be specified, for reasons discussed earlier.
7. Operating costs such as the cost of fuel and electricity should be stated
as well as the norm for evaluating operating costs. Ignoring operating
costs and selecting boilers based on initial costs alone (which is
unfortunately being done even today!) is doing a disservice to the
end user.
8. Furnace area heat release rates are more important than volumetric heat
release rates for clean fuels, as mentioned earlier, therefore specifying
volumetric heat release rates is not recommended for gas and oil fuels.
9. Large fan margins should not be used, and efforts must be made to
estimate the gas pressure drop accurately. Large margins on flow (such
as 20%) and on heat (40%) not only increase the operating horsepower,
which is a waste of energy, but also make it difficult to operate the fan
at low loads. In boilers with single fans, the margins should be small,
say 10–12% on flow and 20–25% on head. Those familiar with utility
boiler practice where multiple fans are used try to apply the same
norms to packaged boilers, which can lead to operating concerns at low
loads unless variable-speed drives or variable-frequency drives are
used. The ambient temperature variations and elevation at which the
boiler is likely to be used are important because this information helps
in the selection of appropriate fans.
These points along with information on mechanical requirements such as
materials, corrosion allowances, and future operational considerations, if any, are
Copyright © 2003 Marcel Dekker, Inc.

important to the boiler designer. The proposal should also clearly state the
required performance aspects.
REFERENCES
1. V Ganapathy. Understand the basics of packaged steam generators. Hydrocarbon
Processing, July 1997.
2. V Ganapathy. Heat recovery steam generators: understand the basics. Chemical
Engineering Progress, August 1996.
3. V Ganapathy, Customizing pays off in steam generators. Chemical Engineering,
January 1995.
4. API Recommended Practice 530, 2nd. ed. Recommended Practice for Calculation of
Heater Tube Thickness in Petroleum Refineries. May 1978.
5. V Ganapathy. Understand the basics of packaged steam generators. Hydrocarbon
Processing, July 1997.
6. V Ganapathy. Superheaters: design and performance. Hydrocarbon Processing, July
2001.
7. V Ganapathy. 21st century packaged boilers will be larger and more environmentally
friendly. Power Engineering, August 2001.
8. O Jones. Developing steam purity limits for industrial turbines. Power, May 1989.
9. J Robinson. A practical guide to avoiding steam purity problems in the industrial
plant. International Water Conference, October 1992.
10. Nalco Corp. The Nalco Guide to Boiler Failure Analysis. New York: McGraw-Hill,
1991.
11. Editor. Attraction grows for heat pipe air heaters in flue gas streams. Power, February
1989.
12. V Ganapathy. How important is surface area? Chemical Engineering Progress,
October 1992.
13. V Ganapathy. Understand steam generator performance. Chemical Engineering
Progress, December 1994.
Copyright © 2003 Marcel Dekker, Inc.

4
Emission Control in Boilers and HRSGs
INTRODUCTION
Boiler and HRSG designs have undergone significant changes during the last few
decades with the enforcement of emission regulations in various parts of the
world. Decades ago boiler and HRSG users were concerned about two issues
only: the initial cost of the boiler or HRSG and the cost of operation. Low boiler
efficiency, for example, meant higher fuel cost, and a large pressure drop across
boiler heating surfaces resulted in increased fan power consumption. Each
additional 1 in. WC pressure drop in a boiler of 100,000 lb=h capacity results
in about 5 kW of additional fan power consumption. In a gas turbine HRSG, an
additional 4 in. WC of gas pressure drop decreases the gas turbine power output
by about 1.0%. At 320�F stack gas temperature, the difference in efficiency
between 5% and 15% excess air operation on natural gas is about 0.4%.
Therefore, steam generators were operated at the lowest possible excess air,
about 5% or so, to maintain good efficiency. With strict emission regulations in
vogue throughout the world, present-day steam generators or HRSGs, in addition
to having low operating costs, must limit the emissions of CO2;CO;NOx; SOx,
and particulates. The expression ‘‘low NOx, no SOx, and no rocks’’ aptly
describes the direction in which we are headed. However, several of the
techniques used for emission control increase the cost of owning and operating
Copyright © 2003 Marcel Dekker, Inc.

the boilers and HRSGs. For example, in order to meet the stringent levels of NOx
and CO, today’s boilers have to operate at higher excess air and use some flue gas
recirculation (FGR), which affects their efficiency as well as their operating costs
significantly, as we discuss later.
One of the important changes is in the use of an economizer instead of an
air heater for heat recovery in packaged boilers. Air heaters were used in
industrial boilers several decades ago even if the fuel fired was natural gas.
However, as the combustion air temperature to the boiler increases, the NOx
formation increases, because it is a function of flame temperature, as shown in
Fig. 4.1. With natural gas at 15% excess air, each 100�F increase in combustion
air temperature increases the flame temperature by about 65�F. Hence today’s
packaged oil- and gas-fired boilers do not use air heaters. Economizers are used
to improve their efficiency. In addition to increasing NOx, an air heater adds
about 3–5 in. WC to the gas- and air-side pressure drop, while the typical gas
pressure drop across the economizer is 1 in. WC. Therefore, with an economizer
as the heat recovery equipment, substantial savings in operating cost can also be
realized.
Owing to the use of low-NOx burners, the furnace dimensions of standard
boilers may have to be reviewed to avoid flame impingement concerns. The
completely water-cooled furnace (Fig. 4.2) is another innovation that helps in
lowering emissions. If the desired emission levels are in single digits, HRSGs and
packaged boilers use catalysts to minimize NOx and CO, which influences their
design significantly. For example, a gas bypass system has to be provided in
boilers, and the evaporator may have to be split up in the case of HRSGs to
accommodate the selective catalytic reduction (SCR) system.
Thus, there are several variables that affect emissions and numerous options
to minimize them, as indicated in Fig. 4.3, which will be addressed in this
FIGURE 4.1 Typical NOx formation versus flame temperature for natural gas.
Copyright © 2003 Marcel Dekker, Inc.

chapter. These emission control strategies naturally add to the initial and
operating costs of boilers and HRSGs and impact their design as well, a price
we must pay for cleaner air.
HOW POLLUTANTS ARE GENERATED
Before going into further details of how the boiler or HRSG is impacted by
emission regulations, one should first understand what the various pollutants are
FIGURE 4.2 Water-cooled furnace. (Courtesy of ABCO Industries, Abilene, TX.)
FIGURE 4.3 Options for NOx removal in boilers and HRSGs.
Copyright © 2003 Marcel Dekker, Inc.

and how they are formed. In the process of combustion of fossil fuels, be it in
steam generators, gas turbines, or engines, several pollutants are released to the
environment. These include carbon dioxide (CO2), oxides of nitrogen (NOx),
carbon monoxide (CO), oxides of sulfur (SOx), and volatile organic compounds
(VOCs).
Carbon dioxide is considered to be responsible for the greenhouse
effect and global warming. Concentrations of 3–6% can cause headaches;
larger concentrations can lead to unconsciousness and possibly death. Coal
generates about 200 lb CO2=MM Btu fired; oil generates 150 lb and natural
gas about 100 lb per MM Btu. Hence one can see why natural gas is the preferred
fuel in any fired equipment. CO2 molecules retain infrared heat energy,
preventing normal radiation from the earth and leading to warming of the
atmosphere. There are several processes, such as amine-based systems that
can remove CO2 from flue gas streams, but these can be justified only in large
plants.
The presence of carbon monoxide (CO) in flue gases is indicative of
inefficient combustion and may be due to poor burner operation, improper
settings, or even poor boiler design. CO is dangerous to the health of humans
and other living creatures. It passes through the lungs directly into the blood-
stream, where it reduces the ability of the red blood cells to carry oxygen. It can
cause fainting and even death. At an exposure of only 0.1% by volume
(1000 ppm) in air, a human being will be comatose in less than 2 h. A few
regulations establish a maximum exposure of CO of 9 ppm for an 8 h average and
13 ppm for any 1 h period.
Oxides of nitrogen, NOx, are predominantly NO and NO2. The majority of
NOx produced during combustion is NO (95%). NOx is responsible for the
formation of ground-level ozone or smog. Oxides of sulfur, SOx, are formed
when fuels containing sulfur are fired. Sulfur dioxide (SO2) and sulfur trioxide
(SO3) are responsible for acid rain and can damage plant life and materials of
construction. The Taj Mahal in India is a good example of what acid formation
from nearby refineries emitting oxides of sulfur can do to the luster and beauty of
marble over a period of time. Particulates are also formed during combustion that
disperse in the air to form haze and smog, affecting visibility. Dangerous driving
conditions are created in some places due to smog formation. Inhalation of
particulates affects the lungs and the digestive system.
Volatile organic compounds (VOCs), which are generated in industrial
processes such as those of chemical and petrochemical plants, also cause harmful
ozone.
Tremendous efforts are being made to reduce these pollutants in power and
process plants, refinery heaters, and combustion equipment.
Copyright © 2003 Marcel Dekker, Inc.

NOx FORMATION
Nitrogen oxides are of environmental concern because they initiate reactions that
result in the formation of ozone and acid rain, which can cause health problems,
damage buildings, and reduce visibility. The allowable NOx emissions from
boilers and HRSGs vary depending on local regulations but are gradually edging
toward single-digit values in parts per million volume (ppmv) due to advances in
combustion and pollution control technology. The principal nitrogen pollutants
generated by boilers, gas turbines, and engines and other combustion equipment
are nitric oxide (NO) and nitrogen dioxide (NO2), collectively referred to as NOx
and reported as NO2. Once released into the atmosphere, NO reacts to form NO2,
which reacts with other pollutants to form ozone (O3). Oxides of nitrogen are
produced during the combustion of fossil fuels through the oxidation of atmo-
spheric nitrogen and fuel-bound nitrogen. These sources produce three kinds of
NOx: fuel NOx, prompt NOx, and thermal NOx.
Fuel NOx is generated when nitrogen in fuel combines with oxygen in
combustion air. Gaseous fuels have little fuel-bound nitrogen, whereas
coal and oil contain significant amounts. Fuel-bound nitrogen can
account for about 50% of total NOx emissions from coal and oil
combustion. Most NOx control technologies for industrial boilers
reduce thermal NOx and have little impact on fuel NOx, which is
economically reduced by fuel treatment methods or by switching to
cleaner fuels. Fuel NOx is relatively insensitive to flame temperature but
is influenced by oxygen availability.
Prompt NOx results when fuel hydrocarbons break down and recombine
with nitrogen in air. Prompt NOx is chemically produced by the reactions
that occur during burning; specifically, it forms when intermediate
hydrocarbon species react with nitrogen in air instead of oxygen.
Prompt NOx, so called because the reaction takes place ahead of the
flame tip, accounts for about 15–20 ppm of the NOx formed in the
combustion process and is a concern only in low temperature situations.
Thermal NOx forms when atmospheric nitrogen combines with oxygen
under intense heat. This rate of formation increases exponentially with an
increase in temperature and is directly proportional to oxygen concen-
tration. Its formation is well understood and straightforward to control.
Keeping the flame temperature low reduces it. Below a certain tempera-
ture, thermal NOx is nonexistent, as indicated in Fig. 4.1. Combustion
temperature, residence time, turbulence, and excess air are the other
factors that affect the formation of thermal NOx. Most NOx is formed in
this manner in gas turbines, industrial boilers, and heaters fueled by
natural gas, propane, butane, and light fuel oils.
Copyright © 2003 Marcel Dekker, Inc.
Common boiler fuels in the order of increasing NOx potential are
methanol, ethanol, natural gas, propane, butanes, distillate fuel oil, heavy fuel
oils, and coal.
NOx CONTROL METHODS
Methods for NOx control can be classified into two broad categories:
1. Postcombustion methods: methods that are deployed after flue gases
are generated.
2. Combustion control methods: methods that are deployed during the
combustion process.
Postcombustion Methods
As the name implies, postcombustion methods deal with the flue gases obtained
after combustion. They are more expensive than combustion control methods,
because they handle large quantities of flue gases generated in the process of
combustion. The ratio of flue gas to fuel on a weight basis is about 21 for natural
gas and 18 for fuel oils in steam generators. In gas turbines, the exhaust gas
quantity generated is very large because on the order of 200–300% excess air is
used. The two commonly used methods of control are
1. Selective noncatalytic reduction (SNCR) methods
2. Selective catalytic reduction (SCR) methods
SNCR
In selective noncatalytic reduction a NOx reduction agent such as ammonia or
urea is injected into the boiler exhaust gases at a temperature of approximately
1400–1650�F. The ammonia or urea breaks down the NOx in the exhaust gases
into water and atmospheric nitrogen, plus CO2 if urea is injected. This reaction
takes place in a narrow range of temperatures; as shown in Fig. 4.4, ammonia is
formed below a certain temperature, and above this temperature the NOx level
increases. SNCR reduces NOx by about 70%. The SNCR method is used in large
industrial and utility boilers, which have adequate residence times for the
reduction reactions. In packaged boilers it is difficult to apply this method
because the ammonia or urea must be injected into the flue gases at a specific flue
gas temperature; however, the gas temperature profile varies with load, excess air,
and fuel fired as shown in Fig. 4.5 and residence times in oil- and gas-fired
packaged boilers are generally very small.
Copyright © 2003 Marcel Dekker, Inc.
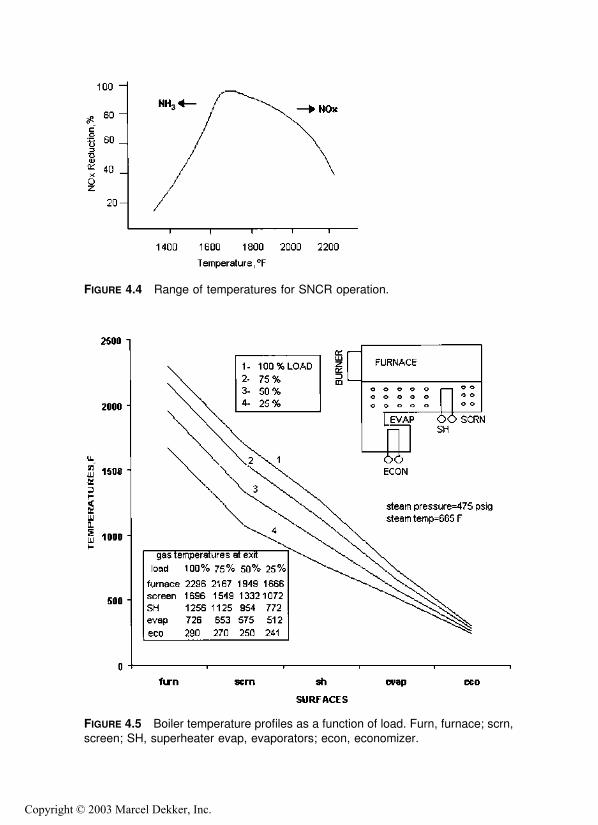
FIGURE 4.4 Range of temperatures for SNCR operation.
FIGURE 4.5 Boiler temperature profiles as a function of load. Furn, furnace; scrn,screen; SH, superheater evap, evaporators; econ, economizer.
Copyright © 2003 Marcel Dekker, Inc.
Typical reactions, that take place with ammonia injection are:
NOþ NH3 þ ð1=4ÞO2�!N2 þ ð3=2ÞH2O
NH3 þ ð5=4ÞO2 ! NOþ ð3=2ÞH2O
Both oxidation and reduction take place. Ammonia oxidizes to form NO.
Because reduction and oxidation reactions are temperature-sensitive, there is a
narrow range of temperatures in which the conversions are efficient. An increase
in ammonia increases the efficiency of conversion; however, excessive ammonia
can slip through the reactions and cause plugging of components downstream.
SNCR has a low cost of operation and may be used in conjunction with other
methods such as a low-NOx burner to improve the efficiency of NOx reduction.
In large field-erected boilers, wall injectors are located at several locations
to inject the ammonia or urea using specially designed lances. This method is not
used in HRSGs because it is difficult to find such a temperature window and also
have a suitable residence time.
Benefits of SNCR include
� Medium to high NOx reduction.
� No by-products for disposal—minimizes waste management concerns,
� Easy to retrofit—little downtime required.
� Minimum space required.
� Can be used along with other NOx reduction methods.
� Low energy consumption. Additional gas pressure drop of flue gases is
zero, unlike in SCR method, where the catalyst could add about 3 to 4 in.
WC to the gas pressure drop, adding to the operating cost.
SCR
If the desired CO and NOx levels are very low, on the order of single digits, a
selective catalytic reduction (SCR) system may have to be used in boilers and
HRSGs, Because most catalysts operate efficiently within a temperature window,
generally 650–780�F, the boiler should have a gas bypass system to accommodate
the gas temperature window at all loads. One can see from Fig. 4.5 how the gas
temperature profile across a packaged boiler varies with load. As the load
decreases, the gas temperature at the various surfaces decreases because a smaller
amount of flue gases is generated at lower load. Hence a gas bypass system, as
shown in Fig. 4.6, that mixes the hot flue gases taken from the convection bank
with the cooler gases at the evaporator exit ensures a higher gas temperature at the
SCR at low loads. Heat recovery steam generators (HRSGs) also use the SCR
system to limit NOx, and, again, to match the gas temperature window of 650–
780�F the evaporator is often split up as shown in Fig. 4.7. If we did not split up
the evaporator, we would have a very low gas temperature at its exit; also we
cannot locate the SCR system ahead of the evaporator, because the gas
Copyright © 2003 Marcel Dekker, Inc.
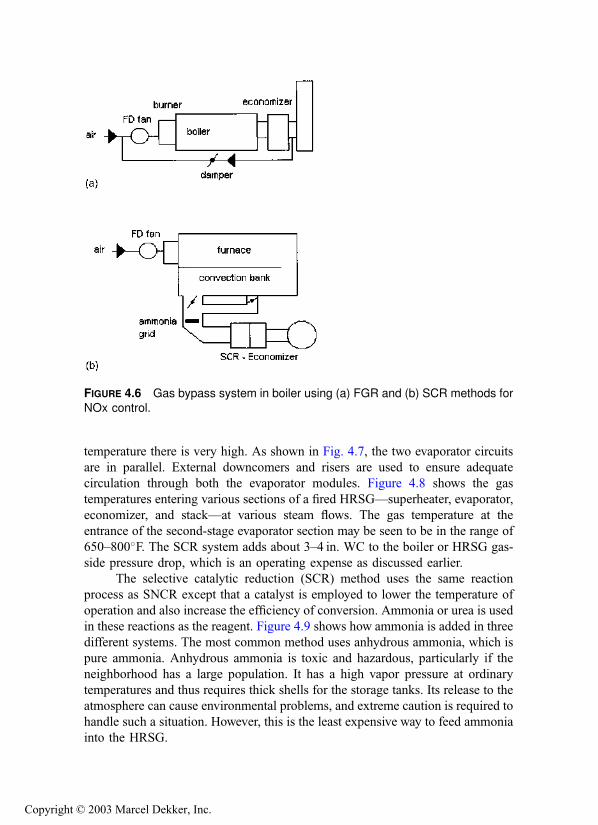
temperature there is very high. As shown in Fig. 4.7, the two evaporator circuits
are in parallel. External downcomers and risers are used to ensure adequate
circulation through both the evaporator modules. Figure 4.8 shows the gas
temperatures entering various sections of a fired HRSG—superheater, evaporator,
economizer, and stack—at various steam flows. The gas temperature at the
entrance of the second-stage evaporator section may be seen to be in the range of
650–800�F. The SCR system adds about 3–4 in. WC to the boiler or HRSG gas-
side pressure drop, which is an operating expense as discussed earlier.
The selective catalytic reduction (SCR) method uses the same reaction
process as SNCR except that a catalyst is employed to lower the temperature of
operation and also increase the efficiency of conversion. Ammonia or urea is used
in these reactions as the reagent. Figure 4.9 shows how ammonia is added in three
different systems. The most common method uses anhydrous ammonia, which is
pure ammonia. Anhydrous ammonia is toxic and hazardous, particularly if the
neighborhood has a large population. It has a high vapor pressure at ordinary
temperatures and thus requires thick shells for the storage tanks. Its release to the
atmosphere can cause environmental problems, and extreme caution is required to
handle such a situation. However, this is the least expensive way to feed ammonia
into the HRSG.
FIGURE 4.6 Gas bypass system in boiler using (a) FGR and (b) SCR methods for
NOx control.
Copyright © 2003 Marcel Dekker, Inc.

FIGURE 4.7 HRSG showing location of NOx (SCR) and CO catalysts.
Copyright © 2003 Marcel Dekker, Inc.
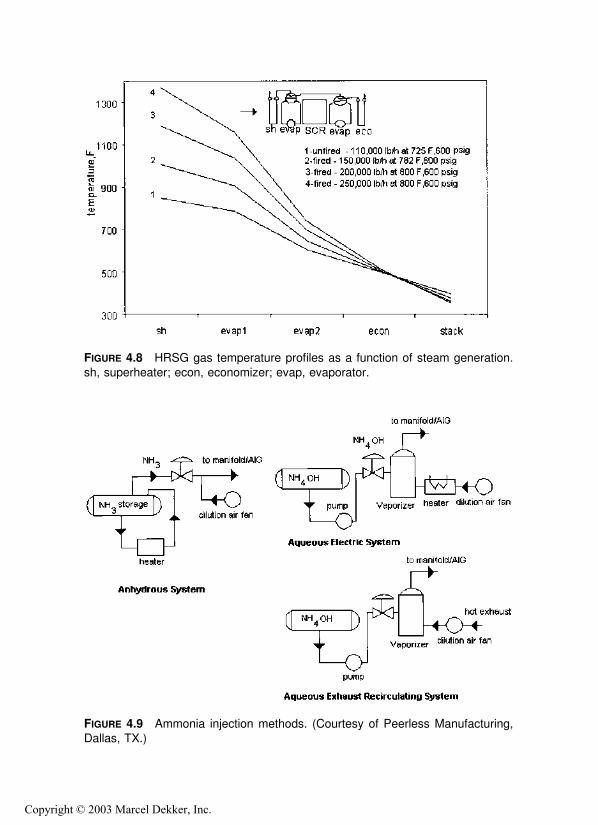
FIGURE 4.8 HRSG gas temperature profiles as a function of steam generation.
sh, superheater; econ, economizer; evap, evaporator.
FIGURE 4.9 Ammonia injection methods. (Courtesy of Peerless Manufacturing,Dallas, TX.)
Copyright © 2003 Marcel Dekker, Inc.

Aqueous NH3ðNH4OHÞ, which is a mixture of ammonia and water, is safer
to handle. A typical grade contains 30% ammonia and 70% water. It has nearly
atmospheric vapor pressure at ordinary temperatures. The liquid ammonia is
pumped to a vaporizer and mixed with heated air before being sent to the mixing
grid. Urea systems, which generate ammonia on-site, are also safer and have been
recently introduced. Dry urea is dissolved to form an aqueous solution, which is
fed to an in-line reactor to generate ammonia by hydrolysis. Heat is applied to
carry out the reactions under controlled conditions. The ammonia is mixed with
air and then injected through a grid into the gas stream.
Computational fluid dynamics (CFD) analysis is done to ensure that the gas
velocity distribution across the boiler or HRSG cross section is uniform, with
variations within 15%. The ammonia vapor is mixed with air and sprayed into the
flue gas stream at the desired location before coming into contact with the
catalyst. A heat transfer surface located immediately behind the ammonia
injection grid ensures good mixing of ammonia vapor with the flue gases. The
optimum gas temperature for the NOx reduction reactions with most catalysts is
600–780�F as mentioned earlier. Below this temperature, chemical reactivity is
impaired, and above it physical damage can occur to the catalyst through
sintering. From the boiler or HRSG design viewpoint, a suitable location has
to be found for the SCR so that at the wide range of loads, the temperature
window is maintained, to ensure that undesirable oxidation of ammonia to NO
does not take place. This is accomplished in a boiler by using a gas bypass system
as discussed earlier. The ammonia injection system is located upstream of the
SCR and should have sufficient mixing length that the flue gases can react with
ammonia. SCR efficiency ratings are in excess of 90%. A gas pressure drop
across the catalyst of about 3–4 in. WC adds to the fan power consumption in a
steam generator and could be a significant power decrement in a gas turbine plant.
Catalysts are typically platinum, vanadium, tungsten, and noble metals and
zeolites, which are used at higher temperatures.
Typical reactions are
4NH3 þ 4NOþ O2 �!catalyst4N2 þ 6H2O
4NH3 þ 2NO2 �!catalyst3N2 þ 6H2O
To complete these reactions, slightly more NH3 than required is injected into the
gas stream. This excess ammonia, which is called slip, is generally limited to a
single-digit value (less than 5 ppm), through a control and emission monitoring
system. The slip value increases gradually over a period of time as the catalyst
nears the end of its service life.
Sulfur-containing flue gas streams present problems for boilers and
HRSGs. The presence of vanadium in the SCR converts SO2 to SO3, which
Copyright © 2003 Marcel Dekker, Inc.

can react with excess ammonia to form ammonium sulfate or with water vapor to
form sulfuric acid, causing problems such as fouling and plugging of tubes
downstream of the boiler or HRSG. Distillate oil contains a small amount of
sulfur, hence the only way to minimize this concern is to limit the operating hours
on oil fuels. Lowering the ammonia slip also helps, but this can lower the NOx
reduction efficiency.
Environmentally ammonium sulfate and bisulfate are particulates that
contribute to visible haze and acidify lakes and ground areas when they settle
out of the air.
Sulfates are formed according to the equations
SO3 þ NH3 þ H2O ! NH4HSO4
SO2 þ 2NH3 þ H2O ! ðNH4Þ2SO4
Ammonium sulfate is a sticky substance that can be deposited on heat transfer
surfaces and cause fouling. The gas pressure drop across the heating surfaces also
increases over a period of time. If the ammonia slip is less than 10 ppm and the
SO3 concentration is less than 5 ppm, expert opinion is that the probability of
ammonium sulfate formation is practically nil unless the gas temperature is low,
on the order of 200�C. Hence low gas temperatures should be avoided,
particularly at the catalysts, because salt formation and deposits there would be
detrimental to the life of the catalyst. Some suppliers require a minimum of 450–
500�F at the catalyst to minimize these reactions. Either ammonium sulfate or
ammonium bisulfate will be formed by the reaction of SO3 and excess ammonia
downstream of the SCR catalyst. In general, ammonium sulfate is considerably
less corrosive than ammonium bisulfate.
One should keep the boiler or HRSG warm in standby conditions during
brief shutdowns if fuel oils are fired. Shutdown and isolation of the HRSG after
oil firing should be avoided because the SO3 can condense during the cooling
phase. For boilers or HRSGs firing natural gas fuels, fortunately, there are no such
concerns as those just discussed. It may be noted that the presence of water vapor
in the flue gases has an adverse effect on NOx reduction efficiency.
Selective catalytic reduction systems have efficiencies of 90–95%.
However, they are expensive and may cost from $3000 to $5000=MM Btu=hin gas or oil-fired packaged boilers. For gas turbines the cost could range from
$40 to 100=kW. In some coal-fired plants where regenerative air heaters are used,
the hot end heating elements are coated with a catalyst material to convert NOx to
N2 and H2O.
SCONOx
The SCONOx system is a recent development that is claimed to reduce NOx and
CO levels to 2–5 ppmv with a single catalyst. It does not use ammonia or urea and
Copyright © 2003 Marcel Dekker, Inc.

hence avoids the concerns associated with handling ammonia. The system can
operate efficiently at 300–700�F, which is an advantage because the HRSG
evaporator need not be split up. Typically the gas temperature between the
evaporator and economizer of an HRSG is in this range. Dampers are not needed
to control the gas temperature in steam generators at low loads. This method has
been used in a few HRSGs but not in packaged boilers.
The SCONOx catalyst works by simultaneously oxidizing CO to CO2,
hydrocarbons to CO2 þ H2O, and NOx to NO2 and then absorbing NO2 onto its
platinum surface through the use of a potassium carbonate absorber coating.
These reactions, shown below, are referred to as the ‘‘oxidation=absorptioncycle.’’
COþ 12O2 ! CO2
NOþ 12O2 ! NO2
CH2Oþ O2 ! CO2 þ H2O
2NO2 þ K2CO3 ! CO2 þ KNO2 þ KNO3
The CO2 produced by these reactions is exhausted up the stack. The potassium
carbonate coating reacts to form potassium nitrates and nitrites, which remain on
the surface of the catalyst.
The SCONOx catalyst can be compared to a sponge absorbing water. It
becomes saturated with NOx and must be regenerated. When all of the carbonate
absorber coating on the catalyst surface has reacted to form nitrogen compounds,
NOx will no longer be absorbed, and the catalyst must enter the regeneration
cycle.
The unique regeneration cycle is accomplished by passing a dilute hydro-
gen reducing gas across the surface of the catalyst in the absence of oxygen. The
hydrogen reacts with nitrites and nitrates to form water and elemental nitrogen.
Carbon dioxide in the regeneration gas reacts with potassium nitrites and nitrates
to form potassium carbonate, which is the absorber coating that was on the
catalyst surface before the oxidation=absorption cycle began. This cycle is called
the ‘‘regeneration cycle.’’
KNO2 þ KNO3 þ 4H2 þ CO2 ! K2CO3 þ 4H2Oþ N2
Water and elemental nitrogen are exhausted up the stack instead of NOx, and
potassium carbonate is once again present on the catalyst surface, allowing the
entire cycle to begin again.
Because the regeneration cycle must take place in an oxygen-free environ-
ment, a section of catalyst undergoing regeneration must be isolated from the
exhaust gases, usually by a set of louvers, one upstream of the section being
regenerated and one downstream. During the regeneration cycle, these louvers
Copyright © 2003 Marcel Dekker, Inc.

close and a valve allows the regeneration gas into the section. Stainless steel strips
on the louvers minimize leaks during operation. A SCONOx system has five to
15 sections of catalyst, depending on gas flow, design, etc. At any given time,
80% of the sections are in the oxidation=absorption cycle and 20% are in the
regeneration mode. Because the same number of sections are always in the
regeneration mode, the production of regeneration gas proceeds at a constant rate.
A regeneration cycle lasts for 3–5min, so each section is in oxidation=absorptionmode for 9–15min.
The SCONOx technology is still being developed and have yet to
accumulate significant operational experience compared to the SCR system. It
is also very expensive and is sensitive to sulfur, even the small amount in natural
gas. For a 2.5 ppmv NOx limit from a 501�F Westinghouse gas turbine, studies
show that the cost of SCONOx is more than that of the SCR system. However,
with technological improvements, it could become an economically viable
option.
Combustion Control Methods
The formation of NOx has been well understood by burner manufacturers, who
are able to offer several methods to reduce the formation of NOx in steam
generators. Gas turbine manufacturers also have come up with design improve-
ments to lower NOx emissions.
During the combustion process, several complex reactions occur within
the flame, and NOx formation is a function of temperature, oxygen, and time
of residence in the high temperature zones. Figure 4.1 shows the effect of
temperature on NOx formation. As the combustion temperature is reduced from
2700�F to 2300�F, NOx is reduced by a factor of 10.
As the excess air increases, the NOx increases and drops off as shown in
Fig. 4.10 Because CO is another pollutant, its emissions should also be limited.
As the excess air increases, CO decreases. Hence there is a band of excess air in
which one can operate the burner to minimize both NOx and CO.
Gas turbine manufacturers have come up with dry low-NOx (DLN)
combustors, which limit the NOx to single-digit levels. Most of the NOx emitted
by a gas turbine firing natural gas is generated by the fixation of atmospheric
nitrogen in the flame, and the amount of this ‘‘thermal NOx’’ is an exponential
function of flame temperature. The DLN combustor lowers the flame temperature
by burning a leaner mixture of fuel and air in premixed mode. To reduce NOx
emissions in traditional combustors, steam or water is injected to reduce the flame
temperature; benefits include additional power output. However, there is a loss in
engine life and shortening of combustor life. CO formation also increases as the
amount of water or steam increases, as shown in Fig. 4.11.
Copyright © 2003 Marcel Dekker, Inc.

Oxygen Control
In steam generators, oxygen trim can be added to control the excess oxygen
levels. Too little oxygen increases CO formation, and too much can increase the
NOx. Also, the boiler efficiency is impacted by the excess air levels as discussed
in Chapter 3. The higher mass flow also affects the gas temperature distribution
throughout the boiler and can affect the superheated steam temperature.
Steam–Water Injection
Boiler and burner suppliers sometimes use steam injection to reduce the flame
temperature and thus decrease NOx. Steam generators as well as gas turbines use
this method. In boilers the steam consumption could vary by 1–3% of the total
steam generated, thus reducing the boiler output; however, the significant
reduction in NOx may offset the need for FGR or other methods. The NOx
reduction is more significant with gas firing than with oil firing. A side effect of
water or steam injection is the increase in CO content. Hence there should be a
compromise between the efforts to reduce NOx and CO.
FIGURE 4.10 Typical NOx and CO levels versus excess air.
Copyright © 2003 Marcel Dekker, Inc.

FIGURE 4.11 Effect of steam–water injection on NOx and CO.
Copyright © 2003 Marcel Dekker, Inc.

In HRSGs, steam or water injection in to the gas turbine combustor is used
along with catalysts located in the HRSG to limit NOx to single digits. The
increase in water vapor content on SCR performance has to be reviewed. Steam
injection also increases the gas turbine power output due to the increased mass
flow and higher specific heat of the gases with increased water vapor content.
This concept is used in the Cheng cycle power system discussed in Chapter 1.
Water or steam injected into gas turbines has to be treated to give high
steam purity. Steam purity should be preferably in the parts per billion range. The
treated water is lost to the atmosphere and has to be evaluated as an operating cost
in such systems.
Burner Modifications
Staged combustion is widely used by burner suppliers to reduce NOx. In this
method, the fuel or air is added in increments (Fig. 4.12) so that at no point in the
flame is an exceptionally high temperature obtained. In air staging, a fuel-rich
mixture is initially created, followed by the addition of air at the burner tip to burn
the remaining fuel. As little as 60% of the total combustion air is introduced into
the primary combustion zone. The substoichiometric operation generates a high
level of partial pressures of hydrogen and CO, and these reducing agents limit the
NOx formation. The second-stage air is introduced downstream to complete the
combustion process after some heat has been transferred to the process, thereby
limiting the formation of thermal NOx. The staging of air does provide some
control over both thermal and fuel NOx.
A concept that is a little more effective for reducing thermal NOx is fuel
staging. Staged fuel burners are widely used. A portion of the fuel and all of the
combustion air are introduced into the primary combustion zone. Rapid combus-
FIGURE 4.12 Staging of fuel and air in burners.
Copyright © 2003 Marcel Dekker, Inc.
tion is achieved in the fuel-rich atmosphere with a high level of excess air, which
reduces the peak flame temperature, thereby reducing thermal NOx. The fuel for
the second stage is introduced through a series of nozzles positioned around the
burner perimeter. This fuel is introduced in such a manner that the final
combustion occurs after heat has been transferred to the process, lowering the
final combustion temperature. In addition, the secondary fuel is injected at a
relatively high pressure, which, because of the position of the secondary tips,
entrains flue gases; this simulates flue gas recirculation, which helps lower the
combustion temperature. Although fuel staging helps lower thermal NOx by up to
75%, it does not reduce the amount of fuel NOx generated. However, this is a
small portion of the overall NOx in gas-fired boilers. Fuel staging is difficult with
liquid fuels. Fuel staging also helps operation at lower excess air than air staging.
A few burner suppliers are able to promise less than 30 ppmvd NOx using this
technique.
Furnace Modifications
The completely water-cooled furnace (Fig. 4.2) provides a cooler envelope for the
flame than a refractory-lined front wall or floor and hence produces less NOx.
Most NOx is generated at the flame front when combustion is initiated, and a
water-cooled furnace absorbs some of the radiation from the flame, which helps
cool it, whereas a refractory-lined boiler reradiates energy back to the flame,
keeping it locally hotter, thus increasing its potential for forming thermal NOx.
The effective projected radiant surface for this design is greater than that of a
refractory-lined boiler by 7–15%. Hence the net heat input per unit effective
radiant area or the heat release rate on area basis is lower, which also helps lower
NOx.
Burner Emissions
Duct burners used in HRSGs also generate NOx and CO, adding to the emissions
from the turbine exhaust gases. The calculation procedure for estimating the NOx
and CO in ppmv after combustion is shown in Q6.26e. It may be noted that the
values of NOx and CO in lb=h are always higher after combustion; however, the
values in ppmv may or may not be, depending on the initial ppmv values of NOx
and CO and the contribution by the burner. Typical NOx and CO emissions from
duct burners are listed in Table 4.1.
With distillate oils containing fuel-bound nitrogen in the range of 0.05%,
nearly 80–90% of it is converted to NOx, whereas with heavy fuel oils with 0.3%
nitrogen, about 50% of it is converted to NOx. In the case of packaged boiler
burners, the emissions depend on burner design, on whether fuel is premixed with
air, on whether fuel or air is staged, and on the combustion temperature as
discussed below. NOx emission ranges from 0.04 to 0.1 lb=Mm Btu for natural
gas firing and increases if hydrogen or a fuel with a high combustion temperature
Copyright © 2003 Marcel Dekker, Inc.

is fired. Typical CO emissions range from 30 to 100 ppmv. Combustion
technology is improving day by day. Readers should note that significant changes
in burner design or combustion techniques could be made available to the
industry before this book is even published!
Flue Gas Recirculation and Excess Air
Present-day packaged steam generators operate at high excess air (15–20%) with
flue gas recirculation (FGR) rates ranging from 0% to 30% to limit CO and NOx.
Flue gas recirculation refers to the admission of flue gases from the boiler exit
back into the burner region in order to lower the combustion temperature, as
shown in Fig. 4.6, which in turn lowers NOx. See Table 4.2 for the effect of FGR
on combustion temperature.
The reason for the use of high excess air can be seen from Fig. 4.10, which
shows that as the excess air is increased, the NOx level increases and then drops
off. At substoichiometric conditions, the combustion temperature is not high and
hence the NOx formation is less; however, as the excess air increases, the
combustion temperature increases, which results in higher NOx. Further increase
in excess air (or FGR) lowers the flame temperature and hence NOx decreases.
Also, at a low excess air rate, the CO generation is high due to poor mixing
between fuel and air. Hence to meet both CO and NOx levels, 15% excess air and
15% FGR rates are not unusual today in oil- and gas-fired steam generators.
Some burner suppliers recommend 15% excess air and 30% FGR rates to limit
the NOx to less than 9 ppmv on natural gas firing. The FGR system naturally adds
TABLE 4.1 Typical Emissions from Various Fuels
Gas Nox (lb=MM Btu) CO (lb=MM Btu)
Natural gas 0.1 0.08
Hydrogen gas 0.15 0Refinery gas 0.1–0.15 0.03–0.08Blast furnace gas 0.03–0.05 0.12
Producer gas 0.05–0.1 0.08
TABLE 4.2 Effect of FGR on Combustion Temperatures with 15% Excess Air
Natural gas No. 2 oil
FGR, % 0 15 30 0 15 30Combustion temp, �F 3227 2892 2619 3354 2994 2713
Copyright © 2003 Marcel Dekker, Inc.
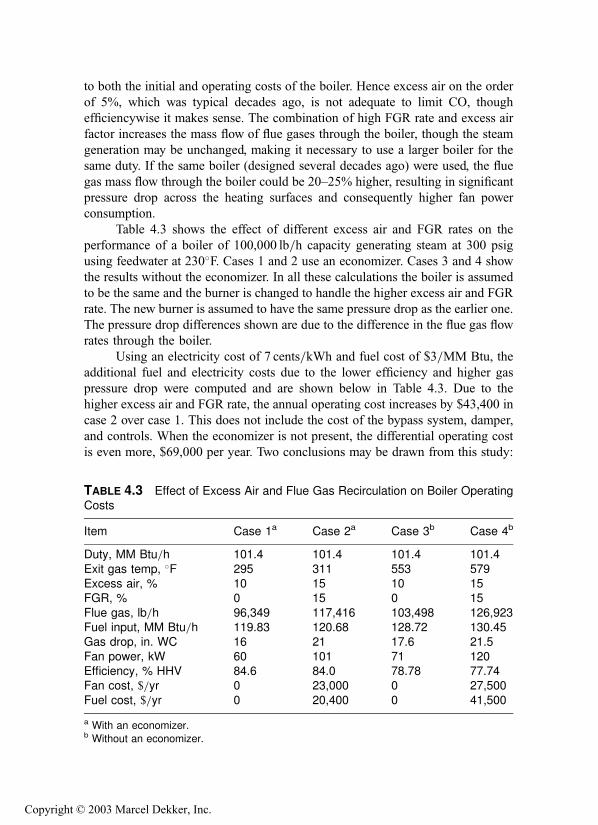
to both the initial and operating costs of the boiler. Hence excess air on the order
of 5%, which was typical decades ago, is not adequate to limit CO, though
efficiencywise it makes sense. The combination of high FGR rate and excess air
factor increases the mass flow of flue gases through the boiler, though the steam
generation may be unchanged, making it necessary to use a larger boiler for the
same duty. If the same boiler (designed several decades ago) were used, the flue
gas mass flow through the boiler could be 20–25% higher, resulting in significant
pressure drop across the heating surfaces and consequently higher fan power
consumption.
Table 4.3 shows the effect of different excess air and FGR rates on the
performance of a boiler of 100,000 lb=h capacity generating steam at 300 psig
using feedwater at 230�F. Cases 1 and 2 use an economizer. Cases 3 and 4 show
the results without the economizer. In all these calculations the boiler is assumed
to be the same and the burner is changed to handle the higher excess air and FGR
rate. The new burner is assumed to have the same pressure drop as the earlier one.
The pressure drop differences shown are due to the difference in the flue gas flow
rates through the boiler.
Using an electricity cost of 7 cents=kWh and fuel cost of $3=MM Btu, the
additional fuel and electricity costs due to the lower efficiency and higher gas
pressure drop were computed and are shown below in Table 4.3. Due to the
higher excess air and FGR rate, the annual operating cost increases by $43,400 in
case 2 over case 1. This does not include the cost of the bypass system, damper,
and controls. When the economizer is not present, the differential operating cost
is even more, $69,000 per year. Two conclusions may be drawn from this study:
TABLE 4.3 Effect of Excess Air and Flue Gas Recirculation on Boiler OperatingCosts
Item Case 1a Case 2a Case 3b Case 4b
Duty, MM Btu=h 101.4 101.4 101.4 101.4
Exit gas temp, �F 295 311 553 579Excess air, % 10 15 10 15FGR, % 0 15 0 15
Flue gas, lb=h 96,349 117,416 103,498 126,923Fuel input, MM Btu=h 119.83 120.68 128.72 130.45Gas drop, in. WC 16 21 17.6 21.5
Fan power, kW 60 101 71 120Efficiency, % HHV 84.6 84.0 78.78 77.74Fan cost, $=yr 0 23,000 0 27,500
Fuel cost, $=yr 0 20,400 0 41,500
a With an economizer.b Without an economizer.
Copyright © 2003 Marcel Dekker, Inc.

1. Modifying an existing boiler to handle new emission levels will be
expensive in terms of operating costs.
2. Operating a boiler without the economizer results in a higher gas
pressure drop even for the same excess air. Case 3 shows an increase of
1.6 in. WC over case 1. This is due to the larger flue gas flow in case 3
arising out of lower boiler efficiency.
As shown in Fig. 4.13, the effect of FGR on NOx reduction gradually
decreases as the FGR rate increases; that is, NOx reduction is very high at low
FGR rates and as the FGR rate increases the incremental NOx reduction becomes
smaller. On oil firing, the effect of FGR is less significant. Operators must
consider the risk of operating a boiler near the limits of inflammability when
using high amounts of FGR. Figure 4.14 shows the narrowing between the upper
flammability limit and the lower ignition limit as FGR increases. Integrating
control systems to maintain fuel=air ratios at high FGR rates is difficult because
FGR dampens the combustion process to the ragged edges of flammability—
flame-outs and flame instability. Full metering combustion control systems with
good safety measures are necessary in such cases.
As the FGR rate increases, the gas pressure drop across the boiler increases,
and the boiler must be made larger with wider tube spacing or the fan power
consumption can be significant as shown in Table 4.3. A boiler using 20% FGR is
equivalent to a 20% increase in its size compared to a boiler of the same capacity
not using FGR. One has to be concerned about the flame stability at low loads
and also the excess CO formed. Generally, in packaged boilers the FGR duct is
connected to the fan inlet duct and a separate FGR fan is not required. Large
FIGURE 4.13 NOx versus flue gas recirculation.
Copyright © 2003 Marcel Dekker, Inc.

industrial boilers use separate FGR fans. If the flue gases contain oxides of sulfur,
then mixing the flue gases at the fan inlet may lower the temperature below the
acid vapor point and risk potential corrosion at the fan and inlet ductwork; in such
cases, a separate fan may be used to admit the flue gases directly near the burner
throat. With induced FGR, the inlet temperature to the fan increases. With 80�Fambient temperature and 15% FGR at 320�F flue gas temperature, the mixed air
temperature at the fan inlet is about 112�F. The air density decreases, which
results in a slightly larger volume of air to be handled by the fan. FGR also affects
the performance of steam generators because it affects the gas temperature profile
throughout the boiler. This is illustrated in Chapter 3.
Gas Reburn
One of the methods to reduce NOx in large industrial boilers is natural gas
reburning, which is capable of providing a 50–70% reduction in NOx. In this
method, natural gas is injected into the upper furnace region to convert the NOx
formed in the primary fuel’s combustion gases to molecular nitrogen. The overall
process occurs within three zones of the boiler as shown in Fig. 4.15.
Primary Combustion Zone: Burners fueled by coal, oil, or gas are turned
down by 10–20%. Low excess air is used to minimize NOx.
Gas Reburning Zone: Natural gas between 10% and 20% of boiler heat
input is injected above the primary combustion zone. This creates a fuel-
rich region where hydrocarbon radicals react with NOx to form mole-
cular nitrogen. Recirculated flue gases may be mixed in with the gas
before it is injected into the boiler.
FIGURE 4.14 Flue gas recirculation and limits of inflammability. (Adapted from
newsletter of Coen Co., Spring 1996, Burlingame, CA.)
Copyright © 2003 Marcel Dekker, Inc.

Burnout Zone: A separate overfire air system redirects air from the primary
combustion zone to a location above the gas reburning reaction zone to
ensure complete combustion of any unreacted fuel. All coal-, oil-, or gas-
fired utility boilers are suitable for reburning. There must be enough
room above the main firing zone for reburning and burnout. As the
natural gas replaces the primary fuel (coal or oil), the emissions of SOx,
CO2, and particulates are also reduced.
CARBON MONOXIDE REDUCTION
From Figs. 4.10 and 4.11 it can be seen that any effort to reduce NOx such as
reducing flame temperature or water=steam injection results in an increase in CO;
therefore a balance must be struck between the efforts to reduce NOx and CO. In
packaged boilers, in addition to using proper excess air and FGR, ensuring that
the combustion products do not leak to the convection pass from the furnace
helps to lower CO. Some boilers that use the tangent tube construction instead of
the membrane wall design for the partition between the furnace and the
convection section have experienced leakage of hot furnace gases from the
furnace side to the convection section; the tangent tubes are likely to warp due to
thermal expansion during operation and allow gas to leak. The difference in gas
FIGURE 4.15 Reburning and NOx reduction.
Copyright © 2003 Marcel Dekker, Inc.
pressure between the furnace and the convection section can be on the order of
10–30 in. WC depending on the boiler design, so the leakage could be significant.
In that case the flue gases do not have the residence time needed to complete the
combustion process in the furnace, which can result in higher CO formation. The
presence of water vapor also increases CO. Increasing the boiler size reduces both
CO and NOx because the furnace temperatures and heat release rates are reduced
and the residence time for CO conversion to CO2 is increased; however, this adds
to the boiler cost.
Generally 30–100 ppmv of CO can be achieved with most packaged boiler
burners in operation today and about 25–50 ppmv in gas turbines. If single-digit
CO emissions are required, an oxidation catalyst is suggested in packaged boilers
and HRSGs, which can add to their cost and operating gas-side pressure drop.
COþ 12O2 ! CO2
HxCy þ O2 ! CO2 þ H2O
An oxidation catalyst increases the conversion of SO2 to SO3, which can react
with ammonia to form ammonium sulfate. However, with natural gas fuel with a
low sulfur content, this is not a serious concern. This conversion is higher at
higher temperatures, say at 1100�F, and decreases to about 10% at 600�F without
significantly affecting the efficiency of CO or formaldehyde removal. Good
combustion controls can also help reduce CO formation. VOCs are also some-
what reduced by oxidation catalysts.
The dry low-NOx (DLN) combustors used in gas turbines have demon-
strated CO levels of less than 5 ppm.
Figure 4.7 shows the use of a CO catalyst in an HRSG. Generally, higher
temperatures on the order of 600–1000�F are acceptable for CO catalysts, so the
catalyst can be placed at the inlet of the unfired gas turbine HRSG. However,
when a burner is used in the HRSG, it is advisable to have another heat transfer
surface precede it so that the burner flame does not impinge on the catalyst. The
CO catalyst should also precede the NOx catalyst to keep it away from ammonia.
Typical CO conversion efficiency can range from 60% to 85%, though higher
values may be obtained. Depending on its size, the gas pressure drop across the
CO catalyst can range from 2 to 3 in. WC. The cost of a typical CO catalyst is
about 50% of that of a SCR catalyst.
SOx REMOVAL
Sulfur present in fuels gets converted to SO2, and in the presence of a catalyst the
SO2 is converted to SO3, which reacts with water vapor to form sulfuric acid
vapor. Sulfuric acid causes environmental damage through corrosion. SO2 and
SO3 are together referred to as SOx. The level of SOx depends on the amount of
Copyright © 2003 Marcel Dekker, Inc.
sulfur present in the fuel. Typically, 95% of the sulfur converts to SO2 and 1–3%
converts to SO3. Historically SOx pollution has been controlled through disper-
sion through the use of tall stacks. However, in cases where this is not adequate,
reduction methods such as flue gas desulfurization (FGD) are used. FGD involves
the use of scrubbers to remove SOx emissions from the flue gases. These are
classified as either regenerable or nonregenerable, depending on how the by-
products are disposed of. In regenerable systems, the sulfur or sulfuric acid is
recovered. However, these are expensive processes and are justified only in large
high-sulfur coal-fired plants. Wet scrubbers using chemicals such as lime soda,
magnesium oxide, and limestone are widely used in large utility plants. Because
many of these chemical processes occur beyond the boiler boundary, they are not
discussed here.
PARTICULATES
Emission particulates from combustion sources consist of compounds such as
sulfates, nitrates, and unburned compounds. Particulate matter emissions are
classified into two categories, PM and PM10, which refer to particulates 10 mm or
more and less than 10 mm in diameter, respectively. All particulates pose health
problems, but small particulates can be inhaled and can cause more damage to
humans than larger ones. PM levels from natural gas are lower than those from
oils and coals. High ash in fuel oils and coals can also increase the PM. In utility
boilers, electrostatic precipitators, scrubbers, or bag houses are used to remove
particulates. These systems increase the installation cost of the plant and may not
be justified in small plants. Switching to low ash, low sulfur fuels also helps
reduce PM but adds to the cost of fuel.
VOLATILE ORGANIC COMPOUNDS
Volatile organic compounds (VOCs) are unburned hydrocarbons of higher
molecular weight than methane. Sources of VOCs include combustion products,
automobile exhaust solvents, and paints, to mention a few. When released into the
atmosphere, VOCs contribute to the formation of harmful ozone and are health
hazards, particularly because of their high molecular weights. [Unburned hydro-
carbons (UHCs) are similar to VOCs but are of lower molecular weight and
characterized as methane.]
Good combustion techniques and the maintenance of high combustion
temperatures minimize VOC formation; however, they also increase NOx. In
chemical plants, incineration is generally adopted to minimize the emission of
VOCs. There are two types of oxidizers. Thermal oxidizers combust the VOCs
along with natural gas and maintain a gas temperature of 1500–1800�F with a
few seconds of residence time, which destroys the VOCs. Catalytic oxidation
Copyright © 2003 Marcel Dekker, Inc.

requires a lower temperature, 500–700�F, and therefore consumes less natural
gas. Heat recovery boilers may be used behind incinerators for recovering energy
from the flue gases, as discussed in Chapter 2. VOCs in packaged boilers are
reduced by using good combustion techniques. Oxidation catalysts also reduce
VOCs but are expensive.
CONCLUSION
It is easier to design for a given NOx or CO level in a new boiler or HRSG than in
an older one, because we can design around the various options and size the
boiler or HRSG accordingly. Modifying an existing boiler or HRSG to meet new
emission levels presents more challenges. For example, the existing boiler
furnace dimensions may not be adequate if a low-NOx burner is retrofitted,
owing to possible flame impingement concerns. The existing fan may not be able
to handle the increase in pressure drop if FGR is used. If an air heater is used it
must be replaced by an economizer. If a catalyst is required, an existing HRSG
may have to operate in a gas temperature regime that may not be optimum for it
unless the heating surfaces are split. A different catalyst material capable of
operation at the gas temperature window available between the evaporator and
economizer or capable of operating ahead of the evaporator may have to be used.
If there are space limitations, the designer may even have to reduce the boiler
capacity. Steam injection in the burner may be examined.
It is possible to improve the emissions of existing boilers through options
such as replacing the refractory-lined boilers with water-cooled furnaces, using
membrane walls where possible to minimize flue gas bypassing between the
furnace and convection bank, and using a low-NOx burner. With HRSGs, if
steam injection is introduced to minimize NOx, the effects of gas flow and
temperature have to be reviewed because they may affect the HRSG performance.
In a new boiler or HRSG project, there are fewer constraints.
There are several ways to control NOx and CO in packaged boilers and
HRSGs, some of which affect the quantity of flue gases flowing through the
boiler, thus affecting the temperature profile, efficiency, and gas pressure drop.
Catalysts require a specific gas temperature window for efficient operation, which
is achieved by modifying the boiler or HRSG design as discussed above. These
factors must be evaluated on a case-by-case basis, because no two boilers are
identical. In the case of gas turbine HRSGs, optimum locations must be found for
the SCR and the CO catalyst by considering the various loads and gas
temperature profiles. The cost of meeting the emission limits is quite large,
because boiler and HRSG designs have to be modified to incorporate catalysts,
dampers, and low-NOx burners. Operating costs are also increased due to the
higher gas pressure drop across the heating surfaces and ducts. The fan may have
to be replaced.
Copyright © 2003 Marcel Dekker, Inc.

New plants evaluate the best available control technology (BACT) for
emissions on the basis of cost and environmental conditions. The cost per ton of
pollutant removed is estimated, and the best technology to achieve this within the
maximum cost allowable is chosen. Emission limits vary depending on location.
Typical limits for a combined cycle plant in California that were both gas turbines
and auxiliary boilers are listed in Table 4.4.
As the technology improves, it is hoped that the cost of emission control
will also be reduced. For example, research work is going on to lower NOx and
CO to single-digit percentages in gas-fired burners by using internal recirculation
of partial combustion products without the use of flue gas recirculation and while
using low excess air. This will lower operating costs and also improve the boiler
efficiency.
REFERENCES
1. Catalogues. Coen Company, Burlingame, CA.
2. V Burd. Squeezing clean energy from boilers and heaters. Chemical Engineering,
March 1992.
3. P Bancel et al. Gas turbine NOx controlled with steam and water injection. Power
Engineering, June 1986.
4. Nalco Fuel Tech Brochure on NOx out process, 1992.
5. D Lambert and TF McGowan. Nox control techniques for the CPI. Chemical
Engineering, June 1996.
TABLE 4.4 Typical Allowable Emission Rates for a Combined Cycle Project in
California
Allowable emission rate
Unit Pollutant lb=h lb=MM Btu or pmvd
CTG=HRSG with duct firing PM 28.2 0.012
SOx 5.7 0.0023NOx 28.6 3 ppmvd at 15% O2
VOCs 35.2 0.015
CO 98.5 20 ppmvd at 15% O2
Formaldehyde 5.0 0.002Auxiliary boiler PM 0.19 0.005
SOx 0.09 0.0024NOx 3.5 0.092VOCs 0.49 0.013CO 2.1 0.055
Copyright © 2003 Marcel Dekker, Inc.

6. S Drennen, V Lifshits. Developmental issues of ultra low NOx burners for steam
generation. Paper presented at the Fall Meeting of the Western States Section of the
Combustion Institute, Diamond Bar, CA, Oct 23–24, 1997.
7. T Webster. Burner technology for single digit NOx emissions in boiler applications,
CIBO NOx Control Conference, San Diego, CA, Mar 13, 2001.
8. Use of SCR for control of NOx emissions from power plants in the US. Prepared by
Synapse Energy Economics, Inc., Cambridge, MA, for the Ontario Clean Air
Program, Canada (ONTAIR), campaign, February 2000.
9. S Naroozi. Urea enhances safety in SCR applications. Power Engineering, December
1993.
10. L Czarnecki. SCONOx—ammonia-free NOx removal technology for gas turbines.
International Joint Power Generation Conference (IJPGC)-2000-15032, Florida, July
2000.
Copyright © 2003 Marcel Dekker, Inc.

5
Basic Steam Plant Calculations
5.01 Converting liquid flow in lb=h to gpm, and vice versa; relating density,
specific gravity, and specific volume
5.02 Relating head of liquid or gas column to pressure; converting feet of liquid
to psi; relating inches of water column of gas to psi and feet of gas column
5.03 Estimating density of gases; relating molecular weight and density; effect
of elevation on gas density; simplified formula for density of air and flue
gases at sea level
5.04 Relating actual and standard cubic feet of gas per minute to lb=h5.05 Computing density of gas mixture; relating mass to volumetric flow;
computing velocity of gas in duct or pipe
5.06 Relating mass and linear velocities
5.07 Calculating velocity of wet and superheated steam in pipes; computing
specific volume of wet steam; use of steam tables
5.08 Relating boiler horsepower to steam output
5.09 Calculating amount of moisture in air; relative humidity and saturation
vapor pressure
5.10 Water dew point of air and flue gases; partial pressure of water vapor
5.11 Energy absorbed by wet and superheated steam in boilers; enthalpy of wet
and dry steam; use of steam tables; converting MM Btu=h (million Btu=h)to kilowatts
Copyright © 2003 Marcel Dekker, Inc.
5.12 Relating steam by volume, steam by weight, and steam quality; relating
circulation ratio and quality
5.13a Determining steam quality using throttling calorimeter
5.13b Relating steam quality to steam purity
5.14 Water required for desuperheating steam; energy balance in attemperators,
desuperheaters
5.15 Water required for cooling gas streams
5.16 Calculating steam volume after throttling process; use of steam tables
5.17 Determining blowdown and steam for deaeration
5.18 Calculating flash steam from boiler blowdown; economics of flash steam
recovery
5.19a Estimating leakage of steam through openings; effect of wetness of steam
on leakage
5.19b Estimating air flow through openings
5.20 Estimating leakage of gas across dampers; calculating energy loss of
leakage flow; sealing efficiency of dampers on area and flow basis
5.21 Economics of waste heat recovery; annual cost of energy loss; simple
payback period calculation
5.22 Life-cycle costing applied to equipment selection; interest and escalation
factors; capitalized and life-cycle cost
5.23 Life-cycle costing applied to evaluation of heat recovery systems
5.24 Calculating thickness of boiler tubes to ASME Code; allowable stresses
for various materials
5.25 Calculating maximum allowable working pressures for pipes
5.26 Sizing tubes subject to external pressure
5.27 On sound levels: OSHA permissible exposure levels
5.28 Adding decibels
5.29 Relating sound pressure and power levels
5.30 Effect of distance on noise level
5.31 Computing noise levels from engine exhaust
5.32 Holdup time in steam drum
5.01
Q:Convert 50,000 lb=h of hot water at a pressure of 1000 psia and 390�F to gpm.
A:To convert from lb=h to gpm, or vice versa, for any liquid, we can use the
following expressions:
W ¼ 8q
vð1Þ
r ¼ 62:4s ¼ 1
vð2Þ
Copyright © 2003 Marcel Dekker, Inc.

where
W ¼ flow, lb=hq¼ flow, gpm (gallons per minute)
r¼ density of liquid, lb=cu ft
s¼ specific gravity of liquid
v¼ specific volume of liquid, cu ft=lb
For hot water we can obtain the specific volume from the steam tables (see the
Appendix). v at 1000 psia and 390�F is 0.0185 cu ft=lb. Then, from Eq. (1),
q ¼ 50;000� 0:0185
8¼ 115:6 gpm
For water at temperatures of 40–100�F, for quick estimates we divide lb=h by 500
to obtain gpm. For example, 50,000 lb=h of water at 70�F would be 100 gpm.
5.02A
Q:Estimate the head in feet developed by a pump when it is pumping oil with a
specific gravity of 0.8 through a differential pressure of 150 psi.
A:Conversion from feet of liquid to psi, or vice versa, is needed in pump
calculations. The expression relating the variables is
H1 ¼ 144 DP v ¼ 2:3DPs
ð3Þ
where
DP¼ differential pressure, psi
H1 ¼ head, ft of liquid
Substituting for DP and s, we have
Hl ¼ 2:3� 150
0:8¼ 431:2 ft
5.02B
Q:If a fan develops 8 in. WC (inches of water column) with a flue gas density of
0.05 lb=cu ft, what is the head in feet of gas and in psi?
Copyright © 2003 Marcel Dekker, Inc.

A:Use the expressions
Hg ¼ 144DPrg
ð4Þ
Hw ¼ 27:7DP ð5Þ
where
Hg ¼ head, ft of gas
Hw ¼ head, in. WC
rg ¼ gas density, lb=cu ft
Combining Eqs. (4) and (5), we have
Hg ¼ 144� 8
27:7� 0:05¼ 835 ft
DP ¼ 8
27:7¼ 0:29 psi
5.03
Q:Estimate the density of air at 5000 ft elevation and 200�F.
A:The density of any gas can be estimated from
rg ¼ 492�MW� P
359� ð460þ tÞ � 14:7ð6Þ
where
P¼ gas pressure, psia
MW¼ gas molecular weight (Table 5.1)
t¼ gas temperature, �Frg ¼ gas density, lb=cu ft
The pressure of air decreases as the elevation increases, as shown in Table 5.2,
which gives the term ðP=14:7Þ �MW of air¼ 29. Substituting the various terms,
we have
rg ¼ 29� 492� 0:832
359� 660¼ 0:05 lb=cu ft
Copyright © 2003 Marcel Dekker, Inc.

A simplified expression for air at atmospheric pressure and temperature t at sea
level is
rg ¼40
460þ tð7Þ
For a gas mixture such as flue gas, the molecular weight (MW) can be obtained as
discussed in Q5.05. In the absence of data on flue gas analysis, Eq. (7) also gives
a good estimate of density.
TABLE 5.1 Gas Molecular Weights
Gas MW
Hydrogen 2.016
Oxygen 32.0Nitrogen 28.016Air 29.2
Methane 16.04Ethane 30.07Propane 44.09
n-Butane 58.12Ammonia 17.03Carbon dioxide 44.01
Carbon monoxide 28.01Nitrous oxide 44.02Nitric oxide 30.01Nitrogen dioxide 46.01
Sulfur dioxide 64.06Sulfur trioxide 80.06Water 18.02
TABLE 5.2 Density Correctionfor Altitude
Altitude (ft) Factor
0 1.0
1000 0.9642000 0.9303000 0.896
4000 0.8645000 0.8326000 0.801
7000 0.7728000 0.743
Copyright © 2003 Marcel Dekker, Inc.
When sizing fans, it is the usual practice to refer to 70�F and sea level as
standard conditions for air or flue gas density calculations.
5.04A
Q:How is acfm (actual cubic feet per minute) computed, and how does it differ from
scfm (standard cubic feet per minute)?
A:acfm is computed using the density of the gas at given conditions of pressure and
temperature, and scfm is computed using the gas density at 70�F and sea level
(standard conditions).
q ¼ W
60rgð8Þ
where
q¼ gas flow in acfm (at 70�F and sea level, scfm and acfm are equal; then
q ¼ W=4:5)rg ¼ gas density in lb=cu ft (at standard conditions rg ¼ 0:075 lb=cu ftÞW ¼ gas flow in lb=h ¼ 4:5q at standard conditions
5.04B
Q:Convert 10,000 lb=h of air to scfm.
A:Using Eq. (6), it can be shown that at P ¼ 14:7 and t ¼ 70, for air
rg ¼ 0:075 lb=cu ft.
Hence, from Eq. (8),
q ¼ 10;000
60� 0:075¼ 2222 scfm
5.04C
Q:Convert 3000 scfm to acfm at 35 psia and 275�F. What is the flow in lb=h? The
fluid is air.
Copyright © 2003 Marcel Dekker, Inc.

A:Calculate the density at the actual conditions.
rg ¼ 29� 492� 35
359� 735� 14:7¼ 0:129 lb=cu ft
From the above,
W ¼ 4:5� 3000 ¼ 13;500 lb=h
Hence
acfm ¼ 13;500
60� 0:129¼ 1744 cfm
5.05
Q:In a process plant, 35,000 lb=h of flue gas having a composition N2 ¼ 75%,
O2 ¼ 2%, CO2 ¼ 15%, and H2O ¼ 8%, all by volume, flows through a duct of
cross section 3 ft2 at a temperature of 350�F. Estimate the gas density and
velocity. Because the gas pressure is only a few inches of water column, for quick
estimates the gas pressure may be taken as atmospheric.
A:To compute the density of a gas, we need its molecular weight. For a gas mixture,
molecular weight is calculated as follows:
MW ¼PðMWi � yiÞwhere
yi ¼ volume fraction of gas i
MWi ¼molecular weight of gas i
Hence
MW ¼ 0:75� 28þ 0:02� 32þ 0:15� 44
þ 0:08� 18 ¼ 29:68
From Eq. (6),
rg ¼ 29:68� 492
359� 810¼ 0:05 lb/cu ft
The gas velocity Vg can be obtained as
Vg ¼W
60rgAð9Þ
Copyright © 2003 Marcel Dekker, Inc.
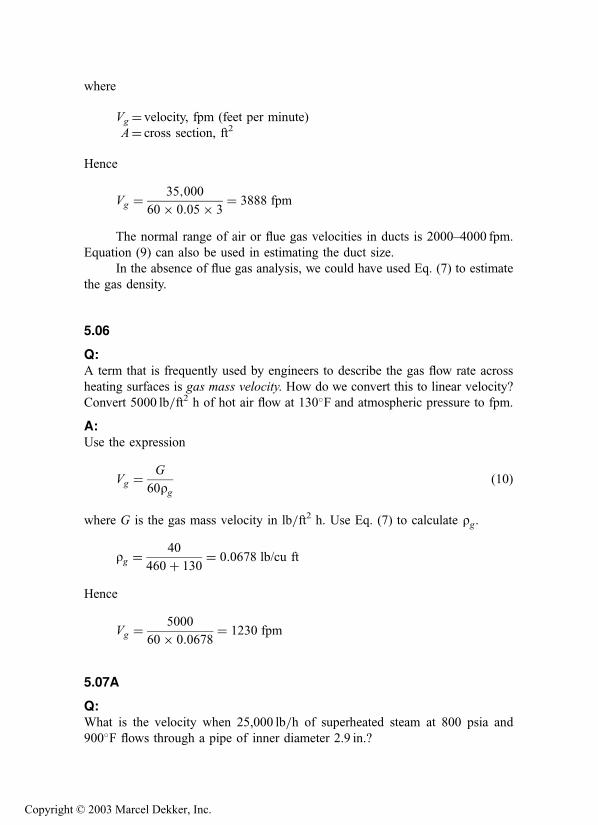
where
Vg ¼ velocity, fpm (feet per minute)
A¼ cross section, ft2
Hence
Vg ¼35;000
60� 0:05� 3¼ 3888 fpm
The normal range of air or flue gas velocities in ducts is 2000–4000 fpm.
Equation (9) can also be used in estimating the duct size.
In the absence of flue gas analysis, we could have used Eq. (7) to estimate
the gas density.
5.06
Q:A term that is frequently used by engineers to describe the gas flow rate across
heating surfaces is gas mass velocity. How do we convert this to linear velocity?
Convert 5000 lb=ft2 h of hot air flow at 130�F and atmospheric pressure to fpm.
A:Use the expression
Vg ¼G
60rgð10Þ
where G is the gas mass velocity in lb=ft2 h. Use Eq. (7) to calculate rg.
rg ¼40
460þ 130¼ 0:0678 lb/cu ft
Hence
Vg ¼5000
60� 0:0678¼ 1230 fpm
5.07A
Q:What is the velocity when 25,000 lb=h of superheated steam at 800 psia and
900�F flows through a pipe of inner diameter 2.9 in.?
Copyright © 2003 Marcel Dekker, Inc.

A:Use expression (11) to determine the velocity of any fluid inside tubes, pipes, or
cylindrical ducts.
V ¼ 0:05�W � v
d2ið11Þ
where
V ¼ velocity, fps
v¼ specific volume of the fluid, cu ft=lbdi ¼ inner diameter of pipe, in.
For steam, v can be obtained from the steam tables in the Appendix.
v ¼ 0:9633 cu ft/lb
Hence
V ¼ 0:05� 25;000� 0:9633
2:92¼ 143 fps
The normal ranges of fluid velocities are
Water: 3–12 fps
Steam: 100–200 fps
5.07B
Q:Estimate the velocity of 70% quality steam in a 3 in. schedule 80 pipe when the
flow is 45,000 lb=h and steam pressure is 1000 psia.
A:We need to estimate the specific volume of wet steam.
v ¼ xvg þ ð1� xÞvfwhere vg and vf are specific volumes of saturated vapor and liquid at the pressure
in question, obtained from the steam tables, and x is the steam quality (see Q5.12
for a discussion of x). From the steam tables, at 1000 psia, vg ¼ 0.4456 and
vf ¼ 0.0216 cu ft=lb. Hence the specific volume of wet steam is
v ¼ 0:7� 0:4456þ 0:3� 0:0216 ¼ 0:318 cu ft=lb
The pipe inner diameter di from Table 5.3 is 2.9 in. Hence, from Eq. (11),
V ¼ 0:05� 45;000� 0:318
2:92¼ 85 fps
Copyright © 2003 Marcel Dekker, Inc.

5.08
Q:What is meant by boiler horsepower? How is it related to steam generation at
different steam parameters?
A:Packaged fire tube boilers are traditionally rated and purchased in terms of boiler
horsepower (BHP). BHP refers to a steam capacity of 34.5 lb=h of steam at
atmospheric pressure with feedwater at 212�F. However, a boiler plant operates atdifferent pressures and with different feedwater temperatures. Hence conversion
between BHP and steam generation becomes necessary.
W ¼ 33;475� BHP
Dhð12Þ
where
W ¼ steam flow, lb=hDh¼ enthalpy absorbed by steam and water¼ ðhg � hfwÞ þ BD ðhf � hfwÞ
where
hg ¼ enthalpy of saturated steam at operating steam pressure, Btu=lbhf ¼ enthalpy of saturated liquid, Btu=lbhfw ¼ enthalpy of feedwater, Btu=lbBD¼ blowdown fraction
For example, if a 500BHP boiler generates saturated steam at 125 psig with 5%
blowdown and with feedwater at 230�F, the steam generation at 125 psig will be
W ¼ 500� 33;475
ð1193� 198Þ þ 0:05� ð325� 198Þ¼ 16;714 lb=h
where 1193, 198, and 325 are the enthalpies of saturated steam, feedwater, and
saturated liquid, respectively, obtained from steam tables. (See Appendix.)
5.09A
Q:Why do we need to know the amount of moisture in air?
A:In combustion calculations (Chap. 6) we estimate the quantity of dry air required
to burn a given amount of fuel. In reality, atmospheric air is never dry; it consists
of some moisture, depending on the relative humidity and dry bulb temperature.
To compute the partial pressure of water vapor in the flue gas, which is required
Copyright © 2003 Marcel Dekker, Inc.
TABLE 5.3 Dimensions of Iron Steel Pipe (IPS)
Surface perlinear ft
Nominal Flow area (ft2=ft) Weightpipe size, Schedule per pipe per lin ftIPS (in.) OD (in.) no. ID (in.) (in.2) Outside Inside (lb steel)
13 0.405 40a 0.269 0.058 0.106 0.070 0.25
80b 0.215 0.036 0.056 0.3214 0.540 40a 0.364 0.104 0.141 0.095 0.43
80b 0.302 0.072 0.079 0.5423 0.675 40a 0.493 0.192 0.177 0.129 0.57
80b 0.423 0.141 0.111 0.7412 0.840 40a 0.622 0.304 0.220 0.163 0.85
80b 0.546 0.235 0.143 1.0934 1.05 40a 0.824 0.534 0.275 0.216 1.13
80b 0.742 0.432 0.194 1.48
1 1.32 40a 1.049 0.864 0.344 0.274 1.6880b 0.957 0.718 0.250 2.17
114 1.66 40a 1.380 1.50 0.435 0.362 2.28
80b 1.278 1.28 0.335 3.00112 1.90 40a 1.610 2.04 0.498 0.422 2.72
80b 1.500 1.76 0.393 3.64
2 2.38 40a 2.067 3.35 0.622 0.542 3.6680b 1.939 2.95 0.508 5.03
2 12 2.88 40a 2.469 4.79 0.753 0.647 5.80
80b 2.323 4.23 0.609 7.67
3 3.50 40a 3.068 7.38 0.917 0.804 7.5880b 2.900 6.61 0.760 10.3
4 4.50 40a 4.026 12.7 1.178 1.055 10.8
80b 3.826 11.5 1.002 15.06 6.625 40a 6.065 28.9 1.734 1.590 19.0
80b 5.761 26.1 1.510 28.6
8 8.625 40a 7.981 50.0 2.258 2.090 28.680b 7.625 45.7 2.000 43.4
10 10.75 40a 10.02 78.8 2.814 2.62 40.5
60 9.75 74.6 2.55 54.812 12.75 30 12.09 115 3.338 3.17 43.814 14.0 30 13.25 138 3.665 3.47 54.516 16.0 30 15.25 183 4.189 4.00 62.6
18 18.0 20c 17.25 234 4.712 4.52 72.720 20.0 20 19.25 291 5.236 5.05 78.622 22.0 20c 21.25 355 5.747 5.56 84.0
24 24.0 20 23.25 425 6.283 6.09 94.7
aCommonly known as standard.bCommonly known as extra heavy.cApproximately.
Copyright © 2003 Marcel Dekker, Inc.
for calculating nonluminous heat transfer, we need to know the total quantity of
water vapor in flue gases, a part of which comes from combustion air.
Also, when atmospheric air is compressed, the saturated vapor pressure
(SVP) of water increases, and if the air is cooled below the corresponding water
dew point temperature, water can condense. The amount of moisture in air or gas
fixes the water dew point, so it is important to know the amount of water vapor in
air or flue gas.
5.09B
Q:Estimate the pounds of water vapor to pounds of dry air when the dry bulb
temperature is 80�F and the relative humidity is 65%.
A:Use the equation
M ¼ 0:622� pw
14:7� pwð13Þ
where
M ¼ lb water vapor=lb dry air
pw ¼ partial pressure of water vapor in air, psia
This may be estimated as the vol% of water vapor� total air pressure or as the
product of relative humidity and the saturated vapor pressure (SVP). From the
steam tables we note that at 80�F, SVP¼ 0.5069 psia (at 212�F, SVP¼ 14.7 psia).
Hence pw ¼ 0.65� 0.5069.
M ¼ 0:622� 0:65� 0:5069
14:7� 0:65� 0:5069¼ 0:0142
Hence, if we needed 1000 lb of dry air for combustion, we would size the fan to
deliver 1000� 1.0142¼ 1014.2 lb of atmospheric air.
5.10A
Q:What is the water dew point of the flue gases discussed in Q5.05?
A:The partial pressure of water vapor when the vol% is 8 and total pressure is 14.7
psia will be
pw ¼ 0:08� 14:7 ¼ 1:19 psia
Copyright © 2003 Marcel Dekker, Inc.
From the steam tables, we note that the saturation temperature corresponding to
1.19 psia is 107�F. This is also the water dew point. If the gases are cooled below
this temperature, water can condense, causing problems.
5.10B
Q:What is the water dew point of compressed air when ambient air at 80�F,14.7 psia, and a relative humidity of 65% is compressed to 35 psia?
A:Use the following expression to get the partial pressure of water vapor after
compression:
pw2 ¼ pw1 �P2
P1
ð14Þ
where
pw ¼ partial pressure, psia
P¼ total pressure, psia
The subscripts 1 and 2 stand for initial and final conditions. From Q5.09b,
pw1 ¼ 0.65� 0.5069.
pw2 ¼ 0:65� 0:5069� 35
14:7¼ 0:784 psia
From the steam tables, we note that corresponding to 0.784 psia, the saturation
temperature is 93�F. This is also the dew point after compression. Cooling the air
to below 93�F would result in its condensation.
5.11A
Q:Calculate the energy absorbed by steam in a boiler if 400,000 lb=h of superheatedsteam at 1600 psia and 900�F is generated with feedwater at 250�F. What is the
energy absorbed, in megawatts?
A:The energy absorbed is given by
Q ¼ W � ðh2 � h1Þ (neglecting blowdown) ð15Þwhere
W ¼ steam flow, lb=hh2; h1 ¼ steam enthalpy and water enthalpy, Btu=lb
Q¼ duty, Btu=h
Copyright © 2003 Marcel Dekker, Inc.
From the steam tables, h2 ¼ 1425.3 Btu=lb and h1 ¼ 224Btu=lb.
Q ¼ 400;000� ð1425:3� 224Þ¼ 480:5� 106 Btu=h
¼ 480:5 million Btu/h (MM Btu/h)
Using the fact that 3413 Btu=h¼ 1 kW, we have
Q ¼ 480:5� 106
3413� 103¼ 141 MW
5.11B
Q:Estimate the energy absorbed by wet steam at 80% quality in a boiler at 1600 psia
when the feedwater temperature is 250�F.
A:The enthalpy of wet steam can be computed as
h ¼ xhg þ ð1� xÞhf ð16Þ
where h is the enthalpy in Btu=lb. The subscripts g and f stand for saturated vapor
and liquid at the referenced pressure, obtained from saturated steam properties. x
is the steam quality fraction.
From the steam tables, hg ¼ 1163Btu=lb and hf ¼ 624Btu=lb at 1600 psia.
The enthalpy of feedwater at 250�F is 226Btu=lb.
h2 ¼ 0:8� 1163þ 0:2� 624 ¼ 1054 Btu=lb
h1 ¼ 226 Btu=lb
Q ¼ 1054� 226 ¼ 828 Btu=lb
If steam flow were 400,000 lb=h, then
Q ¼ 400;000� 828 ¼ 331� 106 ¼ 331 MM Btu=h
5.12
Q:How is the wetness in steam specified? How do we convert steam by volume
(SBV) to steam by weight?
Copyright © 2003 Marcel Dekker, Inc.

A:A steam–water mixture is described by the term quality, x, or dryness fraction.
x¼ 80% means that in 1 lb of wet steam, 0.8 lb is steam and 0.2 lb is water. To
relate these two terms, we use the expression
SBV ¼ 100
1þ ½ð100� xÞ=x� � vf =vgð17Þ
where
vf ; vg ¼ specific volumes of saturated liquid and vapor, cu ft=lbx¼ quality or dryness fraction
From the steam tables at 1000 psia, vf ¼ 0:0216 and vg ¼ 0.4456 cu ft=lb.
SBV ¼ 100
1þ ½ð100� 80Þ=80� � 0:0216=0:4456¼ 98:8%
Circulation ratio (CR) is another term used by boiler engineers to describe
the steam quality generated.
CR ¼ 1
xð18Þ
A CR of 4 means that the steam quality is 0.25 or 25%; in other words, 1 lb of
mixture would have 0.25 lb of steam and the remainder would be water.
5.13A
Q:How is the quality of steam determined using a throttling calorimeter?
A:Throttling calorimeters (Fig. 5.1) are widely used in low pressure steam boilers
for determining the moisture or wetness (quality) of steam. A sampling nozzle is
located preferably in the vertical section of the saturated steam line far from bends
or fittings. Steam enters the calorimeter through a throttling orifice and passes
into a well-insulated expansion chamber. Knowing that throttling is an isoenthal-
pic process, we can rewrite Eq. (16) for enthalpy balance as
hs ¼ hm ¼ xhg þ ð1� xÞhfwhere
hs; hm; hf ; hg ¼ enthalpies of steam, mixture, saturated liquid, and saturated
steam, respectively
x¼ steam quality fraction
Copyright © 2003 Marcel Dekker, Inc.

The steam temperature after throttling is measured at atmospheric pressure, and
then the enthalpy is obtained with the help of steam tables. The steam is usually in
superheated condition after throttling.
Example
A throttling calorimeter measures a steam temperature of 250�F when connected
to a boiler operating at 100 psia. Determine the steam quality.
Solution. hs at atmospheric pressure and at 250�F¼ 1168.8 Btu=lb from
steam tables; hg ¼ 1187.2 and hf ¼ 298.5 Btu=lb, also from steam tables. Hence
1168:8 ¼ 1187:2xþ ð1� xÞ298:5or
x ¼ 0:979 or 97:9% quality
5.13B
Q:How is steam quality related to steam purity?
FIGURE 5.1 Throttling calorimeter.
Copyright © 2003 Marcel Dekker, Inc.

A:Steam purity refers to the impurities in wet steam, in ppm. A typical value in low
pressure boilers would be 1 ppm of solids. However, quality refers to the moisture
in steam.
The boiler drum maintains a certain concentration of solids depending on
ABMA or ASME recommendations as discussed in Q5.17. If at 500 psig pressure
the boiler water concentration is 2500 ppm, and if steam should have 0.5 ppm
solids, then the quality can be estimated as follows:
% Moisture in steam ¼ 0:5
2500� 100 ¼ 0:02%
or
Steam quality ¼ 100� 0:02 ¼ 99:98%
5.14
Q:How do we estimate the water required for desuperheating steam? Superheated
steam at 700 psia and 800�F must be cooled to 700�F by using a spray of water at
300�F. Estimate the quantity of water needed to do this.
A:From an energy balance across the desuperheater, we get
W1h1 þWhf ¼ W2h2 ð19aÞwhere
W1;W2 ¼ steam flows before and after desuperheating
W ¼water required
h1; h2 ¼ steam enthalpies before and after the process
hf ¼ enthalpy of water
Also, from mass balance,
W2 ¼ W1 þW
Hence we can show that
W ¼ W2 �h1 � h2
h1 � hfð19bÞ
Neglecting the pressure drop across the desuperheater, we have from the steam
tables h1 ¼ 1403, h2 ¼ 1346, and hf ¼ 271, all in Btu=lb. Hence W=W2 ¼ 0.05.
That is, 5% of the final steam flow is required for injection purposes.
Copyright © 2003 Marcel Dekker, Inc.

5.15
Q:How is the water requirement for cooling a gas stream estimated? Estimate the
water quantity required to cool 100,000 lb=h of flue gas from 900�F to 400�F.What is the final volume of the gas?
A:From an energy balance it can be shown [1] that
q ¼ 5:39� 10�4 � ðt1 � t2Þ� W
1090þ 0:45� ðt2 � 150Þð20Þ
where
q¼water required, gpm
t1; t2 ¼ initial and final gas temperatures, �FW ¼ gas flow entering the cooler, lb=h
Substitution yields
q ¼ 5:39� 10�4 � ð900� 400Þ� 100;000
1090þ 0:45� ð400� 150Þ¼ 23 gpm
The final gas volume is given by the expression
ð460þ t2Þ �W
2361þ 0:341
� �
The final volume is 43,000 acfm.
5.16
Q:In selecting silencers for vents or safety valves, we need to figure the volume of
steam after the throttling process. Estimate the volume of steam when 60,000 lb=hof superheated steam at 650 psia and 800�F is blown to the atmosphere through a
safety valve.
A:We have to find the final temperature of steam after throttling, which may be
considered an isoenthalpic process; that is, the steam enthalpy remains the same
at 650 and 15 psia.
Copyright © 2003 Marcel Dekker, Inc.

From the steam tables, at 650 psia and 800�F, h¼ 1402Btu=lb. At 15 psia(atmospheric conditions), the temperature corresponding to an enthalpy of
1402Btu=lb is 745�F. Again from the steam tables, at a pressure of 15 psia and
a temperature of 745�F, the specific volume of steam is 48 cu ft=lb. The total
volume of steam is 60,000� 48¼ 2,880,000 cu ft=h.
5.17
Q:How do we determine the steam required for deaeration and boiler blowdown
water requirements?
A:Steam plant engineers have to frequently perform energy and mass balance
calculations around the deaerator and boiler to obtain the values of makeup water,
blowdown, or deaeration steam flows. Boiler blowdown quantity depends on the
total dissolved solids (TDS) of boiler water and the incoming makeup water.
Figure 5.2 shows the scheme around a simple deaerator. Note that there could be
several condensate returns. This analysis does not consider venting of steam from
the deaerator or the heating of makeup using the blowdown water. These
refinements can be done later to fine-tune the results.
The American Boiler Manufacturers Association (ABMA) and ASME
provide guidelines on the TDS of boiler water as a function of pressure (see
Tables 5.4 and 5.5. The drum solids concentration can be at or less than the value
shown in these tables. Plant water chemists usually set these values after
reviewing the complete plant chemistry.
FIGURE 5.2 Scheme of deaeration system.
Copyright © 2003 Marcel Dekker, Inc.

TABLE 5.4 Suggested Water Quality Limitsa
Boiler type: Industrial water tube, high duty, primary fuel fired, drum typeMakeup water percentage: Up to 100% of feedwaterConditions: Includes superheater, turbine drives, or process restriction on steam purity
Drum operating pressureb, 0–2.07 2.08–3.10 3.11–4.14 4.15–5.17 5.18–6.21 6.22–6.89 6.90–10.34 10.35–13.79MPa (psig) (0–300) (301–450) (451–600) (601–750) (751–900) (901–1000) (1001–1500) (1501–2000)
Feedwater c
Dissolved oxygen (mg=L O2)measured before oxygenscavenger additiond
<0.04 <0.04 <0.007 <0.007 <0.007 <0.007 <0.007 <0.007
Total iron (mg=L Fe) �0.100 �0.050 �0.030 �0.025 �0.020 �0.020 �0.010 �0.010Total copper (mg=L Cu) �0.050 �0.025 �0.020 �0.020 �0.015 �0.015 �0.010 �0.010Total hardness (mg=L CaCO3) �0.300 �0.300 �0.200 �0.200 �0.100 �0.050 n.d. n.d.pH range @25�C 7.5–10.0 7.5–10.0 7.5–10.0 7.5–10.0 7.5–10.0 8.5–9.5 9.0–9.6 9.0–9.6
Chemicals for preboilersystem protection
Use only volatile alkaline materials
Nonvolatile TOCs
(mg=L C)e<1 <1 <0.5 <0.5 <0.5 —As low as possible, <0.2—
Oily matter (mg=L) <1 <1 <0.5 <0.5 <0.5 —As low as possible, <0.2—
Boiler waterSilica (mg=L SiO2) �150 �90 �40 �30 �20 �8 �2 �1Total alkalinity (mg=L CaCO3) <350f <300f <250f <200f <150f <100f n.s.g n.s.g
Free hydroxide alkalinity(mg=L CaCO3)
hn.s. n.s. n.s. n.s. n.d.g n.d.g n.d.g n.dg
Specific conductance(mmho=cm) @ 25�C without
neutralization
<3500i <3000i 2500i <2000i <1500i <1000i �150 �100
Copyright © 2003 Marcel Dekker, Inc.

n.d.¼ not detectable; n.s.¼ not specified.aNo values are given for saturated steam purity target because steam purity achievable depends upon many variables, including boiler water total
alkalinity and specific conductance as well as design of boiler, steam drum internals, and operating conditions (see footnote i). Because boilers in
this category require a relatively high degree of steam purity, other operating parameters must be set as low as necessary to achieve this high
purity for protection of the superheaters and turbines and=or to avoid process contamination.bWith local heat fluxes > 473.2 kW=m2 (>150,000Btu=h ft2), use values for the next higher pressure range.cBoilers below 6.21MPa (900psig) with large furnaces, large steam release space, and internal chelant, polymer, and=or antifoam treatment can
sometimes tolerate higher levels of feedwater impurities than those in the table and still achieve adequate deposition control and steam purity.
Removal of these impurities by external pretreatment is always a more positive solution. Alternatives must be evaluated as to practicality and
economics in each case.dValues in table assume the existence of a deaerator.eNonvolatile TOCs are the organic carbon not intentionally added as part of the water treatment regime.fMaximum total alkalinity consistent with acceptable steam purity. If necessary, should override conductance as blowdown control parameter. If
makeup is demineralized water at 4.14–6.89MPa (600–1000 psig), boiler water alkalinity and conductance should be that in table for 6.90–
10.34MPa (1001–1500 psig) range.g‘‘Not detectable’’ in these cases refers to free sodium or potassium hydroxide alkalinity. Some small variable amount of total alkalinity will be
present and measurable with the assumed congruent or coordinated phosphate pH control or volatile treatment employed at these high pressure
ranges.hMinimum level of OH� alkalinity in boilers below 6.21MPa (900 psig) must be individually specified with regard to silica solubility and other
components of internal treatment.iMaximum values are often not achievable without exceeding suggested maximum total alkalinity values, especially in boilers below 6.21MPa
(900psig) with > 20% makeup of water whose total alkalinity is >20% of TDS naturally or after pretreatment with soda lime or sodium cycle ion-
exchange softening. Actual permissible conductance values to achieve any desired steam purity must be established for each case by careful
steam purity measurements. Relationship between conductance and steam purity is affected by too many variables to allow its reduction to a
simple list of tabulated values.
Source: Adapted from ASME 1979 Consensus.
Copyright © 2003 Marcel Dekker, Inc.

Example
A boiler generates 50,000 lb=h of saturated steam at 300 psia, out of which
10,000 lb=h is taken for process and returns to the deaerator as condensate at
180�F. The rest is consumed. Makeup water enters the deaerator at 70�F, andsteam is available at 300 psia for deaeration. The deaerator operates at a pressure
of 25 psia. The blowdown has a total dissolved solids (TDS) of 1500 ppm, and the
makeup has 100 ppm TDS.
Evaluate the water requirements for deaeration steam and blowdown.
Solution. From mass balance around the deaerator,
10;000þ DþM ¼ F ¼ 50;000þ B ð21Þ
TABLE 5.5 Recommended Boiler Water Limits and Associated Steam Purity atSteady-State Full Load Operation—Water Tube Drum-Type Boilers
Drum
pressure(psig)
TDS range,a
boiler water(ppm)(max)
Range total
alkalinity,b boilerwater (ppm)
Suspendedsolids
boiler water(ppm)(max)
TDS range,b,c
steam (ppm)
(max expectedvalue)
0–300 700–3500 140–700 15 0.2–1.0301–450 600–3000 120–600 10 0.2–1.0451–600 500–2500 100–500 8 0.2–1.0601–750 200–1000 40–200 3 0.1–0.5
751–900 150–750 30–150 2 0.1–0.5901–1000 125–625 25–125 1 0.1–0.51001–1800 100 —d 1 0.1
1801–2350 50 n.a. 0.12351–2600 25 n.a. 0.052601–2900 15 n.a. 0.05
Once-through boilers1400 and above 0.05 n.a. n.a. 0.05
n.a.¼not available.aActual values within the range reflect the TDS in the feedwater. Higher values are for high
solids in the feedwater, lower values for low solids.bActual values within the range are directly proportional to the actual value of TDS of boiler
water. Higher values are for the high solids in the boiler water, lower values for low solids.cThese values are exclusive of silica.dDictated by boiler water treatment.
Source: American Boiler Manufacturers Association, 1982.
Copyright © 2003 Marcel Dekker, Inc.

From an energy balance around the deaerator,
10;000� 148þ 1202:8� DþM � 38 ¼ 209� F ¼ 209� ð50;000þ BÞð22Þ
From a balance of solids concentration,
100�M ¼ 1500� B ð23ÞIn Eq. (22), 1202.8 is the enthalpy of the steam used for deaeration, 209 the
enthalpy of boiler feedwater, 148 the enthalpy of the condensate return, and 38
that of the makeup, all in Btu=lb. The equation assumes that the amount of solids
in returning condensate and steam is negligible, which is true. Steam usually has
a TDS of 1 ppm or less, and so does the condensate. Hence, for practical purposes
we can neglect it. The net solids enter the system in the form of makeup water
and leave as blowdown. There are three unknowns—D, M, and B—and three
equations. From Eq. (21),
DþM ¼ 40;000þ B ð24ÞSubstituting (23) into (24),
Dþ 15B ¼ 40;000þ B2
or
Dþ 14B ¼ 40;000 ð25ÞFrom (22),
1;480;000þ 1202:8Dþ 38� 15B
¼ 209� 50;000þ 209B
Solving this equation, we have B¼ 2375 lb=h, D¼ 6750 lb=h, M ¼ 35,625 lb=h,and F ¼ 52,375 lb=h. Considering venting of steam from the deaerator to expel
dissolved gases and the heat losses, 1–3% more steam may be consumed.
5.18
Q:How can the boiler blowdown be utilized? A 600 psia boiler operates for 6000 h
annually and discharges 4000 lb=h of blowdown. If this is flashed to steam at
100 psia, how much steam is generated? If the cost of the blowdown system is
$8000, how long does payback take? Assume that the cost of steam is $2=1000 lb.
Copyright © 2003 Marcel Dekker, Inc.

A:To estimate the flash steam produced we may use the expression
h ¼ xhg þ ð1� xÞhf ð26Þwhere
h¼ enthalpy of blowdown water at high pressure, Btu=lbhg; hf ¼ enthalpies of saturated steam and water at the flash pressure,
Btu=lbx¼ fraction of steam that is generated at the lower pressure
From the steam tables, at 600 psia, h ¼ 471:6, and at 100 psia, hg ¼ 1187 and
hf ¼ 298, all in Btu=lb. Using Eq. (26), we have
471:6 ¼ 1187xþ ð1� xÞ � 298
or
x ¼ 0:195
About 20% of the initial blowdown is converted to flash steam, the quantity
being 0.2� 4000¼ 800 lb=h. This 800 lb=h of 100 psia steam can be used for
process. The resulting savings annually will be
800� 2� 6000
1000¼ $9600
Simple payback will be 8000=9600¼ 0.8 year or about 10 months.
Tables are available that give the flash steam produced if the initial and flash
pressures are known. Table 5.6 is one such table.
5.19A
Q:Estimate the leakage of steam through a hole 1=8 in. in diameter in a pressure
vessel at 100 psia, the steam being in a saturated condition.
A:The hourly loss of steam in lb=h is given by [2]
W ¼ 50AP
1þ 0:00065ðt � tsatÞð27Þ
where
W ¼ steam leakage, lb=hA¼ hole area, in.2
P¼ steam pressure, psia
t; tsat ¼ steam temperature and saturated steam temperature, �F
Copyright © 2003 Marcel Dekker, Inc.
If the steam is saturated, t ¼ tsat. If the steam is wet with a steam quality of x, then
the leakage flow is obtained from Eq. (27) divided byffiffiffiffix:
pBecause the steam is
saturated ðx ¼ 1Þ,
W ¼ 50� 3:14� 1
8
� �2
� 1
4� 100 ¼ 61 lb=h
If the steam were superheated and at 900�F, then
W ¼ 61
1þ 0:00065� ð900� 544Þ ¼ 50 lb=h
544�F is the saturation temperature at 1000 psia. If the steam were wet with a
quality of 80%, then
W ¼ 61ffiffiffiffiffiffiffi0:8
p ¼ 68 lb=h
TABLE 5.6 Steam Flash and Heat Content at Differential Temperatures
Initial Temp. of Percent of flash at reduced pressurespressure liquid Atm.
(psig) ð�FÞ pressure 5 lb 10 lb 15 lb 20 lb 25 lb 30 lb 35 lb 40 lb
100 338 13 11.5 10.3 9.3 8.4 7.6 6.9 6.3 5.5125 353 14.5 13.3 11.8 10.9 10 9.2 8.5 7.9 7.2
150 366 16 14.6 13.2 12.3 11.4 10.6 9.9 9.3 8.5175 377 17 15.8 14.4 13.4 12.5 11.6 11.1 10.4 9.7200 388 18 16.9 15.5 14.6 13.7 12.9 12.2 11.6 10.9
225 397 19 17.8 16.5 15.5 14.7 13.9 13.2 12.6 11.9250 406 20 18.8 17.4 16.5 15.6 14.9 14.2 13.6 12.9300 421 21.5 20.3 19 18 17.2 16.5 15.8 15.2 14.5
350 435 23 21.8 20.5 19.5 18.7 18 17.3 16.7 16400 448 24 23 21.8 21 20 19.3 18.7 18.1 17.5450 459 25 24.3 23 22 21.3 20 19.9 19.3 18.7500 470 26.5 25.4 24.1 23.2 22.4 21.7 21.1 20.5 19.9
550 480 27.5 26.5 25.2 24.3 23.5 22.8 22.2 21.6 20.9600 488 28 27.3 26 25 24.3 23.6 23 22.4 21.8Btu in flash per lb 1150 1155 1160 1164 1167 1169 1172 1174 1176
Temp. of liquid, �F 212 225 240 250 259 267 274 280 287Steam volume,cu ft=lb
26.8 21 16.3 13.7 11.9 10.5 9.4 8.5 7.8
Source: Madden Corp. catalog.
Copyright © 2003 Marcel Dekker, Inc.

5.19B
Q:How is the discharge flow of air from high pressure to atmospheric pressure
determined?
A:Critical flow conditions for air are found in several industrial applications such as
flow through soot blower nozzles, spray guns, and safety valves and leakage
through holes in pressure vessels. The expression that relates the variables is [8]
W ¼ 356� AP � MW
T
� �0:5
ð28Þ
where
W ¼ flow, lb=hA¼ area of opening, in.2
MW¼molecular weight of air, 28.9
T ¼ absolute temperature, �RP¼ relief or discharge pressure, psia
What is the leakage air flow from a pressure vessel at 40 psia if the hole is 0.25 in.
in diameter? Air is at 60�F.
A ¼ 3:14� 0:25� 0:25
4¼ 0:049 in:2
Hence,
W ¼ 356� 0:049� 40� 28:9
520
� �0:5
¼ 164 lb=h
5.20A
Q:Derive an expression for the leakage of gas across a damper, stating the
assumptions made.
A:Most of the dampers used for isolation of gas or air in ducts are not 100%
leakproof. They have a certain percentage of leakage area, which causes a flow of
Copyright © 2003 Marcel Dekker, Inc.

gas across the area. Considering the conditions to be similar to those of flow
across an orifice, we have
Vg ¼ Cd
ffiffiffiffiffiffiffiffiffiffiffiffiffiffiffiffiffiffiffi2gHw
rw2rg
sð29Þ
where
Vg ¼ gas velocity through the leakage area, fps
Hw ¼ differential pressure across the damper, in. WC
rg; rw ¼ density of gas and water, lb=cu ft
g¼ acceleration due to gravity, ft=s2
Cd ¼ coefficient of discharge, 0.61
The gas flow W in lb=h can be obtained from
W ¼ 3600 rg Að100� EÞ Vg
100
� �ð30Þ
where E is the sealing efficiency on an area basis (%). Most dampers have an E
value of 95–99%. This figure is provided by the damper manufacturer. A is the
duct cross section, ft2. Substituting Cd ¼ 0:61 and rg ¼ 40=ð460þ tÞ into Eqs.
(29) and (30) and simplifying, we have
W ¼ 2484A ð100� EÞffiffiffiffiffiffiffiffiffiffiffiffiffiffiffiHw
460þ t
rð31Þ
where t is the gas or air temperature, �F.
5.20B
Q:A boiler flue gas duct with a diameter of 5 ft has a damper whose sealing
efficiency is 99.5%. It operates under a differential pressure of 7 in. WC when
closed. Gas temperature is 540�F. Estimate the leakage across the damper. If
energy costs $3=MM Btu, what is the hourly heat loss and the cost of leakage?
A:Substitute A ¼ 3:14� 52=4;Hw ¼ 7; t ¼ 540, and E ¼ 99:5 into Eq. (31). Then
W ¼ 2484� 3:14� 52
4� ð100� 99:5Þ � 7ffiffiffiffiffiffiffiffiffiffi
1000p
¼ 2040 lb=h
Copyright © 2003 Marcel Dekker, Inc.

The hourly heat loss can be obtained from
Q ¼ WCpðt � taÞ ¼ 2040� 0:26� ð540� 80Þ¼ 240;000 Btu=h ¼ 0:24 MM Btu=h
where Cp is the gas specific heat, Btu=lb�F. Values of 0.25–0.28 can be used for
quick estimates, depending on gas temperature. ta is the ambient temperature in�F. 80�F was assumed in this case. The cost of this leakage¼ 0.24� 3¼ $0.72=h.
5.20C
Q:How is the sealing efficiency of a damper defined?
A:The sealing efficiency of a damper is defined on the basis of the area of cross
section of the damper and also as a percentage of flow. The latter method of
definition is a function of the actual gas flow condition.
In Q5.20b, the damper had an efficiency of 99.5% on an area basis. Assume
that the actual gas flow was 230,000 lb=h. Then, on a flow basis, the efficiency
would be
100� 2040
230;000¼ 99:12%
If the flow were 115,000 lb=h and the differential pressure were maintained, the
efficiency on an area basis would still be 99.5%, whereas on a flow basis it would
be
100� 2040
115;000¼ 98:24%
Plant engineers should be aware of these two methods of stating the
efficiency of dampers.
5.21
Q:50,000 lb=h of flue gas flows from a boiler at 800�F. If a waste heat recovery
system is added to reduce its temperature to 350�F, how much energy is saved? If
energy costs $3=MM Btu and the plant operates for 6000 h=year, what is the
annual savings? If the cost of the heat recovery system is $115,000, what is thesimple payback?
Copyright © 2003 Marcel Dekker, Inc.

A:The energy savings Q ¼ WCpðt1 � t2Þ; where t1 and t2 are gas temperatures
before and after installation of the heat recovery system, �F. Cp is the gas specific
heat, Btu=lb �F. Use a value of 0.265 when the gas temperature is in the range of
400–600�F.
Q ¼ 50;000� 0:265� ð800� 350Þ ¼ 5:85� 106
¼ 5:85 MM Btu=h
Annual savings ¼ 5:85� 6000� 3 ¼ $105;000
Hence
Simple payback ¼ 115;000
105;000¼ 1:1 years, or 13 months
5.22
Q:What is life-cycle costing? Two bids are received for a fan as shown below.
Which bid is better?
Bid 1 Bid 2
Flow, acfm 10,000 10,000Head, in. WC 8 8
Efficiency, % 60 75Total cost, fan and motor, $ 17,000 21,000
A:Life-cycle costing is a methodology the computes the total cost of owning and
operating the equipment over its life. Several financing methods and tax factors
would make this a complicated evaluation. However, let us use a simple approach
to illustrate the concept. To begin with, the following data should be obtained.
Cost of electricity, Ce ¼ $0.25=kWh
Annual period of operation, N ¼ 8000 h
Life of equipment, T ¼ 15 years
Interest rate, i¼ 0.13 (13%)
Escalation rate, e¼ 0.08 (8%)
If the annual cost of operation is Ca, the life-cycle cost (LCC) is
LCC ¼ Cc þ CaF ð32Þ
Copyright © 2003 Marcel Dekker, Inc.

where Cc is the cost of equipment and F is a factor that capitalizes the operating
cost over the life of the equipment. It can be shown [4,5] that
F ¼ 1þ e
1þ i�
1� 1þ e
1þ i
� �T
1� 1þ e
1þ i
ð33Þ
The annual cost of operation is given by
Ca ¼ PCe N ð34Þwhere P is the electric power consumed, kW.
P ¼ 1:17� 10�4 � qHw
Zf
ð35Þ
where
Hw ¼ head, in. WC
Zf ¼ efficiency, fraction
q¼ flow, acfm
Let us use the subscripts 1 and 2 for bids 1 and 2.
P1 ¼ 1:17� 10�4 � 10;000� 8
0:60¼ 15:6 kW
P2 ¼ 1:17� 10�4 � 10;000� 8
0:75¼ 12:48 kW
From Eq. (33), substituting e¼ 0.08, i¼ 0.13, and T ¼ 15, we get F ¼ 10.64.
Calculate Ca from Eq. (34):
Ca1 ¼ 15:6� 8000� 0:025 ¼ $3120
Ca2 ¼ 12:48� 8000� 0:025 ¼ $2500
Using Eq. (32), calculate the life-cycle cost.
LCC1 ¼ 17;000þ 3120� 10:64 ¼ $50;196
LCC2 ¼ 21;000þ 2500� 10:64 ¼ $47;600
We note that bid 2 has a lower LCC and thus may be chosen. However, we have to
analyze other factors such as period of operation, future cost of energy, and so on,
before deciding. If N were lower, it is likely that bid 1 would be better.
Hence, the choice of equipment should not be based only on the initial
investment but on an evaluation of the life-cycle cost, especially as the cost of
energy is continually increasing.
Copyright © 2003 Marcel Dekker, Inc.

5.23
Q:A process kiln omits 50,000 lb=h of flue gas at 800�F. Two bids were received for
heat recovery systems, as follows:
Bid 1 Bid 2
Gas temperature leaving system, �F 450 300Investment, $ 215,000 450,000
If the plant operates for 6000 h=year and interest, escalation rates, and life
of plant are as in Q5.22, evaluate the two bids if energy costs $4=MM Btu.
A:Let us calculate the capitalized savings and compare them with the investments.
For bid 1:
Energy recovered ¼ 50;000� 0:25� ð800� 450Þ¼ 4:375 MM Btu=h
This energy is worth
4:375� 4 ¼ $17:5=h
Annual savings ¼ 6000� 17:5 ¼ $105;000
The capitalization factor from Q5.22 is 10.64. Hence capitalized savings (savings
throughout the life of the plant)¼ 105,000� 10.64¼ $1.12� 106. A similar
calculation for bid 2 shows that the capitalized savings will be $1.6� 106. The
difference in capitalized savings of $0.48� 106, or $480,000, exceeds the
difference in the investment of $235,000. Hence bid 2 is more attractive.
If, however, energy costs $3=MM Btu and the plant works for 2500 h=year,capitalized savings on bid 1 will be $465,000 and that of bid 2 $665,000. Thedifference of $200,000 is less than the difference in investment of $235,000.Hence under these conditions, bid 1 is better.
The cost of energy and period of operation are important factors in arriving
at the best choice.
5.24
Q:Determine the thickness of the tubes required for a boiler super-heater. The
material is SA 213 T11; the metal temperature is 900�F (see Q8.16a for a
Copyright © 2003 Marcel Dekker, Inc.

discussion of metal temperature calculation), and the tube outer diameter is
1.75 in. The design pressure is 1000 psig.
A:Per ASME Boiler and Pressure Vessel Code, Sec. 1, 1980, p. 27, the following
equation can be used to obtain the thickness or the allowable pressure for tubes.
(A tube is specified by the outer diameter and minimum wall thickness, where as
a pipe is specified by the nominal diameter and average wall thickness.) Typical
pipe and tube materials used in boiler applications are shown in Tables 5.3 and
5.7.
tw ¼ Pd
2Sa þ Pþ 0:005d þ e ð36Þ
P ¼ Sa �2tw � 0:01d � 2e
d � ðtw � 0:005d � eÞ ð37Þ
where
tw ¼minimum wall thickness, in.
P¼ design pressure, psig
d¼ tube outer diameter, in.
e¼ factor that accounts for compensation in screwed tubes, generally zero
Sa ¼ allowable stress, psi
TABLE 5.7 Allowable Stress Values, Ferrous Tubing, 1000 psi
Temperatures not exceeding (�F):
Material specifications 20–650 700 750 800 850 900 950 1000 1200 1400
SA 178 gr A 10.0 9.7 9.0 7.8 6.7 5.5 3.8 2.1 — —12.8 12.2 11.0 9.2 7.4 5.5 3.8 2.1 — —
SA 192 gr C 11.8 11.5 10.6 9.2 7.9 6.5 4.5 2.5 — —
SA 210 gr A-1 SA 53 B 15 14.4 13.0 10.8 8.7 6.5 4.5 2.5 — —gr C 17.5 16.6 14.8 12.0 7.8 5.0 3.0 1.5 — —
SA 213 T11, P11 15.0 15.0 15.0 15.0 14.4 13.1 11.0 7.8 1.2 —
T22, P22 15.0 15.0 15.0 15.0 14.4 13.1 11.0 7.8 1.6 —T9 — 13.4 13.1 12.5 12.5 12.0 10.8 8.5 — —
SA 213 TP 304 H — 15.9 15.5 15.2 14.9 14.7 14.4 13.8 6.1 2.3
TP 316 H — 16.3 16.1 15.9 15.7 15.5 15.4 15.3 7.4 2.3TP 321 H — 15.8 15.7 15.5 15.4 15.3 15.2 14.0 5.9 1.9TP 347 H — 14.7 14.7 14.7 14.7 14.7 14.6 14.4 7.9 2.5
Source: ASME, Boiler and Pressure Vessel Code, Sec. 1, Power boilers, 1980.
Copyright © 2003 Marcel Dekker, Inc.

From Table 5.7, Sa is 13,100. Substituting into Eq. (36) yields
tw ¼ 1000� 1:75
2� 13;100þ 1000þ 0:005� 1:75 ¼ 0:073 in:
The tube with the next higher thickness would be chosen. A corrosion allowance,
if required, may be added to tw.
5.25
Q:Determine the maximum pressure that an SA 53 B carbon steel pipe of size 3 in.
schedule 80 can be subjected to at a metal temperature of 550�F. Use a corrosionallowance of 0.02 in.
A:By the ASME Code, Sec. 1, 1980, p. 27, the formula for determining allowable
pressures or thickness of pipes, drums, and headers is
tw ¼ Pd
2SaE þ 0:8Pþ c ð38Þ
where
E¼ ligament efficiency, 1 for seamless pipes
c¼ corrosion allowance
From Table 5.3, a 3 in. schedule 80 pipe has an outer diameter of 3.5 in. and a
nominal wall thickness of 0.3 in. Considering the manufacturing tolerance of
12.5%, the minimum thickness available is 0.875� 0.3¼ 0.2625 in.
Substituting Sa ¼ 15,000 psi (Table 5.7) and c ¼ 0:02 into Eq. (38), we
have
0:2625 ¼ 3:5P
2� 15;000þ 0:8Pþ 0:02
Solving for P, we have P¼ 2200 psig.
For alloy steels, the factor 0.8 in the denominator would be different. The
ASME Code may be referred to for details [6]. Table 5.8 gives the maximum
allowable pressures for carbon steel pipes up to a temperature of 650�F [7].
5.26
Q:How is the maximum allowable external pressure for boiler tubes determined?
Copyright © 2003 Marcel Dekker, Inc.

A:According to ASME Code [9], the external pressures of tubes or pipes can be
determined as follows.
For cylinders having do=t > 10,
Pa ¼4B
3ðdo=tÞð39Þ
where
Pa ¼maximum allowable external pressure, psi
A;B¼ factors obtained from ASME Code, Sec. 1, depending on values of
do=t and L=do, where L; do, and t refer to tube length, external
diameter, and thickness.
When do=t < 10; A and B are determined from tables or charts as in Q5.25.
For do=t < 4; A ¼ 1:1=ðdo=tÞ2. Two values of allowable pressures are then
computed, namely, Pa1 and Pa2.
Pa1 ¼2:167
do=t� 0:0833
� �� B
and
Pa2 ¼ 2Sb �1� t=dodo=t
TABLE 5.8 Maximum Allowable Pressurea
Nominal pipe size (in.) Schedule 40 Schedule 80 Schedule 160
1=4 4830 6833 —
1=2 3750 5235 69281 2857 3947 5769112 2112 3000 4329
2 1782 2575 4225212 1948 2702 37493 1693 2394 3601
4 1435 2074 33705 1258 1857 31916 1145 1796 3076
8 1006 1587 2970
aBased on allowable stress of 15,000psi; corrosion allowance is zero.
Source: Ref. 7.
Copyright © 2003 Marcel Dekker, Inc.
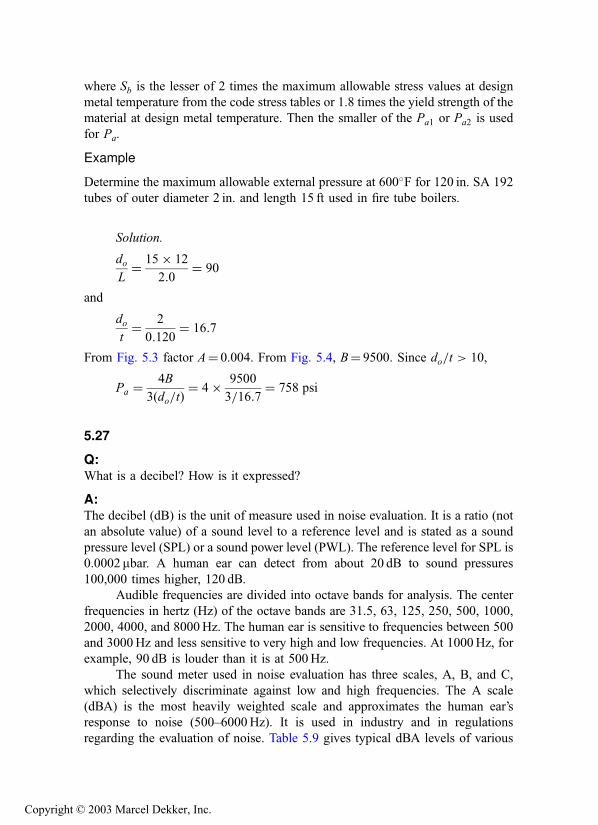
where Sb is the lesser of 2 times the maximum allowable stress values at design
metal temperature from the code stress tables or 1.8 times the yield strength of the
material at design metal temperature. Then the smaller of the Pa1 or Pa2 is used
for Pa.
Example
Determine the maximum allowable external pressure at 600�F for 120 in. SA 192
tubes of outer diameter 2 in. and length 15 ft used in fire tube boilers.
Solution.
do
L¼ 15� 12
2:0¼ 90
and
do
t¼ 2
0:120¼ 16:7
From Fig. 5.3 factor A¼ 0.004. From Fig. 5.4, B¼ 9500. Since do=t > 10,
Pa ¼4B
3ðdo=tÞ¼ 4� 9500
3=16:7¼ 758 psi
5.27
Q:What is a decibel? How is it expressed?
A:The decibel (dB) is the unit of measure used in noise evaluation. It is a ratio (not
an absolute value) of a sound level to a reference level and is stated as a sound
pressure level (SPL) or a sound power level (PWL). The reference level for SPL is
0.0002 mbar. A human ear can detect from about 20 dB to sound pressures
100,000 times higher, 120 dB.
Audible frequencies are divided into octave bands for analysis. The center
frequencies in hertz (Hz) of the octave bands are 31.5, 63, 125, 250, 500, 1000,
2000, 4000, and 8000Hz. The human ear is sensitive to frequencies between 500
and 3000Hz and less sensitive to very high and low frequencies. At 1000Hz, for
example, 90 dB is louder than it is at 500Hz.
The sound meter used in noise evaluation has three scales, A, B, and C,
which selectively discriminate against low and high frequencies. The A scale
(dBA) is the most heavily weighted scale and approximates the human ear’s
response to noise (500–6000Hz). It is used in industry and in regulations
regarding the evaluation of noise. Table 5.9 gives typical dBA levels of various
Copyright © 2003 Marcel Dekker, Inc.

noise sources, and Table 5.10 gives the permissible Occupational Safety and
Health Act (OSHA) noise exposure values.
5.28
Q:How are decibels added? A noise source has the following dB values at center
frequencies:
Hz 31.5 63 125 250 500 1000 2000 4000 8000
dB 97 97 95 91 84 82 80 85 85
What is the overall noise level?
FIGURE 5.3 Factor A for use in external pressure calculation [9].
Copyright © 2003 Marcel Dekker, Inc.

FIGURE 5.4 Factor B for use in external pressure calculation (SA 178A, SA 192 tubes) [9].
Copyright © 2003 Marcel Dekker, Inc.

A:Decibels are added logarithmically and not algebraically. 97 dB plus 97 dB is not
194 dB but 100 dB.
P ¼ 10 logð10P1=10 þ 10P2=10 þ 10P3=10 þ � � �Þ¼ 10 logð109:7 þ 109:7 þ 109:5 þ 109:1 þ 108:4 þ 108:2 þ 108
þ 108:5 þ 108:5Þ¼ 102 dB
TABLE 5.9 Typical A-Weighted Sound Levels
dBA Source Perception=hearing
140 Jet engine at 25 ft Unbearable130 High pressure safety vent at 25 ft Threshold of pain120 Large forced draft fan plenum area Uncomfortably loud
110 8000 hp engine exhaust at 25 ft100 Compressor building Very loud90 Boiler room
80 Pneumatic drill Loud70 Commercial area60 Normal conversation
50 Average home Comfortable40 Nighttime residential area30 Broadcast studio
20 Whisper Barely audible100 Threshold of hearing
TABLE 5.10 Permissible Noise Exposures(OSHA)
Duration per day (h)Sound level (dBA)(slow response)
8 906 924 95
3 972 100112 102
1 10512 11014 or less 115
Copyright © 2003 Marcel Dekker, Inc.

5.29
Q:What are SPL and PWL?
A:SPL is sound pressure level, which is dependent on the distance and environment
and is easily measured with a sound level meter. SPL values should be referred to
distance. PWL is sound power level and is a measure of the total acoustic power
radiated by a given source. It is defined as
PWL ¼ 10 logW
10�12
� �dB ð40Þ
PWL is a constant for a given source and is independent of the environment. It
cannot be measured directly but must be calculated. PWL can be roughly
described as being equal to the wattage rating of a bulb. Manufacturers of fans
and gas turbines publish the values of PWL of their machines. When selecting
silencers for these equipment, PWL may be converted to SPL depending on
distance, and the attenuation desired at various frequencies may be obtained. A
silencer that gives the desired attenuation can then be chosen.
5.30
Q:A sound level of 120 dB is measured at a distance of 3 ft from a source. Find the
value at 100 ft.
A:The following formula relates the PWL and SPL with distance:
SPL ¼ PWL� 20 log Lþ 2:5 dB ð41Þwhere L¼ distance, ft.
PWL is a constant for a given source. Hence
SPLþ 20 log L ¼ a constant
120þ 20 log 3 ¼ SPL2 þ 20 log 100
Hence
SPL2 ¼ 89:5 dB
Thus we see that SPL has decreased by 30 dB with a change from 3 ft to 100 ft.
When selecting silencers, one should be aware of the desired SPL at the desired
distance. Neglecting the effect of distance can lead to specifying a larger and
more costly silencer than necessary.
Copyright © 2003 Marcel Dekker, Inc.

5.31
Q:How is the noise level from the exhaust of engines computed?
A:A gas turbine exhaust has the noise spectrum given in Table 5.11 at various
octave bands. The exhaust gases flow through a heat recovery boiler into a stack
that is 100 ft high. Determine the noise level 150 ft from the top of the stack (of
diameter 60 in.) and in front of the boiler.
Assume that the boiler attenuation is 20 dB at all octave bands. In order to
arrive at the noise levels at the boiler front, three corrections are required: (1)
boiler attenuation, (2) effect of directivity, and (3) divergence at 150 ft. The effect
of directivity is shown in Table 5.12. The divergence effect is given by 20 log
L� 2:5; where L is the distance from the noise source.
Row 8 values are converted to dBA by adding the dB at various
frequencies. The final value is 71 dBA.
5.32
Q:How is the holdup or volume of water in boiler drums estimated? A boiler
generating 10,000 lb=h of steam at 400 psig has a 42 in. drum 10 ft long with 2:1
ellipsoidal ends. Find the time between normal water level (NWL) and low level
cutoff (LLCO) if NWL is at 2 in. below drum centerline and LLCO is 4 in. below
NWL.
TABLE 5.11 Table of Noise Levels
1. Frequency, Hz 63 125 250 500 1000 2000 4000 80002. PWL, �10�12W dB(gas turbine)
130 134 136 136 132 130 131 133
3. Boiler attenuation, dB �20 �20 �20 �20 �20 �20 �20 �204. Directivity, dB 0 �1 �2 �5 �8 �10 �13 �165. Divergence, dB �41 �41 �41 �41 �41 �41 �41 �41
6. Resultant 69 72 73 70 63 59 57 567. A scale, dB �25 �16 �9 �3 0 1 1 �18. Net 44 56 64 67 63 60 58 55
56 69 65 60
69 66.5
71
Copyright © 2003 Marcel Dekker, Inc.

A:The volume of water in the drum must include the volume due to the straight
section plus the dished ends.
Volume in the straight section, Vs, is given by
Vs ¼ L� R2 � a
57:3� sin a� cos a
� �
where a is the angle shown in Fig. 5.5. The volume of liquid in each end is given
by
Ve ¼ 0:261� H2 � ð3R� HÞ
TABLE 5.12 Effect of Directivity Based on Angle to Direction of Flow and Size ofSilencer Outlet
Octave band center frequency (Hz)Angle to direction Silencer outletof flow diameter (in.) 63 125 250 500 1000 2000 3000 4000
0� 72–96 þ4 þ5 þ5 þ6 þ6 þ7 þ7 þ754–66 þ3 þ4 þ4 þ5 þ5 þ5 þ5 þ536–48 þ2 þ3 þ3 þ4 þ4 þ4 þ4 þ4
26–32 þ1 þ1 þ2 þ2 þ2 þ2 þ2 þ216–24 0 0 þ1 þ1 þ1 þ1 þ1 þ18–14 0 0 0 0 0 0 0 06 0 0 0 0 0 0 0 0
45� 72–96 þ2 þ3 þ3 þ4 þ4 þ5 þ5 þ554–66 þ1 þ2 þ2 þ3 þ3 þ3 þ3 þ336–48 0 þ1 þ1 þ2 þ2 þ2 þ2 þ2
26–32 0 0 0 þ1 þ1 þ1 þ1 þ116–24 0 0 0 0 0 0 0 08–14 0 0 0 0 0 0 0 0
6 0 0 0 0 0 0 0 090 and 135� 72–96 �1 �2 �5 �7 �10 �12 �15 �17
54–66 0 �1 �2 �5 �8 �10 �13 �16
36–48 0 0 �1 �3 �6 �7 �11 �1526–32 0 0 0 �1 �3 �5 �9 �1416–24 0 0 0 0 �1 �3 �7 �138–14 0 0 0 0 �1 �2 �5 �11
5–6 0 0 0 0 0 �1 �3 �64 0 0 0 0 0 0 �1 �3
Source: Burgess Manning.
Copyright © 2003 Marcel Dekker, Inc.

where
H ¼ straight length of drum
R¼ drum radius
In this case, H¼ 120 in. and R¼ 21 in.
Let us compute Vs1 and Ve1, the volume of the straight section and each end
corresponding to the 19 in. level from the bottom of the drum.
cos a ¼ 2
21¼ 0:09523
Hence
a ¼ 84:5� and sin a ¼ 0:9954
vs1 ¼ 120� 21� 21� 84:53
57:3� 0:0953� 0:9954
� �¼ 73;051 cu in:
Ve1 ¼ 0:261� 19� 19� ð3� 21� 19Þ ¼ 4146 cu in:
Hence total volume of liquid up to 19 in. level¼ 73,051 þ 2� 4146¼ 81,343 cu
in.¼ 47.08 cu ft.
Similarly, we can show that total volume of water up to the 15 in.
level¼ 34.1 cu ft. Hence the difference is 13 cu ft.
Specific volume of water at 400 psig¼ 0.0193 cu ft=lb.
Normal evaporation rate ¼ 10;000� 0:0193
60
¼ 3:2 cu ft=min
Hence the length of time between the levels assuming that the water supply has
been discontinued¼ 13=3.21¼ 4.05min.
FIGURE 5.5 Partial volume of water in boiler drum.
Copyright © 2003 Marcel Dekker, Inc.

NOMENCLATURE
A Area of opening, in.2, or duct cross section, ft2
A;B Factors used in Q5.26
BD Blowdown, fraction
BHP Boiler horsepower
c Corrosion allowance, in.
Cc Initial investment, $Cd Coefficient of discharge
Ce Cost of electricity, $=kWh
Cp Specific heat, Btu=lb �Fd Tube or outer diameter, in.
di Tube or pipe inner diameter, in.
e Escalation factor
E Sealing efficiency, %; ligament efficiency, fraction
F Factor defined in Eq. (33)
G Gas mass velocity, lb=ft2 hh Enthalpy, Btu=lbH Height of liquid column, in.
hg; hf Enthalpy of saturated vapor and liquid, Btu=lbHg Head of gas column, ft
Hl Head of liquid, ft
Hw Differential pressure across damper, in. WC
i Interest rate
L Distance, ft
LCC Life-cycle cost, $M Moisture in air, lb=lbMW Molecular weight
N Annual period of operation, h
Pw Partial pressure of water vapor, psia
P Gas pressure, psia; design pressure, psig
DP Differential pressure, psi
PWL Sound power level
q Volumetric flow, gpm or cfm
Q Energy, Btu=hR Radius of drum, in.
RH Relative humidity
s Specific gravity
Sa Allowable stress, psi
SBV Steam by volume
SPL Sound pressure level, dB
SVP Saturated vapor pressure, psia
Copyright © 2003 Marcel Dekker, Inc.
t Fluid temperature, �Ftw Minimum wall thickness of pipe or tube, in.
T Life of plant, years
v Specific volume, cu ft; subscripts g and f stand for saturated vapor and
liquid
Ve;Vs Volume of drum ends, straight section, cu in.
Vg Velocity of gas
W Mass flow, lb=hx Steam quality
y Volume fraction
r Density, lb=cu ft; subscript g stands for gas
REFERENCES
1. V Ganapathy. Determining operating parameters for hot exhaust gas cooling systems.
Plant Engineering, Mar 3, 1983, p 182.
2. V Ganapathy. Nomograph estimates steam leakage and cost. Heating Piping and Air-
Conditioning, Nov 1982, p 101.
3. V Ganapathy. Quick estimates of damper leakage and cost energy loss. Oil and Gas
Journal, Sept 21, 1981, p 124.
4. V Ganapathy. Applied Heat Transfer, Tulsa, OK: PennWell Books, 1982, p 186.
5. RJ Brown and RRYanuck. Life Cycle Costing. Atlanta, GA: Fairmont Press, 1980, p
188.
6. ASME. Boiler and Pressure Vessel Code, Sec. 1. New York, 1980, p 119.
7. V Ganapathy. Estimate maximum allowable pressures for steel piping, Chemical
Engineering, July 25, 1983, p 99.
8. ASME. Boiler and Pressure Vessel Code, Sec. 8, Div. 1, Para UG 131, 1980.
9. ASME. Boiler and Pressure Vessel Code, Sec. 1, Para PFT 51, 1989.
Copyright © 2003 Marcel Dekker, Inc.

6
Fuels, Combustion, and Efficiency of Boilersand Heaters
6.01 Estimating HHV (higher heating value) and LHV (lower heating value) of
fuels from ultimate analysis; relating heat inputs based on HHV and LHV;
relating boiler efficiencies based on HHV and LHV
6.02 Estimating HHV and LHV of fuel oils if �API is known6.03 Calculating cost of fuels on MM Btu (million Btu) basis; comparing
electricity cost with cost of fuels
6.04 Estimating annual fuel cost for power plants; relating heat rates with
efficiency of power plants
6.05 Determining gas regulator settings for different fuels
6.06 Correcting fuel flow meter readings for operating fuel gas pressures and
temperatures
6.07 Determining energy, steam quantity, and electric heater capacity required
for heating air
6.08 Determining energy, steam quantity, and electric heater capacity required
for heating fuel oils
6.09 Combustion calculations from ultimate analysis of fuels; determining wet
and dry air and flue gas quantities; volumetric analysis of flue gas on wet
and dry basis; partial pressures of water vapor and carbon dioxide in flue
gas; molecular weight and density of flue gas
6.10 Combustion calculations on MM Btu basis; determining air and flue gas
quantities in the absence of fuel data
Copyright © 2003 Marcel Dekker, Inc.
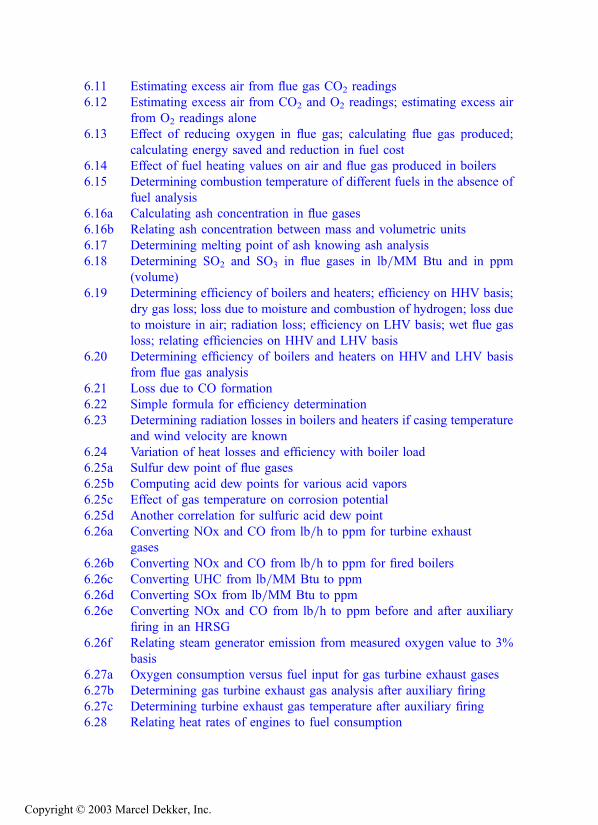
6.11 Estimating excess air from flue gas CO2 readings
6.12 Estimating excess air from CO2 and O2 readings; estimating excess air
from O2 readings alone
6.13 Effect of reducing oxygen in flue gas; calculating flue gas produced;
calculating energy saved and reduction in fuel cost
6.14 Effect of fuel heating values on air and flue gas produced in boilers
6.15 Determining combustion temperature of different fuels in the absence of
fuel analysis
6.16a Calculating ash concentration in flue gases
6.16b Relating ash concentration between mass and volumetric units
6.17 Determining melting point of ash knowing ash analysis
6.18 Determining SO2 and SO3 in flue gases in lb=MM Btu and in ppm
(volume)
6.19 Determining efficiency of boilers and heaters; efficiency on HHV basis;
dry gas loss; loss due to moisture and combustion of hydrogen; loss due
to moisture in air; radiation loss; efficiency on LHV basis; wet flue gas
loss; relating efficiencies on HHV and LHV basis
6.20 Determining efficiency of boilers and heaters on HHV and LHV basis
from flue gas analysis
6.21 Loss due to CO formation
6.22 Simple formula for efficiency determination
6.23 Determining radiation losses in boilers and heaters if casing temperature
and wind velocity are known
6.24 Variation of heat losses and efficiency with boiler load
6.25a Sulfur dew point of flue gases
6.25b Computing acid dew points for various acid vapors
6.25c Effect of gas temperature on corrosion potential
6.25d Another correlation for sulfuric acid dew point
6.26a Converting NOx and CO from lb=h to ppm for turbine exhaust
gases
6.26b Converting NOx and CO from lb=h to ppm for fired boilers
6.26c Converting UHC from lb=MM Btu to ppm
6.26d Converting SOx from lb=MM Btu to ppm
6.26e Converting NOx and CO from lb=h to ppm before and after auxiliary
firing in an HRSG
6.26f Relating steam generator emission from measured oxygen value to 3%
basis
6.27a Oxygen consumption versus fuel input for gas turbine exhaust gases
6.27b Determining gas turbine exhaust gas analysis after auxiliary firing
6.27c Determining turbine exhaust gas temperature after auxiliary firing
6.28 Relating heat rates of engines to fuel consumption
Copyright © 2003 Marcel Dekker, Inc.

6.01
Q:How are the HHV (higher heating value) and LHV (lower heating value) of fuels
estimated when the ultimate analysis is known?
A:We can use the expressions [1]
HHV ¼ 14,500� Cþ 62,000� H2 �O2
8
� �þ 4000� S ð1Þ
LHV ¼ HHV� 9720� H2 � 1110W ð2Þwhere W is the fraction by weight of moisture in fuel, and C;H2;O2, and S are
fractions by weight of carbon, hydrogen, oxygen, and sulfur in the fuel.
If a coal has C ¼ 0:80;H2 ¼ 0:003;O2 ¼ 0:005;W ¼ 0:073; S ¼ 0:006,and the rest ash, find its HHV and LHV. Substituting into Eqs. (1) and (2), we
have
HHV ¼ 14,500� 0:80þ 62,000� 0:003� 0:005
8
� �þ 4000� 0:006 ¼ 11,771 Btu=lb
LHV ¼ 11,771� 9720� 0:003� 1110� 0:073
¼ 11,668 Btu=lb
Fuel inputs to furnaces and boilers and efficiencies are often specified without
reference to the heating values, whether HHV or LHV, which is misleading.
If a burner has a capacity of Q MM Btu=h (million Btu=h) on HHV basis,
its capacity on LHV basis would be
QLHV ¼ QHHV � LHV
HHVð3aÞ
Similarly, if ZHHV and ZLHV are the efficiencies of a boiler on HHV and LHV
basis, respectively, they are related as follows:
ZHHV � HHV ¼ ZLHV � LHV ð3bÞ
6.02a
Q:How can we estimate the HHV and LHV of a fuel oil in the absence of its
ultimate analysis?
Copyright © 2003 Marcel Dekker, Inc.

A:Generally, the �API of a fuel oil will be known, and the following expressions canbe used:
HHV ¼ 17,887þ 57:5� �API� 102:2�%S ð4aÞLHV ¼ HHV� 91:23�%H2 ð4bÞ
where %H2 is the percent hydrogen by weight.
%H2 ¼ F � 2122:5�APIþ 131:5
ð5Þ
where
F ¼ 24:50 for 0 � �API � 9
F ¼ 25:00 for 9 � �API � 20
F ¼ 25:20 for 20 � �API � 30
F ¼ 25:45 for 30 � �API � 40
HHV and LHV are in Btu=lb.
6.02b
Q:Determine the HHV and LHV of 30 �API fuel oil in Btu=gal and in Btu=lb.Assume that %S is 0.5.
A:From Eq. (4a),
HHV ¼ 17,887þ 57:5� 30� 102:2� 0:5
¼ 19,651 Btu=lb
To calculate the density or specific gravity of fuel oils we can use the expression
s ¼ 141:5
131:5þ �API¼ 141:5
131:5þ 30¼ 0:876 ð6Þ
Hence
Density ¼ 0:876� 8:335 ¼ 7:3 lb=gal
8.335 is the density of liquids in lb=gal when s ¼ 1.
HHV in Btu/gal ¼ 19,561� 7:3 ¼ 142,795
Copyright © 2003 Marcel Dekker, Inc.
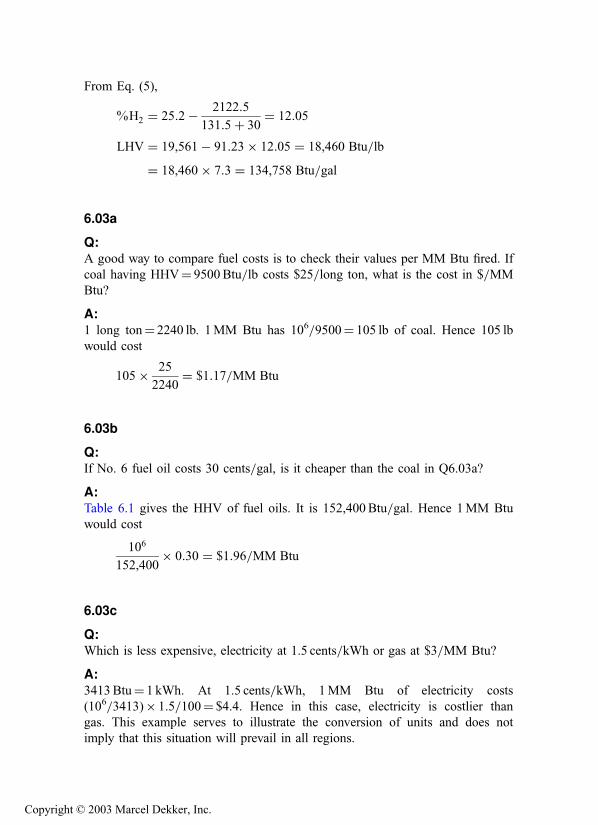
From Eq. (5),
%H2 ¼ 25:2� 2122:5
131:5þ 30¼ 12:05
LHV ¼ 19,561� 91:23� 12:05 ¼ 18,460 Btu=lb
¼ 18,460� 7:3 ¼ 134,758 Btu=gal
6.03a
Q:A good way to compare fuel costs is to check their values per MM Btu fired. If
coal having HHV¼ 9500Btu=lb costs $25=long ton, what is the cost in $=MM
Btu?
A:1 long ton¼ 2240 lb. 1MM Btu has 106=9500¼ 105 lb of coal. Hence 105 lb
would cost
105� 25
2240¼ $1:17=MM Btu
6.03b
Q:If No. 6 fuel oil costs 30 cents=gal, is it cheaper than the coal in Q6.03a?
A:Table 6.1 gives the HHV of fuel oils. It is 152,400Btu=gal. Hence 1MM Btu
would cost
106
152,400� 0:30 ¼ $1:96=MM Btu
6.03c
Q:Which is less expensive, electricity at 1.5 cents=kWh or gas at $3=MM Btu?
A:3413Btu¼ 1 kWh. At 1.5 cents=kWh, 1MM Btu of electricity costs
(106=3413)� 1.5=100¼ $4.4. Hence in this case, electricity is costlier than
gas. This example serves to illustrate the conversion of units and does not
imply that this situation will prevail in all regions.
Copyright © 2003 Marcel Dekker, Inc.
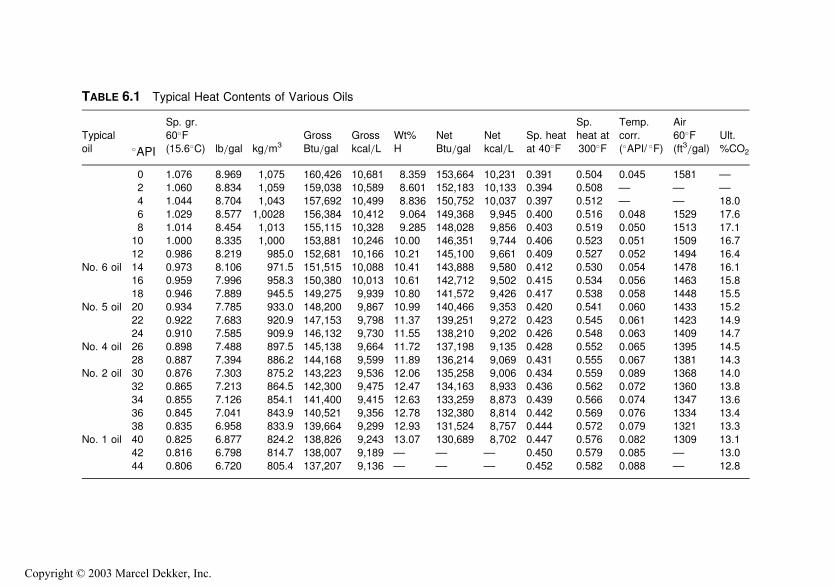
TABLE 6.1 Typical Heat Contents of Various Oils
Typical
oil �API
Sp. gr.
60�F(15.6�C) lb=gal kg=m3
Gross
Btu=gal
Gross
kcal=L
Wt%
H
Net
Btu=gal
Net
kcal=L
Sp. heat
at 40�F
Sp.
heat at
300�F
Temp.
corr.
(�API/ �F)
Air
60�F(ft3=gal)
Ult.
%CO2
0 1.076 8.969 1,075 160,426 10,681 8.359 153,664 10,231 0.391 0.504 0.045 1581 —
2 1.060 8.834 1,059 159,038 10,589 8.601 152,183 10,133 0.394 0.508 — — —
4 1.044 8.704 1,043 157,692 10,499 8.836 150,752 10,037 0.397 0.512 — — 18.0
6 1.029 8.577 1,0028 156,384 10,412 9.064 149,368 9,945 0.400 0.516 0.048 1529 17.6
8 1.014 8.454 1,013 155,115 10,328 9.285 148,028 9,856 0.403 0.519 0.050 1513 17.1
10 1.000 8.335 1,000 153,881 10,246 10.00 146,351 9,744 0.406 0.523 0.051 1509 16.7
12 0.986 8.219 985.0 152,681 10,166 10.21 145,100 9,661 0.409 0.527 0.052 1494 16.4
No. 6 oil 14 0.973 8.106 971.5 151,515 10,088 10.41 143,888 9,580 0.412 0.530 0.054 1478 16.1
16 0.959 7.996 958.3 150,380 10,013 10.61 142,712 9,502 0.415 0.534 0.056 1463 15.8
18 0.946 7.889 945.5 149,275 9,939 10.80 141,572 9,426 0.417 0.538 0.058 1448 15.5
No. 5 oil 20 0.934 7.785 933.0 148,200 9,867 10.99 140,466 9,353 0.420 0.541 0.060 1433 15.2
22 0.922 7.683 920.9 147,153 9,798 11.37 139,251 9,272 0.423 0.545 0.061 1423 14.9
24 0.910 7.585 909.9 146,132 9,730 11.55 138,210 9,202 0.426 0.548 0.063 1409 14.7
No. 4 oil 26 0.898 7.488 897.5 145,138 9,664 11.72 137,198 9,135 0.428 0.552 0.065 1395 14.5
28 0.887 7.394 886.2 144,168 9,599 11.89 136,214 9,069 0.431 0.555 0.067 1381 14.3
No. 2 oil 30 0.876 7.303 875.2 143,223 9,536 12.06 135,258 9,006 0.434 0.559 0.089 1368 14.0
32 0.865 7.213 864.5 142,300 9,475 12.47 134,163 8,933 0.436 0.562 0.072 1360 13.8
34 0.855 7.126 854.1 141,400 9,415 12.63 133,259 8,873 0.439 0.566 0.074 1347 13.6
36 0.845 7.041 843.9 140,521 9,356 12.78 132,380 8,814 0.442 0.569 0.076 1334 13.4
38 0.835 6.958 833.9 139,664 9,299 12.93 131,524 8,757 0.444 0.572 0.079 1321 13.3
No. 1 oil 40 0.825 6.877 824.2 138,826 9,243 13.07 130,689 8,702 0.447 0.576 0.082 1309 13.1
42 0.816 6.798 814.7 138,007 9,189 — — — 0.450 0.579 0.085 — 13.0
44 0.806 6.720 805.4 137,207 9,136 — — — 0.452 0.582 0.088 — 12.8
Copyright © 2003 Marcel Dekker, Inc.
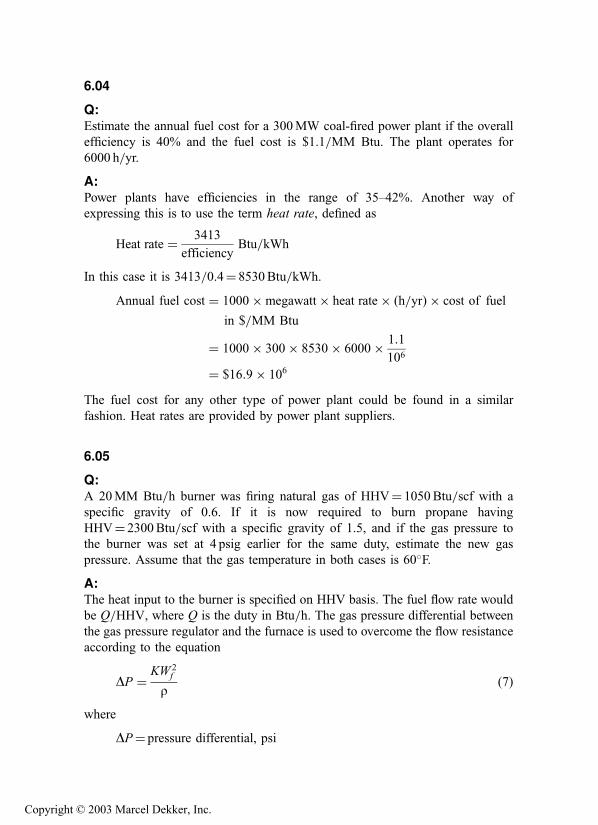
6.04
Q:Estimate the annual fuel cost for a 300MW coal-fired power plant if the overall
efficiency is 40% and the fuel cost is $1.1=MM Btu. The plant operates for
6000 h=yr.
A:Power plants have efficiencies in the range of 35–42%. Another way of
expressing this is to use the term heat rate, defined as
Heat rate ¼ 3413
efficiencyBtu=kWh
In this case it is 3413=0.4¼ 8530Btu=kWh.
Annual fuel cost ¼ 1000�megawatt� heat rate� ðh=yrÞ � cost of fuel
in $=MM Btu
¼ 1000� 300� 8530� 6000� 1:1
106
¼ $16:9� 106
The fuel cost for any other type of power plant could be found in a similar
fashion. Heat rates are provided by power plant suppliers.
6.05
Q:A 20MM Btu=h burner was firing natural gas of HHV¼ 1050Btu=scf with a
specific gravity of 0.6. If it is now required to burn propane having
HHV¼ 2300Btu=scf with a specific gravity of 1.5, and if the gas pressure to
the burner was set at 4 psig earlier for the same duty, estimate the new gas
pressure. Assume that the gas temperature in both cases is 60�F.
A:The heat input to the burner is specified on HHV basis. The fuel flow rate would
be Q=HHV, where Q is the duty in Btu=h. The gas pressure differential betweenthe gas pressure regulator and the furnace is used to overcome the flow resistance
according to the equation
DP ¼ KW 2f
rð7Þ
where
DP¼ pressure differential, psi
Copyright © 2003 Marcel Dekker, Inc.
K ¼ a constant
r¼ gas density¼ 0.075s (s is the gas specific gravity; s¼ 1 for air)
Wf ¼ fuel flow rate in lb=h¼ flow in scfh� 0.075s
Let the subscripts 1 and 2 denote natural gas and propane, respectively.
Wf 1 ¼20� 106
1050� 0:075� 0:6
Wf 2 ¼20� 106
2300� 0:075� 1:5
DP1 ¼ 4; r1 ¼ 0:075� 0:6, and r2 ¼ 0:075� 1:5. Hence, from Eq. (7),
DP1
DP2
¼ W 2f 1r2
W 2f 2r1
¼ 4
DP2
¼ 0:6
ð1050Þ2 �ð2300Þ21:5
or
DP2 ¼ 2:08 psig
Hence, if the gas pressure is set at about 2 psig, we can obtain the same duty. The
calculation assumes that the backpressure has not changed.
6.06
Q:Gas flow measurement using displacement meters indicates actual cubic feet of
gas consumed. However, gas is billed, generally, at reference conditions of 60�Fand 14.65 psia (4 oz). Hence gas flow has to be corrected for actual pressure and
temperature. Plant engineers should be aware of this conversion.
In a gas-fired boiler plant, 1000 cu ft of gas per hour was measured, gas
conditions being 60 psig and 80�F. If the gas has a higher calorific value of
1050Btu=scf, what is the cost of fuel consumed if energy costs $4=MM Btu?
A:The fuel consumption at standard conditions is found as follows.
Vs ¼ VaPa
Ts
PsTað8Þ
Copyright © 2003 Marcel Dekker, Inc.

where
Vs;Va ¼ fuel consumption, standard and actual, cu ft/h
Ts ¼ reference temperature of 520�RTa ¼ actual temperature, �R
Ps;Pa ¼ standard and actual pressures, psia
Vs ¼ 100� ð30þ 14:22Þ � 520
14:65� 540
¼ 2900 scfh
Hence
Energy used¼ 2900� 1050¼ 3.05MM Btu=hCost of fuel¼ 3.05� 4¼ $12.2=h.
If pressure and temperature corrections are not used, the displacement
meter reading can lead to incorrect fuel consumption data.
6.07
Q:Estimate the energy in Btu=h and in kilowatts (kW) for heating 75,000 lb=h of air
from 90�F to 225�F. What is the steam quantity required if 200 psia saturated
steam is used to accomplish the duty noted above? What size of electric heater
would be used?
A:The energy required to heat the air can be expressed as
Q ¼ WaCpDT ð9Þ
where
Q ¼ duty, Btu/h
Wa ¼ air flow, lb/h
Cp ¼ specific heat of air, Btu/lb�F
DT ¼ temperature rise, �F
Cp may be taken as 0.25 for the specified temperature range.
Q ¼ 75,000� 0:25� ð225� 90Þ ¼ 2:53� 106 Btu=h
Copyright © 2003 Marcel Dekker, Inc.

Using the conversion factor 3413Btu¼ 1 kWh, we have
Q ¼ 2:53� 106
3413¼ 741 kW
A 750 kW heater or the next higher size could be chosen.
If steam is used, the quantity can be estimated by dividing Q in Btu=h by
the latent heat obtained from the steam tables (see the Appendix). At 200 psia, the
latent heat is 843 Btu=lb. Hence
Steam required ¼ 2:55� 106
843¼ 3046 lb=h
6.08
Q:Estimate the steam required at 25 psig to heat 20 gpm of 15 �API fuel oil from40�F to 180�F. If an electric heater is used, what should be its capacity?
A:Table 6.2 gives the heat content of fuel oils in Btu=gal [2]. At 180�F, enthalpy is
529Btu=gal, and at 40�F it is 26Btu=gal. Hence the energy absorbed by the fuel
oil is
Q ¼ 20� 60� ð529� 26Þ ¼ 0:6� 106 Btu=h
¼ 0:6� 106
3413¼ 175 kW
The latent heat of steam (from the steam tables) is 934Btu=lb at 25 psig or
40 psia. Hence
Steam required ¼ 0:6� 106
934¼ 646 lb=h
If an electric heater is used, its capacity will be a minimum of 175 kW.
Allowing for radiation losses, we may choose a 200 kW heater.
In the absence of information on fuel oil enthalpy, use a specific gravity of
0.9 and a specific heat of 0.5 Btu=lb �F. Hence the duty will be
Q ¼ 20� 60� 62:40� 0:9
7:48� 0:5� ð180� 40Þ
¼ 0:63� 106 Btu=h
(7.48 is the conversion factor from cubic feet to gallons.)
Copyright © 2003 Marcel Dekker, Inc.

TABLE 6.2 Heat Content (Btu=gal) of Various Oilsa
Gravity, �API at 60�F (15.6�C)
10 15 20 25 30 35 40 45Specific gravity, 60�F=60�F
Temp.
(�F) 1.0000 0.9659 0.9340 0.9042 0.8762 0.8498 0.8251 0.8017
32 0 0 0 0 0 0 0 0
0 0 0 0 0 0 0 060 95 93 92 90 89 87 86 85
965100 237 233 229 226 222 219 215
1065 1062120 310 305 300 295 290 286 281
1116 1112140 384 378 371 366 360 355 349
1169 1164160 460 453 445 438 431 425 418
1236 1223 1217180 538 529 520 511 503 496 488
1293 1278 1272200 617 607 596 587 577 569 560
1371 1352 1335 1327220 697 686 674 663 652 643 633
1434 1412 1393 1384240 779 766 753 741 729 718 707
1498 1474 1452 1442260 862 848 833 820 807 795 783
1563 1537 1513 1502300 1034 1017 999 984 968 954 939
1699 1668 1639 1626400 1489 1463 1439 1416 1393 1372 1352 1333
2088 2064 2041 2018 1997 1977 1958500 1981 1947 1914 1884 1854 1826 1799 1774
2497 2464 2434 2404 2376 2349 2324600 2511 2467 2426 2387 2350 2314 2281 2248
2942 2901 2862 2825 2789 2756 2723700 3078 3025 2974 2927 2881 2837 2796 2756
3478 3425 3374 3327 3281 3237 3196 3156800 3683 3619 3559 3502 3447 3395 3345 3297
4008 3944 3884 3827 3772 3720 3670 3622
aValues in regular type are for liquid; bold values are for vapor.
Copyright © 2003 Marcel Dekker, Inc.

TABLE 6.3 Combustion Constants
Heat of combusionc
Sp gr Btu=cu ft Btu=lbMol. Lb per Cu ft air¼
No. Substance Formula wta cu ftb per lbb 1,000b Gross Netd Gross Netd
1 Carbon C 12.01 — — — — — 14,093g 14,093
2 Hydrogen H2 2.016 0.005327 187.723 0.06959 325.0 275.0 61,100 51,623
3 Oxygen O2 32.000 0.08461 11.819 1.1053 — — — —
4 Nitrogen (atm) N2 28.016 0.07439c 13.443c 0.9718e — — — —
5 Carbon monxide CO 28.01 0.07404 13.506 0.9672 321.8 321.8 4,347 4,347
6 Carbon dioxide CO2 44.01 0.1170 8.548 1.5282 — — — —
Paraffin series CnH2nþ2
7 Methane CH4 16.041 0.04243 23.565 0.5543 1013.2 913.1 23,879 21,520
8 Ethane C2H6 30.067 0.08029c 12.455c 1.04882e 1792 1641 22,320 20,432
9 Propane C3H8 44.092 0.1196c 8.365c 1.5617c 2590 2385 21,661 19,944
10 n-Butane C4H10 58.118 0.1582c 6.321c 2.06654e 3370 3113 21,308 19,680
11 Isobutane C4H10 58.118 0.1582e 6.321e 2.06654e 3363 3105 21,257 19,629
12 n-Pentane C5H12 72.144 0.1904e 5.252e 2.4872c 4016 3709 21,091 19,517
13 Isopentane C5H12 72.144 0.1904e 5.252e 2.4g72e 4008 3716 21,052 19,47g
14 Neopentane C5H12 72.144 0.1904e 5.252e 2.4872e 3993 3693 20,970 19,396
15 n-Hexane C6H14 86.169 0.2274e 4.39ge 2.9704c 4762 4412 20,940 19,403
Olefin series CnH2n
16 Ethylene C2H4 28.051 0.07456 13.412 0.9740 1613.8 1513.2 21,644 20,295
17 Propylene C3H6 42.077 0.1110e 9.007e 1.4504e 2336 2186 21,041 19,691
18 n-Butene (butylene) C4H8 56.102 0.1480e 6.756e 1.9336e 3084 2gg5 20,840 19,496
19 Isobutene C4H8 56.102 0.1480e 6.756e 1.9336e 3068 2g69 20,730 19,382
20 n-Pentene C5H10 70.128 0.1852e 5.400e 2.4190e 3836 3586 20,712 19,363
Aromatic series CnH2n�6
21 Benzene C6H6 76.107 0.2060c 4.852c 2.6920e 3751 3601 1g,210 17,480
22 Toluene C7H8 92.132 0.2431c 4.113e 3.1760e 4484 4284 18,440 17,620
23 Xylene C8H10 106.158 0.2803e 3.567e 3.6618e 5230 4980 18,650 17,760
Miscellaneous gases24 Acetylene C2H2 26.036 0.06971 14.344 0.9107 1499 1448 21,500 20,776
25 Naphthalene C10H8 128.162 0.3384e 2.955e 4.4208e 5854f 5654f 17,298f 16,708f
26 Methyl alcohol CH3OH 32.041 0.0846e 11.820e 1.1052e g67.9 768.0 10,259 9,078
27 Ethyl alcohol C2H5OH 46.067 0.1216e 8.221e 1.5890e 1600.3 1450.5 13,161 11,929
2g Ammonia NH3 17.031 0.0456e 21.914e 0.5961e 441.1 365.1 9,668 8,001
29 Sulfur S 32.06 — — — — — 3,983 3,983
30 Hydrogen sulfide H2S 34.076 0.09109e 10.979e 1.1g98e 647 596 7,100 6,545
31 Sulfur dioxide SO2 64.06 0.1733 5.770 2.264 — — — —
32 Water vapor H2O 18.016 0.04758e 21.017e 0.6215e — — — —
33 Air — 26.9 0.07655 13.063 1.0000 — — — —
All gas volumes corrected to 60�F and 30 in. Hg dry. For gases saturated with water at 60�F, 1.73% of the Btu value must be
deducted.aCalculated from atomic weights given in Journal of the American Chemical Society, February 1937.bDensities calculated from values given in gL at 0�C and 760mmH in the International Critical Tables allowing for the known
deviations from the gas laws. Where the coefficient of expansion was not available, the assumed value was taken as 0.0037
per �C. Compare this with 0.003662, which is the coefficient for a perfect gas. Where no densities were available, the
volume of the mole was taken as 22.4115L.cConverted to mean Btu per lb (1=180 of the heat per lb of water from 32 to 212�F) from data by Frederick D. Rossini,
National Bureau of Standards, letter of April 10, 1937, except as noted.
Copyright © 2003 Marcel Dekker, Inc.

Cu ft per cu ft of combustible Lb per lb of combustible
Experimental
Required for
combustion Flue products
Required for
combustion Flue products
error in
heat of
combustion
O2 N2 Air CO2 H2O N2 O2 N2 Air CO2 H2O N2 (� %)
— — — — — — 2.664 8.863 11.527 3.664 — 8.863 0.012
0.5 1.882 2.382 — 1.0 1.882 7.937 26.407 34.344 — 8.937 26.407 0.015
— — — — — — — — — — — — —
— — — — — — — — — — — — —
0.5 1.882 2.382 1.0 — 1.882 0.571 1.900 2.471 1.571 — 1.900 0.045
— — — — — — — — — — — — —
2.0 7.528 9.528 1.0 2.0 7.528 3.990 13.275 17.265 2.744 2.246 13.275 0.033
3.5 13.175 16.675 2.0 3.0 13.175 3.725 12.394 16.119 2.927 1.798 12.394 0.030
5.0 18.821 23.821 3.0 4.0 18.821 3.629 12.074 15.703 2.994 1.634 12.074 0.023
6.5 24.467 30.967 4.0 5.0 24.467 3.579 11.908 15.487 3.029 1.550 11.908 0.022
6.5 24.467 30.967 4.0 5.0 24.467 3.579 11.908 15.487 3.029 1.550 11.908 0.019
8.0 30.114 38.114 5.0 6.0 30.114 3.548 11.805 15.353 3.050 1.498 11.805 0.025
8.0 30.114 38.114 5.0 6.0 30.114 3.548 11.805 15.353 3.050 1.498 11.805 0.071
8.0 30.114 38.114 5.0 6.0 30.114 3.548 11.805 15.353 3.050 1.498 11.805 0.11
9.5 35.760 45.260 6.0 7.0 35.760 3.528 11.738 15.266 3.064 1.464 11.738 0.05
3.0 11.293 14.293 2.0 2.0 11.293 3.422 11.385 14.807 3.138 1.285 11.385 0.021
4.5 16.939 21.439 3.0 3.0 16.939 3.422 11.385 14.807 3.138 1.285 11.385 0.031
6.0 22.585 28.585 4.0 4.0 22.585 3.422 11.385 14.807 3.138 1.285 11.385 0.031
6.0 22.585 28.585 4.0 4.0 22.585 3.422 11.385 14.807 3.138 1.285 11.385 0.031
7.5 28.232 35.732 5.0 5.0 28.232 3.422 11.385 14.807 3.138 1.285 11.385 0.037
7.5 28.232 35.732 6.0 3.0 28.232 3.073 10.224 13.297 3.381 0.692 10.224 0.12
9.0 33.878 32.g78 7.0 4.0 33.878 3.126 10.401 13.527 3.344 0.782 10.401 0.21
10.5 39.524 50.024 8.0 5.0 39.524 3.165 10.530 13.695 3.317 0.849 10.530 0.36
2.5 9.411 11.911 2.0 1.0 9.411 3.073 10.224 13.297 3.381 0.692 10.224 0.16
12.0 45.170 57.170 10.0 4.0 45.170 2.996 9.968 12.964 3.434 0.562 9.968 —
1.5 5.646 7.146 1.0 2.0 5.646 1.498 4.984 6.482 1.374 1.125 4.984 0.027
3.0 11.293 14.293 2.0 3.0 11.293 2.084 6.934 9.018 1.922 1.170 6.934 0.030
0.75 2.823 3.573 — 1.5 3.323 1.409 4.688 6.097 — 1.587 5.511 0.088
SO2
— — — — — — 0.998 3.287 4.285 1.998 — 3.287 0.071
SO2 SO2
1.5 5.646 7.146 1.0 1.0 5.646 1.409 4.688 6.097 1.880 0.529 4.688 0.30
— — — — — — — — — — — — —
— — — — — — — — — — — — —
— — — — — — — — — — — — —
dDeduction from gross to net heating value determined by deducting 18,919Btu=lb mol water in the products of combustion.
Osborne, Stimson and Ginnings, Mechanical Engineering, p. 163, March 1935, and Osborne, Stimson, and Flock, National
Bureau of Standards Research Paper 209.eDenotes that either the density or the coefficient of expansion has been assumed. Some of the materials cannot exist as
gases at 60�F and 30 in.Hg pressure, in which case the values are theoretical ones given for ease of calculation of gas
problems. Under the actual concentrations in which these materials are present their partial pressure is low enough to keep
them as gases.fFrom third edition of Combustion.
Adapted from Ref. 8.
Copyright © 2003 Marcel Dekker, Inc.

6.09a
Q:Natural gas having CH4 ¼ 83:4%;C2H6 ¼ 15:8%, and N2 ¼ 0:8% by volume
is fired in a boiler. Assuming 15% excess air, 70�F ambient temperature, and 80%
relative humidity, perform detailed combustion calculations and determine flue
gas analysis.
A:From Chapter 5 we know that air at 70�F and 80% RH has a moisture content of
0.012 lb=lb dry air. Table 6.3 can be used to figure air requirements of various
fuels. For example, we see that CH4 requires 9.53mol of air per mole of CH4, and
C2H6 requires 16.68mol.
Let us base our calculations on 100mol of fuel. The theoretical dry air
required will be
83:4� 9:53þ 16:68� 15:8 ¼ 1058:3 mol
Considering 15% excess,
Actual dry air¼ 1.15� 1058.3¼ 1217mol
Excess air¼ 0.15� 1058.3¼ 158.7mol
Excess O2 ¼ 158.7� 0.21¼ 33.3mol
Excess N2 ¼ 1217� 0.79¼ 961mol
(Air contains 21% by volume O2, and the rest is N2.)
Moisture in air ¼ 1217� 29� 0:012
18¼ 23:5 mol
(We multiplied moles of air by 29 to get its weight, and then the water quantity
was divided by 18 to get moles of water.)
Table 6.3 can also be used to get the moles of CO2;H2O, N2 and O2 [3].
CO2 ¼ 1� 83:4þ 2� 15:8 ¼ 115 mol
H2O ¼ 2� 83:4þ 3� 15:8þ 23:5 ¼ 237:7 mol
O2 ¼ 33:3 mol
N2 ¼ 961þ 0:8 ¼ 961:8 mol
The total moles of flue gas produced is 115 þ 237.7 þ 33.3 þ 961.8 ¼ 1347.8.
Hence
%CO2 ¼115
1347:8� 100 ¼ 8:5
Similarly,
%H2O ¼ 17:7; %O2 ¼ 2:5; %N2 ¼ 71:3
Copyright © 2003 Marcel Dekker, Inc.

The analysis above is on a wet basis. On a dry flue gas basis,
%CO2 ¼ 8:5� 100
100� 17:7¼ 10:3%
Similarly,
%O2 ¼ 3:0%; %N2 ¼ 86:7%
To obtain wda,wwa,wdg, and wwg, we need the density of the fuel or the molecular
weight, which is
1
100� ð83:4� 16þ 15:8� 30þ 0:8� 28Þ ¼ 18:30
wda ¼ 1217� 29
100� 18:3¼ 19:29 lb dry air=lb fuel
wwa ¼ 19:29þ 23:5� 18
18:3� 100¼ 19:52 lb wet air=lb fuel
wdg ¼115� 44þ 33:3� 32þ 961� 28
1830
¼ 18 lb dry gas=lb fuel
wwg ¼115� 44þ 33:3� 32þ 237:7� 18þ 961:8� 28
1830
¼ 20:40 lb wet gas=lb fuel
This procedure can be used when the fuel analysis is given. More often, plant
engineers will be required to estimate the air needed for combustion without a
fuel analysis. In such situations, the MM Btu basis of combustion and calcula-
tions will come in handy. This is discussed in Q6.10a.
6.09b
Q:For the case stated in Q6.09a, estimate the partial pressure of water vapor, pw, and
of carbon dioxide, pc, in the flue gas. Also estimate the density of flue gas at
300�F.
A:The partial pressures of water vapor and carbon dioxide are important in the
determination of nonluminous heat transfer coefficients.
pw ¼ volume of water vapor
total flue gas volume¼ 0:177 atm ¼ 2:6 psia
pc ¼volume of carbon dioxide
total flue gas volume¼ 0:085 atm ¼ 1:27 psia
Copyright © 2003 Marcel Dekker, Inc.
To estimate the gas density, its molecular weight must be obtained (see Q5.05).
MW ¼PðMWi � yiÞ¼ 28� 71:3þ 18� 17:7þ 32� 2:5þ 44� 8:5
100
¼ 27:7
Hence, from Eq. (6),
rg ¼ 27:7� 492� 14:7
359� 760� 14:7¼ 0:05 lb=cu ft
The gas pressure was assumed to be 14.7 psia. In the absence of flue gas
analysis, we can obtain the density as discussed in Q5.03.
rg ¼40
760¼ 0:052 lb=cu ft
6.10a
Q:Discuss the basis for the million Btu method of combustion calculations.
A:Each fuel such as natural gas, coal, or oil requires a certain amount of
stoichiometric air per MM Btu fired (on HHV basis). This quantity does not
vary much with the fuel analysis and has therefore become a valuable method of
evaluating combustion air and flue gas quantities produced when fuel gas analysis
is not available.
For solid fuels such as coal and oil, the dry stoichiometric air wda in lb=lbfuel can be obtained from
wda ¼ 11:53� Cþ 34:34� H2 �O2
8
� �þ 4:29� S
where C;H2;O2, and S are carbon, hydrogen, oxygen, and sulfur in the fuel in
fraction by weight.
For gaseous fuels, wda is given by
wda ¼ 2:47� COþ 34:34� H2 þ 17:27� CH4
þ 13:3� C2H2 þ 14:81� C2H4
þ 16:12� C2H6 � 4:32� O2
Copyright © 2003 Marcel Dekker, Inc.

Example 1
Let us compute the amount of air required per MM Btu fired for fuel oil.
C¼ 0.875, H¼ 0.125, and �API¼ 28.
Solution. From (4a),
HHV ¼ 17,887þ 57:5� 28� 102:2� 0
¼ 19,497 Btu=lb
The amount of air in lb=lb fuel from the above equation is
wda ¼ 11:53� 0:875þ 34:34� 0:125
¼ 14:38 lb=lb fuel
1MM Btu of fuel fired requires (1� 106)=19,497¼ 51.28 lb of fuel. Hence, from
the above, 51.28 lb of fuel requires
51:28� 14:38 ¼ 737 lb of dry air
Table 6.4 shows a range of 735–750. To this must be added excess air; the effect
of moisture in the air should also be considered.
Example 2
Let us take the case of natural gas with the following analysis: methane¼ 83.4%,
ethane¼ 15.8%, and nitrogen¼ 0.8%.
Solution. Converting this to percent weight basis, we have
Fuel % vol MW Col 2� col 3 % wt
CH4 18.3 16 1334.4 72.89C2H6 15.8 30 474 25.89N2 0.8 28 22.4 1.22
Let us compute the air required in lb=lb fuel.
From Table 6.3,
Air required ¼ 17:265� 0:7289þ 16:119� 0:2589
¼ 16:75 lb=lb fuel
HHV of fuel ¼ 0:7289� 23,876þ 0:2589� 22,320
¼ 23,181 Btu=lb
where 23,876 and 22,320 are HHV of methane and ethane from Table 6.3.
Copyright © 2003 Marcel Dekker, Inc.

The amount of fuel equivalent to 1MM Btu would be (1� 106)=23,181¼ 43.1 lb, which requires 43.1� 16.75¼ 722 lb of air, or 1MM Btu
fired would need 722 lb of dry air; this is close to the value indicated in Table 6.4.
Let us take the case of 100% methane and see how much air it needs for
combustion. From Table 6.3, air required per pound of methane is 17.265 lb, and
its heating value is 23,879Btu=lb. In this case 1MM Btu is equivalent to
(1� 106)=23,879¼ 41.88 lb of fuel, which requires 41.88� 17.265¼ 723 lb of
dry air.
Taking the case of propane, 1 lb requires 15.703 lb of air.
1 MM Btu ¼ 1� 106
21,661¼ 46:17 lb fuel
This would require 46.17� 15.703¼ 725 lb of air.
Thus for all fossil fuels we can come up with a good estimate of theoretical
dry air per MM Btu fired on HHV basis, and gas analysis does not affect this
value significantly. The amount of air per MM Btu is termed A and is shown in
Table 6.4 for various fuels.
6.10b
Q:A fired heater is firing natural gas at an input of 75MM Btu=h on HHV basis.
Determine the dry combustion air required at 10% excess air and the amount of
flue gas produced if the HHV of fuel is 20,000Btu=lb.
A:From Table 6.4, A is 730 lb=MM Btu. Hence the total air required is
Wa ¼ 75� 1:1� 730 ¼ 60,200 lb=h
TABLE 6.4 Combustion Constant A For Fuels
No. Fuel A
1 Blast furnace gas 5752 Bagasse 6503 Carbon monoxide gas 670
4 Refinery and oil gas 7205 Natural gas 7306 Furnace oil and lignite 745–750
7 Bituminous coals 7608 Anthracite 7809 Coke 800
Copyright © 2003 Marcel Dekker, Inc.

The flue gas produced is
Wg ¼ Wa þWf ¼ 60,200þ 106
20,000¼ 60,250 lb=h
These values can be converted to volume rates at any temperature using the
procedure described in Chapter 5.
The MM Btu method is quite accurate for engineering purposes such as fan
selection and sizing of ducts and air and gas systems. Its advantage is that fuel
analysis need not be known, which is generally the case in power and process
plants. The efficiency of heaters and boilers can also be estimated using the MM
Btu method of combustion calculations.
6.10c
Q:A coal-fired boiler is firing coal of HHV¼ 9500Btu=lb at 25% excess air. If
ambient conditions are 80�F, relative humidity 80%, and flue gas temperature
300�F, estimate the combustion air in lb=lb fuel, the volume of combustion air in
cu ft=lb fuel, the flue gas produced in lb=lb fuel, and the flue gas volume in cu
ft=lb fuel.
A:Because the fuel analysis is not known, let us use the MM Btu method. From
Table 6.4, A¼ 760 for coal. 1MM Btu requires 760� 1.25¼ 950 lb of dry air.
At 80% humidity and 80�F, air contains 0.018 lb of moisture per pound of air
(Chap. 5). Hence the wet air required per MM Btu fired is 950� 1.018 lb. Also,
1MM Btu fired equals 106=9500¼ 105 lb of coal. Hence
wda ¼ dry air, lb=lb fuel ¼ 950
105¼ 9:05
wwa ¼ wet air, lb=lb fuel ¼ 950� 1:018
105¼ 9:21
ra ¼ density of air at 80�F ¼ 29� 492
359� 540
¼ 0:0736 lb=cu ft ðsee Chap: 5;Q5:03Þ:Hence
Volume of air ¼ 9:21
0:0736¼ 125 cu ft=lb fuel
rg ¼ density of flue gas ¼ 40
760¼ 0:0526 lb=cu ft
wdg ¼ dry flue gas in lb=lb fuel ¼ 950þ 105
105¼ 10:05
Volume of flue gas, cu ft=lb fuel ¼ 10:05
0:0526¼ 191
Copyright © 2003 Marcel Dekker, Inc.

6.11
Q:Is there a way to figure the excess air from flue gas CO2 readings?
A:Yes. A good estimate of excess air E in percent can be obtained from the equation
E ¼ 100� K1
%CO2
� 1
� �ð10aÞ
%CO2 is the percent of carbon dioxide in dry flue gas by volume, and K1 is a
constant depending on the type of fuel, as seen in Table 6.5. For example, if
%CO2 ¼ 15 in flue gas in a coal-fired boiler, then for bituminous coal
(K1 ¼ 18.6),
E ¼ 100� 18:6
15� 1
� �¼ 24%
6.12
Q:Discuss the significance of %CO2 and %O2 in flue gases.
A:Excess air levels in flue gas can be estimated if the %CO2 and %O2 in dry flue
gas by volume are known. The higher the excess air, the greater the flue gas
quantity and the greater the losses. Plant engineers should control excess air
levels to help control plant operating costs. The cost of operation with high excess
air is discussed in Q6.13.
A formula that is widely used to figure the excess air is [1]
E ¼ 100� O2 � CO=2
0:264� N2 � ðO2 � CO=2Þ ð10bÞ
TABLE 6.5 K1 Factors for Fuels
Fuel type K1
Bituminous coals 18.6Coke 20.5
Oil 15.5Refinery gas and gas oil 13.4Natural gas 12.5
Blast furnace gas 25.5
Source: Ref. 1.
Copyright © 2003 Marcel Dekker, Inc.

where O2;CO, and N2 are the oxygen, carbon monoxide, and nitrogen in dry flue
gas, vol%, and E is the excess air, %.
Another formula that is quite accurate is [1]
E ¼ K2 �O2
21� O2
ð10cÞ
where K2 is a constant that depends on the type of fuel (see Table 6.6).
6.13
Q:In a natural gas boiler of capacity 50MM Btu=h (HHV basis), the oxygen level in
the flue gas is reduced from 3.0% to 2.0%. What is the annual savings in
operating costs if fuel costs $4=MM Btu? The HHV of the fuel is 19,000 Btu=lb.The exit gas temperature is 500�F, and the ambient temperature is 80�F.
A:The original excess air is 90� 3=ð21� 3Þ ¼ 15% (see Q6.12). The excess air is
now
E ¼ 90� 2:0
21� 2¼ 9:47%
With 15% excess, the approximate air required (see Q6.10a) is 50� 746�1.15¼ 42,895 lb=h.
Flue gas ¼ 42,895þ 50� 106
19,000¼ 45,256 lb=h
TABLE 6.6 Constant k2 Used inEq. (10c)
Fuel K2
Carbon 100Hydrogen 80
Carbon monoxide 121Sulfur 100Methane 90
Oil 94.5Coal 97Blast furnace gas 223
Coke oven gas 89.3
Source: Ref. 1.
Copyright © 2003 Marcel Dekker, Inc.

With 9.47% excess air,
Air required ¼ 50� 746� 1:0947 ¼ 40,832 lb=h
Flue gas produced ¼ 40,832þ 50� 106
19,000
¼ 43,463 lb=h
Reduction in heat loss ¼ ð45,526 � 43,463Þ � 0:25� ð500� 80Þ¼ 0:22 MM Btu=h
This is equivalent to an annual savings of 0.22� 4� 300� 24¼ $6336. (We
assumed 300 days of operation a year.) This could be a significant savings
considering the life of the plant. Hence plant engineers should operate the plant
realizing the implications of high excess air and high exit gas temperature.
Oxygen levels can be continuously monitored and recorded and hooked up to
combustion air systems in order to operate the plant more efficiently. (It may be
noted that exit gas temperature will also be reduced if excess air is reduced. The
calculation above indicates the minimum savings that can be realized.)
6.14
Q:Fuels are often interchanged in boiler plants because of relative availability and
economics. It is desirable, then, to analyze the effect on the performance of the
system. Discuss the implications of burning coal of 9800Btu=lb in a boiler
originally intended for 11,400 Btu=lb coal.
A:Let us assume that the duty does not change and that the efficiency of the unit is
not altered. However, the fuel quantity will change. Combustion air required,
being a function of MM Btu fired, will not change, but the flue gas produced will
increase. Let us prepare a table.
Coal 1 Coal 2
Fuel HHV, Btu=lb 11,400 9800Fuel fired per MM Btu (106=HHV) 87 102Air required per MM Btu (25% excess air) 760� 1.25¼ 950 760� 1.25¼ 950Flue gas, lb 1037 1052
Ratio of flue gas 1 1.015
We can use the same fans, because the variation in flue gas produced is not
significant enough to warrant higher gas pressure drops. We must look into other
Copyright © 2003 Marcel Dekker, Inc.

aspects, such as the necessity of higher combustion air temperature (due to higher
moisture in the fuel), ash concentration, and fouling characteristics of the new
fuel. If a different type of fuel is going to be used, say oil, this will be a major
change, and the fuel-handling system’s burners and furnace design will have to be
reviewed. The gas temperature profiles will change owing to radiation character-
istics, and absorption of surfaces such as superheaters and economizers will be
affected. A discussion with the boiler design engineers will help.
6.15
Q:What is meant by combustion temperature of fuels? How is it estimated?
A:The adiabatic combustion temperature is the maximum temperature that can be
attained by the products of combustion of fuel and air. However, because of
dissociation and radiation losses, this maximum is never attained. Estimation of
temperature after dissociation requires solving several equations. For purposes of
estimation, we may decrease the adiabatic combustion temperature by 3–5% to
obtain the actual combustion temperature.
From an energy balance it can be shown that
tc ¼LHVþ Aa� HHV� Cpa � ðta � 80Þ=106ð1�%ash=100þ Aa� HHV=106Þ � Cpg
ð11Þ
where
LHV;HHV¼ lower and higher calorific value of fuel, Btu=lbA¼ theoretical air required per million Btu fired, lb
a¼ excess air factor¼ 1 þ E=100ta; tc ¼ temperature of air and combustion temperature, �F
Cpa;Cpg ¼ specific heats of air and products of combustion, Btu=lb �F
For example, for fuel oil with combustion air at 300�F, LHV¼ 17,000Btu=lb, HHV¼ 18,000 Btu=lb, a¼ 1.15, and A¼ 745 (see Table 6.4). We have
tc ¼17,000þ 745� 1:15� 18,000� 0:25� ð300� 80Þ=106
ð1þ 745� 1:15� 18,000=106Þ � 0:32
¼ 3400�F
Cpa and Cpg were taken as 0.25 and 0.32, respectively.
Copyright © 2003 Marcel Dekker, Inc.
6.16a
Q:How is the ash concentration in flue gases estimated?
A:Particulate emission data are needed to size dust collectors for coal-fired boilers.
In coal-fired boilers, about 75% of the ash is carried away by the flue gases and
25% drops into the ash pit. The following expression may be derived using the
MM Btu method of combustion calculation [5]:
Ca ¼240,000� ð% ash=100Þ
T � ½7:6� 10�6 � HHV� ð100þ EÞ þ 1� ð% ash=100Þ� ð12aÞ
where
Ca ¼ ash concentration, grains=cu ft
E¼ excess air, %
T ¼ gas temperature, �RHHV¼ higher heating value, Btu=lb
Example
If coals of HHV¼ 11,000 Btu=lb having 11% ash are fired in a boiler with 25%
excess air and the flue gas temperature is 850�R, determine the ash concentration.
Solution. Substituting into Eq. (12a), we have
Ca ¼240,000� 0:11
850� ð7:6� 10�6 � 11,000� 125þ 1� 0:11Þ¼ 2:75 grains=cu ft
6.16b
Q:How do you convert the ash concentration in the flue gas in wt% to grains=acf orgrains=scf?
A:Flue gases from incineration plants or solid fuel boilers contain dust or ash, and
often these components are expressed in mass units such as lb=h or wt%, whereas
engineers involved in selection of pollution control equipment prefer to work in
terms of grains=acf or grains=scf (actual and standard cubic feet). The relation-
ship is
Ca ¼ 0:01� A� 7000� r ¼ 70A ð12bÞ
Copyright © 2003 Marcel Dekker, Inc.

where
r¼ gas density, lb=cu ft¼ 39.5=(460 þ t)
t¼ gas temperature, �FCa ¼ ash content, grains=acf or grains=scf depending on whether density is
computed at actual temperature or at 60�FA¼ ash content, wt%
The expression for density is based on atmospheric flue gases having a molecular
weight of 28.8 (see Q5.03).
Flue gases contain 1.5 wt% ash. The concentration in grains=acf at 400�F is
Ca ¼ 70� 1:5� 39:5
860¼ 4:8 grains=acf
and at 60�F,
Ca ¼ 70� 1:5� 39:5
520¼ 7:98 grains=scf
6.17
Q:Discuss the importance of the melting point of ash in coal-fired boilers. How is it
estimated?
A:In the design of steam generators and ash removal systems, the ash fusion
temperature is considered an important variable. Low ash fusion temperature may
cause slagging and result in deposition of molten ash on surfaces such as
superheaters and furnaces. The furnace will then absorb less energy, leading to
higher furnace exit gas temperatures and overheating of superheaters.
A quick estimate of ash melting temperature in �C can be made using the
expression [6]
tm ¼ 19� Al2O3 þ 15� ðSiO2 þ TiO2Þþ 10� ðCaOþMgOÞþ 6� ðFe2O3 þ Na2Oþ K2OÞ
where tm is the fusion temperature in �C, and the rest of the terms are percent ash
content of oxides of aluminum, silicon, titanium, calcium, magnesium, iron,
sodium, and potassium.
Copyright © 2003 Marcel Dekker, Inc.

Example
Analysis of a given ash indicates the following composition:
Al2O3 ¼ 20%; SiO2 þ TiO2 ¼ 30%
Fe2O3 þ Na2Oþ K2O ¼ 20%; CaOþMgO ¼ 15%
Find the fusion temperature.
Solution. Substituting into Eq. (13), we find that tm ¼ 1100�C.
6.18a
Q:What is the emission of SO2 in lb=MM Btu if coals of HHV¼ 11,000Btu=lb and
having 1.5% sulfur are fired in a boiler?
A:The following expression gives e, the emission of SO2 in lb=MM Btu:
e ¼ 2� 104S
HHVð14Þ
where S is the percent sulfur in the fuel.
e ¼ 2� 104 � 1:5
11,000¼ 2:73 lb=MM Btu
If an SO2 scrubbing system of 75% efficiency is installed, the exiting SO2
concentration will be 0.25� 2.73¼ 0.68 lb=MM Btu.
6.18b
Q:What is the SO2 level in ppm (parts per million) by volume if the coals in Q6.18a
are fired with 25% excess air?
A:We have to estimate the flue gas produced. Using the MM Btu method,
wg ¼106
11,000þ 1:25� 760 ¼ 1041 lb=MM Btu
Copyright © 2003 Marcel Dekker, Inc.

Let the molecular weight be 30, which is a good estimate in the absence of flue
gas analysis. Then,
Moles of flue gas ¼ 1041
30¼ 34:7 per MM Btu fired
Moles of SO2 ¼2:73
64
¼ 0:042 (from Q6.18a and Table 5.1)
(64 is the molecular weight of SO2. Dividing weight by molecular weight gives
the moles.)
Hence ppm of SO2 in flue gas will be 0.042� 106=34.7¼ 1230 ppm.
6.18c
Q:If 5% of the SO2 gets converted to SO3, estimate the ppm of SO3 in the flue gas.
A:
Moles of SO3 ¼ 0:05� 2:73
80¼ 0:0017 per MM Btu
Hence
ppm by volume of SO3 ¼0:0017
34:7� 106 ¼ 49 ppm
(80 is the molecular weight of SO3.)
6.19a
Q:How is the efficiency of a boiler or a fired heater determined?
A:The estimation of the efficiency of a boiler or heater involves computation of
several losses such as those due to flue gases leaving the unit, unburned fuel,
radiation losses, heat loss due to molten ash, and so on. Readers may refer to the
ASME Power Test Code [7] for details. Two methods are widely used, one based
on the measurement of input and output and the other based on heat losses. The
latter is preferred, because it is easy to use.
Copyright © 2003 Marcel Dekker, Inc.
There are two ways of stating the efficiency, one based on HHV and the
other on LHV. As discussed in Q6.01,
ZHHV � HHV ¼ ZLHV � LHV
The various losses are [1], on an HHV basis,
1. Dry gas loss, L1:
L1 ¼ 24wdg
tg � ta
HHVð15aÞ
2. Loss due to combustion of hydrogen and moisture in fuel, L2:
L2 ¼ ð9� H2 þW Þ � ð1080þ 0:46tg � taÞ� 100
HHV
3. Loss due to moisture in air, L3:
L3 ¼ 46Mwda
tg � ta
HHVð15cÞ
4. Radiation loss, L4. The American Boiler Manufacturers Association
(ABMA) chart [7] may be referred to to obtain this value. A quick
estimate of L4 is
L4 ¼ 100:62�0:42 logQ ð15dÞFor Eqs. (15a)–(15d),
wdg ¼ dry flue gas produced, lb=lb fuel
wda ¼ dry air required, lb=lb fuel
H2;W ¼ hydrogen and moisture in fuel, fraction
M ¼moisture in air, lb=lb dry air (see Q5.09b)
tg; ta ¼ temperatures of flue gas and air, �FQ¼ duty in MM Btu=h
5. To losses L1–L4 must be added a margin or unaccounted loss, L5.
Hence efficiency becomes
ZHHV ¼ 100� ðL1 þ L2 þ L3 þ L4 þ L5Þ ð15eÞNote that combustion calculations are a prerequisite to efficiency determination.
If the fuel analysis is not available, plant engineers can use the MM Btu method
to estimate wdg rather easily and then estimate the efficiency (see Q6.20).
The efficiency can also be estimated on LHV basis. The various losses
considered are the following.
Copyright © 2003 Marcel Dekker, Inc.

1. Wet flue gas loss:
wwg Cp
tg � ta
HHVð15f Þ
(Cp, gas specific heat, will be in the range of 0.26–0.27 for wet flue
gases.)
2. Radiation loss (see Q6.23)
3. Unaccounted loss, margin
Then
ZLHV ¼ 100� ðsum of the above three lossesÞOne can also convert ZHHV to ZLHV using Eq. (3b) (see Q6.01).
6.19b
Q:Coals of HHV¼ 13,500Btu=lb and LHV¼ 12,600Btu=lb are fired in a boiler
with 25% excess air. If the exit gas temperature is 300�F and ambient temperature
is 80�F, determine the efficiency on HHV basis and on LHV basis.
A:From the MM Btu method of combustion calculations, assuming that moisture in
air is 0.013 lb=lb dry air,
wwg ¼1:013� 760� 1:25þ 106=13,500
106=13,500
¼ 1036
74¼ 14:0
(760 is the constant obtained from Table 6.4.) Hence
wet flue gas loss ¼ 100� 14:0� 0:26
� 300� 80
12,600
¼ 6:35%
Let radiation and unaccounted losses be 1.3%. Then
ZLHV ¼ 100� ð6:35þ 1:3Þ ¼ 92:34%
ZHHV ¼ 92:34� 12,600
13,500¼ 86:18%
(Radiation losses vary from 0.5% to 1.0% in large boilers and may go up to 2.0%
in smaller units. The major loss is the flue gas loss.)
Copyright © 2003 Marcel Dekker, Inc.

6.19c
Q:Determine the efficiency of a boiler firing the fuel given in Q6.09a at 15% excess
air. Assume radiation loss¼ 1%, exit gas temperature¼ 400�F, and ambient
temperature¼ 70�F. Excess air and relative humidity are the same as in Q6.09a
(15% and 80%).
A:Results of combustion calculations are already available.
Dry flue gas ¼ 18 lb=lb fuel
Moisture in air ¼ 19:52� 19:29 ¼ 0:23 lb=lb fuel
Water vapor formed due to combustion of fuel ¼20:4� 18� 0:23 ¼ 2:17 lb=lb fuel
HHV ¼ 83:4� 1013:2þ 15:8� 1792
100¼ 1128 Btu=cu ft
Fuel density at 60�F¼ 18.3=379¼ 0.483 lb=cu ft, so
HHV ¼ 1128
0:0483¼ 23,364 Btu=lb
The losses are
1. Dry gas loss,
L1 ¼ 100� 18� 0:24� 400� 70
23,364¼ 6:1%
2. Loss due to combustion of hydrogen and moisture in fuel,
L2 ¼ 100� 2:17� 1080þ 0:46� 400� 70
23,364
¼ 11:1%
3. Loss due to moisture in air,
L3 ¼ 100� 0:23� 0:46� 400� 70
23,364¼ 0:15%
4. Radiation loss¼ 1.0%
5. Unaccounted losses and margin¼ 0%
Total losses ¼ 6:1þ 11:1þ 0:15þ 1:0 ¼ 18:35%
Hence
Efficiency on HHV basis ¼ 100� 18:35 ¼ 81:65%
One can convert this to LHV basis after computing the LHV.
Copyright © 2003 Marcel Dekker, Inc.
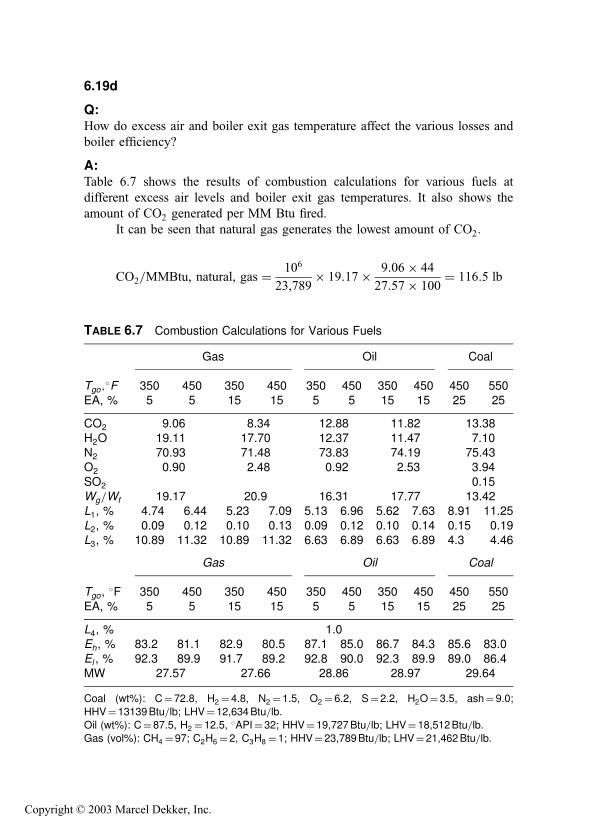
6.19d
Q:How do excess air and boiler exit gas temperature affect the various losses and
boiler efficiency?
A:Table 6.7 shows the results of combustion calculations for various fuels at
different excess air levels and boiler exit gas temperatures. It also shows the
amount of CO2 generated per MM Btu fired.
It can be seen that natural gas generates the lowest amount of CO2.
CO2=MMBtu, natural, gas ¼ 106
23,789� 19:17� 9:06� 44
27:57� 100¼ 116:5 lb
TABLE 6.7 Combustion Calculations for Various Fuels
Gas Oil Coal
Tgo;�F 350 450 350 450 350 450 350 450 450 550
EA, % 5 5 15 15 5 5 15 15 25 25
CO2 9.06 8.34 12.88 11.82 13.38
H2O 19.11 17.70 12.37 11.47 7.10N2 70.93 71.48 73.83 74.19 75.43O2 0.90 2.48 0.92 2.53 3.94
SO2 0.15Wg=Wf 19.17 20.9 16.31 17.77 13.42L1, % 4.74 6.44 5.23 7.09 5.13 6.96 5.62 7.63 8.91 11.25
L2, % 0.09 0.12 0.10 0.13 0.09 0.12 0.10 0.14 0.15 0.19L3, % 10.89 11.32 10.89 11.32 6.63 6.89 6.63 6.89 4.3 4.46
Gas Oil Coal
Tgo,�F 350 450 350 450 350 450 350 450 450 550
EA, % 5 5 15 15 5 5 15 15 25 25
L4, % 1.0Eh, % 83.2 81.1 82.9 80.5 87.1 85.0 86.7 84.3 85.6 83.0
El , % 92.3 89.9 91.7 89.2 92.8 90.0 92.3 89.9 89.0 86.4MW 27.57 27.66 28.86 28.97 29.64
Coal (wt%): C¼72.8, H2 ¼4.8, N2 ¼1.5, O2 ¼ 6.2, S¼2.2, H2O¼ 3.5, ash¼ 9.0;
HHV¼ 13139Btu=lb; LHV¼ 12,634Btu=lb.
Oil (wt%): C¼87.5, H2 ¼ 12.5, �API¼32; HHV¼19,727Btu=lb; LHV¼ 18,512Btu=lb.
Gas (vol%): CH4 ¼97; C2H6 ¼2, C3H8 ¼1; HHV¼ 23,789Btu=lb; LHV¼21,462Btu=lb.
Copyright © 2003 Marcel Dekker, Inc.

(The above is obtained by converting the volumetric analysis to weight basis
using the molecular weights of CO2 and the flue gas.) For oil, CO2 genera-
ted¼ 162.4 lb, and for coal, 202.9 lb.
6.20
Q:A fired heater of duty 100MM Btu=h (HHV basis) firing No. 6 oil shows the
following dry flue gas analysis:
CO2 ¼ 13:5%; O2 ¼ 2:5%; N2 ¼ 84%
The exit gas temperature and ambient temperature are 300�F and 80�F, respec-tively. If moisture in air is 0.013 lb=lb dry air, estimate the efficiency of the unit
on LHV and HHV basis. LHV¼ 18,400Btu=lb and HHV¼ 19,500Btu=lb.
A:Because the fuel analysis is not known, let us estimate the flue gas produced by
the MM Btu method. First, compute the excess air, which is
E ¼ 94:5� 2:5
21� 2:5¼ 12:8%
The factor 94.5 is from Table 6.6 (see Q6.12). The wet flue gas produced is
745� 1:128� 1:013
106þ 106
19,500
106=19,500
¼ 17:6 lb=lb fuel
Hence
Wet gas loss ¼ 100� 17:6� 0:26� 300� 80
18,400¼ 5:47%
The radiation loss on HHV basis can be approximated by Eq. (15d):
Radiation loss ¼ 100:62�0:42 logQ ¼ 0:60%
Q ¼ 100 MM Btu=h
Let us use 1.0% on LHV basis, although this may be a bit high. Hence the
efficiency on LHV basis is 1007 6.47¼ 93.53%. The efficiency on HHV basis
would be [Eq. (3b)]
ZHHV � HHV ¼ ZLHV � LHV
Copyright © 2003 Marcel Dekker, Inc.

or
ZHHV ¼ 95:53� 18,400
19,500¼ 88:25
Thus, even in the absence of fuel ultimate analysis, the plant personnel can check
the efficiency of boilers and heaters based on operating data.
6.21
Q:How is the loss due to incomplete combustion such as the formation of CO
determined?
A:Efforts must be made by the boiler and burner designers to ensure that complete
combustion takes place in the furnace. However, because of various factors such
as size of fuel particles, turbulence, and availability of air to fuel and the mixing
process, some carbon monoxide will be formed, which means losses. If CO is
formed from carbon instead of CO2, 10,600 Btu=lb is lost. This is the difference
between the heat of reaction of the two processes
Cþ O2 ! CO2 and Cþ O2 ! CO
The loss in Btu=lb is given by [1]
L ¼ CO
COþ CO2
� 10,160� C
where C is the carbon in the fuel, fraction by weight, and CO and CO2 are vol%
of the gases.
Example
Determine the losses due to formation of CO if coal with HHV of 12,000Btu=lbis fired in a boiler, given that CO and CO2 in the flue gas are 1.5% and 17% and
the fuel has a carbon content of 56%.
Solution. Substituting into the equation given above,
L ¼ 1:5
18:5� 10,160� 0:56
12,000¼ 0:038
or L¼ 3.8% on HHV basis (dividing loss in Btu=lb by HHV).
Copyright © 2003 Marcel Dekker, Inc.

6.22
Q:Is there a simple formula to estimate the efficiency of boilers and heaters if the
excess air and exit gas temperature are known and the fuel analysis is not
available?
A:Boiler efficiency depends mainly on excess air and the difference between the flue
gas exit temperature and the ambient temperature. The following expressions
have been derived from combustion calculations for typical natural gas and oil
fuels. These may be used for quick estimations.
For natural gas:
ZHHV,% ¼ 89:4� ð0:001123þ 0:0195� EAÞ � DT ð16aÞZLHV,% ¼ 99:0� ð0:001244þ 0:0216� EAÞ � DT ð16bÞ
For fuel oils:
ZHHV,% ¼ 92:9� ð0:001298þ 0:01905� EAÞ � DT
ZLHV,% ¼ 99:0� ð0:001383þ 0:0203� EAÞ � DT
where
EA¼ excess air factor (EA¼ 1.15 means 15% excess air)
DT ¼ difference between exit gas and ambient temperatures
Example
Natural gas at 15% excess air is fired in a boiler, with exit gas temperature 280�Fand ambient temperature 80�F. Determine the boiler efficiency. EA ¼ 1:15 and
DT ¼ 280� 80 ¼ 200�F.
Solution.
ZHHV ¼ 89:4� ð0:001123þ 0:0195� 1:15Þ� ð280� 80Þ ¼ 84:64%
ZLHV ¼ 99:0� ð0:001244þ 0:0216� 1:15Þ� ð280� 80Þ ¼ 93:78%
The above equations are based on 1% radiation plus unaccounted losses.
Copyright © 2003 Marcel Dekker, Inc.

6.23
Q:The average surface temperature of the aluminum casing of a gas-fired boiler was
measured to be 180�F when the ambient temperature was 85�F and the wind
velocity was 5mph. The boiler was firing 50,000 scfh of natural gas with
LHV¼ 1075Btu=scf. Determine the radiation loss on LHV basis if the total
surface area of the boiler was 2500 ft2. Assume that the emissivity of the
casing¼ 0.1.
A:This example shows how radiation loss can be obtained from the measurement of
casing temperatures. The wind velocity is 5mph¼ 440 fpm. From Q8.51 we see
that the heat loss q in Btu=ft2 h will be
q ¼ 0:173� 10�8 � 0:1� ½ð460þ 180Þ4 � ð460þ 85Þ4�
þ 0:296� ð180� 85Þ1:25 �ffiffiffiffiffiffiffiffiffiffiffiffiffiffiffiffiffiffi440þ 69
69
r¼ 252 Btu=ft2 h
ð17Þ
The total heat loss will be 2500� 252¼ 0.63� 106 Btu=h. The radiation loss on
LHV basis will be 0.63� 106� 100=(50,000� 1075)¼ 1.17%. If the HHV of
the fuel were 1182Btu=scf, the radiation loss on HHV basis would be
0.63� 1182=1075¼ 1.06%.
6.24
Q:How does the radiation loss vary with boiler duty or load? How does this affect
the boiler efficiency?
A:The heat losses from the surface of a boiler will be nearly the same at all loads if
the ambient temperature and wind velocity are the same. Variations in heat losses
can occur owing to differences in the gas temperature profile in the boiler, which
varies with load. However, for practical purposes this variation can be considered
minor. Hence the heat loss as a percent will increase as the boiler duty decreases.
The boiler exit gas temperature decreases with a decrease in load or duty
and contributes to some improvement in efficiency, which is offset by the increase
in radiation losses. Hence there will be a slight increase in efficiency as the load
increases, and after a certain load, efficiency decreases.
The above discussion pertains to fired water tube or fire tube boilers and not
waste heat boilers, which have to be analyzed for each load because the gas flow
Copyright © 2003 Marcel Dekker, Inc.

and inlet gas temperature can vary significantly with load depending on the type
of process or application.
6.25a
Q:Discuss the importance of dew point corrosion in boilers and heaters fired with
fuels containing sulfur.
A:During the process of combustion, sulfur in fuels such as coal, oil, and gas is
converted to sulfur dioxide. Some portion of it (1–5%) is converted to sulfur
trioxide, which can combine with water vapor in the flue gas to form gaseous
sulfuric acid. If the surface in contact with the gas is cooler than the acid dew
point, sulfuric acid can condense on it, causing corrosion. ADP (acid dew point)
is dependent on several factors, such as excess air, percent sulfur in fuel, percent
conversion of SO2 to SO3, and partial pressure of water vapor in the flue gas.
Manufacturers of economizers and air heaters suggest minimum cold-end
temperatures that are required to avoid corrosion. Figures 6.1 and 6.2 are typical.
Sometimes the minimum fluid temperature, which affects the tube metal
temperature, is suggested. The following equation gives a conservative estimate
of the acid dew point [8]:
Tdp ¼ 1:7842þ 0:0269 log pw � 0:129 log pSO3
þ 0:329 log pw � log pSO3
ð18aÞ
where
Tdp ¼ acid dew point, K
pw ¼ partial pressure of water vapor, atm
pSO3¼ partial pressure of sulfur trioxide, atm
Table 6.8 gives typical pSO3values for various fuels and excess air. Q6.18c
shows how ppmSO3 can be computed from which pSO3is obtained.
A practical way to determine Tdp is to use a dew point meter. An estimation
of the cold-end metal temperature can give an indication of possible corrosion.
6.25b
Q:How is the dew point of an acid gas computed?
A:Table 6.9 shows the dew point correlations for various acid gases [9,11].
Copyright © 2003 Marcel Dekker, Inc.

Flue gas from an incinerator has the following analysis (vol%): H2O¼ 12,
SO2 ¼ 0.02, HCl¼ 0.0015 and the rest oxygen and nitrogen. Gas pressure
¼ 10 in. wg. Compute the dew points of sulfuric and hydrochloric acids given
that 2% of SO2 converts to SO3. In order to use the correlations, the gas pressures
must be converted to mmHg. Atmospheric pressure¼ 10 in. wg¼ 10=407¼0.02457 atmg or 1.02457 atm abs.
pH2O¼ 0:12� 1:02457� 760 ¼ 93:44 mmHg
ln PH2O¼ 4:537
PHCl ¼ 0:0015� 1:0245� 760 ¼ 0:1168 mmHg
ln pHCl ¼ �2:1473
Partial pressures of sulfuric acid and SO3 are equal. Hence
PSO3¼ 0:02� 0:0002� 760� 1:0245 ¼ 0:0031 mmHg
ln PSO3¼ �5:7716
Substituting into the equations, we obtain the following.
FIGURE 6.1 The relationship between SO3 and ADT. (Courtesy of LandCombustion Inc.)
Copyright © 2003 Marcel Dekker, Inc.

For hydrochloric acid:
1000
Tdp¼ 3:7368� 0:1591� 4:537þ 0:0326� 2:1473
� 0:00269� 4:537� 2:1473 ¼ 3:0588
or
Tdp ¼ 327 K ¼ 54�C ¼ 129�F
FIGURE 6.2 Limiting tube metal temperatures to avoid external corrosion ineconomizers and air heaters when burning fuels containing sulfur. (From Ref. 13,
with permission.)
TABLE 6.8 SO3 in Flue Gas (ppm)
Sulfur (%)
Fuel Excess air (%) 0.5 1.0 2.0 3.0 4.0 5.0
Oil 5 2 3 3 4 5 611 6 7 8 10 12 14
Coal 25 3–7 7–14 14–28 20–40 27–54 33–66
Copyright © 2003 Marcel Dekker, Inc.

For sulfuric acid:
1000
Tdp¼ 2:276� 0:0294� 4:537þ 0:0858� 5:7716
� 0:0062� 4:537� 5:7716 ¼ 2:4755
or
Tdp ¼ 404 K ¼ 131�C ¼ 268�F
The dew points of other gases can be obtained in a similar manner.
6.25c
Q:Does the potential for acid dew point corrosion decrease if the gas temperature at
the economizer is increased?
TABLE 6.9 Dew Points of Acid Gasesa
Hydrobromic acid
1000=Tdp ¼ 3.56397 0.1350 ln PH2O70.0398 ln PHBrþ 0.00235 ln PH2O
ln PHBr
Hydrochloric acid
1000=Tdp ¼ 3.73687 0.1591 ln PH2O70.0326 ln PHCl
þ 0.00269 ln PH2Oln PHCl
Nitric acid
1000=Tdp ¼ 3.66147 0.1446 ln PH2O70.0827 ln PHNO3þ 0.00756 ln PH2O
ln PHNO3
Sulfurous acid
1000=Tdp ¼ 3.95267 0.1863 ln PH3Oþ 0.000867 ln PSO2
7 0.000913 ln PH2Oln PSO2
Sulfuric acid
1000=Tdp ¼ 2.27670.0294 ln PH2O70.0858 ln PH3SO4þ 0.0062 ln PH2O
ln PH2SO4
aTdp is dew point temperature (K), and P is partial pressure (mmHg).
Compared with published data, the predicted dew points are within
about 6K of actual values except for H2SO4, which is within about 9K.
Source: HCl, HBr, HNO3 and SO2 correlations were derived from
vapor–liquid equilibrium data. The H2SO4 correlation is from Ref. 5.
Copyright © 2003 Marcel Dekker, Inc.

A:Acid dew points were computed in Q6.25a. If the tube wall temperatures can be
maintained above the dew point, then condensation of vapors is unlikely.
However, the tube wall temperature in a gas-to-liquid heat exchanger such as
the economizer is governed by the gas film heat transfer coefficient rather than the
tube-side water coefficient, which is very high.
It can be shown by using the electrical analogy and neglecting the effects of
fouling that [9]
tm ¼ to � ðto � tiÞhi
hi þ ho
where
tm ¼ tube wall temperature
to ¼ gas- and tube-side fluid temperature
hi ¼ tube-side heat transfer coefficient
ho ¼ gas-side heat transfer coefficient
In an economizer, hi is typically about 1000Btu=ft2 h �F and h0 is about
15Btu=ft2 h �F.Let us assume that water temperature ti ¼ 250�F and compute the wall
temperature tm for two gas temperatures, 350�F and 750�F.
tm1 ¼ 350� ð350� 250Þ 10001015
¼ 252�F
tm2 ¼ 750� ð750� 250Þ 10001015
¼ 258�F
Hence for a variation of 400�F in gas temperature, the tube wall temperature
changes by only 6�F because the gas film heat transfer coefficient is so low
compared to the water-side coefficient. Even with finned tubes the difference
would be marginal.
We see that if we specify a higher stack gas temperature when selecting or
designing an economizer we cannot avoid corrosion concerns if the water
temperature is low or close to the acid dew point. A better way is to increase
the water temperature entering the economizer by raising the deaerator pressure
or by using a heat exchanger to preheat the water.
6.25d
Q:Using the correlation given below, evaluate the sulfuric acid dew point.
Tdp ¼ 203:25þ 27:6 log PH2Oþ 10:83 logPSO3
þ 1:06 ðlogPSO3þ 8Þ2:19
ð18bÞ
Copyright © 2003 Marcel Dekker, Inc.

The partial pressures are in atmospheres and dew point is in degrees Celsius.
A:Using the data from Q6.25b [14],
PSO3¼ 0:0031mmHg ¼ 4:1� 10�6 atm logPSO3
¼ �5:3872
PH2O¼ 93:44 mmHg ¼ 0:1229 atm logPH2O
¼ �0:9104
Tdp ¼ 203:25� 27:6� 0:9104� 10:83� 5:3872þ 1:06� ð2:6128Þ2:19
¼ 128:4�C, or 263�F
which agrees with the other correlation. However, it should be mentioned that
these calculations have some uncertainty, and experience should be taken as the
guide.
6.26a
Q:How do you convert pollutants such as NOx and CO from gas turbine exhaust
gases from mass units such as lb=h to ppm?
A:With strict emission regulations, plant engineers and consultants often find it
necessary to relate mass and volumetric units of pollutants such as NOx and CO.
In gas turbine cogeneration and combined cycle plants, in addition to the
pollutants from the gas turbine itself, one has to consider the contributions
from duct burners or auxiliary burners that are added to increase the steam
generation from the HRSGs (heat recovery steam generators).
One can easily obtain the total lb=h of NOx or CO in the exhaust gas.
However, regulations refer to NOx and CO in ppmvd (parts per million volume
dry) referred to 15% oxygen in the gas. The conversion can be done as follows.
If w lb=h is the flow rate of NOx (usually reported as NO2) in a turbine
exhaust flow of W lb=h, the following expression gives NOx in volumetric units
on dry basis [9].
V ¼ 100� ðw=46Þ=ðW=MWÞ100�%H2O
ð19Þ
where
%H2O¼ volume of water vapor
MW¼molecular weight of the exhaust gases
Copyright © 2003 Marcel Dekker, Inc.

The value of V obtained with Eq. (19) must be converted to 15% oxygen on dry
basis to give ppmvd of NOx:
Vn ¼V � ð21� 15Þ � 106
21� 100�%O2=ð100�%H2OÞ¼ V � F ð20Þ
where %O2 is the oxygen present in the wet exhaust gases and factor F converts
V to 15% oxygen basis, which is the usual basis of reporting emissions. Similarly,
CO emission in ppmvd can be obtained as
Vc ¼ 1:642� Vn (for the same w lb=h rateÞbecause the ratio of the molecular weights of NO2 and CO is 1.642.
Example
Determine the NOx and CO concentrations in ppmvd, 15% oxygen dry basis if
25 lb=h of NOx and 15 lb=h of CO are present in 550,000 lb=h of turbine exhaust
gas that has the following analysis by volume percent (usually argon is added to
the nitrogen content):
CO2 ¼ 3:5; H2O ¼ 10; N2 ¼ 75; O2 ¼ 11:5
Solution. First,
MW ¼ ð3:5� 44þ 10� 18þ 75� 28þ 11:5� 32Þ=100 ¼ 28
Let us compute NOx on dry basis in the exhaust.
V ¼ 100� ð25=46Þð550,000=28Þ=ð100� 10Þ ¼ 0:00003074
F ¼ 106 � ð21� 15Þ21� ½100=ð100� 10Þ� � 11:5
¼ 0:73� 106
Hence
Vn ¼ 0:00003074� 0:73� 106 ¼ 22:4 ppmvd
Similarly, Vc ¼ (15=25)� 1.642� 22.4¼ 22.0 ppmvd.
6.26b
Q:How can the emissions due to NOx and CO in fired boilers be converted from
ppm to lb=MM Btu or vice versa [10]?
A:Packaged steam generators firing gas or oil must limit emissions of pollutants in
order to meet state and federal regulations. Criteria on emissions of common
Copyright © 2003 Marcel Dekker, Inc.
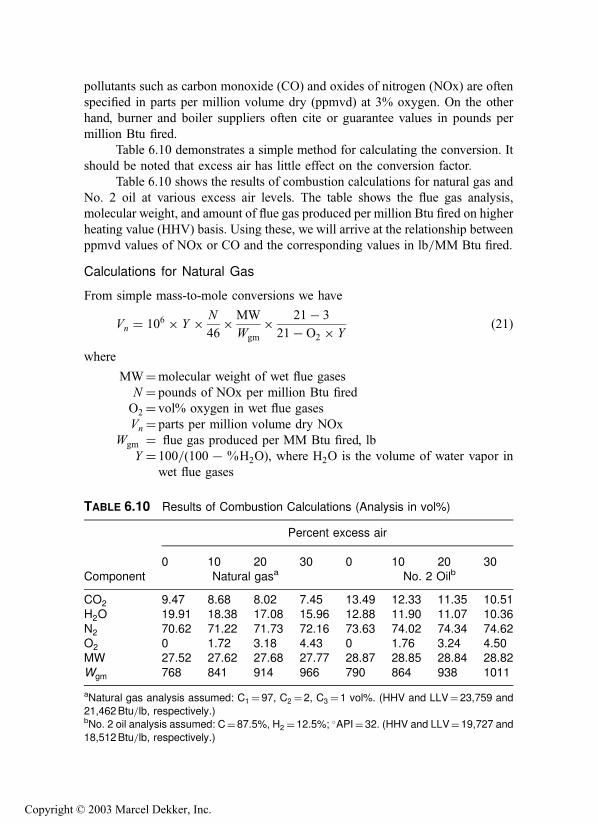
pollutants such as carbon monoxide (CO) and oxides of nitrogen (NOx) are often
specified in parts per million volume dry (ppmvd) at 3% oxygen. On the other
hand, burner and boiler suppliers often cite or guarantee values in pounds per
million Btu fired.
Table 6.10 demonstrates a simple method for calculating the conversion. It
should be noted that excess air has little effect on the conversion factor.
Table 6.10 shows the results of combustion calculations for natural gas and
No. 2 oil at various excess air levels. The table shows the flue gas analysis,
molecular weight, and amount of flue gas produced per million Btu fired on higher
heating value (HHV) basis. Using these, we will arrive at the relationship between
ppmvd values of NOx or CO and the corresponding values in lb=MM Btu fired.
Calculations for Natural Gas
From simple mass-to-mole conversions we have
Vn ¼ 106 � Y � N
46�MW
Wgm
� 21� 3
21� O2 � Yð21Þ
where
MW¼molecular weight of wet flue gases
N ¼ pounds of NOx per million Btu fired
O2 ¼ vol% oxygen in wet flue gases
Vn ¼ parts per million volume dry NOx
Wgm ¼ flue gas produced per MM Btu fired, lb
Y ¼ 100=(1007%H2O), where H2O is the volume of water vapor in
wet flue gases
TABLE 6.10 Results of Combustion Calculations (Analysis in vol%)
Percent excess air
0 10 20 30 0 10 20 30Component Natural gasa No. 2 Oilb
CO2 9.47 8.68 8.02 7.45 13.49 12.33 11.35 10.51H2O 19.91 18.38 17.08 15.96 12.88 11.90 11.07 10.36
N2 70.62 71.22 71.73 72.16 73.63 74.02 74.34 74.62O2 0 1.72 3.18 4.43 0 1.76 3.24 4.50MW 27.52 27.62 27.68 27.77 28.87 28.85 28.84 28.82
Wgm 768 841 914 966 790 864 938 1011
aNatural gas analysis assumed: C1 ¼ 97, C2 ¼ 2, C3 ¼1 vol%. (HHV and LLV¼ 23,759 and
21,462Btu=lb, respectively.)bNo. 2 oil analysis assumed: C¼87.5%, H2 ¼12.5%; �API¼32. (HHV and LLV¼ 19,727 and
18,512Btu=lb, respectively.)
Copyright © 2003 Marcel Dekker, Inc.

From Table 6.10; for zero excess air:
Wgm ¼ ð106=23,789Þ � 18:3 ¼ 769
Y ¼ 100=ð100� 19:91Þ ¼ 1:248
MW ¼ 27:53; O2 ¼ 0
Substituting these into Eq. (21) we have
Vn ¼ 106� 1:248� N � 27:52� 18
46� 769� 21¼ 832 N
Similarly, to obtain ppmvd CO (parts per million volume dry CO), one would use
28 instead of 46 in the denominator. Thus the molecular weight of NOx would be
46 and the calculated molecular weight of CO would be 28.
Ve ¼ 1367 CO
where CO is the pounds of CO per MM Btu fired on higher heating value (HHV)
basis.
Now repeat the calculations for 30% excess air:
Wgm ¼ 986:6; Y ¼ 100
100� 15:96¼ 1:189
MW ¼ 27:77; O2 ¼ 4:43
Vn ¼ 106 � 1:189� N
46� 27:77
986:6
� 18
21� ð4:43� 1:189Þ ¼ 832N
Thus, independent of excess air, we obtain 832 as the conversion factor for NOx
and 1367 for CO.
Similarly, for No. 2 oil and using values from Table 6.10,
Vn ¼ 783N and Vc ¼ 1286 CO
Example
If a natural gas burner generates 0.1 lb of NOx per MM Btu fired, then the
equivalent would equal 832� 0.1¼ 83 ppmvd.
6.26c
Q:How can the emissions of unburned hydrocarbons (UHCs) be converted from
lb=MM Btu to ppmv basis?
Copyright © 2003 Marcel Dekker, Inc.

A:Refer to Table 6.10, which shows the results of combustion calculations for oil
and gaseous fuels at various excess air levels. We can obtain UHC emissions on
ppmv basis if lb=MM Btu values are known.
Let us assume that U is the emission of UHC (treated as methane) in
lb=MM Btu in flue gases of natural gas at 20% excess air. Using Eq. (21) for
converting from mass to volume units,
Vu ¼106 � Y �MW� ð21� 3Þ16�Wgm � ð21� O2 � Y Þ
MW¼ 16 for UHC and 27.68 for flue gases, water vapor in flue gases¼ 17.08
vol% at 20% excess air for natural gas, Wgm ¼ 914 lb=MM Btu, and % oxygen
wet¼ 3.18. Hence,
Vu ¼ U � 106 � 100
82:92
� 27:68� 18
16� 914� ð21� 3:18� 100=82:92Þ ¼ 2394U ppmvd
For excess air at 10% excess air, MW¼ 27.62 for flue gases, water vapor¼ 18.38
vol%, oxygen wet¼ 1.72 vol% Wgm ¼ 841.
Vu ¼ U � 106 � 100
82:62� 27:62� 18
16� 841� ð21� 1:72� 100=82:62Þ¼ 2365U ppmvd
Hence, if the UHC value is 0.1 lb=MM Btu for natural gas, it is equivalent to
about 237 ppmv.
For No. 2 oil at 20% excess air, Wgm ¼ 938, oxygen¼ 3.24, MW flue
gases¼ 28.84, water vapor¼ 11.07 vol%.
Vu ¼ U � 106 � 100
88:93� 28:84� 18
16� 938� ð21� 3:24� 100=88:93Þ¼ 2240U ppmvd
6.26d
Q:Convert SOx values from lb=MM Btu to ppmvd.
Copyright © 2003 Marcel Dekker, Inc.

A:Each pound of sulfur in fuel converts to 2 lb of SO2. Using natural gas at 20%
excess air, S lb=MM Btu of SO2 is equivalent to
Vs ¼ S � 106 � 100
82:92� 27:68� 18
64� 914� ð21� 3:18� 100=82:92Þ¼ 598S ppmvd
0.1 lb=MM Btu of SOx is equivalent to 60 ppmv. [We are simply using Eq. (21)
and substituting for MW and Y .]
Similarly, for No. 2 oil at 20% excess air;
Vs ¼ S � 106 � 100
88:93� 28:84� 18
64� ð21� 3:24� 100=82:92Þ ¼ 534S ppmvd
6.26e
Q:A gas turbine HRSG has the following data:
Exhaust gas flow¼ 500,000 lb=h at 900�FGas analysis vol%; CO2 ¼ 3;H2O ¼ 7;N2 ¼ 75;O2 ¼ 15. The exhaust
gas has 9 lb=h of NOx and CO. The HRSG is fired to 1500�F using natural gas
consisting of vol% methane¼ 97, ethane¼ 2, propane¼ 1. Fuel input¼ 90MM
LHV. HHV of fuel¼ 23,790Btu=lb, and LHV¼ 21,439Btu=lb. The burner
contributes 0.05 lb=MM Btu of NOx and CO. Also see what happens when the
burner contributes 0.1 lb=MM Btu of these pollutants. Flue gas analysis after
combustion vol% CO2 ¼ 4:42, H2O ¼ 9:78, N2 ¼ 73:91, O2 ¼ 11:86, and flue
gas flow¼ 504,198 lb=h. Compute the NOx and CO levels in ppmvd corrected to
15% oxygen before and after the burner.
A:We have to convert the mass flow of NOx and CO to volumetric units and correct
for 15% oxygen dry basis.
At the burner inlet, using Eqs. (19) and (20),
ppmvd NOx ¼ 9
46� 100
93� 28:38
500,000� 106 � 21� 15
21� 15� 100=93¼ 14:7
In this example, the molecular weights of NOx¼ 46, flue gas¼ 28.38. The mass
of CO remains the same, so ppmvd CO¼ (46=28)� 14.7¼ 24.2.
At the burner exit; the mass of NOx in the exhaust gases after combus-
tion is
9þ 90� 23,790
21,439� 0:05 ¼ 14 lb=h
Copyright © 2003 Marcel Dekker, Inc.

Because the burner heat input is on LHV basis and emissions are on HHV basis,
we correct the values using the above expression.
ppmvd NOx ¼ 14
46� 100
90:22� 28:2
504,198� 106
� 21� 15
21� 11:86� 100=90:22¼ 14:4
ppmvd CO ¼ ð46=28Þ � 14 ¼ 23:7
With 0.1 lb=MM Btu emissions from the burner, NOx ppmvd¼ 19.5 and CO
ppmvd¼ 32.1 Thus both the burner contribution and the initial pollutant levels in
the turbine exhaust gases affect the ppmv values after combustion. ppmvd values
after the burner can be lower or higher than the inlet ppmvd values, though in
terms of mass flow they will always be higher.
6.26f
Q:Steam generator emissions are usually referred to 3% oxygen dry basis, and gas
turbine or HRSG emissions are referred to 15% oxygen dry basis. However, in
operation, different excess air rates are used that generate flue gases with different
oxygen levels. What is the procedure for converting from actual to 3% oxygen
basis?
A:
ppm (@ 3% dry) ¼ ppm (actual)� 21� 3
21� O2 ðactualÞIf dry oxygen in flue gases is 1.7% and 12 ppm of a pollutant is measured, then at
3% oxygen,
Emission ¼ 12� 21� 3
21� 1:7¼ 11:2 ppm
6.27a
Q:In gas turbine cogeneration and combined cycle projects, the heat recovery steam
generator may be fired with auxiliary fuel in order to generate additional steam.
One of the frequently asked questions concerns the consumption of oxygen in the
exhaust gas versus fuel quantity fired. Would there be sufficient oxygen in the
exhaust to raise the exhaust gas to the desired temperature?
Copyright © 2003 Marcel Dekker, Inc.

A:Gas turbine exhaust gases typically contain 14–16% oxygen by volume compared
to 21% in air. Hence generally there is no need for additional oxygen to fire
auxiliary fuel such as gas or oil or even coal while raising its temperature. (If the
gas turbine is injected with large amounts of steam, the oxygen content will be
lower, and we should refer the analysis to a burner supplier.) Also, if the amount
of fuel fired is very large, then we can run out of oxygen in the gas stream.
Supplementary firing or auxiliary firing can double or even quadruple the steam
generation in the boiler compared to its unfired mode of operation [1]. The energy
Q in Btu=h required to raise Wg lb=h of exhaust gases from a temperature of t1 to
t2 is given by
Q ¼ Wg � ðh2 � h1Þwhere
h1; h2 ¼ enthalpy of the gas at t1 and t2, respectively
The fuel quantity in lb=h is Wf in Q=LHV, where LHV is the lower heating
value of the fuel in Btu=lb.If 0% volume of oxygen is available in the exhaust gases, the equivalent
amount of air Wa in the exhaust is [9]
Wa ¼100�Wg � O� 32
23� 100� 29:5
In this equation we are merely converting the moles of oxygen from volume to
weight basis. A molecular weight of 29.5 is used for the exhaust gases, and 32 for
oxygen. The factor 100=23 converts the oxygen to air.
Wa ¼ 0:0471�Wg � O ð22ÞNow let us relate the air required for combustion with fuel fired. From Q5.03–
Q.5.05 we know that each MM Btu of fuel fired on HHV basis requires a constant
amount A of air. A is 745 for oil and 730 for natural gas; thus, 106=HHV lb of fuel
requires A lb of air. Hence Q=LHV lb of fuel requires
Q
LHV� A� HHV
106lb air
and this equals Wa from (22).
Q
LHV� A� HHV
106¼ Wa ¼ 0:0471Wg � O ð23Þ
or
Q ¼ 0:0471�Wg � O� 106 � LHV
A� HHVð24Þ
Copyright © 2003 Marcel Dekker, Inc.

Now for natural gas and fuel oils, it can be shown that LHV=ðA� HHVÞ ¼0:00124. Substituting into Eq. (24), we get
Q ¼ 58:4�Wg � O ð25ÞThis is a very important equation, because it relates the energy input by the fuel
(on LHV basis) with oxygen consumed.
Example
It is desired to raise the temperature of 150,000 lb=h of turbine exhaust gases
from 950�F to 1575�F in order to double the output of the waste heat boiler. If the
exhaust gases contain 15 vol% of oxygen, and the fuel input is 29MM Btu=h(LHV basis), determine the oxygen consumed.
Solution. From Eq. (24),
O ¼ 29� 106
150,000� 58:4¼ 3:32%
Hence if the incoming gases had 15 vol% of oxygen, even after the firing of
29MM Btu=h we would have 157 3.32¼ 11.68% oxygen in the exhaust gases.
A more accurate method would be to use a computer program [9], but the
above equation clearly tells us if there is likely to be a shortage of oxygen.
6.27b
Q:150,000 lb=h of turbine exhaust gases at 900�F having a gas analysis (vol%) of
CO2 ¼ 3;H2O ¼ 7;N2 ¼ 75 and O2 ¼ 15 enters a duct burner, and 35MM
Btu=h (LHV) of natural gas is fired. Determine the exhaust gas analysis after the
burner. Use 100% methane as fuel gas analysis for illustrative purposes.
A:From Table 6.3, the LHV¼ 21,520Btu=lb. Hence fuel fired¼ 35� 106=21,520¼ 1626 lb=h.
From combustion basics,
CH4 þ 2O2 ! CO2 þ 2H2O
So 16 lb of methane requires 64 lb of oxygen and yields 44 lb of CO2 and 36 lb of
water vapor, using molecular weights of 16 for methane, 32 for oxygen, 44 for
carbon dioxide, and 18 for water vapor. Hence 1626 lb=h of methane will
consume
1626� ð64=16Þ ¼ 6504 lb=h of oxygen
Copyright © 2003 Marcel Dekker, Inc.

Also, it will increase CO2 by
1626� ð44=16Þ ¼ 4471 lb=h
H2O will increase by
1626� ð36=16Þ ¼ 3659 lb=h
Convert the volume percent in incoming exhaust gases to weight percent
basis as follows. The molecular weight of incoming gases is 0:03� 44þ0:07� 18þ 0:75� 28þ 0:15� 32 ¼ 28:38
Fraction by weight of CO2 ¼ 0:03� 44=28:38 ¼ 0:0465
H2O ¼ 0:07� 18=28:38 ¼ 0:0444
N2 ¼ 75� 28=28:38 ¼ 0:74
O2 ¼ 0:15� 32=28:38 ¼ 0:1691
The amounts of these gases in incoming exhaust gas in lb=h:
CO2 ¼ 150,000� 0:0465 ¼ 6975 lb=h
H2O ¼ 150,000� 0:0444 ¼ 6660 lb=h
N2 ¼ 150,000� 0:74 ¼ 111,000 lb=h
O2 ¼ 150,000� 0:1691 ¼ 25,365 lb=h
The final products of combustion will have
CO2 ¼ 6975þ 4471 ¼ 11,446 lb=h
H2O ¼ 6660þ 3659 ¼ 10,319 lb=h
N2 ¼ 111,000
O2 ¼ 25,365� 6504 ¼ 18,861 lb=h
Total exhaust gas flow ¼ 11,446 þ 10,319þ 111,000þ 18,861
¼ 151,626 lb=h
which matches the sum of exhaust gas flow and the fuel gas fired.
To convert the final exhaust gas to vol% analysis, we have to obtain the
number of moles of each constituent.
Moles of CO2 ¼ 11,446=44 ¼ 260:1
H2O ¼ 10,319=18 ¼ 573:2
N2 ¼ 111,000=28 ¼ 3964:3
O2 ¼ 18,861=32 ¼ 589:4
Total moles ¼ 5387
Copyright © 2003 Marcel Dekker, Inc.

Hence
CO2 ¼ 260:1=5387 ¼ 0:0483, or 4:83% by volume
Similarly,
H2O ¼ 573:2=5387 ¼ 0:1064, or 10:64 vol%
N2 ¼ 3964:2=5387 ¼ 0:7359; or 73:59 vol%
O2 ¼ 589:4=5387 ¼ 0:1094, or 10:94 vol%
Using Eq. (25), we see that nearly 4% oxygen has been consumed
[(35� 106)(58.4=150,000)¼ 4%] or final oxygen¼ 157 4¼ 11%, which
agrees with the detailed calculations.
When possible, detailed combustion calculations should be done because
they also reveal the volume percent of water vapor, which has increased from 7%
to 10.64%. This would naturally increase the gas specific heat or its enthalpy and
affect the heat transfer calculations.
Table 6.11 shows the exhaust gas analysis at various firing temperatures.
6.27c
Q:Determine the final exhaust gas temperature after combustion in the example in
Q6.27b.
A:To arrive at the final gas temperature, the enthalpy of the exhaust gases must be
obtained. A simplistic specific heat assumption can also give an idea of the
temperature but will not be accurate.
TABLE 6.11 Effect of Firing Temperature on Exhaust Gas Analysis
Firing temperature,�F
1400 1800 2200 2600 3000
Burner duty, MM Btu=h 22.5 41.83 62.98 86.54 111.1Total gas flow, lb=h 151,037 151,947 152,935 154,035 155,174H2O, vol% 9.33 11.29 13.39 15.67 18.00
CO2, vol% 4.19 5.18 6.26 7.42 8.6O2, vol% 12.38 10.18 7.83 5.27 2.67
150,000 lb=h of exhaust gases at 900�F. Exhaust gas analysis (vol%): CO2 ¼3, H2O¼ 7,
N2 ¼75, O2 ¼ 15. Natural gas: C1 ¼97 vol%, C2 ¼ 3 vol%.
Copyright © 2003 Marcel Dekker, Inc.

Using, say, 0.3 Btu=lb �F for the average gas specific heat for the tempera-
ture range in consideration, the increase in gas temperature is
35� 106=ð150,000� 0:3Þ ¼ 777�F
or
Final gas temperature ¼ 900þ 777 ¼ 1677�F
However, let us use gas enthalpy calculations, which are more accurate. Figure
6.3 shows the gas enthalpy for the turbine exhaust gas at various temperatures. (A
program was used to compute these values based on the enthalpy of individual
constituents.) Enthalpy of exhaust gas at 900�F¼ 220Btu=lb.From an energy balance across the burner;
150,000� 220þ 35� 106 ¼ 151,626� hg
where hg ¼ enthalpy of final products of combustion. hg ¼ 448.5 Btu=lb. From the
chart, the gas temperature¼ 1660�F.A computer program probably gives more accurate results, because it can
compute the gas temperature and enthalpy for any gas analysis and iterate for the
actual enthalpy, whereas a chart can be developed only for a given exhaust gas
analysis and a maximum firing temperature.
FIGURE 6.3 Enthalpy of turbine exhaust gas as a function of temperature.
Copyright © 2003 Marcel Dekker, Inc.

6.28
Q:How can the fuel consumption for power plant equipment such as gas turbines
and diesel engines be determined if the heat rates are known?
A:The heat rate (HR) of gas turbines or engines in Btu=kWh refers indirectly to the
efficiency.
Efficiency ¼ 3413
HR
where 3413 is the conversion factor from Btu=h to kW. One has to be careful
about the basis for the heat rate, whether it is on HHV or LHV basis. The
efficiency will be on the same basis.
Example
If the heat rate for a gas turbine is 9000 Btu=kWh on LHV basis and the higher
and lower heating values of the fuel are 20,000 and 22,000Btu=lb, respectively,then
Efficiency on LHV basis ¼ 3413
9000¼ 0:379; or 37:9%
To convert this efficiency to HHV basis, simply multiply it by the ratio of the
heating values:
Efficiency on HHV basis ¼ 37:9� 20,000
22,000¼ 34:45%
NOMENCLATURE
A Theoretical amount of air for combustion per MM Btu fired, lb
C;CO;CO2 Carbon, carbon monoxide, and carbon dioxide
Ca Ash concentration in flue gas, grains=cu ft
Cp Specific heat, Btu=lb �Fe Emission rate of sulfur dioxide, lb=MM Btu
E Excess air, %
EA Excess air factor
HHV Higher heating value, Btu=lb or Btu=scfHR Heat rate, Btu=kWh
hi; ho Inside and outside heat transfer coefficients, Btu=ft2 h �FK Constant used in Eq. (7)
K1;K2 Constants used in Eq. (10a) and (10c)
Copyright © 2003 Marcel Dekker, Inc.

L1–L5 Losses in steam generator, %
LHV Lower heating value, Btu=lb or Btu=scfMW Molecular weight
Pc;Pw,PH2OPartial pressures of carbon dioxide and water vapor, atm
PSO3Partial pressure of sulfur trioxide, atm
Pa;Ps Actual and standard pressures, psia
DP Differential pressure, psi
q Heat loss, Btu=ft2 hQ Energy, Btu=h or kW
s Specific gravity
S Sulfur in fuel
ta; tg Temperatures of air and gas, �Ftm Melting point of ash, �C; tube wall temperature, �CTdp Acid dew point temperature, K
Ts; Ta Standard and actual temperatures, �RVs;Va Standard and actual volumes, cu ft
Vc;Vn CO and NOx ppmvd
w Weight of air, lb=lb fuel; subscript da stands for dry air; wa, wet
air; wg, wet gas; dg, dry gas
W Moisture, lb=hWa;Wg;Wf Flow rates of air, gas, and fuel, lb=hZ Efficiency; subscripts HHV and LHV denote the basis
r Density, lb=cu ft; subscript g stands for gas, f for fuel
REFERENCES
1. V Ganapathy. Applied Heat Transfer. Tulsa, OK: PennWell Books, 1982, pp 14–24.
2. North American Combustion Handbook. 2nd ed. Cleveland, OH: North American
Mfg. Co., 1978, pp 9–40.
3. Babcock and Wilcox. Steam: Its Generation and Use. 38th ed. New York, 1978,
p 6–2.
4. VGanapathy, Use chart to estimate furnace parameters. Hydrocarbon Processing, Feb
1982, p 106.
5. V Ganapathy. Figure particulate emission rate quickly. Chemical Engineering, July
26, 1982, p 82.
6. V Ganapathy. Nomogram estimates melting point of ash. Power Engineering, March
1978, p 61.
7. ASME. Power Test Code. Performance test code for steam generating units, PTC 4.1.
New York: ASME, 1974.
8. V Ganapathy. Estimate combustion gas dewpoint. Oil and Gas Journal, April 1978,
p 105.
9. V Ganapathy. Waste Heat Boiler Deskbook. Atlanta, GA: Fairmont Press, 1991.
Copyright © 2003 Marcel Dekker, Inc.

10. V Ganapathy. Converting ppm to lb=MM Btu; an easy method. Power Engineering,
April 1992, p 32.
11. KY Hsiung. Predicting dew points of acid gases. Chemical Engineering, Feb 9, 1981,
p 127.
12. C Baukal Jr. The John Zink Combustion Handbook. Boca Raton, FL: CRC Press,
2001.
13. Babcock and Wilcox, Steam, its generation and use, 40th ed. The Babcock and
Wilcox Company, Barberton, Ohio, 1992.
14. AG Okkes. Get acid dew point of flue gas. Hydrocarbon Processing, July 1987.
Copyright © 2003 Marcel Dekker, Inc.

7
Fluid Flow, Valve Sizing,and Pressure Drop Calculations
7.01 Sizing flow meters; discharge coefficients for orifices, venturis, and
nozzles; permanent pressure drop across flow meters; correcting steam
flow readings for different operating conditions
7.02 Sizing orifices for water flow measurement
7.03 Sizing orifices for steam flow measurement
7.04 Significance of permanent pressure drop in flow meters; cost of permanent
pressure drop across flow meters
7.05 Converting pitot tube readings to air velocity, flow in ducts
7.06 Sizing safety valves for boilers; ASME Code procedure
7.07 Relieving capacities for steam service; orifice designations for safety
valves; relating set and accumulated inlet pressures
7.08 Selecting safety valves for boiler superheater; actual and required relieving
capacities
7.09 Relieving capacities of a given safety valve on different gases
7.10 Relieving capacity of safety relief valve for liquid service
7.11 Determining relieving capacity of a given safety valve on air and steam
service
7.12 Sizing control valves; valve coefficient Cv
7.13 Calculating Cv for steam service; saturated and superheated steam; critical
and noncritical flow
7.14 Calculating Cv for liquid service
Copyright © 2003 Marcel Dekker, Inc.

7.15 On cavitation: recovery factors
7.16 Selecting valves for laminar flow
7.17 Calculating pressure loss in water line; determining friction factor for
turbulent flow; equivalent length of piping; viscosity of water
7.18 Pressure loss in boiler superheater; estimating friction factor in smooth
tubes; pressure drop in smooth tubing; Reynolds number for gases
7.19 Determining pressure drop under laminar conditions; pressure drop in fuel
oil lines; effect of temperature on specific volume, viscosity of oils
7.20 Pressure drop for viscous liquids; friction factor under turbulent conditions
7.21 Calculating flow in gpm and in lb=h for fuel oils; expansion factors for fueloils at different temperatures
7.22 Pressure loss in natural gas lines using Spitzglass formula
7.23 Calculating pressure drop of flue gas and air in ducts; friction factors;
equivalent diameter for rectangular ducts; Reynolds number estimation
7.24 Determining Reynolds number for superheated steam in tubes; viscosity of
steam; Reynolds number for air flowing over tube bundles.
7.25 Determining flow in parallel passes of a superheater
7.26 Equivalent length of piping system; equivalent length of valves and fittings
7.27 Pressure drop of air and flue gases over plain tube bundles; friction factor
for in-line and staggered arrangements
7.28 Pressure drop of air and flue gases over finned tube bundles
7.29 Factors influencing boiler circulation
7.30 Purpose of determining circulation ratio
7.31 Determining circulation ratio in water tube boilers
7.32 Determining circulation ratio in fire tube boilers
7.33 Determining steam flow in blowoff lines
7.34 Sizing boiler blowdown lines
7.35 Stack height and friction losses
7.36 Flow instability in evaporators
7.01a
Q:How are flow meters sized?
A:The basic equation for pressure differential in head meters (venturis, nozzles,
orifices) is [1]
W ¼ 359YCd d2o
ffiffiffiffiffiffihr
pffiffiffiffiffiffiffiffiffiffiffiffiffi1� b4
q ð1aÞ
Copyright © 2003 Marcel Dekker, Inc.

where
W ¼ flow of the fluid, lb=hY ¼ expansion factor, which allows for changes in density of compressible
fluids (for liquids Y ¼ 1, and for most gases it varies from 0.92 to 1.0)
Cd ¼ a coefficient of charge
do ¼ orifice diameter, in.
r¼ density of fluid, lb=cu ft
b¼ ratio of orifice to pipe inner diameter¼ do=dih¼ differential pressure, in. WC
Cd may be taken as 0.61 for orifices and 0.95–0.98 for venturis and nozzles. It is a
complicated function of Reynolds number and orifice size. The permanent
pressure drop, Dp, across a flow meter is important, because it means loss in
power or additional consumption of energy. It is the highest for orifices [2]:
DP ¼ h ð1� b2Þ ð1bÞFor nozzles,
DP ¼ h1� b2
1þ b2ð1cÞ
and for venturis it depends on the angle of divergence but varies from 10% to
15% of h. Q7.04 discusses the significance of permanent pressure drop and the
cost associated with it.
7.01b
Q:The differential pressure across an orifice of a steam flow meter shows 180 in.
WC when the upstream conditions are 1600 psia and 900�F. The steam flow was
calibrated at 80,000 lb=h under these conditions. Because of different plant load
requirements, the steam parameters are now 900 psia and 800�F. If the differentialpressure is 200 in. WC, what is the steam flow?
A:From Eq. (1a),
W /ffiffiffiffiffiffirh
p/
ffiffiffih
v
rwhere
W ¼ steam flow, lb=hv¼ specific volume, cu ft=lbh¼ differential pressure, in. WC
r¼ density, lb=cu ft
Copyright © 2003 Marcel Dekker, Inc.

From the steam tables (see the Appendix),
n1 ¼ 0:4553 cu ft=lb at 1600 psia; 900�Fn2 ¼ 0:7716 cu ft=lb at 900 psia; 800�F
h1 ¼ 180, h2 ¼ 200, and W1 ¼ 80,000. We need to find W2.
80;000
W2
¼ffiffiffiffiffiffiffiffiffiffiffiffiffiffiffiffiffiffiffiffiffiffiffiffiffiffiffi180� 0:7716
200� 0:4553
r¼ 1:235
Hence W2 ¼ 64,770 lb=h.
7.02
Q:Determine the orifice size to limit the differential pressure to 100 in. WC when
700 lb=s of water at 60�F flows in a pipe of inner diameter 18 in. The density of
water is 62.4 lb=cu ft.
A:Equation (1a) is not handy to use when it is required to solve for the orifice
diameter do. Hence, by substituting for b ¼ do=di and simplifying, we have
W ¼ 359CdYd2i
ffiffiffiffiffiffirh
pb2p
1� b4ð2Þ
This equation is easy to use either when orifice size is needed or when flow
through a given orifice is required. The term b2=p1� b4 is a function of b and
can be looked up from Table 7.1. Substituting for W ¼ 700� 3600;Cd ¼ 0:61; Y ¼ 1; r ¼ 62:4, and h ¼ 100, we have
700� 3600 ¼ 359� 0:61� 1� 182ffiffiffiffiffiffiffiffiffiffiffiffiffiffiffiffiffiffiffiffiffiffi62:4� 100
p� FðbÞ
or
FðbÞ ¼ 0:45
From Table 7.1, by interpolation, we note that b¼ 0.64. Thus the orifice diameter
do ¼ 0.64� 18¼ 11.5 in.
7.03
Q:What size of orifice is needed to pass a saturated steam flow of 26,480 lb=h when
the upstream pressure is 1000 psia and line size is 2.9 in. and the differential is not
to exceed 300 in. WC?
Copyright © 2003 Marcel Dekker, Inc.

A:Using Eq. (2) and substituting Y ¼ 0:95; r ¼ 1=v ¼ 1=0:4456 ¼ 2:24 lb/cu ft,
and di ¼ 2.9, we have
W ¼ 26;480
¼ 359� 0:61� 0:95� 2:92 � FðbÞ �ffiffiffiffiffiffiffiffiffiffiffiffiffiffiffiffiffiffiffiffiffiffi2:24� 300
p
Hence
FðbÞ ¼ 0:58
From Table 7.1, b¼ 0.71. Hence
do ¼ 0:71� 2:9 ¼ 2:03 in:
7.04
Q:What is the significance of a permanent pressure drop across the flow measure-
ment device? 1.3 million scfh of natural gas with a specific gravity of 0.62 at
125 psia is metered using an orifice plate with a differential head of 100 in. WC.
The line size is 12 in. What are the operating costs involved? Assume that
electricity costs 20mills=kWh.
A:The first step is to size the orifice. Use a molecular weight of 0.62� 29¼ 18 to
compute the density. (The molecular weight of any gas¼ specific gravity� 29.)
From Q5.03
r ¼ 18� 492� 125
359� 520� 15¼ 0:39 lb=cu ft
TABLE 7.1 F ðbÞ Values for SolvingEq. (2)
b F ðbÞ ¼ b2=p
1� b4
0.3 0.090.4 0.162
0.5 0.2580.6 0.390.7 0.562
0.8 0.83
Copyright © 2003 Marcel Dekker, Inc.

(A temperature of 60�F was assumed.) The density at standard conditions of 60�F,15 psia, is
r ¼ 18� 492
359� 520¼ 0:047 lb=cu ft
Hence mass flow is
W ¼ 1:3� 106 � 0:047
¼ 359� 0:61� 122 �ffiffiffiffiffiffiffiffiffiffiffiffiffiffiffiffiffiffiffiffiffiffi0:39� 100
p� FðbÞ
FðbÞ ¼ 0:31
From Table 7.1, b ¼ 0:55, so b2 ¼ 0:3. The permanent pressure drop, from
Q7.01, is
DP ¼ ð1� b2Þh ¼ ð1� 0:3Þ � 100 ¼ 70 in. WC
The horsepower consumed in developing this head is
HP ¼ scfh� ð460þ tÞ � DPP � 107
ð3Þ
It was assumed in the derivation of Eq. (3) that compressor efficiency was 75%.
Substitution yields
HP ¼ 1:3� 106 � 520� 70
107 � 125¼ 38
The annual cost of operation is
38� 0:746� 8000� 0:02 ¼ $4535
(8000 hours of operation was assumed per year; 0.746 is the factor converting
horsepower to kilowatts.)
7.05
Q:Often, pitot tubes are used to measure air velocities in ducts in order to compute
the air flow. A pitot tube in a duct handling air at 200�F shows a differential of
0.4 in. WC. If the duct cross section is 4 ft2, estimate the air velocity and the flow
rate.
A:It can be shown [3] by substituting r ¼ 40=ð460þ tÞ that for a pitot,
V ¼ 2:85�ffiffiffiffiffiffiffiffiffiffiffiffiffiffiffiffiffiffiffiffiffiffiffiffiffiffih� ð460þ tÞ
pð4Þ
Copyright © 2003 Marcel Dekker, Inc.
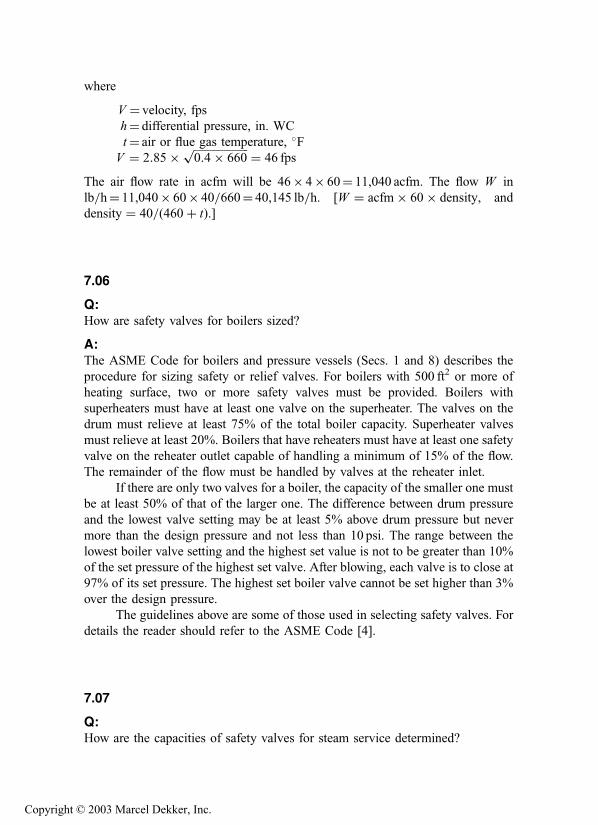
where
V ¼ velocity, fps
h¼ differential pressure, in. WC
t¼ air or flue gas temperature, �FV ¼ 2:85� ffiffiffiffiffiffiffiffiffiffiffiffiffiffiffiffiffiffiffiffi
0:4� 660p ¼ 46 fps
The air flow rate in acfm will be 46� 4� 60¼ 11,040 acfm. The flow W in
lb=h¼ 11,040� 60� 40=660¼ 40,145 lb=h. [W ¼ acfm� 60� density, and
density ¼ 40=ð460þ tÞ.]
7.06
Q:How are safety valves for boilers sized?
A:The ASME Code for boilers and pressure vessels (Secs. 1 and 8) describes the
procedure for sizing safety or relief valves. For boilers with 500 ft2 or more of
heating surface, two or more safety valves must be provided. Boilers with
superheaters must have at least one valve on the superheater. The valves on the
drum must relieve at least 75% of the total boiler capacity. Superheater valves
must relieve at least 20%. Boilers that have reheaters must have at least one safety
valve on the reheater outlet capable of handling a minimum of 15% of the flow.
The remainder of the flow must be handled by valves at the reheater inlet.
If there are only two valves for a boiler, the capacity of the smaller one must
be at least 50% of that of the larger one. The difference between drum pressure
and the lowest valve setting may be at least 5% above drum pressure but never
more than the design pressure and not less than 10 psi. The range between the
lowest boiler valve setting and the highest set value is not to be greater than 10%
of the set pressure of the highest set valve. After blowing, each valve is to close at
97% of its set pressure. The highest set boiler valve cannot be set higher than 3%
over the design pressure.
The guidelines above are some of those used in selecting safety valves. For
details the reader should refer to the ASME Code [4].
7.07
Q:How are the capacities of safety valves for steam service determined?
Copyright © 2003 Marcel Dekker, Inc.

A:The relieving capacities of safety valves are given by the following expressions.
ASME Code, Sec. 1 uses a 90% rating, whereas Sec. 8 uses a 100% rating [5].
W ¼ 45APaKsh ð5aÞW ¼ 50APaKsh ð5bÞ
where
W ¼ lb=h of steam relieved
A¼ nozzle or throat area of valve, in.2
Pa ¼ accumulated inlet pressure¼Ps � ð1þ accÞ þ 15, psia (The factor
acc is the fraction of pressure accumulation.)
Ps ¼ set pressure, psig
Ksh ¼ correction factor for superheat (see Fig. 7.1)
The nozzle areas of standard orifices are specified by letters D to T and are
given in Table 7.2. For saturated steam, the degree of superheat is zero, so
Ksh ¼ 1. The boiler safety valves are sized for 3% accumulation.
7.08
Q:Determine the sizes of valves to be used on a boiler that has a superheater. The
parameters are the following.
Total steam generation¼ 650,000 lb=hDesign pressure¼ 1500 psig
Drum operating pressure¼ 1400 psig
Steam outlet temperature¼ 950�FPressure accumulation¼ 3%
Superheater outlet operating pressure¼ 1340 psig
A:The set pressure must be such that the superheater valve opens before the drum
valves. Hence the set pressure can be 15007 607 40¼ 1400 psig (60 is the
pressure drop and 40 is a margin). The inlet pressure Pa ¼ 1:03 �1400þ 15 ¼ 1457 psia. From Fig. 7.1, Ksh ¼ 0:79.
A ¼ W
45KshPa
¼ 130;000
45� 0:79� 1457¼ 2:51 in:2
We used a value of 130,000 lb=h, which is 20% of the total boiler capacity. A
K2 orifice is suitable. This relieves (2.545=2.51)� 130,000¼ 131,550 lb=h.The drum valves must relieve 650,0007 131,550¼ 518,450 lb=h. About
260,000 lb=h may be handled by each drum valve if two are used. Let the first
Copyright © 2003 Marcel Dekker, Inc.
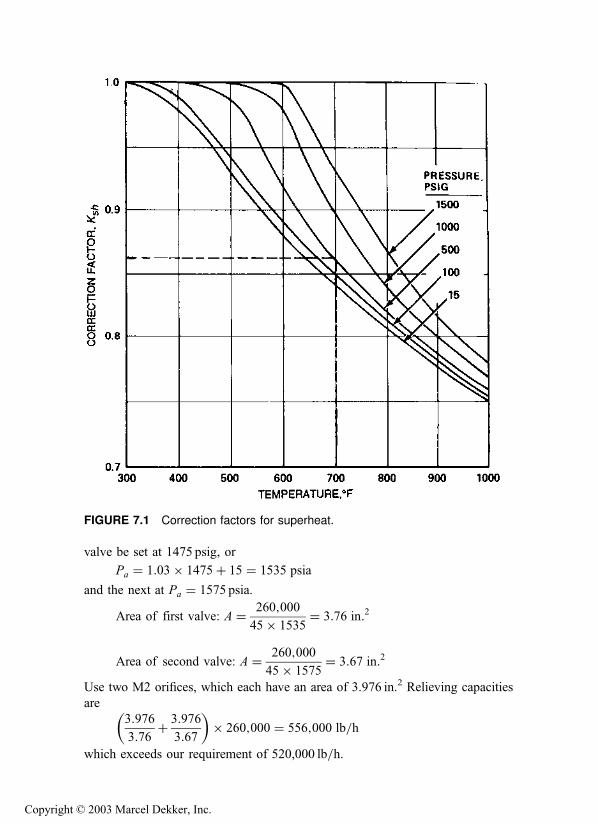
valve be set at 1475 psig, or
Pa ¼ 1:03� 1475þ 15 ¼ 1535 psia
and the next at Pa ¼ 1575 psia.
Area of first valve: A ¼ 260;000
45� 1535¼ 3:76 in:2
Area of second valve: A ¼ 260;000
45� 1575¼ 3:67 in:2
Use two M2 orifices, which each have an area of 3.976 in.2 Relieving capacities
are
3:976
3:76þ 3:976
3:67
� �� 260;000 ¼ 556;000 lb=h
which exceeds our requirement of 520,000 lb=h.
FIGURE 7.1 Correction factors for superheat.
Copyright © 2003 Marcel Dekker, Inc.

7.09a
Q:How is the relieving capacity of safety valves for gaseous service found?
A:The expression used for estimating the relieving capacity for gases and vapors [6]
is
W ¼ CKAPa
ffiffiffiffiffiffiffiffiffiMW
T
rð6Þ
where
C¼ a function of the ratio k of specific heats of gases (Table 7.3)
K ¼ valve discharge coefficient, varies from 0.96 to 0.98
Pa ¼ accumulated inlet pressure¼Psð1þ accÞ þ 15; psiaPs ¼ set pressure, psig
MW¼molecular weight of gas
T ¼ absolute temperature, �R
7.09b
Q:A safety valve is set for 100 psig for air service at 100�F and uses a G orifice.
What is the relieving capacity if it is used on ammonia service at 50�F, pressurebeing the same?
TABLE 7.2 OrificeDesignation
Type Area (in.2)
D 0.110E 0.196
F 0.307G 0.503H 0.785
J 1.287K 1.838K2 2.545L 2.853
M 3.600M2 3.976N 4.340
P 6.380Q 11.05R 16.00
Copyright © 2003 Marcel Dekker, Inc.
A:Assume that k is nearly the same for both air and ammonia. Hence for the valve,
CKAPa is a constant. For air, use C¼ 356, K ¼ 0.98, A¼ 0.503, MW¼ 29, and
T ¼ 560.
Wa ¼ 356� 0:98� 0:503� ð1:1� 100þ 15Þffiffiffiffiffiffiffiffi29
560
r¼ 4990 lb=h
(An acc value of 0.10 was used above.) From Eq. (6), substituting MW¼ 17 and
T ¼ 510 for ammonia, we have
Wa
Wamm
¼ffiffiffiffiffiffiffiffiffiffiffiffiffiffiffiffiffiffi29� 510
17� 560
r¼ 1:246
Hence
Wamm ¼ 4990
1:246¼ 4006 lb=h
7.10a
Q:How are the relieving capacities for liquids determined?
TABLE 7.3 Constant C for Gas or Vapor Related to Ratio of Specific Heats(k ¼ Cp=Cv)
k Constant C k Constant C k Constant C
1.00 315 1.26 343 1.52 3661.02 318 1.28 345 1.54 368
1.04 320 1.30 347 1.56 3691.06 322 1.32 349 1.58 3711.08 324 1.34 351 1.60 372
1.10 327 1.36 352 1.62 3741.12 329 1.38 354 1.64 3761.14 331 1.40 356 1.66 3771.16 333 1.42 358 1.68 379
1.18 335 1.44 359 1.70 3801.20 337 1.46 361 2.00 4001.22 339 1.48 363 2.20 412
1.24 341 1.50 364
Source: Ref. 5.
Copyright © 2003 Marcel Dekker, Inc.

A:An expression for relieving capacity at 25% accumulation [5] is
q ¼ 27:2AKs
ffiffiffiffiffiffiffiffiffiffiffiffiffiffiffiffiP1 � Pb
pð7Þ
where
P1 ¼ set pressure, psig
Pb ¼ backpressure, psig
Ks ¼ffiffiffiffiffiffiffi1=s
p; s being the specific gravity
A¼ orifice area, in.2
q¼ capacity, gpm
7.10b
Q:Determine the relieving capacity of a relief valve on an economizer if the set
pressure is 300 psig, backpressure is 15 psig, and s¼ 1. The valve has a G orifice
(A¼ 0.503 in.2).
A:Using Eq. (7), we have
q ¼ 27:2� 0:503� 1�ffiffiffiffiffiffiffiffiffiffiffiffiffiffiffiffiffiffi300� 15
p
¼ 231 gpm
¼ 231� 500 ¼ 115;000 lb=h
At 10% accumulation, q would be 0.6� 231¼ 140 gpm and the flow W ¼70,000 lb=h (500 is the conversion factor from gpm to lb=h when s¼ 1.)
7.11
Q:A safety valve bears a rating of 20,017 lb=h at a set pressure of 450 psig for
saturated steam. If the same valve is to be used for air at the same set pressure and
at 100�F, what is its relieving capacity?
A:For a given valve, CKAPa is a constant if the set pressure is the same. (See Q7.09a
for definition of these terms.)
For steam,
20;017 ¼ 50� KAPa
Copyright © 2003 Marcel Dekker, Inc.
Hence
KAPa ¼20;017
50¼ 400:3
For air,
W ¼ CKAPa
ffiffiffiffiffiffiffiffiffiMW
T
r
C¼ 356, MW¼ 29, and T ¼ 560�R for the case of air. Hence,
Wa ¼ 356� 400:3�ffiffiffiffiffiffiffiffi29
560
r¼ 32;430 lb=h
Converting to acfm, we have
q ¼ 32;430� 560� 15
0:081� 492� 465� 60
¼ 244 acfm
(The density of air was estimated at 465 psia and 100�F.)
7.12
Q:How is the size of control valves for steam service determined?
A:Control valves are specified by Cv or valve coefficients. The manufacturers of
control valves provide these values (see Table 7.4). The Cv provided must exceed
the Cv required. Also, Cv at several points of possible operation of the valve must
be found, and the best Cv characteristics that meet the load requirements must be
used, because controllability depends on this. For example. a quick-opening
characteristic (see Fig. 7.2) is desired for on–off service. A linear characteristic is
desired for general flow control and liquid-level control systems, whereas equal
percentage trim is desired for pressure control or in systems where pressure
varies. The control valve supplier must be contacted for the selection and for
proper actuator sizing.
For the noncritical flow of steam (P1 < 2P2) [7],
Cv ¼W � ½1þ 0:00065� ðt � tsÞ�
2:11� ffiffiffiffiffiffiffiffiffiffiffiffiffiffiffiffiffiDP � Pt
p ð8Þ
Copyright © 2003 Marcel Dekker, Inc.

TABLE 7.4 Flow Coefficient Cv
Valve opening (% total travel)Body Port Total
size (in.) diameter (in.) travel (in.) 10 20 30 40 50 60 70 80 90 100 Km and Cf
3=4 1=4 3=4 0.075 0.115 0.165 0.230 0.321 0.448 0.625 0.870 1.15 1.47 0.70
3=8 3=4 0.120 0.190 0.305 0.450 0.628 0.900 1.24 1.68 2.18 2.69 0.801=2 3=4 0.235 0.400 0.600 0.860 1.16 1.65 2.15 2.85 3.40 3.66 0.70
1 1=4 3=4 0.075 0.115 0.165 0.230 0.321 0.448 0.625 0.870 1.20 1.56 0.80
3=8 3=4 0.120 0.190 0.305 0.450 0.630 0.910 1.35 1.97 2.78 3.68 0.701=2 3=4 0.235 0.410 0.610 0.900 1.26 1.80 2.50 3.45 4.50 5.36 0.703=4 3=4 0.380 0.700 1.10 1.57 2.36 3.40 5.00 6.30 6.67 6.95 0.75
11=2 1=4 3=4 0.075 0.115 0.165 0.230 0.321 0.448 0.625 0.870 1.20 1.56 0.80
3=8 3=4 0.120 0.190 0.305 0.450 0.630 0.910 1.35 1.97 2.78 3.68 0.701=2 3=4 0.265 0.420 0.620 0.915 1.31 1.90 2.64 3.65 4.56 6.04 0.803=4 3=4 0.380 0.700 1.10 1.65 2.45 3.70 5.30 7.10 8.88 10.2 0.75
1 3=4 0.930 1.39 2.12 3.10 4.44 6.12 8.13 10.1 11.5 12.2 0.752 1=4 3=4 0.075 0.115 0.165 0.230 0.321 0.448 0.625 0.870 1.20 1.56 0.80
3=8 3=4 0.120 0.190 0.305 0.450 0.630 0.910 1.35 1.97 2.78 3.68 0.70
1=2 3=4 0.265 0.420 0.620 0.915 1.31 1.90 2.64 3.65 4.89 6.44 0.703=4 3=4 0.380 0.700 1.10 1.65 2.45 3.70 5.53 8.00 10.3 12.3 0.701 3=4 0.930 1.39 2.12 3.10 4.50 6.45 9.31 12.9 15.7 17.8 0.75
11=2 3=4 0.957 1.45 2.31 3.70 6.05 9.86 15.2 20.2 22.0 22.0 0.79
3 1=4 3=4 0.075 0.115 0.165 0.230 0.321 0.448 0.625 0.870 1.20 1.56 0.803=8 3=4 0.120 0.190 0.305 0.450 0.630 0.910 1.35 1.97 2.78 3.68 0.701=2 3=4 0.265 0.420 0.620 0.915 1.31 1.90 2.64 3.65 4.89 6.44 0.70
3=4 3=4 0.380 0.700 1.10 1.65 2.45 3.70 5.70 8.66 12.3 14.8 0.651 3=4 0.930 1.39 2.12 3.10 4.50 6.70 9.90 13.2 17.9 23.6 0.65
11=2 11=8 1.15 2.29 3.41 4.77 6.44 8.69 12.5 19.2 26.7 32.2 0.74
2 11=8 1.92 3.13 4.83 7.93 12.6 24.6 35.9 40.5 43.4 44.3 0.72
Copyright © 2003 Marcel Dekker, Inc.

For critical flow (Pl 2P2),
Cv ¼W � ½1þ 0:00065� ðt � tsÞ�
1:85� P1
ð9Þ
where
t; ts ¼ steam temperature and saturation temperature (for saturated steam,
t ¼ ts)
W ¼ steam flow, lb=hPt ¼ total pressure (P1 þ P2), psia
FIGURE 7.2 Typical control valve characteristics.
Copyright © 2003 Marcel Dekker, Inc.

7.13a
Q:Estimate the Cv required when 60,000 lb=h of superheated steam at 900�F,1500 psia flows in a pipe. The allowable pressure drop is 30 psi.
A:Since this is a case of noncritical flow, from Eq. (8), substituting t ¼ 800 and
ts ¼ 596, we have
Cv ¼60;000� ½1þ 0:00065� ð900� 596Þ�
2:11� ffiffiffiffiffiffiffiffiffiffiffiffiffiffiffiffiffiffiffiffiffiffiffiffiffiffiffiffiffiffiffiffiffiffiffiffiffiffiffi30� ð1500þ 1470Þp
¼ 114
If the steam is saturated, t¼ ts and Cv ¼ 95. We have to choose from the valve
supplier’s catalog a valve that gives this Cv or more at 90–95% of the opening of
the trim. This ensures that the valve is operating at about 90% of the trim opening
and provides room for control.
7.13b
Q:In a pressure-reducing station, 20,000 lb=h of steam at 200 psia, 500�F is to be
reduced to 90 psia. Determine Cv.
A:Use Eq. (9) for critical flow conditions:
Cv ¼20;000� ½1þ 0:00065� ð500� 382Þ�
1:85� 200¼ 58
(382 is the saturation temperature at 200 psia.)
7.14
Q:Determine the valve coefficient for liquids. A liquid with density 45 lb=cu ft flowsat the rate of 100,000 lb=h. If the allowable pressure drop is 50 psi, determine Cv.
A:The valve coefficient for liquid, Cv, is given by [8]
Cv ¼ q
ffiffiffiffiffiffiffis
DP
rð10Þ
Copyright © 2003 Marcel Dekker, Inc.
where
q¼ flow, gpm
DP¼ pressure drop, psi
s¼ specific gravity
From Q5.01,
W ¼ 8qr
q ¼ 100;000
8� 45¼ 278 gpm
s ¼ 45
62:4¼ 0:72
DP ¼ 50
Hence
Cv ¼ 278�ffiffiffiffiffiffiffiffiffi0:72
50
r¼ 34
7.15
Q:How is cavitation caused? How is the valve sizing done to consider this aspect?
A:Flashing and cavitation can limit the flow in a control valve for liquid. The
pressure distribution through a valve explains the phenomenon. The pressure at
the vena contracta is the lowest, and as the fluid flows it gains pressure but never
reaches the upstream pressure. If the pressure at the port or vena contracta should
drop below the vapor pressure corresponding to upstream conditions, bubbles
will form. If the pressure at the exit remains below the vapor pressure, bubbles
remain in the stream and flashing occurs.
A valve has a certain recovery factor associated with it. If the recovery of
pressure is high enough to raise the outlet pressure above the vapor pressure of
the liquid, the bubbles will collapse or implode, producing cavitation. High-
recovery valves tend to be more subject to cavitation [9]. The formation of
bubbles tends to limit the flow through the valve. Hence the pressure drop used in
sizing the valve should allow for this reduced capacity. Allowable pressure drop
DPall is used in sizing,
DPall ¼ Km ðP1 � rcPvÞ ð11Þwhere
Km ¼ valve recovery coefficient (depends on valve make)
P1 ¼ upstream pressure, psia
rc ¼ critical pressure ratio (see Fig. 7.3)
Pv ¼ vapor pressure at inlet liquid temperature, psia
Copyright © 2003 Marcel Dekker, Inc.

Full cavitation will occur if the actual DP is greater than DPall and if the outlet
pressure is higher than the fluid vapor pressure. If the actual DP is less than DPall,
the actual DP should be used for valve sizing. To avoid cavitation, select a valve
with a low recovery factor (a high Km factor).
7.16
Q:How are valves selected for laminar flow and viscous liquids?
A:Calculate the turbulent flow Cv from Eq. (10) and the laminar Cv from [10]
lam Cv ¼ 0:072��mqDP
�2=3
ð12Þ
Use the larger Cv in the valve selection. (m is the liquid viscosity in centipoise.)
FIGURE 7.3 Critical pressure ratios for water.
Copyright © 2003 Marcel Dekker, Inc.

7.17a
Q:Determine the pressure loss in a 3 in. schedule 80 line carrying water at 100�Fand 2000 psia if the total equivalent length is 1000 ft. Flow is 38,000 lb=h.
A:The expression for turbulent flow pressure drop of fluids (Reynolds number
> 2100) is [11]
DP ¼ 3:36� 10�6 � f W 2Lev
d5ið13Þ
where
DP¼ pressure loss, psi
f ¼Darcy friction factor
W ¼ flow, lb=hLe ¼ equivalent length, ft (Q7.26 shows how the equivalent length can be
computed)
v¼ specific volume of fluid, cu ft=lbdi ¼ tube inner diameter, in.
For water at 100�F and 2000 psia, from Table A4 (Appendix 3), v¼ 0.016. In
industrial heat transfer equipment such as boilers, superheaters, economizers, and
air heaters, the fluid flow is generally turbulent, and hence we need not check for
Reynolds number. (Q7.24 shows how Re can be found.) However, let us quickly
check Re here:
Re ¼ 15:2W
dimð14Þ
Referring to Table 7.5, water viscosity, m, at 100�F is 1.645 lb=ft h
Re ¼ 15:2� 38,000
2:9� 1:645¼ 121;070
The inner diameter of 2.9 for the pipe was obtained from Table 5.6. For turbulent
flow and carbon or alloy steels of commercial grade, f may be obtained from
Table 7.6. Here f for a tube inner diameter of 2.9 in. is 0.0175. Substituting into
Eq. (13) yields
DP ¼ 3:36� 10�6 � 0:0175� ð38;000Þ2 � 100� 0:016
2:95¼ 6:6 psi
Copyright © 2003 Marcel Dekker, Inc.

TABLE 7.5 Viscosity of Steam and Water (lbm=h ft)
Pressure (psia)Temp(�F) 1 2 5 10 20 50 100 200 500 1000 2000 5000
1500 0.0996 0.0996 0.0996 0.0996 0.0996 0.0996 0.0996 0.0996 0.1008 0.1008 0.1019 0.10661400 0.0938 0.0938 0.0938 0.0938 0.0938 0.0938 0.0952 0.0952 0.0952 0.0961 0.0973 0.10191300 0.0892 0.0982 0.0892 0.0892 0.0892 0.0892 0.0892 0.0892 0.0892 0.0903 0.0915 0.0973
1200 0.0834 0.0834 0.0834 0.0834 0.0834 0.0834 0.0834 0.0834 0.0846 0.0846 0.0867 0.09261100 0.0776 0.0776 0.0776 0.0776 0.0776 0.0776 0.0776 0.0776 0.0788 0.0799 0.0811 0.08921000 0.0730 0.0730 0.0730 0.0730 0.0730 0.0730 0.0730 0.0730 0.0730 0.0741 0.0764 0.0857
900 0.0672 0.0672 0.0672 0.0672 0.0672 0.0672 0.0672 0.0672 0.0683 0.0683 0.0707 0.0846800 0.0614 0.0614 0.0614 0.0614 0.0614 0.0614 0.0614 0.0614 0.0625 0.0637 0.0660 0.0973700 0.0556 0.0556 0.0556 0.0556 0.0556 0.0556 0.0568 0.0568 0.0568 0.0579 0.0625 0.171600 0.0510 0.0510 0.0510 0.0510 0.0510 0.0510 0.0510 0.0510 0.0510 0.0510 0.210 0.221
500 0.0452 0.0452 0.0452 0.0452 0.0452 0.0452 0.0452 0.0440 0.0440 0.250 0.255 0.268400 0.0394 0.0394 0.0394 0.0394 0.0394 0.0394 0.0394 0.0382 0.317 0.320 0.323 0.335300 0.0336 0.0336 0.0336 0.0336 0.0336 0.0336 0.441 0.442 0.444 0.445 0.448 0.460
250 0.0313 0.0313 0.0313 0.0313 0.0313 0.551 0.551 0.551 0.552 0.554 0.558 0.569200 0.0290 0.0290 0.0290 0.0290 0.725 0.725 0.725 0.726 0.729 0.729 0.732 0.741150 0.0255 0.0255 1.032 1.032 1.032 1.032 1.032 1.032 1.033 1.034 1.037 1.044
100 1.645 1.645 1.645 1.645 1.645 1.645 1.645 1.645 1.645 1.646 1.646 1.64850 3.144 3.144 3.144 3.144 3.144 3.144 3.144 3.142 3.141 3.139 3.134 3.11932 4.240 4.240 4.240 4.240 4.240 4.240 4.240 4.239 4.236 4.231 4.222 4.192
Copyright © 2003 Marcel Dekker, Inc.

7.17b
Q:Estimate the pressure drop in a superheater of a boiler that has an equivalent
length of 200 ft. The tube inner diameter is 2.0 in., the flow per pass is 8000 lb=h,the steam pressure is 800 psia, and the temperature is 700�F.
A:Using Eq. (13) and substituting v¼ 0.78 cu ft=lb and f ¼ 0.0195 for turbulent
flow from Table 7.6 (generally flow in superheaters, economizers, and piping
would be turbulent), we obtain
DP ¼ 3:36� 10�6 � 0:0195� 200� 80002 � 0:78
25¼ 21 psi
7.18a
Q:How does the friction factor depend on pipe roughness?
A:For smooth tubes such as copper and other heat exchanger tubes, f is given by
[12]
f ¼ 0:133� Re�0:174 ð15Þ
TABLE 7.6 Tube DiameterVersus Friction Factor(Darcy) for Turbulent Flow
di (in.) f
0.5 0.028
0.75 0.02451.0 0.02301.5 0.0210
2.0 0.01952.5 0.01803.0 0.01754.0 0.0165
5.0 0.01608.0 0.0140
10.0 0.013
Copyright © 2003 Marcel Dekker, Inc.

Substituting this into Eq. (13) gives us
DPLe
¼ 0:0267 r0:8267 m0:174V 1:826
d1:174i
ð16Þ
(m is the viscosity, lb=ft h; V is the velocity, fps.)
7.18b
Q:Determine the pressure drop per 100 ft in a drawn copper tube of inner diameter
1.0 in. when 250 lb=h of air at a pressure of 30 psig and at 100�F flows through it.
A:Calculate the density (see Chap. 5):
r ¼ 29� 492� 45
359� 560� 15¼ 0:213 lb=cu ft
The effect of pressure can be neglected in the estimation of viscosity of gases up
to 40 psig. For a detailed computation of viscosity as a function of pressure,
readers may refer to Ref. 11. From Table 7.7, m¼ 0.047 lb=ft h. The velocity is
V ¼ 250� 576
3600� 3:14� 0:213¼ 60 fps
DP100
¼ 0:0267� 0:2130:8267 � 0:0470:174 � 601:826
1¼ 7:7 psi
TABLE 7.7 Viscosity of Air
Temperature (�F) Viscosity (lb=ft h)
100 0.0459200 0.0520400 0.062600 0.0772
800 0.08061000 0.08841200 0.0957
1400 0.10271600 0.11001800 0.1512
Copyright © 2003 Marcel Dekker, Inc.
7.19a
Q:Derive the expression for DP for laminar flow of fluids.
A:For laminar flow of fluids in pipes such as that occurring with oils, the friction
factor is
f ¼ 64
Reð17aÞ
Substituting into Eq. (13) and using Eq. (14) gives us
DP ¼ 3:36� 10�6 � 64� dimW2 Le � v
15:2�Wd5i
¼ 14:4� 10�6 �W � Le �vmd4i
ð17bÞ
Converting lb=h to gph (gallons per hour), we can rewrite this as
DP ¼ 4:5� 10�6 � Le � cS� s� gph
d4ið18Þ
where
cS¼ viscosity, centistokes
s¼ specific gravity
Equation (18) is convenient for calculations for oil flow situations.
7.19b
Q:Estimate the pressure drop per 100 ft in an oil line when the oil has a specific
gravity of 16�API and is at 180�F. The line size is 1.0 in., and the flow is
7000 lb=h.
A:We must estimate Re. To do this we need the viscosity [13] in centistokes:
cS ¼ 0:226 SSU� 195
SSUfor SSU 32�100 ð19Þ
cS ¼ 0:220 SSU� 135
SSUfor SSU > 100 ð20Þ
SSU represents the Saybolt seconds, a measure of viscosity. Also, cS � s ¼ cP,
where cP is the viscosity in centipoise, and 0.413 cP¼ 1 lb=ft h.
Copyright © 2003 Marcel Dekker, Inc.

The specific gravity is to be found. At 180�F, from Eq. (23) (see Q7.21) it
can be shown that the specific volume at 180�F is 0.0176 cu ft=lb. Then
s ¼ 1
0:0176� 62:4¼ 0:91
Hence cP¼ 0.91� 24.83, where
cS ¼ 0:22� 118� 135
118¼ 24:83
and
m ¼ 2:42� 0:91� 24:83 ¼ 54:6 lb=ft h
Re ¼ 15:2� 7000
0:91� 24:83� 2:42¼ 1948
(2.42 was used to convert cP to lb=ft h.) From Eq. (17a),
f ¼ 64
1948¼ 0:0328
Substituting into Eq. (17b) yields
DP ¼ 14� 10�6 � 54:6� 7000� 100� 1
0:91� 62:4¼ 9:42 psi
7.20a
Q:For viscous fluids in turbulent flow, how is the pressure drop determined?
A:For viscous fluids, the following expression can be used for the friction factor:
f ¼ 0:316
Re0:22ð21Þ
Substituting into Eq. (13) gives us
DP ¼ 3:36� 10�6 � 0:361� ðdimÞ0:22LeW 2 � v
ð15:2W Þ0:22d5i¼ 0:58� 10�6 � m0:22W 1:78Le �
v
d4:78i
ð22Þ
Copyright © 2003 Marcel Dekker, Inc.
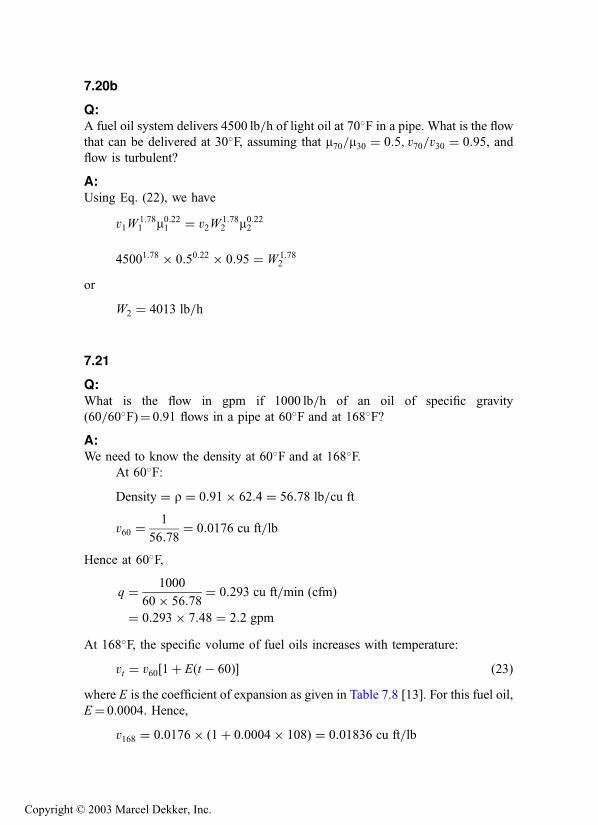
7.20b
Q:A fuel oil system delivers 4500 lb=h of light oil at 70�F in a pipe. What is the flow
that can be delivered at 30�F, assuming that m70=m30 ¼ 0:5; v70=v30 ¼ 0:95, andflow is turbulent?
A:Using Eq. (22), we have
v1W1:781 m0:221 ¼ v2W
1:782 m0:222
45001:78 � 0:50:22 � 0:95 ¼ W 1:782
or
W2 ¼ 4013 lb=h
7.21
Q:What is the flow in gpm if 1000 lb=h of an oil of specific gravity
(60=60�F)¼ 0.91 flows in a pipe at 60�F and at 168�F?
A:We need to know the density at 60�F and at 168�F.
At 60�F:
Density ¼ r ¼ 0:91� 62:4 ¼ 56:78 lb=cu ft
v60 ¼1
56:78¼ 0:0176 cu ft=lb
Hence at 60�F,
q ¼ 1000
60� 56:78¼ 0:293 cu ft=min ðcfmÞ
¼ 0:293� 7:48 ¼ 2:2 gpm
At 168�F, the specific volume of fuel oils increases with temperature:
vt ¼ v60½1þ Eðt � 60Þ� ð23Þwhere E is the coefficient of expansion as given in Table 7.8 [13]. For this fuel oil,
E¼ 0.0004. Hence,
v168 ¼ 0:0176� ð1þ 0:0004� 108Þ ¼ 0:01836 cu ft=lb
Copyright © 2003 Marcel Dekker, Inc.

Hence
q168 ¼ 1000� 0:01836
60
¼ 0:306 cfm ¼ 0:306� 7:48
¼ 2:29 gpm
7.22
Q:How is the pressure loss in natural gas lines determined? Determine the line size
to limit the gas pressure drop to 20 psi when 20,000 scfh of natural gas of specific
gravity 0.7 flows with a source pressure of 80 psig. The length of the pipeline is
150 ft.
A:The Spitzglass formula is widely used for compressible fluids [13]:
q ¼ 3410� F
ffiffiffiffiffiffiffiffiffiffiffiffiffiffiffiffiP21 � P2
2
sL
rð24Þ
where
q¼ gas flow, scfh
s¼ gas specific gravity
P1; P2 ¼ gas inlet and exit pressures, psia
F ¼ a function of pipe inner diameter (see Table 7.9)
L¼ length of pipeline, ft
Substituting, we have
20;000 ¼ 3410� F
ffiffiffiffiffiffiffiffiffiffiffiffiffiffiffiffiffiffiffiffi952 � 752
0:7� 150
r
TABLE 7.8 Expansion Factorfor Fuel Oils
�API E
14.9 0.0003515–34.9 0.00040
35–50.9 0.0005051–63.9 0.0006064–78.9 0.00070
79–88.9 0.0008089–93.9 0.0008594–100 0.00090
Copyright © 2003 Marcel Dekker, Inc.

Hence F ¼ 1.03. From Table 7.9 we see that d should be 114in. Choosing the next
higher standard F or d limits the pressure drop to desired values. Alternatively, if
q; d; L, and P1 are given, P2 can be found.
7.23
Q:Determine the pressure loss in a rectangular duct 2 ft� 2.5 ft in cross section if
25,000 lb=h of flue gases at 300�F flow through it. The equivalent length is
1000 ft.
TABLE 7.9 Standard Steel Pipea Data (Black, Galvanized, Welded, andSeamless)
Nominal
pipe size[in. (mm)] Scheduleb
Outside
diameter[in. (mm)]
Inside
diameter(in.)
Wall
thickness(in.)
Functionsof inside
diameter,c
F (in.)
1=8 (6) 40 0.405 (10.2) 0.269 0.068 0.00989
1=4 (8) 40 0.540 (13.6) 0.364 0.088 0.02423=8 (10) 40 0.675 (17.1) 0.493 0.091 0.05921=2 (15) 40 0.840 (21.4) 0.622 0.109 0.117
3=4 (20) 40 1.050 (26.9) 0.824 0.113 0.2651 (25) 40 1.315 (33.8) 1.049 0.113 0.53311=4 (32) 40 1.660 (42.4) 1.380 0.140 1.17
11=2 (40) 40 1.900 (48.4) 1.610 0.145 1.822 (50) 40 2.375 (60.2) 2.067 0.154 3.6721=2 (65) 40 2.875 (76.0) 2.469 0.203 6.02
3 (80) 40 3.500 (88.8) 3.068 0.216 11.04 (100) 40 4.500 (114.0) 4.026 0.237 22.95 (125) 40 5.563 (139.6) 5.047 0.258 41.96 (150) 40 6.625 (165.2) 6.065 0.280 68.0
8 (200) 40 8.625 (219.1) 7.981 0.322 1388 (200) 30 8.625 8.071 0.277 14210 (250) 40 10.75 (273.0) 10.020 0.365 247
10 (250) 30 10.75 10.136 0.307 25412 (300) 40 12.75 (323.9) 11.938 0.406 38212 (300) 30 12.75 12.090 0.330 395
a ASTM A53-68, standard pipe.b Schedule numbers are approx. values of 1000�maximum internal service pressure, psig
allowable stress in material, psicF ¼
ffiffiffiffiffiffiffiffiffiffiffiffiffiffiffiffiffiffiffiffiffiffiffiffiffiffiffiffiffiffiffiffiffiffiffiffiffiffiffiffiffiffiffiffiffiffid ð1þ 0:03d þ 3:6=d Þ
pfor use in Spitzglass formula¼ 5=23 for gas line pressure loss.
Source: Adapted from Ref. 13.
Copyright © 2003 Marcel Dekker, Inc.

A:The equivalent diameter of a rectangular duct is given by
di ¼ 2� a� b
aþ b¼ 2� 2� 2:5
4:5
¼ 2:22 ft ¼ 26:64 in:
The friction factor f in turbulent flow region for flow in ducts and pipes is given
by [11]
f ¼ 0:316
Re0:25ð25Þ
We make use of the equivalent diameter calculated earlier [Eq. (14)] while
computing Re:
Re ¼ 15:2W
dim
From Table 7.7 at 300�F, m¼ 0.05 lb=ft h.
Re ¼ 15:2� 25,000
26:64� 0:05¼ 285;285
Hence
f ¼ 0:316
285;2850:25¼ 0:014
For air or flue gases, pressure loss is generally expressed in inches of water
column and not in psi. The following equation gives DPg [11]:
DPg ¼ 93� 10�6 � fW 2vLe
d5ð26Þ
where di is in inches and the specific volume is v ¼ 1=r.
r ¼ 40
460þ 300¼ 0:526 lb=cu ft
Hence
v ¼ 1
0:0526¼ 19 cu ft=lb
Substituting into Eq. (26), we have
DPg ¼ 93� 10�6 � 0:014� 25;0002 � 19� 1000
ð26:64Þ5 ¼ 1:16 in: WC
Copyright © 2003 Marcel Dekker, Inc.

7.24a
Q:Determine the Reynolds number when 500,000 lb=h of superheated steam at
1600 psig and 750�F flows through a pipe of inner diameter 10 in.
A:The viscosity of superheated steam does not vary as much with pressure as it does
with temperature (see Table 7.5).
m ¼ 0:062 lb=ft h
Using Eq. (14), we have
Re ¼ 15:2� W
dim¼ 15:2� 500;000
10� 0:062
¼ 1:25� 107
7.24b
Q:Determine the Reynolds number when hot air flows over a tube bundle.
Air mass velocity¼ 7000 lb=ft2 hTemperature of air film¼ 800�FTube size¼ 2 in. OD
Transverse pitch¼ 4.0 in.
A:The Reynolds number when gas or fluids flow over tube bundles is given by the
expression
Re ¼ Gd
12mð27Þ
where
G¼ fluid mass velocity, lb=ft2 hd¼ tube outer diameter, in.
m¼ gas viscosity, lb=ft h
At 800�F, the air viscosity from Table 7.7 is 0.08 lb=ft h; thus
Re ¼ 7000� 2
12� 0:08¼ 14;580
Copyright © 2003 Marcel Dekker, Inc.

7.25
Q:There are three tubes connected between two headers of a super heater, and it is
required to determine the flow in each parallel pass. The table gives the details of
each pass.
Total steam flow is 15,000 lb=h, and average steam conditions are 800 psia and
750�F.
A:Because the passes are connected between the same headers, the pressure drop in
each will be the same. Also, the total steam flow will be equal to the sum of the
flow in each. That is,
DP1 ¼ DP2 ¼ DP3
In other words, using the pressure drop correlation, we have
W 21 f1
Le1
d5i1¼ W 2
2 f2Le2
d5i2¼ W 2
3 f3Le3
d5i3
and
W1 þW2 þW3 ¼ total flow
The effect of variations in steam properties in the various tubes can be neglected,
because it will not be very significant.
Substituting the data and using f from Table 7.6, we obtain
W1 þW2 þW3 ¼ 15;000
W 21 � 0:0195� 400
25¼ W 2
2 � 0:02� 350
ð1:75Þ5
¼ W 23 � 0:0195� 370
25
¼ a constant
Tube no. (pass no.) Inner diameter (in.) Equivalent length (ft)
1 2.0 4002 1.75 3503 2.0 370
Copyright © 2003 Marcel Dekker, Inc.
Simplifying and solving for flows, we have
W1 ¼ 5353 lb=h; W2 ¼ 4054 lb=h; W3 ¼ 5591 lb=h
This type of calculation is done to check if each pass receives adequate steam
flow to cool it. Note that pass 2 had the least flow, and a metal temperature check
must be performed. If the metal temperature is high, the tube length or tube sizes
must be modified to ensure that the tubes are protected from overheating.
7.26
Q:How is the equivalent length of a piping system determined? 100 ft of a piping
system has three globe valves, a check valve, and three 90� bends. If the line sizeis 2 in., determine the total equivalent length.
A:The total equivalent length is the sum of the developed length of the piping plus
the equivalent lengths of valves, fittings, and bends. Table 7.10 gives the
equivalent length of valves and fittings. A globe valve has 58.6 ft, a check
valve has 17.2 ft, and a 90� bend has 5.17 ft of equivalent length. The equivalent
length of all valves and fittings is
3� 58:6� 17:2þ 3� 5:17 ¼ 208:5 ft
Hence the total equivalent length is ð100þ 208:5Þ ¼ 308:5 ft.
TABLE 7.10 Equivalent Length Le for Valves andFittingsa
Pipe size (in.) 1b 2b 3b 4b
1 0.70 8.70 30.00 2.602 1.40 17.20 60.00 5.203 2.00 25.50 87.00 7.704 2.70 33.50 114.00 10.00
6 4.00 50.50 172.00 15.208 5.30 33.00 225.00 20.0010 6.70 41.80 284.00 25.00
12 8.00 50.00 338.00 30.0016 10.00 62.50 425.00 37.5020 12.50 78.40 533.00 47.00
aLe ¼ Kdi=12f , where di is the pipe inner diameter (in.) and K is
the number of velocity heads (adapted from Crane Technical
Paper 410). f is the Darcy friction factor.b1, Gate valve, fully open; 2, swing check valve, fully open;
3, globe valve, fully open; 4, 90� elbow.
Copyright © 2003 Marcel Dekker, Inc.

7.27
Q:Determine the pressure drop of flue gases and air flowing over a tube bundle
under the following conditions:
Gas mass velocity¼ 7000 lb=ft2 hTube size¼ 2 in. OD
Transverse pitch¼ 4.0 in.
Longitudinal pitch¼ 3.6 in.
Arrangement: in-line
Average gas temperature¼ 800�FNumber of rows deep¼ 30
A:The following procedure may be used to determine gas pressure drop over tube
bundles in in-line and staggered arrangements [11].
DPg ¼ 9:3� 10�10 � fG2 � NH
rgð28Þ
where
G¼ gas mass velocity, lb=ft2 hDPg ¼ gas pressure drop, in. WC
f ¼ friction factor
rg ¼ gas density, lb=cu ft
NH ¼ number of rows deep
For an in-line arrangement for ST=d¼ 1.5–4.0 and for 2000 <Re < 40;000 [12],
f ¼ Re�0:15 0:044þ 0:08SL=d
ðST=d � 1Þ0:43þ1:13d=SL
!ð29Þ
where ST is the transverse pitch and SL is the longitudinal pitch, in.
For a staggered arrangement for ST=d¼ 1.5–4.0,
f ¼ Re�0:16 0:25þ 0:1175
ðST=d � 1Þ1:08� �
ð30Þ
In the absence of information on gas properties, use a molecular weight of
30 for flue gas. Then, from Chapter 5,
rg ¼ 30� 492
359� ð460þ 800Þ ¼ 0:0326 lb=cu ft
Copyright © 2003 Marcel Dekker, Inc.

The viscosity is to be estimated at the gas film temperature. However, it can be
computed at the average gas temperature, and the difference is not significant for
Reynolds number computations.
From Table 7.7, m ¼ 0:08 lb=ft h. From Eq. (27),
Re ¼ Gd
12m¼ 7000� 2
12� 0:08¼ 14;580
From Eq. (29),
f ¼ ð14;580Þ�0:15 0:044þ 0:08� 2
1
� �¼ 0:0484
DPg ¼ 9:3� 10�0 � 0:0484� 70002 � 30
0:0326
¼ 2:03 in:WC
Similarly, using Eq. (30) we can estimate DPg for a staggered arrangement.
Note: The foregoing procedure may be used in the absence of field-tested
data or correlation.
7.28
Q:Determine the gas pressure drop over a bundle of circumferentially finned tubes
in an economizer when
Gas mass velocity of flue gas ¼ 6000 lb=ft2 h
(The method of computing G for plain and finned tubes is discussed in
Chapter 8.)
Average gas temperature¼ 800�FTube size¼ 2.0 in.
Transverse pitch ST ¼ 4.0 in.
Longitudinal pitch SL ¼ 3.6 in.
Number of rows deep NH ¼ 10
A:The equation of Robinson and Briggs [11] may be used in the absence of
site-proven data or correlation provided by the manufacturer for staggered
arrangement:
DPg ¼1:58� 10�8 � G1:684 d0:611 m0:316 ð460þ tÞNH
S0:412T S0:515L �MWð31Þ
Copyright © 2003 Marcel Dekker, Inc.

where
G¼ gas mass velocity, lb=ft hMW¼ gas molecular weight
d¼ tube outer diameter, in.
FðtÞ ¼ m0:316 � ð460þ tÞST ; SL ¼ transverse and longitudinal pitch, in.
FðtÞ is given as a function of gas temperature in Table 7.11. Substituting into Eq.
(31) gives us
DPg ¼ 1:58� 10�8 � 60001:684 � 20:611 � 556
� 10
40:412 � 3:60:515 � 30
¼ 3:0 in:WC
7.29
Q:What is boiler circulation, and how is it determined?
A:The motive force driving the steam–water mixture through boiler tubes (water
tube boilers) or over tubes (in fire tube boilers) is often the difference in density
between the cooler water in the downcomer circuits and the steam–water mixture
in the riser tubes (Fig. 7.4). A thermal head is developed because of this
difference, which forces a certain amount of steam–water mixture through the
system. This head overcomes several losses in the system such as
Friction loss in the downcomers
Friction loss and flow acceleration loss in the risers and connecting pipes to
the drum
TABLE 7.11 F ðtÞVersus t for Air or Flue
Gases
tðF �Þ F ðtÞ200 251400 348600 450
800 5561000 6641200 776
1600 1003
Copyright © 2003 Marcel Dekker, Inc.

FIGURE 7.4 Scheme of natural circulation boiler showing furnace, drum, riser,and downcomer circuits.
Copyright © 2003 Marcel Dekker, Inc.

Gravity loss in the evaporator tubes and the riser system
Losses in the drum internals
Generally, the higher the drum operating pressure, the less the difference
between the densities of water and the steam–water mixture, and hence the lower
the circulation rate.
Circulation ratio (CR) is defined as the ratio between the mass of the
steam–water mixture flowing through the system and the mass of the steam
generated. If CR¼ 15, then a boiler generating 10,000 lb=h of steam would have
150,000 lb=h of steam–water mixture flowing through the downcomers, risers,
internals, etc. The quality of steam at the exit of the riser¼ 1=CR, or 0.067 if
CR¼ 15. In other words, 6.7% would be the average wetness of steam in the
mixture. Low pressure systems have an average CR ranging from 10 to 40. If
there are several parallel circuits for the steam–water mixture, each would have a
different resistance to flow, and hence CR would vary from circuit to circuit. For
natural circulation systems, CR is usually arrived at by trial and error or by
iterative calculation, which first assumes a CR and computes all the losses and
then balances the losses with the available thermal head. This computation is
iterated until the available head and the losses balance.
Sometimes the difference in density between the water and the steam–water
mixture is inadequate to circulate the mixture through the system. In such cases, a
circulation pump is installed at the bottom of the steam drum, which circulates a
desired quantity of mixture through the system (Fig. 7.5). This system is called a
forced circulation system. One has to ensure that there are an adequate number of
FIGURE 7.5 Scheme of forced circulation boiler.
Copyright © 2003 Marcel Dekker, Inc.

pumps to ensure circulation, because the failure of the pump would mean
starvation of flow in the evaporator tubes. Because we are forcing the mixture
through the tubes, the CR is preselected, and the circulating pump is chosen
accordingly. A CR of 3–10 is typical. This system is usually used when the
pressure drop through the evaporator is likely to be high such as when horizontal
tubes are used. When horizontal tubes are used, the critical heat flux to avoid
DNB (departure from nucleate boiling) conditions is lower, so forced circulation
helps to ensure adequate flow inside the tubes. Circulating pumps are also used
when the boiler pressure is high owing to the lower difference in density between
the water and the steam–water mixture.
7.30
Q:What is the main purpose of determining CR?
A:Determination of CR is not the end in itself. The CR value is used to determine
whether a given circuit in the boiler has all the conditions necessary to avoid
departure from nucleate boiling (DNB) problems. For each pressure and quality
(or CR) there is a particular heat flux beyond which the type of boiling may change
from nucleate boiling, which is preferred, to film boiling, which is to be avoided
because it can cause the tube wall temperatures to rise significantly, resulting in
tube failure. DNB occurs at heat fluxes of 100,000–400,000Btu=ft2 h depending
on size and orientation of tubes, pressure, mass velocity, quality, and tube
roughness. DNB occurs at a much lower heat flux in a horizontal tube than in
an equivalent vertical tube because the steam bubble formation and release occurs
more freely and rapidly in vertical tubes than in horizontal tubes, where there is a
possibility of bubbles adhering to the top of the tube and causing overheating.
More information on DNB and circulation can be found in references cited in
Refs. 11 and 14.
Note that the heat flux in finned tubes is much higher than in bare tubes owing
to the large ratio of external to internal surface area; this aspect is also discussed
elsewhere. Hence one has to be careful in designing boilers with extended surfaces
to ensure that the heat flux in the finned tubes does not reach critical levels or
cause DNB. That is why boilers with very high gas inlet temperatures are
designed with a few rows of bare tubes followed by a few rows of low-fin-density
tubes and then high-fin-density tubes. As the gas cools, the heat flux decreases.
7.31a
Q:Describe the procedure for analyzing the circulation system for the water tube
boiler furnace shown in Fig. 7.4.
Copyright © 2003 Marcel Dekker, Inc.

A:First, the thermal data such as energy absorbed, steam generated, pressure, and
geometry of downcomers, evaporator tubes, and risers should be known. These
are obtained from an analysis of furnace performance (see example in Chap. 8).
The circulation ratio (CR) is assumed; then the flow through the system is
computed, followed by estimation of various pressure losses. Thom’s method is
used for evaluating two-phase flow losses [15, 16].
The losses can be estimated as follows. DPf , the friction loss in two-phase
flow (evaporators=risers), is given by
DPf ¼ 4� 10�10 � vff L
diG2
i r3 ð32Þ
The factor r3 is shown in Fig. 7.6. Gi is the tube-side mass velocity in lb=ft2 h.The friction factor used is that of Fanning, which is 0.25 times the Moody friction
factor.
FIGURE 7.6 Thom’s two-phase multiplication factor for friction loss. (See Refs.11, 15, and 16.)
Copyright © 2003 Marcel Dekker, Inc.
DPg , the gravity loss in the heated riser=evaporator, is given by
DPg ¼ 6:95� 10�3 � Lr4
vfð33Þ
where r4 is obtained from Fig. 7.7.
DPa, the acceleration loss, which is significant at lower pressures and at
high mass velocities, is given by
DPa ¼ 1:664� 10�11 � vf � G2i � r2 ð34Þ
Figure 7.8 gives r2.
Single-phase pressure losses such as losses in downcomers are obtained
from
DP ¼ 12� f Le rV 2
2g � di
FIGURE 7.7 Thom’s two-phase multiplication factor for gravity loss. (See Refs.11, 15, and 16.)
Copyright © 2003 Marcel Dekker, Inc.

FIGURE 7.8 Thom’s two-phase multiplication factor for acceleration loss. (See
Refs. 11, 15, and 16.)
Copyright © 2003 Marcel Dekker, Inc.

or
DP ¼ 3:36� 10�6 � f LevW 2
d5i
where
W ¼ flow per tube, lb=hV ¼ fluid velocity, fps
f¼Moody’s friction factor
Le ¼ effective or equivalent length of piping, ft
v¼ specific volume of the fluid, cu ft=lb
The unheated riser losses can be obtained from
DPf ¼ f � 12Ledi
G2i
vf rf
2g � 144ð35Þ
rf is given in Fig. 7.9.
The equivalent lengths have to be obtained after considering the bends,
elbows, etc., in the piping. See Tables 7.10 and 7.12.
FIGURE 7.9 Two-phase friction factor for unheated tubes. (See Refs. 11, 15, and16.)
Copyright © 2003 Marcel Dekker, Inc.

A heat balance is first done around the steam drum to estimate the amount
of liquid heat to be added to the steam–water mixture before the start of boiling.
The mixture is considered to be water until boiling starts.
Once all of the losses are computed, the available head is compared with the
losses. If they match, the assumed circulation rate is correct; otherwise another
iteration is performed. As mentioned before, this method gives an average
circulation rate for a particular circuit. If there are several parallel circuits, then
the CR must be determined for each circuit. The circuit with the lowest CR and
highest heat fluxes should be evaluated for DNB.
In order to analyze for DNB, one may compute the allowable steam quality
at a given location in the evaporator with the actual quality. The system is
considered safe if the allowable quality is higher than the actual quality. The
allowable quality is based on the heat flux, pressure, mass velocity, and roughness
and orientation of the tubes. Studies have been performed to arrive at these
values. Figure 7.10 shows a typical chart [14] that gives the allowable steam
quality as a function of pressure and heat flux. It can be seen that as the pressure
or heat flux increases, the allowable quality decreases. Another criterion for
ensuring that a system is safe is that the actual heat flux on the steam side (inside
tubes in water tube boilers and outside tubes in fire tube boilers) must be lower
than the critical heat flux (CHF) for the particular conditions of pressure, flow,
tube size, roughness, orientation, etc. CHF values are available in the literature;
boiler manufacturers have developed their own CHF correlations based on their
experience. See Chapter 8 for an example.
TABLE 7.12 Le=di , Ratios for Fitting TurbulentFlow
Fitting Le=di
45� elbow 1590� elbow, standard radius 32
90� elbow, medium radius 2690� elbow, long sweep 20180� close-return bend 75
180� medium-radius return bend 50Tee (used as elbow, entering run) 60Tee (used as elbow, entering branch) 90Gate valve, open 7
Gate valve, one-quarter closed 40Gate valve, half-closed 200Gate valve, three-quarters closed 800
Gate valve, open 300Angle valve, open 170
Copyright © 2003 Marcel Dekker, Inc.
FIGURE 7.10 Allowable quality for nucleate boiling at 2700 psia, as a function ofmass velocity and heat flux inside tubes. (From Ref. 14.)
Copyright © 2003 Marcel Dekker, Inc.

7.31b
Q:Compute the circulation ratio and check the system shown in Fig. 7.4 for DNB.
A:Figure 7.4 shows a boiler schematic operating on natural circulation principles.
The basis for estimating the flow through water walls is briefly as follows.
1. Assume a circulation ratio (CR) based on experience. For low pressure
boilers (< 1000 psia), CR could be from 20 to 50. For high pressure
boilers (1000–2700 psia), CR could range from 9 to 5. The following
expression relates circulation ratio and dryness fraction, x:
CR ¼ 1
xð36Þ
Hence, flow through the evaporator¼CR� the steam generated.
2. Furnace thermal performance data such as efficiency, furnace exit
temperature, and feedwater temperature entering the drum should be
known before the start of this exercise, in addition to details such as the
location of the drum, bends, size, and length of various circuits.
3. Mixture enthalpy entering downcomers is calculated as follows
through an energy balance at the drum.
hfw þ CR � he ¼ hg þ CR � hm ð37Þ4. As the flow enters the water walls, it gets heated, and boiling starts after
a particular distance from the bottom of the furnace. This distance is
called boiling height, and it increases as the subcooling increases. It is
calculated as follows.
Lb ¼ L� CR�Ws
hf � hm
Q
Beyond the boiling height, the two-phase flow situation begins.
5. Friction loss in various circuits such as downcomers, connecting
headers, water wall tubes (single-phase, two-phase losses), riser
pipes, and drums are calculated. Gravity losses, DPg, are estimated
along with the acceleration losses, DPa, in a boiling regime. The head
available in the downcomer is calculated and equated with the losses. If
they balance, the assumed CR is correct; otherwise, a revised trial is
made until they balance. Flow through the water wall tubes is thus
estimated.
6. Checks for DNB are made. Actual quality distribution along furnace
height is known. Based on the heat flux distribution (Fig. 7.11), the
Copyright © 2003 Marcel Dekker, Inc.
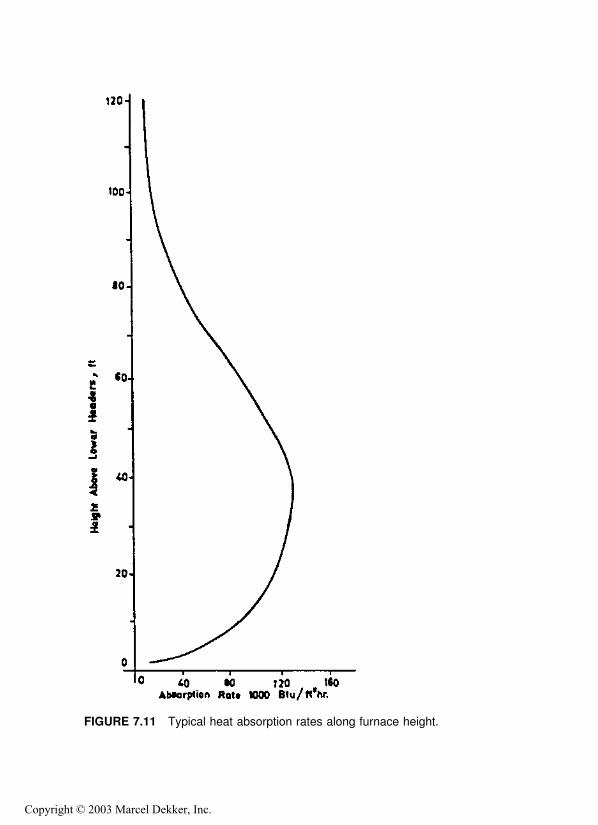
FIGURE 7.11 Typical heat absorption rates along furnace height.
Copyright © 2003 Marcel Dekker, Inc.

allowable quality along the furnace height can be found. If the
allowable quality exceeds actual quality, the design is satisfactory;
otherwise, burnout possibilities exist, and efforts must be made to
improve the flow through water wall tubes.
Example
A coal-fired boiler has a furnace configuration as shown in Fig. 7.4. Following are
the parameters obtained after performing preliminary thermal design:
Steam generated 600,000 lb=hPressure at drum 2700 psia
Feedwater temperature entering drum
from economizer 570�FFurnace absorption 320� 106 Btu=hNumber and size of downcomers 4, 12 in. ID
Number and size of water wall tubes 416, 212in. OD� 0.197 in. thick
Number and size of riser tubes 15, 6 in. ID
Drum ID 54 in.
Furnace projeced area 8400 ft2
Because it is difficult to estimate flow through parallel paths, let us assume that
flow in each tube or circuit of downcomers, water walls, and risers may be near
the average flow values. However, computer programs may be developed that
take care of different circuits. The manual method gives a good idea of the
solution procedure (though approximate).
Method
Let circulation ratio CR¼ 8. Then x¼ 0.125. From the steam tables,
tsat ¼ 680�Fhg ¼ 1069.7 Btu=lbhf ¼ 753.7 Btu=lbvf ¼ 0.0303 cu ft=lbvg ¼ 0.112 cu ft=lbhfw ¼ 568Btu=lb
Enthalpy of steam leaving water walls is
he ¼ 0:125� 1069:7þ 0:875� 753:7 ¼ 793:2 Btu=lb
Copyright © 2003 Marcel Dekker, Inc.

Heat balance around the drum gives
Steam flow ¼ 600;000 lb=h
Water wall, downcomer flow ¼ 8� 600;000
¼ 4;800;000 lb=h
600;000� 568þ 8� 600;000� 793:2 ¼600;000� 1069:7þ 8� 600;000 hm
Hence, hm ¼ 731Btu=lb.From the steam tables,
vm ¼ 0:0286 cu ft=lb
ve ¼ 0:125� 0:112þ 0:875� 0:0303
¼ 0:0405 cu ft=lb
a. DPg ¼ head available ¼ 106=ð0:0286� 144Þ ¼ 25:7 psi.b. DPdc ¼ losses in downcomer circuit.
The downcomer has one 90� bend and one entrance and exit loss.
Using an approximate equivalent length of 7di,
Le ¼ 104þ 16þ ð7� 12Þ ¼ 204 ft
The value fi from Table 7.6 is around 0.013.
Vdc ¼8� 600;000� 0:0286� 576
3600� p� 144� 4¼ 12:1 fps
DPdc ¼0:013� 204� ð12:1Þ2 � 12
2� 32� 12� 0:0286� 144
¼ 1:47 psi
c. Estimate boiling height:
Lb ¼ 100� 8� 600;000� 753:7� 731
320� 106
¼ 31 ft
Hence, up to a height of 31 ft, preheating of water occurs. Boiling
occurs over a length of only 1007 31¼ 69 ft.
Copyright © 2003 Marcel Dekker, Inc.

d. Gravity loss in boiling height:
Vm; mean specific volume ¼ 0:0286þ 0:0303
2
¼ 0:02945 cu ft=lb
DPg ¼31
0:02945� 144¼ 7:3 psi
e. Friction loss in boiling height. Compute velocity through water wall
tubes: di ¼ 2.1 in.
Vw ¼ 8� 600;000� 576� 0:02945
416� p� ð2:1Þ2 � 3600
¼ 3:93 fps
From Table 7.6, fi ¼ 0.019.
One exit loss, one 135� bend, and one 45� bend can be con-
sidered for computing an equivalent length. Le works out to about 45 ft.
DPw ¼ 0:019� 45� ð3:93Þ2 � 12
2� 32� 2:1� 0:02945� 144
¼ 0:28psi
f. Compute losses in two-phase flow, from Figs. 7.6–7.8, for x ¼ 12:5%and P ¼ 2700 psi,
r2 ¼ 0:22; r3 ¼ 1:15; r4 ¼ 0:85
For computing two-phase losses:
DPa ¼ 1:664� 10�11 � vf r2G2i
Gi ¼8� 600,000� 576
416� p� ð2:1Þ2 ¼ 480;000 lb=ft2 h
DPa ¼ 1:664� 10�11 � 0:0303
� ð4:8� 105Þ2 � 0:22 ¼ 0:026 psi
Friction loss,
DPf ¼ 4� 10�10 � 0:0303� 0:0019
4
� 69� ð4:8� 105Þ2 � 1:15
2:1
¼ 0:5 psi
Copyright © 2003 Marcel Dekker, Inc.

Gravity loss,
DPg ¼6:944� 10�3 � 69� 0:85
0:0303¼ 13:4 psi
Total two-phase loss ¼ 0:026þ 0:5þ 13:4
¼ 13.926 psi, or 14.0 psi
g. Riser circuit losses. Use Thom’s method for two-phase unheated tubes.
Let the total equivalent length, considering bends and inlet and exit
losses, be 50 ft.
rf ¼ 1:4 ðFig: 7:9Þ; fi ¼ 0:015 from Table 7.6
Gi ¼576� 8� 600,000
p� 36� 15¼ 1:63� 106 lb=ft2 h
DPf ¼ 0:015� 50� 12
6� ð1:63� 106Þ2
2� 32� 36002
� 1:4
144� 0:0303 ¼ 1:41 psi
Note that in estimating pressure drop by Thom’s method for heated
tubes, the Darcy friction factor was used. For unheated tubes, Moody’s
friction factor could be used. Void fraction a0 from Fig. 7.12¼ 0.36.
DPg ¼ ½rf ð1� a1Þ þ rga0� L
144ð38Þ
DPg ¼1
0:0303� 0:64
� �þ 1
0:112� 0:36
� �� �
� 5
144¼ 0:85 psi
Total losses in riser circuit¼ 1.41 þ 0.85¼ 2.26 psi.
h. Losses in drum. This is a negligible value; use 0.2 psi. (Generally the
supplier of the drums should furnish this figure.)
Total losses ¼ bþ dþ eþ f þ gþ h
¼ 1:47þ 7:3þ 0:28þ 14:0þ 2:26þ 0:2
¼ 25:51 psi
Available head ¼ a ¼ 25:7 psi
Hence, because these two match, an assumed circulation ratio of 8 is
reasonable. This is only an average value for the entire system. If one is
interested in a detailed analysis, the circuits should be separated
Copyright © 2003 Marcel Dekker, Inc.

according to heat loadings, and a rigorous computer analysis balancing
flows and pressure drop in each circuit can be carried out.
Analysis for DNB
Typical furnace absorption profiles for the actual fuel fired are desirable for DNB
analysis. These data are generally based on field tests, but for the problem at hand
let us use Fig. 7.11, which gives typical absorption profiles for a boiler.
Average heat flux ¼ furnace absorption
furnace projected area¼ 320� 106
8400
¼ 38,095 Btu/ft2 h
There is a variation at any plan cross section of a boiler furnace between the
maximum heat flux and the average heat flux, based on the burner location,
burners in operation, excess air used, etc. This ratio between maximum and
average could be 20–30%. Let us use 25%.
Again, the absorption profile along furnace height shows a peak at some
distance above the burner where maximum heat release has occurred. It decreases
as the products of combustion leave the furnace. The average for the entire profile
FIGURE 7.12 Void fraction as a function of quality and pressure for steam [SeeRefs. 11, 16].
Copyright © 2003 Marcel Dekker, Inc.

may be found, and the ratio of actual to average heat flux should be computed.
For the sake of illustration, use the following ratios of actual to average heat flux
at the locations mentioned.
We must determine the maximum inside heat flux at each of the locations
and correct it for flux inside the tubes to check for DNB. Hence, considering the
tube OD=ID ratio of 1.19 and the 25% nonuniformity at each furnace elevation,
we have the following local maximum inside heat flux at the locations mentioned
ðqi is taken as qp � d=diÞ :
It is desirable to obtain allowable quality of steam at each of these locations
and check to be sure actual quality does not exceed it.
DNB tests based on particular tube profiles, roughness, and water quality as
used in the operation give the most realistic data for checking furnace tube
burnout. Correlations, though available in the literature, may give a completely
wrong picture because they are based on tube size, heating pattern, water quality,
and tube roughness that may not tally with actual operating conditions. However,
they give the trend, which could be useful. For the sake of illustrating our
example, let us use Fig. 7.10. This gives a good estimate only, because
Distance from
bottom (ft)
Ratio of actual to
average heat flux
40 1.456 1.6
70 1.080 0.9
100 0.4
Location (ft) qi (Btu=ft2 h)
40 1.4� 38,095� 1.25� 1.19¼ 79,33556 90,44070 56,525
80 50,872100 22,600
Copyright © 2003 Marcel Dekker, Inc.

extrapolation must be carried out for the low heat flux in our case. We see the
following trend at Gi ¼ 480,000 lb=ft2 h and 2700 psia:
Figure 7.13 shows the actual quality (assuming linear variation, perhaps in
reality quadratic) versus allowable quality. It shows that a large safety margin
exists; hence, the design is safe. This exercise should be carried out at all loads
(and for all circuits) before coming to a conclusion.
7.32a
Q:How is the circulation system analyzed in fire tube boilers?
A:The procedure is similar to that followed for water tube boilers in that the CR is
assumed and the various losses are computed. If the losses associated with the
assumed CR and the resulting mass flow are in balance with the available head,
then the assumed CR is correct; otherwise another iteration is done. Because fire
tube boilers in general use horizontal tubes, the allowable heat flux to avoid DNB
is lower than when vertical tubes are used. With gas streams containing hydrogen
and steam as in hydrogen plant waste heat boilers, the tube-side and hence the
overall heat transfer coefficient and heat flux will be rather high compared to flue
gas stream from combustion of fossil fuels. Typical allowable heat fluxes for
horizontal tubes range from 100,000 to 150,000Btu=ft2 h.
7.32b
Q:Perform the circulation calculations for the system shown in Fig. 7.14 with the
following data:
Steam flow ¼ 20;000 lb=h; steam pressure ¼ 400 psig
Assume that saturated water enters the drum.
Location (ft) Allowable quality (%)
40 2556 2270 30
80 34100 42
Copyright © 2003 Marcel Dekker, Inc.
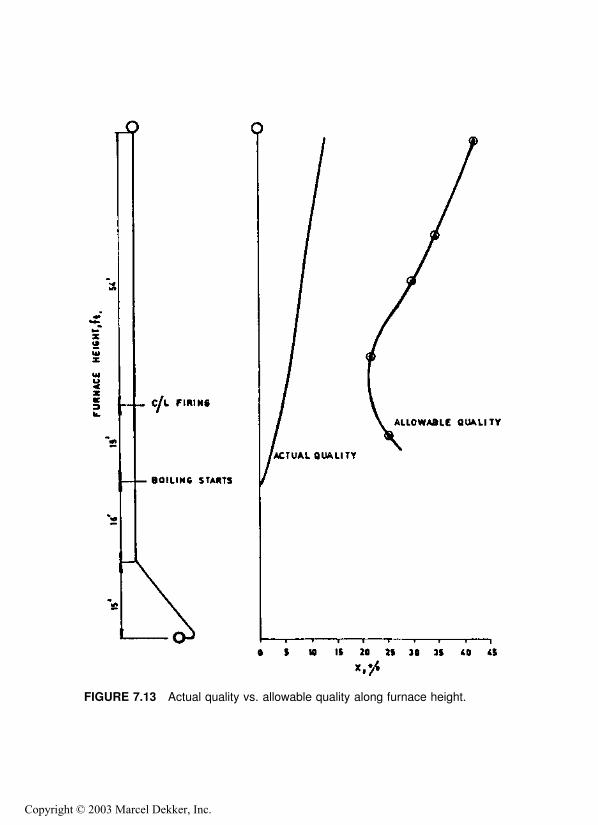
FIGURE 7.13 Actual quality vs. allowable quality along furnace height.
Copyright © 2003 Marcel Dekker, Inc.
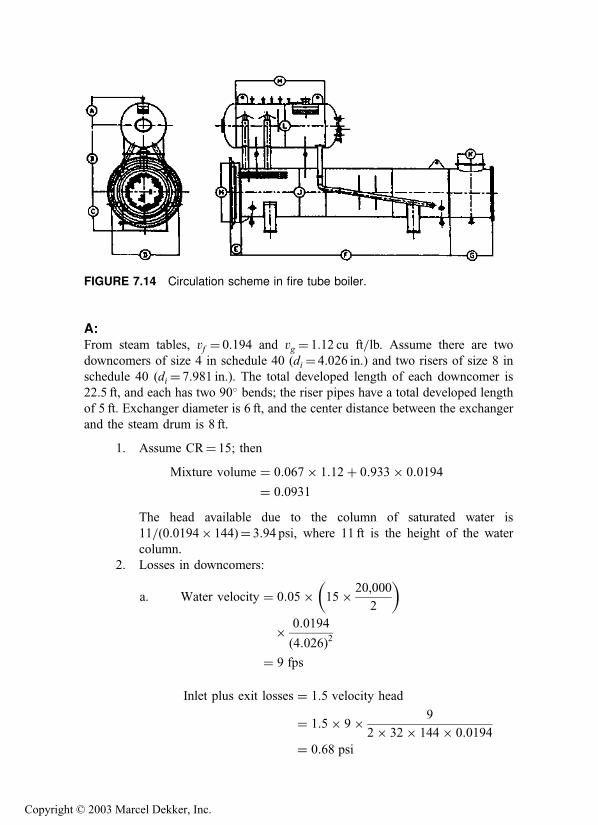
A:From steam tables, vf ¼ 0.194 and vg ¼ 1.12 cu ft=lb. Assume there are two
downcomers of size 4 in schedule 40 (di ¼ 4.026 in.) and two risers of size 8 in
schedule 40 (di ¼ 7.981 in.). The total developed length of each downcomer is
22.5 ft, and each has two 90� bends; the riser pipes have a total developed length
of 5 ft. Exchanger diameter is 6 ft, and the center distance between the exchanger
and the steam drum is 8 ft.
1. Assume CR¼ 15; then
Mixture volume ¼ 0:067� 1:12þ 0:933� 0:0194
¼ 0:0931
The head available due to the column of saturated water is
11=(0.0194� 144)¼ 3.94 psi, where 11 ft is the height of the water
column.
2. Losses in downcomers:
a. Water velocity ¼ 0:05� 15� 20,000
2
� �
� 0:0194
ð4:026Þ2¼ 9 fps
Inlet plus exit losses ¼ 1:5 velocity head
¼ 1:5� 9� 9
2� 32� 144� 0:0194
¼ 0:68 psi
FIGURE 7.14 Circulation scheme in fire tube boiler.
Copyright © 2003 Marcel Dekker, Inc.

b. Total developed length¼ 22.5 þ 2� 10¼ 42.5 ft, where 10 ft is
the equivalent length of a 90� bend from Table 7.10.
DPf ¼ 3:36� 0:0165� 15� 20
2
� �2
� 42:5� 0:0194
ð4:026Þ5¼ 0:98 psi
where 0.0165 is the friction factor. Equation (13) was used for pressure
drop of single-phase flow.
Total downcomer losses ¼ 0:68þ 0:98
¼ 1:66 psi
3. Friction and acceleration losses in the exchanger may be neglected for
this first trial, because in a fire tube boiler they will be negligible due to
the low mass velocity.
4. Gravity losses in the exchanger: Using Fig. 7.7, r4 ¼ 0.57.
DPg ¼ 0:00695� 6� 0:57
0:0194¼ 1:22 psi
5. Gravity loss in riser pipe:
DPg ¼5
0:0931� 144¼ 0:37 psi
6. Friction loss in riser:
Velocity ¼ 0:05� 15� 20;000
2
� �� 0:0931
ð7:981Þ2 ¼ 11 fps
Inlet plus exit losses ¼ 1:5� velocity head
¼ 1:5� 11� 11
2� 32� 0:0931� 144¼ 0:21 psi
Friction loss ¼ 3:36� 0:014� 15� 20
2
� �2
� 5� 0:0931
ð7:981Þ5 ¼ 0:02 psi
where 5 ft is the developed length of the riser.
Copyright © 2003 Marcel Dekker, Inc.
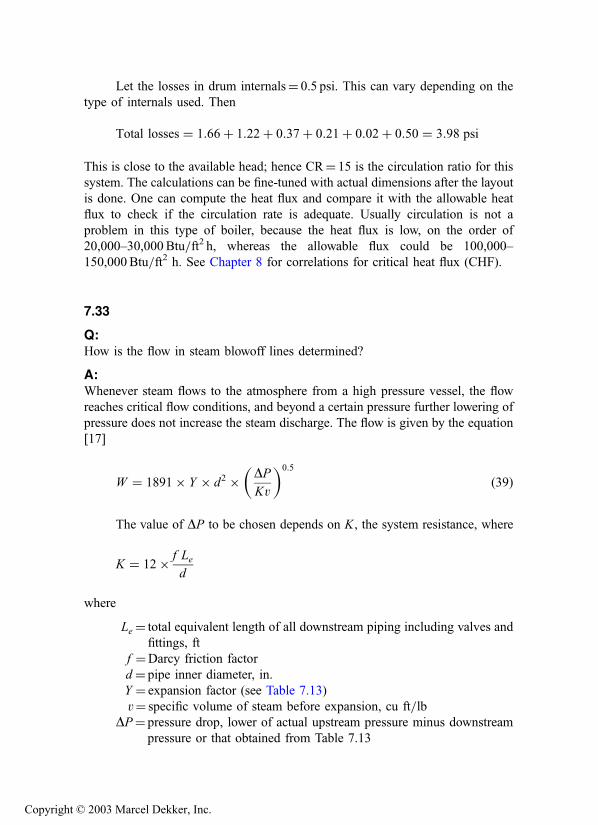
Let the losses in drum internals¼ 0.5 psi. This can vary depending on the
type of internals used. Then
Total losses ¼ 1:66þ 1:22þ 0:37þ 0:21þ 0:02þ 0:50 ¼ 3:98 psi
This is close to the available head; hence CR¼ 15 is the circulation ratio for this
system. The calculations can be fine-tuned with actual dimensions after the layout
is done. One can compute the heat flux and compare it with the allowable heat
flux to check if the circulation rate is adequate. Usually circulation is not a
problem in this type of boiler, because the heat flux is low, on the order of
20,000–30,000 Btu=ft2 h, whereas the allowable flux could be 100,000–
150,000 Btu=ft2 h. See Chapter 8 for correlations for critical heat flux (CHF).
7.33
Q:How is the flow in steam blowoff lines determined?
A:Whenever steam flows to the atmosphere from a high pressure vessel, the flow
reaches critical flow conditions, and beyond a certain pressure further lowering of
pressure does not increase the steam discharge. The flow is given by the equation
[17]
W ¼ 1891� Y � d2 ��DPKv
�0:5
ð39Þ
The value of DP to be chosen depends on K, the system resistance, where
K ¼ 12� f Le
d
where
Le ¼ total equivalent length of all downstream piping including valves and
fittings, ft
f ¼Darcy friction factor
d¼ pipe inner diameter, in.
Y ¼ expansion factor (see Table 7.13)
v¼ specific volume of steam before expansion, cu ft=lbDP¼ pressure drop, lower of actual upstream pressure minus downstream
pressure or that obtained from Table 7.13
Copyright © 2003 Marcel Dekker, Inc.

Example
Determine the flow of saturated steam from a vessel at 170 psia to the atmosphere
if the total equivalent system resistance K ¼ 10 and pipe inner diameter¼2.067 in.
Solution. Specific volume of steam at 170 psia¼ 2.674 ft3=lb. Actual
DP¼ 1707 14.7¼ 155.3 psia. From Table 7.13, for K ¼ 10, DP=P1 ¼ 0.773,
or DP¼ 170� 0.773¼ 131.5 psia. Hence, use DP¼ 131.5 psia. Also from Table
7.13 for K ¼ 10, Y ¼ 0.705. Hence
W ¼ 1891:0� 0:705� ð2:067Þ2 ��
131:5
10� 2:674
�0:5
¼ 12;630 lb=h
7.34
Q:How is the flow through boiler blowdown lines determined?
A:Sizing of blowdown or drain lines is very important in boiler or process plant
operations.
The problem of estimating the discharge rates from a boiler drum or vessel
to the atmosphere or to a vessel at low pressures involves two-phase flow
calculations and is a lengthy procedure [18].
TABLE 7.13 Limiting Factors for SonicVelocity k ¼ 1.3
K DP=P 01 Y
1.2 0.525 0.6121.5 0.550 0.6312.0 0.593 0.635
3 0.642 0.6584 0.678 0.6706 0.722 0.6858 0.750 0.698
10 0.773 0.70515 0.807 0.71820 0.831 0.718
40 0.877 0.718100 0.920 0.718
Copyright © 2003 Marcel Dekker, Inc.
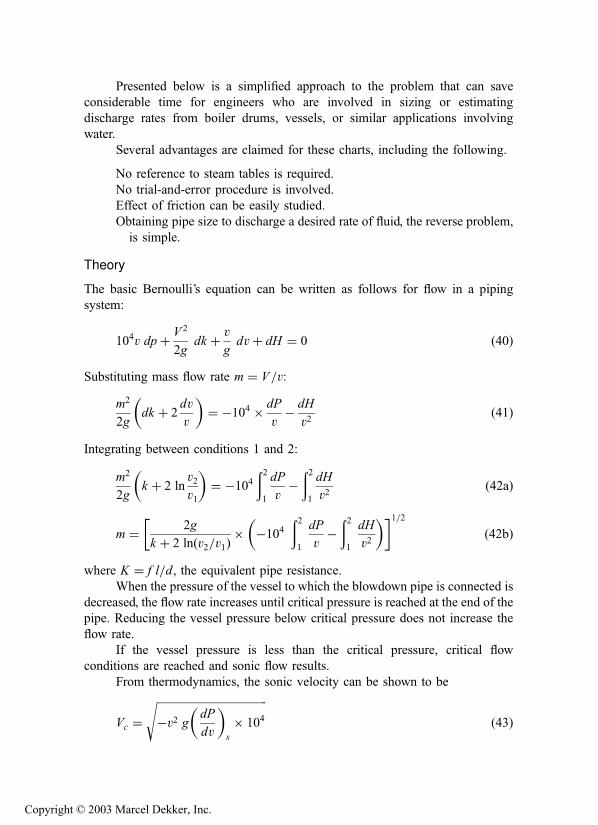
Presented below is a simplified approach to the problem that can save
considerable time for engineers who are involved in sizing or estimating
discharge rates from boiler drums, vessels, or similar applications involving
water.
Several advantages are claimed for these charts, including the following.
No reference to steam tables is required.
No trial-and-error procedure is involved.
Effect of friction can be easily studied.
Obtaining pipe size to discharge a desired rate of fluid, the reverse problem,
is simple.
Theory
The basic Bernoulli’s equation can be written as follows for flow in a piping
system:
104v dpþ V 2
2gdk þ v
gdvþ dH ¼ 0 ð40Þ
Substituting mass flow rate m ¼ V=v:
m2
2g
�dk þ 2
dv
v
�¼ �104 � dP
v� dH
v2ð41Þ
Integrating between conditions 1 and 2:
m2
2gk þ 2 ln
v2v1
� �¼ �104
ð21
dP
v�ð21
dH
v2ð42aÞ
m ¼ 2g
k þ 2 lnðv2=v1Þ� �104
ð21
dP
v�ð21
dH
v2
� �� �1=2ð42bÞ
where K ¼ f l=d, the equivalent pipe resistance.
When the pressure of the vessel to which the blowdown pipe is connected is
decreased, the flow rate increases until critical pressure is reached at the end of the
pipe. Reducing the vessel pressure below critical pressure does not increase the
flow rate.
If the vessel pressure is less than the critical pressure, critical flow
conditions are reached and sonic flow results.
From thermodynamics, the sonic velocity can be shown to be
Vc ¼ffiffiffiffiffiffiffiffiffiffiffiffiffiffiffiffiffiffiffiffiffiffiffiffiffiffiffiffiffiffiffiffiffiffiffiffiffiffiffiffi�v2 g
�dP
dv
�s
� 104
sð43Þ
Copyright © 2003 Marcel Dekker, Inc.

and
mc ¼ 100
ffiffiffiffiffiffiffiffiffiffiffiffiffiffiffiffiffiffiffiffiffiffi�g
�dP
dv
�s
sð44Þ
The term ðdP=dvÞs refers to the change in pressure-to-volume ratio at
critical flow conditions at constant entropy.
Hence, in order to estimate mc, Eqs. (42) and (44) have to be solved. This is
an iterative procedure. For the sake of simplicity, the term involving the height
differences will be neglected. For high pressure systems the error in neglecting
this term is marginal, on the order of 5%.
The problem is, then, given K and Ps, to estimate Pc and m. This is a trial-
and-error procedure, and the steps are outlined below, followed by an example.
Figs. 7.16 and 7.17 are two charts that can be used for quick sizing purposes.
1. Assume a value for Pc.
2. Calculate ðdP=dvÞs at Pc for constant-entropy conditions. The volume
change corresponding to 2–3% of Pc can be calculated, and then
ðdP=dvÞs can be obtained.
3. Calculate mc using Eq. (44).
4. Solve Eq. (42b) for m.
The term �10�4Ð 21dP=v is computed as follows using Simpson’s rule:
�104ð21
dP
v¼ �104
ð21
r dP
¼ Ps � Pc
6� ðrs þ 4 rm þ rcÞ
where rm ¼ density at a mean pressure of ðPs þ PcÞ=2.The densities are computed as isenthalpic conditions. The term 2 ln
ðv2=v1Þ ¼ 2 ln ðrs=rcÞ is then found.
Then m is computed using Eq. (42b). If the m values computed using Eqs.
(42b) and (44) tally, then the assumed Pc and the resultant mc are correct.
Otherwise Pc has to be changed, and all steps have to be repeated until m and mc
agree.
Example
A boiler drum blowdown line is connected to a tank set at 8 atm. Drum pressure is
100 atm, and the resistance K of the blowdown line is 80. Estimate the critical
mass flow rate mc and the critical pressure Pc.
The procedure will be detailed for an assumed pressure Pc of 40 atm.
For steam table Ps ¼ 100 atm, s¼ 0.7983 kcal=kg �C; hl ¼ 334 kcal=kg,vl ¼ 0.001445m3=kg, or r¼ 692 kg=m3.
Copyright © 2003 Marcel Dekker, Inc.

Let rc ¼ 40 atm; then hl ¼ 258.2 kcal=kg, hv ¼ 669 kcal=kg, Sl ¼ 0.6649,
Sv ¼ 1.4513, vl ¼ 0.001249, vv ¼ 0.05078.
Hence:
x ¼ S � Sl
Sv � Sl¼ 0:7983� 0:6649
1:4513� 0:6649
¼ 0:1696
v ¼ vl þ xðvv � vlÞ¼ 0:001249þ 0:1696� ð0:05078� 0:001249Þ¼ 0:009651 m3=kg
Again, compute v at 41 atm (2.5% more than Pc). Using steps similar to
those described above, v¼ 0.0093m3=kg.Hence,
mc ¼ 100
ffiffiffiffiffiffiffiffiffiffiffiffiffiffiffiffiffiffiffiffi�g
dP
dv
� �s
s
¼ 100
ffiffiffiffiffiffiffiffiffiffiffiffiffiffiffiffiffiffiffiffiffiffiffiffiffiffiffiffiffiffiffiffiffiffiffi9:8� 1
0:00965 � 0:0093
r¼ 16;733 kg=m2 s
Compute the densities as
rs ¼1
0:001445¼ 692 kg=m3
The dryness fraction at 40 atm at isenthalphic condition is
x ¼ 334� 258:2
669� 258:2¼ 0:1845
vc ¼ 0:001249þ 0:1845� ð0:05078� 0:001249Þ¼ 0:010387 m3=kg
rc ¼ 96:3 kg=m3
Similarly, at Pm ¼ (100 þ 40)=2¼ 70 atm,
vm ¼ 0:03785 m3=kg or rm ¼ 264 kg=m3
�104ð21
dP
v¼ 100� 40
6� ð692þ 4� 264þ 96:3Þ
¼ 184� 106 � 2� lnv2v1
¼ 2� lnrsrc
¼ 4:6
Copyright © 2003 Marcel Dekker, Inc.

Substituting the various quantities into Eq. (42b),
m ¼ffiffiffiffiffiffiffiffiffiffiffiffiffiffiffiffiffiffiffiffiffiffiffiffiffiffiffiffiffiffiffiffiffiffiffiffiffiffiffiffiffiffiffi2� 9:8
80þ 4:6� 184� 106
r¼ 6530 kg=m2 s
The two values m and mc do not agree. Hence we have to repeat the calculations
for another Pc.
This has been done for Pc ¼ 30 and 15, and the results are presented in Fig.
7.15. At about 19 atm, the two curves intersect, and the mass flow rate is about
7000 kg=m2 s. However, one may do the calculations at this pressure and check.
Use of Charts
As seen above, the procedure is lengthy and tedious, and trial and error is
involved. Also, reference to steam tables makes it cumbersome. Hence with
various K values and initial pressure Ps, a calculator was used to solve for Pc and
m, and the results are presented in Figs. 7.16 and 7.17.
FIGURE 7.15 Calculation results.
Copyright © 2003 Marcel Dekker, Inc.
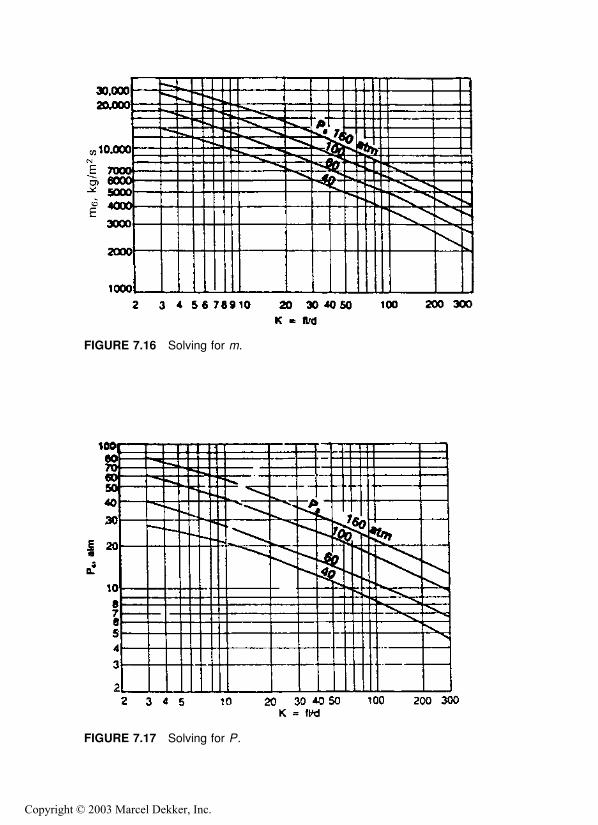
FIGURE 7.16 Solving for m.
FIGURE 7.17 Solving for P.
Copyright © 2003 Marcel Dekker, Inc.
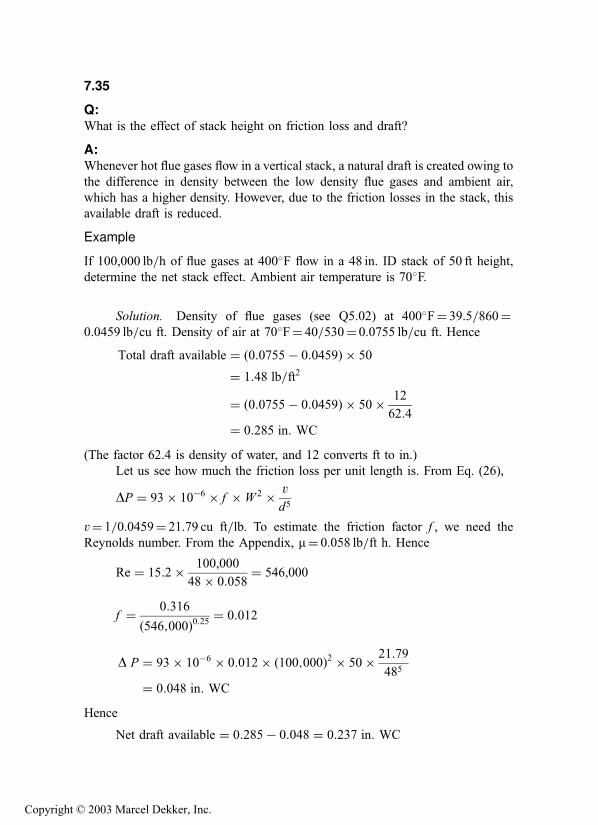
7.35
Q:What is the effect of stack height on friction loss and draft?
A:Whenever hot flue gases flow in a vertical stack, a natural draft is created owing to
the difference in density between the low density flue gases and ambient air,
which has a higher density. However, due to the friction losses in the stack, this
available draft is reduced.
Example
If 100,000 lb=h of flue gases at 400�F flow in a 48 in. ID stack of 50 ft height,
determine the net stack effect. Ambient air temperature is 70�F.
Solution. Density of flue gases (see Q5.02) at 400�F¼ 39.5=860¼0.0459 lb=cu ft. Density of air at 70�F¼ 40=530¼ 0.0755 lb=cu ft. Hence
Total draft available ¼ ð0:0755� 0:0459Þ � 50
¼ 1:48 lb=ft2
¼ ð0:0755� 0:0459Þ � 50� 12
62:4
¼ 0:285 in: WC
(The factor 62.4 is density of water, and 12 converts ft to in.)
Let us see how much the friction loss per unit length is. From Eq. (26),
DP ¼ 93� 10�6 � f �W 2 � v
d5
v¼ 1=0.0459¼ 21.79 cu ft=lb. To estimate the friction factor f , we need the
Reynolds number. From the Appendix, m¼ 0.058 lb=ft h. Hence
Re ¼ 15:2� 100,000
48� 0:058¼ 546,000
f ¼ 0:316
ð546;000Þ0:25 ¼ 0:012
D P ¼ 93� 10�6 � 0:012� ð100;000Þ2 � 50� 21:79
485
¼ 0:048 in: WC
Hence
Net draft available ¼ 0:285� 0:048 ¼ 0:237 in: WC
Copyright © 2003 Marcel Dekker, Inc.

7.36
Q:Discuss the flow instability problem in boiler evaporators.
A:In once-through boilers or evaporators generating steam at high quality, the
problem of flow instability is often a concern. This is due to the nature of the two-
phase pressure drop characteristics inside tubes, which can have a negative slope
with respect to flow under certain conditions. The problem is felt when multiple
streams are connected to common header systems as in once-through or forced
circulation systems. Small perturbations can cause large changes in flow through
a few tubes, resulting in possible dryout or overheating conditions. Vibration can
also occur. The problem has been observed in a few low pressure systems
generating steam at high quality.
To illustrate the problem, let us take up the example of steam generation
inside a tube. For the sake of analysis, a few assumptions will be made:
Heat flux is uniform along the length of the tube,
Steam at the exit of the tube has a quality x,
Some subcooling of feedwater is present. That is, the feedwater enters the
boiler at less than the saturation temperature.
We are considering a long straight tube without bends to describe the nature
of the problem.
If a tube is supplied with subcooled water, the boiling starts after the enthalpy
of the water has risen to the saturated liquid level. Thus the length of the boiler
can be divided into two portions, the economizer portion and the evaporator, their
lengths being determined by the heat input to their respective sections.
Let W be the flow of water entering in lb=h. Let Q¼ total heat input to the
evaporator and Ql the heat input per unit length, Btu=ft h. The steam quality at the
exit of the evaporator is x, fraction. Let the economizer length be L1 ft. The
pressure drop DP1 in the economizer section is
D P1 ¼ 3:36f L1W2vf =d
5i ð45Þ
where
L1 ¼ WDh=Ql ð46ÞDh¼ enthalpy absorbed by water in the economizer portion, Btu=lbvf ¼ average specific volume of water in the economizer, ft3=lb
In Eq. (46) we are simply using the fact that heat addition is uniform along the
tube length.
di ¼ tube inner diameter, in.
Copyright © 2003 Marcel Dekker, Inc.

The pressure drop in the evaporator region of length L� L1 is given by
DP2 ¼ 3:36f ðL� L1ÞW 2vf þ xðvg � vf Þ=2
d5ið47Þ
Now
xhfg
Dh¼ L� L1
L1ð48Þ
because the heat applied is uniform along the evaporator length, and we are
simply taking the ratio of energy absorbed in the evaporator and economizer,
which is proportional to their lengths.
hfg ¼ latent heat of vaporization, Btu=lbvg; vf ¼ specific volume of saturated liquid and vapor, ft3=lb
Now substituting for x from Eq. (48) in. to Eq. (47) and for L1 from Eq.
(46) and simplifying the above equations, we can obtain the total pressure drop as
follows.
DP ¼ DP1 þ DP2
¼ kW 3Dh2vg � vf
2Qlhfg� kW 2 Dh
vg � vf
hfg� vf
!þ kWL2Ql
vg � vf
2hfg
ð49Þor
DP ¼ AW 3 � BW 2 þ CW ð50ÞThough this is a simplistic analysis for two-phase flow pressure drop, it may be
used to show the effect of the variables on the process.
Equation (50) is shown in Fig. 7.18. It is seen that the curve of pressure
drop versus flow is not monotonic but has a negative slope. This is more so if the
steam pressure is low. Hence it may lead to unstable conditions. For example, at
the pressure drop condition shown by the horizontal line, there could be three
possible operating points, which may cause oscillations and large variations in
flow through the circuit. This is likely if multiple streams are connected between
headers, where a few tubes can receive very small flows, causing tube overheating
concerns and possible DNB conditions.
To improve the situation, one may add a restriction such as a control valve
or orifice at the inlet to the economizer section. The orifice increases the
resistance in proportion to the square of the flow as shown by the term R in
Eq. (51). Figure 7.18a also shows the effect of the orifice, which makes the
pressure drop curve monotonic.
DP ¼ AW 3 þ ðR� BÞW 2 þ CW ð51Þ
Copyright © 2003 Marcel Dekker, Inc.
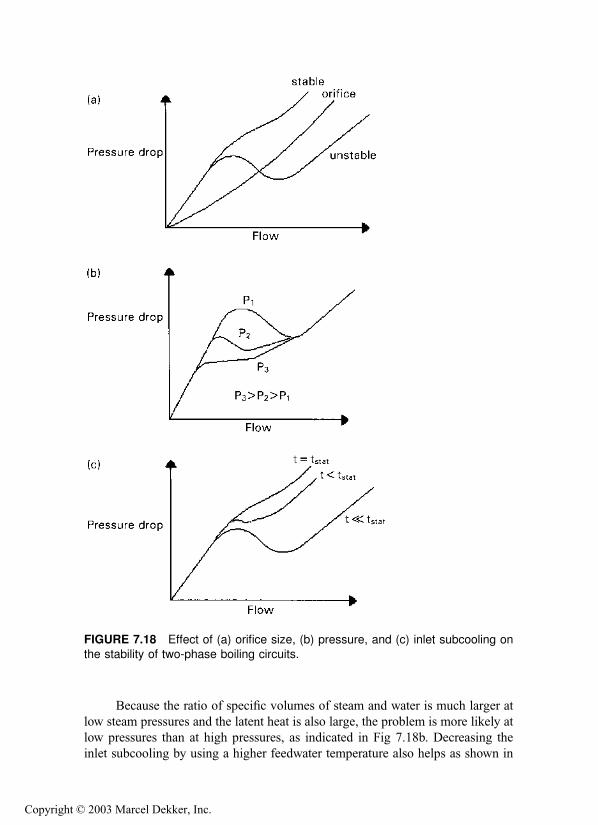
Because the ratio of specific volumes of steam and water is much larger at
low steam pressures and the latent heat is also large, the problem is more likely at
low pressures than at high pressures, as indicated in Fig 7.18b. Decreasing the
inlet subcooling by using a higher feedwater temperature also helps as shown in
FIGURE 7.18 Effect of (a) orifice size, (b) pressure, and (c) inlet subcooling on
the stability of two-phase boiling circuits.
Copyright © 2003 Marcel Dekker, Inc.

Fig. 7.18c. If inlet subcooling is eliminated, Dh ¼ 0 and then Eq. (50) becomes
more stable as shown by the equation
DP ¼ BW 2 þ CW ð52Þ
NOMENCLATURE
A Area of orifice, in.2
C A constant depending on ratio of gas specific heats
CR Circulation ratio
Cd Discharge coefficient
Cv Control valve coefficient
d Tube or pipe outer diameter, in.
do; di Orifice diameter and pipe or duct inner diameter, in.
E Expansion factor for fuel oils
f Friction factor
G Gas mass velocity, lb=ft2 hh Differential pressure across flow meter, in. WC
he Enthalpy of mixture at exit, Btu=lbhf ; hg; hm; hfw Enthalpy of saturated liquid, saturated steam, mixture, and
feedwater, Btu=lbK System resistance
Km Valve recovery coefficient
Ksh Superheat correction factor
L Length of pipe, ft
Le Equivalent length, ft
M Constant used in Q7.25
mc mass flow at critical condition, kg=m2 s
MW Molecular weight of gas or vapor
NH Number of rows deep in a tube bundle
Pa Accumulated inlet pressure, psia
Pb Backpressure, psig
Ps Set pressure, psig
Pv Vapor pressure, psia
P1;P2 Inlet and exit pressures, psia
DP Pressure drop, psi
DPg Gas pressure drop, in. WC
DPa;DPf ;DPg Acceleration loss, friction loss, and loss due to gravity, psi
q Fluid flow, gpm
Re Reynolds number
r2; r3; r4; rf Factors used in two-phase pressure drop calculation
S Entropy
s Specific gravity of fluid
Copyright © 2003 Marcel Dekker, Inc.

ST ; SL Transverse and longitudinal pitch, in.
t; T Fluid temperature, �F or �Rts Saturation temperature, �Fv Specific volume of fluid, cu ft=lbVc Critical velocity, m=sV Fluid velocity, ft=svf ; vg; vm Specific volume of saturated liquid, steam, and mixture, cu ft=lbW Flow, lb=hx Steam quality, fraction
y Volume fraction of gas
Y Expansion factor
b do=di ratiom Fluid viscosity, lb=ft hr Density of fluid, lb=cu ft; subscript g stands for gas
m Specific volume of fluid, m3=kg
REFERENCES
1. V Ganapathy. Determining flowmeter sizes. Plant Engineering, Sept 18, 1980, p 127.
2. Chemical Engineers’ Handbook. 5th ed. New York: McGraw-Hill, 1974, pp 5–7.
3. VGanapathy. Converting pitot tube readings. Plant Engineering, June 24, 1982, p 61.
4. ASME. Boiler and Pressure Vessel Code, Sec. 1. New York: ASME, 1980, pp 59, 67.
5. Crosby Valve Catalog 402. Crosby, Wrentham, MA, 1968, p 27.
6. ASME. Boiler and Pressure Vessel Code, Sec. 8. New York: ASME, 1980, Appendix
11, p 455.
7. V Ganapathy. Control valve coefficients. Plant Engineering, Aug 20, 1981, p 80.
8. V Ganapathy. Nomogram estimates control valve coefficients. Power Engineering,
December 1978, p 60.
9. FD Jury. Fundamentals of Valve Sizing for Liquids. Fisher Tech Monograph 30.
Marshalltown, IA: Fisher Controls Co., 1974, p 2.
10. Masoneilan. Handbook for Control Valve Sizing. 6th ed. Norwood, MA: 1977, p 3.
11. VGanapathy. Applied Heat Transfer. Tulsa, OK: PennWell Books, 1982, pp 500–530.
12. VGanapathy. Chart speeds estimates of gas pressure drop. Oil and Gas Journal, Feb 4,
1980, p 71.
13. North American Combustion Handbook. 2nd ed. Cleveland, OH: North American
Mfg. Co., 1978, pp 20–25.
14. Babcock and Wilcox. Stream: Its Generation and Use. 38th ed.
15. JRS Thom. Prediction of pressure drop during forced circulation boiling of water.
International Journal of Heat Transfer 7: 1964.
16. W Roshenow, JP Hartnett. Handbook of Heat Transfer. New York: McGraw-Hill,
1972.
17. Crane Company Technical Paper 410.
18. FJ Moody. Maximum two-phase vessel blowdown from pipes. Transactions of
ASME, Journal of Heat Transfer, August 1966, p 285.
Copyright © 2003 Marcel Dekker, Inc.

8
Heat Transfer Equipment Design andPerformance
8.01 Estimating surface area of heat transfer equipment; overall heat trans-
fer coefficient; approximating overall heat transfer coefficient in water
tube boilers, fire tube boilers, and air heaters; log-mean temperature
difference
8.02 Estimating tube-side heat transfer coefficient; simplified expression for
estimating tube-side coefficient
8.03 Estimating tube-side coefficient for air, flue gas, water, and steam
8.04 Estimating heat transfer coefficient outside tubes
8.05 Estimating convective heat transfer coefficient outside tubes using
Grimson’s correlations
8.06 Effect of in-line vs. staggered arrangement
8.07a Evaluating nonluminous radiation heat transfer using Hottel’s charts
8.07b Nonluminous radiation using equations
8.08a Predicting heat transfer in boiler furnaces
8.08b Design of radiant section for heat recovery application
8.09a Evaluating distribution of radiation to tube banks
8.09b Estimating the temperature of a lance inside boiler enclosure
8.10 Sizing fire tube boilers
8.11 Effect of gas velocity, tube size on fire tube boiler size
Copyright © 2003 Marcel Dekker, Inc.
8.12 Computing heat flux, tube wall temperatures
8.13 Effect of scale formation on tube wall temperature and boiler perfor-
mance
8.14 Design of water tube boilers
8.15a Predicting off-design performance
8.15b Logic for off-design performance evaluation for water tube boilers
8.16 Estimating metal temperature in a boiler superheater tube; thermal
resistances in heat transfer; calculating heat flux
8.17 Predicting performance of fire tube and water tube boilers
8.18 Why finned tubes are used and their design aspects
8.19a Heat transfer and pressure drop in finned tubes using ESCOA correla-
tions
8.19b Heat transfer in finned tubes using Briggs and Young correlation
8.19c Predicting the performance of a finned tube superheater
8.20 Sizing of finned tube evaporator
8.21 Comparison of bare tube and finned tube boilers
8.22 In-line versus staggered arrangement
8.23 Effect of tube-side heat transfer on fin configuration
8.24 Effect of tube-side fouling on bare and finned tube boilers
8.25 Estimating weight of finned tubes
8.26 Effect of fin thickness and conductivity on boiler performance and tube
and fin tip temperatures
8.27a Is surface area an important criterion for boiler selection?
8.27b Optimization of a finned evaporator surface
8.28 Design of tubular air heaters
8.29 Off-design performance of air heaters
8.30 Predicting performance of economizers using NTU method
8.31 Evaluating natural convection heat transfer coefficients in air
8.32 Natural convection heat transfer in liquids
8.33 Determining size of coil=tube bundle immersed in liquids
8.34 Evaluating gas=steam temperature profiles in HRSGs
8.35a Simulating off-design performance
8.35b A simplified approach to determining auxiliary fuel requirement in an
HRSG
8.36 Why gas exit temperature cannot be assumed in HRSGs
8.37 How to optimize temperature profiles in HRSGs
8.38 Efficiency of HRSGs according to ASME Power Test Code
8.39a Effect of fresh air fan size on HRSG performance
8.39b Performance of a multipressure HRSG in fresh air–fired mode
8.40 How to evaluate operating costs in HRSGs
8.41 Why economizer steaming occurs in gas turbine HRSGs
Copyright © 2003 Marcel Dekker, Inc.

8.42 Why water tube boilers are preferred to fire tube boilers for gas turbine
applications
8.43 Why 10% increase in surface area does not mean 10% more duty in
boilers or heat transfer equipment
8.44a Time required to heat up boilers
8.44b Transient heating of a superheater bundle
8.44c Transient response of a water tube evaporator to cutoff in heat input and
feedwater supply
8.44d Response of a water tube evaporator when steam demand increases and
feedwater supply is cut off
8.45a Parameters to be considered in testing performance of HRSGs
8.45b Evaluating HRSG performance from operating data
8.46 Estimating boiling heat transfer coefficient and critical heat flux in water
tube boilers
8.47a Relating heat flux, steam pressure, quality, flow in water tube boilers
8.47b Estimating critical heat flux in fire tube boilers
8.47c Estimating critical heat flux in a fire tube boiler; correcting for bundle
geometry
8.48 Simplified approach to designing fire tube boilers
8.49 Simplified approach to designing water tube boilers
8.50 Estimating tube bundle size
8.51 Estimating thickness of insulation for flat and curved surfaces; effect of
wind velocity; estimating thickness to limit surface temperatures
8.52 Estimating surface temperature of given thickness of insulation; trial-
and-error procedure to determine casing temperature
8.53 Sizing insulation to prevent freezing; determining water dew point
8.54a Estimating heat loss from pipes for various insulation thicknesses
8.54b Estimating temperature drop of fluids in insulated piping
8.55 Optimum thickness of insulation; life-cycle costing; annual heat loss and
capitalized cost; annual heat loss if no insulation is used
8.56 Design of hot casing
8.57 Temperature of duct or stack wall with and without insulation
8.58 Effect of wind velocity, casing emissivity on heat loss
8.59a Checking for noise and vibration problems in heat transfer equipment
8.59b Determining natural frequency of vibration of a tube bundle
8.59c Computing acoustic frequency
8.59d Determining vortex shedding frequency
8.59e Checking for bundle vibrations
8.59f Checks for tube bundle vibration using damping and fluid elastic
instability criteria
8.60 Estimating specific heat, viscosity, and thermal conductivity for a gas
mixture
Copyright © 2003 Marcel Dekker, Inc.
8.61 Effect of gas analysis on heat transfer
8.62 Effect of gas pressure on heat transfer
8.63 Converting gas analysis from weight to volume basis
8.64 Effect of gas pressure and analysis on design of fire tube boiler
8.01
Q:
How is the surface area of heat transfer equipment determined? What terms can
be neglected while evaluating the overall heat transfer coefficient in boilers,
economizers, and superheaters?
A:
The energy transferred in heat transfer equipment, Q, is given by the basic
equation
Q ¼ U � A� DT ð1ÞAlso,
WhDhh ¼ Wc Dhc ð2Þwhere
A¼ surface area, ft2
W ¼ fluid flow, lb=hDh¼ change in enthalpy (subscripts h and c stand for hot and cold)
DT ¼ corrected log-mean temperature difference, �FU ¼ overall heat transfer coefficient, Btu=ft2 h �F
For extended surfaces, U can be obtained from [1]
1
U¼ At
hiAi
þ ff i �At
Ai
þ ff oþAt
Aw
� d
24Km
� lnd
diþ 1
Zhowhere
At ¼ surface area of finned tube, ft2=ftAi ¼ tube inner surface area¼ pdi=12, ft
2=ftAw ¼ average wall surface area¼ pðd þ diÞ=24, ft2=ftKm ¼ thermal conductivity of the tube wall, Btu=ft h �F
d; di ¼ tube outer and inner diameter, in.
ff i; ff o ¼ fouling factors inside and outside the tubes, ft2 h �F=Btuhi; ho ¼ tube-side and gas-side coefficients, Btu=ft2 h �F
Z¼ fin effectiveness
If bare tubes are used instead of finned tubes, At ¼ pd=12.
Copyright © 2003 Marcel Dekker, Inc.
Equation (3) can be simplified to
1
U¼ d
hidiþ 1
hoþ d
24Km
� lnd
di
þ ff i �d
diþ ff o
ð4Þ
where ho is the outside coefficient.
Now let us take the various cases.
Water Tube Boilers, Economizers, and Superheaters
The gas-side heat transfer coefficient ho is significant; the other terms can be
neglected. In a typical bare tube economizer, for example, hi ¼ 1500 Btu=ft2 h �F,ff i and ff o ¼ 0:001 ft2 h �F=Btu, and ho ¼ 12Btu=ft2 h �F. d¼ 2.0 in., di ¼ 1.5 in.,
and Km ¼ 25Btu=ft h �F.Substituting into Eq. (4) yields
1
U¼ 2:0
1500� 1:5þ 1
12þ 2:0
24� 25� ln
2
1:5
þ 0:001� 2:0
1:5þ 0:001
¼ 0:0874
Hence,
U ¼ 11:44 Btu=ft2 h �F
Thus we see that the overall coefficient is close to the gas-side coefficient, which
is the highest thermal resistance. The metal thermal resistance and the tube-side
resistance are not high enough to change the resistance distribution much.
However, in a liquid-to-liquid heat exchanger, all the resistances will be of
the same order, and hence none of the resistances can be neglected.
Even if finned tubes were used in the case above, with At=Ai ¼ 9 substituted
into Eq. (3), U ¼ 9.3 Btu=ft2 h �F, which is close to ho. Thus, while trying to
figure U for economizers, water tube boilers, or gas-to-liquid heat exchangers, U
may be written as
U ¼ 0:8 to 0:9� ho ð5Þ
Copyright © 2003 Marcel Dekker, Inc.
Fire Tube Boilers, Gas Coolers, and Heat Exchangers with GasFlow Inside Tubes with Liquid or Steam–Water Mixture on theOutside
ho is large, on the order of 1000–1500Btu=ft2 h �F, whereas hi will be about 10–12Btu=ft2 h �F. Again, using Eq. (4), it can be shown that
U hi �di
dð6Þ
All the other thermal resistances can be seen to be very small, and U approaches
the tube-side coefficient hi.
Gas-to-Gas Heat Exchangers (Example: Air Heater in BoilerPlant)
In gas-to-gas heat transfer equipment, both hi and ho are small and comparable,
while the other coefficients are high.
Assuming that ho ¼ 10 and hi ¼ 15, and using the tube configuration above,
1
U¼ 2:0
15� 1:5þ 1
10þ 0:001þ 9:6� 10�4
þ 0:001� 2
1:5¼ 0:1922
or
U ¼ 5:2 Btu=ft2 h �F
Simplifying Eq. (4), neglecting the metal resistance term and fouling, we obtain
U ¼ ho �hidi=d
ho þ hidi=dð7Þ
Thus both ho and hi contribute to U .
DT , the corrected log-mean temperature difference, can be estimated from
DT ¼ FT � DTmax � DTmin
lnðDTmax=DTminÞ
where FT is the correction factor for flow arrangement. For counterflow cases,
FT ¼ 1.0. For other types of flow, textbooks may be referred to for FT. It varies
from 0.6 to 0.95 [2]. DTmax and DTmin are the maximum and minimum terminal
differences.
Copyright © 2003 Marcel Dekker, Inc.
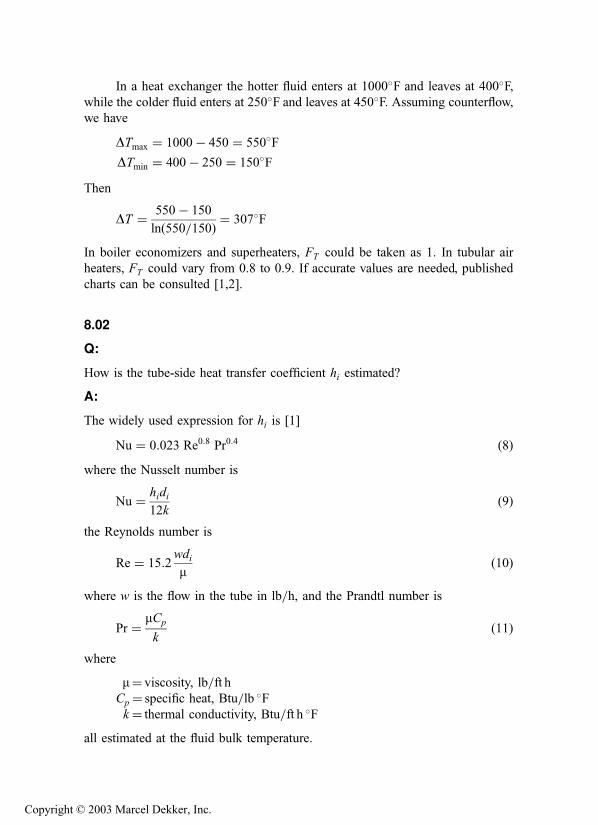
In a heat exchanger the hotter fluid enters at 1000�F and leaves at 400�F,while the colder fluid enters at 250�F and leaves at 450�F. Assuming counterflow,
we have
DTmax ¼ 1000� 450 ¼ 550�FDTmin ¼ 400� 250 ¼ 150�F
Then
DT ¼ 550� 150
lnð550=150Þ ¼ 307�F
In boiler economizers and superheaters, FT could be taken as 1. In tubular air
heaters, FT could vary from 0.8 to 0.9. If accurate values are needed, published
charts can be consulted [1,2].
8.02
Q:
How is the tube-side heat transfer coefficient hi estimated?
A:
The widely used expression for hi is [1]
Nu ¼ 0:023 Re0:8 Pr0:4 ð8Þwhere the Nusselt number is
Nu ¼ hidi
12kð9Þ
the Reynolds number is
Re ¼ 15:2wdi
mð10Þ
where w is the flow in the tube in lb=h, and the Prandtl number is
Pr ¼ mCp
kð11Þ
where
m¼ viscosity, lb=ft hCp ¼ specific heat, Btu=lb �Fk ¼ thermal conductivity, Btu=ft h �F
all estimated at the fluid bulk temperature.
Copyright © 2003 Marcel Dekker, Inc.
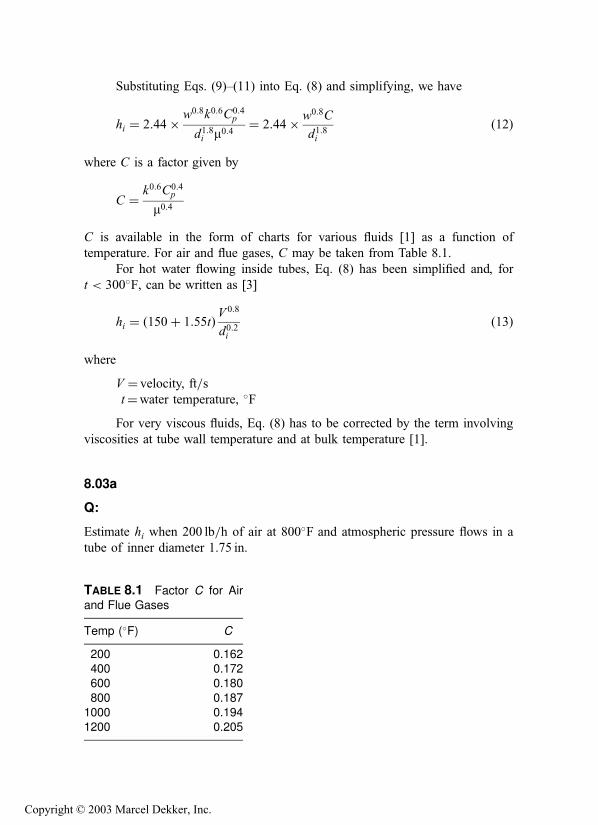
Substituting Eqs. (9)–(11) into Eq. (8) and simplifying, we have
hi ¼ 2:44� w0:8k0:6C0:4p
d1:8i m0:4¼ 2:44� w0:8C
d1:8i
ð12Þ
where C is a factor given by
C ¼ k0:6C0:4p
m0:4
C is available in the form of charts for various fluids [1] as a function of
temperature. For air and flue gases, C may be taken from Table 8.1.
For hot water flowing inside tubes, Eq. (8) has been simplified and, for
t < 300�F, can be written as [3]
hi ¼ ð150þ 1:55tÞV0:8
d0:2i
ð13Þ
where
V ¼ velocity, ft=st¼water temperature, �F
For very viscous fluids, Eq. (8) has to be corrected by the term involving
viscosities at tube wall temperature and at bulk temperature [1].
8.03a
Q:
Estimate hi when 200 lb=h of air at 800�F and atmospheric pressure flows in a
tube of inner diameter 1.75 in.
TABLE 8.1 Factor C for Air
and Flue Gases
Temp (�F) C
200 0.162400 0.172600 0.180
800 0.1871000 0.1941200 0.205
Copyright © 2003 Marcel Dekker, Inc.
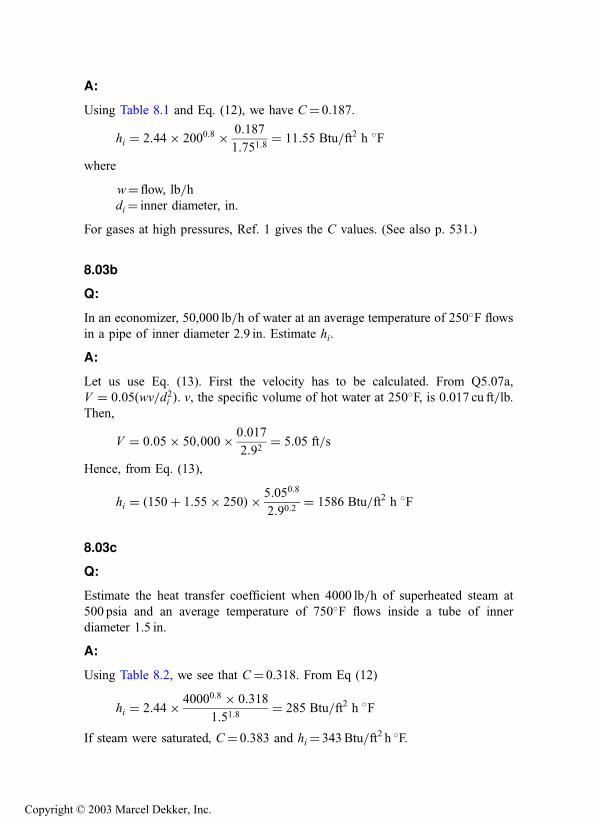
A:
Using Table 8.1 and Eq. (12), we have C¼ 0.187.
hi ¼ 2:44� 2000:8 � 0:187
1:751:8¼ 11:55 Btu=ft2 h �F
where
w¼ flow, lb=hdi ¼ inner diameter, in.
For gases at high pressures, Ref. 1 gives the C values. (See also p. 531.)
8.03b
Q:
In an economizer, 50,000 lb=h of water at an average temperature of 250�F flows
in a pipe of inner diameter 2.9 in. Estimate hi.
A:
Let us use Eq. (13). First the velocity has to be calculated. From Q5.07a,
V ¼ 0:05ðwv=d2i Þ: v, the specific volume of hot water at 250�F, is 0.017 cu ft=lb.Then,
V ¼ 0:05� 50;000� 0:017
2:92¼ 5:05 ft=s
Hence, from Eq. (13),
hi ¼ ð150þ 1:55� 250Þ � 5:050:8
2:90:2¼ 1586 Btu=ft2 h �F
8.03c
Q:
Estimate the heat transfer coefficient when 4000 lb=h of superheated steam at
500 psia and an average temperature of 750�F flows inside a tube of inner
diameter 1.5 in.
A:
Using Table 8.2, we see that C¼ 0.318. From Eq (12)
hi ¼ 2:44� 40000:8 � 0:318
1:51:8¼ 285 Btu=ft2 h �F
If steam were saturated, C¼ 0.383 and hi ¼ 343Btu=ft2 h �F.
Copyright © 2003 Marcel Dekker, Inc.

8.04
Q:
How is the outside gas heat transfer coefficient ho in boilers, air heaters,
economizers, and superheaters determined?
A:
The outside gas heat transfer coefficient ho is the sum of the convective heat
transfer coefficient hc and nonluminous heat transfer coefficient hN .
ho ¼ hc þ hN ð14ÞFor finned tubes, ho should be corrected for fin effectiveness. hN is usually small
if the gas temperature is less than 800�F and can be neglected.
Estimating hc for Bare Tubes
A conservative estimate of hc for flow of fluids over bare tubes in in-line and
staggered arrangements is given by [1]
Nu ¼ 0:33 Re0:6 Pr0:33 ð15ÞSubstituting, we have the Reynolds, Nusselt, and Prandtl numbers
Re ¼ Gd
12 mð16Þ
Nu ¼ hcd
12kð17Þ
TABLE 8.2 Factor C for Steam
Pressure (psia)
100 200 500 1000 2000Saturation
Temperature (�F) 0.282 0.310 0.383 0.498 0.8733
400 0.2716 0.3059500 0.2737 0.2909 0.3595
600 0.2813 0.2896 0.3228 0.413700 0.2917 0.2965 0.3161 0.3586 0.5206800 0.3050 0.3090 0.3206 0.3453 0.4214
900 0.3161 0.3197 0.3277 0.3477 0.39461000 0.3276 0.3302 0.3392 0.3531 0.386
Copyright © 2003 Marcel Dekker, Inc.

and
Pr ¼ mCp
kð18Þ
where
G¼ gas mass velocity, lb=ft2 hd¼ tube outer diameter, in.
m¼ gas viscosity, lb=ft hk¼ gas thermal conductivity, Btu=ft h �F
Cp ¼ gas specific heat, Btu=lb �F
All the gas properties above are to be evaluated at the gas film temperature.
Substituting Eqs. (16)–(18) into Eq. (15) and simplifying, we have
hc ¼ 0:9G0:6 F
d0:4ð19Þ
where
F ¼ k0:67C0:33p
m0:27ð20Þ
Factor F has been computed for air and flue gases, and a good estimate is given in
Table 8.3.
The gas mass velocity G is given by
G ¼ 12Wg
NwLðST � dÞ ð21Þ
where
Nw ¼ number of tubes wide
ST ¼ transverse pitch, in.
L¼ tube length, ft
Wg ¼ gas flow, lb=h
TABLE 8.3 F Factor for Airand Flue Gases
Temp (�F) F
200 0.094
400 0.103600 0.110800 0.116
1000 0.1231200 0.130
Copyright © 2003 Marcel Dekker, Inc.

For quick estimates, gas film temperature tf can be taken as the average of gas and
fluid temperature inside the tubes.
Example
Determine the gas-side convective heat transfer coefficient for a bare tube
superheater tube of diameter 2.0 in. with the following parameters:
Gas flow¼ 150,000 lb=hGas temperature¼ 900�FAverage steam temperature¼ 500�FNumber of tubes wide¼ 12
Length of the tubes¼ 10.5 ft
Transverse pitch¼ 4.0 in.
Longitudinal pitch¼ 3.5 in. (staggered)
Solution. Estimate G. From Eq. (21),
G ¼ 12� 150;000
12� 10:5� ð4� 2Þ ¼ 7142 lb=ft2 h
Using Table 8.3, at a film temperature of 700�F, F ¼ 0.113. Hence,
hc ¼ 0:9� 71420:6 � 0:113
20:4¼ 15:8 Btu=ft2 h �F
Because the gas temperature is not high, the hN value will be low, so
U ho hc ¼ 15:8 Btu=ft2 h �F
(Film temperature may be taken as the average of gas and steam temperatures, for
preliminary estimates. If an accurate estimate is required, temperature drops
across the various thermal resistances as discussed in Q8.16a must be deter-
mined.)
The convective heat transfer coefficient obtained by the above method or
Grimson’s method can be modified to include the effect of angle of attack a of the
gas flow over the tubes. The correction factor Fn is 1 for perpendicular flow and
decreases as shown in Table 8.4 for other angles [1].
If, for example, hc ¼ 15 and the angle of attack is 60�, then hc ¼0:94� 15 ¼ 14:1 Btu=ft2 h �F:
TABLE 8.4 Correction Factor for Angle of Attack
a, deg 90 80 70 60 50 40 30 20 10
Fn 1.0 1.0 0.98 0.94 0.88 0.78 0.67 0.52 0.42
Copyright © 2003 Marcel Dekker, Inc.

8.05
Q:
How is the convective heat transfer coefficient for air and flue gases determined
using Grimson’s correlation?
A:
Grimson’s correlation, which is widely used for estimating hc [1], is
Nu ¼ B� ReN ð22Þ
Coefficient B and power N are given in Table 8.5.
Example
150,000 lb=h of flue gases having an analysis (vol%) of CO2 ¼ 12, H2O¼ 12,
N2 ¼ 70, and O2 ¼ 6 flows over a tube bundle having 2 in. OD tubes at 4 in.
square pitch. Tubes per row¼ 18; length¼ 10 ft. Determine hc if the fluid
temperature is 353�F and average gas temperature is 700�F. The Appendix
tables give the properties of gases.
At a film temperature of 0:5� ð353þ 700Þ ¼ 526�F; Cp ¼ 0:2695;m ¼ 0:0642 and k¼ 0.02344. Then mass velocity G is
G ¼ 12� 150;000
18� 10� ð4� 2Þ ¼ 5000 lb=ft2 h
TABLE 8.5 Grimson’s Values of B and N
ST =d ¼ 1:25 ST =d ¼ 1:5 ST =d ¼ 2 ST =d ¼ 3
SL=d B N B N B N B N
Staggered1.25 0.518 0.556 0.505 0.554 0.519 0.556 0.522 0.5621.50 0.451 0.568 0.460 0.562 0.452 0.568 0.488 0.568
2.0 0.404 0.572 0.416 0.568 0.482 0.556 0.449 0.5703.0 0.310 0.592 0.356 0.580 0.44 0.562 0.421 0.574In-line
1.25 0.348 0.592 0.275 0.608 0.100 0.704 0.0633 0.7521.50 0.367 0.586 0.250 0.620 0.101 0.702 0.0678 0.7442.0 0.418 0.570 0.299 0.602 0.229 0.632 0.198 0.648
3.0 0.290 0.601 0.357 0.584 0.374 0.581 0.286 0.608
Copyright © 2003 Marcel Dekker, Inc.
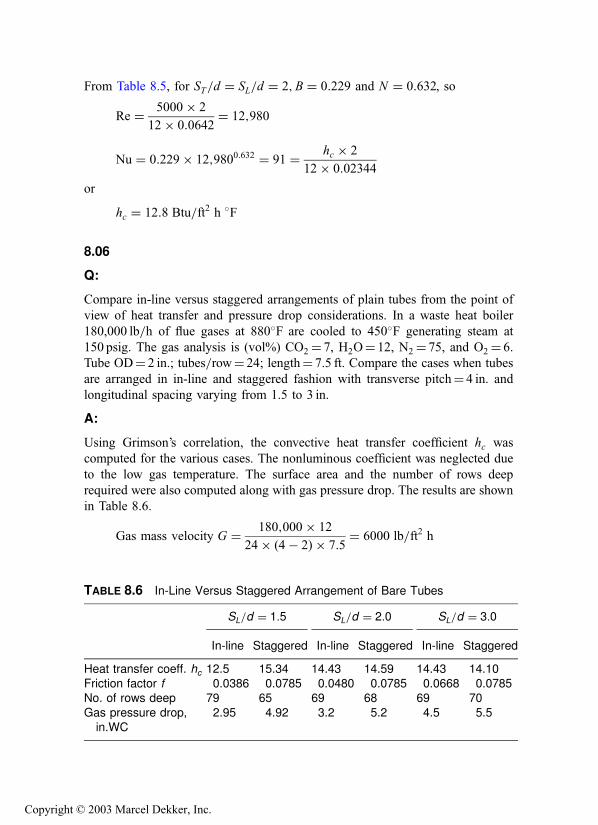
From Table 8.5, for ST=d ¼ SL=d ¼ 2;B ¼ 0:229 and N ¼ 0:632, so
Re ¼ 5000� 2
12� 0:0642¼ 12;980
Nu ¼ 0:229� 12;9800:632 ¼ 91 ¼ hc � 2
12� 0:02344
or
hc ¼ 12:8 Btu=ft2 h �F
8.06
Q:
Compare in-line versus staggered arrangements of plain tubes from the point of
view of heat transfer and pressure drop considerations. In a waste heat boiler
180,000 lb=h of flue gases at 880�F are cooled to 450�F generating steam at
150 psig. The gas analysis is (vol%) CO2 ¼ 7, H2O¼ 12, N2 ¼ 75, and O2 ¼ 6.
Tube OD¼ 2 in.; tubes=row¼ 24; length¼ 7.5 ft. Compare the cases when tubes
are arranged in in-line and staggered fashion with transverse pitch¼ 4 in. and
longitudinal spacing varying from 1.5 to 3 in.
A:
Using Grimson’s correlation, the convective heat transfer coefficient hc was
computed for the various cases. The nonluminous coefficient was neglected due
to the low gas temperature. The surface area and the number of rows deep
required were also computed along with gas pressure drop. The results are shown
in Table 8.6.
Gas mass velocity G ¼ 180;000� 12
24� ð4� 2Þ � 7:5¼ 6000 lb=ft2 h
TABLE 8.6 In-Line Versus Staggered Arrangement of Bare Tubes
SL=d ¼ 1:5 SL=d ¼ 2:0 SL=d ¼ 3:0
In-line Staggered In-line Staggered In-line Staggered
Heat transfer coeff. hc 12.5 15.34 14.43 14.59 14.43 14.10Friction factor f 0.0386 0.0785 0.0480 0.0785 0.0668 0.0785No. of rows deep 79 65 69 68 69 70
Gas pressure drop,in.WC
2.95 4.92 3.2 5.2 4.5 5.5
Copyright © 2003 Marcel Dekker, Inc.

Average gas temperature¼ 0.5� (880 þ 450)=2¼ 665�F, and film temp-
erature is about 525�F.Cp ¼ 0.2706, m¼ 0.06479, k¼ 0.02367 at gas film temperature and
Cp ¼ 0.2753 at the average gas temperature.
Re ¼ 6000� 2
12� 0:06479¼ 15;434
Duty Q¼ 180,000� 0.99� 0.2753� (8807 450)¼ 21MMBtu=hSaturation temperature¼ 366�F.
DT ¼ log-mean temperature difference ¼ ð880� 366Þ � ð450� 366Þln½ð880� 366Þ=ð450� 366Þ�
¼ 237�F
With SL=d¼ 1.5 in-line, we have the values for B and N from Table 8.5:
B ¼ 0:101 and N ¼ 0:702
Hence
Nu ¼ 0:101� 15;4340:702 ¼ 88:0 ¼ hc �2
12� 0:02367
or
hc ¼ 12:5
Because other resistances are small, U ¼ 0:95hc ¼ 11:87 Btu=ft2 h �F.Hence
A ¼ 21� 106
237� 11:87¼ 7465 ¼ 3:14� 2� 24� 7:5Nd=12
or the number of rows deep Nd ¼ 79.
The friction factor f , using the method discussed in Q7.27, is
f ¼ 15;434�0:15ð0:044þ 0:08� 1:5Þ ¼ 0:0386
Average gas density ¼ 0:0347 lb=ft3
Gas pressure drop ¼ 9:3� 10�10 � 60002 � 79� 0:0386
0:0347¼ 2:95 in:WC
The calculations for the other cases are summarized in Table 8.6.
1. The staggered arrangement of bare tubes does not have a significant
impact on the heat transfer coefficient when the longitudinal spacing
exceeds 2, which is typical in steam generators. Ratios lower than 1.5
are not used, owing to potential fouling concerns or low ligament
efficiency.
Copyright © 2003 Marcel Dekker, Inc.

2. The gas pressure drop is much higher for the staggered arrangement.
Hence, with bare tube boilers the in-line arrangement is preferred.
However, with finned tubes, the staggered arrangement is comparable
with the in-line and slightly better in a few cases. This is discussed
later.
8.07a
Q:
How is the nonluminous radiation heat transfer coefficient evaluated?
A:
In engineering heat transfer equipment such as boilers, fired heaters, and process
steam superheaters where gases at high temperatures transfer energy to fluid
inside tubes, nonluminous heat transfer plays a significant role. During combus-
tion of fossil fuels such as coal oil, or gas—triatomic gases—for example, water
vapor, carbon dioxide, and sulfur dioxide—are formed, which contribute to
radiation. The emissivity pattern of these gases has been studied by Hottel, and
charts are available to predict gas emissivity if gas temperature, partial pressure of
gases, and beam length are known.
Net interchange of radiation between gases and surroundings (e.g., a wall or
tube bundle or a cavity) can be written as
Q
A¼ sðegT4
g � agT4o Þ ð23Þ
where
eg ¼ emissivity of gases at Tgag ¼ absorptivity at ToTg ¼ absolute temperature of gas, �RTo ¼ absolute temperature of tube surface, �R
eg is given by
eg ¼ ec þ Zew � De ð24Þ
ag is calculated similarly at To. Z is the correction factor for the water pressure,
and De is the decrease in emissivity due to the presence of water vapor and
carbon dioxide.
Although it is desirable to calculate heat flux by (23), it is tedious to
estimate ag at temperature To. Considering the fact that T 4o will be much smaller
Copyright © 2003 Marcel Dekker, Inc.

than T 4g , with a very small loss of accuracy we can use the following simplified
equation, which lends itself to further manipulations.
Q
A¼ segðT4
g � T 4o Þ ¼ hN ðTg � ToÞ ð25Þ
The nonluminous heat transfer coefficient hN can be written as
hN ¼ segT4g � T 4
o
Tg � Toð26Þ
To estimate hN , partial pressures of triatomic gases and beam length L are
required. L is a characteristic dimension that depends on the shape of the
enclosure. For a bundle of tubes interchanging radiation with gases, it can be
shown that
L ¼ 1:08� STSL � 0:785d2
dð27aÞ
L is taken approximately as 3.4–3.6 times the volume of the space divided by the
surface area of the heat-receiving surface. For a cavity of dimensions a; b and c,
L ¼ 3:4� abc
2ðabþ bcþ caÞ ¼1:7
1=aþ 1=bþ 1=cð27bÞ
In the case of fire tube boilers, L ¼ di.
eg can be estimated using Figs. 8.1a–8.1d, which give ec; ew;Z, and De,respectively. For purposes of engineering estimates, radiation effects of SO2 can
be taken as similar to those of CO2. Hence, partial pressures of CO2 and SO2 can
be added and Fig. 8.1 used to get ec.
Example 1
Determine the beam length L if ST ¼ 5 in., SL ¼ 3.5 in., and d¼ 2 in.
Solution.
L ¼ 1:08� 5� 3:5� 0:785� 4
2¼ 7:8 in:
Example 2
In a fired heater firing a waste gas, CO2 in flue gases¼ 12% and H2O¼ 16%. The
gases flow over a bank of tubes in the convective section where tubes are arranged
as in Example 1 (hence L¼ 7.8). Determine hN if tg ¼ 1650�F and to ¼ 600�F.
Copyright © 2003 Marcel Dekker, Inc.
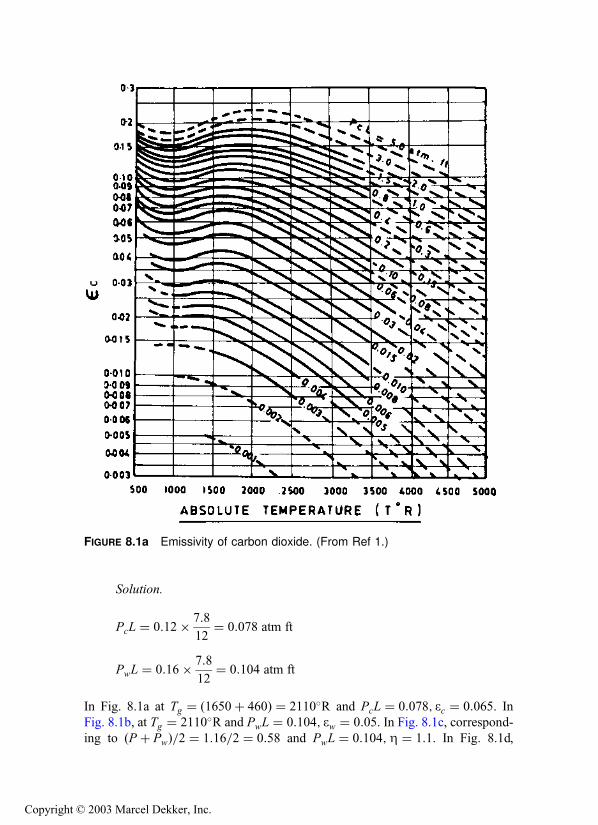
Solution.
PcL ¼ 0:12� 7:8
12¼ 0:078 atm ft
PwL ¼ 0:16� 7:8
12¼ 0:104 atm ft
In Fig. 8.1a at Tg ¼ ð1650þ 460Þ ¼ 2110�R and PcL ¼ 0:078; ec ¼ 0:065. InFig. 8.1b, at Tg ¼ 2110�R and PwL ¼ 0:104; ew ¼ 0:05. In Fig. 8.1c, correspond-ing to ðP þ PwÞ=2 ¼ 1:16=2 ¼ 0:58 and PwL ¼ 0:104;Z ¼ 1:1. In Fig. 8.1d,
FIGURE 8.1a Emissivity of carbon dioxide. (From Ref 1.)
Copyright © 2003 Marcel Dekker, Inc.

corresponding to Pw=ðPc þ PwÞ ¼ 0:16=0:28 and ðPc þ PwÞL ¼ 0:182; De ¼0:002. Hence,
eg ¼ 0:065þ ð1:1� 0:05Þ � 0:002 ¼ 0:118
Using Eq. (26) with the Boltzmann constant s ¼ 0:173� 10�8,
hN ¼ 0:173� 10�8 � 0:118� 21104 � 10604
2110� 1060
¼ 3:6 Btu=ft2 h �F
Thus, hN can be evaluated for gases.
FIGURE 8.1b Emissivity of water vapor. (From Ref 1.)
Copyright © 2003 Marcel Dekker, Inc.

FIGURE 8.1c,d (c) Correction factor for emissivity of water vapor. (d) Correction
term due to presence of water vapor and carbon dioxide. (From Ref 1.)
Copyright © 2003 Marcel Dekker, Inc.

8.07b
Q:
Can gas emissivity be estimated using equations?
A:
Gas emissivity can be obtained as follows. hN is given by Eq. (26),
hN ¼ segT4g � T 4
o
Tg � To
where
s¼ Stefan–Boltzmann constant¼ 0.173� 10�8
Tg and To ¼ gas and tube outer wall temperature, �R
eg, gas emissivity, is obtained from Hottel’s charts or from the expression
[1]
eg ¼ 0:9� ð1� e�KLÞ ð28aÞ
K ¼ ð0:8þ 1:6pwÞ � ð1� 0:38Tg=1000Þffiffiffiffiffiffiffiffiffiffiffiffiffiffiffiffiffiffiffiffiffiffið pc þ pwÞLp � ð pc þ pwÞ ð28bÞ
Tg is in K. L is the beam length in meters, and pc and pw are the partial pressures
of carbon dioxide and water vapor in atm. L, the beam length, can be estimated
for a tube bundle by Eq. (27a),
L ¼ 1:08� ST � SL � 0:785d2
d
ST and SL are the transverse pitch and longitudinal pitch. Methods of estimating
pc and pw are given in Chapter 5.
Example
In a boiler superheater with bare tubes, the average gas temperature is 1600�F andthe tube metal temperature is 700�F. Tube size is 2.0 in., and transverse pitch
ST ¼ longitudinal pitch SL ¼ 4.0 in. Partial pressures of water vapor and carbon
dioxide are pw ¼ 0.12, pc ¼ 0.16. Determine the nonluminous heat transfer
coefficient.
From Eq. (27a), the beam length L is calculated.
L ¼ 1:08� 4� 4� 0:785� 2� 2
2
¼ 6:9 in: ¼ 0:176 m
Copyright © 2003 Marcel Dekker, Inc.

Using Eq. (28b) with Tg ¼ (16007 32)=1.8 þ 273¼ 1114K, we obtain
K ¼ ð0:8þ 1:6� 0:12Þ � ð1� 0:38� 1:114Þffiffiffiffiffiffiffiffiffiffiffiffiffiffiffiffiffiffiffiffiffiffiffiffiffiffi0:28� 0:176
p � 0:28
¼ 0:721
From Eq. (28a),
eg ¼ 0:9� ½1� expð�0:721� 0:176Þ� ¼ 0:107
Then, from Eq. (26),
hN ¼ 0:173� 0:107� 10�8 � 20604 � 11604
1600� 700
¼ 3:33 Btu=ft2 h �F
8.08a
Q:
How is heat transfer in a boiler furnace evaluated?
A:
Furnace heat transfer is a complex phenomenon, and a single formula or
correlation cannot be prescribed for sizing furnaces of all types. Basically, it is
an energy balance between two fluids—gas and a steam–water mixture. Heat
transfer in a boiler furnace is predominantly radiation, partly due to the luminous
part of the flame and partly due to nonluminous gases. A general approximate
expression can be written for furnace absorption using an energy approach:
QF ¼ Apew efsðT 4g � T4
o Þ¼ Wf LHV�Wghe
ð29Þ
Gas temperature (Tg) is defined in many ways; some authors define it as the
exit gas temperature itself. Some put it as the mean of the theoretical flame
temperature and te. However, plant experience shows that better agreement
between measured and calculated values prevails when tg ¼ tc þ 300 to 400�F [1].
The emissivity of a gaseous flame is evaluated as follows [1]:
ef ¼ bð1� e�KPLÞ ð30Þb characterizes flame-filling volumes.
b¼ 1.0 for nonluminous flames
¼ 0.75 for luminous sooty flames of liquid fuels
¼ 0.65 for luminous and semiluminous flames of solid fuels
L¼ beam length, m
Copyright © 2003 Marcel Dekker, Inc.

K ¼ attenuation factor, which depends on fuel type and presence of ash and
its concentration. For a nonluminous flame it is
K ¼ 0:8þ 1:6pwffiffiffiffiffiffiffiffiffiffiffiffiffiffiffiffiffiffiffiffiffiffið pc þ pwÞLp ð1� 0:38Te=1000Þ ð pc þ pwÞ ð28bÞ
For a semiluminous flame, the ash particle size and concentration enter into the
calculation:
K ¼ 0:8þ 1:6pwffiffiffiffiffiffiffiffiffiffiffiffiffiffiffiffiffiffiffiffiffiffið pc þ pwÞLp ð1� 0:38Te=1000Þ ð pc þ pwÞ
þ 7m1
d2m � T2e
� �1=3
ð28cÞ
where
dm ¼ the mean effective diameter of ash particles, in mmdm ¼ 13 for coals ground in ball mills
¼ 16 for coals ground in medium- and high-speed mills
¼ 20 for combustion of coals milled in hammer mills
m¼ ash concentration in g=N m3
Te ¼ furnace exit temperature, K
For a luminous oil or gas flame,
K ¼ 1:6Te1000
� 0:5 ð28dÞ
pw and pc are partial pressures of water vapor and carbon dioxide in the flue gas.
The above equations give only a trend. A wide variation could exist due to
the basic combustion phenomenon itself. Again, the flame does not fill the
furnace fully. Unfilled portions are subjected to gas radiation only, the emissivity
of which (0.15–0.30) is far below that of the flame. Hence, ef decreases.
Godridge reports that in a pulverized coal-fired boiler, emissivity varied as
follows with respect to location [3]:
Also, furnace tubes coated with ferric oxide have emissivities, ew, of the order of0.8, depending on whether a slag layer covers them. Soot blowing changes ewconsiderably. Thus, only an estimate of ef and ew can be obtained, which varies
with type of unit, fuel, and operation regimes.
Excess air 15% 25%
Furnace exit 0.6 0.5Middle 0.7 0.6
Copyright © 2003 Marcel Dekker, Inc.

To illustrate these concepts, a few examples are worked out. The purpose is
only to show the effect of variables like excess air and heat release rates on
furnace absorption and furnace exit gas temperature.
Example 1
Determine the approximate furnace exit gas temperature of a boiler when net heat
input is about 2000� 106 Btu=h, of which 1750� 106 Btu=h is due to fuel and
the rest is due to air. HHV and LHV of coals fired are 10,000 and 9000Btu=lb,respectively, and a furnace heat release rate of 80,000Btu=ft2 h (projected area
basis) has been used. The values ew and ef may be taken as 0.6 and 0.5,
respectively; 25% is the excess air used. Water-wall outer temperature is 600�F.Ash content in coal is 10%.
Solution.
Q
Ap
¼ 80;000 ¼ Wf
LHV
Ap
From combustion calculation methods discussed in Chapter 5, using 1MMBtu
fired basis, we have the following ratio of flue gas to fuel:
Wg
Wf
¼ 760� 1:24� 104
106þ 1� 10
100
¼ 10:4 lb=lb
Q ¼ APewefs ðT4g � T4
o Þ ¼ Wf LHV�Wghe
Dividing throughout by Wf gives
Ap
Wf
ewefsðT 4g � T4
o Þ ¼ LHV�Wg
Wf
he
Ap=Wf ¼ LHV=80;000 ¼ 0:1125
Assume te ¼ 1900�F. Then
Cpm ¼ 0:3 Btu=lb �F
tg ¼ 1900þ 300 ¼ 2200�F ¼ 2660�R
Let us see if the assumed te is correct. Substituting for Ap=Wf ; ew; ef ;s; Tg; Te inthe above equation, we have (LHS¼ left-hand side; RHS¼ right-hand side)
LHS ¼ 0:1125� 0:6� 0:5� 0:173
� ð26:64 � 10:64Þ ¼ 2850
RHS ¼ ð9000� 10:4� 1900� 0:3Þ ¼ 3072
Copyright © 2003 Marcel Dekker, Inc.
These do not tally, so we try te ¼ 1920�F. Neglect the effect of variation in Cpm:
LHS ¼ 0:1125� 0:6� 0:5� ð26:84 � 10:64Þ� 0:173 ¼ 2938
RHS ¼ 9000� 1920� 0:3� 10:4 ¼ 3009
These agree closely, so furnace exit gas temperature is around 1920�F. Note thatthe effect of external radiation to superheaters has been neglected in the energy
balance. This may give rise to an error of 1.5–2.5% in te, but its omission greatly
simplifies the calculation procedure. Also, losses occurring in the furnace were
omitted to simplify the procedure. The error introduced is quite low.
Example 2
It is desired to use a heat loading of 100,000Btu=ft2 h in the furnace in Example
1. Other factors such as excess air and emissivities remain unaltered. Estimate the
furnace exit gas temperature.
Solution.
Q
Ap
¼ 100;000 ¼ Wf
LHV
Ap
Ap
Wf
¼ LHV
100;000¼ 0:09
wg
wf
¼ 10:4; te ¼ 2000�F; tg ¼ 2300�F
Cpm ¼ 0:3 Btu=lb �F; Tg ¼ 2300þ 460 ¼ 2760�R
LHS ¼ 0:09� 0:6� 0:5� 0:173
� ð27:64 � 10:64Þ ¼ 2664
RHS ¼ ð9000� 10:4� 2000� 0:3Þ ¼ 2760
From this it is seen that te will be higher than assumed. Let
te ¼ 2030�F; Tg ¼ 2790�R
Then
LHS ¼ 0:09� 0:6� 0:5� 0:173
� ½ð27:9Þ4 � ð10:6Þ4� ¼ 2771
RHS ¼ 9000� 10:4� 2030� 0:3 ¼ 2667
Hence, te will lie between 2000 and 2030�F, perhaps 2015�F.
Copyright © 2003 Marcel Dekker, Inc.

The exercise shows that the exit gas temperature in any steam generator will
increase as more heat input is given to it; that is, the higher the load of the boiler,
the higher the exit gas temperature. Example 3 shows the effect of excess air on
te.
Example 3
What will be the furnace exit gas temperature when 40% excess air is used
instead of 25%, heat loading remaining at about 100,000 Btu=ft2 h in the furnace
mentioned in earlier examples?
Solution.
Q
Ap
¼ 100;000 ¼ Wf
LHV
Ap
;Ap
Wf
¼ 0:09
Wg
Wf
¼ 760� 1:4� 104
106þ 0:9 ¼ 11:54 lb=lb
te ¼ 1950�F; Cpm ¼ 0:3 Btu=lb �F
Tg ¼ 1950þ 300þ 460 ¼ 2710�R
LHS ¼ 0:09� 0:6� 0:5� 0:173
� ½ð27:1Þ4 � ð10:6Þ4� ¼ 2460
RHS ¼ 9000� ð11:54� 1950� 0:3Þ ¼ 2249
These nearly tally; hence, te is about 1950�F, compared to about 2030�F in
Example 2. The effect of the higher excess air has been to lower te.
Example 4
If ew � ef ¼ 0:5 instead of 0.3, what will be the effect on te when heat loading is
100,000 Btu=ft2 h and excess air is 40%?
Solution. Let
te ¼ 1800�F; Tg ¼ 1800þ 300þ 460 ¼ 2560�R
LHS ¼ 0:09� 0:5� 0:173� ½ð25:6Þ4 � ð10:6Þ4�¼ 3245
RHS ¼ 9000� ð11:54� 1800� 0:3Þ ¼ 2768
Try
te ¼ 1700�F; Tg ¼ 2460�R
Copyright © 2003 Marcel Dekker, Inc.

Then
LHS ¼ 0:09� 0:5� 0:173� ½ð24:6Þ4 � ð10:6Þ4�¼ 2752
RHS ¼ 9000� ð11:54� 1700� 0:3Þ ¼ 3115
Try
te ¼ 1770�F; Tg ¼ 2530�R
Then
LHS ¼ 3091; RHS ¼ 2872
Hence, te will be around 1760�F. This example shows that when surfaces are
cleaner and capable of absorbing more radiation, te decreases.
In practice, furnace heat transfer is not evaluated as simply as shown above
because of the inadequacy of accurate data on soot emissivity, particle size,
distribution, flame size, excess air, presence and effect of ash particles, etc.
Hence, designers develop data based on field tests. Estimating te is the starting
point for the design of superheaters, reheaters, and economizers.
Some boiler furnaces are equipped with tilting tangential burners, whereas
some furnaces have only front or rear nontiltable wall burners. The location of the
burners affects te significantly. Hence, in these situations, correlations with
practical site data would help in establishing furnace absorption and temperature
profiles. (See also p. 112, Chapter 3.)
A promising technique for predicting furnace heat transfer performance is
the zone method of analysis. It is assumed that the pattern of fluid flow, chemical
heat release, and radiating gas concentration are known, and equations describing
conservation of energy within the furnace are developed. The furnace is divided
into many zones, and radiation exchange calculations are carried out.
8.08b
Q:
How is heat transfer evaluated in unfired furnaces?
A:
Radiant sections using partially or fully water-cooled membrane wall designs are
used to cool gas streams at high gas temperatures (Fig. 8.2). They generate
saturated steam and may operate in parallel with convective evaporators if any.
The design procedure is simple and may involve an iteration or two. The higher
the partial pressures of triatomic gases, the higher will be the nonluminous
radiation and hence the duty.
Copyright © 2003 Marcel Dekker, Inc.

If a burner is used as in the radiant section of a furnace-fired HRSG, the
emissivity of the flame must also be considered. As explained elsewhere [8],
radiant sections are necessary to cool the gases to below the softening points of
any eutectics present so as to avoid bridging or slagging at the convection section.
They are also required to cool gases to a reasonable temperature at the super-
heater if it is used.
Example
200,000 lb=h of flue gases at 1800�F has to be cooled to 1600�F in a radiant
section of a waste heat boiler of cross section 9 ft� 11 ft. Saturated steam at
200 psig is generated. Determine the furnace length required. Flue gas analysis is
(vol%) CO2 ¼ 8, H2O¼ 18, N2 ¼ 72, O2 ¼ 2. Assume a length of 25 ft and that
the furnace is completely water-cooled.
Surface area for cooling ¼ ð11þ 9Þ � 2� 25 ¼ 1000 ft2
Beam length ¼ 3:4� volume
surface area
¼ 3:4� 9� 11� 25
2� ð11� 9þ 9� 25þ 11� 25Þ ¼ 7:1 ft ¼ 2:15 m
Figure 8.2 Radiant furnace in a water tube boiler.
Copyright © 2003 Marcel Dekker, Inc.

Average gas temperature¼ 1700�F¼ 1200K. Partial pressure of
CO2 ¼ 0.08, and that of H2O¼ 0.18. Using Eq. (28b),
K ¼ ð0:8þ 1:6� 0:18Þð1� 0:38� 1:2Þ � 0:26
ð0:26� 2:15Þ0:5 ¼ 0:2053
Gas emissivity eg ¼ 0:9� ð1� e�0:2053�2:16Þ ¼ 0:3223
Let the average surface temperature of the furnace be 420�F (saturation
temperature plus a margin). Then the energy transferred is
Qr ¼ 0:173� 0:9� 0:3223� ð21:64 � 8:84Þ � 1000 ¼ 10:63 MM Btu=h
Required duty ¼ 200;000� 0:99� 0:32� 200 ¼ 12:67 MM btu=h
where 0.32 is the gas specific heat. Hence the furnace should be longer. The beam
length and hence the gas emissivity will not change much with change in furnace
length; therefore one may assume that the furnace length required¼(12.67=10.63)� 25¼ 29.8 or 30 ft.
If the performances at other gas conditions are required, a trial-and-error
procedure is warranted. First the exit gas temperature is assumed; then the energy
transferred is computed as shown above and compared with the assumed duty.
8.09a
Q:
How is the distribution of external radiation to tube bundles evaluated? Discuss
the effect of tube spacing.
A:
Tube banks are exposed to direct or external radiation from flames, cavities, etc.,
in boilers. Depending on the tube pitch, the energy absorbed by each row of tubes
varies, with the first row facing the radiation zone receiving the maximum energy.
It is necessary to compute the energy absorbed by each row, particularly in
superheaters, because the contribution of the radiation can result in high tube wall
temperatures.
The following formula predicts the radiation to the tubes [8].
a ¼ 3:14d
2S� d
Ssin�1 d
S
� �þ
ffiffiffiffiffiffiffiffiffiffiffiffiffiffiffiffiffiffiS
d
� �2
�1
s� S
d
24
35 ð31Þ
where a is the fraction of energy absorbed by the first row. The second row would
then absorb ð1� aÞa; the third row, f1� ½aþ ð1� aÞa�ga; and so on.
Copyright © 2003 Marcel Dekker, Inc.

Example
1MMBtu=h of energy from a cavity is radiated to a superheater tube bank that
has 2 in. OD tubes at a pitch of 8 in. If there are six rows, estimate the distribution
of energy to each row.
Solution. Substituting d¼ 2, S¼ 8 into Eq. (31), we have
a ¼ 3:142=8
2
� �� 2
8sin�1 2
8
� �þ
ffiffiffiffiffiffiffiffiffiffiffiffiffiffiffiffiffiffiffi4� 4� 1
p� 8
2
� �
¼ 0:3925� 0:25ð0:2526þffiffiffiffiffi15
p� 4Þ ¼ 0:361
Hence the first row absorbs 0.361MMBtu=h.The second row would receive (17 0.361)� 0.361¼ 0.231 or 0.231
MMBtu=h.The third row receives [17 (0.361 þ 0.231)]� 0.361¼ 0.147MMBtu=h.The fourth row, [17 (0.361 þ 0.231 þ 0.147)]� 0.361¼ 0.094MM
Btu=h, and so on.
It can be seen that the first row receives the maximum energy and the
amount lessens as the number of rows increases. For a tube pitch S of 4 in.,
a¼ 0.6575. The first row receives 0.6575MMBtu=h; the second, 0.225MBtu=h;and the third, 0.077MMBtu=h. Hence if the tube pitch is small, a large amount of
energy is absorbed within the first two to three rows, resulting in high heat flux in
those tubes and consequently high tube wall temperatures. Hence it is better to
use a wide pitch when the external radiation is large so that the radiation is spread
over more tubes and the intensity is not concentrated within two or three tubes.
Screen tubes in boilers and fired heaters perform this function.
8.09b
Q:
A soot blower lance is inserted in a boiler convection section where hot flue gases
at 2000�F are flowing around the tubes. If the water wall enclosure is at 400�F,what will be the lance temperature? Assume that the heat transfer coefficient
between the flue gas and the lance is 15 Btu=ft2 h �F and the emissivity of the
lance and the water wall tubes is 0.9.
Copyright © 2003 Marcel Dekker, Inc.

A:
The energy transferred between the flue gases and lance and from the lance to the
water wall enclosure in Btu=ft2 h is given by
Q ¼ hcð2000� T Þ¼ 0:173� 0:9� 0:9� ½ðT þ 460Þ4 � ð400þ 460Þ4� � 10�8
where
T ¼ lance temperature, �F0.173� 10�8 is the radiation constant
Emissivity of lance and enclosure¼ 0.9
Actually, a trial-and-error procedure is required to solve the above equation.
However, it may be shown that at T ¼ 1250�F, both sides balance and
Q¼ 11,250Btu=ft2 h. At low loads, when hc ¼ 5 and with other parameters
remaining the same, what will be the lance temperature? It can be shown to be
about 970�F and Q ¼ 5150 btu=ft2h.Hence just as a thermocouple reads a lower temperature due to the radiation
to the enclosure, the lance also will not reach the gas temperature. Its temperature
will be lower than that of the gas.
8.10
Q:
Determine the size of a fire tube waste heat boiler required to cool 100,000 lb=hof flue gases from 1500�F to 500�F. Gas analysis is (vol%) CO2 ¼ 12, H2O¼ 12,
N2 ¼ 70, and O2 ¼ 6; gas pressure is 5 in.WC. Steam pressure is 150 psig, and
feedwater enters at 220�F. Tubes used are in 2 in. OD� 1.77 in. ID; fouling
factors are gas-side fouling factor (ft); 0.002 ft2 h �F=Btu and steam-side
ff¼ 0.001 ft2 h �F=Btu. Tube metal thermal conductivity¼ 25Btu=ft h �F. Steam-
side boiling heat transfer coefficient¼ 2000Btu=ft2 �F. Assume that heat losses
and margin¼ 2% and blowdown¼ 5%.
A:
Use Eq. (4) to compute the overall heat transfer coefficient, and then arrive at the
size from Eq. (1).
1
U¼ do
dihiþ ff o þ ff i
do
diþ do
lnðdo=diÞ24Km
þ 1
ho
Copyright © 2003 Marcel Dekker, Inc.

hi, the tube-side coefficient, is actually the sum of a convective portion hc plus a
nonluminous coefficient hn: hc is obtained from Q8.04:
hc ¼ 2:44� w0:8 � C
d1:8i
At the average gas temperature of 1000�F, the gas properties can be shown to be
Cp ¼ 0.287 Btu=lb �F, m¼ 0.084 lb=ft h, and k¼ 0.0322 Btu=ft h �F. Hence,
C ¼ 0:287
0:084
� �0:4
� ð0:0322Þ0:6 ¼ 0:208
Boiler duty Q ¼ 100;000� 0:98� 0:287� ð1500� 500Þ¼ 28:13� 106 Btu=h
Enthalpies of saturated steam, saturated water, and feedwater from steam tables
are 1195.5, 338, and 188Btu=lb, respectively. The enthalpy absorbed by steam is
then (1195.57 188) þ 0.05� (3387 188)¼ 1015Btu=lb, where 0.05 is the
blowdown factor corresponding to 5% blowdown.
Hence,
Steam generation ¼ 28:13� 106
1015¼ 27;710 lb=h
In order to compute hi, the flow per tube w is required. Typically w ranges from
100 to 200 lb=h for a 2 in. tube. Let us start with 600 tubes; hence w¼100,000=600¼ 167 lb=h.
hc ¼ 2:44� 0:208� 1670:8
ð1:77Þ1:8 ¼ 10:9 Btu=ft2 h �F
The nonluminous coefficient is usually small in fire tube boilers because the beam
length corresponds to the tube inner diameter. However, the procedure used in
Q8.07 can also be used here. Let us assume that it is 0.45Btu=ft2 h �F. Then
hi ¼ 10:90þ 0:45 ¼ 11:35 Btu=ft2 h �F
Copyright © 2003 Marcel Dekker, Inc.
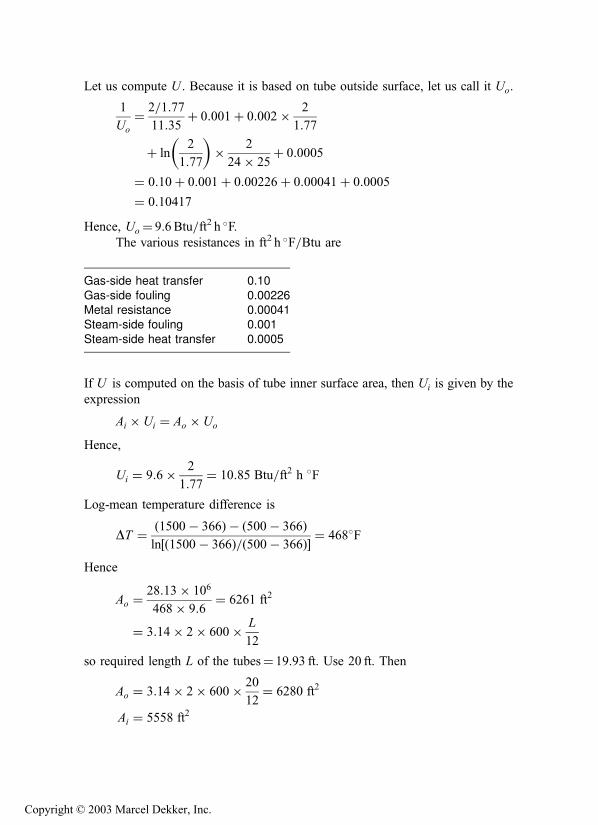
Let us compute U . Because it is based on tube outside surface, let us call it Uo.
1
Uo
¼ 2=1:77
11:35þ 0:001þ 0:002� 2
1:77
þ ln2
1:77
� �� 2
24� 25þ 0:0005
¼ 0:10þ 0:001þ 0:00226þ 0:00041þ 0:0005
¼ 0:10417
Hence, Uo ¼ 9.6 Btu=ft2 h �F.The various resistances in ft2 h �F=Btu are
If U is computed on the basis of tube inner surface area, then Ui is given by the
expression
Ai � Ui ¼ Ao � Uo
Hence,
Ui ¼ 9:6� 2
1:77¼ 10:85 Btu=ft2 h �F
Log-mean temperature difference is
DT ¼ ð1500� 366Þ � ð500� 366Þln½ð1500� 366Þ=ð500� 366Þ� ¼ 468�F
Hence
Ao ¼28:13� 106
468� 9:6¼ 6261 ft2
¼ 3:14� 2� 600� L
12
so required length L of the tubes¼ 19.93 ft. Use 20 ft. Then
Ao ¼ 3:14� 2� 600� 20
12¼ 6280 ft2
Ai ¼ 5558 ft2
Gas-side heat transfer 0.10
Gas-side fouling 0.00226Metal resistance 0.00041Steam-side fouling 0.001
Steam-side heat transfer 0.0005
Copyright © 2003 Marcel Dekker, Inc.

Let us compute the gas pressure drop using Eq. (12) of Chapter 7.
DPg ¼ 93� 10�6 � w2f Lev
d5i
Friction factor f depends on tube inner diameter and can be taken as 0.02. The
equivalent length Le can be approximated by Lþ 5di to include the tube inlet and
exit losses.
Specific volume v obtained as 1=density, or v ¼ 1=r. Gas density at the
average gas temperature of 1000�F is rg ¼ 39=1460¼ 0.0267 lb=cu ft. Therefore,
DPg ¼ 93� 10�6 � 1672 � 0:02
� 20þ 5� 1:77
0:0267� ð1:77Þ5 ¼ 3:23 in: WC
This is only one design. Several variables such as tube size and mass flow could
be changed to arrive at several options that could be reviewed for optimum
operating and installed costs.
8.11
Q:
What is the effect of tube size and gas velocity on boiler size? Is surface area the
sole criterion for boiler selection?
A:
Surface area should not be used as the sole criterion for selecting or purchasing
boilers, because tube size and gas velocity affect this variable.
Shown in Table 8.7 are the design options for the same boiler duty using
different gas velocities and tube sizes; the procedure described in Q8.10 was used
to arrive at these options. The purpose behind this example is to bring out the fact
that surface area can vary by as much as 50% for the same duty.
1. As the gas velocity increases, the surface area required decreases,
which is obvious.
2. The smaller the tubes, the higher the heat transfer coefficient for the
same gas velocity, which also decreases the surface area.
3. For the same gas pressure drop, the tube length is smaller if the tube
size is smaller. This fact helps when we try to fit a boiler into a small
space.
4. For the same tube size, increasing the gas velocity results in a longer
boiler, a greater gas pressure drop, but smaller surface area.
In the case of water tube boilers, more variables such as tube spacing and
in-line or staggered arrangement in addition to gas velocity and tube size can
affect surface area. This is discussed elsewhere.
Copyright © 2003 Marcel Dekker, Inc.
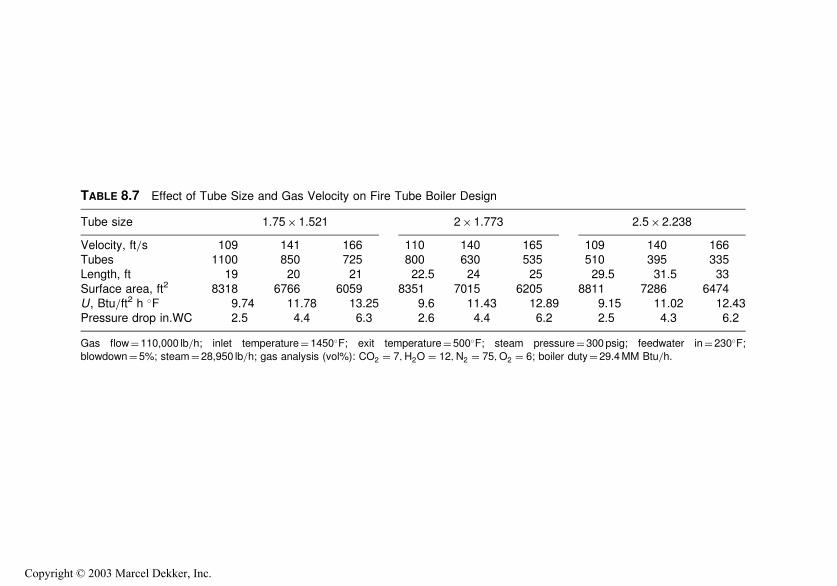
TABLE 8.7 Effect of Tube Size and Gas Velocity on Fire Tube Boiler Design
Tube size 1.75� 1.521 2�1.773 2.5� 2.238
Velocity, ft=s 109 141 166 110 140 165 109 140 166Tubes 1100 850 725 800 630 535 510 395 335Length, ft 19 20 21 22.5 24 25 29.5 31.5 33
Surface area, ft2 8318 6766 6059 8351 7015 6205 8811 7286 6474U, Btu=ft2 h �F 9.74 11.78 13.25 9.6 11.43 12.89 9.15 11.02 12.43Pressure drop in.WC 2.5 4.4 6.3 2.6 4.4 6.2 2.5 4.3 6.2
Gas flow¼ 110,000 lb=h; inlet temperature¼ 1450�F; exit temperature¼500�F; steam pressure¼ 300 psig; feedwater in¼230�F;blowdown¼ 5%; steam¼28,950 lb=h; gas analysis (vol%): CO2 ¼ 7;H2O ¼ 12;N2 ¼ 75;O2 ¼ 6; boiler duty¼ 29.4MM Btu=h.
Copyright © 2003 Marcel Dekker, Inc.

8.12
Q:
How is the tube wall temperature in fire tube boilers evaluated? Discuss the
importance of heat flux.
A:
To compute the tube wall temperatures, heat flux must be known.
qo ¼ heat flux outside tubes ¼ Uo � ðtg � tiÞ Btu=ft2 h
Similarly, qi (heat flux inside the tube) would be Ui � ðtg � tiÞ. However, heatflux outside the tubes is relevant in fire tube boilers because boiling occurs
outside the tubes, whereas in water tube boilers the heat flux inside the tubes
would be relevant. A high heat flux can result in a condition called departure from
nucleate boiling (DNB), which will result in overheating of the tubes. It is
preferable to keep the actual maximum heat flux below the critical heat flux,
which varies from 150,000 to 250,000 Btu=ft2 h depending on steam quality,
pressure, and tube condition [1].
An electrical analogy can be used in determining the tube wall tempera-
tures. Heat flux is analogous to current, electrical resistance to thermal resistance,
and voltage drop to temperature drop. Using the example worked in Q8.10, we
have that at average gas conditions the product of current (heat flux) and
resistance (thermal resistance) gives the voltage drop (temperature drop):
qo ¼ heat flux ¼ 9:6� ð1000� 366Þ ¼ 6086 Btu=ft2 h
Temperature drop across gas film ¼ 6086� 0:1 ¼ 609�F
Temperature drop across gas-side fouling ¼ 6086� 0:00226 ¼ 14�F
Temperature drop across tube wall ¼ 6086� 0:00041 ¼ 3�F
Temperature drop across steam-side fouling ¼ 6086� 0:001 ¼ 6�F
Temperature drop across steam film ¼ 6085� 0:0005 ¼ 3�F
Hence,
Average inside tube wall temperature ¼ 1000� 609� 14 ¼ 377�F
Outside tube wall temperature ¼ 377� 3 ¼ 347�F:
The same results are obtained working from the steam side.
Outside tube wall temperature ¼ 366þ 6þ 3 ¼ 375�F
Copyright © 2003 Marcel Dekker, Inc.

One can also compute the maximum tube wall temperature by obtaining the heat
flux at the hot gas inlet end.
8.13
Q:
What is the effect of scale formation on tube wall temperatures?
A:
If nonsoluble salts such as calcium or magnesium salts or silica are present in the
feedwater, they can deposit in a thin layer on tube surfaces during evaporation,
thereby resulting in higher tube wall temperatures.
Table 8.8 lists the thermal conductivity k of a few scales. Outside fouling
factor ff o can be obtained if the scale information is available.
ff o ¼thickness of scale
conductivity
Let us use the same example as in Q8.10 and check the effect of ff o on boiler
duty and tube wall temperatures. Let a silicate scale of thickness 0.03 in. be
formed. Then,
ff o ¼0:03
0:6¼ 0:05 ft2 h �F=Btu
TABLE 8.8 Thermal Conductivities of ScaleMaterials
Material Thermal conductivity[(Btu=ft2 h �F)=in.]
Analcite 8.8Calcium phosphate 25Calcium sulfate 16
Magnesium phosphate 15Magnetic iron oxide 20Silicate scale (porous) 0.6
Boiler steel 310Firebrick 7Insulating brick 0.7
Copyright © 2003 Marcel Dekker, Inc.

Assume that other resistances have not changed. (Because of different duty and
gas temperature profile, the gas-side heat transfer coefficient will be slightly
different. However, for the sake of illustration, we neglect this.) We have
1
Uo
¼ 0:10þ 0:00226 þ 0:00041þ 0:05þ 0:0005
¼ 0:15317
Hence, Uo ¼ 6.52Btu=ft2 h �F
Heat flux qo ¼ 6:52� ð1000� 366Þ ¼ 4133 Btu=ft2 h
Temperature drop across outside steam film ¼ 0:0005� 4133
¼ 2�F
Temperature drop across steam-side fouling layer or scale ¼ 4133� 0:05
¼ 207�F
Temperature drop across tube wall ¼ 4133� 0:00041
¼ 2�F
We see that average tube wall temperature has risen to 366 þ 2 þ 207 þ2¼ 577�F from an earlier value of about 375�F. Scale formation is a serious
problem. Note that the heat flux is now lower, but that does not help. At the front
end, where the heat flux is higher, the tubes would be much hotter.
Now let us check the effect on boiler duty. It can be shown [1,8] that
lntg1 � tsat
tg2 � tsat¼ UA
Wg � Cp � hlfð32Þ
where hlf is the heat loss factor. If 2% losses are assumed, then hlf ¼ 0.98.
We know that Uo ¼ 6.52, Ao ¼ 6280, tg1 ¼ 1500, tsat ¼ 366. Hence,
ln1500� 366
tg2 � 366¼ 6:52� 6280
100;000� 0:98� 0:287
¼ 1:456
or
1500� 366
tg2 � 366¼ 4:29
Hence tg2 ¼ 630�F compared to 500�F earlier. The reason for tg2 going up is the
lower Uo caused by scale formation.
Hence new duty¼ 100,000� 0.98� 0.287� (15007 630)¼ 24.47� 106
Btu=h. The decrease in duty is 28.137 24.47¼ 3.66MMBtu=h. Even assuming
Copyright © 2003 Marcel Dekker, Inc.

a modest energy cost of $3=MMBtu, the annual loss due to increased fouling is
3.66� 3� 8000¼ $87,800. The steam production in turn gets reduced.
Plant engineers should check the performance of their heat transfer
equipment periodically to see if the exit gas temperature rises for the same
inlet gas flow and temperature. If it does, then it is likely due to fouling on either
the gas or steam side, which can be checked. Fouling on the gas side affects only
the duty and steam production, but fouling on the steam side increases the tube
wall temperature in addition to reducing the duty and steam production.
To ensure that variations in exit gas temperature are not due to fouling but
are due to changes in gas flow or temperature, one can use simulation methods.
For example, if, for the same gas flow, the inlet gas temperature is 1800�F, we canexpect the exit gas temperature to rise. Under clean conditions, this can be
estimated using the equation (32)
1500� 366
500� 366¼ 1800� 366
tg2 � 366; or tg2 ¼ 535�F
Now if, in operation, the exit gas temperature were 570–600�F, then fouling could
be suspected; but if the gas temperature were only about 535�F, this would only
be due to the increased gas inlet temperature. Similarly, one can consider the
effect of gas flow and saturation temperature.
8.14
Q:
How is the size of a water tube boiler determined?
A:
The starting point in the design of an evaporator (Fig. 8.3) is the estimation of the
overall heat transfer coefficient U . The cross-sectional data such as the number of
tubes wide, spacing, and length of tubes are assumed. From the duty and log-
mean temperature difference, the surface area is obtained. Then the number of
rows deep is estimated. Tube wall temperature calculations and gas pressure drop
evaluation then follow. A computer program is recommended to perform these
tedious calculations, particularly if several alternatives have to be evaluated.
Example
200,000 lb=h of clean flue gas from an incinerator must be cooled from 1100�F to
600�F in a bare tube evaporator. Steam pressure¼ 250 psig saturated. Feedwater
temperature¼ 230�F. Blowdown¼ 5%. Fouling factors on steam- and gas-side
¼ 0.001 ft2 h �F=Btu. Gas analysis (vol%): CO2 ¼ 7; H2O ¼ 12; N2 ¼ 75;O2 ¼ 6. Let heat loss from casing¼ 1%.
Copyright © 2003 Marcel Dekker, Inc.

Solution: Use 2� 1.773 in carbon steel tubes; number wide¼ 24;
length¼ 10 ft; tube spacing¼ 4 in. square.
Average gas temperature ¼ 0:5� ð1100þ 600Þ ¼ 850�F
Steam temperature inside tubes¼ 406�F. Assume tube wall temperature¼ 410�F(this should be checked again later).
Film temperature ¼ 0:5� ð850þ 410Þ ¼ 630�F
Gas properties at film temperature are (from Appendix) Cp ¼ 0.2741,
m¼ 0.0693, k ¼ 0.0255
Cp at average gas temperature¼ 0.282
Duty Q¼ 200,000� 0.99� 0.282� (11007 600)¼ 27.92MMBtu=hSteam enthalpy change¼ (1201.77 199) þ 0.05� (381.47 199)¼1011.82 Btu=lb
FIGURE 8.3 Boiler evaporator bundle.
Copyright © 2003 Marcel Dekker, Inc.
Hence
Steam generation ¼ 27:92� 106
1011:82¼ 27;600 lb=h
Gas mass velocity G ¼ 200;000� 12
24� 12� ð4� 2Þ ¼ 4167 lb=ft2 h
Reynolds number Re ¼ Gd=12m ¼ 4167� 2
12� 0:0693¼ 10;021
Using Grimson’s correlation,
Nu ¼ 0:229� ð10;021Þ0:632 ¼ 77:3
The convective heat transfer coefficient
hc ¼ Nu� 12k
d¼ 77:3� 12� 0:0255
2¼ 11:83 Btu=ft2 h �F
Let us compute the nonluminous heat transfer coefficient hN . Partial
pressures of CO2 and H2O are 0.06 and 0.12, respectively; beam length
L¼ 1.08� (4� 47 0.785� 4)=2¼ 6.95 in.¼ 0.176m.
Average gas temperature ¼ 850�F ¼ 727 K
Using Eq. (28b),
K ¼ ð0:8þ 1:6� 0:12Þ � ð1� 0:38� 0:727Þ � 0:19
ð0:19� 0:176Þ0:5 ¼ 0:746
Gas emissivity eg ¼ 0:9� ð1� e�0:746�0:176Þ ¼ 0:1107
Assuming that the tube wall is at 420�F (to be checked later)
hN ¼ 0:173� 0:9� 0:1107� 13:14 � 8:84
1310� 880¼ 0:94 Btu=ft2 h �F
Using a conservative boiling heat transfer coefficient of 2000Btu=ft2 h and a tube
thermal conductivity of 25Btu=ft h �F; we have
1
U¼ 1
0:94þ 11:83þ 0:001þ 0:001
� 2
1:773þ 2
1:773� 2000þ 2
lnð2=1:773Þ24� 25
¼ 0:0782 þ 0:001þ 0:0011þ 0:000565þ 0:0004 ¼ 0:0813
Copyright © 2003 Marcel Dekker, Inc.
or
U ¼ 12:3 Btu=ft2 h �F
Log-mean temperature difference ¼ ð1100 � 406Þ � ð600� 406Þln½ð1100� 406Þ=ð600� 406Þ�
¼ 393�F
Surface area required A ¼ 27:92� 106
12:3� 393¼ 5776 ft2
A ¼ 3:14� 2� Nd � 24� 12=12 ¼ 5776; or Nd ¼ 38:4
Use 40 rows deep. Surface provided¼ 6016 ft2. Let us estimate the gas pressure
drop.
Gas density r ¼ 28:2� 492
359� ð460þ 850Þ ¼ 0:0295 lb=ft3
Friction factor f ¼ 10;020�0:15 � ð0:044þ 0:08� 2Þ ¼ 0:0512
DPg ¼ 9:3� 10�10 � 41672 � 40� 0:0512
0:0295¼ 1:12 in: WC
The average heat flux on tube ID basis is
q ¼ 12:3� ð850� 406Þ � 2=1:773 ¼ 6160 Btu=ft2 h
Temperature drop across inside fouling layer¼ 6160� 0.001¼ 62�FTemperature drop across inside film coefficient¼ 6160=2000¼ 3.1�FDrop across tube wall¼ 0.0004� 1.773� 6160=2¼ 2.2�F
Hence tube outer wall temperature¼ 406 þ 6.2 þ 3.1 þ 2.2¼ 418�F. Since this
is close to the assumed value another iteration is not necessary.
Note that this is only the average tube wall temperature. The maximum heat
flux is at the gas inlet, and one has to redo these calculations to obtain the
maximum tube wall temperature. A computer program would help speed up these
calculations.
8.15a
Q:
How is the off-design performance of a boiler evaluated? Predict the performance
of the boiler designed earlier under the following conditions: Gas flow¼230,000 lb=h; gas inlet temperature¼ 1050�F; steam pressure¼ 200 psig. Gas
analysis remains the same.
Copyright © 2003 Marcel Dekker, Inc.

A:
Performance calculations are more involved than design calculations, because we
do not know the gas exit temperature. The NTU method discussed in Q8.30
minimizes the number of iterations. However, for an evaporator, a simple
procedure exists for predicting the performance.
The boiler duty Q is given by the expression
Q ¼ WgCpðt1 � t2Þ ¼UAðt1 � t2Þ
ln½ðt1 � tsÞ=ðt2 � tsÞ�ð33Þ
where
t1; t2 ¼ gas inlet and exit temperatures, �Fts ¼ saturation temperature, �F
Wg ¼ gas flow, lb=h (correcting for heat loss factor)
Cp ¼ gas specific heat at average gas temperature, Btu=lb �FU ¼ overall heat transfer coefficient, Btu=ft2 h �FA¼ surface area, ft2
Simplifying, we have
lnt1 � ts
t2 � ts¼ UA
WgCp
ð34Þ
First we have to estimate U . Assuming 580�F as the gas exit temperature,
average gas temperature¼ 815�F and average film temperature¼ 613�F.
m ¼ 0:06875; k ¼ 0:0252; Cp ¼ 0:2735
Cp at average gas temperature¼ 0.28Btu=lb �F
G ¼ 230;000� 12
24� 12� 2¼ 4791 lb=ft2 h
Re ¼ 4791� 2
12� 0:06875¼ 11;615
Nu ¼ 0:229� 11;6150:632 ¼ 84:9
or
hc ¼ 84:8� 12� 0:0252=2 ¼ 12:9 Btu=ft2 h �F
The nonluminous heat transfer coefficient may be computed as before and shown
to be 0.895Btu=ft2 h �F.
1
U¼ 1=ð0:895þ 12:9Þ þ 0:001þ 0:0011þ 0:000565þ 0:0004 ¼ 0:0756
U ¼ 13:2 Btu=ft2 h �F
Copyright © 2003 Marcel Dekker, Inc.
Using Eq. (34) with saturation temperature of 388�F, we have
ln1050� 388
t2 � 388¼ 13:2� 6016
230;000� 0:99� 0:28¼ 1:2455
or
t2 ¼ 578�F
From eq. (32)
Q ¼ 230;000� 0:99� 0:28� ð1050� 578Þ ¼ 30:0 MM Btu=h
Steam generation ¼ 29;770 lb=h
The tube wall temperature and gas pressure drop may be computed as
before. It may be shown that the gas pressure drop is 1.5 in.WC and the tube wall
temperature is 408�F. Thus off-design performance is predicted for the evapora-
tor. With an economizer or superheater, more calculations are involved as the
water or steam temperature changes. Also, the duty is affected by the configura-
tion of the exchanger, whether counterflow, parallel flow, or crossflow. The NTU
method discussed in Q8.29 and Q8.30 may be used to predict the off-design
performance of such an exchanger.
8.15b
Q:
Discuss the logic for determining the off-design performance of a water tube
waste heat boiler with the configuration shown in Fig. 8.4.
A:
In the design procedure one calculates the size of the various heating surfaces
such as superheaters, evaporators, and economizers by the methods discussed
earlier based on the equation A ¼ Q=ðU � DT Þ. In this situation, the duty Q, log-
mean temperature difference DT , and overall heat transfer coefficient U are
known or can be obtained easily for a given configuration.
In the off-design procedure, which is more involved, the purpose is to
predict the performance of a given boiler under different conditions of gas flow,
inlet gas temperature, and steam parameters. In these calculations several trial-
and-error steps are required before arriving at the final heat balance and duty,
because the surface area is now known. The procedure is discussed for a simple
case, configuration 1 of Fig. 8.4, which consists of a screen section, superheater,
evaporator, and economizer.
1. Assume a steam flow Ws based on gas conditions.
2. Solve for the screen section, which is actually an evaporator, by using
the methods discussed in Q8.15a.
Copyright © 2003 Marcel Dekker, Inc.

3. Solve for the superheater section, either using the NTU method or by
trial and error. Assume a value for the duty and compute the exit
gas=steam temperatures and then DT .
Assumed duty Qa ¼ WgCpðTgi � TgoÞhlf¼ Wsðhso � hsiÞ
where
hso; hsi ¼ enthalpies of steam at exit and inlet
Tgi; Tgo ¼ gas inlet and exit temperatures.
Compute U . Then transferred duty is Qt ¼ U � A� DT . If Qa and Qt are close,
then the assumed duty and gas=steam temperatures are correct; proceed to the
next step. Otherwise assume another duty and repeat step 3.
FIGURE 8.4 Configurations for water tube boiler.
Copyright © 2003 Marcel Dekker, Inc.
4. Solve for the evaporator section as in step 1. No trial and error is
required, because the steam temperature is constant.
5. Solve for the economizer as in step 3. Assume a value for the duty and
then compute exit gas=water temperatures, DT , and Qt. Iteration
proceeds until Qa and Qt match. The NTU method can also be used
to avoid several iterations.
6. The entire HRSG duty is now obtained by adding the transferred duty
of the four sections. The steam flow is corrected based on the actual
total duty and enthalpy rise.
7. If the actual steam flow from step 6 equals that assumed in step 1, then
the iterations are complete and the solution is over; if not, go back to
step 1 with the revised steam flow.
The calculations become more complex if supplementary firing is added to
generate a desired quantity of steam; the gas flow and analysis change as the
firing temperature changes, and the calculations for U and the gas=steamtemperature profile must take this into consideration. Again, if multipressure
HRSGs are involved, the calculations are even more complex and cannot be done
without a computer.
8.16a
Q:
Determine the tube metal temperature for the case of a superheater under the
following conditions:
Average gas temperature¼ 1200�FAverage steam temperature¼ 620�FOutside gas heat transfer coefficient¼ 15Btu=ft2 h �FSteam-side coefficient¼ 900Btu=ft2 h �F
(Estimation of steam and gas heat transfer coefficients is discussed in Q8.03 and
Q8.04.)
Tube size¼ 2� 0.142 in. (2 in. OD and 0.142 in. thick)
Tube thermal conductivity¼ 21Btu=ft h �F (carbon steel)
(Thermal conductivity of metals can be looked up in Table 8.9.)
A:
Because the average conditions are given and the average tube metal temperature
is desired, we must have the parameters noted above under the most severe
conditions of operation—the highest gas temperature, steam temperature, heat
flux, and so on.
Copyright © 2003 Marcel Dekker, Inc.

TABLE 8.9 Thermal Conductivity of Metals, Btu=ft h �F
Temperature (�F)
Material 200 300 400 500 600 700 800 900 1000 1100 1200 1300 1400 1500
Aluminum (annealed)Type 1100-0 126 124 123 122 121 120 118Type 3003-0 111 111 111 111 111 111 111
Type 3004-0 97 98 99 100 102 103 104Type 6061-0 102 103 104 105 106 106 106
Aluminum (tempered)
Type 1100 (all tempers) 123 122 121 120 118 118 118Type 3003 (all tempers) 96 97 98 99 100 102 104Type 3004 (all tempers) 97 98 99 100 102 103 104Type 6061-T4 and T6 95 96 97 98 99 100 102
Type 6063-T5 and T6 116 116 116 116 116 115 114Type 6063-T42 111 111 111 111 111 111 111
Cast iron 31 31 30 29 28 27 26 25
Carbon steel 30 29 28 27 26 25 24 23Carbon moly (12%) steel 29 28 27 26 25 25 24 23Chrome moly steels
1% Cr, 12% Mo 27 27 26 25 24 24 23 21 21
214% Cr, 1% Mo 25 24 23 23 22 22 21 21 20 205% Cr, 1
2% Mo 21 21 21 20 20 20 20 19 19 19
12% Cr 14 15 15 15 16 16 16 16 17 17 17 18Austenitic stainless steels18% Cr, 8% Ni 9.3 9.8 10 11 11 12 12 13 13 14 14 14 15 1525% Cr, 20% Ni 7.8 8.4 8.9 9.5 10 11 11 12 12 13 14 14 15 15
(continued )
Copyright © 2003 Marcel Dekker, Inc.
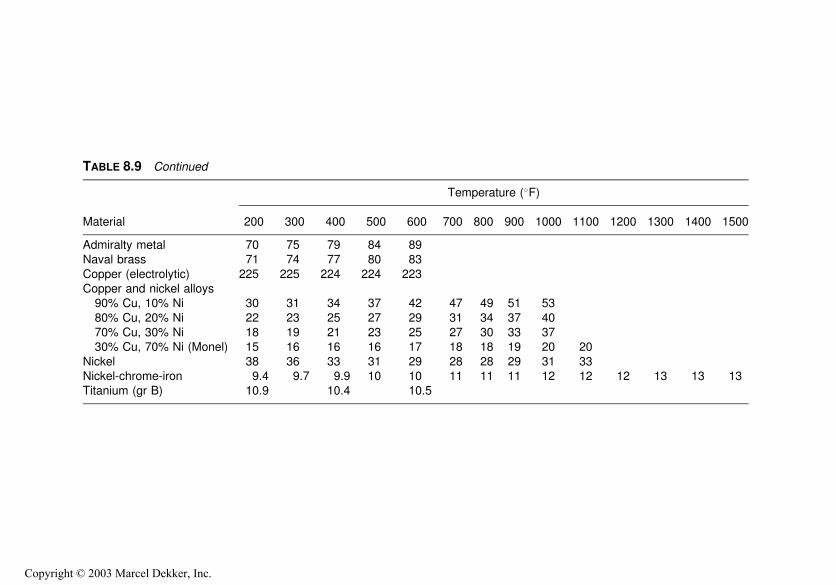
TABLE 8.9 Continued
Temperature (�F)
Material 200 300 400 500 600 700 800 900 1000 1100 1200 1300 1400 1500
Admiralty metal 70 75 79 84 89Naval brass 71 74 77 80 83
Copper (electrolytic) 225 225 224 224 223Copper and nickel alloys90% Cu, 10% Ni 30 31 34 37 42 47 49 51 53
80% Cu, 20% Ni 22 23 25 27 29 31 34 37 4070% Cu, 30% Ni 18 19 21 23 25 27 30 33 3730% Cu, 70% Ni (Monel) 15 16 16 16 17 18 18 19 20 20
Nickel 38 36 33 31 29 28 28 29 31 33Nickel-chrome-iron 9.4 9.7 9.9 10 10 11 11 11 12 12 12 13 13 13Titanium (gr B) 10.9 10.4 10.5
Copyright © 2003 Marcel Dekker, Inc.

Let us use the concept of electrical analogy, in which the thermal and
electrical resistances, heat flux and current, and temperature difference and
voltage are analogous. For the thermal resistance of the tube metal,
Rm ¼ d
24Km
lnd
di¼ 2
24� 21� ln
2
1:72
¼ 0:0006 ft2 h �F=Btu
Outside gas film resistance
Ro ¼1
15¼ 0:067 ft2 h �F=Btu
Inside film resistance Ri ¼1
900¼ 0:0011 ft2 hr �F=Btu
Total resistance Rt ¼ 0:067þ 0:0006þ 0:0011
¼ 0:0687 ft2 h �F=Btu
Hence
Heat flux Q ¼ 1200� 620
0:0687¼ 8443 Btu=ft2 h
Temperature drop across the gas film ¼ 8443� 0:067 ¼ 565�F
Temperature drop across the tube metal ¼ 8443� 0:0006 ¼ 5�F
Temperature drop across steam film ¼ 8443� 0:0011 ¼ 9:3�F
(Here we have applied the electrical analogy, where voltage drop is equal to the
product of current and resistance.) Hence,
Average tube metal temperature ¼ ð1200� 565Þ þ ð620þ 9:3Þ2
¼ 632�F
We note that the tube metal temperature is close to the tube-side fluid tempera-
ture. This is because the tube-side coefficient is high compared to the gas heat
transfer coefficient. This trend would prevail in equipment such as water tube
boilers, superheaters, economizers, or any gas–liquid heat transfer equipment.
An approximation of the tube metal temperature for bare tubes in a gas–
liquid or gas–gas heat transfer device is
tm ¼ to �hi
hi þ hoðto � tiÞ ð35Þ
Copyright © 2003 Marcel Dekker, Inc.

where
hi; ho ¼ heat transfer coefficients inside and outside the tubes, Btu=ft2 h �Fti; to ¼ fluid temperatures inside and outside, �F
8.16b
Q:
In a boiler air heater, ho ¼ 9, hi ¼ 12, ti ¼ 200�F, and to ¼ 800�F. Estimate the
average tube wall temperature tm.
A:
Using Eq. (35), we have
tm ¼ 800� 12
12þ 9� ð800� 200Þ ¼ 457�F
8.17
Q:
How is the performance of fire tube and water tube boilers evaluated? Can we
infer the extent of fouling from operational data? A water tube waste heat boiler
as shown in Fig. 8.5 generates 10,000 lb=h of saturated steam at 300 psia when
the gas flow is 75,000 lb=h and gas temperatures in and out are 1000�F and 500�F.What should the steam generation and exit gas temperature be when 50,000 lb=hof gas at 950�F enters the boiler?
A:
It can be shown as discussed in Q8.15a that in equipment with a phase change
[1,8],
lnt1 � tsat
t2 � tsat¼ UA
WgCp
which was given there as Eq. (34).
For fire tube boilers, the overall heat transfer coefficient is dependent on the
gas coefficient inside the tubes; that is, U is proportional to W 0:8g . In a water tube
boiler, U is proportional to W 0:6g . Substituting these into Eq. (34) gives us the
following.
Copyright © 2003 Marcel Dekker, Inc.
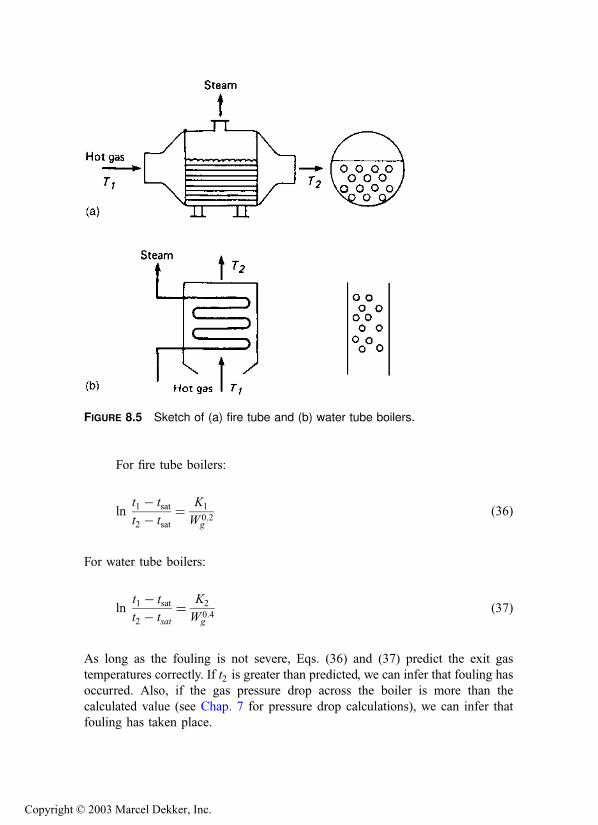
For fire tube boilers:
lnt1 � tsat
t2 � tsat¼ K1
W 0:2g
ð36Þ
For water tube boilers:
lnt1 � tsat
t2 � tsat¼ K2
W 0:4g
ð37Þ
As long as the fouling is not severe, Eqs. (36) and (37) predict the exit gas
temperatures correctly. If t2 is greater than predicted, we can infer that fouling has
occurred. Also, if the gas pressure drop across the boiler is more than the
calculated value (see Chap. 7 for pressure drop calculations), we can infer that
fouling has taken place.
FIGURE 8.5 Sketch of (a) fire tube and (b) water tube boilers.
Copyright © 2003 Marcel Dekker, Inc.

Calculate K2 from Eq. (37). tsat ¼ 417 from the steam tables (see the
Appendix).
K2 ¼ ln1000� 417
500� 417
� �� ð75;000Þ0:4 ¼ 173
Let us predict the exit gas temperature when Wg ¼ 50,000.
ln950� 417
t2 � 417
� �¼ ð50;000Þ0:4
173¼ 2:29
t2 ¼ 417þ 950� 417
expð2:29Þ ¼ 471�F
Now the actual exit gas temperature is 520�F, which means that the fouling is
severe.
The energy loss due to fouling is
Q ¼ 50;000� 0:26� ð520� 471Þ¼ 0:63� 106 Btu=h
If energy costs $3=MMBtu, the annual loss of energy due to fouling will be
3� 0.63� 8000¼ $15,120 (assuming 8000 hours of operation a year).
8.18
Q:
When and where are finned tubes used? What are their advantages over bare
tubes?
A:
Finned tubes are used extensively in boilers, superheaters, economizers, and
heaters for recovering energy from clean gas streams such as gas turbine exhaust
or flue gas from combustion of premium fossil fuels. If the particulate concentra-
tion in the gas stream is very low, finned tubes with a low fin density may be used.
However, the choice of fin configuration, particularly in clean gas applications, is
determined by several factors such as tube-side heat transfer coefficient, overall
size, cost, and gas pressure drop, which affects the operating cost.
Solid and serrated fins (Fig. 8.6) are used in boilers and heaters. Finned
surfaces are attractive when the ratio between the heat transfer coefficients on the
outside of the tubes to that inside is very small. In boiler evaporators or
economizers, the tube-side coefficient could be in the range of 1500–
3000Btu=ft2 h �F, and the gas-side coefficient could be in the range of 10–
Copyright © 2003 Marcel Dekker, Inc.

20Btu=ft2 h �F. A large fin density or a large ratio of external to internal surface
area is justified in this case. As the ratio between the outside and inside
coefficients decreases, the effectiveness of using a large ratio of external to
internal surface areas decreases. For example, in superheaters or high pressure air
heaters, where the tube-side coefficient could be in the range of 30–
300Btu=ft2 h �F, it does not pay to use a large fin surface; in fact, it is counter-
productive, as will be shown later. A moderate fin density such as two or three
fins per inch would be adequate, whereas for economizers or evaporators, five or
even six fins per inch may be justified if cleanliness permits.
The other important fact to be kept in mind is that more surface area does
not necessarily mean more energy transfer. It is possible, through poor choice of
fin configuration, to have more surface area and yet transfer less energy. One has
to look at the product of surface area and overall heat transfer coefficient and not
at surface area alone. The overall heat transfer coefficient is significantly reduced
as we increase the fin surface or use more fins per inch.
Finned tubes offer several advantages over bare tubes such as a compact
design that occupies less space, lower gas pressure drop, lower tube-side pressure
drop due to the fewer rows of tubes, and smaller overall weight and cost.
Solid fins offer slightly lower gas pressure drop than serrated fins, which
have a higher heat transfer coefficient for the same fin density and configuration.
Particulates, if present, are likely to accumulate on serrated finned tubes, which
may be difficult to clean.
Figure 8.6 Solid and serrated fins.
Copyright © 2003 Marcel Dekker, Inc.

8.19a
Q:
How are the heat transfer and pressure drop over finned tubes and tube and fin
wall temperatures evaluated?
A:
The widely used ESCOA correlations developed by ESCOA Corporation [9] will
be used to evaluate the heat transfer and pressure drop over solid and serrated
finned tubes in in-line and staggered arrangements. The basic equation for heat
transfer coefficient with finned tubes is given by Eq. (3).
The calculation for tube-side coefficient hi was discussed earlier. hoconsists of two parts, a nonluminous coefficient hN ; which is computed as
discussed in Q8.07, and hc, the convective heat transfer coefficient. Computation
of hc involves an elaborate procedure and the solving of several equations, as
detailed below.
Determination of hc [9]
hc ¼ C3C1C5
d þ 2 h
d
� �0:5
� tg þ 460
ta þ 460
� �0:25
� GCp �k
mCp
!0:67
ð38Þ
G ¼ Wg
½ðST=12Þ � Ao�NwLð39Þ
Ao ¼d
12þ nbh
6ð40Þ
C1;C2; and C3 are obtained from Table 8.10.
Re ¼ Gd
12 mð41Þ
s ¼ 1
n� b ð42Þ
Fin Efficiency and Effectiveness
For both solid and serrated fins, effectiveness Z is
Z ¼ 1� ð1� EÞ Af
At
ð43Þ
Copyright © 2003 Marcel Dekker, Inc.
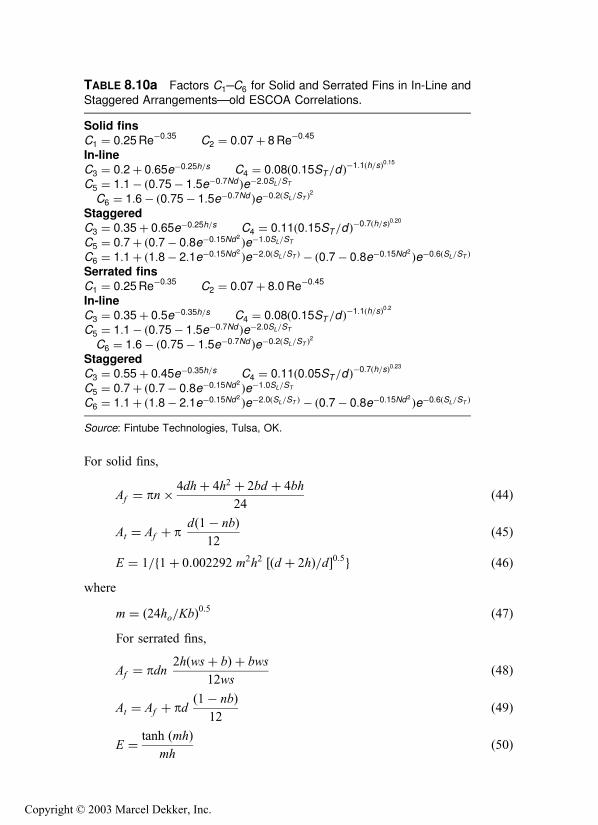
For solid fins,
Af ¼ pn� 4dhþ 4h2 þ 2bd þ 4bh
24ð44Þ
At ¼ Af þ pdð1� nbÞ
12ð45Þ
E ¼ 1=f1þ 0:002292 m2h2 ½ðd þ 2hÞ=d�0:5g ð46Þwhere
m ¼ ð24ho=KbÞ0:5 ð47ÞFor serrated fins,
Af ¼ pdn2hðwsþ bÞ þ bws
12wsð48Þ
At ¼ Af þ pdð1� nbÞ
12ð49Þ
E ¼ tanh ðmhÞmh
ð50Þ
TABLE 8.10a Factors C1–C6 for Solid and Serrated Fins in In-Line and
Staggered Arrangements—old ESCOA Correlations.
Solid finsC1 ¼ 0:25Re�0:35 C2 ¼ 0:07þ 8Re�0:45
In-lineC3 ¼ 0:2þ 0:65e�0:25h=s C4 ¼ 0:08ð0:15ST =d Þ�1:1ðh=sÞ0:15
C5 ¼ 1:1� ð0:75� 1:5e�0:7Nd Þe�2:0SL=ST
C6 ¼ 1:6� ð0:75� 1:5e�0:7Nd Þe�0:2ðSL=ST Þ2
StaggeredC3 ¼ 0:35þ 0:65e�0:25h=s C4 ¼ 0:11ð0:15ST =d Þ�0:7ðh=sÞ0:20
C5 ¼ 0:7þ ð0:7� 0:8e�0:15Nd2 Þe�1:0SL=ST
C6 ¼ 1:1þ ð1:8� 2:1e�0:15Nd2 Þe�2:0ðSL=ST Þ � ð0:7� 0:8e�0:15Nd2 Þe�0:6ðSL=ST Þ
Serrated finsC1 ¼ 0:25Re�0:35 C2 ¼ 0:07þ 8:0Re�0:45
In-lineC3 ¼ 0:35þ 0:5e�0:35h=s C4 ¼ 0:08ð0:15ST =d Þ�1:1ðh=sÞ0:2
C5 ¼ 1:1� ð0:75� 1:5e�0:7Nd Þe�2:0SL=ST
C6 ¼ 1:6� ð0:75� 1:5e�0:7Nd Þe�0:2ðSL=ST Þ2
StaggeredC3 ¼ 0:55þ 0:45e�0:35h=s C4 ¼ 0:11ð0:05ST =d Þ�0:7ðh=sÞ0:23
C5 ¼ 0:7þ ð0:7� 0:8e�0:15Nd2 Þe�1:0SL=ST
C6 ¼ 1:1þ ð1:8� 2:1e�0:15Nd2 Þe�2:0ðSL=ST Þ � ð0:7� 0:8e�0:15Nd2 Þe�0:6ðSL=ST Þ
Source: Fintube Technologies, Tulsa, OK.
Copyright © 2003 Marcel Dekker, Inc.

TABLE 8.10b Factors C1 � C6 for Solid and Serrated Fins in In-line and Staggered Arrangements—Revised
Correlations
Solid finsIn-lineC1 ¼ 0:053ð1:45� 2:9SL=d Þ�2:3 Re�0:21 C2 ¼ 0:11þ 1:4 Re�0:4
C3 ¼ 0:20þ 0:65e�0:25h=s C4 ¼ 0:08ð0:15ST =dÞ�1:1ðh=sÞ0:15
C5 ¼ 1:1� ð0:75� 1:5e�0:7Nd Þe�2:0SL=ST C6 ¼ 1:6� ð0:75� 1:5e�0:7Nd Þe�0:2ðSL=ST Þ2
J ¼ C1C3C5½ðd þ 2hÞ=d �0:5½ðtg þ 460Þ=ðta þ 460Þ�0:5f ¼ C2C4C6½ðd þ 2hÞ=d �½ðtg þ 460Þ=ðta þ 460Þ�0:25StaggeredC1 ¼ 0:091 Re�0:25 C2 ¼ 0:075þ 1:85 Re�0:3
C3 ¼ 0:35þ 0:65e�0:25h=s C4 ¼ 0:11ð0:05ST =dÞ�0:7ðh=sÞ0:20
C5 ¼ 0:7þ ð0:7� 0:8e�0:15Nd2 Þ½e�1:0SL=ST � C6 ¼ 1:1þ ð1:8� 2:1e�0:15Nd2 Þe�2:0ðSL=ST Þ � ½0:7� 0:8e�0:15N2d �e�0:6ðSL=ST Þ
J ¼ C1C3C5½ðd þ 2h=d �0:5½ðtg þ 460Þ=ðta þ 460Þ�0:5f ¼ C2C4C6½ðd þ 2hÞ=d �0:5½ðtg þ 460Þ=ðta þ 460Þ��0:25
Serrated finsIn-lineC1 ¼ 0:053ð1:45� 2:9SL=d Þ�2:3 Re�0:21 C2 ¼ 0:11þ 1:4 Re�0:4
C3 ¼ 0:25þ 0:6e�0:26h=s C4 ¼ 0:08ð0:15ST =d Þ�1:1ðh=sÞ0:15
C5 ¼ 1:1� ð0:75� 1:5e�0:7Nd Þe�2:0SL=ST C6 ¼ 1:6� ð0:75� 1:5e�0:7Nd Þe�0:2ðSL=ST Þ2
J ¼ C1C3C5½ðd þ 2hÞ=d �0:5½ðtg þ 460Þ=ðta þ 460Þ�0:5f ¼ C2C4C6½ðd þ 2hÞ=d �½ðtg þ 460Þ=ðta þ 460Þ�0:25StaggeredC1 ¼ 0:091 Re�0:25 C2 ¼ 0:075þ 1:85 Re�0:3
C3 ¼ 0:35þ 0:65e�0:17h=s C4 ¼ 0:11ð0:05ST =dÞ�0:7ðh=sÞ0:2
C5 ¼ 0:7þ ð0:7� 0:8e�0:15Nd2 Þe�1:0SL=ST C6 ¼ 1:1þ ð1:8� 2:1e�0:15Nd2 Þe�2:0ðSL=ST Þ � ð0:7� 0:8e�0:15Nd2 Þe�0:6ðSL=ST Þ
J ¼ C1C3C5½ðd þ 2hÞ=d �0:5½ðtg þ 460Þ=ðta þ 460Þ�0:25f ¼ C2C4C6½ðd þ 2hÞ=d �0:5½ðtg þ 460Þ=ðta þ 460Þ��0:25
Source: Fintube Technologies, Tulsa, OK.
Copyright © 2003 Marcel Dekker, Inc.
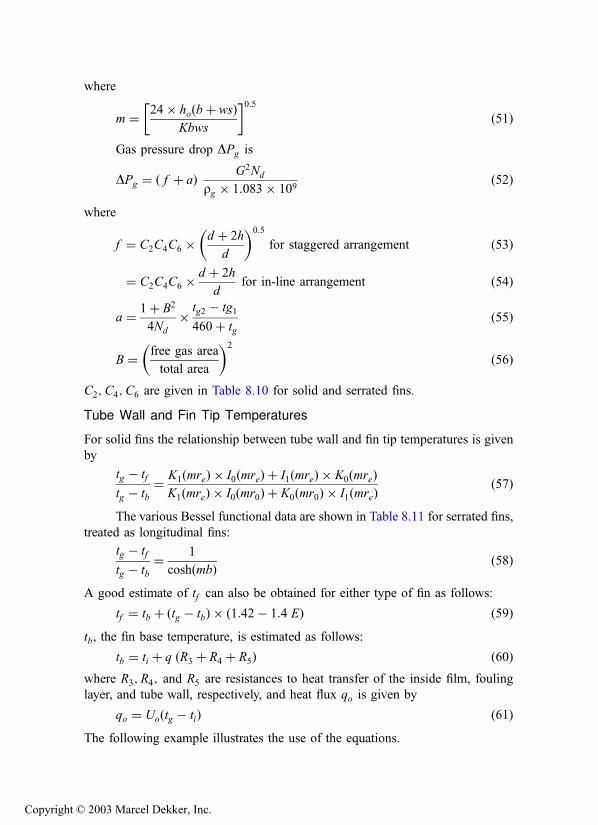
where
m ¼ 24� hoðbþ wsÞKbws
� �0:5ð51Þ
Gas pressure drop DPg is
DPg ¼ ð f þ aÞ G2Nd
rg � 1:083� 109ð52Þ
where
f ¼ C2C4C6 �d þ 2h
d
� �0:5
for staggered arrangement ð53Þ
¼ C2C4C6 �d þ 2h
dfor in-line arrangement ð54Þ
a ¼ 1þ B2
4Nd
� tg2 � tg1
460þ tgð55Þ
B ¼ free gas area
total area
� �2
ð56Þ
C2;C4;C6 are given in Table 8.10 for solid and serrated fins.
Tube Wall and Fin Tip Temperatures
For solid fins the relationship between tube wall and fin tip temperatures is given
by
tg � tf
tg � tb¼ K1ðmreÞ � I0ðmreÞ þ I1ðmreÞ � K0ðmreÞ
K1ðmreÞ � I0ðmr0Þ þ K0ðmr0Þ � I1ðmreÞð57Þ
The various Bessel functional data are shown in Table 8.11 for serrated fins,
treated as longitudinal fins:
tg � tf
tg � tb¼ 1
coshðmbÞ ð58Þ
A good estimate of tf can also be obtained for either type of fin as follows:
tf ¼ tb þ ðtg � tbÞ � ð1:42� 1:4 EÞ ð59Þtb, the fin base temperature, is estimated as follows:
tb ¼ ti þ q ðR3 þ R4 þ R5Þ ð60Þwhere R3;R4; and R5 are resistances to heat transfer of the inside film, fouling
layer, and tube wall, respectively, and heat flux qo is given by
qo ¼ Uoðtg � tiÞ ð61ÞThe following example illustrates the use of the equations.
Copyright © 2003 Marcel Dekker, Inc.

Example
A steam superheater is designed for the following conditions.
Gas flow¼ 225,000 pph
Gas inlet temperature¼ 1050�FGas exit temperature¼ 904�FGas analysis (vol%): CO2 ¼ 3, H2O¼ 7, N2 ¼ 75, O2 ¼ 15
TABLE 8.11 I0; I1;K0; and K1 Values for Various Arguments
x I0ðxÞ I1ðxÞ K0ðxÞ K1ðxÞ0 1.0 0 8 8
0.1 1.002 0.05 2.427 9.8540.2 1.010 0.10 1.753 4.7760.3 1.023 0.152 1.372 3.056
0.4 1.040 0.204 1.114 2.1840.5 1.063 0.258 0.924 1.6560.6 1.092 0.314 0.778 1.303
0.7 1.126 0.372 0.66 1.050.8 1.166 0.433 0.565 0.8620.9 1.213 0.497 0.487 0.716
1.0 1.266 0.565 0.421 0.6021.2 1.394 0.715 0.318 0.4341.4 1.553 0.886 0.244 0.3211.6 1.75 1.085 0.188 0.241
1.8 1.99 1.317 0.146 0.1832.0 2.28 1.591 0.114 0.1402.2 2.629 1.914 0.0893 0.108
2.4 3.049 2.298 0.0702 0.08372.6 3.553 2.755 0.554 0.06532.8 4.157 3.301 0.0438 0.0511
3.0 4.881 3.953 0.0347 0.04023.2 5.747 4.734 0.0276 0.03163.4 6.785 5.670 0.0220 0.02503.6 8.028 6.793 0.0175 0.0198
3.8 9.517 8.140 0.0140 0.01574.0 11.30 9.759 0.0112 0.01254.2 13.44 11.70 0.0089 0.0099
4.4 16.01 14.04 0.0071 0.00794.6 19.09 16.86 0.0057 0.00634.8 22.79 20.25 0.0046 0.0050
5.0 27.24 24.34 0.0037 0.0040
Copyright © 2003 Marcel Dekker, Inc.

Steam flow¼ 50,000 pph
Steam temperature in¼ 501�F (sat)
Steam exit temperature¼ 758�FSteam pressure (exit)¼ 650 psig
Tubes used: 2� 0.120 low alloy steel tubes; 18 tubes=row, 6 deep, 10 ft long,
in-line arrangement with 4 in. square pitch and nine streams. Tube inner dia-
meter¼ 1.738 in.; outer diameter¼ 2 in.
Fins used: solid stainless steel, 2 fins=in., 0.5 in. high and 0.075 in. thick.
Fin thermal conductivity K ¼ 15Btu=ft h �F.Determine the heat transfer coefficient and pressure drop.
Solution.
Ao ¼2
12þ 2� 0:5� 0:075
6¼ 0:17917 ft2=ft
G ¼ 225;000
18� 10� ½ð4=12Þ � 0:17917Þ� ¼ 8127 lb=ft2 h
The gas properties at the average gas temperature (from the Appendix) are
Cp ¼ 0:276; m ¼ 0:086; k ¼ 0:03172
Re ¼ 8127� 2
12� 0:086¼ 15;750
C1 ¼ 0:25� ð15;750Þ�0:35 ¼ 0:0085
s ¼ 1=2� 0:075 ¼ 0:425
C3 ¼ 0:2þ 0:65 e�0:25�0:5=0:425 ¼ 0:6843
C5 ¼ 1:1� ð0:75� 1:5 e�0:7�6Þ ðe�2�4=4Þ ¼ 1:0015
Assume that the average fin temperature is 750�F. The average gas
temperature¼ 977�F, and steam temperature¼ 630�F. The fin thermal conduc-
tivity K is assumed to be 15Btu=ft h �F. Then,
hc ¼ 0:0085� 0:6843� 1:0015� 3
2
� �0:5
� 977þ 460
750þ 460
� �0:25
� 8127� 0:276
� 0:03172
0:276� 0:086
� �0:67
¼ 20:29
Copyright © 2003 Marcel Dekker, Inc.

Using methods discussed in Q8.07, we find hN ¼ 1.0. The beam length for finned
tubes is computed as 3.4� volume=surface area. Hence
ho ¼ 20:29þ 1:0 ¼ 21:29
m ¼ 24� 21:29
15� 0:075
� �0:5
¼ 21:31
E ¼ 1=ð1þ 0:002292� 21:31� 21:31� 0:5� 0:5�ffiffiffiffiffiffiffi1:5
pÞ
¼ 0:758
Af ¼ 3:14� 2
� 4� 2� 0:5þ 4� 0:5� 0:5þ 2� 0:075� 2þ 4� 0:075� 5
24
¼ 1:426
At ¼ 1:426þ 3:14� 2� 1� 2� 0:075
12¼ 1:871
Hence
Z ¼ 1� ð1� 0:758Þ 1:426
1:871¼ 0:8156
Let us compute hi for steam. w¼ 50,000=9¼ 5555 lb=h per tube. From
Table 8.2, factor C¼ 0.34.
hi ¼ 2:44� 0:34� ð5555Þ0:8ð1:738Þ1:8 ¼ 303 Btu=ft2 h �F
1
U¼ 1
21:29� 0:816þ 12� 1:871
303� 3:14� 1:738
þ 0:001þ 0:001� 1:871� 12
3:14� 1:738þ 24 ln
2
1:738
� �
� 1:871
24� 20� 3:14� 1:738
¼ 0:0576þ 0:01358þ 0:001þ 0:0041 þ 0:0032
¼ 0:0795 or U ¼ 12:58 Btu=ft2hF
Calculation of Tube Wall and Fin Tip Temperature
Heat flux q ¼ 12:58� ð977� 630Þ ¼ 4365Btu=ft2 h
tb ¼ 630þ 4365� ð0:0032þ 0:0041þ 0:01358Þ¼ 722�F
Copyright © 2003 Marcel Dekker, Inc.
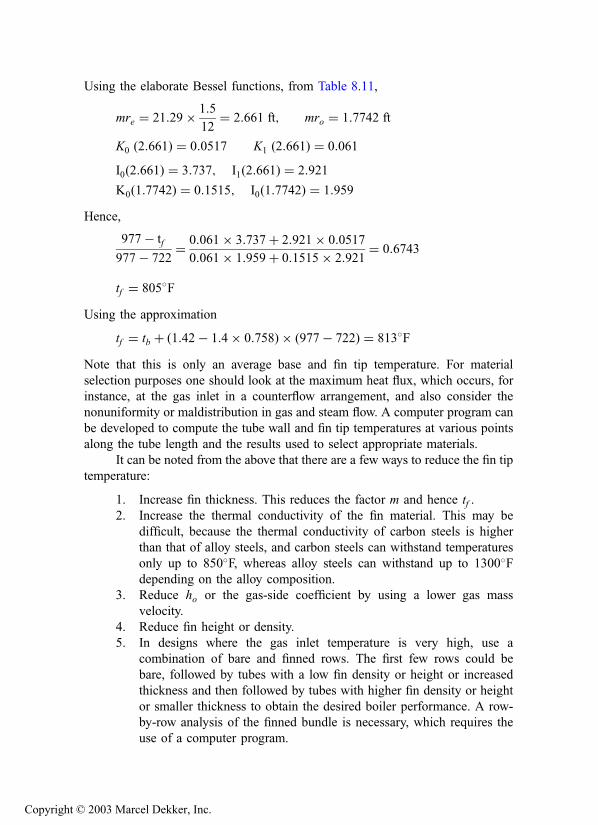
Using the elaborate Bessel functions, from Table 8.11,
mre ¼ 21:29� 1:5
12¼ 2:661 ft; mro ¼ 1:7742 ft
K0 ð2:661Þ ¼ 0:0517 K1 ð2:661Þ ¼ 0:061
I0ð2:661Þ ¼ 3:737; I1ð2:661Þ ¼ 2:921
K0ð1:7742Þ ¼ 0:1515; I0ð1:7742Þ ¼ 1:959
Hence,
977� tf
977� 722¼ 0:061� 3:737þ 2:921� 0:0517
0:061� 1:959þ 0:1515� 2:921¼ 0:6743
tf ¼ 805�F
Using the approximation
tf ¼ tb þ ð1:42� 1:4� 0:758Þ � ð977� 722Þ ¼ 813�F
Note that this is only an average base and fin tip temperature. For material
selection purposes one should look at the maximum heat flux, which occurs, for
instance, at the gas inlet in a counterflow arrangement, and also consider the
nonuniformity or maldistribution in gas and steam flow. A computer program can
be developed to compute the tube wall and fin tip temperatures at various points
along the tube length and the results used to select appropriate materials.
It can be noted from the above that there are a few ways to reduce the fin tip
temperature:
1. Increase fin thickness. This reduces the factor m and hence tf .
2. Increase the thermal conductivity of the fin material. This may be
difficult, because the thermal conductivity of carbon steels is higher
than that of alloy steels, and carbon steels can withstand temperatures
only up to 850�F, whereas alloy steels can withstand up to 1300�Fdepending on the alloy composition.
3. Reduce ho or the gas-side coefficient by using a lower gas mass
velocity.
4. Reduce fin height or density.
5. In designs where the gas inlet temperature is very high, use a
combination of bare and finned rows. The first few rows could be
bare, followed by tubes with a low fin density or height or increased
thickness and then followed by tubes with higher fin density or height
or smaller thickness to obtain the desired boiler performance. A row-
by-row analysis of the finned bundle is necessary, which requires the
use of a computer program.
Copyright © 2003 Marcel Dekker, Inc.

Computation of Gas Pressure Drop
C2 ¼ 0:07þ 8� ð15;750Þ�0:45 ¼ 0:1734
C4 ¼ 0:08� ð0:15� 2Þ�1:11�ð0:5=0:425Þ0:15 ¼ 0:3107
C6 ¼ 1
f ¼ 0:1734� 0:3107� 1� 3
2¼ 0:0808
B2 ¼ 0:333� 0:17917
0:333
� �2
¼ 0:2134
a ¼ 904� 1050
460þ 977� 1þ 0:2134
24¼ �0:005
DPg ¼ ð0:0808� 0:0051Þ � 8120� 8120� 6
0:0271� 1:083� 109
¼ 1:02 in: WC
ðGas density ¼ 0:0271:Þ
Computer solution of the above system of equations saves a lot of time.
However, I have developed a chart (Fig. 8.7) that can be used to obtain hc (or hg)
and Z values for serrated fins and an in-line arrangement for various fin
configurations and gas mass velocities for gas turbine exhaust gases at an average
gas temperature of 700�F. Although a computer program is the best tool, the chart
can be used to show trends and the effect of fin configuration on the performance
of finned surfaces. The use of the chart is explained later with an example. The
following points should be noted.
1. From Fig. 8.7, it can be seen that for a given mass velocity, the higher
the fin density or height, the lower the gas-side coefficient or effec-
tiveness, which results in lower Uo. The amount of energy transferred
in heat transfer equipment depends on the product of the overall heat
transfer coefficient and surface area and not on the surface area alone.
We will see later that one can have more surface area and yet transfer
less duty due to poor choice of fin configuration.
2. Higher fin density or height results in higher DPg. Even after adjusting
for the increased surface area per row, it can be shown that the higher
the fin density or the greater the height, the higher the gas pressure
drop will be for a given mass velocity.
Copyright © 2003 Marcel Dekker, Inc.

8.19b
Q:
Describe Briggs and Young’s correlation.
A:
Charts and equations provided by the manufacturer of finned tubes can be used to
obtain hc. In the absence of such data, the following equation of Briggs and
Young for circular or helical finned tubes in staggered arrangement [4] can be
used.
hcd
12k¼ 0:134
Gd
12m
� �0:681 mCp
k
� �0:33S
h
� �0:2S
b
� �0:113
ð62Þ
Simplifying, we have
hc ¼ 0:295G0:681
d0:319
� �k0:67C0:33
p
m0:351
� �S0:313
h0:2b0:113
� �ð63Þ
Figure 8.7 Chart of convective heat transfer coefficient and pressure drop
versus fin geometry. (Data from Ref. 10)
Copyright © 2003 Marcel Dekker, Inc.

where
G ¼ gas mass velocity
¼ Wg
NwLðST=12� AoÞ½Eq: ð39Þ�
S¼ fin clearance¼ 1=n� b; in [Eq. (42)]
d; h; b¼ tube outer diameter, height, and thickness, in.
Ao ¼ fin obstruction area¼ d
12þ nbd
6; ft2=ft ½Eq: ð40Þ�
The gas properties Cp; m, and k are evaluated at the average gas temperature.
The gas heat transfer coefficient hc has to be corrected for the temperature
distribution along the fin height by the fin efficiency
E ¼ 1
1þ 1
3
mh
12
� �2ffiffiffiffiffiffiffiffiffiffiffiffiffiffid þ 2h
d
r ð64Þ
where
m ¼ffiffiffiffiffiffiffiffiffi24hcKmb
s½Eq: ð47Þ�
Km is the fin metal thermal conductivity, in Btu=ft h �F.In order to correct for the effect of finned area, a term called fin
effectiveness is used. This term, Z, is given by
Z ¼ 1� ð1� EÞ � Af
At
½Eq: 43�
where the finned area Af and total area At are given by
Af ¼pn24
ð4dhþ 4h2 þ 2bd þ 4bhÞ ½Eq: ð44Þ�
At ¼ Af þpd12
ð1� nbÞ ½Eq: ð45Þ�
n is the fin density in fins=in. The factor
F ¼ k0:67C0:33p
m0:35ð65Þ
is given in Table 8.12.
The overall heat transfer coefficient with finned tubes, U , can be estimated
as U ¼ 0:85Zhc, neglecting the effect of the non-luminous heat transfer coeffi-
cient.
Copyright © 2003 Marcel Dekker, Inc.

Example
Determine the gas-side heat transfer coefficient when 150,000 lb=h of flue gases
at an average temperature of 900�F flow over helically finned economizer tubes
with the following parameters:
d¼ tube outer diameter¼ 2.0 in.
n¼ fins=in.¼ 3
h¼ fin height¼ 1 in.
b¼ fin thickness¼ 0.06 in.
L¼ effective length of tubes¼ 10.5 ft
Nw ¼ number of tubes wide¼ 12
ST ¼ transverse pitch¼ 4.5 in. (staggered)
Calculate Ao;Af , and At. From Eq. (40),
Ao ¼2
12þ 3� 0:06� 1
6¼ 0:2 ft2=ft
From Eq. (44),
Af ¼ p� 3
24
� �� ð4� 2� 1þ 4� 1� 1
þ 2� 0:06� 2þ 4� 0:06Þ ¼ 4:9 ft2=ft
From Eq. (45),
At ¼ 4:9þ p2� ð1� 3� 0:06Þ
12¼ 5:33 ft2=ft
TABLE 8.12 Factor F for
Finned Tubes
Temp (�F) F
200 0.0978400 0.1250600 0.1340
800 0.14391000 0.14731200 0.1540
1600 0.1650
Copyright © 2003 Marcel Dekker, Inc.
From Eq. (39),
G ¼ 150;000
12� 10:5� ð4:5=12� 0:2Þ ¼ 6800 lb=ft2 h
Fin pitch S ¼ 1
3� 0:06 ¼ 0:27
Using Eq. (65) with F ¼ 0.145 from Table 8.12 gives us
hc ¼ 0:295� 68800:681 � 0:145
� 0:270:313
20:319 � 10:2 � 0:060:113¼ 12:74 Btu=ft2 h �F
Calculate fin efficiency from Eq. (64). Let metal thermal conductivity of
fins (carbon steel)¼ 24Btu=ft h �F.
m ¼ffiffiffiffiffiffiffiffiffiffiffiffiffiffiffiffiffiffiffiffiffiffi24� 12:74
24� 0:06
r¼ 14:57
E ¼ 1
1þ 0:33� ð14:57� 1=12Þ2 � ffiffiffiffiffiffiffiffiffiffiffiffiffiffiffiffiffiffiffið2þ 2Þ=2p ¼ 0:6
Fin effectiveness Z ¼ 1� ð1� 0:6Þ 4:9
5:33¼ 0:63
Hence,
Zhc ¼ 0:63� 12:74 ¼ 8 Btu=ft2 h �F
Km ranges from 23 to 27Btu=ft h �F for carbon steels, depending on temperature
[1]. For alloy steels it is lower.
8.19c
Q:
This example shows how one can predict the performance of a given heat transfer
surface. A superheater is designed for the following conditions: 18 tubes=row, 6rows deep, 10 ft long with 2 fins=in., 0.5 in. high and 0.075 in. thick solid fins. It
has 18 streams. Surface area¼ 2022 ft2. Tube spacing¼ 4 in. square.
Predict the performance of the superheater under the following conditions:
Gas flow¼ 150,000 lb=h at 1030�FSteam flow¼ 35,000 lb=h at 615 psig sat
Flue gas analysis (vol%): CO2 ¼ 7, H2O¼ 12, N2 ¼ 75, O2 ¼ 6
Heat loss¼ 2%
Surface area A¼ 2022 ft2
Copyright © 2003 Marcel Dekker, Inc.

Let us say that U has been estimated as 10.6 Btu=ft2 h �F using methods discussed
earlier.
A:
Let us use the NTU method to predict the performance of the superheater. This is
discussed in Q8.30. The superheater is in counterflow arrangement.
Energy transferred Q ¼ eCminðtg1 � tS1 Þ
where
e ¼ 1� exp½�NTUð1� CÞ�1� C exp½�NTUð1� CÞ�
C ¼ Cmin=Cmax
Cmin is the lower of (mass� specific heat of the fluid) on gas and steam
sides.
Tg1; ts1 ¼ gas and steam temperature at inlet to superheater, �FUse 491�F for steam saturation temperature.
Though NTU methods generally require no iterations, a few rounds are
necessary in this case to evaluate the specific heat for steam and gas, which are
functions of temperature. However, let us assume that the steam-side specific
heat¼ 0.6679 and that of gas¼ 0.286 Btu=lb �F.
Cgas ¼ 150;000� 0:98� 0:286 ¼ 42;042
Csteam ¼ 35;000� 0:6679 ¼ 23;376
Hence, Cmin ¼ 23,376.
C ¼ 23;376
42;042¼ 0:556
NTU ¼ UA=Cmin ¼10:62� 2022
23;376¼ 0:9186
Hence
e ¼ 1� exp½�0:9186� ð1� 0:556Þ�1� 0:556 exp½�0:9186� ð1� 0:556Þ� ¼ 0:5873
Copyright © 2003 Marcel Dekker, Inc.

Hence
Energy transferedQ ¼ 0:5873� 23;376� ð1030� 491Þ ¼ 6:7 MMBtu=h
Exit steam temperature ¼ 6;700; 000
35;000� 0:06679þ 491 ¼ 287þ 491 ¼ 778�F
Exit gas temperature ¼ 1030� 6;700;000
150;000� 0:286� 0:98¼ 871�F
Steam-side pressure drop is obtained as follows:
Equivalent length of tube ¼ ð18=9Þ � 6� 10þ ð18=9Þ � 6� 2:5� 2
¼ 180 ft
Use 185 ft for estimation. Specific volume of steam at the average steam
conditions of 620 psia and 635�F is 0.956 ft3=lb.
Pressure drop ¼ 3:36� 0:02� 0:956� 35
9
� �2
� 185
1:7385¼ 11:4 psi
Gas-side pressure drop may be estimated using the chart in Fig. 8.7 and is about
0.6 in.WC.
8.20
Q:
A gas turbine HRSG evaporator operates under the following conditions:
Gas flow¼ 230,000 lb h (vol % CO2 ¼ 3, H2O¼ 7, N2 ¼ 75, O2 ¼ 15)
Gas inlet temperature¼ 1050�FExit gas temperature¼ 406�FDuty¼ 230,000� 0.99� 0.27� (10507 406)¼ 39.6MMBtu=hSteam pressure¼ 200 psig
Feedwater temperature¼ 230�FBlowdown¼ 5%
Fouling factors¼ 0.001 ft2 h �F=Btu on both gas and steam sides
Arrangement: 4 in. square pitch
Tubes used: 2� 1.773 in., 24 tubes=row, 11 ft longFins: 5 fins=in., 0.75 in. high, 0.05 in. thick, serrated
Determine the overall heat transfer coefficient and pressure drop using the chart.
A:
The chart shown in Fig. 8.7 has been developed for serrated fins in in-line
arrangement for the above gas analysis. Users may develop their charts for
Copyright © 2003 Marcel Dekker, Inc.
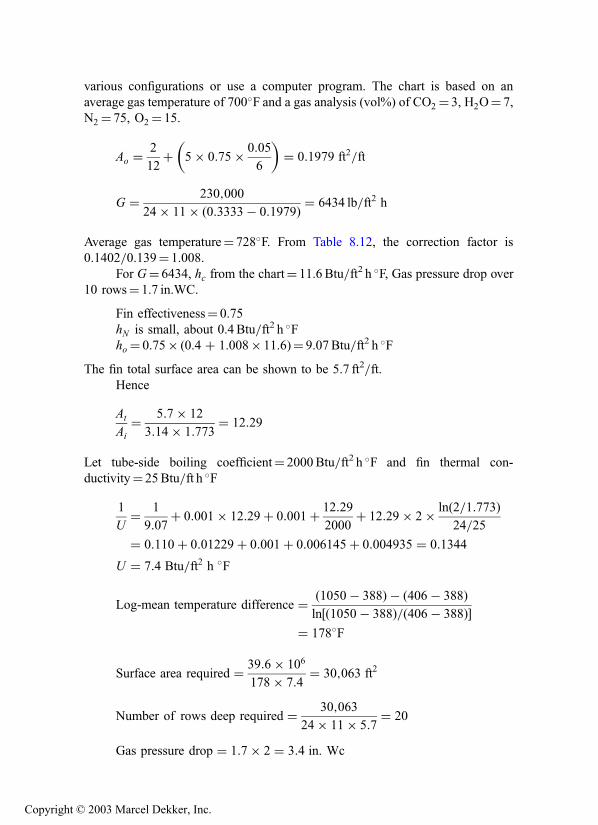
various configurations or use a computer program. The chart is based on an
average gas temperature of 700�F and a gas analysis (vol%) of CO2 ¼ 3, H2O¼ 7,
N2 ¼ 75, O2 ¼ 15.
Ao ¼2
12þ 5� 0:75� 0:05
6
� �¼ 0:1979 ft2=ft
G ¼ 230;000
24� 11� ð0:3333� 0:1979Þ ¼ 6434 lb=ft2 h
Average gas temperature¼ 728�F. From Table 8.12, the correction factor is
0.1402=0.139¼ 1.008.
For G¼ 6434, hc from the chart¼ 11.6 Btu=ft2 h �F, Gas pressure drop over
10 rows¼ 1.7 in.WC.
Fin effectiveness¼ 0.75
hN is small, about 0.4 Btu=ft2 h �Fho ¼ 0.75� (0.4 þ 1.008� 11.6)¼ 9.07Btu=ft2 h �F
The fin total surface area can be shown to be 5.7 ft2=ft.Hence
At
Ai
¼ 5:7� 12
3:14� 1:773¼ 12:29
Let tube-side boiling coefficient¼ 2000Btu=ft2 h �F and fin thermal con-
ductivity¼ 25Btu=ft h �F
1
U¼ 1
9:07þ 0:001� 12:29þ 0:001þ 12:29
2000þ 12:29� 2� lnð2=1:773Þ
24=25
¼ 0:110þ 0:01229þ 0:001þ 0:006145þ 0:004935 ¼ 0:1344
U ¼ 7:4 Btu=ft2 h �F
Log-mean temperature difference ¼ ð1050 � 388Þ � ð406� 388Þln½ð1050� 388Þ=ð406� 388Þ�
¼ 178�F
Surface area required ¼ 39:6� 106
178� 7:4¼ 30;063 ft2
Number of rows deep required ¼ 30;063
24� 11� 5:7¼ 20
Gas pressure drop ¼ 1:7� 2 ¼ 3:4 in. Wc
Copyright © 2003 Marcel Dekker, Inc.

8.21
Q:
How does a finned surface compare with a bare tube bundle for the same duty?
A:
Let us try to design a bare tube boiler for the same duty as above. Use the same
tube size and spacing, tubes per row, and length. Use 2� 1.773 in. bare tubes.
Using the procedure described in Q8.14, we can show that U ¼ 13.05
Btu=ft2 h �F and that 124 rows are required for the same duty. The results are
shown in Table 8.13.
It may be seen that the finned tube bundle is much more compact and has
fewer rows and also a lower gas pressure drop. It also weighs less and should cost
less. Therefore, in clean gas applications such as gas turbine exhaust or fume
incineration plants, extended surfaces may be used for evaporators. In dirty gas
applications such as municipal waste incineration or with flue gases containing
ash or solid particles, bare tubes are preferred. Finned tubes may also be used in
packaged boiler evaporators.
However, the heat flux inside the finned tubes is much larger, which is a
concern in high gas temperature situations. The tube wall temperature is also
higher. Hence when the gas temperature is high, say 1400–1700�F, we use a few
TABLE 8.13 Comparison of Bare Tube and Finned Tube Boilers
Bare tube Finned tube
Gas flow, lb=h 230,000
Inlet gas temperature, �F 1050Exit gas temperature, �F 407Duty, MM Btu=h 39.5Steam pressure, psig 200
Feedwater temperature, �F 230Steam flow, lb=h 39,200Surface area, ft2 17,141 30,102
Overall heat transfer coeff, Btu=ft2 h �F 13.0 7.39Gas pressure drop, in. WC 5.0 3.5Number of rows deep 124 20
Heat flux, Btu=ft2 h 9707 60,120Tube wall temperature, �F 409 516Weight of tubes, lb 81,100 38,800
Tubes=row¼ 24; effective length¼11 ft; 4 in. square spacing. Gas analysis (vol%) CO2 ¼3
H2 ¼7, N2 ¼ 75, O2 ¼ 15. Blowdown¼5%.
Copyright © 2003 Marcel Dekker, Inc.
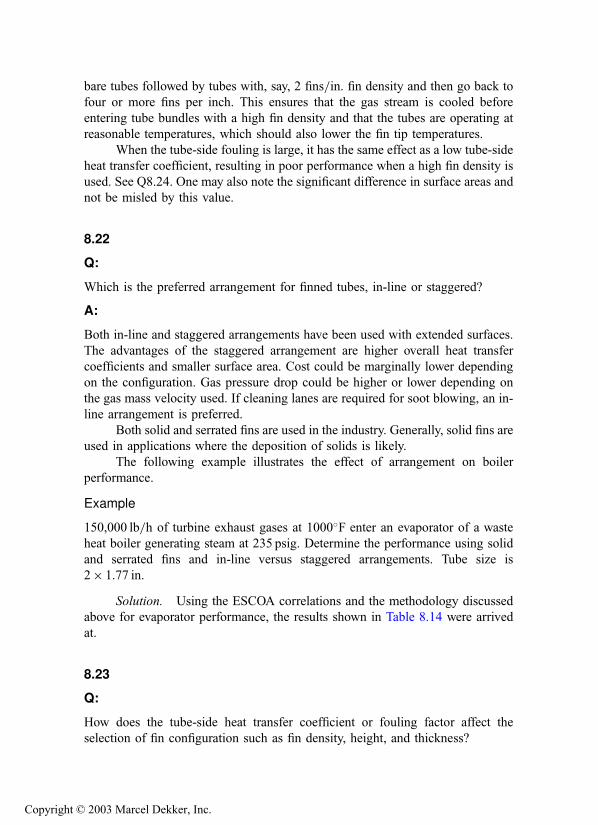
bare tubes followed by tubes with, say, 2 fins=in. fin density and then go back to
four or more fins per inch. This ensures that the gas stream is cooled before
entering tube bundles with a high fin density and that the tubes are operating at
reasonable temperatures, which should also lower the fin tip temperatures.
When the tube-side fouling is large, it has the same effect as a low tube-side
heat transfer coefficient, resulting in poor performance when a high fin density is
used. See Q8.24. One may also note the significant difference in surface areas and
not be misled by this value.
8.22
Q:
Which is the preferred arrangement for finned tubes, in-line or staggered?
A:
Both in-line and staggered arrangements have been used with extended surfaces.
The advantages of the staggered arrangement are higher overall heat transfer
coefficients and smaller surface area. Cost could be marginally lower depending
on the configuration. Gas pressure drop could be higher or lower depending on
the gas mass velocity used. If cleaning lanes are required for soot blowing, an in-
line arrangement is preferred.
Both solid and serrated fins are used in the industry. Generally, solid fins are
used in applications where the deposition of solids is likely.
The following example illustrates the effect of arrangement on boiler
performance.
Example
150,000 lb=h of turbine exhaust gases at 1000�F enter an evaporator of a waste
heat boiler generating steam at 235 psig. Determine the performance using solid
and serrated fins and in-line versus staggered arrangements. Tube size is
2� 1.77 in.
Solution. Using the ESCOA correlations and the methodology discussed
above for evaporator performance, the results shown in Table 8.14 were arrived
at.
8.23
Q:
How does the tube-side heat transfer coefficient or fouling factor affect the
selection of fin configuration such as fin density, height, and thickness?
Copyright © 2003 Marcel Dekker, Inc.

A:
Fin density, height, and thickness affect the overall heat transfer coefficient as can
be seen in Fig. 8.7. However, the tube-side coefficient also has an important
bearing on the selection of fin configuration.
A simple calculation can be done to show the effect of the tube-side
coefficient on Uo. It was mentioned earlier that the higher the tube-side
coefficient, the higher the ratio of external to internal surface area can be. In
other words, it makes no sense to use the same fin configuration, say 5 fins=in. findensity, for a superheater as for an evaporator.
Rewriting Eq. (3) based on tube-side area and neglecting other resistances,
1
Ui
¼ 1
hiþ Ai=At
hoZð66Þ
Using the data from Fig. 8.7, Ui values have been computed for different fin
densities and for different hi values for the configuration indicated in Table 8.15.
The results are shown in Table 8.15. Also shown are the ratio of Ui values
between the 5 and 2 fins=in. designs as well as their surface area.
The following conclusions can be drawn [10].
1. As the tube-side coefficient decreases, the ratio of Ui values (between 5
and 2 fins=in.) decreases. With hi ¼ 20, the Ui ratio is only 1.11. With
an hi of 2000, the Ui ratio is 1.74. What this means is that as hidecreases, the benefit of increasing the external surface becomes less
attractive. With 2.325 times the surface area we have only 1.11-fold
improvement in Ui. With a higher hi of 2000, the increase is better,
1.74.
TABLE 8.14 Comparison Between Staggered and In-Line Designs for Nearly
Same Duty and Pressure Dropa
Serrated fins Solid fins
In-line Staggered In-line Staggered
Fin config. 5� 0.75� 0.05� 0.157 2� 0.75� 0.05� 0
Tubes=row 18 20 18 20No. of fins deep 20 16 20 16Length 10 10 10 11
Uo 7.18 8.36 9.75 10.02DPg 3.19 3.62 1.72 1.42Q 23.24 23.31 21.68 21.71
Surface 20,524 18,244 9802 9584
a Duty, MM Btu=h; DPg , in. WC; surface, ft2; temperature, �F; Uo, Btu=ft2 h �F.
Copyright © 2003 Marcel Dekker, Inc.

2. A simple estimation of tube wall temperature can tell us that the higher
the fin density, the higher the tube wall temperature will be. For the
case of hi ¼ 100, with n¼ 2, Ui ¼ 39.28, gas temperature¼ 900�F, andfluid temperature of 600�F,
Heat flux qi ¼ ð900� 600Þ � 39:28
¼ 11;784 Btu=ft2 h
The temperature drop across the tube-side film (hi ¼ 100)¼11,784=100¼ 118�F. The wall temperature¼ 600 þ 118¼ 718�F.
With n¼ 5, Ui ¼ 53.55, qi ¼ 53.55� 300¼ 16,065Btu=ft2 h.Tube wall temperature¼ 600 þ 16,065=100¼ 761�F. Note that we
are comparing for the same height. The increase in wall temperature
is 43�F.3. The ratio of the gas pressure drop between the 5 and 2 fins=in. designs
(after adjusting for the effect of Ui values and differences in surface
area for the same energy transfer) increases as the tube-side coefficient
reduces. It is 1.6 for hi ¼ 20 and 1.02 for hi ¼ 2000. That is, when hi is
smaller, it is prudent to use a smaller fin surface.
Effect of Fouling Factors
The effects of inside and outside fouling factors ff i and ff o are shown in Tables
8.16 and 8.17. The following observations can be made.
1. With a smaller fin density, the effect of ff i is less. With 0.01 fouling
and 2 fins=in., Uo ¼ 6.89 compared with 10.54 with 0.001 fouling. The
ratio is 0.65. With 5 fins=in., the corresponding values are 4.01 and
TABLE 8.15 Effect of hi on Ui
hi 20 100 1000n, fins=in. 2 5 2 5 2 5
G, lb=ft2 h 5591 6366 5591 6366 5591 6366At=AiZho
a 0.01546 0.00867 0.01546 0.00867 0.01546 0.00867Uo 2.73 1.31 7.03 4.12 11.21 8.38Ui 15.28 17.00 39.28 53.55 62.66 109
Ratio Ui 1.11 1.363 1.74Ratio DPg 1.6 1.3 1.02
Calculations based on 2.0�0.105 tubes, 29 tubes=row, 6 ft long, 0.05 in. thick serrated fins;
tubes on 4.0 in. square pitch; fin height¼0.75 in.; gas flow¼150,000pph; gas inlet
temp¼ 1000�F.a Surface area At of 2 fins=in. tube¼2.59 ft2=ft, and for 5 fins=in., At ¼6.02 ft2=ft.
Copyright © 2003 Marcel Dekker, Inc.
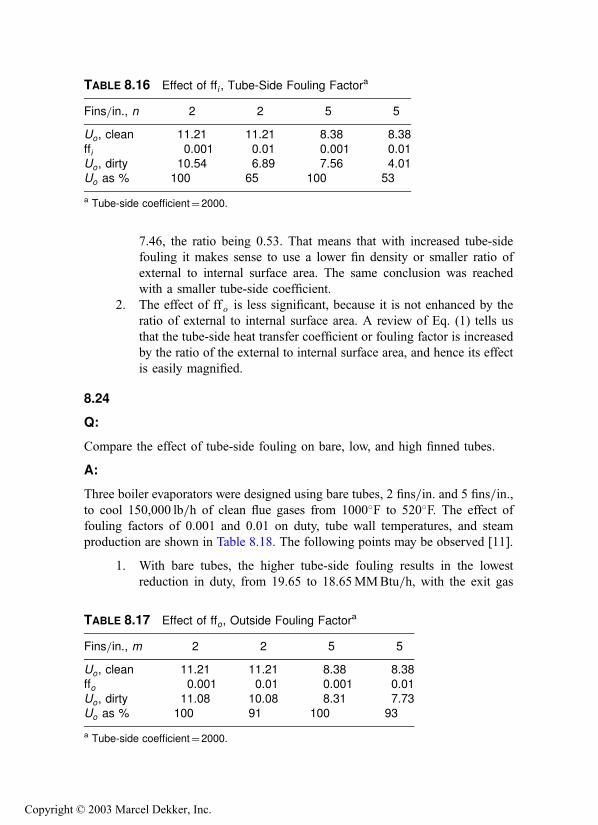
7.46, the ratio being 0.53. That means that with increased tube-side
fouling it makes sense to use a lower fin density or smaller ratio of
external to internal surface area. The same conclusion was reached
with a smaller tube-side coefficient.
2. The effect of ff o is less significant, because it is not enhanced by the
ratio of external to internal surface area. A review of Eq. (1) tells us
that the tube-side heat transfer coefficient or fouling factor is increased
by the ratio of the external to internal surface area, and hence its effect
is easily magnified.
8.24
Q:
Compare the effect of tube-side fouling on bare, low, and high finned tubes.
A:
Three boiler evaporators were designed using bare tubes, 2 fins=in. and 5 fins=in.,to cool 150,000 lb=h of clean flue gases from 1000�F to 520�F. The effect of
fouling factors of 0.001 and 0.01 on duty, tube wall temperatures, and steam
production are shown in Table 8.18. The following points may be observed [11].
1. With bare tubes, the higher tube-side fouling results in the lowest
reduction in duty, from 19.65 to 18.65MMBtu=h, with the exit gas
TABLE 8.16 Effect of ffi , Tube-Side Fouling Factora
Fins=in., n 2 2 5 5
Uo, clean 11.21 11.21 8.38 8.38
ffi 0.001 0.01 0.001 0.01Uo, dirty 10.54 6.89 7.56 4.01Uo as % 100 65 100 53
a Tube-side coefficient¼2000.
TABLE 8.17 Effect of ffo, Outside Fouling Factora
Fins=in., m 2 2 5 5
Uo, clean 11.21 11.21 8.38 8.38ffo 0.001 0.01 0.001 0.01
Uo, dirty 11.08 10.08 8.31 7.73Uo as % 100 91 100 93
a Tube-side coefficient¼2000.
Copyright © 2003 Marcel Dekker, Inc.

temperature going up to 545�F from 520�F—see columns 1 and 2.
With 2 fins=in., the exit gas temperature increases from 520�F to
604�F, with the duty reducing to 16.3 from 19.65MMBtu=h. Thesteam generation is about 3200 lb=h lower. With 5 fins=in., the reduc-
tion in duty and steam generation are the greatest.
2. The heat flux increases with fin density. Therefore, with high tempera-
ture units one has to be concerned with DNB conditions; however, heat
flux decreases because of fouling.
3. The tube wall temperature increases significantly with fin density. The
same fouling factor results in a much higher tube wall temperature for
finned tubes than for bare tubes. The tube wall temperature increases
from 530�F to 760�F with 5 fins=in., and from 437�F to 516�F for bare
tubes. The effect of fouling is more pronounced in tubes of high fin
density, which means that high fin density tubes have to be kept cleaner
than bare tubes. Demineralized water and good water treatment are
recommended in such situations.
8.25
Q:
How is the weight of solid and serrated fins determined?
TABLE 8.18 Effect of Fouling Factors
Case 1 2 3 4 5 6
1. Gas temp in, �F 1000 1000 1000 1000 1000 1000
2. Exit temp, �F 520 545 520 604 520 6463. Duty, MM Btu=h 19.65 18.65 19.65 16.30 19.65 14.604. Steam flow, lb=h 19,390 18,400 19,390 16,110 19,390 14,400
5. ffi , ft2 h �F=Btu 0.001 0.01 0.001 0.01 0.001 0.01
6. Heat flux, Btu=ft2 h 9314 8162 35,360 23,080 55,790 30,2607. Wall temp, �F 437 516 490 680 530 760
8. Fin temp, �F — — 730 840 725 8619. At=Ai 1.13 1.13 5.6 5.6 12.3 12.3
10. Fins bare bare (2� 0.75 (5�0.75
� 0.05� 0.157) � 0.05� 0.157)11. Tubes per row 20 20 20 20 20 2012. No. deep 60 60 16 16 10 1013. Length, ft 8 8 8 8 8 8
14. Surface area, ft2 5024 5024 6642 6642 9122 912215. Gas Dp, in. WC 3.0 3.1 1.80 1.90 2.0 2.1
Copyright © 2003 Marcel Dekker, Inc.

A: The weight of fins is given by the formulas
Wf ¼ 10:68� Fbn� ðdo þ hÞ � ðhþ 0:03Þ for solid fins
Wf ¼ 10:68� Fbndo � ðhþ 0:12Þ for serrated fins
where
Wf ¼ the fin weight, lb=ft (The segment width does not affect the weight.)
b¼ fin thickness, in.
n¼ fin density, fins=in.h¼ fin height, in.
do ¼ tube outer diameter, in.
Factor F corrects for material of fins and is given in Table 8.19 [9].
The weight of the tubes has to be added to the fin weight to give the total
weight of the finned tube. Tube weight per unit length is given by
Wt ¼ 10:68� F � dm � tm ð68Þ
where
dm ¼mean diameter of tube, in.
tm ¼ average wall thickness, in.
Example
Determine the weight of solid carbon steel fins on a 2 in. OD tube if the fin
density is 5 fins=in., height¼ 0.75 in., and thickness¼ 0.05 in. Average tube wall
thickness is 0.120 in.
TABLE 8.19 Table of F Factors
Material F
Carbon steel 1
Type 304, 316, 321 alloys 1.024Type 409, 410, 430 0.978Nickel 200 1.133Inconel 600, 625 1.073
Incoloy 800 1.013Incoloy 825 1.038Hastelloy B 1.179
Copyright © 2003 Marcel Dekker, Inc.

Solution. F from Table 8.19¼ 1. Using Eq. (67a), we have
Wf ¼ 10:68� 1� 0:05� 5� ð2þ 0:75Þ� ð0:75þ 0:03Þ ¼ 5:725 lb=ft
The tube weight has to be added to this. The tube weight is given by
Wt ¼ 10:68� 1:94� 0:12 ¼ 2:49 lb=ft
Hence the total weight of the finned tube¼ 2.49 þ 5.725¼ 8.215 lb=ft.
8.26
Q:
What is the effect of fin thickness and conductivity on boiler performance and
tube and fin tip temperatures?
A:
Table 8.20 gives the performance of a boiler evaporator using different fins.
2� 0.120 carbon steel tubes; 26 tubes=row, 14 deep, 20 ft long
4� 0.75� 0.05 thick solid fins; surface area¼ 35,831 ft2
4� 0.75� 0.102 thick solid fins; surface area¼ 36,426 ft2
In-line arrangement, 4 in. square pitch.
Gas flow¼ 430,000 lb=h at 1400�F in; vol%, CO2 ¼ 8.2, H2O¼ 20.9,
N2 ¼ 67.51, O2 ¼ 3.1
Steam pressure¼ 635 psig
Fouling factors¼ 0.001 ft2 h �F=Btu on both gas and steam.
It can be seen that
1. Due to the slightly larger surface area and higher heat transfer
coefficient, more duty is transferred with higher fin thickness.
TABLE 8.20 Fin Configuration and Performance
Fin cond.(Btu=ft h �F)
Fin thickness(in.)
Duty(MM Btu=h)
Tubetemp.(�F)
Fintemp.(�F)
U(Btu=ft2 h �F)
25 0.05 104 673 996 8.2725 0.102 106.35 692 874 9.0015 0.05 98.35 642 1164 6.78
15 0.102 103.48 670 990 7.98
Copyright © 2003 Marcel Dekker, Inc.
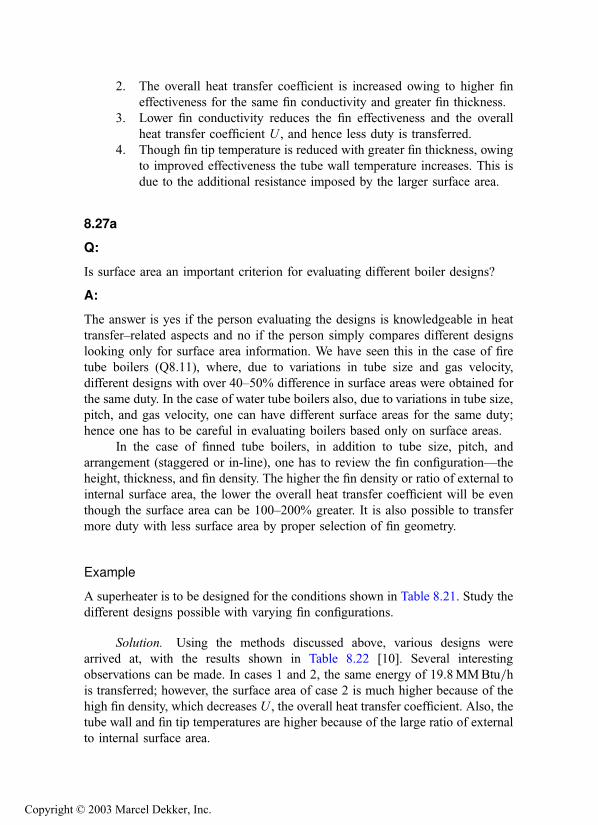
2. The overall heat transfer coefficient is increased owing to higher fin
effectiveness for the same fin conductivity and greater fin thickness.
3. Lower fin conductivity reduces the fin effectiveness and the overall
heat transfer coefficient U , and hence less duty is transferred.
4. Though fin tip temperature is reduced with greater fin thickness, owing
to improved effectiveness the tube wall temperature increases. This is
due to the additional resistance imposed by the larger surface area.
8.27a
Q:
Is surface area an important criterion for evaluating different boiler designs?
A:
The answer is yes if the person evaluating the designs is knowledgeable in heat
transfer–related aspects and no if the person simply compares different designs
looking only for surface area information. We have seen this in the case of fire
tube boilers (Q8.11), where, due to variations in tube size and gas velocity,
different designs with over 40–50% difference in surface areas were obtained for
the same duty. In the case of water tube boilers also, due to variations in tube size,
pitch, and gas velocity, one can have different surface areas for the same duty;
hence one has to be careful in evaluating boilers based only on surface areas.
In the case of finned tube boilers, in addition to tube size, pitch, and
arrangement (staggered or in-line), one has to review the fin configuration—the
height, thickness, and fin density. The higher the fin density or ratio of external to
internal surface area, the lower the overall heat transfer coefficient will be even
though the surface area can be 100–200% greater. It is also possible to transfer
more duty with less surface area by proper selection of fin geometry.
Example
A superheater is to be designed for the conditions shown in Table 8.21. Study the
different designs possible with varying fin configurations.
Solution. Using the methods discussed above, various designs were
arrived at, with the results shown in Table 8.22 [10]. Several interesting
observations can be made. In cases 1 and 2, the same energy of 19.8MMBtu=his transferred; however, the surface area of case 2 is much higher because of the
high fin density, which decreases U , the overall heat transfer coefficient. Also, the
tube wall and fin tip temperatures are higher because of the large ratio of external
to internal surface area.
Copyright © 2003 Marcel Dekker, Inc.
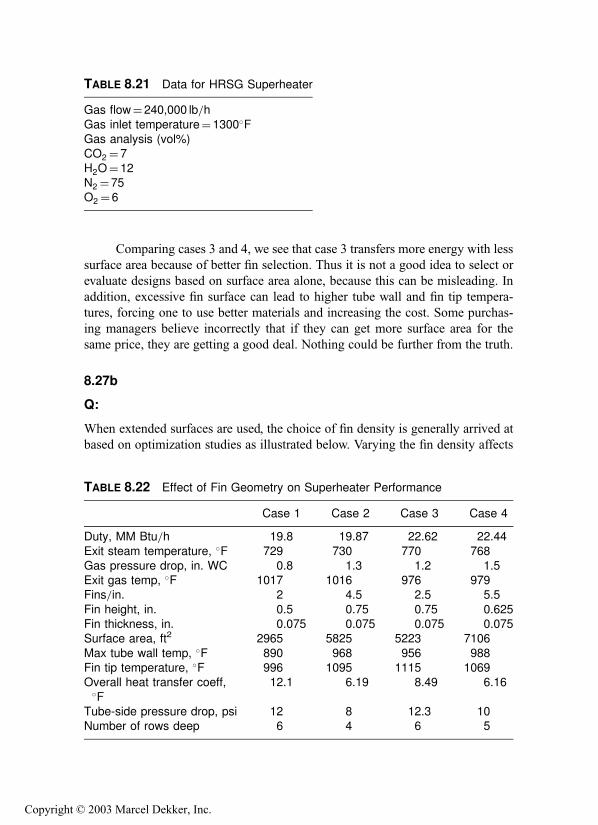
Comparing cases 3 and 4, we see that case 3 transfers more energy with less
surface area because of better fin selection. Thus it is not a good idea to select or
evaluate designs based on surface area alone, because this can be misleading. In
addition, excessive fin surface can lead to higher tube wall and fin tip tempera-
tures, forcing one to use better materials and increasing the cost. Some purchas-
ing managers believe incorrectly that if they can get more surface area for the
same price, they are getting a good deal. Nothing could be further from the truth.
8.27b
Q:
When extended surfaces are used, the choice of fin density is generally arrived at
based on optimization studies as illustrated below. Varying the fin density affects
TABLE 8.21 Data for HRSG Superheater
Gas flow¼ 240,000 lb=hGas inlet temperature¼ 1300�FGas analysis (vol%)CO2 ¼ 7
H2O¼ 12N2 ¼ 75O2 ¼ 6
TABLE 8.22 Effect of Fin Geometry on Superheater Performance
Case 1 Case 2 Case 3 Case 4
Duty, MM Btu=h 19.8 19.87 22.62 22.44
Exit steam temperature, �F 729 730 770 768Gas pressure drop, in. WC 0.8 1.3 1.2 1.5Exit gas temp, �F 1017 1016 976 979Fins=in. 2 4.5 2.5 5.5
Fin height, in. 0.5 0.75 0.75 0.625Fin thickness, in. 0.075 0.075 0.075 0.075Surface area, ft2 2965 5825 5223 7106
Max tube wall temp, �F 890 968 956 988Fin tip temperature, �F 996 1095 1115 1069Overall heat transfer coeff,�F
12.1 6.19 8.49 6.16
Tube-side pressure drop, psi 12 8 12.3 10Number of rows deep 6 4 6 5
Copyright © 2003 Marcel Dekker, Inc.

the gas pressure drop, surface area, and weight of the boiler, not to mention the
tube wall and fin tip temperatures. An incineration plant evaporator is to be
designed to cool 550,000 lb=h of clean flues gases from 1000�F to about 460�F.Steam pressure is 250 psig sat. Feedwater enters the evaporator at 230�F. Flue gasanalysis (vol%) is CO2 ¼ 7, H2O¼ 12, N2 ¼ 75 O2 ¼ 6. Fouling factors are
0.001 ft2 h �F=Btu on both the gas and steam sides. Study the effect of fin
configuration on the design.
A:
The calculation procedure for finned tubes is detailed in Q8.19a–Q8.19c. Only
the results from using a computer program will be discussed here. Using serrated
fins of density 2, 4, and 6 fins=in., 0.75 in. high, 0.05 in. thick with 30 tubes=row,4 in. square pitch configuration, the lengths were varied to obtain different gas
mass velocities. The number of rows deep was adjusted to obtain an exit gas
temperature of about 460�F or a duty of about 82MMBtu=h. Figure 8.8 shows
the results from the study.
As the gas mass velocity increases we see that the gas pressure drop
increases, whereas the surface area decreases for both 2 and 6 fins=in.designs, which should be obvious. The surface area required for the 6
fins=in. design is much larger than with 2 fins=in. As discussed in
Q8.27a, the heat transfer coefficient with higher fin density or large
external fin surface area is lower. The weight of the tube bundle is also
higher with higher fin density.
FIGURE 8.8 Effect of fin geometry on HRSG surface area and gas pressure drop.
Copyright © 2003 Marcel Dekker, Inc.

Table 8.23 summarizes the designs for the 2 and 6 fins=in. cases for the
same duty and gas pressure drop of 4 in.WC. It is seen that the surface
area is much larger with the 6 fins=in. design. The tube wall temperature
is also higher due to the higher heat flux, and the weight is slightly more.
However, the fabrication cost may be less due to the smaller number of
rows deep. Depending on the design, the drum length could also be
smaller due to this. One may evaluate these factors and select the
optimum design.
Note on Surface Areas
As discussed earlier, surface areas from different designs should be interpreted
carefully. One should not select a design based on surface area considerations.
With higher fin density, the heat transfer coefficient will be lower and vice versa.
Simply looking at a spreadsheet that shows surface areas of tubes of different
suppliers and deciding that the design with more surface area is better is
technically incorrect. As can be seen below, the higher surface area option has
higher tube wall temperature and heat flux inside the tubes. If one wants to
compare alternative designs, one should look at UA, the product of overall heat
transfer coefficient U and surface area A and not the surface area alone. The
equation for energy transfer is Q ¼ UADT : Q and DT being the same, UA should
be constant for the various options. Unless one knows how to calculate the heat
transfer coefficients, comparison of surface areas alone should not be attempted,
because it can be misleading. Factors such as tube size, spacing, geometry, and fin
configuration affect U . The discussion also applies to fire tube boilers, where tube
sizes and gas velocities can impact surface areas.
TABLE 8.23 Design of a Boiler with 2 and 6 Fins=in.
Fins=in. 2 6
Gas mass velocity, lb=ft2 h 7500 8000
Surface area, ft2 32,500 50,020Tube wall temp, �F 488 542Fin tip temp, �F 745 724Tubes wide 30 30
Tube length, ft 16 17.6No. of rows deep 26 14Weight, lb 59,650 64,290
Copyright © 2003 Marcel Dekker, Inc.

8.28
Q:
How are tubular air heaters designed?
A:
Let Wg, and Wa be the gas and air quantities. Normally, flue gas flows inside the
tubes while air flows across the tubes in crossflow fashion, as shown in Fig. 8.9.
Carbon steel tubes of 112–3.0 in. OD are generally used. Thickness ranges from
0.06 to 0.09 in. because high pressures are not involved. The tubes are arranged in
in-line fashion and are connected to the tube sheets at the ends. More than one
block may be used in series; in this case, air flows across the tube bundles with a
few turns. Hence, while calculating log-mean temperature difference, we must
consider correction factors FT .
Flue gas velocity is in the range of 40–70 fps, and air-side mass velocities
range from 4000 to 8000 lb=ft2 h. Nw and Nd, the numbers of tubes wide and
deep, can be decided on the basis of duct dimensions leading to the air heater. In
the case of a separate heater, we have the choice of Nw or Nd. In a boiler, for
example, duct dimensions at the economizer section fix dimensions of the air
heater also, because the air heater is located below the economizer.
To size the air heater, first determine the total number of tubes Nt [1]:
Nt ¼0:05Wg
d2i rgVg
ð69Þ
ST=d and SL=d range from 1.25 to 2.0. For the gas-side heat transfer coefficient
hi, Eq. (12) is used:
hi ¼ 2:44� w0:8 C
d1:8i
Values of C are evaluated at average flue gas temperature.
The air-side heat transfer coefficient ho is given by Eq. (19) (variation in hobetween staggered and in-line arrangements is small in the range of Reynolds
number and pitches one comes across),
ho ¼ 0:9� G0:6 F
d0:4
The value ho is calculated at air film temperature.
Because the temperature drops across the gas and air films are nearly the
same, unlike in an evaporator or superheater, film temperature is approximated as
tf ¼ ð3tg þ taÞ=4 ð70Þ
Copyright © 2003 Marcel Dekker, Inc.

FIGURE 8.9 Tubular air heater.
Copyright © 2003 Marcel Dekker, Inc.

where tg and ta refer to the average of gas and air temperatures. Calculate U using
1
U¼ 1� d
hidiþ 1
hoð71Þ
Metal resistance is neglected. Air-and gas-side pressure drops can be computed
by Eqs. (26) and (28) of Chapter 7, after surfacing is done:
DPg ¼ 93� 10�6 � fw2 Lþ 5dirgd
5i
DPair ¼ 9:3� 10�10 � fG2 Nd
rair
It is also good to check for partial load performance to see if dew point
corrosion problems are likely. Methods like air bypass or steam-air heating must
be considered. Vibration of tube bundles must also be checked.
C and F are given in Table 8.24 for easy reference.
Example
A quantity of 500,000 lb=h of flue gas from a boiler is cooled from 700�F;400,000 lb=h of air at 80�F is heated to 400�F. Design a suitable tubular air heater.Carbon steel tubes of 2 in. OD and 0.087 in. thickness are available.
Solution. Assume that duct dimensions are not a limitation. Hence, the
bundle arrangement is quite flexible. Choose ST=d¼ 1.5 and SL=d¼ 1.25 in. in-
line; use a maximum flue gas velocity of 50 ft=s.From an energy balance, assuming negligible losses and for a specific heat
of 0.25 for gas and 0.24 for the air side,
Q ¼ 500;000� 0:25� ð700� tÞ¼ 400;000� 0:24� ð400� 80Þ¼ 30:7� 106 Btu=h
TABLE 8.24 C and F Factors for Calculating hiand ho of Tubular Air
Temp (�F) C F
200 0.162 0.094400 0.172 0.103600 0.18 0.110800 0.187 0.116
Copyright © 2003 Marcel Dekker, Inc.

Hence, the gas temperature leaving the air heater is 454�F. The average flue gas
temperature is (700 þ 454)=2¼ 577�F. Let the molecular weight of the flue gas
be 30. Then
rg ¼30
359� 492
460þ 577¼ 0:0396 lb=cu ft
From Eq. (69),
Nt ¼0:05� 500;000
1:8262 � 0:0396� 50¼ 3800
ST ¼ 3:0 in:; SL ¼ 2:5 in:
Let Nw ¼ 60. Hence, the width of the air heater is
60� 3:0
12¼ 15 ft
Nd ¼ 63 because Nt ¼ Nw � Nd; so
Depth ¼ 63� 2:5=12 ¼ 13:2 ft
At 577�F, from Table 8.24 we have C¼ 0.178:
hi ¼ 2:44� 500;000
3780
� �0:8
� 0:178
ð1:826Þ1:8¼ 7:2 Btu=ft2 h �F
To estimate ho; G is required. This requires an idea of L. We must assume a
value for the length and check later to see if it is sufficient. Hence, it is a trial-and-
error approach. Try L¼ 15 ft:
FGA ¼ ST � d
12� NwL ¼ 1
12� 60� 15 ¼ 75 ft2
G ¼ 400;000=75 ¼ 5333 lb=ft2 h
Average gas and air temperatures are
tg ¼ 577�F; ta ¼ 240�F
tf ¼3� 577þ 240
4¼ 492�F
Copyright © 2003 Marcel Dekker, Inc.

From Table 8.24, F is 0.105. Then
ho ¼ 0:9� 53330:6 � 0:105=20:4 ¼ 12:3 Btu=ft2 h �F
1
U¼ 1
7:2� 2:0
1:826þ 1
12:3
¼ 0:152þ 0:081 ¼ 0:233
U ¼ 4:3 Btu=ft2 h �F
We must calculate FT , the correction factor for DT, for the case of one fluid
mixed and the other unmixed. From Fig. 8.10 (single-pass crossflow),
R ¼ 700� 454
400� 80¼ 0:77
P ¼ 400� 80
700� 80¼ 0:516
FT ¼ 0:9
Therefore,
DT ¼ 0:9� ð454� 80Þ � ð700� 400Þlnð374=300Þ ¼ 302�F
A ¼ Q
U � DT¼ 30:7� 106
4:3� 302¼ 23;641 ft2
¼ p� 2
12� 3780 L
L ¼ 11:95 ft
Hence, the assumed L is not correct. Try L¼ 11.0 ft.
FGA ¼ 11
15� 75 ¼ 55 ft2
G ¼ 7272 lb=ft2 h
Copyright © 2003 Marcel Dekker, Inc.
FIGURE 8.10 Crossflow correction factors (From Refs. 1 and 2).
Copyright © 2003 Marcel Dekker, Inc.

Taking ratios,
ho ¼7272
5333
� �0:6
�12:3 ¼ 14:8 Btu=ft2 h �F
1
U¼ 1� 2:0
7:2� 1:826þ 1
14:8¼ 0:152þ 0:067
¼ 0:219
U ¼ 4:56 Btu=ft2 h �F
A ¼ 30:7� 106
4:56� 302¼ 22;293 ft2; L ¼ 11:25 ft
The calculated and assumed lengths are close to each other, and the design
may be frozen. Check the metal temperature at the exit portion. Because the gas-
side resistance and air film resistances are 0.152 and 0.067, the metal temperature
at the exit of the air heater can be calculated as follows. The drop across the gas
film will be
0:152ð454� 80Þ0:152þ 0:067
¼ 260�F
Metal temperature will be 4547 260¼ 194�F.If the flue gas contains sulfur, dew point corrosion may occur at the exit.
The air-side heat transfer coefficient is high, so the drop across its film is low
compared to the gas-side film drop. If we increase the flue gas heat transfer
coefficient, the drop across its film will be low and the metal temperature will be
higher.
8.29
Q:
How is the off-design performance evaluated?
The air heater described in Q8.28 works at partial loads. Wg ¼300,000 lb=h, and flue gas enters the air heater at 620�F. Wa ¼ 250,000 lb=h,and the air temperature is 80�F. Check the exit gas temperatures of gas and air.
A:
Assume the gas leaves the air heater at 400�F. Then
Q ¼ 300;000� 0:25� ð620� 400Þ¼ 250;000� 0:24ðt � 80Þ ¼ 16:5� 106
Air temperature leaving¼ 355�F
Copyright © 2003 Marcel Dekker, Inc.

To calculate hi and ho, see Table 8.24. At an average flue gas temperature
of ð620þ 400Þ=2 ¼ 510�F; C ¼ 0:175: And at a film temperature of
½3� 510þ ð355þ 80Þ=2�=4 ¼ 437�F;F ¼ 0:104.
hi ¼ 2:44� 300;000
3825
� �0:8
� 0:175
ð1:826Þ1:8¼ 4:75 Btu=ft2 h �F
G ¼ 250;000
75¼ 3333 lb=ft2 h
ho ¼ 0:9� ð3333Þ0:620:4
� 0:104 ¼ 9:22 Btu=ft2 h �F
1
U¼ 2
1:826� 4:73þ 1
9:22¼ 0:238
U ¼ 4:22 Btu=ft2 h �F
From Fig. 8.10,
P ¼ 355� 80
620� 80¼ 0:51
R ¼ 620� 400
355� 80¼ 0:8
FT ¼ 0:9
DT ¼ 0:9� ð400� 80Þ � ð620� 355Þlnð320=265Þ ¼ 262�F
Transferred Q¼ 4.2� 262� 23,640¼ 26� 106 Btu=h, and assumed
Q¼ 16.5� 106 Btu=h. They don’t tally.
Since the air heater can transfer more energy, assume a higher air
temperature, 390�F, at the exit:
Q ¼ 250;000� 0:24ð390� 80Þ ¼ 18:6� 106
¼ 300;000� 0:25� ð620� tÞThen gas temperature leaving¼ 372�F.
Assume U remains the same at 4.2 Btu=ft2 h �F. Then
R ¼ 0:8; P ¼ 0:574; FT ¼ 0:82
DT ¼ 213�F
Transferred Q ¼ 4:2� 23;640� 213
¼ 21:1� 106 Btu=h
Copyright © 2003 Marcel Dekker, Inc.

Again, they don’t tally. Next, try Q¼ 20� 106 Btu=h.
Air temperature leaving¼ 410�FGas temperature leaving¼ 353�FFT ¼ 0.75, DT ¼ 0.75� 242¼ 182�F
Transferred Q ¼ 4:2� 23;640� 182 ¼ 18� 106 Btu=h
Again, try an exit air temperature at 400�F. Then
Q ¼ 250;000� 0:24� ð400� 80Þ¼ 19:2� 106 Btu=h
Exit gas temperature ¼ 620� 19:2� 106
300;000� 0:25
¼ 364�F
R ¼ 0:8; P ¼ 320
540¼ 0:593; FT ¼ 0:77
DT ¼ 0:77� 284� 220
lnð284=220Þ ¼ 193�F
Transferred Q ¼ 4:2� 193� 23;640 ¼ 19:16� 106 Btu=h
Q ¼ 19:2� 106 Btu=h
The gas leaves at 364�F against 454�F at full load.
Metal temperature can be computed as before. At lower loads, metal
temperature is lower, and the air heater should be given some protection. This
protection may take two forms: Bypass part of the air or use steam to heat the air
entering the heater to 100–120�F. Either of these will increase the average metal
temperature of the air heater. In the first case, the air-side heat transfer coefficient
will fall. Because U decreases, the gas temperature leaving the air heater will
increase and less Q will be transferred. Hence, metal temperature will increase. In
the second case, air temperature entering increases, so protection of the metal is
ensured. Again, the gas temperature differential at the exit will be higher, causing
a higher exit gas temperature.
Example
Solve the problem using the NTU method.
Copyright © 2003 Marcel Dekker, Inc.

Solution. Often the NTU method is convenient when trial-and-error
calculations of the type shown above are involved.
NTU ¼ UA
Cmin
¼ 4:2� 23;640
250;000� 0:24¼ 1:65
Cmixed
Cunmixed
¼ 250;000� 0:24
300;000� 0:25¼ 0:80
e ¼ effectiveness
¼ 1� expf�Cmax
Cmin
½1� expð�NTU� CÞ�g
¼ 1� expf�1:25½1� expð�1:65� 0:8Þ�g¼ 0:59
ð72Þ
Effectiveness ¼ 0:59 ¼ air temperature rise
620� 80
Air temperature rise¼ 319�FAir temperature leaving¼ 319 þ 80¼ 399�FThis compares well with the answer of 400�F. When U does not change
much, this method is very handy.
8.30
Q:
Predict the exit gas and water temperatures and the energy transferred in an
economizer under the following conditions:
tg1 ¼ gas temperature in¼ 1000�Ftw1 ¼water temperature in¼ 250�FA¼ surface area¼ 6000 ft2
Wg ¼ gas flow¼ 75,000 lb=hWw ¼water flow¼ 67,000 lb=hU ¼ overall heat transfer coefficient¼ 8Btu=ft2 h �F
Cpg ¼ gas specific heat¼ 0.265Btu=lb �FCpw ¼water specific heat¼ 1Btu=lb �F
A:
Figure 8.11 shows the arrangement of an economizer. A trial-and-error method is
usually adopted to solve for the duty of any heat transfer equipment if the surface
area is known. This procedure is detailed in Q8.29. Alternatively, the number of
transfer units (NTU) method predicts the exit temperatures and duty. For more on
Copyright © 2003 Marcel Dekker, Inc.

this theory, the reader is referred to any textbook on heat transfer [2]. Basically,
the duty Q is given by
Q ¼ eCminðtg1 � tw1Þ ð73Þwhere e depends on the type of flow, whether counterflow, parallel flow, or
crossflow. In economizers, usually a counterflow arrangement is adopted. e for
this is given by
e ¼ 1� exp ½�NTU� ð1� CÞ�1� C exp½�NTU� ð1� CÞ� ð74Þ
where
NTU ¼ UA
Cmin
and C ¼ ðWCpÞmin
ðWCpÞmax
ðWCpÞmin ¼ 75;000� 0:265 ¼ 19;875
ðWCpÞmax ¼ 67;000� 1 ¼ 67;000
C ¼ 19;875
67;000¼ 0:3
NTU ¼ 8� 6000
19;875¼ 2:42
Substituting into Eq. (74) yields
e ¼ 1� expð�2:42� 0:7Þ1� 0:3� expð�2:42� 0:7Þ ¼ 0:86
FIGURE 8.11 Economizer.
Copyright © 2003 Marcel Dekker, Inc.

From Eq. (73),
Q ¼ 0:86� 19;875� ð1000� 250Þ¼ 12:8� 106 Btu=h
Let us calculate the exit water and gas temperatures.
Q ¼ WwCpwðtw2 � tw1Þ ¼ WgCpgðtg1 � tg2ÞHence,
tw2 ¼ 250þ 12:8� 106
67;000� 1¼ 441�F
tg2 ¼ 1000� 12:8� 106
75;000� 0:265¼ 355�F
The NTU method can be used to evaluate the performance of other types of
heat transfer equipment, Table 8.25 gives the effectiveness factor e.
TABLE 8.25 Effectiveness Factors
Exchanger type Effectiveness
Parallel flow, single-pass e ¼ 1� exp½�NTU� ð1þ CÞ�1þ C
Counterflow, single-pass e ¼ 1� exp½�NTU� ð1� CÞ�1� C exp½�NTU� ð1� CÞ�
Shell-and-tube (one shell pass;
2, 4, 6, etc., tube passes)
e1 ¼ 2 1þ C þ 1þ exp½�NTU� ð1þ C2Þ1=2�1� exp½�NTU� ð1þ C2Þ1=2�
"
� ð1þ C2Þ1=2#�1
Shell-and-tube (n shell passes;2n, 4n, 6n, etc., tube passes)
en ¼ 1� e1C1� e1
� �n
�1
� �1� e1C1� e1
� �n
�C
� ��1
Crossflow, both streamsunmixed
e 1� expfC � NTU0:22½expð�C
� NTU0:78Þ � 1�g
Crossflow, both streams mixed e ¼ NTUNTU
1� expð�NTUÞ�
þ NTU� C
1� expð�NTU� CÞ � 1
��1
Crossflow, stream Cmin unmixed e ¼ Cf1� exp½�C½1� expð�NTUÞ��gCrossflow, stream Cmax unmixed e ¼ 1� expf�C½1� expð�NTU� CÞ�g
Copyright © 2003 Marcel Dekker, Inc.
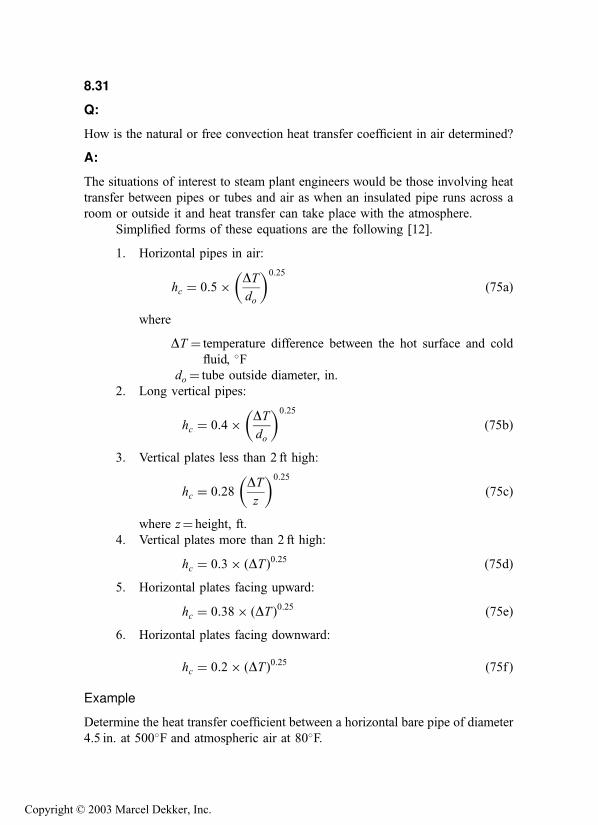
8.31
Q:
How is the natural or free convection heat transfer coefficient in air determined?
A:
The situations of interest to steam plant engineers would be those involving heat
transfer between pipes or tubes and air as when an insulated pipe runs across a
room or outside it and heat transfer can take place with the atmosphere.
Simplified forms of these equations are the following [12].
1. Horizontal pipes in air:
hc ¼ 0:5� DTdo
� �0:25
ð75aÞ
where
DT ¼ temperature difference between the hot surface and cold
fluid, �Fdo ¼ tube outside diameter, in.
2. Long vertical pipes:
hc ¼ 0:4� DTdo
� �0:25
ð75bÞ
3. Vertical plates less than 2 ft high:
hc ¼ 0:28DTz
� �0:25
ð75cÞ
where z¼ height, ft.
4. Vertical plates more than 2 ft high:
hc ¼ 0:3� ðDT Þ0:25 ð75dÞ5. Horizontal plates facing upward:
hc ¼ 0:38� ðDT Þ0:25 ð75eÞ6. Horizontal plates facing downward:
hc ¼ 0:2� ðDT Þ0:25 ð75f Þ
Example
Determine the heat transfer coefficient between a horizontal bare pipe of diameter
4.5 in. at 500�F and atmospheric air at 80�F.
Copyright © 2003 Marcel Dekker, Inc.

Solution.
hc ¼ 0:5� 500� 80
4:5
� �0:25
¼ 1:55 Btu=ft2 h �F
Note that the above equations have been modified to include the effect of wind
velocity in the insulation calculations; see Q8.51.
8.32
Q:
How is the natural or free convection heat transfer coefficient between tube
bundles and liquids determined?
A:
One has to determine the free convection heat transfer coefficient when tube
bundles such as desuperheater coils or drum preheat coils are immersed in boiler
water in order to arrive at the overall heat transfer coefficient and then the surface
area. Drum coil desuperheaters are used instead of spray desuperheaters when
solids are not permitted to be injected into steam. The heat exchanger is used to
cool superheated steam (Fig. 8.12), which flows inside the tubes while the cooler
water is outside the tubes in the drum. Drum heating coils are used to keep boiler
water hot for quick restart or to prevent freezing.
In this heat exchanger, steam condenses inside tubes while the cooler water
is outside the tubes. The natural convection coefficient between the coil and drum
water has to be determined to arrive at the overall heat transfer coefficient and
then the size or surface area.
The equation that relates hc with other parameters is [2]
Nu ¼ 0:54d3r2gb DT
m2� mCp
k
� �0:25
ð76Þ
FIGURE 8.12 Exchanger inside boiler drum.
Copyright © 2003 Marcel Dekker, Inc.
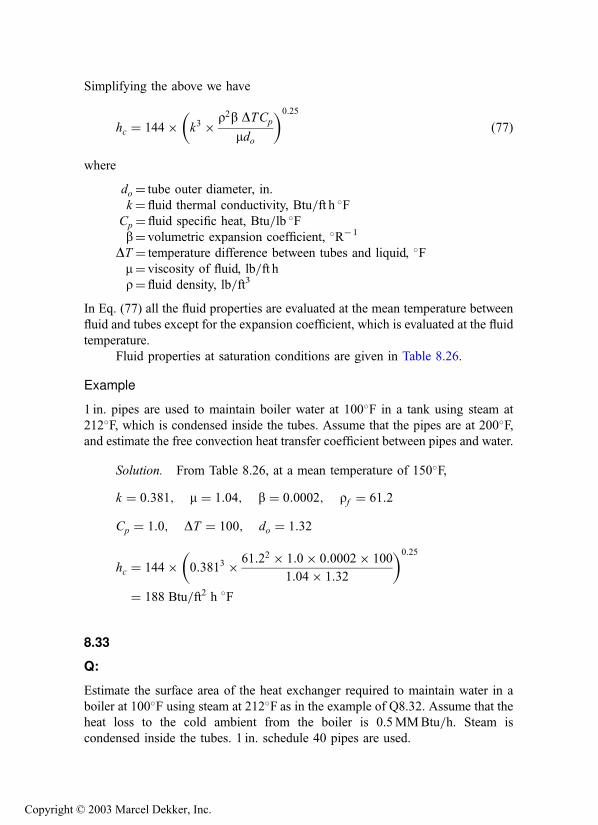
Simplifying the above we have
hc ¼ 144� k3 � r2b DTCp
mdo
� �0:25
ð77Þ
where
do ¼ tube outer diameter, in.
k¼ fluid thermal conductivity, Btu=ft h �FCp ¼ fluid specific heat, Btu=lb �Fb¼ volumetric expansion coefficient, �R�1
DT ¼ temperature difference between tubes and liquid, �Fm¼ viscosity of fluid, lb=ft hr¼ fluid density, lb=ft3
In Eq. (77) all the fluid properties are evaluated at the mean temperature between
fluid and tubes except for the expansion coefficient, which is evaluated at the fluid
temperature.
Fluid properties at saturation conditions are given in Table 8.26.
Example
1 in. pipes are used to maintain boiler water at 100�F in a tank using steam at
212�F, which is condensed inside the tubes. Assume that the pipes are at 200�F,and estimate the free convection heat transfer coefficient between pipes and water.
Solution. From Table 8.26, at a mean temperature of 150�F,
k ¼ 0:381; m ¼ 1:04; b ¼ 0:0002; rf ¼ 61:2
Cp ¼ 1:0; DT ¼ 100; do ¼ 1:32
hc ¼ 144� 0:3813 � 61:22 � 1:0� 0:0002� 100
1:04� 1:32
� �0:25
¼ 188 Btu=ft2 h �F
8.33
Q:
Estimate the surface area of the heat exchanger required to maintain water in a
boiler at 100�F using steam at 212�F as in the example of Q8.32. Assume that the
heat loss to the cold ambient from the boiler is 0.5MMBtu=h. Steam is
condensed inside the tubes. 1 in. schedule 40 pipes are used.
Copyright © 2003 Marcel Dekker, Inc.

A:
The overall heat transfer coefficient can be estimated from
1
Uo
¼ 1
hoþ 1
hiþ Rm þ ff i þ ff o
TABLE 8.26 Properties of Saturated Water
t Cp r m v k a bð�FÞ (Btu=lb �F) (lb=ft3) (lb=ft h) (ft2=h) (Btu=h ft �F) (ft2=h) ð�R�1Þ N
32 1.009 62.42 4.33 0.0694 0.327 0.0052 0.03�10�3 13.3740 1.005 62.42 3.75 0.0601 0.332 0.0053 0.045 11.3650 1.002 62.38 3.17 0.0508 0.338 0.0054 0.070 9.41
60 1.000 62.34 2.71 0.0435 0.344 0.0055 0.10 7.8870 0.998 62.27 2.37 0.0381 0.349 0.0056 0.13 6.7880 0.998 62.17 2.08 0.0334 0.355 0.0057 0.15 5.85
90 0.997 62.11 1.85 0.0298 0.360 0.0058 0.18 5.13100 0.997 61.99 1.65 0.0266 0.364 0.0059 0.20 4.52110 0.997 61.84 1.49 0.0241 0.368 0.0060 0.22 4.04
120 0.997 61.73 1.36 0.0220 0.372 0.0060 0.24 3.65130 0.998 61.54 1.24 0.0202 0.375 0.0061 0.27 3.30140 0.998 61.39 1.14 0.0186 0.378 0.0062 0.29 3.01150 0.999 61.20 1.04 0.0170 0.381 0.0063 0.31 2.72
160 1.000 61.01 0.97 0.0159 0.384 0.0063 0.33 2.53170 1.001 60.79 0.90 0.0148 0.386 0.0064 0.35 2.33180 1.002 60.57 0.84 0.0139 0.389 0.0064 0.37 2.16
190 1.003 60.35 0.79 0.0131 0.390 0.0065 0.39 2.03200 1.004 60.13 0.74 0.0123 0.392 0.0065 0.41 1.90210 1.005 59.88 0.69 0.0115 0.393 0.0065 0.43 1.76
220 1.007 59.63 0.65 0.0109 0.395 0.0066 0.45 1.66230 1.009 59.38 0.62 0.0104 0.395 0.0066 0.47 1.58240 1.011 59.10 0.59 0.0100 0.396 0.0066 0.48 1.51250 1.013 58.82 0.56 0.0095 0.396 0.0066 0.50 1.43
260 1.015 58.51 0.53 0.0091 0.396 0.0067 0.51 1.36270 1.017 58.24 0.50 0.0086 0.396 0.0067 0.53 1.28280 1.020 57.94 0.48 0.0083 0.396 0.0067 0.55 1.24
290 1.023 57.64 0.46 0.0080 0.396 0.0067 0.56 1.19300 1.026 57.31 0.45 0.0079 0.395 0.0067 0.58 1.17350 1.044 55.59 0.38 0.0068 0.391 0.0067 0.62 1.01
400 1.067 53.65 0.33 0.0062 0.384 0.0068 0.72 0.91450 1.095 51.55 0.29 0.0056 0.373 0.0066 0.93 0.85500 1.130 49.02 0.26 0.0053 0.356 0.0064 1.18 0.83
550 1.200 45.92 0.23 0.0050 0.330 0.0060 1.63 0.84600 1.362 42.37 0.21 0.0050 0.298 0.0052 — 0.96
Copyright © 2003 Marcel Dekker, Inc.

where Rm ¼metal resistance, and ff i and ff o are inside and outside fouling
factors; see Eq. (3).
ho, the free convection heat transfer coefficient between the tubes and boiler
water, obtained from Q8.32,¼ 188Btu=ft2 h �F. Assume hi ¼ 1500, ff i ¼ ff o ¼0.001, and
Metal resistance Rm ¼ do
24Kln
do
di¼ 0:0005
Then
1
Uo
¼ 1
188þ 1
1500þ 0:0025 ¼ 0:00849
or
Uo ¼ 177 Btu=ft2 h �F
DT ¼ log-mean temperature difference ¼ 212� 100 ¼ 112�F
Then,
Surface area A ¼ Q
Uo DT¼ 500;000
117� 112¼ 38 ft2
8.34
Q:
Can we determine gas or steam temperature profiles in a heat recovery steam
generator (HRSG) without actually designing it?
A:
Yes. One can simulate the design as well as the off-design performance of an
HRSG without designing it in terms of tube size, surface area, etc. The
methodology has several applications. Consultants and plant engineers can
determine for a given set of gas inlet conditions for an HRSG how much
steam can be generated and what the gas=steam temperature profile will look like,
and hence write better specifications for the HRSG or select auxiliaries based on
this simulation without going to a boiler firm for this information. Thus several
options can be ruled out or ruled in depending on the HRSG performance. The
methodology has applications in complex, multipressure cogeneration or
combined cycle plant evaluation with gas turbines. More information on
HRSG simulation can be found in Chapters 1 and 3 and Refs. 11, 12.
Copyright © 2003 Marcel Dekker, Inc.

Example
140,000 lb=h of turbine exhaust gases at 980�F enter an HRSG generating
saturated steam at 200 psig. Determine the steam generation and temperature
profiles if feedwater temperature is 230�F and blowdown¼ 5%. Assume that
average gas specific heat is 0.27 at the evaporator and 0.253 at the economizer.
Two important terms that determine the design should be defined here (see
Fig. 8.13). Pinch point is the difference between the gas temperature leaving the
evaporator and saturation temperature. Approach point is the difference between
the saturation temperature and the water temperature entering the evaporator.
More information on how to select these important values and how they are
influenced by gas inlet conditions is discussed in examples below.
For unfired gas turbine HRSGs, pinch and approach points lie in the range
of 15–30�F. The higher these values, the smaller will be the boiler size and cost,
and vice versa.
Let us choose a pinch point of 20�F and an approach point of 15�F.Saturation temperature¼ 388�F. Figure 8.14 shows the temperature profile. The
gas temperature leaving the evaporator¼ 388 þ 20¼ 408�F, and water tempera-
ture entering it¼ 3887 15¼ 373�F.
Evaporator duty ¼ 140;000� 0:99� 0:27� ð980� 408Þ¼ 21:4 MMBtu=h
(0.99 is the heat loss factor with a 1% loss.)
Enthalpy absorbed by steam in evaporator
¼ ð1199:3� 345Þ þ 0:05� ð362:2� 345Þ¼ 855:2 Btu=lb
(1199.3, 345, and 362.2 are the enthalpies of saturated steam, water entering the
evaporator, and saturated water, respectively. 0.05 is the blowdown factor for 5%
blowdown.)
FIGURE 8.13 Pinch and approach points.
Copyright © 2003 Marcel Dekker, Inc.

Hence
Steam generated ¼ 21:4� 106
855:2¼ 25;000 lb=h
Economizer duty ¼ 25;000� 1:05� ð345� 198:5Þ¼ 3:84 MM Btu=h
Gas temperature drop ¼ 3;840;000
140;000� 0:253� 0:99
¼ 109�F
Hence gas temperature leaving economizer¼ 4087 109¼ 299�F. Thus the
thermal design of the HRSG is simulated.
8.35a
Q:
Simulate the performance of the HRSG designed in Q8.34 when a gas flow of
165,000 lb=h enters the HRSG at 880�F. The HRSG will operate at 150 psig.
Feedwater temperature remains at 230�F.
A:
Gas turbine exhaust flow and temperature change with ambient conditions and
load. As a result the HRSG has to operate at different gas parameters, and hence
simulation is necessary to determine how the HRSG behaves under different gas
and steam parameters.
FIGURE 8.14 Temperature profile in an HRSG.
Copyright © 2003 Marcel Dekker, Inc.
The evaporator performance can be determined by using Eq. (37). Based on
design conditions, compute K.
ln980� 388
408� 388
� �¼ K � ð140;000Þ�0:4 ¼ 3:388
K ¼ 387:6
Under the new conditions,
ln880� 366
tg2 � 366
" #¼ 387:6� ð165;000Þ�0:4 ¼ 3:1724
Hence tg2 ¼ 388�F.
Evaporator duty ¼ 165;000� 0:99� 0:27� ð880� 388Þ¼ 21:70 MMBtu=h
In order to estimate the steam flow, the feedwater temperature leaving the
economizer must be known. This is arrived at through a series of iterations.
Try tw2 ¼ 360�F. Then
Steam flow ¼ 21:70� 106
ð1195:7� 332Þ þ 0:05� ð338:5� 332Þ¼ 25;110 lb=h
Economizer assumed duty Qa ¼ 25;110� 1:05
� ð332� 198:5Þ¼ 3:52 MMBtu=h
Compute the term ðUSÞdesign ¼ Q=DT for the economizer based on design
conditions.
Q ¼ 3:84� 106
DT ¼ ð299� 230Þ � ð408� 373Þlnð69=35Þ ¼ 50�F
Hence ðUSÞdesign ¼ 3;840;000=50 ¼ 76;800. Correct this for off-design condi-
tions.
ðUSÞperf ¼ ðUSÞdesign �gas flow, perf
gas flow, design
� �0:65
¼ 76;800� 165;000
140;000
� �¼ 85;200
Copyright © 2003 Marcel Dekker, Inc.

The economizer transferred duty is then ðUSÞperf � DT . Based on 360�F water
leaving the economizer, Qa ¼ 3.52MBtu=h and the exit gas temperature is
tg2 ¼3;520;000
165;000� 0:99� 0:253¼ 85�F
Hence tg2 ¼ 3887 85¼ 303�F, and
DT ¼ ð303� 230Þ � ð388� 360Þlnð73=28Þ ¼ 47�F
Transferred duty Qt ¼ 85;200� 47 ¼ 4:00 MM Btu=h
Because the assumed and transferred duty do not match, another iteration is
required. We can show that at duty of 3.55MMBtu=h the, assumed and
transferred duty match. Water temperature leaving the economizer¼ 366�F(saturation); exit gas temperature¼ 301�F. Steam generation¼ 25,310 lb=h.
Because the calculations are quite involved, I have developed a software
program called HRSGS that can simulate the design and off-design performance
of complex, multipressure fired and unfired HRSGs. More information can be
had by writing to V. Ganapathy, P.O. Box 673, Abilene, TX 79604.
8.35b
Q:
In the above case, how much fuel is required and at what firing temperature if
35,000 lb=h steam at 200 psig is to be generated? Gas flow is 140,000 lb=h at
980�F as in Q8.35a.
A:
A simple solution is given here, though the HRSG simulation would provide
more accurate evaluation and temperature profiles. We make use of the concept
that the fuel efficiency is 100% and all of that goes to generating the additional
steam as discussed earlier.
Energy absorbed by steam ¼ 35;000� ð1199:3� 198:5Þ¼ 35:1 MM Btu=h
Additional energy to be provided by the burner¼ 35.17 25.24¼ 9.86MM
Btu=h (the HRSG absorbs 25.24 as shown in Q8.34).
The oxygen consumed in the process of combustion (see Q6.27) is
9:86� 106=ð140;000� 58:4Þ ¼ 1:2%
Copyright © 2003 Marcel Dekker, Inc.

The firing temperature T is obtained as follows:
9:86� 106 ¼ 140;000� 0:3� ðT � 980Þor
T ¼ 1215�F
Thus, by using a few simple concepts, preliminary information about the HRSG
may be obtained. However, a complete temperature profile analysis requires a
computer program such as the HRSG simulation software.
8.36
Q:
Can we assume that a particular exit gas temperature can be obtained in gas
turbine HRSGs without doing a temperature profile analysis?
A:
No. It is not good practice to assume the HRSG exit gas temperature and compute
the duty or steam generation as some consultants and engineers do. The problem
is that, depending on the steam pressure and temperature, the exit gas temperature
will vary significantly. Often, consultants and plant engineers assume that any
stack gas temperature can be achieved. For example, I have seen catalogs
published by reputable gas turbine firms suggesting that 300�F stack gas
temperature can be obtained irrespective of the steam pressure or parameters.
Now this may be possible at low pressures but not at all steam conditions. In
order to arrive at the correct temperature profile, several heat balance calculations
have to be performed, as explained below.
It will be shown that one cannot arbitrarily fix the stack gas temperature or
the pinch point.
Looking at the superheater and evaporator of Fig. 8.13,
Wg � Cpg � ðTg1 � Tg3Þ ¼ Ws � ðhso � hw2Þ ð78ÞLooking at the entire HRSG,
Wg � Cpg � ðTg1 � Tg4Þ ¼ Ws � ðhs0 � hw1Þ ð79ÞBlowdown was neglected in the above equations for simplicity. Dividing Eq. (78)
by Eq. (79) and neglecting variations in Cpg, we have
Tg1 � Tg3
Tg1 � Tg4¼ hs0 � hw2
hs0 � hw1¼ X ð80Þ
Copyright © 2003 Marcel Dekker, Inc.
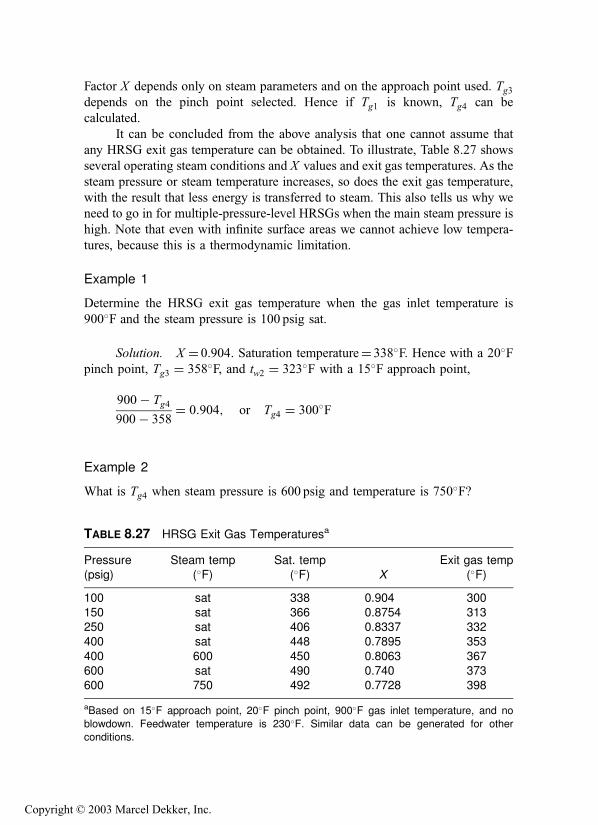
Factor X depends only on steam parameters and on the approach point used. Tg3depends on the pinch point selected. Hence if Tg1 is known, Tg4 can be
calculated.
It can be concluded from the above analysis that one cannot assume that
any HRSG exit gas temperature can be obtained. To illustrate, Table 8.27 shows
several operating steam conditions and X values and exit gas temperatures. As the
steam pressure or steam temperature increases, so does the exit gas temperature,
with the result that less energy is transferred to steam. This also tells us why we
need to go in for multiple-pressure-level HRSGs when the main steam pressure is
high. Note that even with infinite surface areas we cannot achieve low tempera-
tures, because this is a thermodynamic limitation.
Example 1
Determine the HRSG exit gas temperature when the gas inlet temperature is
900�F and the steam pressure is 100 psig sat.
Solution. X ¼ 0.904. Saturation temperature¼ 338�F. Hence with a 20�Fpinch point, Tg3 ¼ 358�F, and tw2 ¼ 323�F with a 15�F approach point,
900� Tg4
900� 358¼ 0:904; or Tg4 ¼ 300�F
Example 2
What is Tg4 when steam pressure is 600 psig and temperature is 750�F?
TABLE 8.27 HRSG Exit Gas Temperaturesa
Pressure Steam temp Sat. temp Exit gas temp(psig) (�F) (�F) X (�F)
100 sat 338 0.904 300150 sat 366 0.8754 313250 sat 406 0.8337 332400 sat 448 0.7895 353
400 600 450 0.8063 367600 sat 490 0.740 373600 750 492 0.7728 398
aBased on 15�F approach point, 20�F pinch point, 900�F gas inlet temperature, and no
blowdown. Feedwater temperature is 230�F. Similar data can be generated for other
conditions.
Copyright © 2003 Marcel Dekker, Inc.
Solution. X ¼ 0.7728. Saturation temperature¼ 492�F; tw2 ¼ 477�F;Tg3 ¼ 512�F.
900� 512
900� Tg4¼ 0:7728; or Tg4 ¼ 398�F
So a 300�F stack temperature is not thermodynamically feasible. Let us see what
happens if we try to achieve that.
Example 3
Can you obtain a 300�F stack gas temperature with 900�F inlet gas temperature
and at 600 psig, 750�F, and 15�F approach temperature?
Solution. X ¼ 0.7728. Let us see, using Eq. (80), what Tg3 results in a Tg4of 300�F, because that is the only unknown.
ð900� Tg3Þ=ð900� 300Þ ¼ 0:7728; or Tg3 ¼ 436�F
which is not thermodynamically feasible because the saturation temperature at
615 psig is 492�F! This is the reason one has to be careful in specifying HRSG
exit gas temperatures or computing steam generation based on a particular exit
gas temperature.
Example 4
What should be done to obtain a stack gas temperature of 300�F in the situation
described in Example 3?
Solution. One of the options is to increase the gas inlet temperature to the
HRSG by supplementary firing. If Tg1 is increased, then it is possible to get a
lower Tg4. Say Tg1 ¼ 1600�F. Then
1600� Tg3
1600� 300¼ 0:7728; or Tg3 ¼ 595�F
This is a feasible temperature because the pinch point is now (5957 492)¼103�F. This brings us to another important rule: Pinch point and exit gas
temperature cannot be arbitrarily selected in the fired mode. It is preferable to
analyze the temperature profiles in the unfired mode and evaluate the off-design
performance using available simulation methods discussed earlier.
Example 5
If gas inlet temperature in Example 1 is 800�F instead of 900�F, what happens tothe exit gas temperature at 100 psig sat?
Copyright © 2003 Marcel Dekker, Inc.

Solution.
800� 358
800� Tg4¼ 0:904
or Tg4 ¼ 312�F versus the 300�F when the inlet gas temperature was 900�F. We
note that the exit gas temperature increases when the gas inlet temperature
decreases, and vice versa. This is another important basic fact.
Once the exit gas temperature is arrived at, one can use Eq. (79) to
determine how much steam can be generated.
8.37
Q:
How can HRSG simulation be used to optimize gas and steam temperature
profiles?
A:
HRSG simulation is a method of arriving at the design or off-design performance
of HRSGs without physically designing them as shown in Q8.34. By using
different pinch and approach points and different configurations, particularly in
multipressure HRSGs, one can maximize heat recovery. We will illustrate this
with an example [12].
Example
A gas turbine exhausts 300,000 lb=h of gas at 900�F. It is desired to generate
about 20,500 lb=h of superheated steam at 600 psig and 650�F and as much as
200 psig saturated steam using feedwater at 230�F. Using the method discussed in
Q8.34, we can arrive at the gas=steam temperature profiles and steam flows.
Figure 8.15 shows results obtained with HRSGS software. In option 1, we have
the high pressure (HP) section consisting of the superheater, evaporator, and
economizer followed by the low pressure (LP) section consisting of the LP
evaporator and economizer. By using a pinch point of 190�F and approach point
of 15�F, we generate 20,438 lb=h of high pressure steam at 650�F. Then, using a
pinch point of 20�F and approach point of 12�F, we make 18,670 lb=h low
pressure steam. The stack gas temperature is 370�F. In option 2, we have the HP
section consisting of the superheater and evaporator and the LP section consisting
of only the evaporator. A common economizer feeds both the HP and LP sections
with feedwater at 375�F. Because of the larger heat sink available beyond the LP
evaporator, the stack gas temperature decreases to 321�F. The HP steam
generation is adjusted using the pinch point to make 20,488 lb=h while the LP
steam is allowed to float. With a pinch point of 20�F, we see that we can make
Copyright © 2003 Marcel Dekker, Inc.

22,400 lb=h in comparison with the 18,673 lb=h earlier. The ASME system
efficiency is much higher now. Thus by manipulating the HRSG configuration,
one can maximize the heat recovery.
8.38
Q:
How is the HRSG efficiency determined according to ASME Power Test Code
4.4?
A:
The efficiency E is given by
E ¼ energy given to steam=water=fluids
gas flow� inlet enthalpyþ fuel input on LHV basis
Figure 8.15 Optimizing temperature profiles.
Copyright © 2003 Marcel Dekker, Inc.

To evaluate the efficiency, the enthalpy of the turbine exhaust gas should be
known. The Appendix gives the enthalpy based on a particular gas analysis. Fuel
input on LHV basis should also be known if auxiliary firing is used.
In Q8.37 the efficiency in the design case is
E ¼ ð21:4þ 3:84Þ � 106
140;000� 242¼ 0:715; or 71:5%
If steam or water injection is resorted to, then the gas analysis will change, and
the enthalpy has to be computed based on the actual analysis.
The HRSG system efficiency in gas turbine plants will improve with the
addition of auxiliary fuel, which increases the gas temperature to the HRSG and
hence increases its steam generation. There are two reasons for this.
1. Addition of auxiliary fuel reduces the effective excess air in the exhaust
gases, because no air is added, only fuel. Hence the exhaust gas loss in
relation to steam production is reduced.
2. With increased steam generation, usually the HRSG exhaust gas
temperature decreases. This is due to the increased flow of water in
the economizer, which offers a larger heat sink, which in turn pulls
down the gas temperature further. In gas turbine units, the gas flow
does not vary much with steam output as in conventional steam
generators, which accounts for the larger temperature drop.
More information on HRSG temperature profiles can be found in Chapters
1 and 2.
Table 8.28 shows the performance of an HRSG under various operating
conditions. Case 1 is the unfired case; cases 2 and 3 have different firing
conditions. It can be seen that the system efficiency is higher when more fuel
is fired, for reasons explained above.
TABLE 8.28 Data for Supplementary-Fired HRSG
Case 1 Case 2 Case 3
Gas flow, lb=h 250,000 250,000 250,000
Inlet gas temperature, �F 1000 1000 1000Firing temperature, �F 1000 1257 1642Burner duty, MM Btu=h 0 19.3 49.8Steam flow, lb=h 45,700 65,000 95,000
Steam pressure, psig 300 300 300Feedwater temperature, �F 230 230 230Exit gas temperature, �F 298 278 265
Boiler duty, MM Btu=h 46.3 66.1 96.7ASME efficiency, % 74.91 80.95 85.65
Copyright © 2003 Marcel Dekker, Inc.
8.39a
Q:
In some cogeneration plants with gas turbines, a forced draft fan is used to send
atmospheric air to the HRSG into which fuel is fired to generate steam when the
gas turbine is not in operation. What should the criteria be for the fan size?
A:
The air flow should be large enough to have turbulent flow regimes in the HRSG
and at the same time be small enough to minimize the loss due to exiting gases. If
the air flow is high, the firing temperature will be low, but the system efficiency
will be lower and the fuel input will be higher. This is illustrated for a simple case
of two fans generating 250,000 and 210,000 lb=h of air flow in the HRSG. The
HRSGS program was used in the simulation. See Table 8.29.
It can be seen that though the firing temperature is higher with the smaller
fan, the efficiency is higher due to the lower exit gas losses considering the lower
mass flow and exit gas temperature. It should be noted that as the firing
temperature increases, the exit gas temperature will decrease when an economizer
is used. Also, with the smaller fan the initial and operating costs are lower. One
should ensure that the firing temperature does not increase to the point of
changing the basic design concept of the HRSG. For example, an insulated
casing design is used up to 1700�F firing temperature, beyond which a water-
cooled membrane wall design is required. See Chapter 1.
8.39b
Q:
How is the performance of an HRSG determined in fresh air fired mode?
A:
In this example, a multiple pressure HRSG with a common economizer is
simulated in the design unfired mode and we are predicting its performance in
the fired mode with fresh air firing using the HRSGS program.
TABLE 8.29 Fresh Air Firing Performance
Air flow, lb=h 250,000 210,000Inlet temperature, �F 80 80Firing temperature, �F 1258 1417
Exit gas temp, �F 278 267Steam flow, lb=h 65,000 65,000Burner duty, MM Btu=h 79.7 76.88ASME efficiency, % 81.66 84.82
Copyright © 2003 Marcel Dekker, Inc.

This is a three pressure level HRSG with HP steam at 600 psig, IP steam at
200 psig, and LP steam at 10 psig. (HP¼ high pressure, IP¼ intermediate
pressure, LP¼ low pressure.) A common economizer feeds the HP and IP
steam. Once the pinch points for the HP, IP, and LP evaporators are suggested,
the program arrives at the steam flows and temperature profiles as shown in Figs.
8.16a and 8.16b. The flow through the common economizer is arrived at after a
FIGURE 8.16a Unfired multipressure HRSG temperature profile.
Copyright © 2003 Marcel Dekker, Inc.

FIGURE 8.16b Fresh air fired temperature profile.
Copyright © 2003 Marcel Dekker, Inc.

few complex iterations. Figure 8.16a shows the design mode results from the
HRSGS program.
In the off-design or fired mode, fresh air is used instead of turbine exhaust.
The air flow used is close to the design exhaust gas flow. We input the ambient air
flow and the desired HP steam flow, and the program asks for fuel analysis and
automatically arrives at the firing temperature. The off-design performance is
shown in Fig. 8.16b.
The efficiency according to ASME Power Test Code 4.4, US values of each
surface in both the design and off-design modes may also be seen, as well as the
exhaust gas analysis after combustion.
This is yet another example of how simulation may be used to perform
various studies without a physical design of an HRSG. Consultants and planners
of cogeneration or combined cycle projects should find this a valuable tool.
8.40
Q:
How do we evaluate alternative HRSG designs if the operating costs are different?
A:
Let us consider the design of two HRSGs, one with low pinch and approach
points (and hence more surface area and gas pressure drop), called design A, and
another with higher pinch and approach points, called design B, which costs less.
These HRSGs operate in both unfired and fired modes for 50% of the time. In the
fired mode, both HRSGs generate 70,000 lb=h of steam; in the unfired mode,
design A naturally generates more steam. Table 8.30 shows the performance of
the HRSGs in unfired and fired modes.
Let fuel cost $3=MMBtu (LHV). Cost of steam¼ $3.5=1000 lb and
electricity¼ 6 cents=kWh. Assume that an additional 4 in.WC of gas pressure
drop is equivalent to a 1% decrease in gas turbine power output, which is a
nominal 8000 kW. The HRSG operates in unfired and fired modes for 4000 h=yeach.
Design A has the following edge over design B in operating costs.
Due to higher steam generation in unfired mode:
ð50;000� 47;230Þ � 3� 4000
1000¼ $33;240
Due to lower fuel consumption:
ð22:55� 19:23Þ � 3:5� 4000 ¼ $46;480
Copyright © 2003 Marcel Dekker, Inc.

Due to higher gas pressure drop of 1.3 in.WC:
1:3� 8000� 0:07� 8000
100� 4¼ $14;560
Thus the net benefit of using design A over B is $(33,240 þ 46,480714,560)¼ $65,160 per year.
If the additional cost of design A over B due to its size is, say, $50,000, the
payback of using design A is less than 1 year. However, if the HRSG operates for
less than, say, 3000 h=year, the payback will be longer and has to be reviewed.
8.41
Q:
What is steaming, and why is it likely in gas turbine HRSGs and not in
conventional fossil fuel fired boilers?
A:
When the economizer in a boiler or HRSG starts generating steam, particularly
with downward flow of water, problems can arise in the form of water hammer,
vibration, etc. With upward water flow design, a certain amount of steaming, 3–
5%, can be tolerated because the bubbles have a natural tendency to go upward
along with the water. However, steaming should generally be avoided.
TABLE 8.30 Performance of Alternative HRSG Designs
Design A Design B
Unfired Fired Unfired Fired
Gas temp to HRSG 980 1208 980 1248Gas temp to economizer, �F 437 441 466 483
Exit gas temperature, �F 314 298 353 343Gas pressure drop, in. WC 4.0 4.3 2.75 3.0Steam flow, lb=h 50,000 70,000 47,230 70,000
Water temp to economizer, �F 398 373 396 370Burner duty, Mm Btu=h 0 19.23 0 22.55Evaporator surface area ft2 39,809 27,866
Economizer surface area, ft2 24,383 13,933Pinch point, �F 16 20 45 62Approach point, �F 23 48 25 51
Gas flow¼287,000 lb=h; Gas analysis (vol%) CO2 ¼3, H2O¼7, N2 ¼75, O2 ¼ 15. Steam
pressure¼ 300psig sat; gas turbine power¼8000 kW.
Copyright © 2003 Marcel Dekker, Inc.

To understand why the economizer is likely to steam, we should first look at
the characteristics of a gas turbine as a function of ambient temperature and load
(see Tables 8.31 and 1.4).
In single-shaft machines, which are widely used, as the ambient tempera-
ture or load decreases, the exhaust gas temperature decreases. The variation in
mass flow is marginal compared to fossil fuel fired boilers, while the steam or
water flow drops off significantly. (The effect of mass flow increase in most cases
does not offset the effect of lower exhaust gas temperature.) The energy-
transferring ability of the economizer, which is governed by the gas-side heat
transfer coefficient, does not change much with gas turbine load or ambient
temperature; hence nearly the same duty is transferred with a smaller water flow
through the economizer, which results in a water exit temperature approaching
saturation temperature as seen in Q8.35. Hence we should design the economizer
such that it does not steam in the lowest unfired ambient case, which will ensure
that steaming does not occur at other ambient conditions. A few other steps may
also be taken, such as designing the economizer [8] with a horizontal gas flow
with horizontal tubes (Fig. 8.17). This ensures that the last few rows of the
economizer, which are likely to steam, have a vertical flow of steam–water
mixture.
In conventional fossil fuel fired boilers the gas flow decreases in proportion
to the water flow, and the energy-transferring ability of the economizer is also
lower at lower loads. Therefore steaming is not a concern in these boilers; usually
the approach point increases at lower loads in fired boilers, whereas it is a concern
in HRSGs.
The other measures that may be considered to minimize steaming in an
economizer are
TABLE 8.31 Typical Exhaust Gas Flow, Temperature Characteristics of a Gas
Turbine
Ambient temp, �F 20.0 40.0 59.0 80.0 100.0 120.0
Power output, kW 38,150 38,600 35,020 30,820 27,360 24,040Heat rate, Btu=kWh 9384 9442 9649 9960 10,257 10,598Water flow rate lb=h 16,520 17,230 15,590 13,240 10,540 6990Turbine inlet temp, �F 1304 1363 1363 1363 1363 1363
Exhaust temp, �F 734 780 797 820 843 870Exhaust flow, lb=s 312 304 286 264 244 225
Fuel: natural gas; elevation: sea level; relative humidity 60%; inlet loss 4 in.H2O; exhaust loss
15 in.H2O; speed: 3600 rpm; output terminal: generator.
Copyright © 2003 Marcel Dekker, Inc.

Increase the water flow through the economizer during these conditions by
increasing the blowdown flow. This solution works only if small amounts
of steam are formed and the period of operation in this mode is small.
Blowdown results in a waste of energy.
Increasing the inlet gas temperature either by supplementary firing or by
increasing the turbine load helps to generate more steam and thus more
water flow through the economizer, which will prevent steaming. As we
saw in Chapter 1, the economizer steams at low loads of the turbine.
Exhaust gases can be bypassed around the HRSG during such steaming
conditions. This minimizes the amount of energy transferred at the
economizer as well as the evaporator. Gas can also be bypassed around
the economizer, mitigating the steaming concerns.
Water can also be bypassed around the economizer during steaming conditions,
but this is not a good solution. When the gas turbine load picks up, it will be
difficult to put the water back into the economizer while the tubes are hot. The
cold water inside hot tubes can flash and cause vibration and thermal stresses and
can even damage the economizer tub.
FIGURE 8.17 Horizontal gas flow economizer.
Copyright © 2003 Marcel Dekker, Inc.

8.42
Q:
Why are water tube boilers generally preferred to fire tube boilers for gas turbine
exhaust applications?
A:
Fire tube boilers require a lot of surface area to reduce the temperature of gas
leaving the evaporator to within 15–25�F of saturation temperature (pinch point).
They have lower heat transfer coefficients than those of bare tube water tube
boilers (see Q8.10), which do not compare well with finned tube boilers. Water
tube boilers can use extended surfaces to reduce the pinch point to 15–25�F in the
unfired mode and hence be compact. The tubes will be very long if fire tube
boilers are used; hence the gas pressure drop will be higher. (A fire tube boiler
can be made into a two-pass boiler to reduce the length; however, this will
increase the shell diameter and the labor cost, because twice the number of tubes
will have to be welded to the tube sheets.) The fire tube boiler will have to be even
larger if the same gas pressure drop is to be maintained. Table 8.32 compares the
performance of water tube and fire tube boilers for the same duty and pressure
drop.
It can be seen from the table footnotes that the water tube boiler is very
compact. If the gas flow is very small, say less than 50,000 lb=h, then a fire tube
boiler may be considered.
TABLE 8.32 Water Tube vs. Fire Tube Boiler for Gas TurbineExhaust
Water tubea Fire tubeb
Gas flow, lb=h 100,000 100,000Inlet temp, �F 900 900Exit temp, �F 373 373Duty, MM Btu=h 13.72 13.72
Gas pressure drop, in. WC 2.75 2.75Feedwater temp, �F 220 220Steam pressure, psig 125 125
Steam flow, lb=h 13,500 13,500Surface area, ft2 12,315 9798
aWater tube boiler: 2�0.105 in. tubes, 20 wide, 18 deep, 6 ft long, with
5 serrated fins=in., 0.75 in. high, 0.05 in. thick.bFire tube boiler: 1400 1.5�0.105 in. tubes, 21 ft long.
Copyright © 2003 Marcel Dekker, Inc.

8.43
Q:
Does the addition of 10% surface area to a boiler increase its duty by 10%?
A:
No. The additional surface area increases the duty only slightly. The increased
temperature drop across the boiler and the temperature rise of water or steam (if
single-phase) due to the higher duty results in a lower log-mean temperature
difference. This results in lower transferred duty, even assuming that the overall
heat transfer coefficient U remains unchanged. If the larger surface area results in
lower gas velocities, the increase in duty will be marginal as U is further reduced.
As an example, consider the performance of a fire tube boiler with 10% and
20% increase in surface area as shown in Table 8.33. As can be seen, a 10%
increase in surface area increases the duty by only 3%, and a 20% increase in
surface area increases the duty by only 6%. Similar trends may be shown for
water tube boilers, superheaters, economizers, etc.
8.44a
Q:
How do we estimate the time required to heat a boiler?
A:
A boiler can take a long time to heat up, depending on the initial temperature of
the system, mass of steel, and amount of water stored. The following procedure
gives a quick estimate of the time required to warm up a boiler. The methodology
is applicable to either fire tube or water tube boilers.
TABLE 8.33 Boiler Performance with Increased Surface Areaa
CaseNo. oftubes
Length(ft)
Surface(ft2)
Duty(MM Btu=h)
Exit gastemp (�F)
1 390 16 2839 20.53 5672 390 17.6 3123 21.16 5333 390 19.2 3407 21.68 505
aGas flow¼ 70,000 lb=h; inlet gas temperature¼1600�F. Gas analysis (vol%): CO2 ¼7,
H2O¼12, N2 ¼ 75, O2 ¼6; steam pressure¼ 125psig saturated. Tubes: 2�0.120 carbon
steel.
Copyright © 2003 Marcel Dekker, Inc.

Gas at a temperature of Tg1 enters the unit, which is initially at a
temperature of t1 (both the water and the boiler tubes). The following energy
balance equation can then be written neglecting heat losses:
Mc
dt
dz¼ WgCpg � ðTg1 � Tg2Þ ¼ UADT ð81Þ
where
Mc ¼water equivalent of the boiler
¼mass of steel� specific heat of steel þ mass of water� specific
heat of water (Weight of the boiler tubes, drum, casing, etc., is
included in the steel weight.)
dt=dz¼ rate of change of temperature, �F=hWg ¼ gas flow, lb=hCpg ¼ gas specific heat, Btu=lb �F
Tg1; Tg2 ¼ entering and exit boiler gas temperature, �FU ¼ overall heat transfer coefficient, Btu=ft2 h �FA¼ surface area, ft2
DT ¼ log-mean temperature difference, �F
¼ ðTg1 � tÞ � ðTg2 � tÞln½ðTg1 � tÞ=ðTg2 � tÞ�
t¼ temperature of the water=steam in boiler, �F
From Eq. (81) we have
lnTg1 � t
Tg2 � t
" #¼ UA
WgCpg
ð82Þ
or
Tg2 ¼ t þ Tg1 � t
eUA=WgCpg¼ t þ Tg1 � t
Kð83Þ
Substituting Eq. (83) into Eq. (81), we get
Mc
dt
dz¼ WgCpgðTg1 � tÞ K � 1
K
or
dt
Tg1 � t¼ WgCpg
Mc
� K � 1
Kdz ð84Þ
Copyright © 2003 Marcel Dekker, Inc.

To estimate the time to heat up the boiler from an initial temperature t1 to t2, we
have to integrate dt between the limits t1 and t2.
lnTg1 � t1
Tg1 � t2¼ WgCpg
Mc
� ðK � 1ÞzK
ð85Þ
The above equation can be used to estimate the time required to heat the boiler
from a temperature of t1 to t2, using flue gases entering at Tg1. However, in order
to generate steam, we must first bring the boiler to the boiling point at
atmospheric pressure and slowly raise the steam pressure through manipulation
of vent valves, drains, etc; the first term of Eq. (81) would involve the term for
steam generation and flow in addition to metal heating.
Example
A water tube waste heat boiler of weight 50,000 lb and containing 30,000 lb of
water is initially at a temperature of 100�F. 130,000 lb of flue gases at 1400�Fenter the unit. Assume the following:
Gas specific heat¼ 0.3 Btu=lb �FSteel specific heat¼ 0.12Btu=lb �FSurface area of boiler¼ 21,000 ft2
Overall heat transfer coefficient¼ 8Btu=ft2 h �F
Estimate the time required to bring the boiler to 212�F.
Solution.
U
WgCpg
¼ 8� 21;000
130;000� 0:3¼ 4:3
K ¼ e4:3 ¼ 74
Mc ¼ 50;000� 0:12þ 30;000� 1 ¼ 36;000
ln1400� 100
1400� 212¼ 0:09 ¼ 130;000� 0:3
36;000� 73
74z
or z¼ 0.084 h¼ 5.1min.
One could develop a computer program to solve Eq. (81) to include steam
generation and pressure-raising terms. In real-life boiler operation, the procedure
is corrected by factors based on operating data of similar units.
It can also be noted that, in general, fire tube boilers with the same capacity
as water tube boilers would have a larger water equivalent and hence the start-up
time for fire tube boilers would be longer.
Copyright © 2003 Marcel Dekker, Inc.
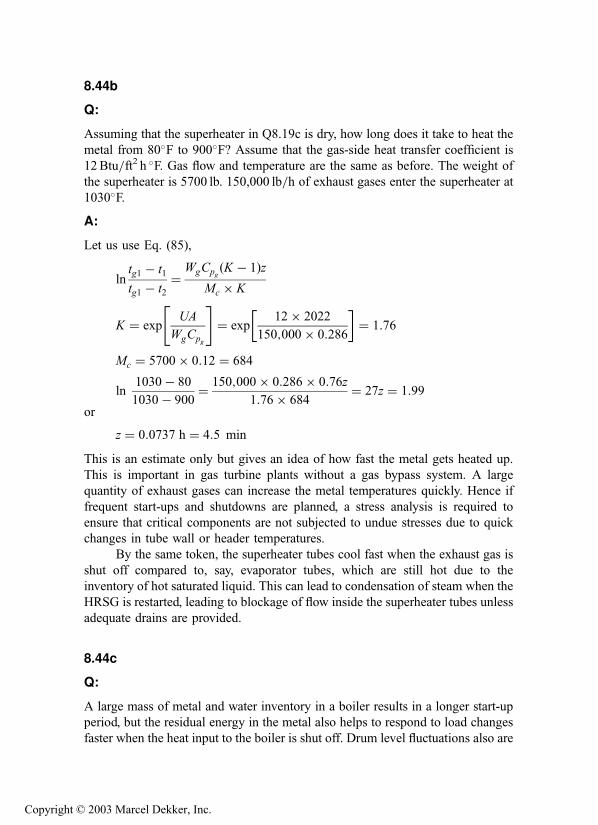
8.44b
Q:
Assuming that the superheater in Q8.19c is dry, how long does it take to heat the
metal from 80�F to 900�F? Assume that the gas-side heat transfer coefficient is
12Btu=ft2 h �F. Gas flow and temperature are the same as before. The weight of
the superheater is 5700 lb. 150,000 lb=h of exhaust gases enter the superheater at
1030�F.
A:
Let us use Eq. (85),
lntg1 � t1
tg1 � t2¼
WgCpgðK � 1Þz
Mc � K
K ¼ expUA
WgCpg
" #¼ exp
12� 2022
150;000� 0:286
� �¼ 1:76
Mc ¼ 5700� 0:12 ¼ 684
ln1030� 80
1030� 900¼ 150;000� 0:286� 0:76z
1:76� 684¼ 27z ¼ 1:99
or
z ¼ 0:0737 h ¼ 4:5 min
This is an estimate only but gives an idea of how fast the metal gets heated up.
This is important in gas turbine plants without a gas bypass system. A large
quantity of exhaust gases can increase the metal temperatures quickly. Hence if
frequent start-ups and shutdowns are planned, a stress analysis is required to
ensure that critical components are not subjected to undue stresses due to quick
changes in tube wall or header temperatures.
By the same token, the superheater tubes cool fast when the exhaust gas is
shut off compared to, say, evaporator tubes, which are still hot due to the
inventory of hot saturated liquid. This can lead to condensation of steam when the
HRSG is restarted, leading to blockage of flow inside the superheater tubes unless
adequate drains are provided.
8.44c
Q:
A large mass of metal and water inventory in a boiler results in a longer start-up
period, but the residual energy in the metal also helps to respond to load changes
faster when the heat input to the boiler is shut off. Drum level fluctuations also are
Copyright © 2003 Marcel Dekker, Inc.

smoothed out by a large water inventory. In order to understand the dynamics, let
us look at an evaporator in a waste heat boiler with the following data:
Gas flow¼ 350,000 lb=hGas inlet temp¼ 1000�FGas exit temp¼ 510�FSteam pressure¼ 600 psig sat
Feedwater temp¼ 222�FTubes: 2� 0.105, 30 tubes=row, 20 deep, 12 ft long with 4.5� 0.75�0.05 in. serrated fins
Steam drum¼ 54 in., mud drum¼ 36 in; both are 13 ft long. Boiler gener-
ates 45,000 lb=h of steam.
Weight of steel including drums¼ 75,000 lb
Weight of water in evaporator¼ 18,000 lb
Volume of steam space¼ 115 ft3
Feedwater temperature¼ 220�FEnergy transferred by gas to evaporator¼ 45.9MMBtu=h
What happens to the steam pressure and steam generation when the heat input
and the feedwater supply are turned off?
A:
The basic equation for energy transfer to an evaporator is
Q ¼ Wshfg þ ðhl � hf ÞWf þ WmCp
dT
dpþWw
dh
dp
� �dp
dzð86aÞ
where
Wm ¼mass of metal, lb
Ws ¼ steam generated, lb=hWf ¼ feedwater flow, lb=hWw ¼ amount of water inventory in boiler system including drums,
tubes, pipes, lb
dh=dp¼ change of enthalpy to change in pressure, Btu=lb psi
dT=dp¼ change of saturation temperature to change in pressure, �F=psiQ¼ energy transferred to evaporator, Btu=h
dp=dz¼ rate of pressure change, psi=h
Now assuming that the volume of space between the drum level and the
valve¼V ft3, we can write the following expression for change in pressure
using the perfect gas law:
pV ¼ C ¼ pV=m
Copyright © 2003 Marcel Dekker, Inc.

where
C¼ a constant
m¼mass of steam, lb, in volume V
or
pV
m¼ C or p ¼ Cm
Vdp
dz¼ pV
VðWs �WlÞ ð86bÞ
where
p¼ pressure, psia
Ws;Wl ¼ steam generated and steam withdrawn, lb=h
For steam at 600–630 psia, we have from the steam tables that the saturation
temperature¼ 486�F and 492�F, respectively.
Enthalpy of water¼ 471.6 and 477.9 Btu=lbAverage latent heat hfg ¼ 730Btu=lbSpecific volume¼ 0.75 ft3=lb
Hence
dh
dp¼ 477:9� 471:6
30¼ 0:21 Btu=lb psi
dT
dp¼ 492� 486
30¼ 0:2�F=psi
When Q¼ 0 and Wf ¼ 0, we have from Eq. (86) that
Ws � 730þ ð75;000� 0:12� 0:2þ 18;000� 0:21Þ dpdz
¼ 0
dp
dz¼ 615� 0:75
115ðWs �WlÞ ¼ 4� ðWs �WlÞ
or, combining this with the previous equation,
Ws � 730þ ð5580Þ � 4� Ws �Wl
� ¼ 0 or Ws ¼ 43;570 lb=h
Using Eq. (87),
dp
dz¼ 4� ð43;570� 45;000Þ ¼ �5720 psi=h or � 1:59 psi=s
The pressure decay will be about 1.59 psi=s if this situation continues without
correcting feedback such as matching heat input and feedwater flow.
These calculations, though simplistic, give an idea of what happens when,
for example, the turbine exhaust gas is switched off. In fresh air fired HRSGs,
there is a small time delay, on the order of a minute, before the fresh air fired
Copyright © 2003 Marcel Dekker, Inc.

burner can come on and fire to full capacity. The steam pressure decay during this
period can be evaluated by this procedure.
8.44d
Q:
Let us assume that the boiler is operating at 45,000 lb=h and suddenly the demand
goes to 50,000 lb=h.
Case 1: What happens to the steam pressure if we maintain the same heat
input to the evaporator and the feedwater supply?
Case 2: What happens if the feedwater is cut off but heat input remains
the same?
A:
Case 1: Q ¼ 45:0� 106 Btu=h; Wf ¼ 45;000 lb=h;Wl ¼ 50;000 lb=h: First
let us com-pute the steam generation. Using Eq. (86a),
h1 ¼ 471:6 Btu=lb and hf ¼ 189:5 Btu=lb
From Eq. (86a),
45;000� ð471:6� 189:6Þ þWs � 730þ 5580dp
dz¼ Q
also, dp=dz ¼ 4ðWs � 50;000Þ,Simplifying,
12:69� 106 þWs � 730þ 5580� 4ðWs � 50;000Þ ¼ 45:9� 106
Ws ¼ 49;857 lb=h
Thus,
dp
dz¼ 4� ð49;857� 50;000Þ ¼ �572 psi=h ¼ �0:159 psi=s
Case 2: Wf ¼ 0 and Q ¼ 45:9 MM Btu=h: Using the above equations,
Ws � 730þ 5580� 4ðWs � 50;000Þ ¼ 45:9� 106; or Ws ¼ 50;405 lb=h
dp
dz¼ 1620 psi=h ¼ 0:45 psi=s
The pressure actually increases, because the cooling effect of the feedwater is not
sensed.
In practice, controls respond fast and restore the balance among heat input,
feedwater flow, and steam generation to match the demand. If we cannot adjust
the heat input, as in unfired waste heat boilers, the pressure will slide as shown if
we withdraw more steam than can be supplied by the boiler.
Copyright © 2003 Marcel Dekker, Inc.

8.45a
Q:
Discuss the parameters influencing the test results of an HRSG during perfor-
mance testing.
A:
The main variables affecting the performance of an HRSG are the gas flow, inlet
gas temperature, gas analysis, and steam parameters. Assuming that an HRSG has
been designed for a given set of gas conditions, in reality several of the
parameters could be different at the time of testing. In the case of a gas turbine
HRSG in particular, ambient temperature also influences the exhaust gas condi-
tions. The HRSG could, as a result, be receiving a different gas flow at a different
temperature, in which case the steam production would be different from that
predicted.
Even if the ambient temperature and the gas turbine load were to remain the
same, it is difficult to ensure that the HRSG would receive the design gas flow at
the design temperature. This is due to instrument errors. Typically, in large ducts,
the gas measurement could be off by 3–5% and the gas temperatures could differ
by 10–20�F according to ASME Power Test Code 4.4. As a result it is possible
that the HRSG would receive 5% less flow at 10�F lower gas temperature than
design conditions, even though the instruments recorded design conditions. As a
result, the HRSG steam generation and steam temperature would be less than
predicted through no fault of the HRSG design. Figure 8.18 shows the per-
formance of an HRSG designed for 500,000 lb=h gas flow at 900�F; steam
generation is 57,000 lb=h at 650 psig and 750�F. The graph shows how the same
HRSG behaves when the mass flow changes from 485,000 to 515,000 lb=h while
the exhaust temperature varies from 880�F to 902�F. The steam temperature falls
to 741�F with 880�F gas temperature, whereas it is 758�F at 920�F. The steam
flow increases from 52,900 to 60,900 lb=h as the gas mass flow increases. Thus
the figure shows the map of performance of the HRSG for possible instrumental
error variations only. Hence HRSG designers and plant users should mutually
agree upon possible variations in gas parameters and their influence on HRSG
performance before conducting such tests.
8.45b
Q:
Based on operating data, can we determine whether an HRSG is operating
well?
Copyright © 2003 Marcel Dekker, Inc.

A:
It is possible to evaluate the operating data for possible deviations from predicted
or guaranteed data as shown below. An HRSG supplier has guaranteed certain
data for his HRSG in his proposal, which are shown alongside the measured data
in Table 8.34. How are these data to be reconciled?
Note that the actual gas flow is difficult to measure and is not shown.
However, using an energy balance, one can obtain the gas flow based on energy
FIGURE 8.18 HRSG performance as a function of gas flow and temperature.
TABLE 8.34 Proposed and Actual HRSG Performance
Data Proposal guarantee Actual data
Gas flow, lb=h 550,000 ?
Exhaust gas temp, �F 1000 970Exit gas temp, �F 372 380Steam pressure, psig 600 500Steam temp, �F 700 690
Feedwater temp, �F 230 230Blowdown, % 2 0Steam flow, lb=h 79,400 68,700
Copyright © 2003 Marcel Dekker, Inc.

absorbed by steam and the difference between gas temperatures at the inlet and
exit. Note that the operating steam pressure is lower than that called for in the
design.
From the energy balance, we have
Wg � ðhi � hoÞ � 0:99 ¼ Ws Dh
where hi; ho refer to the enthalpy of gas at the inlet and exit of the HRSG
corresponding to the gas temperatures measured. The steam flow, Ws, and the
enthalpy absorbed by steam, Dh, are known from steam tables. Hence Wg , the gas
flow, can be calculated. It can be shown to be 501,300 lb=h.Now using the HRSGS program, one can simulate the design mode using
the proposal data as shown in Fig. 8.19a. Then, using the calculated gas flow and
the inlet temperature, run the HRSGS program in the off-design mode at the
lower steam pressure. The results are shown in Fig. 8.19b. It may be seen that
69,520 lb=h of steam should have been generated at 690�F and the exit gas
temperature should be 364�F, whereas we measured only 68,700 lb=h and exit gasat 380�F. Hence more analysis is required, but there is a prima facie concern with
the HRSG performance.
8.46
Q:
Estimate the boiling heat transfer coefficient inside tubes for water and the tube
wall temperature rise for a given heat flux and steam pressure.
A:
Subcooled boiling heat transfer coefficient inside tubes for water can be estimated
by the following equations.
According to Collier [13],
DT ¼ 0:072e�P=1260 q0:5 ð87aÞAccording to Jens and Lottes [13],
DT ¼ 1:9e�P=900 q0:25 ð87bÞwhere
DT ¼ difference between saturation temperature and tube wall temperature,�F
P¼ steam pressure, psia
q¼ heat flux inside tubes, Btu=ft2 h
Copyright © 2003 Marcel Dekker, Inc.
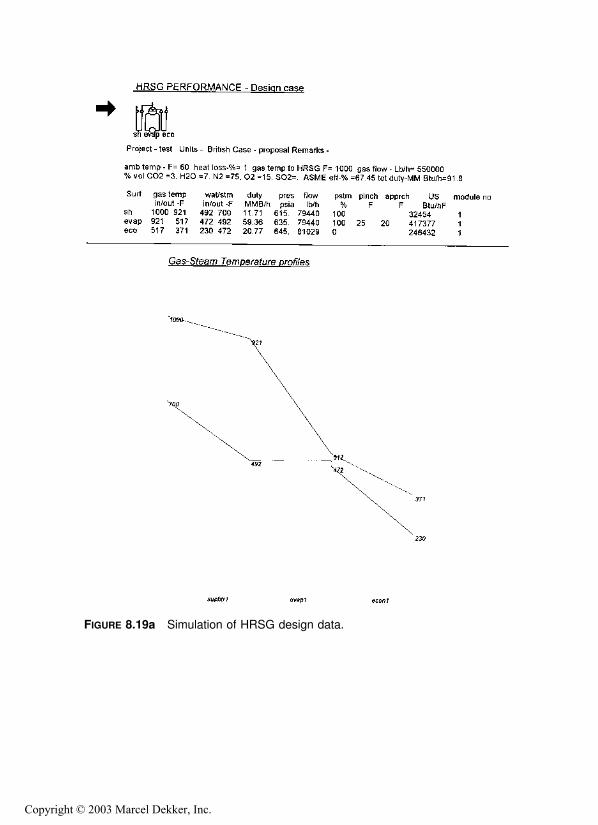
FIGURE 8.19a Simulation of HRSG design data.
Copyright © 2003 Marcel Dekker, Inc.
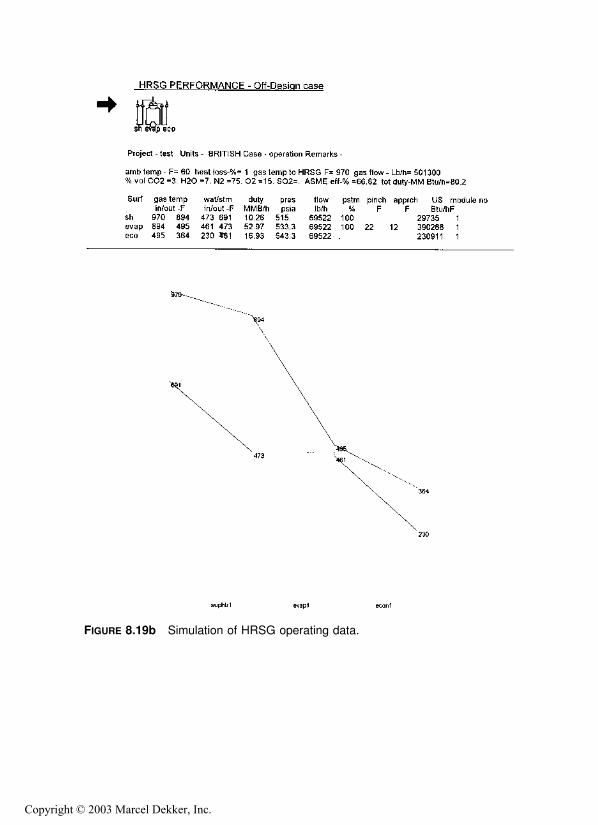
FIGURE 8.19b Simulation of HRSG operating data.
Copyright © 2003 Marcel Dekker, Inc.
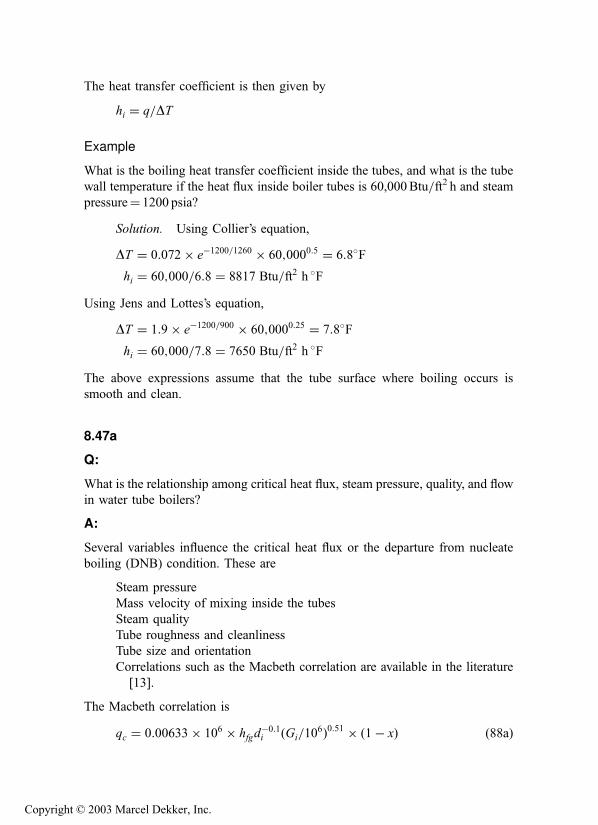
The heat transfer coefficient is then given by
hi ¼ q=DT
Example
What is the boiling heat transfer coefficient inside the tubes, and what is the tube
wall temperature if the heat flux inside boiler tubes is 60,000Btu=ft2 h and steam
pressure¼ 1200 psia?
Solution. Using Collier’s equation,
DT ¼ 0:072� e�1200=1260 � 60;0000:5 ¼ 6:8�F
hi ¼ 60;000=6:8 ¼ 8817 Btu=ft2 h �F
Using Jens and Lottes’s equation,
DT ¼ 1:9� e�1200=900 � 60;0000:25 ¼ 7:8�F
hi ¼ 60;000=7:8 ¼ 7650 Btu=ft2 h �F
The above expressions assume that the tube surface where boiling occurs is
smooth and clean.
8.47a
Q:
What is the relationship among critical heat flux, steam pressure, quality, and flow
in water tube boilers?
A:
Several variables influence the critical heat flux or the departure from nucleate
boiling (DNB) condition. These are
Steam pressure
Mass velocity of mixing inside the tubes
Steam quality
Tube roughness and cleanliness
Tube size and orientation
Correlations such as the Macbeth correlation are available in the literature
[13].
The Macbeth correlation is
qc ¼ 0:00633� 106 � hfgd�0:1i ðGi=10
6Þ0:51 � ð1� xÞ ð88aÞ
Copyright © 2003 Marcel Dekker, Inc.

where
qc ¼ critical heat flux, Btu=ft2 hhfg ¼ latent heat of steam, Btu=lbGi ¼mass velocity inside tubes, lb=ft2 hx¼ steam quality, expressed as a fraction
di ¼ tube inner diameter, in.
Example
Estimate the critical heat flux under the following conditions:
Steam pressure¼ 1000 psia
Tube inner diameter¼ 1.5 in.
Mass velocity¼ 600,000 lb=ft2 hSteam quality¼ 0.20
qc ¼ 0:00633� 106 � 650� 1:50�0:1 � 0:60:51
� ð1� 0:2Þ ¼ 2:43� 106 Btu=ft2 h
In real-life boilers, the allowable heat flux to avoid DNB is much lower, say 20–
30% lower, than the values obtained by laboratory tests under controlled
conditions due to factors such as roughness of tubes, water quality, and safety
considerations. Boiler suppliers have their own data and design boilers accord-
ingly.
8.47b
Q:
How is the critical heat flux qc determined in pool boiling situations as in fire tube
boilers?
A:
Several correlations are available in the literature, but only two will be cited.
Motsinki suggests the simple equation [13]
qc ¼ 803Pc
Ps
Pc
� �0:351� Ps
Pc
� �0:9
ð88bÞ
where Ps;Pc are the steam pressure and critical pressure, both in psia.
Copyright © 2003 Marcel Dekker, Inc.

Zuber’s correlation takes the form [13]
qc
rghfg¼ 0:13� sðrf � rgÞgg0
r2g
!0:25
� rfrg þ rf
!0:5
where
s¼ surface tension
r¼ density
hfg ¼ latent heat
g; g0 ¼ acceleration due to gravity and conversion factor g in force units
all in metric units.
Example
Determine the critical heat flux for steam at 400 psia under pool boiling
conditions.
Solution. The following data can be obtained from steam tables:
Saturation temperature at 400 psia¼ 445�FDensity of liquid¼ 51 lb=cu ft (827 kg=m3)
Density of vapor¼ 0.86 lb=cu ft (13.8 kg=m3)
Latent heat of vaporization¼ 780Btu=lb (433 kcal=kg)
From Table 8.26 at a saturation temperature of 445�F, surface tension is
0.0021 lbf=ft (0.31 kgf=m).
g ¼ 9:8� 36002 m=h2
g0 ¼ 9:8� 36002 kgm=Kgf h2
Substituting into (88b):
qc ¼ 803� 3208� 400
3208
� �0:35
� 1� 400
3208
� �0:9
¼ 1:102 MM Btu=ft2 h
Copyright © 2003 Marcel Dekker, Inc.

Using Eq. (88c),
qc ¼ 13:8� 433� 0:13� 0:0031� 813� 9:82�
� 36004
ð13:8Þ2�0:25
� 827
827þ 13:8
� �0:5
¼ 2:95� 106 kcal=m2 ¼ 1:083 MM Btu=ft2 h
Again, as before, factors such as surface roughness, water quality, scale forma-
tion, and bundle configuration play a role, and for conservative estimates, boiler
designers use a value that is 20–30% of these values.
8.47c
Q:
Estimate the critical heat flux for a tube bundle of a fire tube boiler with the
following data:
Tube OD¼ 2 in.
Number of tubes¼ 590
Length¼ 29.5 ft
Tube spacing¼ 2.75 in., triangular
Surface area¼ 9113 ft2
Tube bundle diameter¼ 78 in.
A:
The heat flux for a tube bundle is obtained by correcting the heat flux for pool
boiling obtained from Q8.47b.
First compute a factor C ¼ DbL=Awhere
Db ¼ bundle diameter, ft
L¼ length of tubes, ft
A¼ surface area of bundle, ft2
C ¼ 78� 29:5
12� 9113¼ 0:021
The correction factor F is obtained from the correlation
logF ¼ 0:8452þ 0:994 logC
For C ¼ 0:021; logF ¼ �0:8224; or F ¼ 0:15:Hence,
Corrected heat flux ¼ 1:083� 106 � 0:15 ¼ 162;500 Btu=ft2 h
Typically a value such as 70–80% of this is used for tube bundles.
Copyright © 2003 Marcel Dekker, Inc.

8.48
Q:
Discuss the simplified approach to designing fire tube boilers.
A:
Engineers often must estimate the size of heat transfer equipment such as heat
exchangers, gas coolers, boilers, and economizers for preliminary costing and to
check space requirements. With the approach presented here, one can quickly
determine one or more configurations to accomplish a certain amount of heat
transfer. One can also size equipment so as to limit the pressure drop without
performing lengthy calculations. Life-cycle costing can then be applied to select
the optimum design.
Two situations will be discussed [8].
1. The tube-side heat transfer coefficient governs the overall heat transfer.
Examples: Fire tube boilers; gas coolers; heat exchangers in which a
medium such as air or flue gas flows on the tube side and a fluid with a
high heat transfer coefficient flows on the outside. Phase changes can
also occur on the outside of the tubes.
2. The shell side governs. Examples: Water tube boilers, steam–air
exchangers, and gas–liquid heat transfer equipment. See Q8.49.
Tube-Side Transfer Governs
In a fire tube boiler, gas flows inside the tubes and a steam–water mixture flows
on the outside. The gas heat transfer coefficient is small, about 10–20Btu=ft2 h �F,compared to the outside coefficient of 2000–3000Btu=ft2 h �F. The metal resis-
tance is also small; hence the gas-side coefficient governs the overall coefficient
and the size of the equipment.
The energy transferred is given by
Q ¼ UA DT ¼ WiCp � ðT1 � T2Þ ð89ÞThe overall heat transfer coefficient is obtained from Eq. (4),
1
U¼ do
hidiþ 1
hoþ d
24Km
lndo
diþ ff i
do
diþ ff o
Because the inside coefficient governs U , we can rewrite Eq. (4) as follows
(neglecting lower order resistances, such as ho, metal resistance, and fouling
factors, which contribute to about 5% of U ):
U ¼ 0:95hidi
doð90Þ
Copyright © 2003 Marcel Dekker, Inc.

The value of the tube-side coefficient is obtained from the familiar Dittus–
Boelter equation, Eq. (8),
Nu ¼ 0:023 Re0:8 Pr0:4
where
Nu ¼ hidi
12k; Re ¼ 15:2
w
dim
The fluid transport properties are evaluated at the bulk temperature.
Substituting Eqs. (8)–(11) into Eq. (90) and simplifying, we have the
following expression [Eq. (12)]:
hi ¼ 2:44w0:8F1=d1:8i
where
F1 ¼ ðCp=mÞ0:4k0:6 ð91Þ
Combining Eqs. (89)–(91) we have, after substituting A ¼ 3:14diLN=12and for flow per tube w ¼ Wi=N ,
Q
DT F1W0:8i
¼ 0:606� LN0:2
d0:8i
ð92Þ
This simple equation relates several important variables. Given Q;DT ;Wi, and
F1, one can try combinations of L; di, and N to arrive at a suitable configuration.
Also, for given thermal data, LN0:2=d0:8i is constant in Eq. (92).
F1 is shown in Table 8.35 for flue gas and air. For other gases, F1 can be
computed from Eq. (91).
When a phase change occurs, as in a boiler, DT is written as
DT ¼ ðT1 � tsÞ � ðT2 � tsÞln½ðT1 � tsÞ � ðT2 � tsÞ�
ð93Þ
Combining Eqs. (92) and (93) and simplifying, we arrive at the expression
lnT1 � ts
T2 � ts¼ 0:606� F1
Cp
� N 0:2 � L
W 0:2i d 0:8
i
ð94Þ
Factor F1=Cp is also given in Table 8.35.
Equation (94) relates the major geometric parameters to thermal perfor-
mance. Using this method, one need not evaluate heat transfer coefficients.
Copyright © 2003 Marcel Dekker, Inc.

Gas Pressure Drop
Now consider gas pressure drop. The equation that relates the geometry to tube-
side pressure drop in in.H2O is
DPi ¼ 9:3� 10�5 f � Wi
N
� �2
ðLþ 5diÞ �nd5i
¼ 9:3� 10�5 � Wi
N
� �2
K2n
ð95Þ
where
K2 ¼ f ðLþ 5diÞ=d5i ð96ÞCombining Eqs. (94)–(96) and eliminating N ,
lnT1 � ts
T2 � ts¼ 0:24� F1
Cp
� K1
n0:1
DP0:1i
ð97Þ
where
K1 ¼ ðLþ 5diÞ0:1Lf 0:1=d1:3i ð98Þ
TABLE 8.35 Factors F1=Cp;F2=Cp;F2, and F3 for Air and
Flue Gasa
Temp (�F) F1=Cp F2 F2=Cp F3
Air100 0.6660 0.0897 0.3730 0.5920200 0.6870 0.0952 0.3945 0.6146
300 0.7068 0.1006 0.4140 0.6350400 0.7225 0.1056 0.4308 0.6528600 0.7446 0.1150 0.4591 0.6810
1000 0.7680 0.1220 0.4890 0.69301200 0.7760 0.1318 0.5030 0.7030
0.1353 0.7150
Flue gasa
200 0.6590 0.0954 0.3698 0.5851300 0.6780 0.1015 0.3890 0.6059400 0.6920 0.1071 0.4041 0.6208
600 0.7140 0.1170 0.4300 0.6457800 0.7300 0.1264 0.4498 0.6632
1000 0.7390 0.1340 0.4636 0.6735
1200 0.7480 0.1413 0.4773 0.6849
aFlue gas is assumed to have 12% water vapor by volume.
Copyright © 2003 Marcel Dekker, Inc.
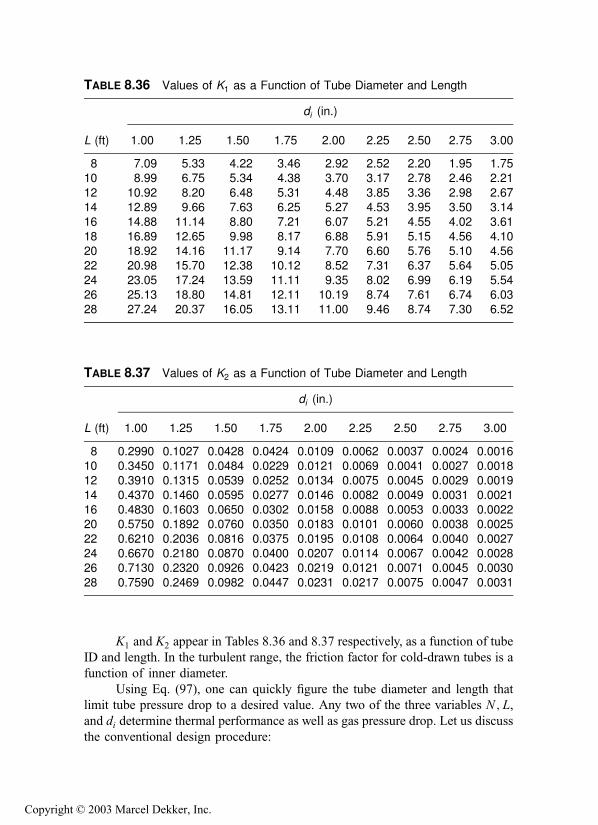
K1 and K2 appear in Tables 8.36 and 8.37 respectively, as a function of tube
ID and length. In the turbulent range, the friction factor for cold-drawn tubes is a
function of inner diameter.
Using Eq. (97), one can quickly figure the tube diameter and length that
limit tube pressure drop to a desired value. Any two of the three variables N ; L,and di determine thermal performance as well as gas pressure drop. Let us discuss
the conventional design procedure:
TABLE 8.36 Values of K1 as a Function of Tube Diameter and Length
di (in.)
L (ft) 1.00 1.25 1.50 1.75 2.00 2.25 2.50 2.75 3.00
8 7.09 5.33 4.22 3.46 2.92 2.52 2.20 1.95 1.7510 8.99 6.75 5.34 4.38 3.70 3.17 2.78 2.46 2.21
12 10.92 8.20 6.48 5.31 4.48 3.85 3.36 2.98 2.6714 12.89 9.66 7.63 6.25 5.27 4.53 3.95 3.50 3.1416 14.88 11.14 8.80 7.21 6.07 5.21 4.55 4.02 3.61
18 16.89 12.65 9.98 8.17 6.88 5.91 5.15 4.56 4.1020 18.92 14.16 11.17 9.14 7.70 6.60 5.76 5.10 4.5622 20.98 15.70 12.38 10.12 8.52 7.31 6.37 5.64 5.05
24 23.05 17.24 13.59 11.11 9.35 8.02 6.99 6.19 5.5426 25.13 18.80 14.81 12.11 10.19 8.74 7.61 6.74 6.0328 27.24 20.37 16.05 13.11 11.00 9.46 8.74 7.30 6.52
TABLE 8.37 Values of K2 as a Function of Tube Diameter and Length
di (in.)
L (ft) 1.00 1.25 1.50 1.75 2.00 2.25 2.50 2.75 3.00
8 0.2990 0.1027 0.0428 0.0424 0.0109 0.0062 0.0037 0.0024 0.001610 0.3450 0.1171 0.0484 0.0229 0.0121 0.0069 0.0041 0.0027 0.001812 0.3910 0.1315 0.0539 0.0252 0.0134 0.0075 0.0045 0.0029 0.0019
14 0.4370 0.1460 0.0595 0.0277 0.0146 0.0082 0.0049 0.0031 0.002116 0.4830 0.1603 0.0650 0.0302 0.0158 0.0088 0.0053 0.0033 0.002220 0.5750 0.1892 0.0760 0.0350 0.0183 0.0101 0.0060 0.0038 0.0025
22 0.6210 0.2036 0.0816 0.0375 0.0195 0.0108 0.0064 0.0040 0.002724 0.6670 0.2180 0.0870 0.0400 0.0207 0.0114 0.0067 0.0042 0.002826 0.7130 0.2320 0.0926 0.0423 0.0219 0.0121 0.0071 0.0045 0.0030
28 0.7590 0.2469 0.0982 0.0447 0.0231 0.0217 0.0075 0.0047 0.0031
Copyright © 2003 Marcel Dekker, Inc.

1. Assume w, calculate N .
2. Calculate U , using Eqs. (4) and (90).
3. Calculate L after obtaining A from Eq. (89).
4. Calculate DPi from Eq. (95).
If the geometry or pressure drop obtained is unsuitable, repeat steps 1–4. This
procedure is lengthy.
Some examples will illustrate the simplified approach. The preceding
equations are valid for single-pass design. However, with minor changes one
can derive the relationships for multipass units (e.g., use length¼ L=2 for two-
pass units).
Example 1
A fire tube waste heat boiler will cool 66,000 lb=h of flue gas from 1160�F to
440�F. Saturation temperature is 350�F. Molecular weight is 28.5, and gas
pressure is atmospheric. If L is to be limited to 20 ft due to layout, determine
N and DPi for two tube sizes: (1) 2� 1.77 in. (2 in. OD, 1.77 in. ID) and (2)
1.75� 1.521 in.
Solution. Use Eq. (92) to find N . Use 2 in. tubes. F1=Cp from Table 8.35
is 0.73 for flue gas at the average gas temperature of 0.5� (1160 þ 440)¼ 800�F.
ln1160� 350
440� 350
� �¼ 2:197
2:197 ¼ 0:606� 0:73� N0:2 � 20
ð66;000Þ0:2 � ð1:77Þ0:8¼ 0:6089N0:2; N ¼ 611
Compute DPi using Eq. (95). From Table 8.37, K2 is 0.035. Compute the gas
specific volume.
Density ðrÞ ¼ 28:5� 492
359� ð460þ 800Þ ¼ 0:031 lb=ft3
n ¼ 32:25 ft3=lb
Substituting into Eq. (95), we have
DPi ¼ 9:3� 10�5 � 66;000
611
� �2
� 0:035� 32:25
¼ 1:23 in:H2O
Repeat the exercise with 1.75 in. tubes; length remains at 20 ft. From Eq.
(92) we note that for the same thermal performance and gas flow, N0:2L=d0:8i ¼
Copyright © 2003 Marcel Dekker, Inc.

a constant. The above concept comes in handy when one wants to quickly figure
the effect of geometry on performance. Hence,
6110:2 � 20
ð1:77Þ0:8 ¼ N0:2 � 20
ð1:521Þ0:8N ¼ 333
With smaller tubes, one needs fewer tubes for the same duty. This is due to
a higher heat transfer coefficient; however, the gas pressure drop would be higher.
From Table 8.37, K2 ¼ 0.076 for 1.521 in. tubes. From Eq. (95),
DPi ¼ 9:3� 10�5 � 66;000
333
� �2
� 0:076� 32:25
¼ 8:95 in:H2O
Example 2
Size the heat exchanger for 2.0 in. tubes with a pressure drop of 3.0 in.H2O. For
the same thermal performance, determine the geometry.
Solution. The conventional approach would take several trials to arrive at
the right combination. However, with Eq. (97), one can determine the geometry
rather easily:
ln1160� 350
440� 350¼ 2:197 ¼ 0:24� F1
Cp
� K1n0:1
DP0:1i
From Table 8.35, F1=Cp ¼ 0.73; DPi ¼ 3, n¼ 32.25. Then
ln1160� 350
440� 350¼ 2:197 ¼ 0:24K1 � ð32:25Þ0:1
� 0:73
30:1¼ 0:222K1
K1 ¼ 9:89
From Table 8.36, we can obtain several combinations of tube diameter and
length that have the same K1 value and would yield the same thermal perfor-
mance and pressure drop. For the 1.77 in. ID tube, L is 21.75 ft. Use Eq. (92) to
calculate the number of tubes.
2:197 ¼ 0:606� 0:73� 21:75� N0:2
ð66;000Þ0:2 � ð1:77Þ0:8N ¼ 402
Thus, several alternative tube geometries can be arrived at for the same
performance, using the preceding approach. One saves a lot of time by not
calculating heat transfer coefficients and gas properties.
Copyright © 2003 Marcel Dekker, Inc.

Life-Cycle Costing
Such techniques determine the optimum design, given several alternatives. Here,
the major operating cost is from moving the gas through the system, and the
installed cost is that of the equipment and auxiliaries such as the fan. The life-
cycle cost is the sum of the capitalized cost of operation and the installed cost:
LCC ¼ Cco þ Ic
The capitalized cost of operation is
Cco ¼ CaY1� YT
1� Y
where Y ¼ ð1þ eÞ=ð1þ iÞ.The annual cost of operating the fan is estimated as
Ca ¼ 0:001� PHCe
where the fan power consumption in kW is
P ¼ 1:9� 10�6 �Wi �DPi
rZ
The above procedure is used to evaluate LCC. The alternative with the lowest
LCC is usually chosen if the geometry is acceptable. (Ce is cost of electricity.) and
H is the number of hours of operation per year.
8.49
Q:
Discuss the simplified approach to designing water tube boilers.
A:
Whenever gas flows outside a tube bundle—as in water tube boilers, economi-
zers, and heat exchangers with high heat transfer coefficients on the tube side—
the overall coefficient is governed by the gas-side resistance. Assuming that the
other resistances contribute about 5% to the total, and neglecting the effect of
nonluminous transfer coefficients, one may write the expression for U as
U ¼ 0:95ho ð99aÞ
where the outside coefficient, ho, is obtained from
Nu ¼ 0:35 Re0:6 Pr0:3 ð99bÞ
Copyright © 2003 Marcel Dekker, Inc.

where, using Eqs. (16)–(18) and (21),
Nu ¼ hodo
12k; Re ¼ Gd
12 m; Pr ¼ mCp
k
G ¼ 12Wo
NwLðST � doÞEquation (99) is valid for both in-line (square or rectangular pitch) and staggered
(triangular pitch) arrangements. For bare tubes, the difference in ho between in-
line and staggered arrangements at Reynolds numbers and pitches found in
practice is 3–5%. For finned tubes, the variation is significant.
Substituting Eqs. (17)–(21) into Eq. (99a) and (99b) and simplifying,
ho ¼ 0:945G0:6F2=d0:4o ð100Þ
U ¼ 0:9G0:6F2=d0:4o ð101Þ
where
F2 ¼ k0:7ðCp=mÞ0:3 ð102ÞF2 is given in Table 8.35. Gas transport properties are computed at the film
temperature.
A ¼ pdoNwNdL=12
Combining the above with Eq. (89) and simplifying gives
Q=DT ¼ UA ¼ p0:9G0:6F2doNwNdL=12d0:4o
¼ 0:235 F2G0:6NwNdLd
0:6o
Substituting for G from Eq. (21),
Q
DT¼ 1:036F2W
0:6o
N 0:4w L0:4Nd
ðST=do � 1Þ0:6 ð103Þ
The above equation relates thermal performance to geometry. When there is a
phase change, as in a boiler, further simplification leads to
lnT1 � ts
T2 � ts¼ 2:82
F2
Cp
� Nd
G0:4ðST=do � 1Þd0:4o
ð104Þ
If the tube diameter and pitch are known, one can estimate Nd or G for a desired
thermal performance.
Let us now account for gas pressure drop. The equation that relates the gas
pressure drop to G is Eq. (28) of Chapter 7:
DPo ¼ 9:3� 10�10 � G2fNd
r
Copyright © 2003 Marcel Dekker, Inc.

For in-line arrangements, the friction factor is obtained from Eq. (29) of Chapter
7:
f ¼ Re�0:15 X
where
X ¼ 0:044þ 0:08SL=do
ðST=do � 1Þ0:43þ1:13do=SL
Another form of Eq. (28) of Chapter 7 is
DPo ¼ 1:34� 10�7 � W 1:85o nN2:85
d m0:15X
N1:85w L1:85d0:15o ðST � doÞ1:85
ð105Þ
Substituting for f in Eq. (28) of Chapter 7 and combining with Eq. (104) we can
relate DPo to performance in a single equation:
DPo ¼ 4:78� 10�10 � G2:25 ðST � doÞ
� lnT1 � ts
T2 � ts
� �� X
d0:75o F3rð106Þ
where
F3 ¼ ðF2=CpÞm�0:15 ð107ÞF3 is given in Table 8.35. With Eq. (107), one can easily calculate the geometry
for a given tube bank so as to limit the pressure drop to a desired value. An
example will illustrate the versatility of the technique.
Example
In a water tube boiler, 66,000 lb=h of flue gas is cooled from 1160�F to 440�F.Saturation temperature is 350�F. Tube outside diameter is 2 in., and an in-line
arrangement is used with ST ¼ SL ¼ 4 in. Determine a suitable configuration to
limit the gas pressure to 3 in.H2O.
Let us use Eq. (106). Film temperature is 0.5� (800 þ 350)¼ 575�F.Interpolating from Table 8.35 at 475�F, F3 ¼ 0:643. Gas density at 800�F is
0.031 lb=ft3 from Example 1.
DPo ¼ 4:78� 10�10 � G2:25 ð4� 2Þ
� ln1160� 350
440� 350
� �
� ð0:044þ 0:08� 2Þ20:75 � 0:643� 0:031
¼ 128� 10�10 � G2:25 ¼ 3
Copyright © 2003 Marcel Dekker, Inc.

Hence, G¼ 5200 lb=ft2 h. From Eq. (21) one can choose different combinations
of Nw and L:
NwL ¼ 66;000� 12=ð2� 5200Þ ¼ 76
If Nw ¼ 8, then L¼ 9.5 ft.
Calculate Nd from Eq. (104):
ln1160� 350
440� 350
� �¼ 2:197
¼ 2:82F2
Cp
� Nd
G0:4ðSTdo � 1Þd0:4o
2:197 ¼ 2:82� 0:426Nd=ð52000:4 � 1� 20:4Þ or Nd ¼ 74
Thus, the entire geometry has been arrived at.
8.50
Q:
How is the bundle diameter of heat exchangers or fire tube boilers determined?
A:
Tubes of heat exchangers and fire tube boilers are typically arranged in square or
triangular pitch (Fig. 8.20). The ratio of tube pitch to diameter could range from
1.25 to 2 depending on the tube size and the manufacturer’s past practice.
Looking at the triangular pitch arrangement, we see that half of a tube area
is located within the triangle, whose area is given by
Area of triangle ¼ 0:5� 0:866p2 ¼ 0:433p2
If there are N tubes in the bundle, then
Total area occupied ¼ 0:866Np2
If the bundle diameter is D, then 3:14� D2=4¼ area of bundle¼ 0.866Np2, or
D ¼ 1:05pN 0:5 ð108ÞSimilarly, for the square pitch, the area occupied by one tube¼ p2. Hence bundle
area¼ 3:14� D2=4 ¼ Np2, or
D ¼ 1:128pN 0:5 ð109ÞIn practice, a small clearance is added to the above number for manufacturing
purposes.
Copyright © 2003 Marcel Dekker, Inc.

FIGURE 8.20 Square (top) and triangular (bottom) pitch for boiler=exchangertubes.
Copyright © 2003 Marcel Dekker, Inc.

Example
If 500 tubes of 2 in. diameter are located in a fire tube boiler shell at a triangular
pitch of 3 in., the bundle diameter would be
D ¼ 1:05� 3� 5000:5 ¼ 70:5 in:
If the pitch were square, the bundle diameter would be
D ¼ 1:128� 3� 5000:5 ¼ 75:7 in:
Sometimes tubes have to be located within a given sector of a circle. In such
cases, it is helpful to know the area of a sector of a circle given its height and
diameter. Table 8.38 gives the factor C, which when multiplied by D2 gives the
sector area.
Example
Find the area of a sector of height 10 in. and diameter 24 in.
Solution. For h=D ¼ 10=24 ¼ 0:4167;C from Table 8.38¼ 0.309. Hence,
Area ¼ C � D2 ¼ 0:309� 24� 24 ¼ 178 in:2
8.51
Q:
How is the thickness of insulation for a flat or curved surface determined?
Determine the thickness of insulation to limit the casing surface temperature of a
pipe operating from 800�F to 200�F, when
Ambient temperature ta ¼ 80�FThermal conductivity of insulation Km at average temperature of 500�F¼0.35Btu in.=ft2 h �F
Pipe outer diameter d¼ 12 in.
Wind velocity V ¼ 264 ft=min (3mph)
Emissivity of casing¼ 0.15 (oxidized)
Copyright © 2003 Marcel Dekker, Inc.

TABLE 8.38 C Factors for Finding Area of Sector of a Circle (Area¼CD2)
h=D C h=D C h=D C h=D C h=D C
0.050 0.01468 0.100 0.04087 0.150 0.07387 0.200 0.111820.001 0.00004 0.051 0.01512 0.101 0.04148 0.151 0.07459 0.201 0.11262
0.002 0.00012 0.052 0.01556 0.102 0.04208 0.152 0.07531 0.202 0.113430.003 0.00022 0.053 0.01601 0.103 0.04269 0.153 0.07603 0.203 0.114230.004 0.00034 0.054 0.01646 0.104 0.04330 0.154 0.07675 0.204 0.11504
0.005 0.00047 0.055 0.01691 0.105 0.04391 0.155 0.07747 0.205 0.115840.006 0.00062 0.056 0.01737 0.106 0.04452 0.156 0.07819 0.206 0.116650.007 0.00078 0.057 0.01783 0.107 0.04514 0.157 0.07892 0.207 0.11746
0.008 0.00095 0.058 0.01830 0.108 0.04578 0.158 0.07965 0.208 0.118270.009 0.00113 0.059 0.01877 0.109 0.04638 0.159 0.08038 0.209 0.119080.010 0.00133 0.060 0.01924 0.110 0.04701 0.160 0.08111 0.210 0.119900.011 0.00153 0.061 0.01972 0.111 0.04763 0.161 0.08185 0.211 0.12071
0.012 0.00175 0.062 0.02020 0.112 0.04826 0.162 0.08258 0.212 0.121530.013 0.00197 0.063 0.02068 0.113 0.04889 0.163 0.08332 0.213 0.122350.014 0.00220 0.064 0.02117 0.114 0.04953 0.164 0.08406 0.214 0.12317
0.015 0.00244 0.065 0.02166 0.115 0.05016 0.165 0.08480 0.215 0.023990.016 0.00268 0.066 0.02215 0.116 0.05080 0.166 0.08554 0.216 0.124810.017 0.00294 0.067 0.02265 0.117 0.05145 0.167 0.08629 0.217 0.12563
0.018 0.00320 0.068 0.02315 0.118 0.05209 0.168 0.08704 0.218 0.126460.019 0.00347 0.069 0.02366 0.119 0.05274 0.169 0.08779 0.219 0.127290.020 0.00375 0.070 0.02417 0.120 0.05338 0.170 0.08854 0.220 0.12811
0.021 0.00403 0.071 0.02468 0.121 0.05404 0.171 0.08929 0.221 0.128940.022 0.00432 0.072 0.02520 0.122 0.05469 0.172 0.09004 0.222 0.129770.023 0.00462 0.073 0.02571 0.123 0.05535 0.173 0.09080 0.223 0.130600.024 0.00492 0.074 0.02624 0.124 0.05600 0.174 0.09155 0.224 0.13144
(continued )
Copyright © 2003 Marcel Dekker, Inc.

TABLE 8.38 (continued )
h=D C h=D C h=D C h=D C h=D C
0.025 0.00523 0.075 0.02676 0.125 0.05666 0.175 0.09231 0.225 0.132770.026 0.00555 0.076 0.02729 0.126 0.05733 0.176 0.09307 0.226 0.13311
0.027 0.00587 0.077 0.02782 0.127 0.05799 0.177 0.09384 0.227 0.133950.028 0.00619 0.078 0.02836 0.128 0.05866 0.178 0.09460 0.228 0.134780.029 0.00653 0.079 0.02889 0.129 0.05933 0.179 0.09537 0.229 0.13562
0.030 0.00687 0.080 0.02943 0.130 0.06000 0.180 0.09613 0.230 0.136460.031 0.00721 0.081 0.02998 0.131 0.06067 0.181 0.09690 0.231 0.137310.032 0.00756 0.082 0.03053 0.132 0.06135 0.182 0.09767 0.232 0.13815
0.033 0.00791 0.083 0.03108 0.133 0.06203 0.183 0.09845 0.233 0.139000.034 0.00827 0.084 0.03163 0.134 0.06271 0.184 0.09922 0.234 0.139840.035 0.00864 0.085 0.03219 0.135 0.06339 0.185 0.10000 0.235 0.140690.036 0.00901 0.086 0.03275 0.136 0.06407 0.186 0.10077 0.236 0.14154
0.037 0.00938 0.087 0.03331 0.137 0.06476 0.187 0.10155 0.237 0.142390.038 0.00976 0.088 0.03387 0.138 0.06545 0.188 0.10233 0.238 0.143240.039 0.01015 0.089 0.03444 0.139 0.06614 0.189 0.10312 0.239 0.14409
0.040 0.01054 0.090 0.03501 0.140 0.06683 0.190 0.10390 0.240 0.144940.041 0.01093 0.091 0.03559 0.141 0.06753 0.191 0.10469 0.241 0.145800.042 0.01133 0.092 0.03616 0.142 0.06822 0.192 0.10547 0.292 0.14666
0.043 0.01173 0.093 0.03674 0.143 0.06892 0.193 0.10626 0.243 0.147510.044 0.01214 0.094 0.03732 0.144 0.06963 0.194 0.10705 0.244 0.148370.045 0.01255 0.095 0.03791 0.145 0.07033 0.195 0.10784 0.245 0.14923
0.046 0.01297 0.096 0.03850 0.146 0.07103 0.196 0.10864 0.246 0.150090.047 0.01339 0.097 0.03909 0.147 0.07174 0.197 0.10943 0.247 0.150950.048 0.01382 0.098 0.03968 0.148 0.07245 0.198 0.11023 0.248 0.151820.049 0.01425 0.099 0.04028 0.149 0.07316 0.199 0.11102 0.249 0.15268
0.250 0.15355 0.300 0.19817 0.350 0.24498 0.400 0.29337 0.450 0.34278
Copyright © 2003 Marcel Dekker, Inc.

0.251 0.15441 0.301 0.19908 0.351 0.24593 0.401 0.29435 0.451 0.343780.252 0.15528 0.302 0.20000 0.352 0.24689 0.402 0.29533 0.452 0.34477
0.253 0.15615 0.303 0.20092 0.353 0.24784 0.403 0.29631 0.453 0.345770.254 0.15702 0.304 0.20184 0.354 0.24880 0.404 0.29729 0.454 0.346760.255 0.15789 0.305 0.20276 0.355 0.24976 0.405 0.29827 0.455 0.347760.256 0.15876 0.306 0.20368 0.356 0.25071 0.406 0.29926 0.456 0.34876
0.257 0.15964 0.307 0.20460 0.357 0.25167 0.407 0.30024 0.457 0.349750.258 0.16501 0.308 0.20553 0.358 0.25263 0.408 0.30122 0.458 0.350750.259 0.16139 0.309 0.20645 0.359 0.25359 0.409 0.30220 0.459 0.35175
0.260 0.16226 0.310 0.20738 0.360 0.25455 0.410 0.30319 0.460 0.352740.261 0.16314 0.311 0.20830 0.361 0.25551 0.411 0.30417 0.461 0.353740.262 0.16402 0.312 0.20923 0.362 0.25647 0.412 0.30516 0.462 0.35474
0.263 0.16490 0.313 0.21015 0.363 0.25743 0.413 0.30614 0.463 0.355730.264 0.16578 0.314 0.21108 0.364 0.25839 0.414 0.30712 0.464 0.356730.265 0.16666 0.315 0.21201 0.365 0.25936 0.415 0.30811 0.465 0.357730.266 0.16755 0.316 0.21294 0.366 0.26032 0.416 0.30910 0.466 0.35873
0.267 0.16843 0.317 0.21387 0.367 0.26128 0.417 0.31008 0.467 0.359720.268 0.16932 0.318 0.21480 0.368 0.26225 0.418 0.31107 0.468 0.360720.269 0.17020 0.319 0.21573 0.369 0.26321 0.419 0.31205 0.469 0.36172
0.270 0.17109 0.320 0.21667 0.370 0.26418 0.420 0.31304 0.470 0.362720.271 0.17198 0.321 0.21760 0.371 0.26514 0.421 0.31403 0.471 0.363720.272 0.17287 0.322 0.21853 0.372 0.26611 0.422 0.31502 0.472 0.36471
0.273 0.17376 0.323 0.21947 0.373 0.26708 0.423 0.31600 0.473 0.365710.274 0.17465 0.324 0.22040 0.374 0.26805 0.424 0.31699 0.474 0.366710.275 0.17554 0.325 0.22134 0.375 0.26901 0.425 0.31798 0.475 0.36771
0.276 0.17644 0.326 0.22228 0.376 0.26998 0.426 0.31897 0.476 0.368710.277 0.17733 0.327 0.22322 0.377 0.27095 0.427 0.31996 0.477 0.369710.278 0.17823 0.328 0.22415 0.378 0.27192 0.428 0.32095 0.478 0.37071
(continued )
Copyright © 2003 Marcel Dekker, Inc.
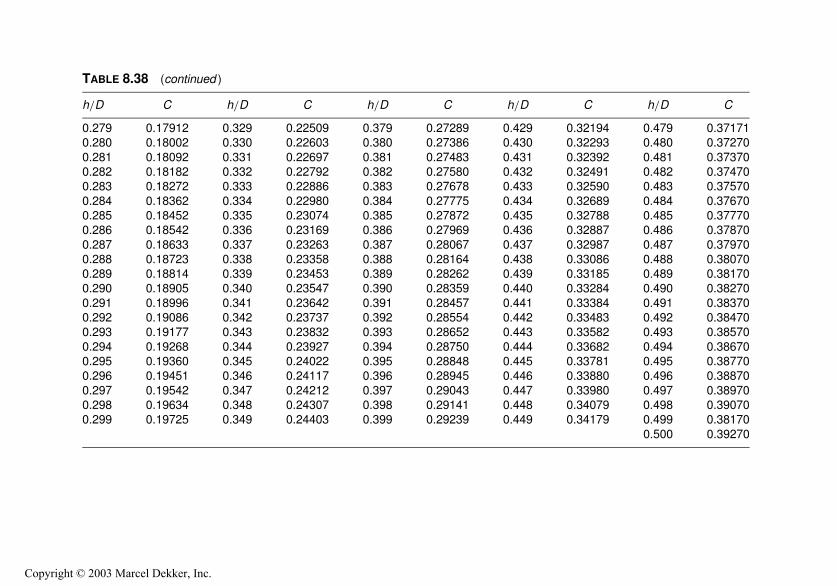
TABLE 8.38 (continued )
h=D C h=D C h=D C h=D C h=D C
0.279 0.17912 0.329 0.22509 0.379 0.27289 0.429 0.32194 0.479 0.371710.280 0.18002 0.330 0.22603 0.380 0.27386 0.430 0.32293 0.480 0.37270
0.281 0.18092 0.331 0.22697 0.381 0.27483 0.431 0.32392 0.481 0.373700.282 0.18182 0.332 0.22792 0.382 0.27580 0.432 0.32491 0.482 0.374700.283 0.18272 0.333 0.22886 0.383 0.27678 0.433 0.32590 0.483 0.37570
0.284 0.18362 0.334 0.22980 0.384 0.27775 0.434 0.32689 0.484 0.376700.285 0.18452 0.335 0.23074 0.385 0.27872 0.435 0.32788 0.485 0.377700.286 0.18542 0.336 0.23169 0.386 0.27969 0.436 0.32887 0.486 0.37870
0.287 0.18633 0.337 0.23263 0.387 0.28067 0.437 0.32987 0.487 0.379700.288 0.18723 0.338 0.23358 0.388 0.28164 0.438 0.33086 0.488 0.380700.289 0.18814 0.339 0.23453 0.389 0.28262 0.439 0.33185 0.489 0.381700.290 0.18905 0.340 0.23547 0.390 0.28359 0.440 0.33284 0.490 0.38270
0.291 0.18996 0.341 0.23642 0.391 0.28457 0.441 0.33384 0.491 0.383700.292 0.19086 0.342 0.23737 0.392 0.28554 0.442 0.33483 0.492 0.384700.293 0.19177 0.343 0.23832 0.393 0.28652 0.443 0.33582 0.493 0.38570
0.294 0.19268 0.344 0.23927 0.394 0.28750 0.444 0.33682 0.494 0.386700.295 0.19360 0.345 0.24022 0.395 0.28848 0.445 0.33781 0.495 0.387700.296 0.19451 0.346 0.24117 0.396 0.28945 0.446 0.33880 0.496 0.38870
0.297 0.19542 0.347 0.24212 0.397 0.29043 0.447 0.33980 0.497 0.389700.298 0.19634 0.348 0.24307 0.398 0.29141 0.448 0.34079 0.498 0.390700.299 0.19725 0.349 0.24403 0.399 0.29239 0.449 0.34179 0.499 0.38170
0.500 0.39270
Copyright © 2003 Marcel Dekker, Inc.

A:
The heat loss q from the surface is given by [7]
q ¼ 0:174ets þ 459:6
100
� �4
� ta þ 459:6
100
� �4" #
þ 0:296 ðts � taÞ1:25 �V þ 68:9
68:9
� �1=2
ð110Þ
e may be taken as 0.9 for oxidized steel, 0.05 for polished aluminum, and 0.15 for
oxidized aluminum. Also,
q ¼ Kmðt � tsÞ½ðd þ 2LÞ=2� � ln½ðd þ 2LÞ=d� ¼
Kmðt � tsÞLe
ð111Þ
where t is the hot face temperature, �F, and Le is the equivalent thickness of
insulation for a curved surface such as a pipe or tube.
Le ¼d þ 2L
2ln
d þ 2L
dð112Þ
Substituting ts ¼ 200, ta ¼ 80, V ¼ 264, and e¼ 0.15 into Eq. (110), we have
q ¼ 0:173� 0:15� ð6:64 � 5:44Þ þ 0:296
� ð660� 540Þ1:25 � 264þ 69
69
� �0:5
¼ 285 Btu=ft2 h
From Eq. (111),
Le ¼ 0:35� 800� 200
285¼ 0:74 in:
We can solve for L given Le and d by using Eq. (112) and trial and error, or we
can use Table 8.39. It can be shown that L¼ 0.75 in. The next standard thickness
available will be chosen. A trial-and-error method as discussed next will be
needed to solve for the surface temperature ts. (Note that L is the actual thickness
of insulation.)
8.52
Q:
Determine the surface temperature of insulation in Q8.51 when 1.0 in. thick
insulation is used on the pipe. Other data are as given earlier.
Copyright © 2003 Marcel Dekker, Inc.

A:
Calculate the equivalent thickness Le. From Eq. (112),
Le ¼12þ 2
2ln
14
12¼ 1:08 in:
Assume that for the first trial ts ¼ 150�F. Let Km at a mean temperature of
(800 þ 150)=2¼ 475�F be 0.34 Btu in.=ft2 h �F. From Eq. (110),
q ¼ 0:173� 0:15� ð6:14 � 5:44Þ þ 0:296
� ð610� 540Þ1:25 � 264þ 69
69
� �0:5
¼ 145 Btu=ft2 h
From Eq. (111),
q ¼ 0:34� 800� 150
1:08¼ 205 Btu=ft2 h
Because these two values of q do not agree, we must go for another trial.
Try ts ¼ 170�F. Then, from Eq. (110),
q ¼ 200 Btu=ft2 h
TABLE 8.39 Equivalent Thickness of Insulation,a Le
Thickness of insulation L (in.)
Tube diam. d (in.) 0.5 1 1.5 2.0 3.0 4.0 5.0 6.0
1 0.69 1.65 2.77 4.0 6.80 9.90 13.2 16.72 0.61 1.39 2.29 3.30 5.50 8.05 10.75 13.62
3 0.57 1.28 2.08 2.97 4.94 7.15 9.53 12.074 0.56 1.22 1.96 2.77 4.55 6.60 8.76 11.105 0.55 1.18 1.88 2.65 4.34 6.21 8.24 10.40
6 0.54 1.15 1.82 2.55 4.16 5.93 7.85 9.808 0.53 1.12 1.75 2.43 3.92 5.55 7.50 9.15
10 0.52 1.09 1.70 2.35 3.76 5.29 6.93 8.57
12 0.52 1.08 1.67 2.30 3.65 5.11 6.65 8.3116 0.52 1.06 1.63 2.23 3.50 4.86 6.31 7.8320 0.51 1.05 1.61 2.19 3.41 4.70 6.10 7.52
aLe ¼ d þ 2L
2lnd þ 2L
d. For example, for d ¼3 and L¼ 1.5, Le ¼2.08.
Copyright © 2003 Marcel Dekker, Inc.

and from Eq. (111),
q ¼ 198 Btu=ft2 h
These two are quite close. Hence the final surface temperature is 170�F, and the
heat loss is about 200Btu=ft2 h.
8.53
Q:
A horizontal flat surface is at 10�F. The ambient dry bulb temperature is 80�F,and the relative humidity is 80%. Determine the thickness of fibrous insulation
that will prevent condensation of water vapor on the surface. Use Km ¼0.28Btu=ft h �F. The wind velocity is zero. Use a surface emissivity of 0.9 for
the casing.
A:
The surface temperature must be above the dew point of water to prevent
condensation of water vapor. Q5.10 shows how the dew point can be calculated.
The saturated vapor pressure at 80�F, from the steam tables in the Appendix, is
0.51 psia. At 80% relative humidity, the vapor pressure will be 0.8� 0.51¼0.408 psia. From the steam tables, this corresponds to a saturation temperature of
73�F, which is also the dew point. Hence we must design the insulation so the
casing temperature is above 73�F.From Eq. (110),
q ¼ 0:173� 0:9� ð5:44 � 5:334Þþ 0:296� ð80� 73Þ1:25 ¼ 10:1 Btu=ft2 h
Also, from Eq. (111),
q ¼ ðtd � tsÞ �Km
L¼ ð73� 10Þ � 0:28
L
(In this case of a flat surface, Le ¼ L.)
Note that the heat flow is from the atmosphere to the surface. td and ts are
the dew point and surface temperature, �F. Solving for L, we get L¼ 1.75 in.
Hence, by using the next standard insulation thickness available, we can
ensure that the casing is above the dew point. To obtain the exact casing
temperature with the standard thickness of insulation, a trial-and-error procedure
as discussed in Q8.52 may be used. But this is not really necessary, because we
have provided a safe design thickness.
Copyright © 2003 Marcel Dekker, Inc.

8.54a
Q:
A 112in. schedule 40 pipe 1000 ft long carries hot water at 300�F. What is the heat
loss from its surface if it is not insulated (case 1) or if it has 1 in., 2 in., and 3 in.
thick insulation (case 2)?
The thermal conductivity of insulation may be assumed to be
0.25Btu in.=ft2 h �F. The ambient temperature is 80�F, and the wind velocity is
zero.
A:
Case 1. Equation (110) can be used to determine the heat loss. For the bare pipe
surface, assume that e is 0.90. Then
q ¼ 0:173� 0:9� ð7:64 � 5:44Þþ 0:296� ð300� 80Þ1:25 ¼ 638 Btu=ft2 h
Case 2. Determination of the surface temperature given the insulation thickness
involves a trial-and-error procedure as discussed in Q8.52 and will be done in
detail for the 1 in. case.
Various surface temperatures are assumed, and q is computed from Eqs.
(110) and (111). Let us use a e value of 0.15. The following table gives the results
of the calculations.
We can draw a graph of ts versus q with these values and obtain the correct ts.
However, we see from the table, by interpolation, that at ts ¼ 115�F, q, from both
equations, is about 33Btu=ft2 h.
Total heat loss ¼ 3:14� 3:9
12� 1000� 33
¼ 33;675 Btu=h
Similarly, we may solve for q when the thicknesses are 2 and 3 in. It can be shown
that at L¼ 2 in., q¼ 15Btu=ft2 h, and at L¼ 3 in., q¼ 9Btu=ft2 h. Also, when
L¼ 2 in., ts ¼ 98�F and total heat loss¼ 23,157Btu=h. When L¼ 3 in., ts ¼ 92�Fand total loss¼ 18,604 Btu=h.
ts q from Eq. (110) q from Eq. (111)
110 26 34120 37 32
140 61 28
Copyright © 2003 Marcel Dekker, Inc.
8.54b
Q:
Estimate the drop in water temperature of 1 in. thick insulation used in Q8.54a.
The water flow is 7500 lb=h.
A:
The total heat loss has been shown to be 33,675Btu=h. This is lost by the water
and can be written as 7500 DT , where DT is the drop in temperature, assuming
that the specific heat is 1. Hence
DT ¼ 33;675
7500¼ 4:5�F
By equating the heat loss from insulation to the heat lost by the fluid, be it
air, oil, steam, or water, one can compute the drop in temperature in the pipe or
duct. This calculation is particularly important when oil lines are involved,
because viscosity is affected, leading to pumping and atomization problems.
8.55
Q:
In Q8.54 determine the optimum thickness of insulation with the following data.
Cost of energy¼ $3=MMBtu
Cost of operation¼ $8000=yearInterest and escalation rates¼ 12% and 7%
Life of the plant¼ 15 years
Total cost of 1 in. thick insulation, including labor and material,¼ $5200;
for 2 in. insulation, $7100; and for 3 in. insulation, $10,500
A:
Let us calculate the capitalization factor F from Q5.22.
F ¼ 1:07
1:12� 1� ð1:07=1:12Þ15
1� 1:07=1:12¼ 10:5
Let us calculate the annual heat loss.
For L¼ 1 in.,
Ca ¼ 33;675� 3� 8000
106¼ $808
Copyright © 2003 Marcel Dekker, Inc.

For L¼ 2 in.,
Ca ¼ 23;157� 3� 8000
106¼ $555
For L¼ 3 in.,
Ca ¼ 18;604� 3� 8000
106¼ $446
Calculate capitalized cost CaF.
For L¼ 1 in.,
CaF ¼ 808� 10:5 ¼ $8484
For L¼ 2 in.,
CaF ¼ 555� 10:5 ¼ $5827
For L¼ 3 in.,
CaF ¼ 446� 10:5 ¼ $4683
Calculate total capitalized cost or life-cycle cost (LCC):
For L¼ 1 in.,
LCC ¼ 8484þ 5200 ¼ $13;684
For L¼ 2 in., LCC¼ $12,927; and for L¼ 3 in., LCC¼ $15,183.
Hence we see that the optimum thickness is about 2 in. With higher
thicknesses, the capital cost becomes more than the benefits from savings in
heat loss. A trade-off would be to go for 2 in. thick insulation.
Several factors enter into calculations of this type. If the period of operation
were less, probably a lesser thickness would be adequate. If the cost of energy
were more, we might have to go for a greater thickness. Thus each case must be
evaluated before we decide on the optimum thickness. This example gives only a
methodology, and the evaluation can be as detailed as desired by the plant
engineering personnel.
If there were no insulation, the annual heat loss would be
3:14� 1:9
12� 1000� 638� 3� 8000
106¼ $7600
Hence simple payback with even 1 in. thick insulation is 5200=(76007 808)¼ 0.76 year, or 9 months.
8.56
Q:
What is a hot casing? What are its uses?
Copyright © 2003 Marcel Dekker, Inc.

A:
Whenever hot gases are contained in an internally refractory-lined (or insulated)
duct, the casing temperature can fall below the dew point of acid gases, which can
seep through the refractory cracks and cause acid condensation, which is a
potential problem. To avoid this, some engineers prefer a ‘‘hot casing’’ design,
which ensures that the casing or the vessel or duct containing the gases is
maintained at a high enough temperature to minimize or prevent acid condensa-
tion. At the same time, the casing is also externally insulated to minimize the heat
losses to the ambient (see Fig. 8.21). A ‘‘hot casing’’ is a combination of internal
plus external insulation used to maintain the casing at a high enough temperature
to avoid acid condensation while ensuring that the heat losses to the atmosphere
are low.
Consider the use of a combination of two refractories inside the boiler
casing: 4 in. of KS4 and 2 in. of CBM. The hot gases are at 1000�F. Ambient
temperature¼ 60�F, and wind velocity is 100 ft=min. Casing emissivity is 0.9.
To keep the boiler casing hot, an external 0.5 in. of mineral fiber is added.
Determine the boiler casing temperature, the outer casing temperature, and the
heat loss.
One can perform the calculations discussed earlier to arrive at the
temperatures and heat loss. For the sake of illustrating the point, a computer
printout of the result is shown in Fig. 8.22. It can be seen that the boiler casing is
at 392�F, and the outermost casing is at 142�F. The heat loss is 180 Btu=ft2 h. Theboiler casing is hot enough to avoid acid condensation, while the heat losses are
kept low.
FIGURE 8.21 Arrangement of hot casing.
Copyright © 2003 Marcel Dekker, Inc.

8.57
Q:
What happens if ducts or stacks handling flue gases are not insulated? What
would the gas or stack wall temperature be?
A:
This question faces engineers involved in engineering of boiler plants. If ducts
and stacks are not insulated, the heat loss from the casing can be substantial. Also,
the stack wall temperature can drop low enough to cause acid dew point
corrosion.
Let the flue gas flow be W lb=h at a temperature of tg1 at the inlet to the
duct or stack (Fig. 8.23). The heat loss from the casing wall is given by Eq. (110),
q ¼ 0:174e� tc þ 460
100
� �4
� ta þ 460
100
� �4" #
þ 0:296ðtc � taÞ1:25 �V þ 69
69
� �0:5
The temperature drop across the gas film is given by
tg � tw1 ¼ qdo=dihc
FIGURE 8.22 Printout on casing temperatures.
Copyright © 2003 Marcel Dekker, Inc.

where
hc ¼ convective heat transfer coefficient Btu=ft2 h �Fdo; di ¼ outer and inner diameter of the stack, in.
hc ¼ 2:44�W 0:8C
d1:8i
where, from Eq. (12),
C ¼ Cp
m
� �0:4
k0:6
The duct wall temperature drop is given by Eq. (111), which can be rearranged to
give
tw1 � two ¼ qdolnðdo=diÞ24Km
where tw1; two are the inner and outer wall temperatures, �F.The total heat loss from the duct or stack is Q ¼ 3:14do � H=12 where H is
the height, ft. The exit gas temperature is then
tg2 ¼ tg1 �Q
Wg � Cp
ð113Þ
FIGURE 8.23 Stack wall temperature.
Copyright © 2003 Marcel Dekker, Inc.
The above equations have to be solved iteratively. A trial value for tg2 is assumed,
and the gas properties are computed at the average gas temperature. The casing
temperature is also obtained through an iterative process. The total heat loss is
computed and tg2 is again evaluated. If the assumed and calculated tg2 values
agree, then iteration stops. A computer program can be developed to obtain
accurate results, particularly if the stack is tall and calculations are better done in
several segments.
Example
110,000 lb=h of flue gases at 410�F enter a 48 in. ID stack that is 50 ft long and
1 in. thick. If the ambient temperature is 70�F and wind velocity is 125 ft=min,
determine the casing temperature, total heat loss, and exit gas temperature.
Flue gas properties can be assumed to be as follows at 400�F (or com-
puted from methods discussed in Q8.12 if analysis is known): Cp ¼ 0.265,
m¼ 0.058 lb=ft h, k¼ 0.0211Btu=ft h �F. Let the gas temperature drop in the
stack¼ 20�F; hence the exit gas temperature¼ 390�F.The gas-side heat transfer coefficient is
2:44� ð110;000Þ0:8 � 0:265
0:058
� �0:4
� ð0:0211Þ0:6 ¼ 4:5 Btu=ft2 h �F
Let the casing temperature tc (¼ two without insulation) be 250�F.
q ¼ 0:174� 0:9� ½ð7:1Þ4 � ð5:3Þ4�
þ 0:296� ð710� 530Þ1:25 � 125þ 69
69
� �0:5
¼ 601 Btu=ft2 h
Gas temperature drop across gas film¼ 601=4.5¼ 134�F.Temperature drop across the stack wall¼
601� 50� lnð50=48Þ24� 25
¼ 2�F
Hence stack wall outer temperature¼ 4007 1347 2¼ 264�F.It can be shown that at a casing or wall temperature of 256�F, the heat
loss through gas film matches the loss through the stack wall. The heat
loss¼ 629Btu=ft2 h, and total heat loss¼ 411,400Btu=h.
Gas temperature drop ¼ 411;400
110;000� 0:265¼ 14�F
The average gas temperature¼ 4107 14¼ 396�F, which is close to the 400�Fassumed. With a computer program, one can fine-tune the calculations to include
fouling factors.
Copyright © 2003 Marcel Dekker, Inc.

8.58
Q:
What are the effects of wind velocity and casing emissivity on heat loss and
casing temperature?
A:
Using the method described earlier, the casing temperature and heat loss were
determined for the case of an insulated surface at 600�F using 3 in. of mineral
fiber insulation. (Aluminum casing has an emissivity of about 0.15, and oxidized
steel, 0.9.) The results are shown in Table 8.40.
It can be seen that the wind velocity does not result in reduction of heat
losses though the casing temperature is significantly reduced. Also, the use of
lower emissivity casing does not affect the heat loss, though the casing
temperature is increased, particularly at low wind velocity.
8.59a
Q:
How does one check heat transfer equipment for possible noise and vibration
problems?
A:
A detailed procedure is outlined in Refs. 1 and 8. Here only a brief reference to
the methodology will be made.
Whenever a fluid flows across a tube bundle such as boiler tubes in an
economizer, air heater, or superheater (see Fig. 8.24), vortices are formed and
shed in the wake beyond the tubes. This shedding on alternate sides of the tubes
causes a harmonically varying force on the tube perpendicular to the normal flow
of the fluid. It is a self-excited vibration. If the frequency of the von Karman
vortices, as they are called, coincides with the natural frequency of vibration of
the tubes, resonance occurs and the tubes vibrate, leading to leakage and damage
TABLE 8.40 Results of Insulation Performance
Casing Emissivity Wind vel. (fpm) Heat loss Casing temp (�F)
Aluminum 0.15 0 67 135
Aluminum 0.15 1760 71 91Steel 0.90 0 70 109Steel 0.90 1760 70 88
Copyright © 2003 Marcel Dekker, Inc.

FIGURE 8.24 Crossflow of gas over tube bundles. (a) Water tube boiler design;
(b) air heater; (c) superheater.
Copyright © 2003 Marcel Dekker, Inc.

at supports. Vortex shedding is more prevalent in the range of Reynolds numbers
from 300 to 2� 105. This is the range in which many boilers, economizers, and
superheaters operate. Another mechanism associated with vortex shedding is
acoustic oscillation, which is normal to both fluid flow and tube length. This is
observed only with gases and vapors. These oscillations coupled with vortex
shedding lead to resonance and excessive noise. Standing waves are formed
inside the duct.
Hence in order to analyze tube bundle vibration and noise, three frequen-
cies must be computed: natural frequency of vibration of tubes, vortex shedding
frequency, and acoustic frequency. When these are apart by at least 20%,
vibration and noise may be absent. Q8.59b–Q8.59e show how these values are
computed and evaluated.
8.59b
Q:
How is the natural frequency of vibration of a tube bundle determined?
A:
The natural frequency of transverse vibrations of a uniform beam supported at
each end is given by
fn ¼C
2pElgo
MeL4
� �0:5
ð114aÞ
where
C¼ a factor determined by end conditions
E¼Young’s modulus of elasticity
I ¼moment of inertia¼ pðd4o � d4i Þ=64Me ¼mass per unit length of tube, lb=ft (including ash deposits, if any, on
the tube)
L¼ tube length, ft
Simplifying (114a), we have for steel tubes
fn ¼90C
L2d4o � d4iMe
� �0:5
ð114bÞ
where do and di are in inches.
Table 8.41 gives C for various end conditions.
Copyright © 2003 Marcel Dekker, Inc.

8.59c
Q:
How is the acoustic frequency computed?
A:
fa is given by Vs=l, where Vs ¼velocity of sound at the gas temperature in the
duct or shell, ft=s. It is given by the expression Vs ¼ ðg0nRT Þ0:5. For flue gases
and air, sonic velocity is obtained by substituting 32 for g0, 1.4 for n, and1546=MW for R, where the molecular weight for flue gases is nearly 29. Hence,
Vs ¼ 49� T 0:5 ð115ÞWavelength l ¼ 2W=n, where W is the duct width, ft, and n is the mode of
vibration.
8.59d
Q:
How is the vortex shedding frequency fe determined?
A:
fe is obtained from the Strouhal number S:
S ¼ fedo=12V ð116Þwhere
do ¼ tube outer diameter, in.
V ¼ gas velocity, ft=s
S is available in the form of charts for various tube pitches; it typically ranges
from 0.2 to 0.3 (see Fig. 8.25) [1].
Q8.59e shows how a tube bundle is analyzed for noise and vibration.
TABLE 8.41 Values of C for Eq. (114b)
Mode of vibration
End support conditions 1 2 3
Both ends clamped 22.37 61.67 120.9One clamped, one hinged 15.42 49.97 104.2
Both hinged 9.87 39.48 88.8
Copyright © 2003 Marcel Dekker, Inc.

FIGURE 8.25a Strouhal number for in-line bank of tubes.
Copyright © 2003 Marcel Dekker, Inc.

8.59e
Q:
A tubular air heater 11.7 ft wide, 12.5 ft deep, and 13.5 ft high is used in a boiler.
Carbon steel tubes of 2 in. OD and 0.08 in. thickness are used in in-line fashion
with a transverse pitch of 3.5 in. and longitudinal pitch of 3.0 in. The heater is 40
tubes wide (3.5 in. pitch) and 60 tubes deep (2.5 in. pitch). Air flow across the
FIGURE 8.25b Strouhal number for staggered bank of tubes.
Copyright © 2003 Marcel Dekker, Inc.

FIGURE 8.25c,d Strouhal number (c) for staggered bank of tubes (top), (d) for in-line bank of tubes (bottom).
Copyright © 2003 Marcel Dekker, Inc.
tubes is 300,000 lb=h at an average temperature of 219�F. The tubes are fixed at
both ends in tube sheets. Check whether bundle vibrations are likely. Tube mass
per unit length¼ 1.67 lb=ft.
A:
First compute fa; fe, and fn. L¼ 13.5 ft, do ¼ 2 in., di ¼ 1.84 in., Me ¼ 1.67 lb=ft,and, from Table 8.41, C¼ 22.37.
Using Eq. (114b), we have
fn ¼90� 22:37
ð13:5Þ2 � ð24 � 1:844Þ0:5ð1:67Þ0:5 ¼ 18:2 Hz
This is in mode 1. In mode 2, C¼ 61.67; hence fn2 is 50.2Hz. (The first two
modes are important.)
Let us compute fe. S from Fig. 8.25 for ST=do ¼ 3.5=2¼ 1.75 and a
longitudinal pitch of 3.0=2¼ 1.5 is 0.33.
From Eq. (1) of Chapter 5, r¼ 40=(219 þ 460)¼ 0.059 lb=cu ft.
Free gas area ¼ 40� ð3:5� 2Þ � 13:5=12 ¼ 67:5 lb=ft2 h
(13.5 is the tube length, and 40 tubes wide is used with a pitch of 3.5 in.) Hence
air velocity across tubes is
V ¼ 300;000
67:5� 3600� 0:059¼ 21 ft=s
Hence
fe ¼12SV
do¼ 12� 0:33� 21
2¼ 41:6 Hz
Let us compute fa. T ¼ (219 þ 460)¼ 679�R. Hence Vs ¼ 49� 6790:5 ¼1277 ft=s. Width W ¼ 11.7 ft, and l¼ 2� 11.7¼ 23.4 ft. For mode 1 or n¼ 1,
fa1 ¼ 1277=23:4 ¼ 54:5 Hz
For n¼ 2,
fa2 ¼ 54:5� 2 ¼ 109 Hz
The results for modes 1 and 2 are summarized in Table 8.42. It can be seen
that without baffles the frequencies fa and fe are within 20% of each other. Hence
noise problems are likely to arise. If a baffle or plate is used to divide the duct
width into two regions, the acoustic frequency is doubled as the wavelength or
width is halved. This is a practical solution to acoustic vibration problems.
Copyright © 2003 Marcel Dekker, Inc.
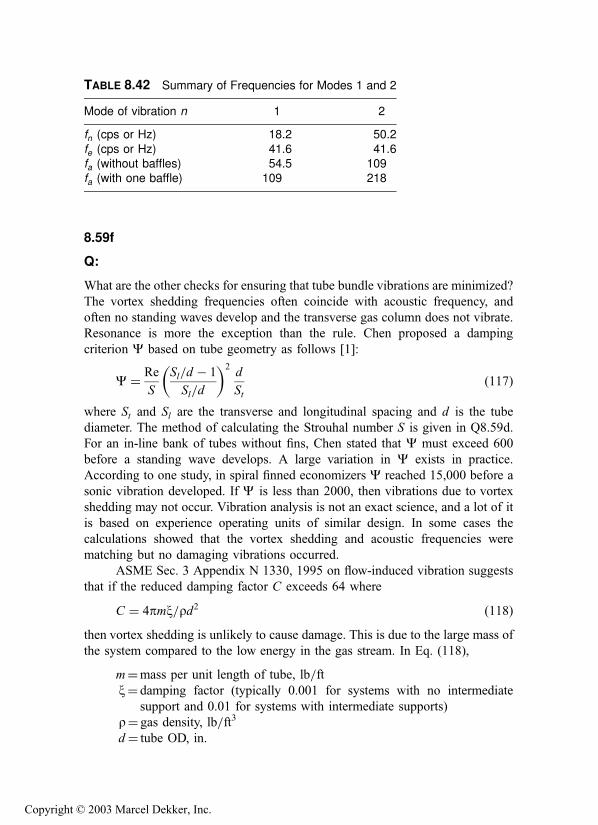
8.59f
Q:
What are the other checks for ensuring that tube bundle vibrations are minimized?
The vortex shedding frequencies often coincide with acoustic frequency, and
often no standing waves develop and the transverse gas column does not vibrate.
Resonance is more the exception than the rule. Chen proposed a damping
criterion C based on tube geometry as follows [1]:
C ¼ Re
S
Sl=d � 1
Sl=d
� �2d
Stð117Þ
where St and Sl are the transverse and longitudinal spacing and d is the tube
diameter. The method of calculating the Strouhal number S is given in Q8.59d.
For an in-line bank of tubes without fins, Chen stated that C must exceed 600
before a standing wave develops. A large variation in C exists in practice.
According to one study, in spiral finned economizers C reached 15,000 before a
sonic vibration developed. If C is less than 2000, then vibrations due to vortex
shedding may not occur. Vibration analysis is not an exact science, and a lot of it
is based on experience operating units of similar design. In some cases the
calculations showed that the vortex shedding and acoustic frequencies were
matching but no damaging vibrations occurred.
ASME Sec. 3 Appendix N 1330, 1995 on flow-induced vibration suggests
that if the reduced damping factor C exceeds 64 where
C ¼ 4pmx=rd2 ð118Þthen vortex shedding is unlikely to cause damage. This is due to the large mass of
the system compared to the low energy in the gas stream. In Eq. (118),
m¼mass per unit length of tube, lb=ftx¼ damping factor (typically 0.001 for systems with no intermediate
support and 0.01 for systems with intermediate supports)
r¼ gas density, lb=ft3
d¼ tube OD, in.
TABLE 8.42 Summary of Frequencies for Modes 1 and 2
Mode of vibration n 1 2
fn (cps or Hz) 18.2 50.2
fe (cps or Hz) 41.6 41.6fa (without baffles) 54.5 109fa (with one baffle) 109 218
Copyright © 2003 Marcel Dekker, Inc.
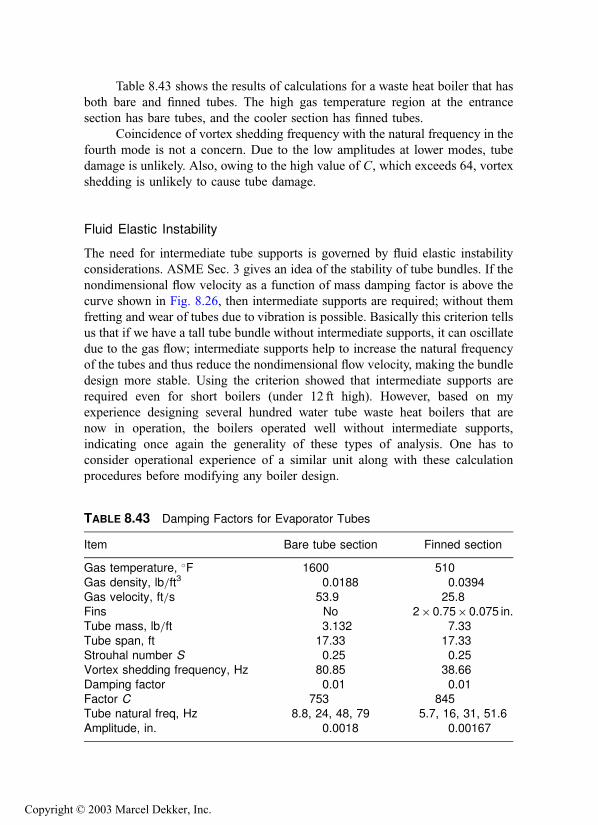
Table 8.43 shows the results of calculations for a waste heat boiler that has
both bare and finned tubes. The high gas temperature region at the entrance
section has bare tubes, and the cooler section has finned tubes.
Coincidence of vortex shedding frequency with the natural frequency in the
fourth mode is not a concern. Due to the low amplitudes at lower modes, tube
damage is unlikely. Also, owing to the high value of C, which exceeds 64, vortex
shedding is unlikely to cause tube damage.
Fluid Elastic Instability
The need for intermediate tube supports is governed by fluid elastic instability
considerations. ASME Sec. 3 gives an idea of the stability of tube bundles. If the
nondimensional flow velocity as a function of mass damping factor is above the
curve shown in Fig. 8.26, then intermediate supports are required; without them
fretting and wear of tubes due to vibration is possible. Basically this criterion tells
us that if we have a tall tube bundle without intermediate supports, it can oscillate
due to the gas flow; intermediate supports help to increase the natural frequency
of the tubes and thus reduce the nondimensional flow velocity, making the bundle
design more stable. Using the criterion showed that intermediate supports are
required even for short boilers (under 12 ft high). However, based on my
experience designing several hundred water tube waste heat boilers that are
now in operation, the boilers operated well without intermediate supports,
indicating once again the generality of these types of analysis. One has to
consider operational experience of a similar unit along with these calculation
procedures before modifying any boiler design.
TABLE 8.43 Damping Factors for Evaporator Tubes
Item Bare tube section Finned section
Gas temperature, �F 1600 510
Gas density, lb=ft3 0.0188 0.0394Gas velocity, ft=s 53.9 25.8Fins No 2� 0.75� 0.075 in.Tube mass, lb=ft 3.132 7.33
Tube span, ft 17.33 17.33Strouhal number S 0.25 0.25Vortex shedding frequency, Hz 80.85 38.66
Damping factor 0.01 0.01Factor C 753 845Tube natural freq, Hz 8.8, 24, 48, 79 5.7, 16, 31, 51.6
Amplitude, in. 0.0018 0.00167
Copyright © 2003 Marcel Dekker, Inc.

Example
In a boiler with mass per unit length m¼ 3.132 lb=ft, damping factor x¼ 0.001,
gas velocity¼ 87 ft=s, and gas density r¼ 0.0188 lb=ft3, d¼ 2 in.
Mass damping factor ¼ 2pmxd2r
¼ 2p� 3:132� 0:001� 144=ð0:0188� 22Þ¼ 37:7
Nondimensional velocity¼ 12U=fd, where f ¼ natural frequency of vibration,
Hz; U ¼ gas velocity, ft=s; and d¼ tube outer diameter, in.
Based on previous calculations, f ¼ 20.6Hz. Hence
Flow velocity ¼ 87� 12=ð20:6� 2Þ ¼ 25:5
It can be seen from Fig. 8.26 that this is a borderline case and that an intermediate
support would have further increased the natural frequency and made the flow
velocity fall within the stable region. In practice, for tall tube bundles, inter-
mediate supports at 11–15 ft intervals are used.
8.60
Q:
How are the gas properties Cp; m, and k estimated for a gaseous mixture?
Determine Cp; m, and k for a gas mixture having the following analysis at
1650�F and 14.7 psia.
FIGURE 8.26 Damping factor versus nondimensional flow velocity.
Copyright © 2003 Marcel Dekker, Inc.
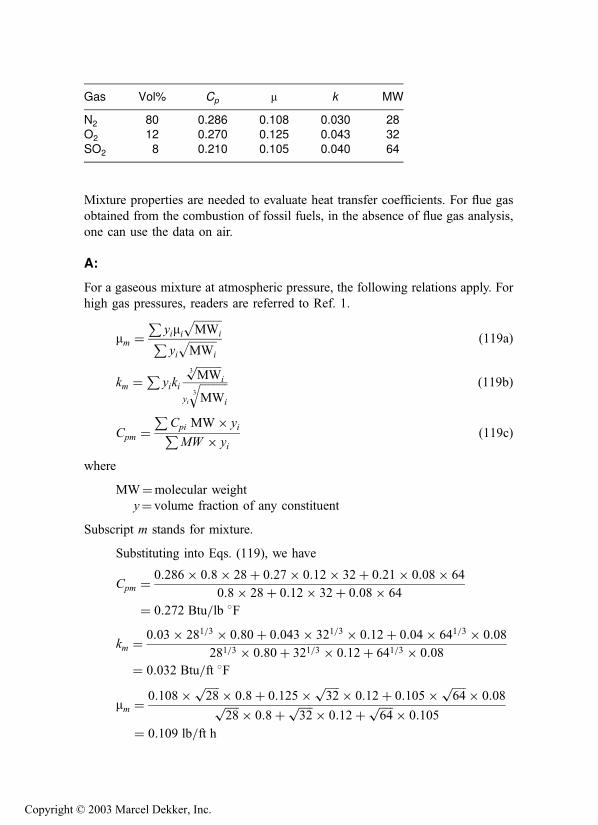
Mixture properties are needed to evaluate heat transfer coefficients. For flue gas
obtained from the combustion of fossil fuels, in the absence of flue gas analysis,
one can use the data on air.
A:
For a gaseous mixture at atmospheric pressure, the following relations apply. For
high gas pressures, readers are referred to Ref. 1.
mm ¼P
yimiffiffiffiffiffiffiffiffiffiffiMWi
pP
yi
ffiffiffiffiffiffiffiffiffiffiMWi
p ð119aÞ
km ¼Pyiki
ffiffiffiffiffiffiffiffiffiMW
3p
i
yi
ffiffiffiffiffiffiffiffiffiffiMWi
3
q ð119bÞ
Cpm ¼P
Cpi MW� yiPMW � yi
ð119cÞ
where
MW¼molecular weight
y¼ volume fraction of any constituent
Subscript m stands for mixture.
Substituting into Eqs. (119), we have
Cpm ¼ 0:286� 0:8� 28þ 0:27� 0:12� 32þ 0:21� 0:08� 64
0:8� 28þ 0:12� 32þ 0:08� 64
¼ 0:272 Btu=lb �F
km ¼ 0:03� 281=3 � 0:80þ 0:043� 321=3 � 0:12þ 0:04� 641=3 � 0:08
281=3 � 0:80þ 321=3 � 0:12þ 641=3 � 0:08
¼ 0:032 Btu=ft �F
mm ¼ 0:108� ffiffiffiffiffi28
p � 0:8þ 0:125� ffiffiffiffiffi32
p � 0:12þ 0:105� ffiffiffiffiffi64
p � 0:08ffiffiffiffiffi28
p � 0:8þ ffiffiffiffiffi32
p � 0:12þ ffiffiffiffiffi64
p � 0:105
¼ 0:109 lb=ft h
Gas Vol% Cp m k MW
N2 80 0.286 0.108 0.030 28O2 12 0.270 0.125 0.043 32
SO2 8 0.210 0.105 0.040 64
Copyright © 2003 Marcel Dekker, Inc.
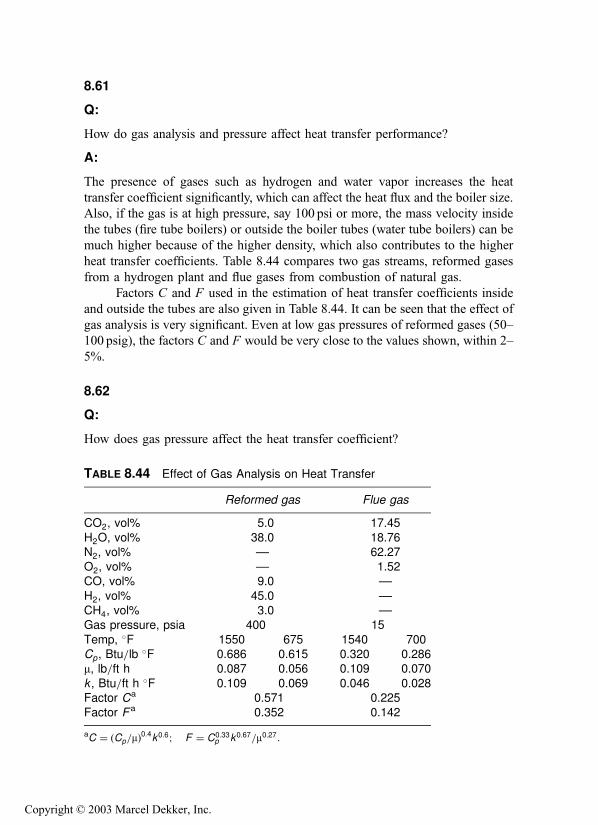
8.61
Q:
How do gas analysis and pressure affect heat transfer performance?
A:
The presence of gases such as hydrogen and water vapor increases the heat
transfer coefficient significantly, which can affect the heat flux and the boiler size.
Also, if the gas is at high pressure, say 100 psi or more, the mass velocity inside
the tubes (fire tube boilers) or outside the boiler tubes (water tube boilers) can be
much higher because of the higher density, which also contributes to the higher
heat transfer coefficients. Table 8.44 compares two gas streams, reformed gases
from a hydrogen plant and flue gases from combustion of natural gas.
Factors C and F used in the estimation of heat transfer coefficients inside
and outside the tubes are also given in Table 8.44. It can be seen that the effect of
gas analysis is very significant. Even at low gas pressures of reformed gases (50–
100 psig), the factors C and F would be very close to the values shown, within 2–
5%.
8.62
Q:
How does gas pressure affect the heat transfer coefficient?
TABLE 8.44 Effect of Gas Analysis on Heat Transfer
Reformed gas Flue gas
CO2, vol% 5.0 17.45
H2O, vol% 38.0 18.76N2, vol% — 62.27O2, vol% — 1.52CO, vol% 9.0 —
H2, vol% 45.0 —CH4, vol% 3.0 —Gas pressure, psia 400 15
Temp, �F 1550 675 1540 700Cp, Btu=lb
�F 0.686 0.615 0.320 0.286m, lb=ft h 0.087 0.056 0.109 0.070
k , Btu=ft h �F 0.109 0.069 0.046 0.028Factor Ca 0.571 0.225Factor Fa 0.352 0.142
aC ¼ ðCp=mÞ0:4k0:6; F ¼ C0:33p k0:67=m0:27.
Copyright © 2003 Marcel Dekker, Inc.
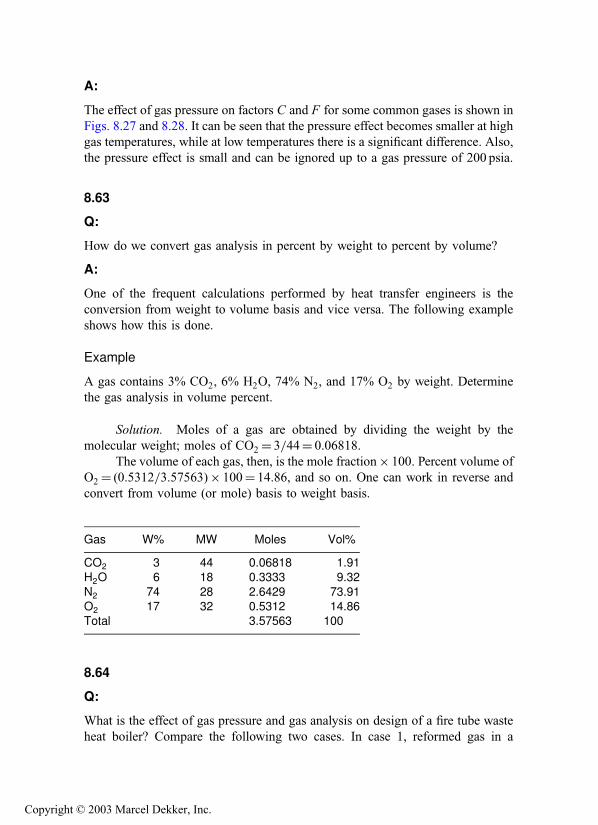
A:
The effect of gas pressure on factors C and F for some common gases is shown in
Figs. 8.27 and 8.28. It can be seen that the pressure effect becomes smaller at high
gas temperatures, while at low temperatures there is a significant difference. Also,
the pressure effect is small and can be ignored up to a gas pressure of 200 psia.
8.63
Q:
How do we convert gas analysis in percent by weight to percent by volume?
A:
One of the frequent calculations performed by heat transfer engineers is the
conversion from weight to volume basis and vice versa. The following example
shows how this is done.
Example
A gas contains 3% CO2, 6% H2O, 74% N2, and 17% O2 by weight. Determine
the gas analysis in volume percent.
Solution. Moles of a gas are obtained by dividing the weight by the
molecular weight; moles of CO2 ¼ 3=44¼ 0.06818.
The volume of each gas, then, is the mole fraction� 100. Percent volume of
O2 ¼ (0.5312=3.57563)� 100¼ 14.86, and so on. One can work in reverse and
convert from volume (or mole) basis to weight basis.
8.64
Q:
What is the effect of gas pressure and gas analysis on design of a fire tube waste
heat boiler? Compare the following two cases. In case 1, reformed gas in a
Gas W% MW Moles Vol%
CO2 3 44 0.06818 1.91H2O 6 18 0.3333 9.32
N2 74 28 2.6429 73.91O2 17 32 0.5312 14.86Total 3.57563 100
Copyright © 2003 Marcel Dekker, Inc.

FIGURE 8.27 Effect of gas pressure on heat transfer—flow inside tubes. (From
Ref. 1.)
Copyright © 2003 Marcel Dekker, Inc.

FIGURE 8.28 Effect of gas pressure on heat transfer—flow outside tubes. (From
Ref. 1.)
Copyright © 2003 Marcel Dekker, Inc.
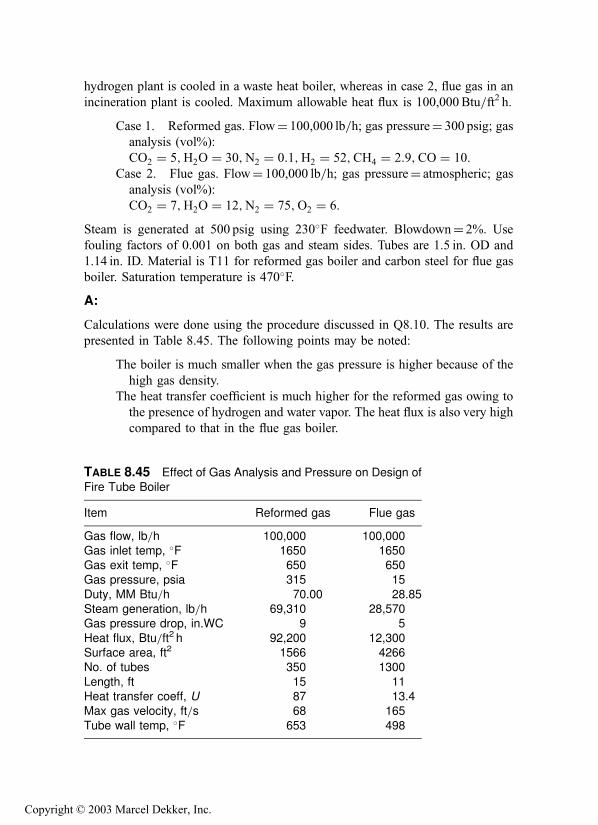
hydrogen plant is cooled in a waste heat boiler, whereas in case 2, flue gas in an
incineration plant is cooled. Maximum allowable heat flux is 100,000 Btu=ft2 h.
Case 1. Reformed gas. Flow¼ 100,000 lb=h; gas pressure¼ 300 psig; gas
analysis (vol%):
CO2 ¼ 5;H2O ¼ 30;N2 ¼ 0:1;H2 ¼ 52;CH4 ¼ 2:9;CO ¼ 10.
Case 2. Flue gas. Flow¼ 100,000 lb=h; gas pressure¼ atmospheric; gas
analysis (vol%):
CO2 ¼ 7;H2O ¼ 12;N2 ¼ 75;O2 ¼ 6.
Steam is generated at 500 psig using 230�F feedwater. Blowdown¼ 2%. Use
fouling factors of 0.001 on both gas and steam sides. Tubes are 1.5 in. OD and
1.14 in. ID. Material is T11 for reformed gas boiler and carbon steel for flue gas
boiler. Saturation temperature is 470�F.
A:
Calculations were done using the procedure discussed in Q8.10. The results are
presented in Table 8.45. The following points may be noted:
The boiler is much smaller when the gas pressure is higher because of the
high gas density.
The heat transfer coefficient is much higher for the reformed gas owing to
the presence of hydrogen and water vapor. The heat flux is also very high
compared to that in the flue gas boiler.
TABLE 8.45 Effect of Gas Analysis and Pressure on Design ofFire Tube Boiler
Item Reformed gas Flue gas
Gas flow, lb=h 100,000 100,000Gas inlet temp, �F 1650 1650Gas exit temp, �F 650 650Gas pressure, psia 315 15
Duty, MM Btu=h 70.00 28.85Steam generation, lb=h 69,310 28,570Gas pressure drop, in.WC 9 5
Heat flux, Btu=ft2 h 92,200 12,300Surface area, ft2 1566 4266No. of tubes 350 1300
Length, ft 15 11Heat transfer coeff, U 87 13.4Max gas velocity, ft=s 68 165
Tube wall temp, �F 653 498
Copyright © 2003 Marcel Dekker, Inc.

TABLE 8.46 Composition of Typical Waste Gases
vol% component
Waste gasa Temp (�C) Pressure (psig) N2 NO H2O O2 SO2 SO3 CO2 CO CH4 H2S H2 NH3 HCL
1 300–1000 1 80 10 102 250–500 1 81 11 1 7
3 250–850 3–10 66 9 19 64 200–1100 1 70 18 3 95 300–1100 30–50 0.5 37 6 8 5.5 43
6 200–500 200–450 20 60 207 100–600 1 75 7 15 38 175–1000 1 72 10 6 12 trace
9 250–1350 1 76 8 4 7 510 150–1000 1 73 20 2 511 300–1450 1.5 55 23 6 6 3 3 4
a1, Raw sulfur gases; 2, SO3 gases after converter; 3, nitrous gases; 4, reformer flue gases; 5, reformed gas; 6, synthesis gas; 7, gas turbine
exhaust; 8, MSW incinerator exhaust; 9, chlorinated plastics incineration; 10, fume or VOC incinerator exhaust; 11, sulfur condenser effluent.
Copyright © 2003 Marcel Dekker, Inc.

The tube wall temperature is also higher with reformed gas. Hence steam-
side fouling should be low in these boilers.
It is obvious that gas analysis and pressure play a significant role in the design of
boilers. Table 8.46 gives the analysis and gas pressure for typical waste gas
streams.
NOMENCLATURE
A Surface area, ft2
Af ;At;Ai;Ao Fin, total, inside, and obstruction surface areas, ft2=ftAw Area of tube wall, ft2=ftB Factor used in Grimson’s correlation
b Fin thickness, in.
C Factor used to estimate heat transfer coefficient
Cp Specific heat, Btu=lb �F; subscripts g;w;m stand for gas, water,
and mixture
C1–C6 Factors used in heat transfer and pressure drop calculations for
finned tubes
D Exchanger diameter, in.
d; di Tube outer and inner diameter, in.
e Escalation factor used in life-cycle costing calculations; base of
natural logarithm
E Efficiency of HRSG or fins
f Frequency, Hz or cps; subscripts a; e; n stand for acoustic, vortex
shedding, and natural
ff Fouling factor, ft2 h �F=Btu; subscripts i and o stand for inside
and outside
F Factor used in the estimation of outside heat transfer coefficient
and in the estimation of capitalized costs
G Gas mass velocity, lb=ft2 hh Fin height, in.
hc Convective heat transfer coefficient, Btu=ft2 h �Fhi; ho Heat transfer coefficients inside and outside tubes, Btu=ft2 h �Fhlf Heat loss factor, fraction
hN Nonluminous heat transfer coefficient, Btu=ft2 h �FDh Change in enthalpy, Btu=lbi Interest rate
k Thermal conductivity, Btu=ft h �F or Btu in.=ft2 h �F; subscript mstands for mixture
Km Metal thermal conductivity, Btu=ft h �FK1;K2 Constants
Copyright © 2003 Marcel Dekker, Inc.

L Length, ft; thickness of insulation, in.; or beam length
Le Equivalent thickness of insulation, in.
m Factor used in Eq. (47, 51)
Mc Water equivalent, Btu=�FMe Weight of tube, lb=ftMW Molecular weight
n Number of fins per inch
N Constant used in Grimson’s correlation; also number of tubes
Nu Nusselt number
NTU Number of transfer units
P Term used in temperature cross-correction
Pw;Pc Partial pressure of water vapor and carbon dioxide
Pr Prandtl number
Q Energy transferred, Btu=h; heat flux, Btu=ft2 hq Heat flux, heat loss, Btu=ft2 hqc Critical heat flux, Btu=ft2 hR Thermal resistance, ft2 h �F=Btu; subscripts i; o, and t stand for
inside, outside, and total
Re Reynolds number
Rm Metal thermal resistance, ft2 h �F=BtuS Fin clearance, in.; Strouhal number; surface area, ft2
ST ; SL Transverse and longitudinal pitch, in.
t Fluid temperature, �F; subscripts a; s; b stand for ambient,
surface, fin base
tf Fin tip temperature, �Ftm Metal temperature, �Ftsat Saturation temperature, �FT Absolute temperature, K or �R; subscripts g and w stand for gas
and wall
DT Log-mean temperature difference, �FU Overall heat transfer coefficient, Btu=ft2 h �FV Fluid velocity, ft=s or ft=min
Vs Sonic velocity, ft=sW Fluid flow, lb=h; subscripts g; s;w stand for gas, steam, and
water
w Flow per tube, lb=hx Steam quality, fraction
y Volume fraction of gas
e Effectiveness factor
ec; ew; eg Emissivity of CO2, water, gas emissivity
De Emissivity correction term
Copyright © 2003 Marcel Dekker, Inc.

Z Fin effectiveness
m Viscosity, lb=ft h; subscript m stands for mixture
r gas density, lb=cu ft
l wavelength, ft
n ratio of specific heats
REFERENCES
1. V Ganapathy. Applied Heat Transfer. Tulsa, OK: PennWell Books, 1982.
2. DQ Kern. Process Heat Transfer. New York: McGraw-Hill, 1950.
3. V Ganapathy. Nomogram determines heat transfer coefficient for water flowing in
pipes or tubes. Power Engineering, July 1977, p 69.
4. V Ganapathy. Charts simplify spiral finned tube calculations. Chemical Engineering.
Apr 25, 1977, p 117.
5. VGanapathy. Estimate nonluminous radiation heat transfer coefficients. Hydrocarbon
Processing, April 1981, p 235.
6. V Ganapathy. Evaluate the performance of waste heat boilers. Chemical Engineering,
Nov 16, 1981, p 291.
7. WC Turner, JF Malloy. Thermal Insulation Handbook. New York: McGraw-Hill,
1981, pp 40–45.
8. V Ganapathy. Waste Heat Boiler Deskbook. Atlanta, GA: Fairmont Press, 1991.
9. ESCOA Corp. ESCOA Fintube Manual. Tulsa, OK: ESCOA, 1979.
10. VGanapathy. Evaluate extended surfaces carefully. Hydrocarbon Processing, October
1990, p 65.
11. V Ganapathy. Fouling—the silent heat transfer thief. Hydrocarbon Processing,
October 1992, p 49.
12. V Ganapathy. HRSG temperature profiles guide energy recovery. Power, September
1988.
13. W Roshenow, JP Hartnett. Handbook of Heat Transfer. New York: McGraw-Hill,
1972, pp 13–56.
Copyright © 2003 Marcel Dekker, Inc.

9
Fans, Pumps, and Steam Turbines
9.01 Determining steam rates in steam turbines; actual and theoretical steam
rates; determining steam quantity required to generate electricity; calculat-
ing enthalpy of steam after isentropic and actual expansion
9.02a Cogeneration and its advantages
9.02b Comparison of energy utilization between a cogeneration plant and a
power plant
9.03 Which is the better location for tapping deaeration steam, boiler or
turbine?
9.04 Determining fan power requirements and cost of operation; calculating
BHP (brake horsepower) of fans; actual horsepower consumed if motor
efficiency is known; annual cost of operation of fan
9.05 Effect of elevation and air density on fan performance
9.06a Density of air and selection of fan capacity
9.06b How fan horsepower varies with density for forced draft fans
9.07 Determining power requirements of pumps
9.08 Electric and steam turbine drives for pumps; annual cost of operation
using steam turbine drive; annual cost of operation with motor
9.09a How specific gravity of liquid affects pump performance; BHP required at
different temperatures
9.09b How water temperature affects boiler feed pump power requirements
9.10 Effect of speed on pump performance; effect of change in supply
frequency
Copyright © 2003 Marcel Dekker, Inc.

9.11 Effect of viscosity on pump flow, head, and efficiency
9.12 Determining temperature rise of liquids through pumps
9.13 Estimating minimum recirculation flow through pumps
9.14 Net positive suction head (NPSH) and its determination
9.15 Effect of pump suction conditions on NPSHa (available NPSH)
9.16 Estimating NPSHr (required NPSH) for centrifugal pumps
9.17 Determining NPSHa for reciprocating pumps
9.18 Checking performance of pumps from motor readings; relating motor
current consumption to pump flow and head; analyzing for pump problems
9.19 Checking performance of fan from motor data; relating motor current
consumption to fan flow and head
9.20 Evaluating performance of pumps in series and in parallel
9.21 Parameters affecting Brayton cycle efficiency
9.22 How to improve the efficiency of the Brayton cycle
9.01
Q:How is the steam rate for steam turbines determined?
A:The actual steam rate (ASR) for a turbine is given by the equation
ASR ¼ 3413
Zt � ðh1 � h2sÞð1Þ
where ASR is the actual steam rate in lb=kWh. This is the steam flow in lb=hrequired to generate 1 kWof electricity. h1 is the steam enthalpy at the inlet to the
turbine, Btu=lb, and h2s is the steam enthalpy at turbine exhaust pressure if the
expansion is assumed to be isentropic, Btu=lb. That is, the entropy is the same at
inlet condition and at exit. Given h1, h2s can be obtained either from the Mollier
chart or by calculation using steam table data (see the Appendix). Zt is the
efficiency of the turbine, expressed as a fraction. Typically, Zt ranges from 0.65 to
0.80.
Another way to estimate ASR is to use published data on turbine theoretical
steam rates (TSRs) (see Table 9.1).
TSR ¼ 3413
h1 � h2sð2Þ
TSR divided by Zt gives ASR. The following example shows how the steam rate
can be used to find required steam flow.
Copyright © 2003 Marcel Dekker, Inc.

TABLE 9.1 Theoretical Steam Rates for Steam Turbines at Some Common Conditions (lb=kWh)
Inlet
200 psig 400 psig 600 psig 600 psig 850 psig,150 psig 200 psig 500�F 750�F 750�F 825�F 825�F,
Exhaust 366�F 388�F 94�F 302�F 261�F 336�F 298�F,pressure saturated saturated superheat superheat superheat superheat superheat
2 in.Hg 10.52 10.01 9.07 7.37 7.09 6.77 6.584 in.Hg 11.76 11.12 10.00 7.99 7.65 7.28 7.060psig 19.37 17.51 15.16 11.20 10.40 9.82 9.3110 psig 23.96 21.09 17.90 12.72 11.64 10.96 10.29
30 psig 33.6 28.05 22.94 15.23 13.62 12.75 11.8050 psig 46.0 36.0 28.20 17.57 15.36 14.31 13.0760 psig 53.9 40.4 31.10 18.75 16.19 15.05 13.66
70 psig 63.5 45.6 34.1 19.96 17.00 15.79 14.2275 psig 69.3 48.5 35.8 20.59 17.40 16.17 14.50
Source: Ref. 4.
Copyright © 2003 Marcel Dekker, Inc.

Example
How many lb=h of superheated steam at 1000 psia, 900�F, is required to generate
7500 kW in a steam turbine if the backpressure is 200 psia and the overall
efficiency of the turbine generator system is 70%?
Solution. From the steam tables, at 1000 psia, 900�F, h1 ¼ 1448.2 Btu=lband entropy s1 ¼ 1.6121Btu=lb �F. At 200 psia, corresponding to the same
entropy, we must calculate h2s by interpolation. We can note that steam is in
superheated condition. h2s ¼ 1257.7 Btu=lb. Then
ASR ¼ 3413
0:70� ð1448� 1257:7Þ ¼ 25:6 lb=kWh
Hence, to generate 7500 kW, the steam flow required is
Ws ¼ 25:6� 7500 ¼ 192;000 lb=h
9.02a
Q:What is cogeneration? How does it improve the efficiency of the plant?
A:Cogeneration is the term used for simultaneous generation of power and process
steam from a single full source, as in a system of gas turbine and process waste
heat boiler, wherein the gas turbine generates electricity and the boiler generates
steam for process (see Fig. 9.1).
In a typical power plant that operates at 35–43% overall efficiency, the
steam pressure in the condenser is about 2–4 in.Hg. A lot of energy is wasted in
the cooling water, which condenses the steam in the condenser.
If, instead, the steam is generated at a high pressure and expanded in a
steam turbine to the process steam pressure, we can use the steam for process, and
electricity is also generated. A full credit for the process steam can be given if the
steam is used—hence the improvement in overall energy utilization. Q9.02b
explains this in detail.
9.02b
Q:50,000 lb=h of superheated steam at 1000 psia and 900�F is available in a process
plant. One alternative is to expand this is a steam turbine to 200 psia and use the
200 psia steam for process (cogeneration). Another alternative is to expand the
Copyright © 2003 Marcel Dekker, Inc.

superheated steam in a steam turbine to 1 psia, generating electricity alone in a
power plant. Evaluate each scheme.
A:
Scheme 1. The steam conditions are as in Q9.01, so let us use the data on
enthalpy. Assume that the turbine efficiency is 70%. The electricity produced can
be written as follows using Eq. (1):
P ¼ WsZt �h1 � h2s
3413ð3Þ
P is in kilowatts. h1 ¼ 1448Btu=lb and h2s ¼ 1257.7 Btu=lb, from Q 9.01.
Substituting into Eq. (3), we have
P ¼ 50;000� ð1448� 1257:7Þ � 0:70
3413¼ 1954 kW
Now let us calculate the final enthalpy at condition 2, h2. Using the equation
Ztðh1 � h2sÞ ¼ h1 � h2 ð4Þ
we obtain
0:70� ð1448� 1257:7Þ ¼ 1448� h2
FIGURE 9.1 Cogeneration produces power and steam from the same fuel
source by converting the turbine exhaust heat in a boiler, which produces steamfor process.
Copyright © 2003 Marcel Dekker, Inc.
or
h2 ¼ 1315 Btu=lb
This enthalpy is available for process in the cogeneration mode. The energy Q
available in the cogeneration mode is the sum of the electricity produced and the
energy to process, all in Btu=h. Hence the total energy is
Q ¼ 1954� 3413þ 50;000� 1315 ¼ 72:4� 106 Btu=h
Scheme 2. Let us take the case when electricity alone is generated. Let us
calculate the final steam conditions at a pressure of 1 psia. s1 ¼ 1.6121¼ s2s. At
1 psia, from the steam tables, at saturated conditions, sf ¼ 0.1326 and
sg ¼ 1.9782. sf and sg are entropies of saturated liquid and vapor. Since the
entropy s2s is in between sf and sg, the steam at isentropic conditions is wet. Let
us estimate the quality x. From basics,
0:1326ð1� xÞ þ 1:9782x ¼ 1:6121
Hence
x ¼ 0:80
The enthalpy corresponding to this condition is
h ¼ ð1� xÞhf þ xhg
or
h2s ¼ 0:80� 1106þ 0:2� 70 ¼ 900 Btu=lb
(hf and hg are 70 and 1106 at 1 psia.) Using a turbine efficiency of 75%, from
Eq. (3) we have
P ¼ 50;000� ð1448� 900Þ � 0:75
3413¼ 6023 kW
¼ 20:55� 106 Btu=h
Hence we note that there is a lot of difference between the energy patterns of the
two cases, with the cogeneration scheme using much more energy than that used
in Scheme 2.
Even if the steam in Scheme 1 were used for oil heating, the latent heat of
834Btu=lb at 200 psia could be used.
Total output ¼ 1954� 3413þ 50;000� 834
¼ 48:3� 106 Btu=h
This is still more than the output in the case of power generation alone.
Note, however, that if the plant electricity requirement were more than
2000 kW, Scheme 1 should have more steam available, which means that a bigger
boiler should be available. Evaluation of capital investment is necessary before a
Copyright © 2003 Marcel Dekker, Inc.

particular scheme is chosen. However, it is clear that in cogeneration the
utilization of energy is better.
9.03
Q:Which is a better location for tapping steam for deaeration in a cogeneration plant
with an extraction turbine, the HRSG or the steam turbine?
A:When steam is taken for deaeration from the HRSG and not from an extraction
point in a steam turbine, there is a net loss to the system power output because the
steam is throttled and not expanded to the lower deaerator pressure. Throttling is
a mere waste of energy, whereas steam generates power while it expands to a
lower pressure. To illustrate, consider the following example.
Example
An HRSG generates 80,000 lb=h of steam at 620 psig and 650�F from
550,000 lb=h of turbine exhaust gases at 975�F. The steam is expanded in an
extraction-condensing steam turbine. Figure 9.2 shows the two schemes. The
FIGURE 9.2 Options for taking steam for deaeration.
Copyright © 2003 Marcel Dekker, Inc.
condenser operates at 2.5 in.Hg abs. The deaerator is at 10 psig. Blowdown
losses¼ 2%. Neglecting flash steam and vent flow, we can show that when steam
is taken for deaeration from the HRSG,
81;700� 208 ¼ 1700� 28þ ð80;000� X Þ � 76þ 1319X
where 208, 28, 76, and 1319 are enthalpies of feedwater at 240�F, makeup water
at 60�F, condensate at 108�F, and steam at 620 psig, 650�F.The deaeration steam X¼ 8741 lb=h; use 8785 to account for losses. Now
compute the actual steam rate (ASR) in the steam turbine (see Q9.01). It can be
shown that ASR¼ 11.14 lb=kWh at 70% expansion efficiency; hence power
output of the turbine generator¼ 0.96� (80,0007 8785)=11.14¼ 6137 kW,
assuming 4% loss in the generator.
Similarly, when steam is taken at 30 psia from the extraction point in the
steam turbine, the enthalpy of steam for deaeration is 1140.6 Btu=lb. An energy
balance around the deaerator shows
81;700� 208 ¼ 1140:6X þ ð80;000� X Þ � 76þ 1700� 28
Hence X¼ 10,250 lb=h. Then ASR for expansion from 620 psig to
30 psia¼ 19 lb=kWh and 11.14 for the remaining flow. The power output is
P ¼ 0:96� 10;250
19þ 80;000� 10;250
11:14
� �¼ 6528 kW
Thus a significant difference in power output can be seen. However, one has to
review the cost of extraction machine versus the straight condensing type and
associated piping, valves, etc.
9.04
Q:A fan develops an 18 in. WC static head when the flow is 18,000 acfm and static
efficiency of the fan is 75%. Determine the brake horsepower required, the
horsepower consumed when the motor has an efficiency of 90%, and the annual
cost of operation if electricity costs 5 cents=kWh and the annual period of
operation is 7500 h.
A:The power required when the flow is q acfm and the head is Hw in. WC is
BHP ¼ qHw
6356Zf
ð5Þ
where Zf is the efficiency of the fan, fraction; in this case, Zf ¼ 0.75.
Copyright © 2003 Marcel Dekker, Inc.
The horsepower consumed is
HP ¼ BHP
Zm
ð6Þ
where Zm is the motor efficiency, fraction. Substituting the data, we have
BHP ¼ 18;000� 18
0:75� 6356¼ 68 hp
and
HP ¼ 68
0:9¼ 76 hp
The annual cost of operation will be
76� 0:74� 0:05� 7500 ¼ $21;261
(0.74 is the conversion factor from hp to kW.)
9.05
Q:A fan develops 18,000 acfm at 18 in. WC when the ambient conditions are 80�Fand the elevation is 1000 ft (case 1). What are the flow and the head developed by
the fan when the temperature is 60�F and the elevation is 5000 ft (case 2)?
A:The head developed by a fan would vary with density as follows:
Hw1
r1¼ Hw2
r2ð7Þ
where r is the density, lb=cu ft, and the subscripts 1 and 2 refer to any two
ambient conditions.
The flow q in acfm developed by a fan would remain the same for different
ambient conditions; however, the flow in lb=h would vary as the density changes.
Let us use Table 9.2 for quick estimation of density as a function of
elevation and temperature. r¼ 0.075=factor from Table 9.2. At 80�F and 1000 ft
elevation,
r1 ¼0:075
1:06¼ 0:0707 lb=cu ft
At 60�F and 5000 ft,
r2 ¼0:075
1:18¼ 0:0636 lb=cu ft
Copyright © 2003 Marcel Dekker, Inc.

TABLE 9.2 Temperature and Elevation Factors
Altitude (ft) and barometric pressure (in.Hg)
0 500 1000 1500 2000 2500 3000 3500 4000 4500 5000 5500 6000Temp. (�F) (29.92) (29.38) (28.86) (28.33) (27.82) (27.31) (26.82) (26.32) (25.84) (25.36) (24.90) (24.43) (23.96)
�40 .79 .81 .82 .84 .85 .87 .88 .90 .92 .93 .95 .97 .990 .87 .88 .90 .92 .93 .95 .97 .99 1.00 1.02 1.04 1.06 1.0840 .94 .96 .98 1.00 1.01 1.03 1.05 1.07 1.09 1.11 1.13 1.16 1.1870 1.00 1.02 1.04 1.06 1.08 1.10 1.12 1.14 1.16 1.18 1.20 1.22 1.2580 1.02 1.04 1.06 1.08 1.10 1.12 1.14 1.16 1.18 1.20 1.22 1.25 1.27100 1.06 1.08 1.10 1.12 1.14 1.16 1.18 1.20 1.22 1.25 1.27 1.29 1.32120 1.09 1.11 1.13 1.16 1.18 1.20 1.22 1.24 1.27 1.29 1.31 1.34 1.37140 1.13 1.15 1.17 1.20 1.22 1.24 1.26 1.29 1.31 1.34 1.36 1.39 1.41160 1.17 1.19 1.21 1.24 1.26 1.28 1.31 1.33 1.35 1.38 1.41 1.43 1.46180 1.21 1.23 1.25 1.28 1.30 1.32 1.35 1.37 1.40 1.42 1.45 1.48 1.51200 1.25 1.27 1.29 1.32 1.34 1.36 1.39 1.42 1.44 1.47 1.50 1.53 1.55250 1.34 1.36 1.39 1.41 1.44 1.47 1.49 1.52 1.55 1.58 1.61 1.64 1.67300 1.43 1.46 1.49 1.51 1.54 1.57 1.60 1.63 1.66 1.69 1.72 1.76 1.79350 1.53 1.56 1.58 1.61 1.64 1.67 1.70 1.74 1.77 1.80 1.84 1.87 1.91400 1.62 1.65 1.68 1.71 1.75 1.78 1.81 1.84 1.88 1.91 1.95 1.99 2.02450 1.72 1.75 1.78 1.81 1.85 1.88 1.92 1.95 1.99 2.03 2.06 2.10 2.14500 1.81 1.84 1.88 1.91 1.95 1.98 2.02 2.06 2.10 2.14 2.18 2.22 2.26550 1.91 1.94 1.98 2.01 2.05 2.09 2.13 2.17 2.21 2.25 2.29 2.33 2.38600 2.00 2.04 2.07 2.11 2.15 2.19 2.23 2.27 2.32 2.36 2.40 2.45 2.50650 2.09 2.13 2.17 2.21 2.25 2.29 2.34 2.38 2.43 2.47 2.52 2.56 2.61700 2.19 2.23 2.27 2.31 2.35 2.40 2.44 2.49 2.53 2.58 2.63 2.68 2.73750 2.28 2.32 2.37 2.41 2.46 2.50 2.55 2.60 2.64 2.69 2.74 2.80 2.85800 2.38 2.42 2.46 2.51 2.56 2.60 2.65 2.70 2.75 2.80 2.86 2.91 2.97850 2.47 2.52 2.56 2.61 2.66 2.71 2.76 2.81 2.86 2.92 2.97 3.03 3.08900 2.57 2.61 2.66 2.71 2.76 2.81 2.86 2.92 2.97 3.03 3.08 3.14 3.20950 2.66 2.71 2.76 2.81 2.86 2.91 2.97 3.02 3.08 3.14 3.20 3.26 3.321000 2.76 2.81 2.86 2.91 2.96 3.02 3.07 3.13 3.19 3.25 3.31 3.37 3.44
Copyright © 2003 Marcel Dekker, Inc.

Substitution into Eq. (7) yields
18
0:0707¼ Hw2
0:0636
Hw2 ¼ 16:1 in. WC
In case 1 flow will be
18;000� 0:0707� 60 ¼ 76;356 lb=h
and in case 2 the flow will be
18;000� 0:0636� 60 ¼ 68;638 lb=h
The exact operating point of the fan can be obtained after plotting the new
Hw versus q characteristic and noting the point of intersection of the new curve
with the system resistance curve.
9.06a
Q:Why should the capacity of forced draft fans for boilers be reviewed at the lowest
density condition?
A:For the same heat input to boilers, the air quantity required in mass flow units
(lb=h) remains the same irrespective of the ambient conditions.
W ¼ 60rq
where
W ¼ mass flow; lb=h
r ¼ density; lb=cu ft
q ¼ volumetric flow; acfm
Fans discharge constant volumetric flow at any density. Hence if the fan is sized
to give a particular volumetric flow at the high density condition, the mass flow
would decrease when density decreases as can be seen in the equation above.
Hence the fan must be sized to deliver the volumetric flow at the lowest density
condition, in which case the output in lb=h will be higher at the higher density
condition, which can be then controlled.
Also, the gas pressure drop DP in in. WC across the wind-box is
proportional to W 2=r. If the air density decreases as at high temperature
conditions, the pressure drop increases, because W remains unchanged for a
given heat input. Considering the fact that H=r is a constant for a given fan,
Copyright © 2003 Marcel Dekker, Inc.
where H is the static head in in. WC, using the lowest r ensures that the head
available at higher density will be larger.
9.06b
Q:How does the horsepower of a forced draft fan for boilers or heaters change with
density?
A:Equation (5) gives the fan horsepower:
BHP ¼ qHw
6356Zf
Using the relation W ¼ 60qr, we can rewrite the above as
BHP ¼ WHw
381;360 rZf
For a boiler at a given duty, the air flow in lb=h and the head in in. WC, Hw,
remain unchanged; hence as the density decreases, the horsepower increases. This
is yet another reason to check the fan power at the lowest density condition.
However, if the application involves an uncontrolled fan that delivers a given
volume of air at all densities, then the horsepower should be evaluated at the
highest density case because the mass flow would be higher as well as the gas
pressure drop.
9.07
Q:A triplex reciprocating pump is used for pumping 40 gpm (gallons per minute) of
water at 100�F. The suction pressure is 4 psig and the discharge pressure is
1000 psig. Determine the BHP required.
A:Use the expression
BHP ¼ q� DP1715Zp
ð8Þ
Copyright © 2003 Marcel Dekker, Inc.

where
q ¼ flow; gpm
DP ¼ differential pressure; psi
Zp ¼ pump efficiency; fraction
In the absence of data on pumps, use 0.9 for triplex and 0.92 for quintuplex
pumps.
BHP ¼ 40� 1000� 4
1715� 0:90¼ 25:8 hp
A 30 hp motor can be used.
The same expression can be used for centrifugal pumps. The efficiency can
be obtained from the pump characteristic curve at the desired operating point.
9.08
Q:A pump is required to develop 230 gpm of water at 60�F at a head of 970 ft. Its
efficiency is 70%. There are two options for the drive: an electric motor with an
efficiency of 90% or a steam turbine drive with a mechanical efficiency of 95%.
Assume that the exhaust is used for process and not wasted.
If electricity costs 50mills=kWh, steam for the turbine is generated in a
boiler with an efficiency of 85% (HHV basis), and fuel costs $3=MM Btu (HHV
basis), determine the annual cost of operation of each drive if the plant operates
for 6000 h=year.
A:Another form of Eq. (8) is
BHP ¼ W � H
1;980;000Zp
ð9Þ
where
W ¼ flow; lb=h
H ¼ head developed by the pump; ft of liquid
For relating head in ft with differential pressure in psi or flow in lb=h with gpm,
refer to Q5.01. Substituting into Eq. (9) and assuming that s¼ 1, W¼ 230
� 500 lb=h,
BHP ¼ 230� 500� 970
0:70� 1;980;000¼ 81 hp
Copyright © 2003 Marcel Dekker, Inc.
The annual cost of operation with an electric motor drive will be
81� 0:746� 0:05� 6000
0:90¼ $20;142
(0.746 is the conversion factor from hp to kW.)
If steam is used, the annual cost of operation will be
81� 2545� 6000� 3
0:85� 0:90� 106¼ $4595
(2545Btu=h¼ 1 hp; 0.85 is the boiler efficiency; 0.95 is the mechanical effi-
ciency.) Hence the savings in cost of operation is 20,1427 4545¼$15,547=year.
Depending on the difference in investment between the two drives, payback
can be worked out. In the calculation above it was assumed that the backpressure
steam was used for process. If it was wasted, the economics may not work out the
same way.
9.09a
Q:How does the specific gravity or density of liquid pumped affect the BHP, flow,
and head developed?
A:A pump always delivers the same flow in gpm (assuming that viscosity effects can
be neglected) and head in feet of liquid at any temperature. However, due to
changes in density, the flow in lb=h, pressure in psi, and BHP would change. A
variation of Eq. (9) is
BHP ¼ q DP1715Zp
¼ W DP857;000Zps
ð10Þ
where
q ¼ liquid flow; gpm
W ¼ liquid flow; lb=h
s ¼ specific gravity
DP ¼ pressure developed; psi
H ¼ head developed; ft of liquid
Also,
H ¼ 2:31DPs
ð11Þ
Copyright © 2003 Marcel Dekker, Inc.

Example
If a pump can develop 1000 gpm of water at 40�F through 1000 ft, what flow and
head can it develop when the water is at 120�F? Assume that pump efficiency is
75% in both cases.
Solution. s1 at 40�F is 1 (from the steam tables; see the Appendix). s2 at
120�F is 0.988.
DP1 ¼ 1000� 1
2:31¼ 433 psi
From Eq. (11),
BHP1 ¼ 1000� 433
0:75� 1715¼ 337 hp
W1 ¼ 500q1s1 ¼ 500� 1000� 1 ¼ 500;000 lb=h
At 120�F,
DP2 ¼ 1000� 0:988
2:31¼ 427 psi
BHP2 ¼ 1000� 427
0:75� 1715¼ 332 hp
W2 ¼ 500� 0:988� 1000 ¼ 494;000 lb=h
If the same W is to be maintained, BHP must increase.
9.09b
Q:How does the temperature of water affect pump power consumption?
A:The answer can be obtained by analyzing the following equations for pump power
consumption. One is based on flow in gpm and the other in lb=h.
BHP ¼ QHs
3960Zp
ð12Þ
where
Q ¼ flow; gpm
H ¼ head; ft of water
s ¼ specific gravity
Zp ¼ efficiency
Copyright © 2003 Marcel Dekker, Inc.
In boilers, one would like to maintain a constant flow in lb=h, not in gpm, and at a
particular pressure in psi. The relationships are
Q ¼ W
500sand H ¼ 2:31� DP
s
where
W ¼ flow; lb=h
DP ¼ pump differential; psi
Substituting these terms into (1), we have
BHP ¼ WDP
857;000Zpsð13Þ
As s decreases with temperature, BHP will increase if we want to maintain the
flow in lb=h and head or pressure in psi. However, if the flow in gpm and head in
ft should be maintained, then the BHP will decrease with a decrease in s, which in
turn is lower at lower temperatures.
A similar analogy can be drawn with fans in boiler plants, which require a
certain amount of air in lb=h for combustion and a particular head in in. WC.
9.10
Q:A centrifugal pump delivers 100 gpm at 155 ft of water with a 60Hz supply. If the
electric supply is changed to 50Hz, how will the pump perform?
A:For variations in speed or impeller size, the following equation applies:
q1
q2¼ N1
N2
¼ffiffiffiffiffiffiH1
pffiffiffiffiffiffiH2
p ð14Þ
where
q ¼ pump flow; gpm
H ¼ head developed; ft
N ¼ speed; rpm
Use of Eq. (14) gives us the head and the flow characteristics of a pump at
different speeds. However, to get the actual operating point, one must plot the
Copyright © 2003 Marcel Dekker, Inc.
new head versus flow curve and note the point of intersection of this curve with
the system resistance curve. In the case above,
q2 ¼ 100� 50
60¼ 83 gpm
H2 ¼ 155� 50
60
� �2
¼ 107 ft
In this fashion, the new H versus q curve can be obtained. The new operating
point can then be found.
9.11
Q:How does the performance of a pump change with the viscosity of the fluids
pumped?
A:The Hydraulic Institute has published charts that give correction factors for head,
flow, and efficiency for viscous fluids when the performance with water is known
(see Figs. 9.3a and 9.3b).
Example
A pump delivers 750 gpm at 100 ft head when water is pumped. What is the
performance when it pumps oil with viscosity 1000 SSU? Assume that efficiency
with water is 82%.
Solution. In Fig. 9.3b, go up from capacity 750 gpm to cut the head line at
100 ft and move horizontally to cut viscosity at 1000 SSU; move up to cut the
various correction factors.
CQ ¼ 0:94; CH ¼ 0:92; CE ¼ 0:64
Hence the new data are
q ¼ 0:94� 750 ¼ 705 gpm
H ¼ 0:92� 100 ¼ 92 ft
Zp ¼ 0:64� 92 ¼ 52%
The new H versus q data can be plotted for various flows to obtain the
characteristic curve. The operating point can be obtained by noting the point of
intersection of the system resistance curve with the H versus q curve. CQ, CH ,
and CE are correction factors for flow, head, and efficiency.
Copyright © 2003 Marcel Dekker, Inc.

FIGURE 9.3a Viscosity corrections. (Courtesy of Hydraulic Institute=Gould PumpManual.)
Copyright © 2003 Marcel Dekker, Inc.

FIGURE 9.3b Determination of pump performance when handling viscousliquids. (Courtesy of Hydraulic Institute=Gould Pump Manual.)
Copyright © 2003 Marcel Dekker, Inc.

9.12
Q:What is the temperature rise of water when a pump delivers 100 gpm at 1000 ft at
an efficiency of 60%?
A:The temperature rise of fluids through the pump is an important factor in pump
maintenance and performance considerations and must be limited. The recircula-
tion valve is used to ensure that the desired flow goes through the pump at low
load conditions of the plant, thus cooling it.
From energy balance, the friction losses are equated to the energy absorbed
by the fluid.
DT ¼ ðBHP � theoretical powerÞ � 2545
WCp
ð15aÞ
where
DT ¼ temperature rise of the fluid; � FBHP ¼ brake horsepower
W ¼ flow of the fluid; lb=h
Cp ¼ specific heat of the fluid; Btu=lb �F
For water, Cp ¼ 1.
From Eq. (9),
BHP ¼ W � H
Zp � 3600� 550
where Zr is the pump efficiency, fraction. Substituting into Eqs. (15a) and (9) and
simplifying, we have
DT ¼ H � 1=Zp � 1
778ð15bÞ
If H ¼ 100 ft of water and Zr ¼ 0.6, then
DT ¼ 1000� 1:66� 1
778 1�F
9.13
Q:How is the minimum recirculation flow through a centrifugal pump determined?
Copyright © 2003 Marcel Dekker, Inc.

A:Let us illustrate this with the case of a pump whose characteristics are as shown in
Fig. 9.4. We need to plot the DT versus Q characteristics first. Note that at low
flows when the efficiency is low, we can expect a large temperature rise. At
100 gpm, for example,
Zp ¼ 0:23 and H ¼ 2150 ft
Then
DT ¼ 2150� 1=0:23� 1
778¼ 9�F
In a similar fashion, DT is estimated at various flows. Note that DT is higher at
low flows owing to the low efficiency and also because of the lesser cooling
capacity.
The maximum temperature rise is generally limited to about 20�F, depend-ing on the recommendations of the pump manufacturer. This means that at least
40 gpm must be circulated through the pump in this case. If the load is only
30 gpm, then depending on the recirculation control logic, 10–70 gpm could be
recirculated through the pump.
FIGURE 9.4 Typical characteristic curve of a multistage pump also showingtemperature rise versus capacity.
Copyright © 2003 Marcel Dekker, Inc.

9.14
Q:What is net positive suction head (NPSH), and how is it calculated?
A:The NPSH is the net positive suction head in feet absolute determined at the
pump suction after accounting for suction piping losses (friction) and vapor
pressure. NPSH helps one to check if there is a possibility of cavitation at pump
suction. This is likely when the liquid vaporizes or flashes due to low local
pressure and collapses at the pump as soon as the pressure increases. NPSH
determined from pump layout in this manner is NPSHa (NPSH available). This
will vary depending on pump location as shown in Fig. 9.5.
FIGURE 9.5 Calculation of system NPSH available for typical suction conditions.
Copyright © 2003 Marcel Dekker, Inc.
NPSHr (NPSH required) is the positive head in feet absolute required to
overcome the pressure drop due to fluid flow from the pump suction to the eye of
the impeller and maintain the liquid above its vapor pressure. NPSHr varies with
pump speed and capacity. Pump suppliers generally provide this information.
NPSHa can be determined by a gauge reading at pump suction:
NPSHa ¼ PB � VP� PGþ VH ð16Þ
where
VH ¼ velocity head at the gauge connection; ft
PG ¼ pressure gauge reading; converted to ft
VP ¼ vapor pressure; ft absolute
PB ¼ barometric pressure; ft ðif suction is atmosphericÞ
To avoid cavitation, NPSHa must be greater than NPSHr.
9.15
Q:Does the pump suction pressure change NPSHa?
A:NPSHa is given by
NPSHa ¼ Ps þ H � VP� Hf ð17Þ
where
Ps ¼ suction pressure; ft of liquid
H ¼ head of liquid; ft
VP ¼ vapor pressure of the liquid at operating temperature; ft
Hf ¼ friction loss in the suction line; ft
For saturated liquids, VP Ps, so changes in suction pressure do not
significantly change NPSHa.
Example
Determine the NPSHa for the system shown in Fig. 9.5b when H ¼ 10 ft,
Hf ¼ 3 ft, and VP¼ 0.4 psia (from the steam tables). Assume that the water has
a density of 62 lb=cu ft.
Copyright © 2003 Marcel Dekker, Inc.

Solution.
VP ¼ 0:4� 144
62¼ 0:93 ft
Suction presssure ¼ 14:6 psia ¼ 14:6� 166
62¼ 33:9 ft
NPSHa ¼ 33:9� 3� 0:93þ 10 ¼ 40 ft
9.16
Q:In the absence of information from the pump supplier, can we estimate NPSHr?
A:A good estimate of NPSHr can be made from the expression for specific speed S.
S ¼ N �ffiffiffiq
pNPSH0:75
r
ð18Þ
S ranges from 7000 to 12,000 for water.
For example, when q¼ 100 gpm, N ¼ 1770, and assuming that S¼ 10,000
for water,
NPSHr ¼ 1770�ffiffiffiffiffiffiffiffi100
p
10;000
� �1:33
¼ 2:2 ft
Even if we took a conservative value of 7000 for S, we would get
NPSHr ¼ 3:43 ft
This information can be used in making preliminary layouts for systems
involving pumps.
9.17
Q:How is NPSHa for a reciprocating pump arrived at?
A:NPSHa for a reciprocating pump is calculated in the same way as for a centrifugal
pump except that the acceleration head Ha is included with the friction losses.
This is the head required to accelerate the liquid column on each suction stroke so
Copyright © 2003 Marcel Dekker, Inc.
that there will be no separation of this column in the pump suction line or in the
pump [1]:
Ha ¼LNVC
Kg
ð19Þ
where
L ¼ length of the suction line; ft ðactual length; not developedÞV ¼ velocity in the suction line; ft=s
N ¼ pump speed; rpm
C is a constant: 0.066 for triplex pump, 0.04 for quintuplex, and 0.2 for duplex
pumps. K is a factor: 2.5 for hot oil, 2.0 for most hydrocarbons, 1.5 for water, and
1.4 for deaerated water. g ¼ 32 ft=s2. Pulsation dampeners are used to reduce L
significantly. By proper selection, L can be reduced to nearly zero.
Example
A triplex pump running at 360 rpm and displacing 36 gpm has a 3 in. suction line
8 ft long and a 2 in. line 18 ft long. Estimate the acceleration head required.
Solution. First obtain the velocity of water in each part of the line. In the
3 in. line, which has an inner diameter of 3.068 in.,
V ¼ 0:41q
d2i¼ 0:41� 36
ð3:068Þ2 ¼ 1:57 ft=s
In the 2 in. line, which has an inner diameter of 2.067 in.,
V ¼ 0:41� 36
ð2:067Þ2 ¼ 3:45 ft=s
The acceleration head in the 3 in. line is
Ha ¼ 8� 360� 1:57� 0:066
1:4� 32¼ 6:7 ft
In the 2 in. line,
Ha ¼ 18� 3:45� 360� 0:066
1:4� 32¼ 32:9 ft
The total acceleration head is 32.9 þ 6.7¼ 39.6 ft.
9.18
Q:How can we check the performance of a pump from the motor data?
Copyright © 2003 Marcel Dekker, Inc.

A:A good estimate of the efficiency of a pump or a fan can be obtained from the
current reading if we make a few reasonable assumptions. The efficiency of a
motor is more predictable than that of a pump owing to its small variations with
duty. The pump differential pressure and flow can be obtained rather easily and
accurately. By relating the power consumed by the pump with that delivered by
the motor, the following can be derived. The pump power consumption, P, in kW
from Eq. (8) is
P ¼ 0:00043q� DPZp
ð20Þ
Motor power output ¼ 0:001732EI cosf Zm ð21ÞEquating Eqs. (20) and (21) and simplifying, we have
qDP ¼ 4EI cosf ZpZm ð22Þwhere
q ¼ flow; gpm
DP ¼ differential pressure; psi
E ¼ voltage; V
I ¼ current; A
Zp; Zm ¼ efficiency of pump and motor; fraction
cosf ¼ power factor
From Eq. (22) we can solve for pump efficiency given the other variables.
Alternatively, we can solve for the flow by making a reasonable estimate of Zp
and check whether the flow reading is good. The power factor cosf typically
varies between 0.8 and 0.9, and the motor efficiency between 0.90 and 0.95.
Example
A plant engineer observes that at a 90 gpm flow of water and 1000 psi differential,
the motor current is 100A. Assuming that the voltage is 460V, the power factor is
0.85, and the motor efficiency is 0.90, estimate the pump efficiency.
Solution. Substituting the data into Eq. (22), we obtain
90� 1000 ¼ 4� 460� 100� 0:85� 0:90� Zp
Solving for Zp, we have Zp ¼ 0.65.
We can use this figure to check whether something is wrong with the
system. For instance, if the pump has been operating at this flow for some time
but the current drawn is more, one can infer that the machine needs attention. One
Copyright © 2003 Marcel Dekker, Inc.

can also check the pump efficiency from its characteristic curve and compare the
calculated and predicted efficiencies.
9.19
Q:Derive an expression similar to (22) relating fan and motor.
A:Equating the power consumption of a fan with that delivered by its motor,
P ¼ 1:17� 10�4 � qHw ¼ 0:001732EI cosf Zm ð23Þwhere
q ¼ flow; acfm
Hw ¼ static head of fan; in: WC
Other terms are as in Q9.18.
If the efficiency of a fan is assumed to be 65% when its differential head is
4 in. WC, the motor voltage is 460, and the current is 7A, then the power factor is
0.8 and the motor efficiency is 85%. Solving for q, we have
1:17� 10�4 � q� 4 ¼ 0:001732� 460� 7� 0:80� 0:85� 0:65
or
q ¼ 5267 acfm
One can check from the fan curve whether the flow is reasonable. Alternatively, if
the flow is known, one can check the head from Eq. (23) and compare it with the
measured value. If the measured head is lower, for example, we can infer that
something is wrong with the fan or its drive or that the flow measured is not
correct.
9.20
Q:How is the performance of pumps in series and in parallel evaluated?
A:For parallel operation of two or more pumps, the combined performance curve
(H versus q) is obtained by adding horizontally the capacities of the same heads.
For series operation, the combined performance curve is obtained by adding
vertically the heads at the same capacities.
Copyright © 2003 Marcel Dekker, Inc.

The operating point is the intersection of the combined performance curve
with the system resistance curve. Figure 9.6 explains this. Head and flow are
shown as percentages [2]. ABC is the H versus q curve for a single pump, DEF is
the H versus q curve for two such pumps in series, and AGH is the H versus q
curve for two such pumps in parallel. To obtain the curve DEF, we add the heads
at a given flow. For example, at q¼ 100%, H with one pump is 100%, and with
two pumps H will be 200%. Similarly, AGH is obtained by adding flows at a
given head. At H ¼ 100, q for two pumps will be 200%.
Let the system resistance curve be KBGE. When one pump alone operates,
the operating point is B. With two pumps in series, E is the operating point. With
two pumps in parallel, G is the operating point.
BHP curves also have been plotted and reveal that with series operation
BHP¼ 250% and with pumps in parallel BHP¼ 164%, indicating that BHP=q is
larger in series operation than in parallel. This varies with pump and system
resistance characteristics. NPSHr also increases with pump capacity.
Note that if the full capacity of the plant were handled by two pumps in
parallel and one tripped, the operating BHP would not be 50% of that with two
pumps, but more, depending on the nature of the H versus q curve and the system
resistance curve. In the case above, with KBGE as the system resistance, G is the
operating point with two pumps, and if one trips B would be the operating point.
FIGURE 9.6 Series and parallel operations of pumps with flat head capacitycurves. (From Ref. 2.)
Copyright © 2003 Marcel Dekker, Inc.

BHP at G is 142%, whereas at B it is 100% (see the inset of Fig. 9.6). Hence in
sizing drives for pumps in parallel, this fact must be taken into account. It is a
good idea to check on whether the pump has an adequately sized drive.
A similar procedure can be adopted for determining the performance of
fans in series and in parallel and for sizing drives.
9.21
Q:Determine the parameters affecting the efficiency of the Brayton cycle [3].
A:Figure 9.7a shows a simple reversible Brayton cycle used in gas turbine plants.
Air is taken at a temperature T1 absolute and compressed, and the temperature
after compression is T2. Heat is added in the combustor, raising the gas
temperature to T3; the hot gases expand to T4 in the turbine, performing work.
Following are some of the terms used to describe the performance.
Thermal efficiency TE ¼ Qa � Qr
Qa
ð24Þ
FIGURE 9.7 (a) Simple and (b) regenerative Brayton cycle.
Copyright © 2003 Marcel Dekker, Inc.
where
Qa ¼ heat added to cycle; Btu=lb
Qr ¼ heat rejected; Btu=lb
Qa ¼ CpðT3 � T2Þ ð25Þ
Qr ¼ CpðT4 � T1Þ ð26Þ
P2 ¼ P3 and P1 ¼ P4 ð27ÞAlso,
T2
T1¼ T3
T4¼ rðk�1Þ=k ð28Þ
where
r ¼ pressure ratio ¼ P2
P1
¼ P3
P4
ð29Þ
k ¼ ratio of gas specific heats
Cp ¼ gas specific heat; Btu=lb
T1 � T4 ¼ temperatures; � RP1 � P4 ¼ pressure; psia
Using the above, we can write
TE ¼ 1� Qr
Qa
¼ 1� T4 � T1
T3 � T2
¼ 1� T1
T2� T4=T1 � 1
T3=T2 � 1ð30aÞ
Since, from Eq. (28), T4=T1 ¼ T3=T2, we have
TE ¼ 1� T1
T2¼ 1� 1=rðk�1Þ=k ð30bÞ
Example
A simple cycle takes in air at 80�F and 14.7 psia and compresses it at constant
entropy through a pressure ratio of 4. The combustor raises the gas temperature to
1500�F. The heated air expands to 14.7 psia at constant entropy in the turbine.
Assume k¼ 1.3 and Cp ¼ 0.28. Find (1) compression work, Wc; (2) heat input to
cycle, Qa; (3) expansion work, Qe; (4) thermal efficiency, TE.
Copyright © 2003 Marcel Dekker, Inc.
Solution. From Eq. (28),
T2 ¼ ð80þ 460Þ � 4ð1:3�1Þ=1:3 ¼ 742�R
Note that 4ð1:3�1Þ=1:3 ¼ 1.375. Hence
Wc ¼ Cp � ðT2 � T1Þ ¼ 0:28� ð742� 540Þ¼ 56:6 Btu=lb
Heat input to cycle ¼ Qa
¼ Cp � ðT3 � T2Þ¼ 0:28� ð1500þ 460� 742Þ¼ 341 Btu=lb
T4 ¼T3
1:375¼ 1960
1:375¼ 1425�R
Expansion work Qe ¼ 0:28� ð1960� 1425Þ ¼ 150Btu=lb
TE ¼ 150� 56:6
341¼ 0:273; or 27:3%
Using Eq. (30b), TE¼ 1 7 1=1.375¼ 0.273.
It can be seen that as the pressure ratio increases, TE increases. Also, as
inlet air temperature decreases, the efficiency increases. That is why some gas
turbine suppliers install chillers or air coolers at the compressor inlet so that
during summer months the turbine output does not fall off compared to the winter
months.
9.22
Q:How can the efficiency of a simple Brayton cycle be improved?
A:One of the ways of improving the cycle efficiency is to use the energy in the
exhaust gases (Fig. 9.7b) to preheat the air entering the combustor. This is called
regeneration.
Assuming 100% regeneration, the exhaust gas at temperature T4 preheats
air from T2 to T5 while cooling it to T6. The actual heat rejected corresponds to a
temperature drop of T6 � T1, while the heat added corresponds to T3 � T5, and
hence the cycle is more efficient. Assuming constant Cp,
TE ¼ 1� Qr
Qa
¼ 1� T6 � T1
T3 � T5
Copyright © 2003 Marcel Dekker, Inc.

Now P2 ¼ P5 ¼ P3 and P4 ¼ P6 ¼ P1. Also,
T2
T1¼ T6
T1¼ rðk�1Þ=k ¼ T3
T4¼ T3
T5
TE ¼ 1� T1T6=T1 � 1
T5ðT3=T5 � 1Þ¼ 1� T1
T5ðT6=T1 ¼ T3=T5; from aboveÞ
T1
T5¼ T1
T3� T3
T5¼ T1
T3� rðk�1Þ=k
Hence
TE ¼ 1� T1
T3� rðk�1Þ=k ð31Þ
Example
Using the same data as above, compute the following for the ideal regenerative
cycle: (1) Work of compression, Wc; (2) heat added to cycle; (3) heat added to
regenerator; (4) expansion work in turbine; (5) cycle efficiency.
Solution. For the same inlet temperature and pressure ratio, Wc ¼ 56.6
and T2 ¼ 742�R. Exhaust temperature from above¼ 1425�R¼ T5.
Heat added in regenerator ¼ Cp � ðT5 � T2Þ¼ 0:28
� ð1425� 742Þ ¼ 191:3 Btu=lb
Heat added in combustor ¼ Qa ¼ Cp � ðT3 � T5Þ¼ 0:28� ð1960� 1425Þ¼ 150 Btu=lb
Heat rejected ¼ Qr ¼ Cp � ðT6 � T1Þ¼ 0:28� ð742� 540Þ ¼ 56:6 Btu=lb
TE ¼ 1� Qr
Qa
¼ 1� 56:6
150¼ 0:622; or 62:2%
Using (31)
TE ¼ 1� 540
1960� 4ð1:3�1Þ=1:3 ¼ 0:621; or 62:1%
It is interesting to note that as the pressure ratio increases, the efficiency
decreases. As the combustor temperature increases, the efficiency increases.
However, it can be shown that the power output increases with increases in the
Copyright © 2003 Marcel Dekker, Inc.

pressure ratio. Hence industrial gas turbines operate at a pressure ratio between 9
and 18 and an inlet gas temperature of 1800–2200�F.
NOMENCLATURE
ASR Actual steam rate, lb=kWh
BHP Brake horsepower, hp
CQ;CH ;CE Factors correcting viscosity effects for flow, head, and efficiency
Cp Specific heat, Btu=lb �Fd Tube or pipe diameter, in.; subscript i stands for inner diameter
E Voltage
h Enthalpy, Btu=lb; subscripts f and g stand for saturated liquid and
vapor
H Head developed by pump, ft; subscript a stands for acceleration
HP Horsepower
Hw Head developed by fan, in. WC
I Current, A
k Ratio of gas specific heats, Cp=Cv
L Length, ft
N Speed of pump or fan, rpm
NPSH Net positive suction head, ft; subscripts a and r stand for available
and required
P Power, kW
DP Differential pressure, psi
q Flow, gpm or acfm
Qa;Qr Heat added, rejected, Btu=lbr Pressure ratio
s Specific gravity
sf ; sg Entropy of saturated liquid and vapor, Btu=lb �RS Specific speed
DT Temperature rise, �FTE Thermal efficiency
T Temperature, �RTSR Theoretical steam rate, lb=kWh
V Velocity, ft=sW Flow, lb=hWc Work of compression, Btu=lbZ Efficiency, fraction; subscripts f;m; p, and t stand for fan, motor,
pump, and turbine
r Density, lb=cu ft
Copyright © 2003 Marcel Dekker, Inc.

REFERENCES
1. Cameron Hydraulic Data. 16th ed. Woodcliff Lake, NJ: Ingersoll Rand, 1981, p 5.1.
2. I Karassik. Centrifugal Pump Clinic. New York: Marcel Dekker, 1981, p 102.
3. Power Magazine, Power Handbook. New York: McGraw-Hill, 1983.
4. RH Perry, CH Chilton. Chemical Engineers Handbook. 5th ed. New York: McGraw-
Hill, 1974.
Copyright © 2003 Marcel Dekker, Inc.

Appendix 1
A Quiz on Boilers and HRSGs
[The answers to all of these questions can be found in the book. However,
email me for the list of answers or clarifications if required. My email is:
1. If boiler efficiency for a typical natural gas fired boiler is 83% on higher
heating value basis, what is it approximately on lower heating value basis?
a. 73% b. 83% c. 92%
2. If NOx in a natural gas fired boiler is 50 ppmv (3% oxygen dry), what is it
in lb=MM Btu (HHV) basis?
a. 0.06 b. 0.10 c. 0.20
3. 1 in. WC of additional gas pressure drop in a 100,000 lb=h packaged boiler
is worth about how many kW of fan power consumption?
a. 5 b. 20 c. 50
4. If boiler water concentration in a boiler drum is 1000 ppm and steam purity
is 1 ppm, what is the percent steam quality?
a. 99.9 b. 99 c. 99.99
5. Boilers of the same capacity are located at different sites, whose ambient
conditions and elevation are as follows. Which case requires the biggest
fan?
a. 80�F and sea level b. 100�F and 3000 ft c. 10�F and 7000 ft
Copyright © 2003 Marcel Dekker, Inc.

6. In a boiler plant if the conductivity of the condensate, makeup, and
feedwater are 800, 40, and 150 mmho=cm, respectively, what is the percent
condensate returns in the feedwater?
a. 5 b. 50 c. 15
7. A 20�F change in exit gas temperature of an oil-fired boiler changes boiler
efficiency by approximately what percent?
a. 1 b. 0.5 c. 2.0
8. Approximate air flow (acfm) required in a packaged boiler firing 100MM
Btu=h (HHV) of natural gas is:
a. 19,000 b. 30,000 c.12,000
9. The steam pressure drop in a boiler superheater is 50 psi when generating
600 psig, 650�F steam. What is it likely to be at 400 psig, 600�F with the
same flow?
a. 70 b. 30 c. 50
10. Which is the worst case scenario for an economizer from the viewpoint of
sulfuric acid condensation? Assume that the oil-fired boiler flue gas
contains 12% water vapor and 0.03% SO2.
a. Flue gas at 680�F and feedwater at 200�F b. Flue gas at 320�F and
feedwater at 275�F.11. If vol% of oxygen (dry) in a natural gas fired boiler is 2.0%, what is the
excess air used?
a. 15 b. 5 c. 10
12. If boiler casing heat loss is 0.2% at 100% load, what is it at 25% load,
assuming that wind velocity and ambient temperature are unchanged?
a. 1.0 b. 2.0 c. 0.8
13. Plant management decides to change the tube inner diameter of an existing
superheater from 1.7 in. to 1.5 in. The steam-side pressure drop for the same
steam conditions will go up by what percent?
a. 87 b. 65 c. 29
14. The heat transfer coefficient in a finned tube bundle is higher than in a bare
tube exchanger for the same gas velocity, temperature, tube size, and
geometry.
a. True b. False
15. In a fire tube waste heat boiler, a small diameter tube has a higher tube side
heat transfer coefficient and higher heat flux than a larger tube for the same
gas velocity.
a. True b. False
16. Superheated steam temperature from a boiler firing oil will be higher than
when firing natural gas at the same steam generation rate (assuming steam
temperature is uncontrolled).
a. True b. False
17. More flue gas is generated in a boiler while firing oil than while firing
Copyright © 2003 Marcel Dekker, Inc.
natural gas at the same excess air and steam generation.
a. True b. False
18. The maximum possible fuel (natural gas=distillate oil) that can be fired in anHRSG with exhaust gas flow¼ 200,000 lb=h and 14% oxygen wet in MM
Btu=h (LHV) is:
a. 100 b. 150 c. 50
19. Surface area gives a good indication of whether a boiler or HRSG design is
adequate or not.
a. True b. False
20. An uncooled soot blower lance is located in a boiler convection bank at
1700�F gas temperature. Its temperature will be:
a. > 1700�F b. 1700�F c. < 1700�F21. (a) A fire tube waste heat boiler using small diameter tubes will be longer
than the design using larger diameter tubes for the same duty and gas
pressure drop.
a. True b. False
(b) A fire tube waste heat boiler using small diameter tubes requires less
surface area than the design using larger diameter tubes for the same
duty and gas pressure drop.
a. True b. False
22. For the same mass flow and gas temperature drop, a flue gas containing
16% water vapor will transfer more energy than a gas stream having 5%
water vapor.
a. True b. False
23. Design of tubular air heaters in steam generators can be improved if finned
tubes are used instead of plain tubes.
a. True b. False c. Depends on fuel used
24. In a crossflow heat transfer situation, an in-line arrangement of plain tubes
is better than a staggered one.
a. True b. False
25. For the same casing insulation thickness and ambient conditions, alumi-
nium casing will run hotter than carbon steel.
a. True b. False
26. If additional steam is required in a cogeneration plant, supplementary firing
the HRSG rather than using a packaged boiler will be more prudent.
a. True b. False
27. Required thickness of a boiler tube subjected to external pressure will be
less than when the same tube is subjected to the same internal pressure at
the same temperature.
a. True b. False
28. Which is a better choice for fin density for a superheater in a HRSG?
a. 5 fins=in. b. 2 fins=in.
Copyright © 2003 Marcel Dekker, Inc.
29. The exit gas temperature in a single-pressure unfired HRSG generating
steam at 600 psig, 700�F can be less than 300�F. (Assume exhaust gas at
950�F and feedwater at 230�F.)a. True b. False
30. A boiler designed for 1000 psig, 800�F steam can be operated at the same
steam flow at 300 psig without modifications.
a. True b. False
31. A gas turbine HRSG economizer is likely to steam at which ambient
temperature in unfired mode?
a. 40�F b. 90�F32. More energy can be transferred to a boiler evaporator if the circulation ratio
is higher.
a. True b. False
33. Heat flux will be higher in a packaged boiler furnace for which fuel?
Assume same steam generation.
a. Fuel oil b. Natural gas
34. For the same excess air and exit gas temperature, an oil-fired boiler will
have a higher efficiency on HHV basis than a gas-fired boiler.
a. True b. False
35. For the same mass flow per tube and length of tube, superheated steam at
600 psig, 800�F will have a higher pressure drop than 150 psig saturated
steam.
a. True b. False
36. Gas-side fouling increases the tube wall temperature in a waste heat boiler.
a. True b. False c. Depends on whether it is a fire tube or water tube boiler
37. The feed pump requires more power to generate a given amount of steam at
a given pressure and temperature in a once-through HRSG than in a natural
circulation HRSG.
a. True b. False
38. The volumetric heat release rate is more important in a gas-fired packaged
boiler than the area heat release rate.
a. True b. False
39. Large margins on flow and head should not generally be used while
selecting the fan for a packaged boiler.
a. True b. False
40. If an economizer with counterflow arrangement is experiencing low
temperature corrosion problems, then re-piping it with a parallel flow
arrangement can fix the problem.
a. True b. False
41. Exit gas temperature from a single-pressure HRSG having a superheater,
evaporator, and economizer increases as steam generation increases.
a. True b. False
Copyright © 2003 Marcel Dekker, Inc.

42. It is better to preheat condensate or feedwater using extraction steam from
the steam turbine rather than use the energy in the HRSG exhaust gases.
a. True b. False
43. Steam for deaeration should preferably be taken from the boiler outlet rather
than from an extraction point in the steam turbine.
a. True b. False
44. The maldistribution of steam flow through superheater tubes will be the
worst at a boiler load of:
a. 20% b. 50% c. 100%
45. Which fuel generates the maximum amount of carbon dioxide per MM Btu
fired?
a. Oil b. Natural gas c. Coal
46. Is it possible to predict the off-design performance of an HRSG without
knowing its mechanical constructional features?
a. Yes b. No
47. Can we have more surface area in an HRSG and yet transfer less duty?
a. Yes b. No
48. Can we use finned tubes for the evaporator or superheater of a gas-fired
packaged boiler?
a. Yes b. No
49. What happens to the pinch and approach points of the evaporator in an
HRSG as we increase the supplementary firing rate?
a. Both increase b. Both decrease c. Pinch point increases while
approach point decreases d. They are unchanged
50. In a packaged boiler, the furnace performance and circulation are more
critical in oil firing than in gas firing.
a. True b. False
51. Can a superheater be located between the evaporator and economizer in a
packaged boiler?
a. Yes b. No
52. Good steam-separating devices cannot prevent carryover of silica from
boiler water into steam at high pressures.
a. True b. False
53. Superheated steam for use in turbines should have better steam purity than
saturated steam.
a. True b. False
54. Feedwater used for attemperation in a desuperheater for steam temperature
control should preferably have low to zero solids.
a. True b. False
55. Tube-side heat flux will be higher in a plain tube evaporator than in a finned
tube evaporator for the same gas- and steam-side conditions.
a. True b. False
Copyright © 2003 Marcel Dekker, Inc.

56. In a waste heat boiler containing hydrogen chloride gas, a low steam
temperature (say 700�F vs 850�F) is preferred.a. True b. False
57. A higher steam pressure requires a higher steam temperature to minimize
wetness in steam after expansion in a steam turbine.
a. True b. False
58. An ammonia–water mixture has a varying boiling point and hence is a
better fluid for energy recovery from waste flue gases than steam.
a. True b. False
59. The cross section of a 100,000 lb=h packaged boiler will be much smaller
than that of an unfired gas turbine HRSG generating the same amount of
steam.
a. True b. False
60. Gas conditions being the same, as steam pressure increases, the steam
generation in an unfired HRSG:
a. increases b. decreases c. is unchanged
61. The cross section of a forced circulation HRSG and its surface area will be
much different from a natural circulation HRSG for the same duty and
pressure drop.
a. True b. False c. Can’t say
62. A fire tube waste heat boiler generally responds faster to load changes than
an equivalent water tube design.
a. True b. False
63. The amount of deaeration steam is impacted by the conductivity of boiler
feedwater.
a. True b. False
64. In a boiler or HRSG evaporator, the allowable steam quality to avoid DNB
conditions decreases as the heat flux increases.
a. True b. False
65. A natural circulation HRSG using vertical evaporator tubes can handle
higher heat flux than a forced circulation or once-through unit using
horizontal tubes.
a. True b. False
66. A gas turbine plant has two options: a supplementary-fired HRSG and an
unfired HRSG. The cross section of the supplementary-fired HRSG
generating twice the amount of steam as the unfired HRSG should be
much larger.
a. True b. False
Think About It!
1. Why is multiple pressure steam generation often required in HRSGs but not
in a packaged boiler?
Copyright © 2003 Marcel Dekker, Inc.

2. Explain how surface areas can be different in steam generators (or HRSGs)
and yet the duty transferred is the same.
3. Why is supplementary firing very efficient in HRSGs?
4. Why is an economizer preferred to an air heater in oil- and gas-fired
packaged boilers? Give at least two reasons.
5. Why is steaming in the economizer often a concern in HRSGs and not in
packaged boilers?
6. Why can we achieve a low exit gas temperature in a packaged boiler at any
steam pressure, whereas it is difficult in a single-pressure unfired HRSG?
7. Why is the superheated steam temperature generally lower with oil firing
than with gas firing in a packaged boiler?
8. Why is a low fin density, say 2 fins=in., preferred in a HRSG superheater
over, say, 5 fins=in.?9. Why does raising the gas temperature at the economizer alone not help
minimize low temperature corrosion problems?
10. Compute typical operating costs of fuel and electricity for various boilers
and HRSGs in your plant and suggest how to lower these costs.
11. Is a supplementary-fired HRSG a better choice than an unfired HRSG in a
combined cycle plant?
12. Why do we not worry about pinch and approach points in a packaged boiler,
whereas they are very important in an HRSG?
13. What are the advantages of a convective superheater in a packaged boiler
over a radiant design?
14. What are the various factors to be considered while modifying an existing
packaged boiler to meet lower emissions of NOx and CO?
15. In a packaged boiler, why is interstage attemperation for steam temperature
control generally preferred to attemperation at the superheater exit?
16. A single-pressure unfired HRSG generates 600 psig steam at 750�F using
230�F feedwater with an exit gas temperature of 380�F. To lower the exit
gas temperature, is it more prudent to add a condensate heater rather than
increase the surface area of the evaporator significantly?
17. Explain why rules of thumb relating surface areas with steam generation
can be misleading.
18. An economizer has been removed from a packaged boiler for maintenance.
Can the plant generate the same amount of steam as before? What are the
concerns?
Copyright © 2003 Marcel Dekker, Inc.

Appendix 2
Conversion Factors
Copyright © 2003 Marcel Dekker, Inc.

Copyright © 2003 Marcel Dekker, Inc.

Copyright © 2003 Marcel Dekker, Inc.

Copyright © 2003 Marcel Dekker, Inc.

Copyright © 2003 Marcel Dekker, Inc.

Appendix 3
Tables
TABLE A1 Thermodynamic Properties of Dry Saturated Steam—Pressure TableTABLE A2 Thermodynaic Properties of Dry Saturated Steam—Temperature
TableTABLE A3 Thermodynamic Properties of Superheated SteamTABLE A4 Enthalpy of Compressed WaterTABLE A5 Specific Heat, Viscosity, and Thermal Conductivity of Some Common
Gases at Atmospheric Pressurea
TABLE A6a Specific Heat, Viscosity, and Thermal Conductivity of Products ofCombustion of Natural Gas, Fuel Oil, and Ambient Air
TABLE A6b Gas Turbine Exhaust GasesTABLE A7a Enthalpy of Gasesa
TABLE A7b Enthalpy of Products of Combustion of Natural Gas and Fuel Oila
(Btu=lb)TABLE A8 Correlation for Superheated Steam PropertiesTABLE A9 Coefficients to Estimate Properties of Dry, Saturated Steam with
Equationa
TABLE A10 Saturation Line; Specific Heat Capacity and Transport PropertiesTABLE A11 Surface Tension of WaterTABLE A12a Specific Heat at Constant Pressure of Steam and Water
ðBtu=lbm �FÞTABLE A12b Viscosity of Steam and Water ðlbm=h ftÞTABLE A12c Thermal Conductivity of Steam and Water ½ðBtu=h ft �FÞ � 103�
Copyright © 2003 Marcel Dekker, Inc.

TABLE A1 Thermodynamic Properties of Dry Saturated Steam—Pressure Table
Copyright © 2003 Marcel Dekker, Inc.
Copyright © 2003 Marcel Dekker, Inc.

TABLE A2 Thermodynaic Properties of Dry Saturated Steam—Temperature Table
Copyright © 2003 Marcel Dekker, Inc.
Copyright © 2003 Marcel Dekker, Inc.

TABLE A3 Thermodynamic Properties of Superheated Steam
Copyright © 2003 Marcel Dekker, Inc.

Copyright © 2003 Marcel Dekker, Inc.

TABLE A3 Continued
Copyright © 2003 Marcel Dekker, Inc.

Copyright © 2003 Marcel Dekker, Inc.

TABLE A4 Enthalpy of Compressed Water
Copyright © 2003 Marcel Dekker, Inc.

Copyright © 2003 Marcel Dekker, Inc.

TABLE A5 Specific Heat, Viscosity, and Thermal Conductivity of Some Common Gases at Atmospheric Pressurea
Copyright © 2003 Marcel Dekker, Inc.

TABLE A6a Specific Heat, Viscosity, and Thermal Conductivity of Products of
Combustion of Natural Gas, Fuel Oil, and Ambient Air
Natural gas Fuel oil Air
Temp,�F Cp m k Cp m k Cp m k
2000 0.3326 0.1174 0.0511 0.3206 0.1178 0.0497 0.2906 0.1232 0.0475
1600 0.3203 0.1050 0.0437 0.3094 0.1055 0.0427 0.2817 0.1108 0.04141200 0.3059 0.0908 0.0362 0.2959 0.0915 0.0356 0.2712 0.0967 0.0351800 0.2907 0.0750 0.0287 0.2812 0.0757 0.0284 0.2602 0.0807 0.0287
400 0.2757 0.0575 0.0211 0.2660 0.0583 0.0211 0.2498 0.0631 0.0221
Analysis of natural gas–15% excess air vol%: CO2 ¼8.29, H2O¼18.17, N2 ¼ 71.08,
O2 ¼2.46.
Fuel oil–15% excess air vol%: CO2 ¼11.57, H2O¼ 12.29, N2 ¼73.63, O2 ¼2.51.
Air vol%: H2O¼ 1, N2 ¼78, O2 ¼21, Cp ¼ specific heat, Btu=lb�F. m¼ viscosity, lb=ft h;
k ¼ thermal conductivity, Btu=ft h �F.
TABLE A6b Gas Turbine Exhaust Gases
Temp, �F Cp m k
1000 0.2768 0.087 0.0321800 0.2704 0.0789 0.0287
600 0.2643 0.0702 0.0252400 0.2584 0.0612 0.0217200 0.2529 0.0517 0.0182
Gas analysis vol%: CO2 ¼ 3, H2O¼ 7, N2 ¼ 75,
O2 ¼15.
Copyright © 2003 Marcel Dekker, Inc.

TABLE A7a Enthalpy of Gasesa
Temp, (�F) A B C D
200 34.98 31.85 35.52 33.74
400 86.19 78.57 87.83 83.00600 138.70 126.57 141.79 133.42800 192.49 175.77 197.35 184.91
1000 247.56 226.2 254.47 237.521400 330.15 372.93 345.771800 437.86 496.42 457.82
a Content (vol%)
CO2 H2O N2 O2 SO2
A Gas turbine exhaust 3 7 75 15 —
B Sulfur combustion — — 81 10 9
C Flue gas 12 12 70 6 —
D Dry air 79 21 —
TABLE A7b Enthalpy of Products ofCombustion of Natural Gas and Fuel
Oila (Btu=lb)
Temp (�F) Natural gas Fuel oil
3000 928.6 894.92600 787.1 759.52200 649.5 627.3
1800 516.3 498.81400 387.9 374.81000 264.9 255.8
600 147.9 142.6200 37.1 35.7
a Same fuel analysis as in Table A6a.
Copyright © 2003 Marcel Dekker, Inc.

TABLE A8 Correlation for Superheated Steam Properties
Copyright © 2003 Marcel Dekker, Inc.

TABLE A9 Coefficients to Estimate Properties of Dry, Saturated Steam with Equationa
Copyright © 2003 Marcel Dekker, Inc.
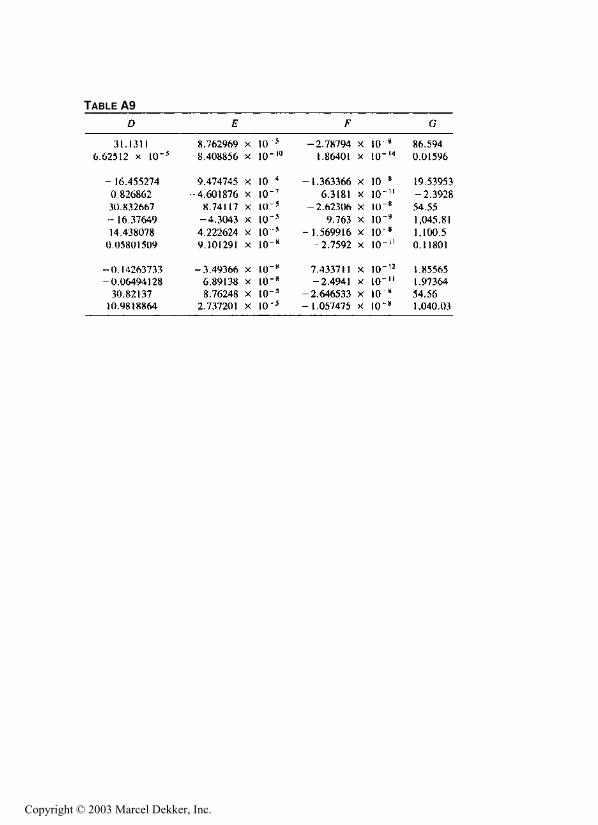
TABLE A9
Copyright © 2003 Marcel Dekker, Inc.
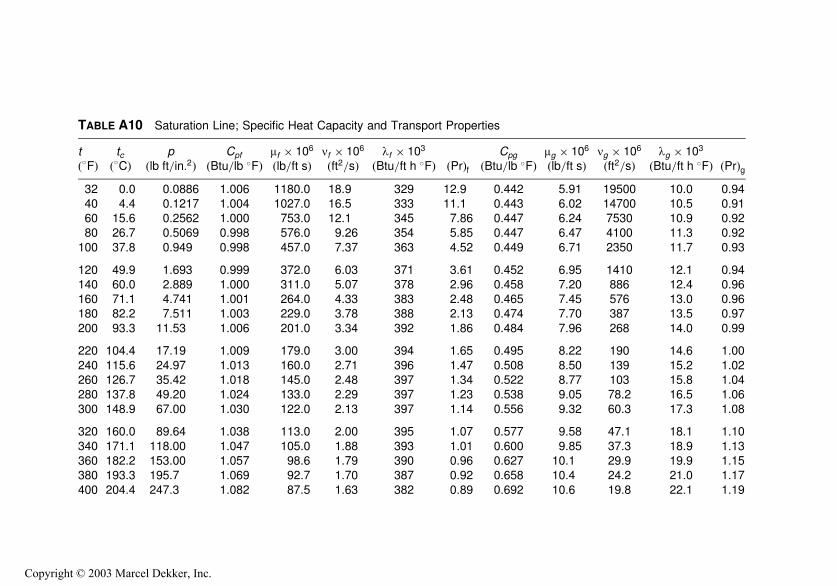
TABLE A10 Saturation Line; Specific Heat Capacity and Transport Properties
t tc p Cpf mf � 106 nf � 106 lf � 103 Cpg mg � 106 ng � 106 lg � 103
ð�FÞ ð�CÞ ðlb ft=in:2Þ ðBtu=lb �FÞ ðlb=ft sÞ ðft2=sÞ ðBtu=ft h �FÞ ðPrÞf ðBtu=lb �FÞ ðlb=ft sÞ ðft2=sÞ ðBtu=ft h �FÞ ðPrÞg32 0.0 0.0886 1.006 1180.0 18.9 329 12.9 0.442 5.91 19500 10.0 0.9440 4.4 0.1217 1.004 1027.0 16.5 333 11.1 0.443 6.02 14700 10.5 0.9160 15.6 0.2562 1.000 753.0 12.1 345 7.86 0.447 6.24 7530 10.9 0.9280 26.7 0.5069 0.998 576.0 9.26 354 5.85 0.447 6.47 4100 11.3 0.92
100 37.8 0.949 0.998 457.0 7.37 363 4.52 0.449 6.71 2350 11.7 0.93
120 49.9 1.693 0.999 372.0 6.03 371 3.61 0.452 6.95 1410 12.1 0.94140 60.0 2.889 1.000 311.0 5.07 378 2.96 0.458 7.20 886 12.4 0.96160 71.1 4.741 1.001 264.0 4.33 383 2.48 0.465 7.45 576 13.0 0.96180 82.2 7.511 1.003 229.0 3.78 388 2.13 0.474 7.70 387 13.5 0.97
200 93.3 11.53 1.006 201.0 3.34 392 1.86 0.484 7.96 268 14.0 0.99
220 104.4 17.19 1.009 179.0 3.00 394 1.65 0.495 8.22 190 14.6 1.00
240 115.6 24.97 1.013 160.0 2.71 396 1.47 0.508 8.50 139 15.2 1.02260 126.7 35.42 1.018 145.0 2.48 397 1.34 0.522 8.77 103 15.8 1.04280 137.8 49.20 1.024 133.0 2.29 397 1.23 0.538 9.05 78.2 16.5 1.06
300 148.9 67.00 1.030 122.0 2.13 397 1.14 0.556 9.32 60.3 17.3 1.08
320 160.0 89.64 1.038 113.0 2.00 395 1.07 0.577 9.58 47.1 18.1 1.10
340 171.1 118.00 1.047 105.0 1.88 393 1.01 0.600 9.85 37.3 18.9 1.13360 182.2 153.00 1.057 98.6 1.79 390 0.96 0.627 10.1 29.9 19.9 1.15380 193.3 195.7 1.069 92.7 1.70 387 0.92 0.658 10.4 24.2 21.0 1.17
400 204.4 247.3 1.082 87.5 1.63 382 0.89 0.692 10.6 19.8 22.1 1.19
Copyright © 2003 Marcel Dekker, Inc.

420 215.6 308.8 1.097 82.9 1.57 377 0.87 0.731 10.9 16.3 23.4 1.23440 226.7 381.6 1.115 78.8 1.52 371 0.85 0.774 11.2 13.6 24.9 1.25
460 237.8 466.9 1.135 75.2 1.47 364 0.84 0.823 11.5 11.4 26.5 1.29480 248.9 566.1 1.158 71.9 1.44 357 0.84 0.885 11.7 9.60 28.4 1.31500 260.0 680.8 1.186 68.9 1.41 349 0.84 0.951 12.1 8.14 30.5 1.36
520 271.1 812.4 1.229 66.2 1.38 340 0.86 1.038 12.4 6.94 32.9 1.41540 282.2 962.6 1.275 63.7 1.37 330 0.88 1.147 12.8 5.95 35.8 1.48560 293.3 1133.2 1.338 61.5 1.36 319 0.92 1.286 13.2 5.11 39.2 1.56
580 304.4 1326.1 1.420 59.8 1.36 308 0.99 1.472 13.6 4.38 43.3 1.66600 315.6 1543.3 1.520 58.0 1.37 296 1.07 1.735 14.4 3.85 48.4 1.86
620 326.7 1787.1 1.659 55.7 1.37 283 1.17 2.153 15.3 3.37 54.9 2.16640 337.8 2060.3 1.880 52.9 1.37 269 1.33 2.832 16.4 2.95 63.6 2.63660 348.9 2366.0 2.310 49.5 1.37 254 1.62 3.943 17.9 2.58 76.1 3.34
680 360.0 2708.3 3.466 45.2 1.37 231 2.44 5.676 20.2 2.25 97.0 4.26
Copyright © 2003 Marcel Dekker, Inc.

TABLE A11 Surface Tension of Water
Temp (�F) lb ft=ft� 103 Temp (�F) lb ft=ft� 103
32 5.184 350 2.942
40 5.141 400 2.51260 5.003 450 2.07180 4.914 500 1.624
100 4.794 550 1.178150 4.473 600 0.744200 4.124 650 0.340
250 3.752 700 0.018300 3.357
Copyright © 2003 Marcel Dekker, Inc.

TABLE A12a Specific Heat at Constant Pressure of Steam and Water ðBtu=lbm �FÞ
Pressure (psia)
Tempð�FÞ 1 2 5 10 20 50 100 200 500 1000 2000 5000
1500 0.559 0.559 0.559 0.559 0.559 0.560 0.561 0.563 0.569 0.580 0.601 0.6681400 0.551 0.551 0.551 0.551 0.551 0.552 0.553 0.555 0.563 0.575 0.600 0.6811300 0.543 0.543 0.543 0.543 0.543 0.544 0.545 0.548 0.556 0.570 0.600 0.7021200 0.533 0.533 0.533 0.533 0.534 0.535 0.536 0.540 0.550 0.567 0.603 0.740
1100 0.524 0.542 0.524 0.524 0.525 0.526 0.528 0.532 0.544 0.564 0.612 0.8141000 0.515 0.515 0.515 0.515 0.516 0.518 0.519 0.524 0.539 0.566 0.633 0.970900 0.506 0.506 0.506 0.506 0.507 0.509 0.512 0.518 0.537 0.576 0.683 1.382
800 0.497 0.497 0.497 0.497 0.498 0.501 0.505 0.513 0.544 0.605 0.800 2.420700 0.488 0.488 0.488 0.489 0.490 0.494 0.500 0.513 0.563 0.681 1.181 1.897b
600 0.479 0.480 0.480 0.481 0.483 0.489 0.499 0.522 0.621 0.888 1.453 1.253
500 0.472 0.472 0.473 0.475 0.478 0.489 0.508 0.554 0.773 1.181 1.157 1.106400 0.464 0.465 0.467 0.470 0.476 0.497 0.536 0.636 1.077 1.072 1.063 1.041300 0.458 0.459 0.463 0.469 0.482 0.524 1.029 1.028 1.027 1.024 1.019 1.006250 0.456 0.458 0.463 0.471 0.489 1.015 1.014 1.014 1.013 1.011 1.007 0.996
200 0.453 0.455 0.463 0.475 1.005 1.005 1.005 1.004 1.003 1.002 0.998 0.989150 0.451 0.455 0.866 1.001 1.000 1.000 1.000 1.000 0.998 0.997 0.993 0.984100 0.998 0.998 0.998 0.998 0.998 0.998 0.998 0.997 0.996 0.994 0.990 0.980
50 1.002 1.002 1.002 1.002 1.002 1.002 1.001 1.001 0.999 0.996 0.989 0.97232 1.007 1.007 1.007 1.007 1.007 1.007 1.006 1.006 1.003 0.999 0.990 0.969
a Horizontal bars indicate phase changeb Critical point (P¼ 3,206.2 psia; T¼ 705.4�F).
Copyright © 2003 Marcel Dekker, Inc.

TABLE A12b Viscosity of Steam and Water ðlbm=h ftÞ
Pressure (psia)Temp
(�F) 1 2 5 10 20 50 100 200 500 1000 2000 5000
1500 0.0996 0.0996 0.0996 0.0996 0.0996 0.0996 0.0996 0.0996 0.1008 0.1008 0.1019 0.1066
1400 0.0938 0.0938 0.0938 0.0938 0.0938 0.0938 0.0952 0.0952 0.0952 0.0961 0.0973 0.10191300 0.0892 0.0982 0.0892 0.0892 0.0892 0.0892 0.0892 0.0892 0.0892 0.0903 0.0915 0.09731200 0.0834 0.0834 0.0834 0.0834 0.0834 0.0834 0.0834 0.0834 0.0846 0.0846 0.0867 0.09261100 0.0776 0.0776 0.0776 0.0776 0.0776 0.0776 0.0776 0.0776 0.0788 0.0799 0.0811 0.0892
1000 0.0730 0.0730 0.0730 0.0730 0.0730 0.0730 0.0730 0.0730 0.0730 0.0741 0.0764 0.0857900 0.0672 0.0672 0.0672 0.0672 0.0672 0.0672 0.0672 0.0672 0.0683 0.0683 0.0707 0.0846800 0.0614 0.0614 0.0614 0.0614 0.0614 0.0614 0.0614 0.0614 0.0625 0.0637 0.0660 0.0973
700 0.0556 0.0556 0.0556 0.0556 0.0556 0.0556 0.0568 0.0568 0.0568 0.0579 0.0625 0.171b
600 0.0510 0.0510 0.0510 0.0510 0.0510 0.0510 0.0510 0.0510 0.0510 0.0510 0.210 0.221500 0.0452 0.0452 0.0452 0.0452 0.0452 0.0452 0.0452 0.0440 0.0440 0.250 0.255 0.268
400 0.0394 0.0394 0.0394 0.0394 0.0394 0.0394 0.0394 0.0382 0.317 0.320 0.323 0.335300 0.0336 0.0336 0.0336 0.0336 0.0336 0.0336 0.441 0.442 0.444 0.445 0.448 0.460250 0.0313 0.0313 0.0313 0.0313 0.0313 0.551 0.551 0.551 0.552 0.554 0.558 0.569200 0.0290 0.0290 0.0290 0.0290 0.725 0.725 0.725 0.726 0.729 0.729 0.732 0.741
150 0.0255 0.0255 1.032 1.032 1.032 1.032 1.032 1.032 1.033 1.034 1.037 1.044100 1.645 1.645 1.645 1.645 1.645 1.645 1.645 1.645 1.645 1.646 1.646 1.64850 3.144 3.144 3.144 3.144 3.144 3.144 3.144 3.142 3.141 3.139 3.134 3.119
32 4.240 4.240 4.240 4.240 4.240 4.240 4.240 4.239 4.236 4.231 4.222 4.192
a Horizontal bars indicate phase change.b Critical point (P¼3,206.2 psia; T¼705.4�F).
Copyright © 2003 Marcel Dekker, Inc.
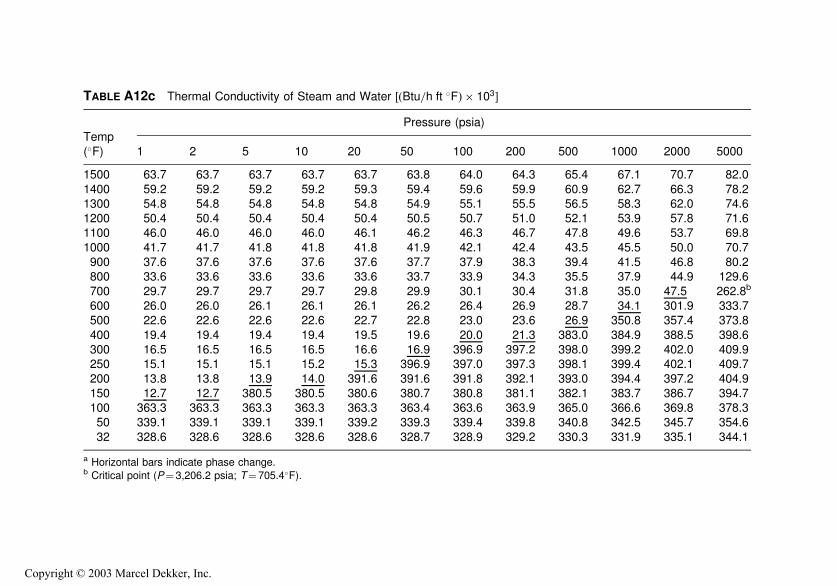
TABLE A12c Thermal Conductivity of Steam and Water ½ðBtu=h ft �FÞ � 103�
Pressure (psia)Temp
(�F) 1 2 5 10 20 50 100 200 500 1000 2000 5000
1500 63.7 63.7 63.7 63.7 63.7 63.8 64.0 64.3 65.4 67.1 70.7 82.0
1400 59.2 59.2 59.2 59.2 59.3 59.4 59.6 59.9 60.9 62.7 66.3 78.21300 54.8 54.8 54.8 54.8 54.8 54.9 55.1 55.5 56.5 58.3 62.0 74.61200 50.4 50.4 50.4 50.4 50.4 50.5 50.7 51.0 52.1 53.9 57.8 71.61100 46.0 46.0 46.0 46.0 46.1 46.2 46.3 46.7 47.8 49.6 53.7 69.8
1000 41.7 41.7 41.8 41.8 41.8 41.9 42.1 42.4 43.5 45.5 50.0 70.7900 37.6 37.6 37.6 37.6 37.6 37.7 37.9 38.3 39.4 41.5 46.8 80.2800 33.6 33.6 33.6 33.6 33.6 33.7 33.9 34.3 35.5 37.9 44.9 129.6
700 29.7 29.7 29.7 29.7 29.8 29.9 30.1 30.4 31.8 35.0 47.5 262.8b
600 26.0 26.0 26.1 26.1 26.1 26.2 26.4 26.9 28.7 34.1 301.9 333.7500 22.6 22.6 22.6 22.6 22.7 22.8 23.0 23.6 26.9 350.8 357.4 373.8
400 19.4 19.4 19.4 19.4 19.5 19.6 20.0 21.3 383.0 384.9 388.5 398.6300 16.5 16.5 16.5 16.5 16.6 16.9 396.9 397.2 398.0 399.2 402.0 409.9250 15.1 15.1 15.1 15.2 15.3 396.9 397.0 397.3 398.1 399.4 402.1 409.7
200 13.8 13.8 13.9 14.0 391.6 391.6 391.8 392.1 393.0 394.4 397.2 404.9150 12.7 12.7 380.5 380.5 380.6 380.7 380.8 381.1 382.1 383.7 386.7 394.7100 363.3 363.3 363.3 363.3 363.3 363.4 363.6 363.9 365.0 366.6 369.8 378.350 339.1 339.1 339.1 339.1 339.2 339.3 339.4 339.8 340.8 342.5 345.7 354.6
32 328.6 328.6 328.6 328.6 328.6 328.7 328.9 329.2 330.3 331.9 335.1 344.1
a Horizontal bars indicate phase change.b Critical point (P¼3,206.2 psia; T¼ 705.4�F).
Copyright © 2003 Marcel Dekker, Inc.

Glossary
acfh Actual cubic feet per hour.
acfm Actual cubic feet per minute, a term used to indicate the flow rate
of gases, at any condition of temperature and pressure.�API A scale adopted by American Petroleum Institute to indicate the
specific gravity of a liquid. Water has an API gravity of 10�APIand No. 2 fuel oil, about 35�API.
ABMA American Boiler Manufacturers Association.
ASME American Society of Mechanical Engineers.
ASR Actual steam rate, a term used to indicate the actual steam
consumption of steam turbines in lb=kWh.
BHP Brake horsepower, a term used for power consumption or rating
of turbomachinery. This does not include the efficiency of the
drive.
Btu British thermal unit, a term for measuring heat.
CFD Computational fluid dynamics
CO Carbon monoxide
CO2 Carbon dioxide
cP Centipoise, a unit for measurement of absolute viscosity.
CR Circulation ratio, a term used to indicate the ratio by weight of a
mixture of steam and water to that of steam in the mixture. A CR
Copyright © 2003 Marcel Dekker, Inc.

of 4 means that 1 lb of steam–water mixture has 14lb of steam and
the remainder water.
dB Decibel, a unit for measuring noise or sound pressure levels.
dBA Decibel, scale A; a unit for measuring sound pressure levels
corrected for frequency characteristics of the human ear.
DNB Departure from nucleate boiling.
FGR Flue gas recirculation.
fps, fpm, fph Feet per second, minute, and hour; units for measuring the
velocity of fluids.
HAT Humid air turbine.
gpm, gph Volumetric flow rate in gallons per minute or hour.
HHV Higher heating value or gross heating value of fuels.
HRSG Heat recovery steam generator.
ICAD Intercooled aeroderivative.
ID Inner diameter of tube or pipe.
IGCC Integrated gasification and combined cycle.
in. WC A unit to measure pressure of gas streams; inches of water
column.
kW Kilowatt, a unit of measurement of power.
LHV Lower heating value or net heating value of a fuel.
LMP Larson–Miller parameter.
LMTD Log-mean temperature difference.
ln Logarithm to base e; natural logarithm.
log Logarithm to base 10.
M lb=h Thousands of pounds per hour
MM Btu Millions of British thermal units.
MW Molecular weight.
NOx Oxides of nitrogen.
NPSH Net positive suction head, a term used to indicate the effective
head in feet of liquid column to avoid cavitation. Subscripts r
and a stand for required and available.
NTU Number of transfer units; a term used in heat exchanger design.
OD Outer diameter of tube or pipe.
oz Ounce.
ozi Ounces per square inch, a term for measuring fluid pressure.
ppm Parts per million by weight or volume.
psia Pounds per square inch absolute, a term for indicating pressure.
psig Pounds per square inch gauge, a term for measuring pressure.
PWL Sound power level, a term for indicating the noise generated by a
source such as a fan or turbine.
RH Relative humidity.
SBV, SBW Steam by volume and by weight in a steam–water mixture, terms
Copyright © 2003 Marcel Dekker, Inc.

used by boiler designers.
scfm, scfh Standard cubic feet per minute or hour, units for flow of gases
at standard conditions of temperature and pressure, namely at
70�F and 29.92 in.Hg, or 14.696 psia. Sometimes 60�F and
14.696 psia is also used. The ratio of scfm at 70�F to scfm at
60�F is 1.019.
SCR Selective catalytic reduction.
SNCR Selective noncatalytic reduction.
SPL Sound pressure level, a unit of measurement of noise in decibels.
SSU Seconds, Saybolt Universal; a unit of kinematic viscosity of
fluids.
SVP Saturated vapor pressure, pressure of water vapor in a mixture of
gases.
TSR Theoretical steam rate, a term indicating the theoretical
consumption of steam to generate a kilowatt of electricity in a
turbine in lb=h.UHC Unburned hydrocarbon.
VOC Volatile organic compound.
Copyright © 2003 Marcel Dekker, Inc.

Bibliography
BOOKS
ASME. 2001 ASME Boiler and Pressure Vessel Code, Sec. 1 and 8, July 2001.
ASME. ASME Power Test Code PTC 4.4-1981, Gas Turbine HRSGs. New York, 1981.
ASME. ASME Power Test Code PTC 4-1998. Fired Steam Generators. New York, 1998.
Babcock & Wilcox. Steam, Its Generation and Use, 40th ed. New York, 1992.
Betz Laboratories. Betz Handbook of Industrial Water Conditioning. Trevose, Pennsyl-
vania, 1976.
Combustion Engineering, Combustion-Fossil Power Systems, 3rd ed. Windsor, 1981.
Crane Co. Flow of Fluids, Technical Paper 410. New York, 1981.
Elliott CT. Standard Handbook of Power Plant Engineering. McGraw-Hill, New York, 1989.
Hicks TG. Handbook of Mechanical Engineering Calculations. McGraw-Hill, New York,
1998.
John Zink Co., Combustion Handbook. Tulsa, Oklahoma, 2001.
Kakac S. Boilers, Evaporators and Condensers. John Wiley, New York, 1991.
Karassik IJ. Centrifugal Pump Clinic. Marcel Dekker, New York, 1981.
Kern DQ. Process Heat Transfer. McGraw-Hill, New York, 1950.
Nalco Chemical Co. The Nalco Guide to Boiler Failure Analysis. McGraw-Hill, New York,
1991.
Roshenow WM, Hartnett JP. Handbook of Heat Transfer. McGraw-Hill, New York, 1972.
Copyright © 2003 Marcel Dekker, Inc.

JOURNALS
Chemical Engineering. Chemical Week Publishing, New York.
Chemical Engineering Progress. AlChe, New York.
Cogeneration and Onsite Power Generation. Science Publishers, London, UK.
Heat Transfer Engineering. Taylor & Francis, London, UK.
Hydrocarbon Processing. Gulf Publishing, Houston, Texas.
Modern Power Systems. Wilmington Publishing, Kent, UK.
Oil and Gas Journal, PennWell. Tulsa, Oklahoma.
Petroleum Technology Quarterly. Crambeth Allen Publishing, London, UK.
Plant Engineering. Cahners, Oak Brook, Illinois.
Pollution Engineering. Business News Publishing, Troy, MI.
Power. McGraw-Hill, New York.
Power Engineering. PennWell, Tulsa, Oklahoma.
See also http://vganapathy.tripod.com/boilers.html for more articles.
Copyright © 2003 Marcel Dekker, Inc.
Related Documents