BOGOTÁ DISTRITO CAPITAL

BOGOTÁ DISTRITO CAPITAL. Agenda Introduction to the District of Bogotá Economic, Social Developments and Infrastructure Fiscal Situation Budget Public.
Jan 02, 2016
Welcome message from author
This document is posted to help you gain knowledge. Please leave a comment to let me know what you think about it! Share it to your friends and learn new things together.
Transcript

BOGOTÁ DISTRITO CAPITAL

Agenda
• Introduction to the District of Bogotá
• Economic, Social Developments and Infrastructure
• Fiscal Situation
• Budget
• Public Debt
Introduction to the District of Bogotá

The District of Bogotá• Bogotá is the capital city of Colombia and it is
strategically located in the geographic centre of the American continent; in the eastern Andes mountain range and 1 hour away from both the Atlantic and Pacific Oceans
• With over 7.3 million residents*, the District of Bogotá is among the 40 most populated urban centers in the world, and houses 15.7% of Colombia’s total population
• Bogotá is divided into 20 localities that together comprise the District
• The district is governed by a Mayor, a District Council, local administrative boards and other local authorities
• The current mayor is Mr. Samuel Moreno Rojas who was elected in 2003 and will serve until December 2007
* According to the data from the 1993 Census

Investment Highlights• Sustainable economic growth in both the District and the Country
• Bogotá is within the top ten cities in Latin America in terms of competitiveness
• Considerable increase in tax collection over the last 5 years
• Reduction of tax evasion
• Public spending austerity and priority in infrastructure investment
• Responsible handling of public debt and good pension coverage
• Sound financial statements and high levels of public information disclosure
• Employment and income generation in the region
• Modern integrated information systems
• High degree of financial regulation and public spending controls

Economic, Social Developmentsand Infrastructure

22,9
22,7
22,6
22,4
22,0
22,1
21,40
21,60
21,80
22,00
22,20
22,40
22,60
22,80
23,00
2002 2003 2004 2005 2006p 2007p
%
Bogota’s Contribution to Colombian GDP
Improving Economic Situation
Economic Structure Inflation
Economic Growth (Real GDP)
Source: Dane y SDH-Dirección de Estadísticas y Estudios Fiscales
4.3%20.8%15.5%
15.4%7.6%
6.0%13.2%
11.9%9.0%
8.4%29.9%
16.7%
20.6% 20.9%
Bogota Colombia
Other ServicesFinancial, and Real Estate Transportation and CommunicationsCommerceConstructionIndustryAgriculture Mining and Others
7,56,8
4,74,93,9
1,9
4,3
3,3
6,9
5,5
7,6 7,8
0,00
1,00
2,00
3,00
4,00
5,00
6,00
7,00
8,00
9,00
2002 2003 2004 2005 2006p 2007p
%
Nation Bogotá
5,57
4,13
4,84
5,38
5,98
6,93
6,99
6,49
5,50
4,48
4,85
5,69
3,00
3,50
4,00
4,50
5,00
5,50
6,00
6,50
7,00
7,50
2002 2003 2004 2005 2006 2007
%
Bogotá Nation

• During the 2002-2007 period the unemployment rate decreased at an average annual rate of 16.7% in 2002 to 9.1% in 2007
• Poverty rates decreased from 38.9% in 2002 to 23.8% in 2007, which makes Bogotá the Colombian city with the lowest poverty levels compared to other major cities
Unemployment Levels in Bogotá when Compared to other Major
Colombian Cities
Reduction in Poverty and Unemployment
Percentage of Population Bellow Poverty Line
Source: Dane, census 1993 y 2005. SDH, Dirección de Estadísticas y Estudios FiscalesMisión para el diseño de una estrategia para la reducción de la pobreza y la desigualdad – MERPD
15,714,9
12,9
11,3 11,1
15,814,7
14,1
12,7 13
9,1
10,3
4,00
6,00
8,00
10,00
12,00
14,00
16,00
18,00
20,00
2002 2003 2004 2005 2006 2007
%
Bogotá Mayor cities without Bogotá
23,8027,00
33,70
38,90
3,404,206,30
9,10
0,00
5,00
10,00
15,00
20,00
25,00
30,00
35,00
40,00
45,00
2003 2004 2005 2006
%
Poverty Line Extreme Poverty Line

• Investments in the District’s security infrastructure produced a significant decrease in criminality, including, an average decrease of 34.0% in murder rates per 100,000 inhabitants from 2002 (28.5 homicides per 100,000 inhabitants) to 2006 (18.8 homicides per 100,000 inhabitants);
• Improvements in the health sector, made through the renovation or construction of hospitals and the development of social health programs, have produced a significant decrease of certain mortality rates, and the coverage of the social security system has increased from 69.7% in 2002 to 72.7% in 2005
Improving Social Situation
Increase in Health Expenditure
396 391331
585
824
668593686
599
155
175232364
934930 12
1,2801,2241,099
757873861
0
400
800
1,200
1,600
2002 2003 2004 2005 2006 2007
Milli
ons
of R
eal P
esos
as
of 2
006
Transfers from Federal Government Bogota District ResourcesOw n Resources Total FFDS

Improving Social Situation
The District has contributed to the improvement in the public education system through the increase of spaces available for new student and the construction of educational infrastructure. In particular there has been great advance in the following areas:
– Guaranteed free education – School meals– Subsidies tied to school assistance– School transportation – Health programs in schools– Distribution of school supplies

Improving Social Situation
0
40
80
120
160
200
240
280
Enero
1998
Julio
Enero
1999
Julio
Enero
2000
Julio
Enero
2001
Julio
Enero
2002
Julio
Enero
2003
Julio
Enero
2004
Julio
Enero
2005
Julio
Enero
2006
Julio
Enero
2007
Julio
Incid
ents
Prom: 188Jan 98 - Agu 02
Prom: 127Sept 02 - Dec 07
Máx: 262 Dec 99
Mín: 83 Oct 07
Violent Deaths

Deaths due to Automovilistic Accidents
Improving Social Situation
0
10
20
30
40
50
60
70
80
90
100
110
Ene
ro19
98
Julio
Ene
ro19
99
Julio
Ene
ro20
00
Julio
Ene
ro20
01
Julio
Ene
ro20
02
Julio
Ene
ro20
03
Julio
Ene
ro20
04
Julio
Ene
ro20
05
Julio
Ene
ro20
06
Julio
Ene
ro20
07
Julio
Inci
dent
s
Prom: 60Ene 98 - Oct 05
Máx: 101 Dec 99
Mín: 22Jan 06
Prom: 40Nov 05 - Dic 07

Robbery
Improving Social Situation
0
150
300
450
600
750
900
1050
1200
1350
Enero
1998
Julio
Enero
1999
Julio
Enero
2000
Julio
Enero
2001
Julio
Enero
2002
Julio
Enero
2003
Julio
Enero
2004
Julio
Enero
2005
Julio
Enero
2006
Julio
Enero
2007
Julio
Incid
en
ts
Prom: 741Jan 98 - Jun 01
Prom: 498Jul 01 - Dec 04 Prom: 1009
Jan 05 - Dec 07
Mín: 331Jun 03
Máx: 1068Mar 98
Máx: 1204 Dec 05
Note:It is not comparable with previous data.

Diversified Economic Growth
Composition of Bogotá Economy Growth Per Sector
Sources: Fedesarrollo-EOE.
Calculations: SDH, Dirección de Estadísticas y Estudios Fiscales
The district GDP is diversified among a number of economic sectors, the largest of which are the financial, real estate, and commercial service sectors followed by the greater service sector, and the manufacturing sector
29.90%
20.60%15.50%
13.20%
9.00%
7.50%4.30%
Financial , Real Estate, and Corporate ServicesServicesManufacturingCommerceTransportation and CommunicationsConstructionAgriculture, Mining and Others
6,8
10,5
9,3
3,5
4,65,9
7,9
4,0
9,2
5,0
3,7
7,5
2,1
-1,6
11,1
5,5
8,7
1,7
5,3
12,5
8,4
12,5
5,0
8,1
-2,00
0,00
2,00
4,00
6,00
8,00
10,00
12,00
14,00
2002 2003 2004 2005 2006p 2007p
%
Financial, real state and corporate services Services
Manufacturing Commerce

Infrastructure
Actually, Transmilenio consisted of 52.2 miles of main routes on nine avenues. Two additional phases of the project are schedule to completed by 2016. When finished, the total network will consist of 241 miles over 22 avenues. In addition to the project of Transmilenio, Bogotá plans the construction of a Metro, that would maintain the tendency of city-planning development and it would be integrated to the present system of massive transport

Fiscal Situation

Tax PolicyThe tax collection strategy of the District dictates as policy:
• Reduce tax evasion through control and prosecution
• Investment in the modernization of tax collection mechanisms
• Strengthening of tributary administration
• Management information systems optimization
The District’s tax collection system is divided in three main areas:
Direct Taxes Stamp Tax Indirect Taxes
Real Estate,and Vehicles
In Benefit of CultureDevelopment
and the Elderly
Commerce, Industry,Entertainment,
Urban Development, Cigarettes,Beer, Gasoline, Publicity,
Sporting Events, Poverty Fund

Improvement in Tax Collection
• The implementation of the District’s tax collection plans
has led Bogotá to increase its tax proceeds at a real
rate of 12% between 1991 – 2007
• The impressive growth is explained by the following
factors
– Increase in the tax base
– Actualization and broadening of the taxable base
– Reduction in the levels of tax evasion
– Implementation of cultural programs
– Establishment of new fiscal policies

Fiscal Situation
-2%
-4%
10%9%
7%
10%
22%
9%7%
-2%5%
6%
21%
74%
6%
15%
-10%
0%
10%
20%
30%
40%
50%
60%
70%
80%
1992
1993
1994
1995
1996
1997
1998
1999
2000
2001
2002
2003
2004
2005
2006
2007
Gasoline surcharge implementation
Tax Reform ICA - Increase in Rates by 38% - Updated Cadastral
Economic Recession – Goods falling prices
Recovery in economic activity - automatic adjustment of the
properties by “IVIUR”.
Administrative Reform. Organic Statute of Bogota - New ICA period - System
Autoavalúo

Fiscal Situation
Other Tax
Motor VehiculeGasoline Surcharge
Beer Consumption
Real State
Industry & Commerce
-
500.000
1.000.000
1.500.000
2.000.000
2.500.000
3.000.000
3.500.000
2003 2004 2005 2006 2007
TAX 2003 2004 2005 2006 2007D Real
Average
Industry & Commerce 1.228.668 1.357.637 1.478.776 1.644.748 1.792.561 9,91%Real State 569.668 620.877 649.590 676.340 736.934 6,67%Beer Consumption 214.956 218.594 227.210 235.573 256.829 4,58%Gasoline Surcharge 264.144 295.721 308.582 294.273 291.168 2,65%Motor Vehicule 138.205 171.648 198.529 220.888 258.127 16,99%Other Tax 76.013 74.090 58.898 117.613 184.362 33,35%
Total Tax Revenues 2.491.654 2.738.567 2.921.585 3.189.435 3.519.981 9,03%
Millions of constant 2007 pesos
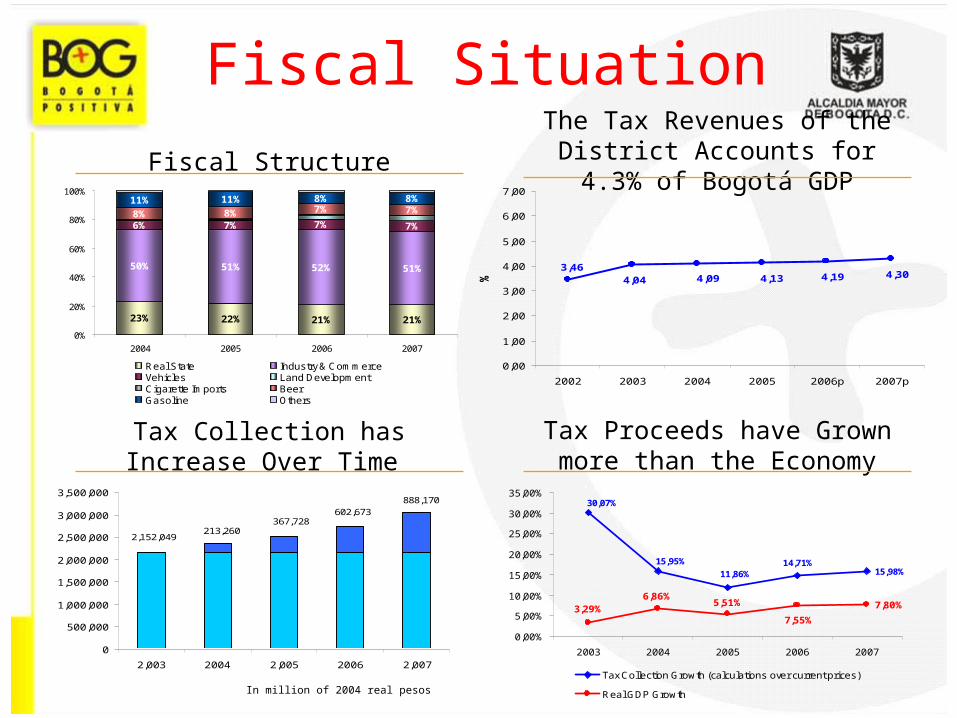
2,152,049
888,170602,673
367,728213,260
0
500,000
1,000,000
1,500,000
2,000,000
2,500,000
3,000,000
3,500,000
2,003 2004 2,005 2006 2,007
Fiscal Situation
Tax Proceeds have Grown more than the Economy
Tax Collection has Increase Over Time
The Tax Revenues of the District Accounts for 4.3% of Bogotá GDPFiscal Structure
In million of 2004 real pesos
23% 22% 21% 21%
50% 51% 52% 51%
6% 7% 7% 7%8% 8% 7% 7%11% 11% 8% 8%
0%
20%
40%
60%
80%
100%
2004 2005 2006 2007
Real State Industry & CommerceVehicles Land DevelopmentCigarette Imports BeerGasoline Others
15,98%
7,80%
14,71%11,86%
15,95%
30,07%
7,55%
5,51%6,86%
3,29%
0,00%
5,00%
10,00%
15,00%
20,00%
25,00%
30,00%
35,00%
2003 2004 2005 2006 2007
Tax Collection Growth (calculations over current prices)
Real GDP Growth
3,464,04 4,09 4,13 4,19 4,30
0,00
1,00
2,00
3,00
4,00
5,00
6,00
7,00
2002 2003 2004 2005 2006p 2007p
%

Digital Map – Second version (2007)
scale
1:1.000scale
1:1.000scale
1:10.000scale
1:10.000
scale
1:5.000scale
1:5.000
Real State Updating Process
Official map of Bogotá
It has 160 layers with myriad physical and legal characteristics of the city and its parcels: parks, boundaries, public buildings, etc.

The Cadastral information is updated in its three components
PhysicalAreas, boundaries, and
characteristics of the building are registered
Field visit
LegalCrossing
informationName of owner and ID number
Economic
Econometric models
Probabilistic samples
Valuations doneby experts
Commercial value of the property
Instrumental in the collection of an adequate property tax from the 2 million parcels in the city
Real State Updating Process
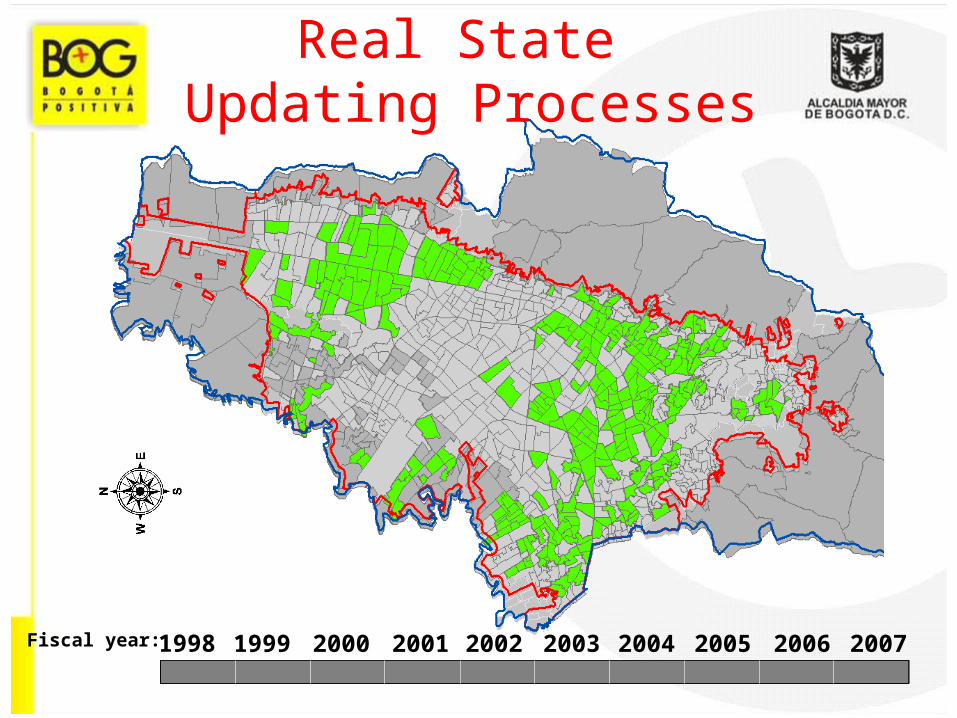
Fiscal year: 1998 1999 2000 2001 2002 2003 2004 2005 2006 2007
Real State Updating Processes

Tax CollectionImprovement
Increase in the Tax Base
Note: Figures in million of 2007 real pesos
Industry and Commerce Tax
Vehicle TaxReal Estate Tax
512,629484,804
545,544569,668
620,877649,590
676,340
736,934
0
100,000
200,000
300,000
400,000
500,000
600,000
700,000
800,000
2000 2001 2002 2003 2004 2005 2006 2007
1,792,561
1,644,748
1,478,7761,357,637
1,228,667
901,380805,409791,499
0
200,000
400,000
600,000
800,000
1,000,000
1,200,000
1,400,000
1,600,000
1,800,000
2,000,000
2000 2001 2002 2003 2004 2005 2006 2007
258,127
220,888
198,529
171,648
138,205
101,356110,282
121,122
0
50,000
100,000
150,000
200,000
250,000
300,000
2000 2001 2002 2003 2004 2005 2006 2007
1.9 1.9
97.106
1.9
204.565
1.9
367.856
1.9
472.140
0.0
0.5
1.0
1.5
2.0
2.5
Millo
ne
s d
e c
ontr
ibu
ye
nte
s
2003 2004 2005 2006 2007*
1.9 1.9
97.106
1.9
204.565
1.9
367.856
1.9
472.140
0.0
0.5
1.0
1.5
2.0
2.5
Millo
ne
s d
e c
ontr
ibu
ye
nte
s
2003 2004 2005 2006 2007*
Note: Increased respect to 2003

Budget

CONCEPT 2002 2003 2004 2005 2006 2007
TOTAL REVENUES 3.358.038 3.798.090 4.136.493 5.376.845 6.154.309 6.219.189
Current Revenues 1.632.977 2.112.949 2.453.213 2.753.435 3.176.175 3.738.224Transfers 1.021.917 1.198.022 1.247.791 1.386.787 1.488.457 1.609.592Capital Revenues 703.144 487.118 435.489 1.236.622 1.489.678 871.374
TOTAL EXPENDITURES 3.124.323 3.722.116 3.872.240 4.853.623 6.026.480 6.309.2072.951.220 3.553.214 3.668.251 4.615.839 5.780.746 6.115.859
Current Expenditures 768.655 777.323 879.898 973.169 1.078.447 1.269.234Investment 2.182.565 2.775.891 2.788.353 3.642.670 4.702.299 4.846.624Debt Service 173.103 168.902 203.989 237.784 245.734 193.348
Budget• The level of leverage that the District can undertake is regulated and controlled by
national guidelines
• The structure of the debt contracted by District is governed by the “Politica de Control
de Riesgos de la Secretaria Distrital de Hacienda”. The regulator has imposed certain
technical criteria to evaluate and control the risks of the District Public Debt
Budget 2002 – 2007Millions of COP
Source: SDH Dirección Distrital de Presupuesto-SFD

Budget Behavior Income Growth 2002 – 2007
Transfer to the District 2002 – 2007
Expenditures 2002 – 2007
Millions of dollars
1,340 1,091
1,620
2,125
2,692
3,131
-
500
1.000
1.500
2.000
2.500
3.000
3.500
2002 2003 2004 2005 2006 2007
Current Debt Service Investment
799
665 607
522
431 357
-
100
200
300
400
500
600
700
800
900
2002 2003 2004 2005 2006 2007
Nation Others
3,087
2,749 2,354
1,731
1,172 1,367
-
500
1.000
1.500
2.000
2.500
3.000
3.500
4.000
2002 2003 2004 2005 2006 2007
Current Transfers Capital Revenues

Public Debt

National Debt and Risk Control Policies for Territorial Entities
Constitution
Article 364: Debt in territorial entities must not exceed its payment capacity.
Law 358/1997
Establish parameters to define payment capacity as well as the minimum operational savings in order to grant debt payment and an additional amount for investment purposes.
Establish two indicators:Debt Capacity: Interest/Operational Savings < 40%Sustainability: Balance/Current Revenues. < 80%
Law 617/2000
Establish operational expenditures limits for territorial entities
Operational expenditures/non specific destination revenues < 50%
Law 819/2003
Establish a financial planning instrument "Medium Term Fiscal Frame" through which primary superavit and sustainability goals are set for a time period of 10 years. The primary objective for this instrument is to grant debt sustainability and economic growth.

National Risk ManagementLevels
Debt Sustainability Payment Capacity
Source: DDCP - SDH
75,84% 63,47%
44,88%
53,16%
39,07%44,38%
0%
10%
20%
30%
40%
50%
60%
70%
80%
2002 2003 2004 2005 2006 2007
Límit 80%
5,66%7,94%
10,44%
9,97%
12,03%
23,56%
0%
5%
10%
15%
20%
25%
30%
35%
40%
45%
50%
2002 2003 2004 2005 2006 2007
Limit 40%
Law 358/1997
Law 617/2000
37%
37,10%
38,90%
39,10%
41,20%
52,60%
0%
10%
20%
30%
40%
50%
60%
2002 2003 2004 2005 2006 2007p
Limit 50%

Politics, Guidelines and Toolsfor the risk management of the
District’s portfolio
• Administer by the District’s Directorate of Public Credit• VaR – Liability Portfolio• Liquidity Risk: Annual Amortization of 15% to 18% of total
debt
• FX Risk: Maximum of 20% denominated in a Foreign Currency
• Interest Rate Risk: Minimum 30% in fixed rate and maximum 70% in variable rate.
• Economic variable projections and risk scenarios
Risk Policy Committee
Office of Risk Analysis and control
Risk Committee
Liabilities

Debt and Risk Control Policies
Risk Policy Committee
Establishes Guidelines and Policies
Risk Committee
Defines and Approves the operational guidelines for the implementation of risk
control strategies
Office of Risk Control
Updates and monitors the guidelines and methodologies for the control of the liability
portfolio
Directorate of Public Credit
Administers the debt portfolio, distributes the resources and manages
the risks
Interest Rates
Maximum 70% in variable rate and minimum 30% in
fixed rate.
Maximum amortization per year should be 15% of
total debt with a deviation up to 18% — Minimum
average life of 4.15 years
Liquidity
Maximum of 20% of debt with exposure to a foreign
currency
FX
Organizational Structure
Risk Management Guidelines

Debt ProfileOutstanding Debt Payments
(percentage per year)
Source: DDCP - SDH
FX Composition
Interest Composition Type of debt and currency
45,90%52,70%
89,40% 89,30% 85,68% 89,05%
14,32% 10,95%47,30%
54,10%
10,60% 10,70%
2002 2003 2004 2005 2006 2007
Debt in COP Debt in other currencies
18,90% 24,30%34,20% 30,70% 32,17%
48,81%
51,19%67,83%81,10% 75,70% 69,30%65,80%
2002 2003 2004 2005 2006 2007
Fixed Variable
External (COP)32,34%
External with no Hedge10,95%
External with Hedge (COP)
10,15%
Internal (COP)46,57%
0%
2%
4%
6%
8%
10%
12%
14%
16%
18%
20%

Debt Ratios
Total Debt / GDP
• The District strictly monitors the incurrence of indebtedness in
order to match the financing needs resulting from the
implementation of new programs and its future revenues
4,11%3,64%
2,89%
3,29%
2,60%
2,80%
0,00%
0,50%
1,00%
1,50%
2,00%
2,50%
3,00%
3,50%
4,00%
4,50%
5,00%
2002 2003 2004 2005 2006p 2007p
Related Documents