Welcome message from author
This document is posted to help you gain knowledge. Please leave a comment to let me know what you think about it! Share it to your friends and learn new things together.
Transcript


1
Performance management .................................................................................... 2
1.1. Revenue ..................................................................................................................................................... 2
1.1.1. PROFITABILITY RATIOS .................................................................................................................. 3
1.1.2. Efficiency ................................................................................................................................................. 5
1.1.3. Management Effectiveness ............................................................................................................. 6
1.2. Cost .............................................................................................................................................................. 7
1.2.1. Interest Cover Ratio ........................................................................................................................... 9
1.2.2. GEARING ................................................................................................................................................. 9
1.2.3. WACC vs. ROIC ................................................................................................................................... 10
1.2.4. Operation Cash Flow ...................................................................................................................... 10
Corporation strategy ............................................................................................ 12
1.3. Macro-‐environmental ....................................................................................................................... 12
1.3.1. Political ................................................................................................................................................ 12
1.3.2. Economic ............................................................................................................................................. 12
1.3.3. Social ..................................................................................................................................................... 13
1.3.4. Technological .................................................................................................................................... 14
1.3.5. Porter’s five forces ........................................................................................................................... 14
1.4. SWOT ........................................................................................................................................................ 17
1.4.1. Strength ............................................................................................................................................... 17
1.4.2. Weaknesses: ....................................................................................................................................... 17
1.4.3. Opportunities ..................................................................................................................................... 18
1.4.4. Threats ................................................................................................................................................. 18
Conclusion ........................................................................................................... 18
References ........................................................................................................... 19
2
Performance management
Boeing is the world’s largest aerospace company and leading manufacturer of commercial airplanes
and defense, space and security systems. Boeing’s products and tailored services include commercial
military aircraft, satellites, weapons, electronic and defense system, launch system, advanced
information and communication system, and performance-based logistical and training. The company
is organized into two business units: Boeing Commercial Airplanes and Boeing Defense, Space &
Security.(Boeing Official Website,2015 )
1.1. Revenue
To classify the revenue from the different business Boeing has, we divide the revenue into three parts:
! Commercial Airplanes;
! Our Defense, Space & Security (BDS) business comprises three segments: Boeing Military
Aircraft (BMA), Network & Space Systems (N&SS) and Global Services & Support (GS&S);
and
! Boeing Capital (BCC).
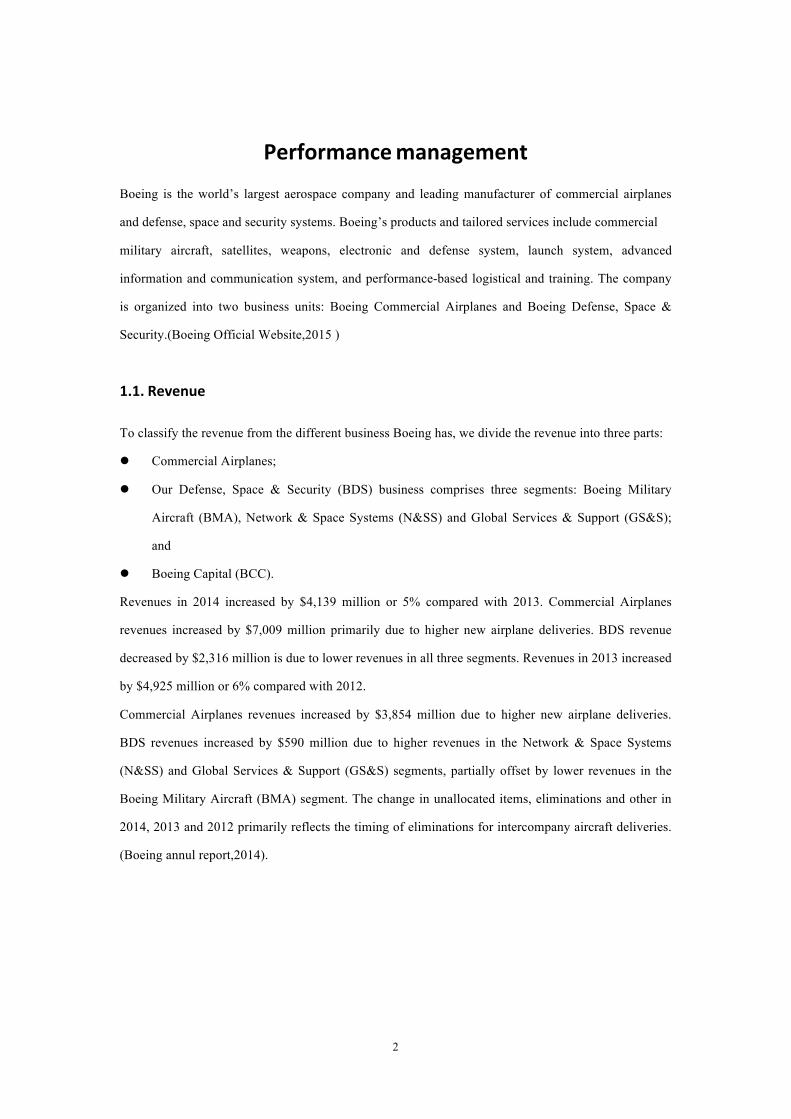
Revenues in 2014 increased by $4,139 million or 5% compared with 2013. Commercial Airplanes
revenues increased by $7,009 million primarily due to higher new airplane deliveries. BDS revenue
decreased by $2,316 million is due to lower revenues in all three segments. Revenues in 2013 increased
by $4,925 million or 6% compared with 2012.
Commercial Airplanes revenues increased by $3,854 million due to higher new airplane deliveries.
BDS revenues increased by $590 million due to higher revenues in the Network & Space Systems
(N&SS) and Global Services & Support (GS&S) segments, partially offset by lower revenues in the
Boeing Military Aircraft (BMA) segment. The change in unallocated items, eliminations and other in
2014, 2013 and 2012 primarily reflects the timing of eliminations for intercompany aircraft deliveries.
(Boeing annul report,2014).
3
And we can see from the graph, the increase of revenue is predominantly the result of the increase of
commercial airplanes revenue. Boeing has continually been in a strong grow in commercial airplane
area, which has driven its revenue to a successful growth. In 2010,Boeing delivered 462 commercial
airplanes, but in 2014,it has broken the record and delivered 723 commercial jets. Also Boeing has
increased its record backlog to nearly 5,800 airplanes worth $440 billion.
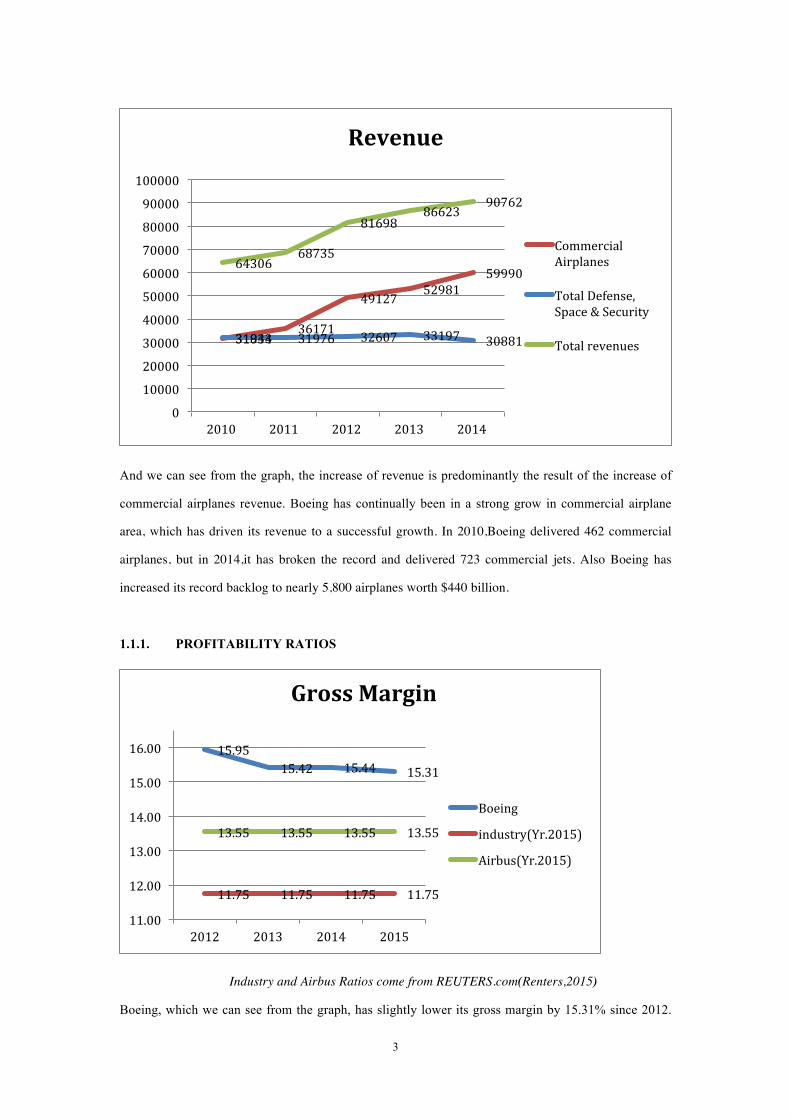
1.1.1. PROFITABILITY RATIOS
Industry and Airbus Ratios come from REUTERS.com(Renters,2015)
Boeing, which we can see from the graph, has slightly lower its gross margin by 15.31% since 2012.
31834 36171
49127 52981
59990
31943 31976 32607 33197 30881
64306 68735
81698 86623
90762
0
10000
20000
30000
40000
50000
60000
70000
80000
90000
100000
2010 2011 2012 2013 2014
Revenue
Commercial Airplanes
Total Defense, Space & Security
Total revenues
15.95 15.42 15.44 15.31
11.75 11.75 11.75 11.75
13.55 13.55 13.55 13.55
11.00
12.00
13.00
14.00
15.00
16.00
2012 2013 2014 2015
Gross Margin
Boeing
industry(Yr.2015)
Airbus(Yr.2015)

4
That probably because of the program accounting that Boeing is using. Program accounting requires
the demonstrated ability to reliably estimate the relationship of sales to costs for the defined program
accounting quantity. At the beginning of a program, such as the 787 program, it required a higher unit
production costs and substantial investment. This will raise the operating cost and drop Gross margin
down. But compared to industry and the biggest competitor Airbus Group, Boeing is still much higher
than them, which indicates its perfect job on manufacture process.
Boeing ‘s operating margin was decreased slightly in 2013 but increased significantly in 2014 and
2015, this primarily because of the higher delivers of commercial airplanes and also because of the
lower research and development expense which partially offset by the dilutive impact of 787 deliveries.
The operation margin of Boeing is much larger than Airbus, reflects it is more efficient and profitable
than Airbus. But as a leader company in the industry, Boeing still invest a huge amount of money in its
new commercial airplanes and DSS, making its margin lower than the industry average.
7.70 7.58 8.23 8.56
12.65 12.65 12.65 12.65
6.91 6.91 6.91 6.91
6.00
7.00
8.00
9.00
10.00
11.00
12.00
13.00
2012 2013 2014 2015
Operating Margin
Boeing
industry(Yr.2015)
Airbus(Yr.2015)

5
1.1.2. Efficiency
To compare the efficiency of the company, we compare Boeing Airbus and the industry in three
dimensions: Receivable Turnover, Inventory Turnover and Asset Turnover. As for receivable turnover,
Boeing has the highest in 11.65, which is much higher than the industry average. That means Boeing
has a high proportion of quality customers that pay off their debts quickly. And it may also indicate
that the company’s collection of accounts receivable is efficient. The company, which has a
conservative policy, will filters out customers who may be more likely to take a long time in paying
their debts, but it also may drive away potential customers and give business to competitors because
the credit is too tight.
Inventory turnover is a ratio showing how many times a company's inventory is sold and replaced over
a period. Boeing’s inventory turnover shows that it can replace its inventory 1.72 times in a year, which
is lower than the industry average ratio. This is a bad sign for company because it shows that the hold
cost is high, and because Boeing is mainly sold the jets through contact, in some point it can prevent
the inventory being deteriorated, and make the company have high ability to stable the price.
Boeing’s asset turnover is much beyond the average as well as its biggest competitor. This reflects the
company is so efficient at making revenue by its asset.
11.65
1.72 1.01
3.53 2.51
0.43
10.26
1.87 0.64
0
2
4
6
8
10
12
14
Receivable Turnover Inventory Turnover Asset Turnover
Ef4iciency
Boeing
industry
Airbus

6
1.1.3. Management Effectiveness
When we compare Boeing’s management effectiveness with industry level and its competitor, we can
see Boeing did quite well in ROA, ROI and ROE. Both return on asset and return on investment show
that Boeing is good at using its asset and investment to make net income. The company manages to
earn more money on less investment. And the high return on equity ratio shows Boeing is worthy to
hold the shares because its very profitable and it can generate a lot of profit with the money
shareholders have invested. And next we compare these three ratios in a vertical way.
Seeing from the graph, Boeing’s ROA and ROIC are almost increased yearly from 2012 to 2015, this
mainly due to the increasing selling of the commercial airplanes. But when we look at ROE, we will
find something interesting. There was a big drop of ROE in 2013 and then its back to normal again not
reaching 2012 level.
5.86
13.96
52.8
2.33 4.05
12.38
2.9 5.8
38.06
0
10
20
30
40
50
60
ROA ROI ROE
Management Effectiveness
Boeing
industry
Airbus
4.4 4.9 5.5 5.68
11.9 11.4 11.8
13.9
4.0
6.0
8.0
10.0
12.0
14.0
16.0
2012 2013 2014 2015
ROA&ROIC
ROA
ROIC
66.5
30.8
62.9
52.8
20.0
30.0
40.0
50.0
60.0
70.0
ROE
ROE
7
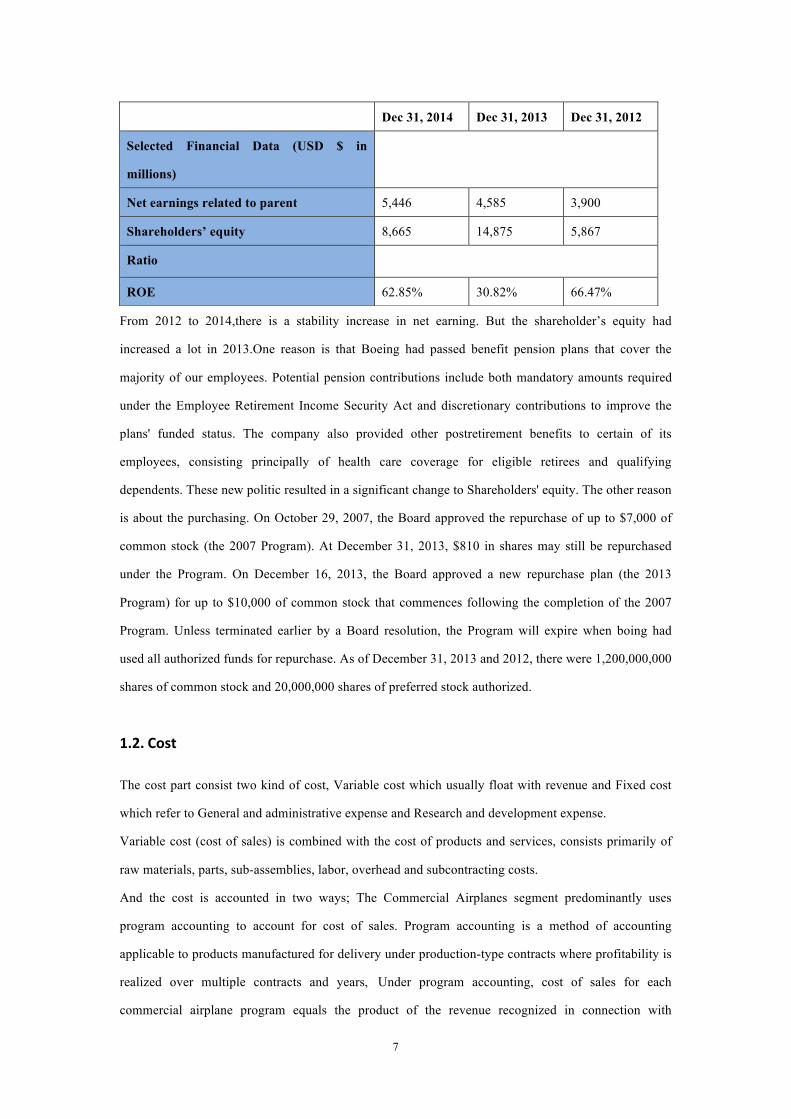
From 2012 to 2014,there is a stability increase in net earning. But the shareholder’s equity had
increased a lot in 2013.One reason is that Boeing had passed benefit pension plans that cover the
majority of our employees. Potential pension contributions include both mandatory amounts required
under the Employee Retirement Income Security Act and discretionary contributions to improve the
plans' funded status. The company also provided other postretirement benefits to certain of its
employees, consisting principally of health care coverage for eligible retirees and qualifying
dependents. These new politic resulted in a significant change to Shareholders' equity. The other reason
is about the purchasing. On October 29, 2007, the Board approved the repurchase of up to $7,000 of
common stock (the 2007 Program). At December 31, 2013, $810 in shares may still be repurchased
under the Program. On December 16, 2013, the Board approved a new repurchase plan (the 2013
Program) for up to $10,000 of common stock that commences following the completion of the 2007
Program. Unless terminated earlier by a Board resolution, the Program will expire when boing had
used all authorized funds for repurchase. As of December 31, 2013 and 2012, there were 1,200,000,000
shares of common stock and 20,000,000 shares of preferred stock authorized.
1.2. Cost
The cost part consist two kind of cost, Variable cost which usually float with revenue and Fixed cost
which refer to General and administrative expense and Research and development expense.
Variable cost (cost of sales) is combined with the cost of products and services, consists primarily of
raw materials, parts, sub-assemblies, labor, overhead and subcontracting costs.
And the cost is accounted in two ways; The Commercial Airplanes segment predominantly uses
program accounting to account for cost of sales. Program accounting is a method of accounting
applicable to products manufactured for delivery under production-type contracts where profitability is
realized over multiple contracts and years, Under program accounting, cost of sales for each
commercial airplane program equals the product of the revenue recognized in connection with
Dec 31, 2014 Dec 31, 2013 Dec 31, 2012
Selected Financial Data (USD $ in
millions)
Net earnings related to parent 5,446 4,585 3,900
Shareholders’ equity 8,665 14,875 5,867
Ratio
ROE 62.85% 30.82% 66.47%

8
customer deliveries and the estimated cost of sales percentage applicable to the total remaining
program. And the BDS mainly use contract counting, under which circumstance the cost of sales is
determined by applying the estimated cost of sales percentage to the amount of revenue recognized.
The cost of service reminds stable and the cost of product increase almost with the same speed as the
increase of revenue.
There is a continually small decrease in fix cost, mainly contributed by the decrease in research and
development expense. Boeing is trying to lower the devotement cost to become more competitive.
Engineering teams are focusing on designs that are more producible, using more common systems and
parts, and adhering to our disciplined, gated development process.
-‐46,642
-‐60,309 -‐65,640 -‐68,551
-‐9,097 -‐8,247 -‐7,553 -‐8,132
-‐55,739
-‐68,556 -‐73,193 -‐76,683
-‐90,000 -‐80,000 -‐70,000 -‐60,000 -‐50,000 -‐40,000 -‐30,000 -‐20,000 -‐10,000
0 2011 2012 2013 2014
Variable cost
Cost of products
Cost of services
Variable cost
-‐3,644 -‐3,408 -‐3,717 -‐3,956 -‐3,767 -‐4,121 -‐3,918 -‐3,298 -‐3,071 -‐3,047
-‐7,765 -‐7,326 -‐7,015 -‐7,027 -‐6,814
-‐9,000 -‐8,000 -‐7,000 -‐6,000 -‐5,000 -‐4,000 -‐3,000 -‐2,000 -‐1,000
0 2010 2011 2012 2013 2014
Fix cost
General and administrative expense
Research and development expense, net
Fix cost

9
1.2.1. Interest Cover Ratio
Year 2012 2013 2014
Earnings Before Interest And Taxes 6,352 6,618 7,470
Interest Expense 442 386 333
Interest Cover Ratio 14.37 17.15 22.43
Interest cover ratio of Boeing is increasing every year which means Boeing can pay interest on
outstanding debt easily. This happens both because the increasing of EBIT and the decreasing of
interest expense. BCC’s earnings from operations are presented net of interest expense, provision for
(recovery of) losses, asset impairment expense, depreciation on leased equipment and other operating
expenses, drop the interest expense.
And when we check the table below, we can find the Boeing’s ratio is more than 8.5. So it’s rating is
AAA, so we can get that the spread is 0.5%.
If interest coverage ratio is
> ≤ to Rating is Spread is
-100000 0.199999 D 15.00%
0.2 0.649999 C 12.00%
0.65 0.799999 CC 10.00%
0.8 1.249999 CCC 8.50%
1.25 1.499999 B- 5.50%
1.5 1.749999 B 5.25%
1.75 1.999999 B+ 4.25%
2 2.2499999 BB 4.00%
2.25 2.49999 BB+ 3.50%
2.5 2.999999 BBB 2.00%
3 4.249999 A- 1.50%
4.25 5.499999 A 1.25%
5.5 6.499999 A+ 1.00%
6.5 8.499999 AA 0.75%
8.50 100000 AAA 0.50%
1.2.2. GEARING
When we look at the gearing, we can see the Boeing’s gearing is very high(more than 100%), that
normally means the company is at a high risk. A lot of debt is used to finance increased operations. the

10
company could potentially generate more earnings than it would have without this outside financing. If
this were to increase earnings by a greater amount than the debt cost, then the shareholders benefit as
more earnings are being spread among the same amount of shareholders.(Investopedia,2015)
However, if the cost of this debt financing ends up losing money stakeholders’ share values may be
more harmfully hit. So this might be a boom in the future if Boeing’s revenue starts to drop.
1.2.3. WACC vs. ROIC
In %
CAPM 10.887 Total Equity 14,997
Cost of debt 4.5 Long-term Debt 8,141
WACC 8.64
First, we calculate the cost of debt=risk free rate (which is 4%) plus spread (0.5%)=4.5%. Then we
calculate the CAPM =risk free rate+β*equity risk premium=4%+0.97*7.1%=10.89%. Finally we use
WACC formula: WACC=E/LD*CAPM+LD/E*Cost of debt=8.64.
As we have mentioned before, the ROIC of Boeing is 11.7 in 2014 larger than WACC. So we can
assume that growth adds value, for every dollar of investment the company attracts it earns with more
than it pays out. And as the ROIC is always higher than WACC in Boeing’s case, it probably means
there is a moat in this company and make it continually generate value for its shareholders. We will
discuss about the moat in strategy part.
1.2.4. Operation Cash Flow
OCF (CAGR 10Y) 2012 2013 2014 2015 2016 2017 2018 2019 2020
REV 81,698 86,623 90,762 95,877 101,280 106,988 113,017 119,386 126,114
Net Profit 3,900 4,584 5,446 5,753 6,077 6,420 6,781 7,164 7,567
D&A 1,811 1,844 1,906 1,906 1,906 1,906 1,906 1,906 1,906
OCF 5,711 6,428 7,352 7,659 7,983 8,326 8,687 9,070 9,473
Discount factor
0.920 0.847 0.780 0.718 0.661 0.608
PV of OCF
2015-2020 7,050 6,764 6,493 6,236 5,993 5,762
First we use the revenue of 2004(52,457) and the revenue of 2014(90,762) to calculate the 10 years
GAGR, which is 0.06. Then we use it to estimate the year 2015-2020’s operation cash flow. And we
use discount factor to make the operating cash flow into present value. Next we use the number of
2020, long-term growth and WACC to calculate the terminal value. We add present value and terminal

11
value to figure out the firm value.
However, the firm value still omits a company’s debt on the one hand and its cash reserves on the other,
when the firm is sold to a new owner, buyer has to pay the equity value and also repay the firm’s debts
and cash, which is net debt. So we use firm value plus net debt to get enterprise value. At last we
compare the enterprise value with the stock market value to see Boeing’s performance.
Sum of PV of OCF 2015-2020 38,298
Terminal Value 102,166
Net Debt -4,186
Firm value 140,463.72
Enterprise Value 136,277.72
Stock Market Value 99,117.38
So if we estimate the operation cash flow using the 10 years GAGR, we get the enterprise value is 35%
higher than the stock market value. And if we want to estimate the OCF based on recent year, we use
the GAGR of 3 years (0.04), through this we get another table.
Sum of PV of OCF 2015-2020 36,377
Terminal Value 93,044
Net Debt -4,186
Firm value 129,421.45
Enterprise Value 125,235.45
Stock Market Value 99,117.38
From this table we can see even if we use a lower GAGR, the enterprise value is still about 25% higher
than stock market value.
From the stock market view, it might be a chance for investors because Boeing’s stock is under valued,
and the stock price still has a large room to climb. But, in Boeing’s view, this might be a bad news
because it reflects the market’s mistrust of Boeing Company. They do not trust Boeing can still have a
high revenue growth in the future. This will make the company’s decision makers think more about
how to persuade investors to come with more money.

12
Corporation strategy
The global airline industry has grown significantly consisting of over 2,000 carriers worldwide,
operating over 23,000 aircraft, and servicing over 3,700 airports. On the average annually, world
airlines flew approximately about twenty eight million (28 million) scheduled flights carrying over 2
billion passengers (IATA, 2006). While air travel has become commonplace as it is becoming more
and more affordable to various income classes of the society, more and more jets are needed today,
especially in the emerging market. The airplane manufacture industry still has a huge growth even in
today. Through Boeing is one of the leading companies, how to survive and be competitive is always a
primary issue on the table.
1.3. Macro-‐environmental
The external environment consists of external influences that affect the firm’s decision-making process
and performance. As an airplane manufacture company, the external marketing environment has a
great influence on Boeing. It is in an area fulfilled with fierce competition and government and politic
also playing a very important role in Boeing’s business. To have a look at what this company is facing
in nowadays world first we analysis the PEST of the market, which refer to P-Political, E – Economic,
S – Social and T – Technological.
1.3.1. Political
Prior to 1970’s, the airline industry was mainly owned and controlled by the governments in different
countries. There was no free market competition, as travelers have to make do with the services and
prices available to them from the few airlines. Now thought things become different. As in commercial
airplane area, because of its large profit that can bring to a country, government now has promoted the
development of the airline industry by providing infrastructure, research and development, subsidies,
protective regulation and outright ownership of airlines. For Boeing, it has deep relations and strong
agreements with US Government and Federal Aviation Administration (FAA), so the policies of the
US government may be a major driving force in accepting new orders of aircrafts. A good side is that
trading of large commercial jetliners has been tariff free since 1979 (GATT, 1994) and ‘Open Skies’
agreement of US government with other countries (US Department of State, 2011). A bad side is the
government have come out a restrictions of selling specific equipment or airplanes to particular
countries like Iran, Iraq, Afghanistan and Pakistan, in which case drive down Boeing’s sales.
1.3.2. Economic
First the cost of jet aircraft depends heavily on raw materials and fuels. A higher price of fuel and the
security equipment is due to terrorism threat especially after 2001 will intensively increase the cost of
13
capital. And another very important economy factor about these kinds of companies is the governments’
subsidies. This is mainly reflects on the competition between Boeing and airbus group. Boeing is
subsided a lot by U.S. government, According to Monday's ruling, the WTO's appellate body said
Boeing received between $3 billion and $4 billion in U.S. subsidies over a period of 8 years. And
Airbus also received a large deal of subsidies owned by European Aeronautic Defense & Space Co.
(EADS) from EU governments like Germany, France, the United Kingdom, and Spain. In 2012 The
World Trade Organization issued a ruling Monday to settle a dispute between the European Union and
United States over subsidies received by Boeing. (Ben Rooney, 2012) But until now the conflict still
remind between these two companies as a part of their fight.
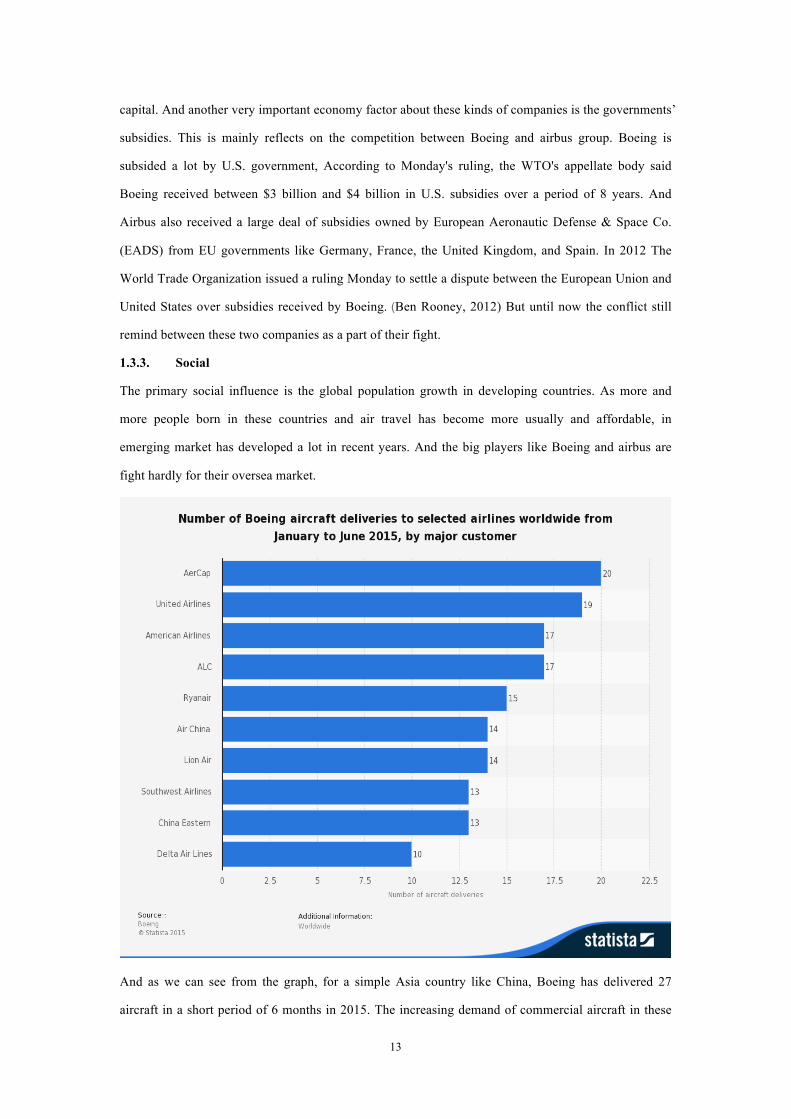
1.3.3. Social
The primary social influence is the global population growth in developing countries. As more and
more people born in these countries and air travel has become more usually and affordable, in
emerging market has developed a lot in recent years. And the big players like Boeing and airbus are
fight hardly for their oversea market.
And as we can see from the graph, for a simple Asia country like China, Boeing has delivered 27
aircraft in a short period of 6 months in 2015. The increasing demand of commercial aircraft in these

14
countries can bring in large revenues for Boeing.
1.3.4. Technological
Boeing has an edge over Airbus and other competitors in using composite lightweight material in the
development of commercial airplanes (Cohan, 2011). And also Boeing is focus on use technology to
develop aircraft more efficiency. To break the upward spiral of development costs, its engineering
teams are focusing on designs that are more producible, using more common systems and parts, and
adhering to our disciplined, gated development process. Tangible benefits of these efforts are evident
on 787, 737 MAX and 777X development programs. For example, more than 90 percent of the 787-10
will be common with the 787-9, which will drive significant efficiencies through the development
process, production system and supply chain. (Boeing annual report, 2014).
1.3.5. Porter’s five forces
The five forces of Porter’s model are threat of new entrants, threat of substitute products, the
bargaining power of suppliers, the bargaining power of customers, and rivalry among competitors. It
shows that how Boeing’s long-term business strategy meet opportunities and threats in the external
environment.
1.3.5.1. Threat of new entrance:
Though the barriers of aircraft manufacture company is very high. One reason is to start a company
like this, you need a lot of money and recourse and also your own technology, and it’s not a company
that you can simply copy the counterparts. The other reason is even you have the resource and money
to build this kind of company, you can’t be a threat in a short time. It will cost a longtime to get to the
break-even point and become profitable.
But now there is indeed a new threat appears. China is also arming into aviation market. The first plane
produced by a Chinese government initiative to compete in the market for large passenger jetliners has
been unveiled in Shanghai. The Commercial Aircraft Corporation of China (COMAC) showed off its
twin-engine C919 in a ceremony on Monday attended by some 4,000 government officials and other
guests at a hangar near the Pudong International Airport. (ALJAZEERA, 2015). Though today the
China's aviation market is still shared by Boeing and Airbus equitably. The ruling Communist Party
wants to claw back some of the commercial benefits that flow to foreign suppliers. And with its power
of manufacturing and the government’s support, China is expected to add 6,330 new aircraft worth
$950bn to its commercial fleet by 2034, Boeing estimates. (ALJAZEERA, 2015).
1.3.5.2. Threat of substitutes:
The substitutes of airplane mainly refer to other transport like cars, trains and ships, and as trains
nowadays become faster and cheaper. In short travel, it may have an influence on airplane. But

15
consider of long distance travel, plane is still the main transport because it ignores the influence of
topography and save a lot more time than train.
1.3.5.3. Bargaining power of suppliers:
The bargaining power of suppliers is high in Boeing as well as the total aircraft industry. The
company’s new planes depend a lot on the suppliers, and in some case like Boeing’s 787 Dreamliner
project, the plane is delayed because of its supplies and cause a big problem to Boeing as it lost
effective control.
1.3.5.4. Bargaining power of customers:
The bargaining power of customer is low in this kind of companies because customer do not have
many choice, the only two big commercial plane made companies are Boeing and Airbus. And as an
airline company, it has to take the price if it wants to have more planes. And the switch cost between
these two companies is also very high. Because of the different control system, the airline companies
can’t afford to change the crews if they want to change the company if planes.
1.3.5.5. Competitive between competitors:

16
Looking at the table of the revenue of worldwide aircraft manufacturers and suppliers, Airbus is no
doubt to be the leading competitor of Boeing. And the competition with Airbus in the commercial
airplane has a significant influence of Boeing.
This graph shows more clearly how fierce is the competition between these two companies. Boeing and
Airbus is playing a race with each other and people can’t tell who is the winner at last. As in 2014,
Boeing delivered more passenger jets than its European rival, but Airbus crossed the finish line with a
higher level of orders. In detail, Airbus hit a record to supply 629 aircraft in 2014, marking 13
consecutive years of increased deliveries. This fell short of Boeing’s 723 deliveries in the period,
however, making the US group the world’s largest manufacturer of aircraft for the third year in a row.
(Peggy Hollinger, 2015).
And also the competition reflects in take more amount in the new market, with the rapid growth of
market in China and Latin American, these two companies are targeting at the international airplane
market.
In hard numbers, Boeing expects Latin American buyers to buy 3,020 new airplanes over the next 20
years, and to spend perhaps $350 billion acquiring them. About 340 of these aircraft will be
long-distance wide body jets, costing as much as $400 million a pop, and 160 or so will be much
cheaper small regional aircraft, carrying 90 passengers or less. (Rich Smith, 2015)

17
Region Population in 2015 Plane Demand (Through
2034)
Inhabitants per Plane
China 1.364 billion 6,330 215,481
South America 525 million 3,050 172,131
Mideast 357 million 3,180 112,264
1.4. SWOT
SWOT is a method for us to analysis the internal strength, weakness of the company and also the
potential opportunities and threats in the external environment.
1.4.1. Strength
The major strength of Boeing is that it’s still the leader of Innovation and Technical Expertise, and the
company has worldwide strong reputation of quality and industry leadership. With the large share of
commercial airplanes and also the business in Defense, Space & Security and Boeing Military Aircraft,
Boeing is not a normal airplane manufacturer but like the symbol of high tech and explorer of the
future airplanes. It’s a company that has an international market of the whole world providing its
products and services to over 90 countries. And its large revenue comes from not only commercial
airplanes but more than 6 divisions. A tight support from the US government also enhances the
strength of the company.
Another strength is reflected by the company’s perfect performance, we can see from the management
effectiveness that the company has a higher ROE, ROA and ROIC than industry average. Strong core
operating performance companywide raised core earnings, and make the company has a higher
enterprises value than its stock market value.
1.4.2. Weaknesses:
One of the weakness is that Boeing depends too much on it suppliers. The company is highly
dependent on the availability of essential materials, parts and subassemblies from our suppliers and
subcontractors. Although alternative sources generally exist for these raw materials, qualification of the
sources could take one year or more. Many major components and product equipment items are
procured or subcontracted on a sole-source basis with a number of companies.
While Boeing maintain an extensive qualification and performance surveillance system to control risk
associated with such reliance on third parties, failure of suppliers or subcontractors to meet
commitments could adversely affect production schedules and program/contract profitability. (Boeing
annul report, 2014)

18
1.4.3. Opportunities
The biggest opportunity is the growing market of airplane in emerging countries especially like
countries in Asia and Latin America. Also the surge of spending heavy amounts on defense and
security because of the tourists these days also increases Boeing’s market in military aircraft. Another
opportunity is new technology making Boeing save more cost in develop new jets and build lighter,
longer-range aircraft. Like Airbus is wooing new customers by increasing the number of seats in the
cabin (Peggy Hollinger, 2015), Boeing also has the opportunity to attract more customers after its new,
fuel-efficient 737 MAX delivered in 2017 and The 787-10 Dreamliner, the third and longest member of
the 787 family being delivered in 2018. (Boeing annual report, 2014)
1.4.4. Threats
One of the threats is a Boeing’s commercial airplane business depends heavily on the airline companies.
Because the it usually does business by longtime contact, the macroeconomic influence such as
sustained economic growth and political stability will both affect deliveries over a long period.
Commercial aircraft sales contracts are often entered into years before the aircraft are delivered.
Because the contracts are usually signed with a fixed-price, if the company has cost overruns or if
increases in its costs exceed the applicable escalation rate, the company will have a loss in its profit.
The other threat is new competitor coming from the emerging countries such as China, these may not
happen in a short term, but someday, with airplane become a common transport and technical barriers
is not that strong, Boeing has to deal with the new competitors joining this big market.
Conclusion
In this research, first we analysis the financial performance of Boeing company, the ratios are healthy
and stable (except the equity floating in 2013 because of the new pension project and the repurchase of
the stock). The company has a good gross profit margin above average and an increasing operating
profit margin. The company is managed efficient with a high and rising ROA and ROIC ratio. The
gearing is high which can bring shareholders a lot of profit but also with a high risk.And the WACC is
lower than ROIC which means the return on capital is more than the cost of capital, Boeing is using its
capital to earn money. At last we calculated the enterprise value and compare it to the stock market
value, the higher enterprise value indicates two thing, one is the company is underestimate by investors.
Or it might be the market’s lack of confidence about Boeing’s ability to keep that growth of profit.
Then we analysis both the internal and external environment of the company. Thought the aerospace
industry id full of competition, Boeing has kept its leading position by its large scale, leading
technology and the support from US government. But we can see the threats of the companying are
19
also coming, one is from the competition with Airbus, and also the new companies from developing
countries like China could also be a big threat.
The way to go out first is to enhance the company’s performance especially the control of the suppliers
and subcontractors to avoid the risk of being delay or over cost. The second is widening its
international business, catching the opportunity of fast market growth in the East Asia and Latin
America.
References
[1] Boeing Official Website,(2015). Boeing in brief. Available from:
<http://www.boeing.com/company/general-info/> [27 November 2015]
[2] The Boeing company,(2014) Annual Report,2014 ,Available from:
<http://www.boeing.com/assets/pdf/companyoffices/financial/finreports/annual/2014/annual_rep
ort.pdf> [31 December 2014]
[3] Reuters, (2015). Financials: Boeing Co (BA.N). Available from
<http://www.reuters.com/finance/stocks/financialHighlights?symbol=BA.N#Rj8DkqOXcIVbIUb
G.97> [27 November 2015]
[4] Reuters, (2015). Financials: Airbus Group SE (AIR.PA). Available from <
http://www.reuters.com/finance/stocks/financialHighlights?symbol=AIR.PA#1j1GTY4QdPeJIT7
B.97 > [27 November 2015]
[5] Investopedia,(2015). Debt/Equity Ratio, Available from:
<http://www.investopedia.com/terms/d/debtequityratio.asp> [27 November 2015]
[6] US Department of State, (2011). Open Skies Partners, Bureau of Economic and Business
Affairs, Washington, [online]. Available from:
<http://www.state.gov/e/eb/rls/othr/ata/114805.htm> [23 April 2012]
[7] Ben Rooney,(2012). U.S. and EU claim victory in Boeing subsidy case, CNN money.
Available from: <http://money.cnn.com/2012/03/12/markets/boeing-airbus-wto/> [12 March
2012]
[8] Cohan, P., (2011). Boeing's Dreamliner Delays: outsourcing goes too far, Daily Finance, [21
January 2011]
[9] ALJAZEERA, (2015). First China-made passenger jet leaves production line, BUSINESS &
ECONOMY, Available from:
<http://www.aljazeera.com/news/2015/11/china-passenger-jet-leaves-production-line-151102054
428051.html> [02 Nov 2015]

20
[10] Peggy Hollinger,(2015), Boeing beats Airbus to title of largest jet maker in 2014, financial
time, Available from
<http://www.ft.com/intl/cms/s/0/a2f9121c-9aa0-11e4-86c2-00144feabdc0.html#axzz3saEWODJ
s> [13 January 2015]
[11] Rich Smith,(2015). Boeing Sees a Brave "New World" for Planes Business, Fool.com,
Available from:
<http://www.fool.com/investing/general/2015/11/25/boeing-sees-a-brave-new-world-for-planes-
business.aspx?source=eogyholnk0000001&utm_source=yahoo&utm_medium=feed&utm_camp
aign=article> [25 November 2015]
[12] Statista, (2015). Statistics and Market Data about Aerospace Manufacturing, Aerospace
Manufacturing, Available from:
<http://www.statista.com/markets/407/topic/939/aerospace-manufacturing/> [27 November
2015]
Related Documents