Mal J Nutr 15(2) : 97 - 119, 2009 Body Mass Index (BMI) of Adults: Findings of the Malaysian Adult Nutrition Survey (MANS) Azmi MY 1 , Junidah R 2 , Siti Mariam A 2 , Safiah MY 3 , Fatimah S 2 , Norimah AK 4 , Poh BK 4 , Kandiah M 5 , Zalilah MS 5 , Wan Abdul Manan WM 6 , Siti Haslinda MD 7 & Tahir A 7 1 Johor State Health Department, Malaysia 2 Nutrition Division, Ministry of Health, Malaysia 3 Faculty of Health Sciences, Univeriti Teknologi MARA 4 Department of Nutrition and Dietetics, Faculty of Allied Health Sciences Universiti Kebangsaan Malaysia 5 Department of Nutrition and Dietetics, Faculty of Medicine and Health Sciences Universiti Putra Malaysia 6 School of Health Sciences, Universiti Sains Malaysia 7 Institute for Health System Research, Ministry of Health, Malaysia ABSTRACT The Malaysian Adults Nutrition Survey (MANS) was carried out between October 2002 and July 2003, involving 6,775 men and 3,441 women aged 18 – 59 years. Anthropometric assessment showed that the overall mean body weight and BMI were 62.65 kg (CI: 62.20, 63.09) and 24.37 kg/m 2 (CI: 24.21, 24.53) respectively. Based on the WHO (1998) classification of BMI, 12.15% (CI: 11.26, 13.10) were obese (BMI > 30 kg/m 2 ), and 26.71% (CI: 25.50, 27.96) overweight (BMI > 25 - 29.9 kg/m 2 ). Significantly, more women were obese [14.66% (CI: 13.37, 16.04)] while significantly more men were overweight [28.55% (CI: 26.77, 30.40)]. Ethnicity- wise, prevalence of obesity was highest among the Malays [15.28% (CI: 13.91, 16.77)] while overweight was highest for the Indians [31.01% (CI: 26.64, 35.76)]. Both obesity and overweight were highest among those aged 40 - 49 years. Obesity was highest for those whose household income was between RM1,500 - 3,500 while overweight was more prevalent for those whose household income exceeded RM3,500. The prevalence of overweight was highest for those with primary education [31.90% (CI: 29.21, 34.72)]. There was no significant urban- rural differential in both obesity and overweight. The study found 9.02% (CI: 8.82, 10.61) with chronic energy deficiency (CED) (BMI < 18.5 kg/m 2 ). The prevalence of CED was relatively higher in the indigenous population (Orang Asli) [14.53% (CI: 5.14, 34.77)], subjects aged 18-19 years [26.24% (CI: 21.12, 32.09)], and with monthly household income of < RM1,500 [10.85% (CI: 9.63, 12.20)]. The prevalence of CED was not significantly different among the geographical zones and educational levels, and between urban/rural areas and sexes. The results call for priority action to address the serious problem of overweight and obesity among Malaysian adults as it poses a grave burden to the country’s resources and development. Keywords: Adults, BMI, findings from MANS Correspondence author: Azmi MY; Email: [email protected]

Welcome message from author
This document is posted to help you gain knowledge. Please leave a comment to let me know what you think about it! Share it to your friends and learn new things together.
Transcript

Mal J Nutr 15(2) : 97 - 119, 2009
Body Mass Index (BMI) of Adults: Findings of theMalaysian Adult Nutrition Survey (MANS)
Azmi MY1, Junidah R2, Siti Mariam A2, Safiah MY3, Fatimah S2, Norimah AK4, Poh BK4,Kandiah M5, Zalilah MS5 , Wan Abdul Manan WM6, Siti Haslinda MD7 & Tahir A7
1 Johor State Health Department, Malaysia2 Nutrition Division, Ministry of Health, Malaysia3 Faculty of Health Sciences, Univeriti Teknologi MARA4 Department of Nutrition and Dietetics, Faculty of Allied Health Sciences
Universiti Kebangsaan Malaysia5 Department of Nutrition and Dietetics, Faculty of Medicine and Health Sciences
Universiti Putra Malaysia6 School of Health Sciences, Universiti Sains Malaysia7 Institute for Health System Research, Ministry of Health, Malaysia
ABSTRACT
The Malaysian Adults Nutrition Survey (MANS) was carried out between October2002 and July 2003, involving 6,775 men and 3,441 women aged 18 – 59 years.Anthropometric assessment showed that the overall mean body weight and BMIwere 62.65 kg (CI: 62.20, 63.09) and 24.37 kg/m2 (CI: 24.21, 24.53) respectively.Based on the WHO (1998) classification of BMI, 12.15% (CI: 11.26, 13.10) wereobese (BMI > 30 kg/m2), and 26.71% (CI: 25.50, 27.96) overweight (BMI > 25 - 29.9kg/m2). Significantly, more women were obese [14.66% (CI: 13.37, 16.04)] whilesignificantly more men were overweight [28.55% (CI: 26.77, 30.40)]. Ethnicity-wise, prevalence of obesity was highest among the Malays [15.28% (CI: 13.91,16.77)] while overweight was highest for the Indians [31.01% (CI: 26.64, 35.76)].Both obesity and overweight were highest among those aged 40 - 49 years.Obesity was highest for those whose household income was between RM1,500 -3,500 while overweight was more prevalent for those whose household incomeexceeded RM3,500. The prevalence of overweight was highest for those withprimary education [31.90% (CI: 29.21, 34.72)]. There was no significant urban-rural differential in both obesity and overweight. The study found 9.02% (CI:8.82, 10.61) with chronic energy deficiency (CED) (BMI < 18.5 kg/m2). Theprevalence of CED was relatively higher in the indigenous population (OrangAsli) [14.53% (CI: 5.14, 34.77)], subjects aged 18-19 years [26.24% (CI: 21.12, 32.09)],and with monthly household income of < RM1,500 [10.85% (CI: 9.63, 12.20)]. Theprevalence of CED was not significantly different among the geographical zonesand educational levels, and between urban/rural areas and sexes. The resultscall for priority action to address the serious problem of overweight and obesityamong Malaysian adults as it poses a grave burden to the country’s resourcesand development.
Keywords: Adults, BMI, findings from MANS
Correspondence author: Azmi MY; Email: [email protected]

Azmi MY, Junidah R, Siti Mariam A et al.98
INTRODUCTION
Obesity is a complex condition that comesabout as a result of dietary excesses and asedentary lifestyle. Globally 300 millionadults were reported to be obese in the year2000. At the same time, another 1 billionadults were overweight (WHO, 1998). Inboth men and women, obesity is a major riskfactor for diabetes, cardiovascular disease,hypertension and stroke, and certain formsof cancer. These can result in an increasedrisk of premature deaths or serious chronicconditions that impair the overall quality ofhuman life.
On the other hand, adult chronic energydeficiency (CED) can lead to a decline inhealth status and productivity of workers,which could impede the country’s economicdevelopment (James & Ralph, 1998). Amongwomen, pregnancy and its outcome will becompromised by CED, impacting on thehealth and nutritional status of futuregenerations.
Studies as early as in 1976 indicated thatMalaysians have both spectrums of theweight problem (Jones, 1976). The problemaffects both the poor rural adult villagepopulation (Chong, Tee & Ng, 1984) andurban executives (Teo, Chong & M Zaini,1988). Over the years, the weight problemhas been found to be higher among theIndians and the Malays. Ismail et al. (1995)reported high prevalence of overweight andobesity among Indian women (29.8% and16.5% respectively) and among urban Malaymen (23.9% and 5.6% respectively).
According to the Second NationalHealth and Morbidity Survey (NHMSll), theoverall prevalence of obesity among adultswas 4.4% and that of overweight was 16.6%while the prevalence of CED was 25.2%(Fatimah et al., 1997). Among adult men inrural villages and estates, 4.2% were obese,19.8% were overweight and 13.2% wereCED. Among women, 11.1% were obese,28.0% were overweight and 12.4% were CED(Khor et al., 1999).
The first comprehensive MalaysianNutrition Survey on Adults (MANS)included assessment of dietary intakes, mealpatterns, supplement intakes and physicalactivities. The present report focuses on theanthropometric assessment of Malaysianadults aged 18-59 years. The objectives ofthis report are to determine (i) the meanweight and mean BMI; and (ii) the prevalenceof obesity, overweight and CED using WHOBMI classification according to socio-demographic characteristics.
METHODOLOGY
The Malaysian Adults Nutrition Survey(MANS) was carried out from October 2002to July 2003 among 3,334 men and 3,441women aged 18 - 59 years old divided intosix geographical zones namely the NorthZone (Perlis, Kedah and Pulau Pinang),Central Zone (Perak, Selangor and WilayahPersekutuan Kuala Lumpur), South Zone(Negeri Sembilan, Melaka and Johor), EastCoast Zone (Kelantan, Pahang and Tereng-ganu), Sabah and Sarawak (MOH, 2008).
Weight and height of adults were takenby trained personnel working in pairs usingstandard procedures and standard digitalweighing scales (Seca 880) and body meters(Seca 208) which were calibrated everymorning. Subjects were measured in theirhomes. Women subjects included postnatalmothers but not those who were pregnant.Body weight was measured to the nearest0.1 kg while height was measured to thenearest 0.1 cm. All readings were taken andrecorded in triplicates.
The BMI was calculated by dividingweight in kilograms by height in meterssquared (WHO, 1998). The calculation of theBMIs was carried out using SPSS version 13with complex sampling module. Using theBMIs, subjects were assigned to variousweight categories based on a modified WHOClassification (Table 1) where CED Class I,CED Class II, CED Class III and ObesityClass I, Obesity Class II and Obesity Class
Body Mass Index (BMI) of Adults: Findings of the Malaysian Adult Nutrition Survey (MANS) 99
III were respectively combined as CED andobesity.
Mean weight, mean BMIs and theprevalence of CED, overweight and obesitywere analysed according to the nine socio-economic characteristics namely, zone,strata, ethnic, sex, age, household income,education and occupation. Additionalanalysis was also carried out for the menand women separately. Significance ofdifferences was conducted between zone,urban-rural stratum, sex and age. Resultsare reported as means, confidence intervals(CI) and at 5% level of significance.
RESULTS
Mean body weight (Appendix 1)
The overall mean body weight and BMI ofadult Malaysians aged 18 - 59 years were62.65 kg (CI: 62.20, 63.09) and 24.37 kg/m2
(CI: 24.21, 24.53) respectively. The mean bodyweight for those in the South [64.42 kg (CI:63.46, 65.38)] and Central Zone [63.40 kg (CI:62.56, 64.23)] was significantly higher thanthe mean body weight of adults in Sarawak[60.66 kg (CI: 59.43, 61.88)] and Sabah [58.93kg (CI: 57.86, 60.01)]. Men [66.56 kg (CI:65.91, 67.21)] had significantly higher meanbody weight compared to women [58.44 kg(CI: 57.88, 59.00)] and were on average at
least 8 kg heavier than women. Urban men[67.85 kg (CI: 66.94, 68.76)] were heavier thanrural men [64.66 kg (CI: 63.79, 65.53)] buturban women [58.46 kg (CI: 57.72, 59.20)]were not heavier than rural women [58.42kg (CI: 57.55, 59.29)].
Overall, the mean body weight washighest among the Indians [63.78 kg (CI:62.41, 65.15)], followed by Malays [(63.49 kg(CI: 62.84, 64.14)] and Chinese [62.58 kg CI:61.77, 63.38)]. Among the men, the Chinesewere the heaviest [68.17 kg (CI: 67.09, 69.24)]while the Indians were the heaviest [60.28kg (CI: 58.58, 61.99)] among the women. Themean body weight of adults peaked at 65.11kg (CI: 64.35, 65.86) among those agedbetween 40 - 49 years old. Both men andwomen showed an increase in mean bodyweight with age (Figure 1).
The mean body weight was highest forthose with a middle household incomerange of RM 1,500 - RM 3,500 [64.40 kg (CI:63.66, 65.14)]. Among the men, the meanweight was highest among those with thehighest household income of more than RM3,500 [69.27 kg (CI: 67.85, 70.69)] whileamong the women, the mean weight did notdiffer much with household income. Themean body weight was highest among thoseadults with college or university education[64.36 kg (CI: 62.82, 65.90)]. Among men, the
Table 1. Classification of body weight in adults according to BMI (modified from WHO, 1998)
Classification BMI (kg/m2)
CED Class III < 16.0CED Class II 16.0 – 16.9CED Class l 17.0 – 18.4Normal 18.5 – 24.9Pre-obese 25.0 – 29.9Obesity Class I 30.0 – 34.9Obesity Class II 35.0 – 39.0Obesity Class III > 40.0
1. CED is Chronic Energy Deficiency. CED in the text refers to CED Class l + CED Class ll + CED Class lll2. Overweight is pre-obese3. Obesity in the text refers to Obesity Class l + Obesity Class ll + Obesity Class lll

Azmi MY, Junidah R, Siti Mariam A et al.100
mean body weight seemed to increase witheducational level while it was almost thereverse for women.
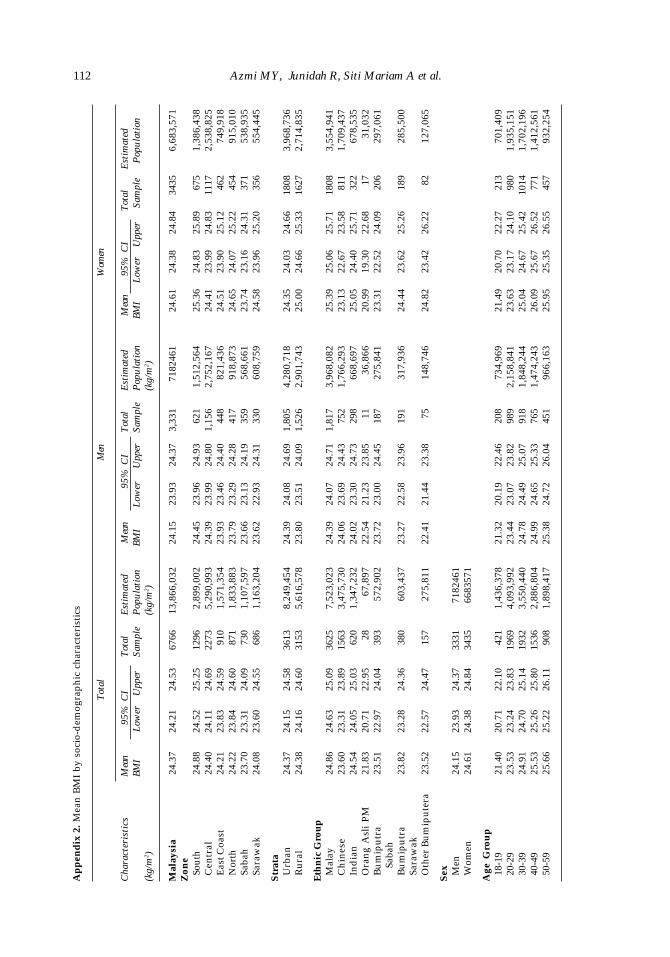
Mean BMI (Appendix 2)
Comparing BMI across the geographicalzones, the mean BMI was highest for adultsin the South Zone [24.88 kg/m2 (CI: 24.52,25.25)] and was significantly higher thanthe mean BMI for Sabah [23.70 kg/m2 (CI:23.31, 24.09)] (Figure 2). The mean BMI ofadult women [24.61 kg/m2 (CI: 24.38, 24.84)]was significantly higher than the mean BMIof adult men [24.15 kg/m2 (CI: 23.93, 24.37)].
The mean BMI of adults between theurban [24.37 kg/m2 (CI: 24.15, 24.58)] andrural [24.38 kg/m2 (CI: 24.16, 24.60)]population was not statistically different.However, mean BMI among men in the urbanareas [24.39 kg/m2 (CI: 24.08, 24.69)] wassignificantly higher than those from ruralareas [23.80 kg/m2 (CI: 23.51, 24.09)]. Incontrast, among the women, mean BMI wassignificantly higher for those in the ruralareas [25.00 kg/m2 (CI: 24.66, 25.33)] thanfrom urban areas [24.35 kg/m2 (CI: 24.03,24.66)] (Figure 3).
Malays [24.86 kg/m2 (CI: 24.63, 25.09)]had the highest mean BMI followed by the
Figure 2. Mean BMI by zone and sex
Figure 1. Mean body weight by age group and sex

Body Mass Index (BMI) of Adults: Findings of the Malaysian Adult Nutrition Survey (MANS) 101
Indians [24.54 kg/m2 (CI: 24.05, 25.03)]. Themean BMI of the Chinese was 23.60 kg/m2
(CI: 23.31, 23.89), Bumiputra Sabah was23.51 kg/m2 (CI: 22.97, 24.04) and BumiputraSarawak was 23.82 kg/m2 (CI: 23.28, 24.36).The Malays had the highest BMI among themen [24.39 kg/m2 (CI: 24.07, 24.71)] andwomen [25.39 kg/m2 (CI: 25.06, 25.71)]. Themean BMI rose to 25.53 kg/m2 (CI: 25.26,25.80) among those aged 40-49 years old.Mean BMI tapered off after the age of 30-39years for men and after 40-49 years forwomen (Figure 4).
The mean BMI did not differ much withhousehold income. This pattern was similar
for the men but among the women, the meanBMI was highest among those with thelowest household income of less thanRM1,500 [24.87 kg/m2 (CI: 24.56, 25.18)].Mean BMI was highest among those withprimary school education [25.27 kg/m2 (CI:24.92, 25.62)]. However, among men, thehighest BMI was among those with a collegeor university education [24.49 kg/m2 (CI:23.82, 25.15)] while among the women, themean BMI was highest among those withprimary school education [26.37 kg/m2 (CI:25.83, 26.92)].
Figure 3. Mean BMI by strata and sex
Figure 4. Mean BMI by age group and sex
Azmi MY, Junidah R, Siti Mariam A et al.102
Overweight and obesity
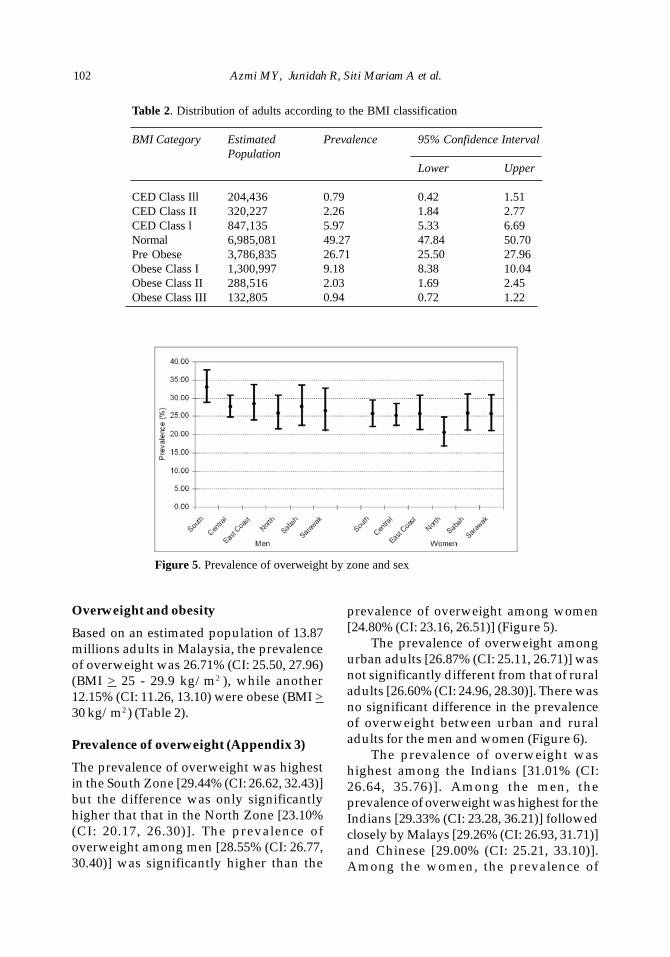
Based on an estimated population of 13.87millions adults in Malaysia, the prevalenceof overweight was 26.71% (CI: 25.50, 27.96)(BMI > 25 - 29.9 kg/m2 ), while another12.15% (CI: 11.26, 13.10) were obese (BMI >30 kg/m2 ) (Table 2).
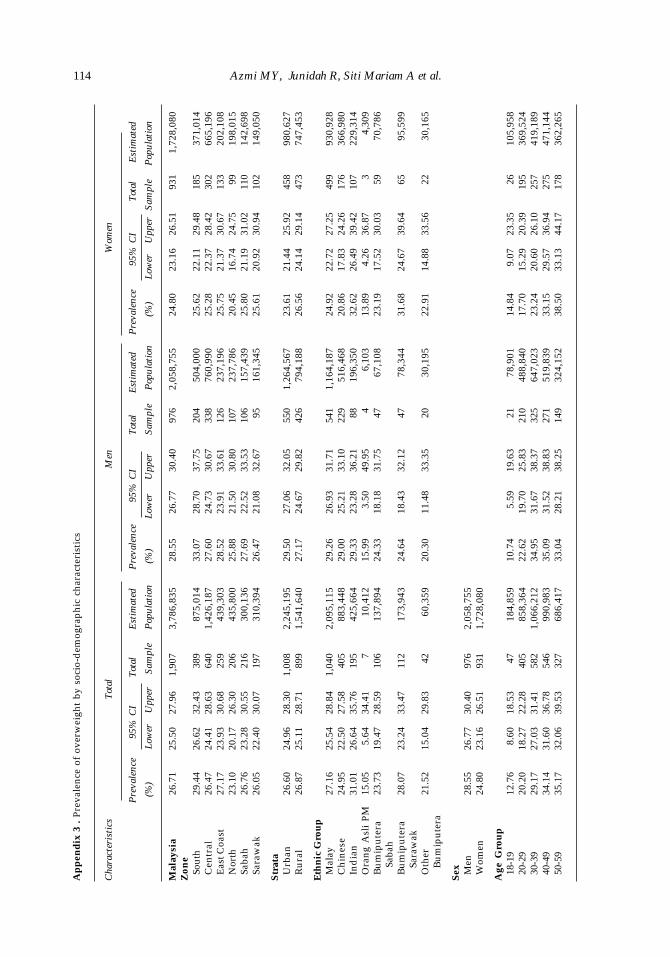
Prevalence of overweight (Appendix 3)
The prevalence of overweight was highestin the South Zone [29.44% (CI: 26.62, 32.43)]but the difference was only significantlyhigher that that in the North Zone [23.10%(CI: 20.17, 26.30)]. The prevalence ofoverweight among men [28.55% (CI: 26.77,30.40)] was significantly higher than the
prevalence of overweight among women[24.80% (CI: 23.16, 26.51)] (Figure 5).
The prevalence of overweight amongurban adults [26.87% (CI: 25.11, 26.71)] wasnot significantly different from that of ruraladults [26.60% (CI: 24.96, 28.30)]. There wasno significant difference in the prevalenceof overweight between urban and ruraladults for the men and women (Figure 6).
The prevalence of overweight washighest among the Indians [31.01% (CI:26.64, 35.76)]. Among the men, theprevalence of overweight was highest for theIndians [29.33% (CI: 23.28, 36.21)] followedclosely by Malays [29.26% (CI: 26.93, 31.71)]and Chinese [29.00% (CI: 25.21, 33.10)].Among the women, the prevalence of
Table 2. Distribution of adults according to the BMI classification
BMI Category Estimated Prevalence 95% Confidence IntervalPopulation
Lower Upper
CED Class Ill 204,436 0.79 0.42 1.51CED Class II 320,227 2.26 1.84 2.77CED Class l 847,135 5.97 5.33 6.69Normal 6,985,081 49.27 47.84 50.70Pre Obese 3,786,835 26.71 25.50 27.96Obese Class I 1,300,997 9.18 8.38 10.04Obese Class II 288,516 2.03 1.69 2.45Obese Class III 132,805 0.94 0.72 1.22
Figure 5. Prevalence of overweight by zone and sex
Body Mass Index (BMI) of Adults: Findings of the Malaysian Adult Nutrition Survey (MANS) 103
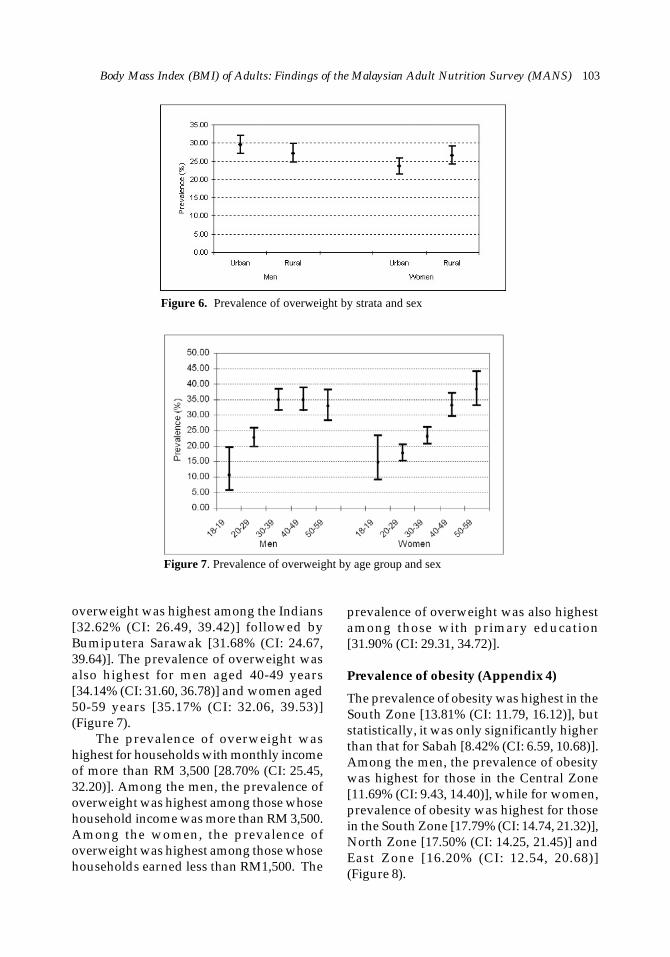
overweight was highest among the Indians[32.62% (CI: 26.49, 39.42)] followed byBumiputera Sarawak [31.68% (CI: 24.67,39.64)]. The prevalence of overweight wasalso highest for men aged 40-49 years[34.14% (CI: 31.60, 36.78)] and women aged50-59 years [35.17% (CI: 32.06, 39.53)](Figure 7).
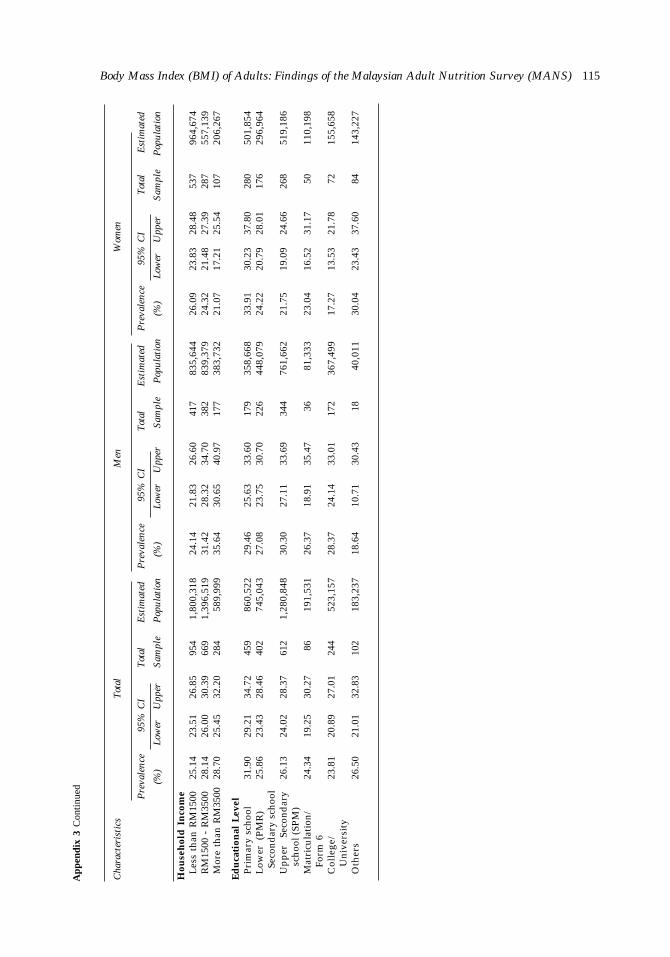
The prevalence of overweight washighest for households with monthly incomeof more than RM 3,500 [28.70% (CI: 25.45,32.20)]. Among the men, the prevalence ofoverweight was highest among those whosehousehold income was more than RM 3,500.Among the women, the prevalence ofoverweight was highest among those whosehouseholds earned less than RM1,500. The
prevalence of overweight was also highestamong those with primary education[31.90% (CI: 29.31, 34.72)].
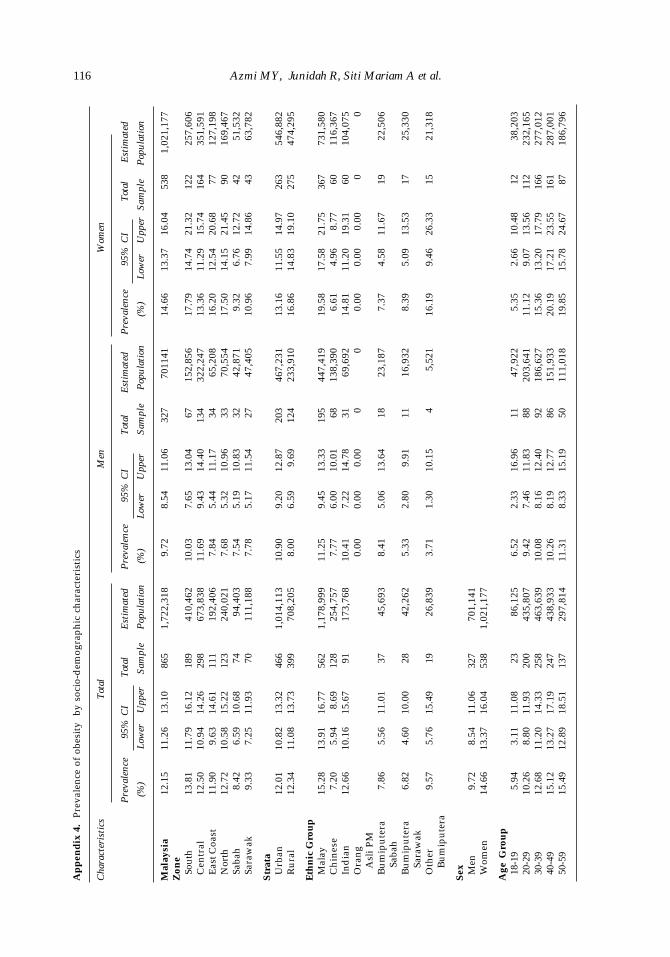
Prevalence of obesity (Appendix 4)
The prevalence of obesity was highest in theSouth Zone [13.81% (CI: 11.79, 16.12)], butstatistically, it was only significantly higherthan that for Sabah [8.42% (CI: 6.59, 10.68)].Among the men, the prevalence of obesitywas highest for those in the Central Zone[11.69% (CI: 9.43, 14.40)], while for women,prevalence of obesity was highest for thosein the South Zone [17.79% (CI: 14.74, 21.32)],North Zone [17.50% (CI: 14.25, 21.45)] andEast Zone [16.20% (CI: 12.54, 20.68)](Figure 8).
Figure 6. Prevalence of overweight by strata and sex
Figure 7. Prevalence of overweight by age group and sex

Azmi MY, Junidah R, Siti Mariam A et al.104
The prevalence of obesity for those inthe urban [12.01% (CI: 10.82, 13.32)] andrural areas [12.34%, (CI: 11.08, 13.73)] wasnot significantly different (Figure 9).
The prevalence of obesity was highestfor the Malays [15.28% (CI: 13.91, 16.77)],followed by the Indians [12.66% (CI: 10.16,15.67)] and Other Bumiputera [9.57% (CI: 5.6,15.49)]. Among the men, obesity was highestfor the Malays [11.25% (CI: 9.45, 13.33)].Obesity was also highest for the Malays[19.58% (CI: 17.58, 21.75)] among the women.
The prevalence of obesity peaked forages 40-49 years [15.12% (CI: 13.27, 17.19)]and 50-59 years [15.49% (CI: 12.89 18.51)](Figure 10). The prevalence of obesity forwomen aged 30 years and above wassignificantly higher than for those aged 18-19 years.
The overall prevalence of obesity washighest for household income between RM1,500– RM 3,500 per month [13.13% (CI:11.66, 14.76)]. It was highest among menwhose monthly household income wasbetween RM 1,500 - RM3,500 [12.59% (CI:
Figure 8. Prevalence of obesity by zone and sex
Figure 9. Prevalence of obesity by urban-rural strata and sex
Prev
alen
ce (%
)

Body Mass Index (BMI) of Adults: Findings of the Malaysian Adult Nutrition Survey (MANS) 105
11.01, 13.1)] and among women whosehouseholds earned less than RM 1,500[16.18% (CI: 14.40, 18.13)]. The prevalenceof obesity was also highest among those withprimary education [14.41% (CI: 12.44, 16.62)].It was highest for men with tertiaryeducation [11.12% (CI: 7.49, 16.19)] and forwomen with primary education [20.09%(CI:17.05, 23.52)].
Prevalence of CED (Appendix 5)
Co-existing with overweight is the problemof underweight or chronic energy deficiency(CED) among Malaysian adults. As shownin Table 2, the study reported 9.02% (CI: 8.82,
10.61) had CED (BMI < 18.5 kg/m2). Theprevalence of CED was not significantlydifferent among the various zones (Figure11).
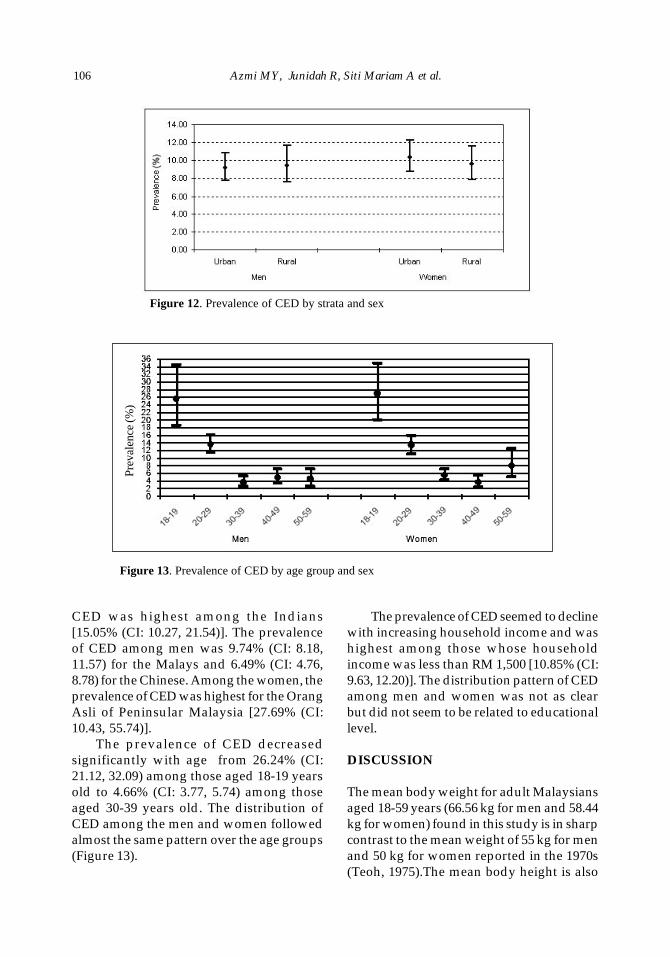
There was also no significant differencein the prevalence of CED among the adults,irrespective of sex, in urban and rural areas(Figure 12).
The prevalence of CED was highestamong the indigenous population (OrangAsli) of Peninsular Malaysia [14.53% (CI:5.14, 34.77)]. The prevalence of CED amongthe Chinese was 9.70% (CI: 7.97, 11.75) andamong the Malays, it was 9.11% (CI: 8.02,10.34). Among the men, the prevalence of
Figure 11. Prevalence of CED by zone and sex
Figure 10. Prevalence of obesity by age group and sex
Prev
alen
ce (%
)
Azmi MY, Junidah R, Siti Mariam A et al.106
CED was highest among the Indians[15.05% (CI: 10.27, 21.54)]. The prevalenceof CED among men was 9.74% (CI: 8.18,11.57) for the Malays and 6.49% (CI: 4.76,8.78) for the Chinese. Among the women, theprevalence of CED was highest for the OrangAsli of Peninsular Malaysia [27.69% (CI:10.43, 55.74)].
The prevalence of CED decreasedsignificantly with age from 26.24% (CI:21.12, 32.09) among those aged 18-19 yearsold to 4.66% (CI: 3.77, 5.74) among thoseaged 30-39 years old. The distribution ofCED among the men and women followedalmost the same pattern over the age groups(Figure 13).
The prevalence of CED seemed to declinewith increasing household income and washighest among those whose householdincome was less than RM 1,500 [10.85% (CI:9.63, 12.20)]. The distribution pattern of CEDamong men and women was not as clearbut did not seem to be related to educationallevel.
DISCUSSION
The mean body weight for adult Malaysiansaged 18-59 years (66.56 kg for men and 58.44kg for women) found in this study is in sharpcontrast to the mean weight of 55 kg for menand 50 kg for women reported in the 1970s(Teoh, 1975).The mean body height is also
Figure 12. Prevalence of CED by strata and sex
Figure 13. Prevalence of CED by age group and sex
Prev
alen
ce (%
)

Body Mass Index (BMI) of Adults: Findings of the Malaysian Adult Nutrition Survey (MANS) 107
higher than that used by the TechnicalWorking Group on Dietary Guidelines(NCCFN, 2005) which was 59 - 64 kg for menand 52 - 57 kg for women.
Comparing the mean BMI reported inNHMS ll (Fatimah et al., 1997), the mean BMIfor Malaysians aged 18 - 59 years hasincreased over the last six years from 22.26kg/m2 to 24.15 kg/m2 for men and from 22.67kg/m2 to 24.61 kg/m2 for women.
The prevalence of overweight among theMalaysian adults has increased almosttwofold from 16.6% to 29.7%. Overweightwas highest among the Indians (31.01%),and affects the minority ethnic groups too,e.g. 15.06% among the Orang Asli ofPeninsular Malaysia, 28.07% in theBumiputera Sarawak and 23.73% for theBumiputera Sabah. In fact, the prevalence ofoverweight among the Bumiputera Sarawakwomen was high at 31.68%.
The overweight prevalence of 29.71% forthe Malaysian adults aged 18 - 59 yearsindicates that the overweight problem inMalaysia is almost as serious as that for thedeveloped countries reported in the 1999 -2002 National Health and NutritionExamination Survey (NHANES) and WHO(2006).
Overall, overweight increased with ageand household income. This pattern ofincrease was also observed among the men.However, among the women, althoughoverweight increased with age, theprevalence declined with household income.In relation to educational level, bothoverweight and obesity was highest amongthose with primary education.
Compared to the NHMS ll, theprevalence of obesity among adults aged 18- 59 years was higher, apparently increasingmore than threefold from 4.4% to 12.42%. Amatter of concern from the findings is thatobesity was high in almost all the states inMalaysia (except for Sabah and Sarawak).This indicates that obesity is prevalent evenin the less developed states in the peninsula.The present findings also confirm the earlierfindings of NHMS ll, where obesity was
found to have crossed the urban and ruraldivide irrespective of income andeducational level.
As in the NHMS II, the prevalence ofobesity was highest among the Malays andIndians. In fact, the prevalence had increasedthreefold from 5.1% to 15.28% for the Malaysand more than twofold from 5.0% to 12.66%for the Indians. Even among the Chinese,the increase was more than twofold from3.5% to 7.20%. It is also important to notethat although the prevalence of obesity forthe Bumiputera Sarawak (6.82%) was thelowest, it still exceeded the overall obesityprevalence reported by NHMS ll.
Over the years, the prevalence of obesityfor the women has remained higher than themen. However, obesity among men seems tobe increasing at a faster rate. While theprevalence of obesity in women hadincreased 2.5 times from 5.7% to 14.66%, theincrease in the prevalence of obesity in menhad increased 3.3 times from 2.9% to 9.72%.Thus, although fewer men were obese, thegap between the sexes is closing.
The higher prevalence of obesity inwomen should be of concern since, inaddition to the risk for chronic diseases,obesity may also affect women’sreproductive functions. In this respect,greater attention should be focused on ruralwomen and Indian women especially thosein the lower income group and with primaryeducation.
As in NHMS ll, the prevalence of obesitywas also found to increase with age until 40- 49 years. The prevalence of obesity waslowest for those aged 18-19 years but it hasincreased almost twofold from 3.0% to 5.9%compared to the NHMS II. Among the 40-49years, the prevalence had increased 2.5 timesfrom 6.0% to 15.1%. These findings suggestthat not only has the prevalence of obesityincreased in all the age groups, the increasewas more rapid among the older age group.
That obesity is not necessarily a problemaffecting only the rich is reflected by thefinding that the prevalence of obesity washigh among those whose household income

Azmi MY, Junidah R, Siti Mariam A et al.108
was in the middle income group of betweenRM1,500 - RM3,500 (13.1%). Similarly, thefact that educational attainment was not afactor associated with obesity is clearlydemonstrated by the finding that theprevalence of obesity was highest amongthose with just primary education (14.4%)and presumably with low knowledge innutrition.
While obesity was more prevalentamong the housewives and retirees,overweight was more prevalent among armypersonnel as well as the legislators, seniorofficials and managers. In contrast, bothoverweight and obesity were lowest amongthe students.
When compared with the obesity ratesin the WHO (2006) report, the overall obesityrate for Malaysian adults aged 18-59 yearswas below those for the developed andindustrialised countries, particularly theUnited States (29.50%) (Centre for DieseaseControl, 2006) and Australia (15.10%).However, the Malaysian figures were wellabove those for Asian countries likeSingapore (6.90%) and China (2.9%).
This study reported a lower magnitudeof CED among Malaysian adults, from 25.2%in 1996 to 9.02%. In comparison, CED wasreported to be as high as 40% in India, 20%in China and 10% in Peru (WHO, 1995).
This report also shows that the problemof CED prevails in all zones with theexception of the South Zone, affecting bothmen and women from rural and urban areas.The relatively higher CED prevalenceamong the Orang Asli should be addressedas a socio-economic issue.
CONCLUSION
The survey findings provide strong evidencethat obesity and particularly overweightamong adults is approaching epidemicproportions in Malaysia while CED is still apublic health concern despite being on thedecline.
The obesity problem is most seriousamong the poor, rural Malay women agedabove 30 years particularly those in thestates of Johor, Negeri Sembilan and Melaka.Overweight, on the other hand, seems to bemore serious among the Indian and Malaymen particularly those who are more than30 years old and with lower education in allthe states irrespective of strata, householdincome and occupation. Meanwhile, CEDcontinues to be a problem among theminority groups and the Indians.
These findings indicate that Malaysianadults aged 18-59 years have a serious andescalating weight problem that will impedethe health of the nation. The nation’s mosteconomically productive population groupis still experiencing the twin facets ofmalnutrition which could derail nationalprogress as it spirals towards 2020 and itsvision of attaining a developed nation status.
ACKNOWLEDGEMENTS
The authors would like to extend theirgrateful thanks to the Director-General of theMinistry of Health for permission to publishthis paper. The support given by therespective state nutrition officers, researchofficers, data enumerators and many otherswho helped throughout the study is alsogratefully acknowledged.
REFERENCES
Centre for Disease Control, National Centrefor Health Statistics (1999-2002).Prevalence of overweight and obesityamong adults: United States. (http://www.cdc.gov/nchs) accessed on26.05.2006.
Chong YH, Tee ES & Ng TKW (1984). Statusof community nutrition in povertykampungs. Bulletin No. 22. KualaLumpur; Institute for Medical Research.
Body Mass Index (BMI) of Adults: Findings of the Malaysian Adult Nutrition Survey (MANS) 109
Fatimah S, Tahir A, Siti Sa’adiah H &Maimunah AH (1997). Nutritionalstatus of adults aged 18 years and above.National Health and Morbidity Survey1996. Vol 14. Institute of Public Health,Ministry of Health.
Ismail MN, Zawiah H, Chee SS & Ng KK(1995). Prevalence of obesity andchronic energy deficiency (CED) in adultMalaysians. Mal J Nutr. 1:1-9.
James WPT& Ralph A (1991). Human energyrequirements. In: Proc of the 6th AsianCongress of Nutrition in Kuala Lumpur.Chong YH (ed), pp 62-76. NutritionSociety of Malaysia, Kuala Lumpur.
Jones JJ (1976). A comparative study of theprevalence of adult obesity in the threeracial groups of Kuala Lumpur. Med JMalaysia 30: 256-260.
Khor GL, Azmi MY, Tee ES, Kandiah M andHuang SL (1999). Prevalence ofoverweight among Malaysian adultsfrom rural communities. Asia Pacific JClin Nutr 8(4): 272-279.
Ministry of Health Malaysia (2005). NationalNutrition Policy of Malaysia.
Ministry of Health Malaysia (2005). NationalPlan of Action for Nutrition of Malaysiall (2006-2015) pp 17-18. NationalCoordinating Committee on Food andNutrition.
Ministry of Health Malaysia (2008).Malaysian Adult Nutrition Survey 2003.General Findings. Vol 2.
National Coordinating Committee on Foodand Nutrition (NCCFN)(2005).Recommended Nutrient Intake forMalaysia. A Report of the TechnicalWorking Group on Nutritional Guide-lines. Ministry of Health Malaysia.
Shetty PS & James WPT (1994) Body massindex - A measure of chronic energydeficiency in adults. FAO Food andNutrition Paper 56, FAO, Rome.
Teo PH, Chong YH & M Zaini AR (1988).Coronary risk factors among Malaysianmale executives in two urban areas. ProcNutr Soc Malaysia. 3: 24-31.
Teoh ST (1975). Recommended daily dietaryintake for Peninsular Malaysia. Med JMal 30(1): 38-42.
World Health Organization (1995). Physicalstatus: The Use and Interpretation ofAnthropometry. Report of a WHO ExpertCommittee. WHO Technical ReportSeries No. 854. Geneva.
World Health Organization (1998). Obesity:Preventing and Managing the GlobalEpidemic. Report of a WHO Consul-tation on Obesity. Geneva.
World Health Organization (2004). GlobalStrategy on Diet, Physical Activity andHealth. Geneva.
World Health Organization (2006). GlobalInfobase Online. (http://www.who.int/n c d _ s u r v e i l l a n c e / i n f o b a s e / w e b /InfoBaseCommon) accessed on26.05.2006.

Azmi MY, Junidah R, Siti Mariam A et al.110A
ppen
dix
1. M
ean
wei
ght b
y so
cio-
dem
ogra
phic
char
acte
rist
ics
Tot
alM
enW
omen
Cha
ract
eris
tics
Mea
n95
% C
IT
otal
Est
imat
edM
ean
95%
CI
Tot
alE
stim
ated
Mea
n95
% C
IT
otal
Est
imat
edW
eigh
tLo
wer
Upp
erSa
mpl
eP
opul
atio
nW
eigh
tLo
wer
Upp
erSa
mpl
eP
opul
atio
nW
eigh
tLo
wer
Upp
erSa
mpl
eP
opul
atio
n(k
g)(k
g)(k
g)
Mal
aysi
a62
.65
62.2
063
.09
6,77
513
,876
,456
66.5
665
.91
67.2
13,
334
7,18
6,44
158
.44
57.8
859
.00
3,44
16,
690,
015
Zone So
uth
64.4
263
.46
65.3
81,
296
2,95
8,17
268
.19
66.7
469
.64
621
1,51
2,56
460
.31
59.0
161
.61
675
1,38
6,43
8C
entr
al63
.40
62.5
664
.23
2,27
45,
291,
930
67.8
066
.60
69.0
01,
157
2,75
3,10
558
.62
57.6
159
.63
1,11
72,
538,
825
East
coas
t60
.91
59.7
762
.05
918
1,58
0,84
164
.39
62.7
666
.02
450
824,
479
57.1
255
.60
58.6
446
875
6,36
2N
orth
62.6
761
.63
63.7
087
11,
833,
883
66.2
264
.81
67.6
241
791
8,87
359
.10
57.6
960
.52
454
915,
010
Saba
h58
.93
57.8
660
.01
730
1,10
7,59
762
.94
61.4
364
.46
359
568,
661
54.7
053
.28
56.1
237
153
8,93
5Sa
raw
ak60
.66
59.4
361
.88
686
1,16
3,20
463
.73
61.7
465
.72
330
608,
759
57.2
955
.87
58.7
135
655
4,44
5
Str
ata
Urb
an63
.33
62.7
163
.95
3,61
38,
249,
454
67.8
566
.94
68.7
61,
805
4,28
0,71
858
.46
57.7
259
.20
1,80
83,
968,
736
Rura
l61
.64
61.0
262
.26
3,16
25,
627,
002
64.6
663
.79
65.5
31,
529
2,90
5,72
358
.42
57.5
559
.29
1,63
32,
721,
279
Eth
nic
Gro
up
Mal
ay63
.49
62.8
464
.14
3,63
37,
531,
610
66.8
665
.89
67.8
21,
820
3,97
2,06
259
.73
58.9
260
.54
1,81
33,
559,
548
Chi
nese
62.5
861
.77
63.3
81,
563
3,47
5,73
068
.17
67.0
969
.24
752
1,76
6,29
356
.80
55.7
357
.87
811
1,70
9,43
7In
dian
63.7
862
.41
65.1
562
01,
347,
232
67.3
265
.25
69.4
029
866
8,69
760
.28
58.5
861
.99
322
678,
535
Ora
ng A
sli P
M48
.95
45.9
052
.00
2867
,897
51.9
246
.28
57.5
611
36,8
6645
.42
41.6
249
.23
1731
,032
Bum
iput
era
57.4
255
.92
58.9
139
457
4,73
962
.26
60.2
664
.25
187
275,
841
52.9
551
.12
54.7
920
729
8,89
8 S
abah
Bum
iput
era
58.0
756
.65
59.4
938
060
3,43
760
.58
58.5
562
.61
191
317,
936
55.2
753
.37
57.1
618
928
5,50
0 S
araw
akO
ther
Bum
iput
era
59.2
457
.10
61.3
815
727
5,81
160
.43
57.6
263
.23
7514
8,74
657
.85
54.4
461
.26
8212
7,06
5
Sex M
en66
.56
65.9
167
.21
3,33
47,
186,
441
Wom
en58
.44
57.8
859
.00
3,44
16,
690,
016
Age
gro
up18
-19
55.8
253
.46
58.1
842
11,
436,
378
59.3
155
.33
63.2
820
873
4,96
952
.17
50.0
754
.27
213
701,
409
20-2
961
.32
60.4
962
.15
1,97
14,
096,
532
65.5
364
.41
66.6
598
92,
158,
841
56.6
355
.48
57.7
898
21,
937,
691
30-3
964
.19
63.5
164
.87
1,93
33,
551,
798
68.4
467
.54
69.3
391
81,
848,
244
59.5
858
.63
60.5
31,
015
1,70
3,55
440
-49
65.1
164
.35
65.8
61,
538
2,88
7,75
768
.66
67.6
469
.68
765
1,47
4,24
361
.40
60.3
762
.43
773
1,41
3,51
450
-59
64.0
363
.00
65.0
591
21,
903,
991
67.5
766
.15
68.9
945
497
0,14
360
.35
58.9
761
.73
458
933,
848
Body Mass Index (BMI) of Adults: Findings of the Malaysian Adult Nutrition Survey (MANS) 111A
ppen
dix
1 C
onti
nued
Tot
alM
enW
omen
Cha
ract
eris
tics
Mea
n95
% C
IT
otal
Est
imat
edM
ean
95%
CI
Tot
alE
stim
ated
Mea
n95
% C
IT
otal
Est
imat
edW
eigh
tLo
wer
Upp
erSa
mpl
eP
opul
atio
nW
eigh
tLo
wer
Upp
erSa
mpl
eP
opul
atio
nW
eigh
tLo
wer
Upp
erSa
mpl
eP
opul
atio
n(k
g)(k
g)(k
g)
Hou
seho
ld In
com
eL
ess
than
RM
1500
61.0
060
.35
61.6
53,
539
7,01
6,25
363
.79
62.7
864
.81
1,64
33,
451,
552
58.2
957
.50
59.0
81,
896
3,56
4,70
2R
M15
00 -
RM
3500
64.4
063
.66
65.1
42,
309
4,85
7,84
969
.05
68.0
670
.04
1,21
62,
667,
048
58.7
457
.74
59.7
41,
093
2,19
0,80
1M
ore
than
RM
3500
64.1
663
.14
65.1
792
72,
002,
354
69.2
767
.85
70.6
947
51,
067,
841
58.3
157
.05
59.5
745
293
4,51
3
Ed
uca
tion
al L
evel
Prim
ary
scho
ol62
.38
61.5
263
.24
1,41
62,
656,
982
63.8
562
.80
64.8
962
31,
208,
258
61.1
559
.84
62.4
779
31,
448,
724
Low
er se
cond
ary
63.8
763
.02
64.7
31,
448
2,82
2,79
666
.51
65.4
567
.58
796
1,65
3,22
260
.15
58.7
761
.52
652
1,16
9,57
4
scho
ol (P
MR
)U
pper
seco
ndar
y62
.50
61.7
663
.24
2,23
64,
760,
890
66.9
965
.94
68.0
41,
131
2,51
0,77
657
.49
56.5
658
.42
1105
2,25
0,11
4
scho
ol (
SPM
)M
atric
ulat
ion/
Form
659
.94
58.2
761
.61
355
779,
605
66.4
763
.78
69.1
713
930
8,47
955
.65
53.7
357
.58
216
471,
126
Col
lege
/Uni
vers
ity64
.36
62.8
265
.90
956
2,15
7,77
869
.59
67.3
771
.80
548
1,29
1,65
456
.57
55.0
858
.06
408
866,
124
Oth
ers
57.0
155
.38
58.6
435
667
7,10
258
.58
55.0
162
.16
9520
8,47
356
.31
54.5
158
.11
261
468,
629
Nu
trit
ion
al S
tatu
sC
ED
Cla
ss ll
l40
.41
39.1
041
.73
8020
4,43
642
.58
41.0
644
.10
3911
6,84
937
.53
35.9
839
.08
4187
,587
CE
D C
lass
ll42
.63
41.4
543
.81
150
320,
227
47.1
145
.85
48.3
760
122,
110
39.8
738
.44
41.3
090
198,
117
CE
D C
lass
l46
.27
45.6
246
.92
398
847,
135
49.6
548
.92
50.3
719
943
1,65
142
.76
42.0
143
.51
199
415,
484
Nor
mal
56.4
956
.18
56.8
03,
366
6,98
5,08
160
.30
59.8
960
.70
1,73
03,
751,
955
52.0
751
.74
52.4
01,
636
3,23
3,12
6Pr
e-ob
ese
70.0
869
.63
70.5
31,
907
3,78
6,83
575
.02
74.5
375
.51
976
2,05
8,75
564
.20
63.7
264
.68
931
1,72
8,08
0O
bese
Cla
ss l
81.2
479
.82
82.6
765
51,
300,
997
89.5
987
.33
91.8
425
754
6,12
975
.21
74.4
176
.00
398
754,
867
Obe
se C
lass
ll91
.70
89.7
293
.68
138
288,
516
98.4
294
.71
102.
1348
116,
812
87.1
385
.37
88.8
990
171,
703
Obe
se C
lass
lll
116.
1810
9.92
122.
4472
132,
805
126.
1011
2.27
139.
9422
38,1
9911
2.17
105.
52
118.
8350
94,6
06
Azmi MY, Junidah R, Siti Mariam A et al.112A
pp
end
ix 2
. Mea
n B
MI
by s
ocio
-dem
ogra
phi
c ch
arac
teri
stic
s
Tot
alM
enW
omen
Cha
ract
eris
tics
Mea
n95
% C
IT
otal
Est
imat
edM
ean
95%
CI
Tot
alE
stim
ated
Mea
n95
% C
IT
otal
Est
imat
edBM
ILo
wer
Upp
erSa
mpl
eP
opul
atio
nBM
ILo
wer
Upp
erSa
mpl
eP
opul
atio
nBM
ILo
wer
Upp
erSa
mpl
eP
opul
atio
n(k
g/m
2 )(k
g/m
2 )(k
g/m
2 )
Mal
aysi
a24
.37
24.2
124
.53
6766
13,8
66,0
3224
.15
23.9
324
.37
3,33
171
8246
124
.61
24.3
824
.84
3435
6,68
3,57
1Z
one
Sout
h24
.88
24.5
225
.25
1296
2,89
9,00
224
.45
23.9
624
.93
621
1,51
2,56
425
.36
24.8
325
.89
675
1,38
6,43
8C
entr
al24
.40
24.1
124
.69
2273
5,29
0,99
324
.39
23.9
924
.80
1,15
62,
752,
167
24.4
123
.99
24.8
311
172,
538,
825
Eas
t Coa
st24
.21
23.8
324
.59
910
1,57
1,35
423
.93
23.4
624
.40
448
821,
436
24.5
123
.90
25.1
246
274
9,91
8N
orth
24.2
223
.84
24.6
087
11,
833,
883
23.7
923
.29
24.2
841
791
8,87
324
.65
24.0
725
.22
454
915,
010
Saba
h23
.70
23.3
124
.09
730
1,10
7,59
723
.66
23.1
324
.19
359
568,
661
23.7
423
.16
24.3
137
153
8,93
5Sa
raw
ak24
.08
23.6
024
.55
686
1,16
3,20
423
.62
22.9
324
.31
330
608,
759
24.5
823
.96
25.2
035
655
4,44
5
Str
ata
Urb
an24
.37
24.1
524
.58
3613
8,24
9,45
424
.39
24.0
824
.69
1,80
54,
280,
718
24.3
524
.03
24.6
618
083,
968,
736
Ru
ral
24.3
824
.16
24.6
031
535,
616,
578
23.8
023
.51
24.0
91,
526
2,90
1,74
325
.00
24.6
625
.33
1627
2,71
4,83
5
Eth
nic
Gro
up
Mal
ay24
.86
24.6
325
.09
3625
7,52
3,02
324
.39
24.0
724
.71
1,81
73,
968,
082
25.3
925
.06
25.7
118
083,
554,
941
Ch
ines
e23
.60
23.3
123
.89
1563
3,47
5,73
024
.06
23.6
924
.43
752
1,76
6,29
323
.13
22.6
723
.58
811
1,70
9,43
7In
dia
n24
.54
24.0
525
.03
620
1,34
7,23
224
.02
23.3
024
.73
298
668,
697
25.0
524
.40
25.7
132
267
8,53
5O
rang
Asl
i P
M21
.83
20.7
122
.95
2867
,897
22.5
421
.23
23.8
511
36,8
6620
.99
19.3
022
.68
1731
,032
Bu
mip
utr
a23
.51
22.9
724
.04
393
572,
902
23.7
223
.00
24.4
518
727
5,84
123
.31
22.5
224
.09
206
297,
061
Sa
bah
Bu
mip
utr
a23
.82
23.2
824
.36
380
603,
437
23.2
722
.58
23.9
619
131
7,93
624
.44
23.6
225
.26
189
285,
500
Sara
wak
Oth
er B
um
ipu
tera
23.5
222
.57
24.4
715
727
5,81
122
.41
21.4
423
.38
7514
8,74
624
.82
23.4
226
.22
8212
7,06
5
Sex M
en24
.15
23.9
324
.37
3331
7182
461
Wom
en24
.61
24.3
824
.84
3435
6683
571
Age
Gro
up
18-1
921
.40
20.7
122
.10
421
1,43
6,37
821
.32
20.1
922
.46
208
734,
969
21.4
920
.70
22.2
721
370
1,40
920
-29
23.5
323
.24
23.8
319
694,
093,
992
23.4
423
.07
23.8
298
92,
158,
841
23.6
323
.17
24.1
098
01,
935,
151
30-3
924
.91
24.7
025
.14
1932
3,55
0,44
024
.78
24.4
925
.07
918
1,84
8,24
425
.04
24.6
725
.42
1014
1,70
2,19
640
-49
25.5
325
.26
25.8
015
362,
886,
804
24.9
924
.65
25.3
376
51,
474,
243
26.0
925
.67
26.5
277
11,
412,
561
50-5
925
.66
25.2
226
.11
908
1,89
8,41
725
.38
24.7
226
.04
451
966,
163
25.9
525
.35
26.5
545
793
2,25
4

Body Mass Index (BMI) of Adults: Findings of the Malaysian Adult Nutrition Survey (MANS) 113
Tot
alM
enW
omen
Cha
ract
eris
tics
Mea
n95
% C
IT
otal
Est
imat
edM
ean
95%
CI
Tot
alE
stim
ated
Mea
n95
% C
IT
otal
Est
imat
edBM
ILo
wer
Upp
erSa
mpl
eP
opul
atio
nBM
ILo
wer
Upp
erSa
mpl
eP
opul
atio
nBM
ILo
wer
Upp
erSa
mpl
eP
opul
atio
n(k
g/m
2 )(k
g/m
2 )(k
g/m
2 )
Hou
seh
old
In
com
eL
ess
than
RM
1500
24.2
023
.97
24.4
235
3170
0676
623
.50
23.1
923
.81
1641
3,44
8,50
924
.87
24.5
625
.18
1,89
03,
558,
257
RM
1500
- R
M35
0024
.64
24.3
824
.90
2308
4856
912
24.7
924
.46
25.1
112
152,
666,
111
24.4
624
.03
24.8
91,
093
2,19
0,80
1M
ore
than
RM
3500
24.3
323
.90
24.7
592
720
0235
424
.64
23.9
925
.29
475
1,06
7,84
123
.97
23.4
324
.51
452
934,
513
Ed
uca
tion
al L
evel
Pri
mar
y sc
hool
25.2
724
.92
25.6
214
122,
651,
863
23.9
523
.58
24.3
162
11,
205,
216
26.3
725
.83
26.9
279
11,
446,
647
Low
er s
econ
dar
y24
.69
24.3
725
.01
1446
2,82
0,96
824
.27
23.8
924
.64
796
1,65
3,22
225
.29
24.7
225
.86
650
1,16
7,74
6
scho
olU
pp
er s
econ
dar
y24
.10
23.8
324
.37
2235
4,76
0,18
824
.18
23.7
924
.56
1131
2,51
0,77
624
.01
23.6
524
.38
1104
2,24
9,41
2
scho
olM
atri
cula
tion
/23
.28
22.7
523
.81
355
779,
605
23.6
322
.81
24.4
613
930
8,47
923
.05
22.3
823
.72
216
471,
126
F
orm
6C
olle
ge/
Uni
vers
ity
23.8
523
.38
24.3
195
52,
155,
941
24.4
923
.82
25.1
554
81,
291,
654
22.8
922
.32
23.4
740
786
4,28
7O
ther
s24
.22
23.5
524
.88
355
676,
164
22.6
121
.36
23.8
694
207,
536
24.9
324
.22
25.6
326
146
8,62
9
Nu
trit
ion
al S
tatu
sC
ED
Cla
ss l
ll15
.22
14.9
915
.45
8020
4,43
615
.27
14.9
115
.63
3911
6,84
915
.16
14.9
315
.39
4187
,587
CE
D C
lass
ll
16.5
316
.47
16.5
915
032
0,22
716
.49
16.3
816
.60
6012
2,11
016
.55
16.4
916
.62
9019
8,11
7C
ED
Cla
ss l
17.8
317
.78
17.8
839
884
7,13
517
.86
17.7
917
.92
199
431,
651
17.8
117
.73
17.8
819
941
5,48
4N
orm
al21
.86
21.7
921
.94
3366
6,98
5,08
121
.90
21.8
022
.00
1730
3,75
1,95
521
.82
21.7
121
.93
1,63
63,
233,
126
Pre
-obe
se27
.18
27.1
127
.25
1907
3,78
6,83
527
.19
27.0
927
.28
976
2,05
8,75
527
.17
27.0
727
.28
931
1,72
8,08
0O
bese
Cla
ss l
32.0
431
.88
32.2
165
51,
300,
997
32.0
731
.75
32.3
925
754
6,12
932
.03
31.8
732
.19
398
754,
867
Obe
se C
lass
ll
36.7
136
.46
36.9
613
828
8,51
636
.54
36.2
436
.85
4811
6,81
236
.82
36.4
737
.17
9017
1,70
3O
bese
Cla
ss l
ll48
.99
46.0
551
.92
7213
2,80
552
.86
45.6
360
.10
2238
,199
47.4
244
.66
50.1
850
94,6
06
App
endi
x 2
Con
tinu
ed
Azmi MY, Junidah R, Siti Mariam A et al.114A
pp
end
ix 3
. P
reva
lenc
e of
ove
rwei
ght
by s
ocio
-dem
ogra
phi
c ch
arac
teri
stic
s
Cha
ract
eris
tics
Tota
lM
enW
omen
Pre
vale
nce
95%
CI
Tota
lE
stim
ated
Pre
vale
nce
95%
CI
Tota
lE
stim
ated
Pre
vale
nce
95%
CI
Tota
lE
stim
ated
(%)
Low
erU
pper
Sam
ple
Pop
ulat
ion
(%)
Low
erU
pper
Sam
ple
Pop
ulat
ion
(%)
Low
erU
pper
Sam
ple
Pop
ulat
ion
Mal
aysi
a26
.71
25.5
027
.96
1,90
73,
786,
835
28.5
526
.77
30.4
097
62,
058,
755
24.8
023
.16
26.5
193
11,
728,
080
Zon
eSo
uth
29.4
426
.62
32.4
338
987
5,01
433
.07
28.7
037
.75
204
504,
000
25.6
222
.11
29.4
818
537
1,01
4C
entr
al26
.47
24.4
128
.63
640
1,42
6,18
727
.60
24.7
330
.67
338
760,
990
25.2
822
.37
28.4
230
266
5,19
6E
ast C
oast
27.1
723
.93
30.6
825
943
9,30
328
.52
23.9
133
.61
126
237,
196
25.7
521
.37
30.6
713
320
2,10
8N
orth
23.1
020
.17
26.3
020
643
5,80
025
.88
21.5
030
.80
107
237,
786
20.4
516
.74
24.7
599
198,
015
Saba
h26
.76
23.2
830
.55
216
300,
136
27.6
922
.52
33.5
310
615
7,43
925
.80
21.1
931
.02
110
142,
698
Sara
wak
26.0
522
.40
30.0
719
731
0,39
426
.47
21.0
832
.67
9516
1,34
525
.61
20.9
230
.94
102
149,
050
Str
ata
Urb
an26
.60
24.9
628
.30
1,00
82,
245,
195
29.5
027
.06
32.0
555
01,
264,
567
23.6
121
.44
25.9
245
898
0,62
7R
ura
l26
.87
25.1
128
.71
899
1,54
1,64
027
.17
24.6
729
.82
426
794,
188
26.5
624
.14
29.1
447
374
7,45
3
Eth
nic
Gro
up
Mal
ay27
.16
25.5
428
.84
1,04
02,
095,
115
29.2
626
.93
31.7
154
11,
164,
187
24.9
222
.72
27.2
549
993
0,92
8C
hin
ese
24.9
522
.50
27.5
840
588
3,44
829
.00
25.2
133
.10
229
516,
468
20.8
617
.83
24.2
617
636
6,98
0In
dia
n31
.01
26.6
435
.76
195
425,
664
29.3
323
.28
36.2
188
196,
350
32.6
226
.49
39.4
210
722
9,31
4O
rang
Asl
i P
M15
.05
5.64
34.4
17
10,4
1215
.99
3.50
49.9
54
6,10
313
.89
4.26
36.8
73
4,30
9B
um
ipu
tera
23.7
319
.47
28.5
910
613
7,89
424
.33
18.1
831
.75
4767
,108
23.1
917
.52
30.0
359
70,7
86
Saba
hB
um
ipu
tera
28.0
723
.24
33.4
711
217
3,94
324
.64
18.4
332
.12
4778
,344
31.6
824
.67
39.6
465
95,5
99
Sara
wak
Oth
er21
.52
15.0
429
.83
4260
,359
20.3
011
.48
33.3
520
30,1
9522
.91
14.8
833
.56
2230
,165
B
um
ipu
tera
Sex M
en28
.55
26.7
730
.40
976
2,05
8,75
5W
omen
24.8
023
.16
26.5
193
11,
728,
080
Age
Gro
up
18-1
912
.76
8.60
18.5
347
184,
859
10.7
45.
5919
.63
2178
,901
14.8
49.
0723
.35
2610
5,95
820
-29
20.2
018
.27
22.2
840
585
8,36
422
.62
19.7
025
.83
210
488,
840
17.7
015
.29
20.3
919
536
9,52
430
-39
29.1
727
.03
31.4
158
21,
066,
212
34.9
531
.67
38.3
732
564
7,02
323
.24
20.6
026
.10
257
419,
189
40-4
934
.14
31.6
036
.78
546
990,
983
35.0
931
.52
38.8
327
151
9,83
933
.15
29.5
736
.94
275
471,
144
50-5
935
.17
32.0
639
.53
327
686,
417
33.0
428
.21
38.2
514
932
4,15
238
.50
33.1
344
.17
178
362,
265
Body Mass Index (BMI) of Adults: Findings of the Malaysian Adult Nutrition Survey (MANS) 115
Cha
ract
eris
tics
Tota
lM
enW
omen
Pre
vale
nce
95%
CI
Tota
lE
stim
ated
Pre
vale
nce
95%
CI
Tota
lE
stim
ated
Pre
vale
nce
95%
CI
Tota
lE
stim
ated
(%)
Low
erU
pper
Sam
ple
Pop
ulat
ion
(%)
Low
erU
pper
Sam
ple
Pop
ulat
ion
(%)
Low
erU
pper
Sam
ple
Pop
ulat
ion
Hou
seh
old
In
com
eL
ess
than
RM
1500
25.1
423
.51
26.8
595
41,
800,
318
24.1
421
.83
26.6
041
783
5,64
426
.09
23.8
328
.48
537
964,
674
RM
1500
- R
M35
0028
.14
26.0
030
.39
669
1,39
6,51
931
.42
28.3
234
.70
382
839,
379
24.3
221
.48
27.3
928
755
7,13
9M
ore
than
RM
3500
28.7
025
.45
32.2
028
458
9,99
935
.64
30.6
540
.97
177
383,
732
21.0
717
.21
25.5
410
720
6,26
7
Ed
uca
tion
al L
evel
Pri
mar
y sc
hool
31.9
029
.21
34.7
245
986
0,52
229
.46
25.6
333
.60
179
358,
668
33.9
130
.23
37.8
028
050
1,85
4L
ower
(P
MR
)25
.86
23.4
328
.46
402
745,
043
27.0
823
.75
30.7
022
644
8,07
924
.22
20.7
928
.01
176
296,
964
Sec
ond
ary
scho
olU
pp
er
Seco
ndar
y26
.13
24.0
228
.37
612
1,28
0,84
830
.30
27.1
133
.69
344
761,
662
21.7
519
.09
24.6
626
851
9,18
6
sch
ool (
SPM
)M
atri
cula
tion
/24
.34
19.2
530
.27
8619
1,53
126
.37
18.9
135
.47
3681
,333
23.0
416
.52
31.1
750
110,
198
Fo
rm 6
Col
lege
/23
.81
20.8
927
.01
244
523,
157
28.3
724
.14
33.0
117
236
7,49
917
.27
13.5
321
.78
7215
5,65
8
Uni
vers
ity
Oth
ers
26.5
021
.01
32.8
310
218
3,23
718
.64
10.7
130
.43
1840
,011
30.0
423
.43
37.6
084
143,
227
App
endi
x 3
Con
tinu
ed
Azmi MY, Junidah R, Siti Mariam A et al.116A
pp
end
ix 4
. P
reva
lenc
e of
obe
sity
by
soc
io-d
emog
rap
hic
char
acte
rist
ics
Cha
ract
eris
tics
Tota
lM
enW
omen
Pre
vale
nce
95%
CI
Tota
lE
stim
ated
Pre
vale
nce
95%
CI
Tota
lE
stim
ated
Pre
vale
nce
95%
CI
Tota
lE
stim
ated
(%)
Low
erU
pper
Sam
ple
Pop
ulat
ion
(%)
Low
erU
pper
Sam
ple
Pop
ulat
ion
(%)
Low
erU
pper
Sam
ple
Pop
ulat
ion
Mal
aysi
a12
.15
11.2
613
.10
865
1,72
2,31
89.
728.
5411
.06
327
7011
4114
.66
13.3
716
.04
538
1,02
1,17
7Z
one
Sout
h13
.81
11.7
916
.12
189
410,
462
10.0
37.
6513
.04
6715
2,85
617
.79
14.7
421
.32
122
257,
606
Cen
tral
12.5
010
.94
14.2
629
867
3,83
811
.69
9.43
14.4
013
432
2,24
713
.36
11.2
915
.74
164
351,
591
Eas
t Coa
st11
.90
9.63
14.6
111
119
2,40
67.
845.
4411
.17
3465
,208
16.2
012
.54
20.6
877
127,
198
Nor
th12
.72
10.5
815
.22
123
240,
021
7.68
5.32
10.9
633
70,5
5417
.50
14.1
521
.45
9016
9,46
7Sa
bah
8.42
6.59
10.6
874
94,4
037.
545.
1910
.83
3242
,871
9.32
6.76
12.7
242
51,5
32Sa
raw
ak9.
337.
2511
.93
7011
1,18
87.
785.
1711
.54
2747
,405
10.9
67.
9914
.86
4363
,782
Str
ata
Urb
an12
.01
10.8
213
.32
466
1,01
4,11
310
.90
9.20
12.8
720
346
7,23
113
.16
11.5
514
.97
263
546,
882
Ru
ral
12.3
411
.08
13.7
339
970
8,20
58.
006.
599.
6912
423
3,91
016
.86
14.8
319
.10
275
474,
295
Eth
nic
Gro
up
Mal
ay15
.28
13.9
116
.77
562
1,17
8,99
911
.25
9.45
13.3
319
544
7,41
919
.58
17.5
821
.75
367
731,
580
Ch
ines
e7.
205.
948.
6912
825
4,75
77.
776.
0010
.01
6813
8,39
06.
614.
968.
7760
116,
367
Ind
ian
12.6
610
.16
15.6
791
173,
768
10.4
17.
2214
.78
3169
,692
14.8
111
.20
19.3
160
104,
075
Ora
ng0.
000.
000.
000
00.
000.
000.
000
0
Asl
i P
MB
um
ipu
tera
7.86
5.56
11.0
137
45,6
938.
415.
0613
.64
1823
,187
7.37
4.58
11.6
719
22,5
06
Saba
hB
um
ipu
tera
6.82
4.60
10.0
028
42,2
625.
332.
809.
9111
16,9
328.
395.
0913
.53
1725
,330
Sa
raw
akO
ther
9.57
5.76
15.4
919
26,8
393.
711.
3010
.15
45,
521
16.1
99.
4626
.33
1521
,318
B
um
ipu
tera
Sex M
en9.
728.
5411
.06
327
701,
141
Wom
en14
.66
13.3
716
.04
538
1,02
1,17
7
Age
Gro
up
18-1
95.
943.
1111
.08
2386
,125
6.52
2.33
16.9
611
47,9
225.
352.
6610
.48
1238
,203
20-2
910
.26
8.80
11.9
320
043
5,80
79.
427.
4611
.83
8820
3,64
111
.12
9.07
13.5
611
223
2,16
530
-39
12.6
811
.20
14.3
325
846
3,63
910
.08
8.16
12.4
092
186,
627
15.3
613
.20
17.7
916
627
7,01
240
-49
15.1
213
.27
17.1
924
743
8,93
310
.26
8.19
12.7
786
151,
933
20.1
917
.21
23.5
516
128
7,00
150
-59
15.4
912
.89
18.5
113
729
7,81
411
.31
8.33
15.1
950
111,
018
19.8
515
.78
24.6
787
186,
796

Body Mass Index (BMI) of Adults: Findings of the Malaysian Adult Nutrition Survey (MANS) 117
Cha
ract
eris
tics
Tota
lM
enW
omen
Pre
vale
nce
95%
CI
Tota
lE
stim
ated
Pre
vale
nce
95%
CI
Tota
lE
stim
ated
Pre
vale
nce
95%
CI
Tota
lE
stim
ated
(%)
Low
erU
pper
Sam
ple
Pop
ulat
ion
(%)
Low
erU
pper
Sam
ple
Pop
ulat
ion
(%)
Low
erU
pper
Sam
ple
Pop
ulat
ion
Hou
seh
old
In
com
eL
ess
than
R
M15
0012
.29
11.0
113
.71
451
880,
181
8.15
6.40
10.3
112
828
2,01
316
.18
14.4
018
.13
323
598,
167
RM
1500
- R
M35
0013
.13
11.6
614
.76
316
651,
759
12.5
910
.66
14.8
015
733
6,22
513
.77
11.6
116
.26
159
315,
534
Mor
e th
an R
M35
009.
267.
4311
.49
9819
0,37
87.
705.
5810
.55
4282
,902
10.9
88.
1314
.66
5610
7,47
6
Ed
uca
tion
al L
evel
Pri
mar
y sc
hool
14.4
112
.44
16.6
220
038
8,61
87.
505.
5210
.10
4791
,294
20.0
917
.05
23.5
215
329
7,32
4L
ower
(PM
R)
13.6
511
.77
15.7
720
539
3,13
410
.64
8.41
13.3
882
176,
055
17.7
014
.67
21.2
112
321
7,07
9 S
econ
dar
y sc
hool
Upp
er (
SPM
)11
.69
10.3
113
.22
290
572,
726
10.2
18.
4312
.32
125
256,
723
13.2
411
.21
15.5
616
531
6,00
2 S
econ
dar
y sc
hool
Mat
ricu
lati
on/
7.11
4.75
10.5
229
55,9
796.
583.
2512
.88
920
,311
7.46
4.63
11.7
920
35,6
68
Form
6C
olle
ge/
9.87
7.42
13.0
394
216,
937
11.1
27.
4916
.19
5714
4,00
58.
095.
7311
.30
3772
,932
U
nive
rsit
yO
ther
s11
.33
7.91
15.9
743
78,3
284.
041.
709.
296
8,67
814
.61
9.98
20.8
937
69,6
51
App
endi
x 4
Con
tinu
ed

Azmi MY, Junidah R, Siti Mariam A et al.118A
pp
end
ix 5
. Pre
vale
nce
of C
ED
by
soci
o-d
emog
rap
hic
cha
ract
eris
tics
Cha
ract
eris
tics
Tota
lM
enW
omen
Pre
vale
nce
95%
CI
Tota
lE
stim
ated
Pre
vale
nce
95%
CI
Tota
lE
stim
ated
Pre
vale
nce
95%
CI
Tota
lE
stim
ated
(%)
Low
erU
pper
Sam
ple
Pop
ulat
ion
(%)
Low
erU
pper
Sam
ple
Pop
ulat
ion
(%)
Low
erU
pper
Sam
ple
Pop
ulat
ion
Mal
aysi
a9.
028.
8210
.61
628
1371
,798
9.30
8.14
10.6
029
867
0,61
010
.06
8.84
11.4
333
070
1,18
8Z
one
Sout
h8.
296.
8410
.02
117
246,
521
8.76
6.75
11.3
059
133,
520
7.80
5.86
10.3
258
1130
00C
entr
al10
.24
8.76
11.9
422
655
1,99
49.
717.
7612
.08
109
267,
630
10.8
18.
6913
.36
117
284,
364
Eas
t Coa
st10
.50
8.11
13.5
184
169,
842
8.59
5.97
12.2
138
71,4
3912
.54
8.75
17.6
546
9840
3N
orth
10.0
07.
7212
.87
8218
8,76
710
.22
7.12
14.4
541
93,8
929.
806.
7614
.01
4194
875
Saba
h9.
126.
7412
.24
5810
2,33
27.
264.
7011
.04
2541
,261
11.0
47.
3016
.36
3361
071
Sara
wak
9.43
6.76
13.0
161
112,
343
10.3
16.
0916
.93
2662
,869
8.50
5.93
12.0
535
4947
4
Str
ata
Urb
an9.
788.
6711
.02
354
825,
923
9.19
7.77
10.8
517
039
4,04
810
.40
8.76
12.3
018
443
1,87
5R
ura
l9.
528.
2210
.99
274
545,
875
9.46
7.61
11.7
012
827
6,56
29.
577.
8611
.61
146
269,
313
Eth
nic
Gro
up
Mal
ay9.
118.
0210
.34
322
703,
048
9.74
8.18
11.5
717
238
7,66
28.
447.
0110
.14
150
315,
386
Ch
ines
e9.
707.
9711
.75
148
343,
285
6.49
4.76
8.78
4911
5,54
012
.95
10.1
216
.42
9922
7,74
5In
dia
n12
.58
9.53
16.4
374
172,
705
15.0
510
.27
21.5
441
100,
783
10.2
36.
9014
.92
3371
,922
Ora
ng A
sli
PM
14.5
35.
1434
.77
510
,052
3.83
0.44
26.5
51
1,46
127
.69
10.4
355
.74
48,
591
Bu
mip
ute
ra10
.62
6.83
16.1
529
61,7
087.
754.
2313
.76
1221
,365
13.2
27.
3122
.71
1740
,343
Sa
bah
Bu
mip
ute
ra9.
196.
4013
.01
3456
,930
9.25
5.41
15.3
615
29,4
049.
125.
6114
.49
1927
,526
Sa
raw
akO
ther
8.58
4.90
14.6
016
24,0
699.
684.
2420
.61
814
,394
7.35
3.42
15.0
78
9,67
5
Bu
mip
ute
ra
Sex M
en9.
308.
1410
.60
298
670,
610
Wom
en10
.06
8.84
11.4
333
070
1,18
8
Age
Gro
up
18-1
926
.24
21.1
232
.09
122
380,
162
25.6
918
.53
34.4
666
188,
824
26.8
019
.99
34.9
156
191,
338
20-2
913
.55
11.9
815
.29
288
575,
584
13.7
011
.56
16.1
514
029
5,97
913
.39
11.1
715
.97
148
279,
605
30-3
94.
663.
775.
7410
217
0,38
93.
742.
645.
2937
69,2
865.
604.
317.
2665
101,
103
40-4
94.
353.
305.
7165
126,
299
4.95
3.42
7.13
3573
,402
3.72
2.47
5.58
3052
,897
50-5
96.
214.
418.
6851
119,
364
4.39
2.63
7.25
2043
,119
8.10
5.17
12.4
831
76,2
45
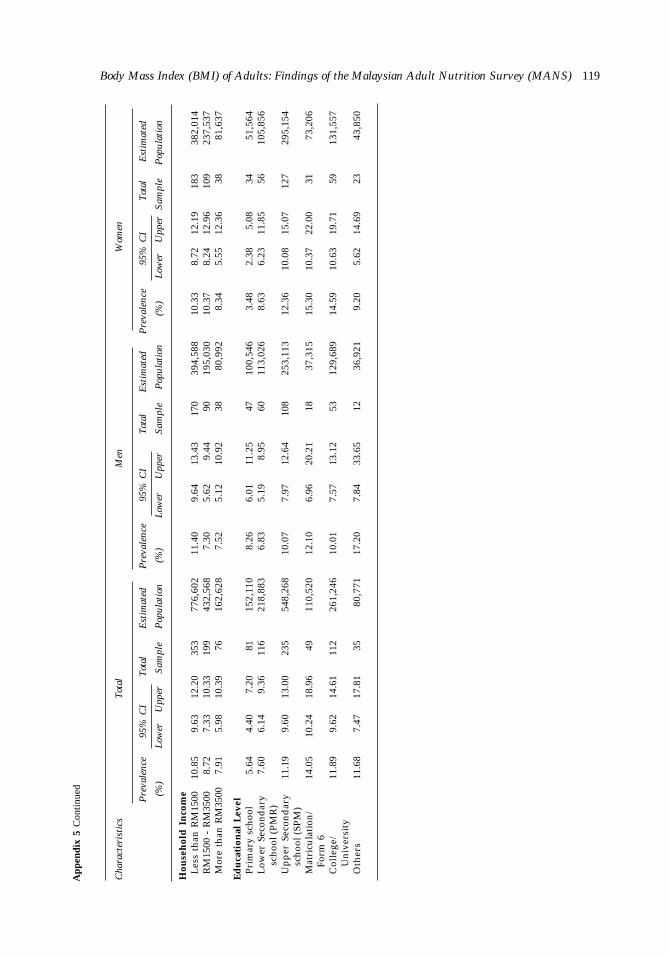
Body Mass Index (BMI) of Adults: Findings of the Malaysian Adult Nutrition Survey (MANS) 119
Cha
ract
eris
tics
Tota
lM
enW
omen
Pre
vale
nce
95%
CI
Tota
lE
stim
ated
Pre
vale
nce
95%
CI
Tota
lE
stim
ated
Pre
vale
nce
95%
CI
Tota
lE
stim
ated
(%)
Low
erU
pper
Sam
ple
Pop
ulat
ion
(%)
Low
erU
pper
Sam
ple
Pop
ulat
ion
(%)
Low
erU
pper
Sam
ple
Pop
ulat
ion
Hou
seh
old
In
com
eL
ess
than
RM
1500
10.8
59.
6312
.20
353
776,
602
11.4
09.
6413
.43
170
394,
588
10.3
38.
7212
.19
183
382,
014
RM
1500
- R
M35
008.
727.
3310
.33
199
432,
568
7.30
5.62
9.44
9019
5,03
010
.37
8.24
12.9
610
923
7,53
7M
ore
than
RM
3500
7.91
5.98
10.3
976
162,
628
7.52
5.12
10.9
238
80,9
928.
345.
5512
.36
3881
,637
Ed
uca
tion
al L
evel
Pri
mar
y sc
hool
5.64
4.40
7.20
8115
2,11
08.
266.
0111
.25
4710
0,54
63.
482.
385.
0834
51,5
64L
ower
Sec
ond
ary
7.60
6.14
9.36
116
218,
883
6.83
5.19
8.95
6011
3,02
68.
636.
2311
.85
5610
5,85
6
scho
ol (
PM
R)
Up
per
Sec
ond
ary
11.1
99.
6013
.00
235
548,
268
10.0
77.
9712
.64
108
253,
113
12.3
610
.08
15.0
712
729
5,15
4
scho
ol (
SPM
)M
atri
cula
tion
/14
.05
10.2
418
.96
4911
0,52
012
.10
6.96
20.2
118
37,3
1515
.30
10.3
722
.00
3173
,206
Fo
rm 6
Col
lege
/11
.89
9.62
14.6
111
226
1,24
610
.01
7.57
13.1
253
129,
689
14.5
910
.63
19.7
159
131,
557
U
nive
rsit
yO
ther
s11
.68
7.47
17.8
135
80,7
7117
.20
7.84
33.6
512
36,9
219.
205.
6214
.69
2343
,850
App
endi
x 5
Con
tinu
ed
Related Documents