Am J Clin Nuir 1989;50:1 167-75. Printed in USA. C 1989 American Society for Clinical Nutrition 1167 Body composition in elderly subjects: a critical appraisal of clinical methodology1’2 Steven B Heymsfield, Jack Wang, Steven Lichtman, Yakov Kamen, Joseph Kehayias, andRichard NPierson, Jr ABSTRACt’ Body composition measurements are integral to nutritional assessment of elderly subjects. The validity of methods available for partitioning body weight into its tissue or chemical subfractions in the geriatric population is of primary importance. Until recently verifying the accuracy ofbody composition techniques in vivo was limited by prevailing tech- nology. New advances such as neutron activation analysis, neutron inelastic scattering, and dual photon absorptiometry now promise to overcome these earlier limitations. With these new tools investigators can now examine critical underlying assumptions related to body corn- position assessment in elderly subjects. This review highlights the need and opportunities for future research in this area. Am JClin Nutr 1989;50:l 167-75. KEY WORDS Body composition, hydrodensitornetry, neutron activation analysis, elderly Introduction As the elderly population increases in size, a growing health concern centers on geriatric nutritional status and methods ofassessment. This heightened interest in nutri- tional assessment is leading to a critical appraisal of cur- rent methodology, especially those related to elderly sub- jects. The central question under scrutiny is “can tech- niques developed and validated in young adults be applied with confidence in an aged individual?” This re- view will describe the efforts ofourlaboratory in evaluat- ing and refining body composition methodology for use in elderly subjects. Body composition There are multiple reasons for the need to collect body composition information in elderly subjects, such as es- tablishing energy stores and protein mass, determining skeletal mineral status, developing a reference base for energy expenditure, and defining relative hydration. These needs are accomplished by subdividing body weight into compartments that represent specific chemi- cal compounds, homogeneous tissues, or spaces that share common physiological properties. As a general rule the number ofcompartments (C) into which body mass is divided requires C - 1 measure- ments (M) in addition to body weight, or M=C-1 Hence, a two-compartment model requires one addi- tional measurement, a four-compartment model re- quires three additional measurements, and so on. Two-compartment model The traditional two-compartment model forms the basis of a majority of our current knowledge of body composition and related energy expenditure. The two- compartment method subdivides body weight into two physiologically distinct subfractions, the energy storage depot fat and the remaining metabolically active fat-free body mass. There is no direct method of measuring fat in the living, and fat free body mass is a heterogeneous compartment, so the single measurement required for separating the subfractions of body weight must rely upon a model. There are three classic two-compartment models. The first is hydrodensitometry in which body density (D) is used in the model described below to calculate fat and fat free body mass (1). The second model defines a relation between total body potassium measured in a whole-body counter, and lean (or fat-free) body mass (2). Total body water is the third model used to derive fat- free body mass (3) by use of isotopically labeled water 1 From the Departments of Medicine and Radiology, Columbia University College of Physicians and Surgeons, St Luke’s-Roosevelt Hospital, New York. 2 Address reprint requests to SB Heymsfield, Weight Control Unit, St Luke’s-Roosevelt Hospital, 41 1 West 1 14th Street, New York, NY (1) 10025.

Welcome message from author
This document is posted to help you gain knowledge. Please leave a comment to let me know what you think about it! Share it to your friends and learn new things together.
Transcript

Am J Clin Nuir 1989;50:1 167-75. Printed in USA. C 1989 American Society for Clinical Nutrition 1167
Body composition in elderly subjects: a critical appraisalof clinical methodology1’2
Steven B Heymsfield, Jack Wang, Steven Lichtman, Yakov Kamen,Joseph Kehayias, andRichard NPierson, Jr
ABSTRACt’ Body composition measurements are integral to nutritional assessment ofelderly subjects. The validity of methods available for partitioning body weight into its tissue
or chemical subfractions in the geriatric population is of primary importance. Until recently
verifying the accuracy ofbody composition techniques in vivo was limited by prevailing tech-
nology. New advances such as neutron activation analysis, neutron inelastic scattering, anddual photon absorptiometry now promise to overcome these earlier limitations. With thesenew tools investigators can now examine critical underlying assumptions related to body corn-
position assessment in elderly subjects. This review highlights the need and opportunities for
future research in this area. Am JClin Nutr 1989;50:l 167-75.
KEY WORDS Body composition, hydrodensitornetry, neutron activation analysis,
elderly
Introduction
As the elderly population increases in size, a growinghealth concern centers on geriatric nutritional status andmethods ofassessment. This heightened interest in nutri-tional assessment is leading to a critical appraisal of cur-rent methodology, especially those related to elderly sub-jects. The central question under scrutiny is “can tech-niques developed and validated in young adults be
applied with confidence in an aged individual?” This re-view will describe the efforts ofourlaboratory in evaluat-ing and refining body composition methodology for use
in elderly subjects.
Body composition
There are multiple reasons for the need to collect bodycomposition information in elderly subjects, such as es-tablishing energy stores and protein mass, determiningskeletal mineral status, developing a reference base forenergy expenditure, and defining relative hydration.These needs are accomplished by subdividing bodyweight into compartments that represent specific chemi-
cal compounds, homogeneous tissues, or spaces thatshare common physiological properties.
As a general rule the number ofcompartments (C) intowhich body mass is divided requires C - 1 measure-ments (M) in addition to body weight, or
M=C-1
Hence, a two-compartment model requires one addi-tional measurement, a four-compartment model re-quires three additional measurements, and so on.
Two-compartment model
The traditional two-compartment model forms thebasis of a majority of our current knowledge of bodycomposition and related energy expenditure. The two-compartment method subdivides body weight into twophysiologically distinct subfractions, the energy storagedepot fat and the remaining metabolically active fat-freebody mass. There is no direct method of measuring fatin the living, and fat free body mass is a heterogeneous
compartment, so the single measurement required forseparating the subfractions of body weight must relyupon a model.
There are three classic two-compartment models. Thefirst is hydrodensitometry in which body density (D) isused in the model described below to calculate fat and fatfree body mass (1). The second model defines a relation
between total body potassium measured in a whole-bodycounter, and lean (or fat-free) body mass (2).
Total body water is the third model used to derive fat-free body mass (3) by use of isotopically labeled water
1 From the Departments of Medicine and Radiology, Columbia
University College of Physicians and Surgeons, St Luke’s-RooseveltHospital, New York.
2 Address reprint requests to SB Heymsfield, Weight Control Unit,St Luke’s-Roosevelt Hospital, 41 1 West 1 14th Street, New York, NY
(1) 10025.

1168 HEYMSFIELD ET AL
TABLE 1Hierarchy ofbody composition methodology
I. Chemical analysis ranging from isolated tissues to whole cadaversII. Direct quantification ofbody constituent in vivo
III. Model approach to estimating body compartment in vivoIV. Somatic physical property measured in vivo calibrated against
body constituent derived by techniques at levels I-Ill
fat-free body mass estimated in elderly subjects by bioim-pedance analysis depends largely on whether or not thecadavers used to validate hydrodensitometry are repre-sentative ofolder adults.
Hydrodensitometry: a critical appraisalin elderly subjects
Historical overview
compounds such as 3H2O, D2O, or H2O18. Fat is calcu-lated in both the total body potassium and total bodywater methods as the difference between body weightand fat-free body mass. Hence body weight can be di-vided into fat and fat-free body mass by measurement of
density, total body potassium, or total body water.The focus ofthis paper is the applicability ofthese two-
compartment models in elderly subjects. The relevanceof this endeavor can be further appreciated through anunderstanding of the hierarchy of body compositionmethodology.
Method hierarchy
At the highest level ofbody composition methodologyis chemical analysis of tissue (Table 1). Although re-gional tissue biopsies are relatively easy to obtain, an ar-duous effort is required for the performance of a com-plete cadaver analysis. Only several cadaver studies are
available for review in the modern literature (2, 4-6).At the next level, we place in vivo measuring tech-
niques that directly quantify an anatomical structure orchemical tissue constituent. Direct quantification asused in this context implies noninvasive measurement ofa specific structural or chemical mass in vivo and doesnot refer to the analysis of isolated tissue as in level I.Examples include estimation of total body sodium, cal-cium, and nitrogen by neutron activation analysis (7).
The third methodology level consists of techniquesthat are based upon experimental models, eg, the two-compartment approach described earlier.
At the fourth and final level we find many ofour clini-cal assessment methods. The common feature in thisgroup is that each one measures a somatic physical prop-erty, and in turn must be calibrated against a higher levelmethod for conversion to an actual body space. Skin-folds measure subcutaneous fat thickness (8), but esti-mating total body fat requires calibration against higherlevel methods. Bioimpedancc analysis measures body re-sistance which is then used to estimate total body waterand fat free body mass through appropriately derivedprediction equations (9).
The body composition field is structured in such a waythat measurement errors or inaccurate assumptions arepropogated from one level to the next. For example, hy-drodensitometric evaluation of fat-free body mass (levelIII) relies on a cadaver-validated model (level I). Withbioimpedance analysis (level IV), measured body resis-tance is often calibrated against underwater weighing-dc-rived fat-free body mass. Thus, the accuracy of fat and
The hydrodensitometry method dates back to the turnof the century when Spivak (10) attempted to quantifycorpulence by underwater weighing. The techniquefailed to meet expectations until Behnke and his col-leagues, almost four decades later, refined the techniquefor density determination (1 1). The general principle isthat density varies inversely with body fat, or
F=fll/D), (2)
where F is the fraction ofbody weight as extractable lipid
and f is an experimentally derived mathematical func-tion. The simplest solution for fat in this equation isbased upon the two-compartment model (Body weight(BW) = fat + fat-free body mass) developed by Behnke(12), Brozek (1 3), and others. In essence, two points forfat were considered where F = 0 (the absence of fat) andF = 1 .0 (all fat). For F = 1 .0, the density was that ofchemically extracted human fat. When total body fat was
set to zero, the estimated fat free body density was 1.10g/cc. These two sets ofdata points allowed developmentofthe appropriate function (f) by linear regression analy-sis (14). How were the needed densities of fat and fat-free body mass established? Are there adjustments in themodel when applied to an elderly person? We now exam-inc these questions in detail.
Whole body density (D) or the density offat-free bodymass (d�) arc functions ofeach compartment’s specificvolume at 36 #{176}C(average body temperature) according
to the relation
Dord�M � [(�) x Sv1]�’n
1=1
(3)
where M and SV1 are the mass and specific volume (1/
D) ofcompartment i and M� is the total body or compart-ment mass. In essence this equation allows calculation ofthe density resulting from a mixture ofsubstances whoseamounts and densities (specific volumes) are known.The ultimate aim is to use this equation to calculate the
density of fat-free body mass.The density and specific volume of fat were deter-
mined on human biopsy samples by Fidanza et al (15)(Table 2). Brozek and his colleagues divided the remain-ing body weight components into three chemical group-ings, aqueous (A), protein (P), and mineral (M)(1 3). Themineral was considered in two parts, osseous (0) and ccl-lular (C). The densities and specific volumes ofwater andrepresentative proteins were known (Table 2), and therespective constants for mineral were calculated from a

BODY COMPOSITION AND AGING 1 169
TABLE 2Densities and specific volumes ofchemical constituents at average
body temperature (36 ‘C)
Substance Density Specific volume
g/cc cc/g
Fat(F) 0.9007 1.1102
Water(A) 0.99371 1.0063
Protein(P) 1.34 0.7463
Osseous mineral (M0) 2.982 0.3353
Cellmineral(M�) 3.317 0.3015
* Modified from reference 13.
detailed analysis ofbonc and cell minerals. Fat-free bodymass was then considered the sum ofA, P, and M. Thus,
each specific volume needed to solve Eq 3 for either totalbody density (D) or the density of fat-free body mass(d�) was known.
The next step in solving Eq 3 for the density of fat-freebody mass required fractions (M1/M�) for A, P, and M.During the late l950s, there were data available from theliterature for five complete cadavers, four of which weremales and one was a female (1 3). One clearly abnormalmale and the female were excluded, leaving three rela-
tively young males between the ages of 25 and 46 y.Based upon these three cadavers and the specific vol-umes presented in Table 2, solving Eq 3 resulted in a fat-free density of 1 . 100 g/cc. Brozek and his colleagues (13)thus confirmed Bchnkes estimated fat-free density of1 . 10 g/cc (12) and equally similar results in animals (18).
Returning now to Eq 2, linear regression analysis canbe used to develop a solution for the fraction of bodyweight as fat based upon the two-compartment model inwhich the density of fat is equal to 0.9 g/cc (ic, F = 1.0)and fat-free density equals 1. 10 g/cc (ie, F = 0). Accord-ing to Siri (14),
F = [4.95 X (��)- 4.50]. (4)
This is the current hydrodensitometry equation in wide-
spread clinical use.Suggestions that the present hydrodensitometry
model’s estimated constant for fat-free density is misap-plied in elderly subjects are well founded. With aging,skeletal demineralization leads to a loss in the high-den-sity mineral fraction, creating the potential for a loweringof fat-free density. Errors in the assumed lean densitytranslate directly into inaccuracies in calculated fat andfat-free body mass (19). In other words, the two-com-partment hydrodensitometry model is based on a fat-free
density of 1 . 10 (g/cc). Higher orlower actual fat-free den-sities will, respectively, under- and overestimate percentbody fat. In a series of recent and ongoing studies, ourgroup refined the techniques needed to critically exam-inc the validity of hydrodensitometry in elderly subjectsand performed pilot studies in selected subjects. Our aim
in the following section is to review the principles and
applications ofthis new methodology.
Four-compartment model
A four-compartment model is traditionally used to re-construct body density in vivo (16). The examination ofa four-compartment model in relation to elderly subjectsis useful in establishing the validity of the present two-
compartment hydrodensitometry model.The development of a four-compartment model is
based on the following considerations. The density ofwater at body temperature is a physical constant, and thedensities offat and protein are known through represen-tative chemical analyses (Table 2). The remaining mm-eral fraction is found in bone and solubilized in the aque-ous phase of fat-free soft tissues. The mineral fraction,consisting of many inorganic compounds, requires gen-eralizations regarding the amounts ofconstituents to ar-rive at a working density. Our efforts in quantifying eachfraction are now reviewed. A section will then follow thatdescribes our efforts in applying these methods to thestudy ofbody composition in elderly subjects.
Mineral. Although still imperfect, the methods nowavailable for estimating mineral arc vastly improved overthose used by early workers. Bone mineral can be mea-sured by either neutron activation analysis (20) or dualphoton absorptiometry (DPA) (2 1). We have coliabo-rated with Brookhaven National Laboratory investiga-
tors in the use of delayed gamma neutron activationanalysis for measurement oftotal body calcium (TBCa).Subjects are first activated by a 238Pu-Be source and theensuing “y-ray decay spectra arc recorded in a whole-body counter. Our system provides TBCa with a bet-ween-measurement precision of 1% (20). The delayedgamma study also permits measurement of total bodysodium, chloride, and phosphorous. In our studies, weassume that TBCa is all within bone and that calciumrepresents 34% ofskeletai ash weight (22).
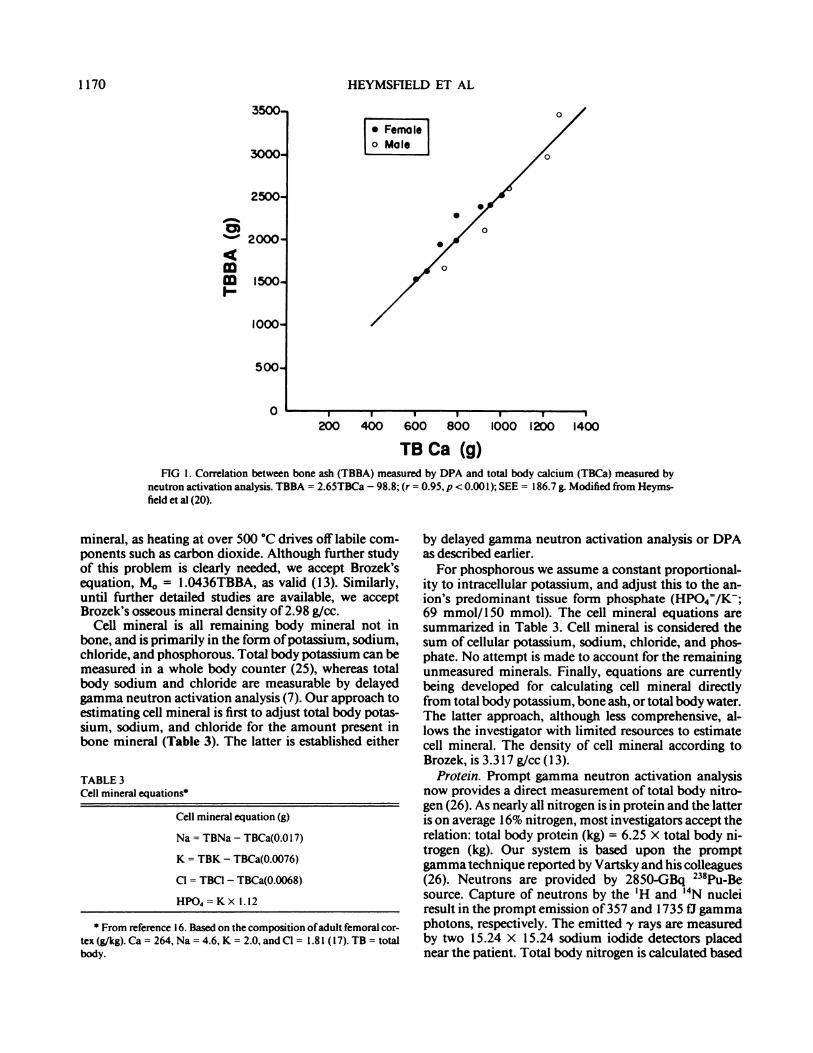
A more recent development is the availability ofwhole-body DPA. Our system, a Lunar DP-4, partitionsbody weight into soft tissue mass and bone ash using thetwo energy levels (16 and 7 t3) of gadolinium (‘53Gd).The technical aspects and theory of DPA are presentedin Ref 2 1 . The differential attenuation of bone mineraland soft tissue at the two “y-ray energy levels is detectedby the system’s sodium iodide crystals. Through iterativeprograms the body weight is resolved into soft tissue andbone ash. The validity of this approach was establishedin skeletons (23) and by neutron activation analysis invivo (24). A recent study at our center showed a closecorrelation between bone ash measured by DPA andTBCa derived by delayed gamma neutron activationanalysis (2 1) (Fig 1, r = 0.97, p < 0.00 1). The between-
day coefficient ofvariation (CV) for bone ash in our labo-ratory is < 1%. The ratio of TBCa to bone ash of 0.34was within the range of 0.34-0.37 established in ashedand chemically analyzed skeletons.
Two methods are thus available for estimating boneash (TBBA). The ash must now be converted to osseous
3500-
3000-
i-� Femo�J[o Male
0
0
0
500
0
. From reference I 6. Based on the composition ofadult femoral cor-tex(g/kg).Ca= 264,Na= 4.6,K = 2.0,andCl = 1.81 (l7).TB= totalbody.
1170 HEYMSFIELD ET AL
2500-
C)2000-
4
� 1500-I-
1000
I P U P U I U
200 400 600 800 1000 1200 400
TB Ca (g)FIG 1. Correlation between bone ash (TBBA) measured by DPA and total body calcium (TBCa) measured by
neutron activation analysis. TBBA = 2.65TBCa - 98.8; (r = 0.95, p < 0.001); SEE = 186.7 g. Modified from Heyms-
field et al (20).
mineral, as heating at over 500 #{176}Cdrives offlabile com-ponents such as carbon dioxide. Although further studyof this problem is clearly needed, we accept Brozek’sequation, M0 = 1 .O436TBBA, as valid (13). Similarly,until further detailed studies are available, we acceptBrozek’s osseous mineral density of2.98 g/ee.
Cell mineral is all remaining body mineral not inbone, and is primarily in the form ofpotassium, sodium,chloride, and phosphorous. Total body potassium can bemeasured in a whole body counter (25), whereas totalbody sodium and chloride are measurable by delayedgamma neutron activation analysis (7). Our approach toestimating cell mineral is first to adjust total body potas-sium, sodium, and chloride for the amount present inbone mineral (Table 3). The latter is established either
TABLE 3Cell mineral equations
Cell mineral equation (g)
Na = TBNa - TBCa(0.Ol 7)
K = TBK - TBCa(0.0076)
Cl = TBCI - TBCa(0.0068)
HPO4=KX 1.12
by delayed gamma neutron activation analysis or DPAas described earlier.
For phosphorous we assume a constant proportional-ity to intracellular potassium, and adjust this to the an-ion’s predominant tissue form phosphate (HP04/K;69 mmol/l50 mmol). The cell mineral equations aresummarized in Table 3. Cell mineral is considered thesum of cellular potassium, sodium, chloride, and phos-phate. No attempt is made to account for the remainingunmeasured minerals. Finally, equations arc currentlybeing developed for calculating cell mineral directlyfrom total body potassium, bone ash, or total body water.The latter approach, although less comprehensive, al-lows the investigator with limited resources to estimatecell mineral. The density of cell mineral according toBrozek, is 3.317 glee (13).
Protein. Prompt gamma neutron activation analysisnow provides a direct measurement of total body nitro-gen (26). As nearly all nitrogen is in protein and the latteris on average 16% nitrogen, most investigators accept therelation: total body protein (kg) = 6.25 X total body ni-trogen (kg). Our system is based upon the promptgamma technique reported by Vartsky and his colleagues(26). Neutrons are provided by 2850-GBq 238Pu-Besource. Capture of neutrons by the ‘H and �4N nucleiresult in the prompt emission of357 and 1735 f1 gammaphotons, respectively. The emitted -y rays are measuredby two 15.24 x 1 5.24 sodium iodide detectors placed
near the patient. Total body nitrogen is calculated based

.
4a-0
0U-
S
05 10 IS 20 25 30 35 40
BODY COMPOSITION AND AGING 1171
upon total body hydrogen as the internal standard. Thebetween-measurement CV of our system is 2.7%. Thedensity ofthe protein fraction is estimated as 1.34 glee.
Totalbody water. Measurement ofaqueous volume invivo is relatively simple. For example, at our center weuse a 3-h tritium dilution technique that includes appro-priate adjustments for urinary isotope losses (27). This isa precise technique (CV = 1.5%) that provides us withthe tritium dilution space. A more formidable problemis estimation of total body water, which is somewhatsmaller due to hydrogen exchange with nonaqueous car-boxyl and hydroxyl groups. Culebras and Moore (28)suggest a maximum upward total body water distortionof 5.22% based on theoretical calculations. According toForbes(29), the tritium dilution space should be adjusteddownward by 5% to estimate total body water. More re-cently, this hydrogen exchange issue has been examinedusing the stable isotopes H20,8 and D20. Dessication cx-periments indicate H2018 is larger than total body waterby 1% (30). Correspondingly, the D20-H20,8 ratio is1.03-I 05 (30). These data suggest that either deuterium-or tritium-labeled water overestimates total body waterby 4-6%. Accordingly, we adjust the tritium dilutionspace (-5%) and correct for water density at 36 #{176}Ctocalculate aqueous mass (A = 3H20 X 0.95 X 0.99371).
Thus, our FFM model is based on estimates of osseousmineral (M0 ; DPA), cell mineral (M� ; whole body count-ing and delayed gamma neutron activation), protein (P;prompt gamma neutron activation), and water (A:3H20). The lean density can be readily calculated by useofEq 3 and the specific volumes presented in Table 2.
Fat. Recall that our aim is to use a method of measur-ing fat that is unbiased by the aging process; hence, untilproven otherwise this eliminates the traditional two-compartment techniques. Presently, four alternatives areavailable to us.
The fIrst approach is to calculate fat as the differencebetween body weight and fat-free body mass as estimatedby the above measurements. Cohn et al used this methodin their studies of body composition and aging (31, 32).One problem with the difference approach is that all Un-measured portions of fat-free body mass are classified asfat. Usually this represents ‘�-‘ 1 kg, which consists of gly-cogen and other unaccounted for minerals and tracecompounds.
The second approach to fat measurement, now underdevelopment, involves the use of inelastic scattering toquantify total body carbon (TBC) (33). The system,based on a deuterium-tritium neutron generator, mea-sures TBC with a precision of 2%. In the first studies ofTBC at Leeds, Kyre et al (34) suggested a model for cal-culating fat in which total carbon was adjusted for car-bon in protein, bone, and glycogen. Using an improvedLeeds model, we found a correlation coefficient of 0.82(p < 0.01) between TBC-derived fat and fat estimatedby Cohn’s four-compartment method [F = BW - (TBW+ TB protein + bone ash)] in 13 healthy subjects (35).Although the inelastic scattering method has yet to reachits full potential, it presents us with an opportunity
S Fat - � of 4 Methods
FIG 2. Correlation between % fat measured by DPA and % fat esti-mated by averaging the results of four conventional techniques (total
body water, total body potassium, hydrodensitometry, and neutron ac-
tivation)(n = 13, r = 0.95, p < 0.001). From Heymsfield et al (20).
to quantify fat that is largely independent of an mdi-vidual’s age.
The third available aging-independent fat measure-ment technique is DPA. Our whole-body system can beused to derive a term reflecting the ratio of soft tissueattenuation (RST) at 7 and 16 11 (21). The R�, which isused in the bone mineral calculation, correlates linearlywith the proportion offat and lean in soft tissue. Several
centers, including our own, use the R� as a method ofestimating fat in vivo (20, 21, 36). The approach appliedin our laboratory is to first scan six frozen beef phantomsthat vary in fat content. The phantoms, which are sealedin polyethylene bags and irradiated, remain useful for upto 1 y. A calibration equation is developed for percentchemically measured fat vs RST . The patient’s R5T canthen be used to calculate total body fat. We found corre-lation coefficients ranging between 0.80 and 0.95 (all p< 0.001) for DPA fat vs fat estimated by hydrodensitom-etry, total body water, total body potassium, and Cohn’sfour-compartment method (21). The previously men-tioned 1 3 healthy subjects were used in this study, andthe correlation between DPA-fat and the mean fat for thefour conventional methods is presented in Figure 2 (r= 0.95, p < 0.001). Future studies are needed to establishthe strengths and limitations ofestimating fat by photonabsorptiometry.
The fourth and final method of determining fat isbased upon a multicompartment technique that com-bines measurements using total body water, DPA, andhydrodensitometry (S Heymsfield, S Lichtman, RN

1 172 HEYMSFIELD ET AL
Baumgartner, et al, unpublished observations). Tritiumdilution is used to establish “aqueous mass,” and DPAprovides osseous mineral. Cell mineral can be calculatedusing several different approaches (eg, from bone ash) asmentioned earlier. The remaining body mass is proteinplus fat, which can be separated into these two compo-nents by using hydrodensitomctric D corrected for aque-ous, osseous mineral, and cell mineral mass. This four-compartment model (BW = A + M + P + F) is nowbeing refined and evaluated in our laboratory.
Initial results
In relation to the classic four-compartment body com-position model, all components can now be measured orestimated with acceptable accuracy. We therefore did aninitial study aimed at comparing calculated fat-free den-sity to the classic cadaver estimate of 1 . 10 g/ee. This wasthe first step in evaluating the hydrodensitometry modelin general with specific reference to its validity in elderlysubjects.
In this study (16), we estimated aqeous mass by tritiumdilution, protein by prompt gamma neutron activationanalysis, osseous mineral by DPA, cell mineral by de-layed gamma neutron activation analysis (total body Naand Cl) and whole body counting(total body potassium),and fat by DPA. The 13 adult healthy volunteers de-scribed earlier underwent each of these respective stud-ies. The studies were approved by the Institutional Re-view Board ofSt Lukes-Roosevelt Hospital Center.
The four compartments when summed accounted for> 97% of body weight. There was good agreement be-tween calculated density (1 .034 ± 0.06 g/ee) and mea-sured density (1 .038 ± 0.04 g/ee; r = 0.94, p < 0.001)(Fig 3). The absolute difference between the two tech-niques was 0.6 ± 0.4%. This comprehensive evaluationofbody composition is internally consistent in that it ac-counts for most of body weight and accurately recon-structs body density.
The results of calculated fat-free density are summa-rized in Table 4. A, P, M0 , and M� were 73.9%, 19.8%,5.4%, and 0.8% of FFM, respectively. This resulted in afat-free density for the n = 13 of 1 .096 ± 0.04 glee, withno obvious gender difference. Brozek’s average resultsfor the three male cadavers (Table 4) are in good agree-ment with our findings. Although the lowest fat-free den-sity (1.084 g/ee) was observed in the oldest subject(M94), no attempt was made in this small database toisolate age as an independent determinant of fat-freedensity.
The next study, now in progress, involves a muchlarger group ofhealthy men and women. Preliminary re-sults will be presented only for young (ages 19-34 y; I± SD = 29.0 ± 3.9 y, n = 55) and older (ages � 65 y; I± SD = 74.5 ± 5.9 y, n = 6 1) women. A between-groupcomparison ofbody composition between these two agegroups will allow us to examine the validity oftwo com-partmcnt models in elderly subjects. A more comprehen-sive report ofthis investigation is in preparation.
Each ofthe subjects underwent determination of totalbody water (3H2O), mineral (DPA), protein, and fatmass. The protein and fat fractions were calculated frommeasured density adjusted for water and mineral contri-butions. Body cell mass (BCM) was calculated from totalbody potassium as described by Moore and his col-leagues (27).
Both groups were equivalent in weight (I ± SD)(young, 58.0 ± 7.0 kg; elderly, 58.9 ± 8.6 kg) and similarwith respect to body mass index 21 .6 ± 3.4 kg/m2 vs 23.6± 3.9 kg/m2). The older women had more fat and lessfat-free body mass than their younger counterparts (fat= 32.6 ± 6.0% vs 23.4 ± 5.2%). Although fat-free bodymass was 1 1.0% lower in the elderly women, the relativereductions in each lean component differed (A = - 12%,M0 = -20%, and P = -5%). The result was a change inthe fraction of fat-free body mass represented by aque-ous, protein, and mineral mass in the older women(0.7 12, 0.230, and 0.059, respectively) vs the youngerwomen (0.721, 0.214, 0.065, respectively). The calcu-lated fat-free density mass was lower in the older women(1 .099 vs 1 . 101 glee), and the standard deviation of thefat-free density distribution was larger in the elderlygroup (0.010 vs 0.007 glee). The older women showed alower potassium (TBK) content of the fat-free body(TBK/FFM, 53.2 ± 3.4 vs 59.9 ± 5.9 mmol/kg) and areduction in the proportion of fat-free body mass as cellmass (BCM/FFM = 0.49 vs 0.55). An in-depth statisticalanalysis of this data is now underway. Our results arequalitatively similar to those reported earlier by theBrookhaven group (32).
Summary and conclusions
Several implications of our review and these initialstudies are evident. First, the capability clearly exists toexplore body composition in elderly subjects by newlydeveloped in vivo methods that are not potentially con-founded by the aging process, as are more commonmethods. Application of these new methods willstrengthen the field by shifting the emphasis from a fewcadaver studies to large groups ofhealthy adults.
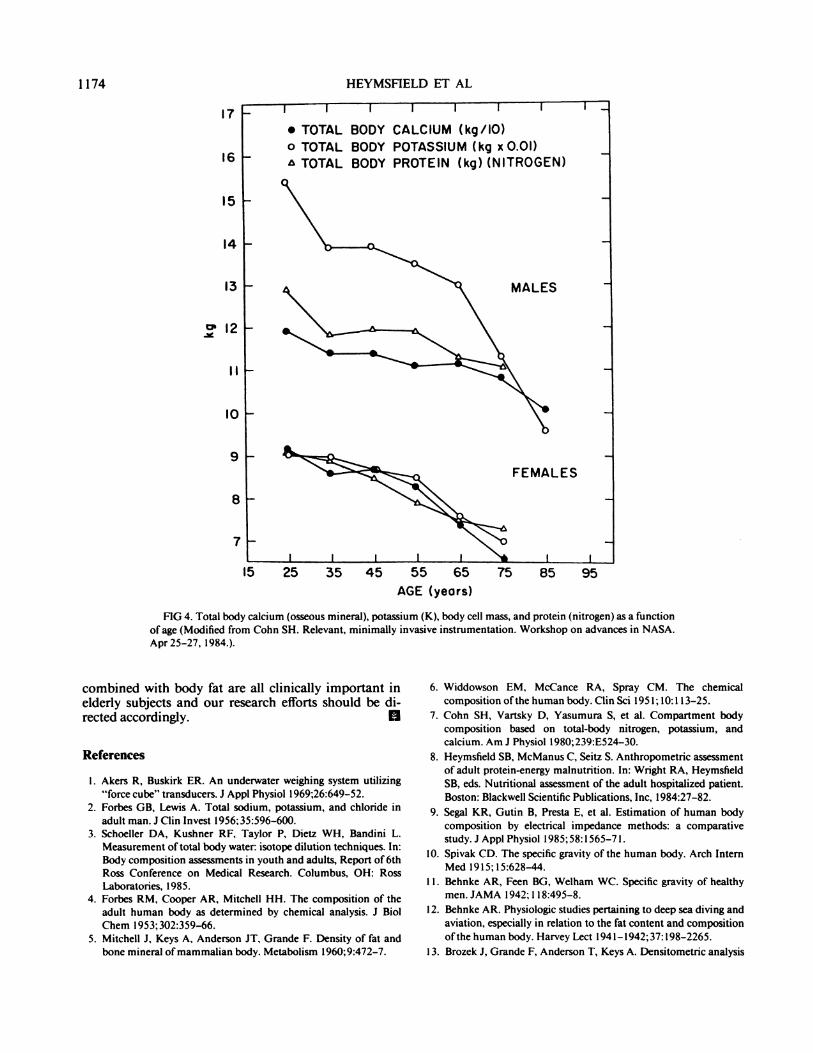
Second, cross-sectional studies such as the one pre-sented above and one previously published by our col-leagues at Brookhaven (Fig 4) demonstrate that alter-ations occur in body composition with aging. The resultis a change in the proportion ofbody weight and fat-freebody mass represented by each compartment. Currentmethods that are potentially age-sensitive must be inten-sively scrutinized and upgraded to account for senes-cence when necessary.
This brings us to our third comment. A collectiveeffort should focus on refining these new methods, thatcan in essence represent calibration standards. We needto shift away from oversimplified reference methods toapproaches that are more resilient with respect to aging,ethnicity, obesity, gender, and the tissue alterations thatoccur with disease. Our presentation above demon-strates that these newer methods are refocusing our con-cepts of human body composition. The eventual result

BODY COMPOSITION AND AGING 1173
109
108
1.07
toe
105#{149}
1.04
1.03
1.02 -
1.01 -
1.00 -
0.99 -
0
line of identity
0
regression hn.
0
0
0
0
0
0.99I I I � I I I I I
1.01 1.03 1.05 107 1.09
(.)
C.)
a)>�
C
�0a)
C.)(00
Meaaured Den8ity (g/cc)
FIG 3. Correlation between body density calculated from measured chemical components to body density mea-sured by hydrodensitometry (n = 13, r = 0.94, p < 0.001). From Heymsfield et al(l8).
will be improved validation and understanding of clini-cal methods for elderly subjects, which largely rely onmore sophisticated techniques for their calibrations.
Finally, our fourth and concluding remark is a synthe-sis ofthe preceeding three comments. If, as suggested, thelean body changes in relative composition with age, whyadhere to two-compartment models that condense these
important alterations into a single-term, fat-free bodymass? The time has arrived to expand our knowledge ofbody composition by use ofmodern technology. Hence,although refining old methods is an important and laud-able goal, the time is now here to perfect techniques thatprovide estimates oftotal body water, extracellular fluid,body cell mass, and bone mineral. These compartments
TABLE 4Comparison offat-free body mass composition (expressed as a fraction offat-free body mass) and density observed in 13 pooled subjects studiedby in vivo methods to 3 (g/cc) previous cadaver studies*
Aqueous(A)
Protein(P)
Osseousmineral
(M0)
Cellmineral
(Me)
Totalmineral
Fat-freedensity
Studies in vivo (n = 13)I 0.739 0.198 0.054 0.008 0.062 1.096Range 0.7 14-0.77 1 0. 164-0.222 0.042-0.065 0.008-0.0 10 0.049-0.078 1.082-1.105
Cadavers (gender/age)M35 0.779 0.166 0.048 0.007 0.055 1.084M25 0.729 0.195 0.056 0.020 0.076 1.129
M46 0.696 0.234 0.064 0.006 0.070 1 . 1 10j; 0.738 0.194 0.056 0.012 0.068 1.100
* Modified from reference 13. This report did not present breakdown of mineral into osseous and nonosseous components. The results shown
represent our estimates based upon the suggestions presented in the original report. Similarly, d� was not presented for each subject, but only forthe pooled subjects (n = 3). The values for each cadaver d� presented in the table represents our estimates based upon the above-mentionedpartition oftotal mineral into M0 and M...
‘7
15 25 35 45 55 65 75 85 95
1174
16
15
‘4
‘3
�l2
I’
I0
9
8
7
HEYMSFIELD ET AL
AGE (years)
FIG 4. Total body calcium (osseous mineral), potassium (K), body cell mass, and protein (nitrogen) as a functionof age (Modified from Cohn SH. Relevant, minimally invasive instrumentation. Workshop on advances in NASA.
Apr25-27, 1984.).
combined with body fat are all clinically important inelderly subjects and our research efforts should be di-rected accordingly. II
References
I. Akers R, Buskirk ER. An underwater weighing system utilizing
“force cube” transducers. J Appl Physiol l969;26:649-52.2. Forbes GB, Lewis A. Total sodium, potassium, and chloride in
adult man. J Clin Invest 1956:35:596-600.3. Schoeller DA, Kushner RF, Taylor P. Dicta WH, Bandini L.
Measurement oftotal body water: isotope dilution techniques. In:Body composition assessments in youth and adults, Report of 6thRoss Conference on Medical Research. Columbus, OH: RossLaboratories, 1985.
4. Forbes RM, Cooper AR, Mitchell HH. The composition of theadult human body as determined by chemical analysis. J Biol
Chem I 953; 302:359-66.5. Mitchell J, Keys A, Anderson iT, Grande F. Density of fat and
bone mineral ofmammalian body. Metabolism 1960;9:472-7.
6. Widdowson EM, McCance RA, Spray CM. The chemical
composition ofthe human body. Clin Sci 195 1;lO:113-25.
7. Cohn SH, Vartsky D, Yasumura 5, et al. Compartment bodycomposition based on total-body nitrogen, potassium, andcalcium. Am J Physiol l980;239:E524-30.
8. Heymsfield SB, McManus C, Seitz S. Anthropometric assessmentof adult protein-energy malnutrition. In: Wright RA, Heymsfield
SB, eds. Nutritional assessment of the adult hospitalized patient.
Boston: Blackwell Scientific Publications, Inc, 1984:27-82.
9. Segal KR, Gutin B, Presta E, et al. Estimation of human body
composition by electrical impedance methods: a comparativestudy. J Appl Physiol l985;58:l565-7l.
10. Spivak CD. The specific gravity ofthe human body. Arch InternMed 1915; 15:628-44.
I 1 . Behnke AR, Feen BG, Welham WC. Specific gravity of healthy
men. JAMA 1942; 1 18:495-8.
12. Behnke AR. Physiologic studies pertaining to deep sea diving and
aviation, especially in relation to the fat content and composition
ofthe human body. Harvey Lect 194 l-l942;37:l98-2265.
13. Brozek J, Grande F, Anderson T, Keys A. Densitometric analysis

BODY COMPOSITION AND AGING 1 175
ofbody composition: revision ofsome assumptions. Ann NY Acad
Sci l963;llO:l13-40.
14. Siri WE. Body composition from fluid spaces and density: analysis
ofmethods. University ofCalifornia Radiation Laboratory Report3349, 1956.
15. Fidanza F, Keys A, Anderson JT. Density ofbody fat in man and
other mammals. J AppI Physiol l953;6:252-6.
16. Keys A, Brozek J. Body fat in adult man. Physiol Rev 1953;33:
245.
17. Lentner C, ed. Geigy scientific tables, vol 1. West Caldwell, NJ:
Ciba-Geigy Corp. 1981.
18. Pace N, Rathbun E. Studies in body composition: III. The bodywater and chemically combined nitrogen content in relation to fat
content. J Biol Chem 1945; 158:685-91.
19. Van Itallie TB, Segal KR, Yang MU, Funk RC. Clinical assessment
ofbody fat content in adults: potential role ofelectrical impedancemethods. In: Roche AF, ed. Body composition assessments in
youth and adults. Report of 6th Ross Conference on MedicalResearch. Columbus, OH: Ross Laboratories, 1985:5-8.
20. Cohn SH, Vaswani AN, Yasumura 5, Ellis KJ. Assessment ofcellular mass by noninvasive nuclear techniques. J Lab Gin Med1985; 105:305-1 1.
21. Mazess RB, Peppler WW, Gibbons M. Total body composition
by dual-photon (‘53Gd) absorptiometry. Am J Clin Nutr l984;40:
834-9.
22. Cohn SH, Vaswani AN, Yasumura 5, Yeun K, Ellis KJ. Improved
models for determination ofbody fat by in vivo neutron activation.
Am J Clin Nutr l984;40:255-9.
23. Gotfredsen A, Borg J, Christiansen C, et al. Total body bone
mineral in vivo by dual photon absorptiometry. II. Accuracy. Clin
Physiol l984;4:357-62.
24. Mazess RB, Peppler WW, Chestnut CH, et al. Total body bone
mineral and lean body mass by dual-photon absorptiometry. II.
Comparison with total body calcium by neutron activation
analysis.CalcifTiss Int 198 l;33:36l-3.
25. Pierson RN, Wang J, Thornton JC, Van Itallie TB, Colt EWD.
Body potassium by four-pi 40K counting: an anthropometric
correction. Am J Physiol l984;F234-39.26. Vartsky D, Ellis KJ, Cohn SH. In vivo quantification of body
nitrogen by neutron capture prompt gamma-ray analysis. J NuclMed l979;20:l158-65.
27. Moore RD. Olesen KH, McMurrey JD, Parker HV, Ball MR.Boyden CM. The body cell mass and its supporting environment.Philadelphia, PA: WB Saunders, 1963.
28. Culebras JM, Moore FD. Total body water and the exchangeable
hydrogen. Theoretical calculations of nonaqueous exchangeablehydrogen in man. Am J Physiol l977;232:R54-9.
29. Forbes GB. Human body composition. New York: Springer-Verlag, 1987:31.
30. Wong WW, Cochran WJ, Lee LS, Klish WJ, Klein PD. Deuteriumand oxygen-18 isotope dilution spaces in normal adults. In: Ellis
KJ, Yasumura 5, Morgan WD, eds. In vivo body composi-tion studies. London: Institute of Physical Sciences in Medicine,1987.
31. Cohn SH, Vaswani AN, Yasumura S, Ellis KJ. Assessment of
cellular mass by noninvasive nuclear techniques. J Lab Clin Med1985; 105:305-11.
32. Cohn SH. Noninvasive techniques for measuring body elemental
composition: state ofthe art and future prospects. Biol Trace ElemRes 1987;13:179-90.
33. Kehayias JJ, Ellis KJ, Cohn SH, Weinlein JH. Use of highrepetition rate neutron generator for in vivo body composition
measurements via neutron inelastic scattering. 9th Conference onApplication of Accelerators in Research and Industry, Denton,TX, November 10-12, 1986.
34. Kyere K, Oldroyd B, Oxby CB, Burkinshaw L, Ellis RE, Hill GL.The feasibility ofmeasuringtotal body carbon by counting neutron
inelastic scattergamma rays. Phys Med Biol l982;27:805-17.35. Kehayias JJ, Wang J, Heymsfield SB, Pierson RN. Determination
of body fat from total body carbon by fast neutrons. FASEB J1988; l:Al203.
36. Gotfredsen A, Jensen J, Borg J, Christiansen C. Measurement oflean body mass and total body fat using dual photonabsorptiometry. Metabolism l986;35:88-93.
Related Documents


