Board Briefing TO: Board of Directors FROM: Debra A. Johnson, General Manager and CEO DATE: July 15, 2021 SUBJECT: Board Briefing Documents - July 2021 This addition to the Board Briefing documents for the month of July can be found on the landing page entitled “Board Briefing” website: https://www.rtd-denver.com/board-briefing-documents. Once reviewed, should Board members have questions regarding the subject matter or information items, a detailed inquiry should be sent to [email protected]. Listed below are the Board Briefing documents by topic and date: Updates • Bus Operations Service Availability – June 2021 • Unaudited Monthly Financial Statement Report – May 2021 • Status of Federal COVID-19 Grant Relief Funding July 2021 • 2021 Performance Report – First Quarter • Rail Operations Briefing May 2021 • Connecting with Customers • Contract Awards/Current Solicitations/Solicitations In Process – July 9, 2021 • Summary of Monthly Purchasing Activity, New Contracts and Purchase Order Activity Reports – May 2021

Welcome message from author
This document is posted to help you gain knowledge. Please leave a comment to let me know what you think about it! Share it to your friends and learn new things together.
Transcript

Board Briefing TO: Board of Directors
FROM: Debra A. Johnson, General Manager and CEO
DATE: July 15, 2021
SUBJECT: Board Briefing Documents - July 2021
This addition to the Board Briefing documents for the month of July can be found on the landing page entitled “Board Briefing” website: https://www.rtd-denver.com/board-briefing-documents. Once reviewed, should Board members have questions regarding the subject matter or information items, a detailed inquiry should be sent to [email protected]. Listed below are the Board Briefing documents by topic and date:
Updates • Bus Operations Service Availability – June 2021
• Unaudited Monthly Financial Statement Report – May 2021
• Status of Federal COVID-19 Grant Relief Funding July 2021
• 2021 Performance Report – First Quarter
• Rail Operations Briefing May 2021
• Connecting with Customers
• Contract Awards/Current Solicitations/Solicitations In Process – July 9, 2021
• Summary of Monthly Purchasing Activity, New Contracts and Purchase Order Activity Reports – May 2021

Regional Transportation District 1660 Blake Street, Denver CO 80202 rtd-denver.com
Bus Operations Service Availability – June 2021
RTD fixed-route bus operations provided 99.81% of all scheduled hours of bus service in June 2021. Lost service hours for personnel related reasons reflects an improvement as compared to the same month (June) last year. Lost service for personnel related reasons follows:
• June 2021 – 18.17 hours • June 2020 – 7.61 hours • Year to date hours for 2021 – 514.59 hours • Year to date hours 2020 – 1551.60 hours
Contributing to service/staffing challenges in June were emergency bus and elevator bridges, the COVID-19 pandemic and the pandemic service reduction. While RTD did provide 99.81% of all scheduled hours of service in the month, it was necessary to cover 0 shifts with RTD operators working a 6th day (one of their scheduled days off). This represents approximately 0 hours of service being provided by a “6th day” RTD operator. Additionally, our contractor partners, First Transit and TransDev, covered 0 shifts, or approximately 0 hours of service, with operators working a “6th day”. The tables below reflect employees who were separated due to retirements, resignations, and termination while not including reduction in force (RIF) and recall numbers.
Recruitment/Retention Category Hired Separated Hired Separated
2021 2020 June 12 10 14 22
Year to Date * 45 80 148 245
Headcount - Bus Operators – June 2021 Category Budgeted Current Vacancies Vacancy Ratio
FT 720 733 -13 -1.81 Total 720 733 -13 -1.81%

2021ACTUAL
2021BUDGET VARIANCE VARIANCE % 2020
ACTUALVARIANCETO 2020
MONTH 61,503 53,886 7,617 14.1% 49,235 12,268 24.9%YTD 281,303 255,520 25,784 10.1% 236,670 44,633 18.9%
MAY 2021ACTUAL VS.
BUDGET
YEAR TO DATE2021 VS. 2020
MAY2021 VS. 2020YTD 2021
ACTUAL VS. BUDGET
Unaudited Monthly Financial Statement - May 2021
14.1%
-5.6%
-17.7%
(In Thousands)
18.9%
-42.7%
-26.6%
24.9%
20.4%
-5048.8%
10.1%
-9.1%
-27.1%
VARIANCE %
TO 2020
SALES AND USE TAXMAY 2021
MAY 20212021 ACTUAL 61,5032021 BUDGET 53,8862020 ACTUAL 49,235
40,000
45,000
50,000
55,000
60,000
65,000
S&U TAX - MAY 2021 ACTUAL VS. BUDGET
$40,000,000.0
$45,000,000.0
$50,000,000.0
$55,000,000.0
$60,000,000.0
$65,000,000.0
SALES AND USE TAX TRENDS
2020 Actual
2021 Budget
2021 Actual
MAY YTD 20212021 ACTUAL 281,3032021 BUDGET 255,5202020 ACTUAL 236,670
200,000
210,000
220,000
230,000
240,000
250,000
260,000
270,000
280,000
290,000
300,000
S&U TAX - YTD ACTUAL VS. BUDGET
S&U TAX
RIDERSHIP
FARE REVENUE
S&U TAX
RIDERSHIP
FARE REVENUE
S&U TAX
RIDERSHIP
FARE REVENUE
S&U TAX
RIDERSHIP
FARE REVENUE
1

2021ACTUAL
2021 BUDGET VARIANCE VARIANCE % 2020
ACTUAL VARIANCE VARIANCE %to 2020
MONTH 3,742 3,964 (222) -5.6% 3,107 635 20.4%YEAR TO DATE 16,641 18,313 (1,672) -9.1% 29,053 (12,412) -42.7%
The N Line opened on September 21, 2020. Fares were suspended for the first week and then will be only local fares for the first six months through March 27,2021.
Ridership May 2021
(In Thousands)
Fares were suspended on April 5, 2020 and resumed on July 1, 2020 due to the COVID-19 pandemic
Bus Mall & Metro Ride Light Rail Commuter Rail OtherMAY 2021 ACTUAL 2,147 241 656 456 46MAY 2020 ACTUAL 3,764 539 1,271 358 59
-
500
1,000
1,500
2,000
2,500
3,000
3,500
4,000RIDERSHIP BY TYPE - MAY 2021
Bus Mall & Metro Ride Light Rail Commuter Rail Other 2021 ACTUAL YTD 7,994 822 2,332 1,586 164 2020 ACTUAL YTD 15,619 2,299 5,654 2,119 254
- 2,000 4,000 6,000 8,000
10,000 12,000 14,000 16,000 18,000
RIDERSHIP BY TYPE - YTD
1.0 2.0 3.0 4.0 5.0 6.0 7.0 8.0 9.0
10.0
(Mill
ions
)
RIDERSHIP TRENDS
2020 Actual
2021 Budget
2021 Actual
MAY 20212021 ACTUAL 3,7422021 BUDGET 3,9642020 ACTUAL 3,107
1,000
1,500
2,000
2,500
3,000
3,500
4,000
4,500
RIDERSHIP - MAY 2021 ACTUAL VS. BUDGET
MAY YTD 20212021 ACTUAL 16,6412021 BUDGET 18,3132020 ACTUAL 29,053
-
5,000
10,000
15,000
20,000
25,000
30,000
35,000
RIDERSHIP - YTD ACTUAL VS. BUDGET
2

2021ACTUAL
2021 BUDGET VARIANCE VARIANCE % 2020
ACTUAL VARIANCE VARIANCE %to 2020
MONTH 6,233 7,572 (1,339) -17.7% (126) 6,359 -5048.8%YEAR TO DATE 25,492 34,966 (9,474) -27.1% 34,708 (9,216) -26.6%
The N Line opened on September 21, 2020. Fares are suspended for the first week and then will be only local fares through March 27, 2021.The fourth quarter 2020 SB 154 ratio was 67.0% which exceeds the statutory minimum of 30.0%
Fare Revenue May 2021
(In Thousands)
Fares were suspended on April 5, 2020 and resumed on July 1, 2020 due to the COVID-19 pandemic.
FARE BOX MY RIDE/MOBILE 10 RIDE/MONTHLY/FLEX COLLEGE PASS ECO PASS TVMMAY 2021 ACTUAL 907 1,099 1,253 592 1,410 973MAY 2020 ACTUAL (15) (0) (114) - - 3
(500)
-
500
1,000
1,500
2,000FARE REVENUE - MAY 2021
FARE BOX MY RIDE/MOBILE 10 RIDE/MONTHLY/FLEX COLLEGE PASS ECO PASS TVM 2021 ACTUAL YTD 4,055 4,137 5,811 2,530 5,648 3,310 2020 ACTUAL YTD 4,223 5,571 8,615 3,811 8,221 4,268
-
2,000
4,000
6,000
8,000
10,000
12,000
FARE REVENUE - YTD
$-
$2.0
$4.0
$6.0
$8.0
$10.0
$12.0
$14.0
(Mill
ions
)
FARE REVENUE TRENDS
2021 Actual
2020 Actual
2021 Budget
MAY 20212021 ACTUAL 6,2332021 BUDGET 7,5722020 ACTUAL (126)
- 1,000 2,000 3,000 4,000 5,000 6,000 7,000 8,000 9,000
10,000
FARE REVENUE - MAY 2021 ACTUAL VS. BUDGET
MAY YTD 20212021 ACTUAL 25,4922021 BUDGET 34,9662020 ACTUAL 34,708
20,000 22,000 24,000 26,000 28,000 30,000 32,000 34,000 36,000 38,000 40,000
FARE REVENUE - YTD ACTUAL VS. BUDGET
3

2021 2021 2021 2021 Dec 31, 2020Base System FasTracks Project FasTracks Ops Combined Combined Change
ASSETSCURRENT ASSETS:
Cash & Cash Equivalents 211,017$ 351,120$ 39,885$ 602,022$ 657,567$ (55,545)$ Receivables:
Sales Taxes 73,006 48,671 - 121,677 114,958 6,719 Grants 75,467 - - 75,467 5,485 69,982 Other (less allowance for doubtful accts) 5,660 4,530 - 10,190 8,551 1,639
Total Net Receivables 154,133 53,201 - 207,334 128,994 78,340 Inventory 33,443 - - 33,443 34,253 (810) Restricted Debt Service/Project Funds 59,309 80,842 - 140,151 88,497 51,654 Other Assets 6,138 1,903 1,255 9,296 9,817 (521)
TOTAL CURRENT ASSETS 464,040 487,066 41,140 992,246 919,128 73,118
NONCURRENT ASSETS:Capital Assets:
Land 171,786 689,348 - 861,134 860,458 676 Land Improvements 1,307,245 4,532,669 - 5,839,914 5,838,359 1,555 Buildings 297,053 392,883 - 689,936 689,916 20 Revenue Earning Equipment 772,204 774,940 - 1,547,144 1,361,911 185,233 Shop, Maintenance & Other Equipment 198,384 7,890 - 206,274 394,412 (188,138) Construction in Progress 52,947 70,489 - 123,436 133,676 (10,240)
Total Capital Assets 2,799,619 6,468,219 - 9,267,838 9,278,732 (10,894) Accumulated Depreciation (1,593,324) (1,207,207) - (2,800,531) (2,678,674) (121,857)
Net Capital Assets 1,206,295 5,261,012 - 6,467,307 6,600,058 (132,751) TABOR Reserves 9,039 10,178 - 19,217 19,258 (41) Restricted Debt Service/Debt Service Reserves 29,139 65,840 - 94,979 94,771 208 Deposits 1,500 - - 1,500 1,500 -
TOTAL NONCURRENT ASSETS 1,245,973 5,337,030 - 6,583,003 6,715,587 (132,584)
TOTAL ASSETS 1,710,013$ 5,824,096$ 41,140$ 7,575,249$ 7,634,715$ (59,466)$
DEFERRED OUTFLOW OF RESOURCES 34,478$ 25,510$ -$ 59,988$ 61,812$ (1,824)$
REGIONAL TRANSPORTATION DISTRICTSTATEMENT OF NET POSITION - COMBINED
(UNAUDITED)(In Thousands)
MAY 31, 2021
(2) Increase in receivables for billings for annual Eco and College passes(1) Primarily for draws submitted on the Eagle FFGA
4

2021 2021 2021 2021 Dec 31, 2020Base System FasTracks Project FasTracks Ops Combined Combined Change
REGIONAL TRANSPORTATION DISTRICTSTATEMENT OF NET POSITION - COMBINED
(UNAUDITED)(In Thousands)
MAY 31, 2021
LIABILITIESCURRENT LIABILITIES:
Accounts & Contracts Payable 33,212$ 17,192$ -$ 50,404$ 89,774$ (39,370)$ Current Portion of Long Term Debt 63,846 13,250 - 77,096 77,096 - Accrued Compensation 25,341 - - 25,341 27,408 (2,067) Accrued Interest Payable 6,719 22,159 - 28,878 19,556 9,322 Other 25,333 2,001 (600) 26,734 19,173 7,561
TOTAL CURRENT LIABILITIES 154,451 54,602 (600) 208,453 233,007 (24,554)
NONCURRENT LIABILITIES:Long Term Debt 344,151 2,879,092 - 3,223,243 3,222,791 452 Other Long-Term Liabilities - 568,290 - 568,290 568,290 - Net Pension Liability 284,791 - - 284,791 284,791 -
TOTAL NONCURRENT LIABILITIES 628,942 3,447,382 - 4,076,324 4,075,872 452
TOTAL LIABILITIES 783,393$ 3,501,984$ (600)$ 4,284,777$ 4,308,879$ (24,102)$
DEFERRED INFLOW OF RESOURCES 25,359$ 5,056$ -$ 30,415$ 25,655$ 4,760$
NET POSITIONNet Investment in Capital Assets 828,127$ 1,855,238$ -$ 2,683,365$ 2,813,989$ (130,624)$ Restricted - Debt Service, Projects and Deferrals 63,362 108,826 - 172,188 120,345 51,843 Restricted - TABOR Reserves 13,917 4,887 4,237 23,041 26,861 (3,820) Restricted - FasTracks - 235,069 - 235,069 216,395 18,674 FasTracks Internal Savings Account (FISA) - 137,304 - 137,304 123,523 13,781 Board Appropriated Fund 26,200 414 12,501 39,115 41,968 (2,853) Capital Replacement Fund - 414 12,501 12,915 15,768 (2,853) Unrestricted Operating Reserve/Mgt Reserve 15,400 - 12,501 27,901 15,400 12,501 Unrestricted Fund 232,832 414 - 233,246 231,843 1,403 Net Pension Liability - Represented (244,099) - - (244,099) (244,099) -
TOTAL NET POSITION 935,739$ 2,342,566$ 41,740$ 3,320,045$ 3,361,993$ (41,948)$
TOTAL LIABILITIES & NET POSITION 1,744,491$ 5,849,609$ 41,140$ 7,635,237$ 7,696,527$ (61,290)$ - - - - -
5
YTD YTD YTD YTD YTD YTD YTD YTDBase Base FasTracks FasTracks FasTracks FasTracks System System $ %
System System Project Project Operations Operations Wide Wide Favorable FavorableActual Budget Actual Budget Actual Budget Actual Budget (Unfavorable) (Unfavorable)
------------ ------------ ------------ ------------ ------------ ------------ ------------ ------------ ------------ ------------OPERATING REVENUE:
Passenger Fares 17,622$ 24,095$ -$ -$ 7,869$ 10,871$ 25,491 34,966 (9,475) -27.1%Advertising, Rent and Other 1,050 1,638 - - 446 675 1,496 2,313 (817) -35.3%
Total Operating Revenue 18,672 25,733 - - 8,315 11,546 26,987 37,279 (10,292) -27.6%OPERATING EXPENSES
Bus Operations 108,883 106,934 - - - - 108,883 106,934 (1,949) -1.8% (1)Rail Operations 22,923 28,813 - - 24,164 34,170 47,087 62,983 15,896 25.2% (2)Planning 1,176 3,341 16 937 - - 1,192 4,278 3,086 72.1% (3)Capital Programs 17,037 20,410 2,250 718 772 1,227 20,059 22,355 2,296 10.3% (4)Safety, Security and Asset Management 8,396 10,516 - - 3,648 4,963 12,044 15,479 3,435 22.2% (5)General Counsel 5,424 7,018 84 97 - - 5,508 7,115 1,607 22.6% (6)Finance and Administration 19,251 20,804 33 - - - 19,284 20,804 1,520 7.3% (7)Communications 4,481 5,670 - - 27 24 4,508 5,694 1,186 20.8% (8)Executive Office 3,757 4,319 - - - - 3,757 4,319 562 13.0% (9)Board Office 370 400 - - - - 370 400 30 7.5% (10)FasTracks Service Increase (8,060) (8,060) 8,060 8,060 - - - - - 0.0%Depreciation and Other Non-Departmental 49,405 39,779 102,972 84,870 1,548 24,860 153,925 149,509 (4,416) -3.0%
Total Operating Expenses 233,043 239,944 113,415 94,682 30,159 65,244 376,617 399,870 23,253 5.8%OPERATING INCOME/(LOSS) (214,371) (214,211) (113,415) (94,682) (21,844) (53,698) (349,630) (362,591) 12,961 3.6%
NONOPERATING REVENUE (EXPENSES)Sales & Use Tax 168,782 153,312 101,175 57,879 11,346 44,329 281,303 255,520 25,783 10.1%Operating Grants 62,682 36,908 2,247 377 7,193 - 72,122 37,285 34,837 93.4% (11)Investment Income 211 - 7,346 - - - 7,557 - 7,557 0.0%Other Income 1,456 1,317 3,461 3,466 - 43 4,917 4,826 91 1.9%Gain/(Loss) Capital Assets 218 - (385) - - - (167) - (167) 0.0%Interest Expense (5,775) (6,100) (64,017) (67,369) - - (69,792) (73,469) 3,677 5.0%
Net Nonoperating Revenue (Expense) 227,574 185,437 49,827 (5,647) 18,539 44,372 295,940 224,162 71,778 32.0%INCOME BEFORE CAPITAL GRANTS 13,203 (28,774) (63,588) (100,329) (3,305) (9,326) (53,690) (138,429) 84,739 -61.2%Capital Grants and Local Contributions 11,781 6,681 353 14,981 - - 12,134 21,662 (9,528) -44.0%INCREASE/(DECREASE) IN NET POSITION 24,984$ (22,093)$ (63,235)$ (85,348)$ (3,305)$ (9,326)$ (41,556)$ (116,767)$ 75,211$ -64.4%
(1) Variance is due to call back of laid-off frontline employees in January(2) Variance is due to lower labor, repair parts and purchased transportation(3) Variance is due to projects budgeted evenly across year but not yet started(4) Variance is due to timing of project expenses not yet incurred, many of which are grant-funded(5) Variance is due to lower outside security services costs(6) Variance is due primarily to timing of outside counsel costs related to litigation as well as lower insurance claims costs(7) Variance is due to timing of outstide IT services costs for projects.(8) Variance is due to timing of outside printing costs for schedules, other outside services and special events.(9) Variance due to coding of certain budgeted compensation done at the Executive level for confidentiality purposes regarding January layoffs(10) Variance due to timing of Accountability Committee invoices(11) Variance due to drawing CRRSAA grant funds that weren't known for the 2021 Adopted Budget when appropriated by the RTD Board
STATEMENT OF REVENUE, EXPENSES AND CHANGE IN NET POSITION - COMBINED
(UNAUDITED)(In Thousands)
MAY 31, 2021
6

January February March April May June July August September October November December Total Year2021 2021 2021 2021 2021 2021 2021 2021 2021 2021 2021 2021 To Date
Actual 50,966$ 48,590$ 60,070$ 60,174$ 61,503$ -$ -$ -$ -$ -$ -$ -$ 281,303$ Budget 47,994 47,207 53,678 52,755 53,886 57,238 56,572 57,026 56,192 55,510 53,521 63,464 655,042
Favorable/(Unfavorable) 2,972$ 1,383$ 6,391$ 7,419$ 7,618$
% Favorable/(Unfavorable) - Month 6.2% 2.9% 11.9% 14.1% 14.1%% Favorable/(Unfavorable) - YTD 6.2% 4.6% 7.2% 9.0% 10.1%
Net Sales & Use Tax Received January February March April May June July August September October November December Total 2021 50,966$ 48,590$ 60,070$ 60,174$ 61,503$ -$ -$ -$ -$ -$ -$ -$ 281,303$ 2020 49,293 48,223 43,604 46,315 49,235 56,393 55,044 55,653 57,796 56,151 52,740 62,218 632,665
Change from to 2020 1,673$ 367$ 16,466$ 13,859$ 12,269$ % Increase/(Decrease) by Month vs. 2020 3.4% 0.8% 37.8% 29.9% 24.9%% Increase YTD vs. 2020 3.4% 2.1% 13.1% 17.3% 18.9%
REGIONAL TRANSPORTATION DISTRICT1% SALES AND USE TAX REVENUE - SYSTEM WIDE
(In Thousands)
2021 ACTUAL VS. BUDGET
2021 VS. 2020 ACTUALS
MAY 31, 2021
7

REGIONAL TRANSPORTATION DISTRICTRIDERSHIP(UNAUDITED)
Jan Feb Mar Apr May June July Aug Sep Oct Nov Dec YTD 2021 YTD 2020 Change % ChangeFixed Route 1,881 1,740 2,056 2,079 2,127 - - - - - - - 9,883 16,911 (7,029) -41.6%Flatiron Flyer 41 40 48 53 55 - - - - - - - 236 803 (567) -70.6%FlexRide & Special Services 13 14 15 15 15 - - - - - - - 72 137 (65) -47.6%
Total Bus Service 1,935 1,793 2,120 2,147 2,196 - - - - - - - 10,191 17,852 (7,661) -42.9%C Line 29 - - - - - - - - - - - 29 743 (714) -96.1%D Line 77 95 120 123 132 - - - - - - - 547 727 (179) -24.7%E Line 153 142 176 189 207 - - - - - - - 867 1,119 (251) -22.5%F Line - - - - - - - - - - - - - 645 (645) -100.0%H Line 90 83 100 105 116 - - - - - - - 493 1,146 (653) -57.0%L Line 25 22 27 26 26 - - - - - - - 127 179 (52) -29.3%R Line 57 53 65 69 75 - - - - - - - 320 567 (248) -43.6%W Line 123 111 128 144 161 - - - - - - - 666 1,113 (448) -40.2%
Total Light Rail 555 506 616 656 717 - - - - - - - 3,049 6,240 (3,191) -51.1%A Line 268 256 327 343 393 - - - - - - - 1,586 1,796 (210) -11.7%B Line 7 6 6 8 9 - - - - - - - 36 98 (63) -63.9%G Line 46 40 47 55 60 - - - - - - - 248 490 (242) -49.4%N Line 44 38 46 51 52 - - - - - - - 230 - 230 0.0%
Total Commuter Rail 366 339 426 456 514 - - - - - - - 2,100 2,385 (285) -11.9%Access-a-Ride 24 25 30 33 35 - - - - - - - 146 176 (30) -17.0%Access-a-Cab 7 7 7 8 7 - - - - - - - 35 34 2 5.0%Vanpool 6 6 6 6 5 - - - - - - - 30 67 (37) -55.5%
Total Revenue Service 2,893 2,674 3,204 3,305 3,474 - - - - - - - 15,551 26,753 (11,202) -41.9%Mall Shuttle 184 171 226 241 268 - - - - - - - 1,090 2,161 (1,071) -49.6%MetroRide - - - - - - - - - - - - - 139 (139) -100.0%
Total Non-Revenue Services 184 171 226 241 268 - - - - - - - 1,090 2,299 (1,209) -52.6%
Total System 3,077 2,845 3,431 3,546 3,742 - - - - - - - 16,641 29,053 (12,411) -42.7%
2021 RIDERSHIP (in Thousands)
8

2021 ADOPTED BUDGET
Risk Level 2013-2018 2019 2020 2021 2013-2021
Estimated in MTFP 2022
Estimated in MTFP Cash Flow 2023-
2026
Estimated in LRP 2027-
2030
Estimated in LRP 2031-
2040 Total------------- ----------------- ----------------- ----------------- ----------------- ----------------- ----------------- ----------------- ----------------- ----------------- -------------
IDENTIFIED SOURCES:
Limit Fastracks funding increases for bus and paratransit expansion to CPI Medium 36,107$ 13,377$ 15,441$ 17,658$ 82,583$ 20,034$ 85,883$ 94,956$ 273,651$ 557,107$ Reduce FasTracks Minimum Unrestricted Fund Balance from $150 million Medium - - - - - - - - - - Reduce FasTracks Operating and Maintenance Fund Balance from 3 to 2 mont Medium - - - - - - - - - - Defer the Union Pacific Railroad (UPRR) relocation for the SW Corridor Extensi Low 9,000 - - - 9,000 - - - - 9,000 Achieve project underruns on FasTracks projects currently under contract 1 Low 40,804 - 15,500 - 56,304 - - - - 56,304 Sales and lease opportunities for all RTD properties 2 Low 14,078 - 601 - 14,679 - - - - 14,679 Request local financial participation in projects above the current 2.5% Low 22,179 - - - 22,179 - - - - 22,179 Restore FISA drawdowns for operations between 2031-2040 3 Low - - - - - - - 16,601 - 16,601 FasTracks sales and use tax collections above adopted budget 4 Low 3,207 - - - 3,207 - - - - 3,207 Sales tax audit/parity Low - - - - - - - - - -
Total Sources 125,375 13,377 31,542 17,658 187,952 20,034 85,883 111,557 273,651 679,077
IDENTIFIED USES:US36 Project draws 1 (2,113) (36) (103) (3,877) (6,129) - - (33,304) - (39,433) North Metro Project draws (22,338) - - - (22,338) - - - - (22,338) Southeast Rail Extension (SERE) Project draws (22,179) - - - (22,179) - - - - (22,179) Debt service and operations funding 1,3 (2) - - - (2) - (44,144) (16,601) - (60,747) Return to 3 months O&M Fund Balance 1 - - - - - - - - - -
Total Uses (46,632) (36) (103) (3,877) (50,648) - (44,144) (49,905) - (144,697)
Net Sources and Uses 78,743$ 13,341$ 31,439$ 13,781$ 137,304$ 20,034$ 41,739$ 61,652$ 273,651$ 534,380$
FasTracks Internal Savings Account Balance 78,743$ 92,084$ 123,523$ 137,304$ 137,304$ 157,338$ 199,077$ 260,729$ 534,380$ 534,380$
1 Includes approved changes from 2020-2025 Midterm Financial Plan adopted in October 2019 and Long Range Plan adopted in October 2018, plus changes proposed in 2020 Amended Budget.2 Sale of Civic Center air rights for $8,063 less $2,500 cost of NAMS study - these are Base System funds; plus Fort Lupton property sale of $4,096; plus Alameda property sale of $5,140, plus Montbello propoerty sale of $6013 The Long Range Financial Plan adopted in 2018 restores funds drawn from the FISA for operations and debt service to the FISA to the extent of available funding in FasTracks.4 The transfer of FasTracks sales and use tax revenues in excess of the annual adopted budget to the FISA was approved by the Board in October 2016.
REGIONAL TRANSPORTATION DISTRICTFASTRACKS INTERNAL SAVINGS ACCOUNT (FISA)
(In Thousands)
Actual Estimated
9

Regional Transportation District 1660 Blake Street, Denver CO 80202 rtd-denver.com
Status of Federal COVID-19 Grant Relief Funding July 2021
RTD received three federal grant apportionments as replacement funding due to significant revenue losses resulting from the COVID-19 Pandemic. The intent of each apportionment is to maintain public transit services which are considered an essential service. Each of the apportionments may be drawn through the Federal Transit Administration (FTA) on a reimbursement basis for eligible expenditures. Those grants are summarized below including the status regarding RTD’s progress to date in drawing those funds.
• Coronavirus Aid, Relief and Economic Security (CARES) Act: Awarded in May 2020 and fully drawn in 2020.
• Coronavirus Response and Relief Supplemental Appropriations Act (CRRSAA): Awarded in January 2021 with grant execution in May 2021. Approximately 90% is designated for transit service deployment over six runboards beginning June 2021. The remaining 10% is designated for elimination of certain 2021 cost-reduction actions and other initiatives.
• American Rescue Plan Act (ARPA): Awarded in March 2021 and grant is not yet executed. RTD has now received direction from the FTA regarding allowable expenditures and expects to submit the grant application.
CARES CRRSAA ARPA Total
% of Total Drawn
RTD Apportionment 232,253,946$ 203,367,528$ 338,468,333$ 774,089,807$
Grant DrawsEmployee Wages and Benefits (146,908,920) (48,837,977) - (195,746,897) 64.8%Contracted Transportation - Bus (36,380,870) (7,211,749) - (43,592,619) 14.4%Contracted Transportation - Rail (48,964,156) (13,672,597) - (62,636,753) 20.7%
Total Drawn (232,253,946) (69,722,323) - (301,976,269)
Remaining to be Drawn -$ 133,645,205$ 338,468,333$ 472,113,538$

_____________________________________________________________________________________________________ 2020 Performance Measures 1 July 1, 2021
2021 PERFORMANCE REPORT-FIRST QUARTER
Objectives: ♦ Reduce vehicle accident ratio ♦ Increase preventive maintenance ♦ Reduce passenger accident ratio ♦ Improve light rail safety ♦ Improve employee safety
Performance Measures:
1.1 Reduce the number of safety incidents. (Department: Bus Operations)
2019 Actual
2020 Actual
2021 Goal
YTD 1st Quarter
Vehicle Accident Involvements per 100,000 miles – Preventable1 1.3 1.0 ≤2.0 1.2 RTD 1.5 1.5 ≤2.0 1.9 First Transit - Commerce City 1.2 0.9 ≤2.0 0.8 Transdev (fka Veolia) 0.8 0.8 ≤2.0 0.7 First Transit – Denver 2.0 1.1 ≤2.0 1.4 First Transit – Longmont 0.8 0.7 ≤2.0 1.3
Passenger Accident Ratio per 100,000 miles – System-wide 0.10 0.16 ≤0.18 0.08 RTD 0.10 0.23 ≤0.18 0.31 First Transit - Commerce City 0.08 0.27 ≤0.18 0.00 Transdev (fka Veolia) 0.15 0.20 ≤0.18 0.12 First Transit – Denver 0.08 0.11 ≤0.18 0.00 First Transit – Longmont 0.07 0.00 ≤0.18 0.00
Operator-Passenger Assault Ratio per 100,000 boardings1 0.02 0.02 ≤0.06 0.29 1 An accident is considered preventable any time the operator was not driving in full compliance with all applicable laws and regulations and in such a manner as to avoid involvement despite adverse conditions of road, weather or traffic or the errors of pedestrians or other drivers.
1.2 Percentage of Preventive Maintenance inspections
incurred as scheduled every 6,000 miles.1 (Department: Bus Operations)
2019 Actual
2020 Actual
2021 Goal
YTD 1st Quarter
Percentage of Preventive Maintenance inspections incurred as scheduled every 6,000 miles – system wide 99.0% 99.8% 98% 100%
RTD 96.3% 99.0% 98% 100% First Transit - Commerce City 99.6% 100% 98% 100% Transdev (fka Veolia) 99.9% 100% 98% 100% First Transit – Denver 100% 100% 98% 100% First Transit – Longmont 99.3% 100% 98% 100%
1 Inspections are scheduled 600 miles prior to 6,000 miles or 600 miles after 6,000 miles.

_____________________________________________________________________________________________________ 2020 Performance Measures 2 July 1, 2021
Performance Measures (continued):
1.3 Improve response time to emergency dispatch calls. (Department: Bus Operations)
2019 Actual
2020 Actual
2021 Goal
YTD 1st Quarter
Average Response Time 18 sec N/A2 ≤20 sec. N/A2 2 Potential data integrity issues were recently discovered. Reporting of this measure is pending further investigation by IT.
1.4 Reduce the number of light rail accidents. (Department: Rail Operations)
2019 Actual
2020 Actual
2021 Goal
YTD 1st Quarter
Reportable Light Rail Accidents per 100,000 train miles – Preventable3 0 0 ≤3.0 0 3 An accident is considered preventable any time the operator was not driving in full compliance with all applicable laws and regulations and in such a manner as to avoid involvement despite adverse conditions of road, weather or traffic or the errors of pedestrians or other drivers. Please note: there was a single preventable accident in January 2019. Due to criteria listed it was not reportable.
1.5 Reduce the number of commuter rail accidents. (Department: Rail Operations)
2019 Actual
2020 Actual
2021 Goal
YTD 1st Quarter
Reportable Commuter Rail Accidents per 100,000 train miles – Preventable4 0 N/A ≤3.0 N/A 4 An accident is considered preventable any time the operator was not driving in full compliance with all applicable laws and regulations and in such a manner as to avoid involvement despite adverse conditions of road, weather or traffic or the errors of pedestrians or other drivers.
Objectives: ♦ Prompt graffiti removal ♦ Prompt bus interior and exterior cleaning ♦ Prompt shelter cleaning
Performance Measures:
2.1 Prompt response to facility complaints. (Department: Capital Programs)
2019 Actual
2020 Actual
2021 Goal
YTD 1st Quarter
Average Response Time Public Complaints <4 hours <4 hours ≤4 hours <4 hours Average Graffiti Complaints per Month 1.0 0.3 ≤3.0 0.7 Average Facilities Maintenance Complaints per Month1 17.1 8.6 ≤20.0 15.3
Elevator 6.0 1.7 3.3 Snow/ice 15.03 1.7 6.0 Shelter 4.7 5.0 2.7 Other2 6.0 3.6 3.3
1Our vulnerability to graffiti has increased due to 1) total increase in linear feet from new corridors and 2) the nature of the areas through which the new corridors travel. 2The majority of Other is lighting and paving issues. 3 Most of these complaints were regarding our snow removal contractors.

_____________________________________________________________________________________________________ 2020 Performance Measures 3 July 1, 2021
Performance Measures (continued):
2.2 Prompt response to vehicle complaints. (Department: Bus Operations)
2019 Actual
2020 Actual
2021 Goal
YTD 1st Quarter
Average Overdue Bus Interior Cleaning per Month 0.1 0.1 0.2 N/A 4 RTD 0.1 0.1 0.2 N/A 4 First Transit - Commerce City 0.0 0.0 0.0 0.0 Transdev (fka Veolia) 0.0 0.0 0.0 0.0 First Transit – Denver 0.0 0.0 0.0 0.0 First Transit – Longmont 0.0 0.0 0.0 0.0
4Some RTD resources were diverted from standard interior cleanings per month to meet the rigorous disinfecting standards recommended by the CDC due to the COVID-19 pandemic. As disinfecting requirements change standard interior cleanings will resume.
Objectives:
♦ Improve on-time performance ♦ Improve miles between lost service road calls ♦ Decrease number of missed trips
Performance Measures:
3.1 Maintain system-wide on time performance. (Departments: Bus Operations, Rail Operations)
2019 Actual
2020 Actual
2021 Goal
YTD 1st Quarter
Local On-Time Service – System-wide1 86.3% 87.0% 86.0% 87.4% RTD Local 86.3% 85.3% 86.0% 85.2% First Transit - Commerce City 83.0% 87.2% 86.0% 89.6% Transdev (fka Veolia) 87.5% 85.4% 86.0% 88.9%
First Transit – Denver 86.4% 87.8% 86.0% 89.2% First Transit – Longmont 88.7% 89.3% 86.0% 93.5% Regional On-Time Service1 87.9% 86.6%3 88.0% 90.4% Light Rail On-Time Service1 86.4% 94.3% 90.0% 95.1% Commuter Rail On-Time Service2 – A, B & G Lines 93.1% 93.3% 90.0% 95.6% Commuter Rail On-Time Service2 – N Line N/A N/A 90.0% 89.3%
1 Bus and Light Rail are considered on-time if a departure from a location is no more than 1 minute early or 5 minutes after the scheduled departure time. 2 Commuter Rail is considered on-time if a departure from a location is no more than 0 minutes early or 5 minutes after the scheduled departure time.
2 Regional On-Time performance has been impacted by the adoption of the Pandemic service plan. There were significant changes to routes in September 2020 that should improve on-time performance. Further schedule adjustments planned for January 2021 should also improve on-time performance.

_____________________________________________________________________________________________________ 2020 Performance Measures 4 July 1, 2021
Performance Measures (continued):
3.2 Maintain system-wide service availability. (Department: Bus Operations, Rail Operations)
2019 Actual
2020 Actual
2021 Goal
YTD 1st Quarter
Light Rail – Service Available4 95.8%6 99.9% 99.0% 99.3% Bus – Service Available5 99.5% 99.7% 97.0% 99.7% Commuter Rail – Service Available – A, B & G Lines 98.4% 95.3% 97.0% 97.1% Commuter Rail – Service Available – N Line N/A N/A 97.0% 93.6%
4 Calculated as total operating hours minus service delay hours, divided by total scheduled hours. 5 Calculated as actual car miles operated divided by total scheduled car miles. 6 Related to train operator shortage.
3.3 Adherence to scheduled Revenue Service trip start time. (Department: Bus Operations)
2019 Actual
2020 Actual
2021 Goal
YTD 1st Quarter
Adherence to scheduled Revenue Service trip start time – system wide 99.6% 99.4% 99.0% 99.3% RTD 99.6% 99.4% 99.0% 99.3% First Transit - Commerce City N/A N/A 99.0% N/A Transdev (fka Veolia) N/A N/A 99.0% N/A
First Transit – Denver N/A N/A 99.0% N/A First Transit – Longmont N/A N/A 99.0% N/A
3.4 Improve miles between road calls. (Departments: Bus Operations)
2019 Actual
2020 Actual
2021 Goal
YTD 1st Quarter
Mileage Between Lost Service Maintenance Road Calls (District)1, 4 34,220 34,788 30,000 52,731
RTD 31,072 33,341 30,000 47,061 Transit Bus 32,739 35,570 52,705 Articulated Bus 19,884 25,307 28,068 Intercity Bus 35,761 33,476 56,096
First Transit - Commerce City 37,754 37,068 30,000 34,170 Transit Bus 37,754 37,068 34,170 Cutaway Bus N/A N/A N/A
Transdev (fka Veolia) 39,452 45,112 30,000 140,377 Transit Bus 45,840 45,540 156,776 Medium Bus 21,929 45,044 58,381
First Transit – Denver 37,300 38,298 30,000 99,261 Transit Bus 37,496 43,905 99,261 Medium Bus 33,313 37,820 N/A
First Transit – Longmont 25,522 26,037 30,000 53,695 Transit Bus 31,413 14,456 156,776 Medium Bus 14,378 30,326 58,381 Cutaway Bus N/A N/A N/A
Hours Between Lost Service Maintenance Road Calls (Mall)2 N/A3 N/A3 ≥600 N/A3 1 District-wide mileage between lost service maintenance road calls excludes the Mall Shuttles. 2 Maintenance effectiveness for the Sixteenth Street Mall Shuttle is measured in terms of service hours. 3 Data collection errors arose when calculating road calls with Mall service - 2020 Q1. 4Average age of the fleet follows:

_____________________________________________________________________________________________________ 2020 Performance Measures 5 July 1, 2021
2020 Quantity (Q2)
2020 Average Age (Q2)
2021 Quantity 2021 Average Age
Fleet Average Number of Buses and Average Age5 1,030 7.47 RTD - Boulder 125 5.04 RTD – Platte (including Mall Shuttle) 277 4.72 RTD – East Metro 205 5.83 First Transit - Commerce City 116 8.72 First Transit - Denver 123 11.32 First Transit – Longmont 74 14.03 Transdev (fka Veolia) 110 9.28 Mall Shuttles 36 4
5 The Board of Directors does not adopt goals for these; informational only. Objectives: ♦ Reduce customer response time ♦ Limit customer complaints ♦ Decrease average wait time for telephone information ♦ Complete installation of shelter boards by date of service change
Performance Measures:
4.1 Reduce average customer response time. (Department: Communications)
2019 Actual
2020 Actual
2021 Goal
YTD 1st Quarter
Average TIC Speed of Answer (in seconds) 27 10 ≤65 17

_____________________________________________________________________________________________________ 2020 Performance Measures 6 July 1, 2021
Performance Measures (continued):
4.2 Reduce level of customer complaints. (Departments: Bus Operations, Communications)
2019 Actual
2020 Actual
2021 Goal
YTD 1st Quarter
Avg. Response Time to Customer Complaints Average Cycle Time 11.13 days 7.59 ≤ 10 days N/A1
RTD Transportation (Bus and Rail) 9.87 6.53 RTD All Other Departments 17.80 12.21 First Transit – Commerce City 5.41 3.92 First Transit - Denver 7.10 4.38 First Transit - Longmont 6.89 6.39 Transdev (fka Veolia) 5.11 4.05
Complaints per Boardings (District)2 N/A N/A .0004 N/A1 RTD .0004
Local Regional
First Transit - Commerce City .0004 Local Regional
Transdev (fka Veolia) .0004 Local Regional
First Transit – Denver .0004 Local Regional
First Transit – Longmont .0004 Local
1 Q1 results are unavailable at this time due to a custom report problem with Salesforce, our new complaint tracking system effective December, 2020. Problem should be resolved by Q2 report. 2 Q1 results are unavailable at this time because ridership is being reported in total and there is no breakdown between local and regional. Complaints are being reported by carrier but only on local service. We are working on obtaining this data in a manner that meets the reporting requirement.

_____________________________________________________________________________________________________ 2020 Performance Measures 7 July 1, 2021
4.3 Complete installation of shelterboards by date of service change. (Department: Communications) Implementation scheduled for January 2021, May 2021, and August 2021 dates.
Objectives: ♦ Improve on-time performance standards ♦ Improve ADA trip availability ♦ Improve ADA courtesy
Performance Measures:
5.1 Improve ADA on-time performance. (Department: Bus Operations)
2019 Actual
2020 Actual
2021 Goal
YTD 1st Quarter
Access-a-Ride Passenger On-time Service 84.0%1 90.0% 86.0% 94.0% 1Affected by lack of adequate staffing levels to cover runs, high rate of operators on FMLA, and the increasing number of trips requested during peak travel hours along with the limitations of our current software to smooth that demand.
5.2 Improve ADA trip availability. (Department: Bus Operations)
2019 Actual
2020 Actual
2021 Goal
YTD 1st Quarter
Adherence to ADA mandate to have zero denials to service request 100% 100% 100% 100%
5.3 Improve ADA courtesy. (Department: Bus Operations)
2019 Actual
2020 Actual
2021 Goal
YTD 1st Quarter
Average ADA complaints per boarding 0.0022 0.001 0.001 0.001 2 Staffing challenges led to a higher number of complaints.
Objectives: ♦ Maintain cost recovery ratios ♦ Increase ridership ♦ Increase farebox and EcoPass revenue ♦ Improve route efficiency ♦ Monitor selected internal functions for efficiency ♦ Maintain cost effective and efficient transportation services ♦ Hire and train competent personnel

_____________________________________________________________________________________________________ 2020 Performance Measures 8 July 1, 2021
Performance Measures:
6.1 Maintain all required recovery ratios.1
(Department: Finance) 2019
Actual 2020 Actual
2021 Goal
YTD 1st Quarter
Operating Cost Recovery Ratio 22.8% 13.1% 20% 13.1% SB154 Cost Recovery Ratio Yes Yes N/A N/A
1 Operating cost recovery ratio is defined as farebox revenues (excluding ADA), advertising revenues, and other operating revenues divided by operating and administrative costs, depreciation on bus operations assets, excluding ADA costs, rapid transit planning costs, and interest payments on rapid transit assets. As of 2021 RTD is no longer required to calculate the SB154 Cost Recovery Ratio.
6.2 Increase in ridership. (Department: Finance)
2019 Actual
2020 Actual
2021 Goal
YTD 1st Quarter
Overall Ridership Increase 0.4% -50.3% 2.1% -59.4%
6.3 Increase in fare revenue and total operating revenue. (Departments: Finance)
2019 Actual
2020 Actual
2021 Goal
YTD 1st Quarter
Fare Revenue 7.8% -50.4% 2.6% -60.7% Total Operating Revenue 6.7% -48.6% 2.4% -59.5%
6.4 Monitor selected internal functions for efficiency. (Department: Administration)
2019 Actual
2020 Actual
2021 Goal
YTD 1st Quarter
Audits 80%2 75% 100% 0%3 2 Staffing Challenges and the State Audit consumed audit time. 3 Audit is in the process of responding to and acting on the State Audit recommendations and the APTA Peer Review recommendations. Once a Strategic Plan is in place and a Risk Assessment is completed an Audit Plan will be developed for 2021/2022.
6.5 Maintain bus/light rail operator headcount and bus mechanic headcount within authorization.1 (Department: Bus Operations and Rail Operations)
2019 Actual
2020 Actual
2021 Goal
YTD 1st Quarter
Bus Operator – Vacancies2 8.7% 19.38%3 ≤5.0% 4.4% Bus Operator – Over Headcount 0.0% 0.0% ≤4.0% 0.0% Bus Mechanic – Vacancies 17.9% 16.59%3 ≤7.5% 7.9% Bus Mechanic – Over Headcount 0.0% 0.0% ≤0.0% 0.0% Light Rail Operator – Vacancies2 31.5% 0.0% ≤5.0% 3% Light Rail Operator – Over Headcount 0.0% 0.0% ≤4.0% 0%
1 Authorized headcount represents the level of personnel required to meet service demands in the current runboard. 2 Human Resources has been authorized to exceed authorized headcount to compensate for operator attrition. 3This measurement is comparing the current headcount to what is authorized. The authorized headcount is higher than the headcount that is needed to deliver the current level of service. Once this measurement uses headcount authorized for 2021 we should be within goal.

_____________________________________________________________________________________________________ 2020 Performance Measures 9 July 1, 2021
Performance Measures (continued):
6.6 Maintain stock-out level. (Department: Administration)
2019 Actual
2020 Actual
2021 Goal
YTD 1st Quarter
Stock-Out Level4 1.1% 1.2% 1.5% 1.1% 4 Calculated as number of stock-out occurrences divided by number of requests.
Performance Measures:
7.1 Deliver civic and neighborhood presentations to communicate with the public regarding service issues. (Departments: Communications, Executive Office, Bus Operations, Planning)
2019 Actual
2020 Actual
2021 Goal
YTD 1st Quarter
Communications 176 50 § 18 General Manager 287 95 § 71 Service Change 26 28 § 3 Route and Service Planning 97 60 § 96 Local Government Planning Workshops* 4 3 3 0 Community Advisory Committee Meetings 11 9 4 3 Info Rides 26 01 § 01
§ The Board of Directors does not adopt goals for these performance measures; for reporting purposes only. 1 Due to COVID-19 restrictions
7.2 Accurate Financial Analysis (Department: Finance)
2021 Goal YTD 1st Quarter
Distinguished Budget Presentation Award
Receive Distinguished Budget Presentation Award from the Government Finance Officers
Association by year end.
N/A
Certificate of Achievement for Excellence in Financial Reporting
Receive Certificate of Achievement for Excellence In Financial Reporting from the Government Finance Officers
Association by year end.
N/A

Regional Transportation District 1660 Blake Street, Denver CO 80202 rtd-denver.com
Rail Operations May 2021
On-Time Performance Month Service Availability On Time
Performance YTD
On-Time Performance
Light Rail Operations May 99.84% 94.41% 94.68%
A, B, G Line – Commuter Rail May 95.48% 94.7% 95.7%
N Line – Commuter Rail May 94.11% 85.6% 89.4%
Mean Distance Between Failures Month Actual Goal
Light Rail Vehicles May 33,649 miles > 25,000 miles
Maintenance of Way May 3,704.58 hours > 2,500 hours
Preventable Accidents May Year to Date
Light Rail Operations 0 0
May 2021 Light Rail Operator Losses
Reason # of Operators
Transfer 1
Terminated 1
Retired 1
Resigned 2
Resigned 1
Resigned 2
Resigned 1
Headcount Month Full Time
Light Rail Train Operators May 173

Regional Transportation District 1660 Blake Street, Denver CO 80202 rtd-denver.com
Connecting With Customers
This is a summary of some recent communications activities that are enhancing engagement and connection with customers. FlexRide in Trip Planner FlexRide service is now embedded in RTD’s Open Trip Planner (OTP). On July 8 the first phase launched, making the service available to internal Customer Care agents assisting customers with trip planning. Later this year, FlexRide will integrate with the customer-facing version of the trip planner on the RTD website. With the introduction of FlexRide data into the trip planner, there are now several benefits for both RTD and customers. The first benefit will provide transit data for RTD’s entire coverage area, breaking down boxy geographic lines where “some type” of service was referenced. Users will now see what that transit looks like with all trip possibilities. Also, FlexRide data will be included in public transit data feeds, allowing third-party app developers such as Google and Transit to show more of what RTD’s services include. It is worthwhile to note that there is no guarantee regarding and how third-party apps choose to display FlexRide. Internally, Customer Care agents will no longer have to check a separate app to see if a destination is in a FlexRide area. This project is one more step toward expanding the awareness and utilization of FlexRide services to enhance the customer experience. Summary of Safety Meetings Recognizing that many people are moving around the region more and considering a return to the RTD system, staff hosted “Welcome Back to RTD: A Conversation About Safety,” two virtual meetings to talk safety. RTD staff shared information about the agency’s approach to safety, such as implementation of the federal mask requirement and cleaning protocols and research showing that riding public transit is not a transmitter of COVID-19. The public asked RTD leaders many questions about safety, service levels and the agency’s co-responder program with the Mental Health Center of Denver. The meetings drew around 60 public attendees and presented an excellent opportunity to instill confidence in customers that RTD is ready when they want to return. Fare Study and Equity Analysis Telephone Town Hall On June 30, RTD hosted a live telephone town hall meeting as part of the first phase of engagement for the Fare Study and Equity Analysis. A total of 5,210 people participated in the meeting for some period of time.
Phone Participants • Average minutes phone participants spent on event: 16 (national average is around 10) • 51 questions were screened • 20 questions were answered live
Online/Streaming
• 315 people pre-registered online • Online streaming participants: 76 • Average minutes online participants spent on event: 20 • 7 questions were submitted • 3 questions were answered

Subject: Connecting with Customers Page
Regional Transportation District 1660 Blake Street, Denver CO 80202 rtd-denver.com
2
Staff responded to the remaining questions that could not be fielded during the meeting. Feedback from this first phase of engagement will help inform the Fare Study process as it proceeds. The annual series of telephone town hall meetings for each director district will occur in September and October.

Regional Transportation District 1660 Blake Street, Denver CO 80202 rtd-denver.com
Contract Awards/Current Solicitations/Solicitations in
Process as of July 9, 2021 Contracts Awarded/Pending Award
Issue Date Solicitation Title Pre
Meetings DBE/ SBE
Due Date
Bidders/ Proposers Status
8/11/20 Request for Proposal (RFP) 120FH012
Account Based Fare Collection System – Validators
N/A DBE 10%
1/5/21 2 p.m.
3 Proposals - Masabi, LLC - Parkeon, Inc.
dba Flowbird - Scheidt and
Bachmann USA, Inc.
Award recommended to Masabi, LLC pending General Manager fully executing Contract. Award was approved by the Board of Directors April 20, 2021
11/10/20 Request for Proposal (RFP) 120DH005
System Advertising Program
N/A N/A 2/18/21 2 p.m.
3 Responsive proposals
- Intersection - Lamar
Advertising - Vector Media 1 Non-
responsive proposal received
- Banner Signs
Award recommended to Lamar Advertising pending General Manager fully executing Contract. Award was approved by the Board of Directors on June 22, 2021
4/14/21 Request for Proposal (RFP) 121DU001
Maintenance Services for Wynkoop Plaza
4/27/21 1 p.m.
N/A 5/20/21 2 p.m.
1 Proposal - Downtown
Denver Business Improvement District
Proposal is being evaluated

Subject: Contract Awards/Current Solicitations/Solicitations in Process Page
Initials JLB Regional Transportation District 1660 Blake Street, Denver CO 80202 rtd-denver.com
2
Contracts Awarded/Pending Award (cont.)
Unsolicited Proposals Pending All Unsolicited Proposals are being reviewed and processed in accordance with RTD procedures.
None
Issue Date Solicitation Title Pre
Meetings DBE/ SBE
Due Date
Bidders/ Proposers Status
4/28/21 Request for Proposal (RFP) 121DX001
State Legislative Advocacy Services
5/17/21 1 p.m.
N/A 6/10/21 2 p.m.
2 Proposals - Brandeberry
McKenna Public Affairs
- Straightforward Communication
Proposals are being evaluated
5/18/21 Request for Proposal (RFP) 121DM003
Diesel Fuel N/A N/A 6/16/21 2 p.m.
4 Proposals - Colonial Oil
Industries, Inc. - Mansfield Oil
Company - Petroleum
Traders Corporation
- TAC Energy
Award recommended to Mansfield Oil Company pending General Manager fully executing Contract
6/11/21 Request for Quotations (RFQ) 121FH019
Homeless Outreach Coordinator
N/A N/A 7/7/21 5 p.m.
2 Quotes - Delle, LLC - Jefferson
Center for Mental Health
Quotes are being reviewed

Subject: Contract Awards/Current Solicitations/Solicitations in Process Page
Initials JLB Regional Transportation District 1660 Blake Street, Denver CO 80202 rtd-denver.com
3
Solicitations Currently Out for Bid/Proposal/Quote Issue Date Solicitation Title Pre-Meetings DBE/ SBE Due Date
5/7/21 Request for Proposal (RFP) 121FK002
Seventeen 40 Foot Battery Electric Transit Buses
N/A N/A 9/1/21 2 p.m.
6/1/21 Request for Proposal (RFP) 121DH015
Large-Format Printing Services
N/A N/A 7/15/21 2 p.m.
7/8/21 Request for Proposal (RFP) 121FH018
Bus Audio/Video Live Connection
7/27/21 1 p.m. Due to COVID-19 Social Distancing requirements, the Pre-Proposal Briefing will be held via conference call
N/A 8/19/21 3 p.m.
Upcoming Solicitations • 1/6/21 – Bike-n-Ride Lockers (Aurora) – estimated advertisement July 2021 – Brenda Leo • 1/20/21 - Public Transportation Services Group 31 Fixed-Route Services – estimated advertisement July
2021 – Linda Wells • 4/7/21 - General Printing Services – estimated advertisement July 2021 – Matt Richey • 6/2/21 – Paratransit Scheduling and Management System Replacement - estimated advertisement July
2021 – Linda Wells • 6/2/21 - Street Improvement Work Order Contract – estimated advertisement July 2021 – Ron Bibeau • 6/9/21 - Snow Removal Services – Light Rail Transit (LRT) Stations – I-225, Southeast and West Lines –
estimated advertisement July 2021 - Ron Bibeau • 6/23/21 – Disc Brake Parts – estimated advertisement July 2021 – Leo Fautsch • 6/23/21 – Snow Removal Services – North Metro Line – estimated advertisement July 2021 – Ron Bibeau

Regional Transportation District 1660 Blake Street, Denver CO 80202 rtd-denver.com
Summary of Monthly Purchasing Activity, New Contracts, Graphs and
Reports for May 2021
This summary is in four parts as listed below:
• Part I is a summary of purchasing activity for the month of May 2021 as compared to May 2020 • Part II is a listing of all new contracts issued during the reporting month in excess of $100,000.00 • Part III is a group of graphs illustrating purchasing activity for the current month compared to the
previous years • Part IV is a computer printout of our Monthly Purchase Order Activity Report

Subject: Board of Directors Briefing Page
Initials JLB Regional Transportation District 1660 Blake Street, Denver CO 80202 rtd-denver.com
2
PART I
PURCHASING ACTIVITY MAY 2021 – MAY 2020

May 2021 May 2020
1. Purchase Order Activity
A. Total Purchase Orders Prepared: 308 484
B. Total Dollars Obligated: 9,194,635.48$ 4,521,747.40$
2. Sale of Surplus Assets:
Mixed Scrap/Scrap Drums Auction 99,259.15$ Purchase of Used Oil -$ -$
TOTAL 99,259.15$ -$
3. Petty Cash Activity:
A. Total Transactions: 0 1
B. Total Dollars Spent: -$ 21,748.00$
4. Purchasing Card Activity:
A. Total Transactions: 1154 1139
B. Total Dollars Spent: 416,388.86$ 473,700.79$
C. Rebate Check -$ -$
SUMMARY OF PURCHASE ORDER, CONTRACTS, PETTY CASH AND PURCHASING CARD ACTIVITY FOR THE MONTH OF
May 2021 COMPARED TO May 2020
Subject: Board of Directors Briefing Page 3
Initials JLB Regional Transportation District 1660 Blake Street, Denver CO 80202 rtd-denver.com
Subject: Board of Directors Briefing Page 4
PART II
LISTING OF NEW PURCHASE ORDERS IN EXCESS OF $100,000

PO/CONTRACT NO. - CONTRACT
PURCHASE ORDER DATE CONTRACT AMOUNT
18DH010/212495 6e Technologies - BI WO Contract - WO 8 5/10/2021 136,000.00$ (6E Technologies LLC)
421DP001/212724 Iliff Garage IGA 5/14/2021 102,289.84$ (City of Aurora)
212696 Boundary Mapping and Redistricting Services
5/12/2021 162,345.00$ (Farnsworth Group, Inc.)
121DM002/212483 Full Service Maintenance Agreement 5/10/2021 208,250.00$ (Johnson Controls, Inc.)
120JD001/212506 Konica Minolta Copier Lease 5/11/2021 636,450.00$ (Konica Minota Business Solutions)
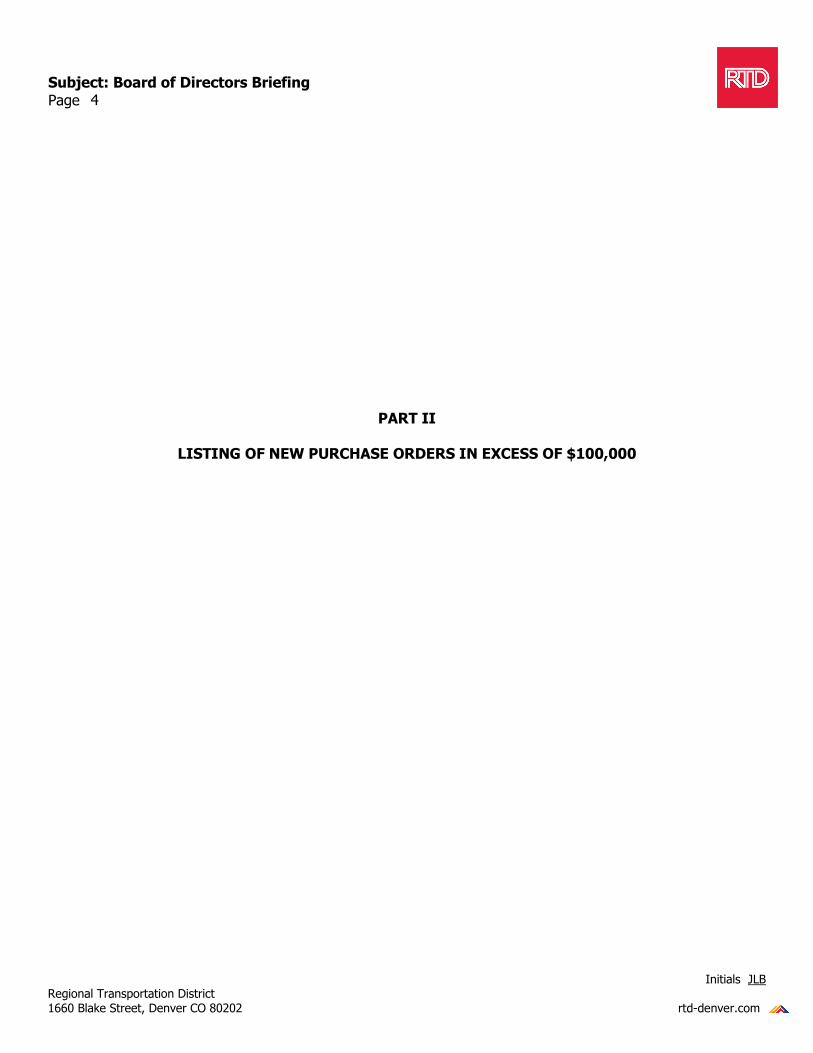
121DH001/212770 ADA Mobility Assessment and Travel Training Start-up 6/1/2021-8/31/2021 Full delivery of service begins 9/1/2021-8/31/2026 5/20/2021 4,735,768.89$ (Medical Transportation Management Inc)
212504 Oracle Support & Cloud Service Renewal/HW EOL Refresh (replaces PO #210597) 5/11/2021 332,716.07$ (Mythics Inc)
17DH022/212486 Oracle/Aconex SaaS - Option Year #2 5/10/2021 167,000.00$ (Oracle America Inc)
This part lists all new Contracts in numeric sequence showing the Contractor, ServicesContracted for, Performance Period and Total Contract Amount.
NEW CONTRACTS ISSUED DURINGMay 2021
IN EXCESS OF $100,000
Subject: Board of Directors Briefing Page 5

PO/CONTRACT NO. - CONTRACT
PURCHASE ORDER DATE CONTRACT AMOUNT
15DH009/212739 Amendment 17 Software Maintenance 6/4/21-6/3/22 5/18/2021 159,474.29$ (RouteMatch Software Inc)
421DB002/212707 2021 HOP Vechicle Replacement 5/13/2021 350,000.00$ (Via Mobility Services)
121DO001/212492 O&M of RTD Groundwater Treatment Facility - Tunnel 16 5/10/2021 956,212.62$ (WSP USA Inc)
Subject: Board of Directors Briefing Page 6

Initials JLB Regional Transportation District 1660 Blake Street, Denver CO 80202 rtd-denver.com
Subject: Board of Directors Briefing Page 7
PART III
GRAPHS OF PURCHASING ACTIVITY MAY 2021

0
100
200
300
400
500
600
Total Purchase Orders Prepared ‐May 2021
$‐
$20,000,000.00
$40,000,000.00
$60,000,000.00
$80,000,000.00
$100,000,000.00
Total Purchase Order Dollars ‐May 2021
$‐
$20,000.00
$40,000.00
$60,000.00
$80,000.00
$100,000.00
$120,000.00
Sales ‐May 2021
Subject: Board of Directors Briefing Page 8

0
1
2
3
Total Petty Cash Transactions ‐May 2021
$‐
$5,000.00
$10,000.00
$15,000.00
$20,000.00
$25,000.00
Total Petty Cash Dollars ‐May 2021
Subject: Board of Directors Briefing Page 9

0
200
400
600
800
1000
1200
1400
Total Purchasing Card Transactions ‐May 2021
$‐
$50,000.00
$100,000.00
$150,000.00
$200,000.00
$250,000.00
$300,000.00
$350,000.00
$400,000.00
$450,000.00
$500,000.00
Total Purchasing Card Dollars ‐May 2021
Subject: Board of Directors Briefing Page 10

Initials JLB Regional Transportation District 1660 Blake Street, Denver CO 80202 rtd-denver.com
Subject: Board of Directors Briefing Page 11
PART IV
MONTHLY PURCHASE ORDER ACTIVITY REPORT

RTD:PO - Purchase Order Monthly Activity
06/10/2021
PO Creation Date - From Date: 05/01/2021 To Date: 05/31/2021
Run Date: Page 1 of 30
6E Technologies LLC
AIS Industrial & Construction Supply
AMGS Distributing LLC
Ace Equipment & Supply Co.
Airgas Inc
Alcam Metal DistributorsInc
PO Vendor Name
$136,000.00
$8,550.28
$183.00
$439.20
$214.08
$3,649.25
212495
212399212402
212415212748212842
212420
212870
212392
212487
212709
PO Number
05/10/21
05/04/2105/04/21
05/06/2105/18/2105/25/21
05/06/21
05/25/21
05/04/21
05/10/21
05/14/21
PO Date
18DH010 6e Technologies - BI WO Contract - WO 8
PAINT SPRAY YELLOW ACRYLICVEST SAFETY LIME REFLECTIVE SILVER STRIPES W/POCKETGun Blow 140PSILID BUCKET PAIL 3.5 GAL AND 5 GALCHEMICAL BRAKE CLEANER NON-CHLORINATED
GAUGE TIRE AUTOMOTIVE MISC. MODELS
BRUSH PARTS CLEANING
Gloves Welding Extra Large
STOCK ALUMINUM SHEET 5052H32 60 X 144 X .080Stock Steel Flat 1 X 1/8 X 20FT
Description
$136,000.00
$219.84 $225.60
$283.00 $441.84
$7,380.00
$183.00
$439.20
$214.08
$3,449.25
$200.00
PO Amount
Total for Vendor:
Total for Vendor:
Total for Vendor:
Total for Vendor:
Total for Vendor:
Total for Vendor:
6E Technologies LLC
AIS Industrial & Construction Supply
AMGS Distributing LLC
Ace Equipment & Supply Co.
Airgas Inc
Alcam Metal Distributors Inc

RTD:PO - Purchase Order Monthly Activity
06/10/2021
PO Creation Date - From Date: 05/01/2021 To Date: 05/31/2021
Run Date: Page 2 of 30
Allied Electronics, Inc.
Alstom Signaling Operation
Apex Design a Consor Company
ArchiveSocial Inc
Arrow Electronics Inc.
PO Vendor Name
$1,521.07
$1,066.00
$86,850.00
$7,200.00
$7,320.00
212441
212758
212760212902
212908
212530
212880
212505
212749
PO Number
05/07/21
05/19/21
05/19/2105/26/21
05/26/21
05/12/21
05/25/21
05/11/21
05/19/21
PO Date
Relay LRV Den V Control 17-30VDC 3NO/1NC W/VaristorCONNECTOR ELECT MOW LUG LONG BARREL1-HOLE 500 KCMILTool Pin Pusher LRV Amp/TycoBATTERY LITHIUM ATS SIZE C FOR SD160 LRV
MODEM BELL 212 HARMON MOW
17DH010 - Consor Engeineers dba Apex Design ITS WO Contract - WO 3217DH010 Apex Design (Consor) ITS WOContract - WO 33
2021 - Social Media Archive Services
CUTTER MECHANISM PRINTER ULTRA HIGHSPEED
Description
$162.17
$1,061.20
$70.10 $227.60
$1,066.00
$7,267.00
$79,583.00
$7,200.00
$7,320.00
PO Amount
Total for Vendor:
Total for Vendor:
Total for Vendor:
Total for Vendor:
Total for Vendor:
Allied Electronics, Inc.
Alstom Signaling Operation
Apex Design a Consor Company
ArchiveSocial Inc
Arrow Electronics Inc.

RTD:PO - Purchase Order Monthly Activity
06/10/2021
PO Creation Date - From Date: 05/01/2021 To Date: 05/31/2021
Run Date: Page 3 of 30
B.D.R. Pallets, Inc.
BYD Coach & Bus LLC
Balfour Beatty Rail Inc.
Batteries Plus LLC
PO Vendor Name
$2,046.80
$7,161.53
$2,204.25
$54,170.24
212824213088
212429212482212531212746
212871212896
212805
212430212513
212514212515212516212804212839
PO Number
05/24/2105/28/21
05/06/2105/10/2105/12/2105/18/21
05/25/2105/26/21
05/21/21
05/06/2105/11/21
05/11/2105/11/2105/11/2105/21/2105/25/21
PO Date
PALLET 24 X 24Pallet 36 X 36
PLATE 1650 SEALING # 3HATCH 1650 ROOF SAFETY ASSEMBLYACCUMULATOR 1650 A/C REFRIGERANTCOVER 1650 DUST-PROOF STEERING GEAROUPUTBUMPER 1650 FRONT LEFTBUSHING 1650 STABILIZER BAR REAR
Relay Control 750 Vdc 1 Substation MOW LRV
BATTERY MOW BLUE TOP MODEL D34MBATTERY 1650 SAE TOP TERMINAL 12V GROUP 31 1150 CCA8D TOP BATTERIES8D SIDE BATTERIES8D STUD BATTERIESBATTERY MOW BLUE TOP MODEL D34MBATTERY AAA ALKALINE
Description
$704.00 $1,342.80
$449.18 $1,522.08 $360.96 $902.10
$3,424.59 $502.62
$2,204.25
$7,500.00 $6,320.00
$7,920.00 $11,880.00 $11,880.00 $7,500.00 $1,170.24
PO Amount
Total for Vendor:
Total for Vendor:
Total for Vendor:
Total for Vendor:
B.D.R. Pallets, Inc.
BYD Coach & Bus LLC
Balfour Beatty Rail Inc.
Batteries Plus LLC

RTD:PO - Purchase Order Monthly Activity
06/10/2021
PO Creation Date - From Date: 05/01/2021 To Date: 05/31/2021
Run Date: Page 4 of 30
Baultar Concepts, Inc.
Bearings & Industrial Supply Co Inc
Calmo Inc
City of Aurora
PO Vendor Name
$8,846.00
$932.50
$5,129.87
$102,289.84
212467
212838
212477212507
212742212754
212724
PO Number
05/07/21
05/25/21
05/10/2105/11/21
05/18/2105/19/21
05/14/21
PO Date
STEP LRV DEN VIII THRESHOLD TOP LH STEP
Chemical Loctite Sealant Quick Set 404 .33 Oz / 9.3 G
SPRING 1650 CYLINDER ASSY W/C RAMPNONSKID 1650 NON-SLIP TAPE WHEELCHAIR RAMP END YELLOWWASHER 1650 WHEELCHAIR RAMPSCREW 1650 WHEELCHAIR RAMP
421DP001 Iliff Garage IGA
Description
$8,846.00
$932.50
$2,356.76 $369.76
$1,935.05 $468.30
$102,289.84
PO Amount
Total for Vendor:
Total for Vendor:
Total for Vendor:
Total for Vendor:
Baultar Concepts, Inc.
Bearings & Industrial Supply Co Inc
Calmo Inc
City of Aurora

RTD:PO - Purchase Order Monthly Activity
06/10/2021
PO Creation Date - From Date: 05/01/2021 To Date: 05/31/2021
Run Date: Page 5 of 30
Colorado Custom Rock Corp
Colorado Fire Services LLC
Colorado Petroleum
PO Vendor Name
$136,637.00
$2,600.00
$2,475.00
212470
212478
212479
212480
212484
212529
212891
212731
212736
PO Number
05/10/21
05/10/21
05/10/21
05/10/21
05/10/21
05/12/21
05/26/21
05/17/21
05/17/21
PO Date
19DT001 Colorado Custom Rock - 16thSt Mall Granite Paver WO Contract -WO 3519DT001 Colorado Custom Rock 16th St Mall Granite Paver WO Contract -WO 3619DT001 Colorado Custom Rock 16th St Mall Granite Paver WO Contract -WO 3719DT001 Colorado Custom Rock 16th St Mall Granite Paver WO Contract -WO 3819DT001 Colorado Custom Rock 16th St Mall Granite Paver WO Contract -WO 39
MSV 73169 - Recharge Fire Extinguisher CylindersMSV 73168 - recharge fire extinguisher cylinders
FLUID ANTIFREEZE 100 PERCENT CONCENTRATE 55 GALLONFLUID ANTIFREEZE 100 PERCENT CONCENTRATE 55 GALLON
Description
$1,320.00
$43,811.24
$36,024.78
$32,011.98
$23,469.00
$1,750.00
$850.00
$1,650.00
$825.00
PO Amount
Total for Vendor:
Total for Vendor:
Total for Vendor:
Colorado Custom Rock Corp
Colorado Fire Services LLC
Colorado Petroleum

RTD:PO - Purchase Order Monthly Activity
06/10/2021
PO Creation Date - From Date: 05/01/2021 To Date: 05/31/2021
Run Date: Page 6 of 30
Counter Trade Products Inc
Cummins Inc
Dean Technology Inc
Denco Sales Company Inc
E & G Terminal, Inc.
Farnsworth Group, Inc.
Fastenal Company
PO Vendor Name
$10,330.00
$1,085.57
$410.00
$7,439.00
$145.92
$162,345.00
$915.02
212723
212461212860
212921
213087
212765213076
212435
212696
212769212874
PO Number
05/14/21
05/07/2105/25/21
05/27/21
05/28/21
05/20/2105/28/21
05/07/21
05/12/21
05/20/2105/25/21
PO Date
Brocade SANnav software and support1 year
HOUSING 9300 9400 ROCKER LEVERHEAD 1800 5260-65 6000 6300 9300 9400 ISL LUBE OIL FILTERPLUG 6000 OIL PAN M22 X 1.50 X 19 THREADED
VOLTRAP 891 VDC 5 AMP
Roland Printer RepairsVINYL SCOTCHLITE GERBER EDGE BLACK
Lubricant Silicone Spray Lube
Boundary Mapping and Redistricting Services
BURNER BLOW TORCHKNIFE PUTTY STIFF 1-1/2 BLADE
Description
$10,330.00
$615.32 $351.75
$118.50
$410.00
$6,767.00 $672.00
$145.92
$162,345.00
$399.62 $515.40
PO Amount
Total for Vendor:
Total for Vendor:
Total for Vendor:
Total for Vendor:
Total for Vendor:
Total for Vendor:
Total for Vendor:
Counter Trade Products Inc
Cummins Inc
Dean Technology Inc
Denco Sales Company Inc
E & G Terminal, Inc.
Farnsworth Group, Inc.
Fastenal Company

RTD:PO - Purchase Order Monthly Activity
06/10/2021
PO Creation Date - From Date: 05/01/2021 To Date: 05/31/2021
Run Date: Page 7 of 30
Fiero Automation
FinishMaster, Inc.
Fraser Tool and Gauge
Gerflor USA
PO Vendor Name
$239.20
$218.80
$12,321.00
$134.72
212389
212803
212500
213077
212450
PO Number
05/04/21
05/21/21
05/11/21
05/28/21
05/07/21
PO Date
Gauge Pressure 160PSI 1/4NPT
HARDNER LRV PPG DELFLEET QT
ADJUSTER 1500 3600 6000 CALIPER MECH SET ELSA 225BOLT 1800 9300 9400 FRONT AXLE TORXM18 X 1.5 X 60
WELDING TIP 90 DEGREE BODY SHOP FLOORING USE
Description
$239.20
$218.80
$11,046.00
$1,275.00
$134.72
PO Amount
Total for Vendor:
Total for Vendor:
Total for Vendor:
Total for Vendor:
Fiero Automation
FinishMaster, Inc.
Fraser Tool and Gauge
Gerflor USA

RTD:PO - Purchase Order Monthly Activity
06/10/2021
PO Creation Date - From Date: 05/01/2021 To Date: 05/31/2021
Run Date: Page 8 of 30
Gillig LLC
PO Vendor Name
212385212395212398
212407
212408212412
212413
212425
212436
212443
212468
212700212708212710212711
212755
212764212767212771212775212785
PO Number
05/04/2105/04/2105/04/21
05/05/21
05/05/2105/06/21
05/06/21
05/06/21
05/07/21
05/07/21
05/07/21
05/13/2105/14/2105/14/2105/14/21
05/19/21
05/19/2105/20/2105/20/2105/20/2105/21/21
PO Date
COVER 6000 REAR EXIT DOOR LOWER LHFUSE 5000 6000 HEAT A/C 125APLATE 6000 6300 AIR SPRING MOUNTINGFRONT SUSPENSIONFITTING 5000 6000 ELBOW GOVERNOR TOAIR COMPRESSOR M10 X 1.0 MALEHARNESS 5000 6000 DRIVERS HEATEREXTRUSION 5000 6000 RAIN GUTTER RUBBER TRIMCAP 1500 3600 3700 5000 6000 RADIATOR SURGE TANK 16LBSHOSE 6000 DEAERATION SURGE TANK FC186 #6 X 024.0MIRROR 6000 ASSY CONVEX HEATED EXTERIOR MIRROR RH LHPUMP 1500 1800 3600 6000 9300 FUEL SPHEROS THERMO 230 300 350CAP 1500 3700 SNAP IN WHEELCHAIR LIFTTANK 1400 5000 A/C RECEIVERSelector 1400 Shift WTEC3FUSE 6000 400 AMP ALTERNATORPIVOT 6200 FLOOR LOWERING ASSY DETAIL BBOLT 5000 6000 M16 X 2 FRONT AXLE HUB AND ROTORBRAKE CHAMBER 6000 6300 FRONTARM MIRROR 5000 6000 MOUNTING RHSHAFT 6000 STEERING INTERMEDIATEHEAD 9300 9400 BURNER 350 SPHEROFRAME 6300 OUT RIGGER, ASSMY
Description
$1,056.00 $5,676.98 $3,799.20
$13,534.64
$4,433.70 $4,589.25
$1,515.24
$2,331.64
$1,176.00
$1,350.39
$235.50
$405.31 $964.64 $805.13 $166.25
$9,201.00
$2,293.76 $2,969.48 $1,889.08 $8,301.30 $1,262.04
PO Amount

RTD:PO - Purchase Order Monthly Activity
06/10/2021
PO Creation Date - From Date: 05/01/2021 To Date: 05/31/2021
Run Date: Page 9 of 30
Gillig LLC
Gilmore Construction Corp
PO Vendor Name
$137,802.07
$10,899.00
212792212795
212811212831
212850
212852
212869212872
212873
212875
212876212894212899
213078
212799
PO Number
05/21/2105/21/21
05/24/2105/24/21
05/25/21
05/25/21
05/25/2105/25/21
05/25/21
05/25/21
05/25/2105/26/2105/26/21
05/28/21
05/21/21
PO Date
GUIDE 1500 LIFT PLATFORM INNERGUIDE 1500 3600 WHEELCHAIR HANDRAILBLOCK KIT L/RNUT 1405-1409 5000 SHOULDERGAUGE 5200 6000 DUAL AIR 0-150 P.S.I.SLIDE PIN KIT 1500 9300 6000 BUSHING BRAKE CALIPERFILTER AIR 1800 6000 9300 ENGINE SECONDARYLIGHT 5000 6000 ASSY STEPWELLHOSE TRANS 5000 6000 TRANSMISSION COOLANT 90DEGDUCT 5260-5265 6000 EXHAUST DIFFUSERPLATE 6000 6300 AIR SPRING MOUNTINGFRONT SUSPENSIONBOX 6000 LIFT CONTROLBRAKE CAMSHAFT 1400 5000 LH DRIVESTEPTREAD 5000 LONG SAFETY WALK BLACKBUMPER 5000 6000 FRONT MODULE RH
17FH009A WO-013 NM Thornton ParkwayMedian Polyurethane Injection
Description
$4,742.75 $4,802.07
$1,992.30 $13,820.49
$17,301.90
$3,148.75
$1,202.95 $2,554.63
$3,209.46
$4,504.68
$4,125.80 $4,549.00 $257.03
$3,633.73
$10,899.00
PO Amount
Total for Vendor:
Total for Vendor:
Gillig LLC
Gilmore Construction Corp

RTD:PO - Purchase Order Monthly Activity
06/10/2021
PO Creation Date - From Date: 05/01/2021 To Date: 05/31/2021
Run Date: Page 10 of 30
Grainger
Graybar Electric Company, Inc.
HBM Supply
HNTB Corporation
PO Vendor Name
$8,536.16
$440.90
$148.80
$44,969.00
212396
212431
212465212701212773212784212801
212865
212866
213084
213086
212892
212800
PO Number
05/04/21
05/06/21
05/07/2105/13/2105/20/2105/21/2105/21/21
05/25/21
05/25/21
05/28/21
05/28/21
05/26/21
05/21/21
PO Date
CHEMICAL SOAP STEAM CLEANING ZEP FORMULA 940 5 GALLUBRICANT MOW GRAPHITE 1 GAL SLIP PLATEFluid Cutting Aluminum 16OZLIGHT MOW EMERGENCY LED 120/277VChemical Sealant Silicone ClearBLADE KNIFE SINGLE EDGE RAZORCONNECTOR ELEC 1500 5000 6000 BATTERY RED SB350 SERIES 2 POLE 2/0NONSKID TAPE YELLOW 2 INCH X 60 FT ROLLCHEMICAL SOAP STEAM CLEANING ZEP FORMULA 940 5 GALHARD DRIVE TOSHIBA INTERNAL L200 2TB 5400RPM SATAIII6GB/S
STROBE MOW BLUE IMPULSE TPSS
Tape Electrical Black 3/4
17FH020 WO-015 TE Vault System PostDesign/Construction Oversight
Description
$639.76
$1,984.68
$163.44 $169.28 $327.36
$1,632.40 $1,113.80
$426.72
$319.88
$1,758.84
$440.90
$148.80
$44,969.00
PO Amount
Total for Vendor:
Total for Vendor:
Total for Vendor:
Total for Vendor:
Grainger
Graybar Electric Company, Inc.
HBM Supply
HNTB Corporation

RTD:PO - Purchase Order Monthly Activity
06/10/2021
PO Creation Date - From Date: 05/01/2021 To Date: 05/31/2021
Run Date: Page 11 of 30
Hi-Tec Enterprises
IFE North America Inc
IFM Efector Inc.
J & S Contractors SupplyCo.
J.T. Ryerson & Son Inc.
Jamaica Bearings Co Inc
Janek Corporation
PO Vendor Name
$5,179.50
$3,755.95
$460.00
$4,240.00
$3,476.10
$738.75
$220.00
212365
213091
212759212853
213092
212790
212485
212843
212444
PO Number
05/03/21
05/28/21
05/19/2105/25/21
05/28/21
05/21/21
05/10/21
05/25/21
05/07/21
PO Date
STRUT LRV DEN I-VII DAMPER OSCILLATION PANTOGRAPH SHOCK ABSORBERMIRROR HEATER GRID 24V LRV
PIN DOOR SENSITIVE EDGE DEN V LRVSWITCH CUTOUT CREW DOOR 1, 11, 4 & 14 DEN V LRV
Box 170 Airflow Supervisor Chopper Blower LRV
BASE SIGN TELSPAR 2 1/4 X 36 INCHES
STOCK ALUMINUM SHEET 5052H-32 48 X 144 X .125
BEARING WHEEL 3600 3700 5000 6000 FRONT INNER CONE
BUMPER 5000 6000 REAR MODULE LH
Description
$4,780.00
$399.50
$75.00 $3,680.95
$460.00
$4,240.00
$3,476.10
$738.75
$220.00
PO Amount
Total for Vendor:
Total for Vendor:
Total for Vendor:
Total for Vendor:
Total for Vendor:
Total for Vendor:
Total for Vendor:
Hi-Tec Enterprises
IFE North America Inc
IFM Efector Inc.
J & S Contractors Supply Co.
J.T. Ryerson & Son Inc.
Jamaica Bearings Co Inc
Janek Corporation

RTD:PO - Purchase Order Monthly Activity
06/10/2021
PO Creation Date - From Date: 05/01/2021 To Date: 05/31/2021
Run Date: Page 12 of 30
Johnson Controls, Inc.
Knorr Brake Company
Konica Minota Business Solutions
Kubat Equipment & Service Co. Inc
L & N Supply Company
L.B. Foster Rail Technologies Corp
PO Vendor Name
$208,250.00
$990.00
$636,450.00
$19,329.98
$1,370.24
$17,350.00
212483
212806
212506
212745
212384212400212416212796
212726
PO Number
05/10/21
05/21/21
05/11/21
05/18/21
05/04/2105/04/2105/06/2105/21/21
05/14/21
PO Date
Full Service Maintenance Agreement Per RFP 121DM002
COUPLER LRV DEN I-IV EH UNIT TO MOTOR
120JD001 Konica Minolta Copier Lease
RTD District Shops, Replace Fuel Dispenser
BROOM ANGLER PLASTICSprayer Only / Bottle 22 OzHandle Squeegee Metal OnlyHandle Mop Spring Yoke W/ AdjustingWing Nut
STICK LUBE TREAD LRV
Description
$208,250.00
$990.00
$636,450.00
$19,329.98
$274.80 $388.40 $192.24 $514.80
$17,350.00
PO Amount
Total for Vendor:
Total for Vendor:
Total for Vendor:
Total for Vendor:
Total for Vendor:
Total for Vendor:
Johnson Controls, Inc.
Knorr Brake Company
Konica Minota Business Solutions
Kubat Equipment & Service Co. Inc
L & N Supply Company
L.B. Foster Rail Technologies Corp

RTD:PO - Purchase Order Monthly Activity
06/10/2021
PO Creation Date - From Date: 05/01/2021 To Date: 05/31/2021
Run Date: Page 13 of 30
LED Smart Inc
Lexipol LLC
MAC Products
PO Vendor Name
$13,266.00
$18,500.00
$7,748.40
212438
212377
212851
PO Number
05/07/21
05/03/21
05/25/21
PO Date
BULB LRV DEN I-VII INTERIOR LED DOME LIGHTS
Annual Law Enforcement Policy Manual & Daily Training Bulletins
STEADY ARM MOW G1 IN S/S SINGLE BEND K&M
Description
$13,266.00
$18,500.00
$7,748.40
PO Amount
Total for Vendor:
Total for Vendor:
Total for Vendor:
LED Smart Inc
Lexipol LLC
MAC Products

RTD:PO - Purchase Order Monthly Activity
06/10/2021
PO Creation Date - From Date: 05/01/2021 To Date: 05/31/2021
Run Date: Page 14 of 30
MHC Kenworth - Denver
MSC Industrial Supply Co. Inc.
PO Vendor Name
$52,972.67
$568.92
212446
212464
212491
212752
212791
212858
212859
212914
213080
212448212699
PO Number
05/07/21
05/07/21
05/10/21
05/19/21
05/21/21
05/25/21
05/25/21
05/26/21
05/28/21
05/07/2105/13/21
PO Date
SENSOR 3600 3700 ISX NITROGEN OXIDEW/ PROTECTIVE COVERSEAL KIT 1500 1800 3600 3700 3900 ISL ISX REAR AIR COMPRESSORSENSOR 1800 6000 9300 ISL NITROGEN OXIDE OUTLETHOSE 1500 3600 3700 MOLDED CRANKCASE BREATHERCOVER 1400 2000 6000 9300 DIAGNOSTIC BOX REAR PROTECTIVEMODULE 1800 6001-6299 9300 ISL ENGINE ELECTRONIC CONTROLFILTER 1500 3600 3700 CRANKCASE BREATHERSENSOR 1500 3600 3700 6000 9300 9400 ISL ISX TEMPERATURE EXHUASTADAPTER 1500 1800 3600 9300 VACUUM BRAKE CALIPER
GAUGE TIRE STRAIGHT ON TO CHECK PSIADHESIVE EPOXY 50ML 3M TRACK BRAKE BRACKET BLACK LRV
Description
$2,950.32
$4,881.69
$17,544.60
$1,482.52
$1,306.58
$9,119.88
$1,440.00
$13,263.08
$984.00
$226.80 $342.12
PO Amount
Total for Vendor:
Total for Vendor:
MHC Kenworth - Denver
MSC Industrial Supply Co. Inc.

RTD:PO - Purchase Order Monthly Activity
06/10/2021
PO Creation Date - From Date: 05/01/2021 To Date: 05/31/2021
Run Date: Page 15 of 30
Majorsell International LTD
Mallory Safety & Supply LLC
Marini Diesel Inc
PO Vendor Name
$4,930.00
$20,195.00
$21,159.50
212421
212750212837
212698
212788
212445212462
212712212794
212798212849
213079
PO Number
05/06/21
05/19/2105/25/21
05/13/21
05/21/21
05/07/2105/07/21
05/14/2105/21/21
05/21/2105/25/21
05/28/21
PO Date
RING KIT 1800 6000 9300 STANDARD AIR COMPRESSORCALIPER KIT BEARING ELSA 225LEVER 1500 1990 3600 6000 CALIPER
GLOVES NITRILE POWDER FREE 5 MIL DISPOSABLE MEDIUMRegulator Face Mask Half 3M SA2000
WASHER 1500 6000 SEALINGCOVER 5260-5265 6300 9400 GRID HEATER INTAKE MANIFOLDCONNECTION 1400 ISB TURBO OIL DRAINGASKET 1800 5260-5265 6000 9300 ISLOIL PANINJECTOR 1500 3600 ENGINEACTUATOR 1800 6000 9300 9400 ISL TURBO KIT VGTHOSE 1800 5260-5265 6000 9300 ISL AIR COMPRESSOR TO BLOCK
Description
$2,920.00
$1,740.00 $270.00
$19,836.00
$359.00
$985.68 $1,307.81
$94.15 $3,746.22
$6,561.90 $6,866.94
$1,596.80
PO Amount
Total for Vendor:
Total for Vendor:
Total for Vendor:
Majorsell International LTD
Mallory Safety & Supply LLC
Marini Diesel Inc
RTD:PO - Purchase Order Monthly Activity
06/10/2021
PO Creation Date - From Date: 05/01/2021 To Date: 05/31/2021
Run Date: Page 16 of 30
Maxwell Industries R & DInc
McMaster-Carr Supply Company
Medical Transportation Management Inc
Midwest Sign & Screen Printing
PO Vendor Name
$9,281.50
$2,513.58
$4,735,768.89
$764.15
212517212518212519212520212521
212373
212403212725212847
212904
212770
212452
PO Number
05/11/2105/11/2105/11/2105/11/2105/11/21
05/03/21
05/04/2105/14/2105/25/21
05/26/21
05/20/21
05/07/21
PO Date
MSV 72565 - REPAIR SHOCKS 70065122MSV 72564 - REPAIR SHOCKS 70065124MSV 72563 - REPAIR SHOCKS 612332MSV 72562 - REPAIR SHOCKS 9120815MSV 72561 - REPAIR SHOCKS 6133789
HINGE 1500 PIANO STYLE 1 FOOT DRIVERS BARRIERVELCRO 1IN DUAL LOCKCLEVIS SANDING TUBE LRVTAPE COTTON CLOTH FRICTION ELECTRICAL 3/4 INCH X 60 FT X 13 MILTRIM LRV DEN I-VII EDGE PROTECTION RACK ASSY
121DH001 ADA Mobility Assessment and Travel Training Start-up 6/1/2021-8/31/2021 Full delivery ofservice begins 9/1/2021-8/31/2026
FOIL GERBER EDGE FX BLACK
Description
$5,151.00 $1,515.00 $1,060.50 $1,045.00 $510.00
$236.64
$1,752.00 $279.30 $164.64
$81.00
$4,735,768.89
$764.15
PO Amount
Total for Vendor:
Total for Vendor:
Total for Vendor:
Total for Vendor:
Maxwell Industries R & D Inc
McMaster-Carr Supply Company
Medical Transportation Management Inc
Midwest Sign & Screen Printing

RTD:PO - Purchase Order Monthly Activity
06/10/2021
PO Creation Date - From Date: 05/01/2021 To Date: 05/31/2021
Run Date: Page 17 of 30
Modine Manufacturing Company
Mohawk Mfg. & Supply Co.
Motion Industries, Inc.
Muncie Transit Supply
PO Vendor Name
$35,298.00
$3,863.69
$142.00
$8,575.50
212499
212895
212458
212877212893
212732
212390212459
212766
212783
212845212867212901
213081
PO Number
05/11/21
05/26/21
05/07/21
05/25/2105/26/21
05/17/21
05/04/2105/07/21
05/20/21
05/21/21
05/25/2105/25/2105/26/21
05/28/21
PO Date
RADIATOR 6001-6355 CAC COOLIING MODULE FRAMELESSRADIATOR 6001-6355 CAC COOLIING MODULE FRAMELESS
CLAMP 1800 9300 EXHAUST 4.75 INCH I.D.LIGHT 5000 LED STEPWELL FRONTVALVE 6000 BRAKE APPLICATION E-8P
Hose Fuel Clear 1/2IN
FUSE 5000 6000 HEAT A/C 125ACAP FUEL 1500 3600 3700 5000 6000 9300 FILL DUST COVERLATCH 6000 COMPRESSION LEVER FLOOR HATCHBEARING WHEEL 5000 6000 DRIVE OUTERCONEHOSE SILICONE 5/8 X 36 INFILL ASSY 5000 6000 6300 FUEL NECKELECTRODE ALL EXCEPT 1401-1404 1990IGNITION SPHEROS THERMO 230 300 350FAN 1800 9300 ASSEMBLY CONDENSER
Description
$11,766.00
$23,532.00
$309.80
$389.08 $3,164.81
$142.00
$1,521.93 $1,800.60
$392.25
$537.60
$1,421.12 $1,418.90 $182.04
$1,301.06
PO Amount
Total for Vendor:
Total for Vendor:
Total for Vendor:
Total for Vendor:
Modine Manufacturing Company
Mohawk Mfg. & Supply Co.
Motion Industries, Inc.
Muncie Transit Supply

RTD:PO - Purchase Order Monthly Activity
06/10/2021
PO Creation Date - From Date: 05/01/2021 To Date: 05/31/2021
Run Date: Page 18 of 30
Mythics Inc
NAPA Auto Parts
NASG Holdings LLC
National Coatings & Supplies Inc
PO Vendor Name
$332,716.07
$526.00
$697.41
$9,272.86
212504
212466
212844
212761
212406212463212498212898
PO Number
05/11/21
05/07/21
05/25/21
05/19/21
05/05/2105/07/2105/10/2105/26/21
PO Date
Oracle Support & Cloud Service Renewal/HW EOL Refresh (replaces PO#210597)
CONNECTOR LRV DEN I-VII PIGTAIL WEATHER PACK 2-WAY TOWER 18 GA. SXLBLK 10" FEMALEPropane Bernzomatic
CAB WINDOW GLASS FIXED LH LRV
SATA Fresh Air ComponentsPAINT ACCELERATOR DUPONT QUARTPAINT BUS WHITE 3/4 GAL IMRONACTIVATOR MID TEMP DUPONT
Description
$332,716.07
$108.40
$417.60
$697.41
$6,951.57 $667.28 $189.53
$1,464.48
PO Amount
Total for Vendor:
Total for Vendor:
Total for Vendor:
Total for Vendor:
Mythics Inc
NAPA Auto Parts
NASG Holdings LLC
National Coatings & Supplies Inc

RTD:PO - Purchase Order Monthly Activity
06/10/2021
PO Creation Date - From Date: 05/01/2021 To Date: 05/31/2021
Run Date: Page 19 of 30
National Oak Distributors Inc
National Trackwork Inc.
Neopart Transit LLC
New Pig Corporation
PO Vendor Name
$22,815.80
$117.96
$738.15
$5,856.00
212386212417
212532212751
212774
212823
212868
212907
213082
212821
212822
PO Number
05/04/2105/06/21
05/12/2105/19/21
05/20/21
05/24/21
05/25/21
05/26/21
05/28/21
05/24/21
05/24/21
PO Date
ADHESIVE SEMI-RIGID PLASTIC REPAIRChemical Adhesive Plastic Thin MediumSATA Fresh Air PartsBODY FILLER PLATINUM PLUS 3 GAL PAILFILLER FIBRAL SANDABLE FIBERGLASS 1LITER BAGSANDPAPER DISC 6 IN 80 GRIT HOOKIT PURPLE 3M CUBITRONCHEMICAL ADHESIVE FUSOR BONDER 1.7OZ ID PLATE
Gasket Lead Mechanical Switchman MOW LRV
SEAL 1500 1990 3600 3700 DRIVE AXLEINNER
ABSORBANT MAT WHITE 16.5 X 20 OL ONLYABSORBANT MAT GREY 15 X 20 COOLANT/OIL
Description
$430.56 $699.24
$18,654.25 $827.25
$969.02
$279.00
$956.48
$117.96
$738.15
$1,152.00
$4,704.00
PO Amount
Total for Vendor:
Total for Vendor:
Total for Vendor:
Total for Vendor:
National Oak Distributors Inc
National Trackwork Inc.
Neopart Transit LLC
New Pig Corporation

RTD:PO - Purchase Order Monthly Activity
06/10/2021
PO Creation Date - From Date: 05/01/2021 To Date: 05/31/2021
Run Date: Page 20 of 30
Onspot of North America Inc
Oracle America Inc
PPG Architectural Finishes, Inc.
PSI Repair Services, Inc.
Power Product Technologies, Inc.
Prevost Car (US) Inc.
Prime Industries Inc.
PO Vendor Name
$429.30
$167,000.00
$876.14
$6,452.00
$156.00
$2,231.60
$1,686.72
212414
212486
212828212917
212786
212730
212879
212449212878
PO Number
05/06/21
05/10/21
05/24/2105/27/21
05/21/21
05/17/21
05/25/21
05/07/2105/25/21
PO Date
CHAIN WHEEL 3700 AUTO CHAINS S/S
17DH022 Oracle/Aconex SaaS - OptionYear #2
CHEMICAL WIPES GRAFFITI SAFEPAINT EPOXY YELLOW 2-PART PPG AMERLOCK
Unscheduled Repair of DC/DC Converters OEM PSI
HOSE SHOP AIR 250 PSI RED 3/8 IN GOODYEAR HORIZON
GOVERNOR 1400 1650 5000 6000 AIR COMPRESSOR
CHEMICAL ROOF SEALANT SEAL BOND 100CHEMICAL ROOF SEALANT SEAL BOND 100
Description
$429.30
$167,000.00
$577.80 $298.34
$6,452.00
$156.00
$2,231.60
$783.12 $903.60
PO Amount
Total for Vendor:
Total for Vendor:
Total for Vendor:
Total for Vendor:
Total for Vendor:
Total for Vendor:
Total for Vendor:
Onspot of North America Inc
Oracle America Inc
PPG Architectural Finishes, Inc.
PSI Repair Services, Inc.
Power Product Technologies, Inc.
Prevost Car (US) Inc.
Prime Industries Inc.

RTD:PO - Purchase Order Monthly Activity
06/10/2021
PO Creation Date - From Date: 05/01/2021 To Date: 05/31/2021
Run Date: Page 21 of 30
Pynergy Petroleum Company LLC
R.F.S., Inc.
R.S. Hughes Company, Inc.
Rocky Mountain Adhesives, LLC
RouteMatch Software Inc
Royal Supply Company
PO Vendor Name
$1,053.00
$325.00
$2,085.64
$262.88
$159,474.29
$217.80
212911
212912
212434212862
212427212456212772212841
212404
212739
212453
PO Number
05/26/21
05/26/21
05/07/2105/25/21
05/06/2105/07/2105/20/2105/25/21
05/04/21
05/18/21
05/07/21
PO Date
Lubricant Grease Conoco Red Multiplex 120LB KEGLubricant Grease Conoco Red Multiplex 120LB KEG
CABLE MECH PASSENGER BELL CORDSTRIKER WELDING TORCH
Sandpaper Disc Roloc 2IN 50GRITCLEANER ADHESIVE GENERAL PURPOSE TAPE VHB 1 INCH DOUBLE SIDED GRAYCHEMICAL CLEANER ELECTRICAL CONTACTELECTRO140
BOX AIR INTAKE 9.5 X 11.5 X 12.5
15DH009 Amendment 17 Software Maintenance 6/4/21-6/3/22
TOOL DDEC PIN REMOVER
Description
$702.00
$351.00
$175.00 $150.00
$217.50 $1,066.32 $257.02 $544.80
$262.88
$159,474.29
$217.80
PO Amount
Total for Vendor:
Total for Vendor:
Total for Vendor:
Total for Vendor:
Total for Vendor:
Total for Vendor:
Pynergy Petroleum Company LLC
R.F.S., Inc.
R.S. Hughes Company, Inc.
Rocky Mountain Adhesives, LLC
RouteMatch Software Inc
Royal Supply Company

RTD:PO - Purchase Order Monthly Activity
06/10/2021
PO Creation Date - From Date: 05/01/2021 To Date: 05/31/2021
Run Date: Page 22 of 30
Saf-T-glove, Inc.
Scheidt & Bachmann USA Inc
Schunk Carbon TechnologyLLC
Securr
PO Vendor Name
$736.80
$7,984.80
$35,740.30
$13,995.00
212501212827
212888
212694
212734
212744
212779
213089
212733
PO Number
05/11/2105/24/21
05/25/21
05/12/21
05/17/21
05/18/21
05/20/21
05/28/21
05/17/21
PO Date
Jacket Rain LargePants Rain Medium
0371957- MDL DISPLAY 15-TS LITEMAX -IX D
SHUNT UPPER TO LOWER FRAME PANTOGRAPH LRVSHAFT INSIDE ENDS OF COUPLING ROD PANTOGRAPH LRVCARBON STRIP WITH HEATING ELEMENT PANTOGRAPH LRVSPRING LOOP LRV DEN I-VIII PANTOGRAPH PAN HEADSHUNT CABLE BRAIDED PANTOGRAPH LRV
Guardian Series Waste Receptacle HS35OW-CS Clear sided, Homeland security compliant waste receptacles
Description
$118.32 $618.48
$7,984.80
$905.40
$911.70
$22,362.00
$11,340.00
$221.20
$13,995.00
PO Amount
Total for Vendor:
Total for Vendor:
Total for Vendor:
Total for Vendor:
Saf-T-glove, Inc.
Scheidt & Bachmann USA Inc
Schunk Carbon Technology LLC
Securr

RTD:PO - Purchase Order Monthly Activity
06/10/2021
PO Creation Date - From Date: 05/01/2021 To Date: 05/31/2021
Run Date: Page 23 of 30
Selective Transit Parts
Sid Harvey Industries, Inc.
Siemens Mobility Inc
SmartDrive Systems, Inc
Sportworks Northwest, Inc.
PO Vendor Name
$2,442.60
$219.50
$14,892.00
$300.00
$2,931.00
212706212830
212897
212919
212422
212372
212916
212753
212502212802
PO Number
05/13/2105/24/21
05/26/21
05/27/21
05/06/21
05/03/21
05/27/21
05/19/21
05/11/2105/21/21
PO Date
SENSOR 5000 6HP592 SPEEDOMETERSENSOR 1800 6000 9300 OUTPUT TURBINE ZF ECOLIFE TRANSMISSIONSENSOR 6000 6300 9300 9400 ZF TRANSMISSION FLUID LEVELDRUM 1800 9300 TRANSMISSION B CLUTCH
Hose A/C Charging Red
HARNESS GROUND BRUSH AXLE 4 SD160 DEN V LRVWINDOW LRV DEN VIII SLIDING CAB LH
BRACKET 1800 6000 9300 MOUNTING PRIMARY TYPE 2 CAMERA
BRACKET 1500 1990 3600 BIKE RACKBIKE RACK 1500 1800 3600 3700 5000 6000 9300 STAINLESS FULL ASSY
Description
$49.60 $990.00
$690.00
$713.00
$219.50
$2,140.00
$12,752.00
$300.00
$342.00 $2,589.00
PO Amount
Total for Vendor:
Total for Vendor:
Total for Vendor:
Total for Vendor:
Total for Vendor:
Selective Transit Parts
Sid Harvey Industries, Inc.
Siemens Mobility Inc
SmartDrive Systems, Inc
Sportworks Northwest, Inc.

RTD:PO - Purchase Order Monthly Activity
06/10/2021
PO Creation Date - From Date: 05/01/2021 To Date: 05/31/2021
Run Date: Page 24 of 30
Sunshine Building Maintenance, Inc
Super-Tech Filter
Talk the Rockies
Team Petroleum, LLC
PO Vendor Name
$7,653.96
$245.60
$430.00
$376.44
212854
212428
212451
212768
PO Number
05/25/21
05/06/21
05/07/21
05/20/21
PO Date
Funding for Janitorial Services at 8101 and 8215 Steele Street
Filter Air Pleated 30" X 20" X 2" MOW LRV
ANTENNA PORTABLE 7-800 GPS
CHEMICAL CLEANER SOLVENT WINDSHIELDWIPER WASHER READY-MIX
Description
$7,653.96
$245.60
$430.00
$376.44
PO Amount
Total for Vendor:
Total for Vendor:
Total for Vendor:
Total for Vendor:
Sunshine Building Maintenance, Inc
Super-Tech Filter
Talk the Rockies
Team Petroleum, LLC

RTD:PO - Purchase Order Monthly Activity
06/10/2021
PO Creation Date - From Date: 05/01/2021 To Date: 05/31/2021
Run Date: Page 25 of 30
The AfterMarket Parts Company
PO Vendor Name
212401
212419
212437212439
212440
212442
212447212454
212455
212460212496
212533
212713
212743
212793
212797212829212840
PO Number
05/04/21
05/06/21
05/07/2105/07/21
05/07/21
05/07/21
05/07/2105/07/21
05/07/21
05/07/2105/10/21
05/12/21
05/14/21
05/18/21
05/21/21
05/21/2105/24/2105/25/21
PO Date
VALVE 1500 3600 3700 ASSY LEVELING LH RRSTRAP 1800 9300 STANDING ASSIST ARTCULATED JOINTMODULE 3600 3700 MASTERGLASS 1800 9300 ENTRANCE DOOR GLASSAFTTUBE 1500 1990 3600 3700 BAGGAGE DOOR STABILIZERCABLE 1500 3600 ALTERNATOR NO. 2 ISXALTERNATOR 1500 3600 3700SILENCER 1500 1650 1990 3600 3700 AIR DRYER KITSLIDE 1500 1990 3600 3700 UNIT COMPLETE FRAME AND GLASSBEARING 1500 1990 FRONT TAG AXLEWINDSHIELD 1500 1990 3600 3700 LH STREETSIDESTRAP 1500 1800 3600 3700 5000 60009300 STATIC GROUNDBRACKET 1800 9300 9400 ALTERNATOR SUPPORT BRACKETPOCKET 1800 9300 9400 FLOOR FORWARD FLOOR INSTALLATIONVALVE AIR SURGE TANK SCHRADER 1/4 MPTVENT 1800 9300 BREATHER PUMP RAMPDOOR 1800 9300 ASSY-SIDE CONSOLEBUSHING KIT 1800 9300 UPPER LOWER REAR RADIUS ROD
Description
$708.70
$3,487.22
$6,303.16 $633.30
$1,433.30
$1,502.64
$13,622.59 $13,650.39
$2,734.45
$5,762.30 $1,013.36
$1,554.00
$3,396.78
$1,903.26
$7,962.22
$886.58 $4,063.68
$11,611.40
PO Amount

RTD:PO - Purchase Order Monthly Activity
06/10/2021
PO Creation Date - From Date: 05/01/2021 To Date: 05/31/2021
Run Date: Page 26 of 30
The AfterMarket Parts Company
The Branting Industries II Inc
The Home Depot Pro
PO Vendor Name
$111,046.77
$175.00
$2,047.40
212909212910
212913
212918
212920
213075
213085
212825
212387212848
PO Number
05/26/2105/26/21
05/26/21
05/27/21
05/27/21
05/28/21
05/28/21
05/24/21
05/04/2105/25/21
PO Date
VALVE 1990 DRIVER'S HTR DEFROSTERWHEEL 1500 1990 ALCOA BRUSHED ALUMINUM 22.5 X 9Bracket Body 1990 1500 3600 3700 Bumper Front Latching Angle LHTRAY 1500 1990 3600 3700 BATTERY BASEPLATE 1500 1990 3600 3700 CLOSING REAR BUMPERMOUNT 1500 3600 EXTRUSION RUBBER RUB RAIL REAR SIDE SERVICE DOORMOLDING 1800 9300 FENDER POLYURETHANE
Torque Converter Replacement Work Order DSHUS-2021-32/ Invoice 97646
Brush Scratch Stainless SteelNozzle Garden Hose Pistol Grip Standard
Description
$400.00 $3,123.28
$8,298.25
$4,996.64
$10,742.96
$356.31
$900.00
$175.00
$216.00 $1,831.40
PO Amount
Total for Vendor:
Total for Vendor:
Total for Vendor:
The AfterMarket Parts Company
The Branting Industries II Inc
The Home Depot Pro

RTD:PO - Purchase Order Monthly Activity
06/10/2021
PO Creation Date - From Date: 05/01/2021 To Date: 05/31/2021
Run Date: Page 27 of 30
The Sherwin-Williams Company
Thermo King of Dallas LLC
Titan Laboratories
Translite Enterprises Inc
Transwest ATTP
PO Vendor Name
$2,462.38
$13,941.37
$12,948.00
$1,769.90
$450.60
212391212735
212861
213090
212714212762
212807
212418
212820
212497
212846
PO Number
05/04/2105/17/21
05/25/21
05/28/21
05/14/2105/19/21
05/21/21
05/06/21
05/24/21
05/10/21
05/25/21
PO Date
TAPE DUCT SILVER 2IN 3M HIGHLANDSHEETING OVERSPRAY PROTECTIVE 3M LRVSANDPAPER DISC 6 IN 40 GRIT HOOKIT PURPLE 3M CUBITRONSANDPAPER DISC 6 IN 180 GRIT HOOKITPURPLE 3M CUBITRON
DRYER 1400 5000 6000 6300 A/CSENSOR TEMP A/C THERMO KING HVAC LRVCONTROLLER HVAC CONTROL BOX SD160 LRV
Bottle Sample W/CAP Natural PlasticFuel 8 OzBOTTLE OIL SAMPLE TITAN W/PROBE
WINDSHIELD 5000 6000 RH W/ SHADEBAND
FLUID DIESEL EXHAUST DEF 2.5 GAL
Description
$1,557.38 $213.00
$224.00
$468.00
$225.35 $369.60
$13,346.42
$300.00
$12,648.00
$1,769.90
$450.60
PO Amount
Total for Vendor:
Total for Vendor:
Total for Vendor:
Total for Vendor:
Total for Vendor:
The Sherwin-Williams Company
Thermo King of Dallas LLC
Titan Laboratories
Translite Enterprises Inc
Transwest ATTP

RTD:PO - Purchase Order Monthly Activity
06/10/2021
PO Creation Date - From Date: 05/01/2021 To Date: 05/31/2021
Run Date: Page 28 of 30
US Standard Sign Company
Vecom USA
Vehicle Maintenance Program, Inc.
Via Mobility Services
Vision Chemical Systems Inc
WSP USA Inc
PO Vendor Name
$999.00
$4,892.00
$462.15
$350,000.00
$6,802.80
$956,212.62
212787
212691
212424213083
212707
212366
212394
212826
212492
PO Number
05/21/21
05/12/21
05/06/2105/28/21
05/13/21
05/03/21
05/04/21
05/24/21
05/10/21
PO Date
Sign Blank 24 X 24 Sign Shop
TWC TRANSPONDER 8A83 LRV
HEADLIGHT 1990 5000 HALOGEN LOWBEARING WHEEL 5000 6000 DRIVE INNERCUP
421DB002 2021 HOP Vehicle Replacement
CHEMICAL CLEANER LOOK GLASS CONCENTRATE BUTCHERSChemical Cleaner Carpet Extraction Butchers FountainheadCHEMICAL CLEANER GRAFFITI REMOVER CONCENTRATE GALLON
121DO001 O&M of RTD Groundwater Treatmetn Facility - Tunnel 16
Description
$999.00
$4,892.00
$99.75 $362.40
$350,000.00
$334.80
$480.00
$5,988.00
$956,212.62
PO Amount
Total for Vendor:
Total for Vendor:
Total for Vendor:
Total for Vendor:
Total for Vendor:
Total for Vendor:
US Standard Sign Company
Vecom USA
Vehicle Maintenance Program, Inc.
Via Mobility Services
Vision Chemical Systems Inc
WSP USA Inc

RTD:PO - Purchase Order Monthly Activity
06/10/2021
PO Creation Date - From Date: 05/01/2021 To Date: 05/31/2021
Run Date: Page 29 of 30
West Direct Oil LLC
Western Paper Distributors Inc
Western States Fire Protection Co
Western Tool Company
Western-Cullen-Hayes Inc.
Whisler Bearing Company
PO Vendor Name
$6,070.36
$2,440.00
$83,380.00
$412.80
$2,164.00
$249.36
212493
212741
212855
212789
212738
212423
212426
212457
PO Number
05/10/21
05/18/21
05/25/21
05/21/21
05/17/21
05/06/21
05/06/21
05/07/21
PO Date
LUBRICANT OIL 10W30 PREMIUM BLUE SYNTHETIC BLEND 55 GAL DRUMBRAKE FLUID 5 GALLON (HYD FLUID) LRVGREASE 14oz GLADUS S3 V220 C2 TUBES
TOWEL RAG WYPALL WORK HORSE KIMBERLY
Civic Center Station - Fire Pump, Pump Controller and Transfer SwitchReplacement
PEN MARKING WHITE DYKEM M-3
MOTOR DC MOW GATE MECHANISM 3590 WCH
LUBRICANT LUBRIPLATE SPRAY LUBE A
Description
$1,798.00
$4,095.20
$177.16
$2,440.00
$83,380.00
$412.80
$2,164.00
$249.36
PO Amount
Total for Vendor:
Total for Vendor:
Total for Vendor:
Total for Vendor:
Total for Vendor:
Total for Vendor:
West Direct Oil LLC
Western Paper Distributors Inc
Western States Fire Protection Co
Western Tool Company
Western-Cullen-Hayes Inc.
Whisler Bearing Company

RTD:PO - Purchase Order Monthly Activity
06/10/2021
PO Creation Date - From Date: 05/01/2021 To Date: 05/31/2021
Run Date: Page 30 of 30
$9,194,635.48
308
Wurth USA Inc.
Zilla Corporation
PO Vendor Name
$441.22
$19,104.75
Total Amount for Report:
212864
212697212705
PO Number
05/25/21
05/13/2105/13/21
PO Date
Paint Undercoat Wurth Rubberized 20Oz Can
POST SIGN SHOP LONG POLE SETPOST SIGN LONG BLACK POWDERCOATED
Description
$441.22
$12,900.00 $6,204.75
PO Amount
Total for Vendor:
Total for Vendor:
Total Number of POs:
Wurth USA Inc.
Zilla Corporation
Related Documents