Bo T54 482 TITLE INSTITUTION 0 PUB DATE NOTE BIAS ,PRICE DESCRIPTORS 4. ABSTRACT /DOCUMENT RESUME , EA 010 569- A a rogramming System .for School, Location, Facility tion, - / '`,Nort Carolina State Dept. of Public Instruction, Raleig Ti 131pAt N t available in paper copy due to small print of Ruch,. of the doculent; Some igutes have grey Amckgrounds and iy not. reprcd e clearly MP-$0.83 Pius Postage. 4C,Not Available from EDRS. ,*Attendance Patterns; *Computer Programs; Elementary Secondary Education;-*Pacility Utilization 'Research; Flow Charts; *Integration Plans; Models; Residential Patterns; Site Selection; *Student Transportation . . A . , A/linear program model designed to aid in site selection and the development of pupil assignment plans is illustrated in t'reins pl.a hypothetical Schoolsybtem: The model is 'designedto pro Vide the best possible realization. of any single stated objectiie (for example, "Minimize the distance,that pupils must travel") given any number of specified constraints (for e merle; "No school may have an enrollment greater than its deiign capa ity," or "Racial- percentages must be within predetermined bounits"). The model uses two programs written in'Portram, both documented in full in an' extensive appendix. (Alithor/PGD) N. 6 A i r. ,-=. -.. **********************************t**4*******************************44 * ileproduttions supplied by EDRS,are the best that can .be made * , tram the original dccumento . - .. * ***114**************************************************************e * .. - 3.

Welcome message from author
This document is posted to help you gain knowledge. Please leave a comment to let me know what you think about it! Share it to your friends and learn new things together.
Transcript
Bo T54 482
TITLE
INSTITUTION0
PUB DATENOTE
BIAS ,PRICEDESCRIPTORS4.
ABSTRACT
/DOCUMENT RESUME,
EA 010 569-
A a rogramming System .for School, Location, Facilitytion, - /
'`,Nort Carolina State Dept. of Public Instruction,RaleigTi131pAt N t available in paper copy due to small printof Ruch,. of the doculent; Some igutes have greyAmckgrounds and iy not. reprcd e clearly
MP-$0.83 Pius Postage. 4C,Not Available from EDRS.,*Attendance Patterns; *Computer Programs; ElementarySecondary Education;-*Pacility Utilization 'Research;Flow Charts; *Integration Plans; Models; ResidentialPatterns; Site Selection; *Student Transportation
. .
A .
,
A/linear program model designed to aid in siteselection and the development of pupil assignment plans isillustrated in t'reins pl.a hypothetical Schoolsybtem: The model is'designedto pro Vide the best possible realization. of any singlestated objectiie (for example, "Minimize the distance,that pupilsmust travel") given any number of specified constraints (for e merle;
"No school may have an enrollment greater than its deiign capa ity,"or "Racial- percentages must be within predetermined bounits"). Themodel uses two programs written in'Portram, both documented in fullin an' extensive appendix. (Alithor/PGD)
N.
6
A
i
r.
,-=.-..
**********************************t**4*******************************44* ileproduttions supplied by EDRS,are the best that can .be made* , tram the original dccumento . - .. ****114**************************************************************e *
.. -
3.
,
S
es
I.A PrOgraimiling,
for:.School tocati6i
Facility Vtilization'
14
T COPY AVAIIABLE
I
4
U S DEPARTMENT OF HEALTH.EDUCATION & WELFARE
;NATIONAL INSTITU OFEDUCATIO I
THIS DOCUME ItAS BEEN REPRO-. .DUCED EXACT1:}L444 RECEIVED PROW..THE PERSON OR ORGANIZATION ORIGIN. ItATING IT POINTS OF VIEW 09 OPINIONS-STATEb DO N01' NECESSARILY REPRE=
'SENT OFFICIAL NATIONAL INSTITUTE OF;.EDUCATION POSITION .OR POLICY
II,
. . .
,t
. .
3PERMISIDN TO REPRODUCE :rms,MATERIAL 04 'MICROFICHE ;ONLY`liAS BEEN GRANTED BY
0,-1L4 Cete-o
..?,e i 417e, rbTO THE EDDaTIONict. NgsouROES411FORMATJON 6ENTER,,,temo AND:USERS OF THE ERIC SYSTEMI'
er, ,
V.
FOREWORD°
.1A
. 1
.
As a consequence of declinipg enrollthents, and the changing natureof tir1,school systems, decisions regarding the location of schools, theassignment of students, and the utilization and organization of facilitieshave become very. impo'rt'ant. ' . .
.
Amopg the'many factors contributing to.this-dynamic State are: newsite selection; shifts in population, changes'in educational prbgrms,obtaining a desired balance of minority groups in the schools, and the merger,and consolidation .of two or more schools or school tyStems. ,
,
Local school administrators are constantly' fadid with the task of - .
making de isions which maintain-edelicate balance between qualit .educationt. ' and econo c efficiency. These are difficult tasks and ones which require
that the estsinformation obtainable be available when makng these decisions.
Maly of the quantitative tools of manageMent -avallabil today .areapplicable to'the problems faced by school officials. This ,publicationdescribes the application of one such tool, a ine pTogranlang model
11.developed jointly by/Mr. Dave Norris,'Or. Robe owell; and'D.r. JamesYoung, at the Center for Urban Aff4rs, North Carolina State University,and Mr. EUgene Cheatham, Division of School Planning. -The purpose of'thismodel is. .td aid in the solution-to prob
,
merit of''pqpil assignment-plans for_misystem-.
)
)
As with most management tosolutions .to problems posed b
theadministratot the capabi ity'to consider numerous:a.lternatiyes and makedecisions based on the dosrrability of Plans res9Ating,from the alternativesConsidered. - . ./
/',
,'
-' ., % ., \ .
Zonsdltantsifrom the Division of Schook-Olanning are available to
.
ems of site selection'an4,the develop-imum transportation o.,0apils in a school
.
s, linear programs utilize tomputers fordecision makers and this combination provides
assist lbcal unit'q in:Preparing the data necessary to use the model, and in.interpreting the illtAmW,les gee rated by the model.
. Spfing.1g
../ ')
.A'
J. ierce, DirectorDivision of School Planning
I
,
-I Setteg Goals (Objectives and constraints) '1. 40.,
II...Dataltequireeents,
$ 1 . . .6. .. ,
III. SolutiOn Methods ,
,
0,
IV. Prograt Results.r
. 10
N., /V. Program Options :: .... 't ..oft%'. : . ..
:., . 17
o
TABLE OF :CONTENTS
Page.e,
.
VI. Other Applications , .1 31
VII. System Documentation . . . 37
. .I. Example Output . 0, 57
IX. 'Job Control Language and Run Sequence . . . *:. . . .,.. 66,,.
,
.
..
.
'.' X. File Organization ., . . .
,
71
1
It
'
o 1
O
1.
*
Figure 1 . .
MAPS AND CHARTS
r".
Page
2
Figure 2 8
Figure 3 OVe 9 '0 9
gore 4 11
Figure, . . . Wo0 12
Figu;e 6' 14
4 ,
Figure 7 16
Figure 8 20
'Figiire 9 22--A
Figure 10 24*
Figure.11 25
Figure 12 27
Figure 13 28'
.Figure 14- ... . - .e30
Figure 15 33.
1
Ilnea Programming System Hoy: 40*,
rogram 1 (Data try Flow) 42
Program 2 (MPS Solution Flow) 45
Pupil Assignment Plan for the Mecklenburg County School System .
Cla sification)of Pupils for Each Area *61
Dist ces (in miles) Between School's and Assignment Areas 02
Assignment Information for each Assignment Area 63,A
Assignment Information forU SHIA . . 64
65Summary Statisfigs(D.Mecklenburg County School System
/
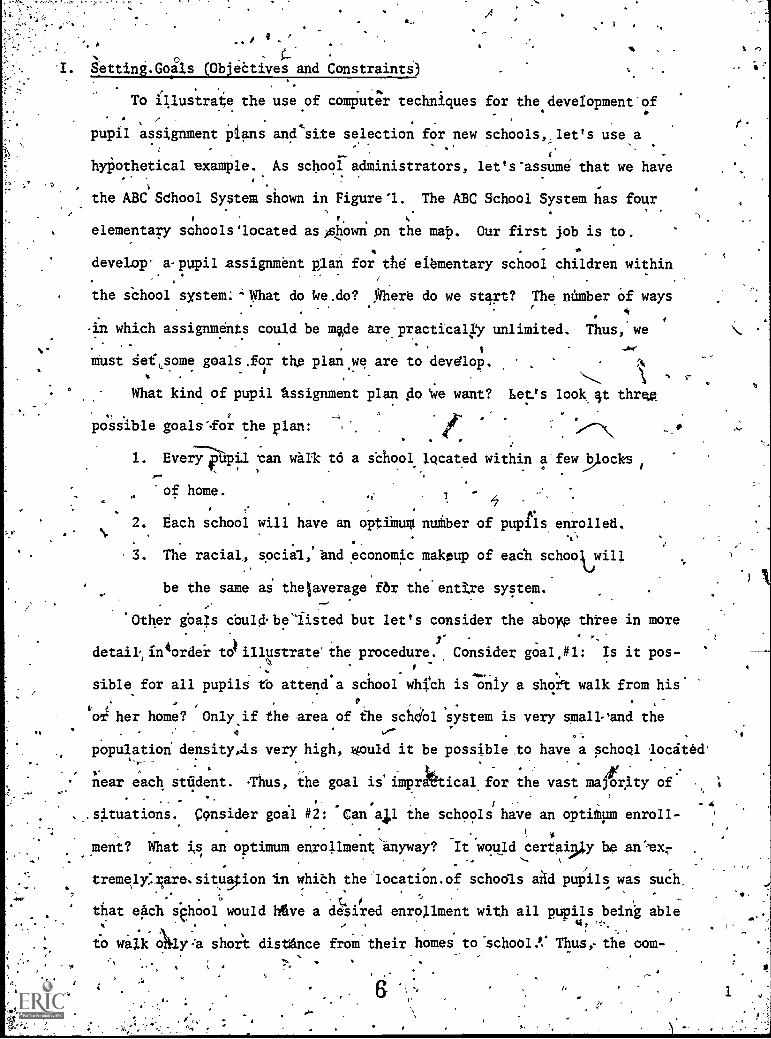
. Setting.Goils (Objectives and Constraints)
AI
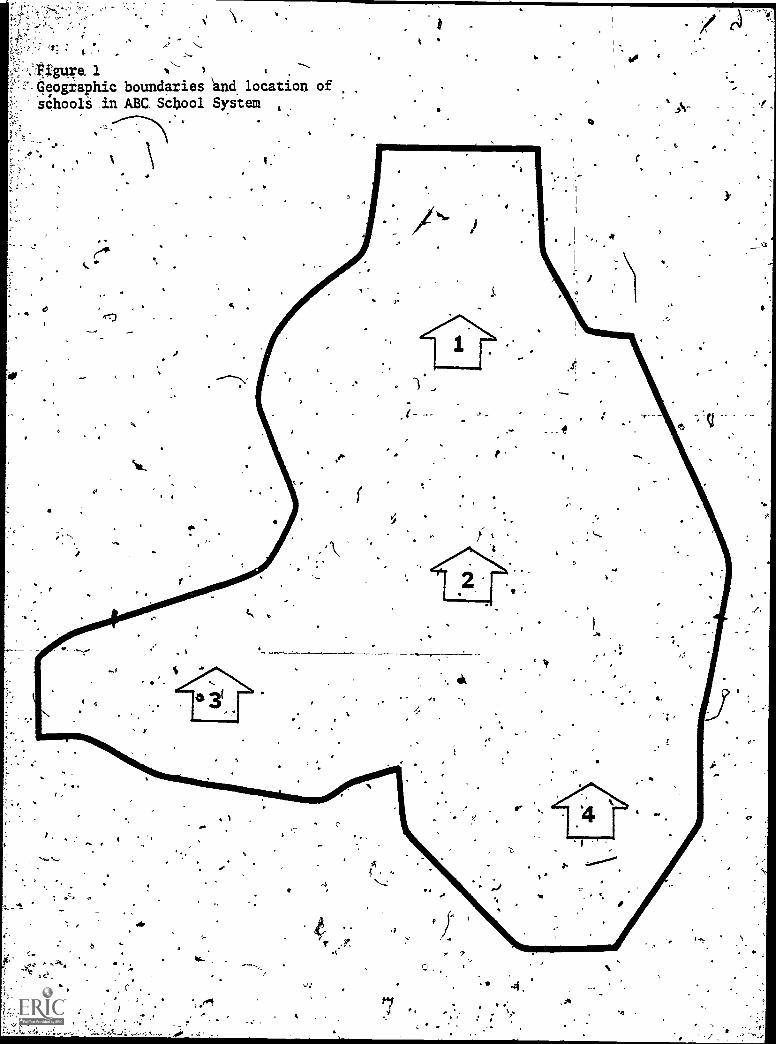
To illustrate the use of computer techniques for the development'of
pupil assignment Plans and`site selection for new schools,,let's use a
hypothetical example. As school administrators, let's-assume that we have
, 1 .
the ABC School System shown in Figurel. The ABC School System has four
1 f .
elementary sohools'located asAtiomi pn the map. Our first job is to.0
develop° a-pupil assignment plan for the elementary school children within
the school system;' What do ke.do? Where do we start? The number of ways
in which assignments could be made arepracticalp unlimited. Thus, we
, I
must set, some goals .for the plan Owe are to develop.. I
S.
....r-
\ ' r
What kind of pupil ssignment plan AO We want? Let's look, at threwP . .
possible goals for the plan:ilt-
.
. .--\,..,
1. EverTil an walk to a school located within a few,blocks,
of home..
,. 1 -
. . .
2. Each school will have an optimum number of pupils enrolled.
3. The racial, social, and economic makeup of eacli schookjwill
be the same as thelaverage for the entire system. .
'Other gbals cbuldbefisted but let's consider the aboyp three in more
''.
detail,in4order toPillusttate'the procedure. Consider gbal #1: Is it pos-
sible for all pupils to attend school which is only a sholt walk from his
i f -
or her home? Only.if the area of the schbOl system is very small -'and thev . ..
population density4s very high, would it be possible to have a school located'. . ,
AV.
near each student. -Thus, the goal is'imp4tical for the vast maYbrAty of, ..
.
. . . .. 0e f , '
. 4
.situations. consider goal #2: Can 41 the schools have an optiMum enroll-- . ! f
ment? What is an optimum entollmentNanyway? It would certainly be an'exr4 -- .
. .
.tremelyare.situagon in which the locationof schodls aid pupils was such,
,., :. . 0
that each school would Ave a desired enrollment with all pupils being able
'7I.
. or
to waikAly:a short distdnce froM their homes to 'school??' Thus,- the own-
, 6.
.
..
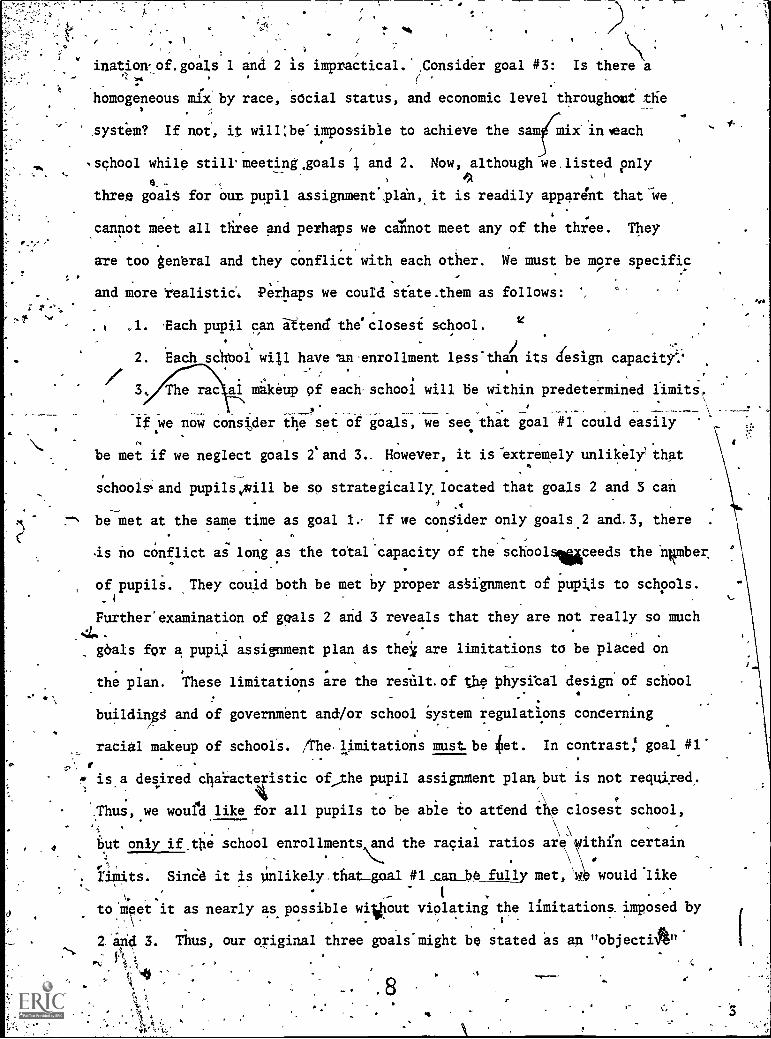
ination-of.goals 1 and 2 is impractical. ,Consider goal #3: Is there a,.. , .
( '
homogeneous mix by race, social status, and economic level throughout the
system? If not, it will:be'impossible to achieve the sam' in each
school while still' meeting.goals and 2. Now, although we.listed only
4.-
three goalt for Our pupil assignment'plin,it is readily apparent that-We.
cannot meet all three and perhaps we cannot meet any of the three. They
are too general and they conflict with each other. We must be more specific
and more 'realistic', Perhaps we could state.them as follows:
.1. Each pupil can ittend the'closesi school.
2. Each school wi],l have ftan enrollment less 'than its design capacity:*
3, The rac al makeup of each. school will Be within predetermined limits.
.
coIt We now consider the set of goals, we see that goal #1 could easily.
be met if we neglect goals 2' and 3.. However, it is-extremely unlikelyi that
schools- and pupils gill be so strategically, located that goals 2 and 3 can4
be met at the same time as goal 1., If we consider only goals.2 and.3, there .
.
is no conflict as long as the total capacity of the schoolswiteeds the ntimber
of pupils. They could both be met by proper assignment of pupils to schools.
Further'examination of goals 2 and 3 reveals that they are not really so much
goals for a pupil assignment plan as theii are limitations to be placed on
the plan. These limitations are the resultof the physical design of school
buildings and of government and/or school system regulations concerning
racial makeup of schoolt. /rhe limitations must.be fet. In contrast: goal #1
* is a desired characteristic of,the pupil assignment plan but is not required.1 .
..Thus, we w
but only i
rimits. S
to meet it
2. and 3.
I4oufd like for all pupils to be able to attend the closest school,
f.the school enrollments and the racial ratios are yithfn certain
inCe it is unlikely _that_gool #1 canoe fully met, W.
1
as nearly as possible wittiout violating the limitations- imposed byA 111.,
1 I
Thus, our original three goals'might be stated as an "objectilik"". .
would like
8k
.
/
and two' "constraints" as.follows: .
-
Objective : Minimize the distance that pupils must trav el,from their
-
omes to schools.
Constraints: 1. No scho J may have an enrollment grater than.its4esign
caphcity.
2. The racial PercentageS in each school must be within'
predetermined limits.V
7,
The terms "objective" and "constraints" are used by mazhematicians and
other scientists,to ddscrihe the goals and.the limitations of problems'and/-
their solutions. The "constraints" are the limitations which'jnust
__hy. _whatever solution is.. stbtain e d, _ The ...."zob j is, the' goal 'which. '
be met without violating the constraints. There 'can be only one objecti*&
but, there may be many constraints. However, the constraints. cannot conflict
with each Other. '4
Lets take a simple example which does not involve a schOol system.
,
Suppose we are planning an automobile trip from North Cakoli4"to California
and we wish to complete the trip as 'quickly-as possible. If we could take
a straight-line path for the trip and drive twenty-four hours a day at the
maximum speed which tA automobile Can reach, we would Complete the trip in
,
.,
.
A minimum of time.' However, there are some limitations which must be met.. .
,,
bur Objective and some posSible constraints may be stated as follows:.. .
s.' ( /Objective :. .Minimize the time rdciuired for v.` trip /frOin- North
. ,
Carolina to California.
Constraints: 1. Travel must be along paved highways.
2. Speed .limits and traffic Signals must V observed'.
3. Stops must be made for refueling. O 7.
'4. Twelve hours per day'must be reserved for meals and sleep.I .
Once,thp objective and the constraints are identified, a, route and-schedule
9
9
.
may be.determine&which minimize the travel time without violating theL.
constraints.
cP
4 iNow, back to he development Of 123.2k11 assignment plans. ,The compu;er
Robedures discussed in this' document allow the devel4Mpht of plans Ketch ,,\ , . ,
.
..
,..,_,61, meet certain objective's while complying 'with certain limitations or con-,
,
straints...114.opjectives which may be chosen by users- of these computer
procedures aregi§ted below.
-Alternative Objectives-: .
1-. Minimize the distance that pupils must travel from their 'homes to schools.
e (Includes walking distanced as well as i;ussifig\distances.)
. Minimize_ the distance .which pupild_must be bussed froN\their_homes to
schools. (Excl4des distance pupils wan.). c
., e
,. y --.
3, Minimize the number of pupils busied:. . .,-...-t-- ,
. . ,,
4. Minimize the numbe%Of pupils bussed away from closest school. -1.,,
,r
.
Note sthat only one of the above laisted objectives can be chpen for the '
.,_. , .. ,
deirelopient,of a:Particular plan. A different plan would be rdejeloped for( , . . c ,
4
each of.the objectives.. ,..
There are also a number-of constraints which may be chosen by users of
°
la4.
the computer, procedures They are Iidted below., .A
Posa,ible..Constraintd '- -t.,
.
.
1. No school may have an enrollment greater than its design capa4ty- r'
, . , \s. /-'N ,
2. The racial percentaged in eacg'school must be within'predeterminedi" .
. !..0/
No pupil may b. assigned to a school mhictiid more than a liredeteimined'
-distance fTom hit or het home. ...
.
4. No pupil may be bussed to a school which is.farther from his or her
'.'. :'.
d. . .,
home that the second closest school. C - -,
Note that any oombination:of the possibleconstraints maybe chosen,'- ,
i--:. / Zi-'
, . They matall.be-simultaneously specind for the development of a plan.-.... .
r .t
s. 1
. .3
II. Data Ikuiremil-s j .
j
e .
Now; let's assume that as school administrators in the ABC School06
/
System, we have,definakal- objective and constraints for the pupil. ,
± , ,
"-.--pignment.plaip we are to develop. What do we dO next? How do we get
. 0 , . .r I.
the plan which best mteets the objective? This is the function of the.
... -.
,
. 3,
computer procedures Aescribed.in this manual. -Once an 'Objective and °
appropriate constraints have been agreed upon by, administrators, ,they
pro blem becomes a mathematical problem which'may be solved i.Nng a..4Omputer.,
HoweVer, the systn must be described in. numerical terms so that the com-.
puter can make the necessary computations. This numerical description.A
involves data_gn_the.location_and_capacity Of.schools and the iodation and
Arace of'pupils. The school locations may be described in terms of X- and
Y- coordinates on a map while their-Capacity is'a'specification.of the
maximum number of pupils to be eftroiled. Each indlvidul pupil could also
be located*in terms of X-. and Y- coordinates ori'the'map and his or her
race specifie4. However, this.would require a tremendous amount of un-.
,.
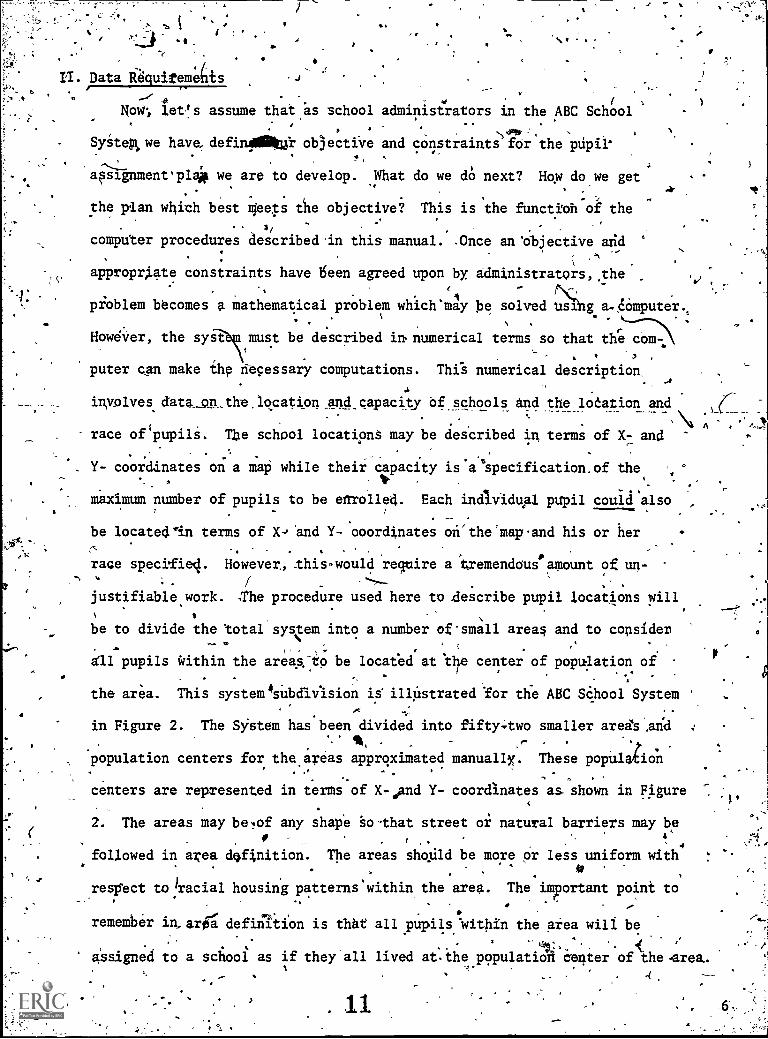
justifiable work. The procedure used here to .desc ribe pupil locations will
be to divide the total system into a number of-small areas and to consider
all pupils Within the areas.-to be located at 'tl7e center of population of
the area. This system4sUbdivision is illitstrated Tor the ABC SChool System
in Figure 2. The System has been divided into fifty-two smaller areis Aridf^
population centers for theareas approximated manually. These population.
centers are represented in terms of X-40.nd Y- coordinates as shown in Figure.
2. The areas may be.!of any shape k-that street or natural barriers may be13
. ( ,. .
followed in area Winition. The areas shorild be more Or less uniform with. ,
*,
,respect to 1racial housing patterns
.
within the area. The important point to,..
- .. 0 .
remember in,arig deflation is that all pupils within the area will be. . .
, .. { ..
assigned to a school as if they all lived at. the population. *ter of the area..A
. 11
r
. .. % II .
. -
. t k.7
. ..
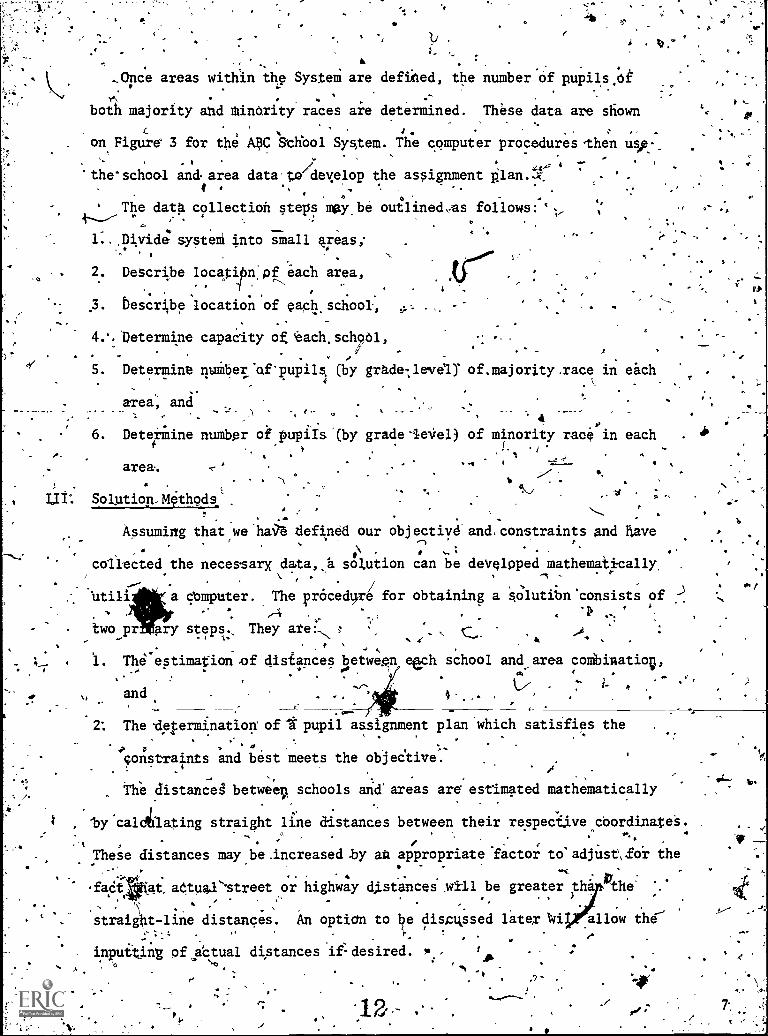
..pnce areas within the System are deflUed, the number of pupils.ok, . ..
,t' . ,, ',
. --
both majority and Minority races are,
determined. These data are shown
( , .
on Figure 3 for the WSthbol System. The computer procedures, then use
o'the'school and- area data'to dexelop the assignment iilan.Ji,k. ' .
, .
.
...
The data collection steps mgy,be oalined,as follows:.
'1,,.
. .
. :.
1. Divid; system into small areas;. ,
.
2. Describe locaitnof each area,.
. .
3. bescribe location of each. school., ,i... . -0
.
.. _
4.% Determine capacity of leach. schota ,.-
. -.
. ". - . , .
S. Determine nuMber'of-pupilsi
(by grade-levelI of,majority.race in each.
.
., .
area, and.
_. ..'-'
,- ( ...
..
......a
.6'
6. Deteriline number of pupiIs'(by grade-leVel) of minority race in eachf .
.C. -i.
' j ,,, .
area. ,. 1 41 4 I ,
4 s ' b . 44
..U.,) . 4 . ; 4Ur. Solution, Methods
. , .
, .. ..
Assuming that,we'hOZ defined our objective and. constraints and have
. , straiOt -line distances. An optidn to be discussed later Wi allow the, 4 .
..
. .
inputting of actual distances 'il=desired. is I
-
. 0 N..: .0
' Ie , a . . . 'If. :N' ...-------.ia.. ...,_ . ,I,
. . .... ..
collected the necessary data,.a solution can be developed mathematically, .
. .,-I .-%
., .. .
,
btili a computer. The Faced for obtaining a solutibn consists of .)...
.4 . ..; . 1' -, ':,..
,two pr ary steps. They ate: ,.
..
1. The-estimation -of-of disiances between eeph school and area conibivatio,.. . - ,
.-. .. .
and,,,--
. ., . 4s.... 0/4
,
2: The A.perminatioll of't pupil assignment plan which satisfies the, . _
., - -:
,p F ,constraints and best meets the objective.
/ ,
the distanceg betweep schools and'areas are estimated mathematically- ,
, 'by cali1ating straight line distances between their respective Coordinate's.
-
.. .p., .
TheSe distances may be .increased by au appropriate 'factor to-adjUstofor the_, . -
fact, at.adtua,Pstreet or highway distances will be greater th the- %..--
.
./,e
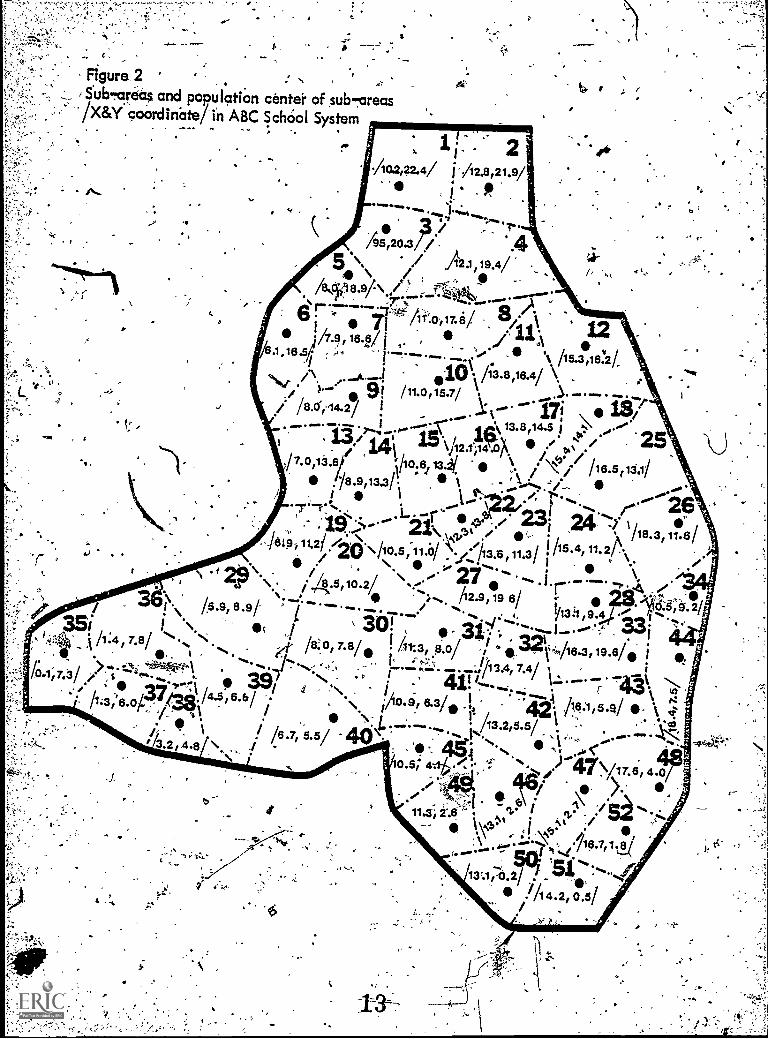
Figure2 :Sub -areas and population center of sub7areas
"M&Y coordinate/'in ABC Schciol System
*""" ,...... I...:...4 ---:-...
/5,./ , . .r.
.41./920.3/ /5 \ - ,/ .fi2.1,19.4/...< ..,,,-, , I°/84.18.9/:\ I ...,..1441.4t, .....--A -,.. ...---141 lrr.6 .7
..
.:fI. I
/4 0 , 1%6/ 0 .41
121:zi /a ,185§ ,;* I
."77 ' /154,162/,..0...i .id\ /;3.8,16.4/
/ /8.6,14.2/ !
18.9,134 /".
1\ 4,.5t ./
i .'
kh
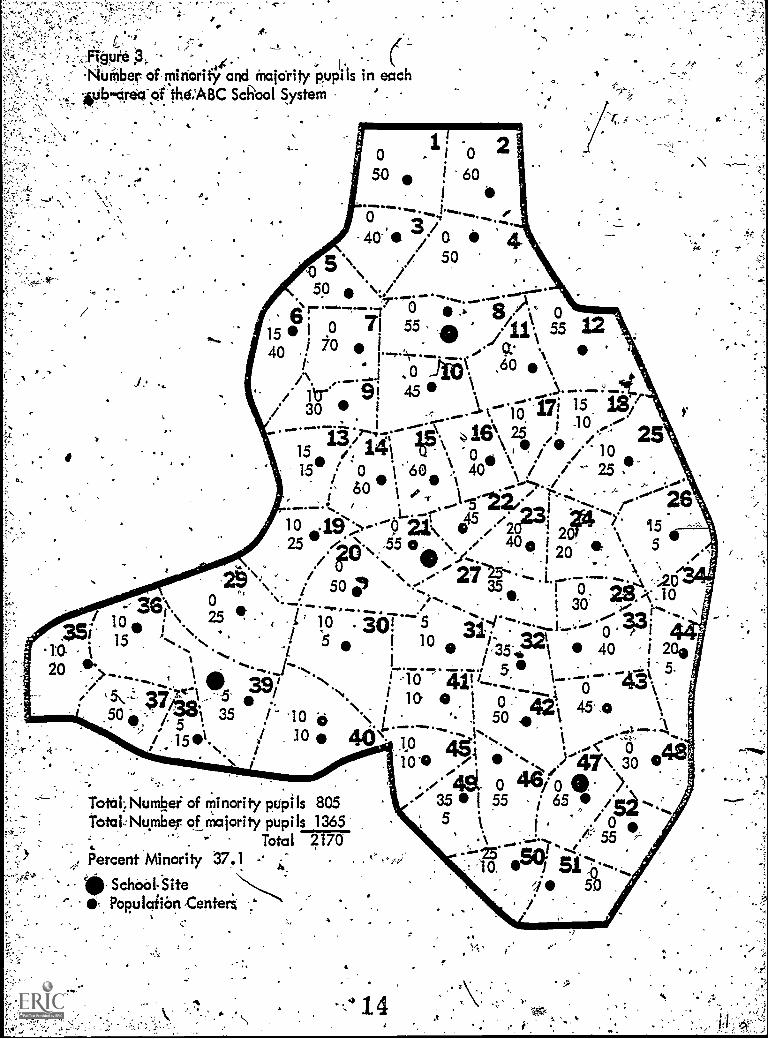
teP ,
N ibex of, minority and majority pupils in each441?-asap the:ABC School System
N .
20
4'
1
J
2936\ o
\ 25". \15
a- - $
I 0
501 0 2
601
-a
6--"*1*--./ .
-40' .
/ ,* 0 6 4../ / 50 ,-
150 .\../
S. '.7-A "ft...-. -...-- 1c r.----, 0 ., 8 , . t 0
15 WI 0 71 55 *.. Ai\ 5.5./40 .1 0 I 9: .i 1.-'rijfei # 60,........! ,- . \
30i 111-. 91 45 . \ ......1-7i is.,
. .,, .......-...t io ',..._...... ..,..) _.--,-- ,3 j -10 ..;13 / ,'";'; # ., 1.'1 dGI
15 / J.41 ` Ni . 1, .: . , \ 0 \ / / 0
15 . 0 I. 60 . 40 *, i i 25 7- ,
/ 60 i ...1.-,.-/*._.....,, , . . ,.... _'"is " 'r 1.5"22/./ r*". '-26
1 . -,. /-___,. ....L. -r 45 /. 23. ,..10 15' '.,-* 0 #31,6,,s,\ 20--4 20 15
, 25 / `- -55 0 . . I 5'' */ 40' 20 . \
\\ /* 501 35olow I
.41. an. ..
3° 213:c
. I 0
3 0. 30T 5
s5 1 10 ,/,35-4.32\ 40 1 2047.1
5.1. 39i N
,rIcf"" 4171 -.0
`. 10 I 0 42. 45
1510. / I° 40 io 4. .too ./. 47\ 30
-
. 0 4/0 4) >35 55 655 .1 0
5525. el,:
4 50/
5\ .,50 / 1 35 / 10 '\ t
.5 N I
..0 -
Total, Nurnbei of minority pupils 805Total:Number of majority pupils 1365
. Total 21704, Percent Minority 37.1 -.
0 Schaal Site-- PopulafiOn Centers
a
414
.,t
,...
47.
-0
The pupil.assj.gnmeht plan.-which most nearly meets the objectivs is
'.
determined by a mathemktical technique known,,?
as linear,
ptogramming. This.
...
technique allows a systematic determination of.
the possible assignment ,
plan which, best. meets the objective. The mathematical eqdations use for.
;.i.........
<describing the objective and the constraints are giiten,in Part' IV of this. .
- ,
al.k /manu ,
. IS,
*:1172\ Program Results; ,..
,
Now let's lOok at 'four assignment Glans developed for the ABC School.
. .
.System. i
Plan I
Objective : Minimize the distance that pupils must travel from
their homes to schobls.
Constraints: None. .
The pupil ssignment plan for the above objective with no constraints
is shown in Figur ote that the assignment areas are such that pupils
in all areas are assigned to the closest school. This _results, however, in
wide variations in pupil enrollment's and racial makeup in the famr.schools.
The enrollments vary from a low of 21S in-School 3 to a high of 760 in School,.
.1. The percentage of minority'pupils varies from 8.5% in School to 90.9%, .
in School 4. These results illustrate the necessity for using some constraints16 . , .. __
. . 1in ,the development of most Assignment plans. ,Numeriqszl values for each of.the
,four possible objectives are given on Figure 4. Note that the total pupil-
I A
. )hiles traveled is 3626.
Plan II.
Objective Minimize the distance that pupils must travelfrom their..
Mmes to schools.,
Constraints: No school may have an. enrollment greater thin its
4e4.gn capacity.
15
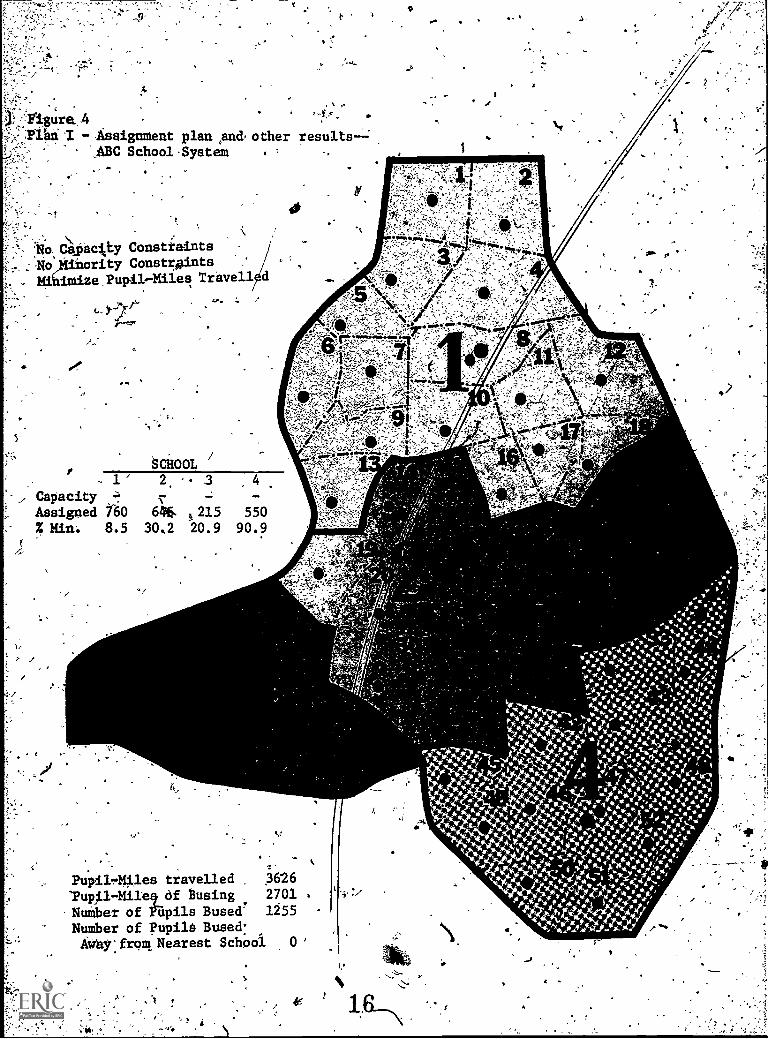
igure,.41ari .Z - Assignment plan And, other
..ABC School System
S
:No;CApactty Constraints
No Minority ConstraintsN3amize.Pupil-Miles Travell d
results-=
st
A
4,
/
SCHOOL1' 2 3 4
Capacity ---, V - -Assigned /60 646. 215 550
% ban. 8.5 30,2 20.9 90.9
PupilTeMiles travelled 3626
'Pup1-Miley of Busing 2701
NuMber of Pupils Bused- 1255
Number of Pupils Bused'Awhy:from. Nearest Schpol 0'
de'
a
10
..141..11.
I:..1..I
:*
4: :4-:;%
.. Ft.r41.7aia..* .,.1
4A -3 . ,.. .
0 440a4,134F77:::7:44,.
VI^
.Z.::::::*-* 1 a
:-141.Plk... 1. 4 a:
*-4.** *
\,
4**4.,41.44
4.4444-4-**.**444*-11.12:44:#411.
....-
4,4-4
* i 44 4.4la
*4 44 40/ 404 *4 a 4 4.41
44.1.44.4471"
4-51,* 4' s' *IP 4 4
?,,,,,0 4,-* k 4
441,..... 44, 4 4.4i).4.44-444;4 " 1t4.4 04 velt
*. 4,44.**, `,4 *4 * 4
........,......1,1,0IaI
1 4. * 4-4,1 le-4 4
44 4-4 a. a"., l a pit-411.
t .,
I _ , 4.1,141,..
la **la* 1,{s *law
l* I.4a 4, a}, ahlt
a. 'P
L 4 0 ..aIa.
7,4.4.1)
Airps.l.pa,aal 4. ,a` 4......
*4 4, IR `a, .0.
IP.4 4 41
I 1, *÷41.....:
'.4 ii. --42.1
i( p 1
dfr..-4,44-.04A
-
T. 4,44444 '
4*.4.4 t 4.4.1.4
4"4.N
A.
4**,44:4 1'*4 T
ut A 4
)44%44:7"fr"11....r
f*-1,` 44 4.,
4444
.....2_4..44
:,i,i.
44 414-;74.417:rw,,,,,*4,1
'4I't4
44*4,1,...,4* 4,,,,,,
---11.174.44.4,0
-4, 1,44h If.*
,*-14,
74* I, 4, 4'
4,4 *44.4r0.4414.-%
1
4-1,40a, '41i.
Nik
.A
.4. 4 *0, Ita.-.4.
,h.,' 00,4.40,*
1"-
-;-'''' f. 7,...
.,4-5,
_-...4.-
,--,-
Ii
, 4.
..,4.30
S., .-4
'0a)..
0-.
,a)
a),--4
*.i
. -.
El
,?,
?"ca.co
$4.0 a)
-.$1
14.s
P., d.C
O *04
u'l----
0j/2A
rLul . CO
CO
44V
4-4M
C!
.4.1.1 -$
'Tco .. -.
.....
,....
0. 44 4344'..-..
fg .1 54i
4#- ,4-i :.
- '>
114.
11).
.
....
-C
- A ,,1::
Aco
'1....,48$
64.1,44,.,'rl'A
*-1°-'-'''''
22'...
,.
Fur04.
5A
,.
.44 '
0 03In InIn tri
'
01
.0 InIn O
N 0
0%c-)
cy)
00Cr)
'0 0 0crl 0 cN
1--.101
N
-co 01 10
csi 0 IDq)N;
4
0 0 crri 0 0
%,0
c'4'
4
Oaf
0 41
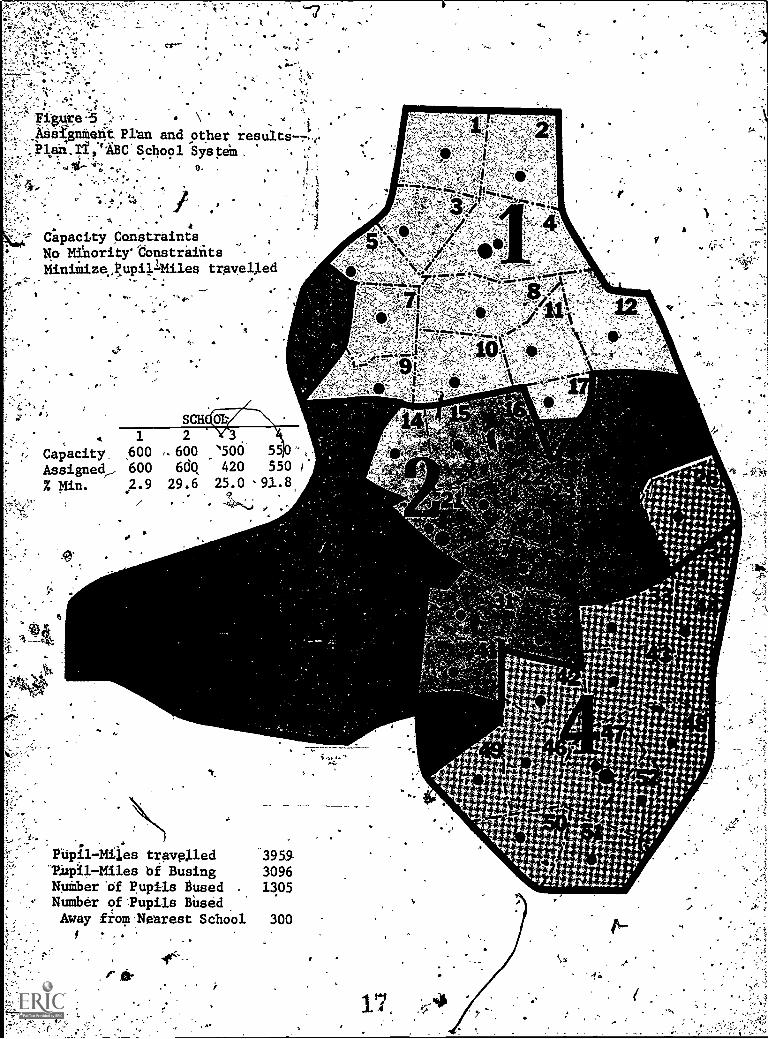
,A plan for the aforementioned:0W iist:and constraint is sham, in ,
. .
Figure 5. Capacity constraints of 60q, 60.0, bu0;and SSO have:been Oaded
on SchoRp
tO'Sch6,61s
, ___) ... .
pupils- t .1 ..:t°f, 2, 3, and 4 respectively: Thusl.fewercan be assigned
.
iL.1 add,'2- and more pupils'-mUst be assigned to School 3. Note that ,
, .../, . 0 .. , - :..,
-...
., , 6 . ,, ." . , .,assignment zones for each school are aade up, of` contiguous areas in Most
1... /
cases. Assignments are made such that chools 1, . , and ,4-. are 'At' capacity,,..
'ti
,,,
, .
'Whii% School 3 absorbs. all the extess systeu' pac y withe-onlr.420 pupil's
enrolle . The range of percentages of minority
is even larger than in Plan I, varying from 2:9% in School 1 tb.:91.8%in .
/ A i, %.. , .
School 4. The pupil miles traveled have increased from '3626 to 5959,,the
ools
.pupil -miles of busing havtincreased'from 2701'to
pupils bussed/has increased from 12,55. to 1305; and
3096, the ngber of.
the number of, pupils
lawaylaway from the closest schOol has increased from 0 to
Plan III '
'ObjectiVe : /Minimize the distance that -pupils must travel from ,.
/their homes to schools.
Constraints:; 1. No-school pay have an enrollment.greater than its
// , -
... ,
design capacitvV $
.
2. The percentage oft minority pupils in .each schOol
. . /. ,
must be between 25% and"50%. 'A
.. . i
ft,
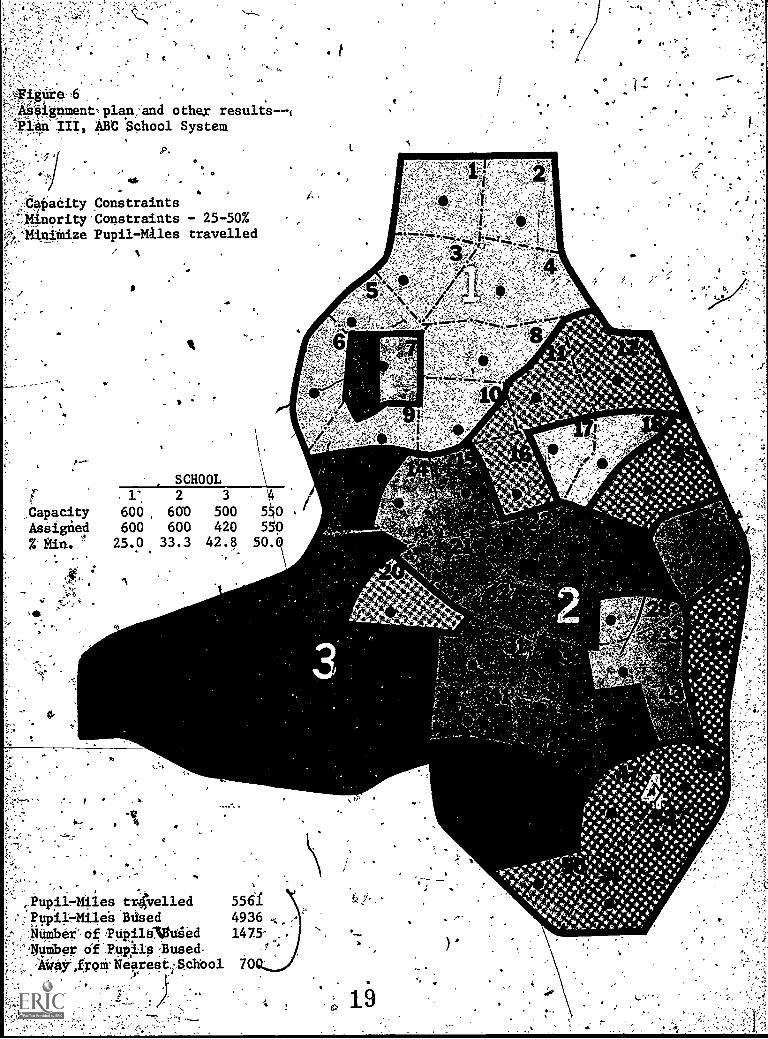
'Figure 6.. 4
- -
eachconstraint of from/25% to 50% it. placed on of.the four schools in,,,,, , i
,os'
addition to,the capacity constraints. Note that now a number of satellite
areas are necessary in order'tOgivethe desired racial balance. For example,
pupils in area 7 are split between Schools 2 and 3.rather than being assignedi
4 \ .to the earby School 1. The attendance zone ftot School1 includes a satellite
..
. 4
illustrates a plan for the ABC School System when a racial
410
consis g of areas 17 *and 18 an4 a second satellite *consisting of areas 26,
of 43. The attendance zpne .fOxSchoo1.4 includes-a satellite'
18
411/
.tsH. 1:130 OD 0
CD rt
Ui CI\0 0 F-A0 0 0 '
a% a%0 00 GS
N
PN 4- InN 0 LaNoo 0 0
0 t.nCri-Ur---00
00
(0 0 0'..,i+-o
"co . :00' .
'111n'g 4 4 ,H1 Cr.
It 6 c. rs. ,
o o o .11ms :o1-, co co
cs t--.
... 1 it it 4 -ovI. rt rt.z to to
1-1 0 0 1, o 0.CD re rtCO Co co
- II 0. cn rt0 IPI s ,4 WCo NI 4 gC Ui .
CD
Iii 11CD I
1III tit0 Co
uiCD :>20. IIrt
cnII
v
Co
4
6
° e's"
," pupil-miles of bussing have increased from 3096 to 4936, the ndiklr of pupili
y.
,,.. ,
C6nsistingiof:area.ZO, a second satellite conisting.of area 25, anda,,, ,, , :., __J
third satellite con'sisting of areas 11, 12, 16, and part of 10.
41. ,
.. % .. 'i
'tfie plan shown in Figure 6 results in a minority percentage in School .
,O'f.=',. ',
1,atthe lower?limit.df.25 and a percentage in School 4 at the upper limitq..
of 50.' The liupil-milet traveled have .increased from 3959 to 5561 the'ti "
,.,f.,bussed has increased from 1305, to 1475, and the number of pdpils bussed away -
. .
t from, the closest school has increased from, 300 to '700.
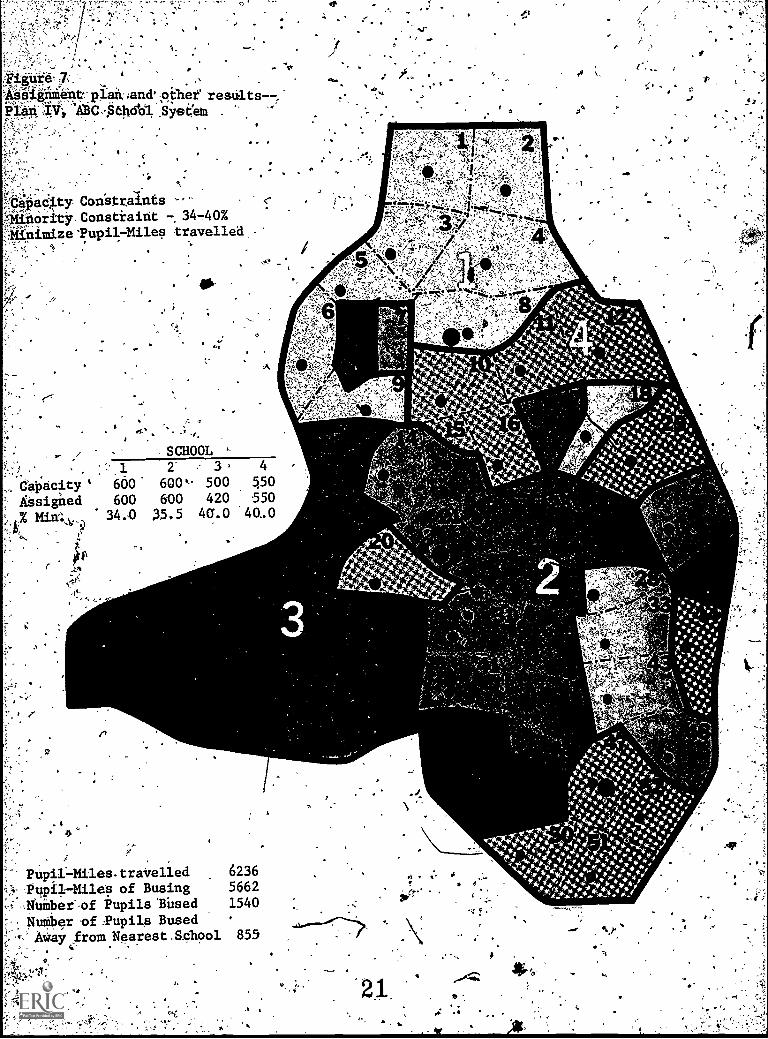
'Plan IV
-
Objective Minimizethe distance that pupils.must travel
from their homes to \ychools.
Constraints:l. No school may ha;.re an enroldlient greater than
its design capadity,
2. The percentage, of minority pupils in each school
must, be between 34% and 40%.P
.6*.
Figure 7 illustrates a plan in which the'alloqable range in-racial0 ,.
percentages has -been reduced to 34% to 40% minority pupils. A compatison'
ofligures 6 and 7 reveals'that the plans are.very similar buethat the
satellite areas haye primarily increased size. School 1 continues to
,5have the p west allowable minorit percentage of 349611:411ile both Schools 3
;-
and 4 have the maximum allowable nority percentage of 40%. The pupil-'
,miles tra\reled have increased from 55
have increased from 4936 to 5662, the
o 6236, the pupil-miles of bussing
n ber of pupils bussed has ,increased
from 1475 to 1540, and the number of pupils bussed away from the closest.
school has increased from 700 to 855.
Sattaw of Plans I - IV
The assignment plans' illustrated in Figures 4-7 are the plaits which'
minimize mathematicallythe pupil-miles of transportation in the total
20
.
A
t
.
n
0
F-
I '''1
CO
4.) .
. .. 1
Ili'.. .44 i 1T 0) .
V
r0
eft $.4
-Li0)
4.)0:1
y.0rif
g ri rle0
$4 44 I
JO ri0 1100 0 94
, r+1.1 1.1 N
; d 6>.'g 0,14
*404 .14, 0;',Ovd,
6tr)
CD cD CDul
C;
CD cD CD0 .M
CNI O 1110 .t%.0 in CO
0 in 1-1
CD CD ulN4cDD .0 trt
0 0 Q0 0
fly' 4.1
-;
rl.ta. 03 Ai
tCg '6 IA.761
sYSte
laps howeveri
cons dared
.0
4.tt
..!Qs
sUbject to the fisted constraints. there may be features of the- ,
Which are unacCoptable fox:reasons which have not been :. 1
9A
Computer' solution. example14 point might be the'. / .
,
assignment of pup ls in, area. 7. in Plan IV (Figure 7) . Area 3 is divided-, lr
.. 1\ ,,, .,4,, ,
,4;,;
., .
beeweenSchools 2 and 3 rather than bei4 dssiped to nearby School 1,4,
.. : vq' .
Table P.reveals that area 7,ha4,70 mifority'rilce pupili-and no minority.,, .. . ro
race pupils. These are ,mok assigned to School dile to the difficulty/ ,1, , 1
. - ,t,3.in aihing tie minimum allowablegPercentage,ot.minoriiy pupils there,
,. b . 0 c
HOwever, splitting area 7 between Schools 2 and 3 does,not 'id= desirable, ,
.,,.. ,..
since two satellite areas,,are formed., neither of which hasenough pupils,
,..
next.
to fill a bus. In the section we WilllOok at some ways to make
. -
meet; :
.4alterations An the plan to meet Criteria which cannot, be r diteexpressed
--,-, ..1 e-
mathematically. .
- , ,.,
,,. a ,,
, I .
Other areas in Plan IV (Figuid4) which may need..further inspection
include areas 17, 18, 204' 25. 34,boand 44°.". -If the-number of - 'satellite,` '.
,
,....., .,v. - ,': ° ' ik .4* .
..
or other aesthet features of the assignment plan,gf - '
,, , - ..%
4 "-.
411k, .
areas Can be reduced
improved with only a small effeceon the stated objective, these probably
should be accommodated..
V. Prograth Options.
.4,.,
In this section we will,consider some offtional features of the computer_ .
..
. , .
program whichmay be used in the ddvolopment,of impil..assiggment plans., . .
) el "Some of these featurs will be used to improve9Lhe'planifdevioped in the7
S
previous section ifoie giCEhOolSkStem.':: 44,
4
1. Input Actual DiAances ,
ce . ,.
In Section D we stated that the distant'es..between schools and areas
were estimated mathematisally byjcalct24iins the straight line distancts
between their respective coordina 'tes. This straight line distance Was then
4
increased by an appropriate factor in order to 4proxikete actual street,* ,-
A
22-
rv.,!
,
Or highway distance's. This procedure for estimating distances will be_
I.-
satisfactory in most cases but these are situations in which the calculated
distancds will-be unrealistic.
Let's again'use the ABC Sthbal System to illustrate a situation'in
which it might be desirable to input actual dist ces rather than dependf.
on the'calculated values.
areas 45, 46,.49, .50; and
Consider theistance between Schoo13 and
51. The'straight Hie distancps would be Along
lines which pasgthrough an area outside the School2System. Let's assume
that'area contains some natural (river,'lake,imouniain,etc.) or artificial
(raile6ad, park, eta1 barrier which makes a out along approximately a
.
straight line undesir-Ab e or impossible. Then we might provide the .computer
with actual measured distances by a feasible route. The actual distances
. may be provided for as many' or as few area tb school Combinations, as is.
. desired by 0.anners: In the plan to followr for the ABC School System \-1.t
willbe assumed that in order to travel' from School 3 -to areas 4S, 46, 49,
50, or51 it is necessary to go by way of area 41. Measured distanCes,for
these routes were provided to the computer.k
Plan°
bjective :Minimize the distance that pupils must travel,
, from their homes i3 schools..
Constraints: 1..No school may haveAnlenrollment greater than its
design capacity.
1.92. "The percentage of Minority pupils
-
in each schoolIF
_
must be between 34% and 40%. 43. Acutal distances are used from Sglool 3 to areas .
,".4 f 45,. 46, 49, 50, an45,
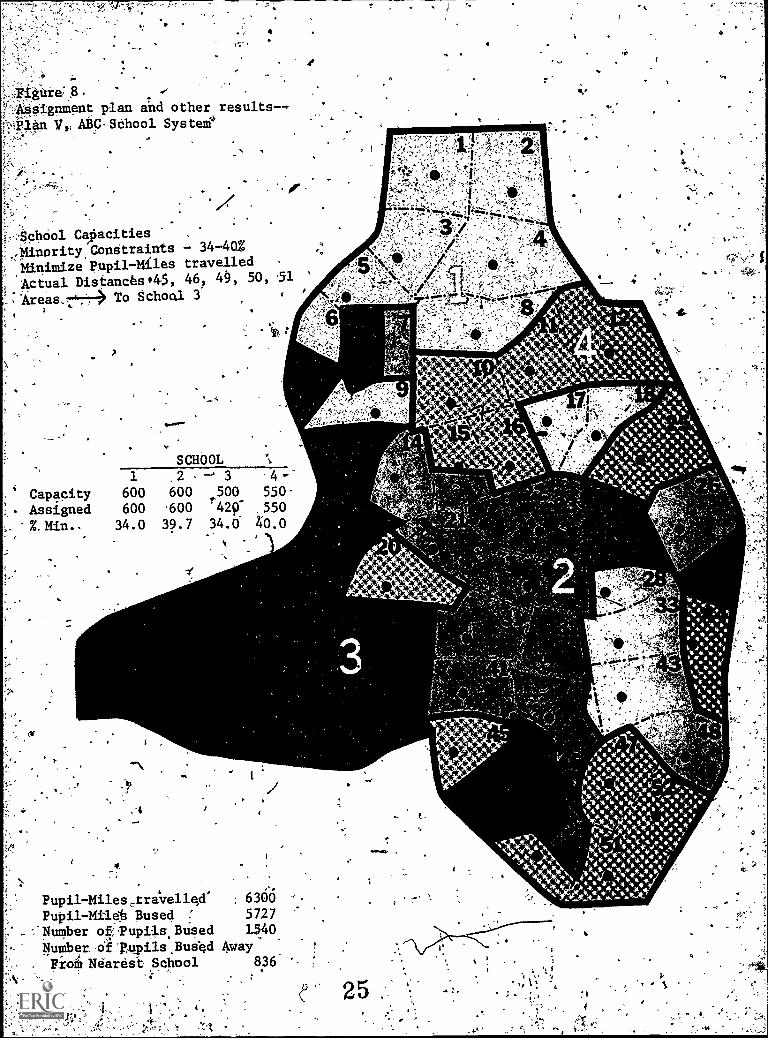
Fie6e8 illustrates a plan for the :ABC School System in which thet
actual distances for the listed areas were4used. The .objective and con-,
4
a
23 ,
,
.
itraints were otherwise the same as In Plan IV,
(Figure 7): Note that area_-u
AS is no longer assigned to School 3)ut becomes a satellite area of School'
:. t. Comparison of 'Figures, 7 and 8 shows that Plan. V is similar to Plan IV.
b there are minor shifts in the assignMent areas forall four schools. ,
, ____ ,.. ..
..,.
School 1 continues to have the.lowest allowable minority percentage of 34%
, -..-)....
.____biltnov5chool 3 also has the minimum percentage. School 4 continues to. .
\ ,
minority. - . . .
*aye the maximum i percentage of 40%. The pupil-mileS. --(
traveled have .r
, ..
.
increased from 6236 to 6500, the pupil -miles of bussing have increased from7
.. .
- ,
5662 to 5727, the number-of pupils bussed was, unchanged, and the.number of
_
4 l.
,
-,
13upils buss o away from the nearest school has actually decreased from 855 °t
.'.
to 836.A.
2: gliMination_.
Selected Assignment Possibilities
Plan V,(Figbre 8) has a number of rather small satellite area'which
are undesirable..1,
We will now use an option for eliminating,selected assign-. 0 -
4
o . .
onients in .an attempt to-imprOve the aesthetic qualities of Plan V. We will. 2
look at a seties of six restrictions to make 'Plan x'f,morl acceptable. First,
let's see whaf'will happen if we prohibit the assighffent of pupils in area j
7 to either School 2 or 3 and prohibit the assiment-ofpupils in areas .
17 and 18 to School 1.
44 Plan Va
T, ,. .
.
Objective :- Minimize the distaftee that pupils Must travel I.
from their,homes to schools.
Constraints: 1. Nb School may have ah enrollment greater thanN,
its' design capacity:
2. Thp percentageof,minority pupils, in each.
' school must be between 34% and 40%.
3. Actual distances are used from School 3 to
areal 4S, 46, 49, SO, and Sl.
24
O
.:
iUte:8.SSignment plan and other results-,
An V, ABC.SChool Systems-,-,
'School CaOacities',,Minority. Constraints - 34-40Z
Mfnimize Pupil-Miles travelled
Actual Distances5, 46, 49, 50, 51
Areas,74 To School 3
4,
4s
.
1 ,2 3 4 -Capacity 600 600 500
f429-
550Assigned 600 600 550
:.Min.. 34.0 39.7 34.0 2o.0
4
Pupil-Miles,travellqd' : 6300 '
Pupil - Mile' Bused 5727
Number of.Pupils.Bused 1540
Oumber,dilawils Busted Awaygio0idaresi.Sohool 836
25
4rr ' .'
. -
4: Assigninentt, of area 7 to Schboi.
2 or-3 is. .4
4g
.
.4t
t
1 i ., r Ite
prohibited. .
I : -%' 116 "F. ' '/' *o.< :: '''5.'Assignmint of areas 17 and. 18 to School 1: , .
. its prohibited.
Figure 9 illtittqgteglhe results'fO?Plan Va. Note that most ofI' % ' . 4,'. . r. .. . ..---, .,a ea_7 -if now assigned to nearby School 1 whilp a small portion of the
,..., .. .
.......
4p . area joins thevilready existing satellitegrea of School 4. .Areas 17
j.i.
,and are now assi*ne to School 2. Compariton of the std: stics fdr
Plans' and Ara shm4s 'that the traveled have.incieated from
ave'increasediiom 5727 6,5782,.,.
, .
.
the number 0 pupils bussed is achangedPand the number of pupils bussed.7,
, .,
_
. , . awayfrfrom the nearest school has decregsed from 836 to-822L-. "
., ...e
The next step in our atiempt to ippfOirethe assign:1.1qm plan will De 'V.
M'
. I igto prohibit the assignment of area 45 to School 4. This is prohibited st.
.
.6300 to 6356, the pupil-mile9 of
Oilnce there are only 20'pupjils in ax a 45 ina the'are al,does not join any
other'area assigned to School 4.
,
Minimize the distdnce that pppils must tri;tel from *-
their homes to sc
Constraints: (1) - (5) Saud as
t6) Assignment of area 45 fa,School 4 is prohibitek
t
10311ustFates the retplet-forPlan,Vb.' Area 4S is in,;gnaassidiEt
.0
to SCliO01' 3 and the 'number of satillite areas has been reduced by one. Tlie
40t.
statistics indicate an iiicr as$, of oni,y 3,pupil-miles' of transportation and
.
', pupil-miles of bussing while.
5 additional pupils are bussed away from the. ., .
earest school: -
i
.
,-
1 t .
...
Our nex*step will be to prohibitTthe:assignment ofare_a_tito School: 4.,
f. ..
4' 4,
2_61
0
1.
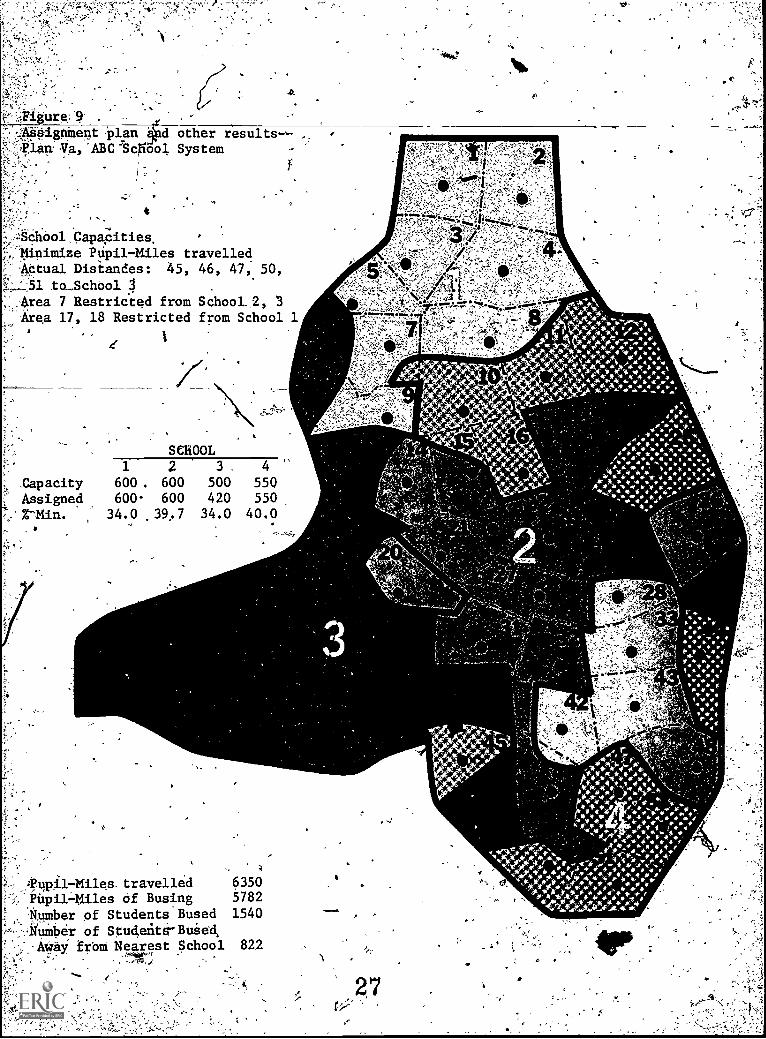
OignMe4i :plan id other results--an:la,"ABC°S0ool System
chool,Papapities.'Minimize PUpil-billes travelled*Wel Distandes: 45, 46, 47, 50,
to_SchOol 3:;,,Axea 7 Restricted from School. "2, 3
17,Area 17 18 Restricted from School 1
1 2 3 , 4
.Capacity 600. 600 500 550Assigned 600 600 420 550
rMin. : 34.0 .39.7 34.0 40.0
Pupil- Miles. travelled 6350'Pupil=011es of Busing 5782
,Number of Students'Bused 1540
4uiriber of Students" Bused,Away frbt Nearest School 822
111.
27
Ob'ectiVe : Minimize the distance that pupils must travel from
their homes to schools.
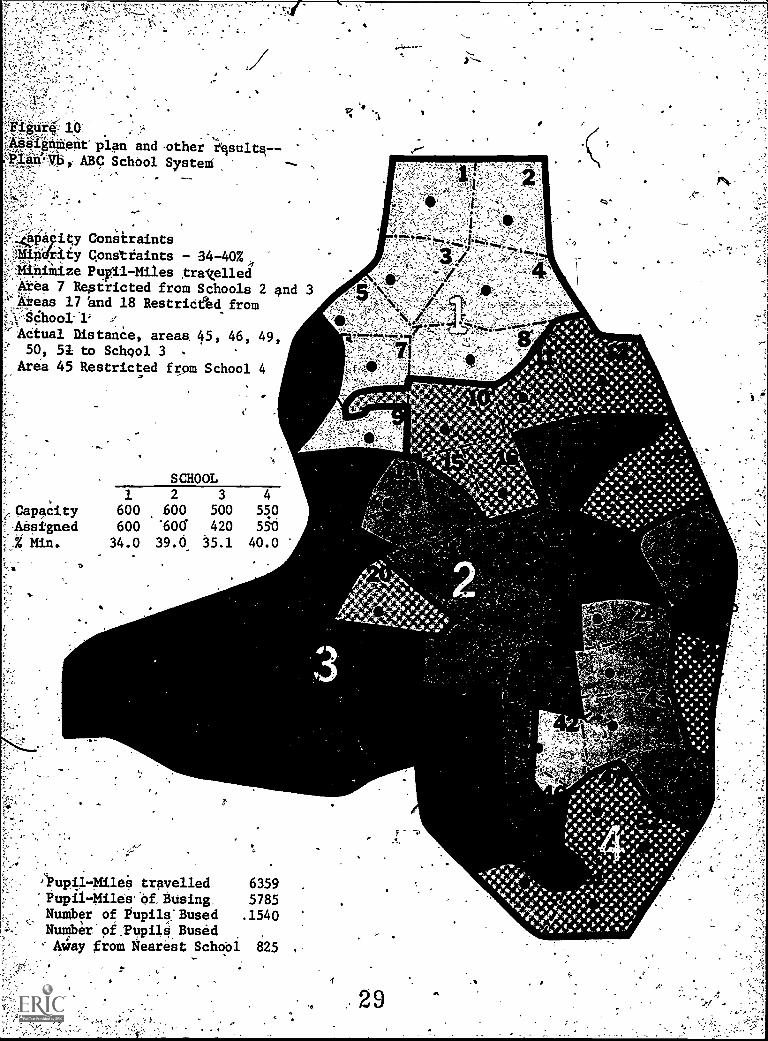
Constraiiiis: (1) - (6) Same as Plan Vb.,
/(7) Assignment of area 44 to School 4 is prohibited.
Figure 11 illustrates the results for Plan Vc. Area 44 is now assign-
ed to School 2 and the number of satellites again reduced. In this case
,the pupil -miles traveled have increased from 6359 to 6406, the pupil-miles .
of bussing have increased from 5785 to 5819, the number of pupils bussed,
ifhas decreased from 1540 to 1525,-and the number of pupils bussed away from
the nearest school has decreased from 825 to 790.
Our next step will be to.prohibit the assignment ofpupils in area
20 to Scliool 4.
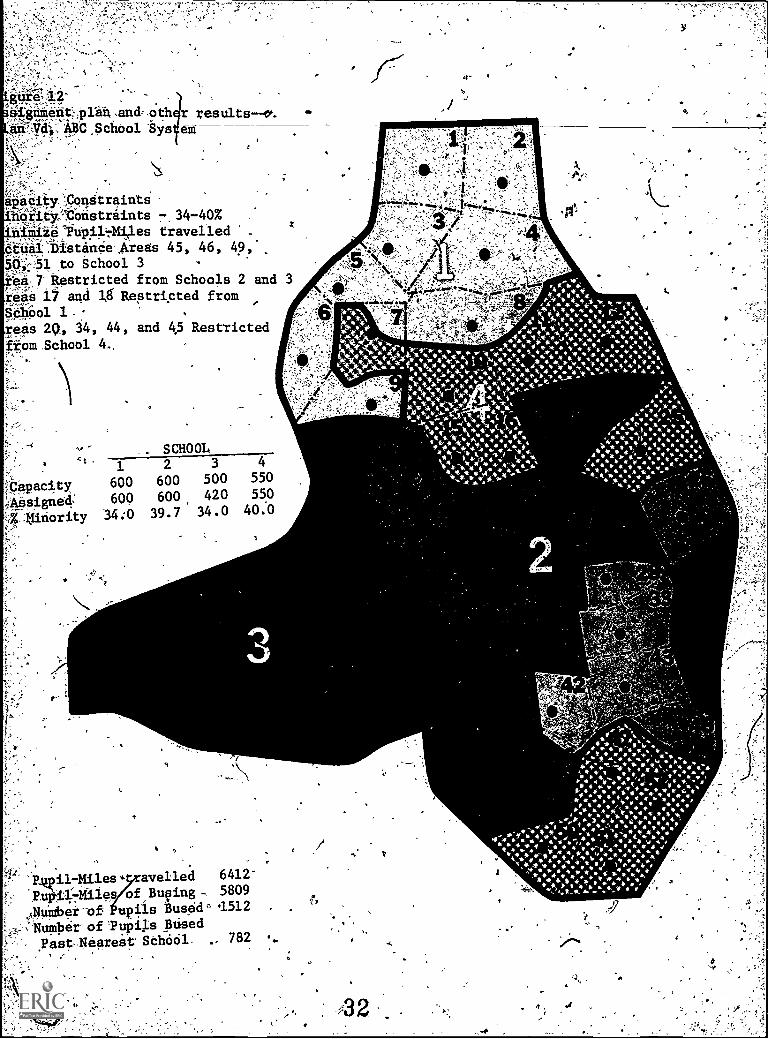
Plan Vd
Objective : Minimize the distance that.pupils must travel from
their homes to schools.
Constraints: (1)' - (75 Same,as Plan Vc.
(8) Assignment of area 20 to School .4 is prohibited.
Figure 12 illustrates the results for Plan Vd. Area 20 is now split
between SOloolA2 and 3. The pupil-miles.traveled have increased from
6406 to 6412, the Pupil-miles.of bussing have decreased from 5819,to 5809,
the number of pupils bossed has decreased,from'1525 to 1512, and the number-
of pupils, bussed away from the nearest school has decreased from 782_ to 762.
The fifth step is to prohibit the assignment of pupils in area 25 to0
Scholl 4.
Plan Ve , *.
Objective- ; Miniilize.the distance that Pupils must travel from
their homes to schddls.
. tE3
-:1O.
g'4ipiit' plan and -other ritsulta--ABC School SysteM
ity Conilbraintsr4.4 Constraints - 34-40% .
niiaize travelledea 7 Reptricted from Schools 2 and 3
Areas 17 and 18 Restricted fromSchool, 1'
Actual DistanCe, areas 45, 46, 49,50, 51 to School 3 -
Area 45 Restricted from School 4
'',
SCHOOL1 2 3 4
Capacity 600 600 500 55,0Assigned 600 "601 420 550Z Min. 34.0 39.0_ 35.1 40.0
u p 1. -Xi 1 e i; travelled 6359Pupil-Miles. of. Busing. 5785Number of Pupils, -Bused .1540Number' of :Pupil* BusedAWay from Nearest School 825
1
29.
*0*.and-Other results--
A14.S,Ohoo; .Sys tem
agagity Constraints*ri*yConstrailirs = 34-40%Iiii Mize Pupil -Niles travelled
cinal. Distance Areas 45, 46, 49,
50, $1,to School 34rea 7'RestrictO from Schools 2 and 3_Areas 17 and 18 Restricted from
School 1:Areas 34,44, and'45 Restricted
lila* School 4
i'At ***40.4:1;1?..m10") F07044 El
4R 6* 0..164
*"4,;1"_ - ,-......,...
tk I`.0 0
1 2 3 4
Capacity epo 600 500 550
4ssigned 600 600 420 5550
Z Minority 3440 39.0 35.1 40.0
-5,
4tr.4!Ar,-
*.*0 IP10*00,1
RupilMiles Tr.Riipi3Mi).es. of
1110her-of-Ppl)
14uMher of :#4
-'Away "from
a
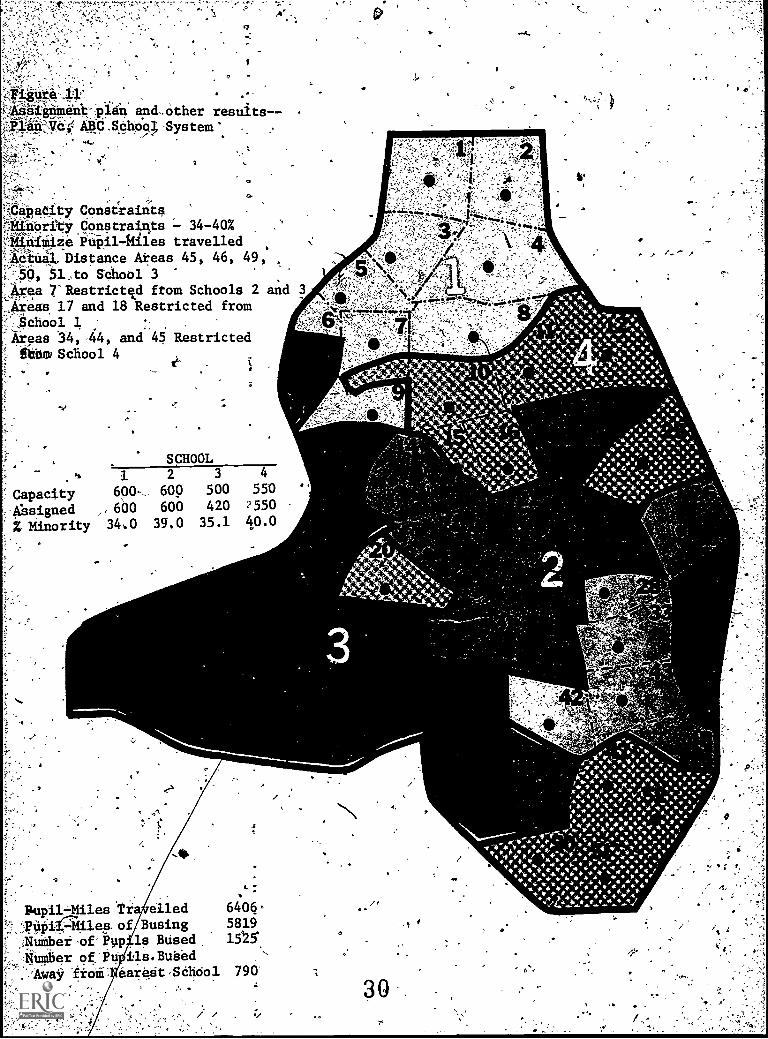
.Constraints: (1) - (8) Same as Plan va.
;at
(9),Assignment of area 25 to Schoch 4 is prohibited:
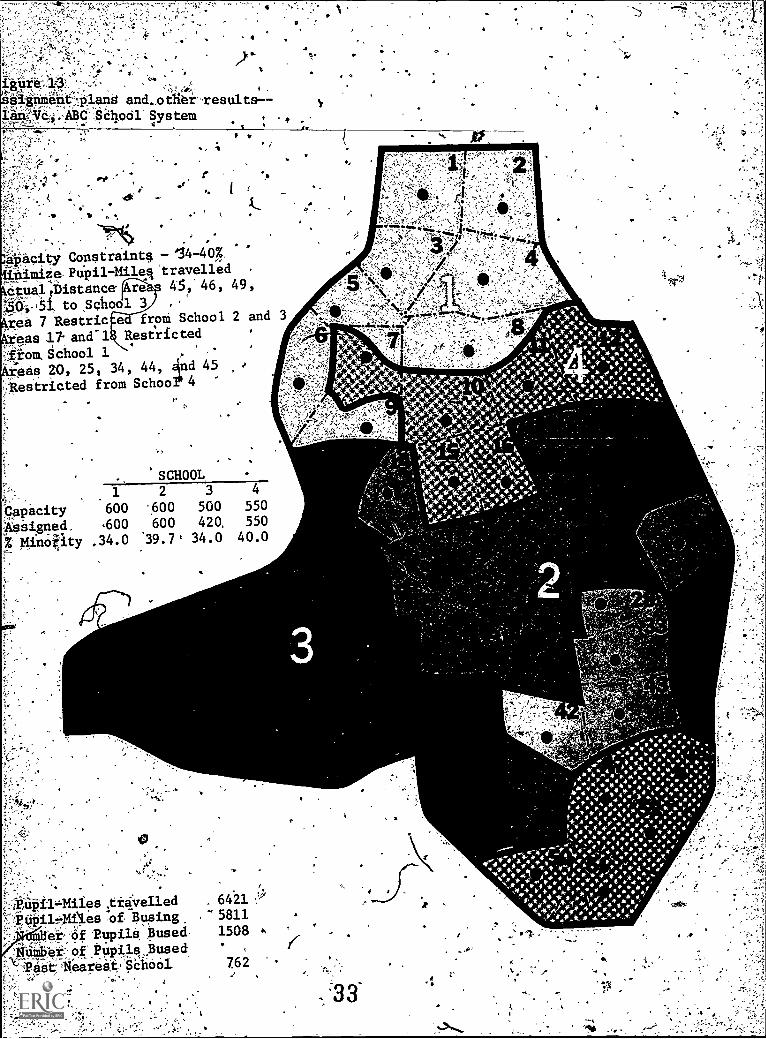
Figure 13 gives the results for Plan Ve. Arba 25 is assigned to area
2 along with its adjoining areas 18
have now beeiireduced to three (one
ison of the statistics, for Plans Vd
and 24.; The number of satellite areas
each for Schools.1, 2, and 4). Compar-
and Ve indicate that the pupil-Idlest
traveled have increased from 6412 to 6421, the pupil-miles Of bussing have
increased from 5809 to 5811, the number of pupils bussred has decreased from
1512 to 1508, and the number of pupils bussed away from the closest school'
A Kai decreased from 782 to 762.
Our last step for improvement of Plan V will be to prohibit the
. .
assignment of areas 34 and 44 to School 2.
Plan Vf
Objective : Minimize the distance that pupils
; their homes to schools.
.
must tra 1 from
.
Constraints: (1) - (9) Sames as Pfan Ve.
0_(10) Asiiignment of aAaS'14 and 44 to School 2 is
prohibited.
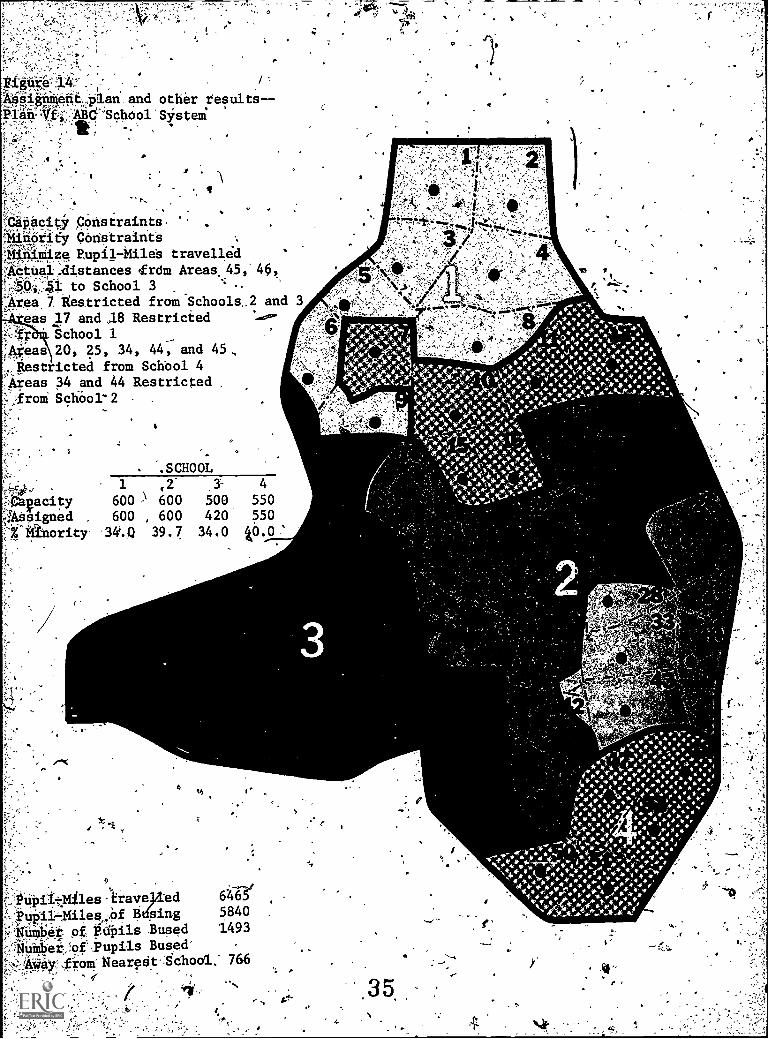
Figure 14 illustrates the results for Plan Vf. The number of satellite
areas has now been reduced to two (one each for Sdhools 1 and-4). The re=
main ng,satellite areas Consist of several contiguous source areas haying a
suffic t number of pupils for development of efficient bus schedules. The
es traveled have increased from 6421 to 6465, the pupil-miles' ofpupil-. . k
bussing have increased from 5811 to $840 i7, the number of pupilsussed has,f.' . ;
0-,decreased from 1508 to 1493, aid th7 number of pupils,bussed away from the ;
. ;
nearest school has incriased from 762 to' 766.
. . . . ,
Plan Vf appears to.be a quite acceptable assignment plan for the ABC
first,School,System. It has been developer
by fi deterthining.tho plan (Plan V). No
- .
31 .; ,
latent,:)) an ,and .oth r results--10.
ABC ,School S378 em
azacity.:::condtraint s#-i.o..:VOristraints 7, 34-40%
"44*.`,04:41..71.134.es travelled
441 .Distan0e-Aireas 45, 46, 49,
50;51 to School 37' Restricted from Schools 2 and
'teas 17 and LS Restricted fromSCiiColteas 20!, 34, 44, and 45 Restricted
from .School 4,
3
alb
y
t.
SCHOOL
1 2 3 4
;Capacity 600 600 500 550
;ASOgnek 600 600, 420 550
1.Airiority 34:0 39.7 34.0 40.0
r
avelled 6412-
'P.0 1.[-,-Miles of Buffing 5809
upils Bused° 1512 .
,'Number of 'Pupils Bused
Past Nearest' Sehocil. 782
./
432
-.
.
4acity Constraints 114-40%,
0.0.74.Pupil-aileq'travelledatual rDistance. re 45," 46, 49,
:40-,51, to School 3)Fea 7 Restric a froM School 2 and 3
'e.es 17- and-1 RestrictedSchool 1
OAS 20, 25, 34, 44, And 45;Restricted from School.' 4
'SCHOOL1 2 3 4
Capacity 600 .600 500 550
Assigned. 6,00 600 420. 550
Minotity .34.0 39:7, 34.0 40.0
upil4files travelled . 6421Oily-0.4es of Busing 5811
Pupils, 'Bused- 1508 kof tinpils,Sused.
ii.str.14:eareat: School 762
F
i
, C. ..
,, . .
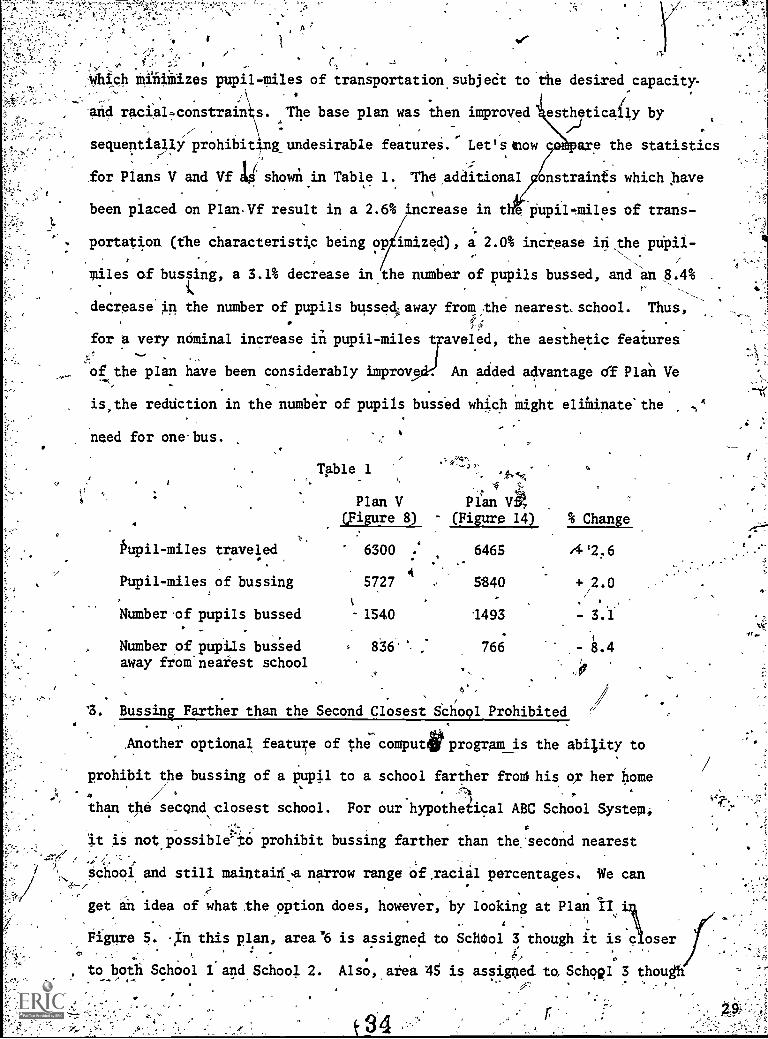
which minimizes pupil-miles of transportation subjedt to the desired capacity%
, and racial.constraini\s. The base plan was then improved
sequentially prohibiting undesirable featurei. Let's mow
for Plans V and Vf shown in Table 1. The additional
est,h7tically by
are the statistics
onstrainfs which have
been placed on Plan-Vf result in a 2.6% increase in theme, pupil-miles of trans-
. portation (the characteristic being op imized), a 2.0% increase in the pupil-
..
/
miles of bussing, a 3.1% decrease in the number of pupils bussed, and an 8.4%,
decrease in the number of pupils bussed away from the nearest. school. Thus,nfi
for a very nominal increase in pupil-miles traveled, the aesthetic features
of the plan have been considerably improve An added advantage df Plan Ve. ,
is,the reduction in the number of pupils bussed which might eliiinate'the
need for one bus.
A
o
pupil -miles traveled. .
Pupil-miles of bussing
Number .of pupils bussed
Number sof pupils bussedaway from'nearest school
Table 1
Plan V(Figure 8)
.
:
Pan(Figure 14) % Change
I6300
5727
-1540
836'
: 6465
5840
493
766
4'2,6
+ 2.0
- 3.1
-/ .
/I. Bussin& Farther than the Second Closest School Prohibited 1
64f
.Another optional featur of the comput'e-program is the ability to
prohibit the bussing of a pupil to a school farther froni his or her home,
than the second closest school. For our hypothetical ABC School System,
it is not possible-to prohibit bussing farther than the-second nearest
school and still maintaid:a narrow range Of,raciil percentages. We can
get an idea of what the option does, however, by looking at Plan II
Figure 5. 11 this plan, area '6 is assigned to School 3 though it is c oser
to both School 1 and School 2. Also, area 45 is assigned to Schq21 3 though
r
s,igiukerkt...,,plan and other results--P14 k'. "School' System
,,4city potistraintsnority Constraints ..
-10.1.;q, Pupil-Miles travelledACtuaI .distances frdm Areas, 45,' 46,..,,,,
41: to School 3Area, 7. Restricted from Schools 2 and 3' 'eas 17 and l8 Restricted ....e.c.
r.;.1chool 1;,fleas 20, 25, 34, 44, and 45,,,,Restricted from Schbol 4;Areas 34 and 44 Restricted'' ,,from School- 2 . .
;1
.SCHOOL1 ,2 1 4
Ca?acity 600 .\ 600 500 550ssigned 600 , 600 420 550
Shority Q 39.7 34.0 k0.0
9
..s
40tMlles,trave)led 647Ee
41*-,M11es.4 Busing 584040* Pf, pupils .Bused 1493
jer,,,f`upils Bused.ity,fromi Nearest :School ," 766
II . :. ,
A.
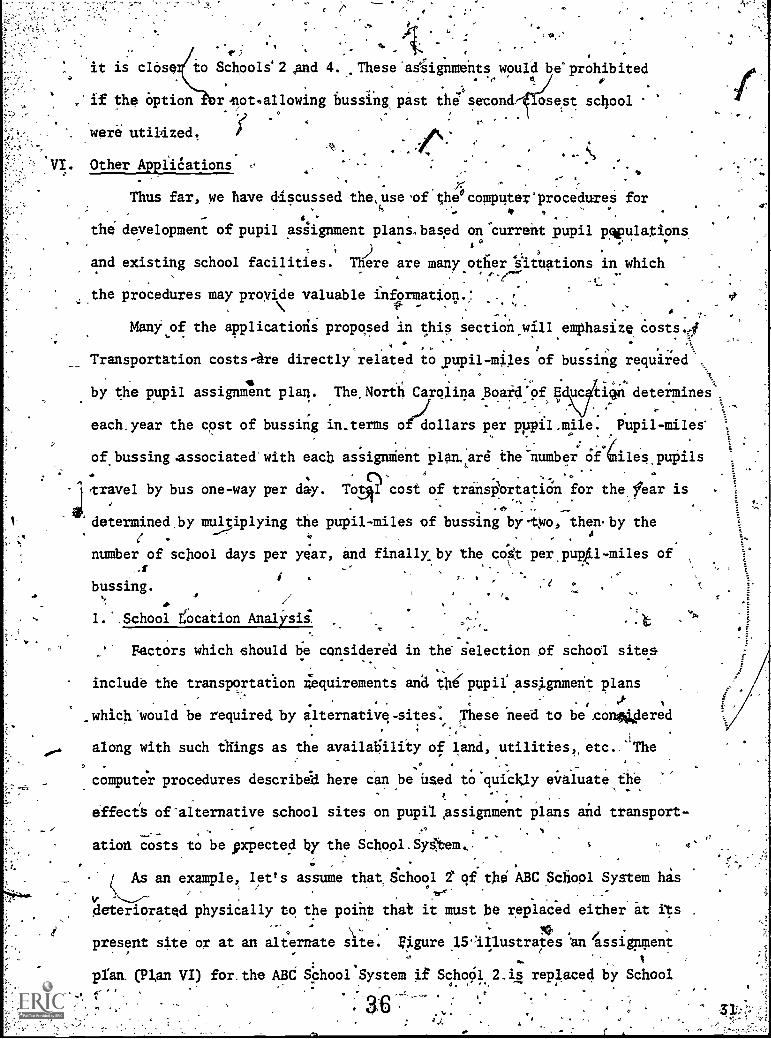
it is closeito Schoole2 And 4. These'aggignments would be' prohibited0
,'if the option rnot.a/lowing bussing, past the' second.," osest schoolo
were utilized.
. Other Applications
ti
. ./,-:
Thus far, we have discussed thesuseof thecomputer*procedureS for, . , .
4 '
thedevelopment of pupil asiignment plans.based on'current pupil Npulations.
and existing school facilities. There are many °tiler 'S'ituations in which
the procedures may proy ide valuable information.;\ .
,. .
.
iMany of the applications proposed in this section will emphasize Costs-5- .
.7,_
-,, ,u
. :! ,, I .,
Transportation costs-are directly related topupil-miles of bussing required'....
. 4 \0 %
by the pupilassignm11
ent plan. The.North Carolina.Board'of E uc titan determines .
. ..
I
AAA
each.year the cost of bussing in.terms ofidrollars per pppil.mile. Pu pil-miles
. .
../of bussing .associated' with each assigndent plan, are" the -number Of biles pupils
. , a
travel by bus one-way per day. Totc)511 cost of transliortatiOn for the fear is
'determined,by multiplying the pupil-miles of bussing by-tWo, then. by the(
number of school days per year, and finally by the cot per.p141 -miles of
bussing./':4 . z
°. , le.
.1.' School cation Analysis. ,., . .
,.. Factors which should be considered in the selection of school sites. ..
,..
include the transportation iequirements and tbe'pupil'assignment plans-,.
. 1 .. ,. . . ,
_which 'would be required by alternative-sites..
These need to be conWered:
, ,
along with such things as the availability of land, utilities,, etc. JThe. . ,. .
computer procedures described here can be used to`quickly evaluate theA ..
,
effects of alternative school sites on pupil assignment plans and transport-r....-. ,
ation costs to be expected by the Schopl.Syitem.. . . .
( As an example, let's assume that, echool 2' qf the ABC School System has. /
-,.....---- .
deteriorated physically to the point that it must be replaced either at its .
\.- .* 10 .
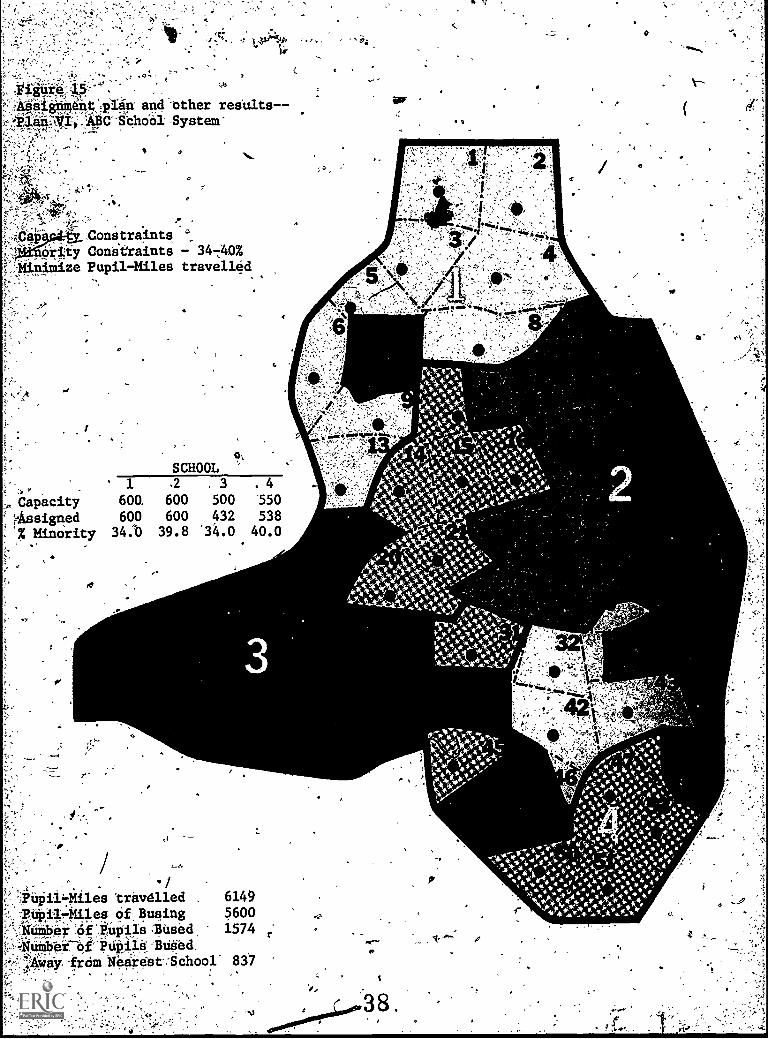
present site or at an alternate site. Eigure lS'aIlustrates 'an assignment. , e
t.,.
plan_ Plan VI) for. the ABC SChool'System
.,
if SchoO1 2.5., replaced by School-- .
.
. . . 36 .,.: .
,
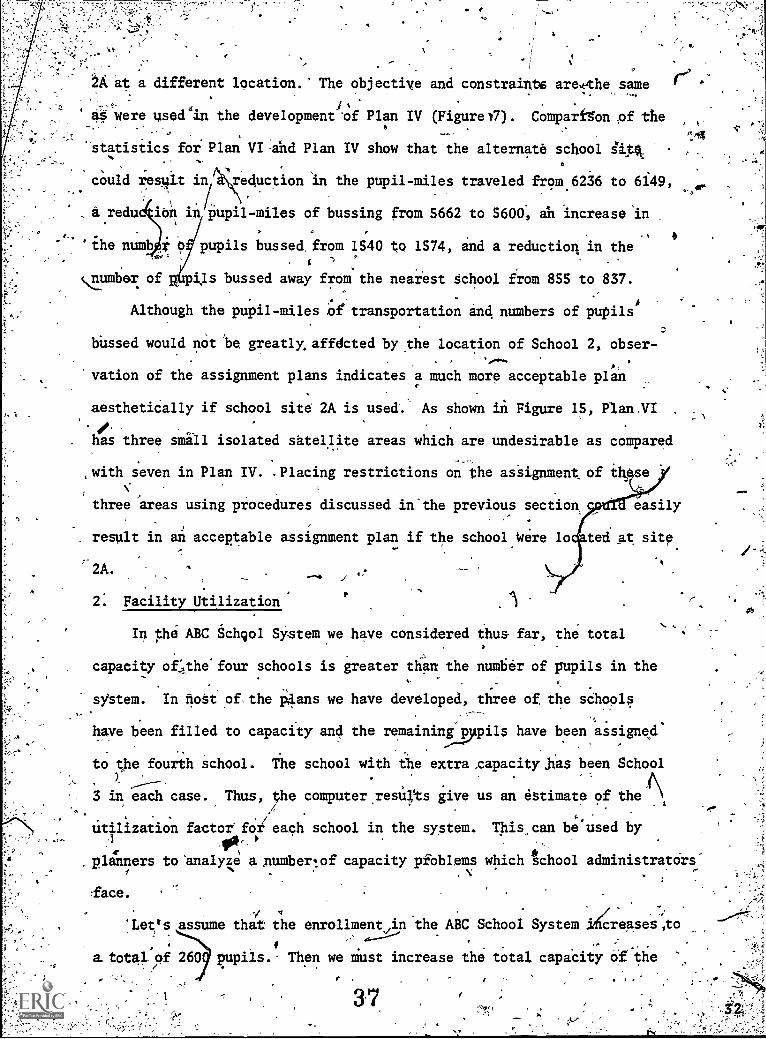
-'244, at a different location.' The objective and constraints arethe same
at were used in the developmentof Plan IV (Figuret7). Comparfgon of the
'statistics for Plan VI and Plan IV show that the alternate school ikpik
could restilt in reduction 'in the pupil-miles traveled from 6236 to 6149,
,
__dredu ion in/pupil-miles of bussing from 5662 to 5600, an increase In
'1-14
.., . ,the num o pupils bussed from 1540 to 1574, and a reduction in the
.
. 4 1
ils bussed away from.the nearest School from 855 to 837.cumber of
Although the pupil -miles :of transportation and numbers of pupils'
bUssed would not be greatly,affdcted by the location of School 2, obser-...
much more acceptable planvation of the assignment plans indicates a
aesthetiCally if school site 2A is used'. As shown in Figure 15, Plan VI
has three Small isolated satellite areas which are undesirable as compared11
, with seven in Plan IV. .Placing restrictions on the assignment of
three areas using procedures discussed in'the previous section
result in an acceptable assignment plan if the school Were lo
2A. a ---16
2: Facility Utilization
In the ABC School System we have considered
capacity ofthefour schools is greater than the
easily
tedat sitp.
thus far, the total
number of pupils in the
three of, the schools
pill have been,assignee
.capacity ,has been School
us an estimate of the ?\
. This.can be'Used by
system. In floti ofthe P4.ans we have developed,
have been filled to capacity and the remainingpy
to the fourth school. The school with the extra
3 in each case. Thus, the computer.resUtts giveP
Utilization factor' for /each school in the system
110.
planners to'analye a number!of capacity pfoblems which school administrators'.y
face.
'Let's
a. total. rof
assume that the enrollment,inthe ABC School System jreases,to
260 pupils.- Then we must increase the totat capacity of' the
I.
and'otherC'SChobiSystem'
-A,
Constraints
ority Conieraints - 34-40%Aqiiiimize Pupil-Miles travelled
, /
Y
. Capacity'Assigned% Minority
t4
--'
o
1
600,
60034.b
SCHOOL2 3 .4
600 500 550600 432 53839.8 34.0 40.0
,
"- owi.,'
=
a" .4%A
r "i*
travaled . 6149
es 6f Busing 5600
Nüinbë of upi1s Bused 1574
NumberThf Pupils Busedi./AWriirlianitt040st:81chool. 837
.
?.*
. sthbOls in thesystem. This= can be done, by building an :additional school;
'
,..
-or by adding capacity to,existing schools. If :a.new school is to. beibuilt,
the coMputerprocedime& can beftga to estimate the effects' dfvarious
.. , alternative locations onlupii.assignment plans an& transportation costs,k
.13y removing the capac ty constraint on a new school and determining hoW., ..
:0,.
, ..i,A
many pupils 4ould be ass gned there, planners can evaluate the-school size,
.- A 'skv
which Wouldould result in the leastotransportation costsfor the 'system. This
information can be used along with construction costs, land colts etc. in
_-__-__-_,_ l'
making the.ginal deciiions On:the locatidn andoize of the school to be built.'4? -,
4.If the capacity of existing school is td be increased either by persan-
ent cdnstructionkr by adding mobile cl ssroomp, etermination df the best
location for the additional space can be made by wing capacity con-e 1
a
straints from the existing schools and seeing where pupils are assigned to
minimize pupil-miles of travel.,
In school sy&tems with declining enrollments there may be situations
In which the utilization of certain schools is very low inh_the ptimum
assignment plan. Thip information may be used to select schools which
shot' ld be closed to reduce opirating costs and thus maintain complete
' programs.at remaining schools..
O
3. Organizational Problems
School systems are organized in many different grade level arrangements.
These may vary within a given system For example, one school may contain°
grades 8-12 w hile, another school may contain grade's 9-12. The pros and cons
of program aspects of different grade leveldrganizations, will not be address-
.
ed in this report. However, the,computer procedure presented can be quite
,useful when evaluating the economics of different grade leVel structWer
The prodedure could be particularly useful when the grade,lev organization
throughout the syiiem is the same. It could be tladdto develop assignment
3 9
plans and egtimate costs.of transportation-for any nu er of alternative. .-;
organizations that the planners would like tq consider.
aOne'popular organizational structure involves the concept Of feeder I
,sr"
schools. Under this concept pupils who start tO school in the same
elementary school eventually go to the.same high school.' The corn-,
/After procedure can be used to deveiopLplans for the feeder concept by.
first devel8loingpupil assignment plans for the high schOol. The attendance
area identified for each high school'Would repreent the which would be
-\ . -,:-'
considered in developing assignment plans for the junior high schottls whiojt--., o. J., .
.7..-
feed that high schook., Thus the probiedeveloping assignment plans for- .
. ,an entire 'school system would Consist of one plan. fole the high schools, one
...
rper high school for the junior high-schools, and one>
per junior high school. 1.
.
for,the elementary schools. The prOt7:Ief.--arriving at themost desirables2.: ..
. .
o, .
. .,,
plans might require severalibterations through the computer pit:gram. It
might be necessary, for example, to choose aligh school plan which is not
-409 the most desifabldin order,to'obtan desirable junior high _elementary',
assignment plani.4
4. Facility Forecasting
.ne matter of optimum utilization of school facilities has been
It
f,
-
discussed. When the location and population-Of,pupilt and location and
capa4ty of schools are known, ,his problem is not simple. When one coI ..'
siders.the changes in_pupil population, both rate changes and 2ocatio14
) ,.
, ,..
changes,-and additichtand deletion oficapilities, this problem beco*
e ,
even more complex. In much the say way that the prOgram can.
tq. tudy facility site selection and facility uti31..
-,._ '1
to study the effects_of future changes-. .
11 ..
DIV pligi assignment plans and trhnsportati4.%
O
,utilized .
ation, it can.be used4
pupil population and facilities
pupils.:
tly, this program can be used to develop input during the*. , .
410
o.
.,planning;-efer site selagtion of new schoolsansl for decisivns- ,
,
WhiCh_loCal, government must make regarding such istues.as zoning for
new residential.developm t or low - income housing projects, In the /atter- --
case thaprogram can be used to detelrge effects of pupil assiknment on
existing schools from the point of view of capacity and racial makeup
4of the schools.
I I I
a*
I
ft.
..0
4
O
0ztr,
The linear programming system fbr schoold ocation and.facility utilization0 ,
Uses the MPS/560 version 2 compiler which is currently in use at the
Triangle University COmputing Center. Tfie MPS'S.);stem uses 'a revised
simplex method to'calculate probable solutions. The two fortran programs
that are a part of the system are written for the Fortran IV G,Level Compiler
and are used to format the inputdata for MPS and then to transform the MPS
,output into a readable report format.,
J
-43
6
",
//,
/
4
.tySTBMAARRATXVE ,
0
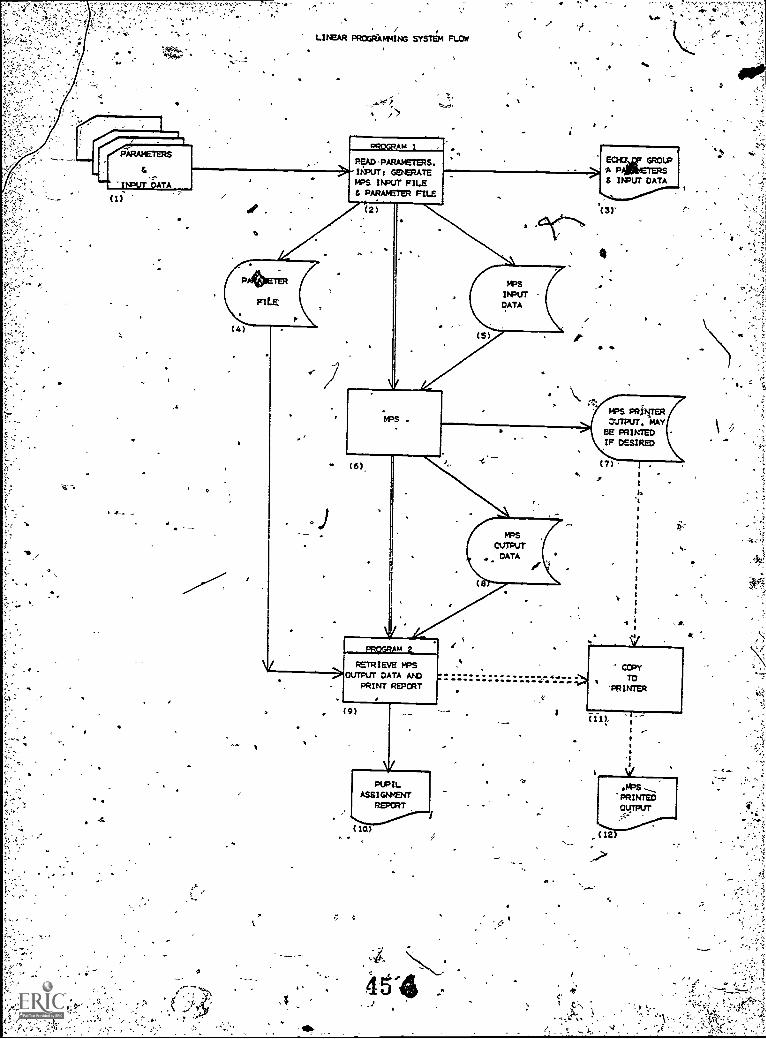
le first proem (2) reads the parameter cdrds (1) and the input
data. -file parameters set the
'the amount of input datar
c'
generates a parameter file:(4), the MPS input data'fite,(S), at echo of
the following parameters: 'number of sdhools, number -of pupils, number
of assignment areas, maximum busing distance, minimum busing,ctance,
constraints for the solution and specifies
t , k9?, ,
is tOlie read in. The fiistprogram also, .
maximum minority ratio, minimum minority ratio, number of days in the
school year; cost per pupil mile, school system name, city, North Carolina
Board number of.cost.per pupil idle, number of socio-economic factors,
ratio for each factor, and an echo of the area input data. (t) the _second
step executes MPS.,(0 which reads in the input data (5) and gendfates the MPS
output ,data (8). The print produced by MPS is .saved, in a temporary file (7)4
. ..
so it may be printed if.deiired but printing is not necessary in most cases...._
. ,. .
The third step executes the. second program (9) whidh accesses the MPS output.
/
data with special subroutines available at TUCC. [Postin, Array, Colnam,
Vector] the report generated (10) indicates the assigriments made in ar
readable-format. The last step is optional and may be executed if the MPS
pilited output is desired. A utility program (11) that simply copies
datasetsbs employed to read the temporary dataset (7) ana produce a pfinted
I ;
-:,';"' -",1
"'Z
.";r'','.;\"'".1
4.;
'
.P
,
04,
-
,t
4.1tf",c./''''',13.(=
3- I"".."4
e""`
,r
\4
4
P09
4'
14
PC
ItteSO
IIIt
J
N
149
4
0.
4
4,'-.
",,,
'A
I"
.'
I:: '
,.
..
,.
0.
,.
,,
'-,,..---
t.
,. i
,_. ',
,`," .:.
.,
,,
4
vs'
15i:',.3),
PROGRAM I (DATA:ENTRy)
. .
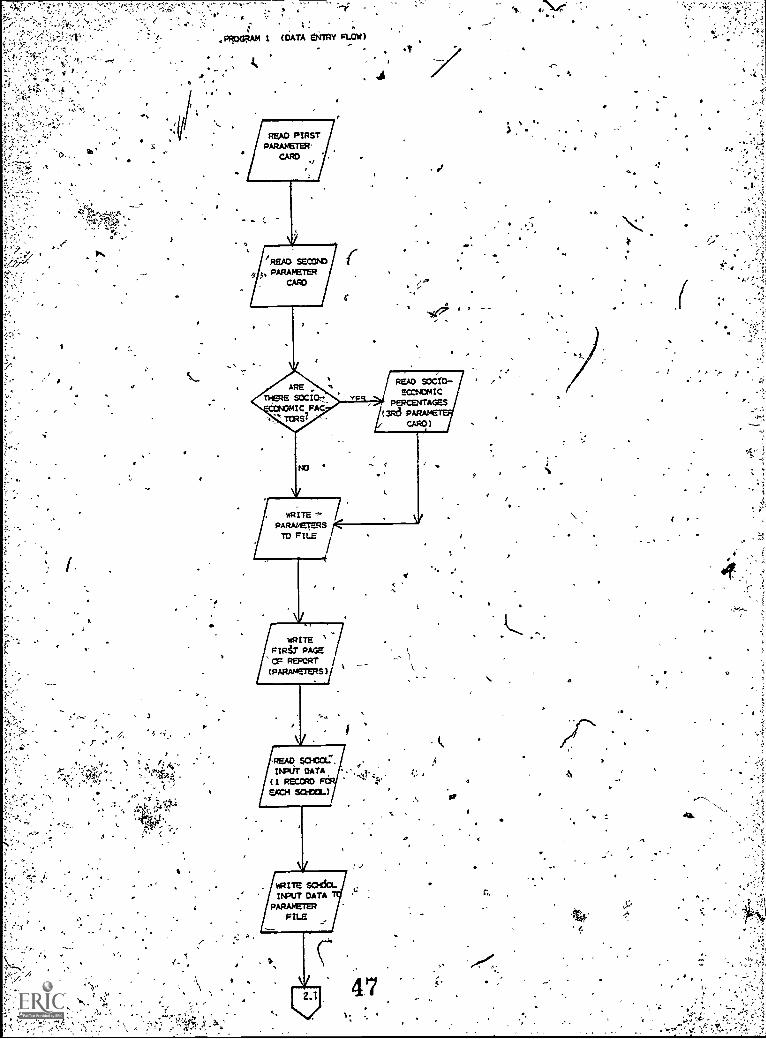
.. The piogram-reads the. first 1wo.parameter cards and from one of..-, . .
..
the Terameters determines if is an additiona) parameter card: If-.
so, the third parameter card is read. The parameters ate written to a..
.
ti
- t ,
file to be used at input to the second prOgram. A report page of the
parameters is printed out and the school inpUt data is read in. There
IL 4'mutt- be ofie card for each school peCified Mthe parameter
informdtion is also written tb:the parameter file.
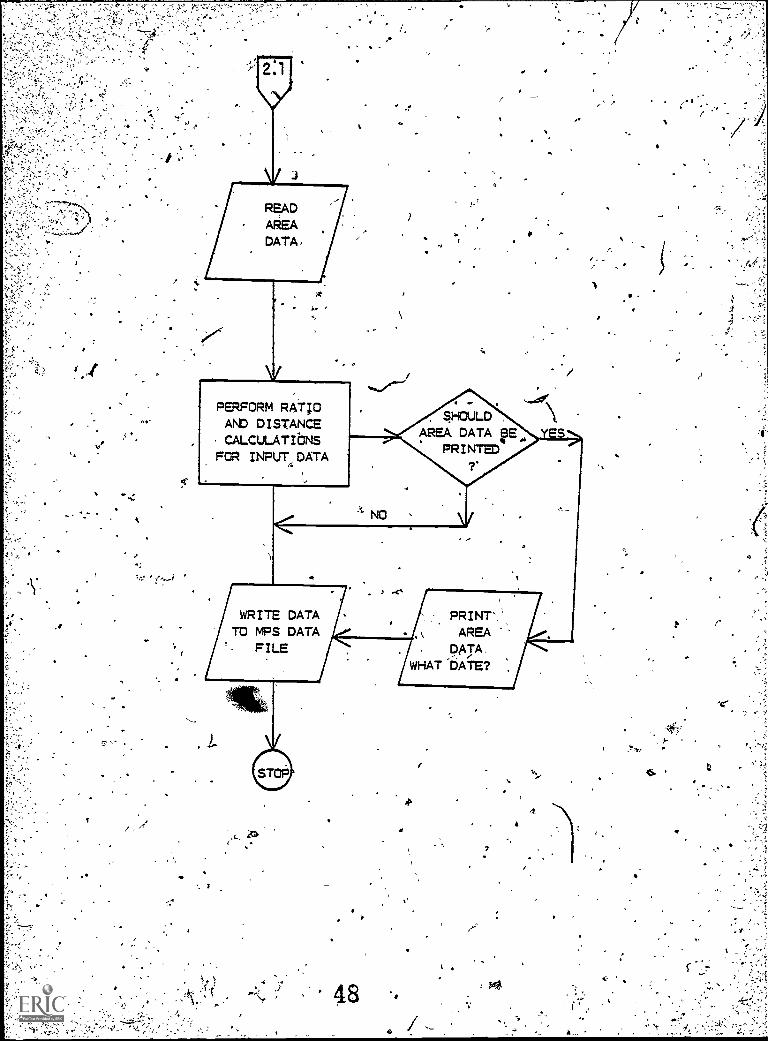
The area data'is rear in and professed. This information it -contained.
card. Tbis.
on :two cards for each area and there must he two cards for each area from4
the parameter card. The input for each area contains its location with
X, Y coordinates and the majority, and minority-pupils for etch grade,
kindergarten through 12th grade. The program calc ulates 'the minority
ratio and the distance to each school from each area. This information
- .
,is written to the MPS iliput'siataset. If called 'for` the minority ratio ,
for each grade, in la' area is printed out.
It
O
.46
. .
- .
S
S
a
"f
ir.
.2
z
1 o
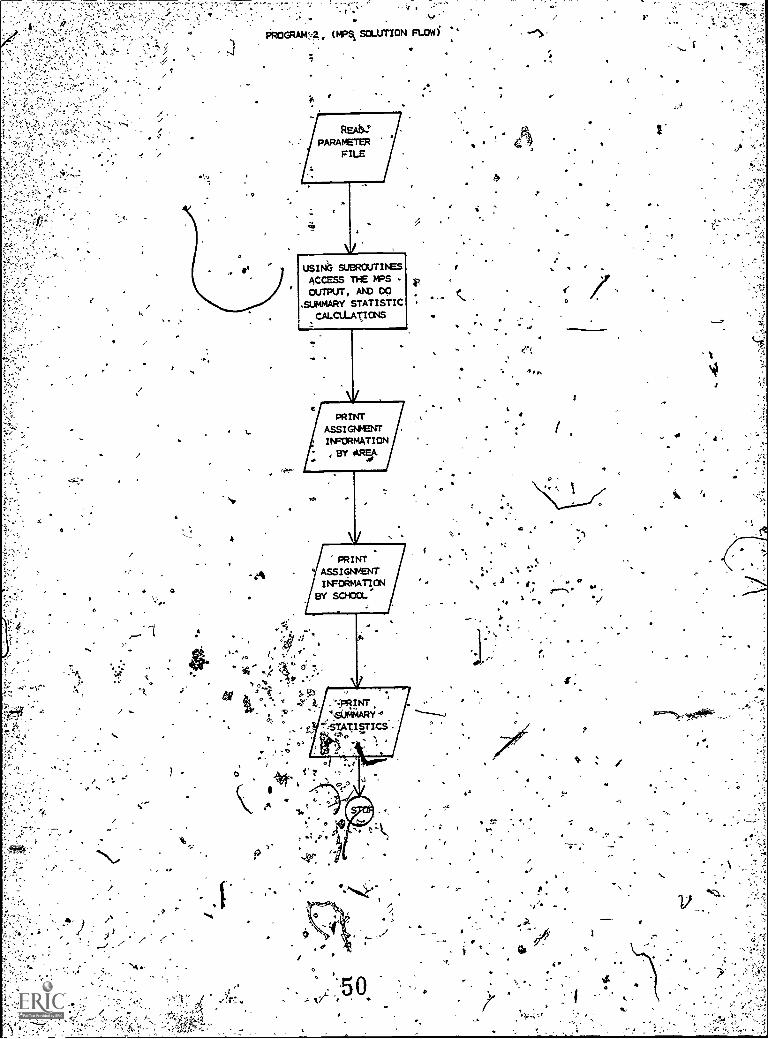
The second program accesses the MPS output dataset using special. .
,
MPS subroutines. The data, is printed out and summary statistics are
accuraliattd for a oneTage summary.tt
d..
NOTE: For 'infoimation on theesubroutinet see IBM'publication:
MPS/360 Read Communications Format (geadcommY (H20-0372)
S
**
O
O .
."/
M
3.
0
.0
;
4 r
, -
2,
5
;--2,272.2,2,, :.:;2:2, t",:i-.-ts cc!!
ir
1
k
)
' 8 , ,..
n 9
.6.r
VA
e
/ 9
.
ell .f.t. a
,;
a''. -
,"
6 ../"
!K.a; of - ,0e, 004
-,
I
t
1,
Yf
. I.:- '-a, ;. 2; .! S..".' ::.
..
.., .... ., ,,,c; '!.. ., 2 ,,, ...:!!,
!';,-i' ...''--;::::::,c4":,..::,'2,...','.':',-;.4..7:::.i2c..,'.. ,.:84:: ..:8""..i.....]0',, 4 :..;;,..`,..'L';',--i=4;7S.,.,,,,'.,".t.'': 8-,'irt!,-. ...=';,.;;;;:'",-..., ...:,;.;:,','..--..1", - :
2.
\
-a ;.;:al.,-;;;,.,"
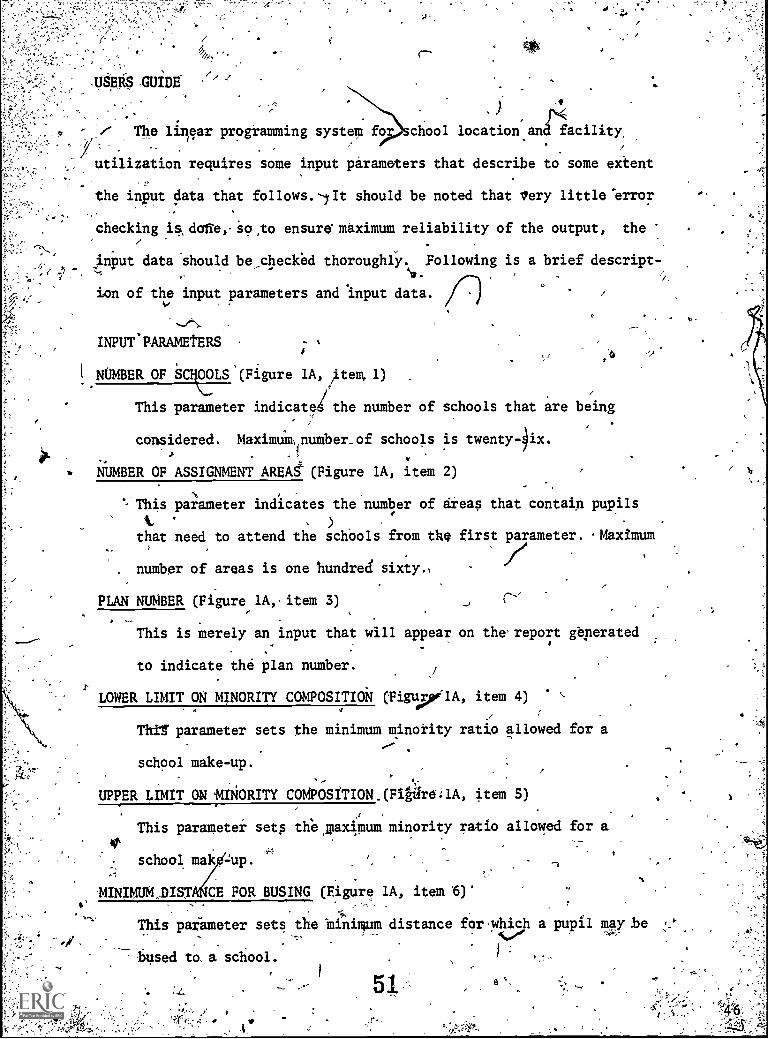
/ The linear programming system for school location and facility.
utilization requires some input parameters that describe to some extent
the input data that follows.-IIt should be noted that Very little'error
checking isolofit,Sci,to ensure maximum reliability of the output, the
input data should be checked thoroughly. Following is a brief descript-
ion of the input parameters and Input data.
INPUT'PARAMEtERS
NUMBER OF SatOLS (Figure 1A, /item, 1) _
C
This parameter indicate the number of schools that are being
considered. Maximulw number.of schools is twenty -)ix.
NUMBER OF ASSIGNMENT AREAS (Figure 1A, item 2)
*- This paimmeter indicates the number of areas that contain pupils.
that need to attend the schools from the first parameter. . Maximum
)(/. number of areas is one hundred sixty., .
PLAN NUMBER (Figure 1A, item 3) ,C`'
,
This is merely an input that will appear on the report generated
to indicate the plan number.
LOWER LIMIT ON MINORITY COMPOSITION (Figu#3011A, item 4)
Thtf parameter sets the minimum minority ratio allowed for a
school make-up.
UPPER LIMIT ON MINORITY COMPOSITION (FigilreaA, item 5)
This parameter sets theFaximum minority ratio allowed for a
school mak -up.
MINIMUM,DIST CE FOR BUSING (Figure 1A, item 6)'
This parameter sets the iliniqum distance for .which a pupil may be
bused ta a school.
51 e
1 .A
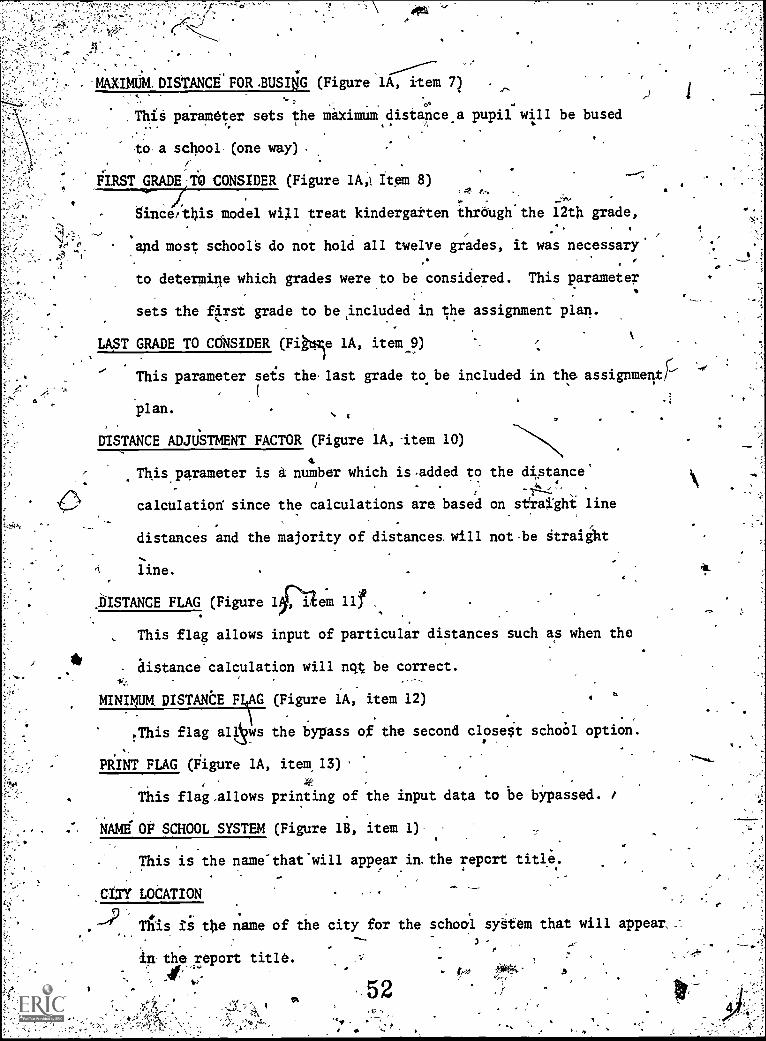
. ,------MAXIMUM. DISTANCE FOR .BUSING (Figure 1A, item 7) .
..
This parameter sets the maximum distance a pupil..
will be bused, ,. /
.
.
to a school (one way) . ,-
FIRST GRADE Tb CONSIDER (Figure 1A,1 Item 8),4
Sincerthis model will treat kindergatten through the 12th grade,
and most schools do not hold all twelve grades, it was necessary.
to determine which grades were to be considered..
This parameter
sets the first grade to be %included in the assignment plan.
LAST GRADE TO CONSIDER (Fi e 1A, item 9)
' This parameter sets the last grade to be included in the assignment
plan.g
DISTANCE ADJUSTMENT FACTOR (Figure 1A,.item 10)
4This parameter is a number which is.added to
calculatiori since the calculations are based
. .
distances and the majority of distances will
line.
.DISTANCE FLAG (Figure 14, em llf
the distance'
on straight line
not be straight
This flag allows input of particular distances such as when the
distance calculation will nqt be correct.
MINIMUM. DISTANCE FIG (Figure 1A, item 12)
.This flag all!ws the bypass of the second closett schoOl option.
PRINT FLAG (Figure 1A, item. 13)
This flavallows printing of the input data to be
NAME OF SCHOOL SYSTEM (Figure 18, item 1)
This is the name'that*will appear in. the report title.
bypassed.
CITY LOCATION
This is tie name of the city for the school syttem that
In the report title.
52-11
will appear,
a
1
41,
_.
'NUMBER OF PUPILS IN THE SCHOOL SYSTEM (Figure 1B, item 34e. ,t
..0d, '1, Printout only), \
I ,
NUMBERsOFTAYS IN SCHOOL YEAR (Figure IB, item 4)) ..,
. - O
',\''' Used for final cost Calculations-
CoSTB#IR PUPIL-MILE (Figure 1B, item 5)
Estimated cost of busing one pupil one mile
NORTH CAROLINA BOARD OF EDUCATION (Figure IB, item 6)
Source of cost per pupil mile
NUMBER OP SOCIOECONOMIC FACTORS (Figure.1B, item 7)
0btterffiines if an additional input card should 005ead. Also
determines the number 14 factors.
.NOTE:. Figure 1C - Has not been implemented yet.. .The card must.be
preseneifthe above item so indicates, however, nothing is
done with the data.O
-;
'b
\.
..
53
N
vei
d'
.
e
* Application
f--
-.,
,(
o----.
w. 'f.
1
A.
N-
I'
4
. ,
.t,
.,.
.
'
Figur
411' LINEAR PROGRAMMING SYSTEM FOR SCHOOL LOCATION,ANDTACILITY.UTILIZATION,
FILE LAYOUT
-
-
.
Y
INPUT PARAMETER
Date
JO N
o.
.a
.
.\'
,.
Page N.
zr
.
1
9 9I
2,
.
91 92 4 5
s,40
9 9 9 96 1
9910
'
3
9 9 9It
14 ly11.
a.
.9 99 9-9 9
$4/ II I /V
I 227
90
5.
9 9 9 991'91
rs Is zi n 31 39 It 32A
AL
9 933 V
I 1931 369 93/ 18 6
N,\
9 9 99 9
.31 411 it It 43 441-
.
74)
9 9 9 9 9 9 9 943 IS 41 48,49 50 54 5/
AL
9 952 54
8
9 9 1933 36 5/ 31
/'
9
9-99 934 10 6I 41
10
,
9 9 9 9 9\9SI 61 IS 66 II SI4
11
9 9 9S
9 /0iti
i
. 1.2
.
9 9 9 9 922 II /05 /1
A
1.3
9 9n n
,
9i 40..
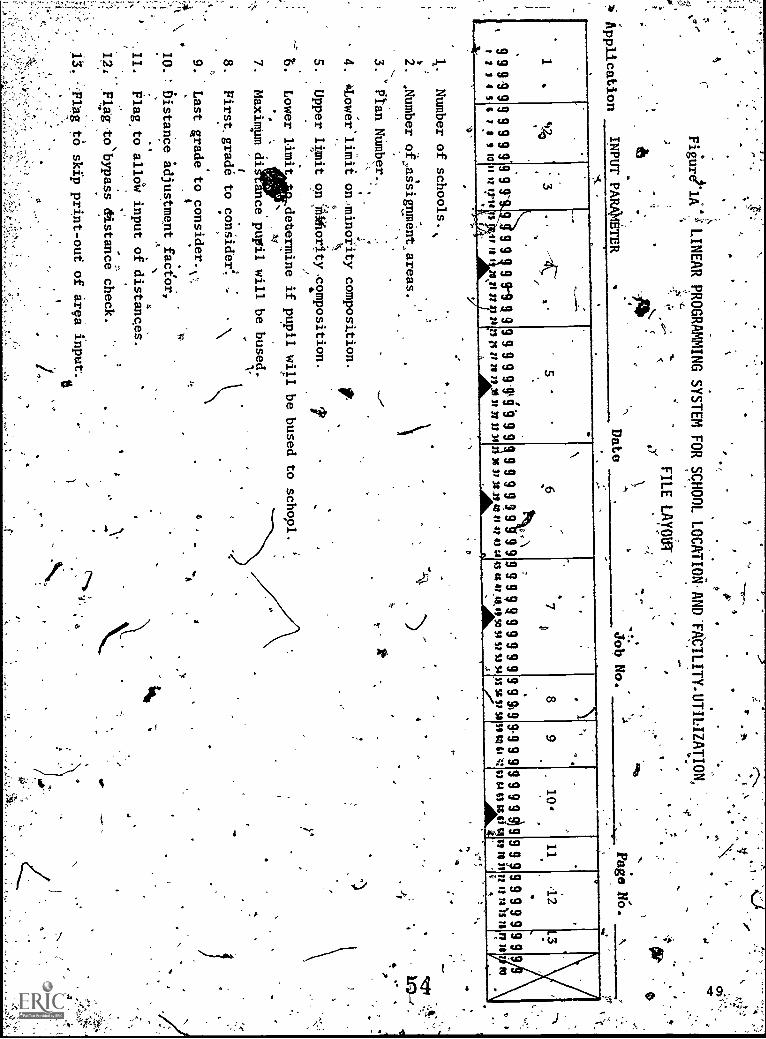
.Number of schools.
,
2.
,Number of assignment, areas.
'
3. 'Plan Numbr.
4. ..Lowerlimii on minority composition.
t
S.
Upper thnit
Lower limit
7.
Maximum d
8.
First grade
on *orty composition.
/
determine if pupil will be bused to schopl.
t
ance pupil will be bused.
to consider: ,
.
9. Last grade to consider.
10.: Distance adjustmentfaC6i,
11.
Flag to allow input of distances.
..
12:
Flag tobypass distance check.
(
lag to skip print-out of ir9a input.
6
10.
1
0
Cs..", 2 ,4,
4
S
Application
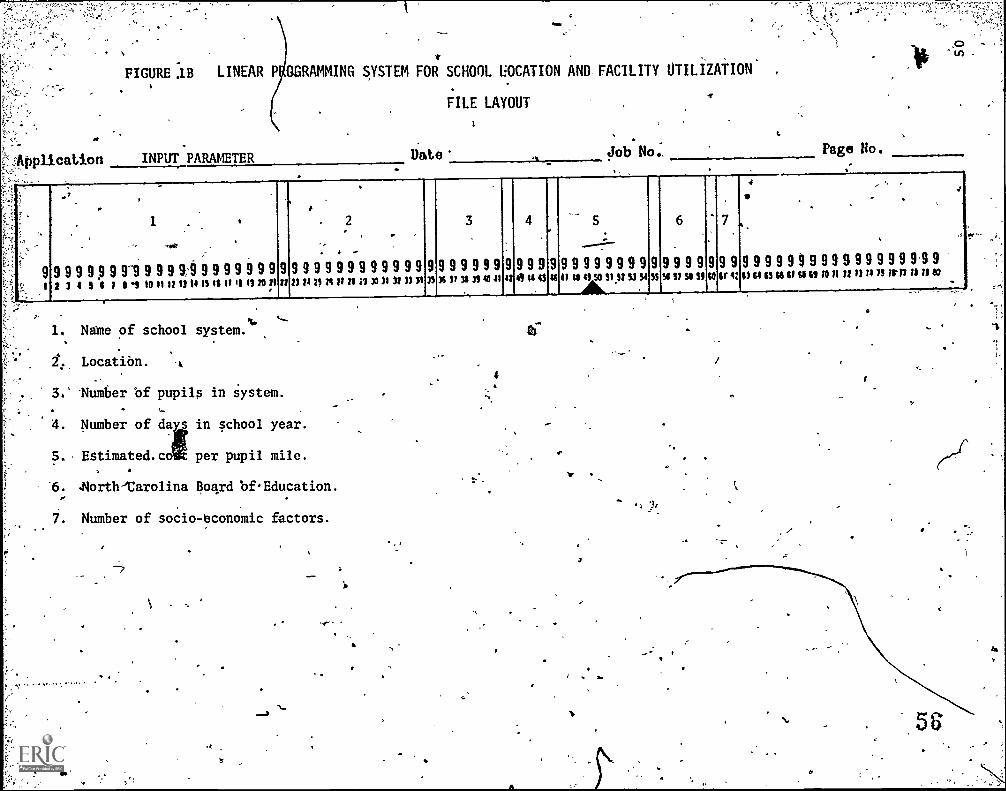
FIGURE 1B LINEAR P °RAMMING SYSTEM FOR SCHOOL LOCATION AND FACILITY UTILIZATION' .
FILE LAYOUT
INPUT PARAMETER Date Job No.. Page Ho.
..., .
91
9 92 3
.
.
.
9 94 3
.
9 91 /
1 .
91 9 9 9 9.9 9 9Ill 10111113111311
.
9 9 9 9 911111220212/,
...
. 2. .
9 9 9 9 9 9 9 9 9 9 9 9 9231121241111/1313132332133361/
9 9 9
3.
9 9 9 933314311120$41316111$1150315/3.131515$3/5233101r4/132,1001$1S11210/1/21//113/1711111/0.
9 9 9 9
.
9 9 9 9 9 9 9 9 9
AL9 9 9 9 9 9 9 9
1 .. .
9 9 9 9 9 9 9 9 9 9 9 9 9 9 9 9 9 9
_.,..
,
1. Name of school system.'
Locatibn.
3.' -Number of pupils in system.
4. Number of da s
tin school year.
5. Estimated.co per pupil mile.
6. .North'Carolina Boqrd bfEducation.
7. Number of socio-bconomic factors.
1r
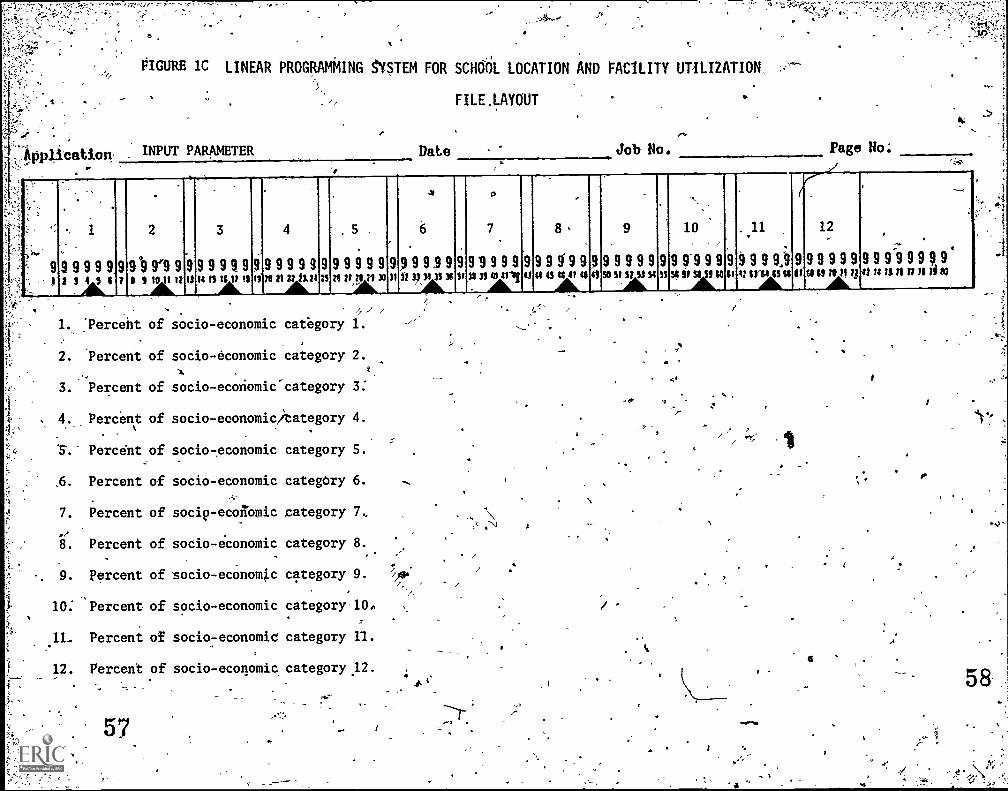
FIGURE 1C LINEAR PROGRAMMING SYSTEM FOR SCHOOL LOCATION AND FACILITY UTILIZATION,
FILE.LAYOUT
.,
*4W:cation .INPUT PARAMETER Date Job No. Page No;
9999999919199999999999999999999$9999991999999g99999999919999999:9999999999999992
1
2 2 4 5 4..i
2
1 a 1 10 It It
3
53 14 I IISAL"
4
1i NI 11 :7 /124
5 .
.
23 M 5/ /I il 30
6
31 21 I, )I 33 36
7
ft 3$ 31 40 11'nAl
8.
44 0 43 C if II
9
45 SO 51 5/ Si S4A
10
SI 5441X10
11
is 4:4Y64 OK_A&
If
12.
si o is Hipit. ' - .
11 3 /1 7/ II ii 83
sw 1. 'Percent of socio-economic category
2. Percent of socio-economic category 2.
3. Percent of socio-ecoriomic-category 3:
4. Percent of socio- eoonomic)tategory 4.
4 Percdnt of socio-economic category 5.
,6. Percent of socio-economic category 6.
7. Percent of socip-economic category 7..
8. Percent of socio-economic category 8...
9. Percent of socio - economic category 9. 7*
10: Percent of socio-economic category 100
11. Percent of socio-economic category 11.
12. Percent of socio-economic category 12.
57
.7 :7
a.
:";INPUT DATA
Two kinds, of irlimt data are necessary after defining theput
,parameters. The first describes the schools, the second describes the
areas that are involved in the assignment plan. The,school input data
,consists of a school identification sp the school may be identified in
the printouts genera he X and Y location from a grid mai, and the
school's capcity. (see figure 2A) The area data coniista of an area
identification which is.used.the same way the, school ID is used, the
`X and Y coordinatAfrom a grid map, and the numbet of majority and:
_minority pupils for kindergarten through the twelfth'grade. -/:114 is
also.a place to indicate the socio- economic category that describes the
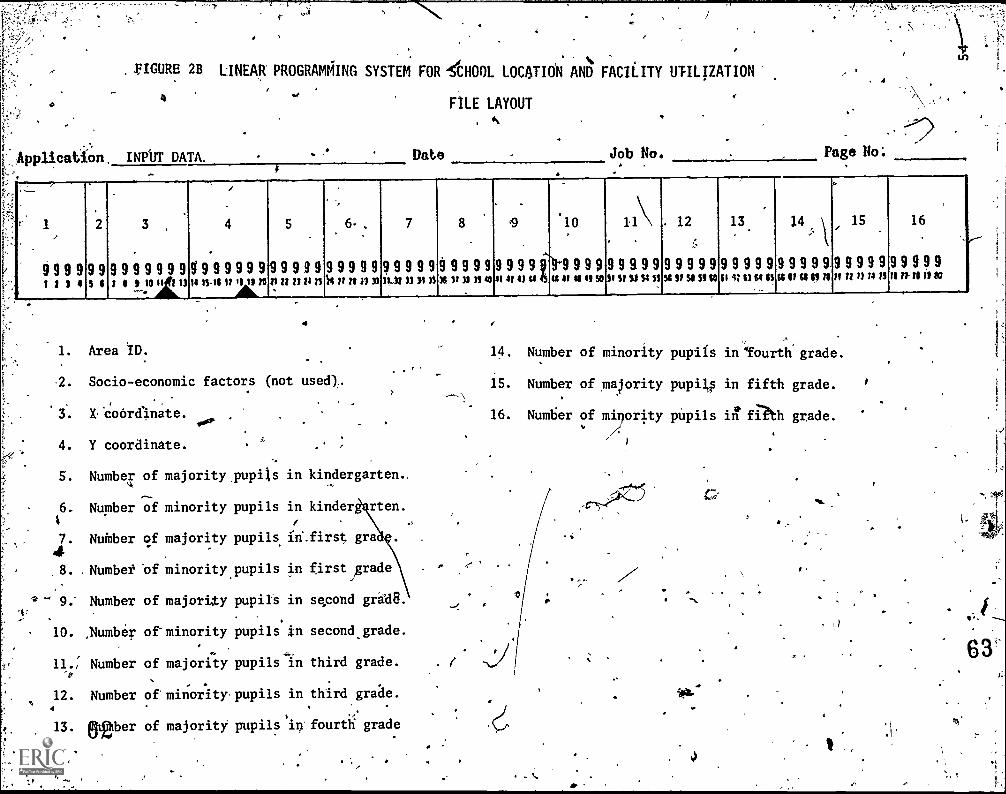
area, however, at this time this information is not in use. Figure 2B
and 2C, show the formata for entering the area data. For eachtarea,
there must be two cards, one from figure 2B and one from figure 2C.
The two cards mitst also appear consecutively, figure .2B first.
I.8
59
(
It
52
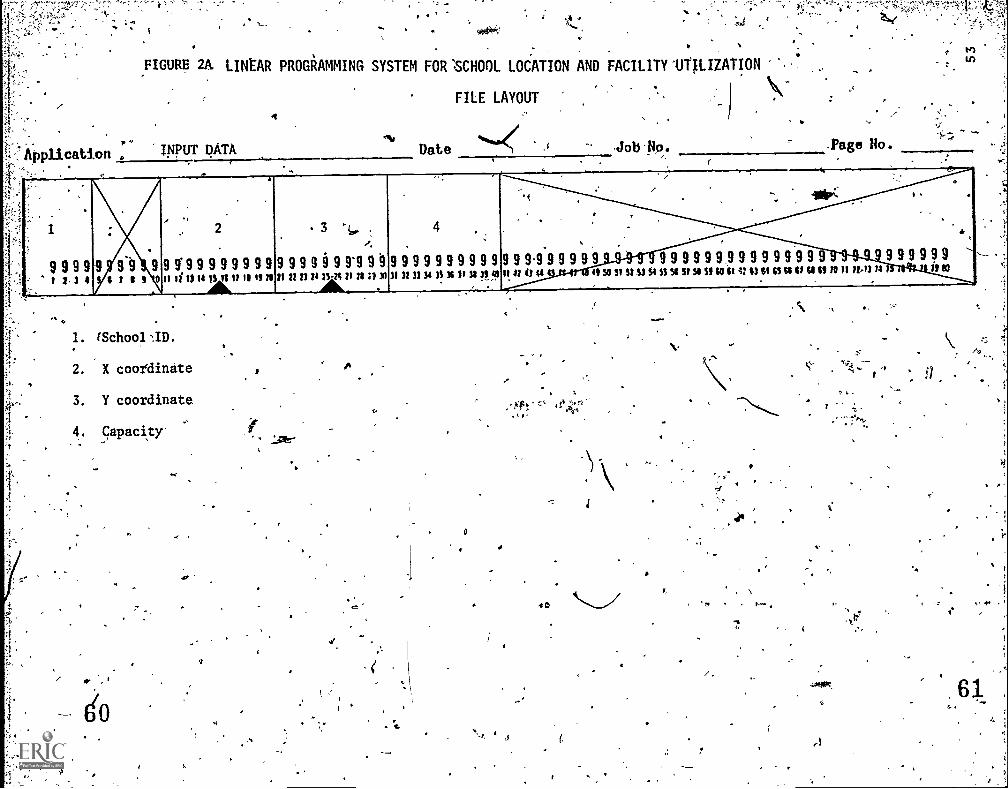
FIGURE 2A LINtAR PROGRAMMING SYSTEM FOR 'SCHOOL LOCATION AND FACILITY 'UTILIZATION
Application :* INPUT BATA Date
FILE LAYOUT
,.
.,.
..2
.
'3 .
.
4
.
,.t
,
, .
.
. .
_
- .
.
.
.
.
.
a
9 9 9 9 9 9 9 9 9 9 9 9 9 9 9 9 9 9 9 9 9 9 i 9 91 9 0 9 9 9 9 9 9 9 9 9 9 9 9 9.9 9 9 9 9 9 9 9 9 9 9 9 9 9 9 9 9 9 9 9 9 ' ' ' ' ' 9 9 9 9 9 9
I 1.3 4 $ / 4 9 II If 11 14 19 IS 11 11 II 20 /I 22 n n 2k II 21 21 30 31 33 33 so 3S lo 33 so 31!1 41 4 4 44 4 49 50 SI St SI S SS 34 3/ S. SI 10 SI 42 3 SI SS SS S 1 11 10 11 1241 14 1 i 11110
,...----- .
i
1. (School -ID.
2. X coordinate
3. Y coordinate
4. Capacity'
.cs
.
. 1c
0
O
.
-FIGURE 28 LINEAR PROGRAMING SYSTEM FOR ''SCHOOL LOCATION AND FACILITY UTILIZATION
.FILE LAYOUT
F. Applicatfon. INPUT DATA.I
Date Job No. Page No:
.
,- 1
.
2 3
.
4 5.
6,, . 7.
8 Q9
.
10 11\ 12 13.
14:.
15
,
16
a
I..
9999999999999199999999 9 9 9 9 9 9 9 9 9 9 9 9 9 9 9 9 9 9 9 9 9 9 9 9 9 9 9 9 9 2 9 9 9 9 9 9 9 9 9 9 9 9 9 9 9 9 9 99999999991 1 1 4 3 1 1 1 3 toll' 14134 If ft it XI tt tt DV i3 /4 titt n313 43133 34 J3 X P31.114410 044 els If 4050 IS? ii3131513/ SIStio it 4:4331$3 64 V sispe ii n n 14 /3 71 11-71 i! to, -
1.
2.
3.
4.
S. Number of majority pupils4
Area ID.
Socio-economic factors (not used),.
X -coordinate.
Y coordinate.
100'
4
.
14. Number of minority pupils in 'fourth- grade.
15. Number of majority pupi10 in fifth grade.
16. Number of myorit lty pUpils ifl?th grade.
6. Number of minority pupils
47. Nuffiber of
.8. .Numbet 'of minority pupils
9; Number of majority pupils
10. ,Number of pupils in
11.: Number of majority pupils'in-ft
in kindergarten.,
in kinder rten,
majority pupils fif.first gra
in first grade
in second grad8.
, .
Number of minority pupils in
13. eit2ber
second, grade.
third grade.
third grade.
of majority pupils'ii fourth grade
.
1
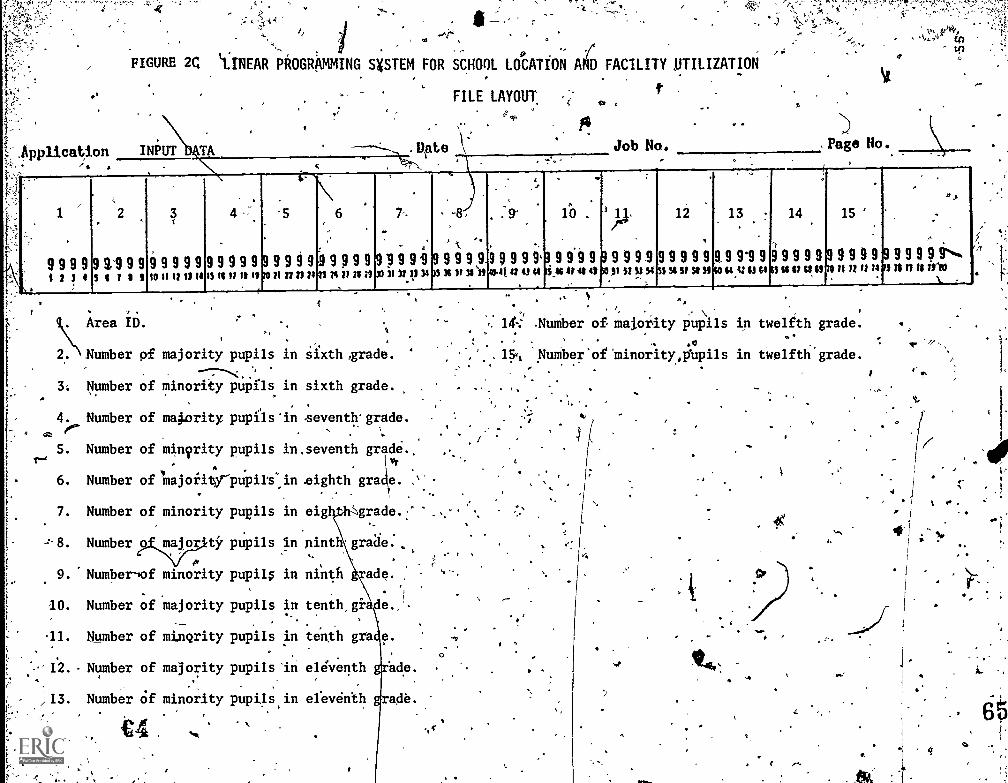
.Application
FIGURE 2C- !
`LINEAR PROGRAMMING SXSTEM FOR SCHOOL LOCATION AND FACILITY UTILIZATION
FILE LAYOUTe
Date \ Job No. . Page No.. _
999999.1i 2 1 1St
4.
99999i II 9
.
99999999999910 11 tt 1114
.
.
IS IS It il it#
.
-5
JO /I it 21 /4
.
9 9 99991991TS 14 If n il
.
7--
.
30 31 5113 34
.
-
,
,
9999 9.9)5 34 lf len
.
,
..
99991454t 47 43 44
.
lb .
.
9999li46 0410
p..
99 99-99351 St SIM
12
999999.95554 st 54 55
13.
91 99999999999999991%..'40 et4: gi 64
14.
1
65 gi It cs g5
15 '
mil /2 t1 /4
..
.
,,,,
.
nun /I ino-
Area ID.
2.\Eumber pf majority pupils
3. Number of minority pupils
4. NumberO
in sixth ,grade.
in sixth grade.
of majority pupils 'in
S. Number of minority pupils
6. Number of majority
7.
8.
9.
10.
12.
13.
Number of minority pupils
Number major tir pupils
pNumber-'of minority pupil4
Number of majority pupils
Number of minority pupils
Number of majority pupils in
Number Of minority pupils.in
zeventh'grade.
n,seventh grhde.,
n .eighth grade.
in eig Sgrade.
in Ninth grade.
in ninth ade.
tenth, gr.de.
in tenth grade.
eleventh ade.
el:el/611th grade.
in
C4
O
.Number of majoilty pupils in twelfth grade.
. .6
15r, 'NuMber'of'minority,pitpils in twelftgrade.
r
ti
.4\
'
1-
p
t.
-t65
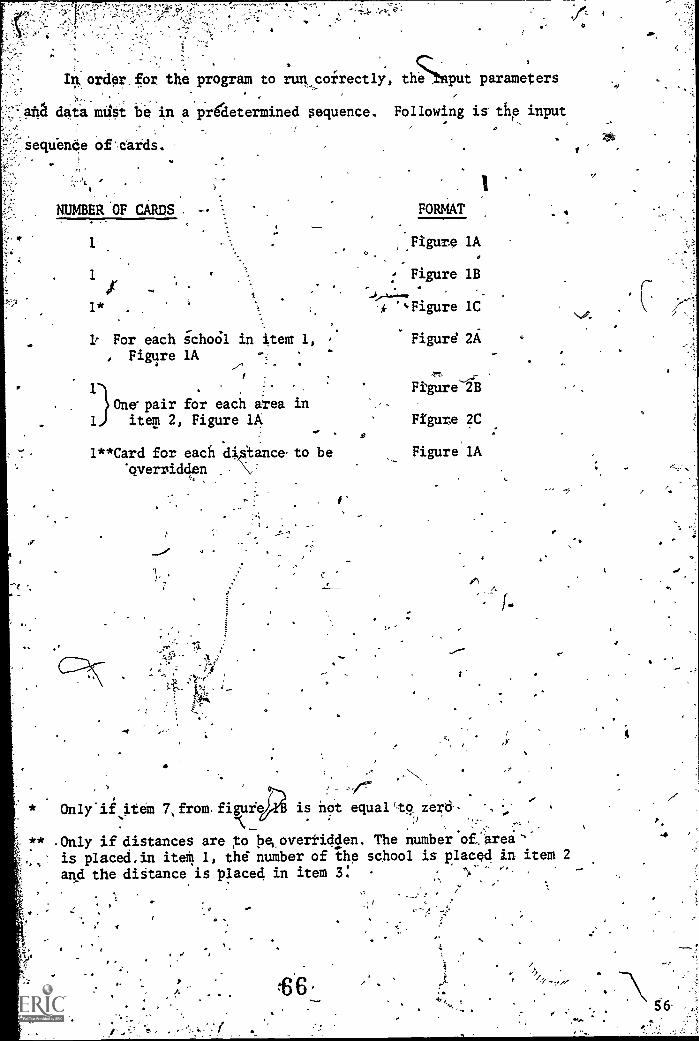
In, order for, the program to run, correctly, the /nput parameters
aftd data must be in a prgaetermined sequence. Following is' the input,
sequenOe Of%dards.
N
NUMBER OF CARDS
I
1
1* .
V For each icho61Figure lA
1
7
in item 1,
One pair for each area in1 item 2, Figure lA
- .
1**Card for each di tance to be'overridden
,
LCD. SEr _
FORMAT
Figure IA
Figure IB
Figure 1C
Figure' 2A
47t
Figure 2B
Figure 2C
Figure lA
Only'il item 7, from. figufe is not equal 'to zerd-,
** .Only if distances are to be, overridden. The number.of.'arei
is placed.in item 1, thd number of Ihe school is placed in item 2
and the distance is placed in item 3:
O
'
.64144.
7
;
.4
s.
0
2
;44 LINEAR- PROGRAMMING SYSTEM:. , ,
FOR SCHOOL LOCATION ND OACILItY,UTILIZ
S
a
->
I
0
0,
EXAMPLE OUTPUT
6
a"
0
.0"
)
*
.
. . . . . . . .,,,,
The output from a computer run consists of six formaq. Th' \
. W, 0,
first format is an echo-of the initial conditions (format 1). Thar,
.. .
'number of schools that are being considered in the problem (1A), the ;W:. ,
44:
N,
, ,01
5
combined capacity of the schools (1B) and the number pf areas from. .,
,IK
which a-pupil may be assigned (IC) pre d few of the coniNaints which
are echoed. ;The second format is a printout of the afeaedata tilOimat 2). °.
, 1 .
The area identification (2A), the number of pupil.whici will atitend each . '% N
grade (2B) and the tatio of minority pupils iii, each gradr(2C) are reported.
The third format.is a printout'Of the distances ;hat were' calculated ,
..
between each area and school (form 3). area 11)* (3A) , X ane-Y4.
coordinates (3B)., distance td each school (3C), school ID (3D) and school
tX and Y coordinates (3E) are on the report:- "The three formats described
4thus far are produced by the first progfam. The remaining three form t
are producedrby the second program using the MPS output data. The fourth. IA, A
format lists the assignment inforTation by area (format 4). The area Ib_..
.
.
,
(4A), number of pupils in the area J4B),Tercentage of pupils that are,. \
AN at- C.
part of a minority RC), school ID to which the pupils have been; assigpea
(4D) and'the number of pupils from the area that were asSigned to the. .
school (4C);\ The-fifth format lists the assignment information by sch6O1 °
(format S). .The (SA) , areas from which pupils are atsigned to
the school' (SB), number of pupils in the. area (SC) and the number of .
Ails from the area that were assigned to the school p(SD)Ohre.'lpre<«.
Also,inclUded-is a breakdown by grade of the xrunils assigned (SE) and,the4
percentage of eaqh grade's en/k--ament in relation to the whole school (SF).- ,
The final format is a statistical summary of the solution arrived at by ve.-.
MPS (format 61i . The school system name (6A1 is presented,in the title.U .,
16the total distance in m1 pupils will have to travel one way to attend' .
a`
-7`thechool to which they Were assigned for one day (6B), which Vludes
58.1
a
1 . -. fboth busing and non bUiing distances, the t
.
?
be bused one way on one day (6C), the number of pupils used (6D), the
number of pupilS that are bused away from the school close t to them
(6C), the cost of busing for one day (6F) and the school year cost of,--
.. v
busing are summarized in thi,s'final report.
(
istance pupils will
4
.
t
I
'69
ur
A
I
.
en
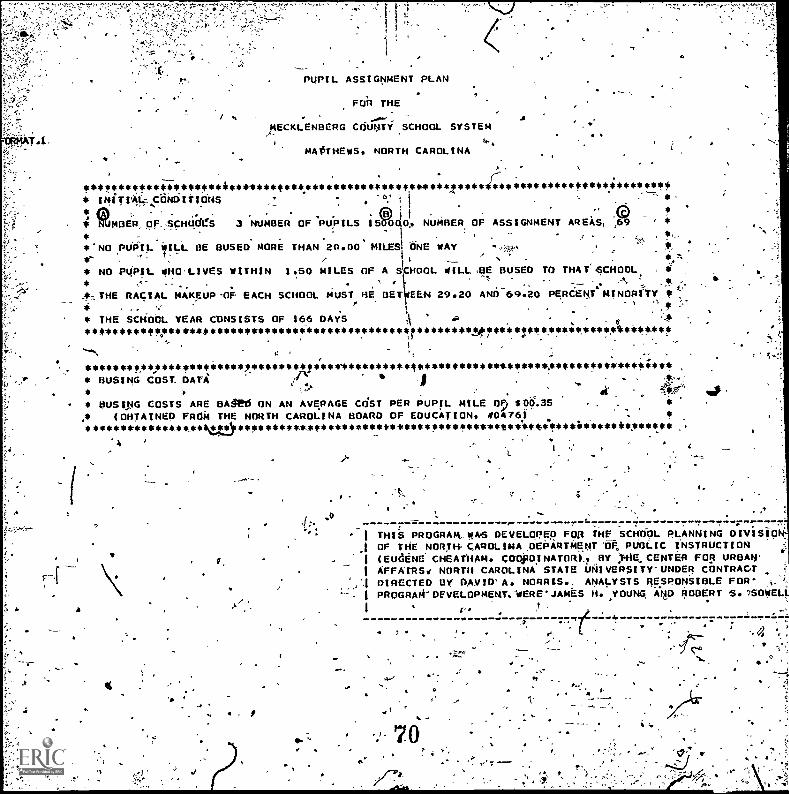
PUPIL ASSIGNMENT PLAN
FOR THE
MECKLENBERG COUNTY SCHOOL SYSTEM
MA#THEwS. NORTH CAROLINA
)_**
****************************4***************** *********/**************************' .
* INITIONDITIONS , *:* 1
* Cb 1
91 t t 0 4.
41 Mimeo; OF scHuces 3 NUMBER OF PUPILS 15u01G. NUMBER OF ASSIGNMENT AREAS, .69 ' *
e.
' "-'es
**NO PUPIL WILL BE BUSED MORE THAN 20.00 MILES! S! ONE WAY ' ,e .
..
/
* NO PUPIL MHO LIVES WITHIN 1.50 MILES OF A SCHOOL WILL' .
BE BUSED TO THAT *SCHOOL,__ '
* \
-- ,
4. THE RACIAL MAKtUPOF EACH SCHOOL MUST RE BET EtN 29.20 AND 69.20 PERCENT4MINORe7V *1
0. .
* THE SCHOOL YEAR CONSISTS OF 166 DAYS'A
.c4. . e
..#
**44***************************************i********.0,*******,******,****0*01.401
. ',:
s"."% c:. '
,
*****************44****,.*********************4,1*******************A**************** ,
. ... . 4....* BUSING COST DATA ( -J4* ,
.;
4
, '0
* MUSING COSTS ARE 8Aged ON AN AVERAGE CdST PER PUPIL MILE n9 $04.35 *
41' (OBTAINED FROM THE NORTH CAROLINA BOARD OF EDUCATION. 00476)*****************W1)**********.*************** *** * *** 4 ** ***4**'**4.*****(4****4*,****** *
.0
THIS PROGRAM MAYS DEVELOPED Fos THE SCHOOL PLANNING otvis0OF THE NORT CAROLINA ,DEPARTMENT OF PUBLIC INSTRUCTION(EUdENECHEATHAM. CODODINATORil BY ,HE_ CENTER FOR URBAN'AFFAIRS.* NORTH CAROLINA STATE UNIVERSITY'UNDER CONTRACT ,DIRECTED BY DAVID'A. NORRIS.. ANALYSTS RESPONSIBLE FORPROGRAWDEVELOPMENT.WRE'JAMES H. YOUNG, AND ROBERT 6.7SOWELL
1
c.43
4.
6
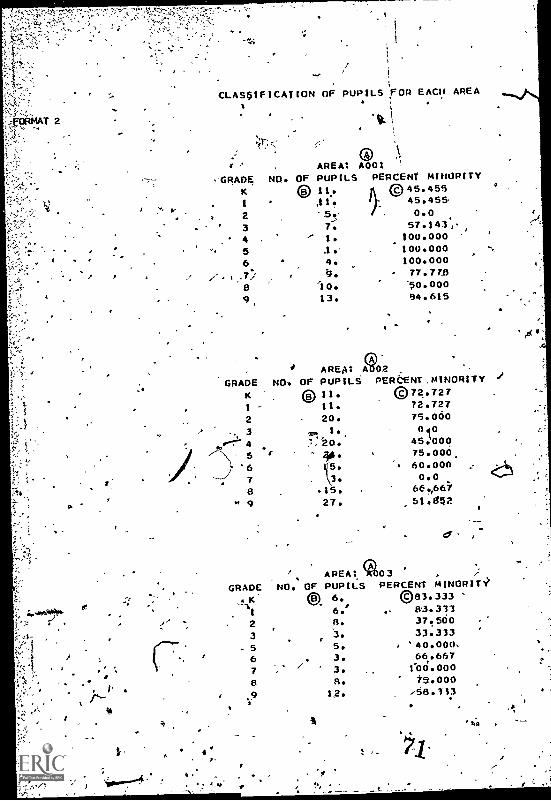
T 2
.
/
4*o,
1
CLASSIFICATION OF PUPILS FOR EACH AREA,
C)AREA: A001
"GRADE NO. OF PUPILS PERCENT MINORITY
(5)1 311,
2. 7.
4 1.
56 4.
4.
a lo.9 13.
045.455545.45
0.057.143#.,100.000100.000100.00077.778.90.00094.615
10 ARE A102
GRADE NO, OF PUPILS PERCENT,M1NORITYK 0) II. 072.7271 *1. 72.727
2 - 20. 75.060
3 =0 1. 010
0"7"ft"4 :::"20. 45.000..----",v 5 t
7
5r3.75.000
6 . ". 60.0000.0
8 15. 66.,667
19 27. 51*852
/ AREA: qL ' i3
GRADE NO..
OF PUPILS PERCENT MINORIT
AK 0. 6. ©83.333 '
I 6.' 83.333
2 8. 37.500
_3 3. 33.333e
. 5 5. . '40.000.
6,
. 3. 66.667
7 3. (00.000
8 8. t.0300
.9 IR. r58.113A
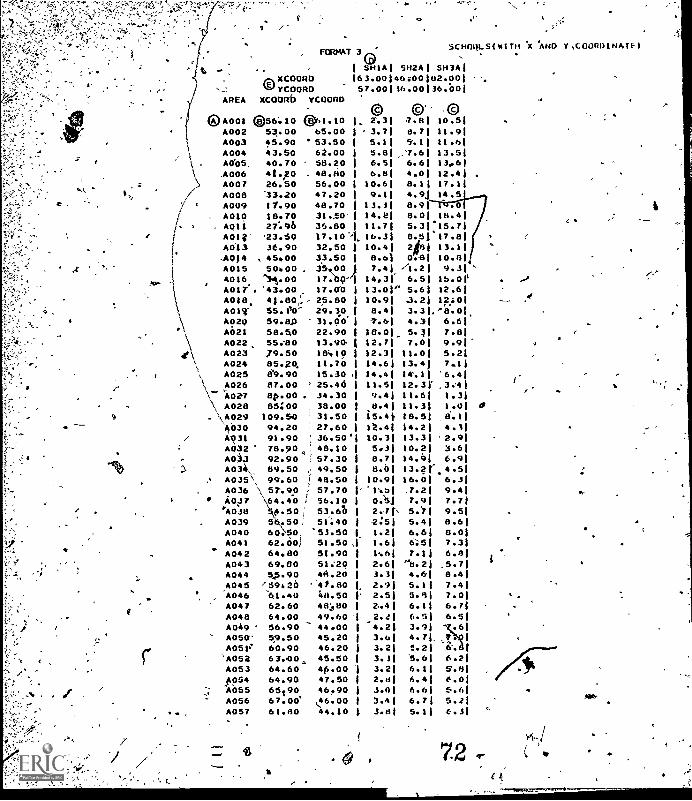
aNXCOORO/ 5/1PCOORO
AREA xcomb YC00110
FORMAT 36 SCH0111.5(WITH
1 SHIA' SH2A1 SH3A1163.00146i00102.90157.00136.00136.001
4 04001 056.10I
A002 53.00A003 45.90A004 43.50A0'05,
\ A006
> A007A008A009
, 4010AQII401;sA013,A0144015
O 1
I
(R61.1065.00
'53.5062.00
40.70 58.20. 48.80
26.50 56.00'33.20 47.2011.90 48.7018.7027.96 36.80'23.50 17.10-"'
36.90 32.5045.00 33.5050.00 , 3 00
4016 ''3.t.00 17.4017 11 '43.00, 17.00A048, 41.80,:., 2,s0210
4011. 55.110' 29,10,4020 59.8.0 31.00A621 58.50 22.90A022. 55.'80 13.90
ti 4023 79.50 1810A024 85.g0 11.704025 69.90 15.30
\ A026 87.00 ' 25.40
\ A027 . 34.30\ 4028 85:00 38.00\A029 109.50 31.50A030 94.20 27.604031 91.90 36.50AQ32 78.90., 48.10A03,3 92.90 57.30AO*, 89.50 49.50A035\ 99.60 48.50A036 , 57o90 57.70A0,37 \64.40 ; 56.10'4038 50.50; 53.01A039 5.50; 51:404040 60:s50, 53.504041 62.001 51.504042 64.80' 51.90A043 69.00 51:204044 5p.90 4A.20A045 /59420 ''41.80A046 61.40 411.50
4047 62.60 40:004048 64.00 49.604049 56.90 44.00A050' 59.50 45.204051e 60.90 46.20
45.504A.0047.5046.90
'4052A053A054A055A0564057
63e00,,,
64.6064.9065t9067.00. 1/446.00
61.80 44.10 1
O 0.'
. "31 '7.01 10.51.3.71 8.71 11.9$5.11 5.11 11.615.81 ,_'7.61 13.516.51 6.6$ 13.616.81 4.01 12.4110.6$ 8.11 17.119.11 4.91 14.5
13.31 8.9114.81 8.01 18.411.71 5.31:15.7
,16.31 8.5j'17.810.41 2181 13.18.61 0.-81 10.07.4$ /1.21 9.3
14,31 6.51 15.013.01° 5.6$ 12.610.91 3.21 12.08.41 3.31,^8.074.61 4.31 6.6
10.01. 5.31 7.812.r1 7.01 9.912.3$ 11.0$ 5.214.6$ 13.41 7.114.41 14'611 '6.411.5$ 12.31-9.41 11.61 1.38.4$ 11.31 1.015.41 18.51Ite41 14.21 4.110.31 13.31 '2.95.31 10.21 3.68.71 14.91 6.98.01 13.21%4.510.91 16.01 6.3'1'.51 '7.21 9.40.'5j 7.91 7.72.41, 5.7$ 9.52:51 5.4$ 8.61.21 6.61 0.01.61 6:51 7.31.61 7.11 6.82.61 '8.21 .5.73.3$ 4.61 8.42.91 5.11 7.42.51 5.41 7.0.41 6.11 6.7
.2.21 6.51 6.54.21 3.91 '7.63.613.21 5..21 6.3.31 5.61 6.23.21 6.11 5.H2.81 6.41 6.03.0$ 6.61 5.63.41 6.71 5.23.81 5.11 6.3
72,
X AHO YOCOOPOINAU)
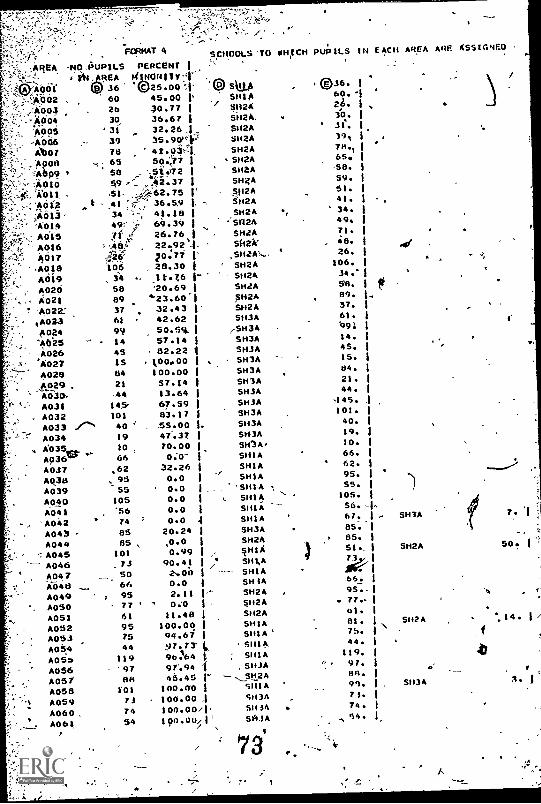
. FORMAT 4
,494A -NO.AUP1LS PERCENT -1
144.419EA MINORIMI.A001 936' .W25.00* IDSW.8-402 60 45.00 ' SHIA
4 S:1104904 30 36.67
24SH2A. .
0P4 24 .72 ./.
*095 .3( 32.26, 5U2A
-*006 39 35.90.1;`' S112A
Rtot 78 4!..03- SH2A
A006 ,- 65 5047 SH2A='441189 V 58 _',515072 SHEA
.41ipto 59,-- ,,42.37 SHEA
:-..Wott 41- ,:r.,.62.75 . $11244
: AO iz _at :,--,- 36.5,9 , . 51124
;A013- 34 ',-, 41.18A014
SH2A491 '', 69.39 ' S1124
: 440I5 f I ..:''' 26.76
44016
SH2ASH2 A"0 ..,48,0 22..92' .
4017 P-28": 70.77 ,SH2A',,.. '
4918 106 28.30 ' SH2A
A019 , 34 -,. 1 t.Z6 -. S1124
A028 58 '20.69 SH2A
.44021 89 423.60 . SH2A
, 44022: 37 32.43 50241
0,02a 61 42.62 SIOA
A024 9y 50.54. ,SH3A
A025 14 57.14 SH3A
A026 45 82.22 SH3A
.A027 15 1,00.00 SH3ASH3A
44028 84T.:::
14.92..921 SH3A
A030,- -44 13.64 SH3A
A031 14" 67.59 SH3A
. A032 101 83.17 SH3A
A033 .../' 40 ' 55.00 . SH3A
A034 19 47.37 SH3A
. PIO,
33 Ok "'" 66 0.0 SSHIA,H IA
10 10.00
A037 ' .62 32.26 SHIA
41838 , 95 0.0e SHIA
A039 -53 . 0.0 - 'SHIA ,A040 105 0.0
N
. 'A042. 74 ' 0.0 iiiIiii '
A041 '56 0.0
A043 - 85 20.24 SH3A
A044 85 , ,0.0 SH2A
-:A045 101 0.99 31-11A
A046 ,73 90.41 ,' SHIA
A047 50 2.on SHIA
A048 66 o.o
A049 95 2.11 -*
SHIA
A050 77 ' ' 0:0 5112A
4051 61 11.40 SI12A
A052 95 *0.0 SHIA
A053 75 94.67:11:142NA034 44 7.73'L
A05* 119 96.I64 l SHIA
A056 '97 9.94 ,SILIA
'..-A057 09 43.45 ' --- SH2A
A058 rot 100.80 SHIA
A059 73 100.00 ,1 51134
A060, 74 100.001 51134 .
. ...1AO6I 54 180.09;1's SH3A
AI
SCHOOLS -TO MI-9ICH PUPILS IN EACH AREA AlfE ASSIGNED
.(036.60.'zb.30.
' 3e.31,
79.,65.8.59.31.41.34.49.71.
, 48.26.106.
58.86.37.
61.19414.4S.15.84.21.44.45.101.40.19.
10.66.
' 62.95.55.105.56.-67.85.85.51.,
.7111:1
y.
.66.
. 77.01.01.7%.44.
119.97.on.96.71.74.54.
p
s'
/
SII2A
SH3A 3.
A
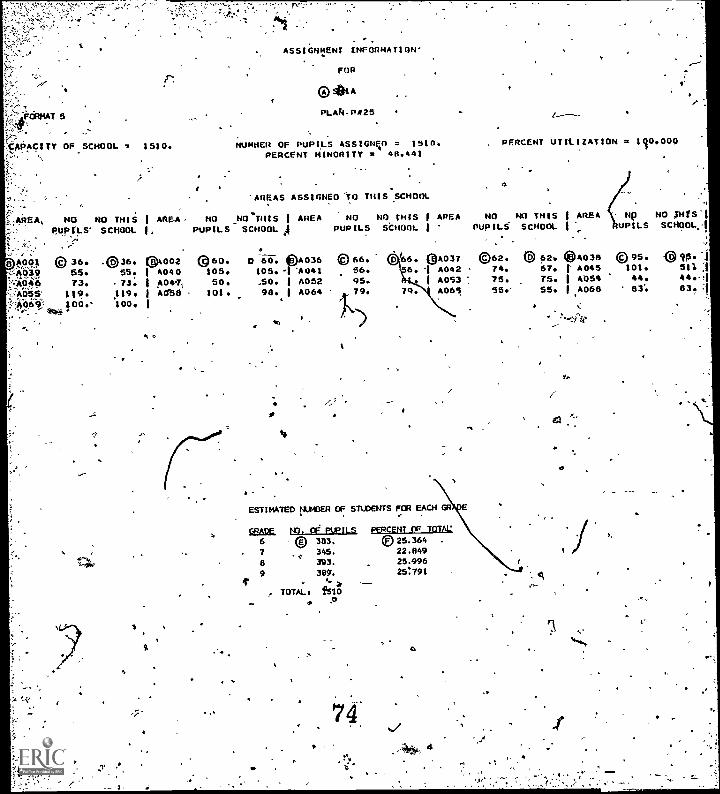
FORMATS
.
ASSIGNMENT ENFORINATION
FOP
O A A
PLAN-P125
).;1110ACITY OF SCHOOL = 1510. MUMMER OF PUPILS ASSIGNc0 = 1510.
PERCENT MINORITY = 411.441
'AREAS ASSIGNED TO 9Nisscrinnt
*EA. NO NO THIS 1 AREA, NO _NO THIS I AREA NOeimp.s SCHOOL I. PUPILS SCHOOL A PUPILS
.r'''..
M9J, (036 .00 360 ®%002 060. 0 60. 4DA036 1066.
-qP4? 55. 55. 1 A040 105..144041 56.
73 73. 1 4047;105.50. .50. I A052 95.
±',0; 15! 119 I Ad58 10I 98 I 4064 794069 1100 100 1
h.
,PERCENT UTILIZATION = 90.000
4
NO THISSCHOOL
I APEAI
NO NO THIS 1 AREAPUPILS soma. 1
0A037 1062. 11) 62. 4)40386: i A042 74. 67. t A045
1 A053 75. 75. 1 4054
79. 4065 55. IA068
ESTIMATED NumegN OF STUDENTS FOR EACH GR
94ADE NO. CF PUPILS PERCENT OF TOTAL
6 0 383. Of)25.3647 345. 22.849
8 393. 25.996
9 389. 25:791
TOTAL, /510
,
'74
..4.$1, 4
' Np NO ZHISs1upms SCHQOL.I
C)95r.10144.83.
IP1P°51144483.1
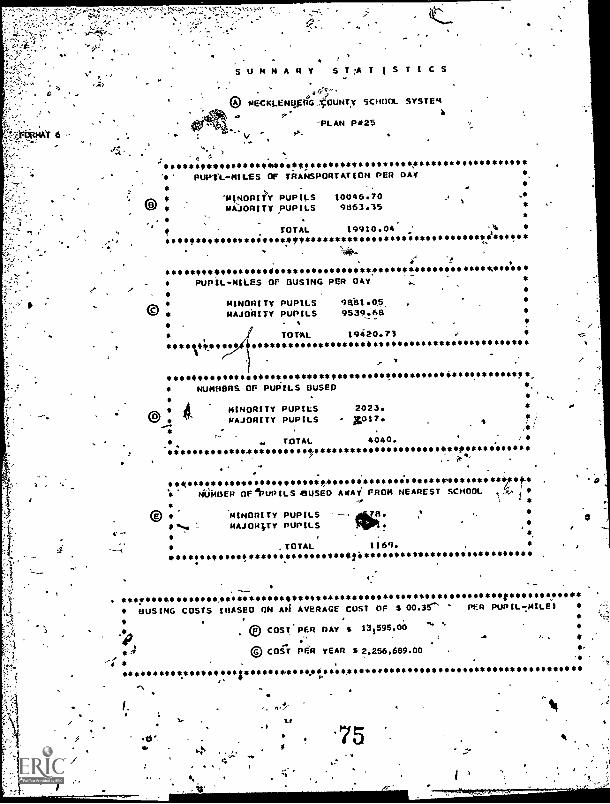
S U M M A R Y S T : A t IS TICS
NECKLE*445440uNT* 506)04.. SYSTEM
ti53624AtPLAN P425
PUPIL -MILES OF TRANSPORTATION PER 0.4*
111.140PliY PUPILS 10046.70MAJORITY PUPILS 9863.35
TOTAL 19910.04'#$
*1,4041, ***
I.
PUPIL -MILES OF BUSING PER OAY'
MINORITY PUPILS 988105. .
MAJORITY PUPILS 9539.68.
1TOTAL 9420.73*****14, **
4.
4MINORITY PUPILS
oat MAJORITY PUPILS ,1017.
TOTAL4 **
NONHORS. OF PUPILS BUSED
2023.
. .
4040.
*,
rig-1, ,
4,54 V
I,* NUMBER OF4OUPILSAUSE0 AWAY FROM NEAREST SCHOOL,,, \ I:
® MINORITY PUPILS 8. *
*.. mAJOR4TY PUPILS ripm:.4.
.TOTAL 1169.41`
. 4 3
BUSING COSTS (RASED ON API AVERAGE COST OF $ 00.35 ' PER PUPIL7MILE
..
4.40 COST PER DAY s 130
..95.00
.
...
v © COST Pea YEAR S 2.256.609.00 -i t **** : * *
vIr
75
e
1
4
I
4
*4
JOB CONTROL LANGUAGE FOR'THE.,*. ,
LINEAR PROGRAMMING SYSTEM FOR SCHOOL LOCATION
AND FACILIiy UTILIZATION
4
6
i9
RUN, SEQUENCE
4
1
444,
ti
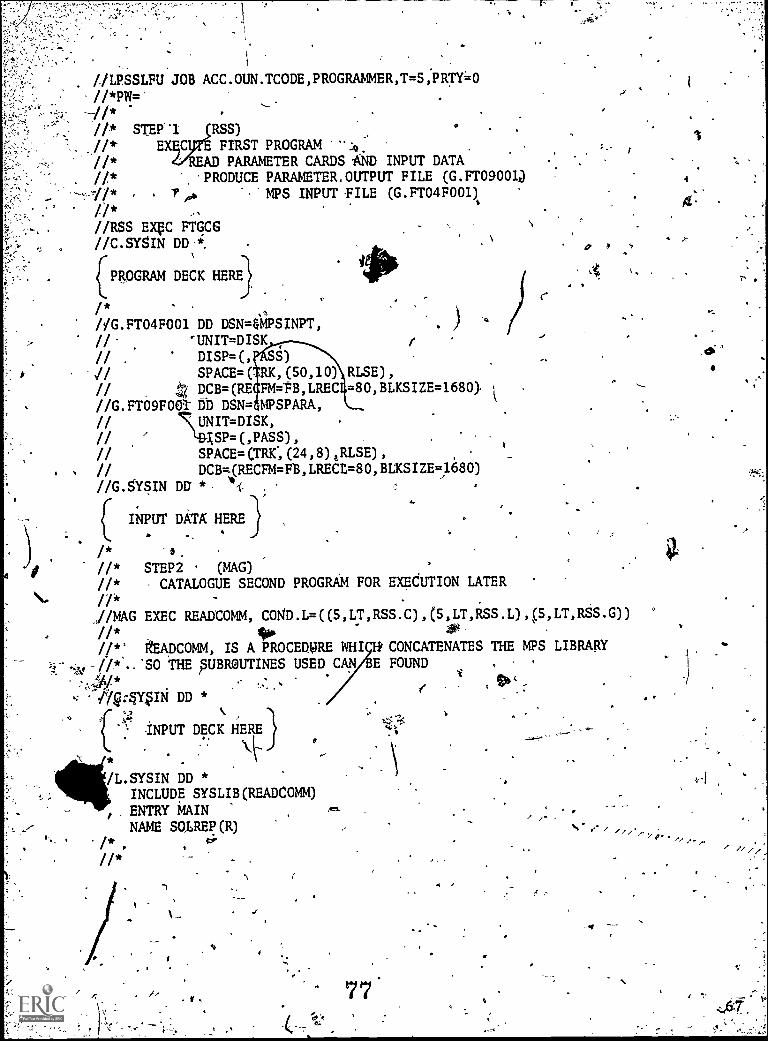
//LPSSLFU JOB ACC.OUN.TCODE,PROGRAMMER,T=5,PRTY=0
//*PW.--
---//*
/1*/1*//*/1*
STEPS 1 (RSS)
EXEC FIRST PROGRAMAD PARAMETER CARDS SAND INPUT DATAPRODUCE PARAMETER.OUTPUT FILE (G.FT09001)
1/* ,//*//RSS EXEC FTGCG//C.SYSIN DD
(PROGRAM DECK HERE
/*//G.FTO4F001 DD DSN=&MPSINPT,//- 'UNIT=DISK
// .DISP=(,
i/ SPACE=(
// DCB=(RE/ /G.FTO9FOOI DD DSN=
MPS INPUT TILE (G.FTO4F001)4
S)
, (50,10) RLSE),FM=TB,LREC =80,BLKSIZE=1680MPSPARA,
// UNIT=DISK,
// / ISP=(,PASS),
// SPACE=CTRK,(24,8)tRLSE),
, , // DCWIRECFM=FE,LRECE=80,BLKSIZE=1680)//G.SYSIN DD * i ,
INPUT DATA HERE), 4
I
STEP (MAG) '
CATALOGUE SECOND PROGRAM FOR EXECUTION LATER
//*.,
. .
EXEC READCOMM, CONb.L=((5,LT,RSS.C),(5,LT,RSS.L),(5
*0 .#
READCOMM, IS A PROCEDiRE WHI CONCATENATES THE MPS
SO THE SUBROUTINES USED CAN FOUND
/*//*//*
/ /MAG
/1*
149.74Y.FN DD *
.
INPUT DECK HERE
/L.SYSIN DD *INCLUDE SYSLIB(READCOMM)ENTRY MAINNAME SOIREP(R)
/*
.1
4
7 7(
9
0' 0
,LT,RSS.G))
LIBRARY
3
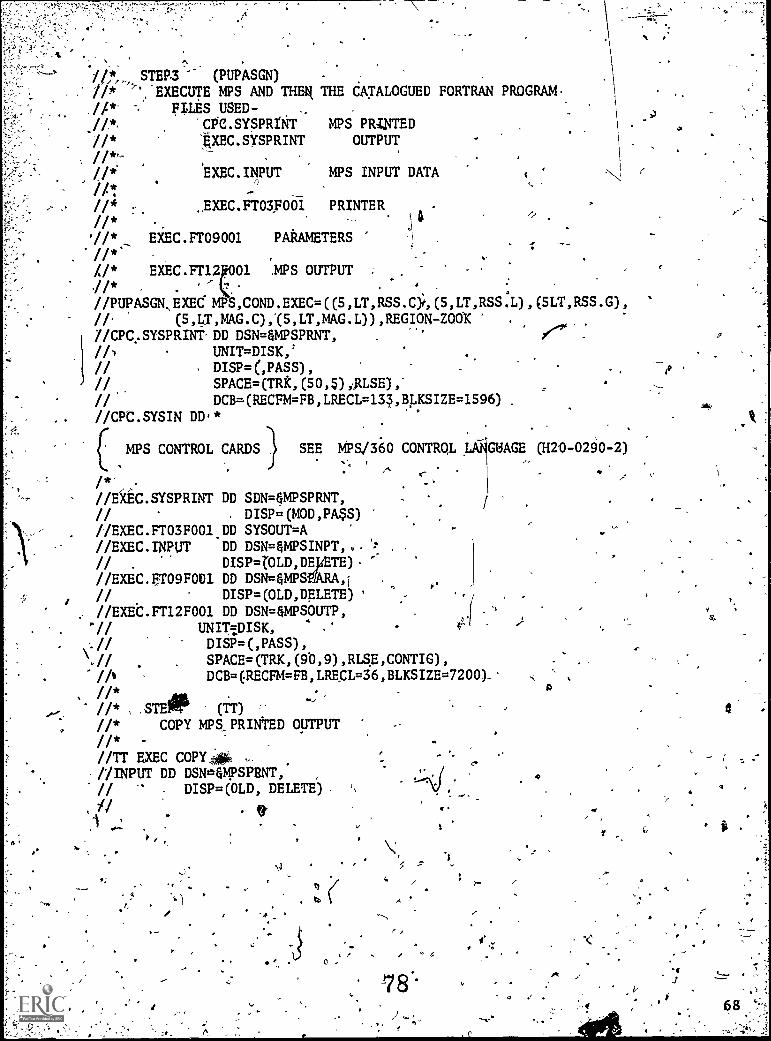
W/k,, STEP-3 (PUPASGN)
//* EXECUTE MPS AND THEN THE CATALOGUED FORTRAN PROGRAM
//* FILES USED//* CPC.SYSPR1NT MPS PUNTED
//* EXEC.SYSPRINT OUTPUT
//*-//* EXEC. INPUT WS INPUT DATA 4
//I//*//*11* EXEC.FT09001 PARAMETERS
//*1/* EXEC:FT12 01 MPS OUTPUT.11* '
//PUPASGN,EXEC S,COND.EXEC=((5,LT,RSS.C);,(5,LT,RSS.L),(5LT,RSS.G),
// (5,LT,MAG.C),(5,LT,MAG.L)),REGION ZOOK .
//CPC..SYSPRINTDD DSN=&MPSPRNT, . s :
UNIT=DISK,'DISP=(,PASS),SPACE=(TRK,(50,5),.ALSE),'
DCB=(RECFM=FB,LRECL=133,B,LKSIZE=1596) .
.
,EXEC.FTO3F001 PRINTER,
//I////////CPC.SYSIN DD,*
MPS CONTROL CARDS) SEE MPS1360 CONTROL LAIGUAGE (120-0290-2)
//EXEC.SYSPRINT DD SDN=&MPSPRNT,
// DISP=(MOD,PA$S)//EXEC.FTO3F001DD SYSOUT=A
//EXEC.INPUT DD DSN=&MPSINPT,.. .
// DISP=tOLD,DEPTE)-//EXEC.ETO9F001 DD DSN=&MPSORA,i
1 // DISP=(OLD,DELETE)//EXEt.FT12F001 DD DSN=&MPSOUTP,
UNITIDISK, rr
DISP=(,PASS),
\.// . SPACE=(TRK,(90,9),RLgE,CONTIG),
//I DCB=(RECFM=FB,LRECL=36,BLKSIZE=7200)_.
//* , .STE041 (TT)
/1* COPY MPS,PRINtED OUTPUT
//* -
//Tr EXEC COPY i0/ INPUT DD DSN*&MPSPRNT,'1/ DISP=(OLD, DELETE) .
// 9-
1
f;
to 1
-7 8
2
4.
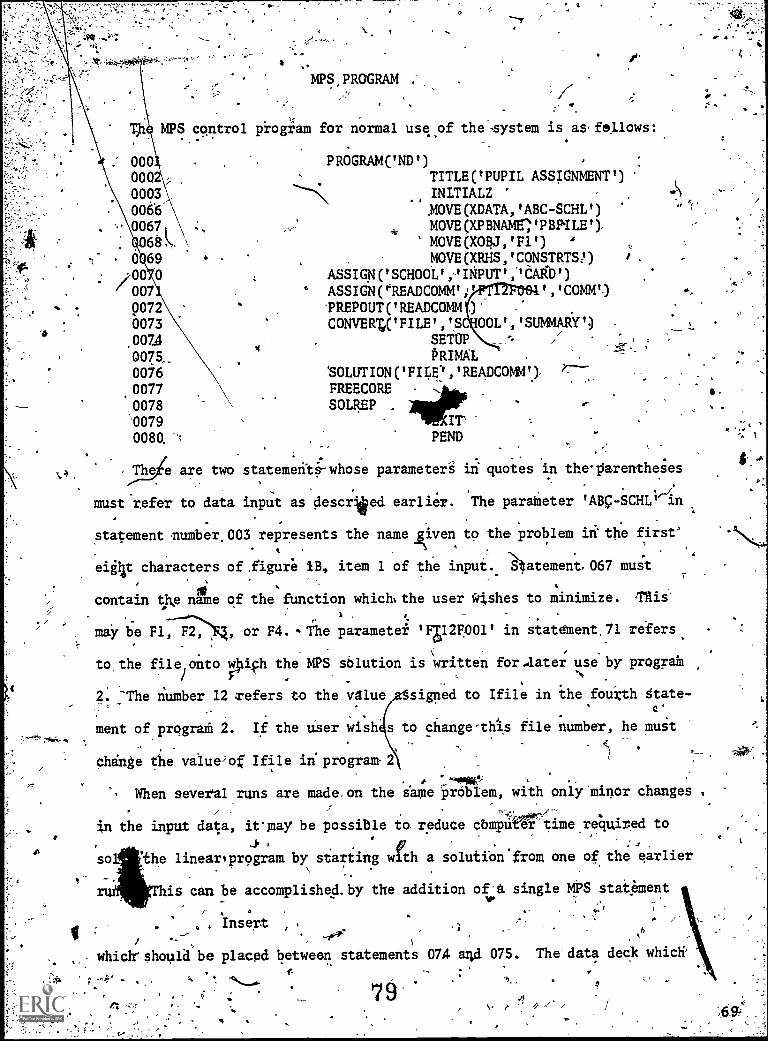
,
MPS,PROGRAM .
'S
MPS control program for normal use,of the-system is as, fellows:
000 PROGRAM('ND')
000 ;,, TITLE('PUPIL ASSIGNMENT')
0003 '''."'S 4P INLTIALZ 48 .. _
0066' MOVE(XDATA,'ABC-SCHM) - 1..
0067i , * MOVE(XPBNAME;'PBP1LE'),.
.068! MOVE(XOBJ,'F1') ',,
z- . 0 69 . MOVE(XRHS,'CONSTRTS) / .
/00'0 ASSIGN('SCH001.',JINPUTc'tAgD1)007 ° ASSIGN('`READCOMMY ','COMM') .,-,
,
9072. PREPOUT('READCOMM ) .'
0073. CONVERU'FILE','S OOLYSUMMARY') .
.00 SETUP -- / , .
PRIMAL..-.f.,a
0075.., ..
0076 'SOLUTION('FILEI,'READCOMM') r----
,0077 FREECORE s.
0078 SOLREP ..
Pi
0079 , IT _- t
0080. 't .PEND * ,
., l4 .
6. ..
S4 .3t0e are two statemerit-whose parameteri in quotes in theliarentheies..:
;*
must refer to data input as descried earlier. The parameter 'ABg-SCHL' in
statement number,003 represents the name sliven to the problem iii the first'
eight characters of .figure iB, item 1 of the input. 14atement.067 must
contain the name of the function which. the user Wishes to minimize. 411is'
may be F1:;y4, or F4. The parametei 'F;12F001' in statement,71 rifers -
to the file onto 1014h the MPS solution is written for..aater use by program
. -The number 12 refers to the vdlue signed to Ifile in the fourth State-
. .
ment of prograda 2. If the user wish s to change-this file number, he must
change the value)of Ifile in'program-2
, When several runs are made on the same problem, with only'minor changes .
in the input data, it%pay be possible to reduce cbmpAg-time required to
47SO 'the lineartprogram by starting with a solution'from one of the earlier
is can be accomplished. by the addition of A single MPS statement
r, Insert
whicirshould be placed between statements 074 arid 075. The data deck which'
f :
7 a1 ne ..
".0"."---4
'4 ''0
.S i i t'.contains the. earlier solution should follow the MPS program.,
't N
..The card deck with this los solution can be obtained by insertig't :,... _
the statement . ,. ti,., - t .
Oil 4 / I/-
.- ,
. ;
, .....-...
Pun
.,,
sIN.;:,,
. . %. .
between statements 0075 and 0076 in the MRS:program.r.
. -
., ;.....
... .
There may also.be situations for yhich the user will want toevaluate.
1 ,
a solution obtained by'some other means. _This solution should be punched.
. ,-
in the same format-asthat provided by MPS. Again the MPS program which
uses this solution must contain the insert statement and the data must
.
follow the MPS program.
t
z/
1.
V
r
80
9
O
/
1\
S
cj
to
LINEAR PROGRAMING snip.
FOR SCHOOL LOCATION AND.FACILITY UTILIZATION .
FILE ORGANIZATION
.0
,
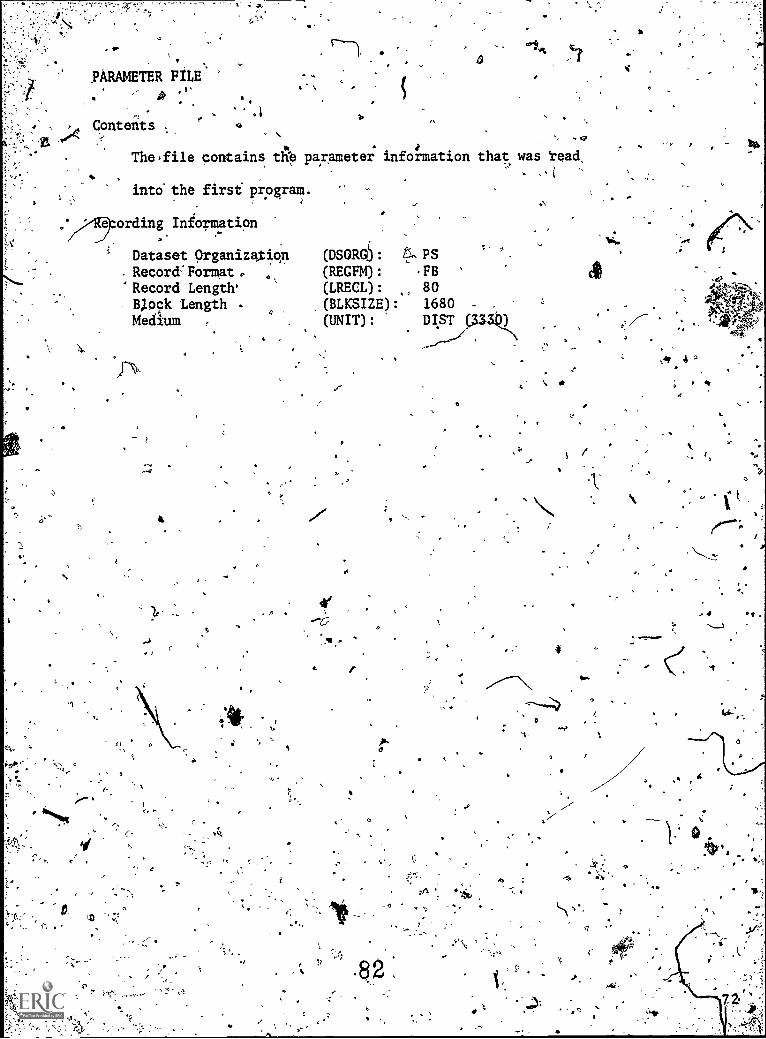
PARAMETERPfLE;'1".
ei4, Contents
Thefile contains t4 parameter informatlon
into the first program.
e ording Information
Dataset Organization. Reoor&Format..'Record LengthsBlock LengthMedium
4
o.
4
(DSORG5: IS PS
(RECFM): FB(LRECL): 80(BLKSIZE): 1680 -
(UNIT): DIST
.1
8
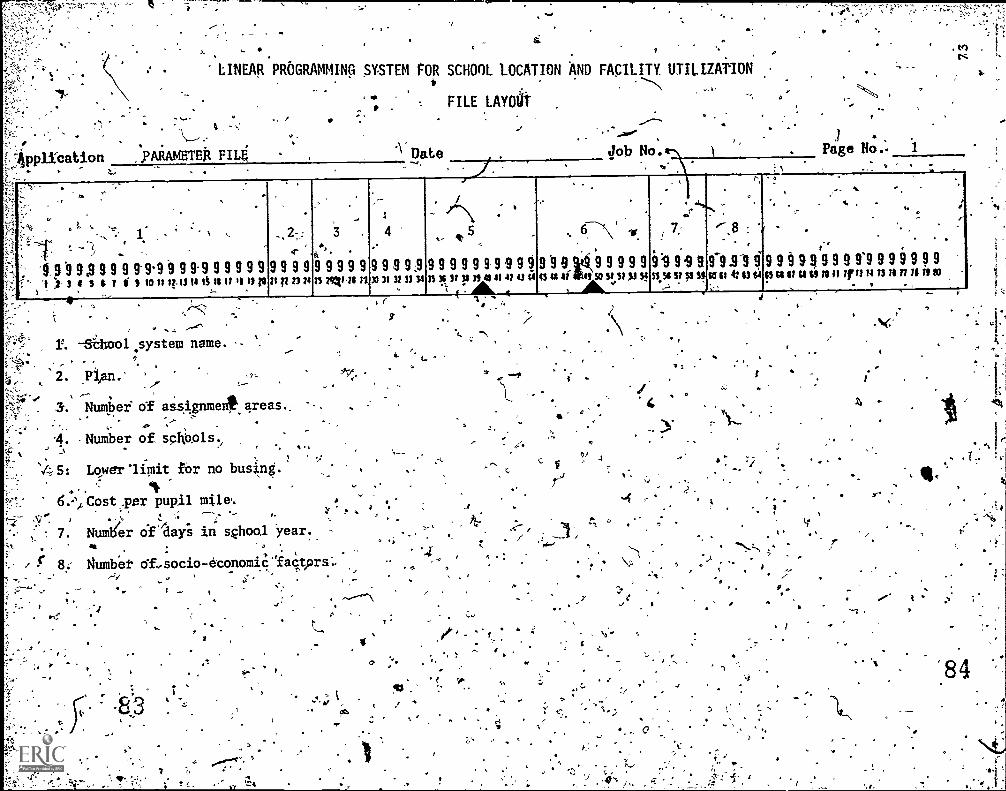
9
LINEAR PROGRAMMING SYSTEM POR SCHOOL LOCATION AND FACILITY. UTILIZATIONI
r.
pplication .PARAMETEitFIL
FILE LAYOUT
Date Job No.I
. Page No.-,
I
,........
tt.'91
s
.
g, 1,..
: --.'-ii
9 .9 949 92`1 4 S 4
-
, .
..,.. .'' 1 \
. .,
9 9 991-9 9 9.9 9 9 9 9 9/ I S IIIIIII.1.114 It isitititportnzanmenn,323inn}in3snlincomcoutitsiss
.
2,,
9 9 9 9
,-
..,
9 9 9 9 9
_0
4.9 9 8 91
"
,. /P\ :
5. 4t, .
9 9 9 9 9 5 9 9 9 9
1 . AL
.. ..
,
9 9 9 1099999491S/1.1Sf
(11419A19"P
1
0
.9
53StS/pSiitlil4:835:1656$8/11t91941/r/11-173117111410,.,
.,-
.
-
.8 :
,
9-9.91 i
: .. -. -
r .G.. t
..
9 9 8 9.4 9 9 9 99 9 9 8 9 9 9
. . , ,
if
system name. -
2. .Ptan.
Number of assignmedt areas._
'4. Number of spl101s.,c4-
%; S: Lower °limit fOr no busing.
6.Cost /per pupil mile. A .
.
7. Number of `days in school year.
8.- Number of,socio-etonomfaCtprs-,
;
7
1
- .9
.
-
.
40.
.
rAI
- s-a*.
c
4..
. .
f
4'
r
;.
'84
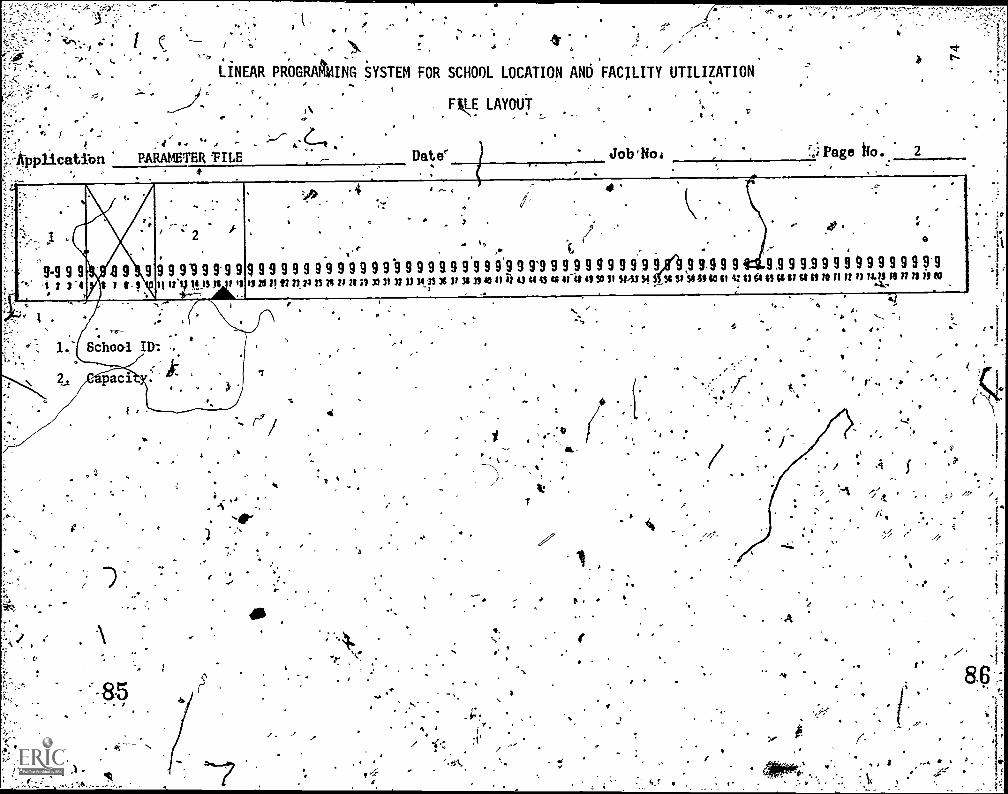
.. ,.. , ,,
.4.. . ; - `. t :
-- N . ..,..
,LINEAR PROGRAMMING SYSTEM FOR SCHOOL LOCATION AND FACILITY UTILIZATION
Date'
Fk_E LAYOUT
Job'No
,
t
L_
7O; Page Ho. 2.
.j',9.999°
-$ 2 31' ,_
899 2 $.$I
9
' 2
99 93 99'99li 19`q 99.19X9
le.-.7
.
.
999 9 9 9 9 9999 99319 29 2! a ns 73 21 n n n X2 31 /3
9999 919 14 IS 36 11
1
.
. to
,
9. 9999 931 11 13 21 rt 43
.
9'94145
,
9 99 999 999 999 11-4. II SO V 31-41f ....,54
... ol>. , it
e/
J,99.999 92 2 22 9 99 9 9 9 9999-2SA9411011 4211911311$2 SS it TO /I It 1/ 71.1.141 tl /1 il XI
v.
..
.
it
r
i
/.
z
1
.;i
:0
it
f
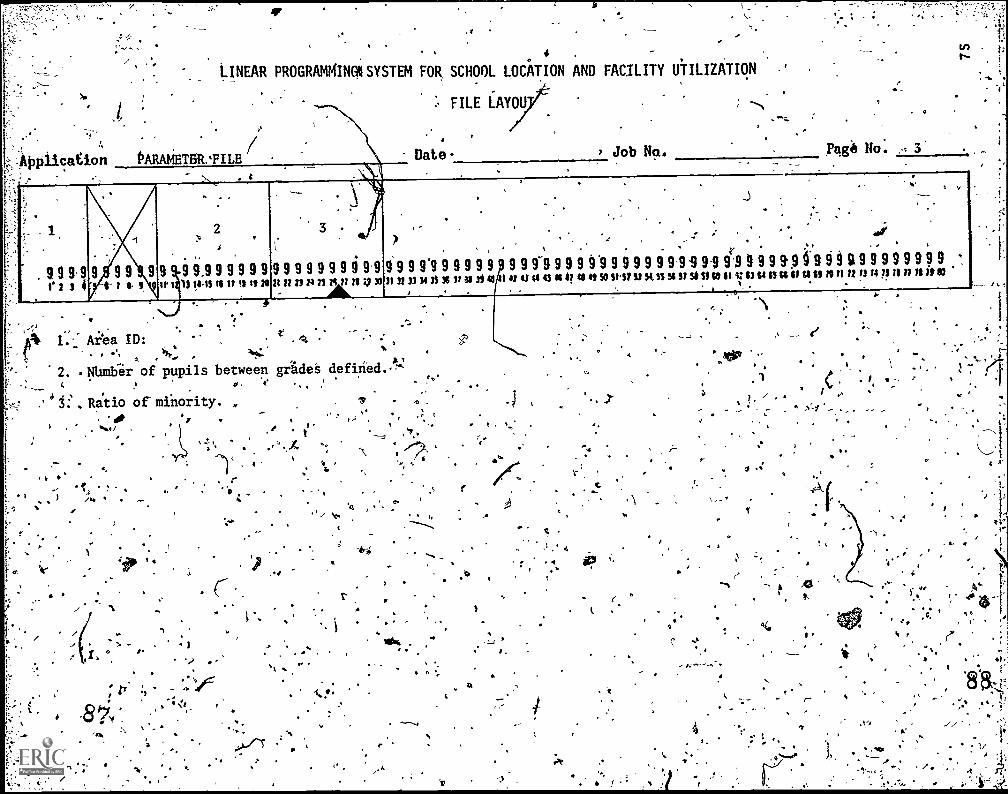
/LINEAR PROGRAMMINCli SYSTEM FOR SCHOOL LOCATION AND FACILITY UTILIZATION
FILE LAYOU) ;
:A plicafton PARAthETB11.FILE
9
Date ' Job Na. Page No. 3
4.-
.1
.
. 9 9 9.9l'234Cre,,Irt11144s1111111920111nnnufliennoenousiou4!onmsPosamssms/Ustmovuuntsussumnnnuysionnitm*
.
9 99 99
. ... ..
2y
1
.t .
9 9.9 9 9 9 9 9
.
..
..
1
9 9 9 9 9 9 9 9 9'9
11.411."I n
. . . ..
.. ,. i .
, `.. .
. -. .
4 0 ; .
) ' i '''de
10 ." '
9 9 9 9'9 9 9 9 9 9 9 99 9 9 9 0.9 9 9 9 9 9 9-9.9 9-9 91 9 9 9 9,9 4 9 9 9 119 9 9 9 9 99 9
%
.. . -. e
v
',
I. Arba ID:s
2. Nlimber of pupils between grAdeS defiried.-C
,. t; . Ratio of minority. .
, ' ...../ . . . st
; .
'Y \*Y1-)^,......X. -0
,, i
%
0l'a . . t.1
t ,)/ 1 a .
4
I
.
"t 21.
&
1
..
44.
.
A, ,A," I ,7
-..
1
171
4
4
4
. ,
4
fit
t.
'4 2
I\
oC
.
'
. .4
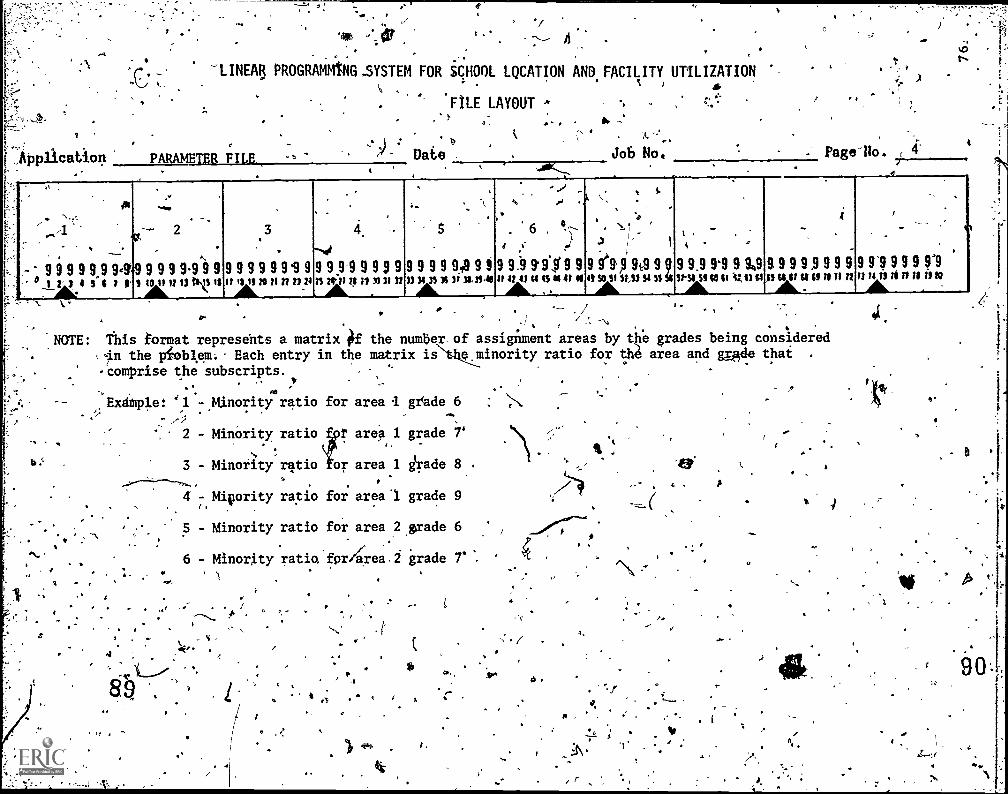
LINEAR PROGRAMMUG SYSTEM FOR SCHOOL LQCATION AND FACILITY UTILIZATION
FILE LAYOUT A
PARAMETER FILE.) : Date -
, .
Job No. : Page-No. 4-*
,,
. -.
,1- ,
999 999941. a I t 3 4 S $ 1 1I
' ,..-....
9 99 9-99' 9I 40 I I I / 13 O t t S ItAL
.
.399 99 99'9 999It 11191ln 1121 24AL
.
4.
-..,,
9-9 9 9 9 9?I r t t ; n rim It 12
.
.,
'8
.
9 9 9 9 9,p9 9 i33 m 31$ J; 31,39.49AL .
. .
4. ..1
6 ,
,
9 9 ."9 9. 9.$ 9 99MO 4)44 43 II 41 4
t 4.
.
"?, .
-,
.) i
e9',994 9 994 SUSS S4 SS S4
IAsc'si
,
.
,
9.99'9 9 9.,9SillISS SO II %,:,1) SIS3AL
-
99 99,999 9Sin WO till 12
.
,
,
-
991 999 9'9li It I. 3 li 1111 if 10
.
NOTE: This format represents a matrix Of the numberin the pioblAm. Each entry in the matrix- comprise the subscripts.
.Exdtple! '1 - ,Minority ratio
.
89
b.
2 - Minority ratio
3 - Minority ratio
isof
for area 1 gthde 6
r area 1 grade 7'
or area 1 grade 8
4 - Mifority ratio for area '1 grade 9
* f0 .
assignment areas by the grades being consideredminority ratio for 04 area and gOe that
5 - Minority ratio for area 2 grade 6
6 - Minority ratia.for4rea 2 grade
a
4
/
o,
V::
r.
ti
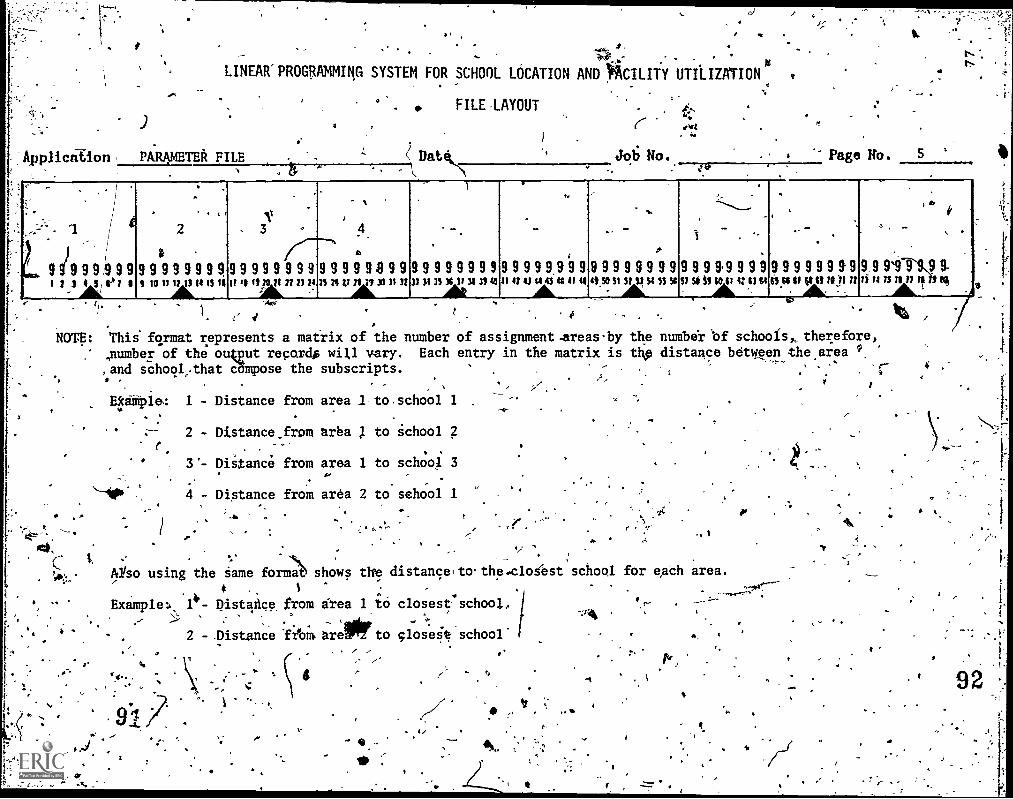
Application
0
: . .
LINEAR' PROGRAMMING SYSTEM FOR SCHOOL LOCATION AND 'ACUITY UTILIZATION
g
PARAMETER FILE
FILE LAYOUT .
J.;
0,4
DatOL Jot; No.. Page Ito. 5
t-.
.10
- . ..
.
L 9 9)9 9 9 I 9 9I : 3 i s et $
-
2
9 99 9 9 9 9 99 10 It n u ti IS i
V3 -
9 9 9 9 9 9 9 9It 4 ti2onnnvnnz3,1
- s
4
9 9 9 9 9 8 9 931 I?
1AL"
t
.
9 9 9 9 9 9 9 933 31 i 31 39 la
nAk3"
,,
-
9 9 9 9 9 9 9 9II It &I 44 4$ IS It 41
AL
,-
9 9 9 9 9 99 94, 50 St St SI St 5$ 51
9 9 9 9 9 9 9 9Sf Si SI le ft i: it 61
--.
9 9 9 9 9 9 9.963, 6$ St it 0 Ittil /I
,
-
9 9 9'9 9 9If Ti is ts n n
AL9-%
.
'4AW
. .
NOTE: Thii fqrmat represents a matrix of the number of assignment-areasby the,number of the ou ut regards will vary. Each entry in the matrix is thp,and schoql.that cmose the subscripts.. ,
,,..,
,
41k.f.
J.
EkaMple: 1 - Distance from area 1 to school 1
2 - Distance from area l to School 2
4
3'- DiStance from area 1 to school 3
4 - Distance from area 2 to school 1
:5
aso using the Same form shows the distance(to-the.clogest* 1
Example:, 1i- Distance, from area 1 io,J J :
:
'
2 - .Distance from arePto
.
9:1
closest school,
close4 school'
4/
I
number of schools, therefore,distance between the area
-55, I
school for each area.
Igh, 4
.
4
o'
92
1'
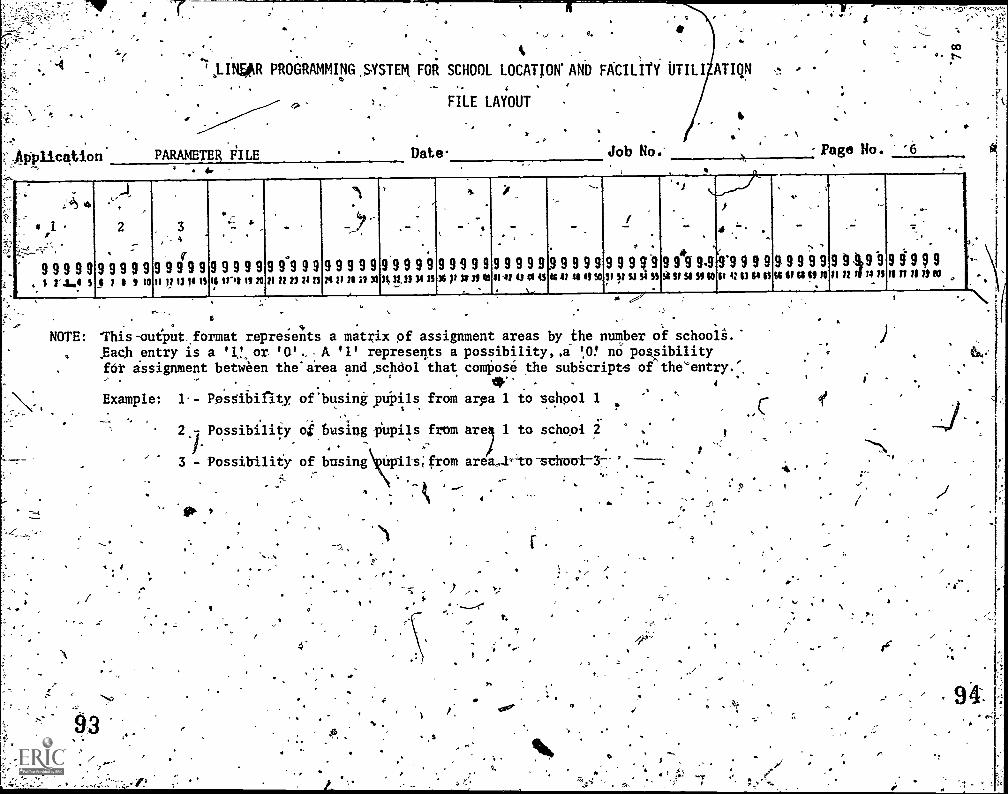
Ap-plctition
a
.
J.INFAR PROGRAMMING .$YSTER FOR SCHOOL LOCATION' AND FACILITY UTILI
PARAMETER FILE Date
FILE LAYOUT
,
ATICIN
r.
Job No.' Page No. '__6ti
00 t4 .1
1
te 1..
1,,,__-_,.7:
9 9 9 9 9* t 2'4.1 1
i
9 9$ /
2
-'''
9 9 9f to
3
Or
9 9 9 9 9rr tt 13 It IS
,_-
.
9 9 9 9 9IS trIS 11 20
-
.9 9 9 9 911 1; 23 11 n
._
9 9 9 9 9Pt 21 21 il V
-9 9 931,11.11
-.
9 934 33
9 99 9 936 p lin
_
9 911-1/
9 9 994.1 VI 43
911
-
9 9 941 SO
/of ,
9 9 9 g931 It 'JOSS
.
-* \
9 9 g 9,9919St SF S. SOO
9 9is V $3 61 0
,.-
-9 9 9 9 9Si ill 611 If /0
9 9: 99II /1 / ussninnoto
..
9 9 9 9 9
NOTE: l'his-output format represents a matrix of assignment areas by the number of schools.Each entry is a '1.!, or. 'O.' . A '1' represents a possibility, A t0! no pos,sibilityfor assignment between the' area and ,schdol that compose the subkripts of the'entry.',
Example: 1 Pesgibirity of 'busing pupils from aria 1 to school 1
I
2.7 Possibility of busing Thipils from 1 to school 2
3JJJJJ-
Possibility of busing upils; from areaFto 'school 3 '
&
t.
.
a.,"f I.
94-as.
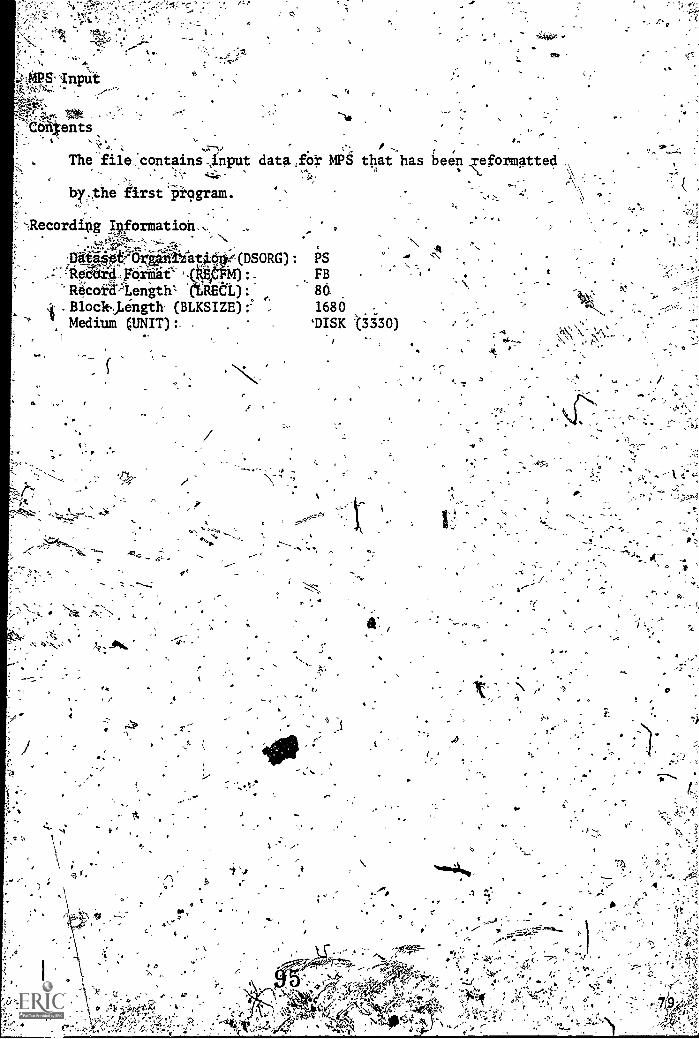
ents
The file...
contains Input data,fOr MPS that has.0
. ,'program.br,:the first program.
ti
-.Recording Wormation
Diike40?GrAn,,
Fte?cora.length-'
Bloc1t.,Lengt (B
.
(Yana):LKSIZE)
Medium (UNIT) - .
4. s".:. N 0
iy
N AV
f
4.,
: PSFB
1680
`DISK (3330)
e
been reformatted
44
4
4. -
L
;4 :4
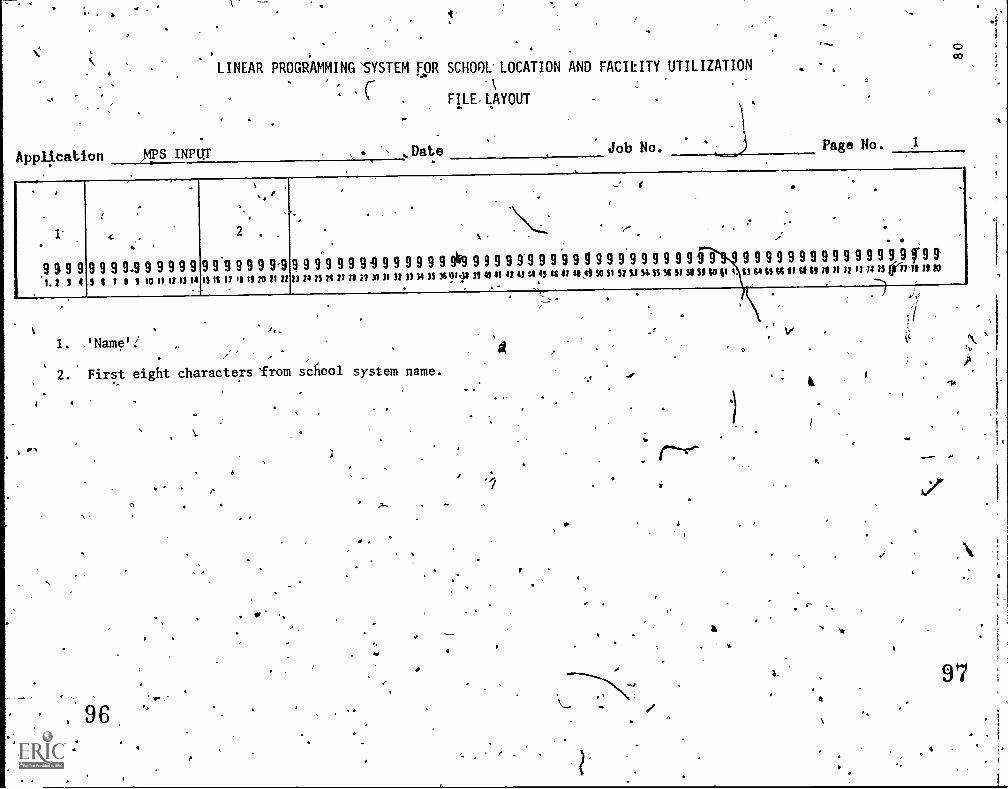
Application ,MPS INPUT
LINEAR PROGRAMMING 'SYSTEM FOR SCHOOL- LOCATION AND FACILITY UTILIZATIONr
. FILE LAYOUT
,Date Job No.
co
Page No. 1
,
1-.
9 91. 2
9 93 4
,.
9 93 8
4
9/
.
.
9.9 9 9 9 9 91 1 10 II I? 13 14
.
2 .
9 9.9 9 9 9 9,9
IS It11H11 70 11 11
.
, .
,
.
9 9 9 9 9 9 9 .9 911 74 13Mt1It 21 11 31
.
9 91 7 33
9 914 31
.
9 9119 91611t.? 31
.
9 940 41
_, .,
. - .
\-:...' ,,,.- . .-
.
. . . .9 5 9 9 9 g 9 g 9 9 9 9 9 9 9 9 9 -9 9 9 9 9 9 9 9 9 9 9 9 9 9 9 9 9 g° 943 4.1 44 43 tt 41 41,41 SO SI Si 51 Si SS 56 51 SS SS 10 61 4. 6S 61 IS 66 $1 st $9 /I II 1? /3 /4 IS prim 31
-, i
.
510
A
1. 'Name':
2. First eight characters 'from school system name.
6
o
CT
S
4
,
A
1.,
I. 6
97
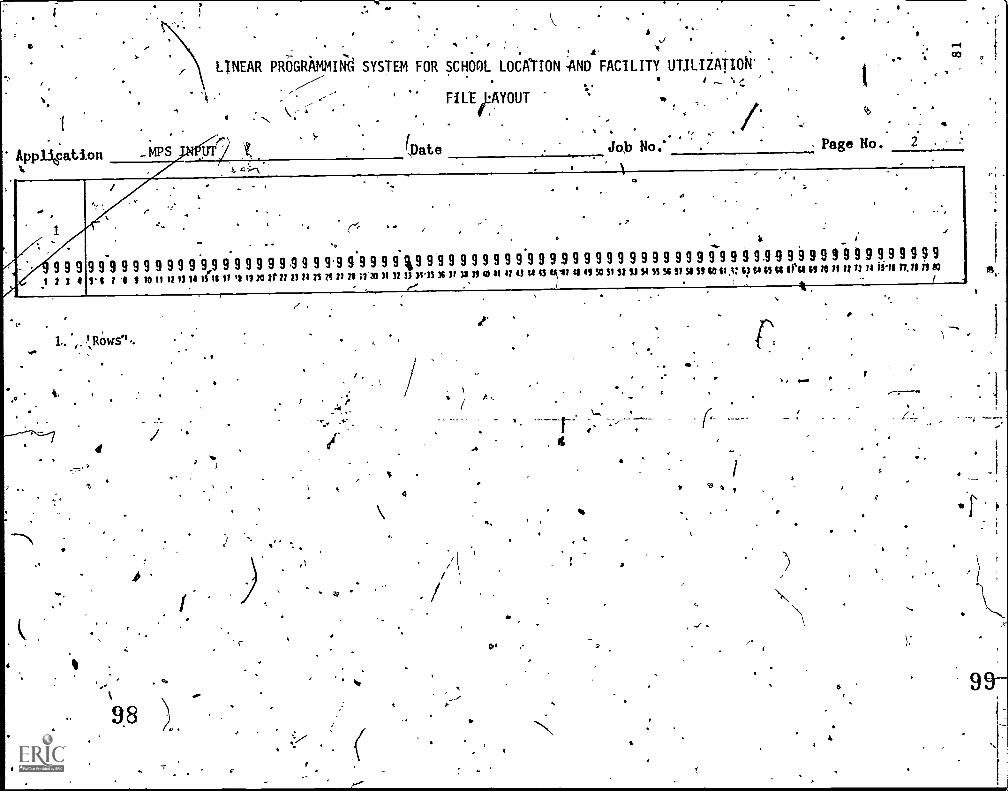
AppLitcation _MPS
1
LINEAR PROGRAMMING SYSTEM FOR SCHOOL LOCATION :ANDS FACILITY UTILIZATION'
o4 "
FILtipAYOUT
(pate Job No.' .Page No. 2
1
I
. ,O
9 9 9 9 9 9 9 9 9 9 9 9 9 9,9 9 9 9 9 9 9 .9 9 9 9.9 9 9 9 9 9 %9 9 9 9 9 9 9 9 9 9 9 9 9 3 9 9 9 9 9 9 9 9 9 9 9 9 9 9 9 9 9.9 9 9 9 9 9 g 9 9 9 9 9 9 g 9 9
1 2 3 4 1. $ .1 10 II 11 13 la is Is 22 is Is 20 2t 11 13 11 10 11 11 II 31'30 31 )2 31 341S 36 3/ 3$ 31 40 11 11 43 44 43 ssit ss 41 so st St 13 14 SS SC SI S1 S1 40113: Cl W ss Oro 19 10 11 I/ /I 14 &II rtr s 21 00
r%,
L. !Rows'' .
4,
4
98
4
4
1 - p
O
CO
1
-1, .
. . . I
)
6 99-
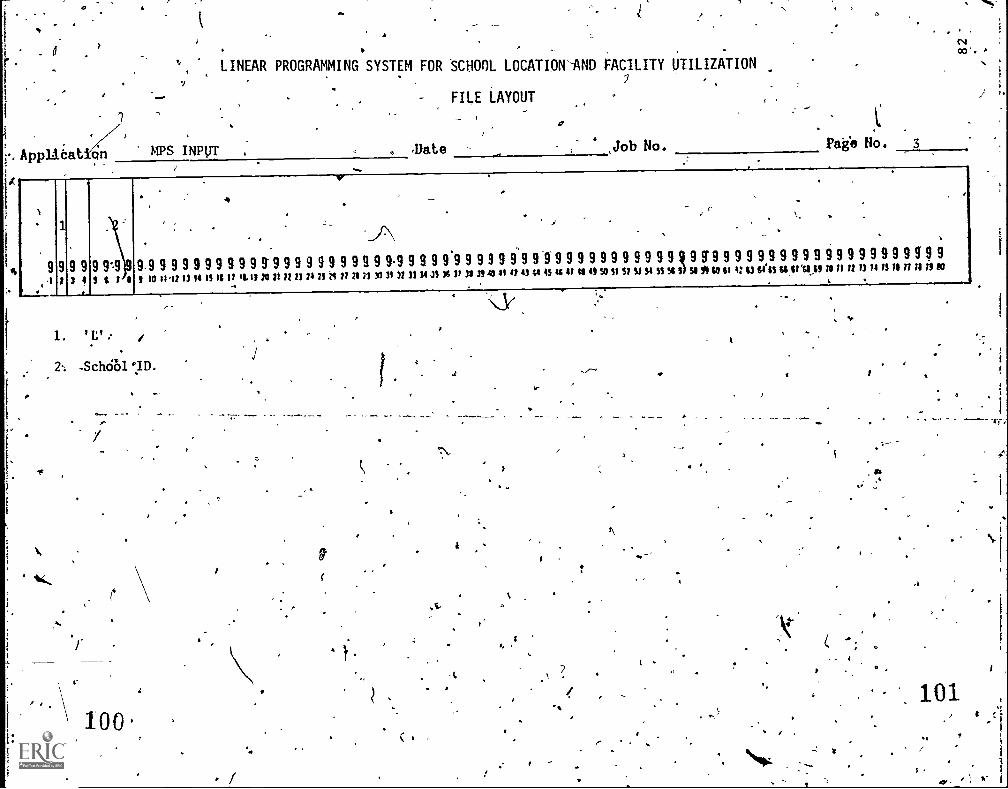
LINEAR PROGRAMMING SYSTEM FOR -SCHOOL LOCATION-AND FACILITY UTILIZATION
FILE LAYOUT
MPS INPUT :ApplUat on . Vale
V
is
,Job No. Page No.
1
9.1
9 9 92 3 4
9 919 9 t 9
.
4 .
. -
. ..A9 9 9 9 9 9 9 9 9 9 9 9 9 9 9 9 9 9 9 9 9. 9 9.99 10 is it 1314 IS It It IL st 20 11 It 23 24 25 ti II II 21 30 31 32
..
9 933 34
'
,
9 9'9 9 9 9 9 9 9 9-9_9 9 9 9 9 9 9 9 9 9 9 q 9 59 9 9 931 36 it 31 31 AO SI 1/ 43 44 IS SS 4/ IS 4, SO SI St Si S4 SS Si Si SS IV SO SI 42 13
_
,
_
9 964.13
,
. . -. . ,
9 9 9 9 9 9 9 9 9 9 9 9 9 9 960 1111,0 SS 10 il 12 li 14 IS is n n n so
_ .....
1. L'
2-. .Schdbl
100
4
- 1
C
t
101n5 r
,
$
I
1
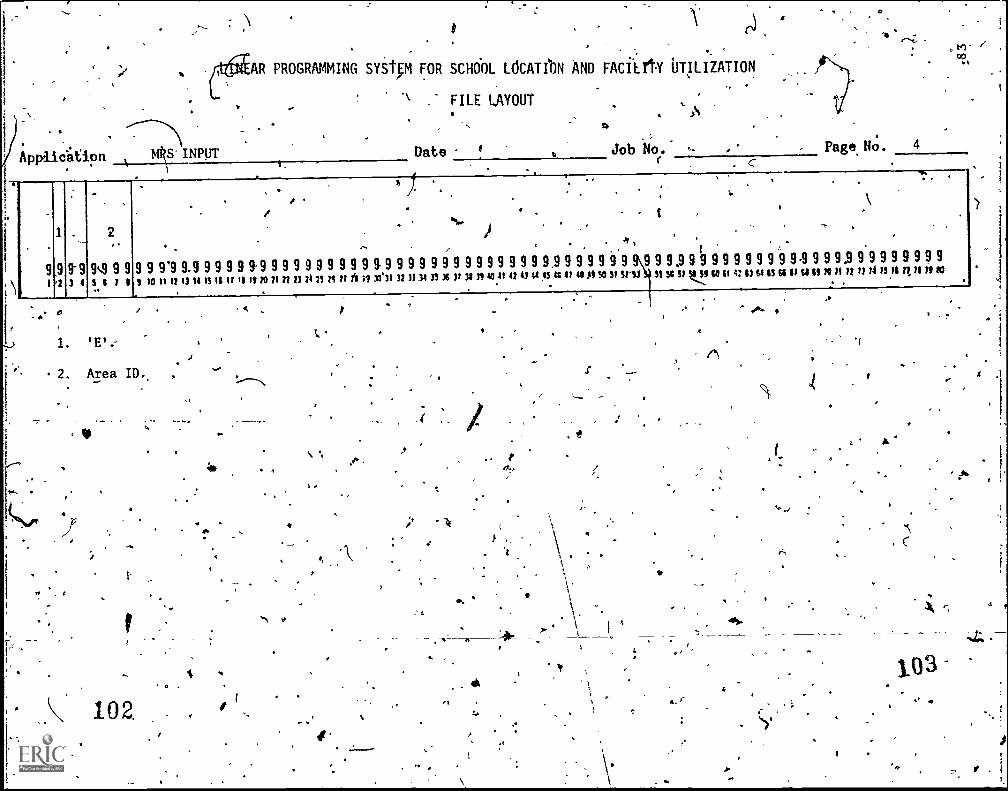
i
Applic-aCion MkS' INPUT
AR PROGRAMMING SYSfp FOR SCHOOL LeiCATIbN AND rAciry UTILIZATION
FILE LAYOUT
Date
t
Job No.
C
. cPage No.
o 44)-op
v
4
9,91
91'2 3 4
91/49
S 19 9/ 1
-. e
9 9 9'9 9.9 9 9 9 9 9-9 9 99 10 II 11 14 IS It 11 fl IS JO 11 2113
i
923
9 974 11
9 929 21
,
9 9 S 9 97'7 II 31.31 32
9 911,34
.
,9 933 36
.
S...
9 9 9 9 9 912 33 II 40 .41 41
9 941 44
9.9 943 41 41
,.
t ,,
.
9 9 9 9 9 9,9 9 0 9 9 941 39 SO St 93.1 33 Si S/ V.91 le 11 4:
9 913 64
,
9063 61
.
9-981 61
-,-
9 919 11
93 9 9/1 H 13 11
9 911 11
.
9 9n,11
..
9 97180
4
.
1. 'E'
2. Area ID.,
102.
,s
A
"..,
.4
.
I
1 to
t
7:
,
O
.'1
:`
4
^*
4. r6
1
A
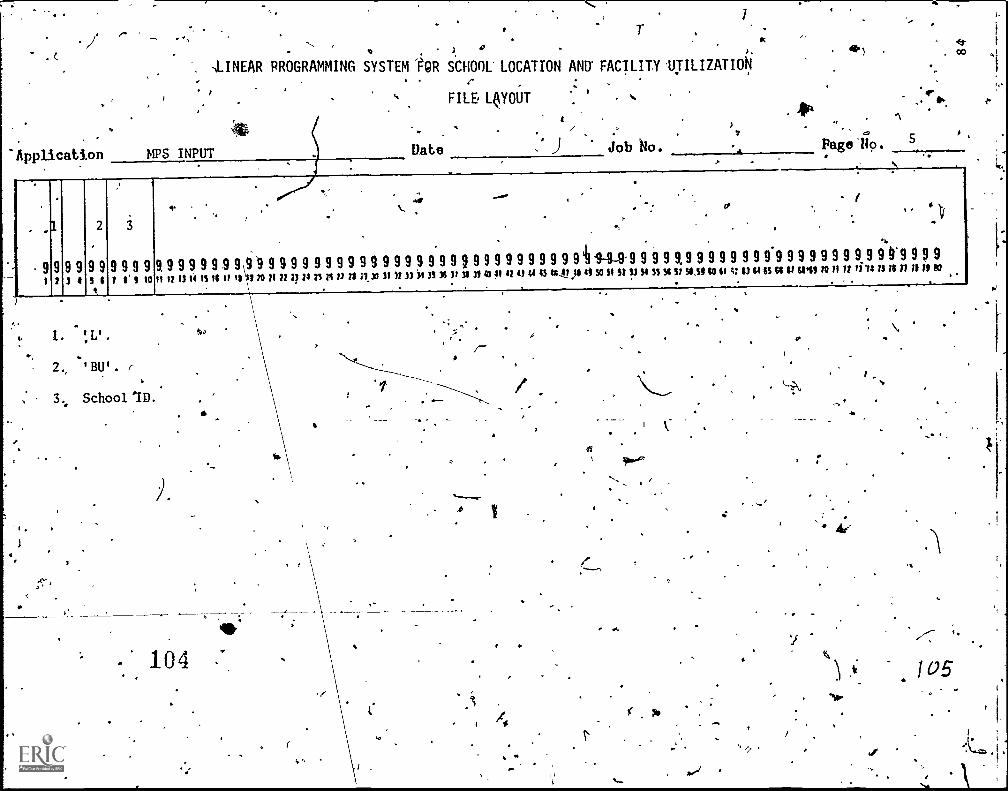
I
5
,LINEAR PROGRAMMING SYSTEM '(;)R SCHOOL' LOCATION AND' FACILITY UTILIZATION
ot
Application MPS INPUT Date
I-
FILE WOUT
z
Job No.7
4111,) .
Page 'No.
co
.
,1
91
9 9 92 3 1
2
9 93 I
4
.
3
9 9 9/ s' 9
910
.
4. ,
.
9 9 9 9 9 9 9 9 99 9 9 9tt I/ 13 11 IS It If 11 1 IO 21 22 23
9 922 23
.
9 929 23
.
9/11
.. -, ...........,.
9 9 9 9 9 9 9 9 9 9 9 9 921, X1 31 li IS 34 3S X If IS n e 41
. . .
.
9 942 41
.
.
9 944 45
. .
. I., ": O. ,, .
It..
. .9 9 9 ii-9-9-9 9 9 9 9,9 9 9 9 9 9 9 9 9 9 9 9 9 9 9 9 9 99'9 9 9 944,41.40 41 so SO S2 S2 Si SS Si 31 SI,S9 tO it 4: I/ /I IS St tf 6119 ro n n tilt 13 IS r/ n ii to ..
.
104
, -
9
so
L
r
I
1 v5
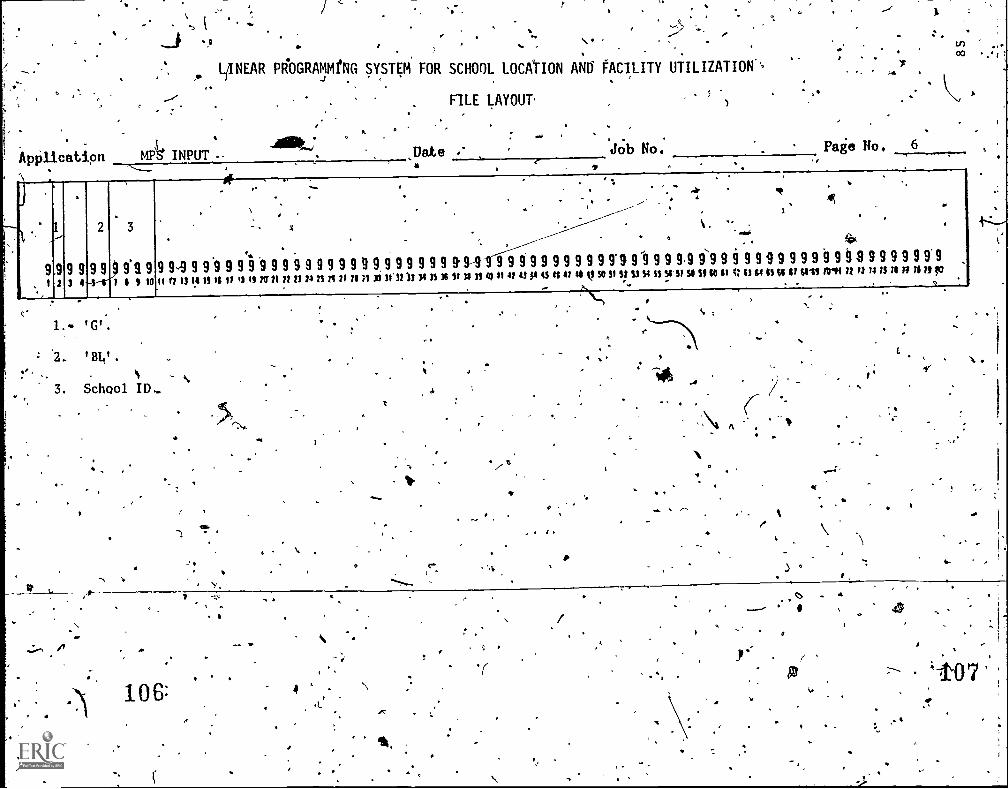
o s_
Application
LINEAR PROGRAMMING SYSTEM FOR SCHOOL LOCATION AND FACILITY UTILIZATION
MPS' INPUT
A.
FILE LAYOUT,
Date .'C-
Job No. Page
V) ,CO .e(
J.
,,,,
91
.9 9 92 1 4
9 9*I 91 3 10
r.- . . .
. r -. '
.2
..9 9-9 9 9 9 9 9 9 9 9 9 9 9 9 9II 0 13 11 IS It 1/ II li xr11 11 7111 IS 14
.. .
..
. -.
. 4R1
. ,.
,.
. , '....., .
9 9 9 9 9 9 9 9 9 9 1-9 9 9 9- 9 9 9 9 9 9 9 91 99 9 9 9.9 99 9 9 9 9 9 9 9 9 9 9 9 9 9 9 9 9 9 9 9' 9
21 11 Y1 V If II )3 14 IS 3S11 IS If 40 SIM 4204s is 41 IS 0 SO SI SI Si S4 SS Si 51 S1 S9 SO II 4; SI S4 1514 $1 Pi, PM It 13 14 IS /11 0 /111Ip_
.. . . . . .
'G'.
2., 'BL'.-
3. School ID._
",
1
41,
...
5
- .
A
3 4
ti
L
.
a-
106
7 V
S
5.
ss,
re
0
(
8
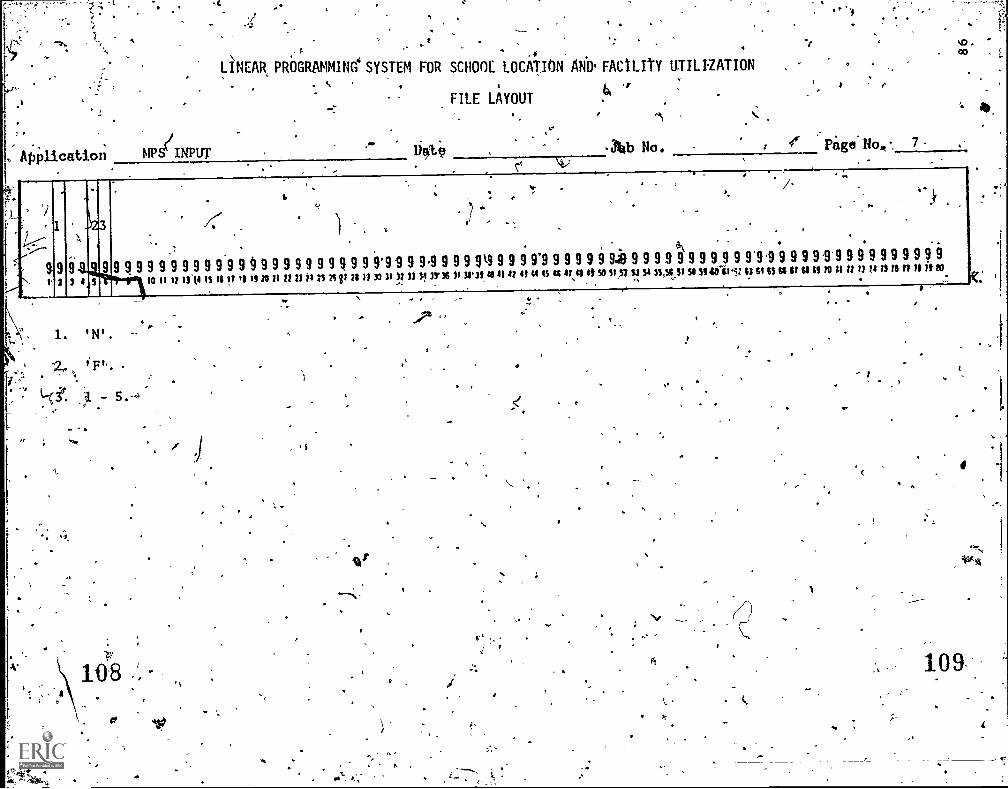
Af;Plicatiori MPS INPUT
.$
LINEAR PROGRAMMING* SYSTEM FOR SCHOOL LOCATION ANb' FACILITY UTILIZATION
0*
FILE LAYOUT.1
-Aib No. No,.. 7
. co I L.
1
-'i'9991,214
95
9 9 9
.
/.1
,
9 9 9 9 9 9 9 9 9 §I8 II II Oils is!, es 15
9 970 11
s.
921
')
9 9 9 9 921 21 ZS 24 /1
.
9 928 21
. . . 4
.. , . , /'. , -
- ..
r, .. ..
,.
. ..
.
. . .' . . .
9'9-9 9 9.9 9 9 9 919 9 9 9 9.9 9 9 9 9 9 9.4 9 9 9 9 9 9 9 9 9 9 9'9.9 9 9 9 9.9'9 9 9 9 9 9 9 9 9 9-30 31 11 13 SI 3r38 II 18'38 48 11 it 41 SI IS IX 41,4$ 45 SO SI 37 SI S.1 3S.58.51 SI 940 Ill: il SI SS FA $1 SI If 10 31 t1 I) ti 15 hi n Is it 82.. ,_
. Iti
`).
Y.
4
1
)
109
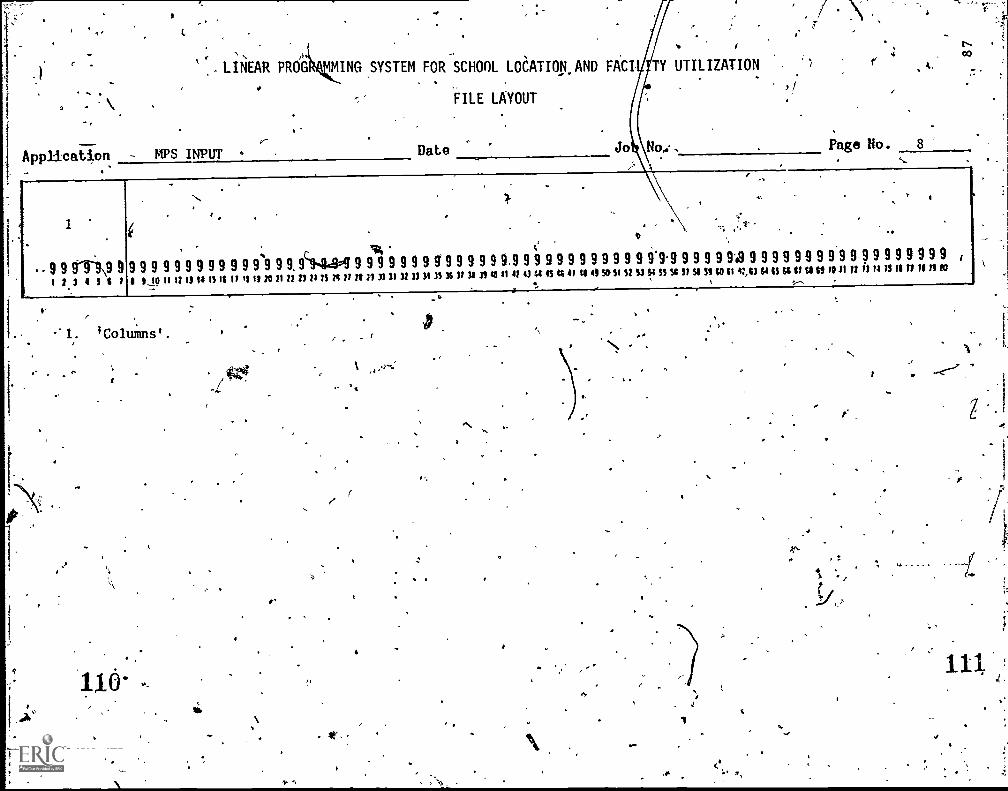
, ,. ,
, LINEAR PROG MING SYSTEM FOR SCHOOL LdATION., AND FACI TY UTILIZATION
. .
.
\ FILE LAYOUT
Application - MPS INPUT
1
9 9 911\9 93 4 5 I ,
.
9 9 9 9 9 9 9 9 9 99 10 11 11 13 14 IS 14 1/
Date
r
N00
o o,. Page No. 8
9 9) 9 9. 9c141.94 9 9 9 9 9 9 9 9 9 9 9 9 9 9,9 9 9 9 9 9 9
11 19 ZO 21 11 23 14 ZS 26 n n 313 31 11 33 11 33 36 1/ II 31 43 41 II 43 64 45 46 41 419 9 9 9 9 9.99 9 9 9 9 949 9 9 9 9 9 9 9 9 9 9-9 9 9 9 9 9 9 9 ,
49 sots, st so so ss 54 so so S9 SO 41 VA) 64 IS 66 V SI 61 10 /1 /4 nannn to
9
1. Columns'.
- -
4
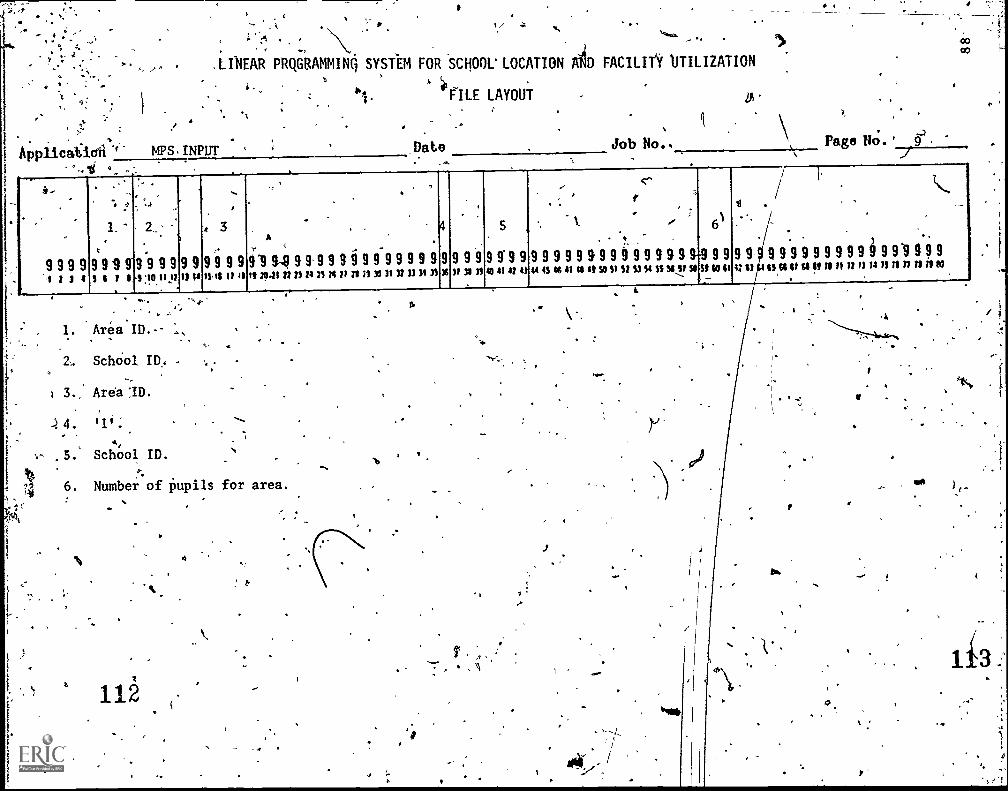
-
` .. Jry
9
_,
.LINEAR PROGRAMMIN(i SYSTEM FOR SCHOOL' LOCATION
-
MPSINPUT
;
Date
FILE LAYOUT
0 FACILITir UTILIZATION
Job No.. \ Page No.' 9
i'...
9 9 91) 3
94
-. .1.'
9 9 9 93 1 / 11
.
9'9 9 94 10.11.n
.
9 913 14
.
, 3
.
9 9 9 9IS It IP 11
.
..
A
91 SI 9 9 9 9 9 i 9 9II :sat n 2; 2,4 rivilutp; 30
.
9 9 9 9 931 I/ tituststr
.
9 9 9 9IS 31
S
9 I 9 949 4I 42 43
9 944 43
c--. r
-1, .,
.
9 9 9 9 9 9 9 9 9 9 9 9 9-944 41 II *I SO SI St 1J S4 SS Silt SO
6
9 9S110 41
1 -
9 94213
r---1./ ,
/.. )
9 9 9 9 9 9 9 9 9 9 9 91 9.
9 9SS WO SS If II 11 ft 11 II IS tutisitto
.2144
'.1. Area ID.-
-s
SchOol ID.
3. Area :ID.
'1i:4,
.5. School ID..
6. Number of pupils for area.
4
4
11,
40.
)
4
$
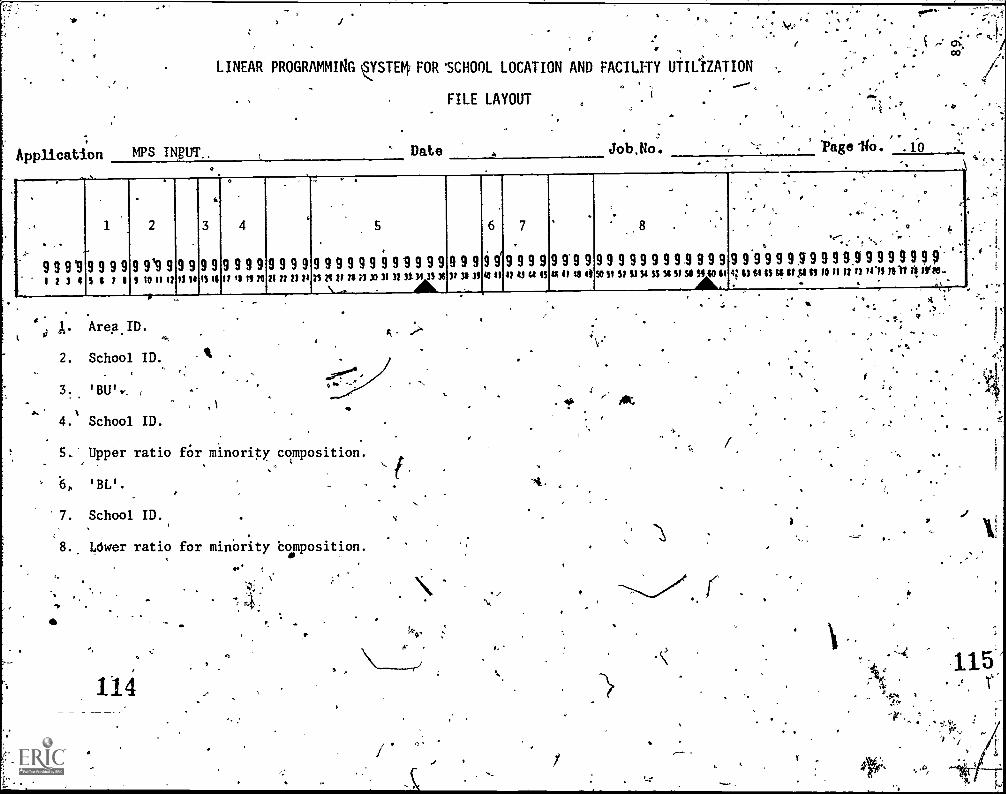
Application
LINEAR PROGRAMMING ..YSTEtit FOR 'SCHOOL LOCATION AND FACILITY UTILIZATION
FILE LAYOUT
MPS INBUT. Date
o 00a
Job,No. Thgello 10.
g, ,
.
.-
91
9 9 e92 3 4
1
9 9 9 95 $ / 1!
-
2
9 9'9 910 11 12
9 912 14
.
3
9 9IS It
4
9 9 9 911 I n11
9 91 2/
9 92114
9 9 9 9 9n 24 21 1t 21
5
930
-
9 931 12
9 9 9 93131 3S 36
40.0
91/
9 9311 33
6
9 943 41
7
.
9 9 9 942 in 44 45
9 9'4 41
9 941
...
.
9 9 9 9 9 9 9 9 9 9 9 9SO SI St Si 31 SS 54 S/ Se S340 St
.
.
.4.
. .
.
9 9 9 9 9 9 .9' 9 9 9 9.942 63 64 Si 61 St Sit! /0 /I 12 13
- .
9 914.23
. .
9 9 9 9 9.
210/ /I! 10`03-,
Area. ID.
School ID.
4. School ID.
5. Upper ratio fOr minority composition.
' 6, 'BL'.
7. School ID.,
8., Ldwer ratio for minority Vposition.
114
t
'
115'
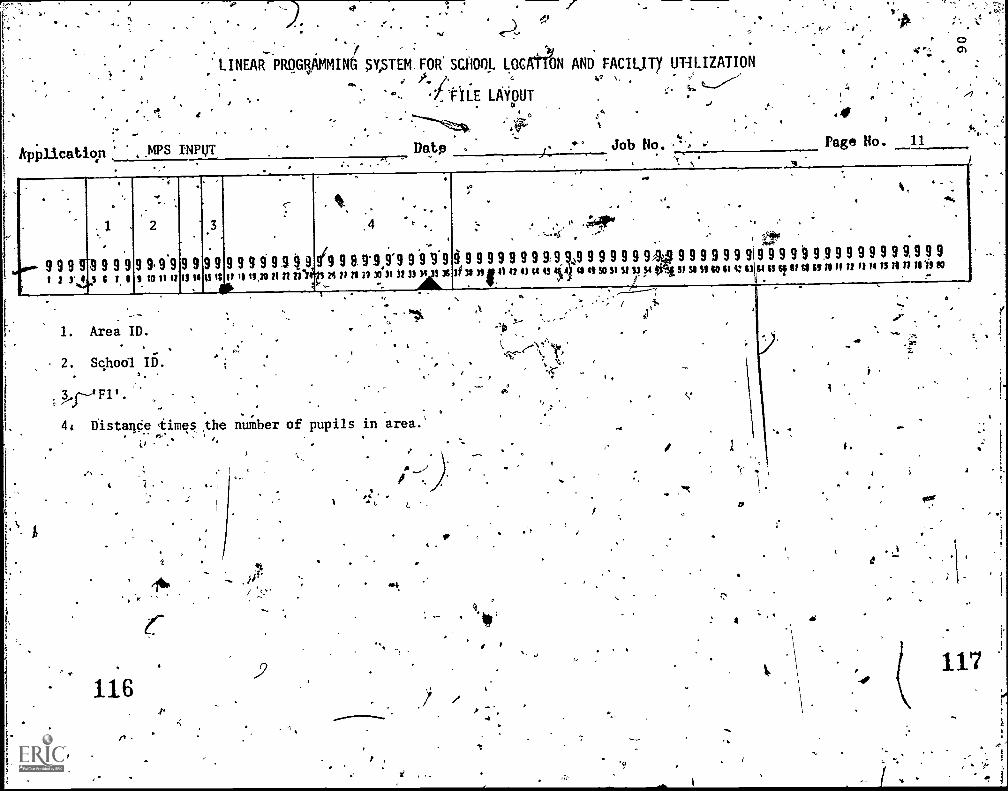
a
44 4
A
LINEAR PlIOGIAMMIND SY,STEN. FOR. SC,1100L LOCATION AND FACILITY UT-ILIZATION
"FILEZ t.../.
.'', fILE LAYOUT,,
'ef:Datp J.
O
Job No.
O
r7
.44
Page No. 11
.
ws- 9 91!
.
.
9 g17 4
oa...0.
.
9 9 9S$ / I
9 9.1 10
-
9 911 t/
9 91S 0
9 9IS It
Ili
9 9 9 9. 9 I 0 90 is es tt 7/ flutS
;
.4 't .
. ,949 9 8, 919"9 9 91
74 ti lin 30 31 3/ 13 0' 33936
.7
--
9 9 9 9 9 9 9/// 37 ni 0 0 0
. .
,. .
., . 0 ,;ear
9 911,9 9 9 9 9 9 9,47 43 Ift7 0 47 SO SI 9 11 S4
.
-.
, ,.
. .
9 9 9 9 9 9 9999999.99999999,9993/ SO SO SO $1 4; 0 71 $S It V t$ 19 0 II // /I /4 /7 Hi n n ii 70
44..
.
. Area ID.
2. School ID .
°-
,44 DistariCe the number of pupils in area.'
It
:-e.;),. if/'\
00
4
14
C`
.44
E
e
2.
Ian
A :,
sf
ft
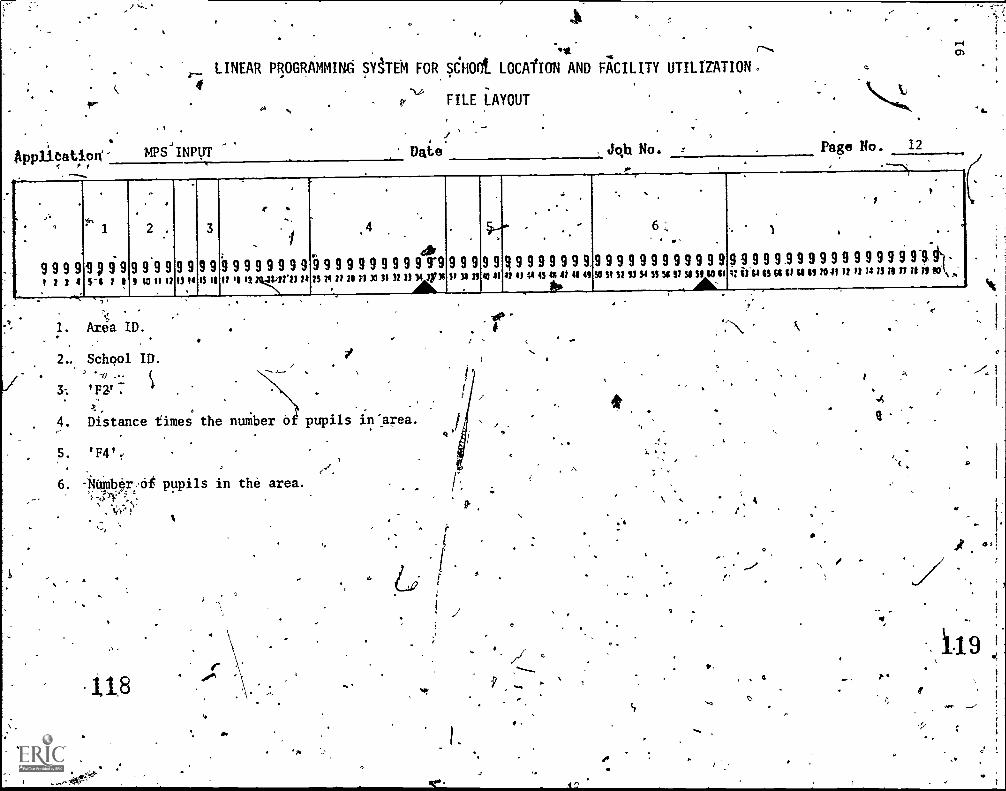
ApplitatiorC
.10.
rLINEAR PROGRAMMING SYSTEM FOR 61100t LOCATION AND FACILITY UTILIZATION.
"*.
MPS INPUT
-"`" FILE LAYOUT
Date Jo.1:1 No. Page Ho. 12
.
...:
99999,99999999991999999911999999999.99999919999999,999999999999199991999999999991 2 3 4
.
l
S-1 7 4
..
2
2 W 17 72.
13 14
3
72 74
,
..,
. I
17 01 13 7t.2.23 24
.
.,
,
71 72 77 72 72 32 31 32 13 34 422
, ,A11.
37 31 II 42 II
..
. .
. .
42 43 44 45 a It SS 42
, b..
.
6 : .SO SI S2 22 .24 SS Si SI SI SI SO It
.
.
.
. ,
.,
).
.
'9,
.
012,4 ss ss 87 2,1 69 to 47 72 7) /4 IS II n is 72 to
. ..
1. Area ID.
2.. School ID.
3-. 'F2,':
4. Distance times the number of pupils in-area.
5. 'F4'.
6. -Number ,ot pupils in the area.
11.8
T
P.
S
\
q
14 P*4
C.r
C
- I
;
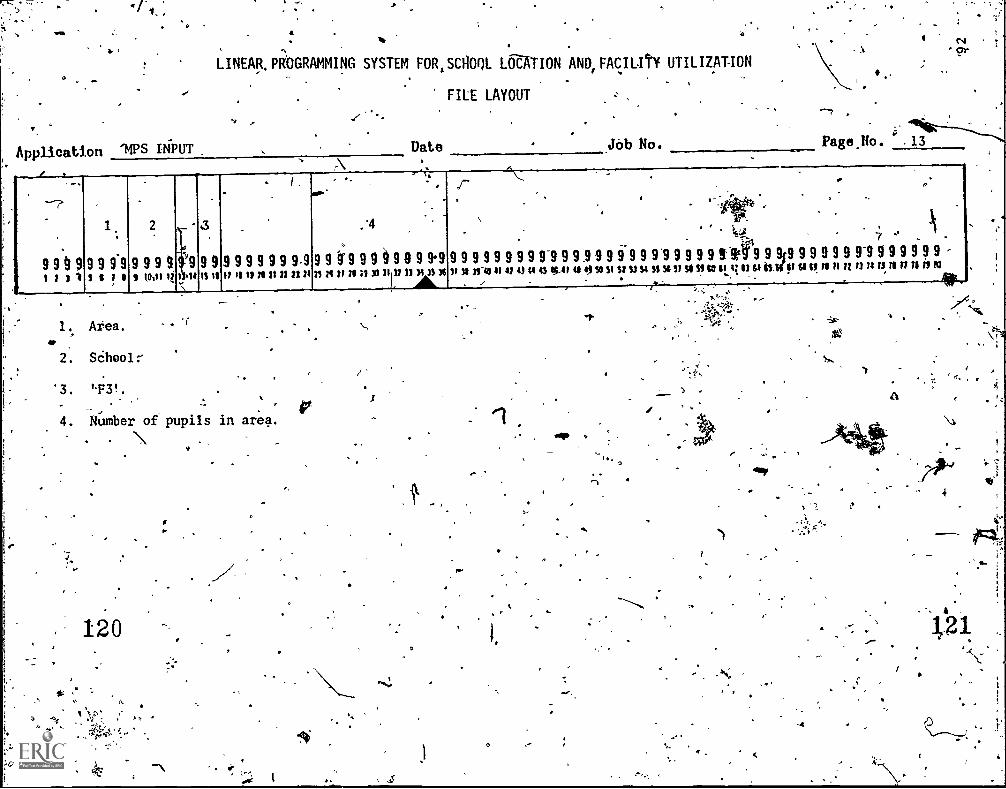
-.
O
Application "MPS INPUT
LINEAR. PROGRAMMING SYSTEM FOR, SCHOOL LOCATION AND, FACILItY UTILIZATION
'40
FILE LAYOUT
("1
Date Job No. Page Ito.
4
9 9t 7
.
§ 91 1
-
1
9 9 9 9s $ 7 1
99
2
9 9 91011 17
9I 14,
9 9IS IS
9 9 9 91/ Il 19 /0
..
9 911 11
9.921 11
4
9 9 b' 9 9 911 24 / 11 tl 93
4 931 /1
,
.
9 9 9°913 11)1 36
AMk_
. ..
\
9 9 9 9 9 9 9 9 9-9 9II St We 41 It 41 it 4$ 49.4
. -
.. . .
. . 4+- .
" i...,,.
. .,,,,: 4
9,9 9 9 9 9 9 91 9 9 9 9 1119 9 90 9 9 9 9 941 1,1 SO S St SS S4 SS US/ Si S910 tin II S1 SS if!, a is ID 11 11
...
.
. 3179-9 9 9 9 9 9 9 -11 14 153 n 11 is co
1. Area.
2. SChool:
'3. ''F3'.
4. NUmber of pupils in area.
\
120
ci
44;
.
$
A
-4
(
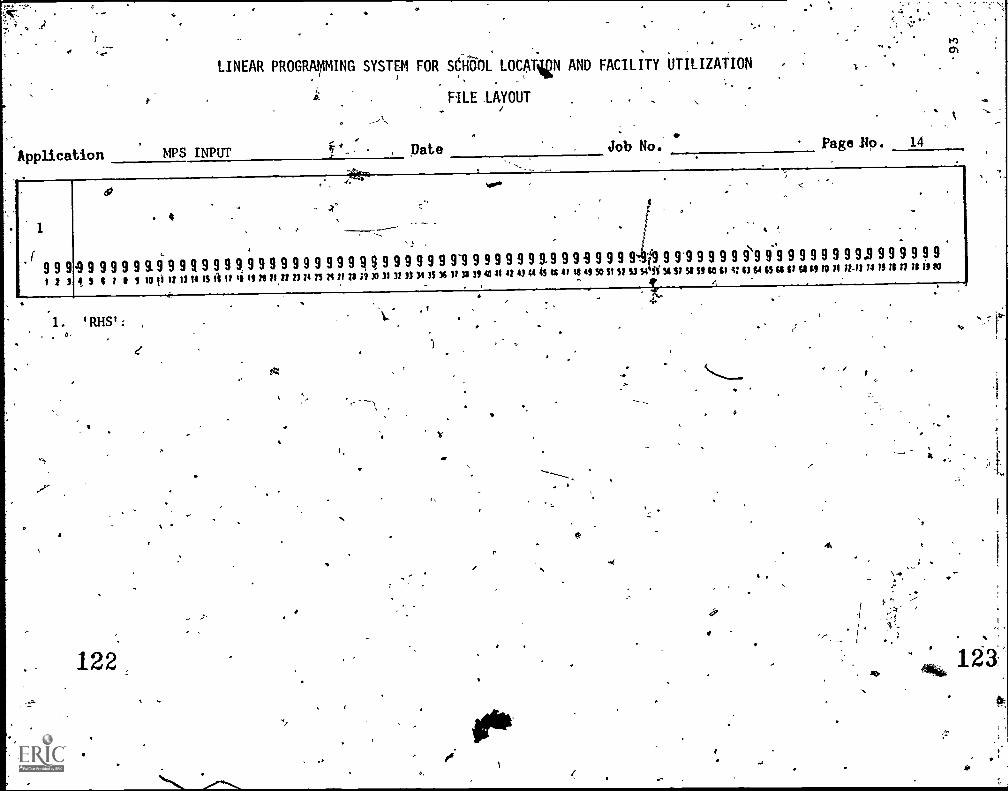
4 4
4
LI NEAR PROGRIVpPANG SISIEMFOR
s6itin1i LOQiigN AND VAC1LITI kilitliAilal
i4VILE iIrg .. ,..
Job No.
.41
Page
rn
ApplicationMPS WPM' Pate
4VASSSISS99,999%99S9999999V1,999S999199999i999999.P99199991k999(399SS99$99999S
,)
1 II I tl IWO It 011011.111114 TS IR 11 1111 In 11 31 3% 15 36 11 3014101 kt 45 is II so II 31 s$ $44,9 9.10 st t,p ti gt ti /01% is is it ti is to
1. qt.14';,
1'
1.22
4
v
4
4
-;
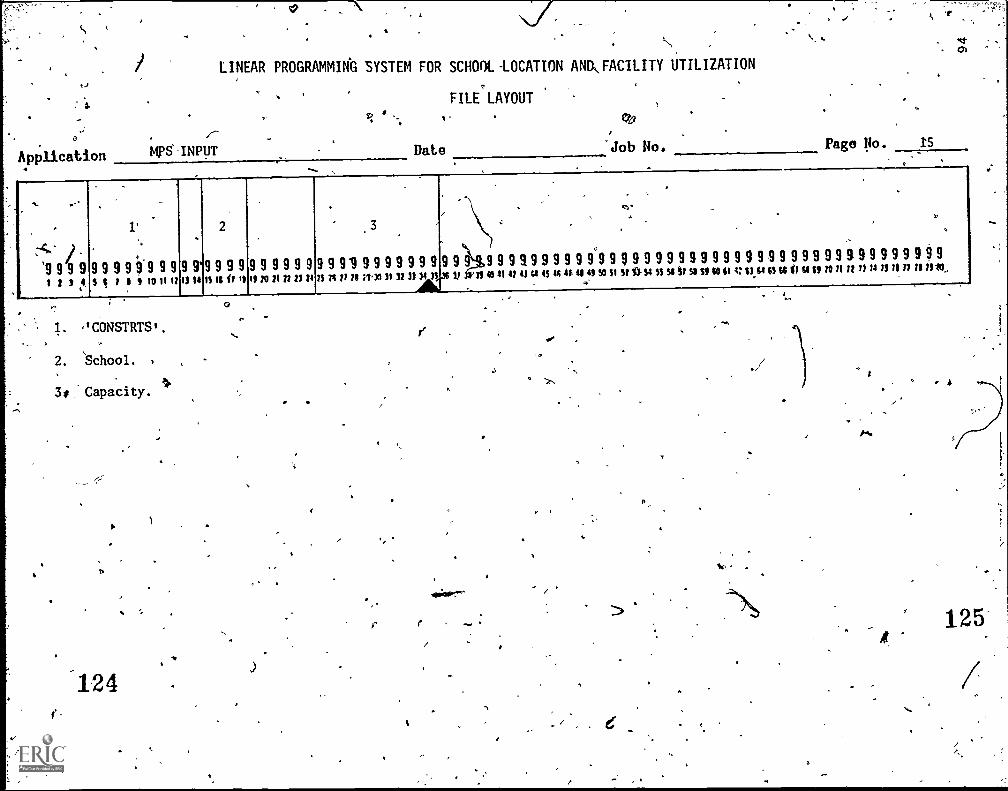
LINEAR PROGRAMMING SYSTEM FOR SCHOOL -LOCATION ANDJACILITY UTILIZATION
FILE LAYOUT:
/Application IS-INPUT Date Job No. Page No. 15
1.
'9 9 9 9t22
1'
9994999set$i 10 11 12
1. CONSTRTS .
2. 'School.
3# Capacity.
2
9 919 9 9I, ta Is a i1
9 9 9 9 9 919 TO 21 22 21 1
3
9991999999999.
9941
9 913 99IS 9O9 9 99 9S9I S9t
9 9s9i
9 9 9 9n9t9' 94:
9916S 9 9 9 9 9 9 9 9 9 9IS 9W9 99i99
n 71 /1 V11131 SI 133VS 1 1
4,
V
--
./
125
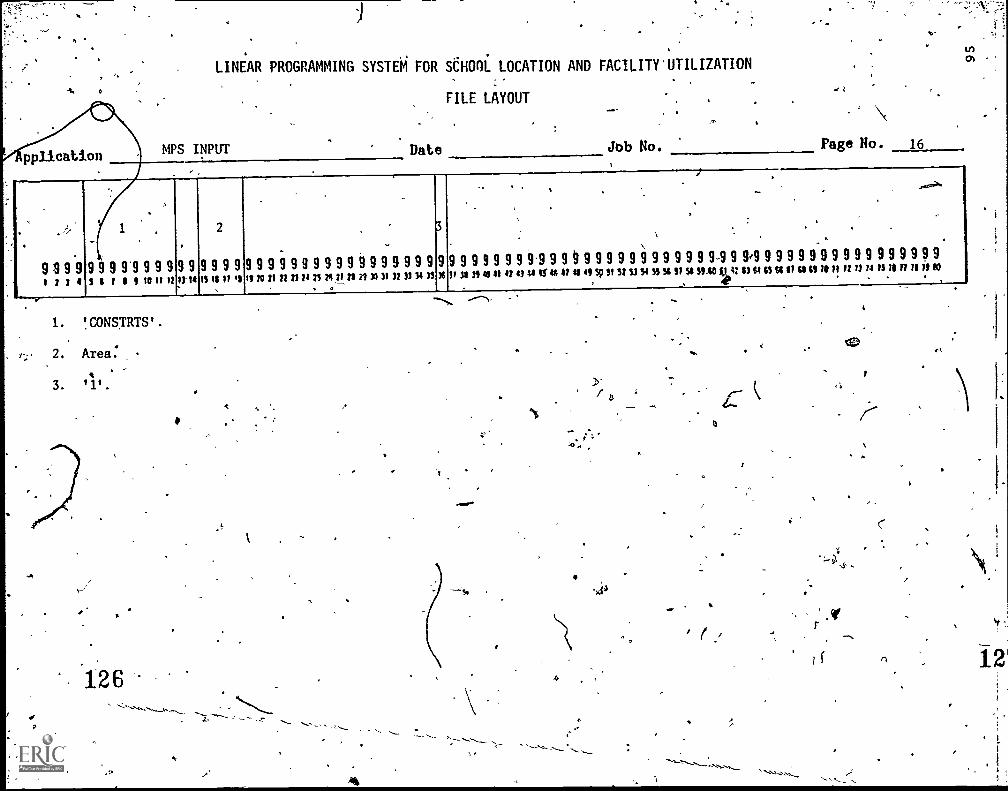
0
pplication
LINEAR PROGRAMMING SYSTEM FOR SCHOOL LOCATION AND FACILITY'UTILIZATION
MPS INPUT
FILE LAYOUT
Date Job No. Page No. 16
.
..
919.9'9t I 3 4
9 9S$ 1
.
91 9 9 9S 9 10 II 12
.
9 913 14
2
9 9 9 9IS IS 1/ II
.9 9 9 9 9 9 9it2olinn 21 73
9 924 21
.
9 911 21
..
9 930 31
,
9 932 )1
9 934 31
3
9 936 31
9 931 39
9 940 41
,
9 911 41
9144 45
,
..
,
\
.9 9 0 9 9 9 9 9 9 9 9 9 9 9 91 941 41 SI 49 59 SI St 1.1 34 SS 54 St 51 5910 jj 4:
,
.
,,
. . .
91 9 9 9 9 9 9 9 9 9 9 9 9 9 9 9 961 64 s) 66 61 ss sg /I /4 /2 /I 14 n 3 it is 2, so
1. !CONSTRTS'.
2. Area:4
3. '1'.
-rt
1.26
t.
ti
-44
,
_
4
12
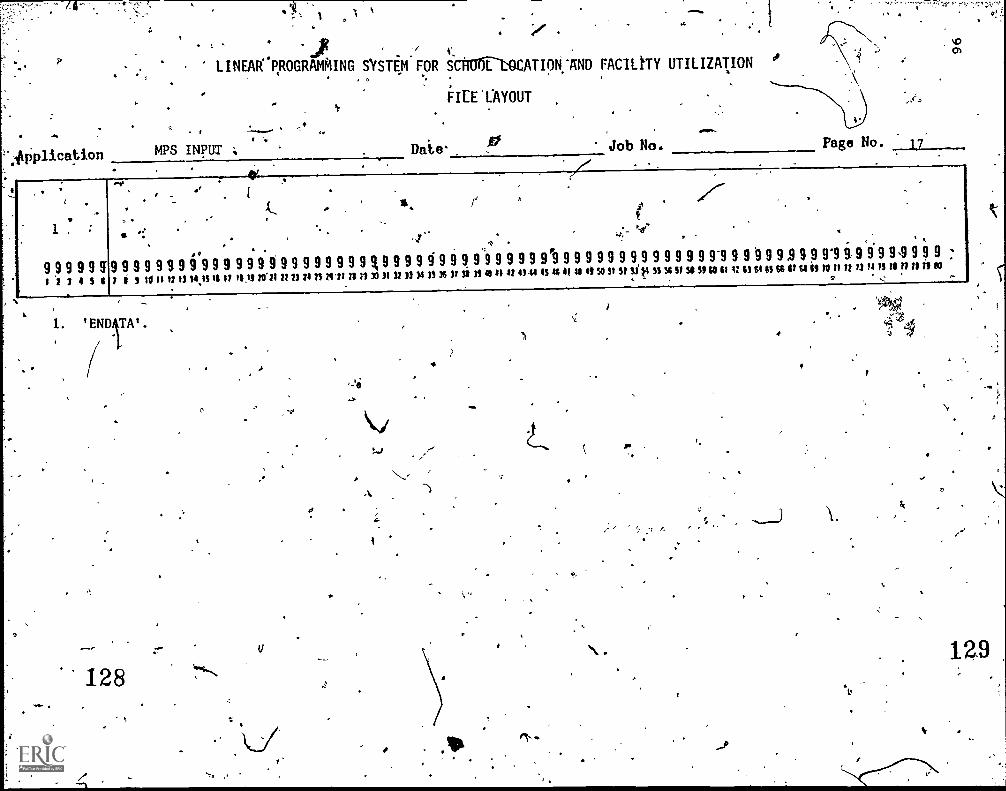
LINEAR P,ROGRAMMING SYSTEM FOR SC1 E'L`OCATION:AND FACILITY UTILIZATION °'
FIFE 'LAYOUT
A/;triplication MPS INPUT ; Date
1
9 9 9 9 9 71'7 3 4 51
9 9 9 9 9 9 9/ i 1 lo IL 17 11
1. .
128
44e
ea,
Job No. Page No. 17
..
.. . .
9 9 9 9 9 9 9 914 IS 11 I/ 11111111.
1''9 9 9 9 9 9 9 9 q 9 9 9 91111 74 II 1411 it ;1 313 31 II 33 )4
1933 36
9 911 31
..is
9 931 48
.
9 94/ 41
9 9 91 9 9 94/44 4S 46 at 41 49
tor'., r-
9 9 9 9 9 9 9 9
,
9 9 91 950 9 St SIS4 SS SS 5/ SO S910 61 4:
9 9 9 9 .9 9 9 9'9 9,911 64 IS 66 V SS e9 /I 8 /3 13
,
9 9 9,914 /S 11 /1
9 9 9/1 /110
i ,s
4
12.9
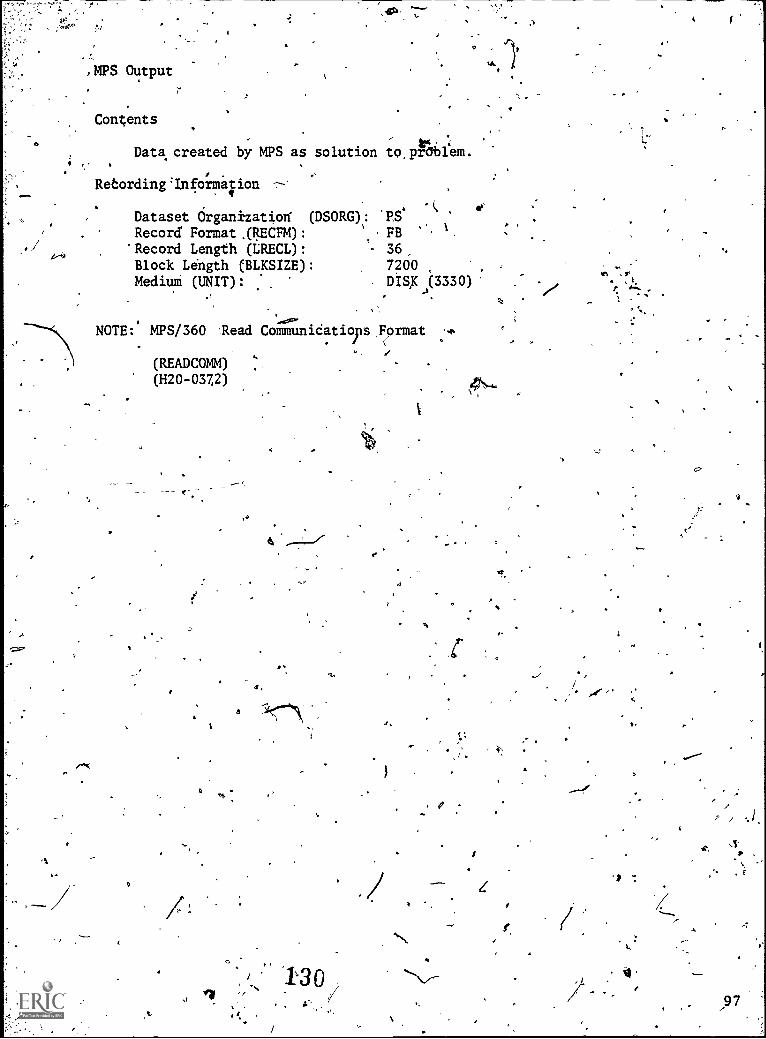
4-4
,MPS Output
Contents,
Data created by MPS as solution to,preblem.
,
Rebordingq;nformailion
Dataset drganizatiorf (DSORG):
Record Format,(RECFM):Record Length (LRECL):Block Length (BLKSIZE):Medium (UNIT):
PS'
FB36
7200DISK (3330)
t
NOTE: MPS/360 Read Communidatio s Formator
(READCOMM)
(H20-0372)
fa
0 -
a
t'e
97
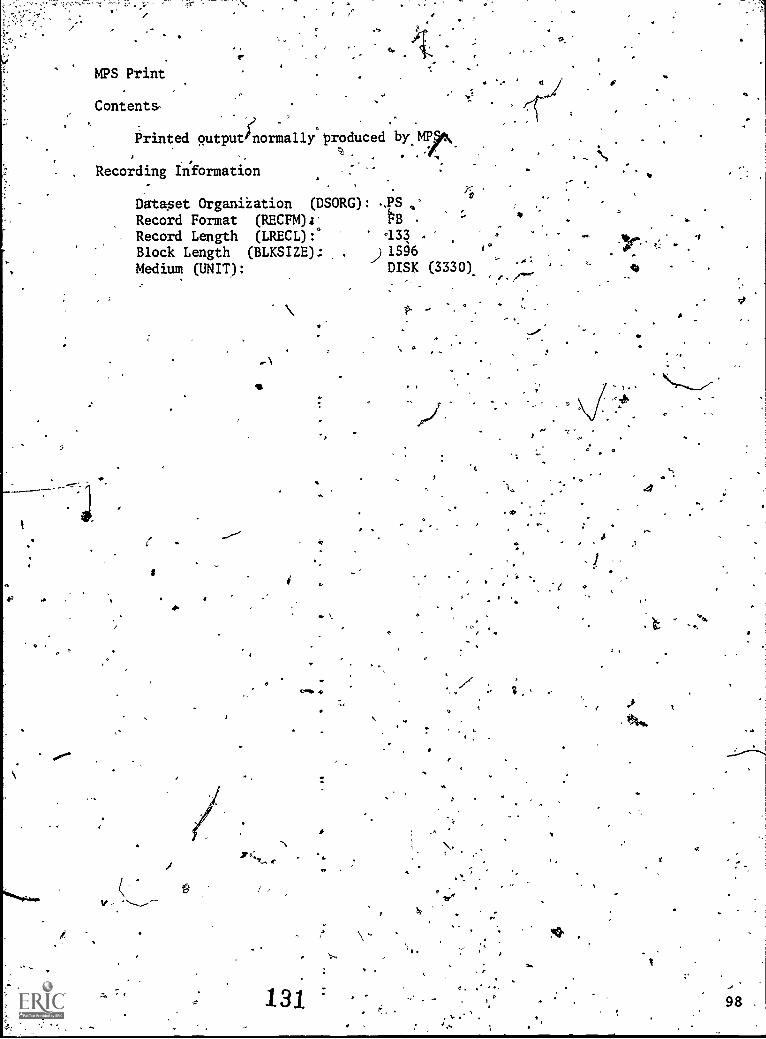
MPS Print
Contents,
Printed putputinormalliproduced by,MP51k
A , 4
Recording Information
Data5et Organiiation (DSORG): -,PS .°
Record Format (RECFM)a- hRecord Length (LRECL): -133
Block Length (BLKSIZE).: . .) 1596
Medium (UNIT): DISK (3330).
fl
(
131
;
t
.4
98
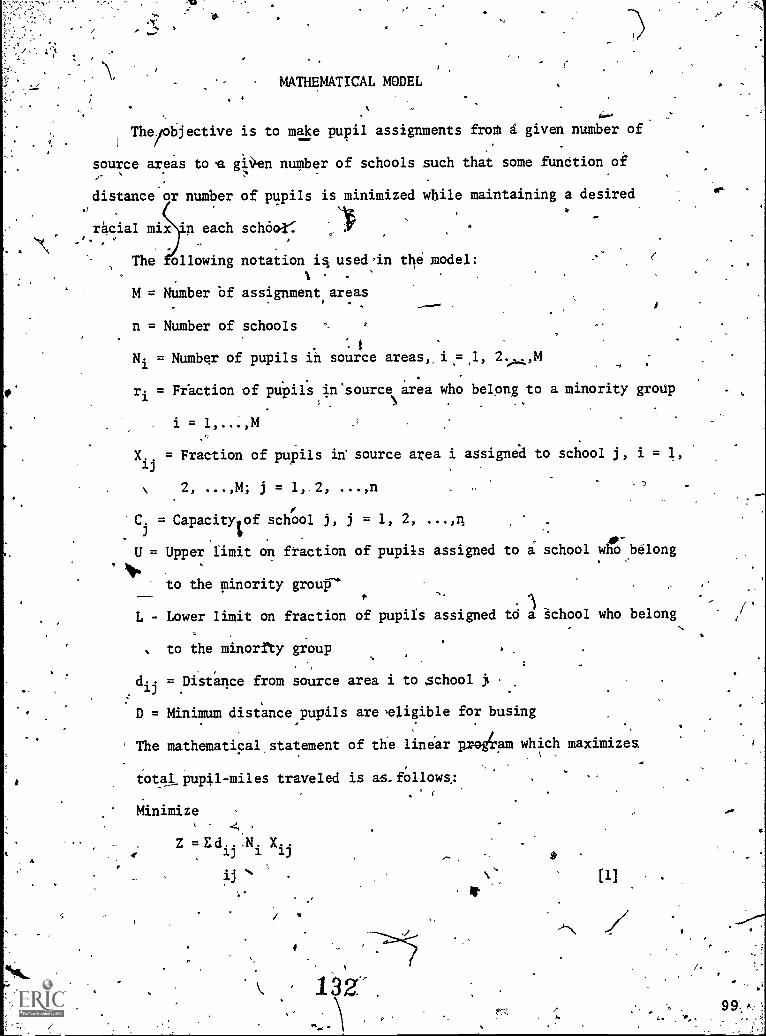
MATHEMATICAL MODEL
0
The/objective is to make pupil assignments froth d given number of
source areas toe gien number of schools such that some function of
distance or number of pupils is minimized while maintaining a desired
racial mix n each schOoPt:
The Following notation is, used ,in the model:
M = Number of assignment areas
n = Number of schools
Ni = Number of pupils in source areas, i=,1, 2. .,M
.
ri = Fraction of pupils in'sourcesarea who belong to a minority group
i = 1,...,M
= Fraction of pupils in source area i assigned to school j, i = 1,Xij
2, ...,M; j = 1,.2, ...,n
C. = Capacitylof school j, j = 1, 2, ...,n
IPU = Upper limit on fraction of pupils assigned to a school who belong
414to the minority group
)L - Lower limit on fraction of pupils assigned to a school who belong
to the minority group
dij=Distance from source area i to school ji
D = Minimum distance pupils are eligible for busing
The mathematical. statement of the linear p
total pupil-miles traveled is as. follows,:
Minimize
Z =Edi N. X.j ij
1-5
am which maximizes
[1]
Or'
/
99;
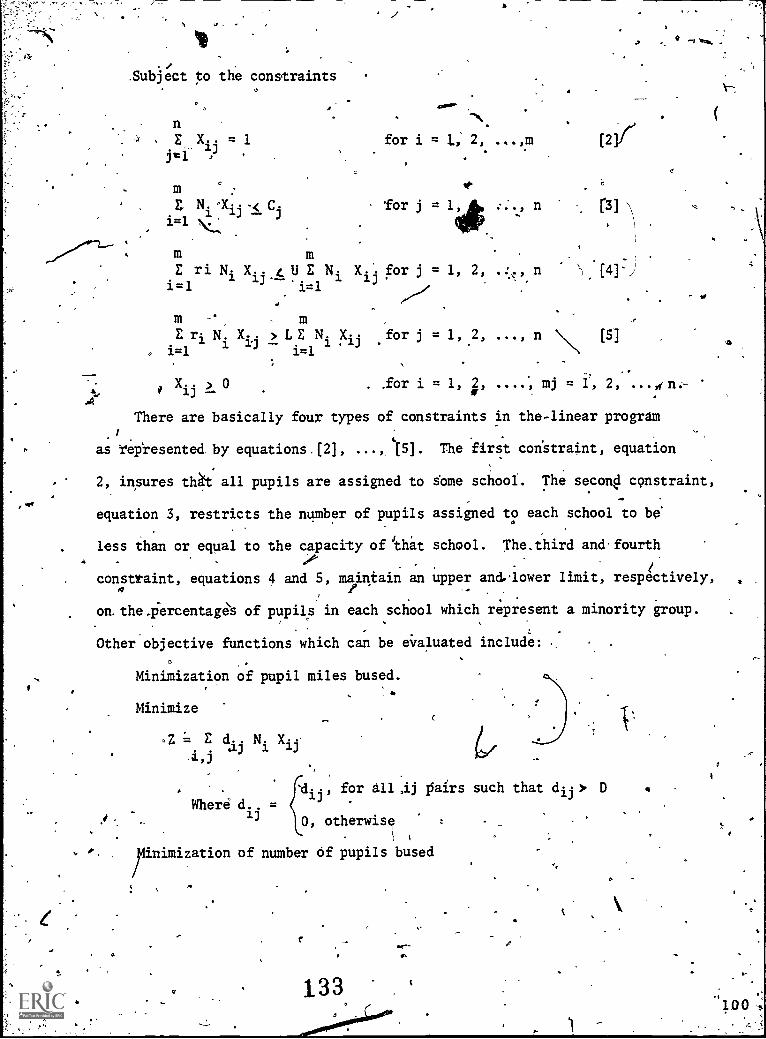
4
.Subject to the constraintso
nE X.. = 1
j=i"
1
-N.
for i = 1, 2, ...,m
m se
Xij > 0 . .for i = 1, 2,#
i=1 N,
. 'for j =E. N. A.4-.< C
,
E ri Ni Xi 4 U E Ni Xi . for j = 1, 2,j---. j
i=1 i=1.
,
m mE ri N. X. > L E N. Xii for j = 1, 2,
- -,
i=1 1 kJ i=1 I
0
::., n 131
.:., n ') [4]* '
..., n \ (5]
mj = 1', 2, . n.-
There are basically four types of constraints in the-linear program
./ . .
as represented by equations.[2], (5]. The first constraint, equation
2, insures that all pupils are assigned to some school. The second constraint,
equation 3, restricts the number of pupils assigned to each school to be
less than or equal to the capacity of 'that school. The.third andfourth
constraint, equations 4 and 5, maintain an upper and.lower limit, respeectively,i1 , .
on.the-percentages of pupils in each school which represent a minority group.
. .
Other objective functions which can be evaluated include:
Minimization of pupil miles bused.. '.
Minimize
Z = E d.. Ni X1)..'
4.j
. 1.. for all ,ij pairs such that d--> Div ijWhere d. =
Y ij0, otherwise
- 1
imization of number of pupils bused
133
O
-4
0
.
100
1
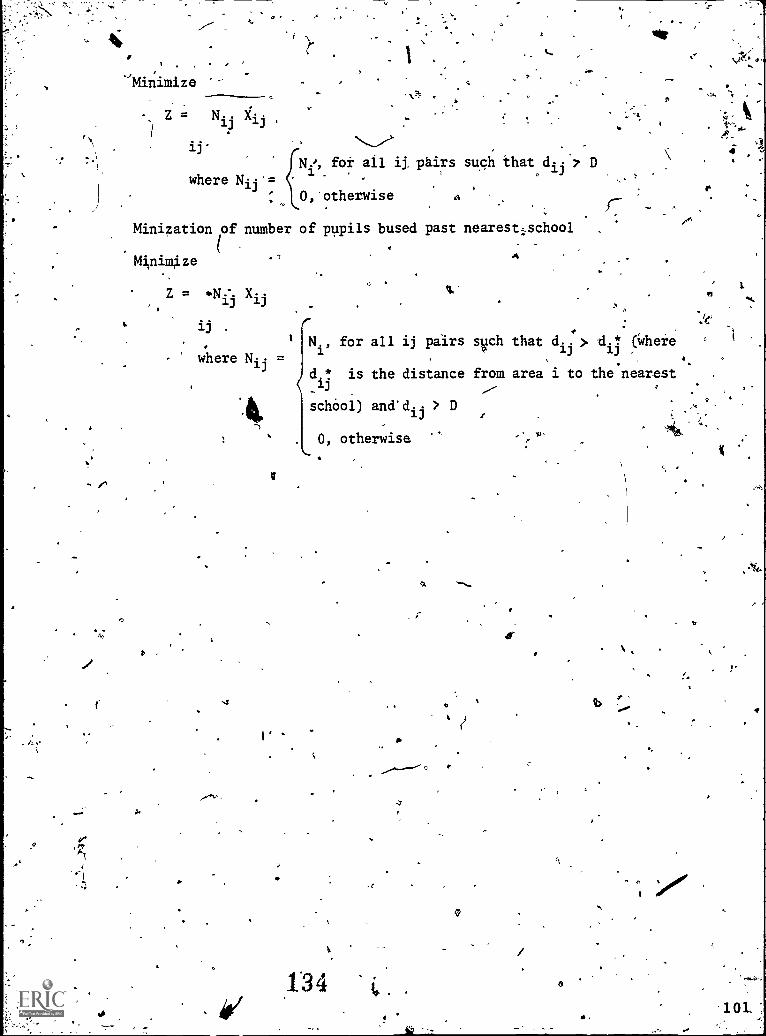
where N--'=
L
N...." ,
, for all ij, ptirs such that dij.7 Dl'_
0,'otherwise
Minization of number of pupils bused past nearest school
Minimize
Z = X.
1J .
where Nij =
2
4
,/4
.
24)
., for all ij pairs such that did > did (Where
is the distance from area i to the nearest
schOol)and'dij>D
0, otherwise
134
.r
0
.
b
" <5
. %
Related Documents