April 13, 2010 TODAY'S HIGHLIGHTS U.S. Canadian / Int'l Initiating Coverage MBAC Fertilizer Estimates/Targets Raised Public Storage CN Railway Compass Minerals Kansas City Southern Union Pacific Express Scripts Estimates/Targets Lowered Alcoa Sector Revisions Electric Util. & Ind. Power: MIR and RRI Combination to Create Material Cost... Rating Upgrades: Mirant Paper & Forest Prod.: Ratings, Estimates Changed and Target Prices Increased Rating Downgrades: Tembec, Catalyst Papers Rails: Q1/10 Preview and Estimate Adjustments; Strong Volume Growth and... Semiconductors : 1Q10 Preview - Decent Fundamentals, Hand in Hand with... Featured Reports MBAC Fertilizer: Initiating Brazilian Phosphate Junior at Outperform (S)... FINANCIALS Diversified Financials Sector Report The Canadian Exchange Bulletin REITs U.S. Public Storage Filling the LA Basin ENERGY & UTILITIES Electric Util. & Ind. Power Sector Comment MIR and RRI Combination to Create Material Cost... MATERIALS Metals & Mining U.S. Alcoa Alcoa Reports Q1/10 Underlying Earnings of US$94M or... Paper & Forest Prod. Sector Comment Ratings, Estimates Changed and Target Prices Increased Fertilizers U.S. Compass Minerals Pre-Released Q1 Highway Deicing Volume Slightly Better... Fertilizers Canada MBAC Fertilizer Initiating Brazilian Phosphate Junior at Outperform... CAPITAL GOODS & SERVICES Rails Canada CN Railway Adjusting Q1 Estimates for Volumes Rails U.S. Kansas City Southern Adjusting Q1 Estimates for Volumes Rails U.S. Union Pacific Adjusting Q1 Estimates for Volumes Rails Sector Comment Q1/10 Preview and Estimate Adjustments; Strong Volume...

Welcome message from author
This document is posted to help you gain knowledge. Please leave a comment to let me know what you think about it! Share it to your friends and learn new things together.
Transcript

April 13, 2010
TODAY'S HIGHLIGHTS
U.S. Canadian / Int'l
Initiating Coverage MBAC Fertilizer
Estimates/Targets Raised Public Storage CN Railway
Compass Minerals
Kansas City Southern
Union Pacific
Express Scripts
Estimates/Targets Lowered Alcoa
Sector Revisions Electric Util. & Ind. Power: MIR and RRI Combination to Create Material Cost... Rating Upgrades: Mirant Paper & Forest Prod.: Ratings, Estimates Changed and Target Prices Increased Rating Downgrades: Tembec, Catalyst Papers Rails: Q1/10 Preview and Estimate Adjustments; Strong Volume Growth and... Semiconductors : 1Q10 Preview - Decent Fundamentals, Hand in Hand with...
Featured Reports MBAC Fertilizer: Initiating Brazilian Phosphate Junior at Outperform (S)...
FINANCIALS
Diversified Financials Sector Report The Canadian Exchange Bulletin
REITs U.S. Public Storage Filling the LA Basin
ENERGY & UTILITIES
Electric Util. & Ind. Power Sector Comment MIR and RRI Combination to Create Material Cost...
MATERIALS
Metals & Mining U.S. Alcoa Alcoa Reports Q1/10 Underlying Earnings of US$94M or...
Paper & Forest Prod. Sector Comment Ratings, Estimates Changed and Target Prices Increased
Fertilizers U.S. Compass Minerals Pre-Released Q1 Highway Deicing Volume Slightly Better...
Fertilizers Canada MBAC Fertilizer Initiating Brazilian Phosphate Junior at Outperform...
CAPITAL GOODS & SERVICES
Rails Canada CN Railway Adjusting Q1 Estimates for Volumes
Rails U.S. Kansas City Southern Adjusting Q1 Estimates for Volumes
Rails U.S. Union Pacific Adjusting Q1 Estimates for Volumes
Rails Sector Comment Q1/10 Preview and Estimate Adjustments; Strong Volume...

TECH/TELECOM/MEDIA
Semiconductors Sector Comment 1Q10 Preview - Decent Fundamentals, Hand in Hand with...
HEALTH CARE
Specialty Pharma U.S. Nektar Therapeutics NKTR-102 Positioned Well at ASCO
Phar Benefit Mngrs U.S. Express Scripts The Next(Rx) Phase - Faster Accretion Through Better...

Diversified Financials – Exchanges
April 12, 2010Toronto, Ontario
John Reucassel, CFA(416) [email protected]
Associate: Natalie Medak(416) [email protected]
This report was prepared by an analyst(s) employed by BMO Nesbitt Burns Inc., and who is (are) not registered as a research analyst(s) under FINRA rules. For disclosure statements, including the Analyst’s Certification, please refer to pages 3 to 6.
The Canadian Exchange BulletinA Preliminary Monthly Recap of Trading, Financing and Other Market Activities
(1) Venture and NEX combined, except for # of new listings, which is Venture only.Source: Company Reports
Mar-09 Feb-10 Mar-10 QTD-10 QTD-09 YTD-10 YTD-09 M/M Y/Y QTD/QTD YTD/YTDToronto Stock Exchange# of Trading Days 22 19 23 62 62 62 62
Volume (mm) 11,359 7,125 9,452 25,338 30,032 25,338 30,032 32.7% -16.8% -15.6% -15.6% Avg. Daily Volume (mm) 516 375 411 409 484 409 484 9.6% -20.4% -15.6% -15.6%# of Transactions ('000s) 20,580 13,166 15,928 43,112 51,925 43,112 51,925 21.0% -22.6% -17.0% -17.0% Avg. Daily Trades ('000s) 935 693 693 695 837 695 837 -0.1% -26.0% -17.0% -17.0%Avg. Size of Transaction 552 541 593 588 578 588 578 9.7% 7.5% 1.6% 1.6%
New Issuers Listed 7 13 11 49 15 49 15 -15.4% 57.1% 226.7% 226.7%# of IPOs 6 10 8 36 8 36 8 -20.0% 33.3% 350.0% 350.0%Issuers Listed 1,541 1,476 1,465 1,465 1,541 1,465 1,541 -0.7% -4.9% -4.9% -4.9%
IPO Financings Raised ($mm) 169 221 1,370 1,788 281 1,788 281 518.8% 710.1% 536.1% 536.1%Financings Raised ex-IPO ($mm) 4,502 1,906 2,887 7,511 11,571 7,511 11,571 51.5% -35.9% -35.1% -35.1%
TSX Venture Exchange (1)
Volume (mm) 2,702 3,942 5,998 15,373 8,069 15,373 8,069 52.2% 122.0% 90.5% 90.5% Avg. Daily Volume (mm) 123 207 261 248 130 248 130 25.7% 112.3% 90.5% 90.5%# of Transactions ('000s) 283 531 759 2,013 799 2,013 799 43.0% 168.4% 151.8% 151.8% Avg. Daily Trades ('000s) 13 28 33 32 13 32 13 18.1% 156.7% 151.8% 151.8%Avg. Size of Transaction 9,555 7,424 7,903 7,638 10,093 7,638 10,093 6.5% -17.3% -24.3% -24.3%
New Issuers Listed 8 14 13 38 24 38 24 -7.1% 62.5% 58.3% 58.3%Issuers Listed 2,449 2,383 2,378 2,378 2,449 2,378 2,449 -0.2% -2.9% -2.9% -2.9%
New Equity Financing ($mm) 290 387 642 1,748 531 1,748 531 65.7% 121.6% 228.9% 228.9%
% Change
Table 1: Cash Equity Markets
• AveragedailytradingvolumeontheSeniorexchangeforthemonthofMarchdecreased20.4%fromayearago.Meanwhile,tradingvolumesattheVentureexchangewereupstronglyinthemonth,withADVincreasing112.3%fromMarch2009.
• Interestingly,Alpha’smarketsharedeclinedslightly inMarch2010versusFebruary2010andtheTMX’sroseto73.1%from71.9%inthepreviousmonth.
• Ascompetitiongrows,weexpectTMX’smarketsharewillcontinuetodecline.
(1) Includes trading volume on the Senior and Venture exchanges.Source: IIROC, Company reports, BMO CM estimates
TMX (1) Alpha Chi-XPure
TradingMatchNow Other
Oct-09 79.9% 14.1% 3.3% 1.7% 0.7% 0.2%
Nov-09 79.8% 14.5% 3.5% 1.3% 0.7% 0.3%
Dec-09 75.9% 17.4% 3.5% 2.0% 0.7% 0.5%
Jan-10 73.9% 19.7% 3.4% 1.8% 0.7% 0.5%
Feb-10 71.9% 21.0% 4.1% 1.6% 0.8% 0.5%
Mar-10 73.1% 20.8% 3.5% 1.4% 0.8% 0.6%
Market Share of Total Trading Volume
Please r cluding the Analyst's Certification.
Public Storage (PSA-NYSE) Stock Rating: UnderperformI ndustry Rating: Market Perform
April 13, 2010
REITs
Paul E. Adornato, CFABMO Capital Markets Corp.
Mark Lutenski 212-885-4197 [email protected]
Filling the LA Basin Securities Info Price (12-Apr) $93.93 Target Price $78 52-Wk High/Low $95/$57 Dividend $2.60Mkt Cap (mm) $15,930 Yield 2.8%Shs O/S (mm, BASIC) 169.6 Ann. Div/2010 AFFO 57%Options O/S (mm) na ADVol (30-day, 000s) 1,233
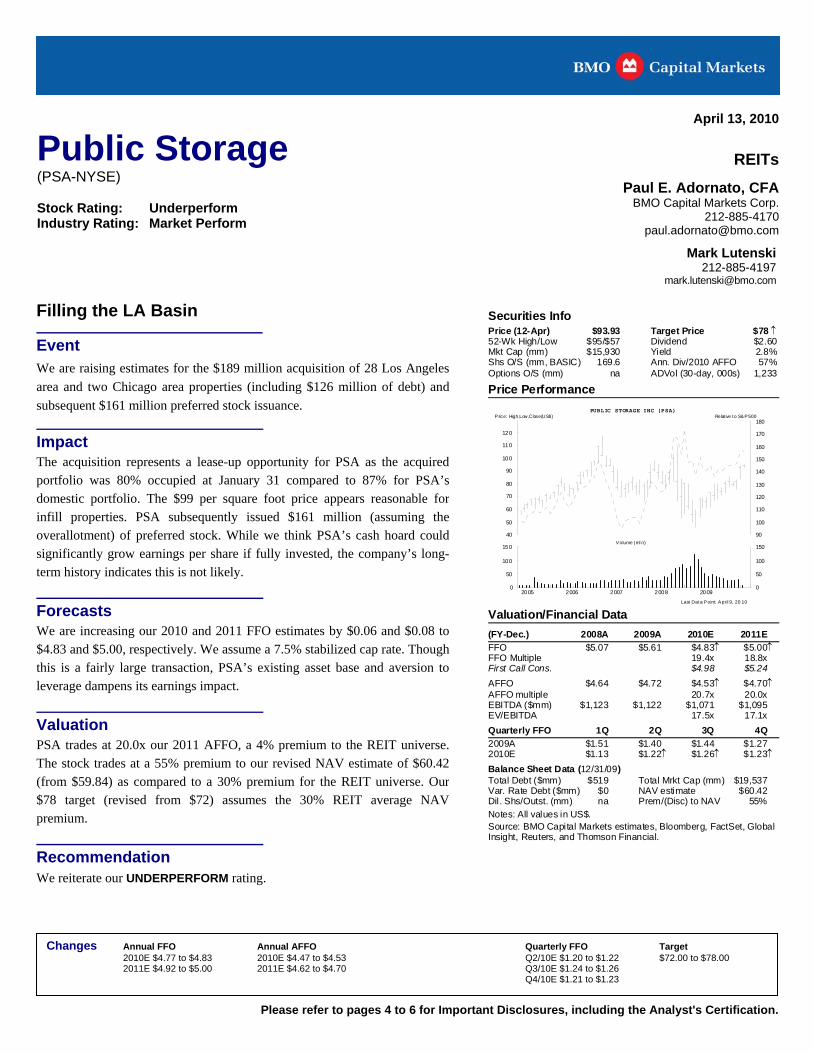
Price Performance
Event We are raising estimates for the $189 million acquisition of 28 Los Angeles
area and two Chicago area properties (including $126 million of debt) and
subsequent $161 million preferred stock issuance.
efer to pages 4 to 6 for Important Disclosures, in
90
100
110
120
130
140
150
160
170
180
PUBLIC STORAGE INC (PSA)Price: High,Low,Close(US$) Relat ive to S& P 500
Impact The acquisition represents a lease-up opportunity for PSA as the acquired portfolio was 80% occupied at January 31 compared to 87% for PSA’s domestic portfolio. The $99 per square foot price appears reasonable forinfill properties. PSA subsequently issued $161 million (assuming the overallotment) of preferred stock. While we think PSA’s cash hoard could significantly grow earnings per share if fully invested, the company’s long-term history indicates this is not likely.
40
50
60
70
80
90
100
110
120
0
50
100
150
Forecasts We are increasing our 2010 and 2011 FFO estimates by $0.06 and $0.08 to $4.83 and $5.00, respectively. We assume a 7.5% stabilized cap rate. Though this is a fairly large transaction, PSA’s existing asset base and aversion to leverage dampens its earnings impact.
Valuation PSA trades at 20.0x our 2011 AFFO, a 4% premium to the REIT universe.The stock trades at a 55% premium to our revised NAV estimate of $60.42(from $59.84) as compared to a 30% premium for the REIT universe. Our $78 target (revised from $72) assumes the 30% REIT average NAVpremium.
Recommendation We reiterate our UNDERPERFORM rating.
Changes Annual FFO Annual AFFO Quarterly FFO Target 2010E $4.77 to $4.83 2010E $4.47 to $4.53 Q2/10E $1.20 to $1.22 $72.00 to $78.00 2011E $4.92 to $5.00 2011E $4.62 to $4.70 Q3/10E $1.24 to $1.26 Q4/10E $1.21 to $1.23
2005 2006 2007 2008 2009
Volume (ml n)
Last Data Point: April 9, 20 10
Valuation/Financial Data
0
50
100
150
(FY-Dec.) 2008A 2009A 2010E 2011E
FFO $5.07 $5.61 $4.83 $5.00 FFO Multiple 19.4x 18.8x First Call Cons. $4.98 $5.24
AFFO $4.64 $4.72 $4.53 $4.70 AFFO multiple 20.7x 20.0x EBITDA ($mm) $1,123 $1,122 $1,071 $1,095 EV/EBITDA 17.5x 17.1x
Quarterly FFO 1Q 2Q 3Q 4Q
2009A $1.51 $1.40 $1.44 $1.27 2010E $1.13 $1.22 $1.26 $1.23
Balance Sheet Data (12/31/09) Total Debt ($mm) $519 Total Mrkt Cap (mm) $19,537 Var. Rate Debt ($mm) $0 NAV estimate $60.42 Dil. Shs/Outst. (mm) na Prem/(Disc) to NAV 55%
Notes: All values in US$. Source: BMO Capital Markets estimates, Bloomberg, FactSet, Global Insight, Reuters, and Thomson Financial.

Page 1 April 13, 2010
Electric Utilities and Independent Power
Industry Rating: Market Perform
April 13, 2010
Michael S. WormsBMO Capital Markets Corp.
Barbara Coletti Harsh Acharya, CFA 203-746-9312 212-885-4012 [email protected] [email protected]
Summary
Mirant and RRI Energy announced on April 11
that they had entered into a definitive agreement
to create a combined company named GenOn
with ~24,700 Mw of generation.
It is a merger of equals with an at-the-market
stock exchange ratio that eliminates any premium
to either company’s shareholders.
Compressed dark spreads in PJM continue to
weigh heavily on the outlook of both companies.
The combination does not address the dark
spread compression issue.
Nonetheless, GenOn should be able to achieve
ongoing annual cost savings of $150 million which
appears to be the key economic rationale for the
combination.
The combined company is expected to have $2.9
billion of cash which would be used to pay down
debt and to maintain the company’s ability to post
collaterals required to support its hedging program.
We expect the transaction to close by YE2010,
after the regulatory approvals are received.
While we are maintaining our adjusted EBITDA
estimate for both companies on a standalone
basis, we raising our price targets to $4 and $12
for MIR and RRI, respectively, as we apportion the
NPV of cost savings to these companies in the 54:
46 ratio.
We are raising our rating on MIR from
UNDERPERFORM to MARKET PERFORM to
reflect our revised valuation.
MIR and RRI Combination to Create Material Cost Savings; Upgrading MIR
Mirant and RRI Energy announced on April 11 that they had entered into a
definitive agreement to create a combined company named GenOn with
~24,700 Mw of generation. The combined company will have generation
assets in PJM, CAISO, ISO-NE, and the Southeast; with concentrated
exposure in PJM (50%) and California (20%).
MIR shareholders will receive a fixed ratio of 2.835 shares for each share of
RRI Energy. This ratio is in line with the average relative stock prices of
both companies as calculated from May 1, 2009, since RRI became a pure-
play generation company after divesting its competitive retail supply
business.
Upon closure of the merger agreement, we expect GenOn to have about
~$2.9 billion in cash, which would be used to pay down debt and maintain
the company’s ability to post collaterals required to support its power and
fuel hedging programs.
Both companies’ outlook continues to be severely pressured by compressed
dark spreads in PJM which had prompted our UNDERPERFORM call on
MIR (made on April 5, 2010). The combination does not address the dark
spread compression issue. However, the combined entity is expected to
realize about $150 million of annual cost savings starting in 2012, which in
our estimate represents ~40% of total corporate G&A costs, and drives a
more favorable earnings outlook than that achievable by either company
independently, in our view.
We are raising our price targets to $12 and $4 for MIR and RRI,
respectively, as we apportion the NPV of cost savings to these companies in
the 54:46 ratio. Concurrently, we are raising our rating on Mirant from
UNDERPERFORM to MARKET PERFORM to reflect our revised valuation;
our rating on RRI remains MARKET PERFORM.
Refer to pages 5 to 6 for Important Disclosures, including Analyst's Certification.

This report was prepared by an analyst(s) employ d as a research analyst(s) under FINRA rules. For disclosure statements, including
Alcoa (AA-NYSE) Stock Rating: Market PerformIndustry Rating: Market Perform
April 12, 2010 Research Comment Toronto, Ontario
Tony Robson BMO Nesbitt Burns Inc. (416) 359-4034 [email protected] Assoc: Matthew Griffiths
Price (12-Apr) $14.57 52-Week High $17.60 Target Price $15.00 52-Week Low $8.10 Alcoa Reports Q1/10 Underlying Earnings of
US$94M or US$0.09/Share
-2
-1
0
1
2
3
4
Alcoa Inc. (AA)Price: High,Low,Close(US$) Earnings/Share(US$)
0
10
20
30
40
50
Event Alcoa reported Q1/10 underlying earnings of US$94M (US$0.09/share), in line
with BMO Research’s estimate of US$0.10/share and consensus of
US$0.09/share. Reported results were once again negatively impacted by a
US$295M restructuring and special items charge and a US$7M loss from
discontinued operations, for a headline loss of US$0.20/share.
ed by BMO Nesbitt Burns Inc., and who is (are) not registerethe Analyst's Certification, please refer to pages 5 to 7.
Impact Neutral. Alcoa managed a marginal profit helped by a slightly firmer metal
price in the quarter.
Forecasts Forecasts have not been adjusted for the Q1/10 results. BMO Research
forecasts 2010E EPS of US$0.74/share and 2011E of US$1.14/share. Earnings
estimates decreased due to an increased share count, which could be offset by
continued cost saving initiatives.
Valuation Using a 10% nominal discount rate and BMO Research’s base case commodity
price assumption, Alcoa has an estimated NPV of US$17.58/share
Recommendation Alcoa is rated Market Perform with a US$15.00 price target. The target price is
derived using a weighted blend of NPV, EBITDA multiples, growth factors and
mine life and equated to 0.85x NPV.
0
1000
2000Volume (mln)
0
1000
2000
2005 2006 2007 2008 20090
100
200AA Relative to S&P 500
Last Data Point: April 9, 2010
0
100
200
(FY-Dec.) 2008A 2009A 2010E 2011E EPS $1.14 -$0.97 $0.74 $1.14P/E 19.7x 12.8x CFPS $1.40 $0.12 $2.11 $2.56P/CFPS 6.9x 5.7x EV/EBITDA 10.8x 38.0x 7.6x 5.9x Aluminum (US$/lb) $1.17 $0.75 $0.95 $1.00 Real'd Alum. (US$/lb) $1.23 $0.82 $0.98 $1.02 Alumina (US$/t) $355 $236 $275 $291 Quarterly EPS Q1 Q2 Q3 Q4 2008A $0.44 $0.66 $0.36 -$0.34 2009A -$0.60 -$0.41 $0.04 $0.00 2010E $0.09a $0.10 $0.24 $0.30 Dividend $0.12 Yield 0.8% Book Value $12.75 Price/Book 1.1x Shares O/S (mm) 1,020.0 Mkt. Cap (US$mm) $14,861 Float O/S (mm) 1,020.0 Float Cap (US$mm) $14,861 Wkly Vol (000s) 172,312 Wkly $ Vol (USmm) $2,170.3 Net Debt ($mm) $8,338.0 Next Rep. Date July (E)
Notes: All values in US$ Major Shareholders: Capital World Investment (6.07%), Barclays (4.47%) First Call Mean Estimates: ALCOA INC. (US$) 2010E: na; 2011E: $1.12
Changes Annual EPS Annual CFPS Quarterly EPS 2010E $0.76 to $0.74 2010E $2.13 to $2.11 Q2/10E $0.09 to $0.10 2011E $1.20 to $1.14 2011E $2.68 to $2.56 Q3/10E $0.25 to $0.24 Q4/10E $0.31 to $0.30

This report was prepared in part by an analyst(s) employed by a Canadian affiliate, BMO Nesbitt Burns Inc., and who is (are) not registered as a research analyst(s) under FINRA rules. For disclosure statements, including the Analyst's Certification, please refer to pages 6 to 7.
Materials - Paper & Forest
Industry Rating: Outperform
Rating Changes: Tembec — Market Perform Catalyst Papers — Underperform
April 13, 2010 Research Comment Montreal, Quebec Stephen Atkinson (514) 286-7309 [email protected] Assoc: Joe Licursi, CMA / David Guenette
Ratings, Estimates Changed and Target Prices Increased Since the beginning of March 2009, the U.S. Paper and Forest Products sector
is up 244% and its Canadian counterpart is up 138%. The market indices are
up an average of 70% over the same period.
Summary
We are raising our target prices for the
following companies due to rising prices for
their respective product lines:
o Domtar: $120 from $100
o IP: $46 from $43
o Sappi: $6.00 from $5.25
o Canfor: $12 from $10
o International Forest: $7.50 from $6.00
o Mercer: $6.75 from $6.00
o Norbord: $14 from $10
o Tembec: $2.50 from $2.00
o West Fraser: $45 from $40
o Weyerhaeuser: $40 from $35
We are lowering the ratings of Catalyst
Papers (Underperform from Market Perform)
and Tembec (Market Perform from
Outperform) due to stock price appreciation.
We are well above the First Call Mean for the
packaging companies (Cascades,
International Paper, Packaging Corp)
because we expect the $60/ton price increase
for April 1, 2010 to hold.
We are positive on the lumber companies but
our estimates are below the First Call Mean,
especially in 2011, due to our forecast of a
slow housing recovery.
Top Recommendations
Our sector rating is Outperform. Our preferred investments in the U.S. are
Domtar and International Paper. We also recommend Packaging Corp.
Our preferred investments in Canada are Canfor Pulp, Cascades, International
Forest Products and Sino Forest, all rated Outperform.
Themes: Elevated Pulp Prices
NBSK pulp prices bottomed at $580/tonne in April, 2009 before rising to the
current $930/tonne, buoyed by Chinese buying, up 55% in 2009. Elevated
pulp prices were also due to supply interruptions relating to flooding in the
U.S. South and Indonesia and the earthquake in Chile. Updated reports from
Chile indicate that roughly 25% of the 4.5mm tonnes of pulp capacity affected
by the earthquake was back online in early April. The remaining shut capacity
is expected to gradually come back online over the next two months (April
and May). The exception is Arauco’s 335,000 tpy unbleached softwood kraft
Constitucion mill scheduled to start up at the end of June due to extensive
damage.
Our forecasts assume pulp will decrease in H2/10 as Chilean production
gradually comes back online and Canadian and Asian pulp producers restart
idled capacity.
The rally could be longer than expected, depending on global paper
consumption and supply disruptions, if any. We increased our 2010–2011
NBSK pulp forecasts by $10/tonne due to stronger-than-expected paper
markets in the U.S. and Europe. Our NBSK pulp forecast for 2010 is
$875/tonne and $775/tonne for 2011.
This report was prepared by an analyst(s) employ d as a research analyst(s) under FINRA rules. For disclosure statements, including
Compass Minerals (CMP-NYSE) Stock Rating: OutperformIndustry Rating: Outperform
April 12, 2010 Research Comment Toronto, Ontario
Joel Jackson, P.Eng. BMO Nesbitt Burns Inc. (416) 359-4250 [email protected]
Price (12-Apr) $77.84 52-Week High $82.65 Target Price $92.00 52-Week Low $45.64 Pre-Released Q1 Highway Deicing Volume Slightly
Better Than Forecast
4.8
5.0
5.2
5.4
5.6
5.8
6.0
Compass Minerals (CMP)Price: High,Low,Close(US$) Earnings/Share(US$)
20
40
60
80
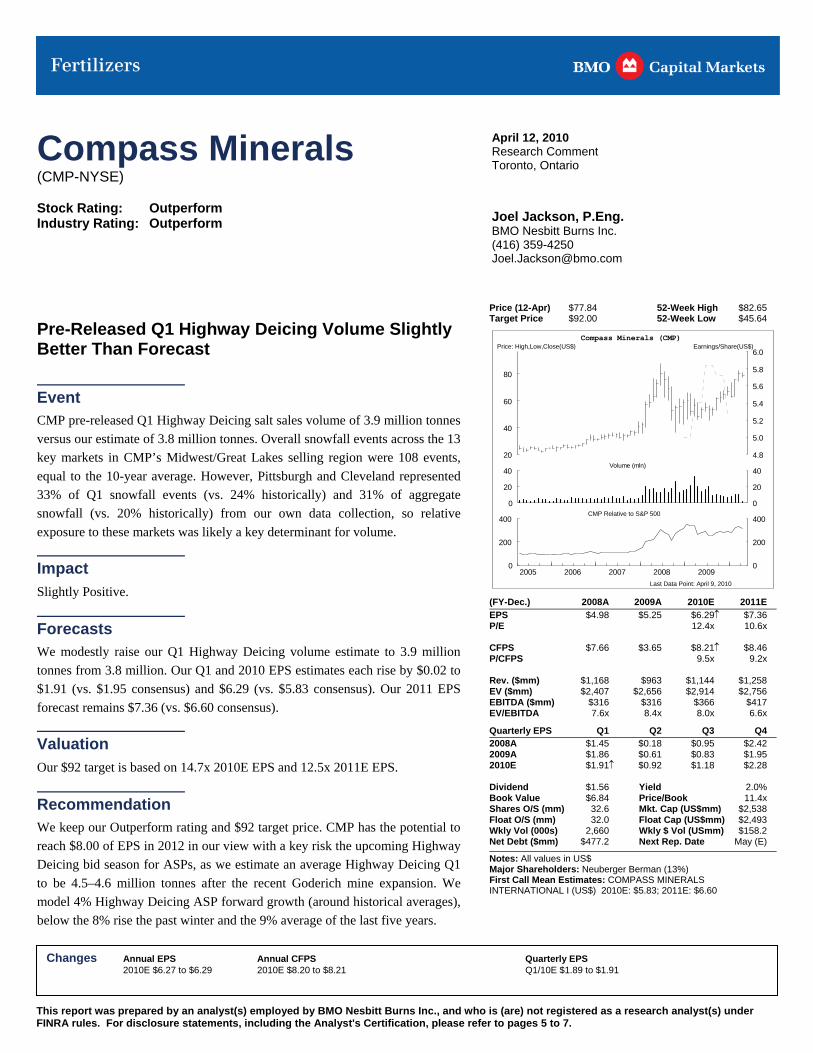
Event CMP pre-released Q1 Highway Deicing salt sales volume of 3.9 million tonnes
versus our estimate of 3.8 million tonnes. Overall snowfall events across the 13
key markets in CMP’s Midwest/Great Lakes selling region were 108 events,
equal to the 10-year average. However, Pittsburgh and Cleveland represented
33% of Q1 snowfall events (vs. 24% historically) and 31% of aggregate
snowfall (vs. 20% historically) from our own data collection, so relative
exposure to these markets was likely a key determinant for volume.
ed by BMO Nesbitt Burns Inc., and who is (are) not registere the Analyst's Certification, please refer to pages 5 to 7.
Impact
Slightly Positive.
Forecasts We modestly raise our Q1 Highway Deicing volume estimate to 3.9 million
tonnes from 3.8 million. Our Q1 and 2010 EPS estimates each rise by $0.02 to
$1.91 (vs. $1.95 consensus) and $6.29 (vs. $5.83 consensus). Our 2011 EPS
forecast remains $7.36 (vs. $6.60 consensus).
Valuation
Our $92 target is based on 14.7x 2010E EPS and 12.5x 2011E EPS.
Recommendation We keep our Outperform rating and $92 target price. CMP has the potential to
reach $8.00 of EPS in 2012 in our view with a key risk the upcoming Highway
Deicing bid season for ASPs, as we estimate an average Highway Deicing Q1
to be 4.5–4.6 million tonnes after the recent Goderich mine expansion. We
model 4% Highway Deicing ASP forward growth (around historical averages),
below the 8% rise the past winter and the 9% average of the last five years.
0
20
40Volume (mln)
0
20
40
2005 2006 2007 2008 20090
200
400CMP Relative to S&P 500
Last Data Point: April 9, 2010
0
200
400
(FY-Dec.) 2008A 2009A 2010E 2011E EPS $4.98 $5.25 $6.29 $7.36 P/E 12.4x 10.6x CFPS $7.66 $3.65 $8.21 $8.46 P/CFPS 9.5x 9.2x Rev. ($mm) $1,168 $963 $1,144 $1,258 EV ($mm) $2,407 $2,656 $2,914 $2,756 EBITDA ($mm) $316 $316 $366 $417 EV/EBITDA 7.6x 8.4x 8.0x 6.6x Quarterly EPS Q1 Q2 Q3 Q4 2008A $1.45 $0.18 $0.95 $2.42 2009A $1.86 $0.61 $0.83 $1.95 2010E $1.91 $0.92 $1.18 $2.28 Dividend $1.56 Yield 2.0% Book Value $6.84 Price/Book 11.4x Shares O/S (mm) 32.6 Mkt. Cap (US$mm) $2,538 Float O/S (mm) 32.0 Float Cap (US$mm) $2,493 Wkly Vol (000s) 2,660 Wkly $ Vol (USmm) $158.2 Net Debt ($mm) $477.2 Next Rep. Date May (E)
Notes: All values in US$ Major Shareholders: Neuberger Berman (13%) First Call Mean Estimates: COMPASS MINERALS INTERNATIONAL I (US$) 2010E: $5.83; 2011E: $6.60
Changes Annual EPS Annual CFPS Quarterly EPS 2010E $6.27 to $6.29 2010E $8.20 to $8.21 Q1/10E $1.89 to $1.91

FertilizersResearch
April 12, 2010Toronto, Ontario
Joel Jackson, P.Eng.(416) 359-4250 [email protected]
This report was prepared by an analyst(s) employed by BMO Nesbitt Burns Inc., and who is (are) not registered as a research analyst(s) under FINRA rules. For disclosure statements, including the Analyst’s Certification, please refer to pages 35 to 38.
MBAC Fertilizer(MBC – TSX)
Stock Rating: Outperform (S)
Industry Rating: Outperform
Initiating Brazilian Phosphate Junior at Outperform (S); Proving Reserves in the Breadbasket Price (9-Apr) $2.30 52-Week High $3.95
Target Price na 52-Week Low $0.07
(FY – Jul) 2009A 2010E 2011EEPS na -$0.29 -$0.05
P/E na na
CFPS na -$0.08 -$0.01
P/CFPS na na
Rev. ($mm) na $4 $9
EV ($mm) na na na
EBITDA ($mm) na -$21 -$7
EV/EBITDA na na na
Dividend $0.00 Yield 0.0%
Book Value $2.28 Price/Book 1.0x
Shares O/S (mm) 72.6 Mkt. Cap ($mm) $167
Float O/S (mm) 54.5 Float Cap ($mm) $125
Notes: All values in C$; (S) in rating denotes Speculative
Highlights
• BMOinitiatescoverageofMBAC,aresourceprovingstorywithstrongexposuretoBrazilianag,withanOutperform(Speculative)rating.
• MBACownsaphosphatedevelopmentinBrazil’sCerradoagriculturalarea,andexpectstoprogressitfromasmallminingoperationtoanintegratedSSP(SingleSuperphosphate)fertilizeroperation.
• MBAChasamaidenresourceestimate,butexplorationisongoingtoproveadequatereservesfor540,000tonnePhaseISSPcapacity.If additionalregionalexplorationoverthenextfewquartersprovesadequateaddedreserve,capacityisexpectedtodouble(PhaseII).
• DuetotheCerrado-centriclocationofMBAC’smineandoperation,andtheregionalnatureoftheSSPsupply/demanddynamic,MBACcouldbecomealow-costsuppliertomanyCerradofarmers.
• Theopportunity ispartiallybalancedby riskofproving sufficientreserves;andproducingconcentratefromalow-graderesource(similartoexistingBrazilianmines)asreportedtestworkispreliminary.
• BMOassumesUS$174mm (C$191mm)of initialnet capex, andUS$120mm(C$132mm)ofadditionalfinancingtobuildPhaseI.
• MBCcurrentlytradesata43%discounttoour11%basecase(PhaseIandII)NAVPSofC$4.05 (US$250/tSSPASP). If onlyPhase Imaterializesduetoalackofreserve,our11%NAVPSisC$2.91.BMOcurrentlyvaluesMBAC’sotherearly-stagepotashandphosphateprojectsatbookvalue.
• Near-termpotentialcatalystsincludeafeasibilityreportandsizeableresourceincreasetosupportPhaseI(expectedQ2).
0
1
2
3
4
5
6
0.0
0.2
0.4
0.6
0.8
1.0
1.2
MBAC Fertilizer (MBC)Price: High,Low,Close Earnings/Share
0
2
4
0
2
4Volume (mln)
2005 2006 2007 2008 20090
1000
2000
3000
0
1000
2000
3000MBC Relative to S&P/TSX Comp

This report was prepared by an analyst(s) employ d as a research analyst(s) under FINRA rules. For disclosure statements, including
CN Railway (CNR-TSX; CNI-NYSE) Stock Rating: Market PerformIndustry Rating: Outperform
April 12, 2010 Research Comment Toronto, Ontario
Randy Cousins, CFA BMO Nesbitt Burns Inc. (416) 359-6194 [email protected] Assoc: Stephen Yang
Price (9-Apr) $61.17 52-Week High $62.55 Target Price $65.00 52-Week Low $44.31 Adjusting Q1 Estimates for Volumes
ed by BMO Nesbitt Burns Inc., and who is (are) not registerethe Analyst's Certification, please refer to pages 6 to 9.
2.0
2.5
3.0
3.5
4.0
CN Railway Co. (CNR)Price: High,Low,Close Earnings/Share
Event
AAR Q1 carloadings for CNR were +15.1% y/y. Our estimate following the
release of the Q4/09 results assumed an increase in Q1 volumes of 6.8%. We are
adjusting our Q1 estimate for CNR to reflect the strong volume growth. 30
40
50
60
Impact
Positive. Q1 volumes were much better than we originally expected.
Additionally, CNR network metrics have never been better. The offset is a
higher Canada-U.S. dollar exchange rate.
Forecasts We are increasing our first quarter estimate to $0.74 from $0.71. Our 2010 EPS
estimate remains $3.80. The increase in the Q1 result is being offset by a higher
Canadian dollar exchange rate. Our 2011 earnings estimate is unchanged at
$4.42 per share.
Valuation
Our target price is based on 17.1 times our 2010 earnings estimate.
Recommendation We rate CNR Market Perform. While we prefer the U.S. rails over CNR/CNI,
for Canadian constrained investors CNR would be our first choice. We will
make any necessary adjustment to our target price and or ratings for CNR and
the other railroads following the completion of the Q1 reporting season.
0
50
100Volume (mln)
0
50
100
2005 2006 2007 2008 200950
100
150CNR Relative to S&P/TSX Comp
Last Data Point: April 9, 2010
50
100
150
(FY-Dec.) 2008A 2009A 2010E 2011E EPS $3.70 $3.24 $3.80 $4.42 P/E 16.1x 13.8x CFPS $5.37 $4.93 $6.05 $6.90P/CFPS 10.1x 8.9x Rev. ($mm) $8,482 $7,367 $8,164 $8,733 EV ($mm) $24,139 $23,705 $35,003 $34,958 EBITDA ($mm) $3,619 $3,196 $3,617 $3,983 EV/EBITDA 6.7x 7.4x 9.7x 8.8x Quarterly EPS Q1 Q2 Q3 Q4 2008A $0.62 $0.90 $1.07 $1.12 2009A $0.64 $0.76 $0.94 $0.90 2010E $0.74 $0.90 $1.02 $1.14 Dividend $1.08 Yield 1.8% Book Value $23.85 Price/Book 2.6x Shares O/S (mm) 471.0 Mkt. Cap ($mm) $28,811 Float O/S (mm) 471.0 Float Cap ($mm) $28,811 Wkly Vol (000s) 10,493 Wkly $ Vol (mm) $534.1 Net Debt ($mm) $6,109.0 Next Rep. Date Apr (E)
Notes: All values in C$ Major Shareholders: Widely held First Call Mean Estimates: CANADIAN NATIONAL RAILWAY (C$) 2010E: $3.72; 2011E: $4.34
Changes Annual CFPS Quarterly EPS 2011E $6.85 to $6.90 Q1/10E $0.71 to $0.74 Q2/10E $0.91 to $0.90 Q3/10E $1.03 to $1.02 Q4/10E $1.15 to $1.14

This report was prepared by an analyst(s) employ d as a research analyst(s) under FINRA rules. For disclosure statements, including
Kansas City Southern (KSU-NYSE) Stock Rating: Market PerformIndustry Rating: Outperform
April 12, 2010 Research Comment Toronto, Ontario
Randy Cousins, CFA BMO Nesbitt Burns Inc. (416) 359-6194 [email protected] Assoc: Stephen Yang
Price (9-Apr) $38.37 52-Week High $38.45 Target Price $38.00 52-Week Low $14.19 Adjusting Q1 Estimates for Volumes
ed by BMO Nesbitt Burns Inc., and who is (are) not registere the Analyst's Certification, please refer to pages 6 to 8.
0.0
0.5
1.0
1.5
2.0
2.5
10
20
30
40
50
60
Kansas City Southern (KSU)Price: High,Low,Close(US$) Earnings/Share(US$)
Event
Our Q1 estimate for Kansas City Southern was based on an increase in carload
volumes of 12.5%. As noted in our sector comment, Rail March Madness
(March 22, 2010), the final month of the quarter is critical. Actual carloadings in
Q1 were up 16.8% y/y. March carloads were up 24.2%. We are adjusting our
Q1 estimates to reflect the strong start to the year.
Impact
Positive. Strong volume growth is combined with excellent network metrics.
Forecasts
We are increasing our Q1/10 EPS estimate to $0.33 from $0.28. Our 2010 EPS
estimate is increased to $1.55 from $1.50. Our 2011 EPS estimate remains
$2.00.
Valuation
Our $38 target price is based on 19 times our 2011 estimate.
Recommendation We rate the stock Market Perform. We prefer the risk/reward ratio of the two
eastern roads CSX and NSC both rated Outperform. We will make any
necessary adjustment to our target price and or ratings for KSU and the other
railroads following the completion of the Q1 reporting season.
0
50
100Volume (mln)
0
50
100
2005 2006 2007 2008 20090
200
400KSU Relative to S&P 500
Last Data Point: April 9, 2010
0
200
400
(FY-Dec.) 2008A 2009A 2010E 2011E EPS $1.86 $0.61 $1.55 $2.00 P/E 24.8x 19.2x CFPS $4.16 $3.06 $4.15 $4.85 P/CFPS 9.2x 7.9x Rev. ($mm) $1,852 $1,480 $1,751 $1,923 EV ($mm) $5,648 $3,843 $5,724 $5,530 EBITDA ($mm) $560 $449 $588 $663 EV/EBITDA 10.1x 8.6x 9.7x 8.3x Quarterly EPS Q1 Q2 Q3 Q4 2008A $0.39 $0.56 $0.52 $0.40 2009A -$0.08 $0.07 $0.27 $0.33 2010E $0.33 $0.32 $0.43 $0.46 Dividend $0.00 Yield 0.0% Book Value $22.75 Price/Book 1.7x Shares O/S (mm) 102.9 Mkt. Cap (US$mm) $3,948 Float O/S (mm) 95.9 Float Cap (US$mm) $3,680 Wkly Vol (000s) 7,029 Wkly $ Vol (USmm) $167.4 Net Debt ($mm) $1,863.0 Next Rep. Date Apr (E)
Notes: All figures in US$; ROE & Book Value calculated on fully diluted basis Major Shareholders: Widely Held First Call Mean Estimates: KANSAS CITY SOUTHN (US$) 2010E: $1.47; 2011E: $1.93
Changes Annual EPS Annual CFPS Quarterly EPS 2010E $1.50 to $1.55 2010E $4.10 to $4.15 Q1/10E $0.28 to $0.33

This report was prepared by an analyst(s) employ d as a research analyst(s) under FINRA rules. For disclosure statements, including
Union Pacific (UNP-NYSE) Stock Rating: OutperformIndustry Rating: Outperform
April 12, 2010 Research Comment Toronto, Ontario
Randy Cousins, CFA BMO Nesbitt Burns Inc. (416) 359-6194 [email protected] Assoc: Stephen Yang
Price (9-Apr) $75.75 52-Week High $75.98 Target Price $75.00 52-Week Low $44.00 Adjusting Q1 Estimates for Volumes
ed by BMO Nesbitt Burns Inc., and who is (are) not registere the Analyst's Certification, please refer to pages 6 to 8.
1
2
3
4
5
Union Pacific Corp. (UNP)Price: High,Low,Close(US$) Earnings/Share(US$)
Event
Our Q1 estimate for Union Pacific was based on an increase in carload volumes
of 7.6%. As noted in our sector comment, Rail March Madness (March 22,
2010), the final month of the quarter is critical. Actual carloadings in Q1 were
up 12.8% y/y. March carloads were up 15.6%. We are adjusting our Q1
estimates to reflect the strong start to the year.
20
40
60
80
Impact
Positive. Strong volume growth is combined with excellent network metrics.
Forecasts
We are increasing our Q1/10 EPS estimate to $0.90 from $0.80. Consequently
our 2010 earnings estimate is increased by 10 cents to $4.40. Our 2011 earnings
estimate remains $5.11 per share.
Valuation
Our target price is $75 or 17 times our 2010 earnings estimate.
Recommendation
The combination of double-digit volume growth and a network that arguably
has never run better should have a positive impact on earnings. We rate UNP
Outperform. We will make any necessary adjustment to our target price and or
ratings for UNP and the other railroads following the completion of the Q1
reporting season.
0
200
400Volume (mln)
0
200
400
2005 2006 2007 2008 20090
200
400UNP Relative to S&P 500
Last Data Point: April 9, 2010
0
200
400
(FY-Dec.) 2008A 2009A 2010E 2011E EPS $4.54 $3.61 $4.40 $5.11 P/E 17.2x 14.8x CFPS $7.90 $7.10 $8.15 $9.10 P/CFPS 9.3x 8.3x Rev. ($mm) $17,970 $14,143 $15,862 $17,168 EV ($mm) $41,845 $34,928 $45,704 $45,411 EBITDA ($mm) $5,462 $4,798 $5,597 $6,076 EV/EBITDA 7.7x 7.3x 8.2x 7.5x Quarterly EPS Q1 Q2 Q3 Q4 2008A $0.85 $1.02 $1.38 $1.31 2009A $0.72 $0.78 $1.02 $1.08 2010E $0.90 $1.07 $1.21 $1.22 Dividend $1.08 Yield 1.4% Book Value $33.59 Price/Book 2.3x Shares O/S (mm) 504.3 Mkt. Cap (US$mm) $38,201 Float O/S (mm) 504.3 Float Cap (US$mm) $38,201 Wkly Vol (000s) 21,374 Wkly $ Vol (USmm) $1,261.5 Net Debt ($mm) $7,998.0 Next Rep. Date Apr (E)
Notes: All figures in US$ Major Shareholders: Widely held First Call Mean Estimates: UNION PACIFIC CORP (US$) 2010E: $4.35; 2011E: $5.17
Changes Annual EPS Annual CFPS Quarterly EPS 2010E $4.30 to $4.40 2010E $8.05 to $8.15 Q1/10E $0.80 to $0.90
This report was prepared by an analyst(s) employed by BMO Nesbitt Burns Inc., and who is (are) not registered as a research analyst(s) under FINRA rules. For disclosure statements, including the Analyst's Certification, please refer to pages 6 to 7.
Industrials - Transportation: Rails
Industry Rating: Outperform
April 12, 2010 Research Comment Toronto, Ontario Randy Cousins, CFA (416) 359-6194 [email protected] Assoc: Stephen Yang
Q1/10 Preview and Estimate Adjustments; Strong Volume Growth and Solid Operating Results Summary
With the exception of CP, the Q1 volume
results for all the other railroads were better
than our expectations. The biggest positive
surprises were CNR/CNI, UNP and KSU.
Railroading is a volume game. The more
traffic you move the better your earnings
should be.
Given better-than-expected volumes and the
solid operating performance of UNP and KSU
we have increased our Q1/10 and 2010
estimates. We have increased the Q1 estimate
for CNR/CNI but left the annual estimate
alone. The higher Canadian dollar is expected
to offset any Q1 win.
It has been a strong start to the year for the
industry. The first quarter results will be the
first true test of operational torque. We
believe that the industry should be able to add
incremental volumes at very low costs and
that the market/street is underestimating the
volume EBIT leverage.
On balance we expect all the companies to
report solid EPS growth. Moreover, we
believe the potential for positive surprise
across the group is quite high.
UNP, CSX and NSC are our top picks. For
Canadian constrained investors we prefer
CNR.
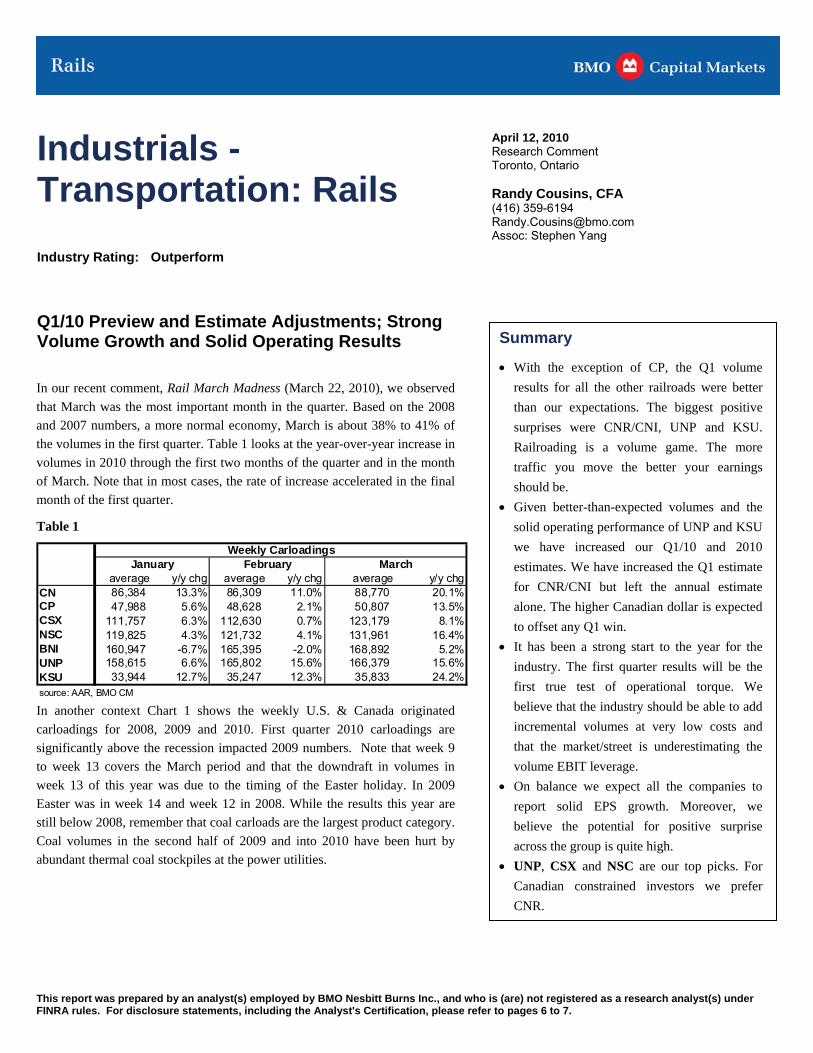
In our recent comment, Rail March Madness (March 22, 2010), we observed
that March was the most important month in the quarter. Based on the 2008
and 2007 numbers, a more normal economy, March is about 38% to 41% of
the volumes in the first quarter. Table 1 looks at the year-over-year increase in
volumes in 2010 through the first two months of the quarter and in the month
of March. Note that in most cases, the rate of increase accelerated in the final
month of the first quarter.
Table 1
average y/y chg average y/y chg average y/y chgCN 86,384 13.3% 86,309 11.0% 88,770 20.1%CP 47,988 5.6% 48,628 2.1% 50,807 13.5%CSX 111,757 6.3% 112,630 0.7% 123,179 8.1%NSC 119,825 4.3% 121,732 4.1% 131,961 16.4%BNI 160,947 -6.7% 165,395 -2.0% 168,892 5.2%UNP 158,615 6.6% 165,802 15.6% 166,379 15.6%KSU 33,944 12.7% 35,247 12.3% 35,833 24.2%source: AAR, BMO CM
January February MarchWeekly Carloadings
In another context Chart 1 shows the weekly U.S. & Canada originated
carloadings for 2008, 2009 and 2010. First quarter 2010 carloadings are
significantly above the recession impacted 2009 numbers. Note that week 9
to week 13 covers the March period and that the downdraft in volumes in
week 13 of this year was due to the timing of the Easter holiday. In 2009
Easter was in week 14 and week 12 in 2008. While the results this year are
still below 2008, remember that coal carloads are the largest product category.
Coal volumes in the second half of 2009 and into 2010 have been hurt by
abundant thermal coal stockpiles at the power utilities.

Page 1
Semiconductors
Industry Rating: Market Perform
April 12, 2010
Ambrish Srivastava, PhDBMO Capital Markets Corp.
Emily Scudder415-591-2130
Summary Intel and Linear kick off earnings for semis on
Tuesday. Expectations are fairly high as
reflected in the move in the SOX from the lows
in February, albeit the group has lagged the
S&P this year.
Overall, we believe expectations are for
companies to provide in-line results and guide
slightly better than seasonal for June.
Our investment thesis for semis continues to be
focused around specific stocks, given our view
that we are somewhat in the middle of the cycle,
with "peaky" indicators such as year-over-year
unit growth, margins, utilization rates, and lead
times, balanced by reasonable valuations, low
inventory, and broadly improving demand.
We are also raising our industry forecast for
2010 to 21% vs. 12%, and 2011 to 8% vs. 9%.
We are raising our estimates and price target for
ARM-LN. Estimates are up largely to account
for a lower exchange rate than we were
previously assuming.
1Q10 Preview – Decent Fundamentals, Hand in Hand with Heightened Expectations
Intel and Linear kick off earnings for semis on Tuesday. Expectations are
fairly high for the group as reflected in the move up from the February lows,
albeit the group has lagged the S&P so far this year.
Overall, we believe expectations are for companies to provide in-line results
and guide to slightly better than seasonal for the June quarter.
Our investment theme for semis continues to be focused around specific
stocks, given our view that we are somewhat in the middle of the cycle, with
typically peaky metrics such as year-over-year unit growth, margins,
utilization rates, and lead times, balanced by reasonable valuations, low
inventory, and a broadly improving demand environment.
We continue to like ARM-LN, INTC, BRCM, MRVL and TXN, all
OUTPERFORM-rated names.
We are also taking this opportunity to raise our industry forecast to a growth
of 21% for 2010 versus our earlier published forecast of 12% growth, and are
tweaking our 2011 forecast to 8% from 9%.
April 12, 2010
Refer to pages 21 to 22 for Important Disclosures, including Analyst's Certification.
12-Apr EPS P/E Mkt CapSemiconductors Rating Price Target 2009E 2010E 2011E 2009E 2010E 2011E Div Yld Book ($mm)Advanced Micro Devices (AMD) Market Perform $9.42 $9 $0.18 -$0.20 $0.07 52.3 nm nm $0.00 0.0% -$0.85 6,314Altera (ALTR) Market Perform $25.41 $24 $0.84 $1.58 $1.66 30.3 16.1 15.3 $0.20 0.8% $3.25 7,505Analog Devices (ADI) Market Perform $29.55 $32 $0.98 $2.00 $2.12 30.2 14.8 13.9 $0.80 2.7% $8.67 8,797ARM Holdings (ARM) Outperform £2.39 £3 £0.05 £0.07 £0.09 43.8 34.1 26.6 £0.02 0.8% £0.55 3,068Broadcom (BRCM) Outperform $34.06 $37 $1.23 $1.93 $2.05 27.7 17.6 16.6 $0.32 0.9% $7.78 14,867Intel (INTC) Outperform $22.55 $26 $0.78 $1.70 $1.85 28.9 13.3 12.2 $0.63 2.8% $7.55 124,566Linear Technology (LLTC) Market Perform $29.34 $31 $1.29 $1.33 $1.58 22.7 22.1 18.6 $0.92 3.1% -$0.74 6,546Marvell Technology (MRVL) Outperform $21.14 $27 $0.76 $0.97 $1.55 27.8 21.8 13.6 $0.00 0.0% $6.57 13,209Maxim Integrated Products (MXIM) Market Perform $19.89 $18 $0.07 $0.94 $1.20 nm 21.2 16.6 $0.80 4.0% $8.43 6,071NVIDIA (NVDA) Market Perform $17.30 $18 $0.26 $0.24 $0.88 66.5 72.1 19.7 $0.00 0.0% $4.40 9,537Texas Instruments (TXN) Outperform $25.69 $35 $1.16 $2.08 $2.34 22.1 12.4 11.0 $0.48 1.9% $7.84 31,904Xilinx (XLNX) Market Perform $26.63 $26 $1.28 $1.29 $1.76 20.8 20.6 15.1 $0.64 2.4% $7.36 7,367
Source: BMO Capital Markets estimates and company reports.
Please r cluding the Analyst's Certification.
Nektar Therapeutics (NKTR-NASDAQ) Stock Rating: OutperformI ndustry Rating: Market Perform
April 12, 2010
Specialty Pharmaceuticals
Robert HazlettBMO Capital Markets Corp.
James Tumbrink212-885-4195
NKTR-102 Positioned Well at ASCO Securities Info Price (12-Apr) $14.60 Target Price $1752-Wk High/Low $16/$5 Dividend --Mkt Cap (mm) $1,367 Yield --Shs O/S (mm, BASIC) 93.6 Float O/S (mm) 92.9Options O/S (mm) na ADVol (30-day, 000s) 936
Selected Bond Iss
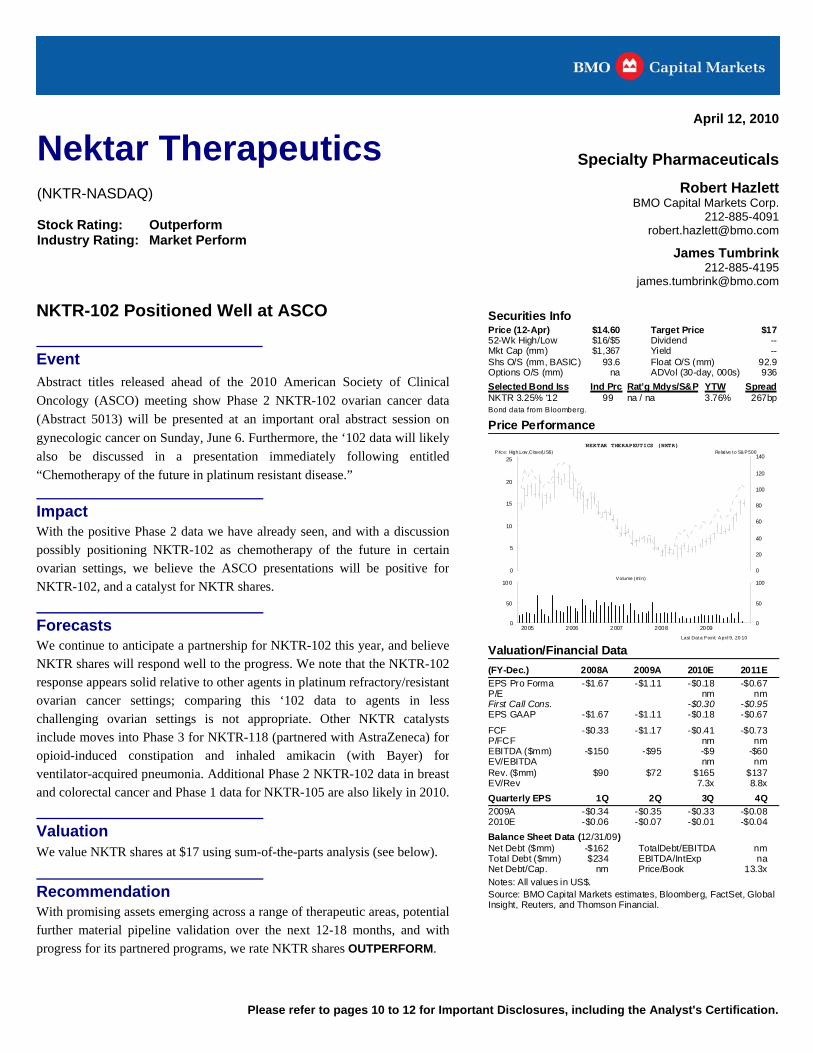
Event Abstract titles released ahead of the 2010 American Society of Clinical
Oncology (ASCO) meeting show Phase 2 NKTR-102 ovarian cancer data
(Abstract 5013) will be presented at an important oral abstract session on
gynecologic cancer on Sunday, June 6. Furthermore, the ‘102 data will likely
also be discussed in a presentation immediately following entitled
“Chemotherapy of the future in platinum resistant disease.”
efer to pages 10 to 12 for Important Disclosures, in
Impact With the positive Phase 2 data we have already seen, and with a discussion possibly positioning NKTR-102 as chemotherapy of the future in certain ovarian settings, we believe the ASCO presentations will be positive for NKTR-102, and a catalyst for NKTR shares.
Forecasts We continue to anticipate a partnership for NKTR-102 this year, and believeNKTR shares will respond well to the progress. We note that the NKTR-102 response appears solid relative to other agents in platinum refractory/resistant ovarian cancer settings; comparing this ‘102 data to agents in less challenging ovarian settings is not appropriate. Other NKTR catalysts include moves into Phase 3 for NKTR-118 (partnered with AstraZeneca) foropioid-induced constipation and inhaled amikacin (with Bayer) forventilator-acquired pneumonia. Additional Phase 2 NKTR-102 data in breast and colorectal cancer and Phase 1 data for NKTR-105 are also likely in 2010.
Valuation We value NKTR shares at $17 using sum-of-the-parts analysis (see below).
Recommendation With promising assets emerging across a range of therapeutic areas, potentialfurther material pipeline validation over the next 12-18 months, and with progress for its partnered programs, we rate NKTR shares OUTPERFORM.
Ind Prc Rat’g Mdys/S&P YTW SpreadNKTR 3.25% '12 99 na / na 3.76% 267bpBond data from Bloomberg.
Price Performance
0
20
40
60
80
100
120
140
NEKTAR THERAPEUTICS (NKTR)Price: High,Low,Close(US$) Relat ive to S& P 500
0
5
10
15
20
25
0
50
100
2005 2006 2007 2008 2009
Volume (ml n)
Last Data Point: April 9, 20 10
Valuation/Financial Data
0
50
100
(FY-Dec.) 2008A 2009A 2010E 2011E
EPS Pro Forma -$1.67 -$1.11 -$0.18 -$0.67 P/E nm nm First Call Cons. -$0.30 -$0.95 EPS GAAP -$1.67 -$1.11 -$0.18 -$0.67
FCF -$0.33 -$1.17 -$0.41 -$0.73 P/FCF nm nm EBITDA ($mm) -$150 -$95 -$9 -$60 EV/EBITDA nm nm Rev. ($mm) $90 $72 $165 $137 EV/Rev 7.3x 8.8x
Quarterly EPS 1Q 2Q 3Q 4Q
2009A -$0.34 -$0.35 -$0.33 -$0.08 2010E -$0.06 -$0.07 -$0.01 -$0.04
Balance Sheet Data (12/31/09) Net Debt ($mm) -$162 TotalDebt/EBITDA nm Total Debt ($mm) $234 EBITDA/IntExp na Net Debt/Cap. nm Price/Book 13.3x
Notes: All values in US$. Source: BMO Capital Markets estimates, Bloomberg, FactSet, Global Insight, Reuters, and Thomson Financial.

Please r cluding the Analyst's Certification.
Express Scripts (ESRX-NASDAQ) Stock Rating: OutperformI ndustry Rating: Outperform
April 12, 2010
Pharmacy Benefit Managers
Dave ShoveBMO Capital Markets Corp.
Jennifer Lynch212-885-4059
The Next(Rx) Phase – Faster Accretion Through Better SG&A Leverage
Securities Info Pr ice (12-Apr) $102.43 Target Price $120 52-Wk High/Low $104/$52 Dividend --Mk t Cap (mm) $28,199 Yield --Shs O/S (mm, BASIC) 275.3 Float O/S (mm) 274.1Options O/S (mm) na ADVol (30-day, 000s) 2,014
Selected Bond Iss Ind Prc Rat’g Mdys/S&P YTW SpreadESRX9.638 '09 na WR / NR naESRX 9.638% '09 na WR / NR naBond data from Bloomberg.
Price Performance
Event Updating estimates to reflect greater 2011 earnings accretion through better
SG&A leverage.
Impact Positive – We are updating our earnings estimates to reflect greater earnings accretion associated with Express Scripts’ acquisition of NextRx. Our new2010 assumptions bring us more inline with company guidance, while ourupdated 2011 estimates make us even more bullish on the name. We believethat positive momentum in the market place will help Express Scripts pushoperating efficiencies through the NextRx book of business faster thanpreviously expected. We are raising our 2011 operating earnings estimate to$6.30 (which excludes deal amortization) and raising our price target to$120. We rate shares of ESRX OUTPERFORM and continue to expectdouble-digit earnings growth through 2011 and beyond.
50
100
150
200
250
300
350
400
450
500
EXP RESS SCRIPTS INC (ESRX)Price: High,Lo w,Close( US$) Relative to S&P 500
0
20
40
60
80
100
0
100
200
efer to pages 4 to 6 for Important Disclosures, in
Forecasts Excluding mergers and acquisitions, our current EPS estimates for ESRX are$5.00 for 2010 and $6.30 for 2011. This represents 42% adjusted EPSgrowth in 2010 and 26% in 2011.
Valuation ESRX shares trade at approximately 16.3x our adjusted 2011 EPS estimateof $6.30. We believe the shares merit a forward P/E of 19x as earnings growth remains robust, producing a price target of $120. Our target multiple is in the midrange of ESRX’s historical range and reflects the politicaloverhang currently weighing on the healthcare sector.
Recommendation We continue to rate ESRX shares OUTPERFORM.
Changes Annual EPS Quarterly EPS Target 2010E $5.06 to $5.00 Q1/10E $1.20 to $1.10 $110.00 to $120.00 2011E $5.94 to $6.30 Q2/10E $1.25 to $1.20 Q3/10E $1.27 to $1.30
Q4/10E $1.34 to $1.40
2005 2006 2007 2008 2009
Volum e ( mln)
L ast Data Point : Apr il 9, 201 0
Valuation/Financial Data
0
100
200
(FY-Dec.) 2008A 2009A 2010E 2011E EPS Pro Forma $3.09 $3.52 $5.00 $6.30 P/E 20.5x 16.3x First Call Cons. $4.94 $6.23 EPS GAAP $3.09 $3.28 $4.13 $5.94
FCF $2.89 $3.54 na na P/FCF na na EBITDA ($mm) $1,378 $1,641 $2,486 $3,020 Rev. ($mm) $19,534 $21,732 $40,309 $44,430
Quarter ly EPS 1Q 2Q 3Q 4Q 2009A $0.86 $0.88 $0.81 $0.97 2010E $1.10 $1.20 $1.30 $1.40
Balance Sheet Data (12/31/09) Net Debt ($mm) $2,751 TotalDebt/EBITDA 0.4x Total Debt ($mm) $3,833 EBITDA/IntExp 1.5x Net Debt/Cap. 37.3% Price/Book 49.0x Notes: All values in US$. Source: BMO Capital Markets estimates, Bloomberg, FactSet, Global Insight, Reuters, and Thomson Financial.
Important Disclosures Analyst's Certification As to each company covered in this report, the analyst hereby certifies that the views expressed in this report accurately reflect my personal views about the subject securities or issuers. I also certify that no part of my compensation was, is, or will be, directly or indirectly, related to the specific recommendations or views expressed in this report. Analysts who prepared this report are compensated based upon (among other factors) the overall profitability of BMO Capital Markets and their affiliates, which includes the overall profitability of investment banking services. Compensation for research is based on effectiveness in generating new ideas and in communication of ideas to clients, performance of recommendations, accuracy of earnings estimates, and service to clients. Analysts employed by BMO Nesbitt Burns Inc. and/or BMO Capital Markets Ltd. are not registered as research analysts with FINRA. These analysts may not be associated persons of BMO Capital Markets Corp. and therefore may not be subject to the NASD Rule 2711 and NYSE Rule 472 restrictions on communications with a subject company, public appearances and trading securities held by a research analyst account.
Company Specific Disclosures For Important Disclosures on the stocks discussed in this report, please go http://researchglobal.bmocapitalmarkets.com/Company_Disclosure_ Public.asp.
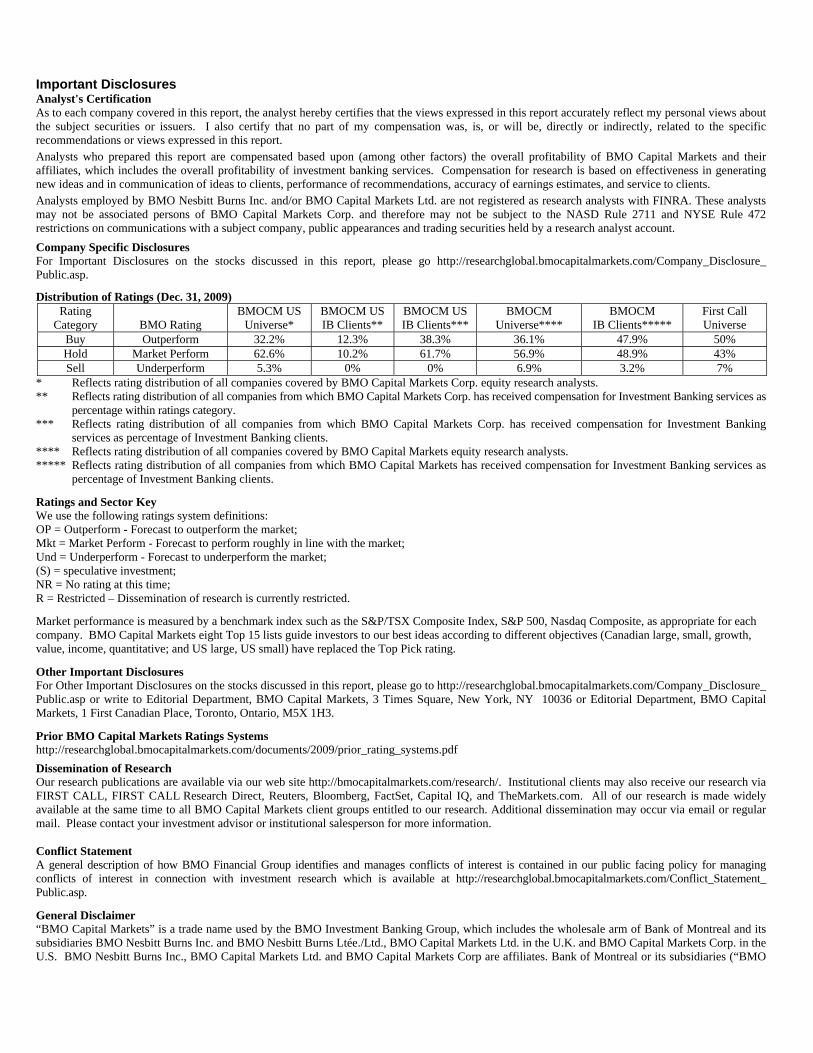
Distribution of Ratings (Dec. 31, 2009) Rating
Category
BMO Rating BMOCM US
Universe* BMOCM USIB Clients**
BMOCM USIB Clients***
BMOCM Universe****
BMOCM IB Clients*****
First Call Universe
Buy Outperform 32.2% 12.3% 38.3% 36.1% 47.9% 50% Hold Market Perform 62.6% 10.2% 61.7% 56.9% 48.9% 43% Sell Underperform 5.3% 0% 0% 6.9% 3.2% 7%
* Reflects rating distribution of all companies covered by BMO Capital Markets Corp. equity research analysts. ** Reflects rating distribution of all companies from which BMO Capital Markets Corp. has received compensation for Investment Banking services as
percentage within ratings category. *** Reflects rating distribution of all companies from which BMO Capital Markets Corp. has received compensation for Investment Banking
services as percentage of Investment Banking clients. **** Reflects rating distribution of all companies covered by BMO Capital Markets equity research analysts. ***** Reflects rating distribution of all companies from which BMO Capital Markets has received compensation for Investment Banking services as
percentage of Investment Banking clients.
Ratings and Sector Key We use the following ratings system definitions: OP = Outperform - Forecast to outperform the market; Mkt = Market Perform - Forecast to perform roughly in line with the market; Und = Underperform - Forecast to underperform the market; (S) = speculative investment; NR = No rating at this time; R = Restricted – Dissemination of research is currently restricted.
Market performance is measured by a benchmark index such as the S&P/TSX Composite Index, S&P 500, Nasdaq Composite, as appropriate for each company. BMO Capital Markets eight Top 15 lists guide investors to our best ideas according to different objectives (Canadian large, small, growth, value, income, quantitative; and US large, US small) have replaced the Top Pick rating.
Other Important Disclosures For Other Important Disclosures on the stocks discussed in this report, please go to http://researchglobal.bmocapitalmarkets.com/Company_Disclosure_ Public.asp or write to Editorial Department, BMO Capital Markets, 3 Times Square, New York, NY 10036 or Editorial Department, BMO Capital Markets, 1 First Canadian Place, Toronto, Ontario, M5X 1H3.
Prior BMO Capital Markets Ratings Systems http://researchglobal.bmocapitalmarkets.com/documents/2009/prior_rating_systems.pdf
Dissemination of Research Our research publications are available via our web site http://bmocapitalmarkets.com/research/. Institutional clients may also receive our research via FIRST CALL, FIRST CALL Research Direct, Reuters, Bloomberg, FactSet, Capital IQ, and TheMarkets.com. All of our research is made widely available at the same time to all BMO Capital Markets client groups entitled to our research. Additional dissemination may occur via email or regular mail. Please contact your investment advisor or institutional salesperson for more information.
Conflict Statement A general description of how BMO Financial Group identifies and manages conflicts of interest is contained in our public facing policy for managing conflicts of interest in connection with investment research which is available at http://researchglobal.bmocapitalmarkets.com/Conflict_Statement_ Public.asp.
General Disclaimer “BMO Capital Markets” is a trade name used by the BMO Investment Banking Group, which includes the wholesale arm of Bank of Montreal and its subsidiaries BMO Nesbitt Burns Inc. and BMO Nesbitt Burns Ltée./Ltd., BMO Capital Markets Ltd. in the U.K. and BMO Capital Markets Corp. in the U.S. BMO Nesbitt Burns Inc., BMO Capital Markets Ltd. and BMO Capital Markets Corp are affiliates. Bank of Montreal or its subsidiaries (“BMO
BMO Capital Markets
Financial Group”) has lending arrangements with, or provide other remunerated services to, many issuers covered by BMO Capital Markets. The opinions, estimates and projections contained in this report are those of BMO Capital Markets as of the date of this report and are subject to change without notice. BMO Capital Markets endeavours to ensure that the contents have been compiled or derived from sources that we believe are reliable and contain information and opinions that are accurate and complete. However, BMO Capital Markets makes no representation or warranty, express or implied, in respect thereof, takes no responsibility for any errors and omissions contained herein and accepts no liability whatsoever for any loss arising from any use of, or reliance on, this report or its contents. Information may be available to BMO Capital Markets or its affiliates that is not reflected in this report. The information in this report is not intended to be used as the primary basis of investment decisions, and because of individual client objectives, should not be construed as advice designed to meet the particular investment needs of any investor. This material is for information purposes only and is not an offer to sell or the solicitation of an offer to buy any security. BMO Capital Markets or its affiliates will buy from or sell to customers the securities of issuers mentioned in this report on a principal basis. BMO Capital Markets or its affiliates, officers, directors or employees have a long or short position in many of the securities discussed herein, related securities or in options, futures or other derivative instruments based thereon. The reader should assume that BMO Capital Markets or its affiliates may have a conflict of interest and should not rely solely on this report in evaluating whether or not to buy or sell securities of issuers discussed herein.
Additional Matters
To Canadian Residents: BMO Nesbitt Burns Inc. and BMO Nesbitt Burns Ltee/Ltd., affiliates of BMO Capital Markets Corp., furnish this report to Canadian residents and accept responsibility for the contents herein subject to the terms set out above. Any Canadian person wishing to effect transactions in any of the securities included in this report should do so through BMO Nesbitt Burns Inc. and/or BMO Nesbitt Burns Ltee/Ltd.
To U.S. Residents: BMO Capital Markets Corp. and/or BMO Nesbitt Burns Securities Ltd., affiliates of BMO NB, furnish this report to U.S. residents and accept responsibility for the contents herein, except to the extent that it refers to securities of Bank of Montreal. Any U.S. person wishing to effect transactions in any security discussed herein should do so through BMO Capital Markets Corp. and/or BMO Nesbitt Burns Securities Ltd.
To U.K. Residents: In the UK this document is published by BMO Capital Markets Limited which is authorised and regulated by the Financial Services Authority. The contents hereof are intended solely for the use of, and may only be issued or passed on to, (I) persons who have professional experience in matters relating to investments falling within Article 19(5) of the Financial Services and Markets Act 2000 (Financial Promotion) Order 2005 (the “Order”) or (II) high net worth entities falling within Article 49(2)(a) to (d) of the Order (all such persons together referred to as “relevant persons”). The contents hereof are not intended for the use of and may not be issued or passed on to, retail clients.
ADDITIONAL INFORMATION IS AVAILABLE UPON REQUEST BMO Financial Group (NYSE, TSX: BMO) is an integrated financial services provider offering a range of retail banking, wealth management, and investment and corporate banking products. BMO serves Canadian retail clients through BMO Bank of Montreal and BMO Nesbitt Burns. In the United States, retail clients are served through Harris N.A. Investment and corporate banking services are provided in Canada and the US through BMO Capital Markets.
BMO Capital Markets is a trade name used by BMO Financial Group for the wholesale banking businesses of Bank of Montreal, Harris N.A. and BMO Ireland Plc, and the institutional broker dealer businesses of BMO Capital Markets Corp. (Member SIPC), BMO Nesbitt Burns Trading Corp. and BMO Capital Markets GKST Inc. (Member SIPC) in the U.S., BMO Nesbitt Burns Inc. (Member CIPF) in Canada, Europe and Asia, BMO Nesbitt Burns Securities Limited (U.S. registered and member of FINRA), and BMO Nesbitt Burns Ltée/Ltd. (Member CIPF) in Canada, and BMO Capital Markets Limited in Europe and Australia. “Nesbitt Burns” is a registered trademark of BMO Nesbitt Burns Corporation Limited, used under license. “BMO Capital Markets” is a trademark of Bank of Montreal, used under license. "BMO (M-Bar roundel symbol)" is a registered trademark of Bank of Montreal, used under license.
® Registered trademark of Bank of Montreal in the United States, Canada and elsewhere. TM Trademark Bank of Montreal
©COPYRIGHT 2010 BMO CAPITAL MARKETS CORP.
Financial GroupA member of BMO
Page 2 February 17, 2010
Related Documents