BioMed Central Page 1 of 15 (page number not for citation purposes) BMC Bioinformatics Open Access Research article Oligomeric protein structure networks: insights into protein-protein interactions KV Brinda and Saraswathi Vishveshwara* Address: Molecular Biophysics Unit, Indian Institute of Science, Bangalore, India 560012 Email: KV Brinda - [email protected]; Saraswathi Vishveshwara* - [email protected] * Corresponding author Abstract Background: Protein-protein association is essential for a variety of cellular processes and hence a large number of investigations are being carried out to understand the principles of protein- protein interactions. In this study, oligomeric protein structures are viewed from a network perspective to obtain new insights into protein association. Structure graphs of proteins have been constructed from a non-redundant set of protein oligomer crystal structures by considering amino acid residues as nodes and the edges are based on the strength of the non-covalent interactions between the residues. The analysis of such networks has been carried out in terms of amino acid clusters and hubs (highly connected residues) with special emphasis to protein interfaces. Results: A variety of interactions such as hydrogen bond, salt bridges, aromatic and hydrophobic interactions, which occur at the interfaces are identified in a consolidated manner as amino acid clusters at the interface, from this study. Moreover, the characterization of the highly connected hub-forming residues at the interfaces and their comparison with the hubs from the non-interface regions and the non-hubs in the interface regions show that there is a predominance of charged interactions at the interfaces. Further, strong and weak interfaces are identified on the basis of the interaction strength between amino acid residues and the sizes of the interface clusters, which also show that many protein interfaces are stronger than their monomeric protein cores. The interface strengths evaluated based on the interface clusters and hubs also correlate well with experimentally determined dissociation constants for known complexes. Finally, the interface hubs identified using the present method correlate very well with experimentally determined hotspots in the interfaces of protein complexes obtained from the Alanine Scanning Energetics database (ASEdb). A few predictions of interface hot spots have also been made based on the results obtained from this analysis, which await experimental verification. Conclusion: The construction and analysis of oligomeric protein structure networks and their comparison with monomeric protein structure networks provide insights into protein association. Further, the interface hubs identified using the present method can be effective targets for interface de-stabilizing mutations. We believe this analysis will significantly enhance our knowledge of the principles behind protein association and also aid in protein design. Published: 10 December 2005 BMC Bioinformatics 2005, 6:296 doi:10.1186/1471-2105-6-296 Received: 26 July 2005 Accepted: 10 December 2005 This article is available from: http://www.biomedcentral.com/1471-2105/6/296 © 2005 Brinda and Vishveshwara; licensee BioMed Central Ltd. This is an Open Access article distributed under the terms of the Creative Commons Attribution License (http://creativecommons.org/licenses/by/2.0 ), which permits unrestricted use, distribution, and reproduction in any medium, provided the original work is properly cited.

Welcome message from author
This document is posted to help you gain knowledge. Please leave a comment to let me know what you think about it! Share it to your friends and learn new things together.
Transcript
BioMed CentralBMC Bioinformatics
ss
Open AcceResearch articleOligomeric protein structure networks: insights into protein-protein interactionsKV Brinda and Saraswathi Vishveshwara*Address: Molecular Biophysics Unit, Indian Institute of Science, Bangalore, India 560012
Email: KV Brinda - [email protected]; Saraswathi Vishveshwara* - [email protected]
* Corresponding author
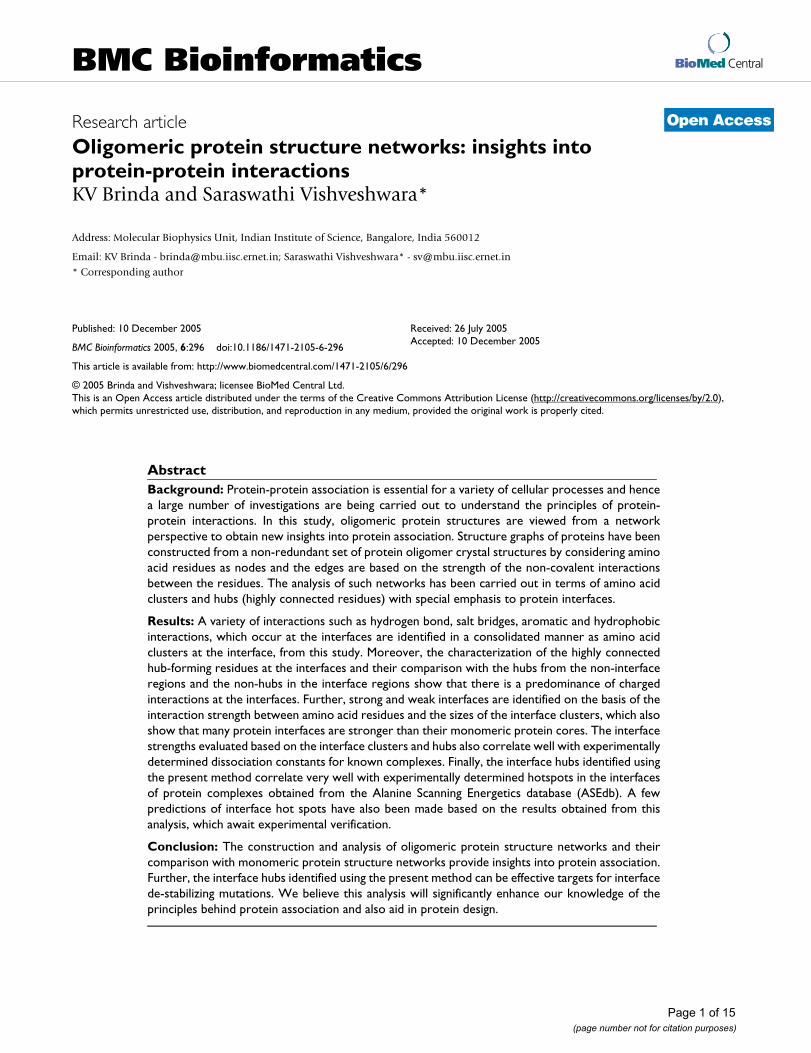
AbstractBackground: Protein-protein association is essential for a variety of cellular processes and hencea large number of investigations are being carried out to understand the principles of protein-protein interactions. In this study, oligomeric protein structures are viewed from a networkperspective to obtain new insights into protein association. Structure graphs of proteins have beenconstructed from a non-redundant set of protein oligomer crystal structures by considering aminoacid residues as nodes and the edges are based on the strength of the non-covalent interactionsbetween the residues. The analysis of such networks has been carried out in terms of amino acidclusters and hubs (highly connected residues) with special emphasis to protein interfaces.
Results: A variety of interactions such as hydrogen bond, salt bridges, aromatic and hydrophobicinteractions, which occur at the interfaces are identified in a consolidated manner as amino acidclusters at the interface, from this study. Moreover, the characterization of the highly connectedhub-forming residues at the interfaces and their comparison with the hubs from the non-interfaceregions and the non-hubs in the interface regions show that there is a predominance of chargedinteractions at the interfaces. Further, strong and weak interfaces are identified on the basis of theinteraction strength between amino acid residues and the sizes of the interface clusters, which alsoshow that many protein interfaces are stronger than their monomeric protein cores. The interfacestrengths evaluated based on the interface clusters and hubs also correlate well with experimentallydetermined dissociation constants for known complexes. Finally, the interface hubs identified usingthe present method correlate very well with experimentally determined hotspots in the interfacesof protein complexes obtained from the Alanine Scanning Energetics database (ASEdb). A fewpredictions of interface hot spots have also been made based on the results obtained from thisanalysis, which await experimental verification.
Conclusion: The construction and analysis of oligomeric protein structure networks and theircomparison with monomeric protein structure networks provide insights into protein association.Further, the interface hubs identified using the present method can be effective targets for interfacede-stabilizing mutations. We believe this analysis will significantly enhance our knowledge of theprinciples behind protein association and also aid in protein design.
Published: 10 December 2005
BMC Bioinformatics 2005, 6:296 doi:10.1186/1471-2105-6-296
Received: 26 July 2005Accepted: 10 December 2005
This article is available from: http://www.biomedcentral.com/1471-2105/6/296
© 2005 Brinda and Vishveshwara; licensee BioMed Central Ltd. This is an Open Access article distributed under the terms of the Creative Commons Attribution License (http://creativecommons.org/licenses/by/2.0), which permits unrestricted use, distribution, and reproduction in any medium, provided the original work is properly cited.
Page 1 of 15(page number not for citation purposes)
BMC Bioinformatics 2005, 6:296 http://www.biomedcentral.com/1471-2105/6/296
BackgroundIt is well known that a vast majority of cellular functionsare mediated through protein-protein and protein-DNAinteractions. Protein association is implicated in cellularsignal transduction, antigen-antibody binding, in the reg-ulation of gene expression and in the functioning of ahuge variety of other constitutive multimers, where themultimeric state is the biologically active state. Hence,extensive research has been carried out to identify and tounderstand the underlying principles of protein associa-tion and interactions. Some insights to such interactionsat atomic level have emerged from the analysis of largenumber of high-resolution crystal structures. Such investi-gations involve the characterization of the geometrical,chemical, and the energetic features of the interfaces asexplained in the various reviews [1-6]. Specific studiesinclude obtaining residue preferences at the interfaces [7],calculations of geometric parameters and shape comple-mentarities between the interacting protein chains [8-11],calculations of the loss in accessible surface upon mul-timerization [12-15], elucidation of the role of hydrogenbonds, salt-bridges and hydrophobic and polar interac-tions at protein interfaces [16-21] and the analysis of con-servation of residues at protein interfaces [22-26]. Variousinvestigators have identified and analyzed energetic hotspots in protein interfaces using varied approaches [26-29]. Haliloglu et al., have compared protein folding andprotein binding using vibrational motions of interface hotspots and conserved residues and conclude that bothprocesses involve similar packing of amino acid residues[30]. They also provide a method for identifying hot spotsat binding interfaces. Further, Ofran and Rost have classi-fied and analyzed the differences between six interfacetypes including obligatory and transient homo and heterooligomers [31]. De et al., have also distinguished obliga-tory and non-obligatory interfaces using differences in theamino acid contacts and interactions patterns between thetwo interface types [32]. Bahadur et al., have distinguishedthe biological oligomers from non-specific oligomerscaused due to crystal packing [33]. There have also beenspeculations about whether folding and binding are com-pletely de-coupled with each other or whether they occursimultaneously, one coupled with the other [34]. Wolynesand co-workers through simulations present that even ifthe monomers involved in binding may be stable sepa-rately, binding might preferably occur through unfoldedintermediates, thus implying that folding and bindingmay be coupled in vivo and driven by the native statetopology of the functional protein [34]. Further, a com-munity-wide evaluation of the significance and success ofdifferent methods used in the prediction of protein-pro-tein interactions and protein docking has been carried out(CAPRI) and has been hugely successful [35]. However,though there have been significant advances in methodsof protein docking, those that are generally used in the
identification of binding sites in monomer surfaces andthe prediction of protein-protein interactions sites are farfrom satisfactory. Hence, newer approaches are requiredto get more insights into the factors contributing to pro-tein-protein interactions.
We have earlier carried out an analysis on a limited set oftwenty homodimers to understand the principles of pro-tein-protein interactions from a graph perspective [36].This analysis was directed towards identifying clusters ofamino acid residues with strong interactions at the proteininterfaces, the nature of the residues involved in theseinterface clusters and the accessibility and conservation ofthese interface cluster forming residues. We had also pro-posed a simple and straightforward method to identifyinteracting surfaces on protein monomers, which washighly successful in that dataset. The present study focuseson the network of amino acid interactions across proteininterfaces and has been carried out on a larger dataset ofprotein homo as well as hetero multimers. Recently, DelSol and co-workers have investigated protein-proteincomplexes from the small-world network perspectiveusing parameters like clustering coefficients and between-ness, where the central residues identified at the inter-faces, have been found to correlate with theexperimentally determined hotspots [37]. Further, thesame group also proposes the rewiring of the small-worldnetworks at protein interfaces to form clusters of centralresidues at the interfaces [38]. The current analysis alsoconsiders the protein structure in its multimeric form as anetwork of non-covalently interacting amino acids. How-ever, we use a different definition of nodes and edges thanthe ones used by Del Sol and co-workers [37,38], andhave also incorporated an interaction strength term in thenetwork construction and in the analysis of differentparameters to understand the network topology of pro-tein multimers. Since we know that protein-protein inter-actions are mainly mediated through non-covalentinteractions, the connections (edges) between aminoacids (nodes) are defined on the basis of the strength ofthe non-covalent interactions, as evaluated from the nor-malized number of contacts between them. The results areanalyzed in terms of the network properties such as thehubs (nodes with greater number of edges) and clusters ofamino acid residues in the protein complex at a giveninteraction strength, with particular focus at the protein-protein interface. Such an approach gives a global per-spective of the interactions across the interface, which isdifficult to obtain from pair-wise interaction or loss ofaccessible surface area analysis. For example, our earlieranalysis on the clusters of interacting residues at the pro-tein interface has given insights regarding the sequencesignatures responsible for the different types of quaternaryassociation in legume lectins[39] and has also helped inthe identification of hot spots in the α-α dimeric interface
Page 2 of 15(page number not for citation purposes)
BMC Bioinformatics 2005, 6:296 http://www.biomedcentral.com/1471-2105/6/296
of Escherichia coli RNA polymerase[40]. The network rep-resentation presented here has also been used earlier toidentify structural domains and domain interface residuesin multi-domain protein using a graph spectral method[41]. However, in this analysis, we focus on the identifica-tion and analysis of amino acid clusters and hubs at pro-tein-protein interfaces based on a generic networkapproach.
Interesting observations made from the present analysison protein multimers include the fact that the strength ofinterfaces evaluated using the interface clusters and hubsidentified by present method correlate well with thekinetic and thermodynamic parameters of complex for-mation evaluated experimentally. Further, the interfacehubs identified here also correlate well with the experi-mentally identified hot spots on the basis of binding freeenergy. This result indicates that hotspots can be associ-ated with interface hubs, the identification of which canbe useful in rationally designing interface de-stabilizingmutants. Further, a comparison of the interface hubs tothe hubs within the protein monomer and with the non-hubs at the interface show significant differences in theinterface hub properties, such as the contribution of thecharged interactions being considerably higher at theinterfaces. The analysis of the interface clusters has alsoshown that the protein interfaces are as strong as orstronger than the protein cores in more than half the pro-tein complexes considered in the dataset. Thus, thepresent algorithm has given a new perspective into analyz-ing protein structures in general and protein complexes inspecific, which has shed light onto some of the factorsinvolved in protein association.
Results and discussionThe concept of networks in biology has been explored inthe areas of protein interaction networks, metabolic net-works etc [42]. The idea of considering protein structuresas a network of amino acid connections is relatively newand has provided insights into protein structure, stabilityand folding. For instance, Vendruscolo et al., andDokholyan et al., [43-45] have used a similar approach tounderstand protein folding, where as Atilgan et al., [46]and Green and Higman [47] have represented proteinstructures as amino acid networks to analyze residue fluc-tuations and stability of the protein structures. Del Soland O'meara have analyzed protein complexes as small-world networks where the central residues in the inter-faces correlate with experimental hot spots [37,38]. Wehave previously used a similar network representation tounderstand the factors affecting protein stability wherethe amino acid residues are the nodes in the protein struc-ture network and the strength of the non-covalent interac-tions between them are evaluated for the edge-determining criterion [48]. In the present work, this
approach has been extended to protein quaternary struc-tures rather than just protein tertiary structures so as tounderstand the factors responsible for protein association.We have extracted the interface cluster (a set of connectedresidues) and hub (a highly connected residue) informa-tion from the network representation of protein multim-ers as explained in the methods section. This has giveninsights into the role of specific amino acid residues in sta-bilizing inter-subunit interfaces. The hubs in many real-world networks are known to provide robustness to thenetworks against random attack[42]. However, targetedattacks on these hubs are known to destabilize them. Inthe multimeric protein structure networks, the interfacehubs can be considered as the centers providing stabilityto these networks due to their extensive interactions andtheir presence at the oligomeric interface. Hence, themutation of a hub can lead to the destabilization of theinterface. Therefore, the hubs can be identified as hotspots at protein interfaces that can be targeted for interfacede-stabilizing mutations.
A non-redundant set of 455 protein oligomers is used inthis study. The oligomeric protein structures as a wholeare represented as graphs, with each amino acid as a nodeand the strength of non-covalent interactions (I, evaluatedas given in the methods section) between them determin-ing the edges. Those amino acid pairs with interactionstrength greater than a user-defined cutoff (Imin) are con-nected by edges. Such graphs generated at various Imin val-ues, have been analyzed in this section to understand thedetails of protein-protein interfaces at the network level.Specifically, (1) the analysis of the interface clusters(defined as distinct clusters of amino acid residues withcontributions from more than one chain of the proteinoligomer) and interface hubs (defined as amino acid resi-dues interacting with five or more residues with at leastone residue belonging to a different chain than itself)have been presented. (2) The strength of interface interac-tion, as measured from the clusters and hubs identified atdifferent Imin values has been compared with the experi-mentally determined dissociation constants for knowncomplexes. Finally, (3) the relevance of interface hubs tothe stability of the oligomer is pointed out comparingsome of the identified interface hubs with experimentalresults.
Analysis of interface clustersCorrelation of interface clusters with loss of accessible surface area and composition of interface clustersInterface clusters have been identified and analyzed forthe loss of accessible surface area, the interface clustercomposition and strength of the interface clusters basedon Imin and number of residues participating in interfacecluster composition. The results of these investigationshave been summarized in the two figures in the additional
Page 3 of 15(page number not for citation purposes)
BMC Bioinformatics 2005, 6:296 http://www.biomedcentral.com/1471-2105/6/296
material (Additional file 1, Figures A1 and A2). The com-parison of the residues that formed interface clusters atImin = 6% with those that have lost accessible surface areaon oligomerization (δASA) showed a very good correla-tion (correlation coefficient = 0.83, Figure A1) indicatingthat the clusters identified at Imin = 6% are a good repre-sentation of the oligomeric interfaces. Hence, all genericcluster analyses are carried out at this Imin. This correlationdecreases with increase or decrease of Imin since higherImins give specific strong clusters that fail to represent thecomplete interface and at lower Imin, the monomeric pro-tein core also becomes a part of the interface cluster. Theinterface cluster composition at Imin = 6% also correlatedvery well with the residue composition obtained fromδASA calculations (Figure A2) with preference for residueslike Arginine, Histidine, Tryptophan, Tyrosine and PhenylAlanine, though other residues are not left out. Such pref-erences have also been observed in several earlier interfaceanalyses [7,15,33,36]. The present investigation in addi-tion has provided information regarding the size andstrength of oligomeric protein interfaces, through theparameters such as the number of interface clusters, thenumber of residues constituting the interface clusters andthe size of the largest interface cluster. This is discussed indetail in a later section where experimental dissociationconstants are compared with the amino acid cluster andhub results from our analysis.
Largest cluster analysisThe size of the largest cluster is one of the parameters thatare generally used to analyze the behavior and properties
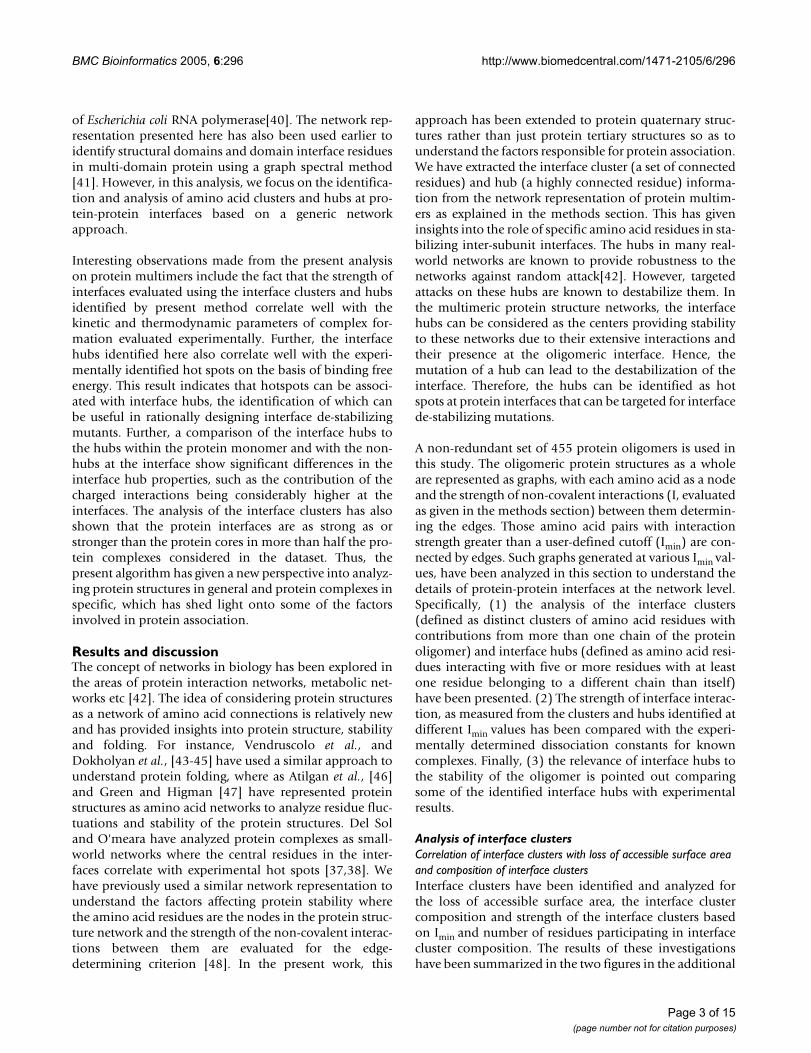
of complex networks [42]. Here we have identified thelargest cluster and its size (in terms of number of residues)in the protein complexes considered in the present datasetat varying Imin values. A plot of normalized size of the larg-est cluster (normalized with respect to the total number ofresidues in the complex) Vs Imin is shown in Figure 1.Interestingly, all the protein multimers show a very simi-lar profile of the largest cluster plot (Figure 1) with a tran-sition around Imin = 4%. (Incidentally, such a profile wasalso observed in the case of monomers, with transitionaround the same Imin value [48]). The largest cluster in thecomplex at a given Imin however, may or may not includethe interface region. Undoubtedly, at Imin = 0% the largestcluster includes the interface in all the cases, since thewhole protein exists as one big cluster at this Imin. As theImin is increased, the cluster size decreases and the largestcluster may be within the monomer or at the interface.This feature depends on the specific nature of the mul-timer complex and can be used to evaluate the strength ofthe interface with respect to the core of monomers. Sincethe clusters obtained at Imin = 6% are significantly strong,this Imin can be used to identify the strength of the inter-face using the following criterion. If the largest cluster atthis Imin is found at the interface, then it is a strong inter-face, where the interface is stronger than its monomericcore. Our analysis has shown that 291 protein multimersin a dataset of 455 proteins have such strong interfaces.The PDB list of these 291 proteins is given in the Addi-tional file 1, Table A1a. The rest of the dataset that do notform such strong interfaces is given in the Additional file1, Table A1b.
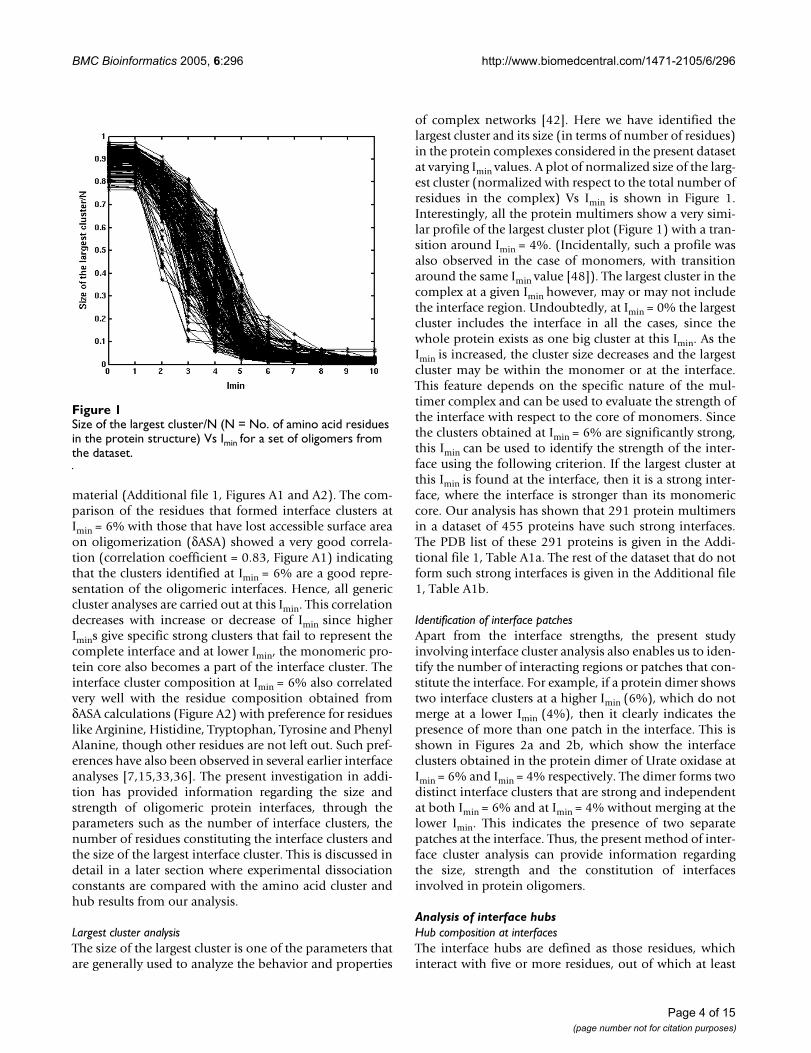
Identification of interface patchesApart from the interface strengths, the present studyinvolving interface cluster analysis also enables us to iden-tify the number of interacting regions or patches that con-stitute the interface. For example, if a protein dimer showstwo interface clusters at a higher Imin (6%), which do notmerge at a lower Imin (4%), then it clearly indicates thepresence of more than one patch in the interface. This isshown in Figures 2a and 2b, which show the interfaceclusters obtained in the protein dimer of Urate oxidase atImin = 6% and Imin = 4% respectively. The dimer forms twodistinct interface clusters that are strong and independentat both Imin = 6% and at Imin = 4% without merging at thelower Imin. This indicates the presence of two separatepatches at the interface. Thus, the present method of inter-face cluster analysis can provide information regardingthe size, strength and the constitution of interfacesinvolved in protein oligomers.
Analysis of interface hubsHub composition at interfacesThe interface hubs are defined as those residues, whichinteract with five or more residues, out of which at least
Size of the largest cluster/N (N = No. of amino acid residues in the protein structure) Vs Imin for a set of oligomers from the datasetFigure 1Size of the largest cluster/N (N = No. of amino acid residues in the protein structure) Vs Imin for a set of oligomers from the dataset.
Page 4 of 15(page number not for citation purposes)
BMC Bioinformatics 2005, 6:296 http://www.biomedcentral.com/1471-2105/6/296
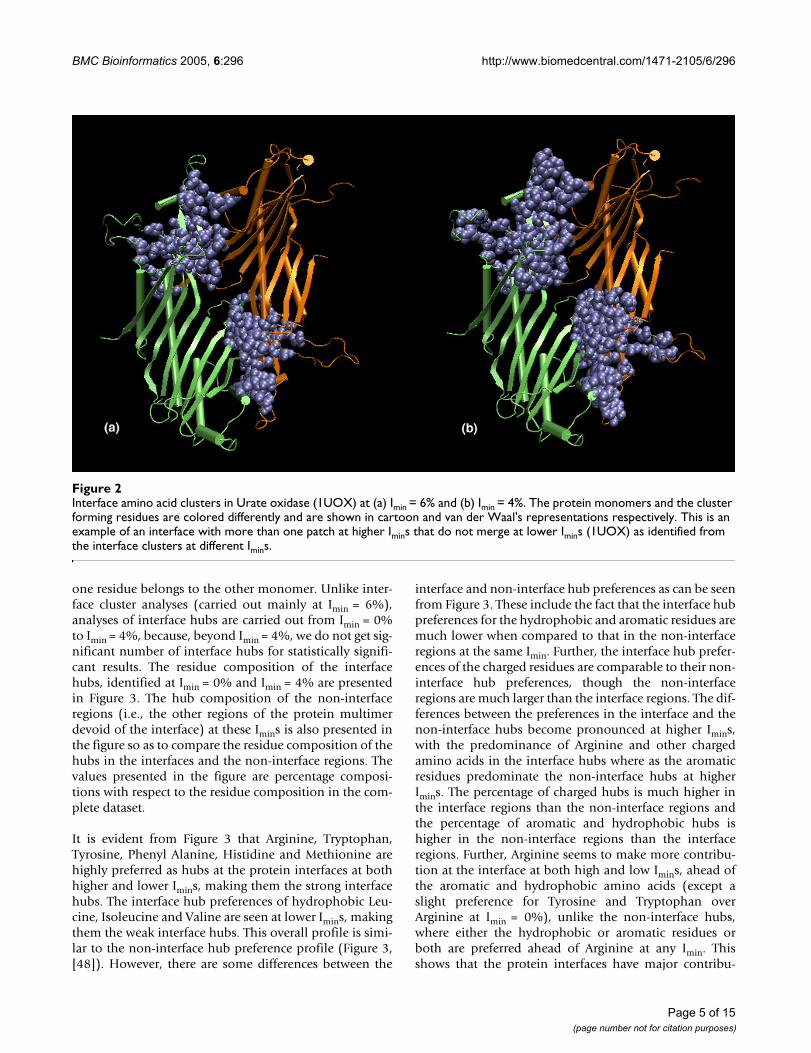
one residue belongs to the other monomer. Unlike inter-face cluster analyses (carried out mainly at Imin = 6%),analyses of interface hubs are carried out from Imin = 0%to Imin = 4%, because, beyond Imin = 4%, we do not get sig-nificant number of interface hubs for statistically signifi-cant results. The residue composition of the interfacehubs, identified at Imin = 0% and Imin = 4% are presentedin Figure 3. The hub composition of the non-interfaceregions (i.e., the other regions of the protein multimerdevoid of the interface) at these Imins is also presented inthe figure so as to compare the residue composition of thehubs in the interfaces and the non-interface regions. Thevalues presented in the figure are percentage composi-tions with respect to the residue composition in the com-plete dataset.
It is evident from Figure 3 that Arginine, Tryptophan,Tyrosine, Phenyl Alanine, Histidine and Methionine arehighly preferred as hubs at the protein interfaces at bothhigher and lower Imins, making them the strong interfacehubs. The interface hub preferences of hydrophobic Leu-cine, Isoleucine and Valine are seen at lower Imins, makingthem the weak interface hubs. This overall profile is simi-lar to the non-interface hub preference profile (Figure 3,[48]). However, there are some differences between the
interface and non-interface hub preferences as can be seenfrom Figure 3. These include the fact that the interface hubpreferences for the hydrophobic and aromatic residues aremuch lower when compared to that in the non-interfaceregions at the same Imin. Further, the interface hub prefer-ences of the charged residues are comparable to their non-interface hub preferences, though the non-interfaceregions are much larger than the interface regions. The dif-ferences between the preferences in the interface and thenon-interface hubs become pronounced at higher Imins,with the predominance of Arginine and other chargedamino acids in the interface hubs where as the aromaticresidues predominate the non-interface hubs at higherImins. The percentage of charged hubs is much higher inthe interface regions than the non-interface regions andthe percentage of aromatic and hydrophobic hubs ishigher in the non-interface regions than the interfaceregions. Further, Arginine seems to make more contribu-tion at the interface at both high and low Imins, ahead ofthe aromatic and hydrophobic amino acids (except aslight preference for Tyrosine and Tryptophan overArginine at Imin = 0%), unlike the non-interface hubs,where either the hydrophobic or aromatic residues orboth are preferred ahead of Arginine at any Imin. Thisshows that the protein interfaces have major contribu-
Interface amino acid clusters in Urate oxidase (1UOX) at (a) Imin = 6% and (b) Imin = 4%Figure 2Interface amino acid clusters in Urate oxidase (1UOX) at (a) Imin = 6% and (b) Imin = 4%. The protein monomers and the cluster forming residues are colored differently and are shown in cartoon and van der Waal's representations respectively. This is an example of an interface with more than one patch at higher Imins that do not merge at lower Imins (1UOX) as identified from the interface clusters at different Imins.
Page 5 of 15(page number not for citation purposes)
BMC Bioinformatics 2005, 6:296 http://www.biomedcentral.com/1471-2105/6/296
tions from the charged amino acid residues. The prefer-ence of Arginine and charged interactions at the proteininterfaces has also been shown by a few previous analyses[7,15,17,33,36]. The present analysis also confirms thisaspect with the charged interactions dominating the inter-faces to a large extent.
Another important observation that can be made by com-paring Figure A2 (see Additional file 1) and Figure 3 is thatalthough the residues like Leucine, Isoleucine, Valine andLysine are found significantly in the interface clusters evenat higher Imins, they are not preferred as interface hubs atthese Imins. Hence, there is marked difference in the resi-due preferences in interface clusters and the hub prefer-ences at the interfaces.
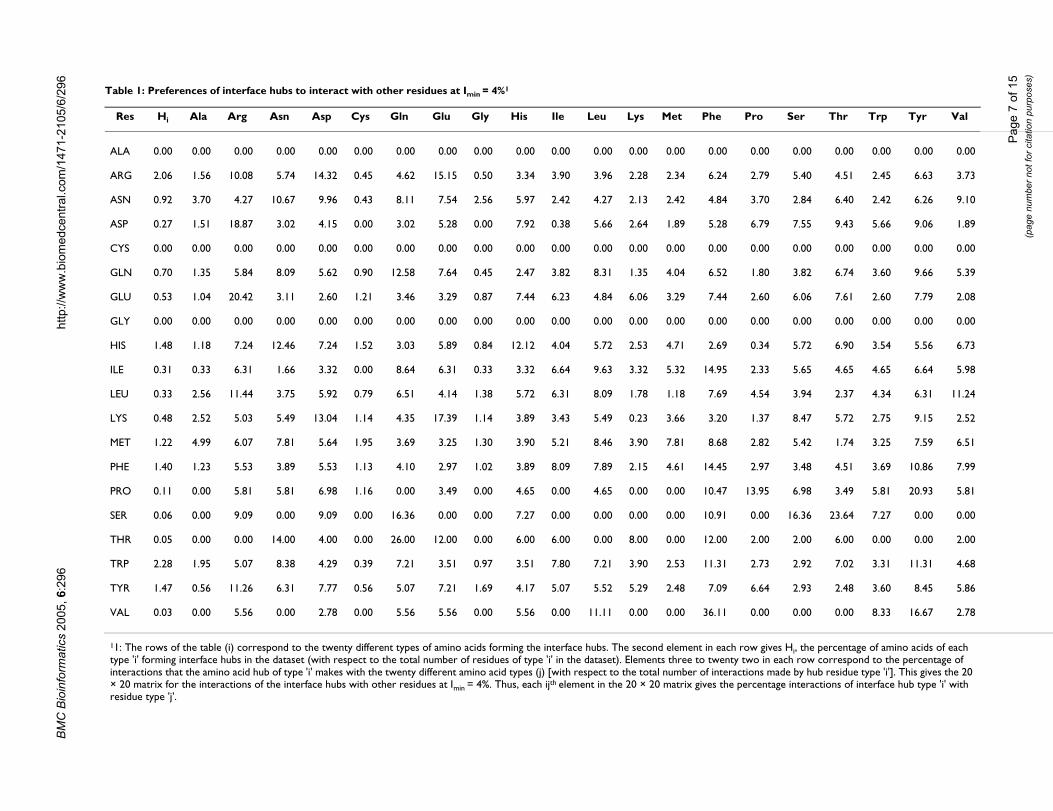
Preferences of hub-forming residues to interact with other residue typesWe have already seen the differences between the hubpreferences in the interfaces and the non-interface regionsfrom Figure 3. It would also be interesting to identify thepreferences in the amino acid interactions that can lead toformation of the strong hubs at protein interfaces.Although the interacting preferences at the protein inter-faces have been studied earlier [7], we present the samefrom the hub perspective here. The 20 × 20 matrix givingthe preference of each of the 20 amino acid hubs to inter-
act with themselves and with the other 19 residues at theinterface regions (normalized percentages) at Imin = 4%are presented in Table 1. The percentage of hubs of a par-ticular residue type is also given. The obvious interactionpreferences are between the positively charged Arginineand the negatively charged Aspartate and Glutamate, theinteractions of the aromatic residues with other aromaticand hydrophobic residues and the preferences of thehydrophobic residues for other hydrophobic and aro-matic residues. However, there seem to be some interest-ing preferences, apart from the normally seen salt-bridge,hydrogen bonds and aromatic stacking interactions. Thesignificant ones include the preference of Arginine hubs tointeract with itself in spite of its positive charge. Similarly,the preference of Histidine hubs to interact with Asparag-ine, Proline hubs with Phenyl alanine and Tyrosine, Leu-cine hubs with Arginine and Tyrosine hubs with Arginineand other charged residues are also noticed. There seemsto be a preference for charged and polar interactions andthose involving planar charge de-localized systems. A fewexamples are presented in detail in the next section.
It is to be noted that a similar 20 × 20 matrix for the non-interface hubs at Imin = 4%, shows a different profile (seeAdditional file 1, Table A2), where the Arg-Arg, His-Asn,Leu-Arg, Tyr-charged and Tyr-polar interaction prefer-ences are much lower than what is observed for the inter-
Amino acid preferences in the interface and the non-interface hubs at (a) Imin = 0% and (b) Imin = 4%Figure 3Amino acid preferences in the interface and the non-interface hubs at (a) Imin = 0% and (b) Imin = 4%. The percentage composi-tions of amino acid hubs in the interfaces and non-interfaces are presented (i.e., (No. of interface or non-interface amino acid hubs of type 'i' ÷ Total No. of amino acid residues of type 'i' present in the dataset) × 100).
Page 6 of 15(page number not for citation purposes)
BM
C B
ioin
form
atic
s 20
05, 6
:296
http
://w
ww
.bio
med
cent
ral.c
om/1
471-
2105
/6/2
96
Page
7 o
f 15
(pag
e nu
mbe
r not
for c
itatio
n pu
rpos
es)
Table 1: Preferences of interface hubs to interact with other residues at Imin = 4%1
Res Hi Ala Arg Asn Asp Cys Gln Glu Gly His Ile Leu Lys Met Phe Pro Ser Thr Trp Tyr Val
ALA 0.00 0.00 0.00 0.00 0.00 0.00 0.00 0.00 0.00 0.00 0.00 0.00 0.00 0.00 0.00 0.00 0.00 0.00 0.00 0.00 0.00
ARG 2.06 1.56 10.08 5.74 14.32 0.45 4.62 15.15 0.50 3.34 3.90 3.96 2.28 2.34 6.24 2.79 5.40 4.51 2.45 6.63 3.73
ASN 0.92 3.70 4.27 10.67 9.96 0.43 8.11 7.54 2.56 5.97 2.42 4.27 2.13 2.42 4.84 3.70 2.84 6.40 2.42 6.26 9.10
ASP 0.27 1.51 18.87 3.02 4.15 0.00 3.02 5.28 0.00 7.92 0.38 5.66 2.64 1.89 5.28 6.79 7.55 9.43 5.66 9.06 1.89
CYS 0.00 0.00 0.00 0.00 0.00 0.00 0.00 0.00 0.00 0.00 0.00 0.00 0.00 0.00 0.00 0.00 0.00 0.00 0.00 0.00 0.00
GLN 0.70 1.35 5.84 8.09 5.62 0.90 12.58 7.64 0.45 2.47 3.82 8.31 1.35 4.04 6.52 1.80 3.82 6.74 3.60 9.66 5.39
GLU 0.53 1.04 20.42 3.11 2.60 1.21 3.46 3.29 0.87 7.44 6.23 4.84 6.06 3.29 7.44 2.60 6.06 7.61 2.60 7.79 2.08
GLY 0.00 0.00 0.00 0.00 0.00 0.00 0.00 0.00 0.00 0.00 0.00 0.00 0.00 0.00 0.00 0.00 0.00 0.00 0.00 0.00 0.00
HIS 1.48 1.18 7.24 12.46 7.24 1.52 3.03 5.89 0.84 12.12 4.04 5.72 2.53 4.71 2.69 0.34 5.72 6.90 3.54 5.56 6.73
ILE 0.31 0.33 6.31 1.66 3.32 0.00 8.64 6.31 0.33 3.32 6.64 9.63 3.32 5.32 14.95 2.33 5.65 4.65 4.65 6.64 5.98
LEU 0.33 2.56 11.44 3.75 5.92 0.79 6.51 4.14 1.38 5.72 6.31 8.09 1.78 1.18 7.69 4.54 3.94 2.37 4.34 6.31 11.24
LYS 0.48 2.52 5.03 5.49 13.04 1.14 4.35 17.39 1.14 3.89 3.43 5.49 0.23 3.66 3.20 1.37 8.47 5.72 2.75 9.15 2.52
MET 1.22 4.99 6.07 7.81 5.64 1.95 3.69 3.25 1.30 3.90 5.21 8.46 3.90 7.81 8.68 2.82 5.42 1.74 3.25 7.59 6.51
PHE 1.40 1.23 5.53 3.89 5.53 1.13 4.10 2.97 1.02 3.89 8.09 7.89 2.15 4.61 14.45 2.97 3.48 4.51 3.69 10.86 7.99
PRO 0.11 0.00 5.81 5.81 6.98 1.16 0.00 3.49 0.00 4.65 0.00 4.65 0.00 0.00 10.47 13.95 6.98 3.49 5.81 20.93 5.81
SER 0.06 0.00 9.09 0.00 9.09 0.00 16.36 0.00 0.00 7.27 0.00 0.00 0.00 0.00 10.91 0.00 16.36 23.64 7.27 0.00 0.00
THR 0.05 0.00 0.00 14.00 4.00 0.00 26.00 12.00 0.00 6.00 6.00 0.00 8.00 0.00 12.00 2.00 2.00 6.00 0.00 0.00 2.00
TRP 2.28 1.95 5.07 8.38 4.29 0.39 7.21 3.51 0.97 3.51 7.80 7.21 3.90 2.53 11.31 2.73 2.92 7.02 3.31 11.31 4.68
TYR 1.47 0.56 11.26 6.31 7.77 0.56 5.07 7.21 1.69 4.17 5.07 5.52 5.29 2.48 7.09 6.64 2.93 2.48 3.60 8.45 5.86
VAL 0.03 0.00 5.56 0.00 2.78 0.00 5.56 5.56 0.00 5.56 0.00 11.11 0.00 0.00 36.11 0.00 0.00 0.00 8.33 16.67 2.78
11: The rows of the table (i) correspond to the twenty different types of amino acids forming the interface hubs. The second element in each row gives Hi, the percentage of amino acids of each type 'i' forming interface hubs in the dataset (with respect to the total number of residues of type 'i' in the dataset). Elements three to twenty two in each row correspond to the percentage of interactions that the amino acid hub of type 'i' makes with the twenty different amino acid types (j) [with respect to the total number of interactions made by hub residue type 'i']. This gives the 20 × 20 matrix for the interactions of the interface hubs with other residues at Imin = 4%. Thus, each ijth element in the 20 × 20 matrix gives the percentage interactions of interface hub type 'i' with residue type 'j'.
BMC Bioinformatics 2005, 6:296 http://www.biomedcentral.com/1471-2105/6/296
face hubs shown in Table 1. In the non-interface hubs, theTyr-Aromatic and Tyr-Hydrophobic interactions are morepreferred than Tyr-charged or Tyr-polar interactions. Sim-ilarly, Arg-Aromatic interactions are also more preferredthan Arg-Arg interactions and Leu-Leu and Leu-Phe aremore preferred than Leu-Arg in case of the non-interfacehubs.
Interactions of interface hubsWe have seen from Figure 2 and Table 1 that Arginine,Histidine and Tyrosine form some of the important hubsin the protein interfaces with some interesting interactingpartners. We will discuss the interactions of some of theseinterface hubs in this section.
(a) Arginine hubsArginine has been shown to play a major role at proteininterfaces [15,17,33,36]. In the present analysis, we findthat there is a preference for Arginine in the interface clus-ters and in the interface hubs in comparison to the other
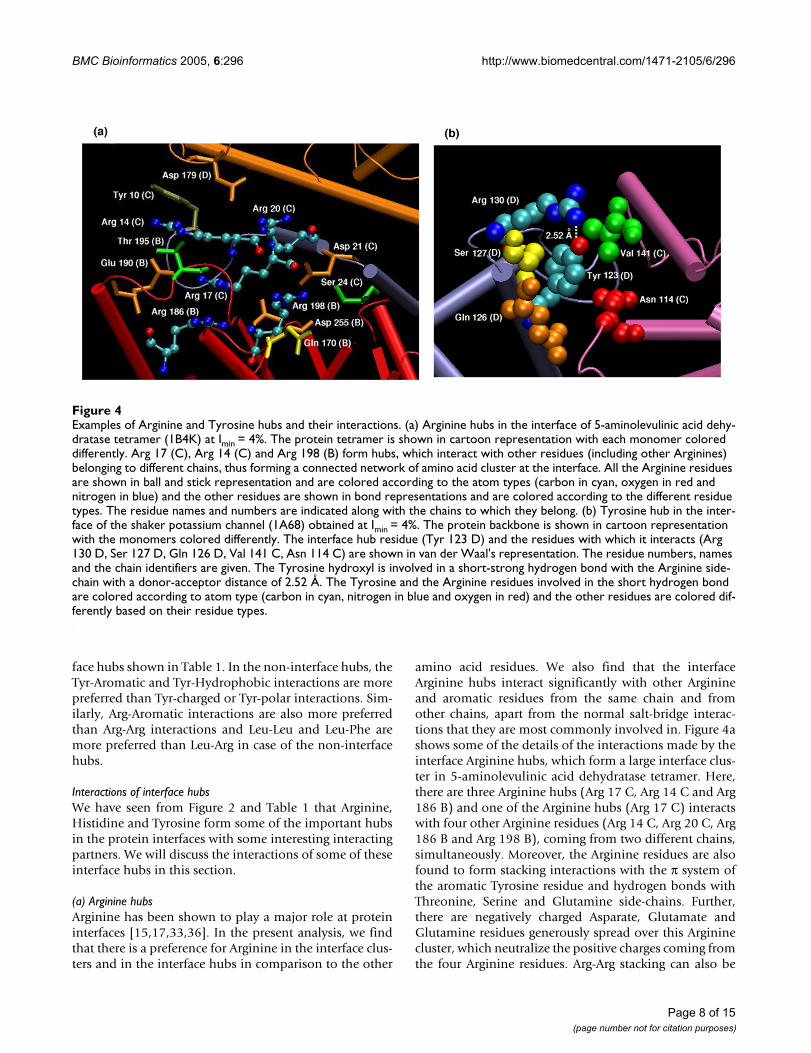
amino acid residues. We also find that the interfaceArginine hubs interact significantly with other Arginineand aromatic residues from the same chain and fromother chains, apart from the normal salt-bridge interac-tions that they are most commonly involved in. Figure 4ashows some of the details of the interactions made by theinterface Arginine hubs, which form a large interface clus-ter in 5-aminolevulinic acid dehydratase tetramer. Here,there are three Arginine hubs (Arg 17 C, Arg 14 C and Arg186 B) and one of the Arginine hubs (Arg 17 C) interactswith four other Arginine residues (Arg 14 C, Arg 20 C, Arg186 B and Arg 198 B), coming from two different chains,simultaneously. Moreover, the Arginine residues are alsofound to form stacking interactions with the π system ofthe aromatic Tyrosine residue and hydrogen bonds withThreonine, Serine and Glutamine side-chains. Further,there are negatively charged Asparate, Glutamate andGlutamine residues generously spread over this Argininecluster, which neutralize the positive charges coming fromthe four Arginine residues. Arg-Arg stacking can also be
Examples of Arginine and Tyrosine hubs and their interactions. (a) Arginine hubs in the interface of 5-aminolevulinic acid dehy-dratase tetramer (1B4K) at Imin = 4%Figure 4Examples of Arginine and Tyrosine hubs and their interactions. (a) Arginine hubs in the interface of 5-aminolevulinic acid dehy-dratase tetramer (1B4K) at Imin = 4%. The protein tetramer is shown in cartoon representation with each monomer colored differently. Arg 17 (C), Arg 14 (C) and Arg 198 (B) form hubs, which interact with other residues (including other Arginines) belonging to different chains, thus forming a connected network of amino acid cluster at the interface. All the Arginine residues are shown in ball and stick representation and are colored according to the atom types (carbon in cyan, oxygen in red and nitrogen in blue) and the other residues are shown in bond representations and are colored according to the different residue types. The residue names and numbers are indicated along with the chains to which they belong. (b) Tyrosine hub in the inter-face of the shaker potassium channel (1A68) obtained at Imin = 4%. The protein backbone is shown in cartoon representation with the monomers colored differently. The interface hub residue (Tyr 123 D) and the residues with which it interacts (Arg 130 D, Ser 127 D, Gln 126 D, Val 141 C, Asn 114 C) are shown in van der Waal's representation. The residue numbers, names and the chain identifiers are given. The Tyrosine hydroxyl is involved in a short-strong hydrogen bond with the Arginine side-chain with a donor-acceptor distance of 2.52 Å. The Tyrosine and the Arginine residues involved in the short hydrogen bond are colored according to atom type (carbon in cyan, nitrogen in blue and oxygen in red) and the other residues are colored dif-ferently based on their residue types.
Page 8 of 15(page number not for citation purposes)
BMC Bioinformatics 2005, 6:296 http://www.biomedcentral.com/1471-2105/6/296
seen along with hydrogen bonds involving the backboneoxygen of Arginine with backbone or side chain nitrogensof other Arginines. Investigations carried out on manyother interface Arginine hubs showed that the Arg-Arginteractions can occur through a variety of interactionsincluding planar stacking of the guanidine groups, hydro-gen bonding between the guanidine-guanidine groups orguanidine group with main chain atoms, CHO hydrogenbonding of backbone oxygen with the Cβ, Cγ and Cδ ofthe Arginine side chain. One of the notable factors is thatthe Arginine hubs are invariably neutralized by the pres-ence of negatively charged Glutamate and Aspartate sidechains in and around the hub (need not necessarily formdirect salt bridges), which have an overall neutralizingeffect on the local environment. Thus, the versatileArginine side-chain has been found to make extensiveinteractions stabilizing the oligomeric protein interfaces.
(b) Tyrosine hubsOne of the significant contributions to the interface hubscomes from the Tyrosine hubs, which makes extensiveinteractions with the charged and polar residues likeArginine, Aspartate, Asparagine, Glutamate andGlutamine apart from the expected interactions with theother aromatic residues and itself as can be seen fromTable 1. The interactions of Tyrosine with charged andpolar residues are generally due to hydrogen bonding orcation-π interactions. Figure 4b shows an example of aninterface Tyrosine hub (Tyr 275) making different kinds ofinteractions including a short hydrogen bond involvingthe hydroxyl group (with Arg 282, donor-acceptor dis-tance = 2.52 Å) at Imin = 4%. (Tyrosine is also known tocontribute to the stability of protein tertiary structure bymeans of short hydrogen bonds [49]). This Tyrosine resi-due also interacts with a Serine (279), Valine (141),Glutamine (278) and Asparagine (114) with Asparagineand Valine being from the other chain. Thus, we find thatthe Tyrosine residue is also versatile in its interactions dueto its planar de-localized side chain and the hydroxylgroup.
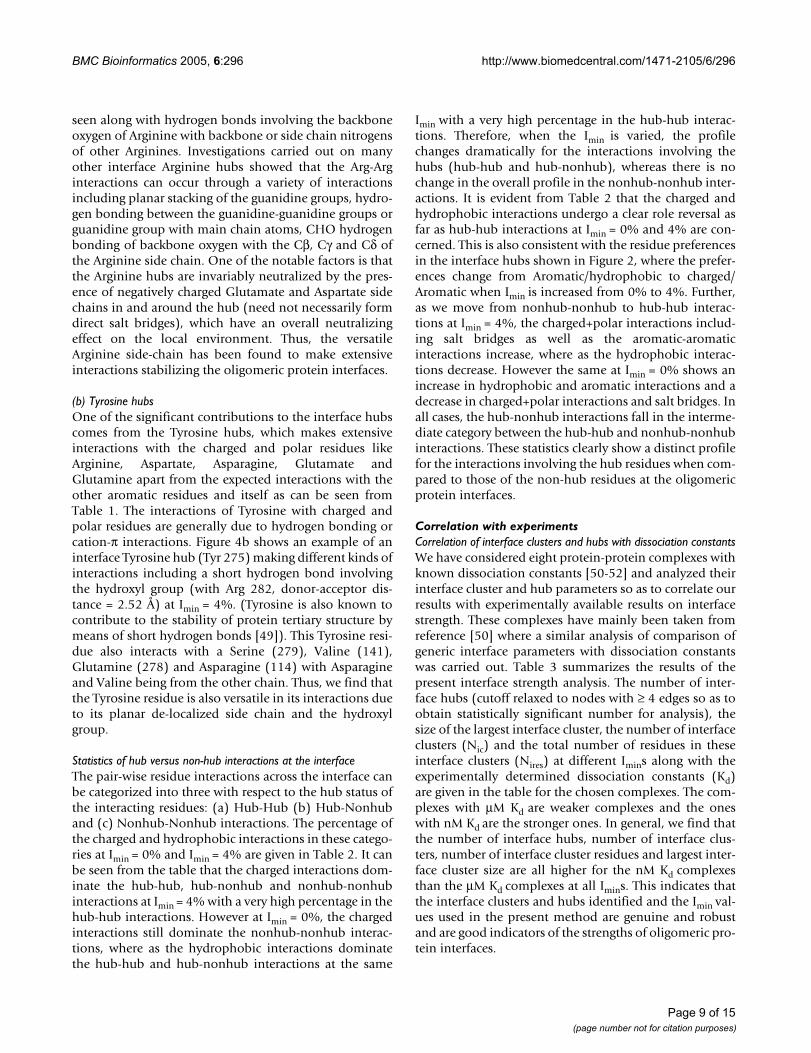
Statistics of hub versus non-hub interactions at the interfaceThe pair-wise residue interactions across the interface canbe categorized into three with respect to the hub status ofthe interacting residues: (a) Hub-Hub (b) Hub-Nonhuband (c) Nonhub-Nonhub interactions. The percentage ofthe charged and hydrophobic interactions in these catego-ries at Imin = 0% and Imin = 4% are given in Table 2. It canbe seen from the table that the charged interactions dom-inate the hub-hub, hub-nonhub and nonhub-nonhubinteractions at Imin = 4% with a very high percentage in thehub-hub interactions. However at Imin = 0%, the chargedinteractions still dominate the nonhub-nonhub interac-tions, where as the hydrophobic interactions dominatethe hub-hub and hub-nonhub interactions at the same
Imin with a very high percentage in the hub-hub interac-tions. Therefore, when the Imin is varied, the profilechanges dramatically for the interactions involving thehubs (hub-hub and hub-nonhub), whereas there is nochange in the overall profile in the nonhub-nonhub inter-actions. It is evident from Table 2 that the charged andhydrophobic interactions undergo a clear role reversal asfar as hub-hub interactions at Imin = 0% and 4% are con-cerned. This is also consistent with the residue preferencesin the interface hubs shown in Figure 2, where the prefer-ences change from Aromatic/hydrophobic to charged/Aromatic when Imin is increased from 0% to 4%. Further,as we move from nonhub-nonhub to hub-hub interac-tions at Imin = 4%, the charged+polar interactions includ-ing salt bridges as well as the aromatic-aromaticinteractions increase, where as the hydrophobic interac-tions decrease. However the same at Imin = 0% shows anincrease in hydrophobic and aromatic interactions and adecrease in charged+polar interactions and salt bridges. Inall cases, the hub-nonhub interactions fall in the interme-diate category between the hub-hub and nonhub-nonhubinteractions. These statistics clearly show a distinct profilefor the interactions involving the hub residues when com-pared to those of the non-hub residues at the oligomericprotein interfaces.
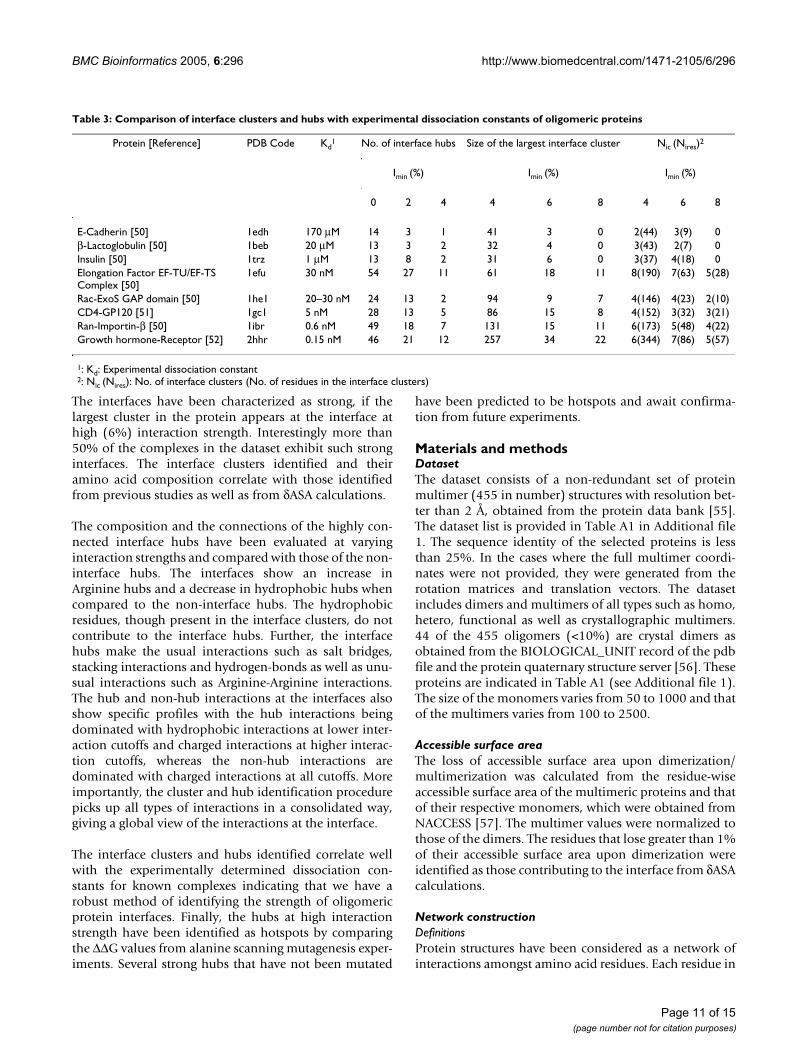
Correlation with experimentsCorrelation of interface clusters and hubs with dissociation constantsWe have considered eight protein-protein complexes withknown dissociation constants [50-52] and analyzed theirinterface cluster and hub parameters so as to correlate ourresults with experimentally available results on interfacestrength. These complexes have mainly been taken fromreference [50] where a similar analysis of comparison ofgeneric interface parameters with dissociation constantswas carried out. Table 3 summarizes the results of thepresent interface strength analysis. The number of inter-face hubs (cutoff relaxed to nodes with ≥ 4 edges so as toobtain statistically significant number for analysis), thesize of the largest interface cluster, the number of interfaceclusters (Nic) and the total number of residues in theseinterface clusters (Nires) at different Imins along with theexperimentally determined dissociation constants (Kd)are given in the table for the chosen complexes. The com-plexes with µM Kd are weaker complexes and the oneswith nM Kd are the stronger ones. In general, we find thatthe number of interface hubs, number of interface clus-ters, number of interface cluster residues and largest inter-face cluster size are all higher for the nM Kd complexesthan the µM Kd complexes at all Imins. This indicates thatthe interface clusters and hubs identified and the Imin val-ues used in the present method are genuine and robustand are good indicators of the strengths of oligomeric pro-tein interfaces.
Page 9 of 15(page number not for citation purposes)
BMC Bioinformatics 2005, 6:296 http://www.biomedcentral.com/1471-2105/6/296
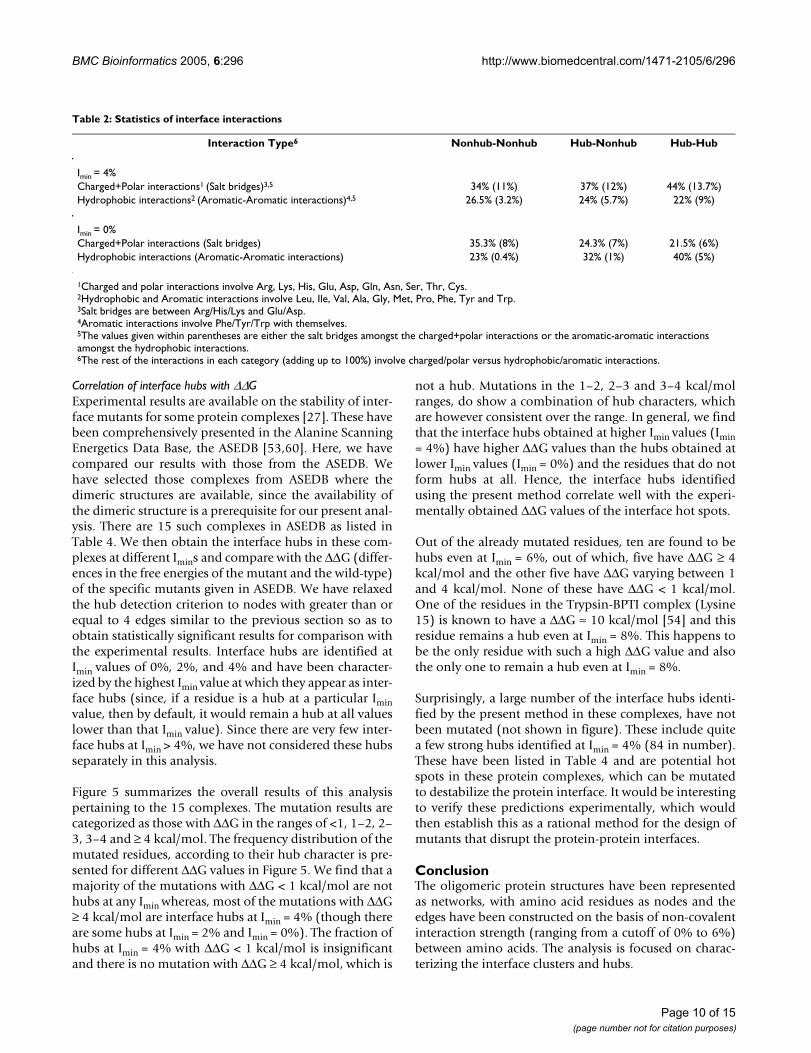
Correlation of interface hubs with ∆∆GExperimental results are available on the stability of inter-face mutants for some protein complexes [27]. These havebeen comprehensively presented in the Alanine ScanningEnergetics Data Base, the ASEDB [53,60]. Here, we havecompared our results with those from the ASEDB. Wehave selected those complexes from ASEDB where thedimeric structures are available, since the availability ofthe dimeric structure is a prerequisite for our present anal-ysis. There are 15 such complexes in ASEDB as listed inTable 4. We then obtain the interface hubs in these com-plexes at different Imins and compare with the ∆∆G (differ-ences in the free energies of the mutant and the wild-type)of the specific mutants given in ASEDB. We have relaxedthe hub detection criterion to nodes with greater than orequal to 4 edges similar to the previous section so as toobtain statistically significant results for comparison withthe experimental results. Interface hubs are identified atImin values of 0%, 2%, and 4% and have been character-ized by the highest Imin value at which they appear as inter-face hubs (since, if a residue is a hub at a particular Iminvalue, then by default, it would remain a hub at all valueslower than that Imin value). Since there are very few inter-face hubs at Imin > 4%, we have not considered these hubsseparately in this analysis.
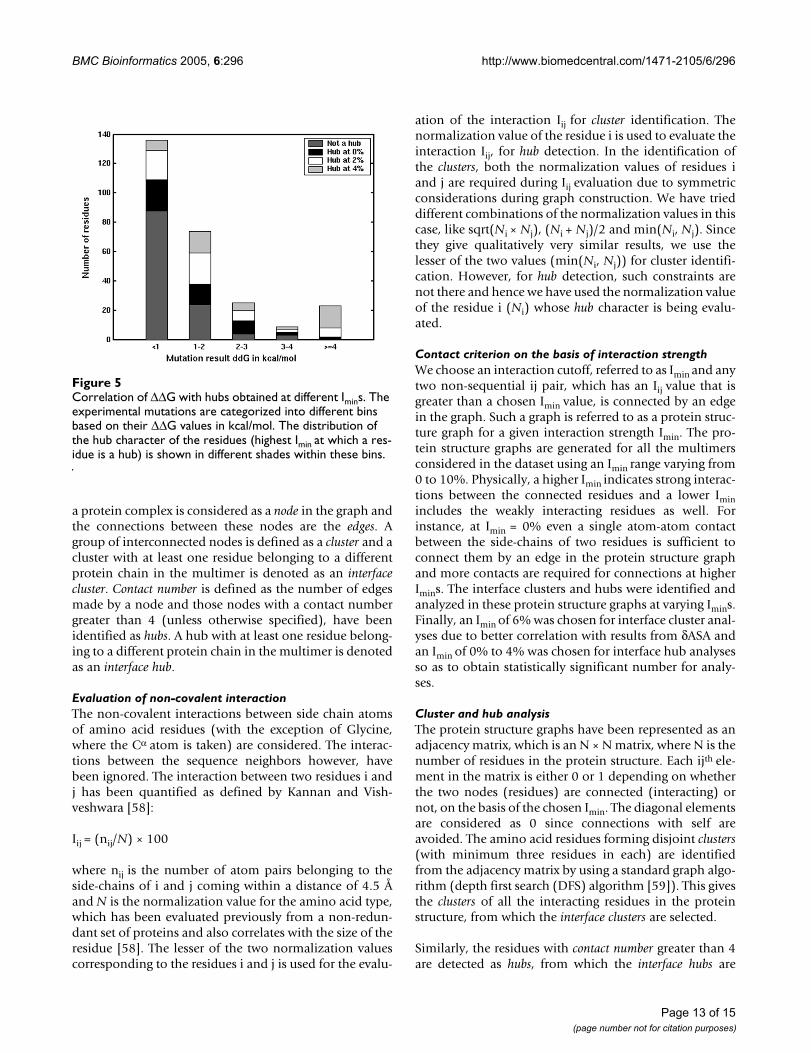
Figure 5 summarizes the overall results of this analysispertaining to the 15 complexes. The mutation results arecategorized as those with ∆∆G in the ranges of <1, 1–2, 2–3, 3–4 and ≥ 4 kcal/mol. The frequency distribution of themutated residues, according to their hub character is pre-sented for different ∆∆G values in Figure 5. We find that amajority of the mutations with ∆∆G < 1 kcal/mol are nothubs at any Imin whereas, most of the mutations with ∆∆G≥ 4 kcal/mol are interface hubs at Imin = 4% (though thereare some hubs at Imin = 2% and Imin = 0%). The fraction ofhubs at Imin = 4% with ∆∆G < 1 kcal/mol is insignificantand there is no mutation with ∆∆G ≥ 4 kcal/mol, which is
not a hub. Mutations in the 1–2, 2–3 and 3–4 kcal/molranges, do show a combination of hub characters, whichare however consistent over the range. In general, we findthat the interface hubs obtained at higher Imin values (Imin= 4%) have higher ∆∆G values than the hubs obtained atlower Imin values (Imin = 0%) and the residues that do notform hubs at all. Hence, the interface hubs identifiedusing the present method correlate well with the experi-mentally obtained ∆∆G values of the interface hot spots.
Out of the already mutated residues, ten are found to behubs even at Imin = 6%, out of which, five have ∆∆G ≥ 4kcal/mol and the other five have ∆∆G varying between 1and 4 kcal/mol. None of these have ∆∆G < 1 kcal/mol.One of the residues in the Trypsin-BPTI complex (Lysine15) is known to have a ∆∆G ≈ 10 kcal/mol [54] and thisresidue remains a hub even at Imin = 8%. This happens tobe the only residue with such a high ∆∆G value and alsothe only one to remain a hub even at Imin = 8%.
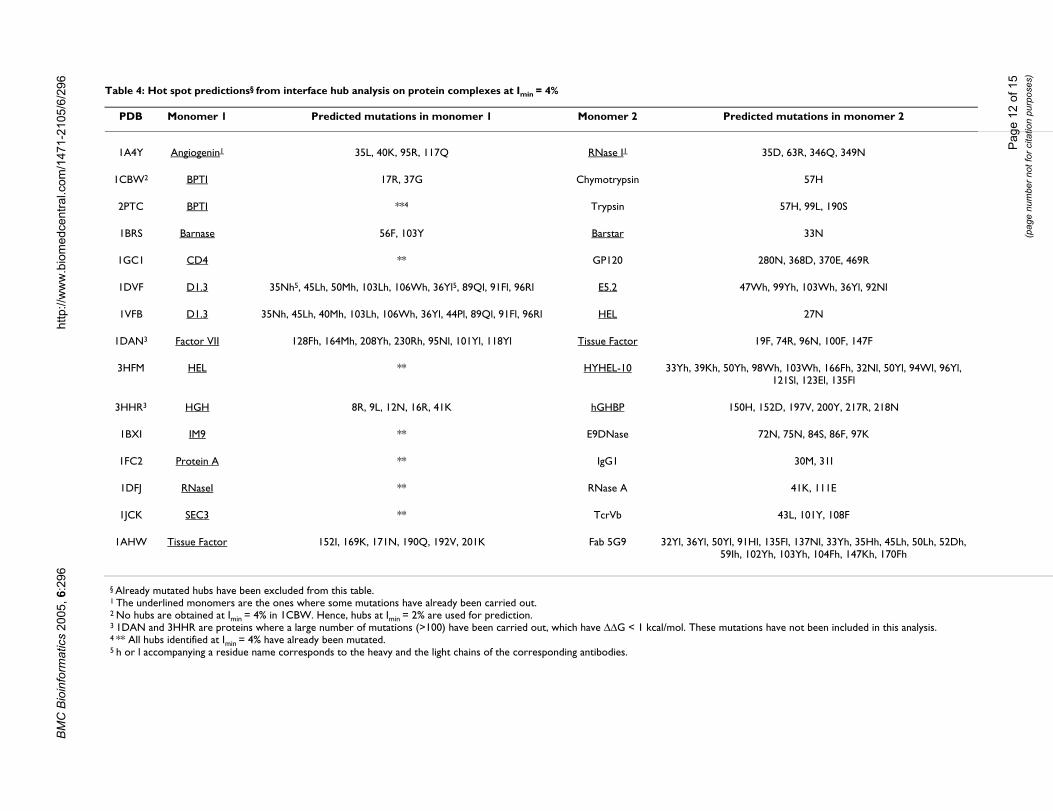
Surprisingly, a large number of the interface hubs identi-fied by the present method in these complexes, have notbeen mutated (not shown in figure). These include quitea few strong hubs identified at Imin = 4% (84 in number).These have been listed in Table 4 and are potential hotspots in these protein complexes, which can be mutatedto destabilize the protein interface. It would be interestingto verify these predictions experimentally, which wouldthen establish this as a rational method for the design ofmutants that disrupt the protein-protein interfaces.
ConclusionThe oligomeric protein structures have been representedas networks, with amino acid residues as nodes and theedges have been constructed on the basis of non-covalentinteraction strength (ranging from a cutoff of 0% to 6%)between amino acids. The analysis is focused on charac-terizing the interface clusters and hubs.
Table 2: Statistics of interface interactions
Interaction Type6 Nonhub-Nonhub Hub-Nonhub Hub-Hub
Imin = 4%Charged+Polar interactions1 (Salt bridges)3,5 34% (11%) 37% (12%) 44% (13.7%)Hydrophobic interactions2 (Aromatic-Aromatic interactions)4,5 26.5% (3.2%) 24% (5.7%) 22% (9%)
Imin = 0%Charged+Polar interactions (Salt bridges) 35.3% (8%) 24.3% (7%) 21.5% (6%)Hydrophobic interactions (Aromatic-Aromatic interactions) 23% (0.4%) 32% (1%) 40% (5%)
1Charged and polar interactions involve Arg, Lys, His, Glu, Asp, Gln, Asn, Ser, Thr, Cys.2Hydrophobic and Aromatic interactions involve Leu, Ile, Val, Ala, Gly, Met, Pro, Phe, Tyr and Trp.3Salt bridges are between Arg/His/Lys and Glu/Asp.4Aromatic interactions involve Phe/Tyr/Trp with themselves.5The values given within parentheses are either the salt bridges amongst the charged+polar interactions or the aromatic-aromatic interactions amongst the hydrophobic interactions.6The rest of the interactions in each category (adding up to 100%) involve charged/polar versus hydrophobic/aromatic interactions.
Page 10 of 15(page number not for citation purposes)
BMC Bioinformatics 2005, 6:296 http://www.biomedcentral.com/1471-2105/6/296
The interfaces have been characterized as strong, if thelargest cluster in the protein appears at the interface athigh (6%) interaction strength. Interestingly more than50% of the complexes in the dataset exhibit such stronginterfaces. The interface clusters identified and theiramino acid composition correlate with those identifiedfrom previous studies as well as from δASA calculations.
The composition and the connections of the highly con-nected interface hubs have been evaluated at varyinginteraction strengths and compared with those of the non-interface hubs. The interfaces show an increase inArginine hubs and a decrease in hydrophobic hubs whencompared to the non-interface hubs. The hydrophobicresidues, though present in the interface clusters, do notcontribute to the interface hubs. Further, the interfacehubs make the usual interactions such as salt bridges,stacking interactions and hydrogen-bonds as well as unu-sual interactions such as Arginine-Arginine interactions.The hub and non-hub interactions at the interfaces alsoshow specific profiles with the hub interactions beingdominated with hydrophobic interactions at lower inter-action cutoffs and charged interactions at higher interac-tion cutoffs, whereas the non-hub interactions aredominated with charged interactions at all cutoffs. Moreimportantly, the cluster and hub identification procedurepicks up all types of interactions in a consolidated way,giving a global view of the interactions at the interface.
The interface clusters and hubs identified correlate wellwith the experimentally determined dissociation con-stants for known complexes indicating that we have arobust method of identifying the strength of oligomericprotein interfaces. Finally, the hubs at high interactionstrength have been identified as hotspots by comparingthe ∆∆G values from alanine scanning mutagenesis exper-iments. Several strong hubs that have not been mutated
have been predicted to be hotspots and await confirma-tion from future experiments.
Materials and methodsDatasetThe dataset consists of a non-redundant set of proteinmultimer (455 in number) structures with resolution bet-ter than 2 Å, obtained from the protein data bank [55].The dataset list is provided in Table A1 in Additional file1. The sequence identity of the selected proteins is lessthan 25%. In the cases where the full multimer coordi-nates were not provided, they were generated from therotation matrices and translation vectors. The datasetincludes dimers and multimers of all types such as homo,hetero, functional as well as crystallographic multimers.44 of the 455 oligomers (<10%) are crystal dimers asobtained from the BIOLOGICAL_UNIT record of the pdbfile and the protein quaternary structure server [56]. Theseproteins are indicated in Table A1 (see Additional file 1).The size of the monomers varies from 50 to 1000 and thatof the multimers varies from 100 to 2500.
Accessible surface areaThe loss of accessible surface area upon dimerization/multimerization was calculated from the residue-wiseaccessible surface area of the multimeric proteins and thatof their respective monomers, which were obtained fromNACCESS [57]. The multimer values were normalized tothose of the dimers. The residues that lose greater than 1%of their accessible surface area upon dimerization wereidentified as those contributing to the interface from δASAcalculations.
Network constructionDefinitionsProtein structures have been considered as a network ofinteractions amongst amino acid residues. Each residue in
Table 3: Comparison of interface clusters and hubs with experimental dissociation constants of oligomeric proteins
Protein [Reference] PDB Code Kd1 No. of interface hubs Size of the largest interface cluster Nic (Nires)2
Imin (%) Imin (%) Imin (%)
0 2 4 4 6 8 4 6 8
E-Cadherin [50] 1edh 170 µM 14 3 1 41 3 0 2(44) 3(9) 0β-Lactoglobulin [50] 1beb 20 µM 13 3 2 32 4 0 3(43) 2(7) 0Insulin [50] 1trz 1 µM 13 8 2 31 6 0 3(37) 4(18) 0Elongation Factor EF-TU/EF-TS Complex [50]
1efu 30 nM 54 27 11 61 18 11 8(190) 7(63) 5(28)
Rac-ExoS GAP domain [50] 1he1 20–30 nM 24 13 2 94 9 7 4(146) 4(23) 2(10)CD4-GP120 [51] 1gc1 5 nM 28 13 5 86 15 8 4(152) 3(32) 3(21)Ran-Importin-β [50] 1ibr 0.6 nM 49 18 7 131 15 11 6(173) 5(48) 4(22)Growth hormone-Receptor [52] 2hhr 0.15 nM 46 21 12 257 34 22 6(344) 7(86) 5(57)
1: Kd: Experimental dissociation constant2: Nic (Nires): No. of interface clusters (No. of residues in the interface clusters)
Page 11 of 15(page number not for citation purposes)
BM
C B
ioin
form
atic
s 20
05, 6
:296
http
://w
ww
.bio
med
cent
ral.c
om/1
471-
2105
/6/2
96
Page
12
of 1
5(p
age
num
ber n
ot fo
r cita
tion
purp
oses
)
Table 4: Hot spot predictions§ from interface hub analysis on protein complexes at Imin = 4%
PDB Monomer 1 Predicted mutations in monomer 1 Monomer 2 Predicted mutations in monomer 2
1A4Y Angiogenin1 35L, 40K, 95R, 117Q RNase I1 35D, 63R, 346Q, 349N
1CBW2 BPTI 17R, 37G Chymotrypsin 57H
2PTC BPTI **4 Trypsin 57H, 99L, 190S
1BRS Barnase 56F, 103Y Barstar 33N
1GC1 CD4 ** GP120 280N, 368D, 370E, 469R
1DVF D1.3 35Nh5, 45Lh, 50Mh, 103Lh, 106Wh, 36Yl5, 89Ql, 91Fl, 96Rl E5.2 47Wh, 99Yh, 103Wh, 36Yl, 92Nl
1VFB D1.3 35Nh, 45Lh, 40Mh, 103Lh, 106Wh, 36Yl, 44Pl, 89Ql, 91Fl, 96Rl HEL 27N
1DAN3 Factor VII 128Fh, 164Mh, 208Yh, 230Rh, 95Nl, 101Yl, 118Yl Tissue Factor 19F, 74R, 96N, 100F, 147F
3HFM HEL ** HYHEL-10 33Yh, 39Kh, 50Yh, 98Wh, 103Wh, 166Fh, 32Nl, 50Yl, 94Wl, 96Yl, 121Sl, 123El, 135Fl
3HHR3 HGH 8R, 9L, 12N, 16R, 41K hGHBP 150H, 152D, 197V, 200Y, 217R, 218N
1BXI IM9 ** E9DNase 72N, 75N, 84S, 86F, 97K
1FC2 Protein A ** IgG1 30M, 31I
1DFJ RNaseI ** RNase A 41K, 111E
1JCK SEC3 ** TcrVb 43L, 101Y, 108F
1AHW Tissue Factor 152I, 169K, 171N, 190Q, 192V, 201K Fab 5G9 32Yl, 36Yl, 50Yl, 91Hl, 135Fl, 137Nl, 33Yh, 35Hh, 45Lh, 50Lh, 52Dh, 59Ih, 102Yh, 103Yh, 104Fh, 147Kh, 170Fh
§ Already mutated hubs have been excluded from this table.1 The underlined monomers are the ones where some mutations have already been carried out.2 No hubs are obtained at Imin = 4% in 1CBW. Hence, hubs at Imin = 2% are used for prediction.3 1DAN and 3HHR are proteins where a large number of mutations (>100) have been carried out, which have ∆∆G < 1 kcal/mol. These mutations have not been included in this analysis.4 ** All hubs identified at Imin = 4% have already been mutated.5 h or l accompanying a residue name corresponds to the heavy and the light chains of the corresponding antibodies.
BMC Bioinformatics 2005, 6:296 http://www.biomedcentral.com/1471-2105/6/296
a protein complex is considered as a node in the graph andthe connections between these nodes are the edges. Agroup of interconnected nodes is defined as a cluster and acluster with at least one residue belonging to a differentprotein chain in the multimer is denoted as an interfacecluster. Contact number is defined as the number of edgesmade by a node and those nodes with a contact numbergreater than 4 (unless otherwise specified), have beenidentified as hubs. A hub with at least one residue belong-ing to a different protein chain in the multimer is denotedas an interface hub.
Evaluation of non-covalent interactionThe non-covalent interactions between side chain atomsof amino acid residues (with the exception of Glycine,where the Cα atom is taken) are considered. The interac-tions between the sequence neighbors however, havebeen ignored. The interaction between two residues i andj has been quantified as defined by Kannan and Vish-veshwara [58]:
Iij = (nij/N) × 100
where nij is the number of atom pairs belonging to theside-chains of i and j coming within a distance of 4.5 Åand N is the normalization value for the amino acid type,which has been evaluated previously from a non-redun-dant set of proteins and also correlates with the size of theresidue [58]. The lesser of the two normalization valuescorresponding to the residues i and j is used for the evalu-
ation of the interaction Iij for cluster identification. Thenormalization value of the residue i is used to evaluate theinteraction Iij, for hub detection. In the identification ofthe clusters, both the normalization values of residues iand j are required during Iij evaluation due to symmetricconsiderations during graph construction. We have trieddifferent combinations of the normalization values in thiscase, like sqrt(Ni × Nj), (Ni + Nj)/2 and min(Ni, Nj). Sincethey give qualitatively very similar results, we use thelesser of the two values (min(Ni, Nj)) for cluster identifi-cation. However, for hub detection, such constraints arenot there and hence we have used the normalization valueof the residue i (Ni) whose hub character is being evalu-ated.
Contact criterion on the basis of interaction strengthWe choose an interaction cutoff, referred to as Imin and anytwo non-sequential ij pair, which has an Iij value that isgreater than a chosen Imin value, is connected by an edgein the graph. Such a graph is referred to as a protein struc-ture graph for a given interaction strength Imin. The pro-tein structure graphs are generated for all the multimersconsidered in the dataset using an Imin range varying from0 to 10%. Physically, a higher Imin indicates strong interac-tions between the connected residues and a lower Iminincludes the weakly interacting residues as well. Forinstance, at Imin = 0% even a single atom-atom contactbetween the side-chains of two residues is sufficient toconnect them by an edge in the protein structure graphand more contacts are required for connections at higherImins. The interface clusters and hubs were identified andanalyzed in these protein structure graphs at varying Imins.Finally, an Imin of 6% was chosen for interface cluster anal-yses due to better correlation with results from δASA andan Imin of 0% to 4% was chosen for interface hub analysesso as to obtain statistically significant number for analy-ses.
Cluster and hub analysisThe protein structure graphs have been represented as anadjacency matrix, which is an N × N matrix, where N is thenumber of residues in the protein structure. Each ijth ele-ment in the matrix is either 0 or 1 depending on whetherthe two nodes (residues) are connected (interacting) ornot, on the basis of the chosen Imin. The diagonal elementsare considered as 0 since connections with self areavoided. The amino acid residues forming disjoint clusters(with minimum three residues in each) are identifiedfrom the adjacency matrix by using a standard graph algo-rithm (depth first search (DFS) algorithm [59]). This givesthe clusters of all the interacting residues in the proteinstructure, from which the interface clusters are selected.
Similarly, the residues with contact number greater than 4are detected as hubs, from which the interface hubs are
Correlation of ∆∆G with hubs obtained at different IminsFigure 5Correlation of ∆∆G with hubs obtained at different Imins. The experimental mutations are categorized into different bins based on their ∆∆G values in kcal/mol. The distribution of the hub character of the residues (highest Imin at which a res-idue is a hub) is shown in different shades within these bins.
Page 13 of 15(page number not for citation purposes)
BMC Bioinformatics 2005, 6:296 http://www.biomedcentral.com/1471-2105/6/296
identified. The hub definition is relaxed to a contact numberequal to or greater than 4, while investigating the interfacehubs of single multimeric complexes in detail, as given inTables 3 and 4, in order to obtain statistically significantnumber for analysis. The interfacial hub preferences ofamino acid residues and the preferences of the residueswith which these hubs interact are obtained and comparedwith similar properties of the non-interface hubs and non-hubs at interfaces, identified from the same data set.
Size of the largest clusterWhen analyzing complex networks, one of the most com-mon parameters used is the size of the largest cluster [42].Here, we have used this parameter to analyze the structurenetworks of protein oligomers. At various Imins, the clus-ters in the protein oligomers are obtained using DFS andthe size of the largest cluster in terms of the number of res-idues constituting it is obtained at different Imins. This hasbeen found to be a function of protein size and hence thesize of the largest cluster is normalized with respect to theprotein size and is plotted as a function of Imin. The largestcluster size decreases as the Imin increases and the largestcluster obtained at a higher Imin may or may not be presentat the oligomeric interface. An analysis is made on all theproteins in the data set, to find out if the largest cluster isat the interface or not at Imin = 6%. This provides an idearegarding the strength of the oligomeric interface withrespect to its monomeric protein core.
Authors' contributionsKVB carried out the construction and analysis of oligo-meric protein structure networks. SV devised the conceptsand the formalism used in this study. Both authors con-tributed to the interpretation of results and the prepara-tion of the manuscript.
Additional material
AcknowledgementsWe acknowledge the Computational Genomics Initiative at the Indian Insti-tute of Science, funded by the Department of Biotechnology (DBT), India,
for support. KVB would like to thank the Council of Scientific and Industrial Research (CSIR), India for the award of a fellowship. We also acknowledge Rakesh Kumar Pandey for providing the DFS program and generating the oligomer dataset.
References1. Janin J, Wodak SJ: Structural basis for macromolecular recog-
nition. In Protein modules and protein-protein interactions. Advances inprotein chemistry Harcourt publishers Ltd; 2002.
2. Russel RB, Alber F, Aloy P, Davis FP, Korkin D, Pichaud M, Topf M,Sali A: A structural perspective on protein-protein interac-tions. Curr Opin Struct Biol 2004, 14:313-324.
3. Valencia A, Pazos F: Computational methods for prediction ofprotein interactions. Curr Opin Struct Biol 2002, 12:368-372.
4. Jones S, Thornton JM: Analysis and classification of protein-pro-tein interactions from a structural perspective. In Protein-Pro-tein Recognition Edited by: Kleanthous C. Oxford University Press,Oxford; 2000.
5. Janin J: Kinetics and thermodynamics of protein-protein inter-actions. In Protein-Protein Recognition Edited by: Kleanthous C.Oxford University Press, Oxford; 2000.
6. Smith GR, Sternberg MJ: Prediction of protein-protein interac-tions by docking methods. Curr Opin Struct Biol 2002, 12:28-35.
7. Glaser F, Steinberg DM, Vakser IA, Ben-Tal N: Residue frequenciesand pairing preferences at protein-protein interfaces. Pro-teins: Struct Funct Genet 2001, 43:89-102.
8. Lawrence MC, Colman PM: Shape complementarity at protein/protein interfaces. J Mol Biol 1993, 234:946-950.
9. Gabb HA, Jackson RM, Sternberg MJ: Modeling protein dockingusing shape complementarity, electrostatics and biochemi-cal information. J Mol Biol 1997, 272:106-120.
10. Jones S, Thornton JM: Analysis of protein-protein interactionsites using surface patches. J Mol Biol 1997, 272:121-132.
11. Jones S, Thornton JM: Principles of protein-protein interac-tions. Proc Natl Acad Sci USA 1996, 93:13-20.
12. Miller S, Lesk AM, Janin J, Chothia C: The accessible surface areaand stability of oligomeric proteins. Nature 1987, 328:834-836.
13. Lo Conte L, Chothia C, Janin J: The atomic structure of protein-protein recognition sites. J Mol Biol 1999, 285:2177-2198.
14. Chakrabarti P, Janin J: Dissecting protein-protein recognitionsites. Proteins: Struct Funct Genet 2002, 47(3):334-43.
15. Bahadur RP, Chakrabarti P, Rodier F, Janin J: Dissecting subunitinterfaces in homodimeric proteins. Proteins: Struct Funct Genet2003, 53(3):708-19.
16. Fernandez HA, Scheraga : Insufficiently dehydrated hydrogenbonds as determinants of protein interactions. Proc Natl AcadSci USA 2003, 100(1):113-118.
17. Xu D, Tsai CJ, Nussinov R: Hydrogen bonds and salt bridgesacross protein-protein interfaces. Protein Engg 1997,10:999-1012.
18. Young L, Jernigan RL, Covell DG: A role of surface hydrophobic-ity in protein-protein recognition. Protein Sci 1994, 3:717-729.
19. Tsai CJ, Lin SL, Wolfson HJ, Nussinov R: Study of protein-proteininterfaces: a statistical analysis of the hydrophobic effect. Pro-tein Sci 1997, 6:53-64.
20. Li Y, Huang Y, Swaminathan CP, Smith-Gill SJ, Mariuzza RA: Magni-tude of the hydrophobic effect at central versus peripheralsites in protein-protein interfaces. Structure 2005,13(2):297-307.
21. Shanahan HP, Thornton JM: Amino acid architecture and thedistribution of polar atoms on the surfaces of proteins. Biopol-ymers 2005, 78(6):318-28.
22. Valdar WSJ, Thornton JM: Protein-protein interfaces: analysis ofamino acid conservation in homodimers. Proteins: Struct FunctGenet 2001, 42:108-124.
23. Ma B, Elkayam T, Wolfson H, Nussinov R: Protein-protein inter-actions: structurally conserved residues distinguish betweenbinding sites and exposed protein surfaces. Proc Natl Acad SciUSA 2003, 100:5772-5777.
24. Landgraf R, Xenarios I, Eisenberg D: Three-dimensional clusteranalysis identifies interfaces and functional residue clustersin proteins. J Mol Biol 2001, 307:1487-1502.
25. Lichtarge O, Bourne HR, Cohen FE: An evolutionary tracemethod defines binding surfaces common to protein fami-lies. J Mol Biol 1996, 257:342-358.
Additional File 1Two tables (Table A1 and Table A2) are provided as additional material (see Additional file 1), giving the list of pdbs in the dataset and the 20 × 20 matrix for the residue preferences of the non-interface hubs to interact with the 20 different amino acid types at Imin = 4%, respectively. Two fig-ures (Figure A1 and Figure A2) are also provided as additional material in Additional file 1, giving the correlation of δASA with interface clusters and the amino acid composition in the interface clusters, respectively. All four additional materials (two tables and two figures) are provided as a single word document (Additional file 1).Click here for file[http://www.biomedcentral.com/content/supplementary/1471-2105-6-296-S1.pdf]
Page 14 of 15(page number not for citation purposes)
http://www.ncbi.nlm.nih.gov/entrez/query.fcgi?cmd=Retrieve&db=PubMed&dopt=Abstract&list_uids=8263940
http://www.ncbi.nlm.nih.gov/entrez/query.fcgi?cmd=Retrieve&db=PubMed&dopt=Abstract&list_uids=8263940
http://www.ncbi.nlm.nih.gov/entrez/query.fcgi?cmd=Retrieve&db=PubMed&dopt=Abstract&list_uids=9299341
http://www.ncbi.nlm.nih.gov/entrez/query.fcgi?cmd=Retrieve&db=PubMed&dopt=Abstract&list_uids=9299341
http://www.ncbi.nlm.nih.gov/entrez/query.fcgi?cmd=Retrieve&db=PubMed&dopt=Abstract&list_uids=9299341
http://www.ncbi.nlm.nih.gov/entrez/query.fcgi?cmd=Retrieve&db=PubMed&dopt=Abstract&list_uids=9299342
http://www.ncbi.nlm.nih.gov/entrez/query.fcgi?cmd=Retrieve&db=PubMed&dopt=Abstract&list_uids=9299342
http://www.ncbi.nlm.nih.gov/entrez/query.fcgi?cmd=Retrieve&db=PubMed&dopt=Abstract&list_uids=8552589
http://www.ncbi.nlm.nih.gov/entrez/query.fcgi?cmd=Retrieve&db=PubMed&dopt=Abstract&list_uids=8552589
http://www.ncbi.nlm.nih.gov/entrez/query.fcgi?cmd=Retrieve&db=PubMed&dopt=Abstract&list_uids=3627230
http://www.ncbi.nlm.nih.gov/entrez/query.fcgi?cmd=Retrieve&db=PubMed&dopt=Abstract&list_uids=3627230
http://www.ncbi.nlm.nih.gov/entrez/query.fcgi?cmd=Retrieve&db=PubMed&dopt=Abstract&list_uids=9925793
http://www.ncbi.nlm.nih.gov/entrez/query.fcgi?cmd=Retrieve&db=PubMed&dopt=Abstract&list_uids=9925793
http://www.ncbi.nlm.nih.gov/entrez/query.fcgi?cmd=Retrieve&db=PubMed&dopt=Abstract&list_uids=8061602
http://www.ncbi.nlm.nih.gov/entrez/query.fcgi?cmd=Retrieve&db=PubMed&dopt=Abstract&list_uids=8061602
http://www.ncbi.nlm.nih.gov/entrez/query.fcgi?cmd=Retrieve&db=PubMed&dopt=Abstract&list_uids=9007976
http://www.ncbi.nlm.nih.gov/entrez/query.fcgi?cmd=Retrieve&db=PubMed&dopt=Abstract&list_uids=9007976
http://www.ncbi.nlm.nih.gov/entrez/query.fcgi?cmd=Retrieve&db=PubMed&dopt=Abstract&list_uids=8609628
BMC Bioinformatics 2005, 6:296 http://www.biomedcentral.com/1471-2105/6/296
Publish with BioMed Central and every scientist can read your work free of charge
"BioMed Central will be the most significant development for disseminating the results of biomedical research in our lifetime."
Sir Paul Nurse, Cancer Research UK
Your research papers will be:
available free of charge to the entire biomedical community
peer reviewed and published immediately upon acceptance
cited in PubMed and archived on PubMed Central
yours — you keep the copyright
Submit your manuscript here:http://www.biomedcentral.com/info/publishing_adv.asp
BioMedcentral
26. Keskin O, Ma B, Nussinov R: Hot regions in protein-proteininteractions: the organization and contribution of structur-ally conserved hot spot residues. J Mol Biol 2005,345(5):1281-94.
27. Bogan AA, Thorn KS: Anatomy of hot spots in protein inter-faces. J Mol Biol 1998, 280(1):1-9.
28. Kortemme T, Baker D: A simple physical model for bindingenergy hot spots in protein-protein complexes. Proc Natl AcadSci USA 2002, 99:14116-14121.
29. Ying G, Wang R, Lai L: Structure based method for analyzingprotein-protein interfaces. J Mol Model 2004, 10(1):44-54.
30. Haliloglu T, Keskin O, Nussinov R: How similar are protein fold-ing and protein binding nuclei? Examination of vibrationalmotions of energy hot spots and conserved residues. BiophysJ 2005, 88(3):1552-9.
31. Ofran Y, Rost B: Analyzing six types of protein-protein inter-faces. J Mol Biol 2003, 325:377-387.
32. De S, Krishnadev O, Srinivasan N, Rekha N: Interaction prefer-ences across protein-protein interfaces of obligatory andnon-obligatory components are different. BMC Struct Biol 2005in press.
33. Bahadur RP, Chakrabarti P, Rodier F, Janin J: A dissection of spe-cific and non-specific protein-protein interfaces. J Mol Biol2004, 336:943-955.
34. Levy Y, Wolynes PG, Onuchic JN: Protein topology determinesbinding mechanism. Proc Natl Acad Sci USA 2004, 101(2):511-516.
35. Janin J, Henrick K, Moult J, Eyck LT, Sternberg MJ, Vajda S, Vakser I,Wodak SJ: CAPRI: a Critical Assessment of PRedicted Inter-actions. Proteins: Struct Funct Genet 2003, 52:2-9.
36. Brinda KV, Kannan N, Vishveshwara S: Analysis of homodimericprotein interfaces by graph-spectral methods. Protein Engg2002, 4:265-77.
37. Del Sol A, O'meara P: Small-world network approach to iden-tify key residues in protein-protein interaction. Proteins: StructFunct Bioinf 2005, 58(3):672-82.
38. Del Sol A, Fujihashi H, O'meara P: Topology of small-world net-works of protein-protein complex structures. Bioinformatics2005, 21(8):1311-5.
39. Brinda KV, Mitra N, Surolia A, Vishveshwara S: Determinants ofquaternary association in legume lectins. Protein Sci 2004,13:1735-1749.
40. Kannan N, Preethi C, Ghosh P, Vishveshwara S, Chatterji D: Stabi-lizing interactions in the dimer interface of α-subunit inEscherichia coli RNA polymerase: A graph spectral and pointmutation study. Protein Sci 2001, 10:46-54.
41. Ramesh K, Sistla Brinda KV, Saraswathi Vishveshwara: Identificationof Domains and Domain Interface Residues in MultidomainProteins from Graph Spectral Method. Proteins: Struct Funct Bio-info 2005, 59(3):616-626.
42. Barabasi AL: Linked: The new science of networks. Persues Pub-lishing, Cambridge, Massachusetts; 2002.
43. Vendruscolo M, Paci E, Dobson CM, Karplus M: Three key residuesform a critical contact network in a protein folding transitionstate. Nature 2001, 409:641-645.
44. Vendruscolo M, Dokholyan NV, Paci E, Karplus M: Small-worldview of the amino acids that play a key role in protein folding.Phys Rev E 2002, 65:061910.
45. Dokholyan NV, Li L, Ding F, Shakhnovich EI: Topological determi-nants of protein folding. Proc Natl Acad Sci USA 2002,99(13):8637-8641.
46. Atilgan AR, Akan P, Baysal C: Small-world communication ofresidues and significance for protein dynamics. Biophys J 2004,86:85-91.
47. Greene LH, Higman VA: Uncovering network systems withinprotein structures. J Mol Biol 2003, 334:781-791.
48. Brinda KV, Vishveshwara S: A network representation of pro-tein structures: implications to protein stability. Biophys J 2005in press.
49. Sathyapriya R, Vishveshwara S: Short hydrogen bonds in pro-teins. FEBS J 2005, 272:1819-1832.
50. Nooren IMA, Thornton JM: Structural characterization andfunctional significance of transient protein-protein interac-tions. J Mol Biol 2003, 325:991-1018.
51. Schnittman SM, Lane HC, Roth J, Burrows A, Folks TM, Kehrl JH,Koenig S, Berman P, Fauci AS: Characterization of GP120 bind-
ing to CD4 and an assay that measures ability of sera toinhibit this binding. J Immunol 1988, 141(12):4181-6.
52. Lascols O, Cherqui G, Capeau J, Caron M, Picard J: Alteration byconcanavalin A of the slow dissociable component in thehuman growth hormone-receptor interaction. Horm MetabRes 1986, 18(8):512-6.
53. Thorn KS, Bogan AA: ASEdb: A database of alanine mutationsand their effects on the free energy of binding in proteininteractions. Bioinformatics 2001, 17(3):284-285.
54. Castro MJ, Anderson S: Alanine point mutations in the reactiveregions of bovine pancreatic trypsin inhibitor: effects on thekinetics and thermodynamics of binding to beta-trypsin andalpha-chymotrypsin. Biochemistry 1996, 35(35):11435-46.
55. Berman HM, Westbrook J, Feng Z, Gilliland G, Bhat TN, Weissig H,Shindyalov IN, Bourne PE: The Protein Data Bank. Nucleic AcidsRes 2000, 28:235-242.
56. Henrick K, Thornton JM, PQS: A protein quaternary structurefile server. Trends in Biochem Sci 1998, 23(9):358-61.
57. Hubbard SJ: NACCESS: program for calculating accessibili-ties. Department of Biochemistry and Molecular Biology. Universitycollege of London; 1992.
58. Kannan N, Vishveshwara S: Identification of side-chain clustersin protein structures by a graph spectral method. J Mol Biol1999, 292(2):441-64.
59. West DB: Introduction to Graph theory. Prentice-Hall of IndiaPrivate Limited; 2000.
60. Alanine Scanning Energetics DataBase (AsEDB) [http://thornlab.cgr.harvard.edu/hotspot/index.php]
Page 15 of 15(page number not for citation purposes)
http://www.ncbi.nlm.nih.gov/entrez/query.fcgi?cmd=Retrieve&db=PubMed&dopt=Abstract&list_uids=9653027
http://www.ncbi.nlm.nih.gov/entrez/query.fcgi?cmd=Retrieve&db=PubMed&dopt=Abstract&list_uids=9653027
http://www.ncbi.nlm.nih.gov/entrez/query.fcgi?cmd=Retrieve&db=PubMed&dopt=Abstract&list_uids=3264307
http://www.ncbi.nlm.nih.gov/entrez/query.fcgi?cmd=Retrieve&db=PubMed&dopt=Abstract&list_uids=3264307
http://www.ncbi.nlm.nih.gov/entrez/query.fcgi?cmd=Retrieve&db=PubMed&dopt=Abstract&list_uids=3264307
http://www.ncbi.nlm.nih.gov/entrez/query.fcgi?cmd=Retrieve&db=PubMed&dopt=Abstract&list_uids=3758923
http://www.ncbi.nlm.nih.gov/entrez/query.fcgi?cmd=Retrieve&db=PubMed&dopt=Abstract&list_uids=3758923
http://www.ncbi.nlm.nih.gov/entrez/query.fcgi?cmd=Retrieve&db=PubMed&dopt=Abstract&list_uids=3758923
http://www.ncbi.nlm.nih.gov/entrez/query.fcgi?cmd=Retrieve&db=PubMed&dopt=Abstract&list_uids=8784199
http://www.ncbi.nlm.nih.gov/entrez/query.fcgi?cmd=Retrieve&db=PubMed&dopt=Abstract&list_uids=8784199
Related Documents