National Institute of Economic and Social Research Professor Jagjit S. Chadha Mercers’ School Memorial Professor of Commerce © Jagjit S. Chadha 2017-8 2017-8 Lecture Series: Blueprint for Brexit Britain: The Structure of Finance

Welcome message from author
This document is posted to help you gain knowledge. Please leave a comment to let me know what you think about it! Share it to your friends and learn new things together.
Transcript

National Institute of Economic and Social Research
Professor Jagjit S. ChadhaMercers’ School Memorial Professor of Commerce
© Jagjit S. Chadha 2017-8
2017-8 Lecture Series:
Blueprint for Brexit Britain:
The Structure of Finance

National Institute of Economic and Social Research
“We shall not cease from explorationAnd the end of all our exploringWill be to arrive where we startedAnd know the place for the first time.”
T. S. Eliot, Four Quartets, 1943
“I would rather see Finance less proud and Industry more content. The fact that this island with its enormous extraneous resources is unable to maintain its population is surely a cause for the deepest heart searching.”
Winston Churchill, 1925

National Institute of Economic and Social Research
Saving and Investment in a closed economy
SIInterest rate
Investment,SavingsYD
1+θ
RL
R D

National Institute of Economic and Social Research
𝑖𝐷
𝑖𝑤
S-I = CA deficit
The shortage of domestic savings is met by the arrival of foreign capital
SIInterest rate
Investment,Savings
Saving and Investment in a small open economy

National Institute of Economic and Social Research
-5.0
-4.0
-3.0
-2.0
-1.0
0.0
1.0
2.0
1980 1985 1990 1995 2000 2005 2010 2015
UK Current Account Balance as % of Nominal GDP
National Institute of Economic and Social Research
H0
T=0 S
T=1 S
T=2 C
T=3
T=4
T=5
T=6
T=7
T=8
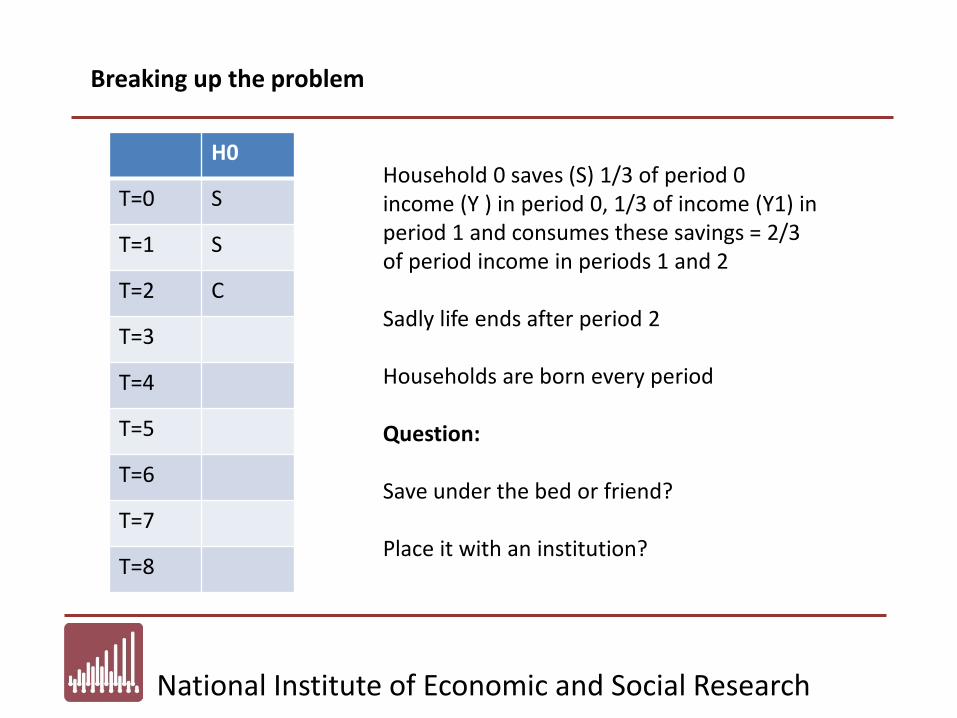
Breaking up the problem
Household 0 saves (S) 1/3 of period 0 income (Y ) in period 0, 1/3 of income (Y1) in period 1 and consumes these savings = 2/3 of period income in periods 1 and 2
Sadly life ends after period 2
Households are born every period
Question:
Save under the bed or friend?
Place it with an institution?

National Institute of Economic and Social Research
H0 H1 H2 H3 H4 H5 H6
T=0 S
T=1 S S
T=2 C S S
T=3 C S S
T=4 C S S
T=5 C S S
T=6 C S S
T=7 C S
T=8 C
The Sequence of Life
National Institute of Economic and Social Research
H0 H1 H2 H3 B1 B2 B3
T=0 S
T=1 S S D=2S
T=2 C S S D=2S
T=3 C S S D=2S
T=4 C S
T=5 C
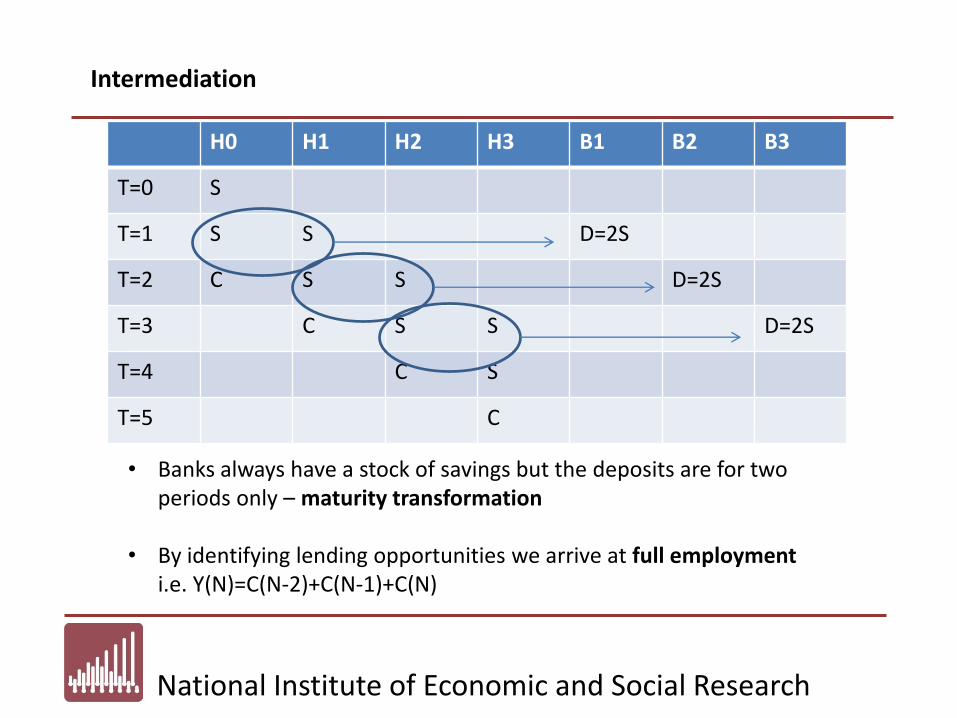
Intermediation
• Banks always have a stock of savings but the deposits are for two periods only – maturity transformation
• By identifying lending opportunities we arrive at full employment i.e. Y(N)=C(N-2)+C(N-1)+C(N)
National Institute of Economic and Social Research
Borrowing
Rate
Quantity of
Loans
R R*
I
Demand
Constrained Lending
MAX

National Institute of Economic and Social Research
Bank and Central Bank Insurance

National Institute of Economic and Social Research
Story so far
The External Position• The UK has a persistent, chronic current account deficit that implies
borrowing from abroad• Might imply borrowing from a richer future• Or a response to relaxed financial frictions over the forty year period of
financial liberalisation• The NIIP is -4.39% of GDP as of 2016
The Bank Problem• To match savers and borrowers • Asymmetric information • Network effects or externalities• Liquidity to offset Bank Runs• And capital choices to absorb losses and provide returns to
shareholders• Central Bank stands behind the system by issuing government liabilities

National Institute of Economic and Social Research
Commercial Bank Balance Sheet
Assets (A) Liabilities (L)
Reserves or Liquid Assets = R = (1-λ)A
Loans = λA
Deposits = (1-μ) L
Capital = μL

National Institute of Economic and Social Research
Bank Problem
RL = (1+θ) R D Loan rate is a spread over the deposit rate
A = L Assets equal liabilities
λ = fraction of illiquid assets
μ = fraction of capital/equity on bank balance sheet
π = RLLoans–RDDeposits-Ϝ Flow profits are interest received on loans - interest paid on deposits - fixed costs
π = (1+θ) R D λA–R D(1-μ)A – Ϝ
𝑑π𝑑A = 0 :
(1−μ)λ = 1+θ
Choice on liquidity and capital pins down the finance spread/premium

National Institute of Economic and Social Research
Bank Problem II
𝑑π𝑑A = 0 :
(1−μ)λ = 1+θ
Choice on liquidity and capital pins down the finance spread/premium
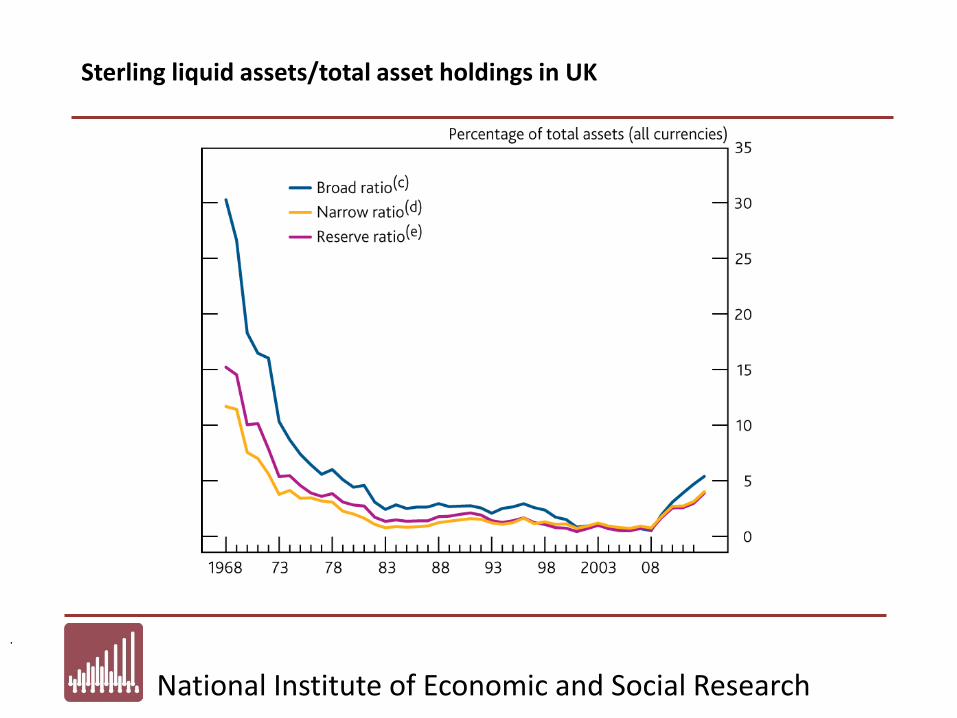
• If banks can have higher fractions of loans compared to liquid reserves, λ, then they can lower the loan rate spread
• If banks can reduce their capital (or equity) then there is less pressure to increase the spread to fund activity
• But πμL i.e. rate of return on capital will fall
Long run falls in capital and liquid assets might offset each other and lead to little change in mark-ups
National Institute of Economic and Social Research
Sterling liquid assets/total asset holdings in UK
.

National Institute of Economic and Social Research
Long-run capital levels for UK and US banks
National Institute of Economic and Social Research
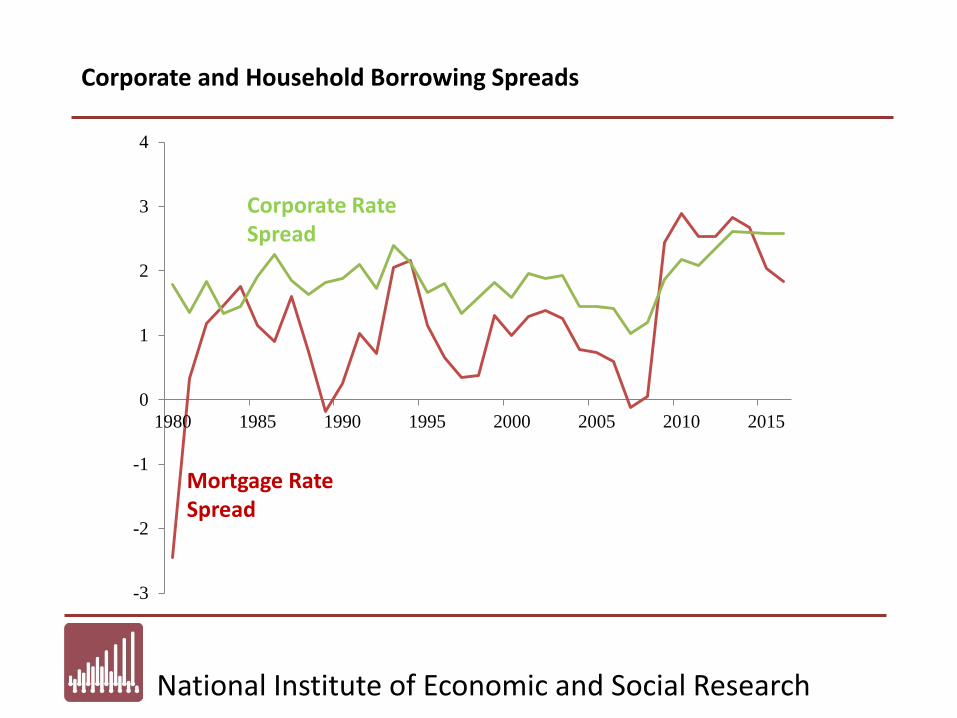
-3
-2
-1
0
1
2
3
4
1980 1985 1990 1995 2000 2005 2010 2015
Corporate Rate Spread
Corporate and Household Borrowing Spreads
Mortgage Rate Spread

National Institute of Economic and Social Research
0
50
100
150
200
250
300
350
400
1997 2002 2007 2012
House Price Index
Earnings Index
Houses per unit of
earnings (1997=100)
Affordability of Housing in the last 2 decades
National Institute of Economic and Social Research
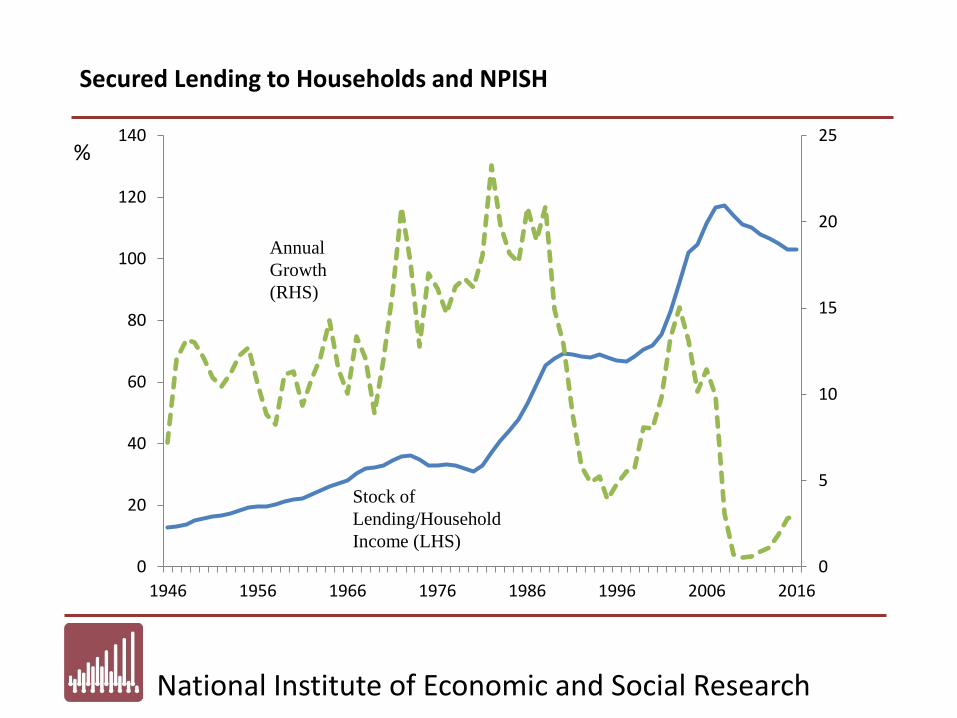
0
5
10
15
20
25
0
20
40
60
80
100
120
140
1946 1956 1966 1976 1986 1996 2006 2016
Annual
Growth
(RHS)
Stock of
Lending/Household
Income (LHS)
%
Secured Lending to Households and NPISH

National Institute of Economic and Social Research
-30
-20
-10
0
10
20
30
40
0 20 40 60 80 100 120 140
Relative
Productivity
Regional House Prices
Regional English House Price Rises versus Relative Productivity

National Institute of Economic and Social Research
Capital Employed Dwindling

National Institute of Economic and Social Research
Income Inequality and Regional Productivity

National Institute of Economic and Social Research
2008-2016
1997-2007
MFP contribution to GVA growth before and after the crisis
Source: ONS and NIESR
-6.00
-5.00
-4.00
-3.00
-2.00
-1.00
0.00
1.00
2.00
-4.00 -3.00 -2.00 -1.00 0.00 1.00 2.00 3.00 4.00
Financial & insurance activities

National Institute of Economic and Social Research
Measuring Financial Sector Output

National Institute of Economic and Social Research
1.0%
1.2%
1.4%
1.6%
1.8%
2.0%
2.2%
2.4%
2.6%
1981 1985 1989 1993 1997 2001 2005 2009 2013
Source: OECD, NIESR
R&D expenditure to GDP ratio in the UK and rest of G7 average, 1981-14
G7 Average ex UK
United Kingdom
National Institute of Economic and Social Research
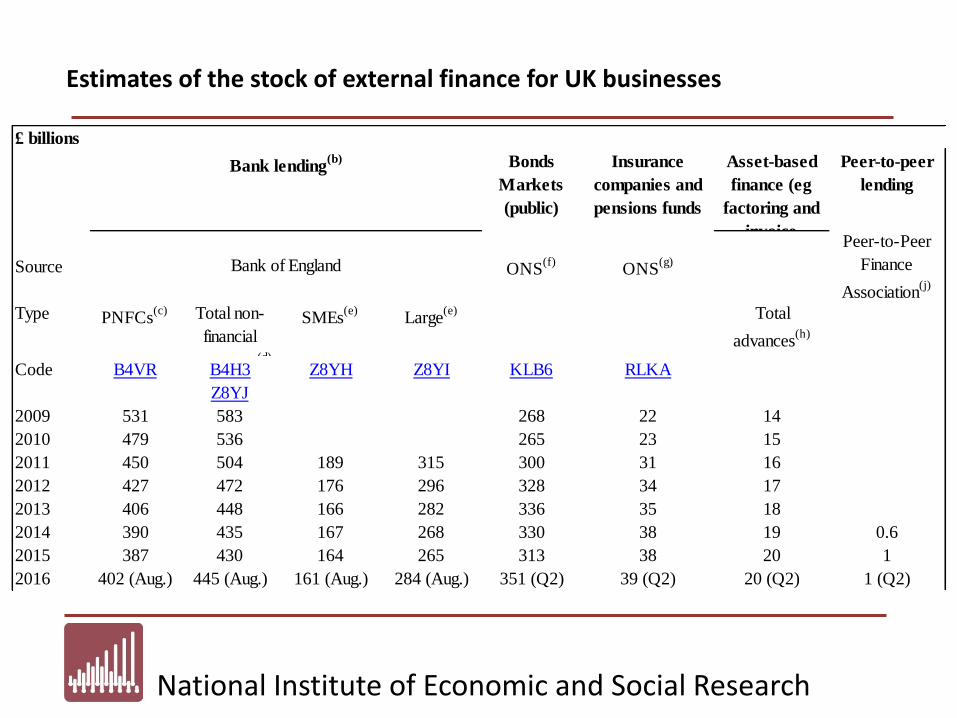
£ billions
Bonds
Markets
(public)
Insurance
companies and
pensions funds
Asset-based
finance (eg
factoring and
invoice
Peer-to-peer
lending
Source ONS(f)
ONS(g)
Peer-to-Peer
Finance
Association(j)
Type PNFCs(c) Total non-
financial
businesses(d)
SMEs(e)
Large(e) Total
advances(h)
Code B4VR B4H3 Z8YH Z8YI KLB6 RLKA
Z8YJ
2009 531 583 268 22 14
2010 479 536 265 23 15
2011 450 504 189 315 300 31 16
2012 427 472 176 296 328 34 17
2013 406 448 166 282 336 35 18
2014 390 435 167 268 330 38 19 0.6
2015 387 430 164 265 313 38 20 1
2016 402 (Aug.) 445 (Aug.) 161 (Aug.) 284 (Aug.) 351 (Q2) 39 (Q2) 20 (Q2) 1 (Q2)
Bank lending(b)
Bank of England
Estimates of the stock of external finance for UK businesses
National Institute of Economic and Social Research
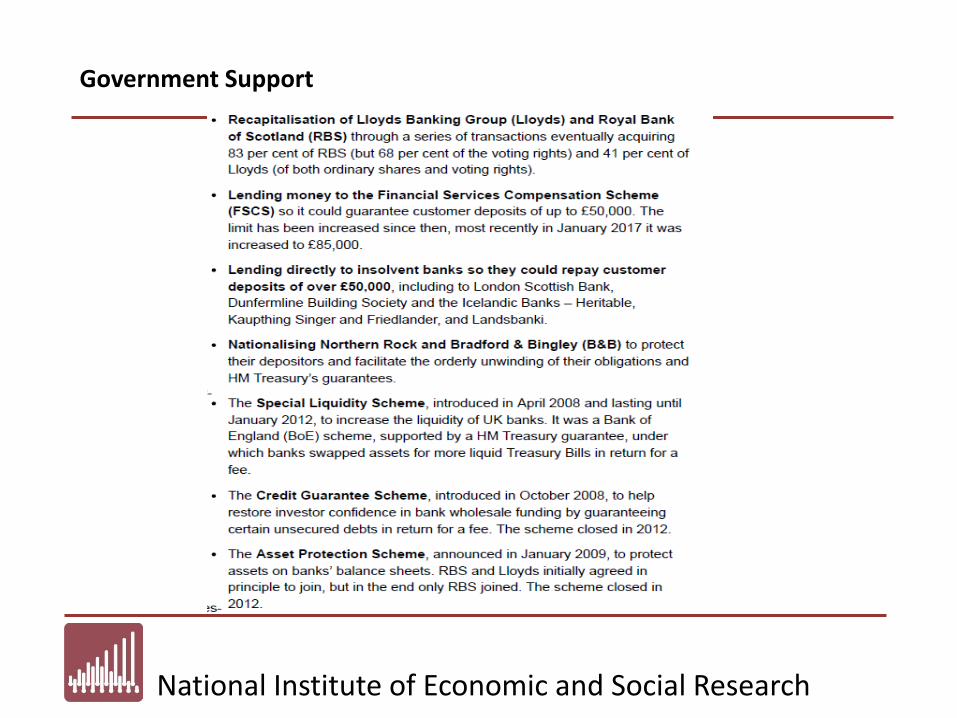
Government Support
National Institute of Economic and Social Research
Economic Issues
• Lending is property based• Household sector is “overweight” housing wealth with c £1.7Tn loans• Significant regional and distributional issues• Capital stock, investment and productivity seems to have fallen short
Financial Sector
• Determines the level of output• Subject to informational constraints and network/externalities• Cannot self-insure so needs liquidity and capital• Measured productivity in the sector has fallen post-crisis
National Institute of Economic and Social Research
Case for a Development Bank
• Government owned or significant capital stake• Can be directed in certain areas e.g. SMEs, start-ups, perhaps even
venture capital• Could have a regional bias or flavour e.g. Liverpool Development Bank
Questions• Projects must still be able to provide a rate of return without
subsidised lending• Might offer better screening and matching function for long term
investment• British Business Bank set up in 2012 with £1bn of government funding• Macro-Prudential Instruments and the centralised rules of modern
banking might mean there are individuals who are perfectly good risks that are not getting finance
• Can we identify shortfalls in lending finance independently of the state of the economy?
Related Documents