Blue Ribbon Commission On Health Care Costs and Access Proposals Submitted by Stakeholders Received as of September 5, 2006

Welcome message from author
This document is posted to help you gain knowledge. Please leave a comment to let me know what you think about it! Share it to your friends and learn new things together.
Transcript
Blue Ribbon Commission On Health Care
Costs and Access
ProposalsSubmitted by Stakeholders
Received as of September 5, 2006
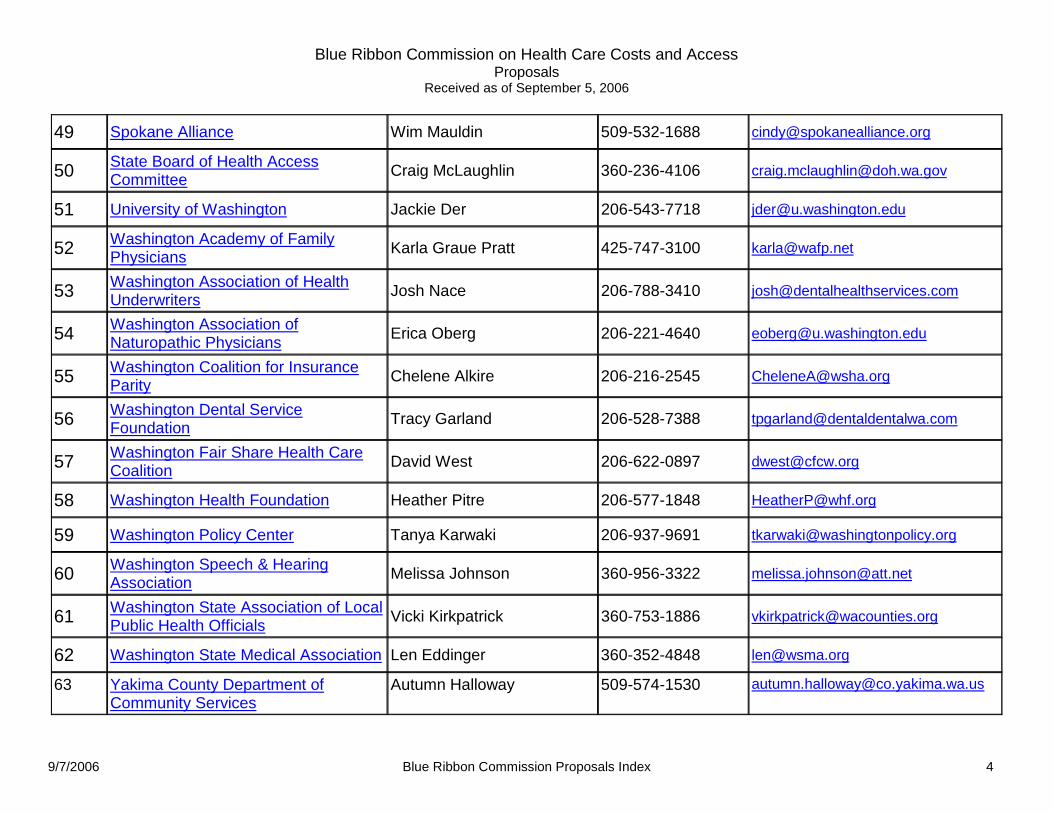
Blue Ribbon Commission on Health Care Costs and AccessProposals
Received as of September 5, 2006
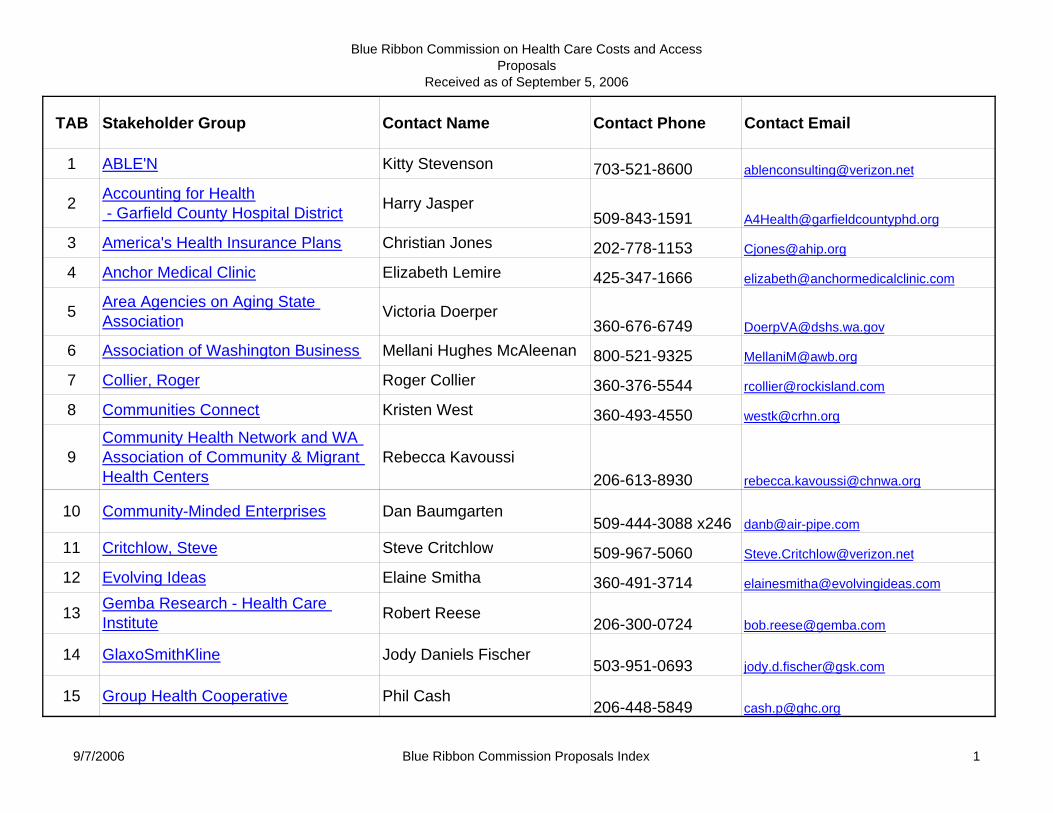
TAB Stakeholder Group Contact Name Contact Phone Contact Email
1 ABLE'N Kitty Stevenson 703-521-8600 [email protected]
2 Accounting for Health - Garfield County Hospital District Harry Jasper
509-843-1591 [email protected]
3 America's Health Insurance Plans Christian Jones 202-778-1153 [email protected]
4 Anchor Medical Clinic Elizabeth Lemire 425-347-1666 [email protected]
5 Area Agencies on Aging State Association Victoria Doerper
360-676-6749 [email protected]
6 Association of Washington Business Mellani Hughes McAleenan 800-521-9325 [email protected]
7 Collier, Roger Roger Collier 360-376-5544 [email protected]
8 Communities Connect Kristen West 360-493-4550 [email protected]
9Community Health Network and WA Association of Community & Migrant Health Centers
Rebecca Kavoussi206-613-8930 [email protected]
10 Community-Minded Enterprises Dan Baumgarten509-444-3088 x246 [email protected]
11 Critchlow, Steve Steve Critchlow 509-967-5060 [email protected]
12 Evolving Ideas Elaine Smitha 360-491-3714 [email protected]
13 Gemba Research - Health Care Institute Robert Reese
206-300-0724 [email protected]
14 GlaxoSmithKline Jody Daniels Fischer503-951-0693 [email protected]
15 Group Health Cooperative Phil Cash206-448-5849 [email protected]
9/7/2006 Blue Ribbon Commission Proposals Index 1
weeks_ri
Line
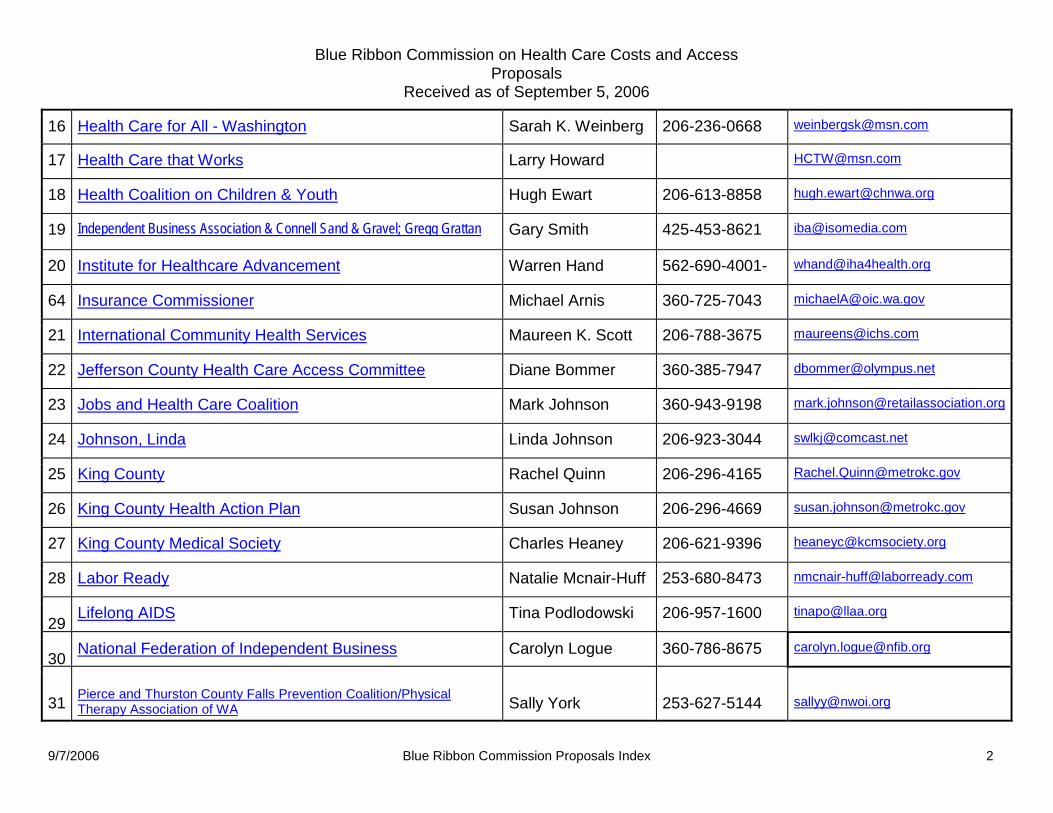
Blue Ribbon Commission on Health Care Costs and Access Proposals
Received as of September 5, 2006
9/7/2006 Blue Ribbon Commission Proposals Index 2
16 Health Care for All - Washington Sarah K. Weinberg 206-236-0668 [email protected]
17 Health Care that Works Larry Howard [email protected]
18 Health Coalition on Children & Youth Hugh Ewart 206-613-8858 [email protected]
19 Independent Business Association & Connell Sand & Gravel; Gregg Grattan Gary Smith 425-453-8621 [email protected]
20 Institute for Healthcare Advancement Warren Hand 562-690-4001- 20
64 Insurance Commissioner Michael Arnis 360-725-7043 [email protected]
21 International Community Health Services Maureen K. Scott 206-788-3675 [email protected]
22 Jefferson County Health Care Access Committee Diane Bommer 360-385-7947 [email protected]
23 Jobs and Health Care Coalition Mark Johnson 360-943-9198 1
24 Johnson, Linda Linda Johnson 206-923-3044 [email protected]
25 King County Rachel Quinn 206-296-4165 [email protected]
26 King County Health Action Plan Susan Johnson 206-296-4669 [email protected]
27 King County Medical Society Charles Heaney 206-621-9396 [email protected]
28 Labor Ready Natalie Mcnair-Huff 253-680-8473 [email protected]
29 Lifelong AIDS Tina Podlodowski 206-957-1600 [email protected]
30 National Federation of Independent Business Carolyn Logue 360-786-8675 [email protected]
31 Pierce and Thurston County Falls Prevention Coalition/Physical Therapy Association of WA Sally York 253-627-5144 [email protected]
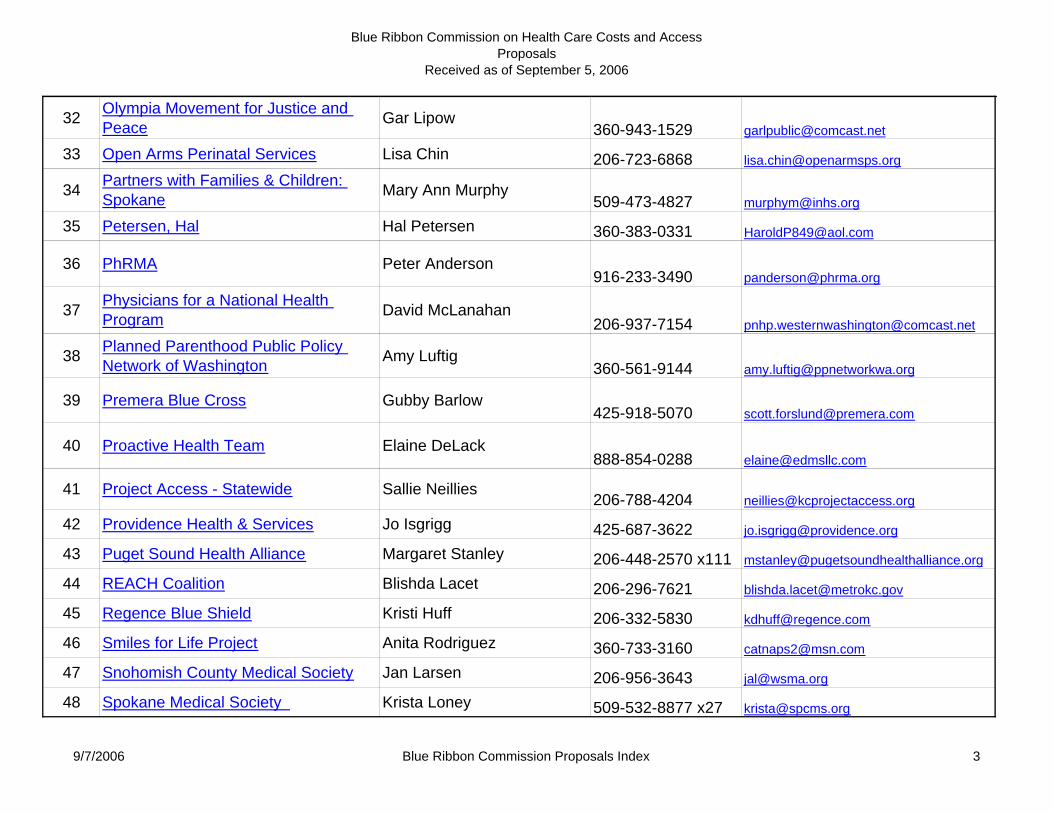
Blue Ribbon Commission on Health Care Costs and AccessProposals
Received as of September 5, 2006
32 Olympia Movement for Justice and Peace Gar Lipow
360-943-1529 [email protected]
33 Open Arms Perinatal Services Lisa Chin 206-723-6868 [email protected]
34 Partners with Families & Children: Spokane Mary Ann Murphy
509-473-4827 [email protected]
35 Petersen, Hal Hal Petersen 360-383-0331 [email protected]
36 PhRMA Peter Anderson916-233-3490 [email protected]
37 Physicians for a National Health Program David McLanahan
206-937-7154 [email protected]
38 Planned Parenthood Public Policy Network of Washington Amy Luftig
360-561-9144 [email protected]
39 Premera Blue Cross Gubby Barlow425-918-5070 [email protected]
40 Proactive Health Team Elaine DeLack888-854-0288 [email protected]
41 Project Access - Statewide Sallie Neillies206-788-4204 [email protected]
42 Providence Health & Services Jo Isgrigg 425-687-3622 [email protected]
43 Puget Sound Health Alliance Margaret Stanley 206-448-2570 x111 [email protected]
44 REACH Coalition Blishda Lacet 206-296-7621 [email protected]
45 Regence Blue Shield Kristi Huff 206-332-5830 [email protected]
46 Smiles for Life Project Anita Rodriguez 360-733-3160 [email protected]
47 Snohomish County Medical Society Jan Larsen 206-956-3643 [email protected]
48 Spokane Medical Society Krista Loney 509-532-8877 x27 [email protected]
9/7/2006 Blue Ribbon Commission Proposals Index 3
Blue Ribbon Commission on Health Care Costs and Access Proposals
Received as of September 5, 2006
9/7/2006 Blue Ribbon Commission Proposals Index 4
49 Spokane Alliance Wim Mauldin 509-532-1688 [email protected]
50 State Board of Health Access Committee Craig McLaughlin 360-236-4106 [email protected]
51 University of Washington Jackie Der 206-543-7718 [email protected]
52 Washington Academy of Family Physicians Karla Graue Pratt 425-747-3100 [email protected]
53 Washington Association of Health Underwriters Josh Nace 206-788-3410 [email protected]
54 Washington Association of Naturopathic Physicians Erica Oberg 206-221-4640 [email protected]
55 Washington Coalition for Insurance Parity Chelene Alkire 206-216-2545 [email protected]
56 Washington Dental Service Foundation Tracy Garland 206-528-7388 [email protected]
57 Washington Fair Share Health Care Coalition David West 206-622-0897 [email protected]
58 Washington Health Foundation Heather Pitre 206-577-1848 [email protected]
59 Washington Policy Center Tanya Karwaki 206-937-9691 [email protected]
60 Washington Speech & Hearing Association Melissa Johnson 360-956-3322 [email protected]
61 Washington State Association of Local Public Health Officials Vicki Kirkpatrick 360-753-1886 [email protected]
62 Washington State Medical Association Len Eddinger 360-352-4848 [email protected]
63 Yakima County Department of Community Services
Autumn Halloway 509-574-1530 [email protected]
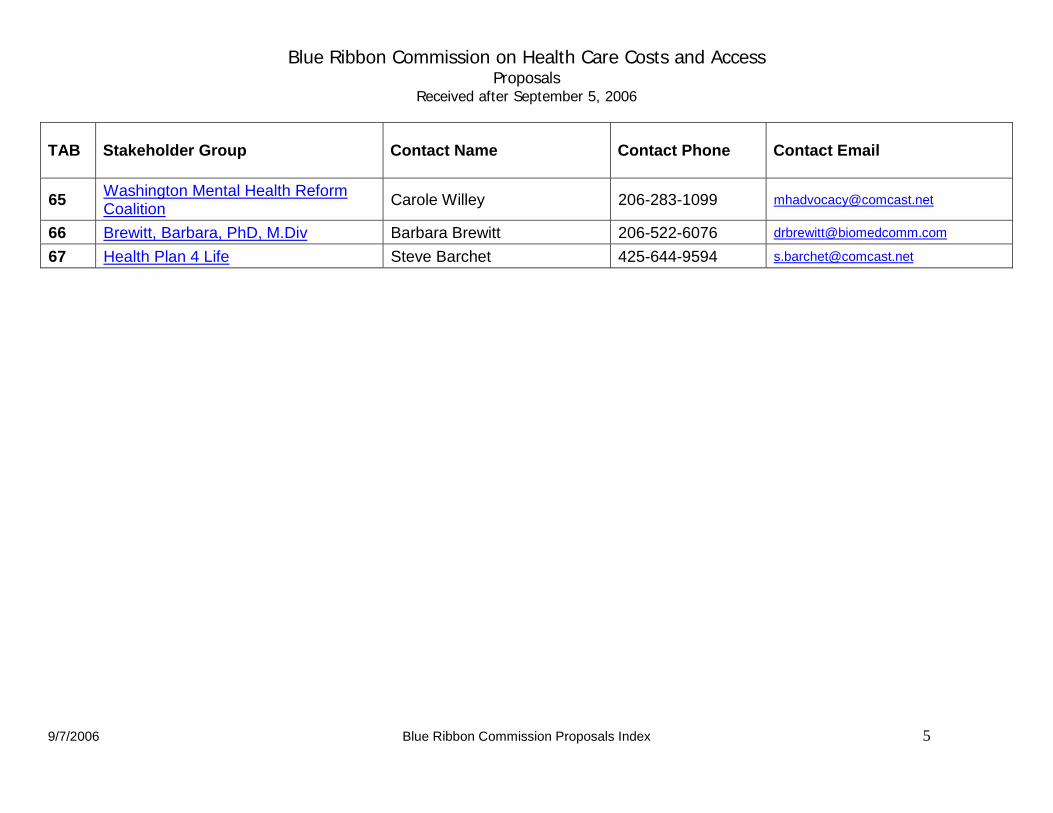
Blue Ribbon Commission on Health Care Costs and Access Proposals
Received after September 5, 2006
9/7/2006 Blue Ribbon Commission Proposals Index 5
TAB
Stakeholder Group
Contact Name
Contact Phone
Contact Email
65 Washington Mental Health Reform Coalition Carole Willey 206-283-1099 [email protected]
66 Brewitt, Barbara, PhD, M.Div Barbara Brewitt 206-522-6076 [email protected]
67 Health Plan 4 Life Steve Barchet 425-644-9594 [email protected]

Tab 1
Consultant On Employment Issues And Persons With Disabilities, Communications and Traveling Services
P.O. Box 41691 Arlington, Virginia 22204-8691 1124 South Monroe Street Arlington, Virginia 22204-4217
E-mail: [email protected]
(703) 521-8600 (703) 521-8601 (FAX)
August 31, 2006
MEMORANDUM FOR: [email protected]
FROM: K. Clark Stevenson, President ABLEN Consulting Chief Principal and Project Manager
SUBJECT: Response to RFP – Blue Ribbon Commission on Health Care Costs & Access – Due September 1, 2006 via e-mail
Question 1: What do you propose be done to realize the vision and goals for Washington State established by the Blue Ribbon Commission on Heath Care Costs and access? Briefly summarize your proposal.
After reviewing the Washington State Health Commission’s information, it appears the proposals being sought are to increase access to health via increasing access to health insurance and quality of care. There is some data to suggest that improving diversity and cultural competency may increase access and quality. However, what appears to be lacking is a positive correlation between improving access/quality and improving competency.
ABLEN Consulting proposes providing cultural competency training to the executive group in the State to better prepare them to understand and navigate the waters as they develop and implement strategies. They will need to be effective cultural brokers in order to make a difference in a project of this scope. Given your parameters, the logical first step seems to be the design and conduct of a “jump-start” type of training program.
This can be a weekend retreat, or a week-long event that focuses on the issues of culture, diversity, access, care and quality. Once trained, the group will be better positioned to select effective strategies and interventions.
Question 2: How will implementation of your proposal enhance, hinder or otherwise impact the achievement of the vision and each of the goals established by the Commission? How do you know?
ABLEN Q represents the partnership between ABLEN and CapacityWare™ and the QWLC Organization Change System to provide change agent technologies fitted together forming a powerful and expanding set of capacity recovery and development techniques. The advantage to the organization is in the speed and staying power of change designs that are available for application to achieve established goals. The CapacityWare™ Practitioner International Network (CWPIN) provides a 21st century development tool – RGBa cornerstone technology – that links directly to other related concepts adding strength to the fabric of organizational capacity. (Visit www.LTODI.org “click” on CWPIN for more information.)
RGB technology is a new millennium tool used to create an “ideal” worklife capacity in complex organizations. The RGB is easier and more quickly adopted into the language and work patterns of a broader range of workers than any other technology in use today. It takes a highly complex condition and makes it simple to understand and use.
1
Question 3: Is your proposal modeled after an existing policy or program within Washington or elsewhere? If so, describe the policy or program and its outcomes.
ABLEN Consulting’s professional consortium of associates and subcontractors brings over 350 years of professional, technical, or legal experiences in relevant areas. We become a tailored cross-functional team to successfully perform the scope of services required by individual contracts. ABLEN's diverse project teams demonstrate a commitment and leadership philosophy that values the full utilization of all members and respects their contributions. Members of the CWPIN are scheduled to provide the retreat and cultural competency training. Kitty Clark Stevenson, President, ABLEN Consulting is the chief principal responsible for the full project performance, quality and administrative control. (Visit www.ablenconsulting.com for more information.)
For this project, staffing includes adding members of the medical and health care profession. Specifically, Vincent E. Schuyler, Director, Transition Services, Program Director, District of Columbia Partnership to Improve Children’s Healthcare Quality (DC-PICHQ); Sara Evans, MD, FAAPMR, Chief of Pediatric Rehabilitation, Children’s National Medical Center (CNMC); Patricia O’Berry, RN, BSN, CSN, Clinical Coordinator, Division of Pediatric Rehabilitation, CNMC; and Joyce Brooks, NSW, Chief, Children’s Bureau, Maternal and Family Health Administration, District of Columbia Department of Health. Mr. Schuyler coordinates and directs programs that provide access to quality healthcare, government or grant-funded services to low-income families, and self-sufficiency programs or transition services. He is also a principal lead on the project.
The National Center for Cultural Competency at Georgetown University provides the best information on diversity and healthcare, and their information and resources will be used (http://www11.georgetown.edu/research/gucchd/nccc/index.html).
QWLC uses RGB technology and CapacityWare™ within the City of Hampton, Virginia, the Department of Transportation, Commonwealth of Virginia, and various healthcare organizations. The lessons learned within these public- and private-sector organizations will help guide efforts designed for Washington State. For example, the Cultural Capacity Development System includes the proprietary software. The QWLC niche includes large organizations that constitute a community infrastructure, such as government, public education, health care, and industry.
Cultural Capacity. An organization’s cultural capacity is high when it is able to find and fix problems that adversely impact performance, innovation, effectiveness, efficiency, and profitability.
This system is predicated more on the development of relationships required to get the work of the organization done successfully than on the formal structure of the organization.
Question 4: Will your proposal impose costs on individuals, businesses or government? Will these costs be time-limited or on-going? Can you estimate how much these costs will be, or suggest how such an estimate could be made? How much, if any, of these costs will be offset by corresponding savings?
Costs will be imposed on government funding, limited to the length of the Cultural Competency and CapacityWare™ training events. Because the focus is on “developing relationships” to get the work done, final costs depend upon how many “retreats” or week-long events contracted.
Generally, however, full day (8 hours, including lunch and breaks) retreats start at $2,200 per day. The size of the group usually is under 40 participants. At a minimum, retreats are more successful if 1-1/2 days are scheduled, or $3,300. Travel, transportation, and per diem costs for a 4-member team, per retreat, are also necessary.
Question 5: How does your proposal reflect collaboration among various stakeholders? Which stakeholders have endorsed it?
The identification of stakeholders is a first priority, tapping into those networks already established. We have extensive experience succeeding within the domain of an organization considering: industry, organization form, geographic location, and organizational neighbors.
2
Question 6: What are the obstacles to implementing your proposal? Who will object to it and why? How do you suggest these objections be addressed?
There are three (3) major obstacles – location, stakeholders network presently non-existent, and proposal focusing on executive leadership “jump-start” training.
State leaders and legislators would object to using a company headquarters outside the State. However, professional affiliations and 21st century technology both aid in minimizing or eliminating the effects of this obstacle. In fact, the Blue Ribbon Commission led the way by obtaining information and research from across the country.
Stakeholders already established and familiar with RFP respondents already involved in the work of the Blue Ribbon Commission or related programs within Washington State would be hesitant to start over with a new group. However, we have extensive experience in working with diverse and divergent groups using proven interactive and adult learning model techniques to impart information and knowledge about our work, methodology, technology, and competence.
Finally, because our focus is on executive leadership cultural competency training and cultural capacity supported by software and technology, it may not be viewed as a priority by the decision makers. However, we know that preparing executives to understand and navigate the waters of change associated with this crucial healthcare initiative creates the foundational platform from which all strategies can be successfully launched. QWLC’s Cultural Capacity Development System seeks to combine stabilizing potential of cause and effect with the reality of uncertainty. It advances courses of action that have a more-than-even chance of success in altering the current culture toward greater capacity, while acknowledging the probability of an acceptable trade-off at each alternative.
Thank you for the opportunity to respond. Your work for the citizens of Washington State is important and necessary. Our best wishes for great success.
Additional information, to schedule a CapacityWare™ demonstration, and all inquiries should be directed to: Kitty Clark Stevenson, President, ABLEN Consulting, 703.521.8600, 703.521.8601 (FAX), or e-mail at: [email protected].
3

Tab 2
Washington StateBlue Ribbon Commission
on Health Care Costs and Access
PROPOSAL
Accounting For Health& The
Engaging individuals & communities –motivating sustained healthy living.
September 2006
Prevention &Personal Health Records
For All Washingtonians by 2012!
“An ounce of prevention is worth a pound of cure.”–Benjamin Franklin
What would Old Ben Franklin say if he knew the health care system of the 21st Centuryspent over 90% of healthcare dollars on the treatment of illness, rather than on itsprevention?
He might identify our current system approach as the primary cause of our poor healthand out of control increases in health spending.
A significant transformation, from our current treatment approach to a new proactiveprevention approach, must occur in order to avoid this impending social economichealth care catastrophe. Our stewardship as health leaders is to stand accountable forthe health of our people. Our challenge is to take the necessary actions that will lead tothe achievement of ideal health results. We possess the awesome potential to lead ourstate to become The Healthiest State in the Nation and lead our nation to become TheHealthiest Nation in the World!
To succeed requires the engagement of individuals and communities in evidence basedprevention and intervention! Accounting For Health is a model approach for engagingpeople in prevention and sustaining healthy living! The Shared Care Plan is a personalhealth record & self management care plan that connects patients, providers, & payors!
Page 2 of 9
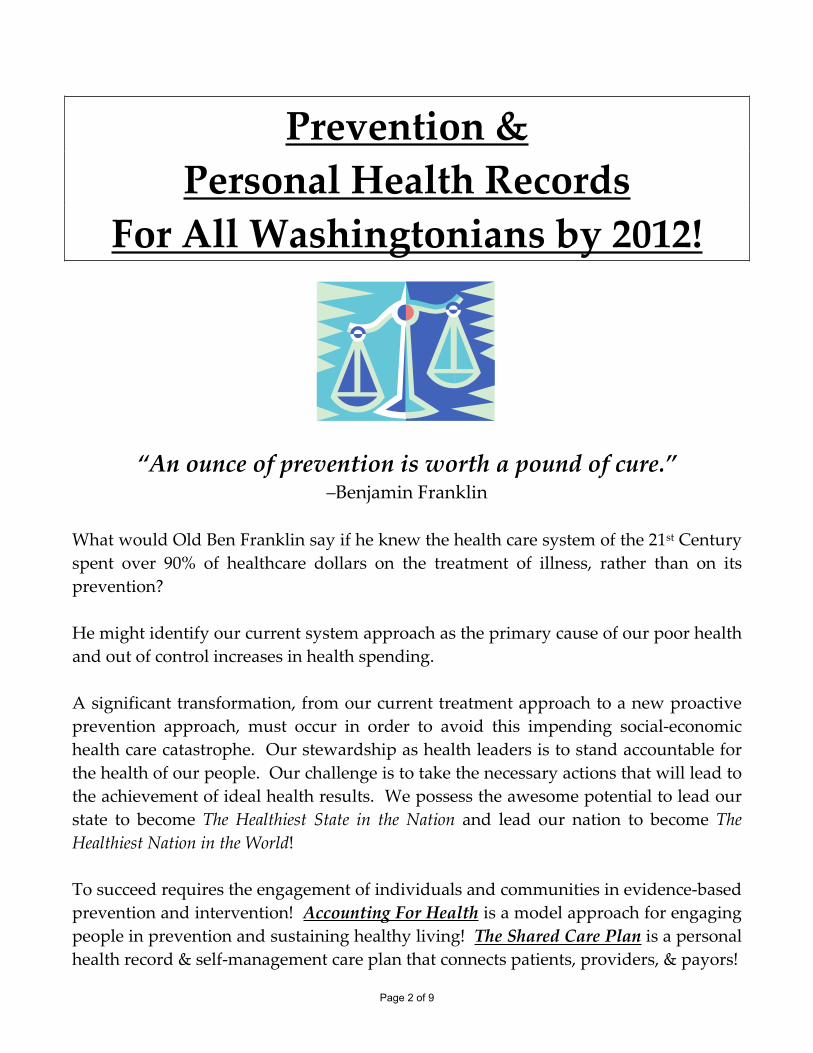
Accounting For HealthA unique web based health challengethat tracks participant’s health results,
shares these results publicly,and without dictating behavior –motivates sustained healthy living.
Engaging individuals & communitiesin evidence based prevention & intervention.
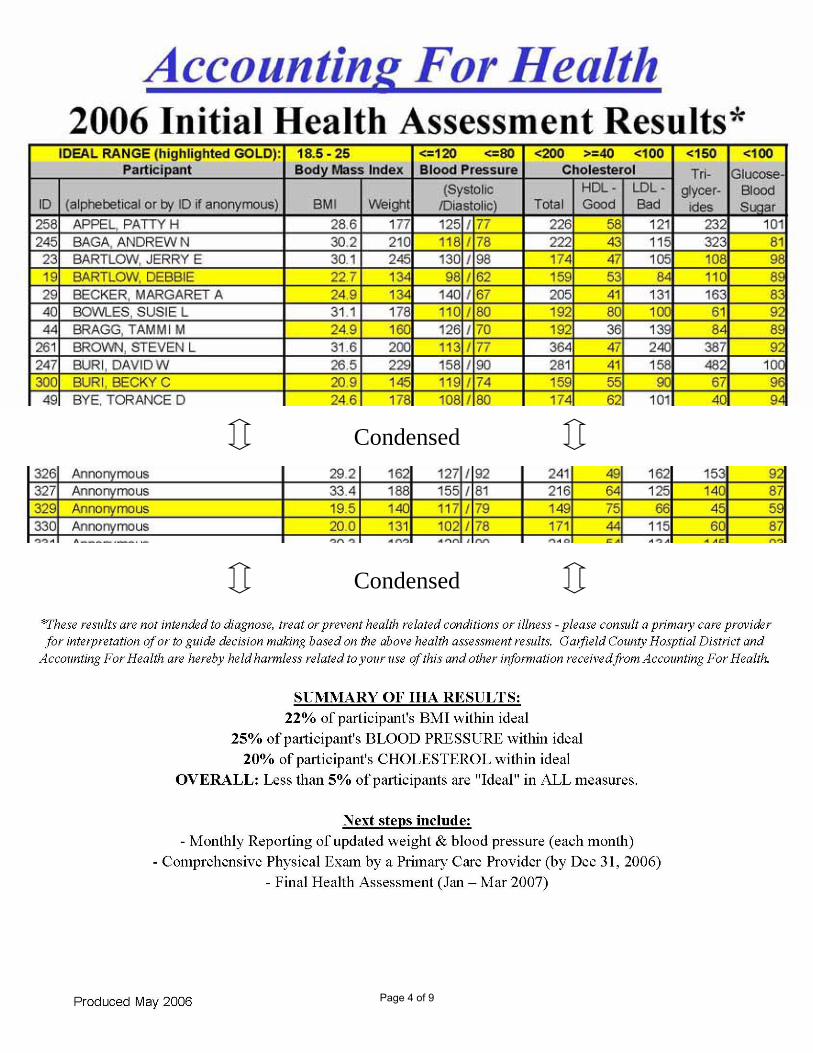
EXAMPLE OF HOW IT WORKS: In June 2006 the following Accounting For Health Reportwas sent to all households in Garfield County – just imagine how this might affect yourcommunity and our entire state!
Initial Results Enclosed!
Page 3 of 9
Condensed
Condensed
Page 4 of 9
ACCOUNTING FOR HEALTHMISSION SUMMARYWeb based health challenge – Simple, public, and results focused; Accounting For Healthharnesses the power of information technology. There is no other health challenge likeAccounting For Health.Tracking participant’s health results – Participants complete a results focused healthassessment, which focuses on four universally relevant measures – Body Mass Index,Blood Pressure, Cholesterol, & Glucose. These simple results are applicable to all, costalmost nothing to measure, and constitute the primary poor health conditions in society –namely, obesity, cardiovascular disease & illness, and diabetes. Accounting For Healthfocuses on key health results.Sharing these results publicly – Based on the principle that accountability andconsequences motivate, Accounting For Health, publicly displays all participants’ healthresults! Participant’s authorize this disclosure at the time of enrollment, and choosewhether to have their name displayed with their results or to remain anonymous using anassigned ID. These results are shared publicly at www.AccountingForHealth.org!Without dictating behavior – Another unique characteristic of the challenge is thatparticipants are free to choose their own behavior. Accounting For Health does not dictatehow or how much to eat or exercise. Each participant, with the guidance of their primarycare provider, is responsible (or able to choose their response) to their health results.Motivating sustained healthy living – the natural results of this approach is healthimprovement. Participants are motivated through sound health information, delivered inreal time, meaningful, publicly accountable ways, and evidence based primary careprevention & intervention resulting in people taking charge of their health and choosinghealthy living!
THE CHALLENGE (Participation Steps)Annual Health Assessment – During this 10 minute assessment the followingresults are measured:
o BMI – Body Mass Index (weight & height)o BP – Blood Pressureo CHOL – Cholesterol (the good, bad, and the total)o GLUC – Glucose (blood sugar).
Participants receive a report card comparing their results to the ideal range.Annual Comprehensive Physical Exam– This exam, completed by a primary careprovider, includes a review of the above assessment report card, complete healthhistory, general multi system examination, and consultation based on allinformation gathered.Monthly Measurement – Each month participants submit their updated weight &blood pressure results. Participants immediately receive a progress reportcomparing these results to their annual assessment results and the ideal range.
Page 5 of 9
What Is the Shared Care Plan?The Shared Care Plan is a free, easy to use, personal health record that lets youorganize and store vital health information. You can share this information with yourfamily, physicians and others you feel should have access to this information.The Shared Care Plan is also much more — it is a self management care plan,improving your understanding of your own health. It can help you manage chronicconditions, coordinate the care of others, and improve your health. Whether you areliving with a chronic condition or are a healthy athlete, the Shared Care Plan canbenefit you.
A Personal Health RecordThe Shared Care Plan is a place for you to organize and store all of your healthinformation in one place. Some of the information you can track in the Shared CarePlan includes:
Medications both past and presentAllergies, reactions, and drug interactionsDiagnoses and immunizationsHospitalizations, surgeries, and proceduresHealth indicators such as blood pressure, cholesterol, and blood sugars
Coordinating Your Health CareYour Care Team is the group of people and organizations that you feel play animportant role in your health care, such as medical providers, pharmacies, familymembers, or social workers. You identify this Care Team in your Shared Care Plan,making it easier to share your preferences and health care information with thoseinvolved in your care.
Printing out the Shared Care Plan and bringing it to your appointment can improveyour conversations with your doctors. Additionally, if you are a family membercoordinating care for a loved one, the Shared Care Plan can offer you help withtracking, understanding and communicating health care issues.
Page 6 of 9
IMPLEMENTATION PLANAccounting For Health and The Shared Care Plan will engage individuals andcommunities through a phased, targeted marketing approach to employers and healthplans beginning with rural public hospital districts throughout the state. Plans arebeing finalized to spread to 10 rural hospital districts starting January 2007! Thesehospitals will be hosting sites as the challenge spreads to their respective communities!
Once the results of these efforts are apparent, we will encourage other employers,insurers, and communities to join the challenge.
IMPACT ON ACHIEVEMENT OF COMMISSION VISIONAccess to evidence based prevention and intervention will be available to all whochoose to participate by connecting patients to primary care providers. For many thiswill become a life long ‘health home’ for coordinating care.
Health outcomes (Quality) will dramatically improve using evidence based preventionand intervention. Once engaged, participants begin to choose healthy behaviors; theyseek out education and training on healthy living, and good choices are rewardedcontinuously with improved and sustained health results.
A study completed in 2003 by the U.S. Department of Health and Human Servicestitled, Prevention Makes Common “Cents”, found significant returns on investments forhealth promotion and disease management programs, ranging from $1.49 to $4.91 inbenefits for every dollar spent on these programs. More recent studies indicate ten foldreturns on investments using health information technologies.
“So many of our health problems can be avoided through diet, exercise and makingsure we take care of ourselves. By promoting healthy lifestyles, we can improve the
quality of life for all Americans, and reduce health care costs dramatically.”Tommy G. Thompson, Former DHHS Secretary
OTHER SIMILAR PROGRAMS & POLICIESOther health and wellness programs track similar measures, but no other effectivelyholds participants accountable to their health results like Accounting For Health. PHRsor Personal Health Records are beginning to become more available to the generalpublic. The primary challenge PHRs face is usability by patients and compatibilitywith existing provider EMRs or Electronic Medical Records. Using advance securityand database technology, The Shared Care Plan, has created a patient friendly PHRwhich is capable of interfacing with EMRs to share important medical recordsinformation.
Page 7 of 9
Together, the two programs become a tool which effectively engages individuals andcommunities in evidence based prevention and intervention achieving optimal healthoutcomes!
COSTSUsing a phased implementation approach, beginning in 2007, the primary costs willinclude administrative staff expenses ($90,000/yr) and web site maintenance costs(approximately $18,000).
Sustained funding for these administrative expenses are expected to come fromemployers and health plans as a result of the savings they will experience from theprogram. The 10 rural hospitals, with approximately 1,500 plan members, willcontribute through monthly insurance premiums.
Again, “An ounce of prevention is worth…” – hopefully, 100’s of millions of dollars inreduced health care costs! In addition to improved physical & mental health, financialhealth will be achieved by employers, health plans, providers, and Washingtoniansacross the state!
COLLABORATIONTransformation doesn’t happen without teamwork! In 2005Washington HealthFoundation through the Healthiest State in the Nation campaign, awardedGarfieldCounty Hospital District $50,000 to continue the development of Accounting ForHealth and spread the challenge countywide. Foundation Northwest awardedfunding which made it possible to cover all non covered charges to the 350+participants for their Comprehensive Physical Exams! TheDepartment of Health’sWashington State Collaborative(s) program has contributed knowledge, technicalskill, and tireless encouragement! (This program is fantastic and absolutelyworthwhile!) TheNational Rural Health Association & localWRHA has been a toolfor sharing our success with other rural communities. Pomeroy School Districtparticipated in the first Accounting For Health Pedometer Challenge in theGovernor’sHealth Bowl 2005! Western States Insurance conceived the idea to promoteAccounting For Health as a wellness program through the innovative AWPHD’sInsurance Trust. Our local representatives have supported our success –WA Rep.David Buri and his wife Becky are stalwart participants,WA Senator Mark Schoeslerjust joined the challenge, & Congresswomen Cathy McMorris and her staff havechampioned our initiative from day 1!
Page 8 of 9
All commission members and staff are invited to join Accounting For Health and createa Shared Care Plan. WA Rep. Bill Hinkle completed his health assessment last week –feel free to ask him any questions you may have regarding his experience!
CONCLUSIONLet us collectively remember Our stewardship as health leaders is to standaccountable for the health of our people. Our challenge is to take the necessary actionsthat will lead to the achievement of ideal health results. We possess the awesomepotential to lead our state to become The Healthiest State in the Nation and lead ournation to become The Healthiest Nation in the World!
CONTACT INFORMATION
Accounting For Healthwww.AccountingForHealth.org
Garfield County Public Hospital DistrictNo. 166 N. 6th St.Pomeroy, WA 99347Phone: 509 843 1591Fax: 509 843 1234
Harry JasperAccounting For Health Project [email protected]
The Shared Care Planwww.SharedCarePlan.org
Pursuing Perfection of WhatcomCounty800 E. Chestnut #3BBellingham, WA 98225Office 360 756 6885Fax 360 756 6834
Marc PiersonPursuing Perfection Project [email protected]
Lori NicholsPursuing Perfection Project Managerand HInet [email protected]
Page 9 of 9

Tab 3
Improving Health Care Access to the Uninsured: America’s Health Insurance Plans Principles
When looking for solutions to provide access to the 43 million Americans that are uninsured, AHIP believes any viable approach must build on the strengths of the present employer-based health care system. This, however, requires a state regulatory environment that does not impose unduly restrictive laws and regulations that inhibit health insurance plans from developing innovative and cost-effective products.
AHIP believes quality is a key component to creating an affordable health care system conducive to increasing access to the uninsured. This can be accomplished by maximizing cost savings that can be achieved through making evidence-based medicine the standard for health care, advancing quality and transparency to improve outcomes, eliminating errors, and helping consumers make informed health care choices.
History has demonstrated that there is no one-size-fits-all solution to the problem of the uninsured. AHIP believes what is needed is a multi-faceted, multi-dimensional approach that accounts for the specific needs and unique characteristics of each segment of the uninsured population. AHIP endorses a range of strategies that will extend access to care to all uninsured Americans including:
Providing access to health care for lower-income through tax credits to help subsidize provided employer-sponsored coverage and to small employers to offset the cost of providing coverage to such individuals; Encouraging younger Americans to seek and maintain health coverage through flexible health insurance coverage offerings such as tax-advantaged HSAs in conjunction with any type of health plan that the company selects, not only high deductible health plans; Intensifying efforts to cover adults and children eligible for but not enrolled in public programs; Creating “high risk” purchasing pools to cover uninsured individuals with especially high health costs;Providing access through public programs for Americans living below poverty by giving states the option of expanding Medicaid and SCHIP coverage to provide health insurance to all individuals with incomes below 100% of poverty; andProviding access through public financing of private health coverage for Americans living near poverty by: (1) encouraging states to subsidize either employer-sponsored or individual insurance premiums for this population; (2) providing additional support to safety net providers that provide access to basic health care services this population; and (3) giving states significant flexibility with regard to coverage, benefits and program structure.
Based on America’s Health Insurance Plans Board of Directors 2004 Statement A Commitment to Improve Health Care Quality, Access, and Affordability.

Tab 4
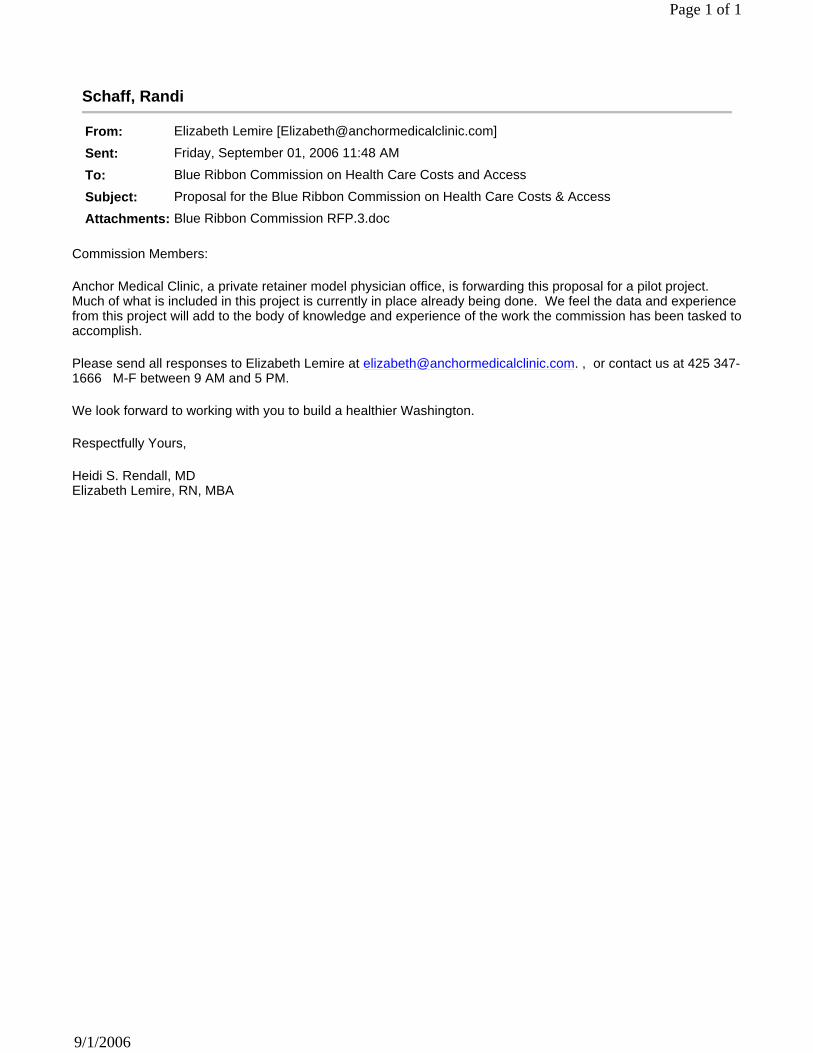
Schaff, Randi
From: Elizabeth Lemire [[email protected]]
Sent: Friday, September 01, 2006 11:48 AM
To: Blue Ribbon Commission on Health Care Costs and Access
Subject: Proposal for the Blue Ribbon Commission on Health Care Costs & Access
Attachments: Blue Ribbon Commission RFP.3.doc
Page 1 of 1
9/1/2006
Commission Members:
Anchor Medical Clinic, a private retainer model physician office, is forwarding this proposal for a pilot project.Much of what is included in this project is currently in place already being done. We feel the data and experience from this project will add to the body of knowledge and experience of the work the commission has been tasked to accomplish.
Please send all responses to Elizabeth Lemire at [email protected]. , or contact us at 425 347-1666 M-F between 9 AM and 5 PM.
We look forward to working with you to build a healthier Washington.
Respectfully Yours,
Heidi S. Rendall, MDElizabeth Lemire, RN, MBA
Washington State Blue Ribbon Commission OnHealth Care Costs and Access
REQUEST FOR PROPOSAL September 1, 2006
Heidi S. Rendall, MD
ANCHOR MEDICAL CLINIC 8227 44th Ave West Suite E
P.O. Box 959 Mukilteo, WA 98275
425 347-1666 [email protected]
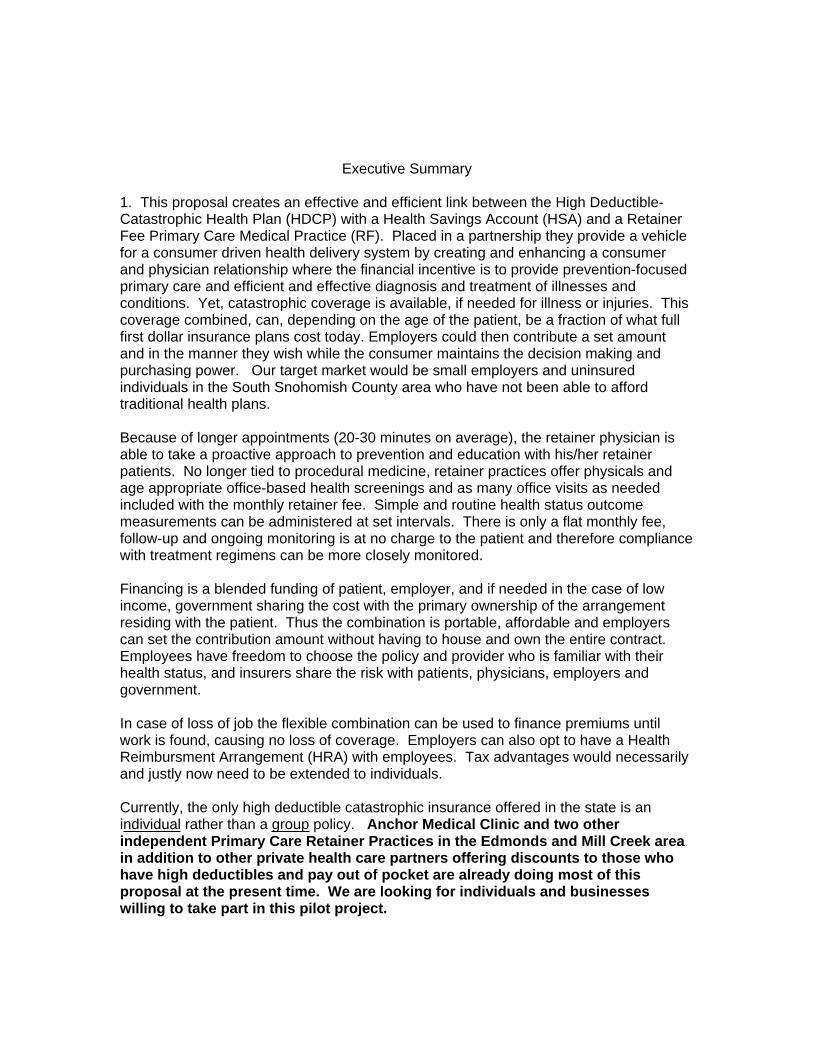
Executive Summary
1. This proposal creates an effective and efficient link between the High Deductible- Catastrophic Health Plan (HDCP) with a Health Savings Account (HSA) and a Retainer Fee Primary Care Medical Practice (RF). Placed in a partnership they provide a vehicle for a consumer driven health delivery system by creating and enhancing a consumer and physician relationship where the financial incentive is to provide prevention-focused primary care and efficient and effective diagnosis and treatment of illnesses and conditions. Yet, catastrophic coverage is available, if needed for illness or injuries. This coverage combined, can, depending on the age of the patient, be a fraction of what full first dollar insurance plans cost today. Employers could then contribute a set amount and in the manner they wish while the consumer maintains the decision making and purchasing power. Our target market would be small employers and uninsured individuals in the South Snohomish County area who have not been able to afford traditional health plans.
Because of longer appointments (20-30 minutes on average), the retainer physician is able to take a proactive approach to prevention and education with his/her retainer patients. No longer tied to procedural medicine, retainer practices offer physicals and age appropriate office-based health screenings and as many office visits as needed included with the monthly retainer fee. Simple and routine health status outcome measurements can be administered at set intervals. There is only a flat monthly fee, follow-up and ongoing monitoring is at no charge to the patient and therefore compliance with treatment regimens can be more closely monitored.
Financing is a blended funding of patient, employer, and if needed in the case of low income, government sharing the cost with the primary ownership of the arrangement residing with the patient. Thus the combination is portable, affordable and employers can set the contribution amount without having to house and own the entire contract. Employees have freedom to choose the policy and provider who is familiar with their health status, and insurers share the risk with patients, physicians, employers and government.
In case of loss of job the flexible combination can be used to finance premiums until work is found, causing no loss of coverage. Employers can also opt to have a Health Reimbursment Arrangement (HRA) with employees. Tax advantages would necessarily and justly now need to be extended to individuals.
Currently, the only high deductible catastrophic insurance offered in the state is an individual rather than a group policy. Anchor Medical Clinic and two other independent Primary Care Retainer Practices in the Edmonds and Mill Creek area in addition to other private health care partners offering discounts to those who have high deductibles and pay out of pocket are already doing most of this proposal at the present time. We are looking for individuals and businesses willing to take part in this pilot project.
2. Wide spread use of the RF Primary Care Practice in combination with a HDCP and an HSA will most likely assist the health delivery system in achievement of the commissions goals in the following ways.
Once the arrangement is funded and maintained it pays for the first dollar of medical expenses for the patient for the year. Patients will need to be financially responsible for both their account and the purchases made with their account or face the risk of unplanned and unaffordable medical expenses. Spending will most likely be limited to those expenditures which will, in the estimation of the trusted physician in cooperation with the patient, be among the best of the alternatives to meet the patient’s particular circumstances among the options available. How do we know these proposals will work? We have studies that show arrangements that enhance the direct doctor patient relationship are working and will continue to work in today’s environment.1
July 16, 2006 1
Study Shows Health Savings Account Plans Stimulate Positive Consumer Health Behavior
A three year study conducted by United Healthcare has found that individuals with a Health Savings Account are more likely to be actively engaged in managing their health and making health care decisions than individuals in more traditional arrangements. While the study sample remains relatively small because of the recent introduction of Health Savings Accounts, it is the largest study to date, covering a three-year period and examining more than 50,000 individuals. The results provide solid and measurable examples of how health care spending and consumer behavior can be positively advanced - without adverse effects on health outcomes - when consumers are given the necessary support.
"These results reinforce the revolutionary impact that the concept of consumerism is having by providing vehicles to effectively transfer knowledge and wealth to consumers so they can make wiser, more financially sound decisions about their health care," said MikeTarino, CEO of Definity Health.
The Health Savings Account study compares cost and utilization trends among approximately 50,000 individuals in high-
deductible plans connected to Health Savings Accounts to data from roughly 15,000 individuals enrolled in preferred
provider organizations (PPOs). The study period was between 2003 and 2005 and consisted of two sample groups drawn
from the same employers. This new data reinforces the results of earlier Definity and United Healthcare studies, which
have consistently shown that HSA enrollees have higher usage of preventive care services and lower tendency to pursue
discretionary acute care services.
Notable findings from the three-year study include:
-- Preventive Care - In each of the three years, up to 5 percent more of the HSA members sought preventive care
services than did PPO enrollees.
-- Acute Care - Individuals enrolled in an HSA showed an annual reduction in the use of acute care services (22 percent
fewer hospital admissions and 14 percent fewer emergency room visits) without adverse health effects or outcomes, while
the relative utilization of those services actually increased year-over-year among PPO members.
-- Chronically Ill - HSA enrollees with a chronic illness also used acute services less (8 percent fewer hospital admissions
and 12 percent fewer emergency room visits) but continued to visit their primary care physician at the same rate as
chronically ill members enrolled in traditional plans.
-- Overall Costs - Costs per member decreased 3 percent to 5 percent in the HSA plans over the 2004-2005 period, as
compared to their 2003 baseline level, while increasing 8 percent to 10 percent among PPO participants (after adjusting
for demographics, health status, plan design impact and geography).
"While not yet conclusive, these findings support what we've seen anecdotally for the past several years: when consumers are given more information and responsibility for their health care, they will make efforts to assume more control over decision-making about the care they need in order to pursue the optimum courses of treatment. This in turn can help positively impact their health care outcomes and related costs," Tarino said
The simple model mentioned above is based on sound market economics and sound medical practice. When the pull through marketing strategy is used to sell the latest technology (marketing efforts targeted toward the end user), having a physician the patient trusts, in most cases, persuades the end user against need for many unnecessary and expensive tests or specialists. Within our ability to do so we would consider tracking randomly assigned patients through episodes of care and comparing the cost incurred to established cost figures across disease states at the level of family practice within this geographic area.
A key to improving health indicators (see above) is the close personal and working relationship established in a RF Practice which allows the time and contact with the patient over repeated intervals and follow-ups, both of which are at no additional charge to the system or the patient. It makes a considerable difference if the face at the other end of the stethoscope is knowledgeable about you and your medical condition, rather than someone to whom you are meeting perhaps only occasionally or for the only time.The tendency can be to over or under treat because the physician does not have the medical history background or the time to read it, if it were available. The physician in relationship with the patient can exact a certain restraint on patient spending by providing accurate information and reasons for treatments.
Improving access is a function of cost (ie. no mandated benefits), availability and portability. Untying the presently defined work/insurance relationship will provide access to lower cost options, enhance price transparency and will maintain the physician patient relationship through job changes.
Most of the health indicators mentioned in the Vision Statement and Goals can be traced to lifestyle choices. It is at precisely this point where a relationship with one physician who knows the individual and family, can and will, make a difference in health related behavior. The responsibility is ultimately up to the patient to make healthy choices and wise consumer decisions. With the retainer fee practice model, the patient holds not only the incentive to make economically wise and physically healthy choices but the direct
purchasing power through the saving account and high deductible catastrophic policy to make those wise choices with the advice of a physician who knows and understands the issues and resources at hand.
Improving affordability comes as a result of change in financing arrangements that enhance direct payment to any provider. Billing and coding are capital and/or labor intensive services which are incorporated into the provider cost structure. By uncoupling the financing of a comprehensive Health Plan from the employer base and spreading it between the employer and the patient, the physician/patient can collaborate in finding the best and less expensive alternatives available for lab, diagnostic imaging and other services for the patient. Involvement of the patient in the decision and financing of the treatment most always provides for better clinical and financial outcomes because the patient has a financial stake in all decisions regarding their care. Fragmented care through multiple physicians in multiple locations will most likely be proven to more costly than arrangements that enhance the doctor patient relationship. True affordability is reached through widespread geographic system adoption of a model which effects downward pressure on the system.2,3
June 08, 2006 2
Health Savings Account plans being embraced by smaller employers
With health-care costs a top issue among many small businesses and no simple solution on the horizon, Health Savings
Account plans appeal to many employers because they involve workers in the process and encourage them to spend
wisely, experts say.
"Employers are willing to do almost anything in an effort to try to control the increases they've been seeing year in and
year out," said David Levitz, executive vice president at GCG Financial, a Bannockburn firm offering employee benefits to
small and mid-size companies. "We're seeing a huge migration, a huge push toward Health Savings Accounts in an effort
to control these costs," he said.
Providing top-flight health insurance for workers always has been a high priority at Loop accounting firm Ostrow Reisin
Berk & Abrams Ltd.
With competition fierce to recruit and retain accountants, the firm is not about to change its focus now, even as rapidly
rising health-care costs eat into profits, said Phil Dunne, administrator at the 85-employee firm.
"We've never tried to take the inexpensive way out," he said. "Our employees work hard and we need them to be healthy."
But as the firm examines the best options this summer in preparation for a Sept. 1 renewal date, what's different this time
is the growing number of "consumer-driven" health plans available that include a deductible of $1,000 or more and are
tied with a health savings account or health reimbursement arrangement. The plans can be set up so employees have a
financial incentive to spend less on health care, often reaping the savings themselves.
In the Chicago area, 23 percent of employers offer consumer-driven health plans, while 29 percent are considering adding
one in 2007, according to a survey of 310 area employers conducted by GCG Financial with Milliman Inc., a Seattle-
based consulting firm. Many of the plans are new, with 12 percent of respondents indicating they added a consumer-
directed plan for the first time in 2006, Levitz said.
Improving quality is a nebulous term. Who really knows if evidence based standards of care are acceptable in all areas to all patients? What a quality outcome means to one patient may not be quality outcome to another. With patents holding the purse strings they determine how far and how much they want to do. In consumer-driven or patient focused medicine, who determines quality is far more important that what a quality outcome looks like on paper. It only seems logical that the person who must live with the outcome and who is paying for much of the care should decide for himself with advice and help of the physician what outcome is acceptable. The outcome findings can be documented and scored with various outcome measurement tools such as the SF-13 and 36 or others. Functionality and emotional status at home, work and play are important aspects of quality to most retainer patients.
3. Our research has found that this proposal has not been tried or proposed elsewhere.
4. Overall costs, on average, should be lower than these employers anticipated with traditional plans, as we are speaking about a catastrophic plan which is shared between consumer and employer and in some cases government. The three main components are the Retainer Fee primary care practice, the high deductible health plan and the health savings account. For example, if employers contribute a set amount to the cost of the health plan and/or Health Savings Account, the employee can pick up the Retainer Fee and a portion of either of the other two. We would work with an insurance expert to determine how this could be best accomplished and have already selected that agent. Again, financing arrangements and outcome measurements that enhance the doctor patient relationship and the trust between the two can exert downward pressure on costs through a more cooperative model of health care delivery.
Cost estimates will be based on the demographics of the group and shared by the employer and employee. Cost estimates could be made by studying the demographics and relative health status of the employer group. Some of these costs may very well be offset by higher worker health and productivity as well as savings to the employer in L& I injuries, as there is no charge to job injured enrollees who are seen in the RF practice.
Government costs are not included in this study but could be the focus of another study at some point in time. Retainer Fee practices hold much promise in this area.
5. Collaboration is inherent in this proposal. Insurers/agents, underwriters, HSA banks and their representatives, employers, employees, retainer physician and other providers will need to agree upon health plans to be offered in the pilot, retainer fee physician groups to be included, and physicians to agree upon outcome measurement criteria. All parties would be represented and stakeholders would have ample opportunity to provide input into the process. Anchor Medical Clinic and partners it chooses to work with would facilitate the group and oversee the management of the project.
6. Obstacles include the tax status of individual health plans and how that could be circumvented or neutralized, underwriting issues with those groups who have a measure of chronic illness within them that has been hampering their ability to provide health
benefits, and the inclusion of the retainer fee as a qualified IRS medical expense which applies to the deductible for the purposes of the pilot program.
Foot Notes: 1 July 16,2006 http://www.health--savings--accounts.com/hsa-weblog-rch/general_hsa_info/index.html
2June 8, 2006 http://www.health--savings--accounts.com/hsa-weblog-rch/general_hsa_info/index.html3May 5, 2006 http://www.health--savings--accounts.com/hsa-weblog-rch/general_hsa_info/index.html

Tab 5
Blue Ribbon Commission on Health Care Costs and Access
Focus on Elders and People Who Need Chronic Care: Strategies for Addressing Health Care Access and Cost
Proposal from the Washington Association of Area Agencies on Aging (W4A) September 1, 2006
With the growing number of seniors in Washington State and the nation, as well as an increasing number of people with chronic conditions that require management and care, a cost-effective approach to wellness, health care, chronic care, and support of unpaid family caregivers is clearly needed.
Area Agencies on Aging (AAAs) in the State of Washington are part of a nationwide network that focuses on the needs of seniors, family caregivers, and adults with chronic care needs. This system represents a community level infrastructure that is
Consumer-oriented, grassroots Local government, non-profit, or tribe Focusing on needs of elders and people with disabilities, targeting
vulnerable people with chronic care needs and family caregivers In every community of the State and Nation: rural, suburban, and urban Collaborative, community-based, and a “can-do” culture.
Seniors represent a disproportionate share of the health care costs in our country. The prevalence of chronic conditions among seniors as compared to other age groups is high. In addition, adults with chronic diseases and conditions utilize health care services at a rate higher than the general population. A focus on these groups is likely to result in more positive health outcomes for individuals, thus allowing them to participate and contribute to their families and communities; in addition, costs to the health care and long term care systems can be mitigated as well.
With this in mind, we would offer four strategies to address the vision and goals of the Blue Ribbon Commission as they relate to seniors, family caregivers, and adults with chronic care needs. Each of these strategies builds on effective community-based solutions, local resource management, and assuring services and capacity in every area of the State.
1. What do you propose be done to realize the vision and goals? We propose four strategies through the State’s Area Agencies on Aging to address health care access and costs for seniors and adults with chronic care needs.
First, expand Senior Information and Assistance programs through increased funding to serve the health access needs of older adults and adults who need chronic care.Currently Information and Assistance programs assist seniors in navigating a variety of community resources for support and services, including home care, housing, medications, mental health, and wellness programs. Expansion would provide capacity
to help adults with chronic care needs (not just seniors) and to expand work with local health care resources. For example, finding medical homes for seniors is often a critical problem. Even though a senior may have access to Medicare coverage, health coverage does not guarantee access to medical care. Many physicians no longer accept Medicare patients. Medicare and Medicaid clients in our state frequently have very limited access to necessary medical interventions. The end result of having coverage and no access is identical to having no coverage and no access. Navigating the healthcare system requires outreach, assistance with information and support as well as mentoring and organizational skills. Assistance with prescription drugs, finding durable medical goods through community programs, and educating consumers about the best way to choose and communicate with health care professionals are all ways that Senior Information and Assistance can enhance access to medical care. In addition, many AAA’s employ specialists to serve the needs of minority and limited-English proficient clients. This outreach and assistance can bring services to currently underserved populations.
Second, implement the Intensive Chronic Care Management program model statewide.Intensive Chronic Case Management (ICCM) is a program operated through Area Agencies on Aging that provides comprehensive case management by a registered nurse in a team approach. The focus is on integrating both acute and long-term care services to high cost and high risk Medicaid clients. The program goals include: maintaining health, minimizing acute episodes, limiting disability and reducing costs. Approximately 5% of Medicaid clients account for 50% of Medicaid costs. Many of these individuals are also consumers of long term care services – additionally they are more likely to be diagnosed with depression and chronic pain.
ICCM was successfully piloted in two Area Agencies on Aging (Pierce and SE Washington) from 2004 to 2006. During the first year of the project it demonstrated a return on investment of 3:1. There were also significant reductions in utilization: Emergency Room Visits (reduced 9%), Hospital Days (reduced 15%), Prescription Drugs (reduced 19%) and Dr. Office Visits (reduced 22%).
Third, enhance and increase funding to the Family Caregiver Support and Respite programs to support the growing number of unpaid family caregivers who provide chronic care to a loved one. Unpaid family caregivers are the backbone of the chronic care system in Washington State, providing a substantial proportion of long term care support services to family and neighbors. Without their substantial support and involvement, long-term care costs in the State, through Medicaid and other public sources, would be significantly larger. Health conditions that result in some level of chronic disability affect entire families, whether from the birth a child with a developmental disability, a dad injured on the job, a brother with MS, or a mother who is diagnosed with Alzheimer’s disease.
Families are our first responders and our best hope for sustained, quality, and loving care. But full-time caregiving is emotionally stressful and physically demanding, and caregivers suffer high rates of illness, depression and mortality. Families and other
informal caregivers are struggling with the challenges of providing and sustaining help over time. Small amounts of help, information, and service have proven to be successful at sustaining family involvement and assisting informal caregivers to manage chronic conditions without more costly public support especially through the over-burdened Medicaid program. Examples of support coordinated by AAAs include respite, adult day services, caregiver counseling, teaching caregivers about good and safe care techniques (through OT and PT, for example), and group training and support.
Fourth, support community-based wellness activities for older adults, particularly those age 70 and older. Various studies show that older adults are disproportionately affected by chronic conditions. Effective methods for managing chronic conditions as well as activities to promote wellness and delay the onset of chronic conditions are important both to preserve the quality of life of individuals as well as minimize health care expenditures. In addition, wellness activities for family caregivers could extend their ability to continue to provide care to a loved one.
Evidence-based wellness programs can make a positive difference for the health of individuals as well as in health care costs. For example, the Enhance Fitness/Enhance Wellness program, an evidence-based model of improving health, showed a 13% improvement in participant social function, a 52% improvement in depression, and a 35% improvement in physical functioning. In addition, cost analysis showed that participant health care costs were only 79% of the costs of non-participants. Other evidence-based prevention and wellness programs, such as falls prevention programs, could yield positive health results and health care cost savings if they were available in communities throughout the State.
2. How will implementation enhance, hinder, or otherwise impact the achievement of the vision and goals? The goal of improving access to health care would be positively impacted by expansion of Senior Information and Assistance, implementation of the Intensive Chronic Care Management model, and expansion of support to unpaid family caregivers. Each of these strategies includes assistance to help individuals navigate the increasingly complex and fragmented array of health resources in their own local communities and ongoing problem-solving assistance. Area Agencies on Aging are structured to target service and support to underserved populations, including those with limited ability to speak English.
The goal of improving health would be positively addressed by each of the four strategies. Utilizing the infrastructure of Area Agencies on Aging for these programs assures that each area of the State’s population will have access to support. The proposed strategies address “everyday” actions that individuals must engage in to preserve health; these actions are the critical adjunct to the intermittent interactions with the formal health care system. In other words, once access to appropriate health care is achieved, support is needed for implementing recommendations, assuring that treatment interventions are received, and implementing behavior changes required to improve health. Community-based supports envisioned in each of these strategies are
well-positioned to support individuals in either improving their health or preventing premature deterioration.
The goal of improving affordability is addressed by each strategy as well. In particular, supporting unpaid family caregivers delays the placement of individuals with chronic care needs in an institutional setting, often at State expense. The ICCM model of chronic care has already shown savings to Medicaid expenditures, and the strategy addressing wellness activities shows promising evidence of decreased health care costs as well.
3. Is your proposal modeled after an existing policy or program within Washington or elsewhere? Yes, each of the four strategies has been shown to be effective in Washington State.The strategies build on systems already in place and piloting models for improved care. Each of the strategies identified could be implemented Statewide by community-based organizations with solid community partnerships in place.
4. Will your proposal impose costs? Time-limited or ongoing? Estimate? Savings?Each proposed strategy will require an investment of State and/or Medicaid funds to implement or expand. The investment in each strategy will be ongoing. Savings are projected based on pilot program evidence related to the Intensive Chronic Care Management Model. Savings are also estimated for supporting unpaid family caregivers, allowing them to continue to provide care for a longer period of time than they would be able to achieve without respite and other supports. Information and Assistance expansion will likely result in savings to the health care system through assisting individuals to link with services and supports before their situation becomes a crisis and requires a higher level of intervention. Finally, a number of evidence-based wellness and prevention activities, including fall prevention programs, show significant health care savings.
5. How does your proposal reflect collaboration among various stakeholders? Area Agencies on Aging are community organizations that partner with a variety of participants on a variety of projects. Community partners include hospitals, clinics, local governments and elected officials, tribes, public health, private business, private non-profits, and communities of faith. Each of the strategies described represents collaboration in development as well as in implementation. For example, Senior Information and Assistance programs work with local community resources such as volunteer centers, food banks, pharmacies, and housing authorities to coordinate services. Case managers work with adults who have chronic care needs and who receive Medicaid in-home services. These case managers coordinate with hospitals, DSHS, DME providers, health clinics, transportation and interpreter brokers, families, and a wide range of local community resources. Due to time constraints we have not
queried our partners on this specific proposal, but a number of stakeholders working on eldercare and chronic care issues in the State have been involved in developing and advocating for these critical and effective strategies.
6. What are the obstacles to implementing your proposal? Objections? Funding is likely the major obstacle to implementation. We do not anticipate specific objections to these proposed strategies.
Submitted by:
Washington State Association of Area Agencies on Aging (W4A)
Contact Information:
Victoria Doerper Chair, W4AExecutive Director Northwest Regional Council/Area Agency on Aging 600 Lakeway Drive Bellingham, WA 98225 360-676-6749
Q:\Victoria\W4A\Advocacy\w4ablueribbonproposal0906.doc

Tab 6
Washington State’s Chamber of Commerce
Association of Washington Business P.O. Box 658 / 1414 Cherry Street Southeast Olympia, Washington 98507-0658
Olympia(360) 943-1600Statewide (800) 521-9325 FAX (360) 943-5811 E-mail [email protected] site www.awb.org
August 31, 2006 August 31, 2006 The Honorable Christine Gregoire The Honorable Christine Gregoire The Honorable Pat Thibaudeau The Honorable Pat Thibaudeau Blue Ribbon Commission on Health Care Costs & Access Blue Ribbon Commission on Health Care Costs & Access Sent via email to [email protected] via email to [email protected]
RE: Blue Ribbon Commission Request for Proposals
Dear Governor Gregoire, Senator Thibaudeau, and Members of the Commission:
Thank you for the opportunity to present proposals to the Blue Ribbon Commission on Health Care Costs and Access. The Association of Washington Business (AWB) is the oldest and largest statewide business organization and serves as Washington’s Chamber of Commerce as well as an umbrella organization for more than 125 trade and professional organizations. Our 5,800 members employ over 600,000 Washington residents. While AWB’s membership includes some of the nation’s largest and most influential companies, more than eighty-five percent of AWB’s members employ fewer than 100 people and one-third are small businesses with less than ten employees. Health care costs and the ability to provide quality health care coverage for their employees are significant concerns to all of our members, large and small. Thus, we are very interested in the outcomes of the Blue Ribbon Commission and look forward to continuing to work with you to achieve the imperative goal of increasing access to affordable, quality health care.
Unfortunately, due to time constraints, we were not able to develop a proposal that is as detailed as has been requested by the Commission. However, we certainly agree that Washington’s leadership must take steps to improve the health care system in Washington. While there is no “silver bullet” solution, the members of the Association of Washington Business believe that the concepts outlined herein will move the state toward the goals of improving access, health, and affordability as outlined by the Commission, and ensuring that Washington citizens, purchasers and consumers alike, receive the best value for their health care dollars.
AWB urges the state must take a hard look at the reasons health care premiums are so high and continue to rise. The decisions necessary to lower premiums will not be easy ones and will often require long-term goals. However, our small businesses, in particular, need help in affording these premiums in the meantime. Businesses, as well as individuals should be incentivized to provide
AWB 8/31/06Page 2
coverage and should be encouraged to lead healthier lifestyles. Washington’s health care market place needs invigorated, and increased competition will generate lower costs. In no particular order, the following is a list of ideas AWB believes will improve Washington’s market:
Reduce Health Insurance RegulationWashington is one of the most regulated states in the nation. It is also very expensive, with little market competition between carriers. The administrative burden to health carriers must be reduced in order to make Washington a viable option for additional carriers seeking to enter the market. Regulatory restrictions on health care options must also be reduced to give employers greater access to plans that are relevant to the health care needs of their workforce with prices they can afford. By allowing insurance companies to offer policies that cover basic medical necessities, premiums would be less expensive, making coverage more affordable. Offerings for additional coverage should be available but not mandated.
Support State and Federal Tax Policy That Encourages CoverageBecause health care is such a vital necessity in our lives, the state and federal government should incentivize (not mandate) coverage by expanding tax reductions to those who purchase coverageCurrently, federal tax advantages are available to businesses that purchase coverage, but for many small businesses, the advantage is not great enough to offset their inability to afford coverage. And for individuals, little to no tax advantages are available.
Encourage the Availability of Low Cost, Flexible Health PlansState-imposed mandates force insurers to offer “one-size-fits-all” coverage that goes beyond basic medical coverage and makes coverage too expensive for many employers and individuals. Small employers, in particular, crave the ability to design coverage that meets the needs of their workforce at prices they can afford. Mandated benefits should be limited. Employers should be encouraged to explore ways to reduce their costs through wellness programs and prudent purchasing.
Supply Information to Consumers Currently Isolated from CostOur employer-based system of coverage is such that consumers are often in the dark about the actual costs of their care and are not encouraged to spend wisely. Transparency must be promoted, and consumers must be educated as to the true costs of coverage as well as the role personal responsibility must play in their health-related decisions. Consumer-driven health plans that promote choice, personal responsibility, and individual ownership should be encouraged. Wellness and preventive care should also be encouraged for both employers and individuals.
Improve Productivity/Efficiencies of the Current Health Care SystemThe US health care system is the “envy of the world in innovation,” but it is also wasteful, inefficient, and unnecessarily expensive. Taxpayers, purchasers, and consumers of health care services must be ensured that they are receiving the highest value for their health care dollars. Those dollars should be focused on the most cost-effective, efficacious care available.
In addition to these points, enclosed you will find a copy of AWB’s 2007-2008 Legislative Objective on Health Care. It has been approved by a number of AWB committees but has not been
AWB 8/31/06Page 3
finally approved by the Board of Directors so remains in DRAFT form. Nonetheless, it should provide you with a number of ideas to consider as you mull over your options. I encourage your review of this document because these are the areas that AWB’s members believe are deserving of the most focus. In addition to our Legislative Objective, which guides AWB’s priorities in the shorter term, we have developed a number of Public Policy Principles against which all propositions are evaluated. All health care proposals are evaluated by AWB’s members according to the following guidelines:
1. The health care system should provide access for all citizens to basic health care through an essentially pluralistic, competitive, private sector delivery and purchasing system.
2. The health care system should allow employers the freedom to establish and maintain affordable, innovative health care coverage plans for their employees without government requirements that increase premium costs beyond any legitimate benefit or justification to the employer or employee.
3. The health care system should promote choice in the variety and availability of health insurance coverage and benefits.
4. The health care system should encourage private-sector, market-based solutions for access to and adequate reimbursement for health care coverage and delivery of care.
5. The health care systems that are provided by state and federal health care programs must be fully and adequately funded through broad-based resources.
The Association of Washington Business strongly believes that any proposal reviewed by the Blue Ribbon Commission should be evaluated against these principles, as well.
Finally, we must remember that, for many, Washington’s health care system is working, and AWB urges you to be very careful not to upset the value in the system currently in place in an effort to improve upon it.
As I mentioned, we look forward to continuing to work with the Commission, as well as other stakeholders, to meet the goals of improving the accessibility, quality and affordability of Washington’s health care system. Please consider the Association of Washington Business a resource at your disposal as you grapple with the enormous task at hand, and please do not hesitate to contact me for additional information.
Sincerely,
Mellani McAleenan Governmental Affairs Director, Human Resources
Enc.
Health Care
Health care costs continue to rise at paces far in excess of inflation, causing many employers to either reduce the benefits they provide to their employees, drop existing coverage, or refrain from purchasing new coverage. The high costs of health care coverage have a direct impact on the number of uninsured in the state, and an expensive health care market makes Washington unattractive to new and existing businesses who want to provide good benefits for their employees. Exorbitant health care costs also erode the ability of the state to provide other vital services without raising taxes.
Private and public entities should continue efforts to address the major problems associated with rising health care costs. Citizens should adopt healthier lifestyles. And, they should be more aware of the costs and efficacy of their treatments. Government policies should be revised to reduce unnecessary regulations, most particularly mandated benefits. Insurers should be permitted to offer affordable basic health care plans, free of many of these mandates, along with those that may contain more options. In addition, the availability of consumer driven health plans, such as Health Savings Accounts, should be expanded, allowing employees greater control of and accountability for their health care decisions.
AWB’s Position:AWB supports health care policy that:
Encourages the availability of low cost, flexible health plans Oppose new, and support the reduction of, regulatory and legislative requirements that unnecessarily
add costs to the system. Promote free market delivery and payment for health care services and oppose government programs
that unfairly compete with private sector businesses. Support measures that allow employers access to health plans that are relevant to the needs of their
workforce within price ranges they can afford. Support efforts to create tax incentives to offset the high costs of health care coverage for purchasers.
Supplies information to consumers currently isolated from cost Support innovations that promote consumer education and awareness as to the cost of their health care,
as well as personal responsibility for healthy consumer lifestyles and employer-based wellness programs.
Support measures that encourage individuals to seek non-emergency treatment at more cost-efficient primary care centers, urgent care centers, and community health centers rather than emergency departments.
Improves productivity/efficiency of the current health care system Support measures that focus health care spending on the most cost-effective, efficacious care available. Support efforts to reduce costs associated with health care liability, and discourage unnecessary and
expensive defensive medicine. Support efforts that encourage the efficient use of medical technology without inappropriately hindering
access to quality care. Do no harm to market-based health coverage plans that have a history of success in Washington State,
including the protection of association plans and individual market successes. Oppose efforts to mandate the purchasing of health care by employers or the establishment of a single-
payer health care system.
Reduces State Costs and Discourages Government Cost Shifting Encourage governments to allocate appropriate funding to reduce uncompensated care, pay adequate
reimbursement levels, and alleviate cost shifting to the private sector. Encourage exploration of all cost saving opportunities in the general fund budget.
DRAFT Legislative Objective
Health Care
Association of Washington Business
2007-2008 Legislative Agenda
For more information on this issue, please contact Mellani McAleenan at 1-800-521-9325 or E-mail [email protected]

Tab 7
PROPOSAL TO THE BLUE RIBBONCOMMISSION ON HEALTH CARE COSTS
AND ACCESS
�
�
�
�
�
�
Submitted by Roger CollierAugust 2006
�
�
�
�
�
�
���������������������������������������������������������������������������������

1
Table of Contents
Executive Summary—the Six Questions Page 2
1. Introduction Page 4
2. Realizing the Commission’s Vision Page 5
3. Implementation Schedule Page 11
2
EXECUTIVE SUMMARY—THE SIX QUESTIONS
This paper has been prepared in response to the Blue Ribbon Commission on Health Care Costs andAccess’s invitation to individuals and organizations to present proposals to realize the Commission’svision and goals. This Executive Summary answers the six questions posed in the invitation.
1. What do you propose be done to realize the vision and goals for Washington Stateestablished by the Blue Ribbon Commission? Briefly summarize your proposal. – The proposedplan consists of five steps designed to respond to the major causes of today’s problems of cost,access, and quality. It does not change the roles of today’s principal stakeholders (providers,employers, insurers, government and consumers), but does attempt to make their relationships lessdysfunctional. It recognizes that although escalating costs are the main driver of the numbers ofuninsured, simply controlling costs will at best only stabilize the uninsured numbers, while merelyincreasing access will exacerbate the crisis.
� Step 1. Control new resource expenditures – With high-cost cases the major cost driver, andwith many hospitals and specialist groups having effective monopolies, better controls—whethermarket-driven or regulatory—over new resource expenditures are essential. A revised CONprocedure and a process for ongoing development of guidelines for care are recommended.
Step 2. Guarantee affordable coverage for employees and dependents – Full-time employeesof all but very small employers should be guaranteed a reasonable level of coverage. Employersshould have the option of buying coverage directly from insurers (or self-insuring) or paying alevy to help cover the cost of coverage selected by employees through a central insurance“marketplace” (see next bullet). Employers choosing the levy option would be protected againstrate increases above the CPI inflation rate.
� Step 3. Establish a central insurance “marketplace” – A central broker function offeringstandardized “no frills” coverage from multiple insurers, emphasizing prevention and qualitycare, would create market competition and a greater awareness of costs by those insured.
� Step 4. Establish a children’s coverage mandate – Every child should have coverage, andevery parent should have responsibility for making it happen. This may mean expanding Stateprograms for children and/or mandating that insurers make available child-only coverage
� Step 5. Provide adequate funding for an effective prevention program – With many high-cost diseases and accidents (e.g. alcoholism, obesity-related diseases, lung cancer, automobileaccidents) readily avoidable, a cost-effective prevention program is essential.
2. How will implementation of your proposal enhance, hinder, or otherwise impact theachievement of the vision and goals established by the Commission? How do you know? –Requiring coverage for all children and all employees and dependents of businesses with ten or moreemployees will reduce the number of uninsured by up to 400,000 (half today’s total), with a furtherreduction occurring as individuals purchase the proposed new “no frills” coverage. Improvements inhealth will result from the reduction in uninsured, whose health status has been shown by variousstudies to be worse than that of comparable insured individuals. The rate of increase in healthspending will be reduced as a result of a more effective CON process, guidelines for care, marketcompetition among insurers within the central broker function, greater awareness of costs amongindividual consumers, and a more cost-effective prevention program.
3
3. Is your proposal modeled after an existing policy or program within Washington orelsewhere? If so, describe the policy or program and its outcomes. -- The overall concept(“everyone gives a little”) and some components of the proposal (limited employer mandate, centralbroker function) are based on Massachusetts’ 2006 legislation, as well as on the original intent ofBasic Health. The children’s coverage mandate is more limited than Massachusetts’ law, whichrequires all residents to have coverage. The use of guidelines for care reflects the experience gainedwith such programs as NICE in Britain.
4. Will your proposal impose costs on individuals, businesses, or government? Will these costsbe time-limited or ongoing? Can you estimate how much these costs will be, or suggest howsuch an estimate could be made? How much, if any, of these costs will be offset by savings? –The intent of the proposed plan is to be budget-neutral in the short term, and to reduce the rate of costincrease to close to the CPI rate in the longer term. Employers and individuals who currentlypurchase coverage should see savings from reduced cost-shifting, from more effective controls overintroduction of new facilities and new treatments, and from more market competition among insurers.The State should also experience these savings, as well as reductions in Basic Health expenditures asmore employers assume some of their employees’ coverage costs; however, these savings will likelybe offset by costs of added Medicaid/SCHIP enrollment and subsidies of small business coverage.Employers (of ten or more employees) who do not currently provide coverage will be required toprovide coverage or pay a monthly levy in the $100-$150 range per employee. Parents of childrencurrently without coverage will be required to provide coverage, but many will be able to do sothrough their employers or State programs.
5. How does your proposal reflect collaboration among various stakeholders? Whichstakeholders have endorsed it? -- Details of this proposal have been shared with representatives ofKing County Medical Society, Group Health Cooperative, CodeBlueNow, Health Care for All, thePuget Sound Health Alliance, and individual business owners and providers. Where possible, theirfeedback has been incorporated.
6. What are the obstacles to implementing your proposal? Who will object and why? How doyou suggest these objections be addressed? -- Almost every part of this proposal can be readilyincorporated within today’s health care system, with minimal changes to the roles of majorstakeholders. In terms of Step 1, modifications to the CON process are currently being considered bya State commission, while the recommended process for guidelines for care has as a prototype thework of the Puget Sound Health Alliance, as well as NICE and other programs. Some providers willresist any limitations on their autonomy, and it may be necessary to establish a “carrot and stick”pricing structure for care meeting or not meeting guidelines. In terms of Step 2, there will beobjections from lobbyists for businesses not now providing employee coverage; however, theproposed monthly cost is within the range of acceptability indicated by many small business owners.In terms of Step 3, the proposal is consistent with the original legislative intent of Basic Health, butwith a design that avoids problems of selection bias. In terms of Step 4, while some parents willobject, mandating that children have health care coverage can be argued as no more extreme thanmandating that children be immunized. In terms of Step 5, the only objections are likely to comefrom businesses whose profits may be reduced if the State’s citizens adopt healthier lifestyles.
4
1. INTRODUCTION
The State of Washington’s Blue Ribbon Commission on Health Care Costs and Access was createdin response to widespread concerns about the affordability, availability, and quality of health care.The Commission’s vision statement says: “In five years, we envision a system which provides everyWashingtonian the ability to obtain needed health care at an affordable price.”
This proposal sets out one possible plan for achieving the Commission’s vision and the associatedgoals. The proposal emphasizes the need to understand and respond to the causes of the health carecrisis—in particular, the causes of the escalating costs that have resulted in Washington’s growingnumbers of uninsured—and to be feasible within the Commission’s five-year timeframe.
One point is worth noting. This proposal is not intended to advance or protect the interests of anyparticular stakeholder group. Rather, it is an independent proposal reflecting experience gained inimplementing a broad range of public and private health care programs over thirty years.
The Magnitude of the Problem
The State of Washington now has between 600,000 and 800,000 uninsured, employer premiumsaverage $6,000 per employee, and State health care expenditures total $8 billion a year.
If present trends continue, and assuming continued Congressional inaction, by 2010—in just fouryears—Washington will have another 100,000 or more uninsured, employer premiums will rise toclose to $9,000 a year, and State health care expenditures will increase to $11 billion annually.
The Causes of the Problem
The causes of Washington’s health care problems can be summarized under six headings:
� No limit on demand -- The sick want to be well, and if care is available they demand access to it.With fewer than 20 percent of the population incurring 80 percent of health care costs (and just 1percent incurring 30 percent of the total), this is the single greatest driver of health care costs.
� Too little personal responsibility – Most people are cushioned from most of their health coststhrough private insurance or State or Federal coverage, and are often unaware of the total costs.At the same time, many individuals’ lifestyles harm their health, while many healthy youngerpeople see little need for insurance.
� Ineffective market competition – The insurance market suffers from few insurer choices,difficulties of switching insurers, complexity of coverage options, legislative mandates, and—forinsurers seeking to control costs—provider monopolies in many communities.
� Inadequate preventive efforts – The current system emphasizes treatment over prevention, oftenfails to ensure continuity of care, and lacks adequate funding or incentives for preventive care,especially for high-risk populations.
� High “overhead” costs – In addition to direct care expenditures, costs are inflated by insurer andprovider administrative efforts, insurer marketing costs and surpluses, and by defensive medicinepracticed by providers in response to tort liability concerns.
5
2. REALIZING THE COMMISSION’S VISION
Framework of the Plan
The Blue Ribbon Commission’s legislative mandate, vision statement, and associated goals call for aplan that in five years will provide every Washingtonian the ability to obtain needed health care at anaffordable price, with specific improvements in access, health status, and affordability.
This combination of ambitious objectives with a short timeframe dictates a plan that recognizeslegislative, social, and technical obstacles, yet moves rapidly to achieve its goals. The following tenassumptions form the framework for the proposed plan:
� ERISA compliance – For any plan to be viable, it must comply with Federal ERISA regulationsrelating to self-insured employers.
� Emphasis on market competition – Market competition is the most politically acceptableapproach to cost-containment. To be effective it will depend on purchasers being able to compareinsurance offerings, and on differences in price and quality being meaningful to the consumer.
� Incorporation of other cost-containment mechanisms – Market competition alone may beinsufficient to control costs, especially with the near-monopoly power of some providers.
� Emphasis on quality – High quality care is generally (but not always) cost-effective care, since itis most likely to result in the patient’s recovery. Coverage should encourage use of evidence-based medicine and chronic care management.
� Affordability for small employers – Most of today’s uninsured are employees (or dependents)of small businesses. Health care must be affordable for such employers either through low-costcoverage or a direct or indirect subsidy.
� Minimal impact on large employers – Most large employers continue to provide healthinsurance to their employees (and often families) at rates significantly below the individual andsmall group markets. Large businesses are likely to resist any approach that increases their costsby requiring them to directly or indirectly subsidize other businesses or individuals.
� Recognition of crucial role of providers – Every health system depends on its providers. Cost-containment is essential, but it cannot be at the expense of provider quality or participation.
� Putting children first – Healthy children are more likely to become healthy adults; insuredchildren are more likely to choose later to be insured adults.
� Funding preventive services – Prevention (and early diagnosis) can be achieved in several ways:funding for clinics for vulnerable populations, funding for “healthy lifestyle” publicity andactivities, and mandating preventive care as a condition of coverage.
� Step-by-step implementation – Whatever the plan, its implementation in Washington must beincremental, to avoid major system disruption, to make timely assessment of the changespossible, and—given the experience of other states in restructuring elements of their systems—toallow the possibility of reversing course.
The proposed plan reflects each of the above considerations. It consists of five major elements:
6
Step 1 -- Control major resource expendituresStep 2 -- Guarantee affordable coverage for employees and dependentsStep 3 -- Establish a central insurance “marketplace”Step 4 -- Establish a children’s coverage mandateStep 5 -- Provide adequate funding for an effective prevention program
Details of these five elements of the plan are provided in the following subsections.
Step 1—Control New Resource Expenditures
Why is it Necessary? -- 80 percent of health care costs are due to only 20 percent of individuals, and30 percent of all costs are due to just 1 percent of the non-aged population, with facility and specialistcharges making up a disproportionate percentage of these costs. In fact, Washington has the highestinpatient hospital costs of the fifty states. If the escalating costs of these high cost cases can beconstrained, the total costs of health care will be largely brought under control.
Discussion – Rising facility, technology, and drug expenses are the principal drivers of high costcases. Potential approaches to controlling facility and technology costs include insurers’ ratenegotiations, Certificate of Need, rate-setting, use of guidelines for care, and central budgeting (usedin other countries, but unlikely to be acceptable in the USA).
Insurers’ rate negotiations attempt to control expenditure increases, but are limited by the near-monopoly status of many hospitals and specialists, and consumers’ preference for providers with thegreatest resources (often regardless of need or expense, since most patients bear little of the cost).Insurers may also attempt to constrain the costs of new treatments and drugs by arguing that they areexperimental or not medically necessary, but such arguments can be undermined if patients or theiradvocates can show enough evidence of their use in other comparable cases.
The Department of Health’s Certificate of Need process is the only current mechanism for directlylimiting expenditures on new or expanded facilities and technology. However, almost all applicationsare eventually approved (although there may be some sentinel effect) and a State commission iscurrently reevaluating the CON process. The earlier alternative of facility rate-setting is nowconsidered ineffective and has been abandoned by every state except Maryland.
Guidelines for care may cover treatments, technology, and drugs. In Britain and other countries,guidelines developed by NICE (National Institute for Health and Clinical Excellence) and similarprograms are used to establish standards for care and to determine whether national programs willpay for new drugs and treatments. In Seattle, the Puget Sound Health Alliance is working toencourage providers to follow diagnosis and treatment protocols for various chronic illnesses, toprescribe only cost-effective drugs, and to establish incentives for appropriate care.
Plan Details – A two-part strategy is proposed for controlling major resource expenditures: (1) revisethe CON process to tie it to a State health resource plan; and (2) create a mechanism for promulgatingguidelines for care, together with incentives for following the guidelines.
To make the CON process more effective, it should be revised so that it is limited to new facilitiesand large facility expansions, and tied to a State health facility resources plan developed and updatedperiodically by a commission comprising providers, insurers, payers, and consumers.
7
The health resources commission should also be responsible for setting guidelines for care, includingtreatments, technologies, and drugs. The commission would not conduct original research, but wouldreview and promulgate established protocols and—for technologies and drugs—cost-effectivenessstandards based on the work of recognized experts.
To provide an incentive for following the guidelines, any insurer doing business with the State wouldbe required to demonstrate that its reimbursement policies rewarded consistency with the guidelines.
Step 2—Guarantee Affordable Coverage for Employees and Dependents
Why is it Necessary? – While escalating costs are the primary cause of the growing population ofuninsured, just controlling costs won’t reduce the numbers. At best, cost controls alone will stabilizethe numbers of uninsured near today’s unacceptable levels. To come close to meeting the BlueRibbon Commission’s goal of “all Washingtonians will have access to health coverage,” action mustbe taken to provide coverage to those currently without it.
Discussion – Currently, Washington has between 600,000 and 800,000 uninsured (depending on thedata source). Of these, close to 100,000 are children, while the majority of the remainder are businessemployees or dependents (mostly, but not all, working for small businesses). Of these employees anddependents, an estimated 300,000 or more work for employers of ten or more employees.
Many of the employers not providing insurance indicate that they would like to offer coverage tobetter compete for employees, but believe insurance is too costly and premiums are increasing toofast. Originally, Basic Health was intended to provide affordable coverage for such small employers,but the unsubsidized part of the program suffered from adverse selection in attracting high cost casesand was abandoned by insurers.
In other states, Massachusetts’ 2006 legislation proposes to provide coverage by imposing a $295annual levy on employers not providing insurance. California’s SB2, enacted in 2003 but rolled backin a narrow referendum vote, would have imposed a levy to cover comprehensive benefits. AlthoughMassachusetts’ levy amount seems clearly inadequate, while California’s was unspecified and lackedany guarantee against future increases, both approaches appear to avoid the problems of ERISA.
Plan Details – As in Massachusetts and California, a levy on all but very small employers isproposed to cover costs of State-sponsored (or brokered) health insurance. To avoid these otherstates’ problems, the proposal is for a levy sufficient for affordable HSA-eligible high-deductiblecoverage, with levy rate increases limited by law to the CPI rate. The proposed levy would be basedon a percentage of payroll, imposed on employers with ten or more employees, except that allemployers already spending at least this amount—either by buying coverage directly from insurers orself-insuring—would be exempted. This approach is expected to be compliant with ERISA.
The levy rate (in the $100-$150 per month range) would be consistent with affordability estimatesmade by small businesses, and used to purchase coverage for employees and dependents through aState-sponsored plan. In the event that costs increase above the CPI rate, benefits would be reduced.
Employees (and dependents) of employers paying the levy would be guaranteed eligible for thelowest cost State-sponsored offering(s) at no additional premium cost. Part-time employees wouldhave the opportunity to buy-in to the full coverage. Employees wishing to enroll in other than thelowest cost plan would pay the difference between the lowest cost offering and their selected plan.
8
Basic Health would be rolled into the new plan, but as a “deductible subsidy” zero-premium planrather than continuing today’s premiums and premium subsidies, resulting in substantial savings tothe State as employers of Basic Health members contribute at the levy rate. These savings could beused to subsidize the costs of the new program.
Future expansion could occur as individuals and employees of businesses below the ten-employeelevel buy-in at the levy rate, along with some employers who currently purchase coverage for theiremployees but choose to migrate to the new program.
Step 3—Establish a central insurance “marketplace”
Why is it Necessary? -- A major weakness of today’s health care system is the way in whichinsurance is purchased, typically by employers rather than the insured, and often selected fromamong disparate offerings. The result is that many purchasers of insurance find coverage hard tocompare, while most consumers have little price sensitivity to either the insurance or subsequent care.
Discussion – The lack of a competitive market, in which insurers offer standard benefit packages thatpurchasers can choose on the basis of price, is a serious problem for small businesses and individuals.Although major employers—whether they self-insure or purchase coverage—are well equipped tonegotiate benefits and prices, others have no such advantages. From the insurers’ viewpoint, smallgroups and individuals present problems of costly administration and high health risk and are chargedaccordingly.
Various business groups and some states (including Washington) have attempted to solve theseproblems by creating their own “bulk purchasing” programs, but these have almost all failed becauseof selection bias and insufficient enrollment. The original unsubsidized component of Basic Health isan example: attracting high-cost users resulted in insurers raising rates, thereby discouraging newenrollment, and insurers ultimately abandoned the program.
Plan Details – It is proposed to create a new State-sponsored broker function offering standardized“no frills” coverage from multiple insurers, emphasizing prevention and quality care. The programwould initially be available to the more than 300,000 employees and dependents obtaining coverageas described in Step 2, and to enrollees in the existing Basic Health (which would be rolled in to thenew program). Future expansion would allow other smaller business employees and individuals toenroll, thereby achieving the Blue Ribbon Commission’s goal of access for all to affordable care.
The standard coverage would be comparable to that currently provided by Basic Health, but—for allexcept Basic Health enrollees—with a high deductible, designed to be eligible for Federal HSAqualification to maximize tax reduction options. Enrollees would pay no premiums for coverage fromthe insurer(s) offering the lowest cost to the State. Those selecting any option other than the lowestcost plan(s) would pay the cost differential. Basic Health enrollees would have their deductiblesreduced, rather than (as now) having premiums subsidized.
More generous coverage could also be offered as an option, with those choosing it paying theadditional cost differential.
Offering a standardized benefit package to the estimated 400,000-plus enrollees (including BasicHealth) should result in much lower administrative costs and more competitive premium rates than intoday’s small group and individual markets. Insurer risk will also be reduced since all those eligible
9
will be enrolled. (Anyone not selecting a specific insurer will be automatically enrolled in the lowestcost plan.) Cost-shifting from uninsured individuals will also be greatly reduced, since the number ofuninsured will be fewer.
Insurers would have to compete on price in order to participate, and continue to offer competitiveprices to retain enrollees (who would be free to switch insurers during open enrollment periods).Because only the Legislature would be able to change the levy rate, there would also be considerablepublic pressure on insurers and providers to hold down costs.
The benefit package—in order to be affordable—would not provide the comprehensive benefitsenvisioned by the 1993 Washington Health Care Commission. On the other hand, a high deductibleversion of the present Basic Health benefits would provide both preventive care and protectionagainst the overwhelming medical expenses that led to 40,000 bankruptcies in the Washington lastyear, as well as reducing the levels of bad debt and charity care that providers currently bear. It’s alsoconsistent with the traditional concept of insurance: protection against unexpected high cost events.
Step 4—Establish a children’s coverage mandate
Why is it Necessary? -- 100,000 Washington children are estimated to lack health coverage. Thesechildren are most likely to be from lower-income and minority groups, and—based on nationalstudies—suffer from more health problems than those insured.
Discussion – Reasons for the number of uninsured children include unavailability of employer-sponsored coverage, inability to pay the high cost of individual insurance, unfamiliarity withavailable State programs like Medicaid/SCHIP, transient family lifestyle, and lack of parentalresponsibility.
The implementation of Steps 2 and 3 above should significantly reduce the number of uninsuredchildren, as dependents of business employees gain coverage. Additional State and local governmentefforts to enroll low-income children in Medicaid/SCHIP may further reduce the number, but willstill leave some remainder without insurance. However, the cost of children’s coverage is relativelylow, and should be affordable to the parents of many or most of the remaining group.
Plan Details – It is proposed to mandate that all children in Washington have some basic level ofhealth care coverage. This is likely to involve requiring that insurers offer low-cost children-onlycoverage, some expansion (at least in terms of numbers) of Medicaid/SCHIP, and establishing rulesfor enforcement.
Traditionally, there has been little market for children-only insurance coverage, but the proposedchildren’s mandate should make such coverage more attractive to insurers.
Adding some enrollees to Medicaid/SCHIP should involve little increase in State costs, as cost-shifting is reduced and Federal government payments are increased.
While Washington cannot readily enforce a total health insurance mandate—unlike Massachusetts,which can use its state income tax structure for this purpose—it could set rules for children’scoverage. For example, just as school entry is dependent on compliance with immunization rules, itcould also be dependent on health care coverage.
10
Step 5—Provide adequate funding for an effective prevention program
Why is it Necessary? -- Prevention is almost always better than treatment. Whether in the form ofimmunization and other preventive care, healthier lifestyles, or more timely medical advice,prevention is likely to be a cost-effective investment. For example, according to the NationalCongress on Pre-Symptom Medicine, regular preventive care (e.g. mammograms, flu shots, prostateexams) could cut projected health care costs by fifty percent over the next ten years.
Discussion – The most recent United Health Foundation ranking of health status by state showed thatWashington—although ranked fifteenth—had suffered the second greatest health score declineamong the fifty states. Part of Washington’s failure to achieve a higher score was due to the very lowpercentage of health care dollars devoted to public health. On the other hand, Washington has one ofthe lowest rates of hospital inpatient days, suggesting that some limited prevention efforts have beeneffective.
Plan Details – A two-part strategy is proposed: (1) the State should require that effective preventivecare be included as part of the coverage for all State programs; (2) the State should fund an effectivepublic campaign to encourage healthy lifestyles.
Some preventive care is already included in existing benefits as a result of legislative mandates. Allsuch mandates should be reviewed for cost-effectiveness, perhaps using the Cost EffectivenessAnalysis registry developed at the Harvard Center for Risk Analysis; only the care determined to becost-effective should be included in State-sponsored benefits. To ensure that preventive care isprovided, incentives should be incorporated, so that—at a minimum—there is no cost to thebeneficiary, and perhaps a premium discount.
Health promotion efforts (for example, to discourage alcoholism, obesity, smoking, and automobileaccidents) must also be determined to be cost-effective, but almost certainly need more funding thanthat presently available. Campaigns such as the Washington Health Foundation’s “MakingWashington the Healthiest State in the Nation” are doomed to failure without adequate resources.
3. IMPLEMENTATION SCHEDULE
If Washington is to avoid huge increases in State health care costs and private sector insurancepremiums over the next five years, along with another jump in the numbers of uninsured, anaggressive implementation schedule will be necessary. The following is an outline schedule:
� February 2007 – Legislation enacted to create Health Resources Commission, establishbusiness levy, establish State-sponsored broker function, mandate children’s coverage, etc.
� July 2007 – Health Resources Commission staffed and funded
� January 2008 – State Health Resources Plan published; benefit package for State-sponsoredcoverage finalized
� March 2008 – Initial guidelines for care published
� July 2008 – State-sponsored broker function operational; businesses with 10 or moreemployees start to pay levy; employees and dependents enroll in State-sponsored plans

11
� January 2009 – Basic Health rolled in to State-sponsored broker coverage; children’scoverage mandatory
� January 2010 – All employees and dependents of very small businesses and individualseligible to buy-in to State-sponsored coverage.

Tab 8
2409 Pacific Ave SE, Olympia, WA 98501 phone 360-493-4550 fax 360-493-7708
September 1, 2006
Washington State Blue Ribbon Commission on Healthcare Costs and Access
Dear Governor Gregoire, Senator Thibaudeau and Honored Members:
Communities Connect congratulates the Commission’s efforts to creatively address the challenges facing the provision of health care in this state. We particularly appreciate the opportunity to respond to your request for proposal and continue to share our thinking on how the state can organize to provide a system of safety-net care that covers all people more cost effectively and with better outcomes.
Attached please find our community-based healthcare proposal, which calls for “achieving better health for everyone by reducing unnecessary costs and coordinating and leveraging care at the community level.” Our blueprint is for a three-phased community development model starting with the implementation of a statewide network of community healthcare collaboratives financed through the Community Healthcare Collaboratives Program. These collaboratives are the engine that then drives the implementation of Phase 2, where communities implement specific activities that reduce waste and improve care and outcomes for low-income people.
Once the prescribed activities are in place and sustainable, collaboratives are then in a position to organize for Phase 3, what we are calling, for the time being, Community Health Management Districts (CHMD). These CHMD’s are structured to capture the savings from the implementation of Phase 1 & 2 and to organize and finance healthcare for low-income people at the community or county level.
Phase 3 is still a conceptual model and we shared our most recent thinking with the Commission at our presentation to the members in July by sharing our “Community-Based Health Care Issue Paper, Draft #3.”Communities Connect will continue to refine this concept with its members over the next month with the goal of having a final paper available for your review later this fall.
Again, thank you for this unique opportunity to be part of the needed changes that can transform healthcare in Washington State. Please feel free to contact either one of us with any additional questions you might have.
Sincerely,
Sue Sharpe Kristen West Sam Selinger Chair, Communities Connect Officer, Communities Connect Vice Chair, Communities Connect Co-Director, Whatcom Alliance for Executive, CHOICE Regional Health Project Access Advisor, Spokane Healthcare Access Network County Medical Society Foundation
A community-based healthcare proposal:
“Achieving better health for everyone by reducing unnecessary costs
and coordinating and leveraging care at the community level”
Submitted to the Blue Ribbon Commission on Health Care Costs and Access
Final Draft
September 1, 2006
By Communities Connect
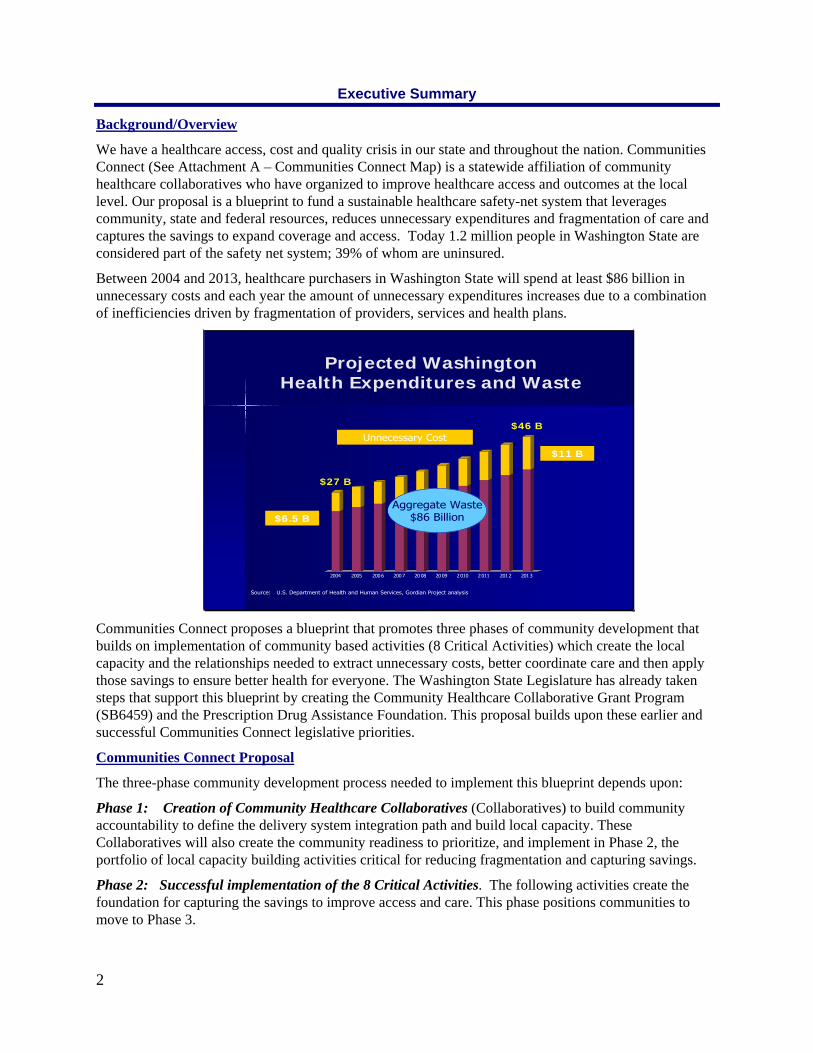
Executive Summary
Background/Overview
We have a healthcare access, cost and quality crisis in our state and throughout the nation. Communities Connect (See Attachment A – Communities Connect Map) is a statewide affiliation of community healthcare collaboratives who have organized to improve healthcare access and outcomes at the local level. Our proposal is a blueprint to fund a sustainable healthcare safety-net system that leverages community, state and federal resources, reduces unnecessary expenditures and fragmentation of care and captures the savings to expand coverage and access. Today 1.2 million people in Washington State are considered part of the safety net system; 39% of whom are uninsured.
Between 2004 and 2013, healthcare purchasers in Washington State will spend at least $86 billion in unnecessary costs and each year the amount of unnecessary expenditures increases due to a combination of inefficiencies driven by fragmentation of providers, services and health plans.
2004 2005 2006 2007 2008 2009 2010 2011 2012 2013
Projected WashingtonHealth Expenditures and Waste
Source: U.S. Department of Health and Human Services, Gordian Project analysis
$46 B
$27 B
Unnecessary Cost
$6.5 B
$11 B
Aggregate Waste$86 Billion
Communities Connect proposes a blueprint that promotes three phases of community development that builds on implementation of community based activities (8 Critical Activities) which create the local capacity and the relationships needed to extract unnecessary costs, better coordinate care and then apply those savings to ensure better health for everyone. The Washington State Legislature has already taken steps that support this blueprint by creating the Community Healthcare Collaborative Grant Program (SB6459) and the Prescription Drug Assistance Foundation. This proposal builds upon these earlier and successful Communities Connect legislative priorities.
Communities Connect Proposal
The three-phase community development process needed to implement this blueprint depends upon:
Phase 1: Creation of Community Healthcare Collaboratives (Collaboratives) to build community accountability to define the delivery system integration path and build local capacity. These Collaboratives will also create the community readiness to prioritize, and implement in Phase 2, the portfolio of local capacity building activities critical for reducing fragmentation and capturing savings.
Phase 2: Successful implementation of the 8 Critical Activities. The following activities create the foundation for capturing the savings to improve access and care. This phase positions communities to move to Phase 3.
2
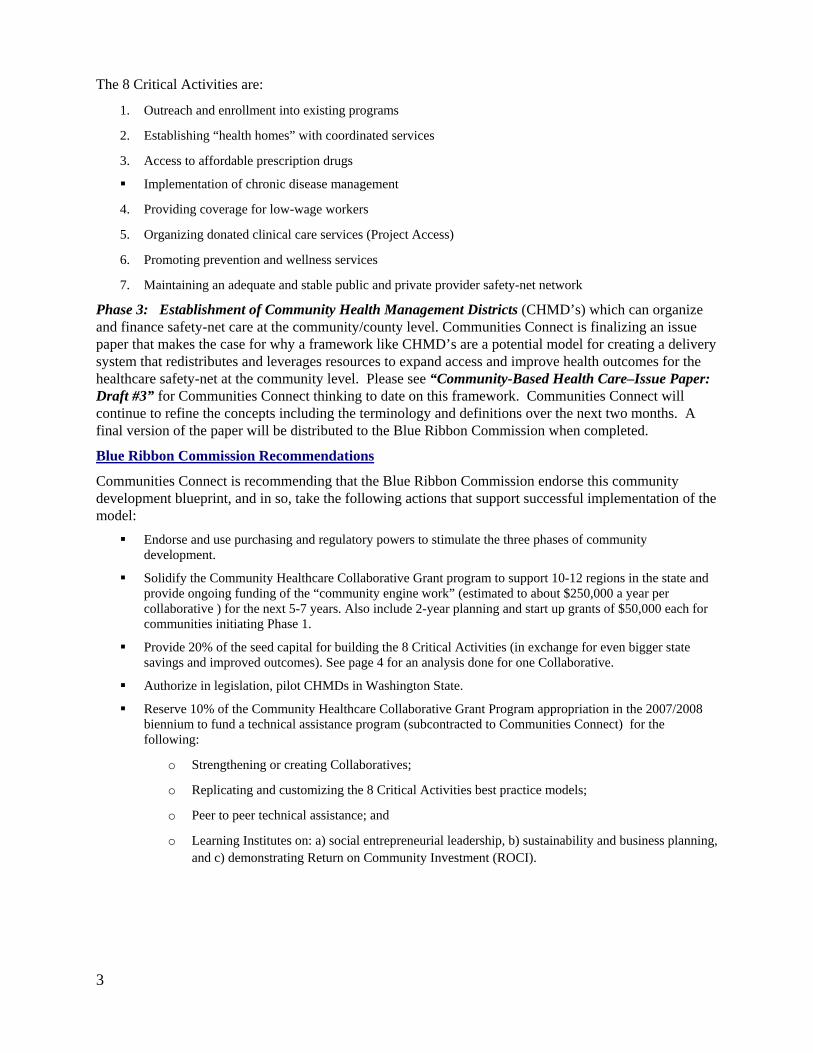
3
The 8 Critical Activities are:
1. Outreach and enrollment into existing programs
2. Establishing “health homes” with coordinated services
3. Access to affordable prescription drugs
Implementation of chronic disease management
4. Providing coverage for low-wage workers
5. Organizing donated clinical care services (Project Access)
6. Promoting prevention and wellness services
7. Maintaining an adequate and stable public and private provider safety-net network
Phase 3: Establishment of Community Health Management Districts (CHMD’s) which can organize and finance safety-net care at the community/county level. Communities Connect is finalizing an issue paper that makes the case for why a framework like CHMD’s are a potential model for creating a delivery system that redistributes and leverages resources to expand access and improve health outcomes for the healthcare safety-net at the community level. Please see “Community-Based Health Care–Issue Paper: Draft #3” for Communities Connect thinking to date on this framework. Communities Connect will continue to refine the concepts including the terminology and definitions over the next two months. A final version of the paper will be distributed to the Blue Ribbon Commission when completed.
Blue Ribbon Commission Recommendations
Communities Connect is recommending that the Blue Ribbon Commission endorse this community development blueprint, and in so, take the following actions that support successful implementation of the model:
Endorse and use purchasing and regulatory powers to stimulate the three phases of community development.
Solidify the Community Healthcare Collaborative Grant program to support 10-12 regions in the state and provide ongoing funding of the “community engine work” (estimated to about $250,000 a year per collaborative ) for the next 5-7 years. Also include 2-year planning and start up grants of $50,000 each for communities initiating Phase 1.
Provide 20% of the seed capital for building the 8 Critical Activities (in exchange for even bigger state savings and improved outcomes). See page 4 for an analysis done for one Collaborative.
Authorize in legislation, pilot CHMDs in Washington State.
Reserve 10% of the Community Healthcare Collaborative Grant Program appropriation in the 2007/2008 biennium to fund a technical assistance program (subcontracted to Communities Connect) for the following:
o Strengthening or creating Collaboratives;
o Replicating and customizing the 8 Critical Activities best practice models;
o Peer to peer technical assistance; and
o Learning Institutes on: a) social entrepreneurial leadership, b) sustainability and business planning, and c) demonstrating Return on Community Investment (ROCI).
4
Question #1 – What do you proposed be done to realize the vision and goals for Washington State established by the Blue Ribbon Commission?
The Communities Connect proposal to “Achieve Better Health for Everyone” supports the Blue Ribbon Commission’s Vision and Goal Statement by improving access, health outcomes and affordability through reducing unnecessary cost and fragmentation and coordinating services at the community level where the most effective interventions and system changes can be implemented.
This proposal targets the 1.2 million low-income residents in Washington State, which for the purposes of this proposal are defined as people age 65 and younger who are below 250% of federal poverty level. 39% of this population is uninsured and the rest are enrolled in a mix of hard to sustain government programs, such as Medicaid and Basic Health. About 75% of the uninsured group lives in a household where at least one adult works.
This proposal recommends the development of Community Healthcare Collaboratives throughout the state that will have unique differences, but will each be focused on a defined low-income population. These Collaboratives understand and embrace the need to focus on a better future, while simultaneously addressing the realities of a collapsing healthcare safety-net. They will demonstrate a commitment to changing how healthcare is delivered within their region so that it is more cost-effective and will have the capacity to implement the 8 Critical Activities in an integrated way that captures savings to provide access for the low income.
The 8 Critical Activities, once sustainable, create the local foundation for the larger delivery system restructuring to a Community Health Management District which is positioned to:
Fully fund prevention and primary medical, dental and mental healthcare for the low-income,
Establish medical or health homes,
Implement electronic health records,
Promote evidence-based treatment, and
Reward consumer stewardship and healthy behaviors, etc.
Phase 1: Establishing a statewide network of Community Healthcare Collaboratives In 2000 the Institute of Medicine published a report on the healthcare safety net called “America's Health Care Safety Net: Intact but Endangered.” In this report, they recommended the creation of Collaboratives to stabilize the healthcare safety-net. (See logic model in Attachment B). The federal government, Robert Wood Johnson Foundation and Kellogg responded to the recommendation by making a significant investment in seed capital for the creation of Collaboratives throughout the United States. There has been a second wave of communities (learning from the first wave) who have started Collaboratives by harnessing local dollars. An estimated 600 Collaboratives are in various stages of maturity nationwide.
Communities Connect sees the potential power of a statewide network of community healthcare collaborative regions through the newly created Community Healthcare Collaborative Grant Program administered by the Health Care Authority (HCA). These regions would be defined through the Collaborative’s creation process.
For purposes of this proposal Communities Connect defines a Collaborative as:
“An organization with a formal governance structure that represents a broad base of community partners including healthcare providers (private and public), health care purchasers, social services, consumers, business interests and local and state government agencies. A community healthcare collaborative collectively holds itself accountable at the local level to develop,
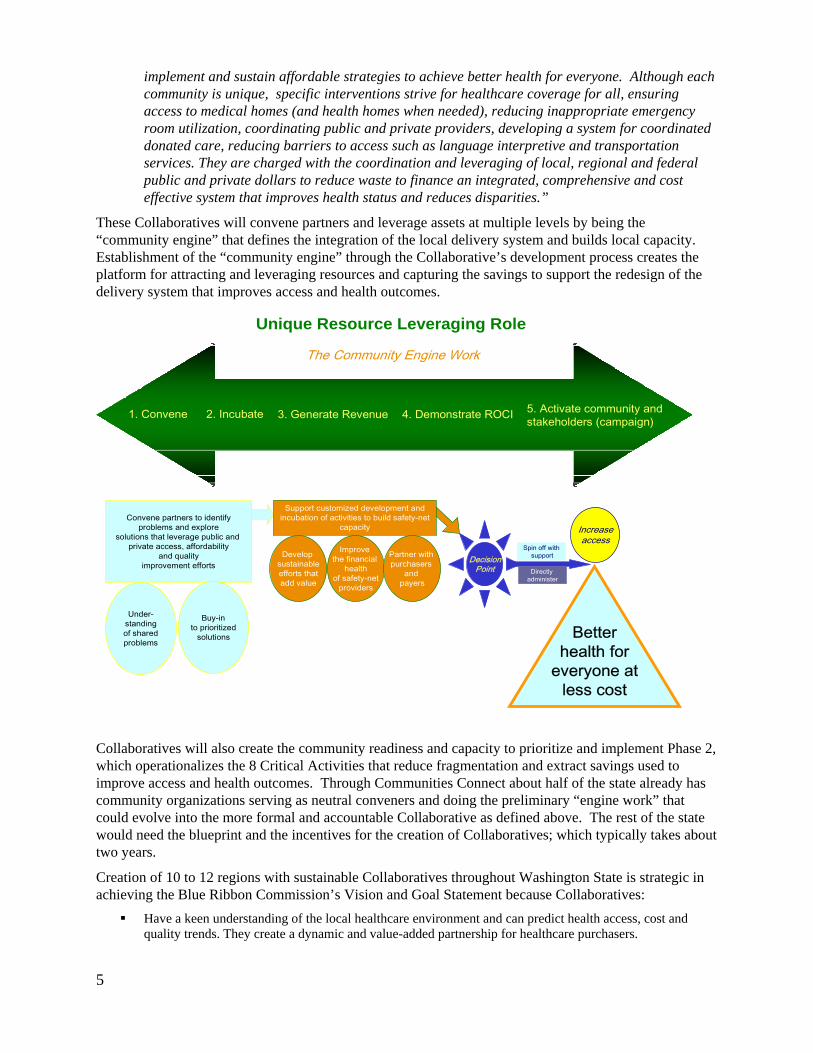
implement and sustain affordable strategies to achieve better health for everyone. Although each community is unique, specific interventions strive for healthcare coverage for all, ensuring access to medical homes (and health homes when needed), reducing inappropriate emergency room utilization, coordinating public and private providers, developing a system for coordinated donated care, reducing barriers to access such as language interpretive and transportation services. They are charged with the coordination and leveraging of local, regional and federal public and private dollars to reduce waste to finance an integrated, comprehensive and cost effective system that improves health status and reduces disparities.”
5
delivery system that improves access and health outcomes.
capacity to prioritize and implement Phase 2,
tet
10 to 12 regions with sustainable Collaboratives throughout Washington State is strategic in
st and
These Collaboratives will convene partners and leverage assets at multiple levels by being the “community engine” that defines the integration of the local delivery system and builds local capacity. Establishment of the “community engine” through the Collaborative’s development process creates the platform for attracting and leveraging resources and capturing the savings to support the redesign of the
Collaboratives will also create the community readiness and
Unique Resource Leveraging RoleUnique Resource Leveraging Role
which operationalizes the 8 Critical Activities that reduce fragmentation and extract savings used to improve access and health outcomes. Through Communities Connect about half of the state already has community organizations serving as neutral conveners and doing the preliminary “engine work” that could evolve into the more formal and accountable Collaborative as defined above. The rest of the stawould need the blueprint and the incentives for the creation of Collaboratives; which typically takes aboutwo years.
Creation ofachieving the Blue Ribbon Commission’s Vision and Goal Statement because Collaboratives:
Have a keen understanding of the local healthcare environment and can predict health access, coquality trends. They create a dynamic and value-added partnership for healthcare purchasers.
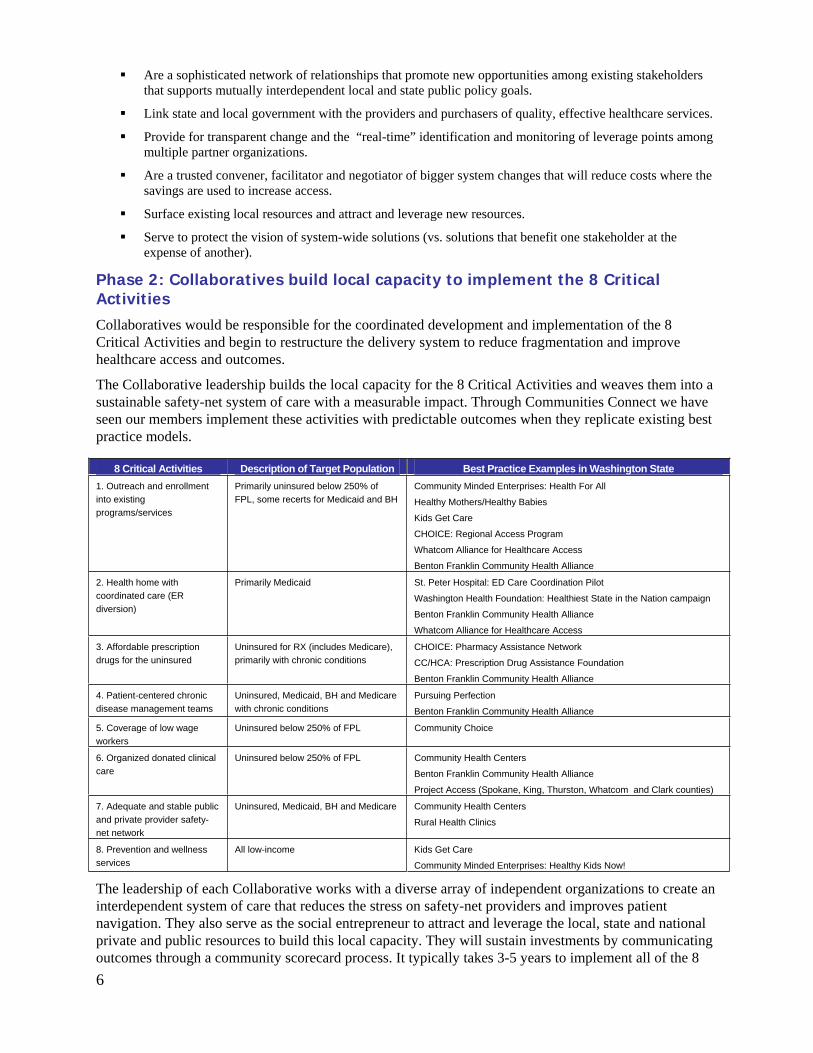
Are a sophisticated network of relationships that promote new opportunities among existing stakeholders that supports mutually interdependent local and state public policy goals.
Link state and local government with the providers and purchasers of quality, effective healthcare services.
Provide for transparent change and the “real-time” identification and monitoring of leverage points among multiple partner organizations.
Are a trusted convener, facilitator and negotiator of bigger system changes that will reduce costs where the savings are used to increase access.
Surface existing local resources and attract and leverage new resources.
Serve to protect the vision of system-wide solutions (vs. solutions that benefit one stakeholder at the expense of another).
Phase 2: Collaboratives build local capacity to implement the 8 Critical Activities Collaboratives would be responsible for the coordinated development and implementation of the 8 Critical Activities and begin to restructure the delivery system to reduce fragmentation and improve healthcare access and outcomes.
The Collaborative leadership builds the local capacity for the 8 Critical Activities and weaves them into a sustainable safety-net system of care with a measurable impact. Through Communities Connect we have seen our members implement these activities with predictable outcomes when they replicate existing best practice models.
8 Critical Activities Description of Target Population Best Practice Examples in Washington State 1. Outreach and enrollment into existing programs/services
Primarily uninsured below 250% of FPL, some recerts for Medicaid and BH
Community Minded Enterprises: Health For All
Healthy Mothers/Healthy Babies
Kids Get Care
CHOICE: Regional Access Program
Whatcom Alliance for Healthcare Access
Benton Franklin Community Health Alliance
2. Health home with coordinated care (ER diversion)
Primarily Medicaid St. Peter Hospital: ED Care Coordination Pilot
Washington Health Foundation: Healthiest State in the Nation campaign
Benton Franklin Community Health Alliance
Whatcom Alliance for Healthcare Access
3. Affordable prescription drugs for the uninsured
Uninsured for RX (includes Medicare), primarily with chronic conditions
CHOICE: Pharmacy Assistance Network
CC/HCA: Prescription Drug Assistance Foundation
Benton Franklin Community Health Alliance
4. Patient-centered chronic disease management teams
Uninsured, Medicaid, BH and Medicare with chronic conditions
Pursuing Perfection
Benton Franklin Community Health Alliance
5. Coverage of low wage workers
Uninsured below 250% of FPL Community Choice
6. Organized donated clinical care
Uninsured below 250% of FPL Community Health Centers
Benton Franklin Community Health Alliance
Project Access (Spokane, King, Thurston, Whatcom and Clark counties)
7. Adequate and stable public and private provider safety-net network
Uninsured, Medicaid, BH and Medicare Community Health Centers
Rural Health Clinics
8. Prevention and wellness services
All low-income Kids Get Care
Community Minded Enterprises: Healthy Kids Now!
The leadership of each Collaborative works with a diverse array of independent organizations to create an interdependent system of care that reduces the stress on safety-net providers and improves patient navigation. They also serve as the social entrepreneur to attract and leverage the local, state and national private and public resources to build this local capacity. They will sustain investments by communicating outcomes through a community scorecard process. It typically takes 3-5 years to implement all of the 8 6
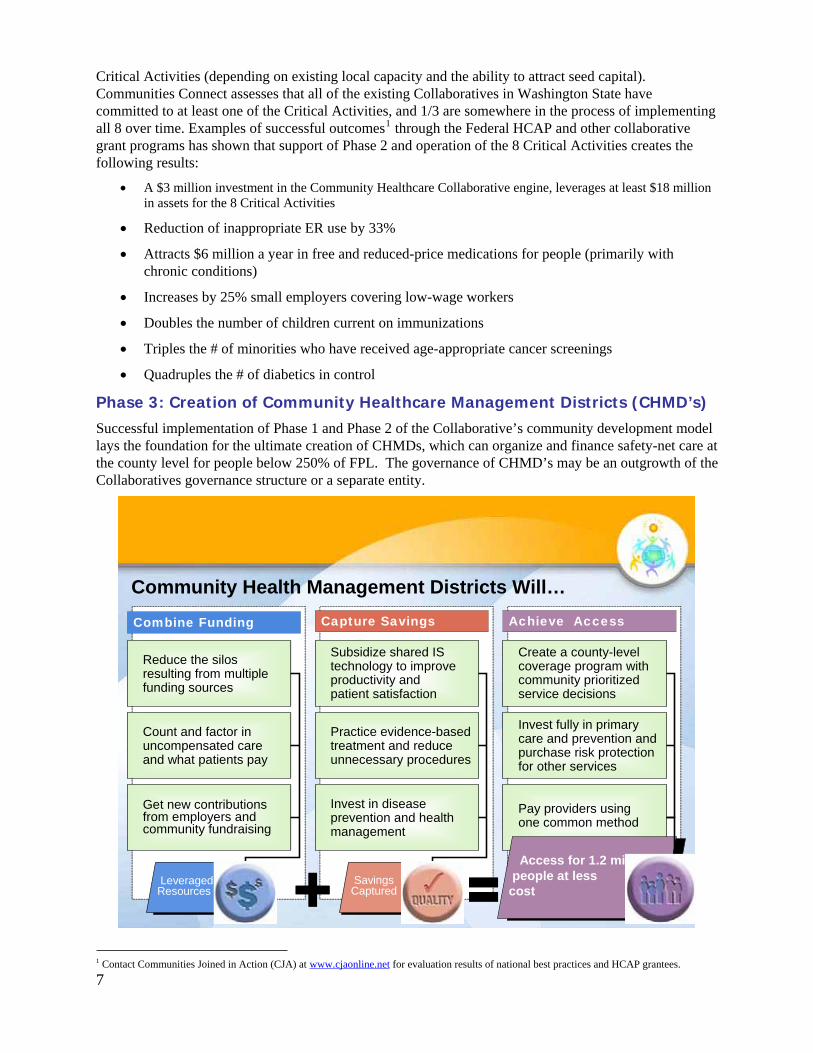
Critical Activities (depending on existing local capacity and the ability to attract seed capital). Communities Connect assesses that all of the existing Collaboratives in Washington State have committed to at least one of the Critical Activities, and 1/3 are somewhere in the process of implementing all 8 over time. Examples of successful outcomes1 through the Federal HCAP and other collaborative grant programs has shown that support of Phase 2 and operation of the 8 Critical Activities creates the following results:
A $3 million investment in the Community Healthcare Collaborative engine, leverages at least $18 million in assets for the 8 Critical Activities
Reduction of inappropriate ER use by 33%
Attracts $6 million a year in free and reduced-price medications for people (primarily with chronic conditions)
Increases by 25% small employers covering low-wage workers
Doubles the number of children current on immunizations
Triples the # of minorities who have received age-appropriate cancer screenings
Quadruples the # of diabetics in control
Phase 3: Creation of Community Healthcare Management Districts (CHMD’s) Successful implementation of Phase 1 and Phase 2 of the Collaborative’s community development model lays the foundation for the ultimate creation of CHMDs, which can organize and finance safety-net care at the county level for people below 250% of FPL. The governance of CHMD’s may be an outgrowth of the Collaboratives governance structure or a separate entity.
Community Health Management Districts Will…
Combine Funding Capture Savings Achieve Access
Practice evidence-based treatment and reduce unnecessary procedures
Invest in disease prevention and health management
Invest fully in primary care and prevention and purchase risk protection for other services
Pay providers using one common method
Subsidize shared IS technology to improve productivity and patient satisfaction
SavingsCaptured
Leveraged Resources
Access for 1.2 millpeople at less
cost
Create a county-levelcoverage program with community prioritized service decisions
Get new contributions from employers and community fundraising
Count and factor in uncompensated care and what patients pay
Reduce the silos resulting from multiple funding sources
71 Contact Communities Joined in Action (CJA) at www.cjaonline.net for evaluation results of national best practices and HCAP grantees.
As mentioned in the Executive Summary, Communities Connect continues to develop this concept but we believe that Community Healthcare Collaboratives can serve as the platform for the creation of CHMD’s that can:
Fully fund the expanded definition of clinical prevention, pharmaceuticals, and primary medical, dental and mental healthcare for the target population;
Better organize the delivery system through major cost-saving interventions that reduce fragmentation, such as subsidized and shared information systems, disease prevention and health management, and evidence-based treatment;
Finance an organized delivery system that reduces funding silos, documents and recognizes donated healthcare services and includes employer contributions;
Capture the savings from the implementation of the above strategies and use them to cover the uninsured and stabilize safety-net providers using a common payment method;
Reward health and consumer stewardship;
Support robust community involvement process;
Evaluate and communicate outcomes that sustain investment; and
Link state programs and funding to effective care delivery at the local level.
It takes a community 2 years under active development to have the political readiness, local capacity, inter-operability among providers and formal accountabilities to successfully administer a Community Health Management District (CHMD).
Recommendations to the Blue Ribbon Commission
1. Endorse and use purchasing and regulatory powers to stimulate the three phases of community development.
2. Solidify the Community Healthcare Collaborative Grant program to support 10-12 regions in the state and provide ongoing funding of the “engine work” (estimated to about $250,000 a year per collaborative) for the next 5-7 years. Also include 2-year planning and start up grants of $50,000 each for communities initiating Phase 1.
3. Provide 20% of the seed capital for building the 8 Critical Activities (in exchange for even bigger state savings). One five-county region has preliminary estimates that a $20 million investment in seed capital to implement the 8 Critical Activities will generate $88 million in savings within 3 years. Based on these early estimates, a $4 million investment from the state (20% of $20 million) can generate significant savings.
4. Authorize in legislation, pilot CHMDs in Washington State.
5. Reserve 10% of the Community Healthcare Collaborative Grant Program appropriation in the 2007/2008 biennium to fund a technical assistance program (subcontracted to Communities Connect) for the following:
Strengthening or creating Collaboratives;
Replicating and customizing the 8 Critical Activities best practice models;
Peer to peer technical assistance; and
Learning Institutes on: a) social entrepreneurial leadership, b) sustainability and business planning, and c) demonstrating Return on Community Investment (ROCI).
8
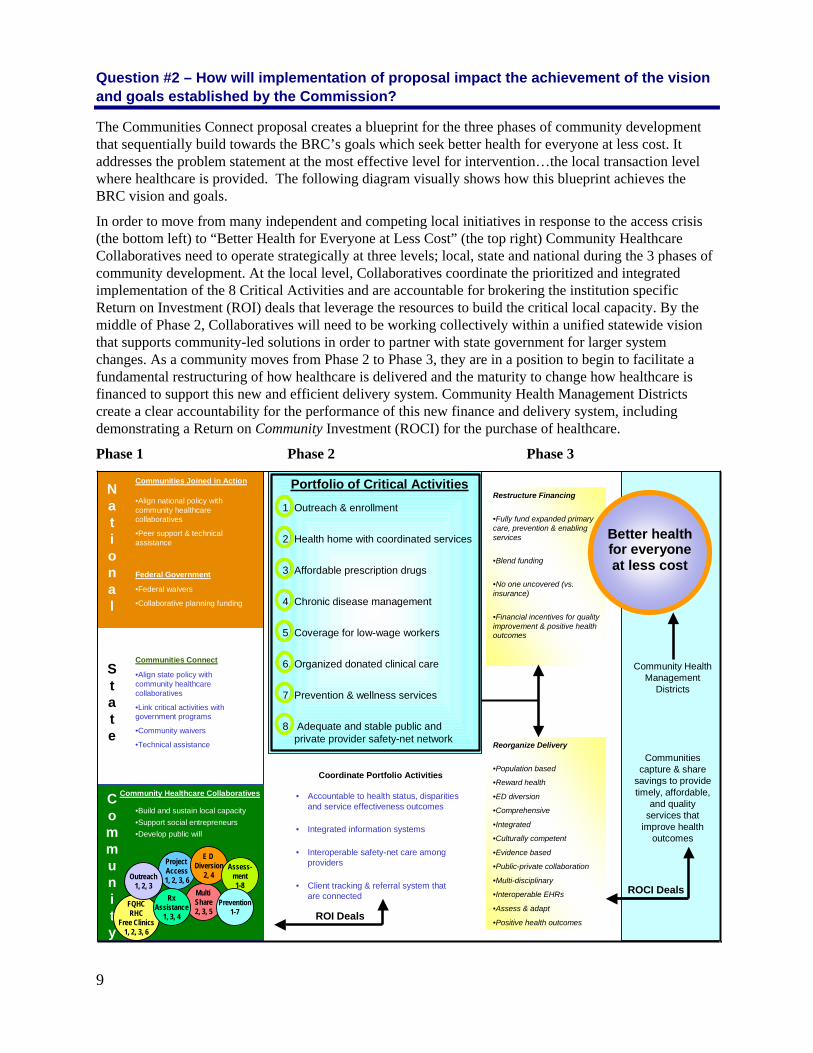
Question #2 – How will implementation of proposal impact the achievement of the vision and goals established by the Commission?
The Communities Connect proposal creates a blueprint for the three phases of community development that sequentially build towards the BRC’s goals which seek better health for everyone at less cost. It addresses the problem statement at the most effective level for intervention…the local transaction level where healthcare is provided. The following diagram visually shows how this blueprint achieves the BRC vision and goals.
In order to move from many independent and competing local initiatives in response to the access crisis (the bottom left) to “Better Health for Everyone at Less Cost” (the top right) Community Healthcare Collaboratives need to operate strategically at three levels; local, state and national during the 3 phases of community development. At the local level, Collaboratives coordinate the prioritized and integrated implementation of the 8 Critical Activities and are accountable for brokering the institution specific Return on Investment (ROI) deals that leverage the resources to build the critical local capacity. By the middle of Phase 2, Collaboratives will need to be working collectively within a unified statewide vision that supports community-led solutions in order to partner with state government for larger system changes. As a community moves from Phase 2 to Phase 3, they are in a position to begin to facilitate a fundamental restructuring of how healthcare is delivered and the maturity to change how healthcare is financed to support this new and efficient delivery system. Community Health Management Districts create a clear accountability for the performance of this new finance and delivery system, including demonstrating a Return on Community Investment (ROCI) for the purchase of healthcare.
Phase 1 Phase 2 Phase 3
National
ROCI Deals
State
Community
Communities Joined in Action
•Align national policy with community healthcare collaboratives
•Peer support & technical assistance
Federal Government
•Federal waivers
•Collaborative planning funding
Communities Connect
•Align state policy with community healthcare collaboratives
•Link critical activities with government programs
•Community waivers
•Technical assistance
Community Healthcare Collaboratives
•Build and sustain local capacity•Support social entrepreneurs•Develop public will
Portfolio of Critical Activities
1. Outreach & enrollment
2. Health home with coordinated services
3. Affordable prescription drugs
4. Chronic disease management
5. Coverage for low-wage workers
6. Organized donated clinical care
7. Prevention & wellness services
8. Adequate and stable public and private provider safety-net network
FQHCRHC
Free Clinics1, 2, 3, 6
Multi Share2, 3, 5
Project Access1, 2, 3, 6
Coordinate Portfolio Activities
• Accountable to health status, disparities and service effectiveness outcomes
• Integrated information systems
• Interoperable safety-net care among providers
• Client tracking & referral system that are connected
Community Health Management
Districts
Communities capture & share
savings to provide timely, affordable,
and quality services that
improve health outcomes
RxAssistance
1, 3, 4 ROI Deals
E D Diversion
2, 4Assess-
ment1-8
Prevention1-7
Outreach1, 2, 3
Restructure Financing
•Fully fund expanded primary care, prevention & enabling services
•Blend funding
•No one uncovered (vs. insurance)
•Financial incentives for quality improvement & positive health outcomes
Reorganize Delivery
•Population based
•Reward health
•ED diversion
•Comprehensive
•Integrated
•Culturally competent
•Evidence based
•Public-private collaboration
•Multi-disciplinary
•Interoperable EHRs
•Assess & adapt
•Positive health outcomes
Better healthfor everyoneat less cost
9
10
Question #3 – Is your proposal modeled after an existing policy or program within Washington or elsewhere?
As mentioned earlier in the proposal the Community Healthcare Collaborative blueprint is modeled after and builds on the successful work of the federal Healthy Communities Access Program (HCAP), Robert Wood Johnson grants and Kellogg initiatives. Communities Joined in Action is a national organization that promotes the implementation of this model throughout the country.
Question #4 – Will your proposal impose costs on individuals, businesses and government? Will the costs be time-limited or on-going? Can you estimate how much these costs will be or suggest how such an estimate could be made? How much if any of these costs will be offset by corresponding savings?
Given the blueprint we are recommending, this is a difficult question to answer. In Phase 1, we are asking for government to use the Community Healthcare Collaborative Grant Program to partially fund the creation or evolution of a statewide network of regional Collaboratives (of which $2 in local resource will match each $1 of state investment). In Phase 2, we’re asking for government to provide one-time seed capital for 20% of the development and implementation costs of the 8 Critical Activities, of which the Collaboratives would need to leverage the remaining 80%. In return, this will generate savings for state purchasers and attract new revenue from employers who don’t currently cover their low-wage workers (and to a lesser extent, collect revenue from employees and individuals). One geographic region of the state with 425,000 residents (94,000 of whom are in the target population) has preliminary estimates that it would cost $20 million over three years to fully implement the 8 Critical Activities. 20% of that investment would be one-time state government investment of $4 million over three years. As a result of this investment, $88 million in savings would be captured; half of which would go back to the Collaborative to sustain the operation of the 8 Critical Activities and the other half ($44 million) would accrue to healthcare purchasers. Communities Connect is in the process of refining these estimates and cost savings for a statewide network of Collaboratives. We will share our analysis with the Commission when it is complete. In addition, CHOICE Regional Health Network’s Sustainable Healthcare Access Council (SHAC) has been working for several years to define coverage and price out the cost and savings that a CHMD might achieve. This analysis for one five-county region of the state is available to the Commission upon request.
Question #5 – How does your proposal reflect collaborations among various stakeholders? Which stakeholders have endorsed it?
The concept was launched at the national level and has been reworked within the state by the Sustainable Healthcare Access Council (SHAC) and Communities Connect members. Communities Connect represents an affiliation of Collaboratives throughout the state who have endorsed this concept. Present members include:
Benton – Franklin Community Health Alliance (Benton and Franklin Counties) CHOICE Regional Health Network (Grays Harbor, Mason, Thurston, Pacific & Lewis Counties) Community Choice Healthcare (Okanogan, Chelan and Douglas Counties) Community Minded Enterprises (Ferry, Stevens, Pend Oreille, Lincoln, Spokane, Adams, Whitman, Columbia, Garfield and Asotin Counties) Human Links Foundation Kids Get Care (Snohomish, King and Pierce Counties) King County Project Access Spokane Project Access Thurston/Mason Medical Society Whatcom Alliance for Healthcare Access Washington Health Foundation
11
Question #6 – What are the obstacles to implementing your proposal? Who will object to it and why? How do you suggest these objections be addressed?
The initial organizing of the stakeholders and partners in the creation of Community Healthcare Collaboratives requires a neutral convener and the establishment of a shared vision so that the partners can take steps to build trust on which they can take collective action to make the changes needed to transform the community healthcare delivery system. Although most partners are disillusioned with the existing healthcare system where resources continue to decline, they have been positioned to compete for those resources with a focus on institutional survival as opposed to being part of larger system change. Changing this dynamic is the ultimate challenge of Collaboratives.
The Community Healthcare Collaborative model is organized at the local level where most partners are prepared to work together to make the needed changes for the win-win goal of improving the system for people in their own community. Stakeholders are willing to make compromises at the local level that they may not be able to make at the state or national level. Secondly, Collaboratives create very real and measurable successes through implementation of the 8 Critical Activities. Those successful outcomes demonstrate that the partners can make meaningful improvements in a system that so many times seems too complex and beyond their grasp. It also motivates them and strengthens their commitment to make greater and more sustainable improvements.
Phase 1 and Phase 2 of the community collaborative development model is easier to implement than Phase 3 which creates Community Health Management District’s, because CHMD’s impact funding streams and the need to co-mingle resources. Although these issues as they relate to public and private dollars are significant the ability to demonstrate cost savings and the improvements that can be made in health access and outcomes lay a strong foundation for addressing these more complex resource issues.

Appendix A – Communities Connect Map
ADAMS
ASOTIN
CHELANCLALLAM
CLARK
COLUMBIACOWLITZ
DOUGLAS
FERRY
GARFIELD
GRANT
GRAYS
HARBOR
ISLAND
JEFFERSON
KING
KITSAP
KITTITAS
KLICKITAT
LEWIS
LINCOLN
MASON
OKANOGAN
PACIFIC
PEND
OREILLE
PIERCE
SAN JUAN
SKAGIT
SKAMANIA
SNOHOMISH
SPOKANE
STEVENS
THURSTON
WAHKIAKUMWALLA WALLA
WHATCOM
WHITMAN
YAKIMA
Kids Get Care
Community-minded enterprises
CHOICE Regional Health Network Spokane County Medical Society Foundation
King County Project
Community Choice Healthcare
Whatcom Alliance for Healthcare Access
Thurston County Medical Society
Benton-Franklin Community Health Alliance
Washington Health Foundation
HumanLinks Foundation
BENTON
FRANKLIN
12
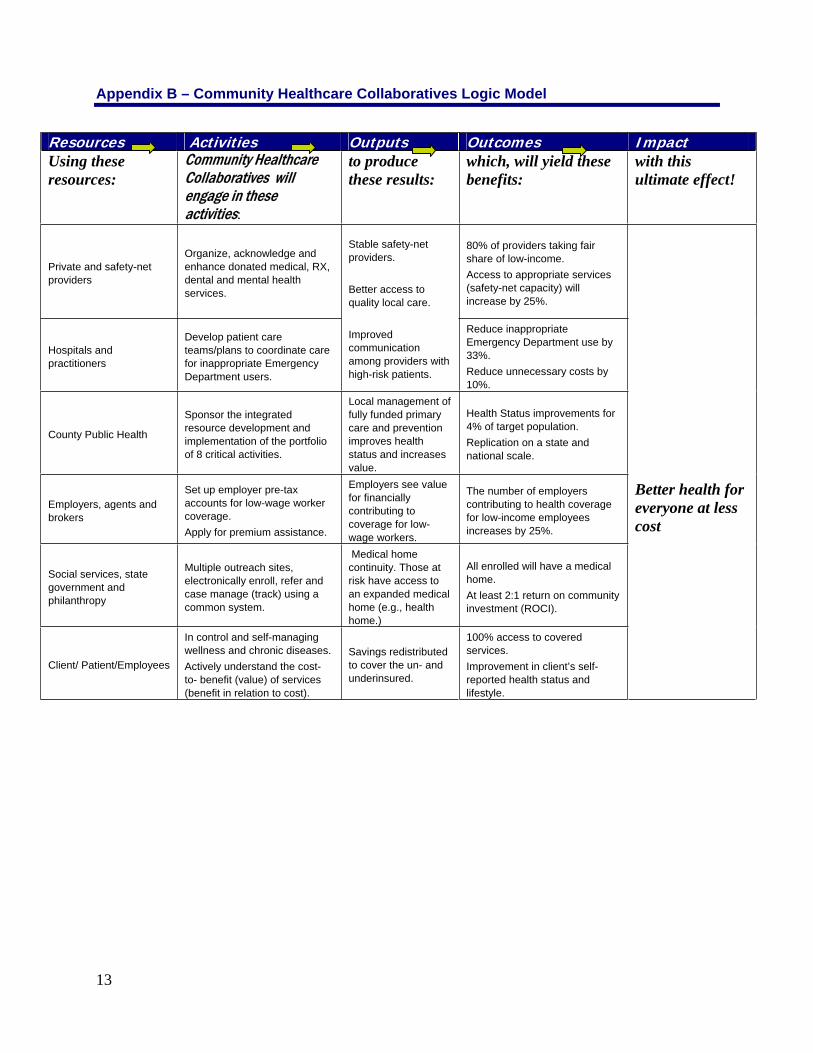
Appendix B – Community Healthcare Collaboratives Logic Model
Resources Activities Outputs Outcomes Impact Using these resources:
Community Healthcare Collaboratives will engage in these activities:
to produce these results:
which, will yield these benefits:
with this ultimate effect!
Private and safety-net providers
Organize, acknowledge and enhance donated medical, RX, dental and mental health services.
80% of providers taking fair share of low-income. Access to appropriate services (safety-net capacity) will increase by 25%.
Hospitals and practitioners
Develop patient care teams/plans to coordinate care for inappropriate Emergency Department users.
Stable safety-net providers.
Better access to quality local care.
Improvedcommunicationamong providers with high-risk patients.
Reduce inappropriate Emergency Department use by 33%.Reduce unnecessary costs by 10%.
County Public Health
Sponsor the integrated resource development and implementation of the portfolio of 8 critical activities.
Local management of fully funded primary care and prevention improves health status and increases value.
Health Status improvements for 4% of target population. Replication on a state and national scale.
Employers, agents and brokers
Set up employer pre-tax accounts for low-wage worker coverage.Apply for premium assistance.
Employers see value for financially contributing to coverage for low-wage workers.
The number of employers contributing to health coverage for low-income employees increases by 25%.
Social services, state government and philanthropy
Multiple outreach sites, electronically enroll, refer and case manage (track) using a common system.
Medical home continuity. Those at risk have access to an expanded medical home (e.g., health home.)
All enrolled will have a medical home.At least 2:1 return on community investment (ROCI).
Client/ Patient/Employees
In control and self-managing wellness and chronic diseases. Actively understand the cost- to- benefit (value) of services (benefit in relation to cost).
Savings redistributed to cover the un- and underinsured.
100% access to covered services. Improvement in client’s self-reported health status and lifestyle.
Better health for everyone at less cost
13
Community-Based Health Care Issue Paper: Draft #3
Communities Connect
September 1, 2006
Table of Contents
Description of the Problem .................................................................... 4
We Spend Too Much on Unnecessary Care.............................................. 4
Health Care Needs to be Delivered Differently......................................... 4
People Can’t Afford Their Prescription Drugs.......................................... 4
People Who Work Are Uninsured and Don’t Have Access...................... 4
Consumer Stewardship .............................................................................. 4
Delivery System ........................................................................................ 5
We Need New Approaches To Access...................................................... 5
Project Design .......................................................................................... 6
Target Population and Number of People to Be Served............................ 6
Community Collaboratives are the Builders of Local Capacity ......... 7
Community Collaboratives are the Means by Which to Achieve
Better Health Care for More People for Less Cost.................................... 8
Washington Community Collaboratives by Stages of Development ........ 8
Principle 1: Stabilize the Safety-Net .................................................... 9
Principle 2: Create Ways for Employers to Financially Contribute.... 9
Principle 3: Enroll Everyone in a Medical Home, Starting with
Children ........................................................................... 9
Measurable and Predictable Outcomes ............................................... 10
Logic Model for Illustrative Activities of a Community Health
Management District................................................................................ 11
Community Health Management Districts Will Fully Fund Primary Care and Clinical Prevention ................................................ 11
Community Health Management Districts Will be the Pharmaceutical Safety-Net ................................................................... 12
Community Health Management Districts will Find Innovative,
Long-term Solutions to Funding, Acquiring and Distributing
Affordable Medications to Those Most in Need ..................................... 13
Context & Elements of a Community-Wide Pharmaceutical Access
Enterprise................................................................................................. 15
Community Health Management Districts Will Deliver Medical, Dental and Mental Health Care Differently........................................ 16
2
Community Health Management Districts Will Redistribute Savings to Cover the Uninsured ........................................................... 17
Projected Washington Health Expenditures and Waste .......................... 18
Washington State Health Care Overview................................................ 19
Community Health Management Districts Financial Model ............ 19
Community Health Management district: Schematic with
Illustrative Guarantees............................................................................. 20
Community Health Management Districts Will Increase Employer Participation........................................................................................... 20
A Spectrum of Employer Participation Possibilities for %100 Access
Model....................................................................................................... 21
Community Health Management Districts Will Retain an Adequate Network of Providers ............................................................................ 22
Community Health Management Districts Will Be a New Local Entity ............................................................................................ 22
Multiple Public and Private Options for Governance and
Accountability to Best Augment Local Capacity in Place ...................... 22
Community Health Management District Guarantees............................. 23
Community Health Management Districts’ Health Interventions........... 23
Possible Tension Points to Resolve with State Agencies ........................ 24
Phase In an Innovative Statewide Solution ......................................... 25
Community Health Works and Is Innovative at Multiple Levels............ 25
3
Community Based Health Care Description of the Problem
We Spend Too Much on Unnecessary Care The answer to the health care crisis can’t be to just pump more money into the current system. U.S. spending on health care per capita continues to be the highest in the world by huge margins, with little evidence of improved health outcomes. Changing how health care is delivered is one of the most crucial activities of community collaboratives because it has the highest potential to improve quality, reduce costs and increase access. In Washington State, we spend 23.8% more per capita on health care than Utah, the most efficient state (this data has not been adjusted for potential differences in age, sex or reimbursement rates). The only way we will reduce the trend line for health care cost in Washington is if we deliver care differently, more effectively and reduce the number of uninsured. While uninsured people get less care, the care they do receive is typically fragmented and inefficient.
Health Care Needs to be Delivered Differently The only way we will be able to deliver health care differently is if we have integrated community health systems backed by appropriate technology. These community health care systems are far more likely than purchasing groups or payers to accomplish relationship-based patient care, evidence-based selection of diagnostic and treatment modalities, team care coordination, and ongoing peer-based improvement of both clinical and business processes.
People Can’t Afford Their Prescription Drugs While only one aspect of a much more complex problem, affordable access to medications is a particular visible and urgent issue right now. This paper includes extended discussion of pharmaceutical access due to its high salience.
People Who Work Are Uninsured and Don’t Have Access The way we will dramatically reduce the number of uninsured in the current situation is if we reduce the unnecessary costs and redistribute those savings to cover the uninsured. Since 75% of the uninsured live in a home where at least one adult works, we need to involve employers in coverage solutions that “make cents” to them. Small employers cannot afford the full cost of coverage for low-wage workers, so we will need to better leverage public premium assistance funds with what small employers can contribute and maximize that leverage with pre-tax options to pay for primary care and prevention services. (See the Communities Connect reference paper entitled: “Leveraging Government Funds with Pre-Tax Accounts and Tax Credits to Increase Small Employer’s Financial Contribution for Low-Wage Worker Coverage”).
Consumer Stewardship The way health care is financed isolates all consumers from the need and ability to be wise and prudent stewards of their body and health services. We believe that most people below 250% of federal poverty are able and willing to be better consumer stewards and we want to create a health care delivery system that makes this stewardship accountability visible, easy and rewarding.
4
Delivery System Our outcomes in the United States are poor because the current service delivery system is so anecdotal, complicated, fragmented, and eroded that clients have come to experience the system itself as a barrier to overcome in order to access care rather than a consistent, familiar, and seamless extension of how health care works. Identifying a consistent location of care is increasingly difficult even for patients covered by Medicaid and Basic Health and more difficult still for the uninsured. The challenges of finding a stable medical home make it difficult for patients to cultivate the trusting, ongoing relationship with a health care provider associated with an increased sense of personal responsibility and ultimately improved health outcomes. Health care delivery is local and the only way these changes will happen is if local communities are in charge and have greater accountability for the value of the health care dollar being spent. Since pricing future health expenditures is based on actuarial models tied to old delivery system models that we know don’t work well enough, we will be breaking new ground with trying to predict the financial impacts of delivering community based health care differently and more efficiently. It will be wise to be conservative in predicting the impact of changes, but we should also challenge the actuarial analysis of such change, since this arm of science (while well equipped to predict the impacts of the status quo) is ill prepared to deal with a future model of change.
We Need New Approaches to Access In the last two years, we’ve seen a dramatic increase in the number of low-income people whose lives will be compromised due to a lack of health care access. The health safety-net is crumbling before our eyes:
1. Safety net providers (hospitals, private-practice practitioners, Community Health Centers) are stressed to the point of operational instability.
2. More and more employers aren’t able to offer affordable coverage to low-wage workers.
3. Low-income people cannot find and keep a medical home.
4. The cost of care is too high. Where savings are achieved, they are notredistributed back into the community to cover the uninsured, so the number of uninsured is on the rise.
5. The quality of care, measured as ability to deliver good healthcare outcomes across the population, is not acceptable and the current over-specialization and inefficiencies are not sustainable (or result in unacceptable public trade-offs).
6. Consumers are isolated from the value equation in personal health decisions and there is no process for a convergence of people’s values at the community level for “what health care services are a right and where do we set limits?”
Project Design We believe we can deliver better health care for more people at less cost by formalizing community collaboratives throughout Washington State who will be “in action” on six interdependent principles: 1) Stabilize the safety net of hospitals and practitioners who provide care to the low-income and uninsured; 2) Create flexible and attractive ways for
5
employers to financially contribute towards coverage for low-wage workers; 3) Enroll people with limited incomes in a medical home, starting with children; 4) Deliver evidence-based and patient-focused care through health teams; 5) Reduce costs and redirect savings to cover more people; 6) Purchase services of greater value to the community through Community Health Management Districts (CHMDs). The first three principles build local capacity for a coordinated delivery system. While communities start in different places, within three years, a portfolio of critical activities begin to emerge.
Target Population and Number of People to Be Served Each community-based health care access demonstration will have some differences, but each is built on a defined low-income population, a commitment to change and a set of linked initiatives designed to build on local assets while addressing both the common issues of a collapsing safety net and unique local issues. The following information from the 100% Access Project in Grays Harbor, Lewis, Mason, Pacific and Thurston Counties (CHOICE Regional Health Network) is illustrative.
There are 425,000 people who live in this five county region. 135,000 (32%) of them are under 65 years of age and have low-income (below 250% of federal poverty) About 50,000 of them already have coverage through their employers, federal or state disability status, or other miscellaneous sources. The remaining 85,000 people are the 100% Access Project’s target population, of whom 35% are currently uninsured (about 30,000) and 65% are enrolled in a mix of unstable government programs, such as Medicaid and Basic Health. About 75% of the uninsured group lives in a household where at least one adult works. Residents of this region tend to be sicker and poorer than people who live in other parts of Washington. There also has been a 126% increase in Latinos over the last ten years (170% in the 4 rural counties), many of whom know only limited English.
A portfolio of initiatives, all aligned with the 100% Access Project, impact on an estimated 27% of the target population in the first year and 55% by the third year of a Community Health Management Districts (CHMDs) start-up period. By the end of three years, these communities can have the capacity and volume to become Community Health Management Districts capable of providing comprehensive, sustainable, and evidence-based care for all 85,000 low-income residents in the target population through an integrated regional approach.
6
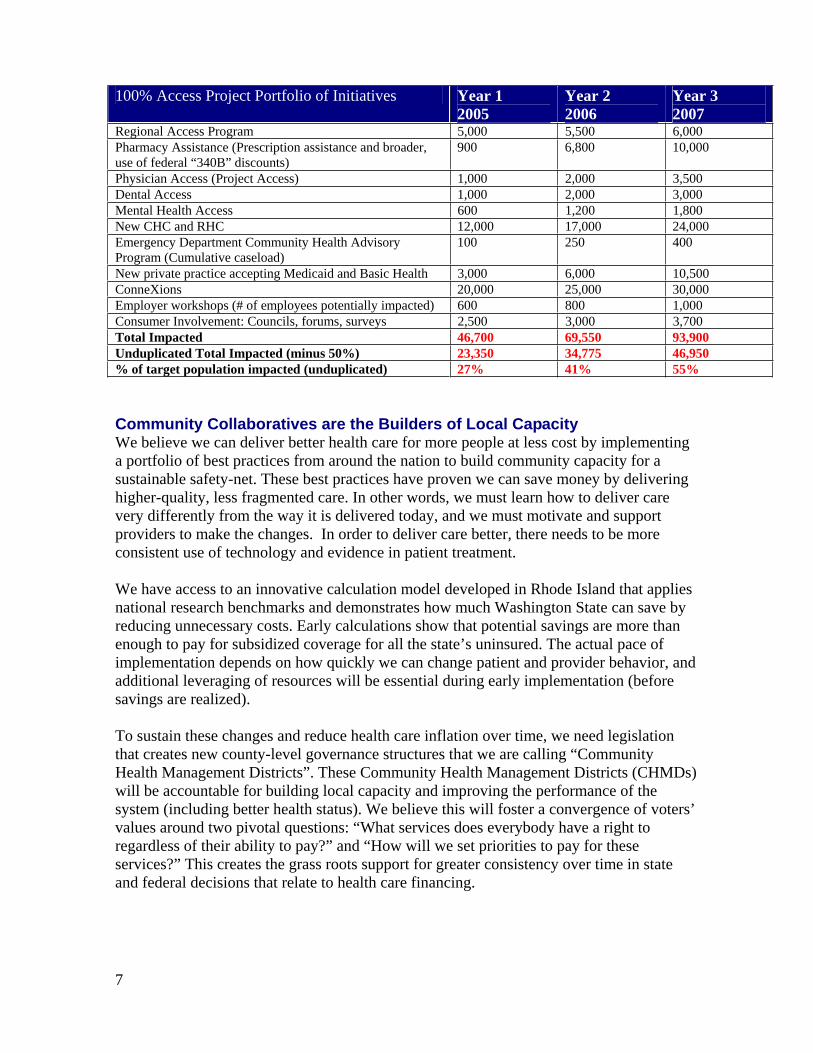
100% Access Project Portfolio of Initiatives Year 1 2005
Year 2 2006
Year 3 2007
Regional Access Program 5,000 5,500 6,000 Pharmacy Assistance (Prescription assistance and broader, use of federal “340B” discounts)
900 6,800 10,000
Physician Access (Project Access) 1,000 2,000 3,500 Dental Access 1,000 2,000 3,000Mental Health Access 600 1,200 1,800 New CHC and RHC 12,000 17,000 24,000 Emergency Department Community Health Advisory Program (Cumulative caseload)
100 250 400
New private practice accepting Medicaid and Basic Health 3,000 6,000 10,500ConneXions 20,000 25,000 30,000 Employer workshops (# of employees potentially impacted) 600 800 1,000 Consumer Involvement: Councils, forums, surveys 2,500 3,000 3,700 Total Impacted 46,700 69,550 93,900 Unduplicated Total Impacted (minus 50%) 23,350 34,775 46,950 % of target population impacted (unduplicated) 27% 41% 55%
Community Collaboratives are the Builders of Local Capacity We believe we can deliver better health care for more people at less cost by implementing a portfolio of best practices from around the nation to build community capacity for a sustainable safety-net. These best practices have proven we can save money by delivering higher-quality, less fragmented care. In other words, we must learn how to deliver care very differently from the way it is delivered today, and we must motivate and support providers to make the changes. In order to deliver care better, there needs to be more consistent use of technology and evidence in patient treatment.
We have access to an innovative calculation model developed in Rhode Island that applies national research benchmarks and demonstrates how much Washington State can save by reducing unnecessary costs. Early calculations show that potential savings are more than enough to pay for subsidized coverage for all the state’s uninsured. The actual pace of implementation depends on how quickly we can change patient and provider behavior, and additional leveraging of resources will be essential during early implementation (before savings are realized).
To sustain these changes and reduce health care inflation over time, we need legislation that creates new county-level governance structures that we are calling “Community Health Management Districts”. These Community Health Management Districts (CHMDs) will be accountable for building local capacity and improving the performance of the system (including better health status). We believe this will foster a convergence of voters’ values around two pivotal questions: “What services does everybody have a right to regardless of their ability to pay?” and “How will we set priorities to pay for these services?” This creates the grass roots support for greater consistency over time in state and federal decisions that relate to health care financing.
7
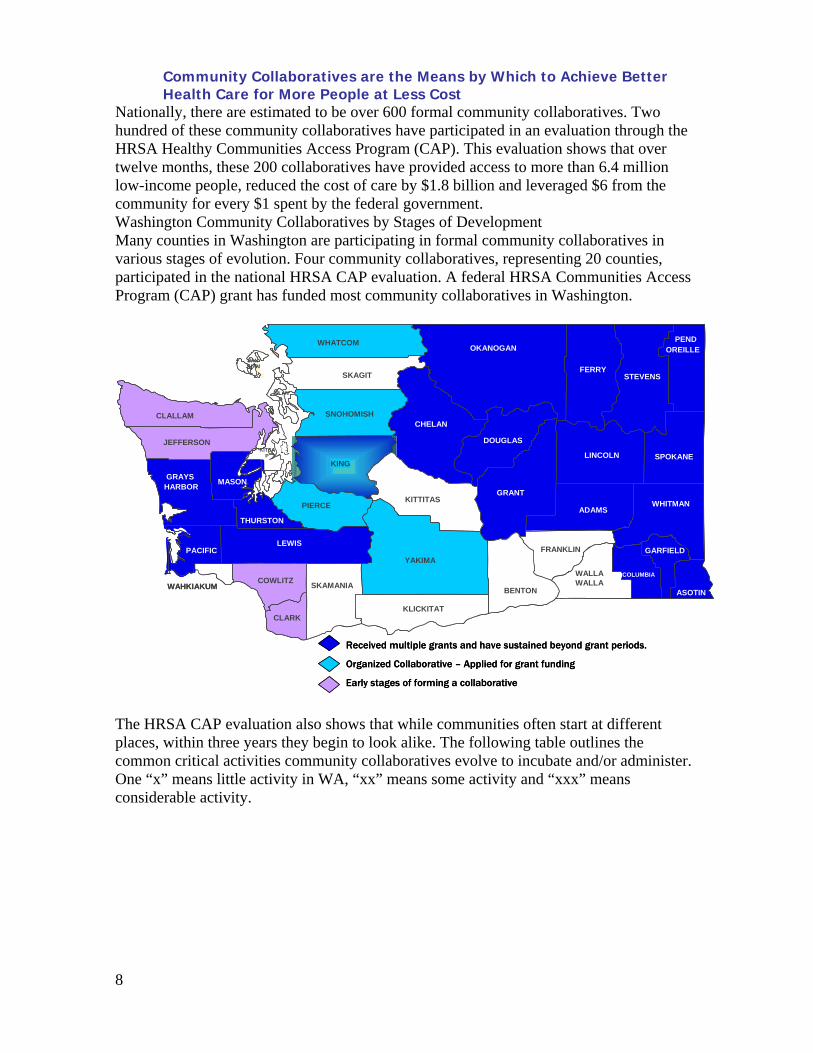
Community Collaboratives are the Means by Which to Achieve Better Health Care for More People at Less Cost
Nationally, there are estimated to be over 600 formal community collaboratives. Two hundred of these community collaboratives have participated in an evaluation through the HRSA Healthy Communities Access Program (CAP). This evaluation shows that over twelve months, these 200 collaboratives have provided access to more than 6.4 million low-income people, reduced the cost of care by $1.8 billion and leveraged $6 from the community for every $1 spent by the federal government. Washington Community Collaboratives by Stages of Development Many counties in Washington are participating in formal community collaboratives in various stages of evolution. Four community collaboratives, representing 20 counties, participated in the national HRSA CAP evaluation. A federal HRSA Communities Access Program (CAP) grant has funded most community collaboratives in Washington.
Received multiple grants and have sustained beyond grant periods.
Organized Collaborative – Applied for grant funding
Early stages of forming a collaborative
ADAMS
ASOTINBENTON
CHELANCLALLAM
CLARK
COLUMBIACOWLITZ
DOUGLAS
FERRY
FRANKLIN GARFIELD
GRANT
GRAYSHARBOR
ISLAND
JEFFERSON
KING
KITSAP
KITTITAS
KLICKITAT
LEWIS
LINCOLN
MASON
OKANOGAN
PACIFIC
PENDOREILLE
PIERCE
SANJUAN
SKAGIT
SKAMANIA
SNOHOMISH
SPOKANE
STEVENS
THURSTON
WAHKIAKUMWALLAWALLA
WHATCOM
WHITMAN
YAKIMA
The HRSA CAP evaluation also shows that while communities often start at different places, within three years they begin to look alike. The following table outlines the common critical activities community collaboratives evolve to incubate and/or administer. One “x” means little activity in WA, “xx” means some activity and “xxx” means considerable activity.
8
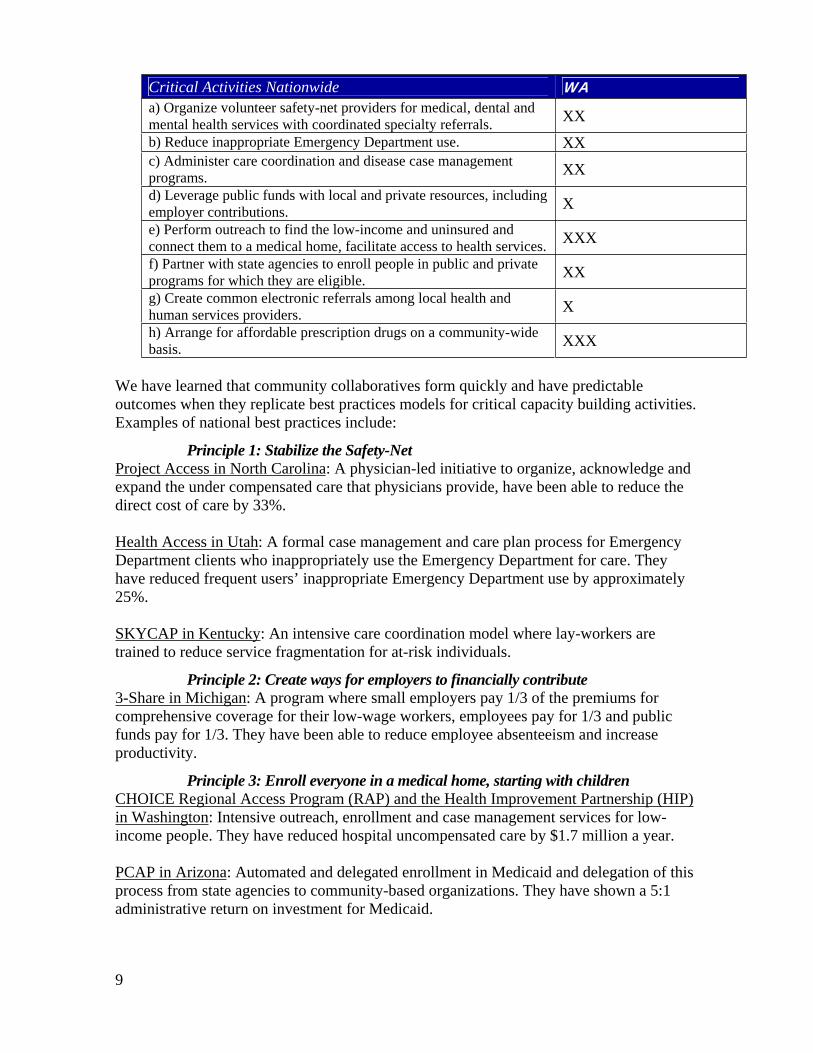
Critical Activities Nationwide WAa) Organize volunteer safety-net providers for medical, dental and mental health services with coordinated specialty referrals. XXb) Reduce inappropriate Emergency Department use. XXc) Administer care coordination and disease case management programs. XXd) Leverage public funds with local and private resources, including employer contributions. Xe) Perform outreach to find the low-income and uninsured and connect them to a medical home, facilitate access to health services. XXXf) Partner with state agencies to enroll people in public and private programs for which they are eligible. XXg) Create common electronic referrals among local health and human services providers. Xh) Arrange for affordable prescription drugs on a community-wide basis. XXX
We have learned that community collaboratives form quickly and have predictable outcomes when they replicate best practices models for critical capacity building activities. Examples of national best practices include:
Principle 1: Stabilize the Safety-Net Project Access in North Carolina: A physician-led initiative to organize, acknowledge and expand the under compensated care that physicians provide, have been able to reduce the direct cost of care by 33%.
Health Access in Utah: A formal case management and care plan process for Emergency Department clients who inappropriately use the Emergency Department for care. They have reduced frequent users’ inappropriate Emergency Department use by approximately 25%.
SKYCAP in Kentucky: An intensive care coordination model where lay-workers are trained to reduce service fragmentation for at-risk individuals.
Principle 2: Create ways for employers to financially contribute 3-Share in Michigan: A program where small employers pay 1/3 of the premiums for comprehensive coverage for their low-wage workers, employees pay for 1/3 and public funds pay for 1/3. They have been able to reduce employee absenteeism and increase productivity.
Principle 3: Enroll everyone in a medical home, starting with children CHOICE Regional Access Program (RAP) and the Health Improvement Partnership (HIP) in Washington: Intensive outreach, enrollment and case management services for low-income people. They have reduced hospital uncompensated care by $1.7 million a year.
PCAP in Arizona: Automated and delegated enrollment in Medicaid and delegation of this process from state agencies to community-based organizations. They have shown a 5:1 administrative return on investment for Medicaid.
9
Jesse Tree in Texas: A coordinated and automated system of information and referrals utilizing a regional phone number (2-1-1), along with a universal screening form and application. This simplified application and referral process will increase access to services by making it easier to navigate through the numerous and often confusing sliding fee scale and charitable systems. They have increased immunizations and health prevention screenings by 30%.
Community-Wide Pharmaceutical Access; Coordinated Care Network, Pennsylvania: A network that provides case management and low-cost pharmacy services (qualifying for deep price discounts through the federal “340B” program) to underserved populations in 10 counties across southwestern Pennsylvania (including Pittsburgh). CCN’s mission is to reduce “system” costs through its case management and prescription discount programs and in the process generate sufficient earned income to finance health care for its uninsured population.
Kids Get Care in Washington: A program to ensure that children, regardless of insurance status, receive early integrated preventive physical, oral, and developmental health services through attachment to a health care home.
Measurable and Predictable Outcomes On page 11 is a logic model and listing of activities critical to achieving measurable outcomes. Letters in the “activities” column refer to 8 “critical activities nationwide” (page 9). Outcomes and impacts are illustrative; each CHMD will negotiate guarantees as part of authorization and funding agreements.
10
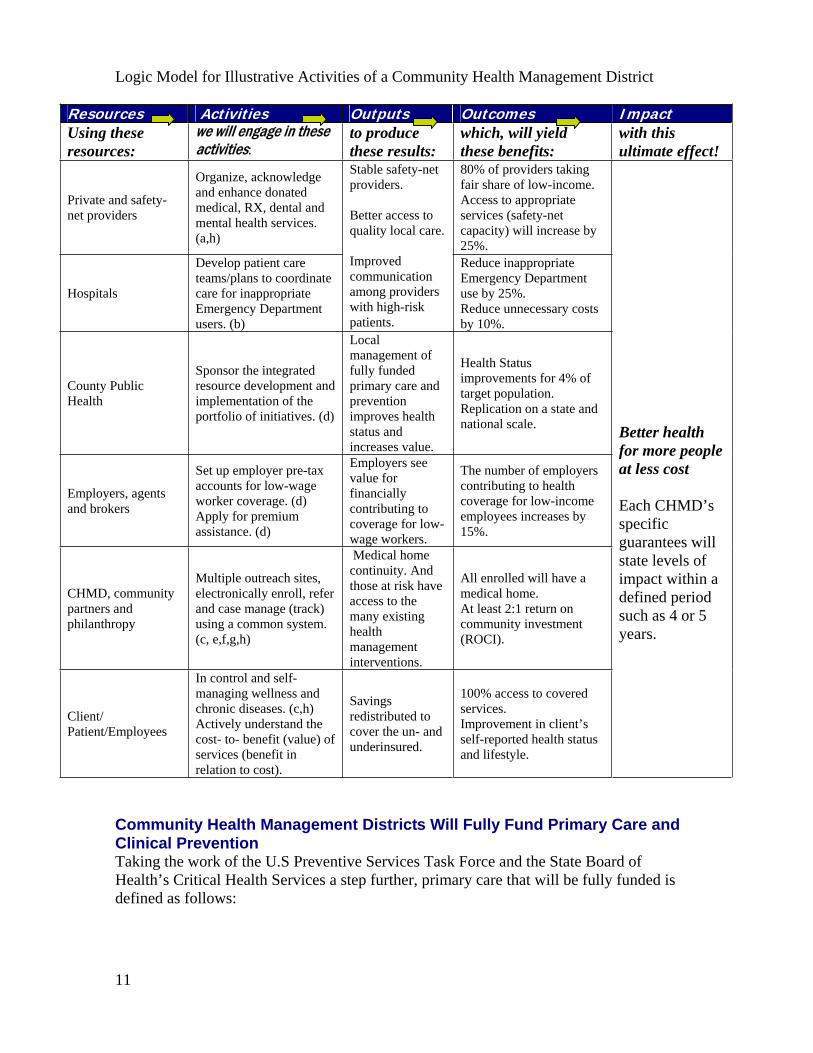
Logic Model for Illustrative Activities of a Community Health Management District
Resources Activities Outputs Outcomes Impact Using these resources:
we will engage in these activities:
to produce these results:
which, will yield these benefits:
with this ultimate effect!
Private and safety-net providers
Organize, acknowledge and enhance donated medical, RX, dental and mental health services. (a,h)
80% of providers taking fair share of low-income. Access to appropriate services (safety-net capacity) will increase by 25%.
Hospitals
Develop patient care teams/plans to coordinate care for inappropriate Emergency Department users. (b)
Stable safety-net providers.
Better access to quality local care.
Improved communication among providers with high-risk patients.
Reduce inappropriate Emergency Department use by 25%. Reduce unnecessary costs by 10%.
County Public Health
Sponsor the integrated resource development and implementation of the portfolio of initiatives. (d)
Localmanagement of fully funded primary care and prevention improves health status and increases value.
Health Status improvements for 4% of target population. Replication on a state and national scale.
Employers, agents and brokers
Set up employer pre-tax accounts for low-wage worker coverage. (d) Apply for premium assistance. (d)
Employers see value for financially contributing to coverage for low-wage workers.
The number of employers contributing to health coverage for low-income employees increases by 15%.
CHMD, community partners and philanthropy
Multiple outreach sites, electronically enroll, refer and case manage (track) using a common system. (c, e,f,g,h)
Medical home continuity. And those at risk have access to the many existing health management interventions.
All enrolled will have a medical home. At least 2:1 return on community investment (ROCI).
Client/ Patient/Employees
In control and self-managing wellness and chronic diseases. (c,h) Actively understand the cost- to- benefit (value) of services (benefit in relation to cost).
Savings redistributed to cover the un- and underinsured.
100% access to covered services. Improvement in client’s self-reported health status and lifestyle.
Better health for more people at less cost
Each CHMD’s specificguarantees will state levels of impact within a defined period such as 4 or 5 years.
Community Health Management Districts Will Fully Fund Primary Care and Clinical Prevention Taking the work of the U.S Preventive Services Task Force and the State Board of Health’s Critical Health Services a step further, primary care that will be fully funded is defined as follows:
11
“Primary care is initial health care (where you start) and ongoing care (where you go back for help with health problems), it is provided by trained health professionals.Primary care means having an ongoing relationship of trust that includes health education and the development of self-care plans. The goals of primary care are to prevent illness, maintain health, and stabilize acute episodes of illness or injury. If you have a chronic condition, primary care attempts to maintain normal health, comfort and the ability to carry out usual activities. Primary care includes preventive care, the first level of acute care, and continuing care for chronic conditions. It includes basic dental services and mental health services. It also includes care coordination. This means connecting patients with other needed services, including more specialized medical care, and it means having services to allow patients to be responsible for their own health. Primary care is accessible to all community members regardless of income, and promotes care coordination and practitioner-patient partnership. It is accountable to the community, to patients and to standards of scientific evidence.”
As referenced above, “preventive services” includes all services endorsed by the U. S. Preventive Services Task Force using its widely respected approach to rating evidence of effectiveness.
Community Health Management Districts Will be the Pharmaceutical Safety-NetBecause of high current interest, access to prescription drugs offers a good case example of how CHMDs can provide an administrative home for interim as well as comprehensive solutions to problems of access, cost and health care system performance. Pharmaceutical drugs (medications) are now a component of almost all medical treatment. The increase in the diversity of illness treatable with medication and the increase in cost to develop new treatments have resulted in medications being an increasing percentage of every health bill. However, people in greatest need cannot consistently access affordable medications. Frustration in not being able to obtain affordable medications has echoed through all demographic groups, but those who are low income, uninsured and/or have chronic conditions are most severely impacted by lack of access to affordable medications. One large study of the uninsured (The Access Project, 2003) found that 56% of respondents needed help paying for their prescribed medications. As a result, 13% to 30% of respondents reported obtaining none or only some of their medications. The effects of not being able to obtain medication include increased medical severity, prolongation of illness, unnecessary Emergency Department use, increased total cost of care and poor outcomes, including death. Current barriers to obtaining affordable medications include:
Lack of coordination and legal restrictions in the distribution of free sample starter medications from pharmaceutical companies to physicians and clinics, which hampers their use for people without other resources. Vendor-sponsored free or reduced-cost Prescription Assistance Programs for those in need are maddeningly complex, have processes and requirements unique to each company and usually require reapplication for each medicine every three months. This complexity places a time and cost burden on physician offices, the patients and those assisting the patient and is a waste of precious resources. Low volume purchasing among multiple purchasers contributes to the high rate of pharmaceutical inflation.
12
The 340B discount drug pricing program currently provides the least expensive pharmaceuticals, particularly for higher priced non-generics. However, currently only a restricted number of covered entities (e.g., Federally Qualified Health Centers) are able to obtain 340B pricing, and only for their treatment of their patients. Thus, a wide variety of other clinics, charitable physicians and other community programs are unable to obtain similar low pricing for their equally needy patients.Low-income patients often float in and out of public program medical coverage and reestablishing benefits is a complex and lengthy process. For instance, patients lose state coverage when imprisoned. Many require multiple pharmaceuticals including expensive mental health pharmaceuticals. Without pharmaceuticals many exhibit costly behavior resulting in increased Emergency Department use, large county expense and recidivism.
Community Health Management Districts will find innovative long-term solutions to funding, acquiring and distributing affordable medications to those most in need.
In addition to the long term potential, some of these solutions can be implemented much sooner as interim measures.
1. Network Adequacy: Each CHMD contracts with a comprehensive range of both individual health providers and health provider networks, including safety-net providers, some of who are eligible to acquire medications through the 340B drug discount pricing program.
CHMDs join in a consortium to leverage statewide or large area influence and economies of scale, one of which is to achieve deep discounts on bulk purchasing of pharmaceuticals.
A network of pharmacists and Pharmacy Benefits Managers (PBMs) would play a role in the acquisition, distribution and tracking of, and patient education, case management and reimbursement for, pharmaceuticals.
2. Acquisition (the enterprise): Acquisition through federal 340B Program: the ultimate goal is to purchase through the 340B program pharmaceuticals for any low income CHMD enrollee regardless of the site of care. This may require reinterpretation of current law or small incremental additions to current law.
o Identify all covered entities qualifying for 340B and, through networking and subcontracts, create a system that allows as many CHMD enrollees as possible to purchase medication under their auspices. Two promising examples are involving Disproportionate Share Hospitals (new covered entities) and case management of poly-pharmacy patients (new enrollees).
o Push for expansion of 340B covered entity definition to include community-based charitable health coalitions and their patients.
13
For example, Representative Rush’s bill HR 4161 could be modified for this purpose.
o If Texas is successful, work with state policy makers to request a Texas-style waiver that would expand the definition of “patient” eligible for 340B discount.
Acquisition through group purchasing: work with state policy makers to add CHMD enrollees in the state’s new purchasing pool for pharmaceutical discounts for those currently over 50 and low income who are allowed access.
Acquisition through vendor-sponsored prescription assistance programs: follow the lead of other states that have negotiated successfully with a group of pharmaceutical companies to provide a full spectrum of pharmaceuticals to the state’s low income uninsured without having to apply for each medicine individually. Health Indiana has been able to negotiate free medications for such patients under 150% FPL. Negotiate a universal application and standardized process.
Acquisition through use of vendor-supplied samples: create a system that efficiently acquires and distributes sample medications. Change state law to allow pharmacies associated with charitable activities to repackage and distribute sample medications. Allow samples to be used to start medication delivery in prescription assistance programs while waiting for delivery of program medications from the company.
Acquisition through Medicare Card: use the new Medicare discount cards with eligible CHMD enrollees.
3. Distribution: Key to cost-effective distribution is a centralized pharmacy function. Each CHMD or a consortium of CHMDs can contract with, or create a state-wide, centralized pharmacy company that acquires medications at affordable prices using the strategies above and dispenses medications via a network of pharmacists, mail delivery, or through physician offices. The pharmacy company would handle all the logistics associated with the dispensing of medications.
Another key to cost-effective acquisition and distribution is development and management of a formulary, developed in consultation with the provider network and pharmacy company.
The final key to cost-effective distribution is patient education and counseling, and case management of complex, high cost poly-pharmacy patients. Each CHMD will provide or subcontract to provide this vital service.
4. Funding Sources: The CHMD will seek to show return on community investment in its pharmaceutical safety-net activities and will use positive Return On
14
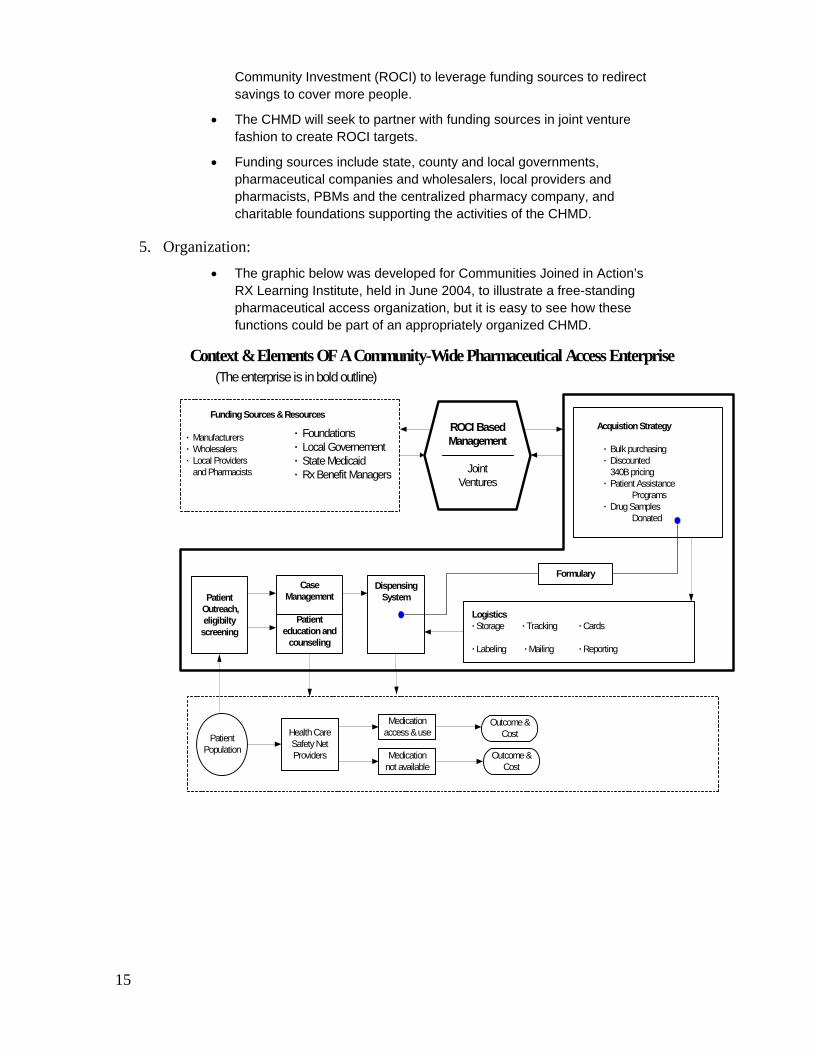
Community Investment (ROCI) to leverage funding sources to redirect savings to cover more people.
The CHMD will seek to partner with funding sources in joint venture fashion to create ROCI targets.
Funding sources include state, county and local governments, pharmaceutical companies and wholesalers, local providers and pharmacists, PBMs and the centralized pharmacy company, and charitable foundations supporting the activities of the CHMD.
5. Organization: The graphic below was developed for Communities Joined in Action’s RX Learning Institute, held in June 2004, to illustrate a free-standing pharmaceutical access organization, but it is easy to see how these functions could be part of an appropriately organized CHMD.
Context & Elements OF A Community-Wide Pharmaceutical Access Enterprise(The enterprise is in bold outline)
Funding Sources & Resources
· Manufacturers · Wholesalers · Local Providers and Pharmacists
· Foundations · Local Governement · State Medicaid · Rx Benefit Managers
ROCI BasedManagement
JointVentures
Acquistion Strategy
· Bulk purchasing· Discounted
340B pricing· Patient Assistance
Programs· Drug Samples
Donated
CaseManagement
Patienteducation and
counseling
DispensingSystem
Logistics · Storage · Tracking · Cards
· Labeling · Mailing · Reporting
Formulary
PatientPopulation
Health CareSafety NetProviders
Medicationaccess & use
Medicationnot available
Outcome &Cost
Outcome &Cost
Patient Outreach,eligibiltyscreening
15
Community Health Management Districts Will Deliver Medical, Dental and Mental Health Care Differently
Consumers will feel accountable and have the information they need to be good stewards of their bodies and pocket books:
Consumers will have a stable and predictable method to finance health services that makes consumers aware of the costs of their decisions and the value of their purchases.
Consumers will have an easy access to a basic level of appropriate and effective health services. This means we will minimize unnecessary costs and medical interventions and create incentives for prevention and primary care that consumers can access in their own neighborhoods.
Consumers will have an aligned incentives and health management interventions to encourage them to be healthy throughout their life.
Consumers will have a consistent access to a flexible, multi-disciplinary team approach that meets the needs of consumers because it is respectful, compassionate and evidence-based. By being compassionate we will communicate about and encourage the relief of suffering.
Consumers will have an annual health assessment process that produces personal wellness reports.
The provider and patient relationship will be more dynamic:
Patient-centered disease management.
Health care teams where the use of technology allows continuity of medical records.
Patient will have stable access to a usual source of culturally competent care where trust can be built over time.
Patient will receive education from the provider team. Consumers will use fewer services due to:
Training in chronic disease self-management, and disease management
Commitment to care plans.
Investment in the plan through personal actions and in many cases out-of-pocket dollars.
Practitioners will provide more consistent, higher quality treatment with fewer errors due to:
Evidence-based treatment norms.
Peer Quality Improvement (QI) initiatives.
Practitioners will take their fair share of the uninsured:
80% of the practicing providers will provide uncompensated care to eligible patients enrolled in Project Access.
16
A network of community partners will donate services, products, or funding toward the operation of the project, which ultimately will include medical, dental, mental health, pharmacy and durable medical equipment.
Network of provider will be developed to serve as the foundation of providers for CHMDs.
Community Health Management Districts Will Redistribute Savings to Cover the Uninsured Based on national research, on average 30% of health care expenditures are unnecessary. They are unnecessary costs due to: 1) redundant tests, 2) errors, 3) unnecessary diagnostics, and 4) unnecessary treatments. The level of unnecessary cost in Washington is probably less; the graphic on the next page has a reduced assumption of 24%. Only 8.4% of Washington’s population is uninsured (2002 data). Despite concerns that uninsured people will use high quantities of health care if they gain coverage (“pent-up demand”), few of them are in the highest utilizing age group over 65. Additionally, many uninsured people are relatively healthy low-wage workers who are unlikely to become high utilizers. This means that capturing even a third of the potential savings (or 8% of statewide spending for healthcare) would provide the resources to cover the uninsured.
The graphic on “Projected Washington Health Expenditures and Waste” shows the dollar amounts. In 2004, Washington State will spend $27 billion on health care; $6 to $8 billion of that will be unnecessary costs. By 2013, that will escalate to between $11 billion and $14 billion. The ten-year aggregate waste is $86 to $108 billion.
The unnecessary costs were estimated based on benchmarking studies that compare various parameters of the health care market among geographic practices areas. Much of this work goes back to the research of John Wennberg, Elliott Fisher and others, comparing regional variations state-to-state and among groups of markets with similar characteristics. In the state-to-state comparisons used to develop estimates for Washington, Utah is the most cost-effective health care market. The gross comparisons do not correct for demographic and “lifestyle” differences and this in one of the many reasons we do not claim that all theoretical waste can be recaptured.
By taking action now to reduce unnecessary costs, it is possible to generate the savings needed to cover all the uninsured within as little as 5 years, without raising state taxes or reducing provider payments to unsustainable levels, depending on how quickly we can change patient and provider behavior. Without reducing the number of uninsured, we will not be able to dramatically reduce waste, because the care received by uninsured people, while inadequate in quantity, is fragmented and inefficient. As different people cycle through periods of being uninsured this inefficiency greatly impairs the health care system’s overall ability to improve health status.
17
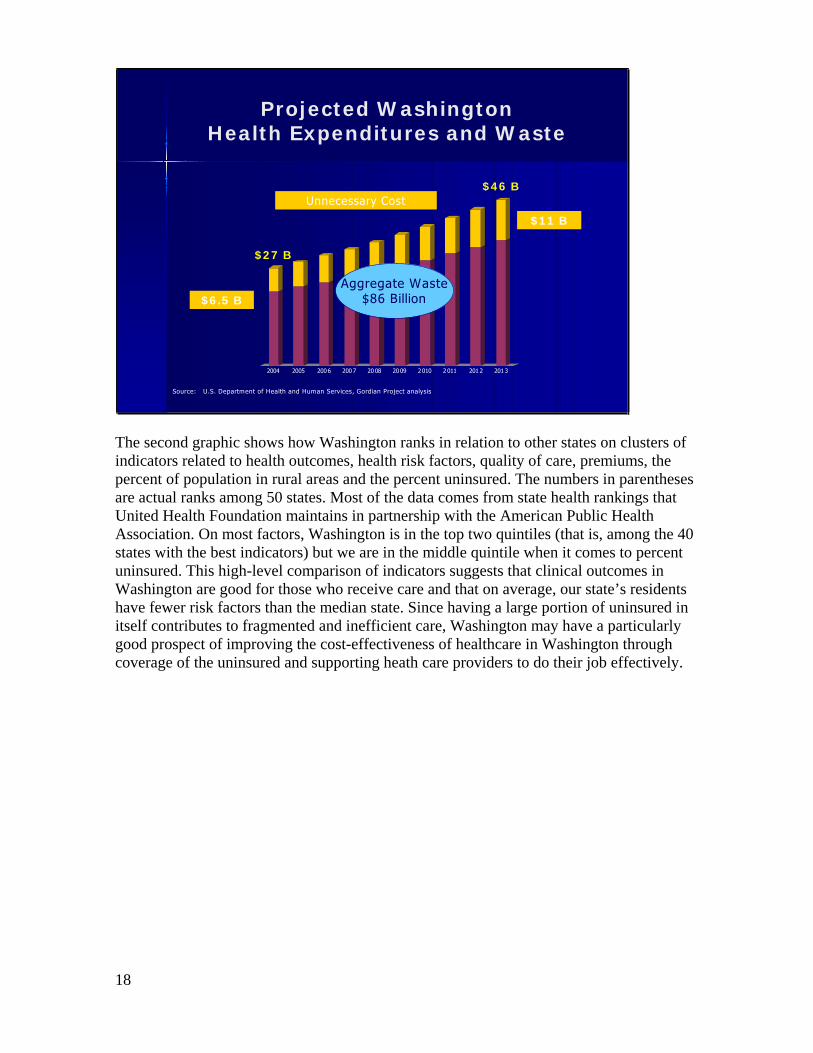
2004 2005 2006 2007 2008 2009 2010 2011 2012 2013
Projected WashingtonHealth Expenditures and Waste
Source: U.S. Department of Health and Human Services, Gordian Project analysis
$46 B
$27 B
Unnecessary Cost
$6.5 B
$11 B
Aggregate Waste$86 Billion
The second graphic shows how Washington ranks in relation to other states on clusters of indicators related to health outcomes, health risk factors, quality of care, premiums, the percent of population in rural areas and the percent uninsured. The numbers in parentheses are actual ranks among 50 states. Most of the data comes from state health rankings that United Health Foundation maintains in partnership with the American Public Health Association. On most factors, Washington is in the top two quintiles (that is, among the 40 states with the best indicators) but we are in the middle quintile when it comes to percent uninsured. This high-level comparison of indicators suggests that clinical outcomes in Washington are good for those who receive care and that on average, our state’s residents have fewer risk factors than the median state. Since having a large portion of uninsured in itself contributes to fragmented and inefficient care, Washington may have a particularly good prospect of improving the cost-effectiveness of healthcare in Washington through coverage of the uninsured and supporting heath care providers to do their job effectively.
18
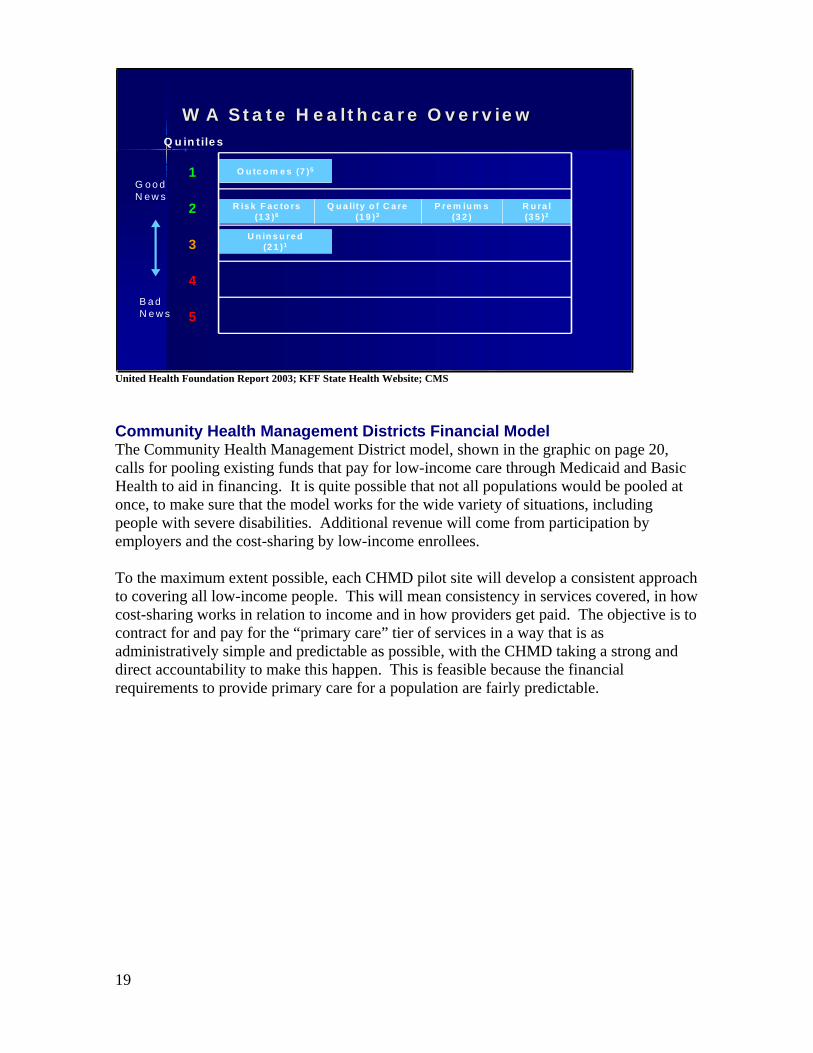
Q u in tile s
R u ra l(3 5 )2
O u tc o m e s (7 )5
P re m iu m s(3 2 )
Q u a lity o f C a re(1 9 )3
U n in s u re d(2 1 )1
R is k F a c to rs(1 3 )6
1
2
3
4
5
W A S ta te H e a lth c a re O v e rv ie wW A S ta te H e a lth c a re O v e rv ie w
G o o d N e w s
B a d N e w s
United Health Foundation Report 2003; KFF State Health Website; CMS
Community Health Management Districts Financial Model The Community Health Management District model, shown in the graphic on page 20, calls for pooling existing funds that pay for low-income care through Medicaid and Basic Health to aid in financing. It is quite possible that not all populations would be pooled at once, to make sure that the model works for the wide variety of situations, including people with severe disabilities. Additional revenue will come from participation by employers and the cost-sharing by low-income enrollees.
To the maximum extent possible, each CHMD pilot site will develop a consistent approach to covering all low-income people. This will mean consistency in services covered, in how cost-sharing works in relation to income and in how providers get paid. The objective is to contract for and pay for the “primary care” tier of services in a way that is as administratively simple and predictable as possible, with the CHMD taking a strong and direct accountability to make this happen. This is feasible because the financial requirements to provide primary care for a population are fairly predictable.
19
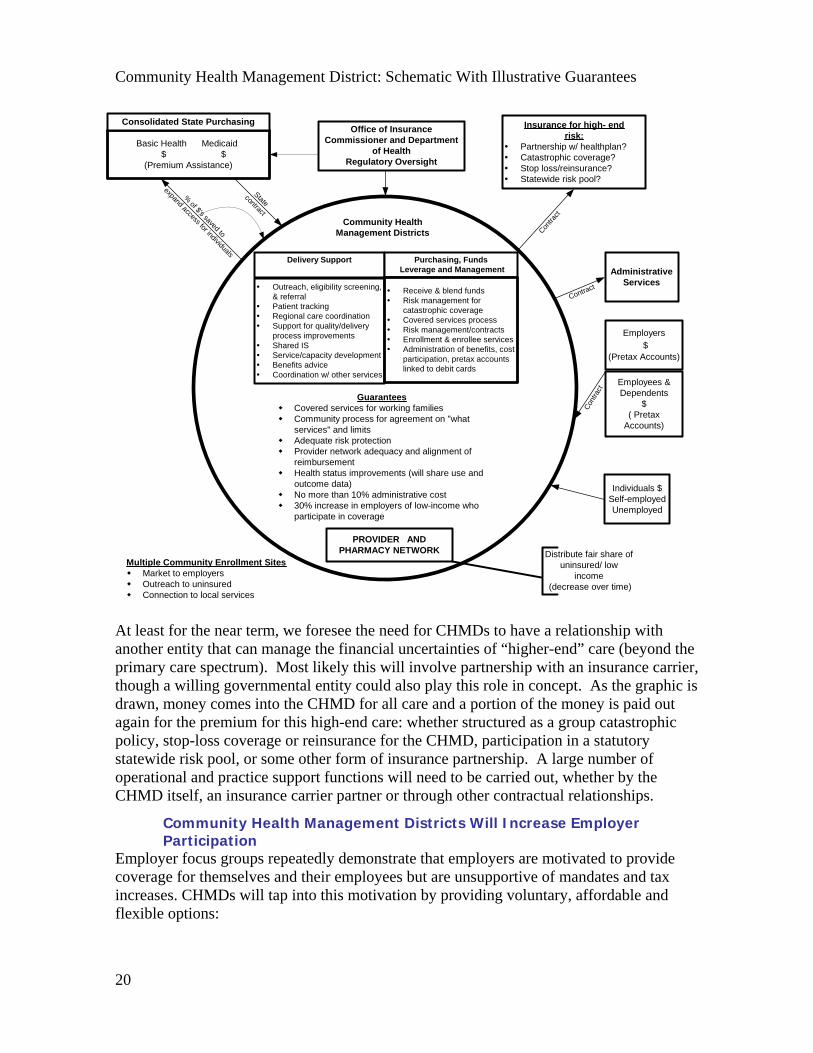
Community Health Management District: Schematic With Illustrative Guarantees
Delivery Support Purchasing, Funds Leverage and Management
Outreach, eligibility screening,& referralPatient trackingRegional care coordinationSupport for quality/deliveryprocess improvementsShared ISService/capacity developmentBenefits adviceCoordination w/ other services
Community HealthManagement Districts
GuaranteesCovered services for working familiesCommunity process for agreement on "whatservices" and limitsAdequate risk protectionProvider network adequacy and alignment ofreimbursementHealth status improvements (will share use andoutcome data)No more than 10% administrative cost30% increase in employers of low-income whoparticipate in coverage
Insurance for high- endrisk:
Partnership w/ healthplan?Catastrophic coverage?Stop loss/reinsurance?Statewide risk pool?
PROVIDER ANDPHARMACY NETWORK
Employees &Dependents
$( Pretax
Accounts)
Individuals $Self-employedUnemployed
Distribute fair share ofuninsured/ low
income (decrease over time)
Multiple Community Enrollment SitesMarket to employersOutreach to uninsuredConnection to local services
Employers$
(Pretax Accounts)
Office of InsuranceCommissioner and Department
of HealthRegulatory Oversight
Basic Health Medicaid $ $(Premium Assistance)
Consolidated State Purchasing
AdministrativeServices
Receive & blend fundsRisk management forcatastrophic coverageCovered services processRisk management/contractsEnrollment & enrollee servicesAdministration of benefits, costparticipation, pretax accountslinked to debit cards
Cont
ract
Contra
ct
Contract
Statecontract
%of $'s saved to
expand access for individuals
At least for the near term, we foresee the need for CHMDs to have a relationship with another entity that can manage the financial uncertainties of “higher-end” care (beyond the primary care spectrum). Most likely this will involve partnership with an insurance carrier, though a willing governmental entity could also play this role in concept. As the graphic is drawn, money comes into the CHMD for all care and a portion of the money is paid out again for the premium for this high-end care: whether structured as a group catastrophic policy, stop-loss coverage or reinsurance for the CHMD, participation in a statutory statewide risk pool, or some other form of insurance partnership. A large number of operational and practice support functions will need to be carried out, whether by the CHMD itself, an insurance carrier partner or through other contractual relationships.
Community Health Management Districts Will Increase Employer Participation
Employer focus groups repeatedly demonstrate that employers are motivated to provide coverage for themselves and their employees but are unsupportive of mandates and tax increases. CHMDs will tap into this motivation by providing voluntary, affordable and flexible options:
20
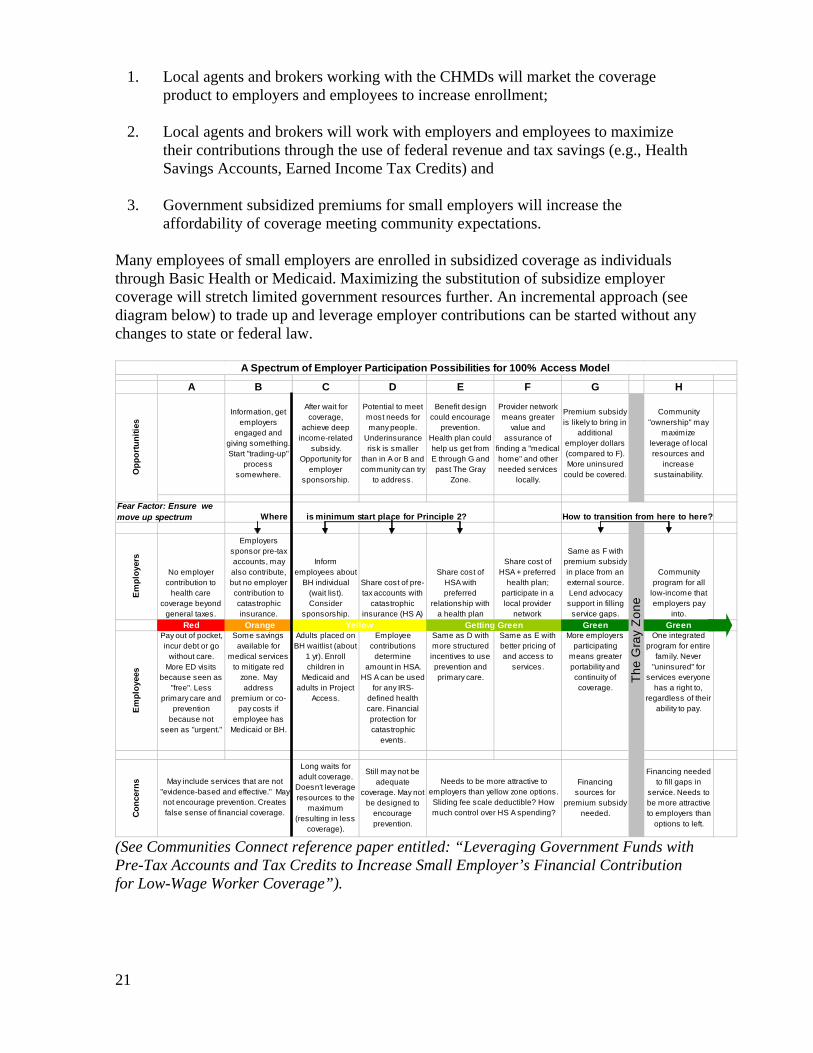
1. Local agents and brokers working with the CHMDs will market the coverage product to employers and employees to increase enrollment;
2. Local agents and brokers will work with employers and employees to maximize their contributions through the use of federal revenue and tax savings (e.g., Health Savings Accounts, Earned Income Tax Credits) and
3. Government subsidized premiums for small employers will increase the affordability of coverage meeting community expectations.
Many employees of small employers are enrolled in subsidized coverage as individuals through Basic Health or Medicaid. Maximizing the substitution of subsidize employer coverage will stretch limited government resources further. An incremental approach (see diagram below) to trade up and leverage employer contributions can be started without any changes to state or federal law.
A B C D E F G H
Information, get employers
engaged and giving something. Start "trading-up"
process somewhere.
After wait for coverage,
achieve deep income-related
subsidy. Opportunity for
employer sponsorship.
Potential to meet most needs for many people.
Underinsurance risk is smaller
than in A or B and community can try
to address.
Benefit design could encourage
prevention. Health plan could help us get from E through G and past The Gray
Zone.
Provider network means greater
value and assurance of
finding a "medical home" and other needed services
locally.
Premium subsidy is likely to bring in
additional employer dollars (compared to F). More uninsured
could be covered.
Community "ownership" may
maximize leverage of local resources and
increase sustainability.
Em
ploy
ers
No employer contribution to
health care coverage beyond
general taxes.
Employers sponsor pre-tax accounts, may also contribute, but no employer contribution to catastrophic insurance.
Inform employees about
BH individual (wait list). Consider
sponsorship.
Share cost of pre-tax accounts with
catastrophic insurance (HS A)
Share cost of HSA with preferred
relationship with a health plan
Share cost of HSA + preferred
health plan; participate in a local provider
network
Same as F with premium subsidy in place from an external source. Lend advocacy support in filling
service gaps.
Community program for all
low-income that employers pay
into.Red Orange Green Green
Em
ploy
ees
Pay out of pocket, incur debt or go
without care. More ED visits
because seen as "free". Less
primary care and prevention
because not seen as "urgent."
Some savings available for
medical services to mitigate red
zone. May address
premium or co-pay costs if
employee has Medicaid or BH.
Adults placed on BH waitlist (about
1 yr). Enroll children in
Medicaid and adults in Project
Access.
Employee contributions
determine amount in HSA.
HS A can be used for any IRS-
defined health care. Financial protection for catastrophic
events.
Same as D with more structured incentives to use prevention and primary care.
Same as E with better pricing of and access to
services.
More employers participating
means greater portability and continuity of coverage.
One integrated program for entire
family. Never "uninsured" for
services everyone has a right to,
regardless of their ability to pay.
Con
cern
s
Long waits for adult coverage.
Doesn't leverage resources to the
maximum (resulting in less
coverage).
Still may not be adequate
coverage. May not be designed to
encourage prevention.
Financing sources for
premium subsidy needed.
Financing needed to fill gaps in
service. Needs to be more attractive to employers than
options to left.
Where is minimum start place for Principle 2?
Needs to be more attractive to employers than yellow zone options. Sliding fee scale deductible? How much control over HS A spending?
A Spectrum of Employer Participation Possibilities for 100% Access Model
May include services that are not "evidence-based and effective." May not encourage prevention. Creates false sense of financial coverage.
Opp
ortu
nitie
s
How to transition from here to here?
The
Gra
y Zo
neYellow Getting Green
Fear Factor: Ensure we move up spectrum
(See Communities Connect reference paper entitled: “Leveraging Government Funds with Pre-Tax Accounts and Tax Credits to Increase Small Employer’s Financial Contribution for Low-Wage Worker Coverage”).
21
Community Health Management Districts will Retain an Adequate Network of Providers Washington State communities are struggling with recruitment and retention of physicians in primary care and many specialties, especially when linked to high areas of Medicaid or Medicare population. CHMDs will provide stabilization and increase the success of physician retention and recruitment in several ways:
Predictable payment;
Reduced administration at the physician office level;
Care risk reduction;
Fair distribution of low income patients;
Innovative approach to malpractice protection and
Strong provider-patient partnership and shared commitment to make health care effective for the whole community, making for a positive practice environment.
(See the Communities Connect reference paper entitled: “Recruitment and Retention of Physician”)
Community Health Management Districts Will Be a New Local Entity Authorized by state statute, a Community Health Management District may be a current legal entity, such as a county/municipal health department, a hospital district, a local/regional health care contractor, a tribe or an existing or newly formed non-profit agency that meets criteria set by the Consolidated State Purchasing Agency (integration of state health care purchasers).
The CHMD is a community owned and directed organization that manages more effective health care expenditures. It places emphasis on patient education, wellness and prevention programs to maximize the use of health care dollars. Communities, counties or other geographic regions should have the option to have a county health department, hospital district, tribe, not-for-profit agency or health care contractor serve as the CHMD. The Insurance Commissioner or State Department of Health will be authorized to license, regulate and audit CHMDs.
Multiple Public and Private Options for Governance and Accountability to Best Augment Local Capacity in Place
Public (Local Government) Pros: Clear line of public accountability to the community, potential taxing authority, may have better chance of long-term sustainability. Statewide legal structure exists. Cons: Subject to political influences that might not support community needs or consistent public policy. Expands current scope of local government. There will be concerns about “unfunded mandates”.
Public/PrivatePros: More responsive to community structures and influences, community based governance, aligned with community resources, more responsive organizationally and strategically, better equipped to coordinate public and private funds.Cons: May lack long-term sustainability if not connected to a taxing authority. Could potentially be dominated by non-community interests.
22
Community Health Management District Guarantees CHMDs will need to provide certain guarantees of improving health system performance through some combination of statutory compliance provisions and performance contracts with state purchasers and other funders or investors. Illustrative examples are included on the CHMD graphic on page 20 and the following serves as a potential list to prioritize:
1. Shared Use and Outcome Data Community/patient utilization of health care dollar
Uninsured/socio-economic data
Patient census
Health provider supply, including appropriate incorporation of both traditional safety –net providers and a broad network.
Health access issues
Communicable & chronic disease
2. Community Resource (Clearinghouse) for Wellness and Prevention Education Health screenings
Community health record
Consumer wellness reports
3. Best Practice for Disease Management Models
4. Active Support for Public Health GoalsAssuring access (including access to pharmaceuticals)
Participating in health campaigns
Reporting communicable diseases
5. State and National Health Advocacy Network
6. Reduce Fragmentation (probably regional or multi-county) Transportation
Interpreting
Care coordination
Community Health Management Districts’ Health Interventions While CHMDs are not themselves health care providers, they can undertake managerial responsibility for interventions that support the health care provider system in patient care.While these interventions themselves will evolve with the state of the art, The Health Plan for Life (HP4LifeSM) model developed by the Seattle-based w HP4LifeSM workshop coordinated by Dr. Stephen Barchet is a valuable benchmark for what can be done. This model includes a set of health management interventions to support consumer stewardship:
23
Consumers attend a 2 hour workshop “You Can Make a Difference” to learn how to actively participate in improving their own health through greater understanding of health care services, cost and utilization.
Consumers can choose to have a wellness mentor with incentives for wellness achievements.
Consumers receive medical self-care book by mail.
Consumers complete annual health questionnaire resulting in a personal wellness report mailed to them with a clinical summary sent to their primary care practitioner.
Consumers whose wellness report identifies them as “high-risk” receive a telephone call from a wellness coach, which will offer to work with them to develop a patient care plan.
Consumers, who have certain conditions, are enrolled in disease management programs and complete a shared patient care plan (Pursuing Perfection model).
Consumers have access to a library of self-directed behavior change and health-related materials and audiotapes that can be sent to them, accessed via the Internet or listened to over the phone.
Consumers receive a wellness newsletter is sent each month.
Consumers have access to a 24/7 toll-free health advice line.
Consumers receive targeted biometric screening (fact-based report on individual’s lab data, immunization history, radiology, etc.) to help them take steps to reduce or eliminate risk.
Consumers have Linkage to face-to-face health and wellness services.
Possible Tension Points to Resolve with State Agencies
Community enrollment sites compared to centralized fraud control approach.
State’s willingness to contract out services they feel they could do with greater consistency statewide and with more fiscal control.
Reserve? Do we need one? If so, where? State, health management district or carrier?
Multi-county districts for rural areas (cf. Educational Services Districts).
Will need to have credible analysis that the additional “layer” will save more money than it costs and reduce administrative complexity rather than add to it. Good outcome data on CHMD’s will be critical.
Phase In an Innovative Statewide Solution There are four regions in the state with mature and sustainable community collaboratives that could serve as pilot project sites for Community Health Management Districts. These pilots will inform a statewide solution. The communities ready to be pilot sites include:
1. CHOICE Regional Health Network: Thurston and the surrounding rural counties.
24
2. Health Improvement Partnership and Project Access: Spokane and the surrounding counties.
3. Community Choice: Douglas and the surrounding counties.
4. Whatcom Health Alliance: Whatcom County.
Community Health Works and is Innovative at Multiple Levels
CommunityConsumer involvement: There will be a robust annual public process that facilitates a convergence of agreement on what services everyone has a right to and where limits will be set. This will create the grass roots support for greater consistency over time in state and federal decisions that relate to health care financing. Employer contributions: Employers across the nation and, in Washington State in particular, have resisted coverage mandates and increased taxes. This project creates flexible, local, voluntary and subsidized options for employer coverage which will add new resources not currently on the table. This will better leverage public funds. Investments in community health status improvements: Communities will measure morbidity and mortality and set targets for improvements. The personal health care system will have an appropriate share of accountability for meeting those targets.
CountyCommunity Health Management Districts: CHMDs will facilitate changes and have the tools in place to deliver care differently. They will blend, leverage and manage health care finances for people below 250% of FPL. CHMDs will guarantee that: 1) There is easy access to covered services, 2) Primary care and prevention is fully funded, 3) There is adequate risk and financial protection, 4) At least 15% of employers contribute to coverage, and 5) There is an adequate network of efficient, high quality providers practicing evidence-based medicine.
Regional Regional Referral and Care Coordination Service: Given the natural use patterns of consumers and referral patterns of providers, we can operate language access (medical interpreting), transportation, care coordination, specialty referral and client tracking administrative services on a regional basis to support safety-net providers.
StateReducing unnecessary costs to cover the uninsured: Research shows that 24% of health care expenditures are unnecessary due to: 1) redundant tests, 2) errors, 3) unnecessary diagnostics, and 4) unnecessary treatments. Our four pilot service areas (20 counties) have a total of 23% of the states population. In 2004, they will spend $6.2 billion on health care, $1.4 to 1.8 million of which will be unnecessary. If we are able to capture and redistribute one-third of the unnecessary cost by the end of a several year phase-in period, we will be able to “close the gap” and cover all the uninsured from that point without raising taxes or reducing provider payments to unsustainable levels.
Leveraging public dollars with employer contributions to cover the uninsured: In addition to reducing unnecessary costs, we will be able to add new revenue through employer contributions. A significant number of those enrolled in Medicaid and Basic Health live in
25
a home where at least one adult works but isn’t offered affordable coverage. By increasing employer sponsored coverage by only 15% and subsidizing the premium by one-third, we’ll be able to make a significant contribution to covering the uninsured.
National Community owned Access Case Management Information System (ACMIS): Now that we are learning that community collaboratives across the nation have eight common critical activities, we can combine our user purchasing power for a comprehensive information system to support these activities. Rather than continuously invest government and philanthropic resources in duplicative, customized IS development, we will be a national model for an off-the-shelf system that community after community can implement without risk or waste. The ACMIS will begin with web-based functionality to 1) Client registry and tracking; 2) Enrollment; 3) Resource referral; 4) Case management; 5) Disease management; 6) Prescription assistance; and 7) Donated services management.
Later phases of ACMIS may include additional functions to support CHMD operations, if combining them in the same information system is the most efficient way to achieve desired scope, integration and efficiency. Whether or not the same software package is used, the connectivity and experience with a shared system provided by ACMIS will pave the way for these expansions of function within each community.
Where is cost and access to health care on your priority list of issues impacting the state?
Will you support “community driven” solutions to resolving cost and access to care issues?
26

Tab 9
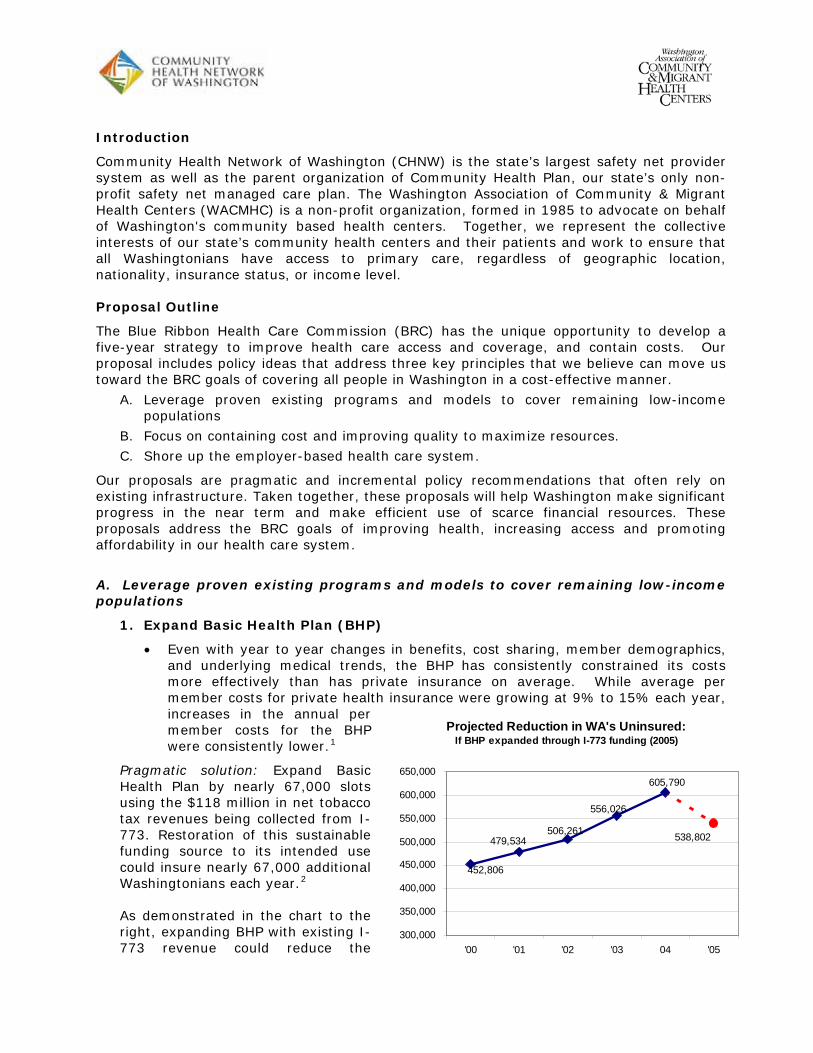
Introduction
Community Health Network of Washington (CHNW) is the state’s largest safety net provider system as well as the parent organization of Community Health Plan, our state’s only non-profit safety net managed care plan. The Washington Association of Community & Migrant Health Centers (WACMHC) is a non-profit organization, formed in 1985 to advocate on behalf of Washington's community based health centers. Together, we represent the collective interests of our state’s community health centers and their patients and work to ensure that all Washingtonians have access to primary care, regardless of geographic location, nationality, insurance status, or income level.
Proposal Outline
The Blue Ribbon Health Care Commission (BRC) has the unique opportunity to develop a five-year strategy to improve health care access and coverage, and contain costs. Our proposal includes policy ideas that address three key principles that we believe can move us toward the BRC goals of covering all people in Washington in a cost-effective manner.
A. Leverage proven existing programs and models to cover remaining low-income populations
B. Focus on containing cost and improving quality to maximize resources.
C. Shore up the employer-based health care system.
Our proposals are pragmatic and incremental policy recommendations that often rely on existing infrastructure. Taken together, these proposals will help Washington make significant progress in the near term and make efficient use of scarce financial resources. These proposals address the BRC goals of improving health, increasing access and promoting affordability in our health care system.
A. Leverage proven existing programs and models to cover remaining low-income populations
1. Expand Basic Health Plan (BHP)
Even with year to year changes in benefits, cost sharing, member demographics, and underlying medical trends, the BHP has consistently constrained its costs more effectively than has private insurance on average. While average per member costs for private health increases in the annual per member costs for the BHP were consistently lower.
insurance were growing at 9% to 15% each year,
PragmaHealth ots
rt to the ght, expanding BHP with existing I-
773 revenue could reduce the
1
tic solution: Expand Basic Plan by nearly 67,000 sl
Projected Reduction in WA's Uninsured:If BHP expanded through I-773 funding (2005)
538,802
605,790
556,026
506,261
452,806
479,534
300,000
350,000
400,000
450,000
500,000
550,000
600,000
650,000
'00 '01 '02 '03 04 '05
using the $118 million in net tobacco tax revenues being collected from I-773. Restoration of this sustainable funding source to its intended use could insure nearly 67,000 additional Washingtonians each year.2
As demonstrated in the chari
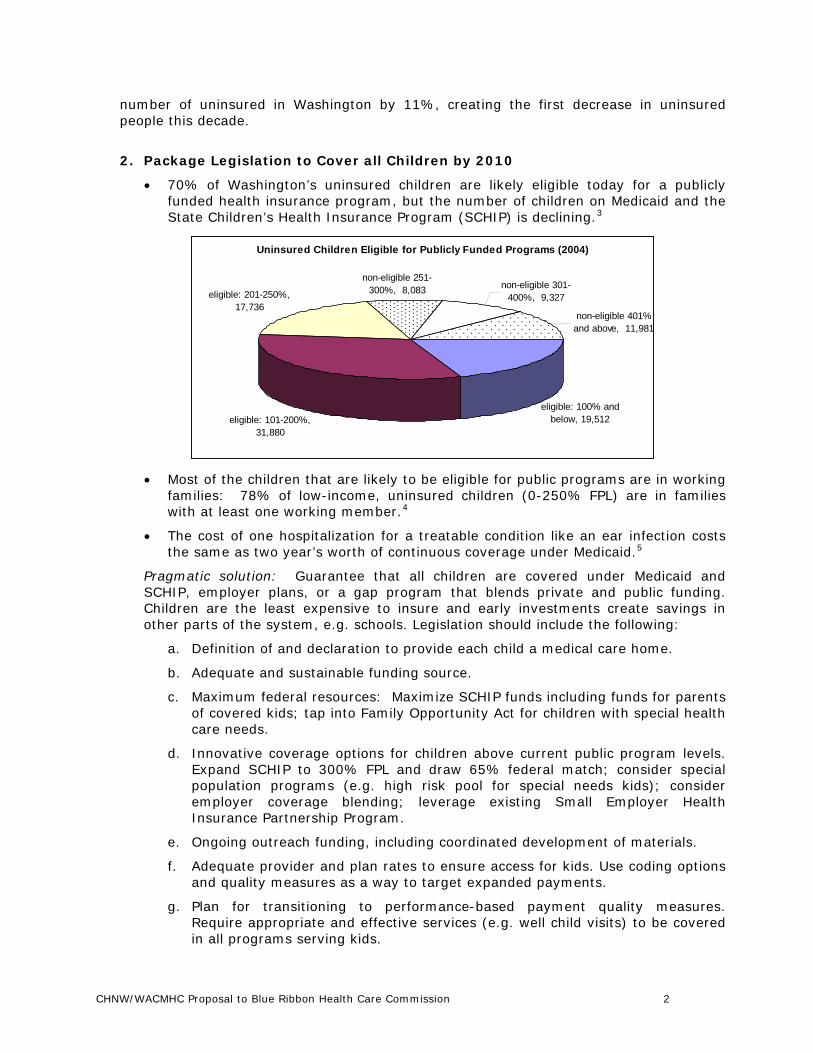
number of uninsured in Washington by 11%, creating the first decrease in uninsured people this decade.
2. Package Legislation to Cover all Children by 2010
eligible today for a publicly 70% of Washington’s uninsured children are likelyfunded health insurance program, but the number of children on Medicaid and the State Children’s Health Insurance Program (SCHIP) is declining.3
Uninsured Children Eligible for Publicly Funded Programs (2004)
eligible: 100% and below, 19,512eligible: 101-200%,
31,880
eligible: 201-250%, 17,736
non-eligible 251-300%, 8,083 non-eligible 301-
400%, 9,327
non-eligible 401% and above, 11,981
Most of the children that are likely to be eligible for public programs are in working
reatable condition like an ear infection costs
Pra dicaid and
funds including funds for parents
d. overage options for children above current public program levels.
e. ing coordinated development of materials.
ns
g. ality measures. Require appropriate and effective services (e.g. well child visits) to be covered in all programs serving kids.
families: 78% of low-income, uninsured children (0-250% FPL) are in families with at least one working member.4
The cost of one hospitalization for a tthe same as two year’s worth of continuous coverage under Medicaid.5
gmatic solution: Guarantee that all children are covered under MeSCHIP, employer plans, or a gap program that blends private and public funding. Children are the least expensive to insure and early investments create savings in other parts of the system, e.g. schools. Legislation should include the following:
a. Definition of and declaration to provide each child a medical care home.
b. Adequate and sustainable funding source.
c. Maximum federal resources: Maximize SCHIPof covered kids; tap into Family Opportunity Act for children with special health care needs.
Innovative cExpand SCHIP to 300% FPL and draw 65% federal match; consider special population programs (e.g. high risk pool for special needs kids); consider employer coverage blending; leverage existing Small Employer Health Insurance Partnership Program.
Ongoing outreach funding, includ
f. Adequate provider and plan rates to ensure access for kids. Use coding optioand quality measures as a way to target expanded payments.
Plan for transitioning to performance-based payment qu
CHNW/WACMHC Proposal to Blue Ribbon Health Care Commission 2
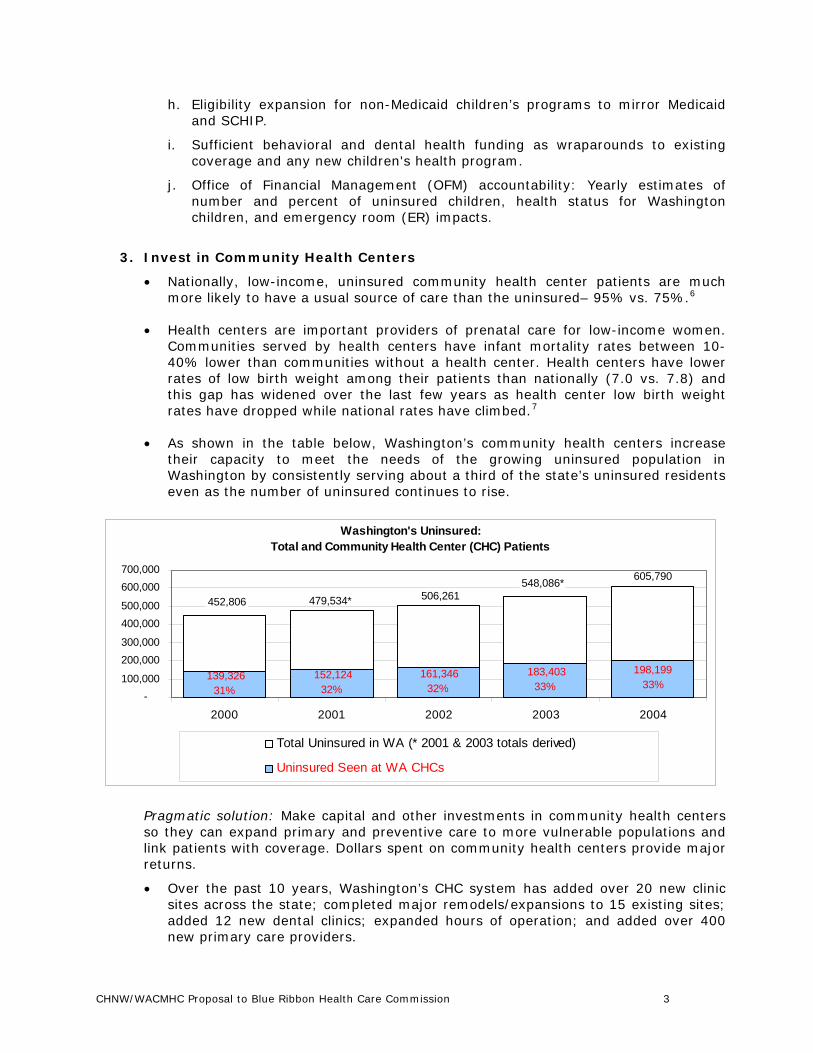
h. Eligibility expansion for non-Medicaid children’s programs to mirror Medicaid and SCHIP.
Sufficient behavioral and deni. tal health funding as wraparounds to existing
j. ancial Management (OFM) accountability: Yearly estimates of
3. Invest
Nat ealth center patients are much more likely to have a usual source of care than the uninsured– 95% vs. 75%.6
state’s uninsured residents
coverage and any new children's health program.
Office of Finnumber and percent of uninsured children, health status for Washington children, and emergency room (ER) impacts.
in Community Health Centers
ionally, low-income, uninsured community h
Health centers are important providers of prenatal care for low-income women. Communities served by health centers have infant mortality rates between 10-40% lower than communities without a health center. Health centers have lower rates of low birth weight among their patients than nationally (7.0 vs. 7.8) and this gap has widened over the last few years as health center low birth weight rates have dropped while national rates have climbed.7
As shown in the table below, Washington’s community health centers increase their capacity to meet the needs of the growing uninsured population in Washington by consistently serving about a third of the even as the number of uninsured continues to rise.
Washington's Uninsured: Total and Community Health Center (CHC) Patients
183,40333%
161,34632%
152,12432%
139,32631%
198,19933%
605,790548,086*506,261479,534*452,806
-100,000
200,000300,000
400,000500,000
600,000700,000
2000 2001 2002 2003 2004
Total U red in WA (* 2 2003 totals d)ninsu 001 & derive
Uninsured Seen at WA CHCs
Pragmatic solution: nvestments in community health centers so they can expand care to more vulnerable populations and nk patients with coverage. Dollars spent on community health centers provide major
12 new dental clinics; expanded hours of operation; and added over 400 new primary care providers.
Make capital and other i primary and preventive
lireturns.
Over the past 10 years, Washington’s CHC system has added over 20 new clinic sites across the state; completed major remodels/expansions to 15 existing sites; added
CHNW/WACMHC Proposal to Blue Ribbon Health Care Commission 3
In just the past four years, Washington’s community health centers have expanded access to an additional 206,000 Washington residents.
Model for quality: All of Governor Gregoire’s health care initiatives are areas with which community health centers are very familiar. The community health center
nts and ensure
B. Foc
1. Uti
A recent study by the Lewin Group found that Medicaid could save $1.5 billion ton State costs and $750 million in r-service temporary assistance for
y Income (SSI) populations to 8
nts—are enrolled in Healthy Options.10
expDishas edictable costs in public
der network, Community Health Plan achieves
2. Create
tive care and spread best practices for some of the most expensive conditions. Through financial assistance from Community Health Plan,
model already incorporates evidence-based practices, chronic disease management, health information technology to drive improvemetransparency, and a focus on wellness and prevention.
Efficient and effective: The community health center model has long proven successful at increasing access, controlling chronic disease, reducing hospital and ER utilization, reducing health disparities and improving overall community health.
us on containing cost and improving quality
lize managed care for expensive populations
total over 10 years - $750 million in Washingfederal costs - by converting current fee-foneedy families (TANF) and Supplemental Securitmanaged care.
Medicaid managed care savings: Enrolling patients in Healthy Options saved Washington State’s Medicaid program nearly $150 million from 2001 to 2003.9
Currently more than half of Washington Medicaid enrollees—primarily low-income kids and their pare
Pragmatic solution: Use managed care to contain costs and improve care for the most ensive populations including those with chronic disease, those in the Aged, Blind & abled program, and those in the Washington State High Risk Pool. Managed care created medical homes, higher quality coverage and pr
insurance programs. Medicaid managed care is a smart investment of state dollars that allows the state to more easily budget expenditures and provide care coordination, utilization management and other value-added services for patients. The responsibility for the patient’s care and the cost of that care is placed squarely with the provider and health plan.
Example: Community Health Plan works with community health centers that have a long history of providing high quality care, cost efficiency and a dedication to all people who need care – insured or uninsured. By working in partnership with its proviconsiderable efficiencies in patient care. For example, the Community Health Plan’s generic prescribing rate of 78% is seven points higher than the national benchmark. This partnership also means that Community Health Plan patients have access to case management, translation and transportation services, group visits, chronic disease management and other innovative and proven programs. CHC-based managed care improves health outcomes while reducing costs.
incentives for best practices and evidence-based care
CHCs participate in chronic disease collaboratives designed to maximize preven
CHNW/WACMHC Proposal to Blue Ribbon Health Care Commission 4
Washington’s CHCs also incorporate Milliman’s evidence-based guidelines into daily clinical practice.
atic solution: Build incentives for best practices and evidence-based care into programs. Link provider pay increases to commitments to expand access and . Use targeted co-payments
Pragmpublicquality and incentives to steer patients toward the most
3.
A recent study found that disparities in health status do not exist among health demographic factors.11
u erculosis case
distrack record on disparity reduction can be an example of how to reduce disparities
4.
Behavioral health: Washington State should seize the opportunity to improve its needed behavioral health
atric visits in the primary care setting
Dentaldisease
storative procedures for children.
appropriate care. Managed care is an existing tool for doing this.
Reduce health and health care disparities
center users even after controlling for socio-
A landmark report from 2003 found that as health centers serve more low-income people in a state, the state’s black/white and Hispanic/white health disparity narrows in such key areas as infant mortality, prenatal care, t brates, and age-adjusted death rates.12
90% of African American and Hispanic community health center patients with hypertension reported that their blood pressure is under control, more than triple that of a comparable national group.13
Pragmatic solution: Implement an action plan to reduce health and health care parities based on race, ethnicity and income. Community health centers’ proven
across the state. Health centers are typically located in underserved areas, are open to all, and provide comprehensive, culturally sensitive care customized to fit the needs of each community. Also, the state could expand the successful Community Health Worker model that CHCs in this state have used to address health disparities in areas such as prenatal care, infant mortality, diabetes and asthma.
Integrate primary, behavioral, and dental health care
delivery model by supporting further integration of much-services with medical and dental services.
Nearly 70% of all health care visits have a primarily psychosocial basis, and 25% of all primary care recipients have a diagnosable mental disorder, most commonly anxiety and depression.14
A combined study by the University of Washington and Harborview Medical Centers showed that a collaborative care treatment model for panic disorder using patient education and psychiresulted in significantly more anxiety-free days and no significant differences in total outpatient costs.15
health: Washington is spending huge sums of money on preventable dental .
More than $50 million is spent each year treating Washington’s children for oral disease. In 2003, Medicaid alone paid more than $27.6 million in dental re
Children who develop cavities in their molars by the age of 10 require on average $2,187 in services by the time they turn 79 in order to maintain each restoration.16
CHNW/WACMHC Proposal to Blue Ribbon Health Care Commission 5
Many of the FQHCs in our state see over 200 dental clients per provider at a time when most provider groups see 1-10 Medicaid dental clients per provider.17
A further decline in dental school enrollment could lead to a shortage in the supply of dentists, particularly in rural areas. Between 1981 and 2001, total dental school enrollment in the US dropped by nearly a quarter - from nearly
18
n-wide average. Statewide half of dentists 19
Pragmamedicaservice unmet
managed care pilot. The state will save money over the long
b.
al residency
5. Reduc
A s of Community Health Centers estimated if all non-emergent care in Washington State in 2006 was delivered at a CHC rather
an estimated $355 20
PracarRed of 2005 includes grant funding opportunities for states to establish
23,000 to approximately 17,000.
Demographic and employment patterns could decrease patient access to dental care, particularly in rural areas, by the end of the decade. Dentists in Washington are older than the natioreport plans to retire by 2013; in rural Washington this figure is 57%.
tic solutions: Invest in integration of behavioral health and dental health with l care. While private providers have been unable or unwilling to provide these s, CHCs have expanded their capacity and expertise to address the
need. Integrating behavioral and dental health care into primary care is a proven cost-effective way to ensure that medical care is not undercut by untreated behavioral or oral health issues. CHCs have led in integrating behavioral and dental health care into primary care but need state support to continue this process. Specific suggestions include:
a. Behavioral health: 1. Provide funding for on-going proven models or pilot projects around integrated service systems, e.g. the General Assistance Unemployableterm by supporting CHC efforts now to hire or contract with behavioral health specialists to work in clinics. 2. Activate new behavioral health codes to allow mental health professionals to treat and bill directly for non-psychiatric diagnoses, e.g. aid diabetics and heart patients with compliance.
Dental health: 1. Make capital investments to allow CHCs to expand their dental services. A small investment made in Washington’s CHC dental facilities last decade led to major expansions in services. 2. Invest in a dentprogram to develop a culturally competent dental workforce that increases access to dental care and reduces disparities in dental outcomes for underserved populations. Unaddressed dental conditions lead to other major health problems, underperformance in school and at work, and unnecessary added costs. Investing in dental residency programs is a cost-effective way to increase access to dental care.
e ER utilization through investments in primary care
tudy by the National Association
than an ER, our state's health care system would have savedmillion.
gmatic solution: Reduce unnecessary hospital ER utilization by investing in primary e, ER diversion projects, and specialty care programs. The federal Deficit uction Act
alternative non-emergency services providers or networks of such providers. These grants are to support providers or networks serving rural or underserved areas with patients that may lack regular access to primary care. Successful models in other states have used community health workers located in emergency rooms to link
CHNW/WACMHC Proposal to Blue Ribbon Health Care Commission 6
patients to more appropriate, cost-effective care at community health centers and other primary care clinics.
Support electronic health record (EHR) conversions 6.
Nearly 2/3 of Washington’s CHCs are well on their way toward implementing EHR atewide system. The CHCs s still occur on the phone,
parmanagement. They also reduce serious medical errors, unnecessary expenses and
State support could ensure that additional community
C. Sho
The rate of employer-based health care coverage in Washington continues to slowly eir health insurance through an 61%.22 Despite these declines,
employers.
PL. This
systems, with a goal of 100% implementation in the stare ahead of the game: 90% of all medical transactionby fax, or on paper.21
While Washington has recognized the importance of helping providers convert to EHRs, there is very little support available for systems that have already started converting.
Pragmatic solution: EHRs allow for increased communication between CHCs and other tners about patient care, effective treatment protocols, and chronic disease
system abuse by patients. EHRs increase the quality of care and control costs. Better electronic practice management and medical records allow for greater accuracy, less staffing, and more office space.
As leaders, Washington community health centers dedicated their own resources to purchase and implement EHRs before foundations and government agencies offered funding for the start-up phase. health centers are able to implement EHRs, and mitigate continuing costs, including initial productivity drops during implementation.
re up the employer-based health care system
decline. In 2000, 63% of residents received themployer; by 2004 this percentage had dropped toemployer-based insurance is still the bedrock of our state’s health care system.
In Washington, eight out of every nine jobs that do not offer health coverage are in small firms employing 50 or fewer workers.23
In 2005, every private family insurance premium included $1,206 to cover uncompensated care costs for the uninsured.24
Pragmatic solutions: Give large employers the option of providing employee health insurance coverage or contributing to the cost of covering employees through state programs. Require insurers to pass on lower premium costs to
Create affordable buy-in options for small employers, with a focus on low-income employees. Legislation passed in 2006 created the Small Employer Health Insurance Partnership Program for small business employees living at up to 200% Fplan could be expanded to 300% FPL to broaden access and participation. If private insurers will not offer coverage under the small business assistance program a Basic Health-like program for this market should be created. BHP has considerably lower trend increases and administrative costs, and is already set up to determine eligibility, handle enrollee premiums, and provide subsidies.
CHNW/WACMHC Proposal to Blue Ribbon Health Care Commission 7
Endnotes: 1 Analysis presented in the upcoming September 2006 Working for Health publication, It’s
Not Too Late: I-773 Revenues Can Increase Access to Care for Washingtonians. Private insurance: The average annual per member cost is defined as the national annual premium cost for individual health insurance coverage, and the 2000 - 2005 data is from Kaiser Family Foundation/Health Research and Education Trust Employer Health Benefits Annual Surveys. (http://www.kff.org/insurance/ehbs-archives.cfm ) BHP: Average annual BHP cost is defined as the average state cost per member plus the average individual per member cost for a year’s coverage in the BHP and was received from the Washington State Health Care Authority, the agency which administers the BHP, on May 12, 2006.
2 Analysis presented in the upcoming August 2006 Working for Health publication, It’s Not Too Late: I-773 Revenues Can Increase Access to Care for Washingtonians. I-773 revenue figures courtesy of the Department of Revenue and Basic Health cost figures courtesy of the Health Care Authority.
3 Washington State Planning Grant on Access to Health Insurance, “Report to the Secretary,” September 30, 2005.
4 Washington State Planning Grant on Access to Health Insurance, “Report to the Secretary,” September 30, 2005.
5 Cost is split between federal and state. Comparable hospitalization would cost the same as four year’s worth of state spending. Data obtained from the Washington State Hospital Association, Sept. 30, 2004 by the Children’s Alliance. 2002 mean cost of one hospitalization for an ear, nose or throat infection = $3920; annual cost for one year of Medicaid coverage= $1,700.
6 NACHC, “A Nation’s Health at Risk II,” August 2004. 7 NACHC, “A Nation’s Health at Risk II,” August 2004. 8 The Lewin Group, “Medicaid Capitation Expansion’s Potential Cost Savings.” Sponsored by:
Association of Community Affiliated Plans and Medicaid Health Plans of America, April 2006. 9 The Lewin Group, “Medicaid Cost Containment: Report No. 1,” October 2002, p. 19.
Prepared for the Washington State Legislature. Available at: www.lewin.com. 10The Lewin Group, “Medicaid Cost Containment: Report No. 1,” October 2002, p. 19.
Prepared for the Washington State Legislature. Available at: www.lewin.com 11 NACHC, “A Nation’s Health at Risk II,” August 2004. 12 NACHC, “A Nation’s Health at Risk II,” August 2004. 13 NACHC, “A Nation’s Health at Risk II,” August 2004. 14 U.S. Department of Health and Human Services. (2001). Report of a Surgeon General’s
working meeting on integration of mental health services and primary health care. Available at: www.surgeongeneral.gov/library/mentalhealthservices.PDF4.
15Wayne J. Katon, MD; Peter Roy-Byrne, MD; Joan Russo, PhD; Deborah Cowley, MD, Departments of Psychiatry and Behavioral Sciences, University of Washington Medical School, Cost-effectiveness and Cost Offset of a Collaborative Care Intervention for Primary Care Patients With Panic Disorder. 2002;59:1098-1104.
16 Based on an analysis of more than 77 million Delta Dental claims submitted to the Dental Data and Analysis Center. Available at: www.dentaldac.com.
17Washington State Department of Social and Health Services: Washington State Medicaid Population FY 2004-2005 Dental Services Program. Provider Caseloads by Provider Specialty (as of 5/30/06).
18American Dental Association. 2000/01 Survey of Predoctoral Dental Education. Academic Programs, Enrollment, and Graduates, Vol 1.Chicago, 2002.
19 Washington State Dental Association, Dental Workforce Study 2001.
CHNW/WACMHC Proposal to Blue Ribbon Health Care Commission 8
NACHC, “2006 Access to Community Health Databook: Washington”. This report utilizes 20
Kaiser Family Foundation, Medical Expenditure Panel Survey (MEPS) and Uniform Data System (UDS) data to calculate: 1) the cost of non-emergency ER visits in Washington, and then 2) subtract the cost of care at a community health center for the same number of visits. The result is a calculation of $355 million in extra spending for non-emergency care received at an emergency room above the cost of care at a community health center. http://nachc.org/research/wa.asp.
21
22
24
Schmit, J. & Appleby, J. USA Today. July 20, 2004. Report to promote e-records for health care. Cited by Tommy Thompson, U.S. Secretary of Health and Human Services. Analysis of Washington State Population Survey data, 2000-2004.
23 Milliman, Small Business Focus Group Results, prepared for the State of Washington, December 2005. Families USA. Paying a Premium. June 2005.
CHNW/WACMHC Proposal to Blue Ribbon Health Care Commission 9

Tab 10
The Value of Community-Based Health Proposal to: The Blue Ribbon Commission on Health Care Costs & Access
Submitted by: Spokane’s Community-Minded Enterprises (formerly the Health Improvement Partnership) under the Auspices of the Washington State Department of Health
September 1, 2006
1. What do you propose be done to realize the vision and goals for Washington State established by the Blue Ribbon Commission on Health Care Costs and Access?
This proposal describes how a community can strengthen preventive health across the entire community. Although the strategies involved will include the traditional healthcare system, this approach will transcend that system by 1) improving upon established healthcare access systems, 2) identifying leverage points through which a community can influence the health behaviors of its citizens, and 3) engaging community systems in a broad, creative campaign for better health through prevention rather than just treatment, thereby broadly improving the health of the community population and reducing the incidence of unnecessary and costly crisis care.
We propose a pilot in Spokane that will measure and quantify the financial savings involved as well as the health improvements realized in this community-based, preventive approach. This pilot will be replicable in other communities in the future.
At the first meeting of the Blue Ribbon Commission, Commission members discussed balancing responsibilities among the three stakeholders in healthcare: the individual, the employer, and the State. This proposal suggests that there is a fourth stakeholder, one which can ease the burden borne by the other three. The fourth stakeholder is the community.
By investing in community-based, prevention-oriented solutions, the Washington’s healthcare leaders can transcend the dynamics that have undercut so many previous reform efforts. These efforts, though well-intentioned, have had the tendency to pit one healthcare interest group against another. When communities promote better health among their citizens, everyone wins.
Historically, the problem with community-based prevention solutions has been that though they seemed to make sense, they were difficult to measure and quantify. In the face of urgent budgetary pressures, their results have seemed to be vague and long term. This proposal overcomes these problems by engaging professional evaluators to solidify a measurable financial return on investment within a five-year timeframe from the initial State investment. This pilot program will demonstrate how the State can incentivize community-based health prevention solutions in a way that saves significant State dollars over time. The replicability of the pilot will be built into its initial design.
We seek a commitment of a special matching fund of $1 million to be designated by the legislature in 2007 to be made available through the Washington State Department of Health for
a one-to-one match of funds to be raised by a coalition in the Spokane community and implemented via Community-Minded Enterprises, a Spokane-based non-profit which has spearheaded the development of the coalition and the plan and which is in the process of leading the fund development. These funds will be used to execute the plan described in this proposal. We project a minimum 5-to-1 return on this public investment, measurable within five years.
The plan will incorporate the following ten elements:
1. The Community Council. A diverse array of individuals and organizations will co-create the Value of Community-Based Health (or Value of Health) initiative. As much as possible, these co-creators will approximate and represent the collective “voice of the community.” Anticipated institutional partners include local school districts, the regional public health district, community clinics, a local communications firm, a collaboration of faith-based institutions, the Spokane Alliance (a grassroots policy group), the Chamber of Commerce, local government, the media, local foundations, and local universities. At the same time, we will invite the participation of a set of individuals with the personal vision and commitment to participate deeply. These individuals will speak from their own experience and not formally represent any group. They will be parents, teachers, laborers, elders, members and representatives of socio-economic and ethnic minority groups—and, especially, young people. The “chartering” and development this Community Council will be a major focus of the first phase of the project. Once in place, the Council will reach out to others to assemble a map of assets and an array of partnerships which will sustain the Value of Health campaign.
2. Youth Engagement: The future of our community lies with our youth. It will not be possible to establish a sustainable, healthier community without engaging youth as long-term leaders of the process. We will do that first by linking strongly with the public schools; second, by linking strongly with the various liaison organizations that reach disconnected youth; third, by involving a widening array of individual youth voices (both mainstream and disconnected youth) in the planning as well as the publicizing of the Value of Community-Based Health; and, fourth, by making youth outreach one of the core features of the public awareness campaign.
3. Health at Work: With an eye toward (and a keen interest in) new state policy incentives for worksite wellness, perhaps with Spokane as a pilot site, we will prioritize assistance for employers in offering wellness support services to employees (See “Ongoing Support for Change,” below). We anticipate the potential to partner with other existing organizations in this support and to help them expand their services. We will also use the worksite as an access point to the family. The wellness services will be designed to reach not just to the employee, but the family members at home.
4. Inclusiveness: A community-wide initiative such as the one we propose cannot succeed unless it acts as a unifying force, bringing together people from many backgrounds and walks of life. This kind of inclusiveness does not occur without special outreach strategies designed to overcome traditional barriers. Both in the formation of the Community Council and in the unfolding of the various prevention strategies, we will use creative inclusiveness and outreach strategies as critical elements of our design. For example, instead of simply employing a "one-size-fits-all" approach, we will engage the representatives from the various diverse populations
within our community, such as people with various disabilities; elders; both tribal and urban Native Americans; the gay, lesbian, and transgender population; refugees and immigrants from Eastern Europe, the Balkan Peninsula and Africa, and the Latino, African-American, and Southeast Asian communities, to name a few. Strategies and methods will be tailored to each culture’s needs based on their recommendations and design. This method has been successfully employed over the past eight years in Community-Minded Enterprises’ Health For All project, and has had the added effect of already establishing us as an ongoing partner with most of these communities.
5. Asset Mapping: The essence of prevention lies in identifying and building from individual and communal assets. Individuals overcome obesity or a smoking habit or depression not through self blame, but through strengthening belief in their capacity. Communities overcome widespread poverty or widespread substance abuse not through focusing on the details of these problems so much as through mobilizing alternative, positive, unifying strategies that sweep people into new configurations of success. The Value of Health campaign will identify and promote a positive communal self-image based on research into and innovative definition of our community’s assets.
6. Collaborative Prevention Initiatives: We propose to stimulate new collaborative prevention initiatives by supporting approximately ten new high profile Value of Health Partnershipswhich will launch various prevention-oriented system change efforts. In the term “system change” we include a spectrum of possibilities: anything from a better way to reach an underserved immigrant neighborhood to an integration of diverse human service information systems to a new school-neighborhood strategy to reach kids who are dropping out.
Within certain criteria, the ten Partnerships will be chosen for the diversity of their approaches. The Community Council will set these criteria. They will include:
Does the Partnership promise to reach significant groups of people and lead to system change that actually impacts people’s lives? Does it involve an innovative (or unexpected) mix of new collaborators? Will its strategies reach pockets of underserved people, especially those for whom the messages of the public awareness campaign might not mean a lot without significant support? To what degree does the Partnership focus on children?
In conjunction with various funders, we will provide mini-grants to these collaborations. The public awareness campaign will feature their progress. These selected initiatives will serve as laboratories in which different types of interventions and different prevention topics will be studied to determine their effect on community health.
7. Public Education Campaign: We envision all the Value of Community-Based Health activities occurring under the banner of a major public awareness and education campaign. This campaign will reach the general public as well as key institutional audiences with messages that move people toward behavior change and system change; it will also share the stories of individuals and institutions as they take adventurous positive steps. Additionally, the public
education campaign will constitute a key vehicle for generating the incentives that fuel the initiative: a key incentive being public recognition itself.
Founded on the view that communities under-invest in preventive health primarily because professionals and citizens alike do not fully appreciate its multiple positive benefits, the campaign will vividly, specifically describe the value of health to young families, to teachers, to employers, to grandmothers, to the regional economy, to policy makers, to teenagers, etc. In so doing, it will highlight linkages between different people and different institutions—and how we all create an interconnected web in which health and quality of communal life become inextricable. It will also highlight the linkage between social and economic factors and health—reinforcing the key social and economic strategies that the campaign is emphasizing. It will celebrate the courage involved in taking one positive step toward well-being, and it will prize the diversity of such steps: from an employer launching a non-smoking program to a landlord who links tenants with community services to a second-grade child proudly unwrapping a healthy bag lunch in front of her friends. It will refer people to the Health for All community information line for advice about access to tools and support services, including access to affordable preventive healthcare.
In designing this campaign, we will conduct best-practice research to learn which prevention messages have resulted in a measurable improvement in community health, and we will also look to community members (through surveys, key informant interviews, and focus groups) for input on how to structure the campaign. Building on Community-Minded Enterprises’ history,we will again seek the involvement of all local media organizations.
8. Ongoing Support for Change: It will be important to link the Value of Community-Based Health public awareness campaign with a source of follow-up support for both individuals as well as technical assistance for groups and organizations who want to get involved. Over the last five years, Community-Minded Enterprises’ Health for All information center (HFA) has advised more than 50,000 Eastern Washington residents regarding their healthcare access options and has helped more than 20,000 uninsured people become insured. Health for All is well positioned to act as the call-in support hub for The Value of Community-Based Health. Access to preventive healthcare will of course continue to be a key component of its services. But with the inauguration of The Value of Community-Based Health, Health for All will expand its services to include various forms of prevention advice and will collect the individual success stories that will fuel the public education effort.
In addition to the organizations involved in the Value of Health Partnerships described above, (which will receive significant levels of technical assistance), there will be other groups and organizations—such as an elementary school PTA, a fourth-grade classroom, a Head Start staff, a Town Council, a grocery store, an auto repair shop, etc.—which will respond to the public call to action. These groups will also contact the Health for All information line and will be referred to the technical assistance wing of The Value of Community-Based Health for advice about strategies, resources, tracking results, and celebrating successes.
9. State Policy. We will keep in close contact with the unfolding policy dialogue at the State level, including the work of the Governor’s Blue Ribbon Commission, for ongoing policy innovations which incentivize community-based prevention.
10. The Value of Health Metrics. Anchoring all the above will be the Value of Health metrics: a comprehensive array of assessment and evaluation components. With the help of professional researchers from local universities, Community-Minded Enterprises assessment/evaluation staff will 1) Scour the national data to quantify the multiple long-term community-wide benefits of prevention; 2) Act as consultants to the Community Council and to organizations and groups to help them establish the value of health in their terms (for example, for an employer, defining the potential bottom-line benefit of a wellness program) and to help them monitor the benefits of their prevention initiatives; 3) Establish a key set of community-wide value of health indicatorsto monitor over time and to publicize as an ongoing report card on the progress of the effort; 4) Establish and monitor a core set of Value of Health indicators which allow us and others to monitor our overall success—that is, the ability of a community to “strengthen preventive health across the entire community—” a critical factor for making the effort replicable; 5) Work incrementally toward the development of a value of health currency, a flexible, multi-faceted way to translate preventive steps into savings, discounts, and rewards for those who take them; and 6) and most important, establish a mechanism for delineating and reporting on financial return on investment for the initial state investment in the project.
2. How will implementation of your proposal enhance, hinder or otherwise impact the achievement of the vision and each of the goals established by the Commission? How do you know?
The Vision: The Value of Community-Based Health will help build “a system which provides every Washingtonian the ability to obtain needed healthcare at an affordable price” by demonstrating how the precursors to health and healthcare—the preventive behaviors and understandings that promote healthy living—can become part of the fabric of community life. As communities (via neighborhoods, schools, workplaces, public programs, etc.) take more responsibility for promoting healthy behaviors, the overall cost of healthcare will go down for everyone.
By using sophisticated research models to measure the financial return on state investment directly in terms of avoided crisis care, we will take this “community prevention quotient” issue out of the clouds and make it quantifiable and replicable.
The Goals:
1) Improving AccessOur public information campaign and our call-in help line will include specific guidance for people in how to enroll on available health coverage and how to understand if they are eligible (Community-Minded Enterprises has eight years experience doing this work).
2) Improving Health
Our Value of Health engagement process reaches deliberately to diverse ethnic and minority groups and to various under-engaged populations (see above). As for making Washington one of the healthiest states in the nation, we believe that this pilot could attract national attention, and a roll-out of incentives for community-based health prevention could be a groundbreaking program nationally that would attract significant resources to Washington.
3) Improving Affordability The core of the Value of Community-Based Health idea is to make healthcare more affordable by incentivizing and shifting responsibility for prevention to a local community context, improving overall health status community by community, and thus reducing unnecessary and costly crisis care across the statewide population.
How do we know? There is a vast body of research and best practice which makes these conclusions inescapable. What we need now is a pilot test in a community like Spokane with a rigorous evaluation component that will quantify the financial return on investment.
3. Is your proposal modeled after an existing policy or program within Washington or elsewhere? If so, describe the policy or program and its outcomes.
Elements of this program have been modeled after other successful programs that have been conducted by Community-Minded Enterprises. For example, through our work on the Healthy Kids Now! public information campaign, we have been able to help over 125,000 previously uninsured children in Washington State access health insurance. We will build on the strategies learned through this program, which was designated a national best practice for conducting public information campaigns.
In addition, through our Health for All program, we have helped more than 50,000 uninsured individuals in eastern Washington access healthcare. More than 20,000 uninsured people became insured through our efforts.
The proposal has taken shape over the past two years through a careful planning process involving extensive research into the successful elements of community-based prevention as well as input from a broad base of community members as well as guidance from the W.K. Kellogg Foundation.
4. Will your proposal impose costs on individuals, businesses or government? Will these costs by time-limited or ongoing? Can you estimate how much these costs will be, or suggest how such an estimate could be made? How much, if any, of these costs will be offset by corresponding savings?
The financial cost of the project will be $2 million over the course of five years. We are seeking support from the State in the form of a $1 million pledge to match one-to-one dollars that the Spokane community coalition raises (primarily from private sources) in support of this program. We are in the process of seeking these funds from the Kellogg Foundation and others.
In addition, there will be a much larger outlay of volunteer and in-kind contributions from diverse individuals and organizations in the Spokane community who will see it in their interest to take advantage of the campaign as an opportunity to achieve and/or promote breakthroughs in preventive health.
This proposal is undertaken in the spirit of and with the awareness of the Communities Connect collaboration, to which the authors of the proposal (Community-Minded Enterprises) belong. Communities Connect would be a natural vehicle for its replication in other communities.
Can you estimate how much these costs will be, or suggest how such an estimate could be made?
The $ 1 million in state funds plus the $1 million raised privately ($2 million total) will pay for the coordination costs of this program, including the strong public education, technical assistance, and evaluation components. Project coordinators will leverage a powerful contribution of grassroots volunteer and in-kind involvement from the Spokane community based on the personal and social benefit to be gained from prevention activities.
We project that an investment in the Value of Health will yield a 5:1 financial return for the State dollars after five years. In other words, we will be able to track $5 million or more in avoided public crisis care costs due to specific interventions—a savings that would not have occurred otherwise. In addition to money saved through a decrease in claims made to state-funded insurance programs through appropriate and timely preventive measures and primary care, the local economy will also benefit. For example, by helping the uninsured access subsidized coverage or care before they get sick, the local hospital system is less likely to take a financial hit from an uncompensated emergency room visit for a condition that could have been prevented through a timely visit to a primary care physician. Plus, when more eligible individuals access subsidized insurance, fewer businesses pay the costs associated with employing uninsured people. In addition, healthier people mean fewer work and school days missed due to illness. In other words, there will be innumerable secondary benefits or positive ripple effects, some of which may be difficult to measure. But the 5-to-1 return on investment will be measurable.
5. How does your proposal reflect collaboration among various stakeholders? Which stakeholders have endorsed it?
The proposal is the result of numerous planning sessions involving Community-Minded Enterprises’ staff and board and an array of more than twenty-five community partners interested in community-based access and prevention, including (partial list):
Spokane Neighborhood Action Programs New Priorities Foundation Desautel Hege Communications Spokane Regional Health District Partners with Families & Children HollisterStier Laboratories LLC
Providence Healthcare Community-Minded EnterprisesWashington State University Spokane Marycliff Institute The City Of Spokane Inland Imaging Volunteers of America
6. What are the obstacles to implementing your proposal? Who will object to it and why? How do you suggest these objections be addressed?
One challenge of course will be to raise the $1 million that will trigger the matching fund we seek from the legislature. But with the legislature’s commitment, we believe that this will be doable. We work with a lot of philanthropic organizations nationally, and we understand that many are eager for an opportunity to invest in a pilot project involving state-level incentives forcommunities to increase community-based prevention. If states can successfully incentivize communities to come together locally, plan creatively and take a more active role in the “upstream” healthcare issues, the issues that help people be healthier and thus lower overall crisis healthcare costs, then a national trend could develop in the direction of building prevention capacity into communities. Foundations seem to be interested in investing in this concept.
Of course, if we fail to raise the matching amount, the state legislature will not have risked anything.
Many national foundations understand communities to be an under-utilized resource in the healthcare reform equation. Though often disorganized, though often lacking an effective convening or coordinating entity, local communities possess unique assets that can contribute to healthcare access and general healthcare reform solutions.
Many people do not understand that it is possible to coordinate collaborative, grassroots campaigns at the community level. State-level planners can sometimes fall into the habit of thinking that improvements have to be choreographed from the state level only. Our track record and the work of countless organizations like ours demonstrates that local community coordination is not only a critical ingredient of healthcare reform, it is also an available ingredient, given the right encouragement from state leaders.
Contact Information Daniel Baumgarten Executive Director Community-Minded Enterprises 421 W Riverside Ave. Suite 353 Spokane, WA 99201
V 509-444-3088 x246 F 509-444-3077 [email protected]

Tab 11
To: Blue Ribbon Commission Member From: Steve Critchlow Re: Resolution of health care availability.
Primary proposal: +Enact Laws that requires all agencies in the state use a common set of the definitions of terms in regulating, or purchasing Health Care.
Secondary proposal: +Enact Laws that mandates the collection, and dissemination of Evidenced Based Medical date.
Benefits: +Responding to the BRC vision and goals, consistent definitions as outlined in this proposal will assure equity for all individuals insured through private or publicly funded plans.
Costs:+Initial funding may be required to compile the definitions into a single document. +When definitions are applied uniformly and EBM data used to satisfy experimental & investigational criteria clearly established, the cost of appeals could be reduced or eliminated from insurer’s actuarial formulas. +Reduced cost should be realized as EBM data is disseminated allowing insurers both state and private to eliminate the expense of technical review corporations.
Patient Bill of rights (PBR) RCW 48.43.500 It is the intent of the legislature that enrollees covered by health plans receive quality health care designed
to maintain and improve their health. The purpose of chapter 5, Laws of 2000 is to ensure that health plan enrollees: (1) Have improved access to information regarding their health plans; (2) Have sufficient and timely access to appropriate health care services, and choice among health care providers; (3) Are assured that health care decisions are made by appropriate medical personnel; (4) Have access to a quick and impartial process for appealing plan decisions; (5) Are protected from unnecessary invasions of health care privacy; and (6) Are assured that personal health care information will be used only as necessary to obtain and pay for health care or to improve the quality of care.
Evidences Based Medicine (EBM) will provide both patient and provider clear treatment recommendations and guidelines that can assist in selecting appropriate treatment options, thereby satisfying intent number 1 of the PBR. Additional initiatives to bring (EBM) to fruition have the potential to resolve many current issues surrounding the introduction of new treatments. Clear laws for EBM data will facilitate new health technologies as they develop allowing transition from FDA clinical trials to common patient treatment. EBM data must not preclude the use and reasonable insurance
1 of 3
coverage of new treatments, medications and devices as this these new technologies achieve pre-established data credibility.
As the Blue Ribbon Commission (BRC) and the legislature consider various aspects of health care and improving access to it, at the same time remaining true to Patient Bill of Rights (PBR), many aspects must be considered. It seems that items 2 and 3 of this law have waned in importance with respect to preserving the financial health of insurance companies, both profit and non-profit.
Satisfying intent no. 2 requires the availability of continually innovative treatment methods. Thus; adopting the provisions of existing codes, from MAA, using as example WAC 388-531-0050 and 388-531-0550 into the RCW that includes the privately insured seems prudent. This action would expand the requirements and provide the same definitions for terms used in all of the health care systems in the state. Obviously a review and consolidation of all definitions used for medical care must be performed. A few additional definitions would be required to remove ambiguity in some areas.
Explanation:Laws (RCW) in force for State purchased or supported health care and code (WAC) that regulates the private health insurance companies are not the same. For example, WAC 388-531-0050 and 388-531-0550 etc. applicable to MAA (DSHS) and have defined most of the terminology for use by those agencies. There are no definitions of terms in WAC or RCW that apply to the private health insurance industry. WAC 284-96-015, 284-50-377, 284-46-507 others related to privately coverage administered under the OIC are for experimental or investigational treatment; however these codes actually allow insurers to define coverage as they chose. Because there is no other control of definitions for health care insurance carriers they make their own definitions. The result of this inequity leads to inconsistent access for many covered by privately for health care coverage in Washington State. Coverage paid from personal budgets.
Recognizing the complexity of the various factors noted above, suggested criteria for law is offered.
Note also: the state of Washington oversees doctors and their credentialing. We need to allow those doctors and surgeons to do their job. Create laws that guide and allow doctors actively involved the clinical trial process to provide new treatments until sufficient EBM data is collected. Encourage them to train others.
Under the authority of the State agencies – Washington State Legislature, Health Care Authority, Dept of Health, Office of Insurance Commissioner and Governor consider the following points in the creation of new Laws for Insurance companies.
By law establish the same clear definitions of terms for all health care in the state. MAA, State Purchased Health care, OIC and L&I.
2 of 3
o Definitions of terms currently in WAC 388-xxx-xxx under the “definition” heading of each section should be applied uniformly and consistently.
o Add additional terms that require definitions.
Mandate by Law that clear un-ambiguous criteria be used by all agencies, and insurance carriers for determination of experimental or investigational drugs devices and treatments. Existing WAC 388-051-0550 is satisfactory adding EBM data as it comes on line.
Create Laws that compel the collection of anonymous data on patient treatment outcomes. Evidence Based medicine (EBM)
o Within these laws would be methods to transition to actual EBM as data becomes sufficient and credible.
o Establish guidelines that doctors could and should use EBM data as first line treatment options for their patients.
o Establish by law statistical qualifications or credibility criteria levels for EBM data that must be achieved prior to mandating, recommending or limiting a treatment option.
o These laws would require the compilation and dissemination of data into formats that the Health care professional will use to evaluate treatment effectiveness.
o For new treatments, with insufficient EBM data, give preference to Institutions, Surgeons etc. that have actively participated in the FDA clinical trials. Establish that if the FDA documents demonstrate efficacy equal to or better than generally accepted treatment that insurers shall cover that new treatment at least at generally accepted treatment rate. Where a generally accepted treatment is not comparable to the new treatment, use the existing criteria as WAC 388-051-0550 provides.
o As EBM data on new treatment becomes sufficient create a process that incorporates it and encourages/ requires insurers to adopt them into their actuarial formulas.
Reward/ require insurers that use their negotiation skills and buying power to contract with suppliers for medication, and devices, and hospital services, etc.
3 of 3
Attachment to: Resolution of Health Care Availability Subject: Definitions of Medical terms From: Steve Critchlow
Intent: Primary request: Enact Law that requires all agencies in the state use a common set of the definitions of terms in regulating, or purchasing Health Care. Make the definitions currently in WAC 388- consistent in all health care regulated by state agencies.
To satisfy the primary request the following is offered. Using, as a bases, the existing definitions of terms in WAC 388- create law that defines all terms to be applied consistently. Additional definitions to be add to support existing Law. Some identified terms and definition are provided. Obviously a review and consolidation of all definitions used for medical care must be performed.
(New Law)This Law shall be applicable to all State agencies under legislative authority includingMedical Assistance Administration (MAA), Department of social and Health Services (DSHS), Office of Insurance Commissioner (OIC), Labor and Industries (L&I) Health Care Authority (HCA) (add any not listed)
All agencies, commissions, authorities, or state departments given authority by Legislation within Washington State to promulgate code (RCW) for the regulation of business for medical services, medical insurance, or administer law (WAC) for medical services, medical insurance, or any health care related activities shall use a single common set of definitions for all terms within those Codes and Laws.
A common set of definitions to satisfy the above requirements shall become effective on June 1 2007.Where existing definitions occur under in different sections, resolve discrepancies to adopt the definitions applicable with preference in the following order the patient, medical professional, medical clinic or hospital. When new definitions are deemed necessary, temporary authority is granted to the applicable state agencies to adopt and submit new definitions as needed pending approval at the next regular session of the legislature.Definitions used by insurers in contracts including subscriber benefit books shall conform to definition provided in (approved new law -WAC) and not subject to the discretion of the insurance company.
Current Law (In force, Existing) WAC 388-531-0050 (Include all definition of terms included in all other WACs (LAW) applicable to health care.)
(Modified)(Only the word expert to be replaced as indicated)
Peer-reviewed medical literature, defined as medical literature published in professional journals that submit articles for review by experts Medical Professionals who are not part of the editorial staff. It does not include publications or supplements to publications primarily intended as marketing material for pharmaceutical, medical supplies, medical devices, health service providers, or insurance carriers.
(New) (Undefined term)Medical Profession or Professional, defined as a physician licensed under chapter 18.71, or 18.57 RCW and actively practicing and Board Certified and member in good standing of national association of medical physicians in the discipline applicable to service or treatment under review and is not affiliated or employed by any insurancecompany, affiliate, or agent. A physician licensed under similar rules or laws within another State and actively practicing shall satisfy this requirement.
Example: A Physician or surgeon reviewing a device for bone prosthetics as experimental or investigational shall be licensed in a US state and be a fellow in good standing of the American Academy of Orthopedic Surgeons (AAOS)
(New) (Undefined term) Generally accepted, within a document is defined to mean knowledge or information on a surgical method, device, treatment, or pharmaceutical, reported in a peer-reviewed literature for treating a condition or disease, available to the majority of medical professionals meeting the Medical Profession or Professional definition.
(Existing WAC 388-531-0050) (Currently not applied to Private insurers) "Experimental" means a term to describe a procedure, or course of treatment, which lacks sufficient scientific evidence of safety and effectiveness. A service is not "experimental" if the service:
(1) Is generally accepted by the medical profession as effective and appropriate; and
(2) Has been approved by the FDA or other requisite government body, if such approval is required.
(Existing WAC 388-531-0050) (Currently not applied to Private insurers) "Investigational" means a term to describe a procedure, or course of treatment, which
lacks sufficient scientific evidence of benefit for a particular condition. A service is not "investigational" if the service:
(1) Is generally accepted by the medical professional as effective and appropriate for the condition in question; or
(2) Is supported by an overall balance of objective scientific evidence, in which the potential risks and potential benefits are examined, demonstrating the proposed service to
be of greater overall benefit to the client in the particular circumstance than another generally available service. Satisfaction of this criterion shall be given to medical professionals (see Definition) and Medical centers were the development of the technology and treatment has taken place for that otherwise and Meet the FDA approval requirements. i.e. satisfactorily completed clinical trial process.
(New)“Off-label use” In the United States, the regulations of the Food and Drug Administration (FDA) permits physicians the discretion to prescribe approved services as treatment for conditions not specifically identified within the FDA approval or intended indications. This practice is known as off-label use. (New Definition from FDA and other sources)
The use of a service, drug or device as “Off Label” in reference to an otherwise FDA approved service shall NOT be considered Experimental or Investigational.
(The following section is modified from WAC 388-531-0550 with a suggested changes or additions in blue). (1) When MAA makes a determination as to whether a proposed service is experimental or investigational, MAA follows the procedures in this section. When a service or treatment does not meet the requirements of definitions for Experimental or investigational the following criteria shall be used such determination for the service in question: The policies and procedures and any criteria for making decisions are available upon request.
(2) The determination of whether a service is experimental and/or investigational is subject to a case-by-case review under the provisions of WAC 388-501-0165 which relate to medical necessity. MAA also considers the following:
a) Evidence in peer-reviewed medical literature, as defined in WAC 388-531-0050, and pre-clinical and clinical data reported to the National Institute of Health and/or the National Cancer Institute, concerning the probability of the service maintaining or significantly improving the enrollee's length or quality of life, or ability to function, and whether the benefits of the service or treatment are outweighed by the risks of death or serious complications;
(b) Whether evidence indicates the service or treatment is more likely than not to be as beneficial as existing conventional treatment alternatives for the treatment of the condition in question;
(c) Whether the service or treatment is generally used or generally accepted for treatment of the condition in the United States; (d) Whether the service or treatment is under continuing scientific testing and research; The collection of clinical data for use in ongoing effectiveness studies for a particular service shall not be construed to mean the service is experimental or investigational.
(e) Whether the service or treatment shows a demonstrable benefit for the condition;
(f) Whether the service or treatment is safe and efficacious;
(g) Whether the service or treatment will result in greater benefits for the condition than another generally available service; and
(h) If approval is required by a regulating agency, such as the Food and Drug Administration, whether such approval has been given before the date of service.
(3)MAA applies consistently across clients with the same medical condition and health status, the criteria to determine whether a service is experimental. A service or treatment that is not experimental for one client with a particular medical condition is not determined to be experimental for another enrollee with the same medical condition and health status. A service that is experimental for one client with a particular medical condition is not necessarily experimental for another, and subsequent individual determinations must consider any new or additional evidence not considered in prior determinations.
(4) MAA does not determine An Insurance company may not determine a service or treatment to be experimental or investigational solely because it is under clinical investigation when there is sufficient evidence in peer-reviewed medical literature to draw conclusions, and the evidence indicates the service or treatment will probably be of greater overall benefit to the client in question than another generally available service. (WAC 388-531-0550)
(5) All determinations that a proposed service or treatment is "experimental" or "investigation" are subject to the review and approval of a physician who is:
(a) Licensed under chapter 18.57 RCW or an osteopath licensed under chapter 18.71RCW; and actively practicing and Board Certified and member in good standing of national association of medical professionals in the discipline applicable to service or treatment under review and is not affiliated or employed by any insurance company, affiliate, or agent. A physician licensed and actively practicing under similar rules or laws within another State shall satisfy this requirement
(b) Designated by MAA's medical director to issue such approvals; and
(c) Available to consult with the client's treating physician by telephone.

Tab 12
Washington State Blue Ribbon Commission onHealth Care Costs & Access
Proposal
Submitted by: Elaine Smitha, CEO/President Evolving Ideas Institute PO Box 3695 Olympia, WA 98509 360-491-3714
In the United States affordable healthcare is a huge issue. “In 2003, an estimated 18 million adults ages 19-64 were not working because of health reasons. Sixty-nine million workers reported missing days due to illness. Fifty-five million workers reported a time when they were unable to concentrate at work because of their own illness or that of a family member. Together, labor time lost due to health reasons represents lost economic output totaling $260 billion per year”.
––The Commonwealth Fund: Health and Productivity Among U.S. Workers.
The staggering statistics of skyrocketing health care costs are infecting business and government like a virus. The nation has spent more than $300 billion a year on stress-linked illness from heart attacks and stroke to diabetes as sixty-two percent of American workers report an increase in work loads, while more than half feel “overtired and overwhelmed.”
“Health care is a major reason why employment growth has been so sluggish.” ––Sung Won Sohn, chief economist at Wells Fargo
“Health premiums are sapping corporate balance sheets even more than the rising cost of energy.” ––Eduardo Porter, Rising Cost of Health Benefits Factor in Slump of Jobs, CAL/AAEM Aug 24, 2004
Because of the per worker health insurance sticker price of $3,000 a year, there’s a reluctance to hire full time employees.
A 2004 study over a four and a half month period tracked and classified 344 errors in 42 “primary care” clinics (primary care is fancy for doctor’s offices, as opposed to the ER or hospital) published in the journal, Quality and Safety in Health Care. Jonathan Wright, MD of Tahoma Clinic, suggests more errors appear to occur when there is a large staff. He draws on the assembly line industrial model for reference as proof that when the employee base is doubled there’s a four-fold increase in errors, i.e., medical mistakes, in this case. Undermining confidence, 13% are due to a lack of knowledge in the doctor’s education and/or experience. More importantly, 82% were caused by “system malfunctions”, meaning that either office administrative mistakes and/or miscommunications played a large part in the patient’s receiving proper health care. In one case, a patient died due to lack of relaying a message. This study was but a small sampling of clinics nationwide over a four and a half-month period that either detected or admitted to patient errors.
In Minnesota’s 2005-hospital report, half the mistakes occurred during surgery, including one death. Of the 106 “adverse health events”, up from 99 the previous year, 16 surgeries were performed on the wrong body part, 2 were done on the wrong patient, while 8 patients received the wrong procedure. In 26 instances, foreign objects were left inside the patient.
Estimated medical error-related costs to the nation reach a burdensome $37.6 billion each year, with $17 billion of those costs associated with preventable errors, according to IOM. They conclude: “hospitals commit 400,000 preventable drug errors each years, that is US$3.5 billion –– not counting lost productivity and other costs –– from hospitals alone.”
Many people feel betrayed by conventional medicine disappointed by inadequate care, misdiagnosis, an intolerable drug, failed surgery, and the lack of careful attention by practitioners. In addition, insurance companies’ haggles over what’s covered and what’s not, conflicting reports from medical studies, deception by drug manufacturers and personal experiences that leave much to be desired, feed their discontent. Government estimates that millions of people annually spend more than $27 billion on alternative and complementary medicine, rather than on traditional health care.
Forty-Eight percent of American adults chose one or more alternative or complementary therapies in 2004. This number will increase as more and more people realize they have been giving their power away to traditional healthcare allopathic practitioners, who in some cases don’t even know your name, removing the responsibility to control your own health. Webster’s Unabridged Twentieth Century Dictionary defines the term, allopathic, meaning, “to suffer”, and suffering is exactly what people are doing,
Our medical care system is still based on Newtonian physics, mechanistic viewpoints shared by science in general, which stated: if by reducing the body to a bunch of parts like a mechanic analyzing your automobile, that science could determine the body’s behavior, i.e. performance, and would know how to predict and control Mother Nature. When the machine is broken, all they had to do was just replace the parts, or treat the parts as individual components. In other words, you end up in the hospital with an enormous medical bill that costs you an arm and a leg to pay off.
A holistic approach is where the whole is the sum of the parts, and when one part ails, it affects the whole. The physical body’s system has innate intelligence, and drives behavior through perceptions.
The issue of healthcare costs and access could be easily solved if the ProblemStatement were worded to assist state residents in maintaining a healthy body and lifestyle, by whatever means necessary.
That disease is inevitable and a funded healthcare infrastructure essential, are both assumptions that miss the point. This notion undermines the body’s innate intelligence to heal itself, given the right environment. Jesus said, “Heal thyself”. To Lazarus, he said, “Pick up your bed and walk”. That belief plays a part in healthcare must not be ignored, for if it worked in Biblical times, it still works today.
2
The definition of disease means “out-of-ease”, a sense of being out of control of one’s life, and is aligned with “stress”. Look to the drug industry, Big Pharma, as a huge player in advancing dependency on drugs. They are part of the problem, constantly bombarding the population’s psyche with advertising. The ads say: you’re not good enough, not slim enough, not smart enough, not sexy enough, and on and on. The commercials “program” the population, not for their health, but to satisfy corporate profits. The accumulation of wealth at the expense of state and private insurers is dependent on a programmed populace who believe the commercials have their best interests at heart. They assume people are incapable of making intelligent decisions for themselves.
Seeing the results of this phenomenon is when patients demand their doctor prescribe specific advertised drugs, and threaten to go to another doctor who will give them the prescription. The doctors are often caught in the middle - serving their patients health, and keeping them happy. Advertisers seek only self-serving bottom line numbers that bring investors lucrative benefits. What is at stake here is a condition of mental gymnastics, drawing on the “belief” that the drugs will work. Applying that same belief to wellness will improve the quality of health in Washington State by emphasizing self-responsibility.
Drug research is divided into 2 camps to measure a drugs’ effectiveness. One gets the drug, the other, called the control group, gets a placebo, generally a sugar pill. Results show that the placebo success rate is 70%, which means that merely the belief is sufficient evidence of a drug’s success. Given this fact, we could save a lot of money by thinking healthy thoughts, and cut healthcare cost by 70%. This means that drugs are only effective 30% of the time, not a winsome margin for investing. Misplaced confidence is costing people and governments untold billions of dollars.
Giving people the emotional support to help themselves stay well and to heal faster, will reward the population at least 70% of the time with success. Supporting wellness by positive reinforcement will help lower the high costs of healthcare, strengthening peace and happiness as desired goals. The benefits far outweigh the expense of establishing a politically justified, expensive healthcare system built on dependency that cripples business and government with high rates of absenteeism, temporary hiring and undermines worker productivity.
- Consider building a governmental healthcare model where wellness is expected, curtailing drug advertising, even though it generates a lot of money.
- Encourage nutritionally balanced diets throughout the state, in school lunch programs, emphasizing physical and mental exercise as a necessity. Be a guiding light.
- Use the power of positive thoughts as a guiding principle. Wellness is everyone’s birthright and should be encouraged.
1.What do you propose be done to realize the vision and goals for Washington State established by the Blue Ribbon Commission on Health Care Costs and Access?
To envision a healthcare system where every Washingtonian can obtain needed services at an affordable price seems reasonable. Since the backbone of every successful country and government is the health of its citizenry, (the worker-bees that maintain it’s
3
functionality), helping them in time of need is simply paying them back for their service and loyalty. A unified healthcare system for everyone is taking care of the human family in the most productive way, and it’s bigger than Washington State.
In our nation’s capitol, lobbyists on Capitol Hill, who work for the health care industry, were paid $183.3 million in 2005, according to PoliticalMoneyLine.com. In the 2003-2004 election cycles, they paid $123.7 million on election campaigns, according to the Center for Responsible Politics. Add to this health care industry’s corporate bureaucracy. CEO pay and benefit packages are in the million-dollar range and $30 million a year salaries, while amassing billion-dollar stock options; all at the expense of taxpayers who only want the best healthcare possible for their hard-earned money. Health care is big business.
Self-preservation is the law of nature, and if the persistence of nature to survive is doubted, we have only to look at the blackberry vines, the dandelions and various weeds whose growth we attempt to stave off with chemicals and mowing, only to return each year as a blessing of renewal. Nature’s system for regeneration is normal. Healing is normal, given the right environment. The human body has a regenerative system and it does the healing, providing there’s a favorable environment and not too much intervention thwarting the body’s ability to do so.
2. How will implementation of your proposal enhance the vision? Energy medicine, common in Eastern cultures, is better than chemical drugs, as
energy travels faster than the speed of light. If healthcare is to be effective and efficient, these forms of healing modalities must be included in any healthcare coverage, otherwise it appears that special interests are controlling the State’s decision-making. They need to be encouraged in healthcare practices as a quicker method of healing, greatly reducing costs by drawing on the natural electromagnetic energy field of the physical body.
We have only to look at the success of Ayurveda with Deepak Chopra, M.D. and Virender Sodhi, ND, MD in Bellevue, WA who both share the same credentials and are proponents of these disciplines. Much research supports this methodology.
Medical schools shy away from energy medicine, because pharmaceutical companies whose vested interests in continuing the monopoly of traditional medical practices fund them and must be protected.
3. A new model includes Complementary and Alternative medicine, combined with exercise, nutrition and vitamin supplements is to be encouraged, allowing people to be the best judge of their use. Too much government intervention removes the self-responsible action essential for a populace to accept control of their body and their health. Andrew Weil, M.D. teaching at the University of Arizona brings levity to health care, offering wisdom and knowledge to the healthcare field in plain talk that people can understand. He may be one of the most significant individuals reshaping the way we view self-care for healthy living. Dr. Weil's health plan boasts conscious awareness of health issues, healthy weight and ways to increase your creativity, while providing exciting challenges for your mind and body that will, effectively, change the way you approach life.
4
Christiane Northrup, MD, who uses common sense and alternative solutions in her practice, shares her wisdom on PBS specials best stating common sense for women’s health. She is a light shining brightly in the field of medicine.
Healthy living criteria and practices cut across race, gender and income levels throughout the population. Everyone wins. Healthcare knows no skin color. All human bodies function the same, all else are artifacts of separation.
Encouraging self-responsibility for personal healthcare is essential to living a long life in good health, and goes a long way toward cutting the high costs of healthcare, a very desirable outcome for all concerned.
Educating government workers and the public about the way the physical body works at a cellular level is my forte. Governor Gregoire recognized my ability to benefit her initiative when I explained to her the new science of biology discovered in 1985 by B. H. Lipton, Ph.D. while Senior Research Scholar at Stanford’s School of Medicine. Applying this new biology to heal myself from neurotoxin poisoning that nearly killed me in 1992, I know that it played a huge part in the healing process. To inspire others, I authored the handbook on self-healing, If You Make The Rules, How Come You’re Not Boss? Minding Your Body’s Business (Hampton Roads, 2003) endorsed by a former Washington State Chief of Public Health, as well as by the Head of Biology and Pre-Health at St. Martin’s University.
The physical body’s 50-70 trillion cells interpret signals from the environment instinctively and enact or deny signal’s entry at the membrane level. Germs, bacteria, for example, are part of our biological system, and function in a way that supports the organism. When a signal from the environment triggers stress, fear, internal anxiety, and/or anger, then germs, as opportunistic organisms, take advantage of the vulnerability and advance their influence.
Most of the problems with health and attitude begin as an individual response to fear-based news that continues to bombard the psyche, keeping people on edge about whether they’re going to live or die. If it were possible to shut off the valve of constant fear-based programming in the media, it would go a long way toward reducing the health care costs in Washington State, as well as throughout America.
R.T. Trall MD wrote in The True Healing Art or Hygienic vs. Drug Medication insisted, and rightly, that it is the body that acts and the drug that is acted upon. He proclaimed the obvious fact that the truth about the so-called "action of remedies" is the exact contrary to what medical men teach.
In 1860, Trall said, "I have myself, through Natural Hygiene, over 16 years, treated all forms and hundreds of cases of typhus and typhoid fevers, pneumonia's, measles and dysentery's, and have not lost a single patient. The same is true of scarlet and other fevers. No medicine whatever was given."
"These diseases (typhoid and pneumonia) are nothing more nor less than a cleansing process - a struggle of the vital powers to relieve the system of its accumulated impurities. The causes of the diseases are constipating foods, contaminated water, atmospheric miasmas, and whatever clogs up the system or befouls the blood. And the day is not far distant when a physician who shall undertake to aid and assist (suppress)
5
Nature in her efforts to expel impurities, by the administration of poisons (drugs, medicines, shots, radiation, etc.) will be regarded as an insane idiot. But now this practice is called medical science." Trall declared, "It is the living system which acts" and not the lifeless drug. He also declared that, "the 'property' is in the living system; and that property is not 'affinity' but antagonism." Medical authors, he said, by their theories and terms "endow these dead (lifeless), inorganic, and actionless substances (actionless except in the mechanical or chemical sense) with instinct, if not with intelligence.” Further, “Such teachings reverse the order of Nature. There is no affinity between poisons and the living system." He affirmed that any "relation of affinity" in "any approved or conceivable sense of the word between a vital structure and a poison," [INHS] Hygienic Review Vol. IV April, 1943 No. 8 Vital Action vs. Drug Action Herbert M. Shelton
4. Regarding evidence-based healthcare dependent upon recent external clinical tests may have value, but danger lurks when they become the deciding factor, for tests are only as good as the individual who reads them. Multiple factors must be considered to assess the physical state of being, and some factors may not be obvious. Consider the mental hygiene and what’s going on in a person’s personal life. These are not always obvious. Having a practitioner, who knows you as a person and not as a number on a file, will be better able to assess the condition, regardless of clinical evidence. The mind is in control of it all, and it doesn’t always reveal its secrets openly.
Given the variability’s testing and potential for false results, no diagnosis should ever be made solely on the basis of a single lab test. Medical tests are not foolproof and can present an incomplete picture when not put into proper context. To reduce the chance of medical errors, test findings must be scrutinized carefully to increase the reliability of a diagnosis. However, each individual remains responsible for monitoring their own care, asking questions, being attentive to detail from the beginning to the end, following up when needed, and not allowing the system to make decisions for them. Individuals must retain control of their life and be the final determinant of any outcomes.
Relying too much on technology as a determinant in assessing health conditions may not be the best choice, as it is not intuitive and cannot read the emotional slide rule that often colors a physical condition. I, myself, had such an experience, and know that human assessment and interaction often reads signals missed by technology. In addition, an element of spirituality must be considered in the mind/body/spirit triune.
Remaining focused on the optimal goal of health is essential, because not everybody in the system can be counted upon to do so. Though doctors may be competent professionals, they may not question the work of others in the system. That, in the end, may be the biggest threat to anyone’s health.
5. Improving affordability may be the greatest advantage to adopting a more liberal model of healthcare. Including a broad spectrum of alternative healing modalities will appeal to those who want to stay out of the traditional medical model of “doctor dependent” healthcare. When all people have access to health care, regardless of its discipline, there is more choice, and better attitudes exist to support well-being practices.
6
Washington State has the ability now to move into being a progressive state, willing to allow broader application, recognition and payment for complementary and alternative medicine. The broad swath of offerings opens the field of self-healing and self-responsibility for one’s own care. Those in need of specialists, emergency care and traditional medicine will also have what they need. In today’s world, there are many choices, and adopting a more open attitude empowers the people. There is little to prove that the high costs of healthcare have anything to do with keeping people healthy. When retirees spend their savings on expensive healthcare, there is little left to enjoy the fruits of a long life.
About a decade ago, doctors began to be trained in what health guru Dr. Andrew Weil dubbed "integrative medicine," a new kind of doctoring that combines Western medicine with the best, most evidence-based alternative therapies. In Southern California, Western medicine teams up with acupuncture, yoga and herbs to fight both disease and pain. Finally, this hybrid is going mainstream. [MEDICINE AND THE NEW AGE Twice as Strong By Hilary E. MacGregor Times Staff Writer August 7, 2006]
Last, but not least, is the amount of stress people of this country endure. Bombarded daily by fear-based news about the fighting and war’s on everything from peanut butter to pretzels facetiously, from oil, nuclear power plants to religion (belief) seriously, the last thing people need are pharmaceutical advertisements that feed more uncertainty into their lives. All this is doing is repressing society, and feeding the coffers of people and companies who profit. The more this continues the sicker will be the population.
So long as fear has a hold, expect healthcare costs to soar. Fear increases the cost of healthcare, exponentially. When the level of threat is high, the screws tighten on personal safety and sanity. The human cells in the body are like children, all 50-70 trillion of them, and they listen to all our conversations, spoken or not. When the outside is scary, emotions are high for fight or flight, and cells respond in an instant. Maintaining high alert on a constant basis thwarts cells ability to thrive and heal, as they would in a relaxed state. Translating that to the atrocious costs of healthcare insurance and healthcare in general, it means that as long as a state of emergency exists, pending security risks will produce more illness higher costs and increased demand for services, leaving scars on the minds of humanity for decades to come.
To be happy and healthy is to feel safe. Trusting is a strong component. When the news reports keep everyone on pins and needles, there’s even more stress. Subsequently, more demands for someone or something to make the fear and hurt go away. The body can only take so much of this kind of thing before it suffers from the strain and breaks down.
The rule is that society and creativity flourish in a safe environment. It’s true now and since the beginning of civilization. The economy grows when the environment is safe, plain and simple. People relax when peace prevails. Knowing that healthcare will be affordable eases some of the stress. But, putting people in charge of their life choices is all part of the wisdom of a caring society, compatible with accepting responsibility for his or her own health and life choices. Of course, emergencies will happen, and that must
7

always be taken into account with competent practitioners and life-saving processes, perhaps the best use of the medical profession as a whole.
6. Marketing ideas for a new model. Washington State, with Governor Christine Gregoire at the helm, has the opportunity to set the pace for a new vision of healthcare by adopting the ways of the wise.
––Allow availability to necessary facilities and competent care for those who need it.
––Encourage preventive measures to assuage illness. ––Alternative, Complementary, and Integrative Medicine becomes the norm.
Energy, the unseen quantum energy field which Einstein formulated in his famous equation, E=mc2 accepted as a healing modality and welcomed with open arms.
––Spearhead a campaign for wellness. ––Use Billboards and signage as a great way to promote wellness, with positive slogans, such as these: I love life (use the red heart symbol) like in I love NY
Look for the good in your life. I love to live in Washington State Be happy. Stay well. You are loved. Let your smile be your umbrella Think Wellness Love yourself into Life We Are One!
Empowering the people with wholesome statements lets them know they have value, and can make a difference in their lives and in those around them. This will improve attitudes and act as positive reinforcement to automatically reduce dependency on needless healthcare services that balloon’s costs. This one alone will go a long way toward building a friendlier, happier and healthier populace; lowering healthcare costs and improving the quality of life, the desired goal! Isn’t it?
––Spearheading this positive reinforcement campaign among state residents is Great PR. Results will speak for themselves, reducing demand for medical services, thus lowering costs.
––Invite business to join the campaign and help promote healthy attitudes by following the same trend. They will be happy to spend money on this, because they stand to benefit.
––T-shirts could also reflect the wholesome slogans, coffee mugs, tags on advertising, pens, label buttons and other venues, including banners on Washington Transportation Dept. vehicles.
––Use the slogans everywhere, and build the momentum.
7. I am willing to be a part of the solution. Developing a curriculum grounded in the new science of biology understanding, training government workers in the empowering secrets of how the mind/body/spirit works together to maintain their life,
8
how they get sick and how they can heal, will shift the balance on worker absenteeism, improve job efficiency and increase profitability, thus cutting the State’s high cost of health care. Collaboration with alternative practitioners, integrative medicine balancing with preventive healthcare measures, enhances the offering.
8. Obstacles to implementation are the limited views of the current vision. The pharmaceutical companies may not be easy to deal with, yet someone must make the hard decisions if there is to be any movement in the right direction of reducing the high costs of healthcare and improving the quality of life for all. Special interests have their own agenda, and it is all based on profits and satisfying the bottom line for investors. Washington State must be strong enough to take the lead toward making a significant difference in peoples lives, and for the health of the state itself. When people are empowered as a unified force, then powerful positive change is possible. Washington State must be strong and flex its muscles on keeping the home front sturdy and economically sustainable.
The residents of the state must be of strong constitution. One step is to encourage preventive care, like cell phone protection for elementary school children 9 years and older. Youngsters 3-8 should not come near a cell phone, for the radiation will adversely affect their brains. The Aulterra product is acclaimed in this department.
The challenge for the Blue Ribbon Commission on Health Care Costs & Access is to design a new way of doing things, like the green movement in architecture is doing in recycling building materials. Ask the people what they want. Utilizing the excellent generic version of the Forum Foundation’s Opinionaire, questions can be designed to feedback valuable insights about how and what people feel is important for Washington State’s future in healthcare. The Opinionaire is better than taking a vote. Oregon is using this now to assess the direction of their healthcare focus in the coming years. This empowers the people, asking them to express their opinion, and it can be done simply and less expensively than trying some unknown approach that wastes a lot of money and gets poor results.
Obviously, the current system is broken and can’t be fixed. Otherwise, Governor Gregoire would have no need to make healthcare reform a pivotal part of her platform.
Drastic measures like banning all pharmaceutical advertising in the media would go a long way toward improving health and well being. Let them advertise to the medical profession, not bypass them to sway the patient. Whose side are they on, anyway?
Other ideas to reward people to stay well … o Offer a bonus or discount for insurance premiums, o A holiday event, picnic or concert with the Governor o A contest to see how few days are taken off for illness with prizes o Free license plates for 5 years o Other incentives meaningful enough to engage the spirit of living a long
life in good health.These suggestions are germinating seeds, a beginning of what could generate a
cohesive force of commonality for the people of this state, bringing to the fore a real unifying principle of caring and concern. No coercion, no threats or punishing behavior. How refreshing!!! And, the likelihood of a positive outcome is better than average.
-Unify the people of the state with positive reinforcement -Give people pause to contemplate their choices -Inspire people with a higher purpose
9
-Reward those who take charge of their lives in a positive way. The reward system works so much better than punishment, as every parent knows.
Everybody wins and this move encourages people to think more about their personal benefit, by accepting responsibility for right thinking, the way they eat, care for their bodies, and how little they complain about workplace conditions, or the people with whom they work. Prevention costs less than repairing the body after abuse. Plenty of rest nourishing meals and exercise builds strong bodies, while monitoring our thoughts for those that are self-deprecating. Encourage grocers and restaurants to eliminate GMO foods that corrupt the body’s natural state of being, affecting the genetic integrity of the body adversely.
The idea here is to be happy, for when you’re happy, you’re in love with life, and when you’re in love with life, you’re healthy, and costs to the system are minimal. This is not rocket-science, but common sense. Cutting healthcare costs begin at home.
The urgency of medical care and all that it represents is appropriate for emergencies and critical care, and that’s where it shows up best. No one will deny the blessing of the medical doctors and their skills in time of need. Every society needs this kind of critical care, and that’s where it counts the most.
Unnecessary procedures, experimental surgeries, the preponderance of inefficiencies, and needless tests that pay for high-tech, high-ticket equipment sold to the doctors and hospitals as the latest greatest tool for diagnosis and profit, mostly the latter.
Einstein said that problems couldn’t be solved using the same consciousness that created them. Which implies that a new vision is needed, that blindfolds be removed from the eyes of those guarding the safety of position, and that fresh ideas from outside are better positioned.
Most people in healthcare are sincere in their desire to help others, and they are to be honored, but when the FDA approves viral adulteration of our food supply, see http://www.newswithviews.com/Richards/byron7.htm then there’s good reason to suspect foul play. What is the agenda? Where are the ethics? Certainly, it is time for the people to rise up and shout, Foul Play. With egregious actions like this, who needs enemies? We, as a people of this country, must give serious consideration to the intent behind this kind of malignant thinking. It’s war on people.
I will continue to help people learn about the innate intelligence of the physical body from a cellular perspective, how physical bodies communicate at a cellular level to create the reality we call life. It is my mission to make a positive difference in the world, by empowering people to accept their innate power to rule themselves, and to know what is best for them in their given situation.
There’s more to this issue than taking an aspirin and calling the doctor in the morning. It’s going to take a courageous commission to sweep the halls of closed-door policy makers and open the minds to realize that all our decisions are based on perceptions of the environment, internal and external, alike. To improve healthcare, and cut costs, we must begin seeing ourselves as healthy. It’s an inside job, after all.
Accompanying this Proposal is a chart comparing the features of Conventional Medicine and Wholistic/Integrative Medicine. Clearly, there is a significant difference in approaches to well-being health care. With the current failed system representing Conventional Medicine, it is clear that Wholistic/Integrative Medicine has a lot to offer and is worth serious consideration in any healthcare plan Washington State considers.
10
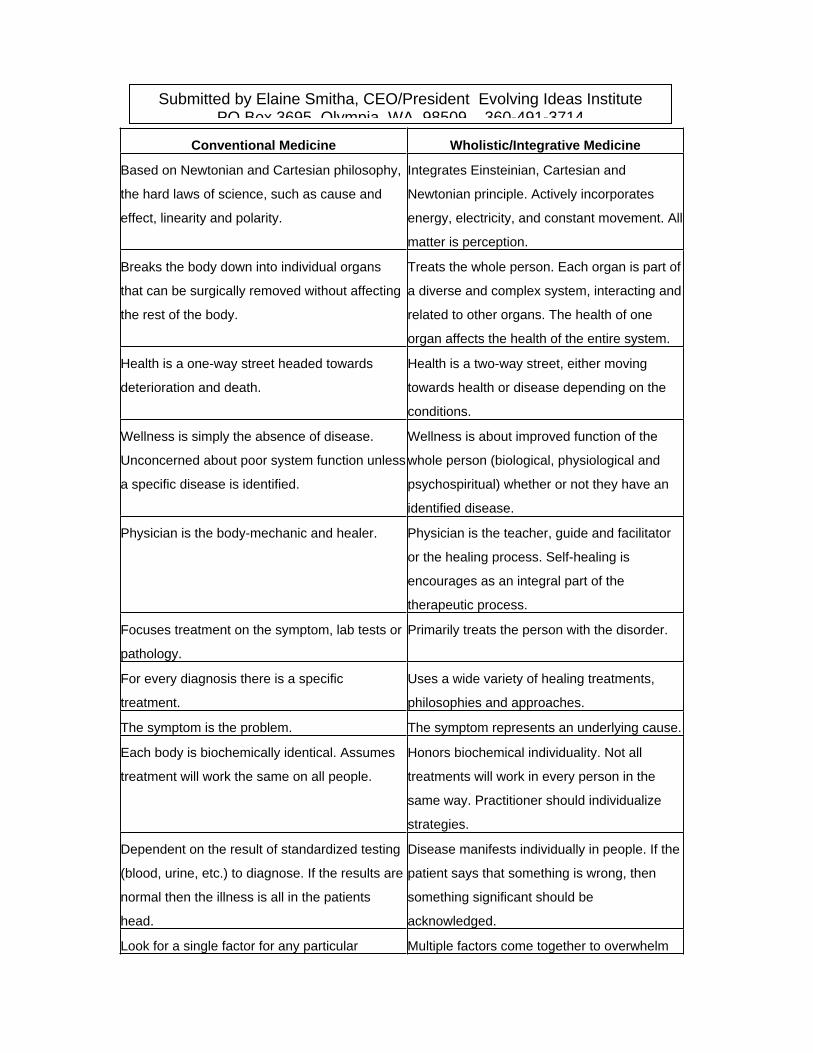
Conventional Medicine Wholistic/Integrative Medicine
Based on Newtonian and Cartesian philosophy,
the hard laws of science, such as cause and
effect, linearity and polarity.
Integrates Einsteinian, Cartesian and
Newtonian principle. Actively incorporates
energy, electricity, and constant movement. All
matter is perception.
Breaks the body down into individual organs
that can be surgically removed without affecting
the rest of the body.
Treats the whole person. Each organ is part of
a diverse and complex system, interacting and
related to other organs. The health of one
organ affects the health of the entire system.
Health is a one-way street headed towards
deterioration and death.
Health is a two-way street, either moving
towards health or disease depending on the
conditions.
Wellness is simply the absence of disease.
Unconcerned about poor system function unless
a specific disease is identified.
Wellness is about improved function of the
whole person (biological, physiological and
psychospiritual) whether or not they have an
identified disease.
Physician is the body-mechanic and healer. Physician is the teacher, guide and facilitator
or the healing process. Self-healing is
encourages as an integral part of the
therapeutic process.
Focuses treatment on the symptom, lab tests or
pathology.
Primarily treats the person with the disorder.
For every diagnosis there is a specific
treatment.
Uses a wide variety of healing treatments,
philosophies and approaches.
The symptom is the problem. The symptom represents an underlying cause.
Each body is biochemically identical. Assumes
treatment will work the same on all people.
Honors biochemical individuality. Not all
treatments will work in every person in the
same way. Practitioner should individualize
strategies.
Dependent on the result of standardized testing
(blood, urine, etc.) to diagnose. If the results are
normal then the illness is all in the patients
head.
Disease manifests individually in people. If the
patient says that something is wrong, then
something significant should be
acknowledged.
Look for a single factor for any particular Multiple factors come together to overwhelm
Submitted by Elaine Smitha, CEO/President Evolving Ideas Institute PO Box 3695 Olympia WA 98509 360-491-3714

disorder. the bodys natural ability to defend and repair
itself.

Tab 13
Health Care Institute 1
Health Care Costs and Access Improvement ProposalHealth Care Institute
1. What do you propose be done to realize the vision and goals for Washington Stateestablished by the Blue Ribbon Commission on Health Care Costs and Access? TheState should establish a non-profit institute to support payer, provider, and supplierefforts to improve the delivery of health care in Washington. The institute would be asmall organization of 10-20 individuals who would work with interested stakeholders toincrease access and improve outcomes through health care process improvement.Washington State would give the institute the mission of applying proven processimprovement techniques to our health care delivery system and grant the institute aspecial charter, giving it authority to represent the State in this effort. The institute wouldidentify processes that offer the greatest potential for cost savings and quality improve-ment, work with providers to establish best practices suited for broader application, andassist small providers that could not afford to staff their own process improvement officeor hire consulting agencies. The institute would assist in the expanded application ofevidenced based medicine as an integral part of process improvement. The institutewould also organize an annual state-wide health care process improvement conference.The conference would serve as a forum to share lessons and best practices, and stimulategrowth in the process improvement program. This institute could become a force forchange, a model for other states, and a source of pride.
2. How will implementation of your proposal enhance, hinder or otherwise impact theachievement of the vision and each of the goals established by the Commission? Theinstitute would enhance achievement of the vision and goals by operating as a non-partisan agency committed to the objectives identified by the State. It would involveproviders, patients, government, businesses, insurance companies, suppliers, and otherstakeholders interested in transforming health care for the citizens of Washington. Theinstitute would tap decades of process improvement experience in the private sector andin health care to eliminate waste and improve quality in all critical processes. It wouldencourage the application of tools like Lean and Six Sigma which have dramaticallychanged operations in selected health care activities within the state and across thecountry. It would identify key processes within the delivery system most capable ofaffecting the cost and quality of delivery.
The institute would consist of a small staff of process improvement experts. The Statewould resource a core team. Major local employers, with recognized Lean programs andinternal expertise, would be encouraged to each provide a process improvement expert tothe institute. The State could also authorize an advisory committee or board consisting ofleaders from stakeholder groups. The institute would examine the delivery system andidentify processes where improvement could impact cost and quality for major portionsof the patient population. The institute would examine the complete delivery systemfrom the patient’s perspective. It would also involve all agencies responsible for pro-vision of health care in this review of the system to identify improvements that couldactually affect bottom-line costs. The institute would then facilitate the improvement ofthese processes state-wide.
Health Care Institute 2
How do you know? There are many examples of providers improving the quality ofprocesses greatly, while lowering costs significantly. They include Virginia MasonMedical Center, Children’s Hospital, and Group Health Cooperative.
3. Is your proposal modeled after an existing policy or program within Washington orelsewhere? Yes.
If so, describe the policy or program and its outcomes. The proposed institute wouldapply the techniques practiced in the process improvement programs found in a numberof major hospitals in Washington and across the country. The institute would deliver thisapproach to cost reduction and quality improvement state-wide. The Pittsburgh RegionalHealthcare Initiative is an example worth considering. That organization has helpedproviders achieve exceptional results by applying Lean techniques in areas of great wasteand unacceptable safety and quality.
This initiative is also modeled after the application of Lean and Six Sigma to a widerange of activities in the private and public sectors. The Automation ResearchCorporation Advisory Group reports that 35% of manufacturers employ Lean or SixSigma tools as their main process improvement method. Lean, which represents Toyotadeveloped techniques for eliminating waste and improving quality, is the most com-prehensive process improvement approach and is best suited for attacking costs and mostquality problems in the health care delivery system. Six Sigma tools are best applied toprocesses involving the production of a large number of identical products, when highdegrees of precision are required (less than 3.4 defects per million); the production ofvaccines would be a good example. Lean is very complementary to the State’s mandateto focus on the patient, in that value, as perceived by the customer, guides Lean processimprovement.
Lean techniques have produced exceptional results within manufacturing and otherindustries. In numerous cases, process owners have reduced defects significantly bybuilding quality into every step in a process, while reducing costs. These costs are thoseassociated with unnecessary processing steps, over production, unnecessary motion andtransportation, waiting, and a number of other wasteful activities found in almost allprocesses. Lean manufacturing techniques allowed Boeing to reduce assembly time forthe 737 by 50%. Automobile industry parts manufactures have reduced throughput timesby up to 90%. Toyota is requiring it suppliers reduce parts costs by 10% a year for threeyears and assisting them in apply Lean continuous process improvement to achieve thisgoal.
The Department of Defense (DoD) offers an example of the application of Lean processimprovement outside the manufacturing industry in an environment where government isdriving the requirement for change. The Navy, Army, and Air Force have applied Leanand Six Sigma to supply and maintenance operations for a number of years. Recently,Defense agencies recognized Lean’s potential to eliminate waste in areas outside logistics.In the last 12-18 months, the Secretary of the Army has expanded the use of these to tools

Health Care Institute 3
to include the entire institutional side of his Service. Likewise, the Secretary of the AirForce launched a service-wide program called Air Force Smart Operations for the 21st
Century (AFSO21) a few months ago to help control costs and improve quality byapplying these tools to a wide range of activities. Agencies across the Air Force aredemonstrating great success in attacking cost and quality issues through the use ofconsultant contracts, by applying in-house process improvement experts, and byinvolving managers and workers throughout organizations.
4. Will your proposal impose costs on individuals, businesses or government? Thisinitiative would impose limited costs on the State and on the few businesses that chooseto provide an expert to the institute.
Will those costs be time-limited or on-going? Government costs could be time-limited.The State could provide operating costs and pay salaries for the core group for limitedtime period. The State might fund the program for five years, after which the initiativewould be assessed to determine if an additional five years of support was required andwarranted. The goal would be to have the institute to fund the core team’s salaries insubsequent years from a portion of the savings generated for providers and payers. Tohave a major impact, this proposal must save millions of dollars annually. The cost of ahandful of continuous process improvement experts should equal only a fraction of thepotential savings.
Major employers supporting the proposal, would accept a continuing requirement toprovide a process improvement expert to the institute. If the State empowers the instituteto help payers and providers share cost savings, businesses should see savings or smallerincreases in health care costs across their workforce that more than offset the cost of theirteam member’s salary.
Can you estimate how much these costs will be, or suggest how such an estimate could bemade? The costs would be largely personnel costs. Operating costs should be kept to aminimum, as the institute should be a model of frugality. This initiative will fail if itcreates another bureaucracy. The State would provide approximately five full-timeequivalents (FTEs) and the supporting group of major employers would provide one FTEeach. These businesses would be encouraged to detail one of their employees with theinstitute rather than pay the salary of one of team members.
How much, if any, of these costs will be offset by corresponding savings? The goalwould be for all of the costs to be offset, as described above.
5. How does your proposal reflect collaboration among various stakeholders? Thisproposal grew from observation of the first commission meeting and informal discussionsamong a handful of participants. It offers tremendous potential for future collaborationamong providers, payers, suppliers, health care professionals, unions, associations,
Health Care Institute 4
businesses, government, and others by focusing all stakeholders on improvementactivities.
Which stake holders have endorsed it? No stake holders have endorsed this proposal, buta number of Washington hospitals have established process improvement programs.Through their actions, they endorse the concept of applying continuous process improve-ment theories and techniques to health care. Additionally, the Healthcare Forum,Medical Association, and Hospital Association have all discussed large-scale processimprovement and would likely support this initiative if it was properly developed andpresented to them.
6. What are the obstacles to implementing your proposal? There are at least threeobstacles. First, ongoing commitment of support by the State, as well as major em-ployers providing process improvement experts, may be an issue. Second, competitionamong providers and provider groups could limit the extent of cooperation. And, lastly,the related notions that our health care problems are too large to solve and that health carecosts cannot be lowered, must be overcome.
Who will object to it and why? Large hospitals and provider groups with well-developedprocess improvement programs may balk at sharing lessons learned with the institute andother health care providers. Today, they share limited lessons. They compete with otherproviders and may not feel comfortable with the level of collaboration necessary to meetstate vision and goals.
Likewise, health care providers may not embrace the goal of using process improvementto lower payer and patient costs. Efficiencies gained through process improvement oftenhelp the providers overcome fiscal challenges and do not always produce savings forpayers or patients. The effort will not get provider support if hospital fiscal consider-ations are overlooked and the initiative fails to provide “win-win” solutions for allinvolved.
How do you suggest these objections be addressed? Convince providers that we canlower costs without sacrificing their fiscal stability if all stakeholders work together toachieve the state’s goals through aggressive continuous process improvement. This couldbe done through a combination of presentations of transformation results by Washingtonproviders experienced in Lean process improvement, as well as information sessions byconsultants.

Tab 14
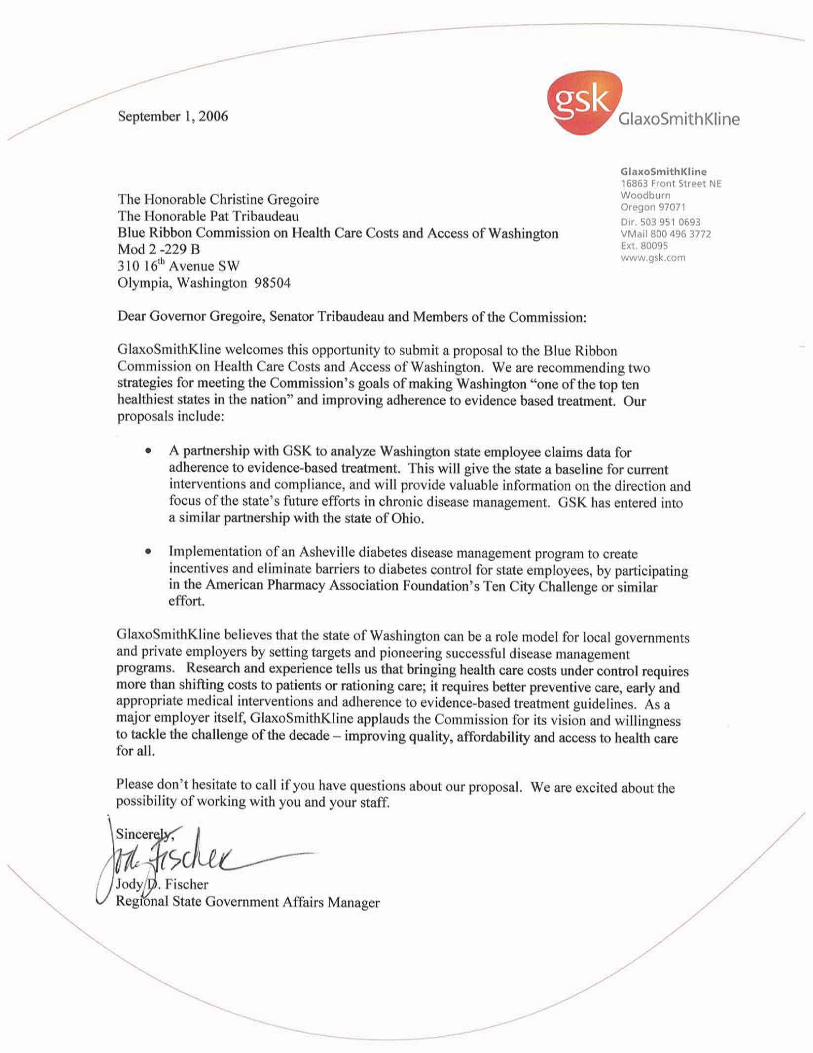
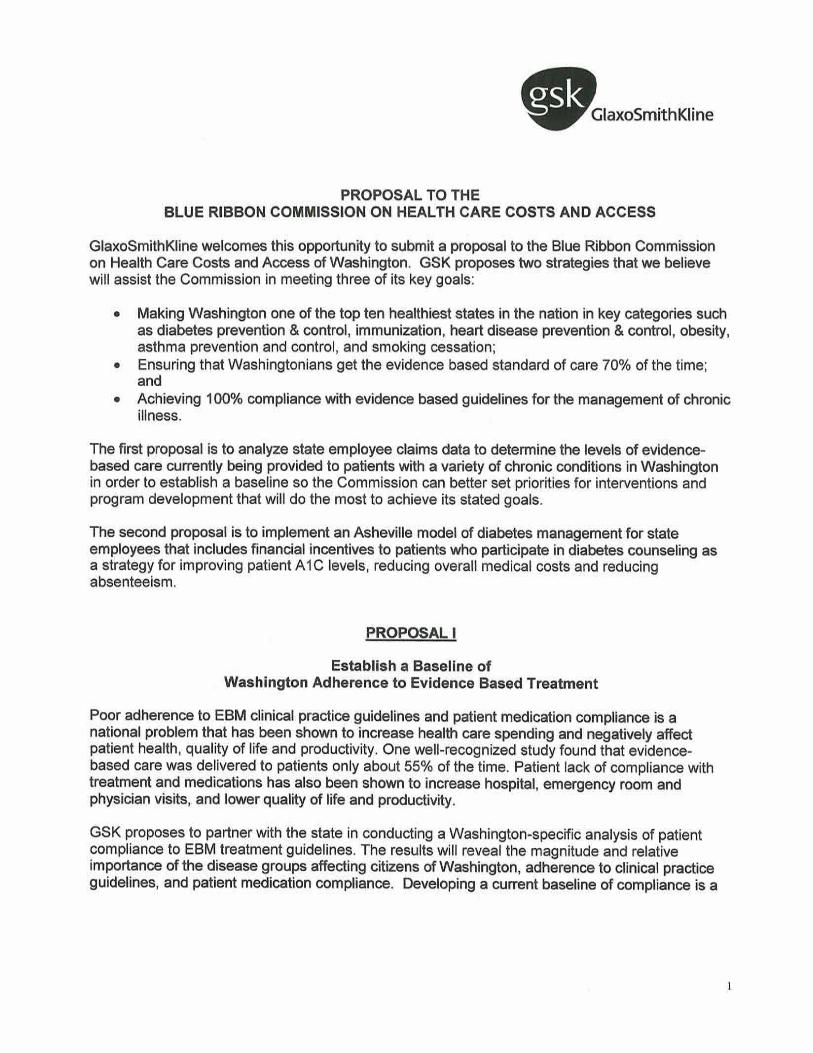
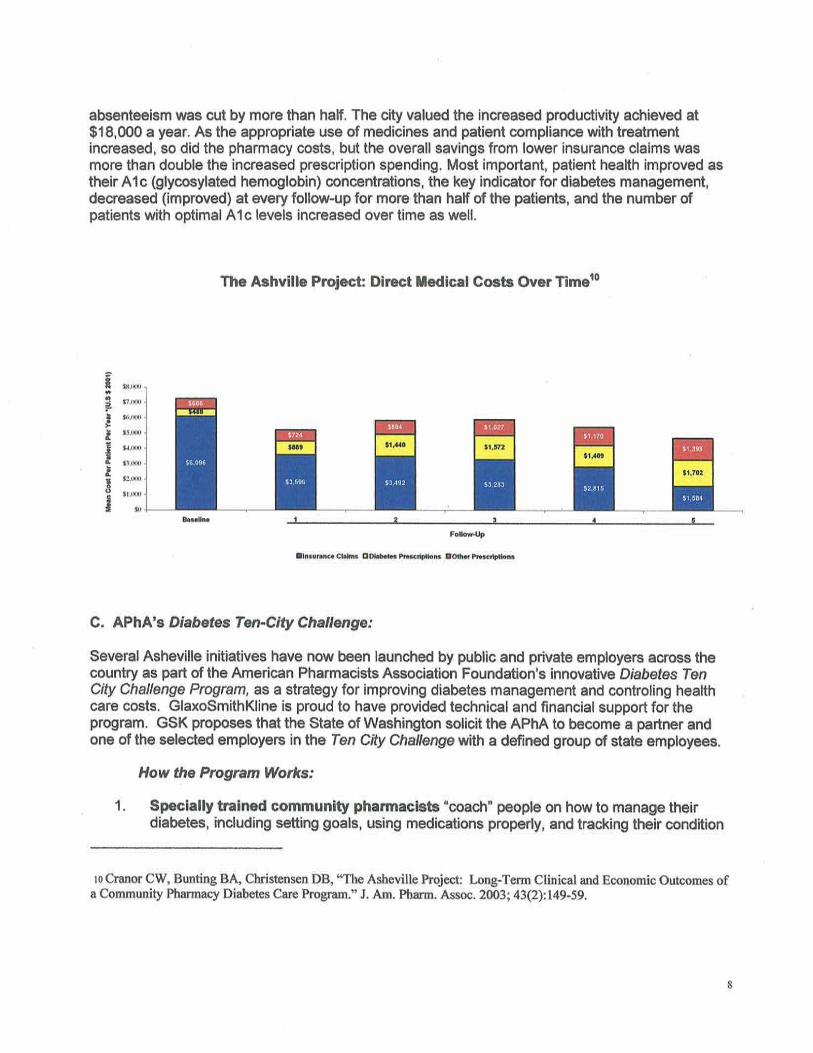

Tab 15
�
�
�
�
� � � �

Tab 16
UNIVERSAL HEALTH CARE COVERAGE PROPOSAL BY HEALTH CARE FOR ALL--WASHINGTON
1 Health Trends/ Frank Fox Associates, 1998-2000 2 Watts, Bob, Report from Facing the Future Conference (DSHS), 12/06/2002 3 Elway, Stuart, Elway Research, Inc., WSMA Polls, 1999
1
II. ONE PAGE SUMMARY HIGHLIGHTS OF THE WASHINGTON HEALTH SECURITY TRUST PROPOSAL
The Problem Based on the 1992 Washington Health Care Commission Report, econometric consultations commissioned for Health Care 20001, and a continuing litany of governmental, news, and anecdotal reports, Health Care for All-Washington finds that there is a health care financing crisis in the state of Washington. Health care economist Frank Fox estimated total health care spending in Washington for the year 2000 at $20 billion1. In 2002, Boeing official Bob Watts made the same estimate of $20 billion per year2. About 45% of that comes from employment-based health coverage, 40% from existing state and federal government programs, and 15% from out-of-pocket individual payments for premiums, deductibles, co-payments, and non-covered items like prescription drugs. More than 600,000 residents of Washington have no health coverage at all. Many others are underinsured or fear they will lose whatever coverage they have. Individual health insurance is increasingly unaffordable, if available at all. Employers are reducing health benefits as insurance rates skyrocket. Costs of the state's health care obligations are increasing faster than any other budget item and are a large part of state budget deficit. The Basic Health Plan has been forced to reduce enrollment. Doctors and hospitals go out of business, operate at a loss, merge and downsize at a pace never seen before. 80% of surveyed Washington voters and doctors blame the mess on insurers3.However, many insurance companies and HMOs also cannot survive in the present chaotic market environment.
The Health Care for All-Washington Proposal Health Care for All-Washington has calculated that the same amount of money, from the same categories we use now can be used to fund health coverage for every resident. This proposal creates the Washington Health Security Trust, a single public trust fund dedicated to the financing of a defined set of health services for all state residents.
Highlights All residents are covered for defined benefits regardless of health or employment status. Residents choose their providers. Providers and patients make the medical decisions. Doctors and other providers work in the private sector, just as they do now. They are not employees or agents of the trust. Physicians, clinics, hospitals, and other providers negotiate the terms of their participation with the trust. A public board of trustees governs the trust. The initial appointed board, using citizens’ and technical advisors, defines the benefits package, establishes a simplified claims processing system, and creates scientifically based tools for monitoring performance. The subsequently elected board of trustees and its advisory committees monitor operations, financial performance, the benefit package, quality of health services, and public satisfaction. They are directed to seek public input for trust policies over time. The initial appointed board is accountable to the governor and the legislature. Once the trust is up and running, elected trustees replace the appointed trustees in an orderly sequence and are directly accountable to the voters in their congressional districts.
How the Trust is Financed The Washington Health Security Trust is funded by a combination of sources chosen to resemble current health spending patterns and to work with specific limitations and unique provisions of the Washington tax system.
Employers pay a health security assessment of 10% of payroll above a threshold of $125,000 per quarter. Residents 18 and over pay a health security premium of $75 per month. Medicare enrollees pay a premium of $50 per month to add trust benefits beyond their Medicare benefits. State funds for health programs are transferred to the trust. Whenever the trust obtains federal waivers, funds for federal health programs will also be transferred to the trust. Until then, federal coverage remains in effect. Patients will pay small co-payments for outpatient and emergency visits, and prescriptions. Certain exemptions are included for low income families and employers facing financial hardship. Employers may purchase private health coverage for their employees. However, the trust benefits package is intended to give employees better coverage than even the best current health benefit plans, which now cost employers 12-14% of payroll. Pooling the funds for health services across the state and spreading the risk across the entire state population provides a stable mechanism to finance quality care for every resident.

UNIVERSAL HEALTH CARE COVERAGE PROPOSAL BY HEALTH CARE FOR ALL--WASHINGTON
1 Health Trends/ Frank Fox Associates, 1998-2000 2 Watts, Bob, Report from Facing the Future Conference (DSHS), 12/06/2002 3 Elway, Stuart, Elway Research, Inc., WSMA Polls, 1999
2
The Health Security Trust is a simple, fair, accountable, and affordable system to fund necessary health care for all residents of the state of Washington.
Blue Ribbon Commission on Health Care Costs & Access
Proposal for Achieving Goals over 5 Years
Submitted by Health Care for All - Washington (HCFA-WA)
Sarah K. Weinberg, MD, Vice President, (HCFA-WA)
Summary of Proposal
Because we believe that affordable universal access to quality health care is only achievable through a centralized source of funding, standard-setting, allocation of resources, and use of advanced information technology, we propose that Washington State adopt a public tax-funded system to finance health care for every Washington resident. (“Universal coverage” means coverage for everybody, not for everything.) Such a system need not prohibit the private purchase of health services outside the system, but the publicly financed system needs to provide sufficiently comprehensive coverage of medically necessary health services for all residents who choose to use it to avoid the creation of a two-tiered system (a lousy public one for the poor, and a better private one for the rich).
The current non-system in effect in the U.S. cannot provide affordable health care for everyone because of the truly stupendous amount of money wasted in administrative costs incurred by all participants, corporate insurer costs of being in business, and shareholder profits. These costs are inherent in a system with multiple payers, and cannot be changed in any significant way with various cost control strategies, as more than ten years of such efforts have shown. We cannot emphasize strongly enough how badly the current financing mechanisms are failing.
In addition, the failure to use evidence-based standards of care, especially for the management of chronic diseases, results in additional high costs of avoidable acute care, never mind the suffering of the patients involved.
The Commission does not need to invent a publicly financed universal coverage system de novo, as much work has already been done, especially in California, where the legislature just passed SB 840 that will create, if implemented, a single-payer publicly financed system for all Californians (see summary at www.healthcareforall.org/summare840.pdf). Actuarial studies have been done in California and in other states (most recently the Thorpe study in Vermont - see www.leg.state.vt.us/CommissionOnHealthCareReform) that consistently show that adoption of a single-payer health coverage system would provide a comprehensive package of benefits for all residents at a cost below what is currently being spent in those states. The overall savings are usually predicted to be about 5%. Additional ongoing savings can be expected through increased efficiency in the choices made in preventive care, in acute care, and in management of chronic diseases.
Future choices necessary as technology advances can be made on the basis of evidence that shows (or fails to show) efficacy and cost effectiveness in appropriate clinical settings. Experience in other nations with universal coverage systems shows that these choices are difficult as new, expensive treatments or medications are created, but centralized coverage decisions are at least perceived as fair. All centralized systems (even Canada, recently) allow those with means to buy whatever non-covered care they wish outside the publicly financed system.
The remainder of this Proposal, then, will address how to achieve a single-payer universal health coverage system in Washington State.
1. What do you propose be done to realize the vision and goals for Washington State established by the Blue Ribbon Commission on Health Care Costs & Access (BRC)?
The very first step is to stop assuming that a single-payer system (SPS) is “politically not feasible”. There have been several national polls showing that over 60% of Americans favor a government-guaranteed, tax-funded health coverage system that would cover everyone. The most recent of such nation-wide polls (with three different approaches) were conducted by the Citizens’ Health Care Working Group established by the Medicare Modernization Act of 2003. All three polls showed that over 70% of participants favored the “creation of a national health plan, financed by taxpayers, in which all Americans would get their health insurance”. Taking the health insurance portfolio away from the private insurance industry will not be popular with that industry, but a large majority of other Americans will appreciate the resulting affordability of their health care. It is time to listen to public opinion that has not been influenced by deceptive media campaigns by those profiting hugely under the current non-system.
Once the BRC decides to move toward a SPS, we think the first step would be to consolidate all of the health coverage funded by the state into one program. For state employees, this can be accomplished with strong financial incentives. For Medicaid, Labor & Industries, the incarcerated population, etc., this can be done by executive decision. The covered population would be sufficiently large to realize savings rapidly through decreased administrative costs, ability to negotiate favorable prices for drugs and medical devices, ability to negotiate favorable payment rates for providers’ services, and the ability to implement payment schedules based on evidence of efficacy and cost-effectiveness.
While this step is implemented, a continuation of the BRC should be defining the ultimate SPS to be available to any Washington resident within 5 years. California’s SB 840 can be the model, but the hard part is devising a fair mechanism to tax the population specifically to fund the system. We think it can be done with a combination of premiums paid by all residents, payroll taxes on employers (who will no longer need to fund employee health benefits on their own), continuation of state general fund support for those with incomes too low to afford premiums, and continued federal financial support at the current level. Two vital ingredients:
Setting up a completely separate fund for health care that cannot be raided for other state expenses Commissioning an actuarial study to determine the specific premiums, payroll taxes, and state general fund commitments needed to give the health care fund an adequate amount of money to work with. (See the Thorpe study in Vermont referenced above.)
A completely universal health coverage system for all residents of Washington State cannot be achieved without the cooperation of the federal government. Medicaid, Medicare, Indian health programs, the ERISA law, the Federal Employees Health Benefits Program, the military, veterans, and the Taft-Hartley trusts all have federal protections that must be dealt with. Forward-thinking members of Congress are thinking about a health partnership approach in which the federal government and state governments cooperate to try reform approaches to decrease the number of uninsured and control costs. The BRC should endorse this concept, which could make a positive impact on the fate of legislation currently pending:
S. 2772 “Health Partnership Act” (Sens. Voinovich and Bingeman) S. 3776 “State-Based Health Care Reform Act” ( Sen. Feingold) HR 5864 “Health Partnership Through Creative Federalism Act” (Reps. Baldwin, Price, Tierney, and Beauprez)
2. How will implementation of your proposal enhance, hinder or otherwise impact the achievement of the vision and each of the goals established by the Commission? How do you know?
Establishing a state-wide SPS will definitely “provide every Washingtonian the ability to obtain needed health care at an affordable price.” This can be accomplished by 2012 for everyone. Children could be added into the state-sponsored program earlier, if desired.
Improving the health of the population will take longer than 5 years. Even immediate implementation of coverage for everyone’s health care will not change health-related behaviors or repair already-damaged bodies in that short a time. That said, implementing health coverage for all residents sets the stage for providing consistent, evidence-based care for residents of every background and socioeconomic level. When everyone is covered by the same program, it is MUCH easier to implement programs to:
Immunize all children and adults as recommended by medical organizations Set up systems to provide consistent, cost-effective management of chronic diseasesProvide educational programs for everyone about preventive care and lifestyle choices related to health Provide support for people who want to make healthy lifestyle changes, but need help doing so Set up specialized programs to work with populations with special needs or ethnic considerations
Implementing these programs, assuming other states do not all do so as well, should lift Washington into the top ten healthiest states in the nation.
Creating a SPS for Washington is the only way to limit health care spending without denying necessary care to some residents. Only by tackling the elephant in the living room - the huge administrative expenses of the private insurance industry that are not paying for anyone’s health care - can health care spending be brought down to the level of inflation (or nearly so). Experience in other nations with national health insurance systems proves that quality health care for all residents can be accomplished at much lower cost than in the U.S. currently.
3. Is your proposal modeled after an existing policy or program within Washington or elsewhere? If so, describe the policy or program and its outcomes.
This Proposal recommends using California’s SB 840 as a model, which we think is the most recent detailed SPS system ready for implementation if it can be funded. (The funding problems do not relate to higher costs of the program, but to political requirements for a supermajority to pass funding legislation.) HCFA-WA drafted a complete system, including a funding mechanism, for Washington State in 2000 as an initiative. A summary of this initiative is appended to this proposal. The monetary amounts surely need to be updated - again, we recommend strongly that any complete plan be studied by a competent actuarial group to determine the adequacy of the proposed funding. No state has implemented a SPS. Three states have passed legislation that is designed to decrease the number of uninsured (Maine, Massachusetts, Vermont). None of these is adequately funded to provide affordable coverage for necessary care for everyone.
However, the U.S. is the only industrialized nation without some kind of national health program that provides decent health coverage for everyone. Pick any one of the systems out there and the U.S. (or Washington State) would be much better off. Ours is the only industrialized nation with 50% of personal bankruptcies caused by medical bills. All of these nations have better population health statistics than the U.S. Even wealthy Americans with health insurance are worse off health-wise than their counterparts in other nations, a fact that counters the popular myth that we have “the best health care in the world”.
A whole paper could be written on this subject, but suffice it to say that treating quality health care as a necessary infrastructure of society and making it available to everyone leads to better health outcomes at lower cost, as demonstrated by the health statistics in all these other nations.
4. Will your proposal impose costs on individuals, businesses or government? Will these costs be time-limited or on-going? Can you estimate how much these costs will be, or suggest how such an estimate could be made? How much, if any, of these costs will be offset by corresponding savings?
Health care is not free anywhere on the planet. The challenge is to require contributions to support the financing of health care in a way that is perceived as fair. In Washington State, the easiest way to do this is with a combination of individual premiums, employer payroll taxes, and government contribution to cover those who cannot afford to contribute. These are roughly the sources of funding for health care currently. Implementing a SPS will involve some transition costs (amount unknown), but then the cost of running the financing system should settle down to 8% or less of total health care spending. Once a specific system is designed, it should be evaluated by an actuarial group to get a better estimate of start-up cost and ongoing cost.
Since the new SPS system ultimately will be less costly than the current mess, there will be savings. These savings will be noticed by providers who will have much reduced administrative costs, employers who no longer have to wrestle with the whole health insurance industry, and individuals who will be able to count on having adequate coverage for a reasonable premium. Payments to providers can take these savings into account, so that the SPS does not become a major income booster for them. Again, past studies of proposals in other states have estimated an overall savings of around 5% as compared with continuation of the present “system”.
5. How does your proposal reflect collaboration among various stakeholders? Which stakeholders have endorsed it?
Implementation of a SPS will require cooperation among government officials in charge of the health care fund, citizens and employers (who need to pay what they are supposed to without major enforcement efforts), and health care providers (who need to negotiate payment rates and participate in coverage decisions).
The concept of a SPS has been endorsed by Physicians for a National Health Plan (representing 14,000 physicians), the National Hispanic Medical Association (representing 36,000 licensed Hispanic physicians in the U.S.), the Washington State Democratic Party, some chapters of the League of Women Voters, Universal Health Care Action Network, Health Care for All (with organizations in many states), the California State Assembly and the State Senate, and many, many labor unions.
6. What are the obstacles to implementing your proposal? Who will object to it and why? How do you suggest these objections be addressed?
Implementing a SPS requires setting up a system that will take virtually all the health insurance business away from the private insurance companies. These companies are profitable (or, in the case of “non-profits”, accumulating large surpluses), have hundreds of employees, and executives earning monumental salaries and other perks.
The pharmaceutical industry will also use all of its money and power to try to block a SPS because a unified system obviously will drive a tough bargain regarding pricing of prescription drugs (as have all the other nations with national health programs), lowering the profitability of the industry. Since this multinational industry has ranked at or near the
top in profits as compared to other industries in the U.S., there is room for lower profits without putting them out of business, no matter how much they complain.
Obviously, both these industries are going to fight SPS tooth and nail, and will be willing to pursue any means, fair or foul, to try to block reform. Both industries have already demonstrated this willingness in derailing past efforts at reform.
However, these industries do not own the United States or the State of Washington. Our elected officials must find the fortitude to face them down and unmask the self-serving nature of their objections to a SPS. Our elected officials have sworn to serve the public as a whole, and need to be willing to do without some very large campaign contributions if necessary.
Employers are aware of how unaffordable it is becoming for them to provide decent health insurance for their employees, but they are not well educated about how much of that cost is due to clinging to the multiple private insurer model of financing health care. Dumping employee health care costs on the public, as some employers are doing, is an inappropriate response to this problem. However, many employers have ideological blinders that prevent them from appreciating what their fellow business people (and their employees) in other nations gain from tax-supported national health programs.
Myths about the “excellence” of U.S. health care and the “inferiority” of single payer systems need to be dispelled:
“We have the best health care in the world.” We do not have the best health, as measured by standardized population health statistics. We have the most expensive acute care in the world, but we lag far behind other nations in preventive care and management of chronic diseases. We routinely overtreat the well insured (sometimes causing harm by so doing), and undertreat those without insurance (causing untold suffering and impoverishment). “Single payer systems will result in long delays in getting treatment.” Some other nations have or have had problems with underinvestment in the resources needed to provide timely care for their populations. These nations are hard at work trying to correct the problem, but none are even thinking of abandoning the commitment to provide affordable health care for every resident. It is important to note that many nations with national health insurance systems do NOT have any wait lists for procedures. In the U.S. there are so many high tech facilities and providers already in place that there is no danger of wait lists as long as the payment system appropriately reimburses necessary care. “Drug prices have to be so high to cover research and development (R&D) costs.” Most of the pharmaceutical industry is in the form of multinational corporations. They are managing to do quite well despite much lower prices for their drugs in other developed nations. In the U.S., the industry’s costs for advertising drugs directly to consumers as well as to providers are larger than their R&D costs. Much of this advertising is first convincing gullible consumers that they have a disease that needs treatment, and then informing them of the most expensive way possible to treat their non-disease. If the ideal health care system prioritizes
prevention, and deals with treatment only when real disease occurs, advertising expensive drugs for non-disease is supremely counterproductive by wasting the time of both the consumer and the provider, driving up costs, and creating misery where none need exist. “Americans want free choice….” This is an essential part of the American character. However, with regard to health care, Americans want the freedom to choose their providers. What they want from their health insurance is coverage for the care decided upon by the patient and the physician working together for the best outcome possible for the patient in a given situation. Currently the health insurance industry places as many obstacles as possible between the patient and the physician on the one hand, and payment for the health care provided on the other hand. Consumers are discovering that all the “choices” offered by the insurers are inferior (or very expensive) - probably the reason behind the poll results showing that over 70% want the government to create a national health plan to cover all Americans. “Market forces should be allowed to fix the health care system.” Competition among health insurers, hospitals, free-standing surgical clinics, drug companies, and others, has failed to control costs or provide affordable health care to many, but rather has added the costs of marketing all these entities to consumers. Market forces are not the appropriate way to handle every need in society. The obvious efficiency and lower cost of providing fire protection by a public fire department, public safety by a public police department, national defense by a public defense department, public roads built by public transportation authorities, and education for everyone by a public education system are clear examples. (Just stop for a moment and imagine the chaos and skyrocketing costs in competing private fire departments or police departments!) The financing of quality health care for everyone should be regarded as the kind of infrastructure needed to improve our nation as a whole, by improving the health (and peace of mind from knowing that care of illnesses will be available when needed) of every citizen. “People should be responsible for their own health.” A common human failing is the inability to make tough choices that require avoiding something comfortable or fun now in order to prevent disease or trouble much later. In a way, most of us remain permanently in the adolescent mindset and ignore the long term consequences of today’s choices. Rather than punishing Americans for bad choices, we need a health care system that encourages good choices AND provides support for making those good choices. Good population-based preventive care and health education can help. We also need to remember that bad things do happen to good people. It is much more compassionate for our society, as well as more cost effective, simply to contribute to the necessary health care of all those who need it and not get side-tracked into arguing about whether the patient “deserved” to get sick.
To quote Gov. Gregoire: “We cannot afford to fail to solve this problem… and by afford I mean the costs to the state and our people.”

Our thanks to the BRC for taking on this tough public policy problem, and for soliciting solutions from any citizen or group of citizens. May you find the strength of purpose to complete your charge.
References
Geyman, John, MD, “Falling Through the Safety Net: Americans Without Health Insurance”, Common Courage Press, 2005.
LeBow, Robert, MD, “Health Care Meltdown: Confronting the Myths and Fixing Our Failing System”, Alan C. Hood & Co., updated edition 2004.
Angell, Marcia, MD, “The Truth About the Drug Companies: How They Deceive Us and What To Do About It”, Random House, 2004.

Tab 17
Health Care That Works
An Overview Of Our Recommendations To The Blue Ribbon Commission
Health Care That Works shares with the Blue Ribbon Commission on Health Care Costs and Access its statements of the Problem, the Vision and Goals.
In its RFP, the Commission asked that the answers to six questions accompany each proposal.
BRC Question #1.
What do you propose be done to realize the vision and goals for Washington State established by the Blue Ribbon Commission on Health Care Costs and Access? Briefly summarize your proposal.
HCTW’s proposal has five components. The Commission can choose to embrace all, parts, or none of these proposal components. What follows is an overview of those components.
First, Health Care That Works recommends that The Governor establish a Task Force with the authority, responsibility and staff to draft legislation that provides every citizen with affordable universal access to health care, with fair reimbursement to providers, and guide that legislation through to enactment. Health Care That Works recommends that the Task Force use California SB 840 as its model for the legislation.
Second, Health Care That Works recommends that, as a part of that responsibility, the Task Force collect data that will help define the problems and facilitate the design of the system that will meet those challenges.
Third, Health Care That Works recommends that, as a part of that responsibility, the Task Force create an informed and educated base of voters, the business community and legislators and, in so doing, motivate them to demand the creation of a health care system that provides universal coverage.
Fourth, Health Care That Works recommends that, as a part of that responsibility, the Task Force create and guide, through to enactment, legislation that provides every citizen with a system of health care which uses evidence-based medicine as a protocol to deliver cost effective treatment outcomes of the highest quality.
Fifth, Health Care That Works recommends that, as a part of that responsibility, the Task Force create and guide, through to enactment, legislation that provides every citizen with an electronic medical record that enables providers to have access to such medical information as may be necessary to provide medical care with safety and thoroughness.
Pages 5 through 8 describe our proposals for each of these elements.
BRC Question # 2.
How will implementation of your proposal enhance, hinder or otherwise impact the achievement of the vision and each of the goals established by the Commission? How do you know?
The HCTW Proposal provides specific recommendations, which, if adopted, will provide a well-defined set of guides for the creation of enabling legislation incorporating all of the
Page One
elements that HCTW believes are essential components of a successful plan.
There is a long road to be traveled between having created a vision statement and having a 24/7 operating Health Care System providing affordable quality care for all our citizens with fair reimbursement to our providers. Health Care That Works believes that its proposal provides a road map with a path outlined to take Washington citizens to the BRC goal.
To the question “How do you know?” For many questions we don’t know. We believe. We desperately need corroborated data in order “to know.”
BRC Question #3.
Is your proposal modeled after an existing policy or program within Washington or elsewhere? If so, describe the policy or program and its outcomes.
HCTW supports the enactment of a Washington version of California SB 840. We have reviewed the several other pending pieces of national legislation addressing universal coverage, notably HR 676, HR 1200, and S 2772. All of these have elements worth considering as possible enhancements. In our opinion, presently only SB 840 has the scope, depth, and detail to provide a working system. It still requires a funding plan, presently under development by the Kuehl team as CA SB 1764. They are interested in our “Calculated Disposable Income” as a mathematical basis for a progressive funding plan.
An educational media campaign has been widely used as a technique for getting legislative approval and community support for and against upcoming legislation. HCTW believes that money to fund such a campaign might be obtained through a combination of grants from State and Federal sources and charitable foundations such as the Robert Woods Johnson and Bill and Melinda Gates Foundations in addition to funds raised by our State’s health care advocacy groups, all working as a coalition to effect change. We can almost guarantee a vigorous media campaign to defeat such legislation by groups in opposition.
Evidence-Based Medicine (EBM) has an impressive list of worldwide supporters. HCTW is not aware of any corroborated data to support an estimate of the reduction in the cost of health care if it were in broad use throughout the Washington medical community. To us, it makes sense that it would. We need numbers to prove that it would and provide an estimate of the likely savings.
The use of the Electronic Health Record system is just beginning to find applications in the United States. It clearly prevents errors where used. Again, we need data.
BRC Question #4
Will your proposal impose costs on individuals, businesses or government? Will these costs be time-limited or ongoing? Can you estimate how much these costs will be, or suggest how such an estimate could be made? How much, if any, of these costs will be offset by corresponding savings?
If fully implemented, the HCTW Proposal will reduce the overall cost of health care in Washington and provide a means of controlling those costs. It will impose costs on those who presently do not presently have health insurance.
Page Two
It will impose costs on those businesses that do not presently subsidize their employees’ health insurance. It will reduce costs for some citizens and businesses. It will raise costs for some citizens and businesses.
The HCTW Proposal will eliminate private insurers from operating in the state.
Premiums for health care are an ongoing cost.
If HCTW’s “Calculated Disposable Income” program is used to compute premiums, it is possible to calculate the premiums necessary that, in its opinion, will equitably provide an income stream that will fully fund the costs of health care for all.
In our Proposal we address the issue of providing corroborating data for those decisions that will have to be made in drafting legislation.
We believe that the present expenditure of $32 Billion for health care will be reduced by eliminating the variously quoted 30% to 38% overhead expenses associated with the private health insurers and replacing their benefit management operations with those of a company such as Noridian that provides those contract services for Medicare at a rate variously quoted at 2% to 5%. This might then save 30% of $20.4 Billion (the private insurer share of the $32 Billion) or $6 Billion. This could pay for insurance coverage for our estimated 600,000 uninsured citizens and leave somewhere between $1.6 Billion and $4 Billion as additional savings. These additional savings would be used to reduce the $32 Billion figure and thus reduce premium expenses. Again, all these figures need corroboration.
The adoption of Evidence-Based Medicine can be expected to reduce the cost of health care. Estimates abound. Pick a number… 10%, 40%? Studies will support your choice. The extension of EBM into the area of “End-of-Life” care can be expected to reduce the cost of health care. Salt Lake City Hospitals spend 30% less than the rest of the United States. The reduction in the practice of “Unnecessary Medicine” can be expected to reduce the cost of health care. Again, pick a study, pick a number. We like 20% By moving previously uninsured patients out of the Emergency Room and into the offices of Primary Care Physicians we believe we will significantly reduce the write-off losses of our hospitals. Our local hospital’s finance officer tells us they wrote off almost $6 Million in 2005 in uncollectible ER treatment of uninsureds. This is a small local hospital with 57 beds serving a community of approximately 30,000 in rural Clallam County.
HCTW prefers not to quote savings percentages for these four areas because, while we have seen many quoted figures in the literature, we do not have corroborating data to support those figures.
BRC Question #5
How does your proposal reflect collaboration among various stakeholders?Which stakeholders have endorsed it?
Physicians for a National Health Plan and Health Care That Works both support the adoption of CA SB 840 as a model for the Washington State Health Plan. We have worked closely with The League of Women Voters, UHCAN, Health Care For All and the offices of California Senator Kuehl, Representative Conyers and Representative McDermott. HR 676 and CA SB 840 staffs are interested in our “Calculated Disposable Income” approach.
Page Three
BRC Question #6.
What are the obstacles to implementing your proposal? Who will object to it and why? How do you suggest these objections be addressed?
The obstacles to the implementation of the Health Care That Works Proposal are formidable. The words “Single Payer” and “Universal Coverage” arouse strong feelings, pro and con.
Here are a few of the contentious issues that have to be dealt with…
There are voters and legislators who are opposed to any change in the status quo.There are the private insurers who will be put out of the health insurance business in Washington.There are the young, healthy uninsureds who “don’t need health insurance” and “have more important things to spend their money on than paying for health care for old folks who are really sick.” There are companies that are self-insured that may resist any change in their control over their businesses by the State. There are the citizens with high incomes who will pay more for their health insurance than they do at present. There are businesses who will pay more for their health insurance than they do at present.There is ERISA, which regulates legislation affecting self-insured plans and private insurance plans. There are HIPAA rulings whose intent are to protect the privacy of medical information but are now obstructing the development of an electronic health record system. Lobbyists will assuredly direct millions of dollars to be used to convince voters and legislators to oppose any meaningful change in the health care insurance system in this state. There are voters and legislators who equate universal access health care with “socialized medicine” and its attendant unacceptable waiting periods for treatment. There is the 1933 State Supreme Court “Culliton” ruling that “income is property” which is still believed, by many, to block the passage by the Washington State Legislature, of any progressive tax for any purpose.
The conventional wisdom for a proposal such as ours is “Political Suicide.”
By doing nothing we will still spend $32 Billion Dollars on health care with that cost going up 9% a year, still leave 600,000 citizens without health care insurance, and have outcomes that trail 36 other OECD nations.
When do we have the courage to say “Enough!!”?
Health Care That Works believes that only the education of our voters, our business owners and our Legislators will create a groundswell of public support for our Proposal. We believe it is the essential element that has been missing from every prior attempt to solve the health care problem in this country.
Give them the facts and the choices and then let the people speak through the ballot box.
Page Four
The Health Care That Works Proposal Elements
1. Create The Health Care Task Force
Health Care That Works believes that the most effective way to enact a health care system that will meet the BRC goals and timeline is to establish a task force whose sole mission is to create, and guide through to enactment, such enabling legislation.
For the salaried position of Task Force Director, we believe that the BRC should nominate no less than three candidates. From that list, The Governor should appoint the Task Force Director.
The Task Force Director will recommend an initial operating budget to cover the first year’s operations within 120 days of being appointed by the Governor. This budget will cover organization, recruitment and operate as it implements the Health Care That Works proposals.
An initial operating fund of $5,000,000 should be made available to the Task Force Director, pending the development and approval of the operating budget for the first year of Task Force operations.
We propose that the provisions of California SB 840 be used as general guidelines for the creation, organization and subsequent operation of the Washington Health Care System. The link to the full text of California SB 840 will be found on Page 7 of this Proposal.
We propose that the funding for the Washington Health Care System use a progressive premium plan such as is described in the Health Care That Works “Calculated Disposable Income.” Links may be found on Page 8 of this Proposal for legal opinions supporting the enactment of progressive taxation for this purpose as well as an explanation and examples of the concept of “Calculated Disposable Income” as a means of favoring our lower income citizens.
Once enabling legislation is enacted, The Task Force Director will transfer operational authority and responsibility to the duly elected Commissioner of the Washington Office of State Health Care. The Washington Office of State Health Care will be organized and staffed in general compliance with CA SB 840 guidelines. The transition process from enacted legislation to full operation is well described in CA SB 840.
Cooperation in this effort will be made available, as required from the Governor’s Office, the Legislature and such other government agencies as are deemed necessary by the Task Force Director.
2. Collect Accurate Data, Develop Accurate Projections and Forecasts
Statistics abound for prior years. Growth rates abound for prior years. Not all questions have answers.
The Task Force Director needs numbers we can all believe and use as a basis for planning.
We have been told that $32 Billion dollars is currently spent on health care in the State of Washington. We have been told that some of that is “unnecessary” overhead.
Page 5
We have been told that “unnecessary” overhead costs Washington citizens $6 Billion dollars a year. We have been told that eliminating that “unnecessary” overhead by going to single payer would more than cover the cost of insuring our 600,000 uninsureds. How much money can be saved by the use of evidence-based medicine? How much does it cost to install, start up and maintain an electronic health record system for a physician? For a town? For a state. After deducting current income from Medicare and Medicaid, we still have some $20 Billion for which to account. Where does that money come from now?
These are but a few of the questions that need hard numbers to aid in the design and funding for a Health Care System that provides universal access with fair reimbursement to Providers.
There should be an ongoing operation to maintain and expand our health care database. Intelligence that is not shared by those who need it is a wasted effort.
The Task Force Director and staff should have priority access to the use of this resource.
3. Creating the Public Demand, Motivating the Legislature, Converting the Opposition
In its Request For Proposals, the BRC asked its stakeholders …
“What are the obstacles to implementing your proposal? Who will object to it and why? How do you suggest these objections be addressed?”
Health Care That Works suggests that the Task Force Director select, by open competitive bidding, one of the top advertising agencies in the United States and one of the leading Opinion Survey companies, a team to run a combined campaign to define issues, educate our voters, business owners and legislators to the advantages of universal access health care, evidence-based medicine, and an electronic health record. As a part of this campaign, the ongoing impact of the campaign would be continuously measured and points requiring additional attention would be addressed.
Health Care That Works believes that this campaign should be professionally produced, using multi-media resources, with prime time and space placements. Funding for and the duration of this program should be professionally advised and judged adequate to the task.
Health Care That Works believes that an important part of the contract negotiations should be a substantial incentive payment paid to the selected agencies if resulting legislation is successful in creating a Universal Access Health Care Plan for the State of Washington.
4. Implementing Evidence-Based Care
Health Care That Works joins with almost every health care advocacy group in the United States, major medical associations, physicians’ groups, hospital associations and many members of the BRC in support of the adoption of evidence-based medicine for those disease groups for which peer group EBM procedure acceptance exists.
Concurrent with the adoption of rules implementing the use of EBM as a working protocol for all Providers, is the obligation to assure the solvency of those groups of Providers who may be impacted by unforeseen developments as a result that EBM implementation.
Page 6
We all heard the “Back Pain” example so forcefully delivered by Dr. Mecklenburg.
Health Care That Works believes that there are reimbursement revisions that may have to be made in order to deal, for example, with the likely loss in ancillary services billings as a result of that reduction in “unnecessary medicine.”
There are likely to be major lobbying efforts to prevent EBM from being enacted because of the increased risk of malpractice litigation resulting from Providers not ordering every possible diagnostic procedure as a result of EBM being in place. This may require enabling legislation.
Health Care That Works is prepared to provide the BRC with specifics on EBM validation, implementation and reimbursement philosophy should that be needed by the BRC. These considerations are available on dozens of web sites. The UW EBM link is on Page 8.
5. Providing Electronic Health Records
Health Care That Works proposes that the Task Force Director create and enact legislation to create a Continuity of Care-based Electronic Health Record system for every Washington citizen.
The advantages of such a system are well known.
Accuracy of describing existing medical conditions to Emergency Providers The ability to deliver electronic prescriptions avoiding errors The ability to confer remotely with specialists out of the region Prevent drug interactions through multiple sourcing of prescriptions
The objections to the implementation of an HER are HIPAA Privacy issues Costs, including equipment, loading patient data and continuous updating Interoperability
Because of the many unknowns to be dealt with in the implementation of an Electronic Health Record system, Health Care That Works proposes that a trial system be installed (obviously we would recommend Port Angeles as that test site.) This system would meet the specifications of the Washington Health Information Infrastructure Advisory Board (HIIAB) and the upcoming specifications of the federal American Health Information Community (AHIC).
Questions and procedures involving installation, training, data loading, patient and provider acceptance, real-time privacy issues, software debugging, all could be evaluated in a small controlled environment. As the system matured, additional providers and patients could be added to the system.
Working with Dr. David Kibbe, of AAFP, we have been advised that grants are available for this type of system development activity.
The privacy issue with HIPAA is going to require cooperation from our US Senators and Representatives.
Health Care That Works believes that the time for an electronic health record system has come.
Page 7
Education is required to create a demand for this desirable tool and the improvement in quality of care and patient safety that it will bring to our health care system.
* * * * * This is the Health Care That Works Proposal. We believe it is a plan that will meet your vision and goals for Washington. It calls for BOLD ACTION.
We wish you well as you pursue this vital challenge.
You have our hearts, minds and wallets.
Serve us well.
Health Care That Works [email protected]
Contact Person: Larry Howard
Links to Supporting Documentation
A thorough review of the history behind the Washington Supreme Court Rulings concerning the constitutionality of a progressive tax on income by Hugh Spitzer and his conclusion, based on many rulings since 1935, that such legislation can now be enacted. (56 Pages)
http://www.olympicuu.org/BRC/PugetSoundLawReview.pdf
The Final Page of the Hugh D. Spitzer Review. (1 Page) http://www.olympicuu.org/BRC/SpitzerLawReviewSummary.doc
The California Kuehl SB 840 Health Insurance System (91 Pages) http://www.olympicuu.org/BRC/CASB840.pdf
How is HCTW’s Calculated Disposable Income Calculated? (17 Slide Presentation) http://www.olympicuu.org/BRC/CDI.ppt
(Use your Page Down key to change slides)
How can I find out how much my premium will be using CDI? (Interactive 1 Page) http://www.olympicuu.org/BRC/HCTWCDIFunding.xls
The Health Care That Works Mission Statement (1 Page) http://www.olympicuu.org/BRC/HCTWMissionStatement.doc
A link to the UW “HealthLinks” web site home page on Evidence-Based Practice. http://healthlinks.washington.edu/ebp
A link to the Search the Trip Database. “Turning Research Into Practice” This will demonstrate the power of the EBM technique. An incredible tool, in use every day at UW Hospital in Seattle
http://www.tripdatabase.com/index.html
Page 8


Tab 18
BLUE RIBBON PROPOSAL: HEALTH COALITION FOR CHILDREN AND YOUTH
The Health Coalition for Children and Youth (HCCY) is a group of health care providers, advocates and stakeholders representing the health care needs of all Washington’s children and youth. We are convened by the Children’s Alliance and have been a voice for the health care needs of Washington children for the past decade.
This document presents the overview of our proposal to achieve the vision of the Blue Ribbon Commission (BRC) for the health of Washington’s children and youth. Our proposal will be submitted for the October 1 deadline. The long-term goal of this proposal is to improve the health of Washington’s children and youth. Achieving this broad long-term goal will require a policy proposal with the following specific goals:
Increase health care coverage for children Increase access to health care services for children through an improved delivery system that incorporates the medical home modelEmphasize and reward the delivery of preventive health care and improve the quality of health care received Secure a sustainable funding source
By focusing on these priorities as a state, Washington will greatly improve the affordability of health care for children and improve their overall health status. Children with health coverage are more likely to have access to a medical home (a regular source of health care that is accessible, continuous, comprehensive, family-centered, coordinated, compassionate, and culturally effective). Access to a medical home increases the likelihood children will receive preventive services such as developmental screenings and fluoride varnishes known to improve health and lower costs.
This proposal will further efforts to achieve the three-part vision of the BRC to cover all children by 2010 or sooner, improve the health of Washington’s children and youth through improved quality and delivery of effective care, and improve the affordability of health care for children and youth by lowering preventable costs.
Our proposal will build on Washington’s current programs that provide health coverage to children including Medicaid, the State Children’s Health Insurance Program (SCHIP), the Children’s Health Program and Basic Health. It will also seek to replicate successful program models such as Kids Get Care and the Children’s Health Improvement Collaborative, and evidence-based initiatives that improve both access to services and the delivery system itself. We will also incorporate models from other states such as a North Carolina program to incent preventive services for children. Research shows that children are more likely to access coverage if their parents are covered; we therefore also seek innovations that encourage coverage for the whole family, including support for the Small Business Assistance Program. We also seek the maximization of available federal SCHIP funds.
Washington’s education system guarantees the right to a basic education to all residents. We must acknowledge that successful achievement of this right is in jeopardy without basic health care for children. When a child cannot see the blackboard, hear the teacher, or is in pain because of untreated dental caries, the opportunities afforded by this right are for naught.
The public understands the fundamental link between health and education, and that prevention is effective. Polls and focus groups conducted both in Washington State and nation-wide consistently show strong support (upwards of 80%) for efforts to cover all children. Our proposal to improve the health of Washington’s children is fundamental to our state’s future ability to serve its residents. It is a practical part of a broader BRC proposal.
Health Coalition for Children and Youth Submission to the Blue Ribbon Commission
Quality Health Care for Every Washington Child September 26, 2006
The Health Coalition on Children and Youth visualizes Washington as a state in which every child is healthy because they have health coverage and access to timely care in a medical home. Both coverage and access to a medical home are important, because together they facilitate receipt of timely services that all children should have. Children are the least expensive group to insure but during the recent budget crisis they were victims of a strategy of cutting back at the margins. This sort of approach is backwards. It holds children hostage to the failures of our health care system, especially in the areas of care for the chronically ill and disabled, which drive the vast majority of Medicaid spending. We applaud the Legislature’s recognition that children should no longer bear this burden, declared in their adoption of HB1441 which states that all Washington children will have coverage by 2010. Furthermore, the vision of the Blue Ribbon Commission is that the state improves access to health care for Washington’s children, improves the health of Washington’s children and improves the affordability of health care. Our proposal is a package that includes policy measures designed to meet these goals. Our proposed policy measures fall into four categories:
I) Increasing children’s health coverage; II) Improving access to care via a medical home; III) Improving the quality of health care services children receive in their
medical home; and IV) Securing a sustainable funding source.
I. Increasing Children’s Health Coverage
Every child should have insurance coverage. Depending on income, this coverage can be paid for by the state and federal government, a parent’s employer or a blend of both, with cost sharing by parents in families with higher incomes. Currently, however, 100,000 children in Washington are uninsured, having fallen through the gaps. There are four principal ways to fill these gaps and cover every child:
A) Make sure all children eligible for programs currently available are enrolled: ~68,000 or 70% of the uninsured kids;
B) Expand the eligibility levels for some current programs: ~8,000 or 10% of the uninsured kids;
C) Capture federal and/or employer funding to cover children in new programs; and
D) Look at innovative programs being implemented at the county level and in other states.
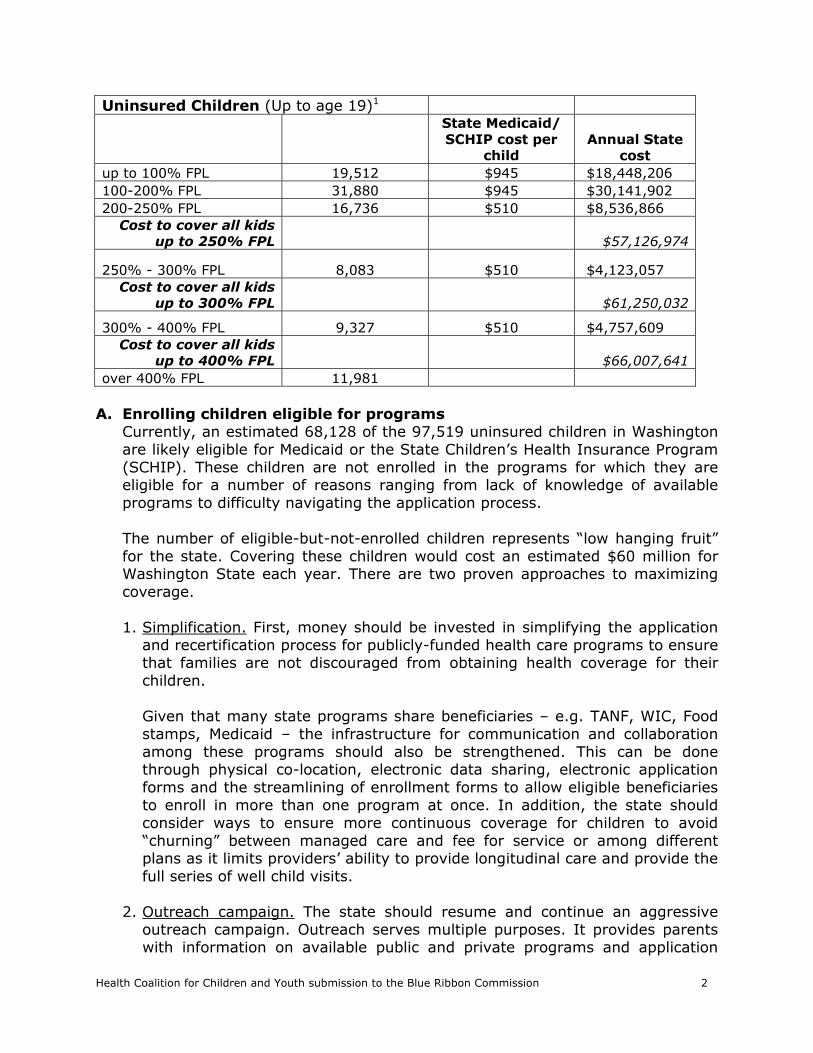
Health Coalition for Children and Youth submission to the Blue Ribbon Commission 2
Uninsured Children (Up to age 19)1
State Medicaid/ SCHIP cost per
child Annual State
cost
up to 100% FPL 19,512 $945 $18,448,206
100-200% FPL 31,880 $945 $30,141,902
200-250% FPL 16,736 $510 $8,536,866
Cost to cover all kids
up to 250% FPL $57,126,974
250% - 300% FPL 8,083 $510 $4,123,057
Cost to cover all kids
up to 300% FPL $61,250,032
300% - 400% FPL 9,327 $510 $4,757,609
Cost to cover all kids
up to 400% FPL $66,007,641
over 400% FPL 11,981
A. Enrolling children eligible for programs
Currently, an estimated 68,128 of the 97,519 uninsured children in Washington are likely eligible for Medicaid or the State Children’s Health Insurance Program (SCHIP). These children are not enrolled in the programs for which they are eligible for a number of reasons ranging from lack of knowledge of available programs to difficulty navigating the application process. The number of eligible-but-not-enrolled children represents “low hanging fruit” for the state. Covering these children would cost an estimated $60 million for Washington State each year. There are two proven approaches to maximizing coverage. 1. Simplification. First, money should be invested in simplifying the application
and recertification process for publicly-funded health care programs to ensure that families are not discouraged from obtaining health coverage for their children.
Given that many state programs share beneficiaries – e.g. TANF, WIC, Food stamps, Medicaid – the infrastructure for communication and collaboration among these programs should also be strengthened. This can be done through physical co-location, electronic data sharing, electronic application forms and the streamlining of enrollment forms to allow eligible beneficiaries to enroll in more than one program at once. In addition, the state should consider ways to ensure more continuous coverage for children to avoid “churning” between managed care and fee for service or among different plans as it limits providers’ ability to provide longitudinal care and provide the full series of well child visits.
2. Outreach campaign. The state should resume and continue an aggressive
outreach campaign. Outreach serves multiple purposes. It provides parents with information on available public and private programs and application
Health Coalition for Children and Youth submission to the Blue Ribbon Commission 3
assistance. Outreach should also be used to educate parents about the importance of health coverage and preventive health care, as well as how to effectively navigate and use the health care system. Outreach is an important component in any plan to improve the health of Washington children.
Recently, Governor Gregoire has authorized the use of $1.9 million in federal SCHIP dollars for outreach. These funds can be matched by $1.1 million in state and local dollars for a total of $3 million for outreach activities. In addition, $1 million in General Fund-State dollars should be allocated each year to match with Federal SCHIP dollars to conduct ongoing statewide outreach activities that promote preventive health care for children and obtain coverage for their children.
B. Expanding eligibility levels for current programs
In order to create a seamless set of programs for all children eligible for public coverage, eligibility for both SCHIP and the Children’s Health Program should be expanded to 300% FPL while maintaining a benefits and cost-sharing structure that mirror Medicaid. This expansion would cover an additional 8,000 children at an estimated state cost of over $4 million. The SCHIP expansion would bring Washington State in line with the six states (HI, MD, NH, VT, NJ, and MA) that have SCHIP programs at or above this level.
C. Capturing federal and/or employer funding to cover children in new programs
One of the ways that the state can ensure every child is covered by 2010 is to maximize opportunities beyond the scope of state programs – including federal funding opportunities and those rooted in employer participation.
1. New Federal Resources - Family Opportunity Act
The federal Family Opportunity Act of 2005 allows low- and middle-income families with children with significant disabilities to buy into Medicaid coverage for these children on a sliding scale up to 300% FPL. The state would need to change its Medicaid program by state plan amendment in order to create this new Medicaid category in Washington. The National Health Interview Survey (NHIS) and current census data shows that 8% of children in this country have significant disabilities, but many of them do not have access to critical health care services they need. Washington State estimates that several hundred Washington children could benefit from this program.
Many employer-sponsored health plans do not cover essential services needed by these children. For example, neither private insurance nor the majority of State Children's Health Insurance Programs cover important rehabilitative services and supports, such as long term physical, occupational, or speech therapies. These services are often needed to maintain the existing function of children with disabilities.
Health Coalition for Children and Youth submission to the Blue Ribbon Commission 4
Medicaid can provide these comprehensive services, but parents have been forced to impoverish themselves, put their children in out-of-home placements, or give up custody in order for parents to maintain Medicaid eligibility. In order to move Washington closer to its goal of covering all children by 2010, the state plan should be amended to create the new Medicaid eligibility category allowed by the Family Opportunity Act.
2. New Employer Resources – Small Business Assistance Partnership
The state Small Business Assistance Partnership Program could make it more feasible for low-income employees in small businesses to purchase health care. This program, enacted in legislation earlier this year, was created to blend small employer, employee and state funds to expand coverage options for employees and dependents in this market, where coverage rates have historically been very low. If successful, this program could inject millions of new private dollars into coverage for children and their parents.
D. Innovative ideas at the county level and in other states
The Health Coalition on Children and Youth encourages the BRC to closely examine children’s coverage models in counties and other states. Models being implemented or considered in other states include buy-in options above SCHIP income eligibility levels and maximizing managed care enrollment.
1. County level innovations – in Washington and other states
Eighteen California counties and King County are developing gap insurance programs to address the financial barriers to purchasing health coverage faced by working poor families. In these areas, affordability is made worse by high costs of living, especially housing costs. Seventeen of these California counties offer subsidized coverage to families up to 300% FPL, with Santa Clara offering coverage up to 400% FPL. King County is preparing to fund a gap insurance product for children up to 300% FPL. If expanded, SCHIP could vastly improve the affordability of coverage for children in this gap by leveraging a 65% federal match.
2. Employer Buy-In (IL, PA, VT, TN)
Washington should consider an option for families with incomes above the SCHIP eligibility level (250% FPL) to buy into an SCHIP look-alike program for children’s coverage. This approach should involve appropriately tiered cost-sharing that increases with income. The Illinois model has no upper income limit.
3. Maximizing Medicaid Managed Care Enrollment (IL, VT)
Washington State should wisely utilize available resources by maximizing children’s enrollment in Healthy Options, Washington’s Medicaid managed care program. Managed care creates a medical home, reduces costs, increases appropriate utilization including well-child visits and immunizations, and helps to improve health outcomes, all with set up front costs and the easily accessible claims and utilization data.
Health Coalition for Children and Youth submission to the Blue Ribbon Commission 5
II. Improving Access to Care via Medical Homes Children who receive care in a medical home are more likely to access all necessary and appropriate care including well child visits and immunizations that keep children healthy and prevent future illnesses. The Blue Ribbon Commission’s vision for improved access to health care for children will be within reach when all children have a medical home.
A. Medical Home - Background: The Medical Home is a concept developed in part by the Maternal Child Health Bureau (MCHB), the American Academy of Pediatrics (AAP), the American Academy of Family Medicine, and the American College of Physicians. The concept promotes the provision of comprehensive coordinated care at a primary care level. The medical home model acknowledges that the best quality of care is provided not in episodic, illness-oriented, complaint based care, but through patient centered, physician guided cost efficient longitudinal care focused on continuous healing relationships. These organizations vary somewhat in their specifics, but all identify some core characteristics of a medical home, and draw from the Chronic Care Model (CCM) developed by Ed Wagner and colleagues at Group Health Cooperative. The CCM can be equally applied across all clinical situations, not just chronic illness. The characteristics of a medical home are detailed below.
1. Accessible
• Care is provided in the child’s or youth’s community. • Public programs and private reimbursement encourage and support
continuous healing relationships in medical home practices, whether centered in community health centers, private physician’s offices or integrated group practice settings.
• Changes in insurance are accommodated. • Practice is accessible by public transportation, where available. • Families or youth are able to speak directly to the physician when needed. • The practice is physically accessible and meets Americans with Disabilities
Act requirements.
2. Family centered • The medical home physician is known to the child or youth and family. • Mutual responsibility and trust exists between the patient and family and
the medical home physician. • The family is recognized as the principal caregiver and center of strength
and support for child. • Clear, unbiased, and complete information and options are shared on an
ongoing basis with the family. • Families and youth are supported to play a central role in care
coordination. • Families, youth, and physicians share responsibility in decision making. • The family is recognized as the expert in their child’s care, and youth are
recognized as the experts in their own care.
Health Coalition for Children and Youth submission to the Blue Ribbon Commission 6
3. Continuous
• The same primary pediatric health care professionals are available from infancy through adolescence and young adulthood.
• Assistance with transitions, in the form of developmentally appropriate health assessments and counseling, is available to the child or youth and family.
• The medical home physician participates to the fullest extent allowed in care and discharge planning when the child is hospitalized or care is provided at another facility or by another provider.
4. Comprehensive
• Care is delivered or directed by a well-trained physician who is able to manage and facilitate essentially all aspects of care.
• Ambulatory and inpatient care for ongoing and acute illnesses is ensured, 24 hours a day, 7 days a week, 52 weeks a year.
• Preventive care is provided that includes immunizations, growth and development assessments, appropriate screenings, health care supervision, and patient and parent counseling about health, safety, nutrition, parenting, and psychosocial issues.
• Preventive, primary, and tertiary care needs are addressed. • The physician advocates for the child, youth, and family in obtaining
comprehensive care and shares responsibility for the care that is provided.
• The child’s or youth’s and family’s medical, educational, developmental, psychosocial, and other service needs are identified and addressed.
• Information is made available about private insurance and public resources, including Supplemental Security Income, Medicaid, the State Children’s Health Insurance Program, waivers, early intervention programs, and Title V State Programs for Children with Special Health Care Needs.
• Extra time for an office visit is scheduled for children with special health care needs, when indicated.
5. Coordinated
• A plan of care is developed by the physician, child or youth, and family and is shared with other providers, agencies, and organizations involved with the care of the patient.
• Care among multiple providers is coordinated through the medical home. • A central record or database containing all pertinent medical information,
including hospitalizations and specialty care, is maintained at the practice. The record is accessible and shared among other providers on a child’s care team and in emergency circumstances. Confidentiality is preserved.
• The medical home physician shares information among the child or youth, family, and consultant and provides specific reason for referral to appropriate pediatric medical subspecialists, surgical specialists, and mental health/developmental professionals.
Health Coalition for Children and Youth submission to the Blue Ribbon Commission 7
• Families are linked to family support groups, parent-to-parent groups, and other family resources.
• When a child or youth is referred for a consultation or additional care, the medical home physician assists the child, youth, and family in communicating clinical issues.
• The medical home physician evaluates and interprets the consultant’s recommendations for the child or youth and family and, in consultation with them and subspecialists, implements recommendations that are indicated and appropriate.
• The plan of care is coordinated with educational and other community organizations to ensure that special health needs of the individual child are addressed.
6. Compassionate
• Concern for the well-being of the child or youth and family is expressed and demonstrated in verbal and nonverbal interactions.
• Efforts are made to understand and empathize with the feelings and perspectives of the family as well as the child or youth.
7. Culturally Effective
• The child’s or youth’s and family’s cultural background, including beliefs, rituals, and customs, are recognized, valued, respected, and incorporated into the care plan.
• All efforts are made to ensure that the child or youth and family understand the results of the medical encounter and the care plan, including the provision of (para) professional translators or interpreters, as needed. Written materials are provided in the family’s primary language. Use of health navigators is incorporated in facilitation of culturally effective services, such as community health workers serving as cultural brokers.
B. Improving Access to Needed Services
To improve the health of Washington children and reduce health care expenditures, it is critical to address the fact that 100,000 Washington children lack coverage, and many of them lack access to the health care services that coverage affords. Today we know that in Washington only half of children have a medical home.2 Since we also know that a medical home is clearly linked to health care access, this is a serious obstacle to timely and appropriate care for children. 1. Increase Insurance Coverage. Insurance is one way to increase access to
care for children. A recent study on Oregon’s SCHIP program found that, while enrolled in this public health insurance program, more than 95 percent of children had a standard source of physician care. However, after losing public health coverage, the number of children with a standard physician care shrunk. About 20 percent of children previously enrolled in the program reported an unmet medical need.3 Unmet medical needs lead to higher costs that must be shifted to other payers. For example, the cost of one
Health Coalition for Children and Youth submission to the Blue Ribbon Commission 8
hospitalization for a treatable condition like an ear infection costs the same as two year’s worth of continuous coverage under Medicaid.4
2. Pay providers adequate rates. Another necessary ingredient to ensure access
is providers who are willing to see children on Medicaid. Unfortunately, low Medicaid reimbursement rates have lead to a decrease in providers willing to accept it as coverage.
While community health centers and public health clinics see a significant number of children on Medicaid, private providers are another very important source of care. Providers in private clinics increasingly struggle to balance a growing caseload of children on public programs without a commensurate increase in payment for services provided – while also witnessing a drop in the privately insured children’s caseload. Between 65% and 95% of private providers in urban counties report their clinics are closed-to or significantly restrict new public patients. In addition, 20% to 60% of private practices (depending on location and payer) with Rural Health Clinic certification report that they are closed-to or are restricting new patients.5 Without a change in Medicaid fee for service reimbursement, parents of kids on Medicaid will find it harder to locate a doctor. Increasing Medicaid fee-for-service reimbursement rates has been linked to lower hospitalization rates for children. Although certain Medicaid office visits have been adjusted upward slightly over the past several years rates, the last substantial Medicaid reimbursement increase for children’s services was in 1989. This increase led to a 90% decline in hospitalization rates for children on Medicaid, improving their access to quality primary and preventive health care in a medical home. We propose that Medicaid fee-for-service rates be increased significantly, in order to ensure that an adequate number of providers are able to serve Medicaid children. Any rate increase should not result in any corresponding reductions in eligibility, coverage, or affordability of services. Increasing fee-for-service rates for Medicaid children is a wise investment since payments for physician services for children represent a small portion of total billed Medicaid services. In fact, less than 3% of Medicaid payments are for physician services for children and adolescents under 21 years.
3. Provide rates to managed care plans that keep up with medical costs and are actuarially sound. For four years in a row, rates provided to the health plans have outstripped the cost of providing care, creating another access problem for children. Health plans are relied on by the state to provide high-quality coverage and create access for children and adults in rural and underserved areas of the state at a predictable cost. Care for kids in managed care hinges on financially solvent health plans with adequate networks of primary and specialty providers and health care institutions.6 Plans can secure their networks only by providing comprehensive coverage and adequate payment levels.
Health Coalition for Children and Youth submission to the Blue Ribbon Commission 9
We propose that the state follow actuarially sound guidelines in its Healthy Options rate-setting process to ensured continued strong participation of managed care plans in the program. Evidence from the past four years suggests that Washington’s Medicaid rate-setting process may not be fully compliant with federal law. Federal law requires Medicaid rates to not only be set via an actuarially sound process, but also to be actuarially sound at the point of provider payment. While Washington follows the letter of the law on the first point, budget corrections over the last few years have resulted in deviations that create problems at the point of payment. Congress is increasingly considering more vigorous oversight and auditing of state rate setting methodology. The current practice of setting rates below medical trend is unsustainable. If left to continue, the trend could lead to a serious access crisis as plans are forced to scale back Healthy Options service. In 2007, the Legislature should approve adequate funding for Healthy Options for calendar years 2008 and 2009.
Without change, the current access problems facing Washington’s children will likely worsen as the number of children in Washington that rely on publicly-funded health care programs grows. When children cannot access a primary care provider, they lose out on all the benefits of a medical home - and end up losing the critical link to a medical home where they are more likely to receive developmental screenings, immunizations, fluoride varnishes and other preventive services known to improve health, prevent illness and lower costs. In addition, parents often end up relying on emergency rooms for care that is much more expensive.
Health Coalition for Children and Youth submission to the Blue Ribbon Commission 10
III. Improving the Quality of Health Care Services Children Receive
in Their Medical Home
Every child in Washington should be healthy and ready to learn, and scarce resources should be spent on proven services that help get us there. Currently in Washington State, much of the data about children obtaining preventive health care services is dismal. Two examples indicate that Washington has a long way to go in the area of preventive care for kids:
• Washington ranked 42nd of 50 states in childhood immunizations in 2005;7 and
• Fewer than 40 percent of Washington children under 15 months are getting all six of the recommended well child care visits that should be standard under Medicaid coverage.8
The third component of our proposal seeks to identify measures that will inform the state about whether children are receiving quality health care and to reward provider and health plan performance. The overall design principles are presented below, with additional detail on incentive alignment, the vital few, and health system integration in the following sections.
A. Design principles for a pay for performance or incentive program
It is time to start the transition to performance-based payments that measure quality. Physicians and other providers who go the extra mile to assure access for kids and deliver preventive services to the patients in their care should be financially rewarded. Some publicly funded programs have already begun the transition, for example Medicare now pays 3% more for outpatient hospital services to hospitals that are able to report performance data, regardless of the level of performance. Ideally, providers should be accountable and evaluated based on a balance of structure, process and outcome measures. The process of how the payment changes are developed is almost as important as the final design. The purpose of paying more for measurably higher quality care is to motivate health care providers and that is done best by using an inclusive process to inspire rather than penalize or dictate.
1. Choose a vital few measures
Instead of launching a myriad of quality measures, the incentive program should select a “vital few” measures that allows both the state and the providers to focus together on key quality improvement targets. • Strike a balance between keeping reporting requirements manageable
and emphasizing important measures (“excessive reporting” versus “what gets measured gets done”).
• Designate one or two coordinated statewide quality improvement initiatives, instead of requiring health plans to implement five separate, self-chosen performance improvement projects.
• Some or all of the HEDIS measures now validated and collected should be used, and a process should be established that describes how change will happen over time. (see Part C below.)
Health Coalition for Children and Youth submission to the Blue Ribbon Commission 11
• As much uniformity as possible among various payers (public and private) should be designed into the incentive structure. Providers cannot respond to multiple and conflicting incentives from a variety of different payers.
2. Make sure these evidence-based measures are strategically aligned to key health outcomes. The incentives should be based on evidence-based measures whose goals are clearly aligned with desired quality outcomes. Longer-term incentives should be substantial and clearly communicated to providers and plans. There should be assistance and incentives for those providers who adopt electronic medical technology to increase accuracy and transparency.
3. Design with provider input. Providers, plans and the public health
community should be engaged in outlining specific ways to incent the desired goals, measurement criteria and methodology. This dialogue will be more successful than imposing the incentives unilaterally. All provider types, including community clinic and private providers, should both be part of an incentive plan. The providers need to understand, guide and support the system developed.
4. Support quality improvement with programs, education, tools and community
involvement. Incentives to participate in educational activities like learning collaboratives (e.g., the Children’s Health Improvement Collaborative) and other quality improvement initiatives are necessary in order to see positive change both at the clinic level and in communities. Such change is fundamental for effective programs. • The incentives need to include both internal system changes as well as
activities that engage the community to be effective. • The desired and incented changes will need to include community
outreach/engagement, health plan level changes and practice level changes.
5. Attach significant incentives, whether dollars, assignment, etc.
Incentives for meeting the outcome goals should add to the amount now received and not result in more work with better outcomes for the same payment. If primary care providers are to be asked to do more at a higher quality level, they should be rewarded, even if that means a larger proportion of expenditures go to primary care or other incented groups. • Incentive funds for providers should reach actual providers, either as
direct payments or as part of the provider incentive program at each health plan.
• The incentives should be built into the managed care plans for the managed care patients and through fee-for-service for those patients. The goal would be to build on current programs and make them more effective.
Health Coalition for Children and Youth submission to the Blue Ribbon Commission 12
B. Align incentives directly with the desired outcomes As stated in the design principles, it is important that the incentives are designed to reward providers for delivering evidence-based care that results in key health outcomes, such as the following two examples.
1. Pay for desired preventive health services. One basic method to ensure
payment for preventive health services is by linking codes for specific procedures or overall measures of population health to increases in reimbursement rates. Washington State could choose to increase Medicaid fee-for-service reimbursement for both specific CPT codes for preventive HEDIS measures (listed in Part C below) as well as several of the set of population-based measures (listed in Part D below) to financially incent the delivery of preventive services.
This strategy is currently in place in North Carolina, where the state pays physicians for developmental screenings (99610 at $28), oral health screening, parent education and fluoride varnish. Additional preventive measures that could be used in this strategy include: STD screening, immunization administration, depression screening for teens, prenatal and postpartum women, and tobacco cessation.
2. Care coordination and linkage with early developmental intervention services.
Care coordination is an important tool to assure that comprehensive preventive services are provided to children in a medical home and to make sure that families are connected with developmental and other community resources when needed.
For example, the Kids Get Care case managers and community health educators have linked close to 23,000 low-income children to medical and dental homes. Approximately 9,000 community agency staff in King, Pierce and Snohomish Counties have been trained to identify early warning signs of developmental delays and oral health problems in young children and how to communicate these issues and the need for early intervention to parents. The staff are also trained about community resources and Access to Baby and Child Dentistry trained dentists who will accept Medicaid payments so that they can help parents more easily navigate confusing systems. Integrating preventive services for the mouth, mind and body has improved health outcomes and increased parent satisfaction and should be incented whenever possible. Kids Get Care and other effective care coordination strategies should be adopted statewide to make sure that low-income families from all cultures received appropriate preventive services and early interventions for their children.
If it is not possible to use staff at existing clinics and practices, Washington State should consider alternative structures and funding mechanisms. Another care coordination model is used in North Carolina where accountable
Health Coalition for Children and Youth submission to the Blue Ribbon Commission 13
community care corporations receive per member per month payments to support case managers and early intervention specialists. North Carolina currently provides funding to link care coordination with early developmental intervention services through local community level entities. These Community Care Corporations receive $2.50 per Medicaid member per month to develop the staff and programs needed to improve the management of enrollee care. These dollars may not be used to make direct payments to clinical providers but are instead allocated to support the development of ACCESS II/III plans and initiatives. The program has demonstrated the following results: • Annual cost to state: $1.5 million. Initial costs offset by the cost savings
generated by the program. Legislature approved funding in spite of tight budgets. Plans are to finance the expansion through the costs savings realized from the local initiatives.
• Physician payments: Each ACCESS participating physician receives $2.00 per member per month to coordinate care for his or her enrolled population.
C. Strategic focus on the vital few: HEDIS measures
In keeping with goals of manageable and strategic data collection, initial selection of “the vital few” initial measures should be limited to the HEDIS measures that are already in place and collected annually by the State: 1. Prenatal Care: Percentage of women who received a prenatal visit within the
first trimester or within 42 days of enrollment in a managed care organization.
2. Immunizations: Percentage of children who had four DTaP/DT, three IPV,
one MMR, three haemophilus influenza type B, three hepatitis B and one chicken pox vaccination by the child's second birthday.
3. Well Child Care (One measure with 3 age-appropriate sections):
• Percentage of members who received 0, 1, 2, 3, 4, 5, and 6 or more visits in first 15 months of life
• Percentage of members age 3 to 6 who received one or more well-child visits with a primary care provider during measurement year.
• Percentage of members age 12 through 21 years who had at least one comprehensive visit with a primary care provider or OB/GYN during the measurement year
4. Oral Health Utilization: Medicaid dental care: percentage of enrolled Medicaid members ages 3 through 21 years who had at least one dental visit during the measurement year.
5. Tobacco: Percent of members -- both current smokers and recent quitters --
who received advice to quit smoking.
Health Coalition for Children and Youth submission to the Blue Ribbon Commission 14
6. Asthma: There are two appropriate asthma measures.
• Dispenses prescriptions - Percentage of members age 5-9 and 10-17 with persistent asthma who had at least one dispensed prescription for inhaled corticosteroids, nedocromil, cromolyn sodium, leukotriene modifiers, or methylxanthines in the measurement year.
• Action plans - Percentage of members age 5-9 and 10-17 with persistent asthma who have a documented action plan.
D. Increase overall health system integration and accountability:
Population Measures
Although many key clinical processes can be measured at a provider or plan level through HEDIS measures, certain key health processes and outcomes are currently better measured through population wide data. Regular reports of this community or state level data, as part of a core public health assessment function, will provide an important point of community level accountability for provider and plan performance.
Aggregated at the state level, this same data would be a key point of public accountability for the performance of the state agencies and programs that plan, organize and direct payments for this care in the same way the WASL now provides such accountability for all levels within the public schools.
Local public health jurisdictions should be authorized and funded to collect, analyze and report on the population wide data elements listed below. Not only do they have access to much of the data, they have the "position" in the community of "objective expert".
1. Health Care Home: Percent who have a regular source of primary care
• Source: Collected in the Behavioral Risk Factor Surveillance System (BRFSS), (adults only), Consumer Assessment of Health Plans, Promoting Healthy Development Survey, WA State Healthy Youth Survey and the National Interview Survey.
2. Obesity: Percent with a Body Mass Index (BMI) for children and teens equal
to or greater than the 95th percentile • Source: Medical record.
3. Oral Health Prevention: There are two appropriate measures. Measure 1: Percent of Medicaid children under five who get fluoride varnish • Source: Billing data Measure 2: Percent screened for oral health • Source: Medical record.
4. Development: Percent screened for developmental delays with validated tool • Source: Medical record.
Health Coalition for Children and Youth submission to the Blue Ribbon Commission 15
5. ADHD: Percent of patients diagnosed with attention deficit hyperactivity disorder (ADHD) and on first-line medication whose medical record contains documentation of a follow-up visit twice a year.
a. Source: Medical record. Institute for Clinical Systems Improvement.
6. Mental health: Depression screening, maternal and adolescent, such as the Maternal Mood Disorder and Domestic Violence screener. • Source: WA State Healthy Youth Survey, Medical record.
7. Youth health: There are several possible measures that should be explored. • Depression screening, as above • Sexually transmitted diseases, e.g. chlamydia screening • Immunizations, e.g. HPV vaccination and others
Health Coalition for Children and Youth submission to the Blue Ribbon Commission 16
IV. Securing a Sustainable Funding Source In order to implement this proposal, Washington will need not only to shuffle resources to ensure our largest investments are made in prevention, but also obtain stable funding sources. It is important to remember that while children make up 58% of Medicaid enrollees, they are responsible for only 23% of the costs, making them an ideal starting place for improving the current and future health of Washington. A. Federal Funding Sources
Washington should continue to pursue all opportunities to increase federal dollars available to improve the health of Washington’s children, beginning with the three listed below. Funds resulting from successfully securing the SCHIP fix and HIFA waiver should be dedicated exclusively to children’s coverage.
1. Permanent SCHIP Fix
A permanent SCHIP fix would give Washington State access to a greater proportion of its SCHIP allotment by allowing the SCHIP matching rate for children enrolled in Medicaid with family incomes between 150% and 200% FPL. The state should continue to work with Washington’s congressional delegation to secure a permanent SCHIP fix that would allow Washington access to additional federal resources to fund children’s coverage.
2. SCHIP HIFA Waiver The SCHIP waiver sought by the state would benefit parents of children on SCHIP or medical assistance that are U.S. citizens and not otherwise eligible for Medicaid, allowing the use of unspent SCHIP funds to draw down Washington’s enhanced 65% SCHIP federal match to create additional BHP slots to cover these adults. Research consistently confirms the positive relationship between parental coverage and children’s coverage, making this a key to the state’s efforts to improve the health of Washington’s children and increase access to care. The state should aggressively pursue approval of this waiver. House Bill 2572 passed in 2006 and requires this waiver to be submitted by October 1, 2006.
3. Family Opportunity Act
As mentioned in Section I, part 3 of this proposal – The Family Opportunity Act of 2005 allows low and middle-income families with children with significant disabilities to buy into Medicaid coverage for these children on a sliding scale up to 300% FPL. The state should pursue the necessary changes to its Medicaid program via state plan amendment to ensure adoption of the Family Opportunity Act. The state estimates that several hundred children are likely eligible.
B. Reclaiming wasted dollars
A study by the National Association of Community Health Centers estimated if all non-emergent care in Washington State in 2006 was delivered at a community health center rather than an emergency room, our state's health
Health Coalition for Children and Youth submission to the Blue Ribbon Commission 17
care system would have saved an estimated $355 million. Finding an innovative way to shift inappropriate emergency room and hospital use to a more appropriate primary care setting should free up significant funds to put toward coverage and primary care for children in Washington. One concrete step should be pursued by this state: submit an application for a federal grant opportunity included in the Deficit Reduction Act that would support emergency room diversion innovations.
There are numerous examples of irrational spending in Washington’s health care system. The Blue Ribbon Commission is in an excellent position to conduct a full analysis of health care spending in the state to identify opportunities for more rationale and effective spending.
C. New State Revenue Sources
New state revenues will need to be secured in order to ensure sufficient and consistent funding of this proposal. A number of different possibilities should be considered. A reasonable test should be whether the new revenue source can be linked to encouraging healthy behavior. For example, taxes on candy, soda or tobacco products should be seriously considered.
Health Coalition for Children and Youth submission to the Blue Ribbon Commission 18
Endnotes 1 Numbers of uninsured children are from the 2004 Washington State Population Survey. It appears that the number of non-citizen children was under counted in this data source, and therefore it was not possible to discretely include the cost of covering non-citizen children in the calculations so they are included with all kids. As the FFS cost of covering this group of children is higher than either the Medicaid or SCHIP cost, this will slightly inflate the overall cost to the state. Approximate FY 07 rates for Washington’s public programs are in the table below.
Per Year State share
Annual State Cost
Medicaid (capitated) $1891 50% $945 SCHIP (capitated) $1457 35% $510 Children's Health Program (FFS) $1260 100% $1,260
2 As determined by the National Survey of Children’s Health, http://nschdata.org/Content/ StatePrevalence.aspx?geo=Washington. 3 Mitchell, Haber, and Hoover. “What Happens to Children Who Lose Public Health Insurance Coverage?” Med Care Res Rev 2006 63: 623-635 4 Cost is split between federal and state. Comparable hospitalization would cost the same as four year’s worth of state spending. Data obtained from the Washington State Hospital Association, Sept. 30, 2004 by the Children’s Alliance. 2002 mean cost of one hospitalization for an ear, nose or throat infection = $3920; annual cost for one year of Medicaid coverage= $1,700. 5 Schueler, Vince. Office of Community and Rural Health, Washington State Department of Health. Washington’s Primary Care Safety Net: Structure and Availability. July 9, 2004. http://www.doh.wa.gov/hsqa/ocrh/har/Wapcnet.doc 6 Rosenbaum, Sara, J.D. Policy Brief: Defined-Contribution Plans and Limited-Benefit Arrangements: Implications for Medicaid Beneficiaries. September 13, 2006. The George Washington University Medical Center - with support from America’s Health Insurance Plans. 7 State ranking found in the United Health Foundation, “America’s Health Rankings 2005”. http://www.unitedhealthfoundation.org/shr2005/components/immunization.html . 8 Press release on DSHS compiled HEDIS results, Feb. 15, 2005. http://www1.dshs.wa.gov/mediareleases/2005/pr05021.shtml.

Tab 19
Schaff, Randi
From: Gregg S Grattan [[email protected]]
Sent: Thursday, August 24, 2006 7:58 AM
To: Blue Ribbon Commission on Health Care Costs and Access
Subject: Health Care costs
Page 1 of 2
8/31/2006
August 24, 2006
The Honorable Christine Gregoire, GovernorThe Honorable Pat Thibaudeau, Co-ChairBlue Ribbon Commission on Health Care Cost and AccessOlympia, WA 98504
Dear Governor Gregoire, Co-Chair Thibaudeau and Members of the Commission:
I would like to take a moment to let you know that I feel Washington State needs major health care reform. As a small business owner, this is one area of necessary expense that is getting harder to deal with each year due to increasing costs. As a background, I offer to pay for the full amount of health insurance for my employees. As costs rise, I have looked at a partial payment system but many of the employees state that if they have to pay for any of the insurance they will not take it. This is not a good situation for the employee nor the employer. The employee needs health insurance and the employer gets people back to work faster if their health care is taken care of. Also, the only way we can afford insurance at all is through group rates and if enough employees drop off, we no longer qualify for group rates. My buying group (Ace Hardware) has initiated some very good rates for health care in other states nationwide but they say time and time again that “Washington State just is not a state that allows for this type of negotiation – they have us over a barrel”. Individual insurance is too costly. Add this to the fact that we are paying the highest minimum wage in the nation which has hurt my business more each year, but I will save that discussion for another time. It has become very necessary for the system to be fixed.
I would like to let you know that I support the recommendations of the Independent Business Association. Those recommendations are as follows:
We strongly support a private market system, not a government-run or government managed health care system like the state‘s current Industrial Insurance program. We fully understand the benefits of atrue competitive private market system because we deal in it every day. We know that the private marketsystem is the best system to assure maximum value for every purchasing dollar – provided there is real and true competition.
We strongly support making affordable health care plans available to Washington small business owners by setting at least two target price points for health care plans with one having an average cost of $100 per person per month, and another plan at $150 per person per month. Insurers can also offer anyother health care plans they want, but they must be allowed and encouraged to offer plans in the lowerprice ranges. We also support the IBA proposal that insurers use a standardized state form indicatingwhich currently mandated benefits are included and not included in their plans, and the standardized formwould also include other basic elements of the plan like deductibles, co-pays, exclusions, etc.
We support changing Washington insurance rating mechanisms so they are more like insurance rating systems used in other states. Washington State has one of the most unique health insurance ratinglaws for small businesses in the nation and many insurers do not offer health insurance to smallbusinesses in Washington State due to the uniqueness of Washington’s rating laws. This is dramatically reducing competition among insurers, significantly reducing the benefits of a private, competitive marketto control costs. Thus, we are paying more for health insurance in Washington State than in other states. We truly need to foster much greater competition among health insurers in Washington State.
We agree in IBA’s proposal to educated workers on the benefits of enrolling in employer providedhealth care plans with before-tax-dollars rather than after-tax dollars. We are well aware of many workers who refuse health care coverage in order to increase their take-home pay. That is “penny wise and pound foolish.”
Health care is the responsibility of each individual. State government can only help facilitate access to affordable health care insurance and affordable health care services. We strongly agree with the IBA,the Commission and the Legislature must focus on individual responsibility and incentives, not onemployer mandates.
We support the proposal to provide incentives to health care providers for providing cost effectivehealth care services. We agree with the IBA, the current health care delivery system in Washington Stateis backwards. It rewards providers for excessive use of the system and penalizes efficient use of thesystem. We urge you to create incentives to turn-around this backward health care delivery system.
We support the IBA’s proposal to improve access to health care information about the effectiveness of health care providers. As consumers, we need this information to make informed health caredecisions. When consumers have the information they need to make informed health care decisions, theycan and will help reduce the costs of health care in Washington State.
Thanks for your time! Please consider the IBA’s comments as well as my own very carefully.
Sincerely,
Gregg S. GrattanOmak Ace Hardware #4226Y661 Riverside DriveOmak, WA 98841509-826-0640fax [email protected]
Page 2 of 2
8/31/2006

Tab 20
Schaff, Randi
From: Warren Hand [[email protected]]
Sent: Tuesday, August 29, 2006 12:02 PM
To: Blue Ribbon Commission on Health Care Costs and Access
Subject: Washington State--Proposal 8-2006
Page 1 of 4Washington State A Response: Problem, Vision and Goals Statement
8/31/2006
Blue Ribbon Commission
I respectfully submit the Institute for Healthcare Advancement’s proposalfor your review. IHA would be honored if our proposal becomes a part of the solution to provide accessible, affordable, quality health care to all of Washington.
Regards,
Warren HandSales and MarketingInstitute for Healthcare Advancement501 S. Idaho St.Suite 300La Habra, California 90631www.iha4health.org562-690-4001 x 205562-690-8988 Fax800-434-4633
Washington State: Blue Ribbon Commission on Health Care Costs & Access
1. What do you propose be done to realize the vision and goals for Washington State established by the Blue Ribbon Commission on Health Care Costs and Access? Please provide a brief summary of yourproposal.
The Blue Ribbon Commission on Health Care Costs & Access is looking to establish a system toprovide every Washingtonian the ability to obtain needed health care at an affordable price. During the last six years, the Institute for Healthcare Advancement (IHA), a not-for-profit 501 (c) (3) private foundation, has been providing a proven solution for lowering healthcare costs for states, health plans,and various organizations.
The solution is in the form of a book series, published by IHA, entitled “What To Do For Health”. The books in the series provide valuable, easy-to-read, easy-to-use, in-home healthcare information designedfor use by parents or caregivers. The books are written at a third- to fifth-grade reading level, and areavailable in both English and Spanish. The best selling book, What To Do When Your Child Gets Sick, is also available in Vietnamese, Chinese, and Korean.
The books deal with common health topics and are written by experienced health educators to enableappropriate healthcare decisions, ultimately lowering healthcare costs. The ability of a family to managetheir healthcare, at-home, is one important factor toward Washington state being able to provide accessible, affordable, quality health care to all Washingtonians by 2012.
IHA’s proposal would be for the state of Washington to purchase books and distribute them through
agencies dealing with the birth of newborn babies such as hospitals, in-home visitations, first check-up visits, community clinics, adult education classes, urgent care centers, local WIC centers, woman’s shelters, or healthcare professional’s offices. The distribution points are only limited by theimagination. One of the most successful methods of distribution is by the “parent kit” method used by other states.
What To Do When Your Child Gets Sick is the book in the series that would have the most immediate impact on improving Washington’s health care.
2. How will implementation of your proposal enhance, hinder, or otherwise impact the achievement ofthe vision and each of the goals established by the Commission? How do you know?
Distribution of the books is linked to appropriate utilization of healthcare services with numerousbenefits including: a decrease in inappropriate use of Emergency Departments and Doctor/Clinic visits,lower employer premium costs, reductions in employee absenteeism, and fewer missed days at school.Reducing costs in any of these categories results in huge across the board savings for Washington.
It is estimated that as much as $73 billion dollars is wasted annually on inappropriate healthcarespending in the United States alone.
When a parent receives What To Do When Your Child Gets Sick and resolves, at-home, the problems ofa bloody nose, fever, diaper rash, toothache, or any of the 50+ ailments found in the book, and they donot visit the ED, their confidence grows. Once they have the confidence, the corresponding ED use drops. Using an average of $200 per ED visit and $30 per clinic visit (low estimates) the resultingsavings by families not using the services of the ED would be substantial for Washington.
Research through organizations, including UCLA, has shown positive outcomes derived through the useof the books by Head Start parents.
What To Do When Your Child Gets Sick has proven to be the deciding factor in reducing unwarrantedEmergency Department visits and Doctor/Clinic use by Head Start parents who were given the book tokeep at-home. Those parents who received the book reported a 48% reduction in unwarranted ED use along with a 37.5% reduction in Doctor/Clinic visits.
3. Is your proposal modeled after an existing policy or program within Washington or elsewhere? If so, please describe the policy or program and its outcomes.
The distribution of books from the “What To Do For Health” series comes in many different forms. The states of California and South Dakota each distribute the books in a “box” that is given to each new parent in their respective states. South Dakota has been distributing their Bright Start Gift Box for the last five years. California will begin distribution of their Kit for New Parents, which contains What To Do When Your Child Gets Sick, in October 2006.
Molina Healthcare of Michigan’s outcome study, Emergency Room Utilization Reduction Project, has shown that parents who have the book at home reduced their ER visits by 14.6% and their “treat at home” response increased by 9.6%. Parents reported increased confidence levels for caring for theirchildren, and. confidence levels translate into cost savings through fewer visits to ER, Doctor’s offices and clinics.
Page 2 of 4Washington State A Response: Problem, Vision and Goals Statement
8/31/2006
Health plans like Neighborhood Health Plan (NHP) in Boston and Molina Healthcare of Michigan use What To Do When Your Child Gets Sick as incentives for their enrollees to stay healthy. Molina andNeighborhood Health Plan also use What To Do When You’re Having a Baby in their programs. NHP distributes What To Do For Teen Health in return for parents bringing their teenagers in for regularcheck-ups. NHP feels that the book is a good intervention tool for teenagers.
4. Will your proposal impose costs on individuals, businesses, or government? Will these costs be time-limited or on-going? Can you estimate how much threes costs will be, or suggest how such anestimate could be made? How much, if any, of these costs will be offset by corresponding savings?
IHA’s proposal will impose costs on the businesses and the government of Washington. BUT, the initial outlay for the purchase of books can be justified/offset by proven reductions in ED andDoctor/Clinic visits. Cost reductions are realized each time What To Do When Your Child Gets Sick isadded to a state or health plan’s program.
Initial costs would be based upon the annual birth rate in Washington state if each new mother were to receive a copy of the book. The discount pricing structure in place at IHA for quantities between 75,001—100,000 is $4.50 per book plus shipping and the price for 100,001—150,000 is $3.95 per bookplus shipping. In calculating totals, multiply the number of births per year times the cost per book and add shipping. Shipping can only be determined around the time of the actual shipment based upon the constantly fluctuating “fuel surcharges”.
On-going costs would depend upon the additional purchases of books for Washington state families.
If Washington were to decide to purchase the Sick Child book for state agencies that work with at-riskpopulations who have children enrolled between the ages of birth and eight years, but do not fall underthe “newborn” category, additional cost would be incurred. The cost would vary by the number ofbooks purchased with shipping charges being the fluctuation factor.
When evaluating the ROI, the $4.50 price vs. one ED visit of $200 produces a savings of $195.50 foreach time the parent uses the book instead of going to the ED for an unwarranted visit. How many times this scenario plays out over a year’s period depends on the individual parent or caregiver, but if justONE unwarranted visit to the ED per family is averted, the trade-off savings are huge.
5. How does your proposal reflect collaboration among various stakeholders? Which stakeholders have endorsed it?
Distribution is the key to the success of the books making a difference in reducing healthcare costsin Washington state and collaboration among stakeholders would be seen as an essential part of the success of distributing the books to those who really need them.
The stakeholders would need to be identified as those who see the books making a difference in the livesof Washingtonians. These distributors can come in a variety of agencies without much of a cost factoras in the example of a hospital distributing the books on the day the baby leaves the hospital, when thehome visitation nurse goes to see the new mother, the book can go along.
6. What are the obstacles to implementing your proposal? Who will object to it and why? How do you
Page 3 of 4Washington State A Response: Problem, Vision and Goals Statement
8/31/2006

suggest these objections be addressed?
Obstacle: The most common obstacle is for the decision makers in any organization to embrace the idea of spending money to save money.
Answer: Reductions in ED use and Doctor/Clinic visits occur in the agencies that have made thecommitment to improve the lives of new parents or underserved populations. It has been shown that parents want to take care of their families but most often do not have access to healthcare informationthey can read or understand. When no materials are available to explain how to manage their family’s healthcare, parents visit the ED unnecessarily. It is estimated that 90 million Americans do not readbeyond a fifth-grade reading level which makes them functionally literate and a burden to the country’s healthcare system, including Washington state.
What To Do When Your Child Gets Sick is a solution to the overcrowding in the ED. The resulting dollar savings per ED visit alone overshadows the per book cost.
Obstacle: How would the state distribute 100,000 books?
Answer: The distribution structure is already in place through Washington’s existing healthcare agencies, even though it might not see obvious at first blush, it just needs to be mined, organized, andimplemented.
Page 4 of 4Washington State A Response: Problem, Vision and Goals Statement
8/31/2006

Tab 21
1
Schaff, Randi
From: Maureen Scott [[email protected]]Sent: Friday, September 01, 2006 1:33 PMTo: Blue Ribbon Commission on Health Care Costs and AccessCc: Shin-Ping Tu; Teresita Batayola; Michael McKeeSubject: Proposal: BRC on HCCA
Importance: High
Attachments: ICHS BRC-HCCA Proposal '06.doc
ICHS BRC-HCCA Proposal '06.doc...
TO: Honorable Members of the Blue Ribbon Commission On Health Care Costs & Access:
On behalf of our Executive Director, Teresita Batayola ([email protected]), I am pleased to attach the proposal submitted by International Community Health Services (ICHS) for your consideration towards achieving the Commissions stated mission and goals.
We wish to acknowledge the significant participation of Shin-Pin Tu, MD, MPH of Harborview Medical Center, the Department of Medicine, University of Washington, and Director of the Asian Health Promotion Project as the medical consultant and contributing author for this proposal.
ICHS looks forward to following the Commission's process and receiving information as you go forward.
Maureen K. Scott, M.S.Grants and Communications AssociateInternational Community Health Services (ICHS)[email protected]
CONFIDENTIALITY NOTE: This e-mail message contains information belonging to International Community Health Services, which may be privileged, confidential and/or protected from disclosure. The information is intended only for the use of the individual or entity named above. If you think that you have received this message in error, please e-mail the sender. If you are not the intended recipient, any dissemination, distribution or copying is strictly prohibited.
Administration 412A Maynard Ave S 3rd Floor Seattle, WA 98104 Tel: 206.788.3650 Fax: 206.490.4011
Finance Office 508 Maynard Ave S Seattle, WA 98104 Tel: 206.788.3600 Fax: 206.652.5216
Holly Park Medical & Dental Clinic 3815 S Othello St 2nd Floor Seattle, WA 98118 Tel: 206.788.3500 Fax: 206.788.3521
International District Medical & Dental Clinic 720 8th Ave S Suite 100 Seattle, WA 98104 Tel: 206.788.3700 Fax: 206.788.3706
International District Pharmacy 710 8th Ave S Seattle, WA 98104 Tel: 206.788.3770 Fax: 206.788.3706
Mailing Address PO Box 3007 Seattle, WA98114-3007
www.ichs.com
PROPOSAL: BLUE RIBBON COMMISSION ON HEALTH CARE COSTS AND ACCESS
Introduction
The information immediately following is offered to establish the context and relevancy of the proposal presented herein as well as the credibility of the proposing organization, ICHS.
Background
Founded in 1973, International Community Health Services (ICHS) is a 501(c)(3) community-based health care center committed to providing linguistically appropriate, culturally relevant, accessible, affordable and comprehensive quality primary and preventive medical and dental care to Asian/Pacific Islanders (API) and other members in the communities of Seattle and King County. Since 1994, our unduplicated patient population has increased by 360 percent (from 3,133 to 14,398), and more recently, between 2002 and 2005 it has increased by over 40%.
Population(s) Served
Our Asian/Pacific Islanders (API) constituency is primarily low-income and one of the most racially, ethnically and linguistically diverse in the State. ICHS’s 2005 utilization data revealed a patient population comprised primarily of Asian/Pacific Islanders (API), at 83.2%, and with 4.8% African/ African-American, 3.4% White, .6% American Indian/Alaska Native, 1.4% self-identified as Hispanic and Spanish-speaking, and 6.6% were not self-identified as any ethnicity or as “other.”
Patient Barriers to Accessing Care
In 2005, 67% of all ICHS patients reported income below 100% percent of the Federal Poverty Level - FPL - ($19,350 for a family of four) and 87% of all dental patients reported income below 200% of the FPL. Many ICHS patients have no health insurance - in 2005, 27% had no health coverage and 34% had no dental coverage.
Beyond financial obstacles, APIs face a number of cultural, linguistic, and societal barriers to accessing medical and dental health care. Immigrants and refugees tend to have little or no experience with the American health care system. In addition to possibly distrusting unfamiliar Western medical practices, APIs with limited English proficiency have difficulty communicating their concerns to medical providers who do not speak their language or understand their cultural beliefs, practices and obligations. ICHS has the capability of providing services in over 29 different languages and dialects to assure effective and culturally competent health care. The linguistic and cultural appropriateness and effectiveness of our services are demonstrated in the ever increasing numbers of patient encounters and unduplicated patients seen at ICHS.
2006 HCCA Proposal 2 of 6
Summary
1. What do you propose be done to realize the vision and goals for Washington State established by the Blue Ribbon Commission on Health Care Costs and Access?
Goal: Improve constituent health by increased use of evidence-based care resulting in better health outcomes and consumer satisfaction.
Objectives: 1.) Improve screening rates for cancer, oral health, diabetes, heart disease and hypertension among non-English speaking members of our API communities.
2.) Develop and disseminate research tested intervention materials promoting evidence based preventive care to limited English speaking Chinese, Korean and Vietnamese consumers.
Need: The findings of a comprehensive community needs assessment, “Asian and Pacific Islander Health,” conducted for ICHS during 2006 included identification of the five most prevalent health concerns among various API communities and their providers (cancer, oral health, diabetes, heart disease and hypertension) and the language/ethnic groups with the highest consumer populations [Chinese (spoken, Cantonese), Korean and Vietnamese].
A major challenge encountered in providing quality medical care across different cultures and languages is the time and appropriate channel to inform patients of the rationale and availability, in terms relevant to the patient, for such evidence-based care within a 15-20 minute primary care medical visit. Without active measures to disseminate new medical knowledge, it takes 17 years on average for that information to be adopted into practice.
Methods: 1.) Conduct a search of federal funding agencies (e.g., Centers for Disease Control and Prevention) for research tested intervention materials that promote evidence based preventive care (e.g. cancer, oral health, diabetes, heart disease and hypertension).
2.) Procure and/or produce in-language materials in the research recommended media, e.g., videos, DVD’s, pamphlets, etc.
3.) Provide dissemination orientation and training for bi-cultural family/ community health workers/educators bi-lingual in one of the target languages and English.
4.) Disseminate the research tested and procured/developed in-language intervention materials through agencies serving limited English speaking patients (e.g., community health centers, public libraries, health fairs, religious and ethnic cultural centers/events, ESL programs, hospitals, pharmacies, etc.).
2006 HCCA Proposal 3 of 6
Impact
2. How will implementation of your proposal enhance, hinder or otherwise impact the achievement of the vision and each of the goals established by the Commission? How do you know?
Decision-aids (e.g., videos, DVD’s, etc.) have been shown to be effective in the general population. Research studies also support such approaches to reach patients of different cultures and with limited English speaking skills: outreach, mass media, videos plus pamphlets.1, 2 A recent study underscores the importance of including patient education in achieving blood pressure control.3 In fact, providers' prescriptions/referrals/ recommendations of evidence based care are futile unless patients are engaged and follow through with such prescribed care.
Through the procurement/development and dissemination of linguistically and culturally appropriate health education materials, limited English speaking consumers gain access to evidence based care and interventions. They are thereby empowered to assimilate the necessary information, engage meaningfully in their health care and follow-through with the evidence based recommendations and prescribed care.
Model
3. Is your proposal modeled after an existing policy or program within Washington or elsewhere? If so, describe the policy or program and its outcomes.
Promoting cancer screening through a health educator has been previously tested in a community setting focusing on Pap testing in Native American women.4 A recently completed collaborative study by the University of Washington, Fred Hutchinson Cancer Research Center and International Community Health Services demonstrated that a multi-component intervention consisting of education through a health educator, culturally and linguistically appropriate materials (video and pamphlet), and a simple screening tool (Fecal Occult Blood Test) is extremely effective at increasing colorectal cancer screening by limited English speaking Chinese patients. The remarkable impact of this study’s intervention offers a profound rationale for the use of linguistically and culturally appropriate health education strategies among populations with limited health information. Results from other cancer control intervention trials with limited English speaking populations also support this finding.5
Cost
4. Will your proposal impose costs on individuals, businesses or government? Will these costs be time-limited or on-going? Can you estimate how much these costs will be, or suggest how such an estimate could be made? How much, if any, of these costs will be offset by corresponding savings?
The effectiveness and cost efficiencies of preventive health care are so well established as to be among the cornerstones of the best practices in contemporary medical and dental health care. The
2006 HCCA Proposal 4 of 6
intent of this proposal is to assure access to limited English speaking API consumers of linguistically and culturally appropriate health education materials specifically pertaining to evidence based screenings and care for cancer, oral health, diabetes, heart disease and hypertension.In the collaborative study mentioned above5, an in-clinic health educator assured successful screening by addressing many of the challenges to providing cancer prevention education confronting busy primary care practices. The health educator utilized the primary care encounter to provide cancer prevention education and adapted the process to the specifics of each patient encounter to prevent disruption of clinic flow. Further, screening promotion and education by an in-clinic health educator did not increase medical encounter time. Additionally, the costs associated with such promotion and education activities performed by a health educator are significantly lower than when provided by a primary care nurse and dramatically lower than when they are required of a physician.
Expected costs will be associated with the procurement or development of linguistically and culturally appropriate materials as they pertain to the specific media documented in research to be most effective [re: Methods, 1)]. Accordingly, that activity would be required to generate realistic budgets. Such costs may vary widely from the direct purchase of consumer-ready materials to actually covering expensed to produce the needed materials in the recommended media format, e.g., DVD production (script, director, actor(s)/narrator, technical supplies and equipment, editing, etc.), pamphlet (text, translation, graphic artist, technical equipment, supplies, printing, etc.), and so on. In-kind supplies, equipment use or pro-bono services may be possible, even likely, for some of these expenses. Although the research project budget to produce the video for the reference collaborative study (2004)5 was in the range of $30,000, that may in fact not be a reliable estimate of costs for what is currently needed.
On-going costs would be associated with the continued purchase or reproduction of the specific materials, the percentage of the health educator’s time devoted to these activities, and the possible updating of materials so that they remain consistent with new, evidenced based protocols and interventions as they are established over time.
Stakeholder Collaboration
5. How does your proposal reflect collaboration among various stakeholders? Which stakeholders have endorsed it?
Shin-Ping Tu, MD, MPH of Seattle’s Harborview Medical Center; the Department of Medicine, University of Washington, and Director of the Asian Health Promotion Project was the medical consultant and contributing author for this proposal.
Institutionally, ICHS is a participating member of the Asian Pacific Islander Coalition (APIC), the Community Health Network of Washington (CHNW) and the Washington Association of Community & Migrant Health Centers (WACMHC) where the need for current culturally and linguistically appropriate health education materials has long been recognized.
2006 HCCA Proposal 5 of 6
Additionally, ICHS is a widely recognized community resource for culturally and linguistically appropriate health education and medical services and is relied upon by many other agencies serving similar populations because of the great need for these services. Because of this, our staff and programs routinely participate in inter-agency collaborations, community forums, task forces, coalition, etc., such as the Diabetes REACH Coalition, the Children’s Health Improvement Collaborative, Asian Counseling and Referral Services, The Center for Career Alternatives, Refugee Women's Alliance, Mutual Assistance Associations, and certainly the Crisis Clinic, Department of Social and Health Services, the Social Security Administration, and the numerous community agencies and associations serving refugees and immigrants: International Rescue Committee, World Relief, Catholic Community Services, Lutheran Social Services, area Community Colleges and ESL/LEP (English as a Second Language/Limited English Proficiency) programs, Harborview Medical Center, University of Washington Medical Center and Swedish/Providence Hospital.
A strength of this proposal is the broad applicability of the objectives and principles of the methods for all ethnic, cultural, racial and/or non-/limited English speaking consumer groups and their primary care providers, and more specifically, non-profit primary health care providers. It relies on identifying specific evidence based, culturally and linguistically effective health education materials and dissemination strategies which enhance health outcomes and customer satisfaction without putting additional demands on primary care providers and patient encounters.
Implementation Obstacles
6. What are the obstacles to implementing your proposal? Who will object to it and why? How do you suggest these objections be addressed?
The need addressed by this proposal being apparent and the effectiveness of the methods being established, it is reasonable to question why such activities have not already been undertaken to the extent needed.
Consumers targeted by this proposal for preventive health education and screenings are predominantly low-income. They often must rely on non-profit health care organizations that receive funding restricted to the delivery of primary care services - typically, health education personnel and activities are not allowable expenses.
The most imposing obstacle to improve screening rates for cancer, oral health, diabetes, heart disease and hypertension among non-English speaking members of our API communities is the allocation of funding. Specifically, adequate funding is necessary for:
1.) Bi-cultural and bi-lingual health educators, and
2.) Procurement/production of linguistically and culturally relevant healtheducation materials.
2006 HCCA Proposal 6 of 6
REFERENCES
1. Taylor VM, Jackson JC, Pineda M, Pham P, Fischer M, Yasui Y. Hepatitis B knowledge among Vietnamese immigrants. J Cancer Educ. 2000;15:51-56.
2. Taylor VM, Jackson JC, Yasui Y, et al. Evaluation of an outreach intervention to promote cervical cancer screening among Cambodian American women. Cancer Detect Prev. 2002;26(4):320-327.
3. Roumie CL, Elasy TA, Greevy R, et al. Improving blood pressure control through provider education, provider alerts, and patient education: a cluster randomized trial. Ann Intern Med. Aug 1 2006;145(3):165-175.
4. Dignan MB, Michielutte R, Wells HB, et al. Health education to increase screening for cervical cancer among Lumbee Indian women in North Carolina. Health Educ Res. Dec 1998;13(4):545-556.
5. Tu SP, Taylor V, Yasui Y, et al. Promoting culturally appropriate colorectal cancer screening through a health educator: a randomized controlled trial. . Cancer. In press (rev. 2004).

Tab 22
Jefferson County Committee for Health Care Access is a group of health care professionals, lay people, and representatives of community agencies who have come together to work on improving access to care for all people of our community. A roster of our members is included at the end of this statement.
Problems:We see many problems with the current health care system, including, but not limited to the following:
Inadequate management of chronic illnesses Use of the hospital emergency room in lieu of primary care providers by the uninsuredA high percentage of health care dollars spent on end-of-life care that does not improve quality of life, due to unrealistic expectations from families and to the focus of our system on cure rather than providing compassionate care of those in the final stage of their lives Defensive medicine due to the risk of malpractice litigation. High administrative costs due to multiple insurers and their demands Risks distributed unequally with public insurers caring for the higher risk patients and private insurers caring for healthier people Lack of preventive care Inadequate patient education and empowerment in the prevention of illness and in their own self-care Inequitable coverage Excessive profits by insurers and pharmaceutical companies who also influence the care that is given Fragmentation of care with lack of communication between providers and community agencies
We recommend, in order to improve health care for all, a system that provides
Universal health coverage, publicly funded with health care privately delivered Universal coverage all at once, rather than incrementally All people covered under the same system and mandatory Coverage should be individual rather than employer-based in order to be totally portable and equitable If financed by premiums rather than tax dollars, they should be based on the concept of Calculated Disposable Income with government subsidy for individuals and/or small businesses who cannot afford health insurance Coverage of reasonable and proper expenses for all medical care including health care providers, hospitals, prescription drugs, mental health, long-term medical care, dental care, vision care, and medical equipment. Such a system would include no deductibles, co-insurance, or exclusions for pre-existing conditions, and would have modest co-pays.
Inclusion of preventive care and emphasis on wellness, prevention of disease, and support of people to practice healthy behaviors Patient-centered, with adaptability according to patients needs as determined by patients and caregivers, with case managers for those with chronic illnesses Oversight by health professionals and lay people, making use of evidence-based protocols and measurement of outcomes Implementation of a state-wide information technology program to reduce errors and improve medical communications Transparency among practices of healthcare providers with patient protection against healthcare accidents and egregious mistakes Fair reimbursement for health care providers
It should also be noted that a strong base of primary care is essential for any universal healthcare plan to be successful. Therefore, monetary and/or other incentives should be developed to encourage physicians and other caregivers to consider a career in primary care.
Cost:The cost of such a system would be no more than what is now being spent on public programs, “uncompensated care,” and private insurance. With the removal of the profit and the excessive administrative costs, everyone can be covered for less than is currently being spent on healthcare.
Obstacles to implementation: We recognize that the barriers to implementing such a system include the powerful lobby of private insurers and national rules concerning Medicare and Medicaid. We encourage the BRC to study the previously proposed initiative, Health Care 2000, since much thought was put into it concerning cost and implementation of such a system. We also suggest that Washington support Senator Russ Feinfold’s State-Based Health Care Reform Act and, if passed, become one of the states to pilot a universal health coverage project.
As we improve our health-care system, it is also important that we work to make our communities more supportive of good health practices, such as decreased reliance on the automobile and improved access to walking/biking trails, and improved nutritional practices in our schools. Recognition of the role that mental health plays in individual and community health is also essential.
Thank you for allowing our input. We eagerly await the recommendations of the commission.
Diane Bommer, RN, CDE (retired) Julia Danskin, Public Health Nursing Director,
Jefferson County Public Health Rebecca Kimball, ARNP, Jefferson Healthcare Mack Boelling, MD (retired) Beth Wilmart, Executive Director, The Women's Health Project
Bob Peden, UGN, Jefferson County Bonnie White, Olympic Community Action Programs Timothy Hockett, Executive Director,
Olympic Community Action Programs (OlyCAP) Cyndi Newman Gail Wood, MASH clinic Judy Tough, NAMI

Susan O’Brien, ARNP, Family Planning Clinic, Jefferson County Public Health
Jean Baldwin, Director, Jefferson County Public Health Laurie Strong, Jefferson Mental Health Services Phil Peet, DSHS Roy Walker, MS, Executive Director, Olympic Area Agency on Aging Paula Dowdle, Chief of Operations, Jefferson Healthcare Suzy White, Jefferson Healthcare Sheila Lauder, NAMI
Ron NelsonVicky Lowe, Jamestown C’llalam Tribe Jenifer Taylor Joe Wagner, citizen, Community Roundtable Linda Kay Smith, Local 20/20 Health and Wellness Action Team Nell Altizer Pat Teal Ron Tacker, MD

Tab 23
August, 2006
The Honorable Christine Gregoire The Honorable Pat Thibaudeau Blue Ribbon Commission on Health Care Costs and Access Olympia, WA 98504
Dear Governor Gregoire, Senator Thibaudeau and Members of the Commission:
On behalf of the undersigned organizations, we would like to introduce you to our newly formed coalition, the “Jobs and Health Care Coalition.” This coalition is made up of groups who are committed to being proactive and solution-oriented to solve the health care problems in our state.
From our perspective, the best solutions will not involve mandates on employers. Instead, we feel that the solutions involve leveraging the best of the private sector through more options and incentives while allowing the public sector to take care of those who need help. We are open to all ideas and solutions that meet the following principles:
Establish an appropriate balance and blending between public programs and the private market to meet the diverse coverage and financing needs of our citizens. The coalition supports utilization of private plans and financing mechanisms as the primary arena with public programs serving as a safety net.
Efforts that reduce the cost of health care both short term and long term by controlling underlying cost drivers in the system and reducing the upfront cost of insurance premiums and/or access to care.
Proposals that remove regulatory barriers in the current system to reduce the cost of health insurance premiums and increase the number of private insurers willing to do business in our state;
Creating a greater variety of choice in products and prices;
Move us toward a system designed to educate individuals about the costs of health care, how they impact those costs and increase their responsibility for their health care.
Clearly defining the role of employers in the health care system as a financing mechanism available to assist individuals in meeting their responsibility in health care on a voluntary basis as a means to attract and retain employees while still being able to provide jobs, wage increases and other benefits.

Since the employers in this state – both small and large – are an integral part of our state’s health care system as both purchasers and consumers, we have a very strong stake in the outcome of the Blue Ribbon Commission. We look forward to working with you to help meet the goals you would like to achieve.
Feel free to lean on our coalition as a resource for you. Our hope is that by having the employer community working together, you will find greater efficiency in getting the information you need to make appropriate decisions in this arena for the state.
If you have any questions, please feel free to contact any of the representatives of our member organizations.
Sincerely,
Trent House, Dir. Government Affairs Carolyn Logue, Washington State Director Washington Restaurant Association National Federation of Independent Business
Gary Smith, Executive Director Gary Chandler, VP Government Affairs Independent Business Association Association of Washington Business
Jan Teague, President/CEO Laurie Kirkland, President Washington Retail Association Washington Assoc. of Health Underwriters
Jan Simon, President/CEO Kathleen Garrity, President Washington St. Hotel & Lodging Assoc. Associated Builders & Contractors of W. WA
Tom Kwieciak Jennifer Holder, Building Industry Association of WA Wal-Mart Corporation
Kerri Lonergran Lombardi’s Neighborhood Italian
Jobs and Health Care Coalition Principles
The Jobs and Health Care Coalition has developed a set of principles for coalition members and policymakers to use when evaluating future health care proposals. The coalition will oppose attempts to impose “mandates” on employers because of the risk this creates for jobs, economic development, and business survival.
The Coalition supports:
Establishing an appropriate balance and blending between public programs and the private market to meet the diverse coverage and financing needs of Washington state citizens. Utilization of private plans and financing mechanisms as the primary arena with public programs serving as a safety net.
Reducing the cost of health care both short term and long term by controlling underlying cost drivers in the system and reducing the upfront cost of insurance premiums and/or access to care.
Removing regulatory barriers in the current system to reduce the cost of health insurance premiums and increase the number of private insurers willing to do business in our state;
Creating a greater variety of choice in products and prices;
Moving toward a system designed to educate individuals about the costs of health care, how they impact those costs and increase their responsibility for their health care.
Clearly defining the role of employers in the health care system as a financing mechanism available to assist individuals in meeting their responsibility in health care on a voluntary basis as a means to attract and retain employees while still being able to provide jobs, wage increases and other benefits.

Tab 24
In 2007:
Declare all children covered for all outpatient office visits, including well-baby care; pre-natal care; post-natal care; mental health; yearly physicals; illness visits; dental care; vision care; and prescription drugs.Establish a reasonable rate of payment to providers – possibly different in rural/urban areas. Pay it to any licensed provider who provides primary care to children, e.g., a general practitioner, family practice physician, pediatrician, ARNP, or others. Solicit the participation of providers on a committee to establish a fair rate of pay. Allow any child to go to any primary care provider (PCP). If the child has insurance, the office can bill it. But any child will be covered for outpatient care by the state at the established rate, if there is no other source of coverage. Providers will not be able to restrict the number of state-insured children as they often do with Medicaid. Referrals to specialists should be processed through a managed care matrix. The reimbursement rate should not be dramatically higher than that established for primary care providers. It is possible that co-pays or deductibles might be part of the payment arrangement for specialists.
The rationale for this plan: The state has a strong interest in assuring the healthy development of children. There should be no barriers in the way of children getting the prevention and early health care they need, so there would be no need to “enroll,” no co-pays, no deductibles, and no premiums for parents of children to pay for routine outpatient care. And, we would waste no money or resources on promoting enrollment, checking eligibility, etc., but would simply provide services. Providers need to be part of the decision-making process about reasonable rates of payment so that does not present a barrier to care. I suspect that some working families who may be buying family coverage through work, even though it is a serious strain on their finances, might drop the coverage for children, and move the children into this state plan. This probable increasing reliance of families on state insurance for outpatient care for children will substantially decrease the administrative burden and cost in outpatient offices for billing numerous different insurance companies. Providing outpatient care can be a relatively predictable and manageable expense. I would assume that when a bill for a child first comes to the state for payment, someone in DSHS would contact the family to determine if they might be eligible for the more comprehensive benefit package available through Medicaid, and encourage/assist the family to apply. In essence, I would process the payments for these children as if they were part of the Basic Health Plan, but with the benefits indicated above specifically for children.
In 2008 Extend the same level of outpatient primary care to all adults, including ob-gyns and internists in the PCP coverage group.
During 07 and 08 Leave Medicare and Medicaid intact as they are – the huge bulk (probably 90% of spending) of those programs go for the care of the elderly, disabled, chronically ill, etc
Funding
Although political leaders whom I approach say the state isn’t ready for it, I think citizens are – a state income tax. An initiative (perhaps organized/sponsored by Wm. Gates, Sr.) to the citizens to establish a state income tax should be started immediately, and should be used to provide the above level of healthcare funding for the next 10 years. After 10 years, the income tax revenues would go into the general fund. I don’t like designated funds, but think this package of healthcare coverage for all outpatient care of children, paid for by an income tax, will be a very attractive package to most voters. I also think the healthcare savings generated by establishingreadily-available outpatient care will save enough money that the designated fund can be moved into the general fund in 10 years.
I’d use the federal tax return to determine the total amount of gross income on which any individual would be responsible for paying state income taxes. I would allow no deductions - not for donations, for medical expenses, for mortgage expenses, for children in the home. I would set a rate of 5% of all income, after allowing everyone who had any income to take a deduction of $25,000 or 200% of poverty, whichever is higher. This would allow those with barely enough income to meet daily needs to avoid paying this tax – including, probably, some of the elderly with lower incomes. I would tie the deduction to 200% of poverty so that it could continue to increase as the cost of living increases.
By 2009 I would have established a payment priority for higher-cost procedures; inpatient care; etc. I’d look to something like the Oregon model for determining priorities, but would apply those designated care/procedure/treatment priorities evenly across the board to anyone, regardless of the payment source.

Tab 25

King County
Proposal Not Available At This Time

Tab 26
The King County Health Action Plan, a public-private partnership with Public Health- Seattle & King County and over three dozen collaborating members, welcomes the opportunity to respond to the invitation to submit ideas to the Blue Ribbon Commission on Health Care Costs & Access that will assist you in your work to achieve the vision and goals as articulated in your statement of July 27, 2006. We will respond to each of the six questions set forth and attach contact information. Thank you in advance for this opportunity.
1. What do you propose be done to realize the vision and goals for Washington State established by the Blue Ribbon Commission on Health Care Costs and Access?
Thinking of two tracks within the overall health care system, one for children and one for adults, we will set forth the foundational opportunities for an approach to achieve an improved system for children.
In 2007 we can start taking the steps necessary to cover all children in Washington and assure their access to services by 2010. By starting with children we will be well on the way to setting the stage for a future healthier Washington. Building and spreading evidenced-based strategies and programs which improve access and health, increase quality and decrease costs, we can create a foundational template to reach the Commission’s goals for children across the state. This is an approach also supported by the Health Coalition for Children and Youth (HCCY).
Our proposal for children will address the key elements of coverage and access to services, improved quality and decreased costs by expansion of evidenced-based programs in three areas.
I. Integrated Preventive Healthcare for ChildrenExpand the Kids Get Care Program (KGC) statewide
Annual Cost: $1,750,000 for 25 sitesAnnual Savings: $1,775,679 statewide for Medicaid children 1-3 years old, potentially more for other
populationsKids Get Care is a program to ensure that children, regardless of health insurance status, receive early integrated preventive physical, developmental, mental health and oral health services through attachment to a health care home. This program is now in 24 sites in King, Pierce and Snohomish counties with a five year track record including having attached over 23,000 children to health care homes, and improved the rates of two year olds up to date with well child checks by 41% from 53% of these young patients to 75%. If spread to all counties in the state Kids Get Care has the potential over five years to save the state at least $9 million byreducing avoidable hospitalizations and other unnecessary services improve the health status of 50,000 children and connect them to health care homes. KGC is an example of a best practice as endorsed by the Communities Connect coalition.
See Appendix A for further program description and accomplishments as well as costs for spreading this program state-wide.
II. Making Sure Best Practices Are Not Best Kept Secrets Expand the statewide reach of the Children’s Health Improvement Collaborative (CHIC)
Annual Cost: State funds: $200,000; Federal Match: $200,000 Annual Savings: Supporting medical practices’ participation in quality improvement projects like
this learning collaborative disseminates best practices in the delivery of preventive care and chronic care management. Substantial literature documents the cost and health improvement benefits of improving such care. (See Appendix B)
Based on the successful State Diabetes and Cardiovascular Disease Collaborative, the purpose of the CHIC is to use quality improvement (QI) methodology and the Breakthrough Series Collaborative (BTS) model to improve the delivery of care for low income children by rapidly disseminating evidence-based care for specific chronic illnesses and preventive care. In the first two years, the CHIC focused on spreading the learnings from KGC, especially in the areas of well-child checks, early developmental screening, integrated oral health including fluoride varnishes and attachment to a medical home. Now in its third year, the CHIC is focusing on improvement of three specific chronic childhood illnesses: asthma, attention deficit/hyperactivity disorder (AD/HD), and overweight which also includes the relationship between nutrition and oral health. Not only does CHIC help medical practices improve care around a specific topic area, once a practice has learned the basic QI tools, they can apply them to any aspect of their practice, which provides them with the basic building blocks of improving their Medical Home capabilities.
By utilizing the CHIC as a vehicle with which to connect both the State’s purchasing arm to its quality hand and to focus on targeted health indicators in the future (such as immunizations, premature delivery, etc ), the State can drive health status and quality up and costs down. By expanding the ability of the CHIC to offer financial incentives to clinic teams for attending the CHIC, by tying participation in the CHIC to a requirement for contracted heath plans to achieve quality improvement goals in targeted areas, and by choosing key measurable quality indicators, such as those population based measures referenced in the Washington Health Foundation’s Healthiest State in the Nation policy paper, the state can tangibly move forward to decrease disparities, improve the health of the state and decrease costs.
See Appendix B for further program description and accomplishments as well as costs for spreading this program state-wide.
III. County Innovations and Expansion of Coverage and Access to Services Pilot Expansion of Children’s Health Initiatives in County “Incubators”
Annual Cost: $3,000,000 (based on the proposal to King County, cost would be lower for a smaller or rural county
Annual Savings: Improved access and coverage is associated with early detection and intervention and less costly treatment. In San Mateo County, California, the Child Health Initiative program was associated with a 58 percent decline in uninsured hospital stays for children in nearby hospitals.
A Children’s Health Task Force (CHATF) convened by King County Executive Ron Sims has recommended that King County move ahead with a three phased approach to improve the coverage and access for low income uninsured children in King County. Implementation of the recommendations requires legislative and budgetary action by the Executive and the King County Council. Information regarding membership and the announcement of this CHATF is available at:http://www.metrokc.gov/exec/news/2006/0522children.aspx
Phase OneThe Task Force recommends investing funds to identify low-income children eligible for existing publicly funded insurance programs by implementing a targeted access and outreach program, beginning in Fall 2006. Strategies include funding new outreach staff and community health workers who are trusted communicators to help sign up the estimated 8,000 children for the coverage they qualify for, and to connect them to comprehensive preventive services including oral and mental health and a medical home. Over time, this investment is projected to connect the majority of children eligible for Medicaid and SCHIP to a medical home and health insurance.
8/29/2006 2
King County Health Action Plan Proposal to the Blue Ribbon Commission on Health Care Costs & Access
Phase TwoBeginning in 2007, the Task Force recommends creating a gap insurance program that would be offered to 5,000 children in families under 300 percent of the FPL or children who are not eligible for existing public or private programs. Children in families over 300 percent of the FPL are not eligible for this gap insurance program. Final enrollment targets will be determined by the level of funding available to the new program.
Phase ThreeGovernor Gregoire has set a goal for the State of Washington that all children in the state will be covered by health insurance by 2010. By 2010, the King County program should either be consolidated into the state’s coverage programs or the state should provide the financial resources to King County to continue this program as a component of the state’s overall strategy.
By incubating ideas and spreading evidenced-based strategies to innovate and improve the delivery of services (such a placing behavioral health specialists in clinics to foster an early integrated and preventive approach to mental health), improvements at a county level are right-sized to fund, manage, evaluate and spread. Funding innovative and replicable approaches such as King County’s and “growing” CHI’s across the state is an idea that has been successful in other states such as California and Vermont.
In addition, the organization of Communities Connect provides the structure to reach into multiple counties for distribution of outreach funding and to capture and share best practices, evaluate the success of new ideas and align this statewide yet locally implemented collection of efforts with the goals of the Commission.
2. How will implementation of your proposal enhance, hinder or otherwise impact the achievement of the vision and each of the goals established by the Commission? How do you know?
The focus of this proposal is to help achieve the Commission’s vision and goals they as relate to children’s health. By relying on the spread of evidence-based programs, approaches and strategies with documented improvements, we know that implementation of this proposal will help achieve the Commission’s vision and goals.
8/29/2006 3
King County Health Action Plan Proposal to the Blue Ribbon Commission on Health Care Costs & Access
3. Is your proposal modeled after an existing policy or program within Washington or elsewhere? If so, describe the policy or program and its outcomes.
Yes, our proposal contains elements that exist both in Washington and in other states. For example:
Kids Get Care is currently in three counties and displays an established track record of improving quality while decreasing costs and achieving impressive outcomes as displayed in Appendix A.
The Children’s Health Improvement Collaborative, now in its third year, is modeled after the extremely successful state Diabetes and Cardiovascular Disease Collaborative which has demonstrated improved quality outcomes while decreasing cost. These targeted approaches utilizing proven QI methodology drive measurable achievements as displayed on the website at http://www.doh.wa.gov/cfh/WSC/.
A series of Children’s Health Initiatives designed to achieve the same outcomes yet utilizing the strengths and assets differently at the county level is based on successful programs of a similar nature in California and Vermont. Documented success of these programs is available at www.ihps-ca.org and www.med.uvm.edu/vchip/. The Communities Connect organization of county level innovations and achievements in eight critical areas is also representative of national approaches present in 600 communities across the country with information available at: http://www1.leg.wa.gov/documents/joint/HCCA/CommunitiesConnect_7-27.pdf#search=%22communities%20connect%20health%20care%22.
4. Will your proposal impose costs on individuals, businesses or government? Will these costs be time-limited or on-going? Can you estimate how much these costs will be, or suggest how such an estimate could be made? How much, if any, of these costs will be offset by corresponding savings?
As stated in each of the three sections of our proposal, the cost investments by government to spread an existing program with proven outcomes is matched by an even greater return on investment through cost savings to Medicaid. Implementing meaningful incentives to measure and improve quality throughout the state can produce both program savings and improved health outcomes.
Expand the Kids Get Care Program (KGC) statewide: Annual Cost: $1,750,000 for 25 sites
Annual Savings: $1,775,679 statewide for Medicaid children 1-3 years old, potentially more for other populations
Expand the statewide reach of the Children’s Health Improvement Collaborative (CHIC):Annual Cost: State funds: $200,000; Federal Match: $200,000
Annual Savings: Supporting medical practices’ participation in quality improvement projects like this learning collaborative disseminates best practices in the delivery of preventive care and chronic care management. Substantial literature documents the cost and health improvement benefits of improving such care. (See Appendix B)
Pilot Expansion of Outreach and Coverage Children’s Health Initiatives in County “Incubators” Annual Cost: $3,000,000 (based on the proposal to King County, cost would decrease for a
smaller or rural county) Annual Savings: Improved access and coverage is associated with early detection and
intervention and less costly treatment. In San Mateo County, California, the Child Health Initiative program was associated with a 58 percent decline in uninsured hospital stays for children in nearby hospitals.
8/29/2006 4
King County Health Action Plan Proposal to the Blue Ribbon Commission on Health Care Costs & Access
King County Health Action Plan Proposal to the Blue Ribbon Commission on Health Care Costs & Access
5. How does your proposal reflect collaboration among various stakeholders? Which stakeholders endorsed it?
This proposal represents the collection of three programs. Two of them, KGC and the CHIC were endorsed and launched under the umbrella of the King County Health Action plan, a public-private partnership with Public Health–Seattle & King County and three dozen collaborating members a listing of whom is available at: http://www.metrokc.gov/health/kchap/haproster.htm.
6. What are the obstacles to implementing your proposal? Who will object to it and why? How do you suggest these objections be addressed?
The main obstacle to these program improvements is funding and some resistance to developing local responses to outreach gaps. However, investing in evidence-based ways to connect children systematically to preventive services and coverage and to support physicians in their provision of high quality care to young people has the highest return on investment since these children can grow up to lead healthy and productive lives. A relatively small investment relative to overall health care spending can yield substantial future financial and health rewards for Washington State. Tapping into local commitment to carry out outreach and linkage activities and supporting quality improvement efforts are innovative ways to improve health status measures among children that have been stalled at less than optimal levels for many years.
For Additional Information Contact:
Susan Johnson, Director, King County Health Action Plan Public Health – Seattle & King County 999 Third Avenue, seattle, WA 98104
Phone: (206) 296-4669 Email: [email protected]
8/29/2006 5
King County Health Action Plan Proposal to the Blue Ribbon Commission on Health Care Costs & Access
Kids Get Care www.metrokc.gov/health/kgc
APPENDIX A
King County Health Action Plan Proposal to the Blue Ribbon Commission on Health Care Costs & Access
Kids Get Care (KGC) is a program to ensure that children, regardless of health insurance status, receive early integrated preventive physical, developmental, mental health and oral health services through attachment to a health care home. To assure access to services, children need both health care coverage and a coordinated delivery system that will assure they get preventiveservices. The Kids Get Care model contains three basic elements:
1. COMMUNITY ENGAGEMENT: Kids Get Care community health educators train community agency staff (typically child care agency staff) and parents about the importance of prevention, using oral health and developmental red flag identification tools. These staff form a web of community connections around participating clinic sites to support parents and funnel children to services.
2. LINKAGE: Children are linked to a medical and dental home. The prevention messages emphasize the importance of getting services from a regular source of care.
3. SEIZE THE MOMENT: The Kids Get Care case manager helps assure that comprehensive preventive services are provided during the visit, i.e. oral health and developmental screening occur during a regular medical preventive visit. Using quality improvement tools, doctors, dentists, and mental health staff are cross trained to recognize and refer children for needed services in all areas, preferably in the same visit; e.g., dentists ask whether immunizations and well child visits are up-to-date and send kids across the hall to the doctor and physicians do oral health education, screening and apply fluoride varnish. Once the children are getting services, good coverage is critical and the case manager and clinic eligibility workers help the family enroll if needed.
KIDS GET CARE ACHIEVEMENTS 2001-2006
OVERALL PROGRAM ACHIEVEMENTS
Cumulative outcomes, 2001 to 2006 TotalChildren connected to medical and/or dental homes (a usual source of care) 22,800 childrenChildren scanned for developmental milestones and oral health by community agency staff 88,000 childrenCommunity agency staff members or parents trained to provide developmental and oral health surveillance and health care home linkage
9,300 staff or parents
Applications of fluoride varnish applied to children 0-5 7,400 fluoride applications
INDIVIDUAL CLINIC RESULTS
Outcome From To Increase Two-year-olds up-to-date with well child checks at three clinics 53% in ‘01 75% in ‘03 41% Children under five assessed by a structured developmental questionnaire in eight clinics
5 in ‘04 363 in ‘06 72-fold
Pregnant women and women with young children assessed for maternal depression at one clinic
33% in ‘04 72% in’06 118%
Women identified with maternal depression connected to appropriate mental health interventions and/or access to appropriate resources
88% in ‘05 100% 14%
Children under 18 months who received a dental visit in eight clinics ( in one clinic 72 % of 15 month old medical clinic patients had received a dental visit)
337 in ‘05 688 in ‘06 104%
Kids and families seen by a Behavioral Health Specialist who are adhering to treatment plans
0 in ‘03 80% in ‘04 NA
8/29/2006 6
PARTNERSHIPS AND PRODUCTS
Partnered with the Access to Baby and Child Dentistry (ABCD) program which recruited and trained 172 dentists and clinics in three counties from July 2002 to February 2006 to treat Medicaid-eligible children under five. ABCD focuses on preventive and restorative dental care for children with an emphasis on the first dental visit by first birthday.603 community staff members and parents were trained on maternal depression and maternal-child oral health issues.Produced Developmental and Oral Health “Red Flags” checklists, and an educational video for parentsin eight languages explaining Well Child Checks available at www.metrokc.gov/health/kgc.
EVIDENCE-BASED PREVENTION IMPROVES HEALTH AND IS COST EFFECTIVE
Measure 1: Children up-to-date with well child visitsKids Get Care Results: 41% increase in two-year-olds up-to-date with Well Child Checks at 3 clinics, from 53% in 2001 to 75% in 2003.
Associated evidence of cost effectiveness: Medicaid children who are up-to-date with well child checks have a 48% lower chance of having an avoidable hospitalization. (Hakim, Pediatrics, 2001) A CHARS analysis shows this equates to annual Medicaid savings of at least $591,893 for two-year-olds only. (UW and KGC cost analysis, 2003)
Measure 2: Application of fluoride varnishes on young children Kids Get Care Results: 7,400 applications of fluoride varnish were applied to children under five at eleven Kids Get Care participating clinical sites from 2003-2006. Associated evidence of cost effectiveness: Fluoride varnish has been demonstrated to reduce caries by 38% (Centers for Disease Control and Prevention. Recommendations for using fluoride to prevent and control dental caries in the United States. MMWR 2001; 50 (No. RR-14):21.) A Washington Dental Service Foundation analysis shows potential savings of roughly $1.5 million statewide if fluoride varnishes were applied during well child visits for children ages under five instead of waiting to pay to fill the cavities that occur without this preventive treatment
Measure 3: First oral health screening by first birthday Kids Get Care Results: 104% increase from 337 in ’05 to 688 in ’06 in children under 18 months who received an oral health visit in eight clinics (in one clinic 72 % of 15 month old medical clinic patients had received a dental visit).
King County Health Action Plan: Strategic Pilot Projects, Innovative Policy Design, Convening for System Change. Susan Johnson, Director, (206) 296-4669, [email protected]
Associated evidence of cost effectiveness: Children with early dental visits incur fewer subsequent dental costs. The age at the first preventive dental visit had a significant positive effect on dental-relatedexpenditures, with the average dental costs being less for children who received earlier preventive care.(Savage, Pediatrics, 2004)
Measure 4: Use of structured developmental surveys, such as Ages and Stages Questionnaire (ASQ) or Parent Evaluation of Developmental Status (PEDS)Kids Get Care Results: Three medical practices achieved an aggregate 46-fold in the percentage of children under five receiving a structured developmental questionnaire (the ASQ or the PEDS) during a well-child visit from 5 in 2004 to 238 in March-August of 2005. Associated evidence of cost effectiveness: ASQs can detect 70 to 80% of children with developmental problems. By contrast, typically only 30% of children with developmental issues are identified before they reach kindergarten (Palfrey et al., J Peds., 1994 and Squires et al., JDBP. 1996) This detection and subsequent early intervention reduces need for special education and other services later in life–20% do not need special education services at 3 years of age (Washington State Infant Toddler Early Intervention Program (ITEIP) data system).
King County Health Action Plan Proposal to the Blue Ribbon Commission on Health Care Costs & Access
8/29/2006 7
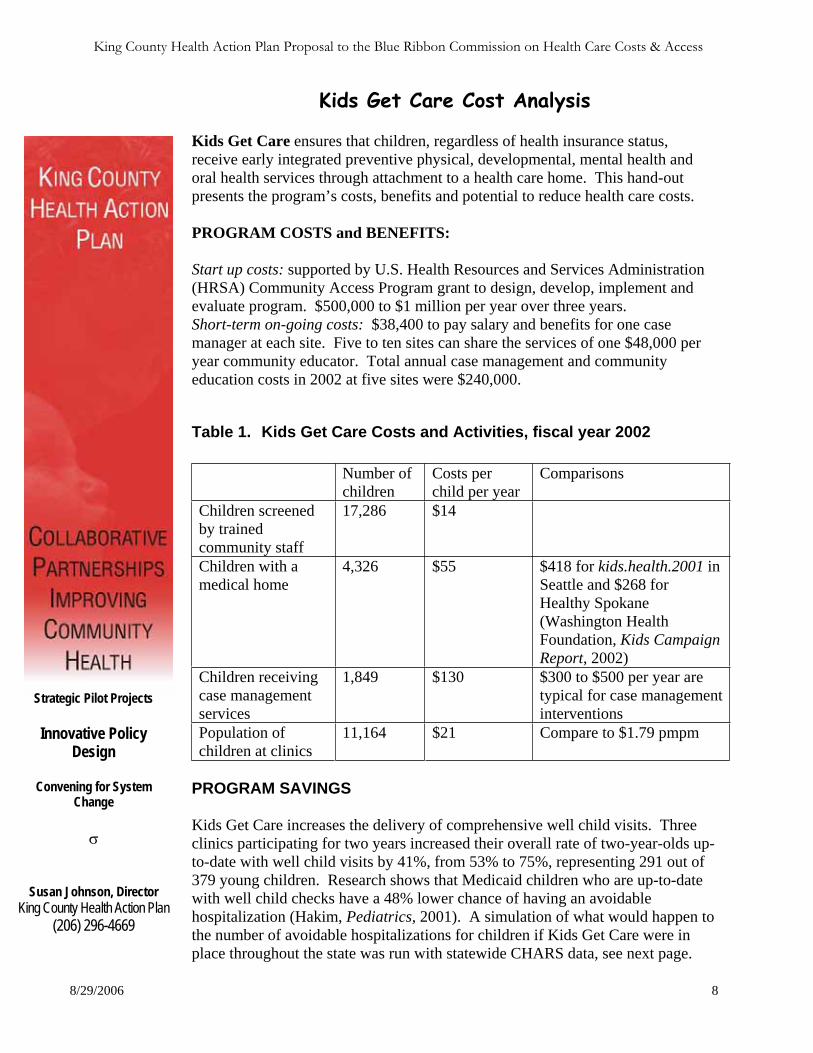
King County Health Action Plan Proposal to the Blue Ribbon Commission on Health Care Costs & Access
Kids Get Care Cost Analysis
Kids Get Care ensures that children, regardless of health insurance status, receive early integrated preventive physical, developmental, mental health and oral health services through attachment to a health care home. This hand-out presents the program’s costs, benefits and potential to reduce health care costs.
PROGRAM COSTS and BENEFITS:
Start up costs: supported by U.S. Health Resources and Services Administration (HRSA) Community Access Program grant to design, develop, implement and evaluate program. $500,000 to $1 million per year over three years. Short-term on-going costs: $38,400 to pay salary and benefits for one case manager at each site. Five to ten sites can share the services of one $48,000 per year community educator. Total annual case management and community education costs in 2002 at five sites were $240,000.
Table 1. Kids Get Care Costs and Activities, fiscal year 2002
Number ofchildren
Costs per child per year
Comparisons
Children screened by trained community staff
17,286 $14
Children with a medical home
4,326 $55 $418 for kids.health.2001 in Seattle and $268 for Healthy Spokane (Washington Health Foundation, Kids Campaign Report, 2002)
Children receiving case management services
1,849 $130 $300 to $500 per year are typical for case management interventions
Population of children at clinics
11,164 $21 Compare to $1.79 pmpm
Strategic Pilot Projects
Innovative Policy Design
Convening for System Change
PROGRAM SAVINGS
Kids Get Care increases the delivery of comprehensive well child visits. Three clinics participating for two years increased their overall rate of two-year-olds up-to-date with well child visits by 41%, from 53% to 75%, representing 291 out of 379 young children. Research shows that Medicaid children who are up-to-date with well child checks have a 48% lower chance of having an avoidable hospitalization (Hakim, Pediatrics, 2001). A simulation of what would happen to the number of avoidable hospitalizations for children if Kids Get Care were in place throughout the state was run with statewide CHARS data, see next page.
Susan Johnson, Director King County Health Action Plan
(206) 296-4669
8/29/2006 8
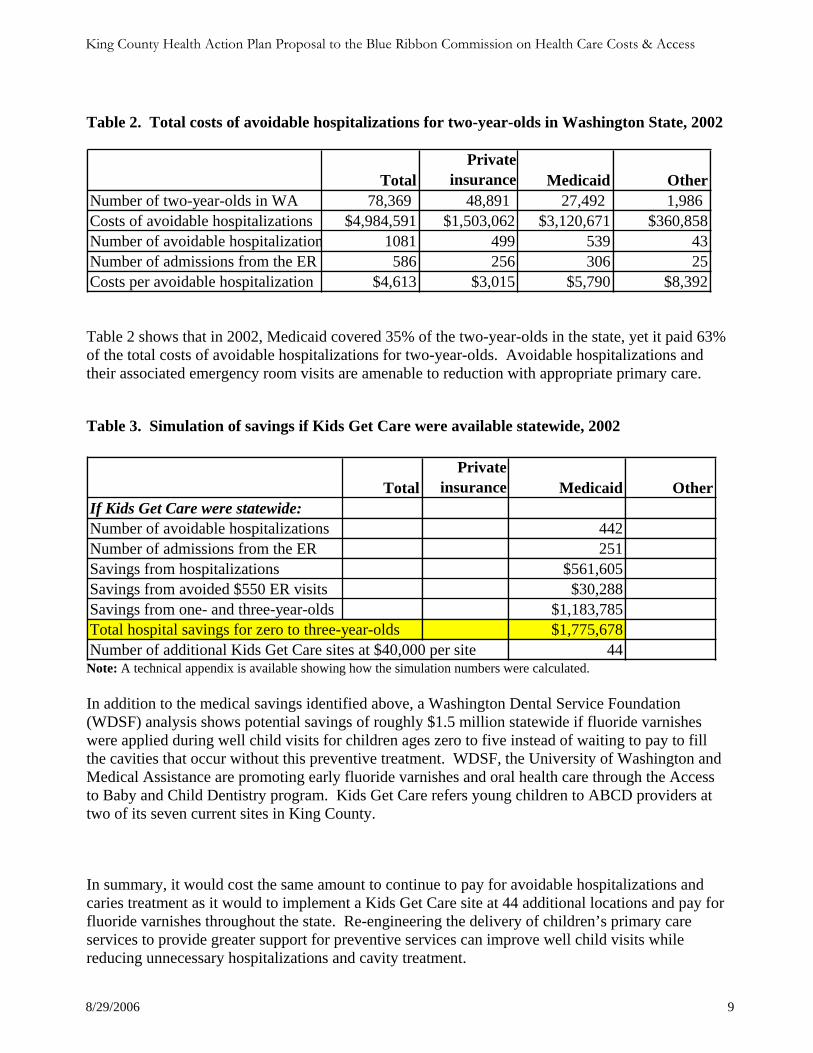
Table 2. Total costs of avoidable hospitalizations for two-year-olds in Washington State, 2002
TotalPrivate
insurance Medicaid OtherNumber of two-year-olds in WA 78,369 48,891 27,492 1,986 Costs of avoidable hospitalizations $4,984,591 $1,503,062 $3,120,671 $360,858Number of avoidable hospitalization 1081 499 539 43Number of admissions from the ER 586 256 306 25Costs per avoidable hospitalization $4,613 $3,015 $5,790 $8,392
Table 2 shows that in 2002, Medicaid covered 35% of the two-year-olds in the state, yet it paid 63% of the total costs of avoidable hospitalizations for two-year-olds. Avoidable hospitalizations and their associated emergency room visits are amenable to reduction with appropriate primary care.
Table 3. Simulation of savings if Kids Get Care were available statewide, 2002
TotalPrivate
insurance Medicaid OtherIf Kids Get Care were statewide:Number of avoidable hospitalizations 442Number of admissions from the ER 251Savings from hospitalizations $561,605Savings from avoided $550 ER visits $30,288Savings from one- and three-year-olds $1,183,785Total hospital savings for zero to three-year-olds $1,775,678Number of additional Kids Get Care sites at $40,000 per site 44
Note: A technical appendix is available showing how the simulation numbers were calculated.
In addition to the medical savings identified above, a Washington Dental Service Foundation (WDSF) analysis shows potential savings of roughly $1.5 million statewide if fluoride varnishes were applied during well child visits for children ages zero to five instead of waiting to pay to fill the cavities that occur without this preventive treatment. WDSF, the University of Washington and Medical Assistance are promoting early fluoride varnishes and oral health care through the Access to Baby and Child Dentistry program. Kids Get Care refers young children to ABCD providers at two of its seven current sites in King County.
In summary, it would cost the same amount to continue to pay for avoidable hospitalizations and caries treatment as it would to implement a Kids Get Care site at 44 additional locations and pay for fluoride varnishes throughout the state. Re-engineering the delivery of children’s primary care services to provide greater support for preventive services can improve well child visits while reducing unnecessary hospitalizations and cavity treatment.
8/29/2006 9
King County Health Action Plan Proposal to the Blue Ribbon Commission on Health Care Costs & Access
King County Health Action Plan Proposal to the Blue Ribbon Commission on Health Care Costs & Access
APPENDIX B
Children’s Health Improvement Collaborative
OVERVIEW AND PURPOSEThe purpose of the Children’s Health Improvement Collaborative (CHIC) is to use quality improvement (QI) methodology and the Breakthrough Series Collaborative (BTS) model to improve the delivery of care for low-income children suffering from specific chronic illnesses and preventive care. In the first two years, known as the Children’s Preventive Health Care Collaborative, CHIC focused on spreading the learnings from KGC especially in the areas of well-child checks, early developmental screening, integrated oral health including fluoride varnishes and attachment to a medical home. Now in its third year, CHIC is focusing on improvement of three specific chronic illnesses: asthma, attention deficit/hyperactivity disorder (AD/HD), and overweight which also includes the relationship between nutrition and oral health.
The broader goal is to move from a completed successful pilot stage in 2005 and 2006 and statewide effort in 2007 to a long-term, sustained quality improvement effort in the state of Washington. This will be accomplished by linking to state health policies that pay for quality and enhancing relationships with local, county and state agencies and organizations to reach widely into the network of medical providers who care for low-income children across the state.
Building on the work of several other organizations: the King County Health Action Plan and its Kids Get Care program, the state Medicaid’s Children’s Health Improvement Collaborative, the Children’s Hospital’s Children’s Obesity Action Team (COAT), the Washington Asthma Initiative and the National Initiative for Children’s Healthcare Quality (NICHQ) collaborative work in all three chronic conditions this collaborative will be a quality improvement effort where approximately 8 to 10 medicalteams per condition will work to measure and improve the quality of care delivered by their practices.
ACHEIVEMENTS AND COST SAVINGSCHIC achievements include:
23 Clinics/practices participating in first two years Year one participants:
o increased the percentage of children receiving fluoride varnishes from 21% to 42% o increased the percentage of children receiving structured developmental questionnaires from 10% to 38%.
Year Two Year one participants: o increased the percentage of children receiving fluoride varnishes from 3% to 70% o increased the percentage of children receiving structured developmental questionnaires from 0% to 46%.
Examples from the literature include: A RAND Evaluation, Measuring The Effectiveness Of A Collaborative For Quality Improvement In Pediatric Asthma
Care, (Schonlau,et al, Ann Fam Med 2005) showed positive impacts on important processes of care and patient self-management practices that have previously been linked to improved health outcomes.
In another RAND evaluation, Improving Primary Care For Patients With Chronic Illness: The Chronic Care Model, Part 2. (Bodenheimer T, et al. JAMA, 2002), thirty-two of 39 studies found that interventions based on chronic care model components improved at least 1 process or outcome measure for diabetic patients. 18 of 27 studies concerned with 3 examples of chronic conditions (congestive heart failure, asthma, and diabetes) demonstrated reduced health care costs or lower use of health care services.
FUNDINGCHIC is funded by the Washington State legislature through DSHS with additional support from several local funders. The collaborative is staffed by Public Health-Seattle & King County and the Child Health Institute. The Child Health Institute is aninter-disciplinary research group comprised of faculty and staff from the Schools of Medicine, Dentistry, and Public Health andCommunity Medicine at the University of Washington. More information is available at: www.childhealthinstitute.org.
A sustainable state-wide quality improvement effort focused on children’s preventive and chronic care will require an on-going annual base commitment from the Department of Health (DOH) or Health Recovery and Services Administration (HRSA) of $200,000 to be matched by Federal private dollars for a total of $500,000 - $600,000 annually. This level of funding will assurethat smaller and rural practices throughout the state are paid for their travel expenses and substitute care and that practicesreceive the level of support required to assist them in making improvements.
8/31/2006 10

Tab 27
July 17, 2006
Washington State Blue Ribbon Commission on Health Care Cost and AccessGovernor Christine Gregoire and Sen. Pat Thibaudeau, Co-Chairs
Dear Commission Members,
On behalf of nearly 4,000 member physicians of the King County Medical Society, we are writing with thehope that you will take full advantage of the historic and timely opportunity you have been given to reshapehealth care in this state over the next several years. Moreover, we hope that you will take a truly bold courserather than rely on the piecemeal approaches of the past that have failed so abysmally to improve the healthcoverage and health status of the public.
In the Commission’s initial, nine-point vision for the future, all but one item refers to cost in one form oranother and it is easy to conclude that this is just another exercise that, despite the high-sounding rhetoric, isall about money. But the high level of health expenditure is important. It is severely straining business andgovernment alike, driving families into bankruptcy and standing between citizens and the care they need withever increasing frequency and costly results.
It is currently fashionable to talk about evidence-based medicine, pay-for-performance, electronic medicalrecords, personal responsibility and other such ideas. In truth, many of them have merit and are worthwhilein and of themselves, especially for their potential benefits in the areas of quality and safety. Nevertheless,we fear that many policymakers will repeat the mistakes of the past by assuming that these disparateactivities will save money on a grand scale. Many of these current trends have huge administrative costsassociated with their development and ongoing maintenance and when these costs are taken into account, webelieve that the savings realized, if any, will be meager indeed. It is unfortunate, therefore, that so muchmoney and effort are being put into ideas that are likely to have relatively little return on investment. Andwe find it ironic and somewhat discouraging that no one in a position of influence has yet had the courage toaddress the single, largest contributor to the high cost of health care, namely, the vast sums of moneyconsumed by the administrative overhead and profits inherent in our antiquated, employer-based, privateinsurance industry. Thousands of companies administering hundreds of thousands of similar benefitpackages with incalculable variations in policies and procedures all siphon enormous amounts of moneyaway from much needed research and patient care. At about thirty percent of the total health careexpenditures, this large, untapped resource dwarfs any savings that might be found by tinkering with variousbits and pieces of the current system but to date, it has been untouchable. Must we really wait for someunimpeachable corporate leader to stand up and tell us that the health insurance business model is no longerworking before real issues are dealt with?
Ultimately, our state, and our country will tackle this issue which is unrivaled among developed nations.We believe that there will be no real progress toward finding an affordable way to improve the overall healthof our citizens until such time as the United States makes a firm commitment to the health of its citizensthrough a well structured national health program that draws on the strengths of its public and private
King CountyMedical Society
200 Broadway, Seattle, WA 98122-5323206-621-9396 fax: 206-621-9455
www.kcmsociety.org
Page 2
sectors. Other modern nations spend proportionally much less on health care and get a much greater returnon their investment in terms of healthier people. So can we if we put our minds to it.
However, until our society decides to deal with fundamental rather than peripheral issues, we will have toseek improvements incrementally rather than on a system-wide basis and it is with this in mind that we offertwo possible ideas for your consideration.
Putting Children First
Our first proposal is that Washington commits itself to providing comprehensive health care to all childrenage 18 and under, not just poor children, but all children and, of course, this should also include maternityand dental care. The continuing deterioration of private insurance coverage and the many uncertaintiesfacing public medical programs due to mounting federal deficits put children at great risk and, in ouropinion, there is no compelling reason for allowing this to continue any longer. Apart from being universallysympathetic, youngsters are relatively inexpensive to care for and are not sufficiently numerous so as tooverwhelm the health system. And it seems a good societal and business investment to usher citizens intoadulthood with healthy minds and bodies. If we cannot find the wherewithal to do a good job inguaranteeing a high standard of care for our children, it is hard to be optimistic about what we will be able toaccomplish for the population as a whole.
This is certainly not a novel idea. Many states are exploring myriad ways to expand health insurancecoverage for children. But what we are suggesting that is unprecedented is that Washington becomes thefirst and only state in the nation to have a truly integrated, systematic and financially stable mechanism forthe care of children. Therefore, we recommend creating a program that incorporates the followingprinciples:
1. Universality: All citizens 18 and under will be included. A birth certificate will be the only documentrequired for proof of eligibility.
2. Uniform Coverage Standards: Envisaged here is coverage for a comprehensive set of services similar tothat typically found in the health plans of large employers, including dental care.
3. Standard Operating Policies and Procedures: To keep operating overhead to an absolute minimum level,all administrative requirements, e.g., forms, brochures, appeals practices, fee schedules, paymentprocedures, etc. should be common across all organizations, public and private, participating in theprogram. Common operating standards would also serve avoid a two-tiered medical system for children.
4. Administration: Similar to the oversight of our nation’s financial markets provided by the FederalReserve Board and the Securities and Exchange Commission, we urge the creation of a single entity,independent of government and the insurance industry, to set standards, monitor performance, enforcecompliance, determine financial requirements, obtain federal waivers and make substantive alterationsfrom time to time as necessary for the smooth functioning and integrity of the program. That the U.S.financial services industry is the most reliable, stable and innovative in the world is in no small part theresult of the prudent and flexible oversight of publicly chartered, independent agencies. We believe thatwe should demand no less for the health care of our children.
Strengthen Primary Care
As a second alternative, should the Commission wishes to consider an option more expansive andcommensurately more challenging, we would encourage you to think about using the abovementionedprinciples to provide coverage for primary health care services for all Washington residents. Primary care iswhere society can get the most value for money, or bang for the buck if you wish. This is where prevention,
Page 3
health education and early detection take place. It is where physicians and other front-line practitioners cantake the time to know their patients, coordinate their care and serve as their advocates in an increasinglycomplex, fractured, and chaotic system. But our health system is failing primary care by its unwillingness topay adequately for it and to simplify this critical area of medicine. Fewer and fewer young physicians arechoosing the field of primary care in favor of the more lucrative and less hectic specialties. And so devisingan approach based on expanding primary care services might serve a dual purpose by raising standards ofcare generally and, at the same time, fortifying the important front line of health care.
In conclusion, we hope that you will avoid cobbling together the familiar band-aid approaches based ondisparate components, leaps of faith regarding future federal participation and the various forms of budgetgimmickry characteristic of current and earlier efforts to expand coverage. We hope that you will chooseinstead to move forward with imagination and courage. Our health system is crying out for orderliness,simplicity and stability and unless our elected officials and other leaders move us in this direction, in fiveyears we will find ourselves continuing to ask why costs are so high and access so low. In the meantime,many ordinary citizens will continue to suffer death and serious illnesses that could have been avoided.
Systems work, chaos doesn’t and if we can apply some of the basic principles of industry that have made oureconomy the strongest and most robust in the world - uniform standards of production, economies of scale,efficient allocation of labor and capital and the like - we will go a long way toward improving the health careand health status of all our citizens at an affordable price. Until we do, we cannot truly lay claim to havingthe best health care in the world.
There is ample money in our economy if it is spent wisely and there is certainly the skill and talent capableof performing to high standards. What we do not yet have is the political will to make the hard decisions thatwill be necessary if we are to reverse the downward spiral in our health services industry. In the end, it ismore a matter of human values than cold statistics. Like the reasoning behind the laws governing publiceducation, a healthy populace yields a more civil society, a more productive work force and a more reliablestream of taxpayers rather than tax users. And finally, we believe that it is no longer acceptable to rationhealth care on the basis of a person’s employment or health status.
It is clear that our national leaders are not yet ready to take on this challenge and so, as with other complexaspects of our economy, it will fall to a few bold states to show imagination and fortitude in finding workablesolutions that can stand the test of time. Starting with ensuring the proper care of mothers and children, orperhaps primary care in its entirety, we hope that Washington can again demonstrate the kind of leadershipon health matters that it has in past decades. You have our full support in this very difficult and vitallyimportant undertaking.
Sincerely,
Phillip Chapman, M.D. William Watts, M.D. Mike Kaminski, M.D. President President-Elect Past President
Curtis Veal, M.D. Edward North, M.D. President, 2004 President, 2003
King CountyMedical Society
200 Broadway, Seattle, Washington 98122-5323206-621-9396 fax: 206-621-9455
www.kcmsociety.org
August 31, 2006
Washington State Blue Ribbon Commission on Health Care Cost and AccessGovernor Christine Gregoire and Sen. Pat Thibaudeau, Co-Chairs
Dear Commissioners,
Shortly before the Commission’s July 27 meeting, the King County Medical Society submitted aletter proposing two discrete and carefully defined measures that would go a long way towardmeeting your primary objective of affordably expanding coverage to all citizens by 2012. Oneproposal called for the creation an integrated, comprehensive health system for all childreneighteen and under and the other envisaged a similar system that would offer primary careservices to all state residents.
While we offer some commentary below on the evaluation criteria for proposals, there cannot beenough emphasis placed on the need to create real systems if the Commission hopes to doanything meaningful over the next five years to increase access without adding burdensomeexpense and overhead. At the July meeting, the Commission heard from Mr. Porter, Mr. Malooly,and Dr. Mecklenberg of Virginia Mason. Each gave examples of how capacity and quality can beimproved simply and inexpensively through the basic R&D and industrial design practicescommon to industry, but relatively new to health care. But again, these individuals representorganized medical systems that have well defined structures and operating procedures that allowthem, like commercial enterprises, to continuously monitor and improve their products andservices. These are not the characteristics of the health services industry through which mostcitizens seek and receive medical services.
The King County Medical Society continues to support the mission and objectives of theCommission and hopes that it will have the courage to break new ground and move this stateforward in a manner that brings meaningful improvements to the health and well being of itscitizens.
Sincerely,
Philip Chapman, M.D. Charles T. Heaney, Ph.D.President Executive Director
KCMS Comments on Proposal Evaluation Criteria
1. What do you propose be done to realize the vision and goals for Washington State established bythe Blue Ribbon Commission on Health Care Costs and Access? Briefly summarize your proposal.
While taking an incremental approach, the KCMS proposal goes a long way toward the goal ofexpanding coverage to all Washingtonians. The universal plan for children speaks for itself while theprimary care alternative gives all Washington residents access to the basic services that have the greatestpotential for improving health status across all sectors of the population.
Should either of these two proposals be adopted in this state and result in the quality and efficiency gainsthat thoughtfully designed systems are capable of producing, it would likely spur whatever efforts arenecessary in the future to incorporate any group of citizens left out of either system for one reason oranother.
2. How will implementation of your proposal enhance, hinder or otherwise impact the achievementof the vision and each of the goals established by the Commission? How do you know?
It is hard to imagine how a systematic approach to a universal coverage scheme for children or forprimary care would not advance the health status of state residents, reduce significantly the burdensomeadministrative cost of the present insurance system, and allow resources to be allocated to improving theoverall quality and effectiveness of services delivered. Moreover, a major reason for the disparities inhealth status is the unavailability of medical care services across various sectors of the populationdefined by race, language, employment status, income and other parameters.
3. Is your proposal modeled after an existing policy or program within Washington or elsewhere? Ifso, describe the policy or program and its outcomes.
The federal Medicare program for older citizens comes closest to exemplifying the type of system thatKCMS has proposed for children and for adults. It is universal in that it covers everyone over the age of65. It is supported financially through the combination of a dedicated tax, general tax revenues, and thefinancial participation of beneficiaries. Medicare has a defined benefit package and program-wideoperating policies and procedures, all of which change over time as circumstances dictate. Finally, theprogram devotes considerable resources R&D efforts aimed at quality and efficiency improvements.
While Medicare is directly administered by government through contracted private intermediaries, theproposals put forth by KCMS do not call for management by government. Instead, they advocate fordirection and oversight by an independent, publicly chartered organization that can marshal the bestcapabilities of the public and private sectors of the health services industry.
4. Will your proposal impose costs on individuals, businesses or government? Will these costs betime-limited or on-going? Can you estimate how much these costs will be, or suggest how such anestimate could be made? How much, if any, of these costs will be offset by corresponding savings?
With respect to creating a universal health plan for children, there will, of necessity, be new expendituresassociated with financing coverage for children who are not currently provided for. These outlays,however, will likely be relatively small and should be easily incorporated into the overall financingstructure of the integrated system envisaged by this proposal. According to official state reports, therewere about 1.7 million children at or below 19 years of age in 2004. Between the data available throughprivate insurers and state programs, estimating the aggregate cost of caring for this age cohort it shouldbe relatively straightforward.
Moreover, in recent years, thanks to new federal and state funds being made available, many childrengenerally ineligible for basic state programs, have found health coverage. Then there are the childrenalready covered through employer-sponsored health plans and plans purchased by individuals. And sothere is already a considerable amount of money currently available for financing health care forchildren. Any additional expenditure, therefore, would go toward providing coverage for thoseyoungsters who are left out of current public and private financing arrangements.
The same reasoning holds true for the primary care alternative. New funding would be necessary to theextent that individuals without primary care coverage were included or that such coverage that did existfailed to meet the requirements set out by plan specifications.
5. How does your proposal reflect collaboration among various stakeholders? Which stakeholdershave endorsed it?
The Medical Society has not collaborated with any individuals or organizations in formulating itsproposals. It is the position of KCMS that the systems approach reflected in both coverage strategiespresented to the Commission stands on its own merits and reflects the growing sentiment in and outsideof the health industry in favor of fundamental change in the manner in which medical services arefinanced and administered.
It should be pointed out, however, that in 2004, the Washington State Medical Association adopted aresolution sponsored by KCMS calling on the state to appoint a blue ribbon commission to assess thefeasibility of achieving universal coverage in the state of Washington. Moreover, at about the same time,Group Health Cooperative also endorsed the principle of universal coverage.
6. What are the obstacles to implementing your proposal? Who will object to it and why? How doyou suggest these objections be addressed?
There are several. First, as KCMS mentioned in its original proposal, there is lack of political will toconfront the longstanding structural weaknesses of the health industry. Second, and closely related, isthe predictable and formidable opposition of those interests whose autonomy, financial position orideological orientation are threatened by the possibility of a stable, well-structured and adequatelyfinanced health sector. As in the past, the opponents of change will include certain segments of theprovider community, various business interests, private insurers, pharmaceutical and medical deviceproducers, others who fear a lessening of the rewards and influence they enjoy under current industryconditions.
To overcome these considerable obstacles, the essential first step is for state government to firmlycommit itself to shaping the principles and priorities that will guide the future development of healthservices in this state. In the health arena, public policy should no longer be taken to be the collectivedecisions of numerous private entities guided by their own self interest. The public, through itsrepresentatives, must take the lead in this important process if the downward spiral in health care is to bereversed. If this process is undertaken in good faith, the medical community will be a willingparticipant.
With public priorities clearly identified, negotiations among the various stakeholders on how best toachieve the goals set can proceed with a common purpose.

Tab 28

Tab 29
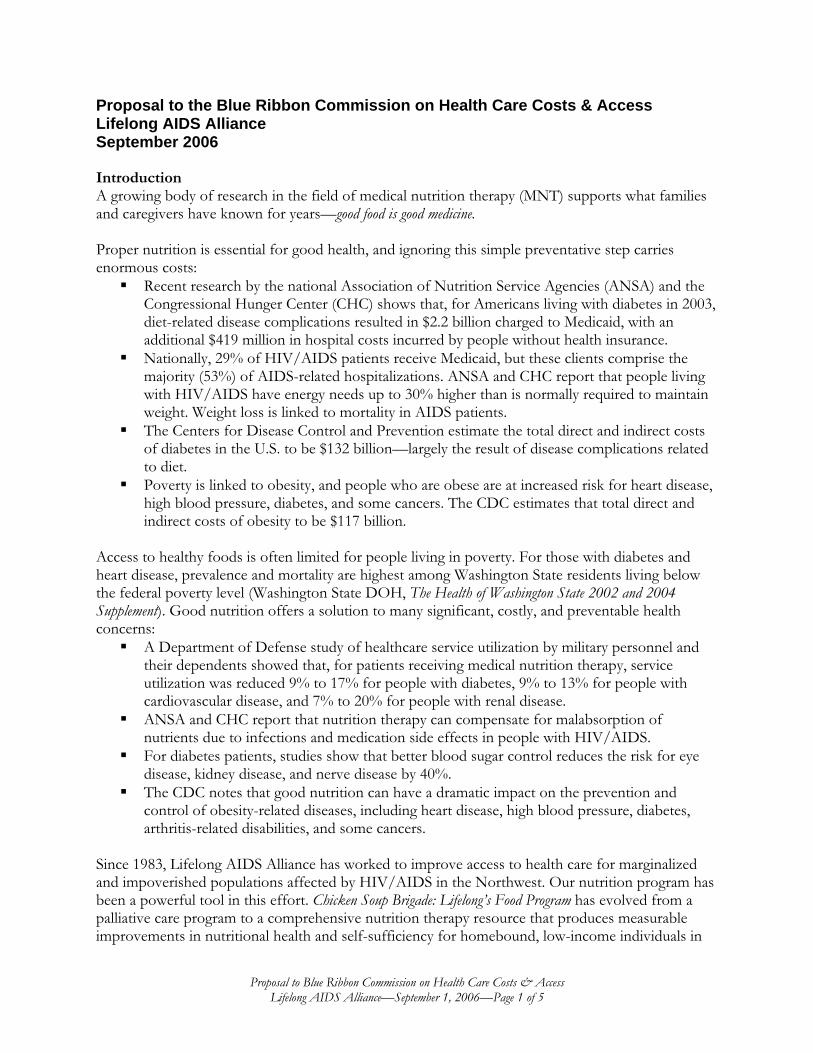
Proposal to the Blue Ribbon Commission on Health Care Costs & Access Lifelong AIDS Alliance September 2006
IntroductionA growing body of research in the field of medical nutrition therapy (MNT) supports what families and caregivers have known for years—good food is good medicine.
Proper nutrition is essential for good health, and ignoring this simple preventative step carries enormous costs:
Recent research by the national Association of Nutrition Service Agencies (ANSA) and the Congressional Hunger Center (CHC) shows that, for Americans living with diabetes in 2003, diet-related disease complications resulted in $2.2 billion charged to Medicaid, with an additional $419 million in hospital costs incurred by people without health insurance. Nationally, 29% of HIV/AIDS patients receive Medicaid, but these clients comprise the majority (53%) of AIDS-related hospitalizations. ANSA and CHC report that people living with HIV/AIDS have energy needs up to 30% higher than is normally required to maintain weight. Weight loss is linked to mortality in AIDS patients. The Centers for Disease Control and Prevention estimate the total direct and indirect costs of diabetes in the U.S. to be $132 billion—largely the result of disease complications related to diet.Poverty is linked to obesity, and people who are obese are at increased risk for heart disease, high blood pressure, diabetes, and some cancers. The CDC estimates that total direct and indirect costs of obesity to be $117 billion.
Access to healthy foods is often limited for people living in poverty. For those with diabetes and heart disease, prevalence and mortality are highest among Washington State residents living below the federal poverty level (Washington State DOH, The Health of Washington State 2002 and 2004 Supplement). Good nutrition offers a solution to many significant, costly, and preventable health concerns:
A Department of Defense study of healthcare service utilization by military personnel and their dependents showed that, for patients receiving medical nutrition therapy, service utilization was reduced 9% to 17% for people with diabetes, 9% to 13% for people with cardiovascular disease, and 7% to 20% for people with renal disease. ANSA and CHC report that nutrition therapy can compensate for malabsorption of nutrients due to infections and medication side effects in people with HIV/AIDS. For diabetes patients, studies show that better blood sugar control reduces the risk for eye disease, kidney disease, and nerve disease by 40%. The CDC notes that good nutrition can have a dramatic impact on the prevention and control of obesity-related diseases, including heart disease, high blood pressure, diabetes, arthritis-related disabilities, and some cancers.
Since 1983, Lifelong AIDS Alliance has worked to improve access to health care for marginalized and impoverished populations affected by HIV/AIDS in the Northwest. Our nutrition program has been a powerful tool in this effort. Chicken Soup Brigade: Lifelong’s Food Program has evolved from a palliative care program to a comprehensive nutrition therapy resource that produces measurable improvements in nutritional health and self-sufficiency for homebound, low-income individuals in
Proposal to Blue Ribbon Commission on Health Care Costs & Access Lifelong AIDS Alliance—September 1, 2006—Page 1 of 5
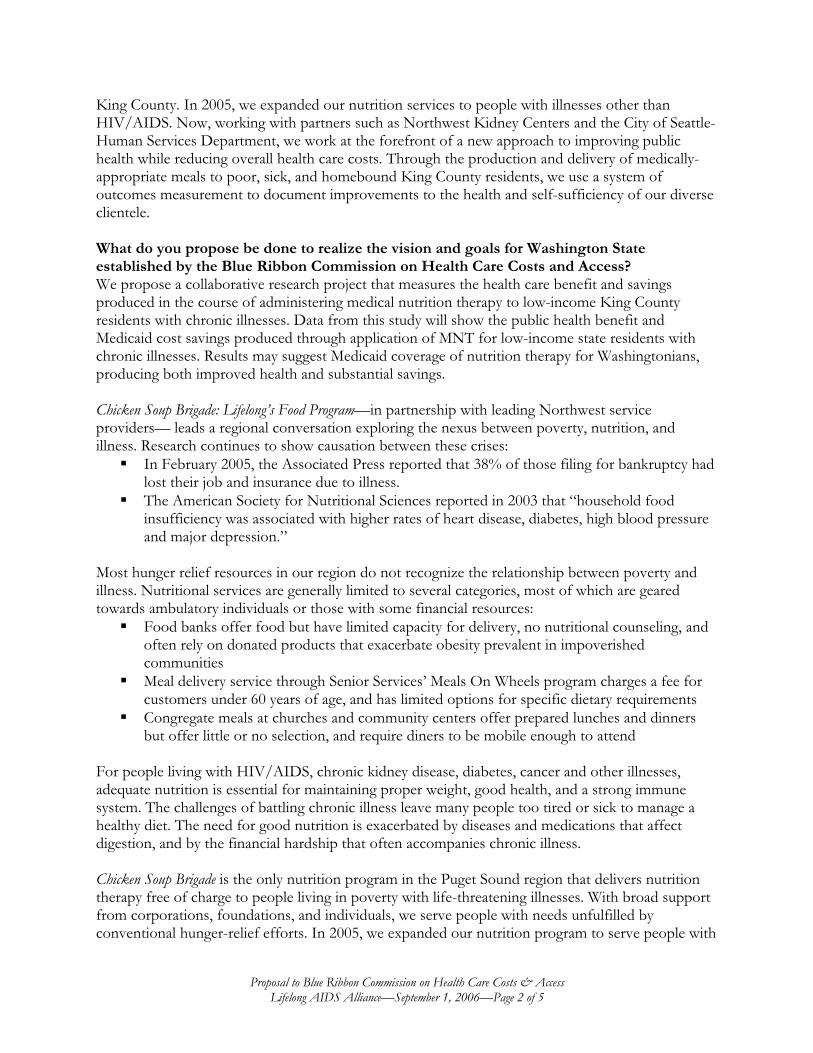
King County. In 2005, we expanded our nutrition services to people with illnesses other than HIV/AIDS. Now, working with partners such as Northwest Kidney Centers and the City of Seattle-Human Services Department, we work at the forefront of a new approach to improving public health while reducing overall health care costs. Through the production and delivery of medically-appropriate meals to poor, sick, and homebound King County residents, we use a system of outcomes measurement to document improvements to the health and self-sufficiency of our diverse clientele.
What do you propose be done to realize the vision and goals for Washington State established by the Blue Ribbon Commission on Health Care Costs and Access? We propose a collaborative research project that measures the health care benefit and savings produced in the course of administering medical nutrition therapy to low-income King County residents with chronic illnesses. Data from this study will show the public health benefit and Medicaid cost savings produced through application of MNT for low-income state residents with chronic illnesses. Results may suggest Medicaid coverage of nutrition therapy for Washingtonians, producing both improved health and substantial savings.
Chicken Soup Brigade: Lifelong’s Food Program—in partnership with leading Northwest service providers— leads a regional conversation exploring the nexus between poverty, nutrition, and illness. Research continues to show causation between these crises:
In February 2005, the Associated Press reported that 38% of those filing for bankruptcy had lost their job and insurance due to illness.The American Society for Nutritional Sciences reported in 2003 that “household food insufficiency was associated with higher rates of heart disease, diabetes, high blood pressure and major depression.”
Most hunger relief resources in our region do not recognize the relationship between poverty and illness. Nutritional services are generally limited to several categories, most of which are geared towards ambulatory individuals or those with some financial resources:
Food banks offer food but have limited capacity for delivery, no nutritional counseling, and often rely on donated products that exacerbate obesity prevalent in impoverished communities Meal delivery service through Senior Services’ Meals On Wheels program charges a fee for customers under 60 years of age, and has limited options for specific dietary requirements Congregate meals at churches and community centers offer prepared lunches and dinners but offer little or no selection, and require diners to be mobile enough to attend
For people living with HIV/AIDS, chronic kidney disease, diabetes, cancer and other illnesses, adequate nutrition is essential for maintaining proper weight, good health, and a strong immune system. The challenges of battling chronic illness leave many people too tired or sick to manage a healthy diet. The need for good nutrition is exacerbated by diseases and medications that affect digestion, and by the financial hardship that often accompanies chronic illness.
Chicken Soup Brigade is the only nutrition program in the Puget Sound region that delivers nutrition therapy free of charge to people living in poverty with life-threatening illnesses. With broad support from corporations, foundations, and individuals, we serve people with needs unfulfilled by conventional hunger-relief efforts. In 2005, we expanded our nutrition program to serve people with
Proposal to Blue Ribbon Commission on Health Care Costs & Access Lifelong AIDS Alliance—September 1, 2006—Page 2 of 5
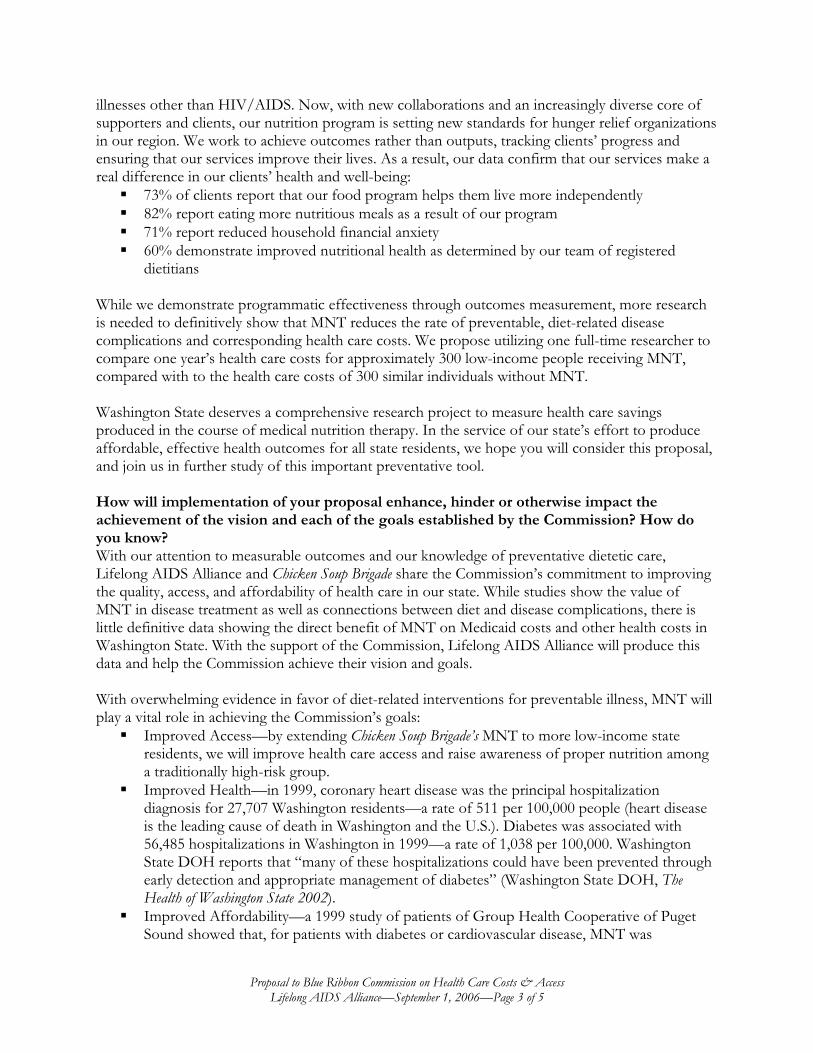
illnesses other than HIV/AIDS. Now, with new collaborations and an increasingly diverse core of supporters and clients, our nutrition program is setting new standards for hunger relief organizations in our region. We work to achieve outcomes rather than outputs, tracking clients’ progress and ensuring that our services improve their lives. As a result, our data confirm that our services make a real difference in our clients’ health and well-being:
73% of clients report that our food program helps them live more independently 82% report eating more nutritious meals as a result of our program 71% report reduced household financial anxiety 60% demonstrate improved nutritional health as determined by our team of registered dietitians
While we demonstrate programmatic effectiveness through outcomes measurement, more research is needed to definitively show that MNT reduces the rate of preventable, diet-related disease complications and corresponding health care costs. We propose utilizing one full-time researcher to compare one year’s health care costs for approximately 300 low-income people receiving MNT, compared with to the health care costs of 300 similar individuals without MNT.
Washington State deserves a comprehensive research project to measure health care savings produced in the course of medical nutrition therapy. In the service of our state’s effort to produce affordable, effective health outcomes for all state residents, we hope you will consider this proposal, and join us in further study of this important preventative tool.
How will implementation of your proposal enhance, hinder or otherwise impact the achievement of the vision and each of the goals established by the Commission? How do you know?With our attention to measurable outcomes and our knowledge of preventative dietetic care, Lifelong AIDS Alliance and Chicken Soup Brigade share the Commission’s commitment to improving the quality, access, and affordability of health care in our state. While studies show the value of MNT in disease treatment as well as connections between diet and disease complications, there is little definitive data showing the direct benefit of MNT on Medicaid costs and other health costs in Washington State. With the support of the Commission, Lifelong AIDS Alliance will produce this data and help the Commission achieve their vision and goals.
With overwhelming evidence in favor of diet-related interventions for preventable illness, MNT will play a vital role in achieving the Commission’s goals:
Improved Access—by extending Chicken Soup Brigade’s MNT to more low-income state residents, we will improve health care access and raise awareness of proper nutrition among a traditionally high-risk group. Improved Health—in 1999, coronary heart disease was the principal hospitalization diagnosis for 27,707 Washington residents—a rate of 511 per 100,000 people (heart disease is the leading cause of death in Washington and the U.S.). Diabetes was associated with 56,485 hospitalizations in Washington in 1999—a rate of 1,038 per 100,000. Washington State DOH reports that “many of these hospitalizations could have been prevented through early detection and appropriate management of diabetes” (Washington State DOH, TheHealth of Washington State 2002).Improved Affordability—a 1999 study of patients of Group Health Cooperative of Puget Sound showed that, for patients with diabetes or cardiovascular disease, MNT was
Proposal to Blue Ribbon Commission on Health Care Costs & Access Lifelong AIDS Alliance—September 1, 2006—Page 3 of 5
associated with a reduction in utilization of hospital services for patients with diabetes (9.5%) and for patients with cardiovascular disease (8.6%). Also, utilization of physician services declined by 23.5% for MNT users with diabetes and 16.9% for MNT users with cardiovascular disease.
Is your proposal modeled after an existing policy or program within Washington or elsewhere? If so, describe the policy or program and its outcomes. We will model our research on recent work by ANSA and CHC (cited above) and on our pending collaboration with the City of Seattle’s Medicaid Savings Project.
The city of Seattle is implementing a Medicaid Savings Project to explore appropriate service interventions for medically complex patients with high Medicaid utilization. City staff will identify and implement preventative services—including MNT—that match the client’s chronic care needs. The goal is to ensure that available Medicaid resources are being used in a cost-effective manner in order to obtain optimum value for both the client and the State of Washington DSHS. The result will be healthier clients of Seattle’s Aging & Disability Services—and significant Medicaid savings for Washington State.
Will our proposal impose costs on individuals, businesses or government? Will these costs be time limited or ongoing? Can you estimate how much these costs will be, or suggest how such an estimated could be made? How much, if any, of these costs will be offset by corresponding savings? With the cost of Chicken Soup Brigade’s nutrition services currently less than $2,000 per client annually, MNT is likely to be a highly affordable alternative to costly diet-related complications of diabetes, HIV/AIDS, chronic kidney disease, and other diseases. The long-term savings and health benefits produced by both this research project and subsequent application of preventative nutrition therapy to high-utilization Medicaid patients would easily justify the initial cost of this research.
Washington State DSHS has a history of success with preventative treatments that reduce Medicaid spending. A 1997 briefing paper by DSHS, Cost Savings in Medicaid Medical Expenses: An outcome of Publicly Funded Chemical Dependency Treatment in Washington State, showed that chemical dependency treatment for indigent state residents—with an average cost of $2,300 per treatment episode—resulted in an average savings of $4,500 over a five year period and an impressive $7,900 average savings for clients with histories of Medicaid-funded care.
With your partnership, Chicken Soup Brigade would be honored to assist in measuring the cost savings produced through preventative MNT for low-income patients with heart disease, diabetes, HIV/AIDS, and other chronic illnesses. We are already starting this work. In collaboration with the City of Seattle-Human Services Department, Chicken Soup Brigade will provide MNT for the City’s upcoming Medicaid Savings Project for their clients with high Medicaid utilization.
How does you proposal reflect collaboration among various stakeholders? Which stakeholders have endorsed it? The successful expansion of our food program’s services has resulted in powerful collaborations with Northwest Kidney Centers, Seattle Housing Authority, and City of Seattle-Aging & Disabilities Services. Also, key funders have supported our work and celebrated our success, including the Paul G. Allen Family Foundation, The Foster Foundation, the Boeing Employees Community Fund, The Seattle Foundation, MAC AIDS Fund, and Microsoft Corporation.
Proposal to Blue Ribbon Commission on Health Care Costs & Access Lifelong AIDS Alliance—September 1, 2006—Page 4 of 5
What are the obstacles to implementing your proposal? Who will object to it and why? How do you suggest these objections be addressed? Challenges to completing this research include identifying appropriate research partners, providing clients with incentives to participate, and securing funds for research and service implementation to appropriate subjects. But with Chicken Soup Brigade’s fully-equipped production facilities and our staff of experienced dietetic professionals, costs of service implementation to study subjects would be minimal, and many of our new and ongoing clientele would be likely candidates for this project.
Thank you for the opportunity to submit this proposal. We look forward to working further with the Commission, and using our dietetic expertise to help achieve our shared goal of accessible, affordable, quality health care for all Washingtonians. If you have any questions or require additional information, please do not hesitate to call. We look forward to hearing from you.
Sincerely,
Tina Podlodowski Executive Director, Lifelong AIDS Alliance 1002 E Seneca St Seattle, WA 98122
Phone: 206-957-1600 E-mail: [email protected]
Proposal to Blue Ribbon Commission on Health Care Costs & Access Lifelong AIDS Alliance—September 1, 2006—Page 5 of 5

Tab 30
September 1, 2006
TO: Members, Blue Ribbon Commission on Health Care Costs & Access
FROM: Carolyn Logue, Washington State Director National Federation of Independent Business
RE: Submission of Proposals and Concepts for Consideration by the Commission
For the nearly 15,000 small business members of the National Federation of Independent Business (NFIB) in Washington State, health care is a top concern. Often these small business owners cannot find health care for themselves and their own families, but more frequently they cannot find or afford health insurance for their employees. This leaves them struggling for good employees as they compete with larger companies. It also pains them as they watch good employees (who are often friends) struggle with health problems.
However, the reality for small business is that even in a perfect environment, many would not be able to afford health care for their employees. The profit margins in these businesses are low and labor/other fixed costs are high resulting in situations where there will never be enough money to add in another cost without impacting wages paid to employees or even the ability to keep the job in the business. It is for this reason that NFIB continues to OPPOSE any proposals that require employers to pay for health insurance, we firmly believe that whether or not health insurance is provided by the employer is part of the overall compensation package – a package that must be flexible to meet the needs of both the employer and the employee.
Below are several ideas that we would like the Commission to consider as it evaluates proposals and plans. We feel strongly that these ideas will help formulate a direction towards cost savings in our health insurance system. They will achieve the goals and vision of the Commission in that the lower the cost, the more access small business and their employees will have in the system and fewer people will be uninsured. With fewer uninsured, more people (both children and adults) will have access to the health care system and thus a healthier population should result. We do believe, however, that no one of these ideas will solve the problem on its own. They, along with ideas from others, must be put into a menu from which multiple selections should occur.
NFIB Submission – p.2
Focus on the private sector: From a small business perspective, the first priority should be to look at cost reductions in private sector insurance rather than simply layering public programs on top of the current system or putting public and private programs in competition with one another. According to NFIB surveys, while public programs are viewed as a safety net or last resort, the private sector is where small business owners want to purchase health insurance. We need to look at other states that have more private health insurance companies in their market and attempt to mirror regulations in those states in order to attract additional companies to the state. It should be a priority of the Office of Insurance Commissioner to increase the competitiveness of our market place since this competitiveness can benefit citizens as insurance companies vie for their health insurance dollars. Competition spurs innovation and creativity which can only benefit our health care system. Also, by building up the competition in the private sector and revitalizing all of our private health insurance markets, the state should not have to spend a dime other than potential staff costs for reviewing and revising regulatory requirements. In addition, a stronger, more affordable private market should reduce pressure on public programs as more people are able to find health insurance without help. An added benefit is that the more families are able to afford health insurance in the private market, the more children will be covered.
Change Our Rating Laws: In order to make our state more attractive to other insurance companies and to allow more diversity in the premiums available to small businesses and individuals, we must look at how we determine insurance rates. The state should focus on other states that have a large number of health insurance plans along with a greater range of price options for individuals and small businesses. Our community rating laws, while helping some individuals, have helped increase our number of uninsured by increasing the price for young, healthy people to a point where they no longer see a benefit to justify the cost of having insurance. Allowing additional rating factors or allowing an insurer more ability to deviate rates within small group plans based on additional factors would help ensure lower cost plans are available to encourage younger, healthier people to get into the market – and a socialized system like health insurance needs more young, healthy people in it. One suggestion comes from Wisconsin which allows some variation for health status within a band similar to the age band we have now. This allows variations in price to reflect the actual costs driven by the group or individual but keeps limits and boundaries on the top and bottom numbers.
Prioritize existing public sector spending: With the goal to cover all children by 2010, it is imperative that the state get its own house in order before requiring any additional spending. A complete review of state priorities in health care spending must be done quickly. This would include all spending in health care from all areas of government with a goal of maximizing existing dollars to meet priorities. If covering all children is a priority, then the spending plan using existing dollars should reflect that priority. A thorough discussion of the “what” government should pay for also must be done. No additional state health care programs should be set up and no additional spending should be done until this task is complete, reviewed and fully vetted.
NFIB Submission – p. 3
Determine Plans by Price: The state should contract with a certified actuarial firm to provide the legislature with five plan designs, not subject to any coverage, service or administrative requirements in Title 48 RCW. These plan designs will include cost-effective coverage at the following price points:
$50 PMPM $75 PMPM $100 PMPM $125 PMPM $150 PMPM
The report will include a detailed listing of the covered services, providers and conditions for each plan, deductible amounts, co-pays, and other out of pocket costs. The report will also include a listing for each plan of the statutory and regulatory requirements in Title 48 that would have to be repealed or revised to allow each plan to be sold in the private insurance market. This can be used to determine minimum coverage requirements in the state based on price rather than benefits or providers. The idea would be to see how the best coverage could be obtained for an affordable price.
Focus on individuals: One of the best ways to meet the Commission’s visions of improving health and improving affordability is to make it easier for individuals to obtain their own health care and insurance rather than creating dependency on employers or government. The more individuals are responsible for their own costs, the more thought will be given to lifestyle choices and the price of goods and services. The more individuals have access to their own health insurance, the less government will have to spend on uncompensated care and the less dependency there will be on an employment-based system. It is also much more preferable, according to NFIB members, for the government to serve as a safety net for individuals in health care, not businesses.
Make it a priority to bring more competition back to the individual market: We need more than just three or four carriers to ensure the number of plans that would truly make our individual market competitive. To increase access, there need to be hundreds of plans available to individuals. To reduce costs, these plans must compete with each other for the same pot of money. To improve health, these plans must compete with each other to provide the best benefits for the least amount of money in order to attract the larger customer base. This should be a focus of the Office of the Insurance Commissioner. It is imperative that he bring back a vibrant and healthy private individual insurance market.
Strengthen the ability for individuals and small businesses to have Health Savings Accounts: These accounts can help people better afford good catastrophic care and avoid bankruptcy. They also are the best way currently that individuals can obtain tax savings for purchasing their own health care. By helping small businesses purchase these types of plans for employees through removing the attached high deductible plan from
NFIB Submission – p. 4
our existing small group rating pools, the plans will become more affordable and the small business owners will be better able to help with deductibles. In addition, the more employers are able to get help get employees started with HSAs, the more individuals will be able to afford their own health insurance once they leave that employer.
Allow Limited Benefit Plans: Offered in other states, such as California, these plans provide first dollar coverage with caps rather than catastrophic coverage. They are very affordable ($35-$40) and can be a means in which an individual can provide up front coverage for themselves to enhance an employer’s catastrophic plan. Or, the small business can offer the Limited Benefit Plan to enhance and help the individual who has an HSA. They can also be a great way to cover children who often just need basic preventive care. Many parents would be able to afford this coverage and reduce dependency and cost for government programs.
Allow Subsidization of Deductibles, Not Just Insurance: The state should explore the cost of assisting individuals with the deductibles in HSAs rather than always subsidizing the total insurance package. Many individuals may be able to afford a high deductible premium but would have trouble with the upfront deductible costs. If the state looked at the cost of allowing the individual to buy their own HSA and then helped with a Limited Benefit Plan and the deductible amount, it may actually end up with reduced government costs while providing the same benefit for the individual. With the caps on both Limited Benefit Plans and HSAs, the government would have more surety in its cost projections. In addition, by building up the HSA, more people may be able to migrate out of state programs and not need the subsidies after a few years. In addition, they would have more incentives to save their deductible amount since it would build. The Limited Benefit Plan would cover the preventive care. (Another benefit is that the subsidy would actually go to the needy family, not the insurance company).
NFIB is constantly surveying its members to determine their positions on health insurance issues and the above ideas are just some of the suggestions that have come forward. We appreciate the opportunity to have input into the Commission’s discussions and will continue to survey our small business members to determine their positions on other suggestions as they arise.
Please feel free to contact me if you have any questions at 360-786-8675.

Tab 31
A Washington State Plan to Reduce Avoidable Falls Injuries and Deaths
Among Older Adults
for the
Washington State Blue Ribbon Commission on Health Care Access & Cost
Respectfully submitted by:
Sally York MN, RNC Chair, Pierce County Falls Prevention Coalition
Interim Director, NorthWest Orthopaedic Institute Office: 1905 S. Jefferson, Tacoma, WA 98402
Mail: P.O. Box 1878, Tacoma, WA 98401 Phone: 253.627.5144 Fax: 253.627.5619
Email: [email protected]
on behalf of the
Pierce and Thurston County Falls Prevention Coalitions
and the
Physical Therapy Association of Washington
September 1, 2006
2
Acknowledgement This proposal is the culmination of several years of collaborative work towards reducing falls in older adults in Washington State. Those who have actively contributed to the development of the Washington State Falls Reduction Plan in the past year include:
Anne Shumway-Cook PT, PhD Department of Rehabilitation Medicine, University of Washington
Ilene Silver MPH Injury and Violence Prevention Program, Washington State Department of Health
James LoGerfo MD, MPH Health Promotion and Research Center, University of Washington
Jackie Barry and Melissa Johnson Physical Therapy Association of Washington
Rich Bettesworth PT Physical Therapy Association of Washington
Roger Herr PT, MPA Gentiva Health Services
David Hanson PhD Pierce County Aging & Longterm Care (Area Agency on Aging)
Rick MacCornack PhD Northwest Physicians Network
Carolynn Morris MN, RN Tacoma Trauma Trust
Roger Edington Tacoma Fire Department
Anne Peterson MEd and Mike McCusker MEd Providence St. Peter Hospital
Eileen Finnigan and Suzanne Mayr Tacoma-Pierce County Public Health Department
3
Table of Contents
Section Page(s) 1. Proposal Summary and Background………………………………………………. 4-8 Summary………………………………………………………………………………… 4 Background……………………………………………………………………………… 4 Washington State data on falls among older adults……………………………………… 5 Health care cost impact of falls injuries…………………………………………………. 5-6 Washington State falls reduction efforts………………………………………………… 6-7 Proposal timing and opportunities……………………………………………………….. 7 State level strategies now needed to reduce falls injuries in older adults………………… 7 A. The development of a statewide falls prevention campaign………………… 7-8 B. The development of falls prevention infrastructures at state and local levels… 8
2. The Falls Reduction Plan Achieves the Commission’s Vision and Goals…………. 9
3. The Falls Reduction Plan is Modeled after National and International Strategies. 9-11 National efforts to reduce falls in older adults……….………………………………… 9-10 International efforts to reduce falls in older adults……………………………………… 11
4. Falls Reduction Plan Costs and Savings………………………………………… 11-12
5. The Falls Reduction Plan Reflects Collaboration Among Key Stakeholders……… 12 State level stakeholders………………………………………………………………… 12 Local level stakeholders………………………………………………………..……… 12-13
6. Falls Reduction Plan Implementation Obstacles…………………………………… 13
Conclusion………………………………………………………………………………… 13
References………………………………………………………………………………….14-16
4
1. Proposal Summary and Background Summary Falls are a major health problem among older adults.1 Falls injuries in older adults are the leading cause of injury hospitalization in Washington State,2 as well as nationally.3 These preventable injuries create a financial and utilization burden on all segments of our health care system, and threaten the independence and quality of life of our aging population. Many falls in older adults can be prevented.4 Washington State can help empower our aging population to stay healthy, safe, active and independent for life by implementing a strategic plan which facilitates and funds effective, sustainable falls reduction interventions. This plan will create the sustainable state and local infrastructures, interventions and system changes needed in our health care and aging services systems to contain falls-related costs and improve the quality of and access to health care for all citizens. Reducing falls injuries in older adults will also be an important step towards helping Washington become one of the top ten healthiest states in the nation.
The purpose of this proposal is to demonstrate that a statewide falls reduction plan meets the goals of the Washington State Blue Ribbon Commission on Health Care Costs and Access. By providing evidence based falls prevention best practices and lessons learned from community-based research conducted by the Washington State Department of Health’s Injury and Violence Prevention Program in partnership with the NorthWest Orthopaedic Institute, health care costs to Washington State for older adults can be contained, and possibly reduced. The two key elements to ensure the success of this proposal are to:
o Ensure that best practices and evidence based interventions are applied o Increase collaboration of agencies and organizations at state and community levels to
capitalize on, mobilize and maximize existing resources This proposal is designed to strengthen systems development for cross-program, cross-agency and cross-organizational work at state and community levels for reducing avoidable falls among older adults. This goal is in support of the Blue Ribbon Commission’s initiatives to reduce costs in health care, and provide evidence based best practice care standards, and involve the patient in their individual care. The goals5 of this falls reduction plan are to:
Reduce the hospitalization rate for falls among adults age 65+ by 10% from 1,667 per 100,000 in 2004 to 1,500 per 100,000 by 2010. Reduce the death rate for falls by 10% from 8.8 per 100,000 population in 2004 to 7.9 per 100,000 population by 2010.
Background Falls and fall-related injuries have a significant negative impact on individuals, communities, and our health care system. The major risks for falls are related to many modifiable factors associated with health and aging, such as medication side effects, weakened balance and muscle strength which affect mobility, and changes in vision and hearing. As the population ages, this problem will only become more prevalent. However, many falls and fall-related injuries can be prevented. According to the Centers for Disease Control and Prevention:6
More than one third of adults age 65 or older have suffered a fall in the last yearAmong older adults, falls are the leading cause of injury deaths and are the most common cause of injuries and hospital admissions for trauma
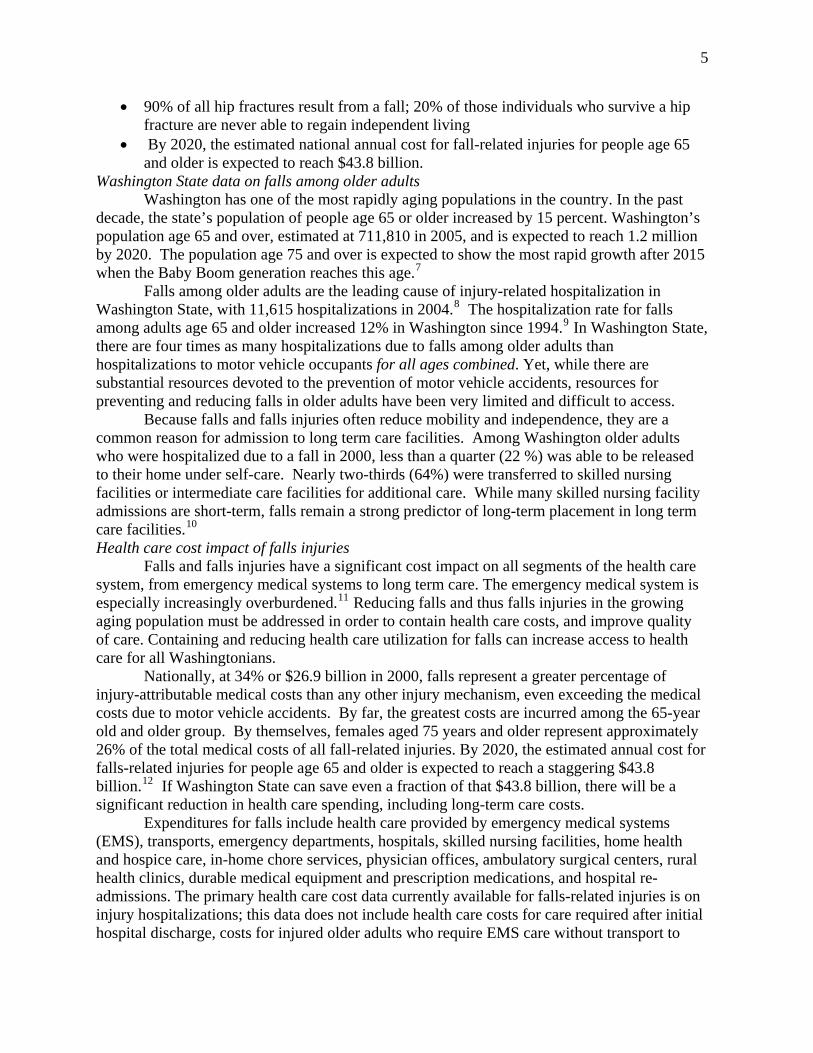
5
90% of all hip fractures result from a fall; 20% of those individuals who survive a hip fracture are never able to regain independent living By 2020, the estimated national annual cost for fall-related injuries for people age 65 and older is expected to reach $43.8 billion.
Washington State data on falls among older adults Washington has one of the most rapidly aging populations in the country. In the past decade, the state’s population of people age 65 or older increased by 15 percent. Washington’s population age 65 and over, estimated at 711,810 in 2005, and is expected to reach 1.2 million by 2020. The population age 75 and over is expected to show the most rapid growth after 2015 when the Baby Boom generation reaches this age.7
Falls among older adults are the leading cause of injury-related hospitalization in Washington State, with 11,615 hospitalizations in 2004.8 The hospitalization rate for falls among adults age 65 and older increased 12% in Washington since 1994.9 In Washington State, there are four times as many hospitalizations due to falls among older adults than hospitalizations to motor vehicle occupants for all ages combined. Yet, while there are substantial resources devoted to the prevention of motor vehicle accidents, resources for preventing and reducing falls in older adults have been very limited and difficult to access.
Because falls and falls injuries often reduce mobility and independence, they are a common reason for admission to long term care facilities. Among Washington older adults who were hospitalized due to a fall in 2000, less than a quarter (22 %) was able to be released to their home under self-care. Nearly two-thirds (64%) were transferred to skilled nursing facilities or intermediate care facilities for additional care. While many skilled nursing facility admissions are short-term, falls remain a strong predictor of long-term placement in long term care facilities.10
Health care cost impact of falls injuries Falls and falls injuries have a significant cost impact on all segments of the health care
system, from emergency medical systems to long term care. The emergency medical system is especially increasingly overburdened.11 Reducing falls and thus falls injuries in the growing aging population must be addressed in order to contain health care costs, and improve quality of care. Containing and reducing health care utilization for falls can increase access to health care for all Washingtonians. Nationally, at 34% or $26.9 billion in 2000, falls represent a greater percentage of injury-attributable medical costs than any other injury mechanism, even exceeding the medical costs due to motor vehicle accidents. By far, the greatest costs are incurred among the 65-year old and older group. By themselves, females aged 75 years and older represent approximately 26% of the total medical costs of all fall-related injuries. By 2020, the estimated annual cost for falls-related injuries for people age 65 and older is expected to reach a staggering $43.8 billion.12 If Washington State can save even a fraction of that $43.8 billion, there will be a significant reduction in health care spending, including long-term care costs. Expenditures for falls include health care provided by emergency medical systems (EMS), transports, emergency departments, hospitals, skilled nursing facilities, home health and hospice care, in-home chore services, physician offices, ambulatory surgical centers, rural health clinics, durable medical equipment and prescription medications, and hospital re-admissions. The primary health care cost data currently available for falls-related injuries is on injury hospitalizations; this data does not include health care costs for care required after initial hospital discharge, costs for injured older adults who require EMS care without transport to
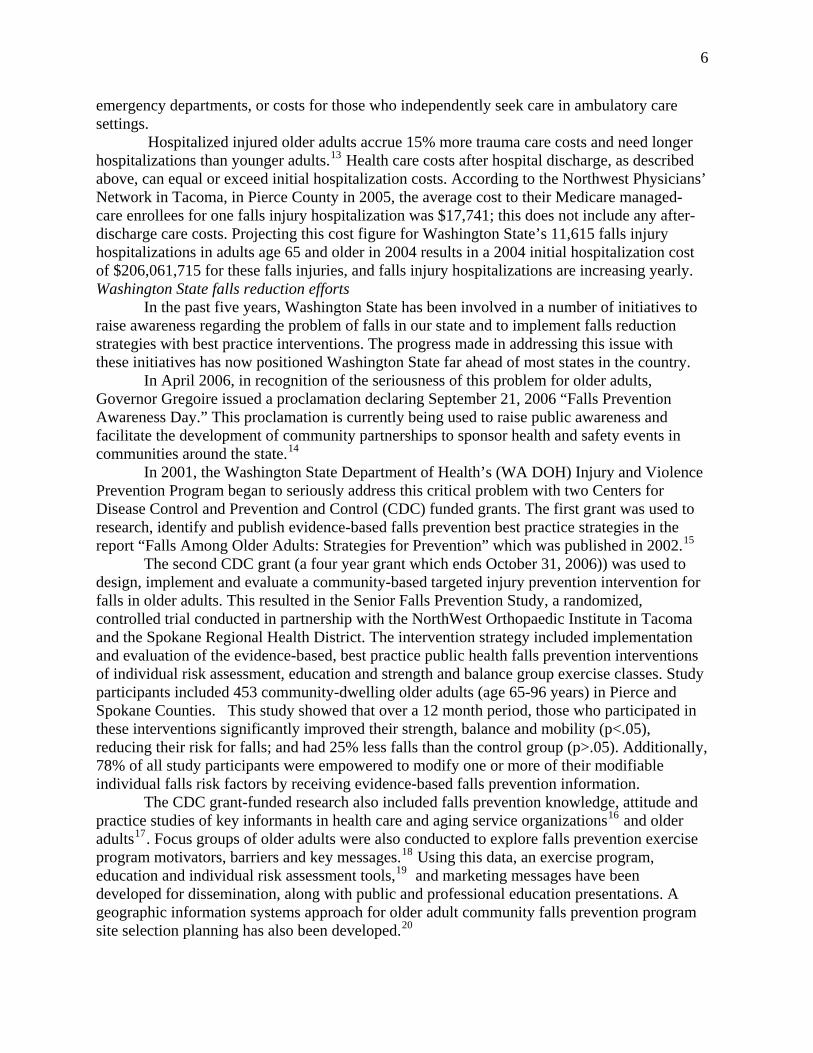
6
emergency departments, or costs for those who independently seek care in ambulatory care settings.
Hospitalized injured older adults accrue 15% more trauma care costs and need longer hospitalizations than younger adults.13 Health care costs after hospital discharge, as described above, can equal or exceed initial hospitalization costs. According to the Northwest Physicians’ Network in Tacoma, in Pierce County in 2005, the average cost to their Medicare managed-care enrollees for one falls injury hospitalization was $17,741; this does not include any after-discharge care costs. Projecting this cost figure for Washington State’s 11,615 falls injury hospitalizations in adults age 65 and older in 2004 results in a 2004 initial hospitalization cost of $206,061,715 for these falls injuries, and falls injury hospitalizations are increasing yearly.Washington State falls reduction efforts In the past five years, Washington State has been involved in a number of initiatives to raise awareness regarding the problem of falls in our state and to implement falls reduction strategies with best practice interventions. The progress made in addressing this issue with these initiatives has now positioned Washington State far ahead of most states in the country. In April 2006, in recognition of the seriousness of this problem for older adults, Governor Gregoire issued a proclamation declaring September 21, 2006 “Falls Prevention Awareness Day.” This proclamation is currently being used to raise public awareness and facilitate the development of community partnerships to sponsor health and safety events in communities around the state.14
In 2001, the Washington State Department of Health’s (WA DOH) Injury and Violence Prevention Program began to seriously address this critical problem with two Centers for Disease Control and Prevention and Control (CDC) funded grants. The first grant was used to research, identify and publish evidence-based falls prevention best practice strategies in the report “Falls Among Older Adults: Strategies for Prevention” which was published in 2002.15
The second CDC grant (a four year grant which ends October 31, 2006)) was used to design, implement and evaluate a community-based targeted injury prevention intervention for falls in older adults. This resulted in the Senior Falls Prevention Study, a randomized, controlled trial conducted in partnership with the NorthWest Orthopaedic Institute in Tacoma and the Spokane Regional Health District. The intervention strategy included implementation and evaluation of the evidence-based, best practice public health falls prevention interventions of individual risk assessment, education and strength and balance group exercise classes. Study participants included 453 community-dwelling older adults (age 65-96 years) in Pierce and Spokane Counties. This study showed that over a 12 month period, those who participated in these interventions significantly improved their strength, balance and mobility (p<.05), reducing their risk for falls; and had 25% less falls than the control group (p>.05). Additionally, 78% of all study participants were empowered to modify one or more of their modifiable individual falls risk factors by receiving evidence-based falls prevention information.
The CDC grant-funded research also included falls prevention knowledge, attitude and practice studies of key informants in health care and aging service organizations16 and older adults17. Focus groups of older adults were also conducted to explore falls prevention exercise program motivators, barriers and key messages.18 Using this data, an exercise program, education and individual risk assessment tools,19 and marketing messages have been developed for dissemination, along with public and professional education presentations. A geographic information systems approach for older adult community falls prevention program site selection planning has also been developed.20
7
Based on data obtained in the study from the collaboration of state and local organizations, implementing falls prevention best practices at the local level improves health outcomes in older adults. The WA DOH Senior Falls Prevention Study demonstrated a need for statewide infrastructures for a sustainable falls prevention plan to reduce falls injuries in the growing Washington State aging population. Proposal timing and opportunities The proposal timing seeks to extend and broaden the impact of the WA DOH Senior Falls Prevention Study to seniors throughout the state by building on the research that has been accomplished in the past five years and the resulting rapidly growing interest and momentum in this area in Washington State. This falls reduction plan reflects the next steps in implementing the lessons learned from the WA DOH Injury and Violence Prevention Program’s research and community partnerships in the area of falls prevention since 2001. In March 2006, a reorganization of the Department of Health placed the Injury Prevention Program into the Office of Emergency Medical Services (EMS)/Trauma Systems. This reorganization provides a tremendous opportunity to enhance linkages of the public health injury prevention program and the EMS/Trauma system. By statute, Washington’s trauma system continuum spans prevention, emergency medical services, acute care and rehabilitation.Falls among older adults was identified by the EMS/Trauma System Technical Advisory Committee for Injury Prevention and Public Education as one of its two main priorities, with the other being motor vehicle crashes. In addition to the tremendous opportunity that Washington State now has to integrate falls risk assessment and prevention into the EMS/Trauma system, it is clear from the work accomplished over the past four years that the path to sustainability is to integrate falls prevention best practices for falls prevention into a spectrum of existing organizational structures. In addition to the EMS/Trauma system, these primarily include:
o Area Agencies on Aging and aging services, including senior centers and meal sites o Trauma, acute, subacute, home health and ambulatory health care systems o Public health departments o Parks and recreation organizations o Residential facilities for older adults (independent and assisted living)
State level strategies now needed to reduce falls injuries in older adults Building on national and international research findings, along with the results of four years of research conducted by the WA DOH and the NorthWest Orthopaedic Institute, the Pierce and Thurston County Falls Prevention Coalitions and the Physical Therapy Association of Washington recommend and submit the following strategies: A. The development of a statewide falls prevention campaign to reach the systems and
professionals who serve older adults, and their families and caregivers. This campaign would be implemented through state and local infrastructures, and should include the following elements:
A social marketing campaign to increase public and professional awareness that in Washington State the health, safety and independence, and active aging in place of older adults is valued and supported, and that many falls in older adults can be preventedThe development and integration falls reduction strategies into the emergency medical system by exploring alternative health care transportation options, prevention, and
8
health care reimbursement strategies and options to reduce emergency room utilization for falls injuries in older adults The implementation of evidence-based best practice exercise (strength and balance) programs for community-dwelling older adults at all senior centers, senior meal sites, parks and recreation facilities, independent living facilities, and for homebound frail older adults receiving in-home care, in assisted living residential facilities, and adult group homes so that all older adults have access to this intervention The integration of falls prevention best practice education, information and resources into ongoing training programs for home care workers, senior service professionals and case managers, health care providers and allied health professionals The integration of falls prevention risk assessment screening and education into all points of contact for older adults in the health care system and senior services, and into health care electronic medical records systems
B. The development of falls prevention infrastructures at state and local levels:The state level through creating state funding for a formal joint position between the WA DOH Injury and Violence Prevention Program, (which is based in the WA DOH Health Systems Quality Assurance Division, Office of Emergency Medical and Trauma System), and the Washington State Aging and Disability Services Administration. This position is specifically needed to establish a state-level collaborative infrastructure to facilitate and support the local level infrastructures needed to create linkages for evidence-based best practice dissemination and prevention-based system changes. Linkages that need to be formally created at the state level through this joint position to contain falls-related health care costs include:
o Area Agencies on Aging* (13 are in Washington State that cover our 39 counties)
o Emergency medical and trauma systems o County public health departments o Acute, ambulatory care, home health and long term health care systems o State associations for health care providers, allied health care professionals,
pharmacists, senior centers, parks and recreation organizations, and assisted and independent living residential facilities
o Businesses and non-profit organizations that meet the needs of older adults *Washington State Area Agencies on Aging, as the community gateways for senior services, are the best positioned community agencies to coordinate aging services and system changes from the state to the local level. The local level through creating funding for Area Agencies on Aging in Washington State to convene regional or county falls prevention coalitions. Community falls prevention coalitions (as currently evidenced in Pierce and Thurston counties), adapting identified state and national strategies,21,22 have proven to be essential and successful in forming local level collaborative partnerships and for create new linkages for the dissemination of evidence-based falls prevention interventions, which include:
o Exercise (strength and balance) programs for older adults o Individual falls risk assessment o Public and professional education needed to address falls in older adults o Home safety modification programs
9
2. The Falls Reduction Plan Achieves the Commission’s Vision and Goals This falls reduction plan addresses the long term core issues needed to reduce falls injuries and realizes the vision and goals of the Blue Ribbon Commission in several ways: First, the plan provides the education to health care providers and professionals that is necessary for evaluating and managing falls risks in older adults. Unfortunately, most health care providers treat patients for injuries after a fall has occurred, instead of educating patients on how to prevent falls from taking place. All Washington consumers would benefit from improving the quality of health care by creating access to falls prevention information and resources. Second, this proposal improves the health and quality of life of Washingtonians by reducing falls-related injuries. Many older adults are aware of and concerned about balance, strength and health issues which can negatively impact their quality of life, as well as lead to falls. Many health care providers, such as physical therapists, have extensive knowledge of balance and mobility science, and interventions. However, consumers do not have adequate access to falls prevention information and these health care resources, resulting in unnecessary and preventable injuries. Third, evidence-based falls prevention interventions have shown good health outcomes in older adults. The WA DOH Injury and Violence Prevention Program’s CDC-funded research has already demonstrated the effectiveness of implementing best practices at the community level in our state. Implementation of the model WA DOH Senior Falls Prevention Study program is cost effective, patient centered, efficient and prevention oriented.
3. The Falls Reduction Plan is Modeled after National and International Strategies National efforts to reduce falls in older adults The Centers for Medicare and Medicaid Services, as part of its Healthy Aging Project, commissioned the Rand Corporation to conduct an evidence-based systematic review of interventions in the prevention of falls6. Findings from that review, published in 2002, include the following:
1. There was a clear trend that a multifactorial falls risk assessment and management program appeared to be the most effective intervention. However, falls risk assessments must be coupled with individually-tailored follow up interventions to be successful in reducing falls risks. The most commonly assessed risks in such programs were medication review, vision, environmental hazards, and orthostatic blood pressure.
2. Exercise was the next most effective intervention component. 3. The best approach to preventing falls is likely to use both a multifactorial falls risk
assessment and management program along with exercise. 4. Home assessment and modification are most useful when combined with other
strategies, and have not been demonstrated to be effective as an independent component.
5. Successful falls prevention interventions have been delivered by a variety of providers, including exercise instructors, nurses, physical therapists, social workers and teams of multiple providers.
6. Falls prevention programs, as a group, were shown to reduce the risk of experiencing a fall by 11% and a monthly rate of falling by 23%.
7. While not conclusive, the evidence suggests that falls prevention programs provided to seniors have the potential to be highly cost-effective, compared with current practice.
10
8. In the absence of new resources, it seems unlikely that much progress will be made in getting seniors to receive the benefits of falls prevention activities.
In the U.S., falls reduction plans have begun nationally and in several individual states.Because falls among the elderly are a nationwide problem, two important national initiatives have been established to address the issue. In December 2004, the National Council on Aging, in conjunction with the Home Safety Council and the Archstone Foundation, brought together 60 national experts to develop a national blueprint designed to reduce falls among the elderly in the United States (Anne Shumway-Cook, PhD, PT, University of Washington Department of Rehabilitation Medicine was an invited participant). “Falls Free: Promoting a National Falls Prevention Action Plan” was then published in March 2005.23 The action plan identifies best practices related to falls prevention, including individual risk identification and management, exercise, and home safety evaluation. The National Council on Aging will be publishing a follow-up report in 2007 to measure the success of this action plan. The National Council on Aging also created and sponsors the National Falls Free Coalition,24 which consists of more than 40 partner organizations, including the Home Safety Council, Centers for Disease Control and Prevention, Centers for Medicare & Medicaid Services, American Society on Aging, American Geriatrics Society, National Indian Council on Aging, American Physical Therapy Association, American Board of Internal Medicine, National Association of Emergency Medical Service Physicians, and the American Academy of Orthopaedic Surgeons. Several states have recently created coalitions and campaigns (California, Maine, Minnesota, New Hampshire, and Wisconsin); however, data is not yet available on their outcomes. The State of California published a “Creating a California Blueprint for Fall Prevention: Proceedings of a Statewide Conference” in February 2003. 25
Two “Keeping Seniors Safe From Falls” bills that direct the development of a national falls prevention initiative are pending in Congress, HR 5608 and S 1531 (co-sponsored by Washington’s Senator Patty Murray).26 This initiative includes public information strategies, demonstration and research projects, falls prevention services, and outcome measures relating to reducing health care costs through falls prevention. In March 2006, the Maine Legislature passed legislation “Directing the Commissioner of Health and Human Services to Develop Strategies To Keep Senior Citizens Safe from Falls” which specifically funds the creation of a statewide coalition, a statewide demonstration project, intervention approaches and programs that encourage partnerships. This successful legislation was modeled after the federal “Keeping Seniors Safe From Falls” House and Senate legislative bills. In October 2005, recognizing the impact of falls on health care costs and quality of life in seniors, the Centers for Disease Control and Prevention (CDC) and Centers for Medicare and Medicaid Services (CMS) implemented a new medical billing (ICD10) code, V15.88 History of Fall. The new falls “V” code is to be used to identify patients at risk or with a history of falls, and justify a provider’s decision to order referrals and interventions. Institution of the new fall code is serving to heighten awareness among health care practitioners and increase services related to falls prevention, as well as providing a mechanism for falls health care cost data collection.
11
International efforts to reduce falls in older adults A recent review of population-based falls prevention intervention studies published in 2006 by the Cochrane Collaborative,27 an internationally recognized public health evaluation group, found that four countries (Australia, Norway, Denmark and Sweden) have begun to show a significant decreases or downward trends ranging from 6 to 33% in injury or fracture hospitalizations, and injury-related mortality rates in older adults. These results are being achieved by implementing policy-level changes in the area of health promotion and public health that include engaging local community agencies and services, direct service delivery, media advocacy, and public and professional education. These findings “support the preliminary claim that the population-based approach to the prevention of fall-related injury is effective and can form the basis of public health practice.”28 Other countries that are now addressing falls include Canada, Hong Kong, Japan, New Zealand, Singapore, South Africa,Taiwan, and the United Kingdom.29
4. Falls Reduction Plan Costs and Savings This plan would require an initial investment of at least several hundred thousand dollars to effect the sustainable longterm changes needed in our health care and aging service systems. It is estimated that many of these changes could be accomplished in three to five years if initial funding is aggressive. One percent of the current yearly cost of $200 million for falls injury hospitalizations in Washington State could lead to a decrease in 10% of these health care costs for injured older adults if this plan is implemented and supported. Plan costs would then decrease over time as system changes and interventions become embedded and integrated into health care and aging services at state, local and systems levels. Falls prevention interventions have been found to reduce falls, which correlate to health care cost savings. If all older adults in Washington State had access to best practice falls prevention interventions, information and resources, health care costs could be contained and reduced over time, and the quality of health care for older adults would improve. Falls among older adults is one area of prevention in which “an ounce of prevention is worth a pound of cure” with an investment in prevention funding. The savings to the emergency medical services and the health care system that will be realized have the potential to grow exponentially in the future as our aging population increases in size. While CDC funding to the WA DOH has accomplished much of the needed research regarding implementing and evaluating evidence-based falls prevention strategies and created community partnerships in a small number of counties, a statewide Falls Reduction Plan requires state funding to achieve the longterm sustainable goals of reducing falls injuries by increasing access to prevention best practices to contain health costs. The WA State Legislature has approved similar funding in the past. As an example, in 2001, Senate Bill 5898 was approved for $136,000 per biennium for a comprehensive campaign to alert parents to dangerous recalled juvenile consumer products. The Falls Reduction Plan funding would specifically need to provide for:
A staff coordinator (1.0 FTE) in a joint position Washington State Department of Health Injury and Violence Prevention Program and theAging and Disability Services Administration to establish a state-level falls reduction infrastructure A staff coordinator (0.5 FTE) at each of the 13 Washington State Area Agencies on Aging to create regional and county-level infrastructures for implementation of the Falls Reduction Plan and coalition building
12
A social marketing campaign Increasing access for all older adults to best practice (strength and balance) exercise and education at the local level in senior centers, meal sites, and parks and recreation sites, assisted and independent living facilities, and for homebound older adults Professional education initiatives for health care providers, allied health care professionals, case managers, home care workers, and aging service professionals Identifying, developing and evaluating effective prevention, response, alternative transportation, and case management strategies in the emergency medical system Improving emergency medical and health care data collection systems to monitor and evaluate falls injury-related health care and outcomes Identifying strategies to integrate falls risk assessment tools into health care electronic medical records systems
5. The Falls Reduction Plan Reflects Active Collaboration Among Key Stakeholders The coalition approach to address falls prevention is a very effective public health strategy that is now being widely used at local, state, national, international levels for building partnerships, creating needed linkages, implementing prevention strategies, identifying policy needs.30 Building coalitions supported by a formal, funded state infrastructure is effective for funding streams, such as charitable foundations, and for mobilizing community organizations to fund and support local initiatives. In Washington State, local falls prevention coalitions are now in place in Pierce and Thurston counties to address falls at the local level; King, Lewis, Mason, and Walla Walla counties are also now expressing interest in developing similar coalitions. The Pierce and Thurston County Falls Prevention Coalitions are successfully demonstrating that the strategies identified in the National Falls Free Action Plan and the California Blueprint for Fall Prevention are adaptable at the local level. Washington State Stakeholders Many state and local stakeholders are collaborating to address falls prevention in older adults, and support a Falls Reduction Plan to improve the quality of life for Washington’s older adults. They include:State level stakeholders:
WA DOH Injury and Violence Prevention Program, Office of Emergency Medical Services & Trauma System Physical Therapy Association of Washington Washington Alliance for Healthy Aging Comprehensive Health and Education Foundation Service International Employees Union 775
Local level stakeholders: Pierce County Falls Prevention Coalition
o NorthWest Orthopaedic Institute (501c3 non-profit) - lead agency o WA State Dept. of Health Injury & Violence Prevention Program – sponsor o Pierce County Aging and Long Term Care (Area Agency on Aging) o Franciscan Health System o MultiCare Health System o Gentiva Health Services o Good Samaritan Community Healthcare
13
o Northwest Physicians Network o Tacoma Trauma Trust o Tacoma Fire Department o Gig Harbor Fire Department o Tacoma-Pierce County Health Department o Lifeline (personal emergency response system) o Pierce County Physical Activity & Healthy Eating Coalition o MetroParks Tacoma o Rebuilding Together South Sound
Thurston County Falls Prevention Coalition o Providence St. Peter Hospital - lead agency and sponsor o Group Health Cooperative o Providence Home Health o City of Olympia Senior Services o Lewis Mason Thurston County Area Agency on Aging o Olympia Fire Department
6. Falls Reduction Plan Implementation Obstacles The obstacles to implementing a falls reduction plan are insufficient funding, the lack of policies to create and sustain formal infrastructures and system changes at state and local levels, and therefore a lack of resources to implement effective strategies. State and local level organizations are increasingly ready and willing to address falls prevention, but are constrained by these barriers.
Conclusion Washington State has already laid the groundwork and developed much of the collaboration necessary to take the next steps to formally implement effective falls reduction strategies for older adults at the state and local levels. This work has uniquely positioned Washington far ahead of most states in this area, and is already looked to as a model by the National Association of Area Agencies on Aging.31 By taking the next steps of creating state policies and funding to reduce falls, the core related issues can be actively addressed to createsustainable systems and interventions for active, healthy, safe and independent aging. Five years from now, these steps will help contain health care costs and improve the access to and quality of health care for all Washingtonians.
14
References
1 U.S. Department of Health and Human Services. RAND report for Centers for Medicare and Medicaid Services: Healthy Aging Initiative Evidence Report and Evidence-based Interventions: Falls Prevention Interventions in the Medicare Population. 2003.
2 Washington State Department of Health, Injury and Violence Prevention Program. Datasource: Washington State Department of Health, Center for Health Statistics, Comprehensive Hospital Abstract Reporting System. (CHARS - August 2005 release).
3 Finkelstein EA, Corso PS, Miller TR. The Incidence and Economic Burden of Injuries in the United States. 2006. Oxford University Press.
4 Washington State Department of Health Publication: Falls Among Older Adults: Strategies for Prevention. 2002. http://www.doh.wa.gov/hsqa/emstrauma/injury/pubs/FallsAmongOlderAdults.pdf
5 Falls Injuries. Washington State Department of Health Injury Community Planning Group. June 8, 2006.
6 Falls and Hip Fractures Among Older Adults. National Center for Injury Prevention and Control, Centers for Disease Control and Prevention. http://www.cdc.gov/ncipc/factsheets/falls.htm
7 Population source: Washington State Office of Financial Management with Department of Social and Health Services/Department Of Health Adjustments.
8 Washington State Department of Health, Injury and Violence Prevention Program. Data source: Washington State Department of Health, Center for Health Statistics, Comprehensive Hospital Abstract Reporting System. (CHARS - August 2005 release).
9 Washington State Department of Health Publication: Falls Among Older Adults: Strategies for Prevention. 2002. http://www.doh.wa.gov/hsqa/emstrauma/injury/pubs/FallsAmongOlderAdults.pdf
10 Washington State Department of Health Publication: Falls Among Older Adults: Strategies for Prevention. 2002. http://www.doh.wa.gov/hsqa/emstrauma/injury/pubs/FallsAmongOlderAdults.pdf
11Institute of Medicine of the National Academies. Report Brief: The Future of Emergency Care in the United States Health System. June 2006.
12 Finkelstein EA, Corso PS, Miller TR. The Incidence and Economic Burden of Injuries in the United States. 2006. Oxford University Press.
13 Jacoby SF, Ackerson TH, Richmond TS. Outcome from serious injury in older adults (review). Journal of Nursing Scholarship. 2006; 38(2)133-140.
15
14 Washington State Fall Prevention Day Awareness (September 21, 2006) community events are listed at www.fallsfreewashington.org (website hosted by Providence St. Peter Hospital and the Thurston County Falls Prevention Coalition).
15 Washington State Department of Health Publication: Falls Among Older Adults: Strategies for Prevention. 2002. http://www.doh.wa.gov/hsqa/emstrauma/injury/pubs/FallsAmongOlderAdults.pdf
16Social Marketing Services, Inc. and The Gilmore Research Group. Senior Falls Knowledge, Attitude and Practice Study Key Informant Interviews. Summer – Fall 2004.
17 Social Marketing Services, Inc. and The Gilmore Research Group. Senior Falls Knowledge, Attitude and Practice Study Pierce County Senior Interviews. Winter 2004 -2005.
18Social Marketing Services, Inc. and The Gilmore Research Group. Promoting Strength and Balance Exercise Classes for Seniors: Focus Group Findings. January 2006.
19Washington State Department of Health Publication: Stay Active and Independent for Life: An Information and Resource Guide for Adults 65+. 2006. http://www.doh.wa.gov/hsqa/emstrauma/injury/pubs/SAILguide.pdf
20 Carlson CT, York SC, Primomo J. Conducting a site suitability analysis for a community-based falls prevention program for older adults with geographic information systems in Pierce County, WAhttp://apha.confex.com/apha/134am/techprogram/paper_128538.htm
21 Creating a California Blueprint for Fall Prevention: Proceedings of a Statewide Conference. February 2003. http://www.archstone.org/usr_doc/04_Conference_Proceedings1.pdf
22 Falls Free: Promoting a National Falls Prevention Action Plan: National Action Plan. National Council on Aging Aging’s Center for Healthy Aging: model health programs for healthy aging. http://www.healthyagingprograms.com/content.asp?sectionid=69&ElementID=220
23 Falls Free: Promoting a National Falls Prevention Action Plan: National Action Plan. National Council on Aging Aging’s Center for Healthy Aging: model health programs for healthy aging. http://www.healthyagingprograms.com/content.asp?sectionid=69&ElementID=220
24 National Falls Free Coalition. National Council on Aging’s Center for Healthy Aging: model health programs for healthy aging. http://www.healthyagingprograms.org/resources/Falls%20Free%20Coalition%20Description.pdf
25 Creating a California Blueprint for Fall Prevention: Proceedings of a Statewide Conference. February 2003. http://www.archstone.org/usr_doc/04_Conference_Proceedings1.pdf
16
26 Legislation. Falls Prevention Resource Page. National Council on Aging’s Center for Healthy Aging: model health programs for healthy aging. http://www.healthyagingprograms.com/content.asp?sectionid=69
27 McClure R, Turner C, Peel N, Spinks A, Eakin E, Hughes K. Population-based interventions for the prevention of fall-related injuries in older people (Review).The Cochrane Collaboration, Cochrane Library. Issue 2, 2006.
28McClure R, Turner C, Peel N, Spinks A, Eakin E, Hughes K. Population-based interventions for the prevention of fall-related injuries in older people (Review).The Cochrane Collaboration, Cochrane Library. Issue 2, 2006.
29Fall prevention center of excellence. International efforts in falls prevention. http://www.stopfalls.org/international/index.shtml
30 Developing Effective Coalitions: An Eight Step Guide. Prevention Institute Tools. http://www.preventioninstitute.org/tools.html
31 Hanson D, York S, Gross L, Beattie L, Haynes P. Evidence-Based Falls Prevention: National, State and Local Models that Work. National Association of Area Agencies on Aging 31st
Annual Conference. August 7, 2006. Chicago, IL. http://www.n4a.org/2006conf/2006_conf_intensives_mon2.cfm#M12

Tab 32
1
Getting Well by Doing Good: Single Payer as thePrescription for a Washington State's Sick HealthCare System
Prepared for Olympia Movement for Justice and Peace
By
Gar W. LipowContact: 360-943-1529815 Dundee Road NWOlympia, WA 98502
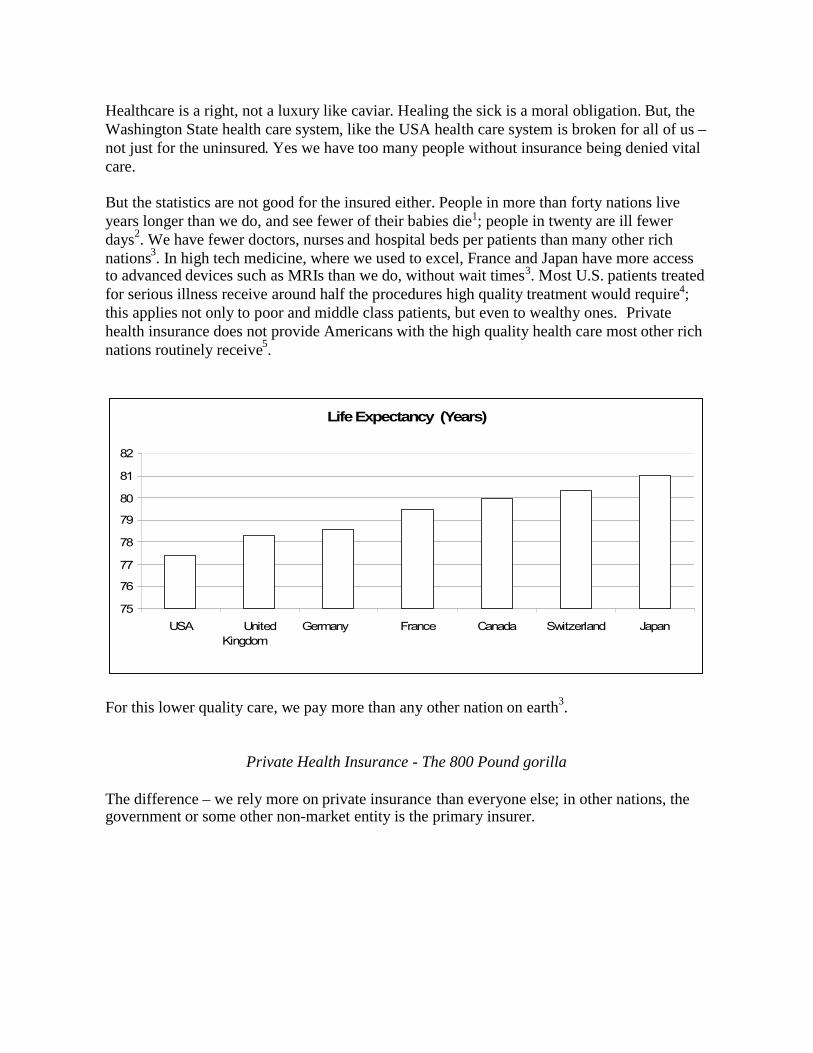
Healthcare is a right, not a luxury like caviar. Healing the sick is a moral obligation. But, theWashington State health care system, like the USA health care system is broken for all of us –not just for the uninsured. Yes we have too many people without insurance being denied vitalcare.
But the statistics are not good for the insured either. People in more than forty nations liveyears longer than we do, and see fewer of their babies die1; people in twenty are ill fewerdays2. We have fewer doctors, nurses and hospital beds per patients than many other richnations3. In high tech medicine, where we used to excel, France and Japan have more accessto advanced devices such as MRIs than we do, without wait times3. Most U.S. patients treatedfor serious illness receive around half the procedures high quality treatment would require4;this applies not only to poor and middle class patients, but even to wealthy ones. Privatehealth insurance does not provide Americans with the high quality health care most other richnations routinely receive5.
LifeExpectancy (Years)
75
76
77
78
79
80
81
82
USA UnitedKingdom
Germany France Canada Switzerland Japan
For this lower quality care, we pay more than any other nation on earth3.
Private Health Insurance - The 800 Pound gorilla
The difference – we rely more on private insurance than everyone else; in other nations, thegovernment or some other non-market entity is the primary insurer.
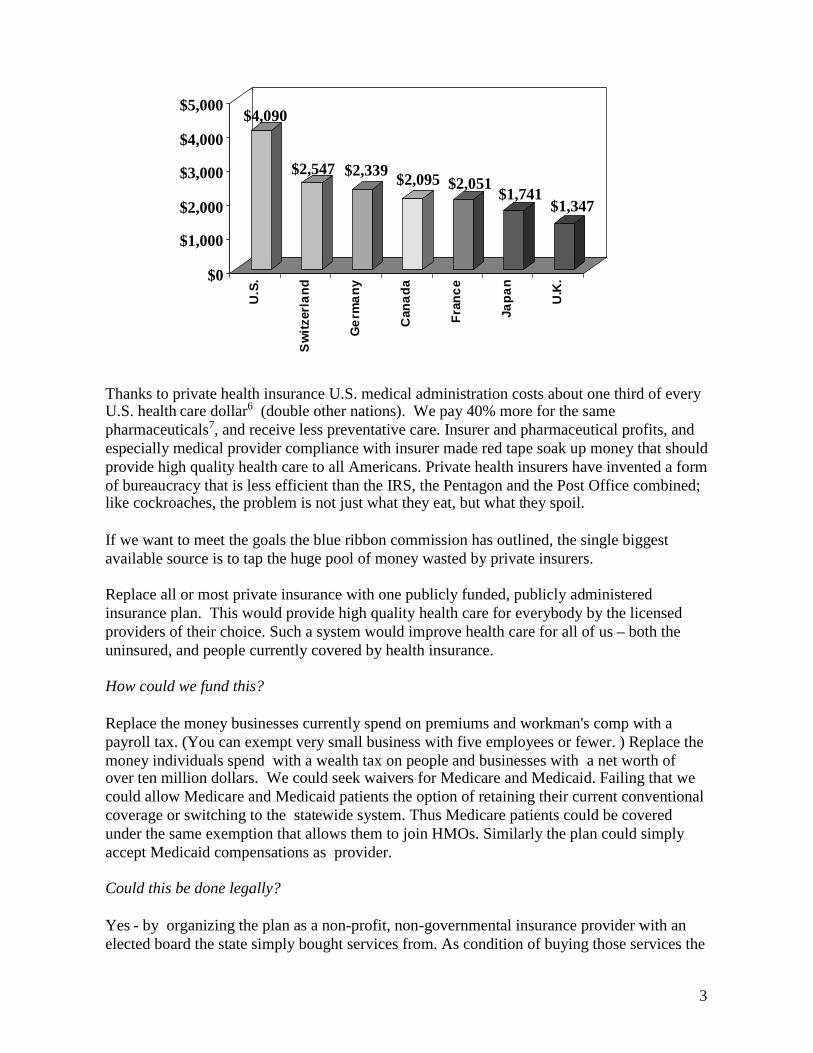
3
$4,090
$2,547 $2,339 $2,095 $2,051$1,741
$1,347
$0
$1,000
$2,000
$3,000
$4,000
$5,000
U.S
.
Sw
itzer
land
Ger
man
y
Can
ada
Fran
ce
Japa
n
U.K
.
Thanks to private health insurance U.S. medical administration costs about one third of everyU.S. health care dollar6 (double other nations). We pay 40% more for the samepharmaceuticals7, and receive less preventative care. Insurer and pharmaceutical profits, andespecially medical provider compliance with insurer made red tape soak up money that shouldprovide high quality health care to all Americans. Private health insurers have invented a formof bureaucracy that is less efficient than the IRS, the Pentagon and the Post Office combined;like cockroaches, the problem is not just what they eat, but what they spoil.
If we want to meet the goals the blue ribbon commission has outlined, the single biggestavailable source is to tap the huge pool of money wasted by private insurers.
Replace all or most private insurance with one publicly funded, publicly administeredinsurance plan. This would provide high quality health care for everybody by the licensedproviders of their choice. Such a system would improve health care for all of us – both theuninsured, and people currently covered by health insurance.
How could we fund this?
Replace the money businesses currently spend on premiums and workman's comp with apayroll tax. (You can exempt very small business with five employees or fewer. ) Replace themoney individuals spend with a wealth tax on people and businesses with a net worth ofover ten million dollars. We could seek waivers for Medicare and Medicaid. Failing that wecould allow Medicare and Medicaid patients the option of retaining their current conventionalcoverage or switching to the statewide system. Thus Medicare patients could be coveredunder the same exemption that allows them to join HMOs. Similarly the plan could simplyaccept Medicaid compensations as provider.
Could this be done legally?
Yes - by organizing the plan as a non-profit, non-governmental insurance provider with anelected board the state simply bought services from. As condition of buying those services the
4
state could insist on negotiating standards, not only of services provided but of compensationpaid to medical providers
What about various spending limitations?
Fortunately most of the spending limitations are laws, not constitutional provision - and thuscould be repealed by the legislature or the referendum. Politically, the way to do this would beto replace current supermajority requirements with a simply majority requirement (other thancertain bond and property tax requirements which are constitutional provisions).
What about the constitutional provisions forbidding income taxes in Washington State?
The don't apply to either wealth or payroll taxes. (If they applied to wealth taxes, then theproperty tax would be unconstitutional).
OK, so we could do it legally. What about political feasibility?
The question is whether you are interested in solving the problem or not. There are not goingto be politically easy solutions to this problem. But if there was real leadership and educationgoing on you could win support of a majority for this.
Single Payer FAQ
Q) How can private health insurance be less efficient than a program run by the <flinch>government?
A) Efficiency in markets, to the extent it exists, comes from competition. But insurers don’tprovide health care; medical practitioners do. Health insurers secure competitive advantage bypaying fewer health care costs. They do this either by insuring as few sick people as possiblein the first place, or by simply not covering the needs of their sickest customers. If it werelegal every health insurer would locate on the tenth story of a building with no elevator. Theywould only accept or renew your policy if you could walk in the door without being out ofbreath.
There are limits to how blatantly insurers can deny care. So they use subtle means. Forexample, insurers may pay low fees for certain tests needed by people with very expensiveillnesses. While a doctor with a healthy clientele may be able to accept this insurance andearn a living, a doctor who treats an illness either refuses to take it or loses money. Theinsurer is not turning down, say kidney patients. It is just that if you have a bad kidney no areanephrologist will accept that particular plan - so, given a choice, you will seek some otherinsurer. This works even if the insurer is not allowed to turn you down; they’ve provided anincentive for you to turn them down. As long as either the insurer has a choice of customers,or the customer has a choice of insurers, the single most profitable move an insurer can makeis to drive the most expensive customers to the competition. This is known as “adverseselection”.
5
Q) Why would that produce bad health care for everybody? No one in my family ischronically ill. Why do those statistics you cited earlier show that we will get poor ormediocre treatment?
A) Because health care is a system – like a car. If something goes wrong with your car itaffects everybody riding it - not just people in the back seat. If one third of the health caredollar is spent on administration that robs health care from everybody – not just the uninsured,or people with poor quality health insurance, not just people with chronic illnesses.
Q) How does denying people care drive administrative expenses up to highest rate in world?
A) There are several factors in private insurance that drive administrative costs up. Thousandsof health care plans, each with their own rules and regulations adds to the paperwork and redtape.
But more that this, a system that exists to prevent doctors and nurses from treating patients isgoing to be very expensive to administer. Medical practitioners want to cure sick people. Ittakes quite a lot of work to stop them.
That is the key reason modern health care organizations have extensive administrativestructures, and multi-million dollar CEO’s. Helping doctors and nurses care for patients is askilled and difficult job; getting in their way even more so. It is not a one-time job either;doctors and nurses over time will find ways to work around a system that tries to reduce thecare they can give – which is why a you need a highly paid CEO to constantly develop newobstacles to put in their way.
Q) Are administrative costs the only way private insurance robs health care of resources?
A) No – though they are the single largest chunk. Here are others:
Dividing pharmaceutical purchases between thousands of plans ensure they are bought retail.That is why the U.S. pays 40% more than nations who negotiate volume discounts7.
For the same reason, U.S. health information technology (HIT) lags about dozen years behindEurope8.
Since most people change insurance companies every seven years or sooner, insurers have anincentive to under-provide preventative care. There is a good chance another insurancecompany will reap many of the benefits. The uninsured mostly receive emergency care only– which further lowers preventative spending and increases costs.
Q) Aren’t our health care costs higher because we eat too many cheeseburgers? It’s the fat!
A) A recent study compared British health with U.S. health; it limited itself to white middleaged men of comparable weight. It still found that the British (who have one of the worsthealth care systems in Europe) are healthier than the U.S. Rich U.K. white males arehealthier than rich American white males, middle class white Englishmen healthier thanmiddle class white American men, and so on for working classes and the poor9. Bear in mindthat we may be fatter, but we are also younger and smoke less than other rich nations. Other
6
studies have confirmed that demographic facts do not explain the differences between us andother rich nations.
Q) Does racism play a role in the quality and cost of U.S. health care?
A) Definitely. Regardless of income non-whites receive worse medical treatment thanwhites10. This does not explain the difference though. If you take white American lifeexpectancy, and treat it as a separate country, white U.S. still ranks 20th11.
Q) What about malpractice insurance? Isn’t the problem that doctors are being suedfrivolously, and so have to pay huge premiums and order unnecessary tests to defendthemselves from false accusations? It’s all the lawyers fault!
A) Malpractice payouts and legal costs in malpractice cases combined add up to less than halfa percent of the health care dollar12. “Defensive medicine” is harder to estimate, but accordingto the Congressional Budget Office the most that could run is 2%. More to the point U.S.malpractice payouts and legal costs are not out of line with other nations; they are slightlylower than Canada. If malpractice premiums are too high it is the fault of the insurancecompanies; U.S. doctors pay higher premiums than other nations to insure against claims thatare lower. The difference again is that other countries also provide single payer malpracticeinsurance.
Q) What will it cost to switch to single payer?
A) Switching to single payer won’t cost a dime. It will save money. Right now, around 16%of the U.S. population is uninsured at any one time. Between savings in administrative costs,eliminating insurer profits, reducing pharmaceutical prices, and funding more preventativecare, switching to single payer would reduce overall costs by 25% per person. So that saves9% even after every uninsured person is covered; ideally we would use this savings toincrease quality, rather than lower prices.
Q) But you are talking about learning from foreigners. Why do you hate America? Are youFrench?
A) Taking other people’s stuff is an old U.S. tradition. Ask any American Indian. Log cabinswere invented in Sweden. Hot dogs, hamburgers, and covered wagons were German. Applepie is Egyptian. We stole the steam engine that powered our industrial revolution fromEngland when they still were trying to re-conquer us. Much of our constitution came from theIroquois.
The French health care system costs around half ours per person, and is rated by the WorldHealth Organizations as the best in the world. The French spend less than we do per personon health care, live longer, stay healthier, go to any doctor they like, and have no more waitsfor elective care than we do. It would be un-American not to adapt their methods.
Q) But won’t we end up waiting for care like they do in the failed Canadian health caresystem?

7
A) In spite of serious problems the Canadian system is not a failure; it is more successful thanours1. It is myth that huge numbers of Canadians cross the border to use U.S. medicalservices. The single most common reason for a Canadian to seek health care in the U.S. is thatthey are here on vacation or for business and get sick13. But it is also true that Canadians dohave to wait for some elective procedures – something that is not true in about half of singlepayers systems14. The difference is that Canada runs most of their system like a giant HMO –paying per doctor, per clinic or per hospital, not fee for service. The best single payer systemslike France and Japan pay per procedure, rather than using capitation systems.
8
1 U.S. Census Bureau, IDB Data Access--Spreadsheet. 2004, U.S. Census Bureau, 3/Sep/2004< http://www.census.gov/ipc/www/idbsprd.html>.<Table 010. Infant Mort Rates & Life Expat Birth, by Sex ; All Countries ; Selected Years; range 2000 - 2004 ;increment by 1>.
2 World Health Organization of the U.N., "Annex Table 4 Healthy Life Expectancy (HALE)in All Member States, Estimates for 2000," The World Health Report : 2001 : Mental Health :New Understanding, New Hope. 2001, World Health Organization of the U.N., 28/Sep/2005<http://www.who.int/entity/whr/2001/en/whr01_en.pdf>.p156.
3 Gerard F. Anderson, Peter S. Hussey, Bianca K. Frogner, and Hugh R. Waters, "HealthSpending in the United States and the Rest of the Industrialized World," Health Affairs, Vol.24, No. 4 (July/August 2005), pp. 903–914.
4 U.S. Department of Health and Human Services Agency for Healthcare Research andQuality, “2005 National Healthcare Disparities Report”, December 2005, AHRQ PublicationNo. 06-0017. <http://www.ahrq.gov/qual/nhdr05/nhdr05.pdf>
5 Cathy Schoen, Robin Osborn, Phuong Trang Huynh, Michelle Doty, Kinga Zapert, JordonPeugh, and Karen Davis, "Taking the Pulse of Health Care Systems: Experiences of Patientswith Health Problems in Six Countries," Health Affairs Web exclusive, November 3, 2005.
6Steffie Woolhandler, Terry Campbell, and David U. Himmelstein, "Costs of Health CareAdministration in the United States and Canada,". New England Journal of Medicine 349, no.8 21/Aug 2003: 768-75, Massachusetts Medical Society, 2/Oct/2005<http://content.nejm.org/cgi/content/full/349/8/768>.
7Commonwealth of Australia Office of Finance and Administration Productivity Commission,International Pharmaceutical Price Difference. Research Report. 2001. Commonwealth ofAustralia Office of Finance and Administration Productivity Commission, 6/Aug/2004<http://www.pc.gov.au/study/pbsprices/finalreport/pbsprices.pdf>.pXXII.
Colin Baker, Anna Cook, Margaret Nowak, “Would Prescription Drug Importation ReduceU.S. Drug Spending?”. Congressional Budget Office. Economic Budget Issue Brief.4/29/2004.< http://www.cbo.gov/ftpdocs/54xx/doc5406/04-29-PrescriptionDrugs.pdf>
8Gerard F. Anderson, Bianca K. Frogner, Roger A. Johns, andUwe E. Reinhardt. “Health Care Spending And Use Of Information Technology In OECDCountries”. Health Affairs. May-June 2006. Volume 25: Issue 3. pp 819-31.<http://content.healthaffairs.org/cgi/reprint/25/3/819>
9 James Banks, PhD; Michael Marmot, MD; Zoe Oldfield, MSc; James P. Smith, PhD.“Disease and Disadvantage in the United States and in England”. Journal of the AmericanMedical Association. May 3, 2006. Vol. 295. No. 17. pp 2037-45. <http://jama.ama-assn.org/cgi/content/short/295/17/2037> .
9
An earlier study evaluated differences between the U.S. and other OECD nations in generaland came to similar conclusions – demographics do not explain the differences:
Elizabeth Docteur, Hannes Suppanz and Jaejoon Woo. “The Us Health System: anAssessment and Prospective Directions for Reform”. Organisation for Economic Co-operation and Development. Economics Department. Feb 2003.<http://www.olis.oecd.org/olis/2003doc.nsf/43bb6130e5e86e5fc12569fa005d004c/a17bfa31f942be2cc1256cdb00332d3c/$FILE/JT00140050.DOC>
10 Brian D. Smedley, Adrienne Y. Stith, Alan R. Nelson Editors. Unequal Treatment:Confronting Racial and Ethic Disparities in Health Care. The following organizations of TheNational Academy of Sciences produced this report: Committee on Understanding andEliminating Racial and Ethnic Disparities in Health Care, Institute of Medicine, Board onHealth Sciences Policy. 2003.<http://www.nap.edu/catalog/10260.html?onpi_newsdoc03202002#toc >
11 Elizabeth Arias, "United States Life Tables, 2000,". National Vital Statistics Reports 51, no.3 19/Dec 2002, National Center for Health Statistics, 2/Oct/2004<http://www.cdc.gov/nchs/data/nvsr/nvsr51/nvsr51_03.pdf>.
12 Marc A. Rodwin, Hak J. Chang and Jeffrey Clausen. “Malpractice Premiums AndPhysicians’ Income: Perceptions Of A Crisis Conflict With Empirical Evidence”.
13 Steven J Katz, Karen Cardiff, Marina Pascali, Morris L Barer, and Robert G EvansPhantoms in the snow: Canadians' use of health care services in the United StatesHealth Affairs, May/June 2002; 21(3): 19-31. <http://content.healthaffairs.org/cgi/reprint/21/3/19.pdf>
14 Luigi Siciliani, Jeremy Hurst. “Explaining Waiting Times Variations for ElectiveSurgery across OECD Countries”. OECD Health Working Papers. Directorate forEmployment, Labour and Social Affairs - Employment, Labour and Social AffairsCommittee. Oct. 2003. <http://www.oecd.org/dataoecd/31/10/17256025.pdf>
10
More Information on Single Payer
Physicians for National Health Care Program(http://www.pnhp.org/ 312-782-6006 [email protected] [email protected])
Health Care for All Washington(http://www.healthcareforallwa.org/ [email protected])
Olympia Movement for Justice and Peace(http://www.omjp.org 360-867-6513 [email protected])
Washington State Citizen Action(http://www.wacitizenaction.org/ [email protected] )

Tab 33
Doula Services for Low-Income Women An Open Arms Perinatal Services Proposal
In 2004 a total of 81,404 births in Washington State were recorded. The associated healthcare costs are tremendous. Of these births at least 11% are in families with incomes that fall below the poverty line. In addition to being least able to afford the high costs of perinatal healthcare, these families are also challenged by a variety of much higher risk factors than normal. These families are also the ones who receive the least support in our society, and instead often face the most discrimination and have the least access to health services.
If we do not support poor and minority women during their birth experiences, we send a message that they are not worthy of support, that their babies are not as important. There are good reasons to empower the next generation’s mothers. These mothers will raise their children in confidence and power, advocating for their children’s education and health needs, in a world that seems to increasingly deny them this. Strong women grow healthy children. That’s what every community needs.
This proposal presents information and options for low-income women to have access to quality, culturally appropriate perinatal care through doula services. The benefits of doula services are well documented and include several short- and long-term benefits in regard to overall improvements in the health of the mothers and babies; increased familial bonding and reduced abuse and neglect; improved school readiness of the children; reductions in health disparities and discrimination within the health service community; and dramatically reduced health care costs.
Open Arms Organizational HistoryOpen Arms Perinatal Services is a community-based nonprofit organization that has been dedicated to providing doula services to low income pregnant women and their infants since 1997. Doulas are women who are trained, experienced, and certified to provide caring support to women before, during, and immediately after birth. They provide emotional and physical support; information and educational materials; and support the decision-making and self-advocacy of the women they serve. Doulas are committed to helping women have satisfying birthing experiences. The mission of Open Arms is to provide services that support, educate, respect, honor and empower women in need and their families throughout the childbearing year.Open Arms fulfills an essential role in Washington by working to match low-income women with a doula appropriate to their particular circumstances, considering their social, cultural, and economic circumstances. By matching low-income women in need of birthing assistance with appropriate doulas, Open Arms is able to provide services to women that give them a safe and nurturing environment that also respects the diversity of their background and life experience, and enables and empowers them during the childbearing experience. The doulas that we provide are bilingual and bicultural. Community-based doulas take a culturally sensitive approach childbirth, infant development, and family support. As a provider of doula services to several counties in Washington, Open Arms has developed strong collaborations with service professionals, local health and social service organizations, community residents, and health care providers. Of our current clients, at least 40% speak a first language that is not English. We provide bilingual and bicultural doulas when possible, and women trained in cultural sensitivity and communication at all times. We actively recruit low income women and minorities, educate new doulas and provide professional development, and advocate for better healthcare for mothers and babies.
Open Arms has a twelve-year history of working effectively with the state to provide perinatal services to low-income women. During our first three years we operated as a program of the Pacific Association for Labor Support (PALS) before becoming an independent nonprofit organization in 1997.
In 2004, federal funding for doula services was cut, dramatically impacting our ability to serve low-income women. Because of these funding cuts, we have been operating on a volunteer basis, serving 140 women annually. However, the need for perinatal services among low-income women is much greater.
Open Arms is now in the process of developing an expanded and diversified funding base, including individual donors, as well as corporate, foundation, and city, county, and state government support. Over the next three years we plan to increase our capacity to serve at least 1,000 women directly with doula services, and provide education and outreach to at least 4,000 women. In 2006 and 2007 we are expanding our programming to better serve our community and region, launching a new community-based Outreach Doula project, developing new doula training programs, and providing continuing education for certified doulas. Specifically this year we are expanding our doula services to provide support to three of Washington’s highest-risk minority and immigrant populations: 1. The Asian and Pacific Islander Refugee and Immigrant Doula Service. We are collaborating
with International Community Health Services to provide doulas to low-income Asian/Pacific Islander immigrant and refugee women. This outreach is unprecedented, while doula care has been available to all low-income women through Public Health, immigrant and refugees have not been specifically targeted for this service.
2. Next Generation. We are collaborating with the Children’s Health Society of Washington to serve Latina teens by providing outreach to the Latina community, and recruiting more women of color into the doula apprenticeship program.
3. The Otter Women Project. We are collaborating with Indigenous Birth Workers Network and the South Puget Intertribal Planning Agency (SPIPA) to provide perinatal outreach and education to Native American women of childbearing age, and will provide a community assessment of the need for perinatal services for the tribes of southwest Washington.
The Need for Perinatal ServicesMany low-income women do not have adequate access to healthcare, and their corresponding risks are higher than the median population. Insuring good healthcare for women during and after pregnancy includes education and nutrition, well baby checks, vision screenings, monitoring for mood disorders, and more.
Many new parents are also unaware of what constitutes normal newborn growth and development, and normal postpartum recovery for the mother. The physical or mental health of the new mother or baby can be compromised, and the parents need more help at home than they had expected. At least one in 10 new mothers experiences various degrees of postpartum depression, but low-income and minority women are at higher risk of depression prior to birth or post-partum depression after birth. A study conducted by Chicago Health Connection revealed that fully one-half of the at-risk young and low-income women participating in the program displayed significant symptoms of depression.
The Need for Minority, Immigrant, and Refugee Perinatal Services Immigrant and refugee women often face greater challenges because they’re in a strange land, with strange customs and unfamiliar environments, and possibly don’t even understand the language. Immigrant needs have been obscured because of aggregated data that lumps new immigrants in with others in the same racial group. According to Children’s Home Society of Washington, Seattle and King County have higher concentrations of minority and immigrant families compared to other areas of Washington, and more immigrants fall within poverty risk factors and poor health outcomes. A significant majority of these immigrants are Asian/Pacific Islander, one of the largest and fastest growing minority groups.
The Need for Teen Perinatal Services The risks for teens of minority or recent immigrant backgrounds are even worse. Teen pregnancy is one of the biggest challenges facing youth today. In addition to the challenge of birthing and raising a child, teen mothers also face severe challenges in completing their education, are at higher risk of severe health problems, and are much more likely to be reduced or confined to poverty, to name just a few of the associated challenges. One of the populations at highest risk is Latina teens. Latina teens have one of the highest rates of teen pregnancy at 34.2%. Compounding the problem, teen mothers in King County are significantly more likely to receive late or no prenatal care, smoke, and be anemic during their pregnancy. One third of mothers in King County, ages 15 to 17, receive inadequate prenatal care, and young mothers are significantly more likely than their older counterparts to have pre-term deliveries and low birth-weight babies.
The Need for Regional and Native American Perinatal Services One of the most marginalized populations of women of child-bearing age is women living in Native American communities scattered across southwest Washington, including the counties of Grays Harbor, Lewis, Mason, Thurston, Pacific, Kitsap, Pierce, Wahkiakum, and Cowlitz. Tribal community members living in or near southwest Washington reservation boundaries are marginalized from larger communities and cities due to geographic isolation, and due to negative social, ethnic, and economic perceptions of their culture, traditions, and worldviews. Most of these women are economically disadvantaged. In 2005 SPIPA, in collaboration with the U.S. Department of Health and Human Services, conducted an assessment of women’s health services in southwestern Washington tribal communities. The assessment revealed that there is no prenatal, delivery, or postpartum care for these communities. It is clear that perinatal services and culturally competent healthcare for low-income women, minorities, immigrants, and regionally isolated and marginalized populations are desperately needed.
The Role of the DoulaThe emotional, social, economic, and cultural experiences that all women bring to the birth setting influence the way in which they will labor and birth their children. Certified doulas are trained to serve women who have cultural backgrounds different from their own, are experiencing perinatal mood disorders or drug-impacted pregnancies, or have prior life experiences which may significantly impact the ways in which they birth their child.
Doula support is intended to fill the gaps left in our customary perinatal practices, which usually include only medical procedures, occasional checkups, and the purchase of baby-related paraphernalia. Doulas provide the education, quiet support, and guidance of traditional perinatal support that our society is missing.
This support can include a wide range of issues. For example, doulas are trained in postpartum adjustment, newborn characteristics, care, feeding, and development, and the promotion of parent-infant bonding. They are experienced in supporting families through their postpartum experience. During the fourth trimester following birth, the doula’s role is to provide education, nonjudgmental support, and companionship, and to assist with newborn care and family adjustment, meal preparation and light household tasks. Doulas offer evidence-based information on infant feeding, emotional and physical recovery from childbirth, infant soothing and coping skills for new parents, and can make appropriate referrals when necessary.
Doulas are trained to recognize signs of depression, and will make referrals to appropriate clinicians or support groups as needed. Unlike therapists or psychiatrists, doulas do not treat postpartum depression. However, they will help by creating a safe place for the mother emotionally. The doula will provide a cushioning effect by accepting the mother within each stage that she passes through. They relieve some of
the pressure on the new mother by helping her move into her new responsibilities gradually. By mothering the mother, doulas make sure that the mother feels nurtured and cared for.
Doulas also make sure the mother is fed, well hydrated, and comfortable. Doulas make sure mothers follow their care provider's instructions regarding diet and the management of any complicating factors such as diabetes.
There are two types of doulas that Open Arms provides to low-income women: birth doulas or outreach doulas.
Birth doulas Birth doulas are trained to focus on the immediate needs of pregnant women just prior to, during, and after birth. Their services are limited to two prenatal visits with the mother, being present and working with the mother during labor and delivery, and two postpartum visits.
Outreach doulas Outreach doulas are outreach workers who have doula training. Outreach doulas work with birthing mothers for a longer period of time, from as early in the pregnancy as possible to up to six months after delivery, and in some cases longer. Outreach doulas receive an additional 48 hours of in-class training beyond that of birth doulas, and the out-of-class training for outreach doulas is double that of birth doulas.
Outreach doulas are recommended in cases of higher risk when extended services are required; cases where cultural or language barriers are more prevalent; and cases where women are more isolated or marginalized due to geographic isolation, or due to negative social, ethnic, and economic perceptions of their culture, traditions, and worldviews.
Open Arms is working with Chicago Health Connection to educate and train our outreach doulas. We are modeling our outreach doula program on the Chicago Health Connection’s community-based doula model, which establishes a culturally sensitive approach to pregnancy, childbirth, infant development, and family support.
A compete description of the Chicago Health Connection model of community-based outreach doulas is provided in answer to question 3 on page 8 in this proposal.
How Open Arms Can Help the Blue Ribbon Commission Realize Its Vision and Goals1. What do you propose be done to realize the vision and goals for Washington State established
by the Blue Ribbon Commission on Health Care Costs and Access? Briefly summarize your proposal.
In 2004 a total of 81,404 births in Washington State were recorded.1 The associated healthcare costs are tremendous. Of these births at least 11% are in families with incomes that fall below the poverty line. In addition to being least able to afford the high costs of perinatal healthcare, these families are also challenged by a variety of much higher risk factors than normal. These families are also the ones who receive the least support in our society, and instead often face the most discrimination and have the least access to health services. Open Arms Perinatal Services addresses the needs of low-income pregnant women in disadvantaged communities. By matching low-income, minority, and immigrant women with appropriate doulas, Open Arms provides services to women that give them a safe and nurturing environment that respects their diversity, background, and life experience, and enables and empowers them during the childbearing experience. Certified doulas are trained to serve women who have different cultural backgrounds, are experiencing perinatal mood disorders or drug-impacted pregnancies, or have prior life experiences which may significantly impact the ways in which they birth their child. Our doula
1 http://www.doh.wa.gov/ehsphl/chs/chs-data/birth/2004/2004c6.htm

services are founded on strong partnerships that include service professionals, local health and social service organizations, community residents, and health care providers.
Our goals are to: Provide women with access to quality, culturally appropriate perinatal care. Significantly reduce the costs of perinatal health care due to lowered intervention rates. Expand and deepen current doula services to all low-income women who need these services. Reduce infant mortality rates for Native, Latina, and African American women. Encourage stronger, healthier families through increased mother-child bonding. Provide the opportunity for more women to initiate breastfeeding. Provide mothers with satisfying birth experiences.
Currently Open Arms services are limited to low-income women in King County and a few surrounding counties. We have already developed short-term goals during 2006 and 2007 of expanding our services for low-income women. We are also targeting three of the highest-risk, highest-need minority and immigrant communities through three focused programs: The Asian and Pacific Islander Refugee and Immigrant Doula Service, Next Generation., and the Otter Women Project.
Our current activities provide a perfect “test-case” opportunity for the Blue Ribbon Commission and the State of Washington to support and evaluate Open Arms programs and our ability to help meet the commission’s vision and goals. Our proposal to the Blue Ribbon Commission is to work with us in supporting our current services; and over the course of the five-year timeline proposed by the commission to bring our services to other high risk communities, and eventually to all low-income women throughout Washington State.
Measurable objectives The Otter Women Project will:
Reach 4,000 women in 2007 with education and outreach materials on perinatal support and doula care. Research and document chronic conditions in perinatal issues within these communities. The tribes will have access to culturally relevant doula services.
The Next Generation program will: Provide doula care to Latina and African American teens. Strengthen mother-infant bonding and delay subsequent pregnancies for teens. Educate teens about their choices during and after birth.
The Asian and Pacific Islander Refugee and Immigrant Doula Service will: Provide culturally appropriate doula care for Asian American and Pacific Islander refugee and immigrant women. Recruit and train Asian American and Pacific Islander refugee and immigrant women to become doulas.Educate new mothers about their choices during and after birth.
Program impacts The impacts that Open Arms programs will have for low-income women include:
Removing barriers to service. Doulas serve as cultural navigators, functioning as culturally competent links from the community to the health system. Perinatal care information is provided to women from within their communities through their natural social and communal networks. Information is provided through methods that are relevant to the women’s cultural worldview. Communities that need the support of bicultural, bilingual doulas will have access to them.
Increasing awareness and supporting the individual’s right to make active, informed choices about their healthcare. Women are educated on their choices in birth and are able to actively make their own choices. Their right to feel supported in birth, and their interest and right in having cultural traditions supported in the birth setting will be respected and affirmed. Providing education about perinatal services and birth options. Choices in birth options are offered. Information about doulas and how they assist in culturally relevant birthing is provided. Reducing repeat pregnancy rates. The number of repeat pregnancies is reduced, especially for teens who first became pregnant at an early age. Offering women professional training and a career path as a birth or outreach doula. By recruiting from and for the communities who most need doulas, we are able to provide quality, culturally appropriate perinatal care to low-income women. At the same time, we are helping to reduce the economic disparity of these women by offering a career path and professional training.
Ultimately, Open arms programs will reduce the disparities in health outcomes for the low-income women, minorities, immigrants with language barriers, and women who have been marginalized due to negative social, ethnic, and economic perceptions of their culture, traditions, and worldviews.Monitoring and evaluating success We’ll measure success by tracking the number of women served, and the quality of service. We’ll track the increase of referrals, the increase of follow up contact, and the level of quality through doula report forms and client feedback forms. We’ll also enhance and track training for doulas, and increased cultural competency by providing doulas with language and cultural backgrounds that better match our clients.
Our success in meeting our objectives can be measured by: Comparing number of women reached to the total number of women in the target audience. Providing an assessment of community needs along with concrete solutions to meet these needs. Establishing accessible doula services and support for low-income and high-risk communities. Comparing breastfeeding and qualitative evaluation of mother-infant bonding rates to general population of mothers. Tracking the number of women who chose to enter the doula training program, and who complete the program.
2. How will implementation of your proposal enhance, hinder or otherwise impact the achievement of the vision and each of the goals established by the Commission? How do you know?
The birth and outreach doula services that Open Arms provides address the vision and goals of the Commission at every level: improved access, improved health, and improved affordability. Our services are provided to low-income women, minorities, and marginalized populations that have limited access, restricted or no health insurance, and much higher rates of risk.
Doula care during the birthing period results in significantly improved health outcomes at a much lower cost than other medical interventions, such as operations or the increased use of medication. The positive impact we provide to low-income women and minorities in terms of improved health outcomes and lowered costs also provides benefits to the state of Washington by reducing the burden of high health care costs.
Improving Access Open Arms specifically serves the communities that have the greatest need and are least able to afford perinatal services and other medical care. We bring our services to low-income women and have programs that are designed to reach out to marginalized communities. Fifty-five percent of our overall client base is made up of women minority backgrounds.
In addition to our doula services for low-income women, Open Arms currently has three programs that reach out to minority populations that demonstrate both the highest need and highest risk. These programs are:
The Asian and Pacific Islander Refugee and Immigrant Doula Service. We are collaborating with International Community Health Services to provide doulas to low-income Asian/Pacific Islander immigrant and refugee women. This outreach is unprecedented; while doula care has been available to all low-income women through Public Health, immigrant and refugees have not been specifically targeted for this service. Next Generation. We are collaborating with the Children’s Home Society of Washington to serve Latina and African American teens by providing outreach to the community, and recruiting more women of color into the doula apprenticeship program. The Otter Women Project. We are collaborating with Indigenous Birth Workers Network and the South Puget Intertribal Planning Agency (SPIPA) to provide perinatal outreach and education to Native American women of childbearing age, and will provide a community assessment of the need for perinatal services for the tribes of southwest Washington.
Improving Health The benefits of doula services are recognized by the World Health Organization, the Medical Leadership Council, and others. Personalized doula services can provide the following benefits for women, babies, and their families2:
Birth outcomes can include shorter labors, fewer complications, reduced cesarean section rates, and reduced need for medication and epidurals. Mothers express greater satisfaction with their birth experience; have more positive assessments of their babies; and experience less postpartum depression. Babies have shorter hospital stays, breastfeed more easily, and experience more affectionate mothers. Subsequent pregnancies are delayed or reduced.
Additionally, doula programs benefit and serve the needs of the larger community by3:Reducing the cost of obstetrical care dramatically. Increasing family attachment and stronger mother-infant bonding, which leads to increased school-readiness and lower rates of child abuse and neglect. Decreasing health disparities and discrimination, by enabling women to serve other women from their own communities and to bridge language and cultural barriers when assisting families in meeting health needs. Supporting medical providers by bridging barriers as clients stay in care longer, show greater compliance, and have more positive outcomes. Providing an entry-level training program in health care for unskilled women who become doulas.
Improving Affordability Doulas are a very cost-effective solution in the area of perinatal services. Several studies have shown dramatically reduced costs in the use of pain medications and medical procedures such as cesarean sections, shorter hospital stays, and overall improvements in the long-term health of the mother and baby—all of which contribute to reduced medical costs.
2 Altfeld, Susan, Ph.D. The Chicago Doula Project Evaluation Final Report. 2003. (www.rwjf.org/portfolios/resources/grantsreport.jsp?filename=029806.htm&iaid=144&gsa=1#RESULTS) 3 Ibid.
In comparing births in which a birth doula was present and those in which no doula was present, DONA International4 presented findings from North American trials and a meta-analysis of all trials of continuous labor which showed that women who had a birth doula in attendance were:
26% less likely to give birth by cesarean section. 41% less likely to give birth with a vacuum extractor or forceps. 28% less likely to use any analgesia or anesthesia. 33% less likely to be dissatisfied or negatively rate their birth experience.
The potential cost savings are significant. For example, a cesarean section costs an average of $11,361 versus $5,574 for a vaginal birth. There is a savings of $5,787 for every cesarean section that does not need to be performed.
3. Is your proposal modeled after an existing policy or program within Washington or elsewhere? If so, describe the policy or program and its outcomes.
Open Arms programs and services are based on established best practices for doulas. We are working with Chicago Health Connection to educate and train our outreach doulas, and we are modeling our outreach doula program on the Chicago Health Connection’s community-based doula model, which establishes a culturally sensitive approach to pregnancy, childbirth, infant development, and family support. This model is effective because:
Outreach doulas are of the same background as the women they serve. Outreach doulas are laywomen who understand the community and culture because they are from and of the community where they provide services. They have the same racial and socioeconomic background as the women they support. They provide effective nurturing, serve as role models, act as teachers, and become liaisons to local health care systems. Outreach doulas are passionate about their work. Successful doulas share certain qualities: a commitment to helping women own their births; a capacity to form strong, trusting relationships; and an ability to listen and respond to a mother’s needs. These women are committed to giving back to their communities and strengthening the resources of other community members. Outreach doulas provide extended support and involvement with families. Outreach doulas foster relationships with families from as early in pregnancy as possible to well into the postpartum period. Both before and after childbirth, doulas offer direct support through home visits and center-based contacts. These opportunities are used to build a trusting relationship and enhance the knowledge of the mother and family about proper prenatal care, early brain development, and the critical role parents play in shaping the emotional, social, and cognitive development of their children.Outreach doulas receive thorough training. Chicago Health Connection has developed an intensive training curriculum for doulas. Their approach, based on Paulo Freire’s “empowerment education,” is similar to that used to train community health workers worldwide. The format is personal, interactive, and reinforces self-esteem and empowerment. Group discussions, role-play, presentations by speakers, and in-depth curriculum materials are all used in the training program. The model develops community partnerships. The community-based doula model relies on partnerships to promote better health. We believe that professionals cannot ignore the needs, perceptions, and strengths of communities if we are to make meaningful inroads into improving community health. We collaborate with community partners including service professionals, local health and social service organizations, financial donors, community residents, and health care providers.
4 http://www.dona.org/publications/position_paper_birth_table1.php and http://www.dona.org/publications/position_paper_birth.php#
4. Will your proposal impose costs on individuals, businesses, or government? Will these costs be time-limited or on-going? Can you estimate how much these costs will be, or suggest how such an estimate could be made? How much, if any, of these costs will be offset by corresponding savings?
Open Arms is a 501(c)3 nonprofit organization. As such our funding is received from individual donors and corporate, foundation, and local and state government grants. Our services are provided for free to low-income women; there are no costs to the clients served through our program.
Our cost for a birth doula is $675 per individual, and the cost for an outreach doula is $3,500 per individual. This is a one-time cost per person per birth.
To illustrate the potential cost versus savings benefits provided by having a birth doula present, we will provide a conservative estimate of the savings involved in cesarean section births using the statistics reported by DONA International, and using 2004 data from the Washington State Department of Health Center for Health Statistics5, which is the most recent data available. In 2004 a total of 81,404 births in Washington State were recorded. Of these births 22,166 births were primary or repeat c-section births.
In Washington State, it is estimated that 11% of the population is living in poverty, so approximately 2,438 c-section births in 2004 might have been within the Open Arms target population of low-income women. The actual number of low-income women giving birth is probably higher, but we will remain conservative in our estimate. When a birth doula is present c-section rates may drop as much as 26%, giving 634 potential births in which a c-section is not needed. A c-section costs an average of $11,361 versus $5,574 for a vaginal birth, so there is a savings of $5,787 for every cesarean section that does not need to be performed.
The cost of a birth doula attending these 634 births is $427,950. The potential savings in the reduction of c-sections is $3,668,958. The overall savings in reducing c-section rates after taking into account birth doula costs is still over $3.2 million. An investment of less than half a million dollars leads to a savings of more than three million dollars.
The potential savings in medical costs for c-section births alone is tremendous. Similar estimates and comparisons can be made for the savings gained by reducing other interventions such as using vacuum extractors or forceps, using analgesia or anesthesia, shortening the length of labor and hospital stays, and other interventions.
Cost comparisons can also be made between the use of birth doulas and outreach doulas. Although outreach doulas are more expensive than birth doulas, they still provide an overall cost savings. The service goals of outreach doulas are much more extensive and comprehensive than birth doulas, but they are focused on a smaller, higher-risk target population than birth doulas in general.
This example focused on only the 11% portion of low-income women giving birth. Clearly, if doula services were provided to women at all economic levels the cost savings statewide would be much larger.
5. How does your proposal reflect collaboration among various stakeholders? Which stakeholders have endorsed it?
Open Arms fulfills an essential service in Washington by specifically working to provide low-income women with appropriately matched certified doulas. There are, however, a number of other service organizations with missions that compliment the mission of Open Arms, and with which we collaborate with on a variety of programs. These collaborations also provide opportunities for ongoing training and education.
5 http://www.doh.wa.gov/ehsphl/chs/chs-data/birth/2004/2004c6.htm
Open Arms collaborates with: County health departments and maternal support services. These providers and clinics refer women to our hotline, and help to inform pregnant women that doula care is available to everyone. Organizations that help us to provide opportunities for ongoing doula training and education. Examples of such collaborations include:
The Pathways to Birth program, a unique apprenticeship/service-learning program that recruits and serves low income women and provides a career path, with the Pacific Association for Labor Support (PALS). Doula training and education with Chicago Health Connection. Outreach doula training with the Infant the Infant Mortality Prevention Network (IMPN). Cosponsoring the Birth Matters lecture series, an educational series addressing different aspects of birth, with the Seattle Midwifery School (SMS).
Open Arms is also part of the Community Coalition for Healthy Babies along with organizations such as the Infant Mortality Prevention Network, Children’s Home Society, and several others. The Bill & Melinda Gates Foundation on the White Center Early Learning Initiative. Openarms is participating in the Perinatal and Home-based Infant/Toddler Services Workgroup, one of 14 workgroups developing service recommendations for the goals of this initiative.
Open Arms stakeholders also include individual donors, city and county government agencies, and foundations. Past and current supporters include the Anthony Maymudes Fund, the March of Dimes, the Noel-Shoemaker Family Foundation, the Office on Women’s Health, and the United Way.
Open Arms Perinatal Services has been formally endorsed by the Seattle/King County Public Health Department, International Community Health Services, and Children’s Home Society of Washington.
The benefits of doula services are endorsed by the World Health Organization, the Medical Leadership Council, and others.
6. What are the obstacles to implementing your proposal? Who will object to it and why? How do you suggest these objections be addressed?
The greatest obstacle Open Arms faces is in educating communities and raising their awareness of the support, access, and benefits that doulas can provide to women, babies, and families. This obstacle can be overcome by continuing to work with public health nurses and clinics to have them refer their cases to Open Arms when in need of support during pregnancy.
Another obstacle is that our outreach doula program might overlap in some cases with other services that provide home visits; for example nurse/family partnerships. To avoid potential conflicts, Open Arms can provide birth doulas instead of outreach doulas. For example, the Next Generation program that we collaborate on with the Children’s Home Society of Washington already has home visitors, so they don’t need our outreach services. However, they still need birth doulas because outreach workers and public health nurses are not available to attend labor and delivery. They cannot take that much time away from their regular duties, so Open Arms provides birth doulas for the time just prior to, during, and immediately after birth rather than the extended services of an outreach doula.
Outreach doulas can have an advantage over other home visit services because they are recruited from the same community of people that they are serving, and they have a common understanding of the challenges facing the mothers. Outreach doulas also have more credibility with the mothers when they come from the same community and have the same cultural background. For example, the reason that it is crucial we provide outreach doulas in our Otter Women Project is that there is a huge need for bringing native culture back into the birth setting for the members of the tribal communities of southwestern Washington. Native American women are often very isolated, and no other service can address their needs.

Tab 34
Partners with Families & Children:Spokane
General Information:a. Partners with Families & Children: Spokane
613 South WashingtonSpokane, WA 99204509-473-4810 Phone509-473-4840 [email protected]
b. Type of entity: private non-profit tax exempt organization, Federal Tax ID Number: 68-0576560
c. Contact person:Mary Ann Murphy, Executive Director 509-473-4827 Phone 509-473-4840 FAX [email protected]
1. What do you propose be done to realize the vision and goals for Washington State established by the Blue Ribbon Commission on Health Care Costs and Access? Briefly summarize your proposal. We propose to organize the response and treatment for child victims of crime in a way that is BOTH cost-effective and efficacious in breaking the cycle of violence that can otherwise seriously compromise their development. This paper describes the experience and results in Spokane and urges the Blue Ribbon Commission to examine the work of the Washington Association of Child Advocacy Centers as a model for funding communities. From unexpected quarters, the Federal Reserve Bank of Minneapolis, Art Rolnick (Senior Vice President and Director of Research) and Rob Grunewald (Regional Economic Analyst), have articulated an innovative argument for economic development. Their analysis concluded that the millions spent annually in communities for Economic Development Councils, focused on recruiting corporations from one community to another, was a zero sum game economically---a sheer waste of money. Which led them to pose the question: what WOULD be the single best investment communities could make in their health and well-being? Their conclusion: “dollars invested in early childhooddevelopment yield extraordinary public returns.” Their advice to communities? Find your highest risk children at the youngest ages and provide whatever it takes to them and their families to interrupt the trajectory that would otherwise bring them to school unable to learn, introduce them to drugs, alcohol and violence at early ages, leading to early pregnancy, school dropout and involvement in the criminal justice system.(Grunewald &Rolnick, 2004). Admittedly, this proposal does not articulate a comprehensive solution for achieving the $17 for every $1 invested posited by the Federal Reserve Bank economists,
1
Partners with Families & Children:Spokane
but it does tell the story of one community in Washington state, how we have organized our resources to treat our most vulnerable children---those who are abused, neglected and endangered by exposure to drugs and violence----in a way that saves health care dollars and produces better results.
In 1988, this program began as a clinic of Deaconess Medical Center, focused at that time on a multidisciplinary approach to child sexual abuse. Partners is now a hospital-based children’s advocacy center, accredited through the National Children’s Alliance and is both a licensed mental health provider and licensed chemical dependency treatment agency for outpatient and intensive outpatient in Washington state. Partners has five service lines addressing all forms of child maltreatment: physical and sexual abuse, neglect, and exposure to drugs and violence. Exclusively the state child welfare agency, law enforcement and/or other medical providers make referrals to us. Social workers from Child Protective Services have been co-located in our agency for the past 18 years. For the past two years, we have a Drug Endangered Children Liaison (our employee) outstationed at Division of Children & Family Services (DCFS) Intake and since last November, a Chemical Dependency Professional performing outreach services at DCFS. We also have a Children’s Legal Advocate outstationed at the Prosecutor’s office to provide education and support to child victims of crime and their families who must testify in criminal justice proceedings.
The five service lines and number of children served in 2005 are: 1. Expert multidisciplinary diagnosis of child physical and sexual abuse and endangerment through exposure to drugs and violence (Medical exams, forensic interviews, multidisciplinary case planning).
397 children
2. Foster Care Assessment Program 28 children
3. Children’s Legal Advocacy 93 children
4. Safe Start, crisis intervention for children exposed to violence 422 children
5. Family-centered teams for comprehensive intervention with children referred for high-risk neglect from DCFS (integrating health, mental health, child welfare and chemical dependency treatment). Gender-specific behavioral health services are provided to pregnant and parenting mothers and for fathers (Dads Track).
283 children
Total children served in 2005 =1223
In the past eighteen years, we have developed this model in Spokane so it is now addressing even more high risk children as well as their family members and is sponsored by both Deaconess and Sacred Heart Medical Centers. These hospitals might compete on other service lines, but they combine their resources for this needy population because they recognize that these families will incur enormous recurring costs---not only to the health care system, but to all systems in the community. Better to treat them, giving them the family-centered care they require and forming the collaborations necessary to achieve better results. Three federal outcome studies have demonstrated program effectiveness: Starting Early Starting Smart, 1998-2003; Safe Start, 2000-2006; Drug Endangered Children, 2003-present. Partners has applied to National Registry of
2
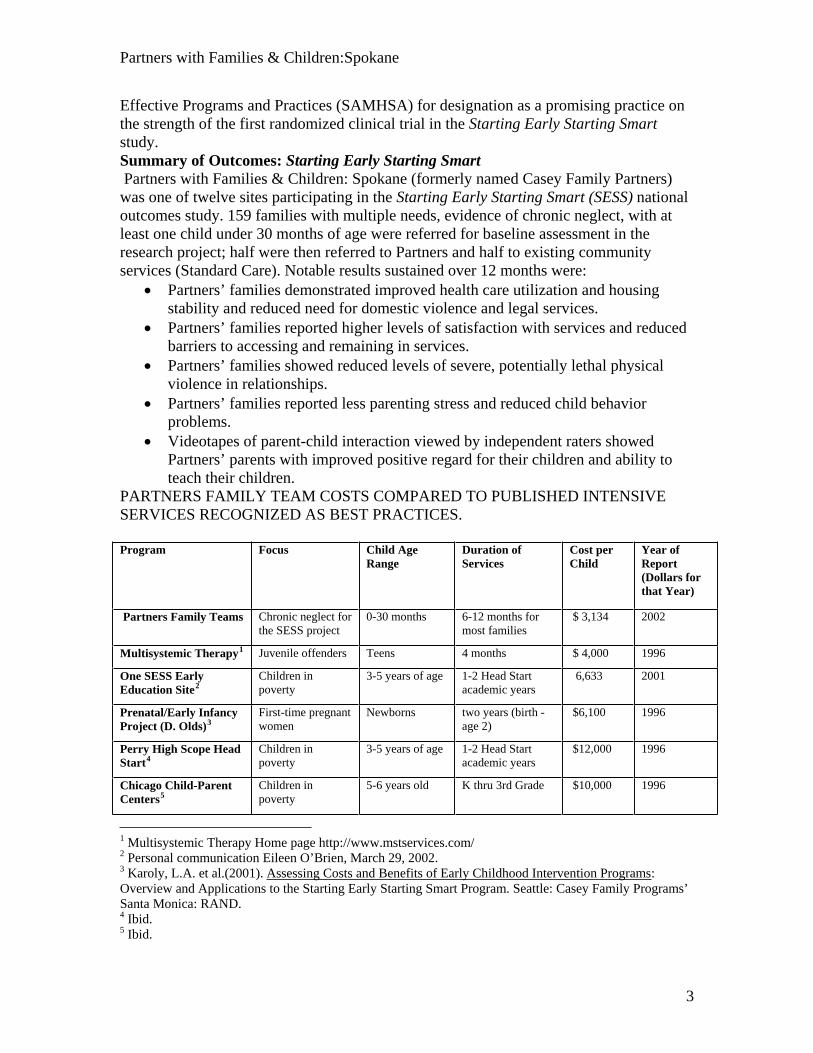
Partners with Families & Children:Spokane
Effective Programs and Practices (SAMHSA) for designation as a promising practice on the strength of the first randomized clinical trial in the Starting Early Starting Smart study.Summary of Outcomes: Starting Early Starting Smart Partners with Families & Children: Spokane (formerly named Casey Family Partners) was one of twelve sites participating in the Starting Early Starting Smart (SESS) nationaloutcomes study. 159 families with multiple needs, evidence of chronic neglect, with at least one child under 30 months of age were referred for baseline assessment in the research project; half were then referred to Partners and half to existing community services (Standard Care). Notable results sustained over 12 months were:
Partners’ families demonstrated improved health care utilization and housing stability and reduced need for domestic violence and legal services. Partners’ families reported higher levels of satisfaction with services and reduced barriers to accessing and remaining in services. Partners’ families showed reduced levels of severe, potentially lethal physical violence in relationships. Partners’ families reported less parenting stress and reduced child behavior problems. Videotapes of parent-child interaction viewed by independent raters showed Partners’ parents with improved positive regard for their children and ability to teach their children.
PARTNERS FAMILY TEAM COSTS COMPARED TO PUBLISHED INTENSIVE SERVICES RECOGNIZED AS BEST PRACTICES.
Program Focus Child AgeRange
Duration of Services
Cost per Child
Year of Report(Dollars for that Year)
Partners Family Teams Chronic neglect for the SESS project
0-30 months 6-12 months for most families
$ 3,134 2002
Multisystemic Therapy1 Juvenile offenders Teens 4 months $ 4,000 1996
One SESS Early Education Site2
Children in poverty
3-5 years of age 1-2 Head Start academic years
6,633 2001
Prenatal/Early Infancy Project (D. Olds)3
First-time pregnant women
Newborns two years (birth - age 2)
$6,100 1996
Perry High Scope Head Start4
Children in poverty
3-5 years of age 1-2 Head Start academic years
$12,000 1996
Chicago Child-Parent Centers5
Children in poverty
5-6 years old K thru 3rd Grade $10,000 1996
1 Multisystemic Therapy Home page http://www.mstservices.com/ 2 Personal communication Eileen O’Brien, March 29, 2002. 3 Karoly, L.A. et al.(2001). Assessing Costs and Benefits of Early Childhood Intervention Programs:Overview and Applications to the Starting Early Starting Smart Program. Seattle: Casey Family Programs’ Santa Monica: RAND. 4 Ibid. 5 Ibid.
3
Partners with Families & Children:Spokane
Safe Start: crisis intervention and brief treatment for young children exposed to violence, 2001-2005; WSU, fiscal agent with Partners as the lead clinical agency in collaboration with NATIVE Project and Spokane Mental Health. Spokane was one of 12 sites funded by the Department of Justice and contributed over half of the clinical data collected in the study. Final reports are in preparation (Dr. Christopher Blodgett, Principal Invesitigator, [email protected])
Drug Endangered Children (DEC): A Collaborative Community Response, 2003-present,Spokane County Sheriff’s Office, fiscal agent; Partners provides multidisciplinary facilitation, forensic interviews, medical examinations, developmental assessments, liaison to Child Protective Service sand children’s legal advocacy. Subject of a published article “Drug endangered children need a collaborative community response.” (Altshuler, S., 2005)
2. How will implementation of your proposal enhance, hinder or otherwise impact the achievement of the vision and each of the goals established by the Commission? How do you know?
This proposal affects all three goals of access, improving health and improving affordability set by the Blue Ribbon Commission. Felitti, et al, in 1998 published the Adverse Childhood Experiences (ACE) study following the health history of 17,421 adult clients of Kaiser Permanente’s Dept. of Preventive Medicine in San Diego, who voluntarily reported about 8 categories of their experiences as children: (1) recurrent physical abuse (2) recurrent severe emotional abuse (3) contact sexual abuse (4) growing up in a household with someone in prison (5) growing up with domestic violence (6) growing up in a home with a parent who abused substances or who was (7) chronically mentally ill, depressed or suicidal and (8) the loss of at least one biological parent during childhood regardless of cause. Felitti’s study then tracks the health consequences and costs throughout life, for example, “Persons who had experienced four or more categories of childhood exposure, compared to those who had experienced non, had 4-to12-fold increased health risks for alcoholism, drug abuse, depression, and suicide attempt; a 2- to 4-fold increase in smoking, poor self-related health, more than 50 sexual intercourse partners and sexually transmitted disease; and a 1.4-1.6 –fold increase in physical inactivity and severe obesity. The number of categories of adverse childhood exposures showed a graded relationship to the presence of adult diseases including ischemic heart disease, cancer, chronic lung disease, skeletal fractures, and liver disease.” (Felitti, et al, 1998, p. 245) Most children in foster care have been exposed to at least four of these categories and many foster children---and their parents---have been exposed to 5-8 categories. In the three decades since passage of the federal Child Abuse Prevention and Treatment Act (1974) a large body of literature demonstrates that child maltreatment has long-term negative impacts on children’s physical and mental health and that it may be associated with a host of other social problems including juvenile delinquency and adult criminality. The estimated costs to society from child abuse and its related sequelae are
4
Partners with Families & Children:Spokane
enormous and continue to climb. A report from the Urban Institute recently estimated that costs of government spending on child welfare activities alone were in excess of $22 billion annually and this figure does not take into account government spending on criminal justice, medical, or mental health services related to child maltreatment. (Shaidon, et al, 2006) Thus, intervention as early as possible with children at risk of these adverse exposures matches the Commission’s goals of: 1) Improving access to health care coverage, in this case, health care that is linked to behavioral health and social services, and that seeks justice for these child victims of crime and holds their perpetrators accountable. 2) Improving health by increased use of evidence-based care available to all children across race, gender and income levels. 3) Improving affordability: see initial cost-benefit evaluation (Shadoin, et al, 2006) described in section 4 below.
3. Is your proposal modeled after an existing policy or program within Washington or elsewhere? If so, describe the policy or program and its outcomes.
The Children’s Advocacy Center (CAC) Model nationally
Since 1985, at least 600 communities in the United States have initiated investigation and treatment programs based on the Children’s Advocacy Center (CAC model) developed in Huntsville, AL.
The Children's Advocacy Center (CAC) model is a child-focused, facility-based program in which representatives from many disciplines -- law enforcement, child protection, prosecution, mental health, medical and victim advocacy - work together, conducting joint forensic interviews and making team decisions about the investigation, treatment, management and prosecution of child abuse cases. CACs are community-based programs designed to meet the unique needs of a community, so no two CACs look exactly alike. They share a core philosophy that child abuse is a multifaceted community problem and no single agency, individual or discipline has the necessary knowledge, skills or resources to serve the needs of all children and their families. They also share a belief that the combined wisdom and professional knowledge of professionals of different disciplines will result in a more complete understanding of case issues and the most effective, child and family-focused system response.
The primary goal of all CACs is to ensure that children are not further victimized by the intervention systems designed to protect them. Program objectives include:
Developing a comprehensive multidisciplinary, developmentally and culturally appropriate response to child abuse which is designed to meet the needs of children and their families in a specific community;
5
Partners with Families & Children:Spokane
Establishing a neutral, child friendly facility where interviews and/or services for abused children can be provided;Preventing trauma to the child caused by multiple, duplicative contacts with different professionals;Providing needed mental health treatment and other services to children and families; Maintaining open communication, information sharing and case coordination among community professionals and agencies involved in child protection efforts so that case decision-making and policy development are enhanced; Coordinating and tracking investigative, prosecutorial, child protection and treatment efforts so that cases do not "fall through the cracks"; Holding more offenders accountable through improved prosecution of child abuse cases;Enhancing professional skills necessary to effectively respond to cases of child abuse through cross-disciplinary and cross-cultural training and support;Enhancing community awareness and understanding of child abuse.
The Children’s Advocacy Center (CAC) model in Washington State
The Spokane program was modeled from that developed at Children’s Hospital in San Diego, now named the David Chadwick Center for Child Protection and opened in 1988 and sought accreditation from the National Children’s Alliance in 2000.
The Washington State Association of Children’s Advocacy Centers was accredited as a state chapter of the National Children’s Alliance in 1999. The Spokane program is a member, but this proposal has not yet been submitted to the state organization for endorsement (the press of time to meet the deadline for the Blue Ribbon Commission and current staff turnover for our state association Executive Director).
Therefore, this proposal speaks only to the Spokane experience, but we would encourage the Blue Ribbon Commission to further explore how these resources are developing throughout Washington State and can contribute to the Commission’s goals.
The Washington State legislature recognized the value of this community resource and passed legislation in 2003 supporting the concept; followed in 2004 to provide some funding for the seven accredited centers in Washington state and the 5 centers seeking accreditation (see ). The purpose of this proposal is to advocate for more robust funding, given the significant benefits from these collaborative community efforts.
Benefits
Communities that have developed a Children’s Advocacy Center (CAC) experience many benefits: more immediate follow-up to child abuse reports; more efficient medical and mental health referrals; reduction in the number of child interviews;
6
Partners with Families & Children:Spokane
increased successful prosecutions; and consistent support for child victims and their families.
Professionals involved in multidisciplinary work report greater appreciation and understanding of the mission of other disciplines; better access to cross-disciplinary training, and more informed decision making. This comprehensive approach, with follow-up services provided by the CAC, ensures that children receive child-focused services in a child friendly environment - one in which the needs of children and families come first (National Children’s Advocacy Center, 2006).
The Office of Juvenile Justice and Delinquency Prevention (OJJDP) in the Department of Justice has funded a multi-year, multi-site evaluation study by The Crimes against Children Research Center (CCRC) at the University of New Hampshire. Preliminary results on more than 1,000 cases of child sexual abuse from four CACs and from comparison communities without CACs highlight the following benefits:
Coordination of investigations: Police in CAC communities were involved in 81 per cent of child protective services investigations of sexual abuse, compared to 52 per cent in other communities. Team interviews (two or more observers) were more common in CAC cases (28 per cent) than non-CAC cases (6 per cent).Medical exams: In the CAC sample, nearly half (48 per cent) of child victims received a forensic medical examination compared to less than a fourth (21 per cent) of non-CAC cases.Mental health services: Sixty percent of the CAC children received referrals for mental health services (compared to 22 percent in non-CAC communities). Of the CAC children referred, 31 per cent were counseled onsite by a therapist specializing in the treatment of child sexual abuse victims.Parents and caregivers in the CAC sample were more satisfied with the investigation than in the comparison sample. All of the CACs in the study were regarded as community leaders and experts in the area of child abuse, providing education, consultation and prevention activities in their communities.
The findings begin the process of establishing research-based support for the CAC model and suggest areas for improvement of the CAC response to children.
4. Will your proposal impose costs on individuals, businesses or government? Will these costs be time-limited or on-going? Can you estimate how much these costs will be, or suggest how such an estimate could be made? How much, if any, of these costs will be offset by corresponding savings?
In 2005, the National Children’s Advocacy Center (NCAC) in Huntsville, AL completed work on the first economic evaluation of children’s advocacy centers.(Shadoin, et al, 2006). Highlights from the findings of this first study include:
On a per-case basis, traditional joint investigations by Child Protective Services and law enforcement were 36% more expensive than CAC investigations. The average per-case cost of a CAC investigation was $2902 compared to $3949 for a non-CAC investigation, generating a savings of more than $1,000 per case.
7
Partners with Families & Children:Spokane
The total annual operations budget for CAC investigations was 45% higher than that of the total annual operations cost in the non-CAC community. However, on that budget, the CAC multidisciplinary team processed 202% of the average annual investigation caseload compared to the caseload processed in the non-CAC community.Annual investigation costs per 1,000 children were 41% lower in the CAC community than in the non-CAC community. CAC style investigations result in higher perceived public benefits (The study examines taxpayer willingness-to-pay in some detail—see http://www.nationalcac.org/professionals/research/CBA%20Executive%20Summary.pdf)
Combining these findings with those from the Felitti study on health costs through the lifespan of adverse childhood experiences, the Blue Ribbon Commission is well advised to consider the wisdom of the earliest possible treatment of child sexual and physical abuse and neglect. (Felitti, et al, 1998)
5. How does your proposal reflect collaboration among various stakeholders? Which stakeholders have endorsed it? Collaboration is the key to the success of these model community responses and the collaboration extends beyond health care disciplines. At the heart of this model is the multidisciplinary team of professionals with expertise in medicine, mental health services, child protection, law enforcement, prosecution and victim advocacy. In Spokane, this collaboration is vigorous, having developed over the past eighteen years since the establishment of the Deaconess clinic. The Washington state legislature charged each county’s prosecuting attorney with the task of convening all stakeholders to articulate a county protocol for child sexual abuse investigations. In Spokane, the protocol was developed in 2000 and updated in 2003, and represents the agreed practice for all stakeholders: Spokane County Prosecutor, Public Defenders, Child Protective Services, law enforcement, FBI, US Attorney, Washington State Attorney General, Spokane Community Sexual Assault Program at Lutheran Community Services, Spokane Victim Witness Unit, Deaconess and Sacred heart Medical centers, Department of Developmental Disabilities, school districts, Martin Luther King Family Outreach Center and Partners with Families & Children, which played a major role in facilitating the agreement. Partners also facilitates a monthly forum of supervisors from the collaborating systems (affectionately termed “Critique Group”), which functions as a vehicle for joint and cross-training in state-of-the-art techniques as well as a mechanism to trouble-shoot the inevitable difficulties that arise from this multi-system model.
6. What are the obstacles to implementing your proposal? Who will object to it and why? How do you suggest these objections be addressed?
This proposal suggests that the Blue Ribbon Commission explore the development of a statewide system of children’s advocacy centers, offering the Spokane experience as one example. The Commission is urged to further explore the Washington Association of Children’s Advocacy Centers and greatly expanding an integrated
8
Partners with Families & Children:Spokane
structure of children’s advocacy centers throughout the state to allow access for every child victim of crime. The attached posters about the experience of “Robin” graphically portray the promise of the revised model. Such a system, however, cannot be dictated and designed from Olympia and imposed on communities; each community or region has to utilize its own resources and coordinate them in ways that work locally. The county protocols developed through Prosecutor’s offices offer a good foundation. Certainly, the state’s medical centers have a stake in the provision of this care as an alternative to their emergency departments, but they are not accustomed to begin their health care planning at the local prosecutor’s office. The issue is not so much one of overcoming objections as it is finding incentives to do business differently and leadership in cross-system analysis and planning.
9
Partners with Families & Children:Spokane
Resources
Altshuler, Sandra J. (2005). Drug-endangered children need a collaborative community response. Child Welfare, LXXXIV (2), p 171-190
Felitti, V.J., Anda, R.F., Nordenberg, D., et al (1998). Relationship of childhood abuse and household dysfunction to many of the leading causes of death in adults: The Adverse Childhood Experiences (ACE) study. American Journal of Preventive Medicine, 14 (4), p 245-256
Grunewald, R., Rolnick, A. (2005). A Proposal for Achieving High Returns on Early Childhood Development. Prepared for “Building the Economic Case for Investments in Preschool,” Washington, D.C., December 3, 2004. Convened by the Committee for Economic Development, with support from The Pew Charitable Trusts and PNC Financial Services Group.
National Children’s Advocacy Center (2006). The CAC Model. Retrieved Aug. 30, 2006 from http://www.nationalcac.org/professionals/model/cac_model.html
Rolnick, A. & Grunewald, R. (n.d.) Early Childhood Development: Economic Development with a High Public Return.
Shadoin, A.L., Magnuson, S., Overman, L., Formby, J. & Shao, L. (n.d.). Executive summary: Findings from the NCAC Cost-Benefit Analysis of community responses to child maltreatment. Retrieved Aug. 2006 from
http://www.nationalcac.org/professional/research/cba%20executive%20summary.pdf
University of New Hampshire Crimes Against Children Research Center. (n.d.). Retrieved Aug 2006 from http//www.unh.edu/ccrc/multi-site_evaluation_children.html
Washington State Association of Children’s Advocacy Centers. (n.d.). Retrieved Aug 2006 from http://www.wsacac.org
10
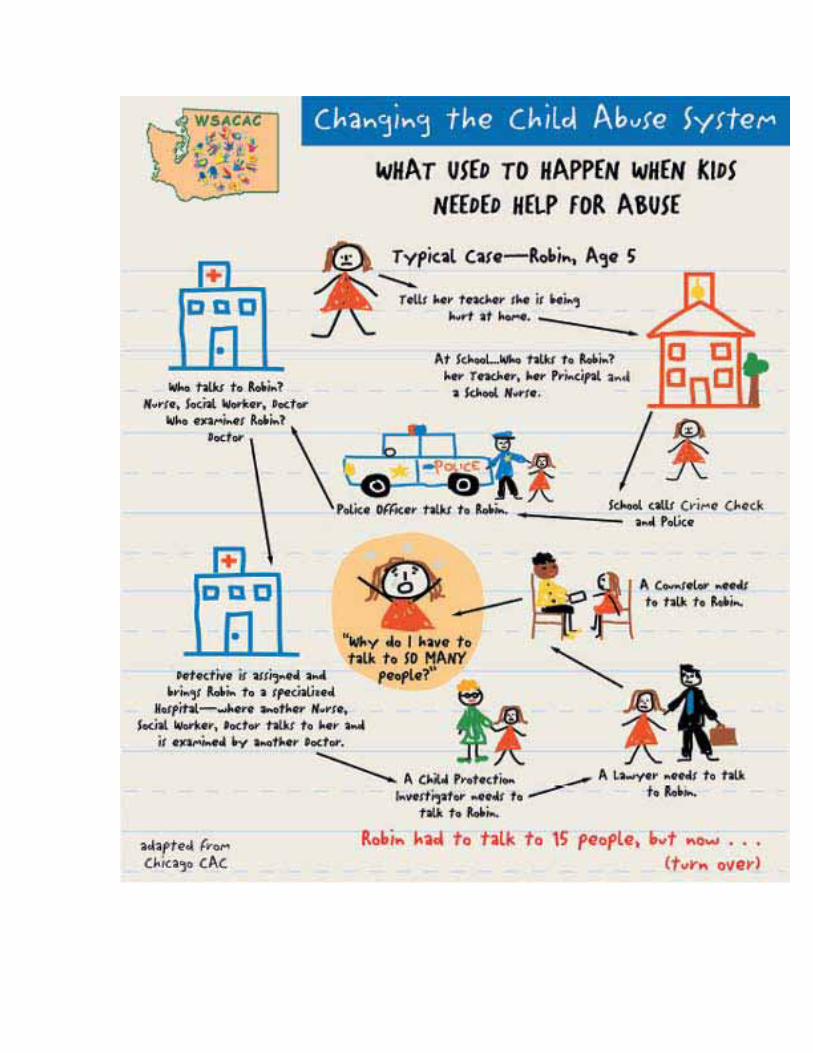
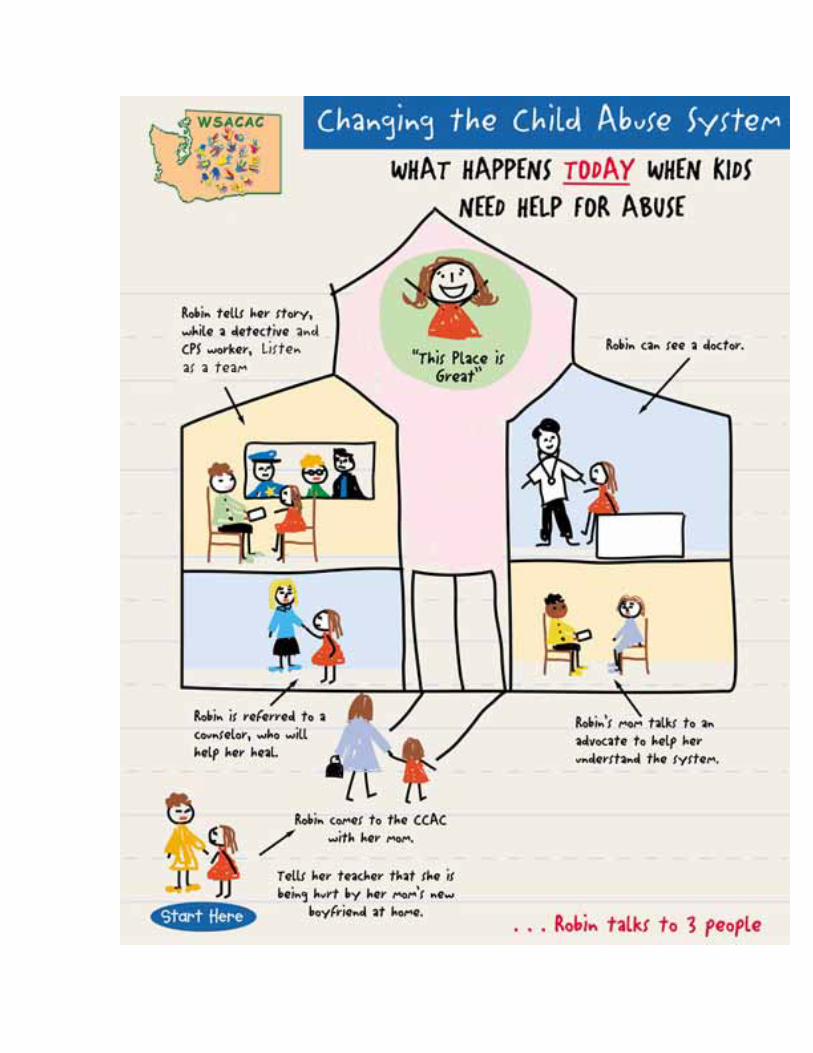


Tab 35
Blue Ribbon Commission On Health Care and Costs
August 31, 2006
Proposal for Competition
This proposal will finally bring long sought for competition into health care. The central focus for competition is between traditional primary care and a new entity established to promote health and well being. Many studies and reports clearly indicate primary care is near collapse. (See notes) The recent study comparing cost and health status of US citizens and British citizens shows in a dramatic way the disparity between the two nations. We spend substantially more and are substantially less healthy. (See note 1.)
1. What is to be done. This proposal brings into being a new entity with the primary mission being to promote health in contrast to traditional primary care mission of seeking to find something wrong and fixing it. The first step in “health’ is assessing risk of disease due to genetic factors, behavior and life style issues. This will be done by carefully designed risk assessment tools such as the “Diabetes Risk” test designed by the Finns. A ten year review of this tool proved it to be very accurate in predicting who will become diabetic. There are many others that have been developed but are seldom used.
This would be done by a new entity whose sole mission is risk assessment, counseling patients on risk reduction, and encouragement for better health. Now such counseling consists of “drop a few pounds and get more exercise.” In a world where we are constantly bombarded with enticing ads for all things good to eat and drink and “take the easy way” such simple admonishments are seldom effective. Therefore weight control and exercise will be key components that are stressed.
Such risk assessment can be done on a personal one on one level or be done for whole groups of people such as all employees and family members of a business or governmental entity or a single location of such an entity.Counseling also can be done on an individual or group level. Doing it on a group level provides opportunity for group support and encouragement.
An important function of these entities would be patient and public education. Now written material for patient understanding of disease is uneven at best. As they develop and establish associations, advocating public policy would become important
Such entities would render no therapeutic services nor would they prescribe drugs. While supervision by a physician may be necessary, much of the work
could be done by a professional “personal trainer.” These entities should not be under the control of any presently established provider of services.
Competition would be on the basis of value of the services provided. As these new entities proved they had a positive impact on the health of their customers, more individuals and employers would seek their services.
2. This proposal will help achieve many of the nine vision goals.
3. I am aware of many risk assessment tools and several wellness clinics, butam not aware of any formal linking them into a single entity that would offer services to individuals and groups.
4. Start up costs and operating costs could be minimum or substantial depending on the scope and size and the number of the entities created. I am aware that some business corporations are now investing in on site clinics for such things as wellness and diabetes. Having worked with many benefit managers, I am aware they keep up with current trends and the report of the disparity between the English and the US must have been disturbing to them as it was to me. In time, a short time I suspect, these services would become part of the benefits offered employees. These services should be eligible for payment from Health Savings Accounts. In addition there are both governmental entities and Foundations that would award grants for start up and operating costs. As such entities proved their worth, a more stable source of funding would emerge.
5. This proposal is from an individual with substantial experience in the health insurance business and more recently as a patient representative with Peace Health with hospitals in Oregon, Washington and Alaska. In a project to improve care of chronic disease of diabetes and congestive heart failure I made a number of proposals to improve care including exercise programs. These were ignored. I was told by one in a leadership position that I should not expect adoption of my suggestions as they would harm hospital revenue. I would not expect any components of the present stakeholders presently delivering services to endorse this proposal. Those who pay for the care would endorse this proposal. And as a parent and grandparent, it is important to me that my family have better care than I receive.
6. The obstacles can be overcome. Enabling legislation would be necessary. That would include licensure, accreditation, regulation and supervision as are present for other service providers. The traditional primary care and intuitional care providers would object. These objections should be addressed by telling them “you failed us.” This would further spur competition to be the best in leading patients to the best state of health possible.
Notes
1. See “Disease and Disadvantage in the US and in England.” Journal of the American Medical Association, May 24, 2006. This article reports US spends $5,274 and England spends $2,164 per capita per year on Health Care. The conclusion is that US citizens are “much less healthy than their English counterparts and these differences exist at all points of the SES distribution.”
2. See “Effective Care” from Dartmouth Atlas Project. This indicates that patients with hypertension, coronary heart disease, pneumonia and colorectal cancer received about 50 percent of the recommended care.
3. See “Insulin Resistance” from the American Heart Association, July 4, 2006.This release indicates 60 million Americans have insulin resistance and that leads to type 2 diabetes, and an increased risk of stroke and heart disease. This is largly ignored by the traditional primary care establishment.
4. See “State of Diabetes in America: A New Report Reveals America’s Diabetes Health is in Jeopardy.” May 18, 2005. American Association of Clinical Endocrinologists. This reports on the dismal state of care of diabetes in the US.
5. See “Reforming Primary Care: a Comprehensive Strategy From The American College of Physicians.” Richard Glickman-Simon, M.D. This report indicates the “collapse” of Primary Care is imminent. See also editorial in NYT on August 30, 2006 regarding the same subject.
Summary comment. I have been involved in health care since 1960. During those 46 years, I have seen costs increase and quality suffer. The exception is of course, in the development of life saving procedures when extreme conditions are present. But our overall health status has suffered. During those 46 years only one change has had any material impact and that is the introduction of the use of DRG’s for payment of hospital services. This resulted in a substantial reduction of use of in patient hospital services.Now we have patient centered care, seamless care and evidence based medicine. While these are worthwhile ideas, in my experience with Peace Health and my personal experience as a patient, they are largly ignored.
Harold M. Petersen Box 3176 Ferndale WA 98248
[email protected] 360 383 0331

Tab 36
Peter Anderson Director State Policy
September 1, 2006
Washington State Blue Ribbon Commission on Health care Costs and Access
Re: Proposals
Dear Commission Members:
The Pharmaceutical Research and Manufacturers of America (PhRMA) supports the efforts of the Blue Ribbon Commission on Health Care Costs and Access and appreciates the opportunity submit proposals regarding what to do to realize the vision and goals to develop “a sustainable five-year plan for substantially improving access to affordable health care for all Washington residents.”
PhRMA is committed to ensuring that all patients have access to affordable medicines. As such, we are submitting for your consideration three proposals. The proposals address the following: tax incentives to encourage physicians and other healthcare providers to provide treatment for the uninsured; promote reauthorization and enhance the outreach and enrollment of the State Children’s Health Insurance Program (SCHIP); and greater use of lower cost, more affordable limited healthcare benefit policies.
While we did not address the Washington Basic Health Plan in our proposals, we recognize the valuable services that it has provided for nearly 20 years. Accordingly, we would support efforts to build upon the existing program and would assist in that endeavor. PhRMA stands ready to work with the Commission in order to examine these as well as other opportunities to improve access to affordable health care for all Washington residents.
Thank you for the opportunity to submit comments to the Blue Ribbon Commission and please contact me at (916) 233-3480 if you desire additional information.
Sincerely,
Peter C. Anderson
Pharmaceutical Research and Manufacturers of America
1215 K Street, Suite 970, Sacramento, CA 95814 916-233-3480 Fax 916-233-3488 [email protected] www.phrma.org
Pharmaceutical Researchers and Manufacturers of America (PhRMA) Proposals to the Washington State Blue Ribbon Commission on Health Care Costs and Access
In order to reach the Commission’s goal of developing a system which provides every Washingtonian the ability to obtain needed health care at an affordable price, PhRMA is submitting three separate proposals: tax incentives to encourage physicians and other healthcare providers to provide treatment for the uninsured; promote reauthorization and enhance the outreach and enrollment of the State Children’s Health Insurance Program (SCHIP); and greater use of lower cost, more affordable limited healthcare benefit policies.
Proposal 1.
1. What do you propose be done to realize the vision and goals for Washington State established by the Blue Ribbon Commission on Health Care Costs and Access? Briefly summarize your proposal.
The proposal is intended to provide a business and occupation (B&O) tax credit or deduction for physicians and other healthcare providers for the cost of treatment for the uninsured. The B&O tax is imposed on the gross receipts of business activities conducted within the state, without any deduction for the costs of doing business. The tax is imposed on the gross receipts from all business activities conducted within the state.
2. How will implementation of your proposal enhance, hinder or otherwise impact the achievement of the vision and each of the goals established by the Commission? How do you know?
Access to medical care and healthcare services is directly correlated to an improvement in long-term patient health outcomes and health costs. Preventive services both postpone and/or eliminate the development of high cost conditions such as diabetes, asthma and hypertension.
Tax incentives can be important tools in assisting the uninsured by encouraging healthcare providers to provide treatment for which they otherwise would be uncompensated. It is important to support tax incentives at the state level that provide the greatest utility to uninsured consumers.
3. Is your proposal modeled after an existing policy or program within Washington or elsewhere? If so, describe the policy or program and its outcomes.
Washington is one of two states that utilize a B&O tax, and neither state currently provides a tax deduction for the treatment of the uninsured. However, generally, states with income taxes provide deductions for losses and charitable contributions such as those that may result from charitable care as characterized in this proposal.
1
4. Will your proposal impose costs on individuals, businesses or government? Will these costs be time-limited or on-going? Can you estimate how much these costs will be, or suggest how such an estimate could be made? How much, if any, of these costs will be offset by corresponding savings?
Implementation of a B&O tax credit or deduction will result in a loss of General Fund revenue to the state. However, this could be offset by a reduction in state costs of treating the uninsured in hospital emergency rooms for conditions that would have been more easily treated weeks before the emergency room visit.
5. How does your proposal reflect collaboration among various stakeholders? Which stakeholders have endorsed it?
The problem of the uninsured will not be solved in a vacuum. It will take concerted efforts and cooperation from all the stakeholders involved in the every aspect of healthcare, business and state government communities. Patient advocates will need to support this effort and convince policy makers that this will result in necessary care for individuals who otherwise would go without medical treatment.
6. What are the obstacles to implementing your proposal? Who will object to it and why? How do you suggest these objections be addressed?
Everyone involved in creating a solution and behaving in a cooperative manner. There are numerous groups that could hold up the design of such a program or limit their cooperation. Pro-tax organizations may object to the proposal or special interest groups may be concerned that this may be funded at the expense of their favorite government program.
Proposal 2.
1. What do you propose be done to realize the vision and goals for Washington State established by the Blue Ribbon Commission on Health Care Costs and Access? Briefly summarize your proposal.
Enhance the Healthy Kids Now! (Washington’s SCHIP) so that it continues to provide coverage to uninsured children of low-income working families. This can be accomplished in two ways:
The SCHIPs federal reauthorization is in 2007 and opportunities exist for the state to take a leading role in encouraging reauthorization and a higher level of funding. Partner with various state and national groups to promote enrollment in these program to ensure childhood access to care and preventive medicine.
2
2. How will implementation of your proposal enhance, hinder or otherwise impact the achievement of the vision and each of the goals established by the Commission? How do you know?
Existing programs for children’s health insurance have been utilized extensively since 1998 and have proven to be very successful at covering the uninsured. Reauthorizing the program at higher funding levels, or at least maintaining current funding levels, could be an effective tool in securing the gains on child health coverage made over the past ten years. Possible funding increases may be important to factor in the measures of healthcare inflation that have occurred since the creation of SCHIP. In addition, partnering with a state or national organization would promote children’s health overall, and would help reach the goal of outreach and enrolling those children at greatest risk of falling through the healthcare safety net.
3. Is your proposal modeled after an existing policy or program within Washington or elsewhere? If so, describe the policy or program and its outcomes.
All states are concerned with the about the reauthorization of the SCHIP program, its authorized funding level, and how to best outreach to those most at-risk in the community.
4. Will your proposal impose costs on individuals, businesses or government? Will these costs be time-limited or on-going? Can you estimate how much these costs will be, or suggest how such an estimate could be made? How much, if any, of these costs will be offset by corresponding savings?
Reauthorization of the program will result in continued federal costs, state matching costs, and successful additional enrollment will result in new costs at both levels.
5. How does your proposal reflect collaboration among various stakeholders? Which stakeholders have endorsed it?
Stakeholders involved in all aspects of both the SCHIP programs and healthcare overall will have to active in lobbying for SCHIP reauthorization. Patient and child advocates will need to support this effort at the state and national levels and convince policy makers that reauthorization of this program will result in necessary care of children who otherwise would go without medical treatment.
6. What are the obstacles to implementing your proposal? Who will object to it and why? How do you suggest these objections be addressed?
The existing federal budget deficit and competing federal programs will be obstacles to obtaining additional funding or even maintaining existing funding levels.
3
Proposal 3.
1. What do you propose be done to realize the vision and goals for Washington State established by the Blue Ribbon Commission on Health Care Costs and Access? Briefly summarize your proposal.
Maximize the use of limited benefit plans, which provide primary or preventive services, which are less costly and more affordable for lower income uninsured individuals and families.
2. How will implementation of your proposal enhance, hinder or otherwise impact the achievement of the vision and each of the goals established by the Commission? How do you know?
Access to medical care and healthcare services is directly correlated to an improvement in long-term patient health outcomes and health costs. Preventive services both postpone and/or eliminate the development of high cost conditions such as diabetes, asthma and hypertension.
In an effort to improve access to health coverage and preventive healthcare services in the low-income and uninsured populations, more affordable limited healthcare benefit policies should be promoted as long as they include adequate pharmaceutical services that demonstrate the importance of drugs in the healthcare continuum.
Limited benefit plans are designed to provide a finite set of health benefits generally focused on preventive care and some basic level of health services.Pharmaceuticals must play a key role in all acceptable limited benefit plans. Limited benefit plans should be targeted to uninsured individuals who cannot afford existing health insurance policies and should not be used in the broader population. Limited benefit plans should not be advocated as a replacement for comprehensive health insurance.
In addition, the expansion and improved access to insurance programs may help improve the overall health insurance market by expanding population risk-pools and decreasing the need for uncompensated care and cost-shifting. In the scope of overall healthcare transformation, insurance reform and new product development will serve both the uninsured and healthcare stakeholders overall.
3. Is your proposal modeled after an existing policy or program within Washington or elsewhere? If so, describe the policy or program and its outcomes.
Limited benefit plans are currently available in Washington and in some other states to varying effect.
4
4. Will your proposal impose costs on individuals, businesses or government? Will these costs be time-limited or on-going? Can you estimate how much these costs will be, or suggest how such an estimate could be made? How much, if any, of these costs will be offset by corresponding savings?
There would be a cost to individuals or families who are otherwise uninsured. However, the cost would be far less than the cost of standard, comprehensive health insurance. Both the state and counties may witness savings by limiting the number of uninsured and reducing the amount of uncompensated medical treatment.
5. How does your proposal reflect collaboration among various stakeholders? Which stakeholders have endorsed it?
Creation of an equitable and functional limited benefit policy will take considerable cooperation on the part of insurers, patient advocates, and the state insurance commission who ultimately approves of state insurance offerings. Patient advocates will need to be involved to ensure that any products are of substantive value and address the most identifiable health cost drivers.
6. What are the obstacles to implementing your proposal? Who will object to it and why? How do you suggest these objections be addressed?
Patient advocates may demand only comprehensive coverage for the uninsured. They may contend that these policies only include primary or preventive services and individuals would have to pay for necessary specialty coverage out of pocket. Limited benefit plans are not full health care coverage, could be viewed as a “band-aid” and not a long-term solution.
5

Tab 37
PNHP Western Washington Chapter 8424 California Ave SW Seattle, Washington 98136 206 9377154 [email protected]
August 28, 2006 Contact: David McLanahan, MD, PNHPWW Coordinator
PNHPWW Recommendations to the Governor’s Blue Ribbon Commission on Health Care Access and Costs
First and foremost, PNHPWW recommends and works toward a national single-payer health program as the only sustainable solution to our national health care crisis in access and costs affecting all the states. Given that implementation of such national legislation is at least 3-5 years away, we are submitting our recommendations for a single-payer plan for Washington State. We believe that such a program, apart from being of benefit to our residents, would encourage the passage of national legislation.
The task of the Commission is to recommend to Governor Gregoire and the Legislature by December 1, 2006, a sustainable five-year plan to substantially improve access to affordable health care for all Washingtonian residents. Our recommendations in response to the six questions posed by the BRC are as follows:
1. What do you propose be done to realize the vision and goals for Washington State established by the Blue Ribbon Commission on Health Care Costs and Access? Briefly summarize your proposal
Set up a single health care plan that guarantees quality health care to every resident of Washington State.
We outlined the crisis in access and costs and arguments for a single-payer system in our Statement by the Western Washington Chapter of Physicians for a National Health Program previously submitted to the BRC. In summary, single payer advances the Commission’s goals of increased access and controlling costs by:
• providing high quality, comprehensive health care to every resident of Washington State
• saving the State expenses by significantly lowering administrative costs, giving leverage to control costs of purchases such as drugs and medical devices; minimizing wasted health care dollars through enhanced public health, self-care, disease prevention, and strong primary care; identification and elimination of unnecessary care and procedures; global budgeting based on prior experience and need
2
• facilitating allocation of resources to provide more uniform care helping to eliminate gaps and disparities across all sectors of our population
• facilitating implementation of electronic medical records and providing a State data base on health service utilization and health outcomes, thereby facilitating quality control and implementation of evidence-based medicine
• fostering transparency in coverage decisions giving greater accountability to the public
• improving the outlook for Washington State business by ensuring a healthy workforce, decreasing overall average costs, thereby enhancing its comparative position in the global market.
If we had had a single-payer health insurance program in 2003, out of total health spending of about $30 billion, Washington State would have saved $5.3 billion in administrative costs according to estimates by the leading researchers in the field. That was $6,735 dollars for each of our 780,000 uninsured residents, more than enough to provide comprehensive coverage for all. (Woolhandler S, Campbell T, and Himmelstein DU. “Administrative Waste in the U.S. Health Care System in 2003: The Cost to the Nation, the States, and the District of Columbia, with State-Specific Estimates of Potential Savings”, International Journal of Health Services, 34:1, 79-86, 2004).
A. PNHPWW Recommendations for BRC study and analysis
The BRC action plan includes analyzing submitted reform proposals from stakeholders in our current system, consumer advocacy groups, and doing its own independent research. We recommend study of California Senate Bill SB 840. This single-payer legislation would provide access to quality health care for all residents of California. It has been carefully formulated with input from health policy experts, provider groups, advocacy groups, and politicians. Details of its administrative setup and accountability, mechanisms for quality improvement and control, etc, are too extensive to be detailed here but are easily available to the BRC. This discussion will focus on funding options and impacts, always the most difficult and controversial aspects of reform legislation. California SB 921, the precursor to SB 840, was critically analyzed in the Lewin Group report “The Health Care for All Californians Act: Costs and Economic Impacts Analysis,” dated 1/19/2005. This study specifically examines SB 921’s cost impact on statewide health spending, program costs and revenues, and impact on state and local government, private employer and family health spending. These evaluations would be generally applicable to Washington State.
In California, the Lewin study found that single-payer bill SB 921would cover everyone, including undocumented immigrants and the uninsured, and still reduce health spending by $8 billion in the first year. This is especially remarkable given that California has a much larger undocumented immigrant population and nearly 18.7 percent of their population uninsured, compared with 13.0 percent in Washington State (2004 data, from the Census Bureau).
3
We recommend that the BRC study SB840 and invite The Lewin Group to make a presentation to the BRC about their study and how it would apply to Washington State. This independent, highly regarded economic analysis firm has over 20 years experience studying the impact of health reform initiatives on major stakeholder groups including governments, employers, providers, and consumers. As noted in response to Question 2 below, the Lewin Group’s experience includes analyses and comparison of many different types of reform initiatives in at least 8 different states.
B. PNHPWW Recommendations for the BRC to present to the Legislature.
PNHPWW advocates that the BRC recommend to the Washington State Legislature that it formulate health care reform legislation based on California SB 840 with modifications as necessary to adapt to specific conditions in Washington State. SB 840 provides for a state Health Insurance System administered by an independent Health Insurance Agency, directed by the Health Insurance Commissioner (appointed by the Governor and confirmed by the Senate). Its intent is to establish a system of universal health insurance that covers all residents with comprehensive health insurance benefits, guarantees a single standard of care, and improves the quality of health care. Apart from establishing a carefully integrated and responsive system, the new program stabilizes and constrains the growth in health care spending by linking it to GDP growth.
On a single-payer basis, the Agency would negotiate for or set fees for health care services provided through the system and pay claims for those services from the State Health Insurance Fund established in the State Treasury. SB 840 would prohibit health care service plan contracts or health insurance policies from being issued for services covered by the state Health Insurance System.
SB 840, as passed by the full California Senate May 31, 2005, did not detail how revenues would be collected other than require the Commissioner to seek all necessary waivers, exemptions, agreements, or legislation to allow various existing federal, state, and local health care payments to be paid into the Health Insurance Fund, which would then assume responsibility for all benefits and services previously paid for with those funds. SB 840, as amended and passed by the California Assembly Appropriations Committee on August 22. 2006, would create the California Health Insurance Premium Commission to determine the cost of the California Health Insurance System and to develop a premium structure for the system that complies with the following criteria:
(1) be means-based and generate adequate income (2) to the greatest extent possible, ensure that all income earners and all employers contribute a premium amount that is affordable and that is consistent with existing funding sources for care in California. (3) maintain the current ratio for aggregate health care contributions among the traditional health care funding sources, including employers, individuals, government, and other sources. (4) provide a fair distribution of monetary savings achieved from the establishment of a
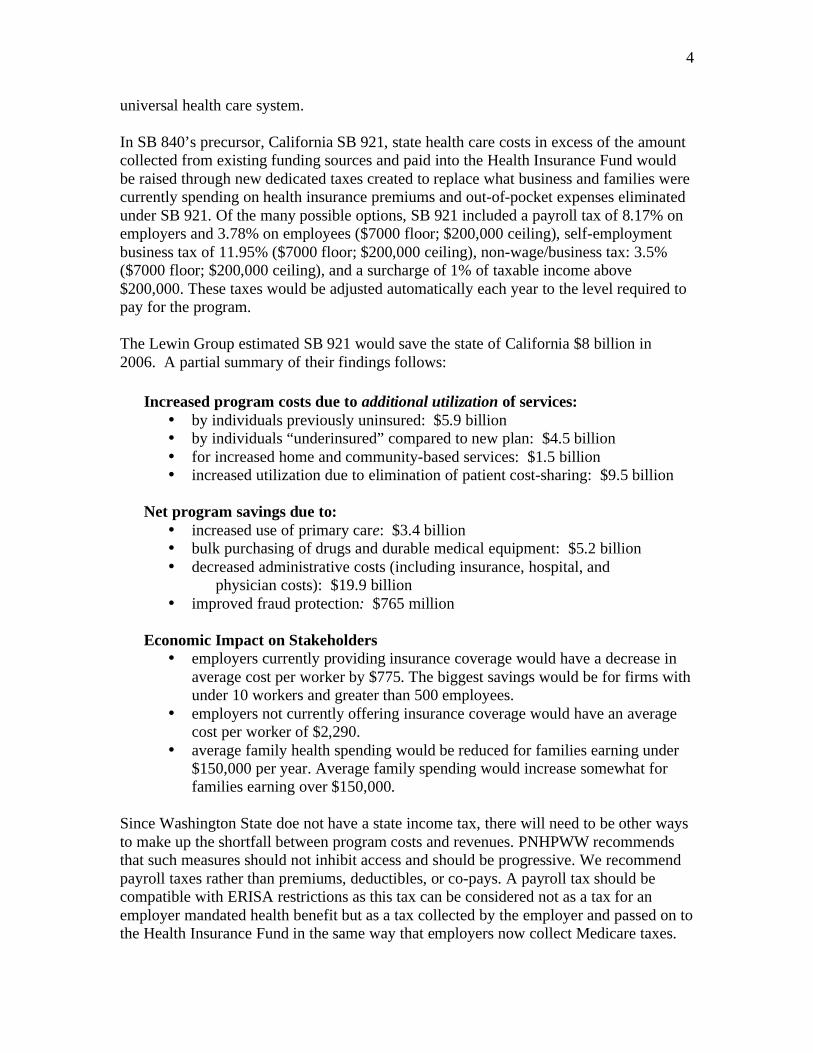
4
universal health care system.
In SB 840’s precursor, California SB 921, state health care costs in excess of the amount collected from existing funding sources and paid into the Health Insurance Fund would be raised through new dedicated taxes created to replace what business and families were currently spending on health insurance premiums and out-of-pocket expenses eliminated under SB 921. Of the many possible options, SB 921 included a payroll tax of 8.17% on employers and 3.78% on employees ($7000 floor; $200,000 ceiling), self-employment business tax of 11.95% ($7000 floor; $200,000 ceiling), non-wage/business tax: 3.5% ($7000 floor; $200,000 ceiling), and a surcharge of 1% of taxable income above $200,000. These taxes would be adjusted automatically each year to the level required to pay for the program.
The Lewin Group estimated SB 921 would save the state of California $8 billion in 2006. A partial summary of their findings follows:
Increased program costs due to additional utilization of services:• by individuals previously uninsured: $5.9 billion • by individuals “underinsured” compared to new plan: $4.5 billion • for increased home and community-based services: $1.5 billion • increased utilization due to elimination of patient cost-sharing: $9.5 billion
Net program savings due to: • increased use of primary care: $3.4 billion • bulk purchasing of drugs and durable medical equipment: $5.2 billion • decreased administrative costs (including insurance, hospital, and
physician costs): $19.9 billion • improved fraud protection: $765 million
Economic Impact on Stakeholders • employers currently providing insurance coverage would have a decrease in
average cost per worker by $775. The biggest savings would be for firms with under 10 workers and greater than 500 employees.
• employers not currently offering insurance coverage would have an average cost per worker of $2,290.
• average family health spending would be reduced for families earning under $150,000 per year. Average family spending would increase somewhat for families earning over $150,000.
Since Washington State doe not have a state income tax, there will need to be other ways to make up the shortfall between program costs and revenues. PNHPWW recommends that such measures should not inhibit access and should be progressive. We recommend payroll taxes rather than premiums, deductibles, or co-pays. A payroll tax should be compatible with ERISA restrictions as this tax can be considered not as a tax for an employer mandated health benefit but as a tax collected by the employer and passed on to the Health Insurance Fund in the same way that employers now collect Medicare taxes.
5
2. How will the implementation of your proposal enhance, hinder or otherwise impact the achievement of the vision and each of the goals established by the Commission. How do you know?
BRC Goal of Improving Access
Guaranteed insurance coverage for all residents under a single comprehensive program will insure access.
BRC Goal of Improving Health
Barriers to receiving quality care will be eliminated. Ensured access will improve disparities in health care statistics across race, gender, and income levels. A single plan will facilitate coordination of care, evidence-based medicine, electronic medical records and many other major improvements. These measures will assure that Washington State will be one of the top 10 healthiest states in the nation.
BRC Goal of Improving Affordability
By eliminating the wasted health care dollars spent on administration in our current multi-payer arrangement, introducing economies of scale and bargaining power, and resources saved by improving the health of our citizens, a single state insurance system will reverse the rate of increase in total spending.
Many independent studies of options for state health care reform have concluded that a single-payer system is the best way to cover everyone and decrease overall costs, the only plan that does so when different reform models were compared:
•New Mexico 1994 – Lewin Group looked at single-payer, managed competition, employer-mandates •Delaware 1995 - by Solutions for Progress •Minnesota 1995 – Lewin Group -VHI •Massachusetts 1998 - Lewin Group/Boston University School of Public Health •Maryland 2000 - Lewin Group study comparing single-payer and “Pay or Play” •Vermont 2001 - Lewin Group •Massachusetts 2002 – Lewin Group studied 3 models •California 2002 - Lewin Group looked at 9 models •Maine 2002 - Mathematica Policy Research •Rhode Island - 2002 Boston University School of Public Health/Solutions for Progress •Missouri 2003 - Missouri Foundation for Health •Georgia 2004 - Lewin Group •California 2005 - Lewin Group •Mississippi – Lewin Group •Connecticut 2006 - Economic and Social Research Institute/Urban Institute
6
A recent study conducted for Connecticut by the Economic and Social Research Institute/Urban Institute in 2006 compared three health care reform models:
1. State single-payer plan 2. State pool with competing private plans for uninsured 3. Expanding health coverage safety net for low & moderate income adults & all children
The models compared were measured by the criteria of “universal health care” set by the Institute of Medicine (100% coverage and affordable). The single-payer model (100% coverage at 16% reduced cost) was the only model to fully satisfy the Institute of Medicine criteria.
3. Is your proposal modeled after an existing policy or program within Washington or elsewhere? If so, describe the policy or program or its outcomes
There is no existing state program insuring access to all its residents. The most prominent, detailed, and researched current legislation is California SB 840 SB as introduced by Senator Sheila Kuehl and described above.
4. Will your proposal impose costs on individuals, businesses or government? Will these costs be time limited or on-going? Can you estimate how much these costs will be, or suggest how such an estimate could be made? How much, if any, of these costs will be offset by corresponding savings?
A single-payer program for Washington State would pay for all medically necessary health services, with total expenditures set at the same proportion of state GDP as in the year prior to implementation of the program. Federal, state, and local public monies now spent directly on health care or insurance as well as public funds routed through private insurers would be paid into the program. Employer and employee contributions to current health plans would be eliminated and could be replaced by payroll taxes as described above or in some other fashion. The mix of taxes used by the Legislature to raise funds is a matter of tax policy separate from the organization of health care but should be on a progressive basis.
The above-mentioned state studies of state single-payer health insurance plans concluded emphatically that any increased costs would be offset by corresponding savings and would be sustainable.
Funding for the new Washington State plan would require waivers or federal legislation to allow federal, state, & local health care payments to be paid into the state insurance
7
system. There are currently three bills introduced in Congress that would enable states to use currently federal funds:
1. Health Partnership Act (S.2772) Senators George V. Voinovich (R-OH) and Jeff Bingaman (D-NM)2. State-Based Health Care Reform Act Senator Russ Feingold (D-Wisc)3. The Health Partnership Through Creative Federalism Act (HR 5864) Reps. Tammy Baldwin (D-WI) and Tom Price (R-GA)
5. How does your proposal reflect collaboration among the various stakeholders? Which stakeholders have endorsed it?
All of the necessary stakeholders could easily collaborate on the new Washington State program. Their expertise is very important. Hundreds of organizations have endorsed national and state single-payer health insurance plans. Of course, the multiple insurance plans would no longer be necessary.
Current insurance industry personnel with qualifications required by the new plan could be absorbed. Help finding new employment or retraining for those displaced would be a priority. There is a great need for additional workers in long-term care and home care for our aging population. Retraining workers to work in long-term care would be very helpful. Also, many utilization review and other administrative staff are nurses - returning nurses to the bedside would help with the nursing shortage. There are also shortages in residential supportive services for the mentally ill - another area where displaced workers could help improve the quality of care and reduce the need for hospitalization. These needs are much more pressing than maintaining an insurance bureaucracy.
6. What are the obstacles to implementing your proposal? Who will object to it and why? How do you suggest these objections be addressed?
The opponents to fundamental health care reform have power, money, and media, and, therefore the ear of many politicians. The insurance companies who would lose a share of their health insurance business would present the biggest obstacles. The pharmaceutical industry would have to bargain drug prices and would see decreased profits. Many providers fear change and decreased income (especially specialists). Many small businesses and others that do not now pay for employee health insurance would have to pay a share. Also, banks and the credit industry would see HSA account profits disappear. Their objections need to be addressed by putting the good of society as a whole ahead of special interest groups.
On the other hand, the potential supporters of fundamental reform are vast. The uninsured all would be covered. The elderly & middle class would not worry about underinsurance
8
and financial ruin. Medicaid recipients would be assured of access and one standard of care. Big Business would find a way to contain rising health costs and improve its position for international competition. Physicians would cut their administrative costs and time wasted on paperwork. Union workers would not need to bargain for health benefits and could focus on other issues.
Most national polls, the CHCWG experience, and initiatives such as the one recently passed overwhelmingly in Seattle indicate the public is ready to back legislators taking a stand for guaranteed health care access. The impediment to fundamental reform in health care is not economic, but political. Political will, not economic expertise, is what will bring about this important change. Many BRC members have expressed “off the record” that they favor a single-payer health insurance program, that it is the only rational solution to our crisis in access and costs, that it will, eventually, come to pass, but that it is not now politically feasible. Washington State needs leadership now from the BRC to “do the right thing.”

Tab 38
1
Planned Parenthood Public Policy Network of Washington 2001 E. Madison Seattle, WA 98122
August 31, 2006
The Honorable Christine Gregoire The Honorable Pat Thibaudeau Co-Chairs, Blue Ribbon Commission on Health Care Cost & Access By email: [email protected]
Dear Governor Gregoire, Sen. Thibaudeau, and Commission Members:
Thank you for this opportunity to participate in the Commission’s effort to achieve its vision of a health care system that provides every Washingtonian the ability to obtain needed health care at an affordable price.
We write today on behalf of Planned Parenthood and other community-based family planning agencies, which serve as the point of entry into Washington's health care system for thousands of of individuals. Each year, 3.1 million women, men, and adolescents enter a Planned Parenthood center in nearly 1,000 American communities and leave treated and better educated about themselves, their bodies, and their health needs.
In 2005, Washington Planned Parenthood staff members, interns and volunteers provided approximately 215,000 people with sexual and reproductive health services. Planned Parenthood and other publicly funded family planning agencies helped prevent 23,000 unintended pregnancies in Washington in 2005 (WA Department of Health).
The range of health care services offered by community family planning clinics include:
a complete medical history and physical examination; screening for cervical and breast cancer; testing for anemia, sexually transmitted diseases and pregnancy; education about pregnancy prevention, STDs, birth control methods, infertility, prenatal care, nutrition and other related health issues; provision of medically approved birth control methods; pregnancy termination; referral to other health and social services as needed.
Planned Parenthood health educators provided a wide variety of educational programs to over 51 thousand people of all ages and in a variety of settings—from middle schools and universities to non-English speaking and homeless populations, from prisons and social service programs to religious institutions and civic organizations. Programs focused on 25 content areas including teenage pregnancy, abstinence, contraception, family planning, sexually transmitted infections, HIV/AIDS, rape and sexual abuse, parent-child communication, women’s health, sexual orientation and family life education.
2
Family planning providers understand the crisis in America's health care system because our clients, especially young, poor women, are those whose needs have been all but ignored by that system. We are committed to helping shape a reformed health care system that is truly responsive to the needs of women and men of reproductive age, adolescents, communities of color, and vulnerable populations.
1. What do you propose to be done to realize the vision and goals for Washington State established by the Blue Ribbon Commission on Health Care Costs and Access?
As community safety-net providers, our message is straight-forward: the best chance to improve health care outcomes and control costs is for Washington State to redouble its efforts to prevent unintended pregnancy by providing access to contraception, family planning services and medically accurate sexual health education.
Access to preventive reproductive health services is a linchpin, not only for women’s health, but also their economic security and family well being. Unintended pregnancy is a risk factor for inadequate prenatal care, low birth-weight, and exposure of the fetus to tobacco, alcohol and other substances. It is also a risk factor for neonatal death, domestic violence, and child abuse. It is associated with economic hardship, failure to achieve educational and career goals, and the failure of marriages.1
Policymakers in Washington State have grappled with the issue of unintended pregnancy as a health care system cost driver for years.
In 1998, the Department of Health submitted a report to the legislature about insurance coverage of contraception. At that time, data showed that 57% of all pregnancies were unintended, and half of those pregnancies ended in abortion.2 In its findings, the department noted: “[t]here is a wealth of literature on unintended pregnancy and contraception. The literature almost universally calls for increased access to comprehensive contraception, including reducing financial barriers…” The department cited numerous studies, including:
The Health of Washington Women, published by the Washington Women’s Education Foundation in August 1997, which recommended that “all health plans in Washington cover the full range of FDA-approved contraceptive methods [and that] state policy should increase funding for subsidized contraceptive services for low-income uninsured women. Access to reproductive health services should be comprehensive, culturally appropriate, and include both medical services and related counseling and patient education. Services should be provided in a variety of settings, including health plans, community clinics, public health departments and districts, and school-based clinics. And, Washington women should have access to a 24-hour statewide clearinghouse for information on family planning information and services.”
The 1998 Washington State Public Health Report, which recommended assurance of confidential access to family planning and other reproductive health services, especially to teens and other at-risk populations. The report also recommended working to increase public awareness of the incidence, costs, and consequences of unintended pregnancy.
1 Federal Title X Family Planning Program. 2 Contraceptive Services Sunrise Review Report, Department of Health, 1998, pg. 3.
3
The Contraceptive Services Sunrise Review Report highlighted the cost savings: “[o]ver the course of five years, a sexually active woman who does not use contraception will cost private insurers a total of $14,500 for pregnancy related care. According to a report entitled Contraceptive Technology, 17th Revised Edition, in a single year 85 out of 100 sexually active women not using a contraceptive method will become pregnant.”3
Since 1998, Washington State has become a national leader on pregnancy prevention efforts, but its progress is threatened by budget cuts and bureaucratic red tape.
We were on the right track with Take Charge, Washington’s Medicaid Section 1115 Waiver Family Planning Program.4 Now in its sixth year, the program provides free family planning services for one year to low-income women and men with no health insurance. The Take Charge program has been overwhelmingly successful.5 Despite increases in population growth, the program has contributed to a 3.5% decrease in the state’s abortion rates and a 2.5% decrease in the state’s birth rates. According to the Department of Social and Health Services, for every dollar spent on Take Charge, Washington saves approximately $3.30 in future care and services, and four of five program objectives described in the initial application (December 1998) have been achieved, or exceeded:6
An estimated 21% of the women eligible under the waiver, who would have had an unintended pregnancy, remained pregnancy free.7
The proportion of clients using a more effective family planning method increased from 53% at enrollment to 69% one year later. The proportion that reported using abstinence in the prior two months increased slightly, from 10.8% to 11.2%. The number of Medicaid women who received services from family planning clinics increased from 22,850 during the baseline year to 85,607 in year one, 108,253 in year two, and 121,997 in year three.The number of Medicaid men receiving family planning services increased from 850 during the baseline year to 3548 in year one, 4384 in year two, and 5018 in year three.
3 Id. at 6 4 The waiver program was supported by the WA. St. Council on Family Planning, the WA. St. Association of Local Public Health Officials, the American College of Obstetricians and Gynecologists, the WA. Federation of Business and Professional Women, the Washington State Labor Council, the Parent-Child Assistance Program (P-CAP), the American College of Nurse Midwives Washington Chapter, the League of Women Voters of Washington, the National Council of Jewish Women, the American Society of Sexuality Educators and Trainers (ASSET), the Children’s Alliance, the Health Coalition for Children and Youth, the March of Dimes, the American Association of University Women, the Northwest Women’s Law Center, ARNPs United, Washington State Community and Migrant Health Centers, the National Organization of Women, and the Washington State Women’s Health Care Coalition, Washington Women United and Women In Unity/Puget Sound Chapter and Planned Parenthood.5 According to the Department of Social and Health Services, “the decrease in Washington birth and abortion rates, especially for young women, implies that many unintended pregnancies have actually been averted.” “The statewide birth rate for women 15-44 decreased by 9% from 66.4 per 1000 in 1991-92 to 60.5 per 1000 in 2001-02. The birth rate for young women, age 15-24, decreased by 24%, from 85.7 per 1000 in 1991-92 to 64.9 per 1000 in 2001-02. In 2001-02, birth rates for older women, 25-44, both low income and higher income, were essentially the same, at 58.7 and 58.4 per 1000. By 2001-02, the birth rate for young higher-income women (50 per 1000) was lower than that for older higher-income women (58.4 per 1000) while the birth rate for young low-income women (84.4 per 1000) remained higher than that for older low-income women (58.6 per 1000).” CSO Profiles, Birth & Unintended Pregnancy Statistics for Community Service Offices, 1991-2002, The Department of Social and Health Services Management Services Administration, Research and Data Analysis Section.6 The fifth objective about raising provider awareness of unintended pregnancy prevention represents a long-term goal and a number of initial steps to facilitate this objective have been completed. http://www1.dshs.wa.gov/rda/research/9/72.shtm 7 Id.
4
But the program’s success is at risk. Inadequate reimbursement rates, bureaucratic red tape and benefit cutbacks threaten to derail the entire program.
Impact of Inadequate Rates: Some small, independent family planning providers in rural, underserved communities with high unintended pregnancy and STD rates are struggling so severely with inadequate Medicaid and Take Charge reimbursements that they are unable to purchase needed contraceptive drugs and devices and are, instead, sending patients to pharmacies as their only alternative. Rising costs and flat Title X family planning funding only exacerbates the problem.
Benefit Cutbacks: The State Department of Health (DOH) and the Centers for Disease Control (CDC) strongly recommend that clinics test and treat all sexually active women under 25 years of age for Chlamydia—largely because this sexually transmitted disease (STD) has no symptom and can have devastating life-long consequences. As of 2004, STD testing and treatment is no longer a covered service under Take Charge, despite the fact that many men and women obtain family planning counseling and contraceptives during an STD-related office visit. Family planning clinics and local health departments are relying almost entirely on the DOH Infertility Prevention Project (IPP) to try to provide Chlamydia testing, but that program is now overwhelmed and has capped the number of Chlamydia tests that a family planning clinic may do under the project. Despite alarming increases in gonorrhea, syphilis, and other STDs in Washington, there are no other state or federal dollars available to local family planning clinics for the testing and treatment of these diseases. As a result, many family planning providers are seeing sharp decreases in the numbers of men and teens coming into their clinics, which undercuts our efforts to provide them with pregnancy prevention counseling and contraceptive methods.
In addition, DSHS is implementing new federal restrictions that prevent a person who has private insurance of any kind from accessing family planning services under Take Charge, even if their insurance does not cover contraceptives or the contraceptive method they need. This includes minors who are covered by their parents’ insurance, but are unable to use that insurance without compromising their right to privacy and confidentiality under state law.8
Bureaucratic Red Tape: Onerous new eligibility criteria, such as requirements for social security numbers and proof of citizenship, are significant obstacles for patients--especially young, minority, and vulnerable patients--who lack access to necessary documentation and/or social security numbers. Unnecessary regulations, frequent changes to billing requirements and reimbursement rates and excessive paperwork requirements place enormous burdens on health care providers. Today, family planning clinics spend hours of staff time filling out paperwork and working with young, at-risk clients to navigate cumbersome eligibility processes and comply with government regulations. These valuable staff hours could be better spent providing direct health services.
To get Take Charge back on track, improve the health of Washington residents, and contain health care costs, state policymakers should ensure that:
Family planning services and STD testing and treatment are available at no cost to uninsured and underinsured individuals with incomes at or below 250% of the federal poverty level.
8 The state may grant exceptions for confidentiality reasons only on a case-by-case basis.
5
Medicaid and Take Charge program requirements and reimbursement rates are reasonable so that local county health departments and local non-profit health care providers – who are the backbone of these programs – can continue to be community partners. While the majority of providers are capping the number of Medicaid clients they will see, family planning clinics are not. Medicaid and Take Charge clients make up approximately 73% of the clients served by family planning providers. Unreasonably low Medicaid reimbursements threaten our continued ability to serve Medicaid and Medicaid waiver clients.
Recognize and treat family planning services as an appropriate entry point into the health care system. More than 70 percent of all women who see a gynecologist or a women's health care specialist do not see any other health care provider. It's their primary point of entry into the system.
Family planning services are convenient, confidential, and sensitive to the individual's cultural background.
Services emphasize the prevention of illness and consumer education, not just treatment of disease and pain. And patient education must be a priority. A Harris poll on women's health found that many American women were not receiving basic preventative health care services. One of the main reasons reported was the lack of information from their physician, including the absence of counseling.
In order to help control costs and increase access to care, the role of nurses, midwives and physician assistants should be expanded. With the present shortages of health care providers in underserved communities, our state must do everything it can to expand access into the health professions, promote efforts to recruit culturally and geographically diverse students, and increase support for financial assistance programs to help low- and middle-income students pursue health care training.
Community safety net providers—community clinics, migrant clinics, tribal clinics and family planning clinics, are supported and integrated throughout the health care system.These organizations have a demonstrated ability to reach traditionally underserved groups with cost-effective, culturally appropriate health services. Washington should examine the Minnesota model, which required health plan networks to include community safety net providers to ensure timely access to essential public health services, including family planning.9
2. How will implementation of your proposal enhance, hinder or otherwise impact the achievement of the vision and each of the goals established by the Commission?
Ensuring access to family planning and STD services to insured and uninsured persons across all income levels will ensure that population health indicators are consistent across race, gender and income levels. Family planning is evidence-based care that ensures better health outcomes by permitting women and men to plan the number and spacing of pregnancies. Providing access to family planning services helps reduce the risk factors identified by above (inadequate prenatal care, low birth-weight; and exposure of the fetus to tobacco, alcohol and other substances; neonatal death, domestic violence, and child abuse). Washington’s Take Charge data shows that every dollar spent on preventive family planning services saves the state $3.30 in future health care costs.10
9 Minnesota Statues (2006) 62Q.19 Essential community providers. 10 DSHS Take Charge Interim Evaluation
6
3. Is your proposal modeled after an existing policy or program within Washington or elsewhere? If so, describe the program and its outcomes.
Our proposal is modeled after successful public health programs in Europe and Canada. These countries have rates of unintended pregnancies, abortion and sexually transmitted diseases that are a fraction of the rates in Washington and the United States. But we need not look beyond the borders of Washington to see the benefits that family planning brings. We urge state policymakers to recognize the success of the Take Charge program, and family planning programs, in general.
4. Will your proposal impose costs on individuals, business or government. Will these costs be time-limited or on-going? Can you estimate how much of these costs will be, or suggest how such estimates can be made? How much if any, of these costs will be offset by corresponding savings?
Washington’s Take Charge data shows that family planning services save the State millions of dollars. DSHS estimates that publicly funded maternity care for unintended pregnancy costs the state approximately $116,000,000 in 2004. Meanwhile, every dollar spent on family planning saves the state $3.30 in other health care costs. The cost of providing a patient family planning services under Take Charge is $311 per year, compared with the average cost of a pregnancy termination at $497, or the average cost of prenatal care and delivery at $6,849 per baby.
State funding of STD testing and treatment also averts long-term health care costs. According to the American Public Health Association (APHA), every dollar spent on prevention of Chlamydia, saves $12 in complication-associated costs.
5. How does your proposal reflect collaboration among various stakeholders? Which stakeholders have endorsed it?
See footnote 4, identifying the organizations that provided support for the family planning waiver proposal in the late 1990s.
6. What are the obstacles to implementing your proposal? Who will object to it and why? How do you suggest these objections be addressed?
The main obstacle to implementing this proposal is the commitment to fully fund family planning and STD prevention and treatment services. Access to reproductive health care services and sexuality education improves the health of the community, reduces unintended pregnancy and abortion, improves educational attainment, reduces violence against women, and saves millions of dollars. Funding family planning and STD services is one of the wisest investments our State can make.
Sincerely,
Elaine Taylor Rose Executive Director
Theresa M. Connor Director of Public Policy
Amy Luftig Deputy Director of Public Policy

Tab 39
September 1, 2006 The Hon. Christine Gregoire, Co-Chair The Hon. Pat Thibaudeau, Co-Chair Blue Ribbon Commission on Health Care Costs & Access Office of the Governor PO Box 40002 Olympia, WA 98504-0002 Dear Governor Gregoire and Senator Thibaudeau: In response to the Blue Ribbon Commission’s recent request for input, I am writing to offer for your consideration Premera’s perspective on ideas the Commission could pursue to progress toward its vision and goals for the future of Washington state’s health care system. Much of the testimony before the Commission and its subsequent discussions reflect broad-based interest in: • Evidence-based, high quality and cost-effective care • Personal responsibility for health status improvement • Relevant, accessible information for consumers and caregivers to make appropriate choices • Elimination of waste that does not add value for the consumer the system is designed to
serve. We want to share with you some of the initiatives Premera has pursued in these areas, as well as related suggestions, which have delivered positive outcomes in our region and may serve as models in the future. Sincerely,
H.R. Brereton Barlow President and CEO Premera Blue Cross
cc: Blue Ribbon Commission members
PREMERA BLUE CROSS RESPONSE - BLUE RIBBON COMMISSION - page 1
September 1, 2006
A proposal to realize the vision and goals for Washington state established by the Blue Ribbon Commission on Health Care Costs and Access. To achieve the Blue Ribbon Commission’s vision for 2012, the private and public sectors should jointly accelerate efforts that will recognize and reward healthy and cost-efficient behavior, and create incentives to encourage more informed and cost-effective health-care decisions. The challenges are formidable and no entity can achieve these goals alone. The ability of Washington state to achieve the vision and goals articulated by the Blue Ribbon Commission will be dependent on specific, measurable improvements in the following areas: 1. A greater focus on improving health versus the “episodic” care model treating sickness --
specifically, a shift in emphasis toward preventing costly and traumatic medical conditions that can be avoided via lifestyle changes.
2. Advances in evidence-based medicine -- driven by collaborative efforts to learn what works and shaping the delivery of medicine to reduce variation from evidence-based guidelines.
3. Greater transparency -- related to healthcare quality, clinical performance and relative cost-effectiveness of treatment options -- providing consumers with information to make better choices and health-care professionals with information to deliver the most cost-effective care.
4. Better accountability across the healthcare system -- including a more involved and accountable consumer -- equipped with better information and incentives (a) to modify lifestyles where possible, and (b) when medical care is needed, to make more informed treatment decisions.
5. Greater collaboration between payers, providers, purchasers and government -- from healthcare delivery (e.g., sharing of data and accelerated adoption of best practices) to public policy (e.g., recent collaborative efforts among business, medical and hospital associations, and health plans to understand the impact of health-care cost shifts from public programs to the private sector).
State government can play a central role in promoting a broader understanding of current efforts by different stakeholders to promote these values, and by creating incentives that accelerate innovation and adoption of best practices. The state could also play a significant role by supporting uniform federal standards in specific areas such as evidence-based medical quality guidelines, information-technology standards, and cost-benefit analysis for new medical treatments.
PREMERA BLUE CROSS RESPONSE - BLUE RIBBON COMMISSION - page 2
Existing models in Washington state In recent years, initiatives have emerged that are aligned with the vision and goals of the Blue Ribbon Commission, delivering positive outcomes, which should be considered as models. A short list of examples follows:
The Puget Sound Health Alliance is a regional partnership involving employers, physicians, hospitals, patients, health plans, and others working together to improve quality and efficiency while reducing the rate of health care cost increases across King, Kitsap, Pierce, Snohomish and Thurston Counties. Alliance participants agree to use evidence-based measures to identify and measure quality health care, then produce publicly-available comparison reports designed to help improve health care decision-making.
Premera’s Quality Score Card initiative, built collaboratively with prominent medical groups
throughout the state, has demonstrated dramatic improvement in quality and health outcomes since 2002 (see Appendix A and www.premera.com/qsc). Premera’s Quality Score Card has been endorsed (and co-designed) by 13 major medical groups statewide and used as an example by the Puget Sound Health Alliance. In 2002, Premera invited medical groups across Washington to identify which quality indicators they wanted to measure; then participants worked collaboratively to agree on quality standards and how to assign responsibility where multiple physicians treated a given patient. Results were initially presented to each medical group confidentially; by 2004 these groups endorsed online publication of what became the first public scorecard developed in a non-HMO environment. Since that time medical groups representing hundreds of thousands of Washington patients have agreed to participate in the scorecard. Since 2002, aggregate performance in low-scoring areas has improved by more than 50 percent. Particularly exciting about this work is the enhancements in health outcomes. Last year a subset of participating medical groups began publishing medical outcomes in certain categories; key indicators of diabetes health have improved by up to 87 percent in a single year. Evidence-based standards, ability to compare clinic performance to a community benchmark, and innovations arising from this collaboration have been the keys to success.
Washington State Health Care Forum, is a coalition of health plans, physicians and
hospitals that joined together to improve health-care efficiency and effectiveness by applying collaborative information technology solutions. The Health Care Forum has delivered a successful model through OneHealthPort (“OHP”) of how technology can be implemented on a shared basis to improve administrative efficiency with a goal of improving delivery of care. At this point more than 20,000 individual subscribers in the medical community are registered to use OHP as a single-sign-on gateway to the web capabilities of local health plans and provider organizations. By sharing investment in technology, OHP provides a common technology infrastructure to improve health-system efficiency (see Appendix B).
Premera’s Springboard® health-risk management and personal coaching initiative, broadly endorsed by benefit consultants, major employers, and state health officials, was launched this year following demonstrated success by Washington employers that health-risk management programs can significantly reduce employees’ excess health risk in as little as
PREMERA BLUE CROSS RESPONSE - BLUE RIBBON COMMISSION - page 3
one year. Peer-reviewed national research correlates lower health risk with lower health-care costs. By paying program costs for Washington employers, Premera is collaborating with businesses to explore the impact of personal health assessments and professional health coaching on employee health, productivity and health costs (see Appendix C.)
Subimo Healthcare Advisor and Hospital Advisor online transparency tools, available to
Premera members facing medical decisions, estimate treatment costs and compare hospital performance and quality for a range of specific conditions (see Appendix D). The hospital quality indicators are subject to verification by the hospitals themselves. Additional information is available online to support members with questions they may have and questions they may wish to ask as they evaluate treatment options and prepare for care.
Challenges to be addressed The Commission’s goals face an environment where health care cost trends have been rising in the 10-14 percent range since the late 1990s -- at least triple the rate of growth in personal income. This presents a huge challenge to meeting the Blue Ribbon Commission’s goal of holding health-care cost trend to the rate of personal income growth within five years. As the Commission develops its recommendations, it should be aware of and address factors which can exacerbate these already high cost trends:
Changing demographics and health status. As baby boomers age, the cost impact of an aging population adds about 1-2 percent to annual medical cost trends. At the same time, declines in health -- from epidemics of obesity and diabetes to alarming projections that this generation of children for the first time in two centuries may live shorter lives than its parents -- will continue to drive more costs into the health-care system.
The threat of medical malpractice lawsuits has a dampening effect on efforts by providers to
increase transparency.
Government cost-shifting--the impact of federal and state program payments on health-care costs paid by employers and individuals. Low public program payments create cost pressures on physicians and hospitals that are in turn shifted to the private market, impacting affordability of employer-based and individual insurance (see Appendix E), and the uninsured. Based on a report prepared by Milliman USA, Washington employers and individuals paid an estimated $738 million (2004 dollars) to cover shortfalls incurred by Washington hospitals serving Medicare and Medicaid patients. The resulting burden on employers was estimated to be $490 per family health insurance contract. This cost-shift accounted for 29.9 percent of the 2004 increase in hospital costs paid by people with private insurance or no coverage -- and the magnitude of cost shifting has been growing. An analysis based on the results of the Milliman study concluded that the corresponding cost-shift for physician services added $412 per family contract, or $620 million statewide. Total burden on Washingtonians: $902 per family insurance contract, or a $1.4 billion statewide. A broad range of business, provider and payer groups is collaborating to understand and address this issue. Organizations interested in participating in a coalition together to address the issue include the Greater Seattle Chamber of Commerce, the Spokane Chamber of Commerce, the Inland Northwest Business Coalition on Health, the Washington State Hospital Association, Regence Blue Shield, the Association of Washington Business, the Washington State
PREMERA BLUE CROSS RESPONSE - BLUE RIBBON COMMISSION - page 4
Medical Association, Group Health Cooperative, the Washington Health Care Forum, the Snohomish County Economic Development Council, MultiCare Health System, the Polyclinic, Planned Parenthood, and Premera.
Given these issues, meeting the Blue Ribbon Commission’s goal of holding total health-care spending to the rate of growth in personal income would require that health-care cost trends be held below the rate of general inflation.
Opportunities for public/private collaboration The public and private sector, working together, should collaborate to:
Showcase quality performance Encourage innovators and achievers in health care quality and efficiency based on evidence-
based criteria Collaborate with stakeholders to avoid duplication of efforts and unintended results Establish State workforce as a model for personal health management Provide consumers with the information they need to make better health-care decisions.
PREMERA BLUE CROSS RESPONSE - BLUE RIBBON COMMISSION - page 5
Appendices Appendix A: Premera Quality Score Card Appendix B: Washington State Health Care Forum - OneHealthPort Appendix C: Springboard® Health Risk Management Program Appendix D: Subimo Healthcare Advisor and Hospital Advisor online transparency tools Appendix E: Milliman USA cost-shifting study
PREMERA BLUE CROSS NEWS RELEASE Page 1
PRESS RELEASE FOR IMMEDIATE RELEASE Premera and Clinic Media Contacts are attached
PREMERA BLUE CROSS 2005 QUALITY SCORE CARD: AN UPDATED SNAPSHOT OF HEALTH
CARE QUALITY IN WASHINGTON
Results range from dramatic improvement in diabetes control to a decline in prescribing practices that minimize antibiotic resistant bacteria
MOUNTLAKE TERRACE, WA – (Dec. 14, 2005) –Premera Blue Cross and prominent medical groups across Washington today announced results of the 2005 Premera Quality Score Card, a collaboration supporting better health and more sustainable costs by providing information health-care professionals and consumers can use to improve the quality and cost-effectiveness of health care. Preventive screenings, diabetes monitoring and treatment, use of cost-effective generic drugs, and satisfaction with thoroughness of treatment were among the 19 variables measured by Premera’s 2005 Quality Score Card. Results are published online at www.premera.com. For the first time, the 2005 Quality Score Card includes performance on a group of important health outcomes -- revealing potentially dramatic improvements in control of diabetes. In 2005, medical group participation in this collaborative effort nearly doubled, creating a robust view of health-care quality in Washington. Participating medical groups reach an estimated one third of Premera’s Washington members. Every participating medical group was among the top three performers in at least one area. The Score Card also estimates performance for physicians statewide. Participating medical groups include Columbia Medical Associates; The Everett Clinic; Minor and James Medical; MultiCare Health Systems; Pacific Medical Centers; Pediatric Associates; Physicians Clinic of Spokane; The Polyclinic; Puget Sound Family Physicians; Rockwood Clinic; Virginia Mason Medical Center; Swedish Physicians; and Wenatchee Valley Medical Center. Diabetes control improving New to the 2005 Quality Score Card are three scores that reveal not just how often patients receive evidence-based standards of care, but also the resulting impact on health. In 2003, a subset of participating medical groups began tracking key diabetes health indicators -- specifically, control of cholesterol, blood pressure, and ongoing blood sugar -- all highly correlated with better long-term health and lower medical costs. All participating clinics have been tracking these scores in 2005 for clinic-by-clinic publication next year. “The Washington clinics chose to measure themselves against a higher level of performance than the minimum ‘control’ standards published by the National Committee for Quality Assurance (NCQA),” noted Dr. Mark Sollek, Premera Medical Director heading up the Quality Score Card project.
PO Box 327 Seattle, WA 98111-0327
PREMERA BLUE CROSS NEWS RELEASE Page 2
The results reveal dramatic improvements for these clinics’ Premera patients from the previous year:
o 51.3 percent of diabetic patients had well controlled hemoglobin A1c levels (at or below 7), nearly doubling the previous year’s performance.
o 41.6 percent of diabetic patients had well controlled cholesterol levels (below 100), improving previous year’s performance by more than half; and
o 38.6 percent of diabetic patients had well-controlled blood pressure (at or below 130), improving previous year’s performance by nearly half.
“This is an early but exciting indicator,” noted Dr. Sollek. “If this improvement can be sustained, it has the potential to reduce heart attacks, hospitalizations, amputations, strokes, blindness, kidney failure and premature deaths -- and represent significant savings in health-care costs.” Studies have shown that every 1 percent drop in “A1c” levels reduces by 40 percent the risk of blindness, kidney failure and nerve disease and other vascular complications. Health care costs are up to 32 percent higher for diabetic patients with A1c levels greater than 10 compared to those whose A1c levels are 7 or lower. Patients with well-controlled LDL cholesterol have 20 percent to 50 percent fewer strokes, heart disease and other cardiovascular complications. Blood pressure control reduces the risk of cardiovascular disease among people with diabetes from 33 percent to 50 percent, and the risk of vascular complications by 33 percent. Quality Improvement: Patterns of Performance Most participating medical groups in Washington state posted at least minor improvements on a majority of quality and satisfaction measures last year. Quality Score Card participants tended to post performance scores 3 percent to 6 percent higher than the average of all other Washington State practices seeing Premera members last year. Some of the greatest single-year improvements by individual participating clinics include:
o 34 percent improvement in the recommended rate of well-child visits for infants in the first 15 months of life.
o 33 percent gain in use of appropriate blood pressure medications for diabetes. o 14 percent improvement in the rate of generic prescribing where a generic is available. o 12 percent improvement in the recommended rate of cholesterol screenings for people with diabetes.
In most cases, declining performance reflected minor fluctuations in already high-scoring quality areas. One exception involved patterns of antibiotic usage. Recommended management of ear infections declined by 9 percent from the previous year, and for acute bronchitis, by 12 percent. Participating medical groups are using these results to examine why performance has declined and to determine what steps should be taken to address it. The Quality Score Card also measures how much health-care practices vary clinic by clinic and doctor by doctor. While recommended treatment of acute bronchitis occurred 34 percent of the time overall, some physicians may have delivered recommended care only 12 percent of the time, while others did so 74 percent of the time. Building on a solid foundation Participating medical groups say the Quality Score Card works because it was developed in a collaborative, trusted environment and tested with physicians for two years before the first results were published by Premera in 2004. In 2005, the collaborative approach used to develop Premera’s Quality Score Card was recognized as a national best practice by the Blue Cross Blue Shield Association.
PREMERA BLUE CROSS NEWS RELEASE Page 3
Using a collaboratively developed set of quality measures and measurement method, participating medical groups and Premera continue to work with other organizations in Washington state and nationally to drive to a more consistent “core” of set quality measures.
About Premera Blue Cross
Our mission is to provide peace of mind to our members about their health-care coverage. We provide health insurance and related services to more than 1.3 million people. Premera Blue Cross has operated in Washington since 1933, and Alaska since 1957. Premera Blue Cross is an independent licensee of the Blue Cross Blue Shield Association.
Premera Blue Cross is a member of a family of companies based in Mountlake Terrace, Washington, that provide health, life, vision, dental, and long-term care insurance, and other related services.
###
PREMERA BLUE CROSS NEWS RELEASE Page 4
Quality Score Card 2005 Media Contacts: Premera Blue Cross Scott Forslund, Director of Communications 425-918-5070 [email protected] 425-280-1653 (cell) Chris Jarvis, Communications Manager 425-918-3368 [email protected] 206-714-4010 (cell) Columbia Primary Care Kelly Stanford, Director of Quality Improvement 509-744-3496 [email protected] The Everett Clinic Catherine Russell, Media & PR Manager 425-304-1139 [email protected] Minor & James Medical Marty Francois, Practice Manager 206-386-9673 [email protected] MultiCare Health System Todd E. Kelley, Manager, Media Relations 253-403-1716 [email protected] Pacific Medical Center Karyn Beckley, VP Marketing 206-621-4544 [email protected] Pediatric Associates Bill Vandenberg, Administrator 425-460-5631 [email protected] Physicians Clinic of Spokane David Page, Administrator 509-353-4264 [email protected] The Polyclinic Tracy Corgiat, Marketing & PR Director 206-860-4538 [email protected] Puget Sound Family Physicians Tim Turner, Associate Executive Director 360-568-1558 x120 [email protected] Rockwood Clinic Christine Eriksen, Marketing & PR Director 509-838-2531 x6232 [email protected] Swedish Physicians Ed Boyle, Media Relations Director 206-386-2748 [email protected] Lisa Tangen, Marketing & Communications 206-386-2791 [email protected] Virginia Mason Medical Center Kim Davis, Media Relations 206-583-6451 [email protected] Wenatchee Valley Medical Center Mall Boyd, Marketing Director 509-664-4868 x 5528 [email protected]
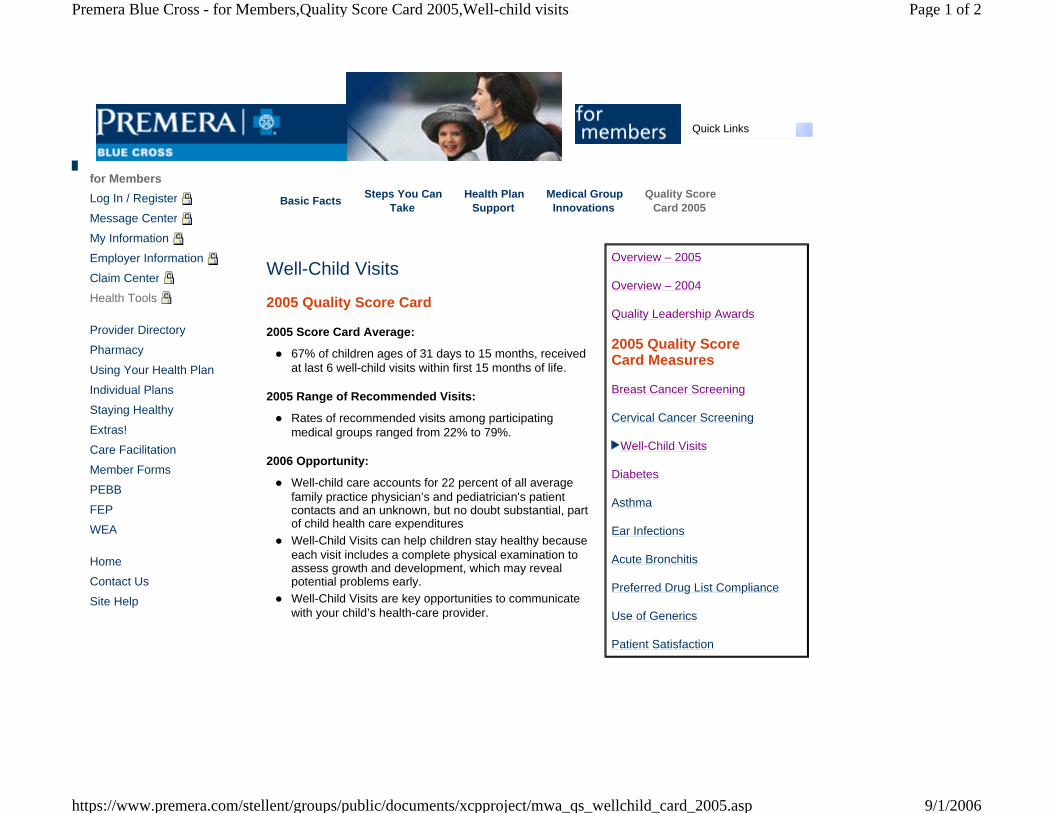
Quick Links
for Members
Log In / Register
Message Center
My Information
Employer Information
Claim Center
Health Tools
Provider Directory
Pharmacy
Using Your Health Plan
Individual Plans
Staying Healthy
Extras!
Care Facilitation
Member Forms
PEBB
FEP
WEA
Home
Contact Us
Site Help
Basic Facts Steps You CanTake
Health PlanSupport
Medical Group Innovations
Quality ScoreCard 2005
Well-Child Visits
2005 Quality Score Card
2005 Score Card Average:
67% of children ages of 31 days to 15 months, received at last 6 well-child visits within first 15 months of life.
2005 Range of Recommended Visits:
Rates of recommended visits among participating medical groups ranged from 22% to 79%.
2006 Opportunity:
Well-child care accounts for 22 percent of all average family practice physician’s and pediatrician's patient contacts and an unknown, but no doubt substantial, part of child health care expenditures Well-Child Visits can help children stay healthy because each visit includes a complete physical examination to assess growth and development, which may reveal potential problems early. Well-Child Visits are key opportunities to communicate with your child’s health-care provider.
Overview – 2005
Overview – 2004
Quality Leadership Awards
2005 Quality Score Card Measures
Breast Cancer Screening
Cervical Cancer Screening
Well-Child Visits
Diabetes
Asthma
Ear Infections
Acute Bronchitis
Preferred Drug List Compliance
Use of Generics
Patient Satisfaction
Page 1 of 2Premera Blue Cross - for Members,Quality Score Card 2005,Well-child visits
9/1/2006https://www.premera.com/stellent/groups/public/documents/xcpproject/mwa_qs_wellchild_card_2005.asp
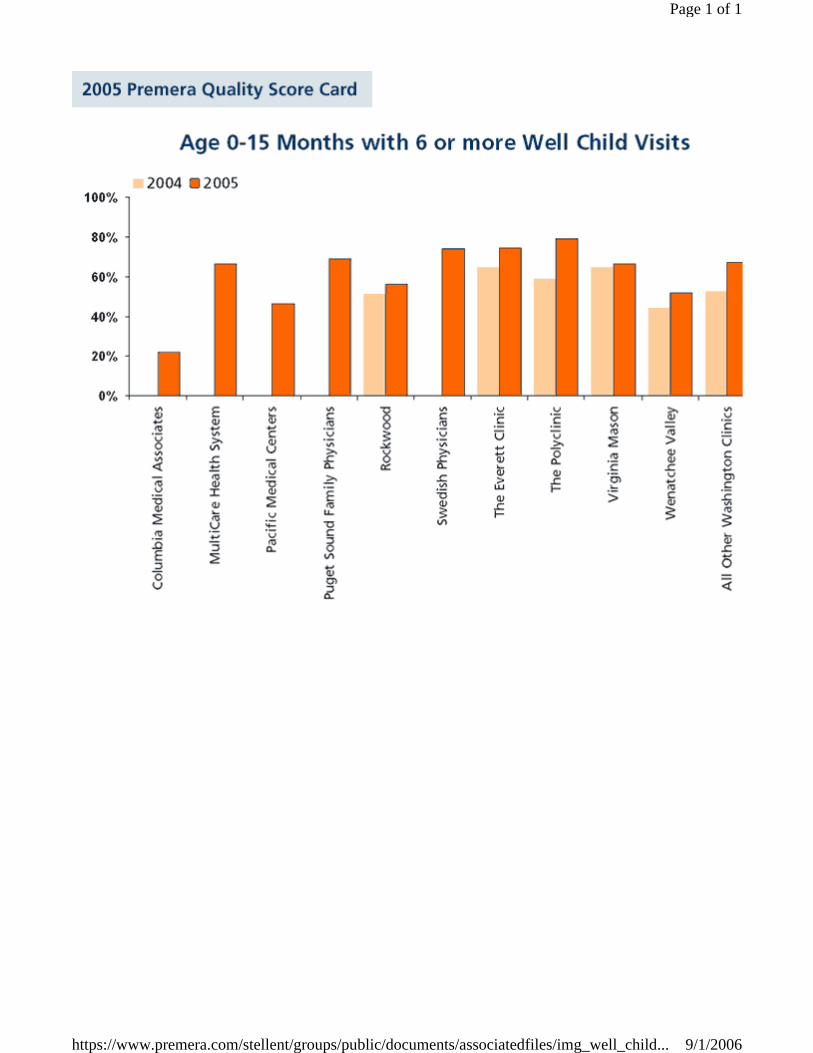
Page 1 of 1
9/1/2006https://www.premera.com/stellent/groups/public/documents/associatedfiles/img_well_child...
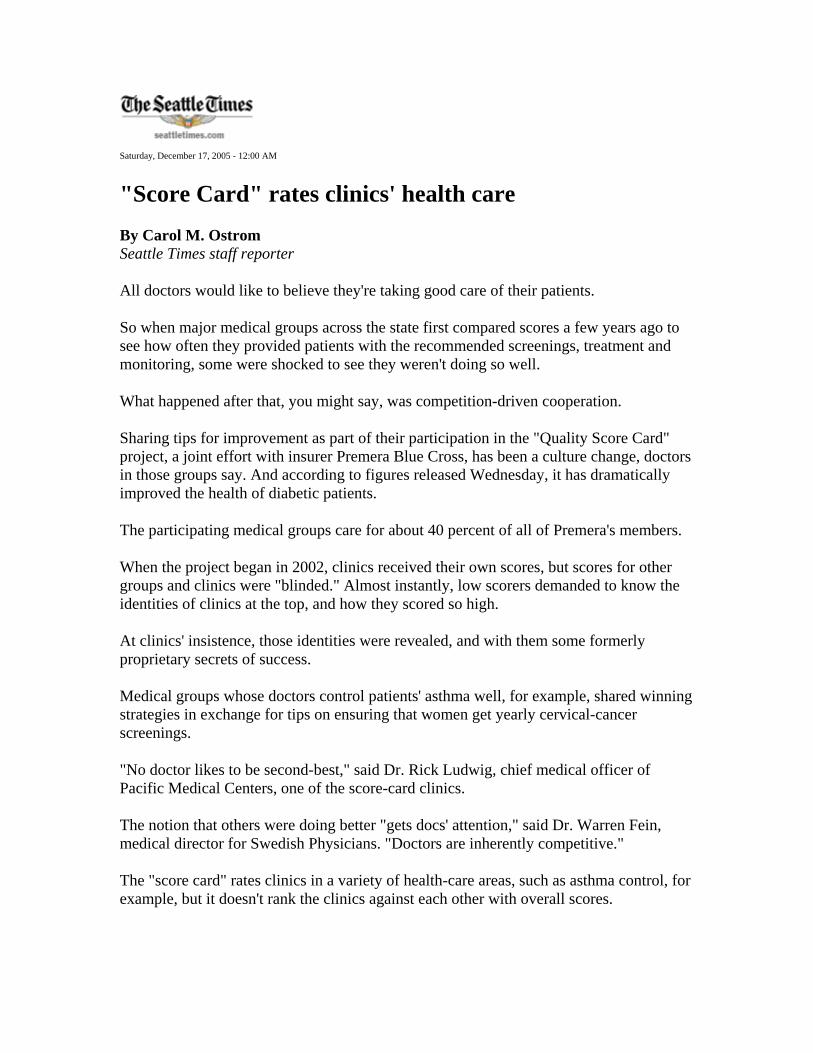
Saturday, December 17, 2005 - 12:00 AM
"Score Card" rates clinics' health care
By Carol M. Ostrom Seattle Times staff reporter
All doctors would like to believe they're taking good care of their patients.
So when major medical groups across the state first compared scores a few years ago to see how often they provided patients with the recommended screenings, treatment and monitoring, some were shocked to see they weren't doing so well.
What happened after that, you might say, was competition-driven cooperation.
Sharing tips for improvement as part of their participation in the "Quality Score Card" project, a joint effort with insurer Premera Blue Cross, has been a culture change, doctors in those groups say. And according to figures released Wednesday, it has dramatically improved the health of diabetic patients.
The participating medical groups care for about 40 percent of all of Premera's members.
When the project began in 2002, clinics received their own scores, but scores for other groups and clinics were "blinded." Almost instantly, low scorers demanded to know the identities of clinics at the top, and how they scored so high.
At clinics' insistence, those identities were revealed, and with them some formerly proprietary secrets of success.
Medical groups whose doctors control patients' asthma well, for example, shared winning strategies in exchange for tips on ensuring that women get yearly cervical-cancer screenings.
"No doctor likes to be second-best," said Dr. Rick Ludwig, chief medical officer of Pacific Medical Centers, one of the score-card clinics.
The notion that others were doing better "gets docs' attention," said Dr. Warren Fein, medical director for Swedish Physicians. "Doctors are inherently competitive."
The "score card" rates clinics in a variety of health-care areas, such as asthma control, for example, but it doesn't rank the clinics against each other with overall scores.
Premera's Dr. Mark Sollek said making scores public was a "gutsy move" on the part of the medical groups. But other doctors said they believe such public accountability is inevitable.
"It's becoming more and more important for the community to know how we're doing," Ludwig said.
For diabetic patients, such attention to good care helps improve their health, according to the yearlong tracking by Premera and some of the larger clinics.
The percentage of diabetic patients who met target levels of blood pressure, cholesterol and long-term blood-sugar control rose dramatically in 2005 compared to 2004, according to the results. For example, there was an 87 percent increase in patients whose tests showed three-month blood-sugar control.
Studies have indicated that every 1 percent drop in a patient's long-term blood-sugar control translates to a 40 percent reduction in the risk of blindness, kidney failure, nerve disease and blood-vessel complications in diabetics.
Despite the encouraging statistics, there's room for improvement. This year, only 59 percent of Premera members with diabetes were tested for long-term blood-sugar control. In a couple of categories, such as the optimal care of ear infections and bronchitis, clinic performance in general declined from 2004 to 2005.
Carol M. Ostrom: 206-464-2249 or [email protected]
Copyright © 2005 The Seattle Times Company
Health notes
Score Card shows area diabetics in better control of disease Megan Cooley Staff writer December 20, 2005
WASHINGTONIANS WITH DIABETES are making dramatic improvements in their control of the disease. That's one of the results of the 2005 Premera Quality Score Card, a collaborative effort between Premera Blue Cross and doctors to share information and improve the quality and cost-effectiveness of health care.
The Score Card, available at www.premera.com, rates clinics using 19 variables such as how many patients undergo preventive screenings and the use of generic versus brand-name drugs.
This was the third year that data was collected and the first time the Score Card included not just how often patients are treated using the best method available, but also the
result of that care on patients' health.
Diabetic patients were tracked on how well they controlled their cholesterol, blood pressure and blood sugar levels.
Among the results:
•Slightly more than 51 percent of diabetic patients had well-controlled hemoglobin A1c, or blood sugar, levels, nearly doubling 2004's performance.
•Almost 42 percent had cholesterol levels below 100, improving last year's performance by more than half.
•Nearly 39 percent had well-controlled blood pressure, improving last year's performance by almost half.
That's good news because for every 1 percent drop in A1c levels, a diabetic's risk of blindness, kidney failure and other vascular complications reduces 40 percent, according to Premera.
And patients with well-controlled cholesterol have 20 to 50 percent fewer strokes, heart disease and other cardiovascular problems.
Premera spokesman Scott Forslund gives a lot of credit for the improvements to the Washington State Diabetes Collaborative, a six-year-old effort by doctors to improve the way they treat diabetic patients.
The Score Card showed improved care for other patients, as well as a reduction in the cost of health care. At one clinic, the rate at which infants were getting well-child visits grew 34 percent between 2005 and 2004. At another clinic, the prescribing of generic drugs versus brand-name ones grew 14 percent.
Three of the 12 clinics that participated in the 2005 Score Card are in Spokane: Rockwood Clinic, Physicians Clinic of Spokane and Columbia Medical Associates. The participating clinics reach about one-third of Premera's Washington members.
Poison helpline available
When it comes to holiday eating, fruitcake isn't the only hazard.
So far this Christmas season, at least nine children have eaten holiday decorations and gift wrap, 17 have tasted candles or lamp oil, 34 consumed plants and 30 drank perfume or cologne, two common holiday gifts, according to the Washington Poison Center.
"It's amazing that they eat what they do," said Kerri Booth, the center's education coordinator.
While most of those items don't pose a poisoning risk, they can be choking hazards. And other dangers lurk during the holidays.
For example, you visit the home of friends without children and, because their house hasn't been childproofed, your toddler swallows a small ornament or rummages through the cupboard with their cleaning supplies.
Maybe your child decides to explore your guestroom, where Grandma is staying, and the little one can't resist the pretty-colored pills your mom left on the nightstand.
Booth encouraged people to call the poison center when they have concerns.
"Oftentimes they call 911 when they really should be calling us," she said.
People should call 911, though, if someone can't breath, can't be woken up, is having a seizure or is clearly having some other medical emergency, she said.
The phone number for poisoning concerns is the same in any state: (800) 222-1222. Whether you're in Washington or Wisconsin, your call is directed to a local help center.
Grieving during the holidays
Hospice of Spokane offers tips for coping with sadness when the rest of the world seems consumed by joy:
•Decide to keep your regular traditions or plan something entirely different. Just remember that your choice is temporary and you can change your activities next year.
•Accept help. Ask friends to shop for or with you or do the cooking, if you choose.
•Light a candle, display a flower or create a special holiday decoration in memory of your loved one. Offer a dinner prayer, meditation or toast to them.
•Do an activity your loved one enjoyed to bring joy to others, such as caroling or serving meals to the homeless.
•And give yourself and others permission to remember happy times with that person.
Pharmacist honored
The Spokane Pharmacists Association named Brenda Bray 2005's community pharmacist of the year.
Bray is a clinical assistant professor of pharmacotherapy at Washington State University's Spokane campus. She was recognized for bringing real-world experiences to her students and for her work as an on-call pharmacist for Group Health Cooperative and Shriners Hospital for Children.
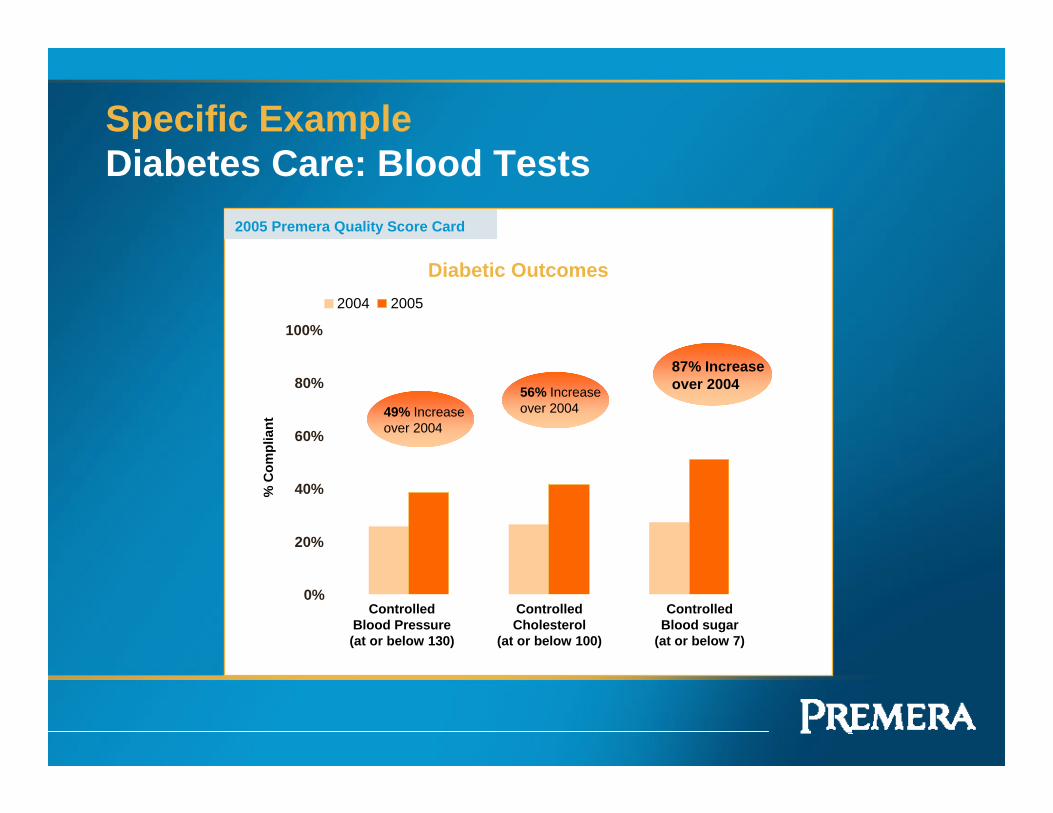
Specific Example Diabetes Care: Blood Tests
2005 Premera Quality Score Card
49% Increaseover 2004
Controlled Blood Pressure(at or below 130)
56% Increaseover 2004
Controlled Cholesterol
(at or below 100)
87% Increaseover 2004
ControlledBlood sugar
(at or below 7)
Diabetic Outcomes
0%
20%
40%
60%
80%
100%
% C
ompl
iant
2004 2005
OneHealthPort opens the door to valuable business and clinical solutions with a single way to sign on to local healthcare sites and online services for healthcare professionals.
Asuris Northwest
Health First Choice Health Group Health
Cooperative LifeWise Health Plan
of Arizona LifeWise Health Plan
of Oregon Premera Blue Cross Regence BlueShield Regence BlueCross
BlueShield of Oregon Uniform Medical Plan
Providence Health
System
Office Ally
Toolkit
Healthcare Career
Network
Custom Coding Books
ChartConnect MedManager
DrFirst Rcopia
ChartConnect
ResultManager
Providence Health
and Services
You can use your OneHealthPort credential to access these services but must register for each
service separately and pay any applicable fees.
Current Subscribers: Also register
here for additional timesaving
services.
Subscribers: Want to get quickly
to the sites you visit most often?
Create a customized view of your
OneHealthPort sites.
Informational PDFs - Download informational sheets on OneHealthPort or any of the services we offer. More
Purchase your 2007 coding package now, and get a free Procedural Custom Coder(TM) featuring online look-up for all codes and quarterly email updates when codes change.
Page 1 of 2OneHealthPort
9/1/2006http://www.onehealthport.com/
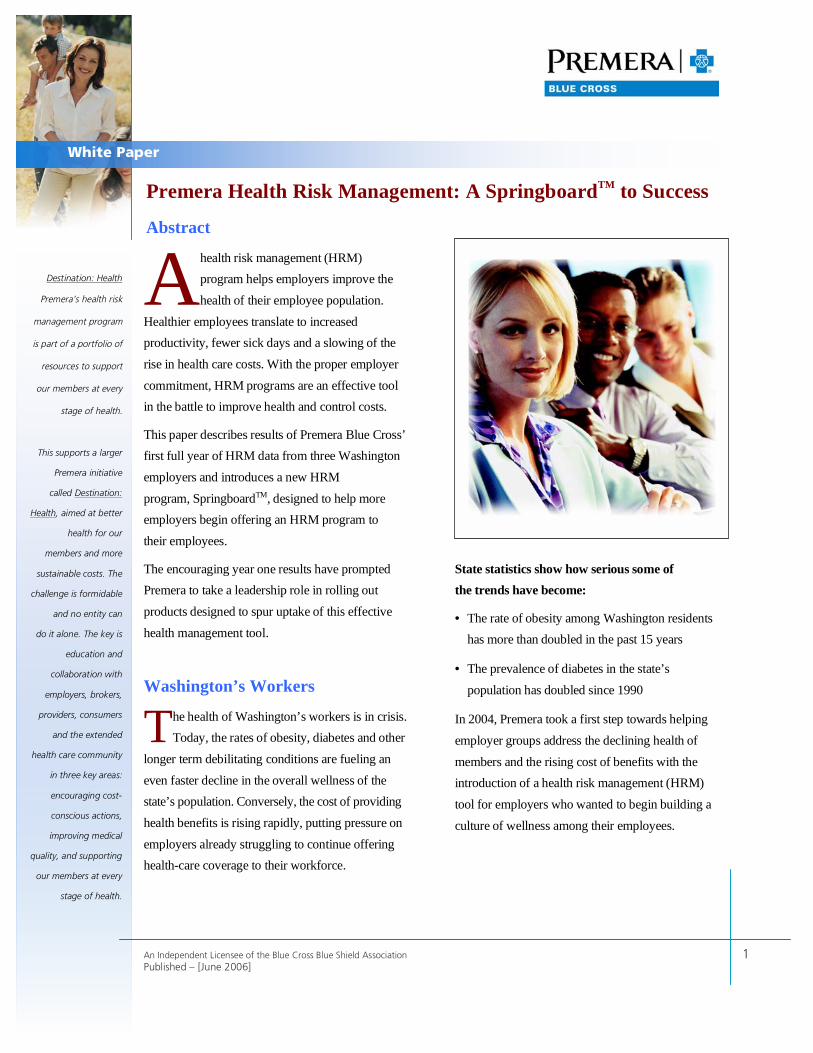
An Independent Licensee of the Blue Cross Blue Shield Association 1 Published – [June 2006]
Destination: Health
Premera’s health risk
management program
is part of a portfolio of
resources to support
our members at every
stage of health.
This supports a larger
Premera initiative
called Destination:
Health, aimed at better
health for our
members and more
sustainable costs. The
challenge is formidable
and no entity can
do it alone. The key is
education and
collaboration with
employers, brokers,
providers, consumers
and the extended
health care community
in three key areas:
encouraging cost-
conscious actions,
improving medical
quality, and supporting
our members at every
stage of health.
White Paper Premera Health Risk Management: A SpringboardTM to Success
Abstract
health risk management (HRM) program helps employers improve the health of their employee population.
Healthier employees translate to increased productivity, fewer sick days and a slowing of the rise in health care costs. With the proper employer commitment, HRM programs are an effective tool in the battle to improve health and control costs.
This paper describes results of Premera Blue Cross’ first full year of HRM data from three Washington employers and introduces a new HRM program, SpringboardTM, designed to help more employers begin offering an HRM program to their employees.
The encouraging year one results have prompted Premera to take a leadership role in rolling out products designed to spur uptake of this effective health management tool.
Washington’s Workers
he health of Washington’s workers is in crisis. Today, the rates of obesity, diabetes and other
longer term debilitating conditions are fueling an even faster decline in the overall wellness of the state’s population. Conversely, the cost of providing health benefits is rising rapidly, putting pressure on employers already struggling to continue offering health-care coverage to their workforce.
State statistics show how serious some of the trends have become:
• The rate of obesity among Washington residents has more than doubled in the past 15 years
• The prevalence of diabetes in the state’s population has doubled since 1990
In 2004, Premera took a first step towards helping employer groups address the declining health of members and the rising cost of benefits with the introduction of a health risk management (HRM) tool for employers who wanted to begin building a culture of wellness among their employees.
A
T
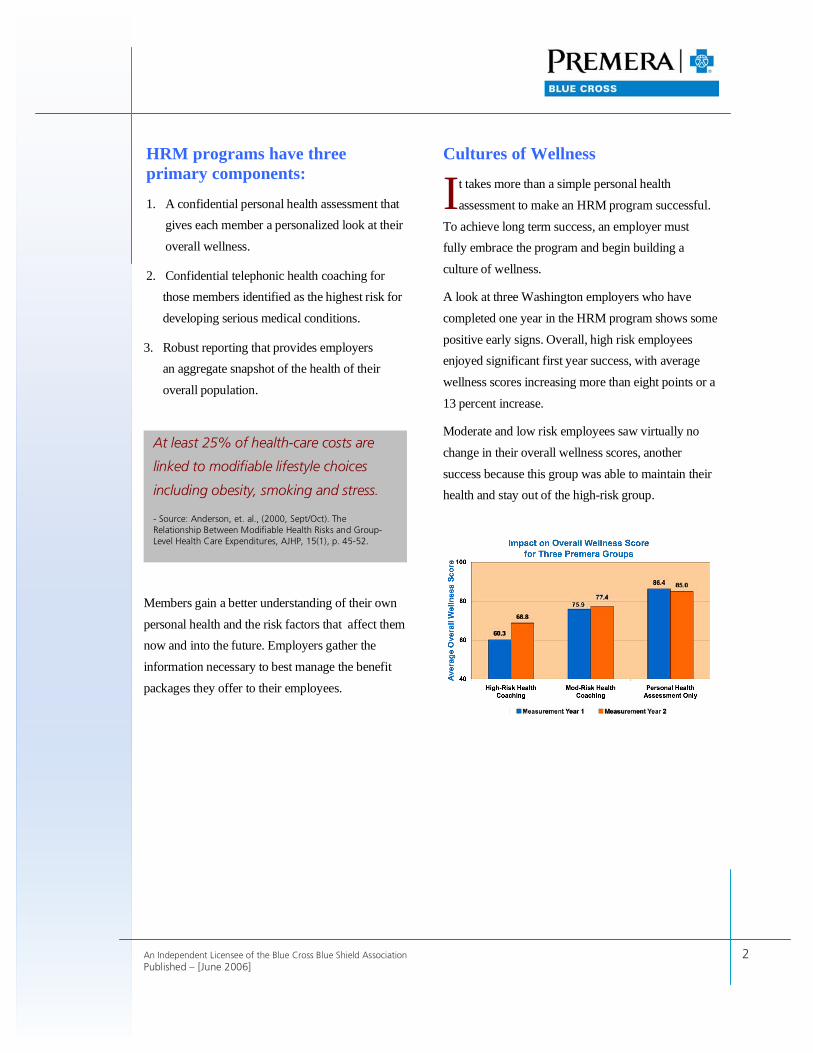
An Independent Licensee of the Blue Cross Blue Shield Association 2 Published – [June 2006]
HRM programs have three primary components:
1. A confidential personal health assessment that gives each member a personalized look at their overall wellness.
2. Confidential telephonic health coaching for those members identified as the highest risk for developing serious medical conditions.
3. Robust reporting that provides employers an aggregate snapshot of the health of their overall population.
Members gain a better understanding of their own personal health and the risk factors that affect them now and into the future. Employers gather the information necessary to best manage the benefit packages they offer to their employees.
Cultures of Wellness
t takes more than a simple personal health assessment to make an HRM program successful.
To achieve long term success, an employer must fully embrace the program and begin building a culture of wellness.
A look at three Washington employers who have completed one year in the HRM program shows some positive early signs. Overall, high risk employees enjoyed significant first year success, with average wellness scores increasing more than eight points or a 13 percent increase.
Moderate and low risk employees saw virtually no change in their overall wellness scores, another success because this group was able to maintain their health and stay out of the high-risk group.
I
At least 25% of health-care costs are
linked to modifiable lifestyle choices
including obesity, smoking and stress.
- Source: Anderson, et. al., (2000, Sept/Oct). The Relationship Between Modifiable Health Risks and Group-Level Health Care Expenditures, AJHP, 15(1), p. 45-52.
An Independent Licensee of the Blue Cross Blue Shield Association 3 Published – [June 2006]
A “SpringboardTM” to Success
he year one results have prompted Premera to take another step forward with the introduction of its SpringboardTM program. The idea: encourage more employers to implement HRM programs by removing
financial barriers to entry.
Premera will provide a two-year financial incentive to employers based upon the cost of the HRM product. Claims savings in year three and beyond are expected to offset the cost of continuing the HRM program.
SpringboardTM at-a-glance:
Employer Requirements
• Fully-insured
• 200+ employees
• 40% minimum employee participation (may include enrolled spouses) in the Personal Health Assessment
• 50% minimum active participation in the coaching program (of those identified as high-risk)
• Employer-sponsored wellness incentive plan
• Medical and pharmacy benefits must be offered exclusively through Premera
Program Components For employees:
• Personal Health Assessment and confidential participants’ health report
• Telephone health coaching
For employers:
• High-quality management reporting
• Communication Kit to inform employees and promote participation
Program Costs and Savings
• Employer is responsible to pay for HRM services delivered by Summex
• Employer is responsible for the cost and administration of the wellness incentive plan
• In the first year, Premera adjusts projected claims based on estimated costs for HRM services
• In the second year, Premera adjusts projected claims to reflect actual costs for first-year HRM services
• Over time, upward trending of health care costs can be lowered and stabilized
• High-quality reporting allows employer to target risks and opportunities to drive down costs even further
T
An Independent Licensee of the Blue Cross Blue Shield Association 4 Published – [June 2006]
About Premera Blue Cross
Our mission is to provide peace of mind to our members about their health-care coverage. We provide health insurance and related services to more than 1.3 million people. Premera Blue Cross has operated in Washington since 1933, and Alaska since 1957. Premera Blue Cross is an independent licensee of the Blue Cross Blue Shield Association.
Premera Blue Cross is a member of a family of companies based in Mountlake Terrace, Washington, that provide health, life, vision, dental, and long-term care insurance, and other related services.
PREMERA BLUE CROSS NEWS RELEASE Page 1
PRESS RELEASE
NEW PREMERA DATA SHOWS WELLNESS AT WORK CAN BUCK THE TREND OF GENERAL HEALTH DECLINE
PREMERA ANNOUNCES NOVEL SPRINGBOARD™ PROGRAM -- INSURER WILL SUBSIDIZE UP TO
TWO YEARS OF EMPLOYERS’ PROGRAM COSTS FOR EMPLOYEES’ PERSONAL HEALTH ASSESSMENTS AND PERSONAL HEALTH COACHING
Premera Introduces Health Risk Management Program at 10 a.m. on June 14 at News
Conference being held at the Edgewater Hotel in Seattle MOUNTLAKE TERRACE, WA – (June 14, 2006) – To help employers assist their employees in preventing poor health conditions that result from unhealthy lifestyles, Premera Blue Cross announced today encouraging results by Washington state employers adopting health risk management (HRM) programs -- and introduced a new program, Springboard™, designed to dramatically accelerate the rate at which employers can build a culture of wellness in their workplace and inspire their employees to adopt healthier habits. “Employers increasingly are considering HRM programs to address declining workplace health and rising healthcare costs,” said Gubby Barlow, CEO of Premera Blue Cross. “We’re launching Springboard™ to enhance support for our members at every stage of health. This is part of a larger effort aimed at twin goals of better health and more sustainable costs for our members.” With Washington state health officials, prominent employers and consultants, Premera announced the Springboard™ program, which will subsidize up to two years of HRM program costs -- including annual confidential personal health assessments and personal health coaching -- for mid-size and larger employer groups in every state the company serves, as a way to jump-start efforts to improve employee wellness in the Northwest. “The health challenges facing Washington residents have never been greater,” said Maxine Hayes, MD, Washington State Health Officer. “Increased rates of obesity, diabetes and other
PO Box 327 Seattle, WA 98111-0327
Contact: Mark W. Stuart Media Relations Manager
(425) 918-3297 office (425) 931-7379 cell
OR Scott Forslund
Communications Director (425) 918-5070 office
(425) 280-1653 cell
PREMERA BLUE CROSS NEWS RELEASE Page 2
preventable conditions combined with decreased amounts of physical activity are putting more people at risk for fast declining health later in life.” Premera’s analysis, involving results from three major Washington corporations, shows a clear opposite, positive trend. The first year HRM results from these employer groups demonstrate that every employer saw significant improvement in a single year for employees identified as high risk, while keeping moderate to low risk groups from moving into the high risk category. “Personal health assessments and personal health coaching work. These results, in context with longer term studies, are exceptionally encouraging,” said Dave Johnson, MD, regional medical director for Premera Blue Cross. “We’re seeing a dramatic improvement in wellness in a short period of time.” Other studies show a strong correlation between improved wellness scores and fewer sick days, increased productivity and reduced health-care costs for the employer, Dr. Johnson noted. “We are hopeful these employer groups will take a similar track,” Dr. Johnson said. “Our employer groups using HRM programs in the past have already begun seeing the benefits of a healthier employee population,” said Barlow. “We expect that Springboard™ will allow more employers to take the important first step to building a culture of wellness in their workplace.” For employers interested in a more intensive HRM program including components such as on-site biometric testing and participation in a multi-employer trust, ClearAdvantage (a Premera program) is offered through ClearPoint, LLC. The trust is expected to be formed by Fall 2006. Premera will be holding a news conference to discuss the results and the new Springboard™ program. The conference will be held at the Edgewater Hotel in Seattle, WA (2411 Alaskan Way, Pier 67) beginning at 10 a.m. Members of the media may also listen to the news conference on the web at www.pugetsoundvideo.net. After entering the site, click on the Premera Blue Cross tab on the left. When the Premera logo appears at the top, click on it and that will open a windows media player showing the meeting live. A white paper is linked to this news release at www.premera.com/newsroom. About Premera Blue Cross
Our mission is to provide peace of mind to our members about their health-care coverage. We provide health insurance and related services to more than 1.3 million people. Premera Blue Cross has operated in Washington since 1933, and Alaska since 1957. Premera Blue Cross is an independent licensee of the Blue Cross Blue Shield Association.
Premera Blue Cross is a member of a family of companies based in Mountlake Terrace, Washington, that provide health, life, vision, dental, and long-term care insurance, and other related services.
###
Start | Health Topics | Hospitals | Treatment Costs | Tools & Resources | Exit
Health Topics
Decision Guide - If you would like to learn how you can be guided through a decision process for a Health Topic, click here.
Choose a Health Topic Area to view available Health Topics:
Accidents and Injuries Adolescent Health Allergies and Asthma Bone, Joint and Muscle Brain and Nervous System Cancer Children's Health (Pediatrics) Diabetes Digestive/Gastroenterology Ear, Nose and Throat Endocrine, Nutritional and Metabolic Eye Geriatric (Senior) Health Gynecology (Female Reproductive System)Heart and Circulatory System Kidney and Urinary Tract Maternal and Childbirth Men's Health Respiratory, Pulmonary and Lung Skin/Dermatology Transplants Women's Health
Search the Healthcare Advisor™
Search the Healthcare Advisor™ for a wealth of resources to help you make better health care decisions.
Search
Hospitals
Find and Compare Hospitals Search for hospitals in your area. Research their experience with specific Procedures or other Types of Care.
Treatment Costs
Estimate Treatment Costs Get estimated costs for specific services, tests, physician visits, and medications.
Tools & Resources
Questions to Ask Your Doctor Be prepared to discuss your situation with your healthcare provider. Questions to Ask Your Insurance Company Get a list of questions to discuss with your benefits provider. Medical Encyclopedia Research articles from a large illustrated medical encyclopedia. Use the
Page 1 of 2Healthcare Advisor™
9/1/2006https://www1.subimo.com/hca/app/premerawa/View/Start?ProviderDirectory=https://www.premera.com/portals/member/provide...
Or click here to view all Health Topics.
Can't find what you're looking for? Click here for tips to help you find your topic.
We comply with the HONcode standard for health trust worthy information: verify here.
Search function or browse the Medical Encyclopedia. Community Discussions Ask the advice of other people and provide input about any Health Topic. Links and Resources Links to other resources, including useful web sites, organized by Healthcare Topic.
Disclaimer: Medical Information is Not Medical Advice This site provides information about health issues designed to help users make better decisions. But medical information is not the same as medical advice -- the application of medicine to an individual's specific circumstances. This information is not meant as a substitute for medical advice that you would receive from your own physician or health care professional. You should not use the information on this site for treating a health problem or disease, or prescribing any medication. You should consult a physician if you want professional assurance that the information is appropriate to your particular situation. We specifically disclaim any guarantee or warranty, express or implied, with respect to any of the products or services mentioned on this site. No information conveyed by Subimo, LLC shall create such a warranty. Read our complete Terms and Conditions for using this site. They apply to you and, by using this site, you agree to all of them. Terms and Conditions Last Updated: February 2006
Privacy Policy | Terms and Conditions | Contact Us | FAQs
Sources and Methodologies | Printer-Friendly Version of This Page
All information is intended for your general use only and is not a substitute for medical advice or treatment for specific medical conditions. You should seek prompt medical care for any specific health issues and consult your physician before taking any action on your health. Use of this online service is subject to the Terms and Conditions. "Subimo" is the trademark of Subimo, LLC. Subimo provides unbiased healthcare information and accepts no advertising. This site may be sponsored by your health plan or employer strictly as a benefit. © 2004, Subimo. All Rights Reserved.
Premera Blue Cross is an independent Licensee of the Blue Cross Blue Shield Association
Page 2 of 2Healthcare Advisor™
9/1/2006https://www1.subimo.com/hca/app/premerawa/View/Start?ProviderDirectory=https://www.premera.com/portals/member/provide...
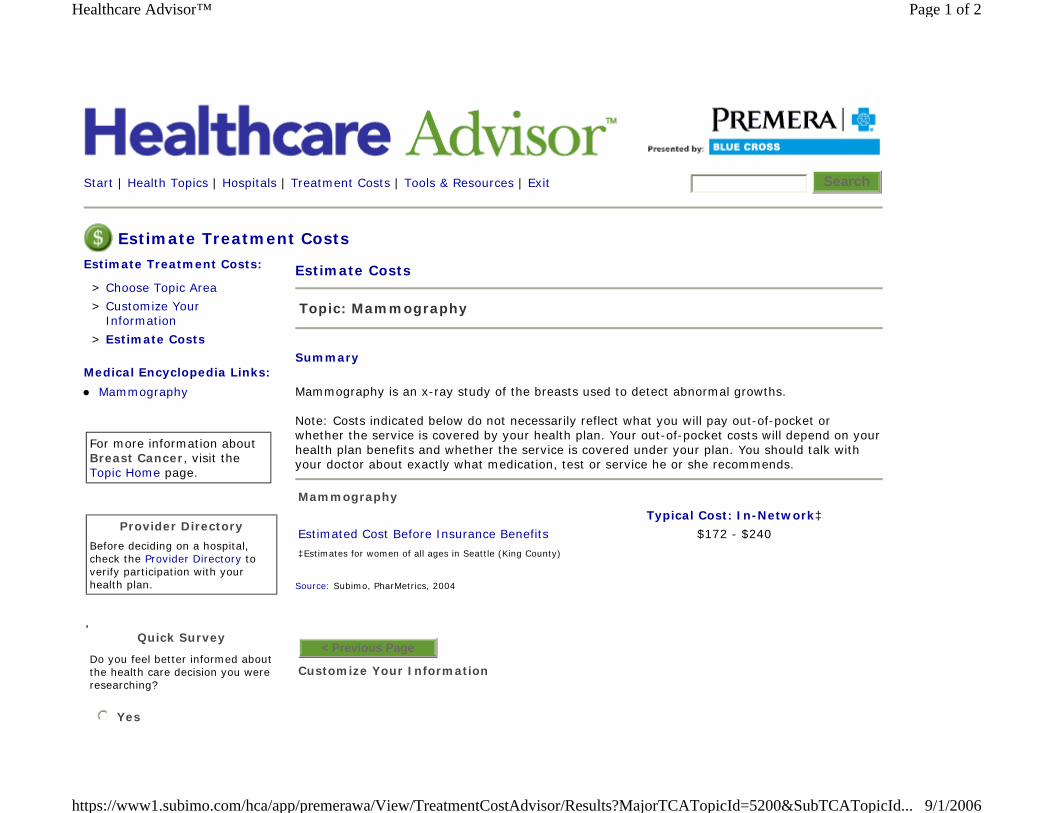
Start | Health Topics | Hospitals | Treatment Costs | Tools & Resources | Exit Search
Estimate Treatment Costs
Estimate Treatment Costs:
Medical Encyclopedia Links:
Mammography
> Choose Topic Area
> Customize Your Information
> Estimate Costs
For more information about Breast Cancer, visit the Topic Home page.
Provider Directory
Before deciding on a hospital, check the Provider Directory to verify participation with your health plan.
Quick Survey
Do you feel better informed about the health care decision you were researching?
Yes nmlkj
Estimate Costs
Summary
Mammography is an x-ray study of the breasts used to detect abnormal growths. Note: Costs indicated below do not necessarily reflect what you will pay out-of-pocket or whether the service is covered by your health plan. Your out-of-pocket costs will depend on your health plan benefits and whether the service is covered under your plan. You should talk with your doctor about exactly what medication, test or service he or she recommends.
Source: Subimo, PharMetrics, 2004
Topic: Mammography
Mammography
Typical Cost: In-Network‡
Estimated Cost Before Insurance Benefits $172 - $240
‡Estimates for women of all ages in Seattle (King County)
Customize Your Information
< Previous Page
Page 1 of 2Healthcare Advisor™
9/1/2006https://www1.subimo.com/hca/app/premerawa/View/TreatmentCostAdvisor/Results?MajorTCATopicId=5200&SubTCATopicId...
No
Somewhat
nmlkj
nmlkj Submit
Privacy Policy | Terms and Conditions | Contact Us | FAQs
Sources and Methodologies | Printer-Friendly Version of This Page
All information is intended for your general use only and is not a substitute for medical advice or treatment for specific medical conditions. You should seek prompt medical care for any specific health issues and consult your physician before taking any action on your health. Use of this online service is subject to the Terms and Conditions. "Subimo" is the trademark of Subimo, LLC. Subimo provides unbiased healthcare information and accepts no advertising. This site may be sponsored by your health plan or employer strictly as a benefit. © 2004, Subimo. All Rights Reserved.
Premera Blue Cross is an independent Licensee of the Blue Cross Blue Shield Association
Page 2 of 2Healthcare Advisor™
9/1/2006https://www1.subimo.com/hca/app/premerawa/View/TreatmentCostAdvisor/Results?MajorTCATopicId=5200&SubTCATopicId...
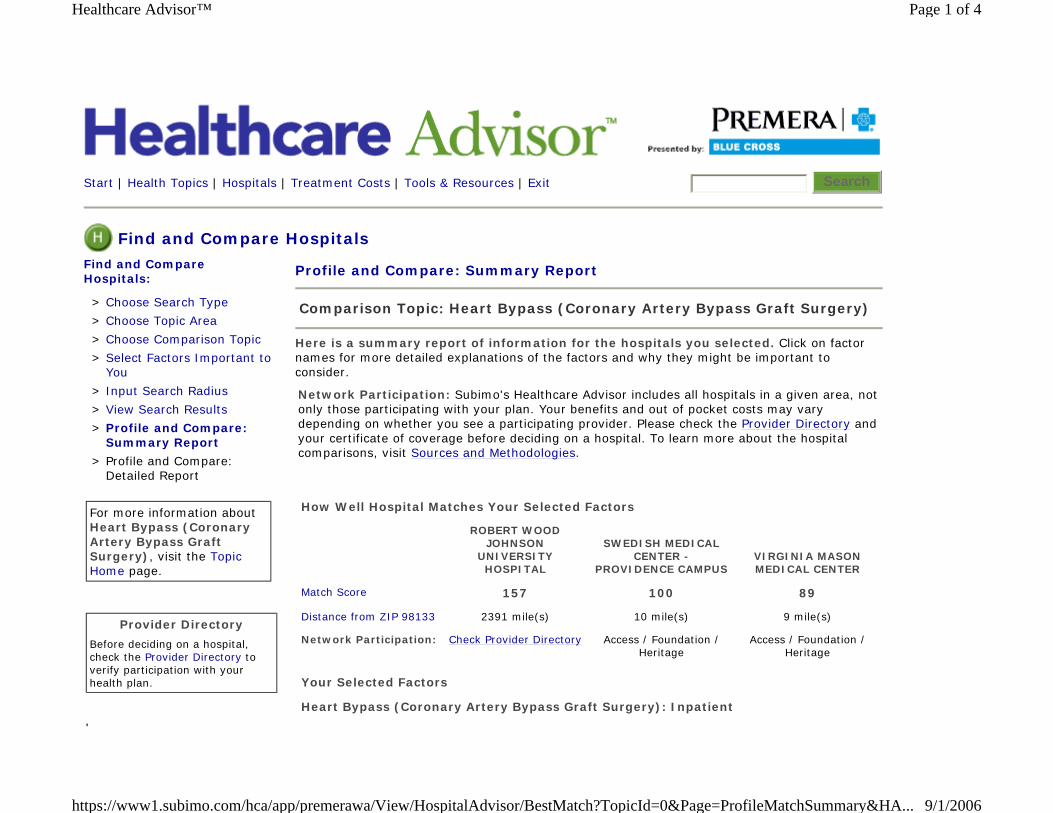
Start | Health Topics | Hospitals | Treatment Costs | Tools & Resources | Exit Search
Find and Compare Hospitals
Find and Compare Hospitals:
> Choose Search Type
> Choose Topic Area
> Choose Comparison Topic
> Select Factors Important to You
> Input Search Radius
> View Search Results
> Profile and Compare: Summary Report
> Profile and Compare: Detailed Report
For more information about Heart Bypass (Coronary Artery Bypass Graft Surgery), visit the Topic Home page.
Provider Directory
Before deciding on a hospital, check the Provider Directory to verify participation with your health plan.
Profile and Compare: Summary Report
Here is a summary report of information for the hospitals you selected. Click on factor names for more detailed explanations of the factors and why they might be important to consider.
Comparison Topic: Heart Bypass (Coronary Artery Bypass Graft Surgery)
Network Participation: Subimo's Healthcare Advisor includes all hospitals in a given area, not only those participating with your plan. Your benefits and out of pocket costs may vary depending on whether you see a participating provider. Please check the Provider Directory and your certificate of coverage before deciding on a hospital. To learn more about the hospital comparisons, visit Sources and Methodologies.
How Well Hospital Matches Your Selected Factors
ROBERT WOOD JOHNSON
UNIVERSITY HOSPITAL
SWEDISH MEDICAL CENTER -
PROVIDENCE CAMPUS VIRGINIA MASON MEDICAL CENTER
Match Score 157 100 89
Distance from ZIP 98133 2391 mile(s) 10 mile(s) 9 mile(s)
Network Participation: Check Provider Directory Access / Foundation / Heritage
Access / Foundation / Heritage
Your Selected Factors
Heart Bypass (Coronary Artery Bypass Graft Surgery): Inpatient
Page 1 of 4Healthcare Advisor™
9/1/2006https://www1.subimo.com/hca/app/premerawa/View/HospitalAdvisor/BestMatch?TopicId=0&Page=ProfileMatchSummary&HA...
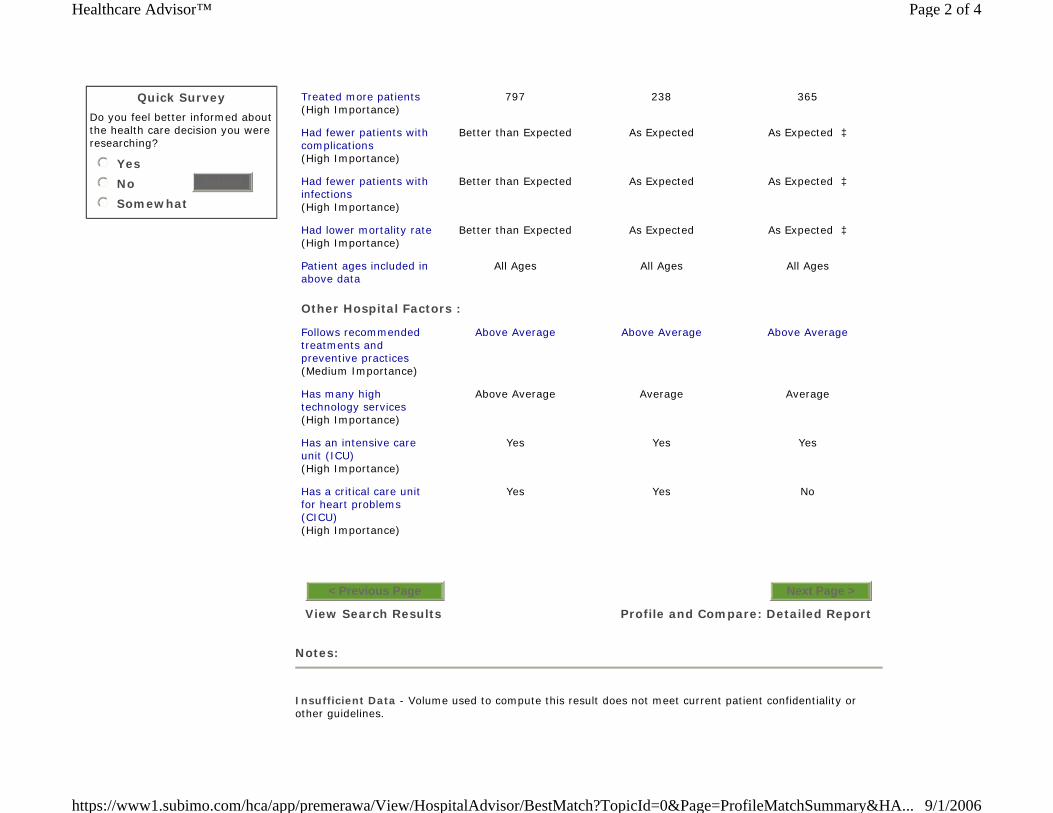
Quick Survey
Do you feel better informed about the health care decision you were researching?
Yes
No
Somewhat
nmlkj
nmlkj
nmlkj
Submit
Notes:
Insufficient Data - Volume used to compute this result does not meet current patient confidentiality or other guidelines.
Treated more patients (High Importance)
797 238 365
Had fewer patients with complications (High Importance)
Better than Expected As Expected As Expected ‡
Had fewer patients with infections (High Importance)
Better than Expected As Expected As Expected ‡
Had lower mortality rate (High Importance)
Better than Expected As Expected As Expected ‡
Patient ages included in above data
All Ages All Ages All Ages
Other Hospital Factors :
Follows recommended treatments and preventive practices (Medium Importance)
Above Average Above Average Above Average
Has many high technology services (High Importance)
Above Average Average Average
Has an intensive care unit (ICU) (High Importance)
Yes Yes Yes
Has a critical care unit for heart problems (CICU) (High Importance)
Yes Yes No
View Search Results
< Previous Page
Profile and Compare: Detailed Report
Next Page >
Page 2 of 4Healthcare Advisor™
9/1/2006https://www1.subimo.com/hca/app/premerawa/View/HospitalAdvisor/BestMatch?TopicId=0&Page=ProfileMatchSummary&HA...
Does Not Apply - Data not relevant to particular hospital situation.
‡ See discussion about outcomes and major teaching hospitals.
Actual complication, post-operative infection, and mortality rates (where displayed) for each hospital are compared to expected rates for that hospital. Expected (or predicted) rates are determined based on the types of patients each hospital sees and how sick the patients are. Hospitals with sicker patients typically have higher expected rates, and our methodology accounts for this.
** - If ** appears for How Well Hospital Matches Your Selected Factors, there were no hospitals in the search area that met your criteria, and it is not possible to provide a relative match score.
Click here for more on how how match scores are calculated for hospitals with Medicare only data vs. hospitals with state data.
Please note that some information about hospital services may reflect the capabilities of a broader hospital system, and not just this hospital location. You should contact the hospital directly to confirm its capabilities.
Learn more about the data Sources and Methodologies.
A hospital's performance on any of the factors you see here is not a guarantee of a good or bad outcome for you. We encourage you to consider multiple factors when choosing a hospital for care. And, we encourage you to seek out additional sources of information in your decision-making process, including talking to your physician and contacting hospitals directly. In addition to hospital information, you should understand your physician's experience.
The Leapfrog Group neither endorses nor warrants the quality of any data in this display other than The Leapfrog Group's data and neither endorses nor warrants the methodology used in this display to compile data from different sources.
Privacy Policy | Terms and Conditions | Contact Us | FAQs
Sources and Methodologies | Printer-Friendly Version of This Page
All information is intended for your general use only and is not a substitute for medical advice or treatment for specific medical conditions. You should seek prompt medical care for any specific health issues and consult your physician before taking any action on your health. Use of this online service is subject to the Terms and Conditions. "Subimo" is the trademark of Subimo, LLC. Subimo provides unbiased healthcare information and accepts no advertising. This site may be sponsored by your health plan or
Page 3 of 4Healthcare Advisor™
9/1/2006https://www1.subimo.com/hca/app/premerawa/View/HospitalAdvisor/BestMatch?TopicId=0&Page=ProfileMatchSummary&HA...
employer strictly as a benefit. © 2004, Subimo. All Rights Reserved.
Premera Blue Cross is an independent Licensee of the Blue Cross Blue Shield Association
Page 4 of 4Healthcare Advisor™
9/1/2006https://www1.subimo.com/hca/app/premerawa/View/HospitalAdvisor/BestMatch?TopicId=0&Page=ProfileMatchSummary&HA...
Ibt Nt\ttBork~nntSBusiness Day
REPRINI'EDWI11I
PERMISSION
THURSDAY, JUNE 1,2006
Low Payments by U.S.Raise Medical Bills Billions a Year
By MILT FREUDENHEIM
Employers and consumers are pay-ing billions of dollars more a yearfor medical care to compensate for
imbalances in the nation's health caresystem resulting from tight Medicareand Medicaid budgets, according to BlueCross officials and independentactuaries.
A new study commissioned by Pre-mera Blue Cross, based in Seattle, hasfound a rapid acceleration in higher coststo private payers in Washington State,for example, as hospitals and doctorsgrapple with constraints in the federalhealth insurance programs.
The study found that in 2004,the mostrecent year for which full data are avail-able, hospitals in Washington Statecharged an additional $738 million - or14.3percent of their revenue - to privatepayers to make up for Medicare andMedicaid underpayments. Similarly,doctors shifted $620 million, or 12 per-cent, said John Pickering, an actuary atMilliman Inc., a consulting and actuarialfirm that conducted the study.
A similar Milliman study in Californiafor 2004 said that health plans and con-sumers paid an additional $4.5billion forhospital care in that state to compensatefor Medicaid and Medicare constraints.
Milliman's California study, commis-sioned by Blue Shield of California, didnot include physicians' charges.
Will Fox, a Milliman actuary, said Cal-ifornia hospitals had been hit particular-ly hard by Medicare payment policies inthe last few years, "and there is no rea-son to think this has let up."
Other research has come to similarconclusions across the country. Unpaidhospital bills, largely for the uninsured,are costing about $45 billion nationally ayear and adding about 8.5 percent to thecost of health insurance for those who dopay, said Kenneth E. Thorpe, a healthcare economist at Emory University.
Employers said the rising cost trendswere, in turn, adding to the growing num-bers of people without insurance. Andwhen those people check into hospitals,they generate even higher costs for thoseemployers and consumers who pay in-surance premiums.
"This is a serious national problem,and it is only going to get much worse,"said Helen Darling, president of theNational Business Group on Health, aresearch and trade group for largeemployers. "There are more uninsured,the hospitals are inefficient, and everyyear, Medicare and Medicaid hold downon increases to cover rising medicalcosts," she said.
Rich Maturi, a senior vice president ofPremera, said the report would show"employers and policy makers that theyneeded to address an unsustainable trendin the growth of cost-shifting." Businessleaders, health plans and groups repre-senting hospitals and doctors plan tomeet in July to review the report andmake policy recommendations.
Although many state budgets are over-whelmed by rising Medicaid costs, healthcare reforms intended to reduce theranks of the uninsured that were recentlyenacted in Massachusetts and Vermontinclude more state money for Medicaid.Blue Cross Blue Shield of Massachusettsand Partners Healthcare, the largesthospital group in Boston, jointly support-ed the Medicaid increases.
"That was a real-world example of hos-pitals and insurers seeing that they hadcommon interests," said Paul Ginsberg,a health economist who is president ofthe Center for Studying Health SystemsChange, a nonprofit research group inWashington.
Hospitals across the country lost mon-ey on Medicare patients in 2003 after atleast six years of declining profitmargins, according to the latest reportby the Medicare Payment AdvisoryCommission, which advises Congressand federal officials.
Copyright (Q2006, by The New York Times Company. Reprinted with permission.For subscriptions to The New York Times, please call 1-800-NYTIMES. Visit us online at www.nytimes.com.
For more information about reprints contact PARS International Corp. at 212-221-9595 x21O.
-------- - "'- - - -
PP AA YY MM EE NN TT LL EE VV EE LL CC OO MM PP AA RR II SS OO NN
BB EE TT WW EE EE NN PP UU BB LL II CC PP RR OO GG RR AA MM SS AA NN DD
CC OO MM MM EE RR CC II AA LL HH EE AA LL TT HH PP LL AA NN SS FF OO RR
WW AA SS HH II NN GG TT OO NN SS TT AA TT EE HH OO SS PP II TT AA LL SS AA NN DD
PP HH YY SS II CC II AA NN SS
Presented by: Will Fox, FSA, MAAA
John Pickering, FSA, MAAA
May 2006
PP AA YY MM EE NN TT LL EE VV EE LL CC OO MM PP AA RR II SS OO NN BB EE TT WW EE EE NN PP UU BB LL II CC PP RR OO GG RR AA MM SS AA NN DD CC OO MM MM EE RR CC II AA LL HH EE AA LL TT HH PP LL AA NN SS FF OO RR WW AA SS HH II NN GG TT OO NN SS TT AA TT EE HH OO SS PP II TT AA LL SS
At the request of Premera Blue Cross, Milliman, Inc. has prepared this comparison of healthcare provider payment levels between public programs and commercial health plans in Washington State. Separate comparisons are presented for hospitals and physicians. For hospitals, we have analyzed financial statements for fiscal years 1995 through 2004, and quantified the cost shift from Medicare and Medicaid to other payers. For physicians, we have compared current fee schedules and quantified the payment level differences between public and commercial payers. We understand that this paper will be shared with hospitals, physicians, employer groups, legislators and others to support a constructive dialogue between all stakeholders regarding provider payment rates paid by public programs. FINDINGS
In recent years, Washington hospitals have incurred increasingly large losses on Medicare and Medicaid business. At the same time, margins on commercial business have increased. This phenomenon can be thought of as a cost shift from the public programs to commercial payers. That is, if Medicare and Medicaid had paid higher hospital rates, commercial payer rates could have been lower with hospitals still achieving the same net patient service operating margins. Similarly, Medicare and Medicaid fee-for-service physician rates are significantly lower than market rates paid by commercial PPOs in Washington. While publicly available financial statements that would enable quantifying gains and losses by payer type are not available for physician services in total, as they are for hospitals, the payment rate differences suggest a subsidization of public payers by those who pay commercial rates. HOSPITAL PAYMENT LEVEL COMPARISON
Our hospital findings are based on analysis of Washington State hospital financial statements for fiscal years 1995 through 2004, as reported by the Washington State Department of Health. We have reviewed the data for reasonableness, but have not audited or independently verified the data. If the data is inaccurate or incomplete, the results of our analysis may likewise by inaccurate or incomplete. The Department of Health reported financials are sufficient to separate Medicare, Medicaid, and all other payers into separate categories. The “all other” category is dominated by commercial insurance payers, but also includes payers such as self-pay, Workers’ Compensation, and other government programs. Throughout this paper, we refer to the “all other” segment as “Commercial.” In order to focus on payment level differences by payer category, only patient related financial results are included in our analysis. Specifically, non-operating, tax, and other operating revenue and expense are excluded.
MILLIMAN, INC. - 1 -
This work product was prepared solely to provide assistance to Premera Blue Cross. Milliman does not intend to benefit and assumes no duty or liability to other parties who receive this work. Milliman recommends recipient be aided by its own actuary or other qualified professional when reviewing this Milliman report.
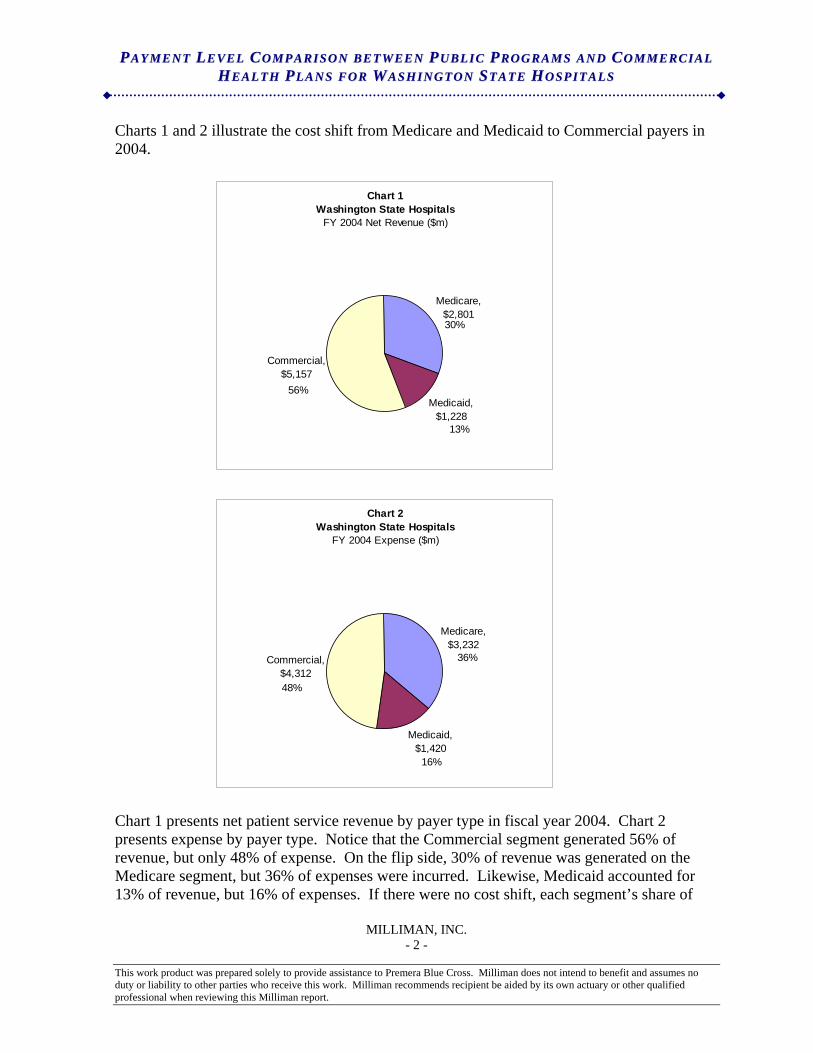
PP AA YY MM EE NN TT LL EE VV EE LL CC OO MM PP AA RR II SS OO NN BB EE TT WW EE EE NN PP UU BB LL II CC PP RR OO GG RR AA MM SS AA NN DD CC OO MM MM EE RR CC II AA LL HH EE AA LL TT HH PP LL AA NN SS FF OO RR WW AA SS HH II NN GG TT OO NN SS TT AA TT EE HH OO SS PP II TT AA LL SS
MILLIMAN, INC. - 2 -
Charts 1 and 2 illustrate the cost shift from Medicare and Medicaid to Commercial payers in 2004.
Chart 1Washington State Hospitals
FY 2004 Net Revenue ($m)
Medicare, $2,801
Medicaid, $1,228
Commercial, $5,157
56%
30%
13%
Chart 2Washington State Hospitals
FY 2004 Expense ($m)
Medicare, $3,232
Medicaid, $1,420
Commercial, $4,312
36%
16%
48%
Chart 1 presents net patient service revenue by payer type in fiscal year 2004. Chart 2 presents expense by payer type. Notice that the Commercial segment generated 56% of revenue, but only 48% of expense. On the flip side, 30% of revenue was generated on the Medicare segment, but 36% of expenses were incurred. Likewise, Medicaid accounted for 13% of revenue, but 16% of expenses. If there were no cost shift, each segment’s share of
This work product was prepared solely to provide assistance to Premera Blue Cross. Milliman does not intend to benefit and assumes no duty or liability to other parties who receive this work. Milliman recommends recipient be aided by its own actuary or other qualified professional when reviewing this Milliman report.
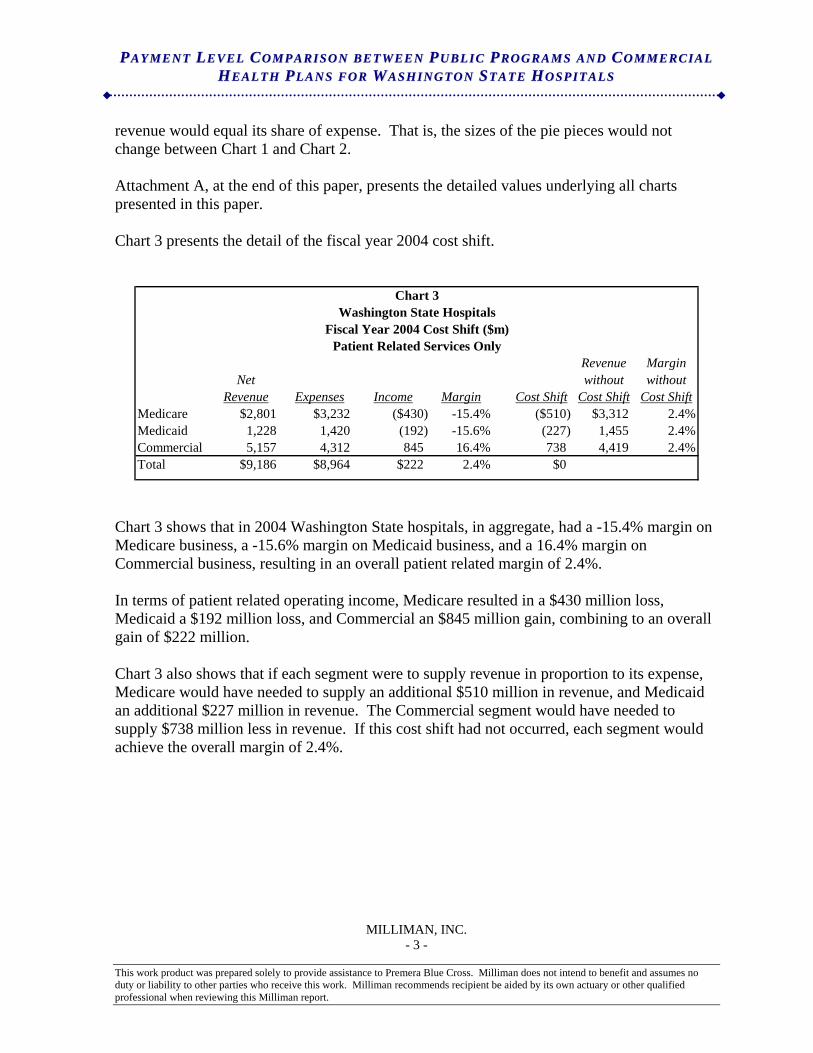
PP AA YY MM EE NN TT LL EE VV EE LL CC OO MM PP AA RR II SS OO NN BB EE TT WW EE EE NN PP UU BB LL II CC PP RR OO GG RR AA MM SS AA NN DD CC OO MM MM EE RR CC II AA LL HH EE AA LL TT HH PP LL AA NN SS FF OO RR WW AA SS HH II NN GG TT OO NN SS TT AA TT EE HH OO SS PP II TT AA LL SS
MILLIMAN, INC. - 3 -
revenue would equal its share of expense. That is, the sizes of the pie pieces would not change between Chart 1 and Chart 2. Attachment A, at the end of this paper, presents the detailed values underlying all charts presented in this paper. Chart 3 presents the detail of the fiscal year 2004 cost shift.
Chart 3Washington State Hospitals
Fiscal Year 2004 Cost Shift ($m)Patient Related Services Only
Revenue MarginNet without without
Revenue Expenses Income Margin Cost Shift Cost Shift Cost ShiftMedicare $2,801 $3,232 ($430) -15.4% ($510) $3,312 2.4%Medicaid 1,228 1,420 (192) -15.6% (227) 1,455 2.4%Commercial 5,157 4,312 845 16.4% 738 4,419 2.4%Total $9,186 $8,964 $222 2.4% $0
Chart 3 shows that in 2004 Washington State hospitals, in aggregate, had a -15.4% margin on Medicare business, a -15.6% margin on Medicaid business, and a 16.4% margin on Commercial business, resulting in an overall patient related margin of 2.4%. In terms of patient related operating income, Medicare resulted in a $430 million loss, Medicaid a $192 million loss, and Commercial an $845 million gain, combining to an overall gain of $222 million. Chart 3 also shows that if each segment were to supply revenue in proportion to its expense, Medicare would have needed to supply an additional $510 million in revenue, and Medicaid an additional $227 million in revenue. The Commercial segment would have needed to supply $738 million less in revenue. If this cost shift had not occurred, each segment would achieve the overall margin of 2.4%.
This work product was prepared solely to provide assistance to Premera Blue Cross. Milliman does not intend to benefit and assumes no duty or liability to other parties who receive this work. Milliman recommends recipient be aided by its own actuary or other qualified professional when reviewing this Milliman report.
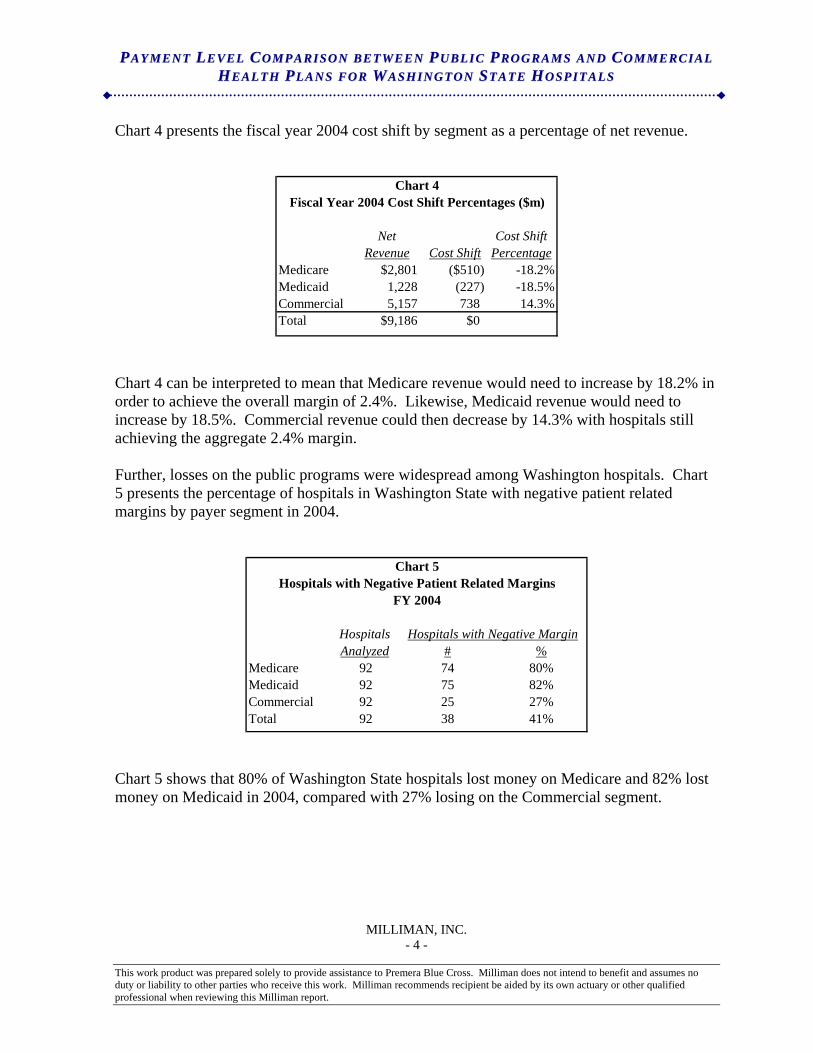
PP AA YY MM EE NN TT LL EE VV EE LL CC OO MM PP AA RR II SS OO NN BB EE TT WW EE EE NN PP UU BB LL II CC PP RR OO GG RR AA MM SS AA NN DD CC OO MM MM EE RR CC II AA LL HH EE AA LL TT HH PP LL AA NN SS FF OO RR WW AA SS HH II NN GG TT OO NN SS TT AA TT EE HH OO SS PP II TT AA LL SS
MILLIMAN, INC. - 4 -
Chart 4 presents the fiscal year 2004 cost shift by segment as a percentage of net revenue.
Chart 4Fiscal Year 2004 Cost Shift Percentages ($m)
Net Cost ShiftRevenue Cost Shift Percentage
Medicare $2,801 ($510) -18.2%Medicaid 1,228 (227) -18.5%Commercial 5,157 738 14.3%Total $9,186 $0
Chart 4 can be interpreted to mean that Medicare revenue would need to increase by 18.2% in order to achieve the overall margin of 2.4%. Likewise, Medicaid revenue would need to increase by 18.5%. Commercial revenue could then decrease by 14.3% with hospitals still achieving the aggregate 2.4% margin. Further, losses on the public programs were widespread among Washington hospitals. Chart 5 presents the percentage of hospitals in Washington State with negative patient related margins by payer segment in 2004.
Chart 5Hospitals with Negative Patient Related Margins
FY 2004
Hospitals Hospitals with Negative MarginAnalyzed # %
Medicare 92 74 80%Medicaid 92 75 82%Commercial 92 25 27%Total 92 38 41%
Chart 5 shows that 80% of Washington State hospitals lost money on Medicare and 82% lost money on Medicaid in 2004, compared with 27% losing on the Commercial segment.
This work product was prepared solely to provide assistance to Premera Blue Cross. Milliman does not intend to benefit and assumes no duty or liability to other parties who receive this work. Milliman recommends recipient be aided by its own actuary or other qualified professional when reviewing this Milliman report.
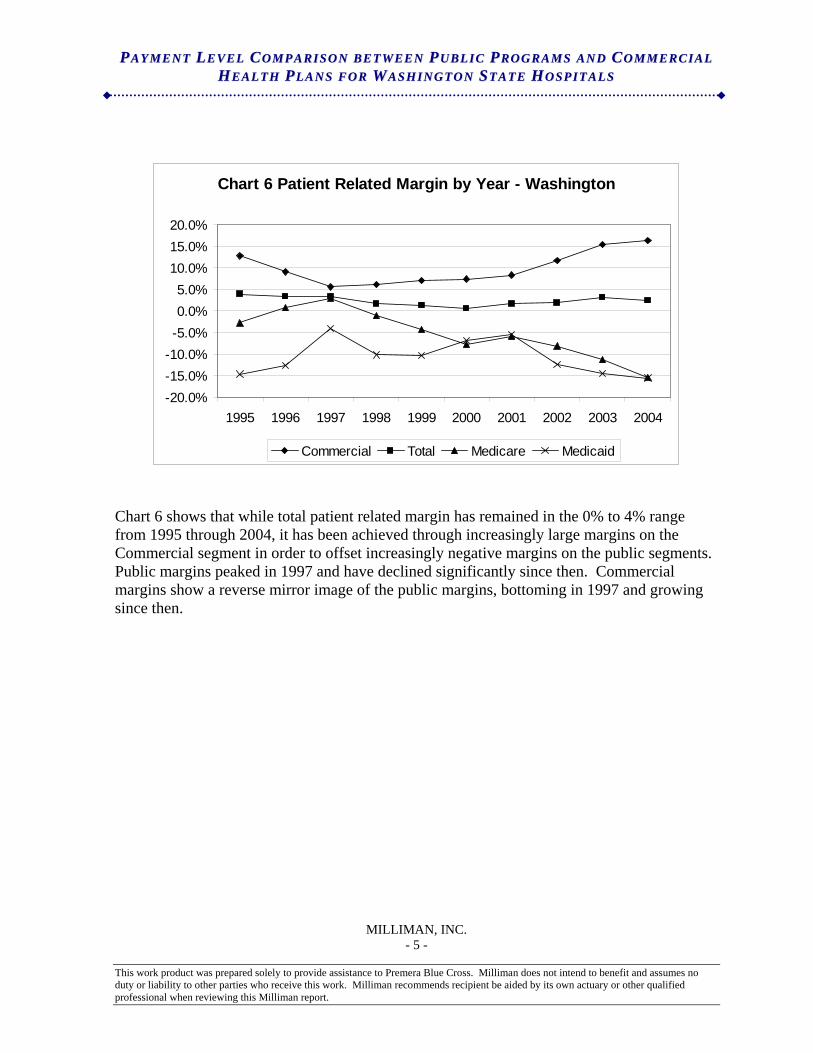
PP AA YY MM EE NN TT LL EE VV EE LL CC OO MM PP AA RR II SS OO NN BB EE TT WW EE EE NN PP UU BB LL II CC PP RR OO GG RR AA MM SS AA NN DD CC OO MM MM EE RR CC II AA LL HH EE AA LL TT HH PP LL AA NN SS FF OO RR WW AA SS HH II NN GG TT OO NN SS TT AA TT EE HH OO SS PP II TT AA LL SS
MILLIMAN, INC. - 5 -
Chart 6 Patient Related Margin by Year - Washington
-20.0%-15.0%-10.0%-5.0%0.0%5.0%
10.0%15.0%20.0%
1995 1996 1997 1998 1999 2000 2001 2002 2003 2004
Commercial Total Medicare Medicaid
Chart 6 shows that while total patient related margin has remained in the 0% to 4% range from 1995 through 2004, it has been achieved through increasingly large margins on the Commercial segment in order to offset increasingly negative margins on the public segments. Public margins peaked in 1997 and have declined significantly since then. Commercial margins show a reverse mirror image of the public margins, bottoming in 1997 and growing since then.
This work product was prepared solely to provide assistance to Premera Blue Cross. Milliman does not intend to benefit and assumes no duty or liability to other parties who receive this work. Milliman recommends recipient be aided by its own actuary or other qualified professional when reviewing this Milliman report.
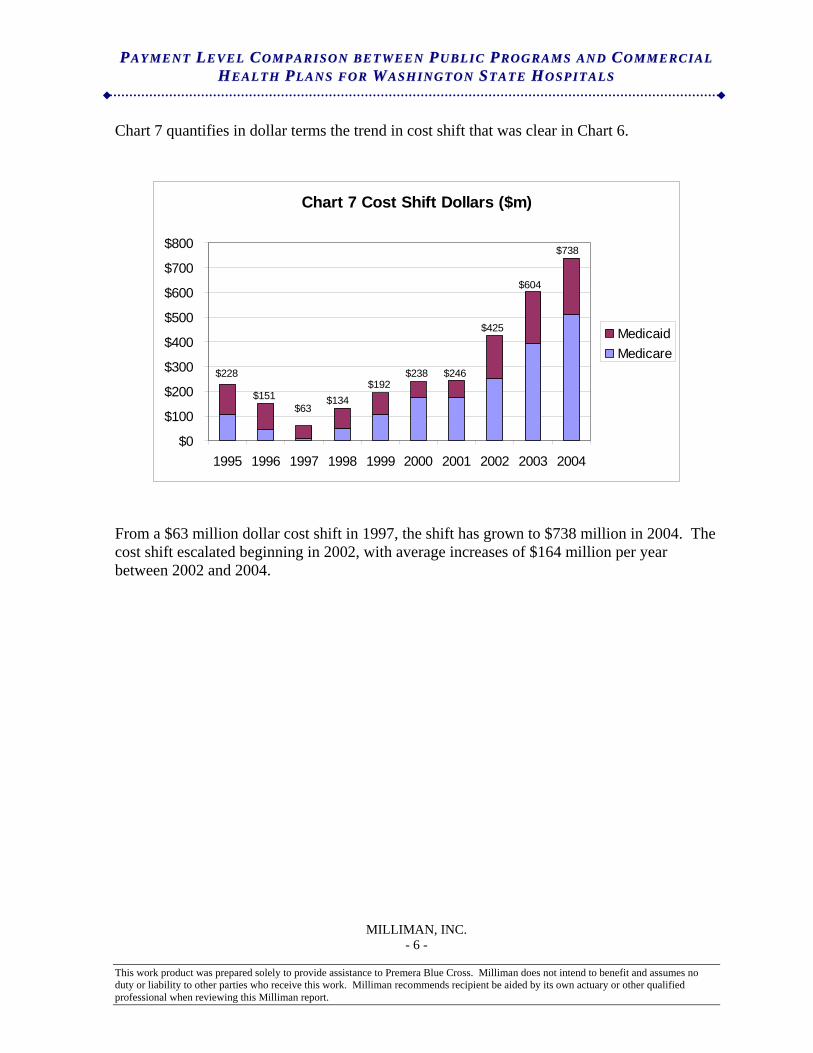
PP AA YY MM EE NN TT LL EE VV EE LL CC OO MM PP AA RR II SS OO NN BB EE TT WW EE EE NN PP UU BB LL II CC PP RR OO GG RR AA MM SS AA NN DD CC OO MM MM EE RR CC II AA LL HH EE AA LL TT HH PP LL AA NN SS FF OO RR WW AA SS HH II NN GG TT OO NN SS TT AA TT EE HH OO SS PP II TT AA LL SS
MILLIMAN, INC. - 6 -
Chart 7 quantifies in dollar terms the trend in cost shift that was clear in Chart 6.
Chart 7 Cost Shift Dollars ($m)
$0
$100
$200
$300
$400
$500
$600
$700
$800
1995 1996 1997 1998 1999 2000 2001 2002 2003 2004
MedicaidMedicare
$228
$738
$151
$604
$425
$246$238$192
$134$63
From a $63 million dollar cost shift in 1997, the shift has grown to $738 million in 2004. The cost shift escalated beginning in 2002, with average increases of $164 million per year between 2002 and 2004.
This work product was prepared solely to provide assistance to Premera Blue Cross. Milliman does not intend to benefit and assumes no duty or liability to other parties who receive this work. Milliman recommends recipient be aided by its own actuary or other qualified professional when reviewing this Milliman report.
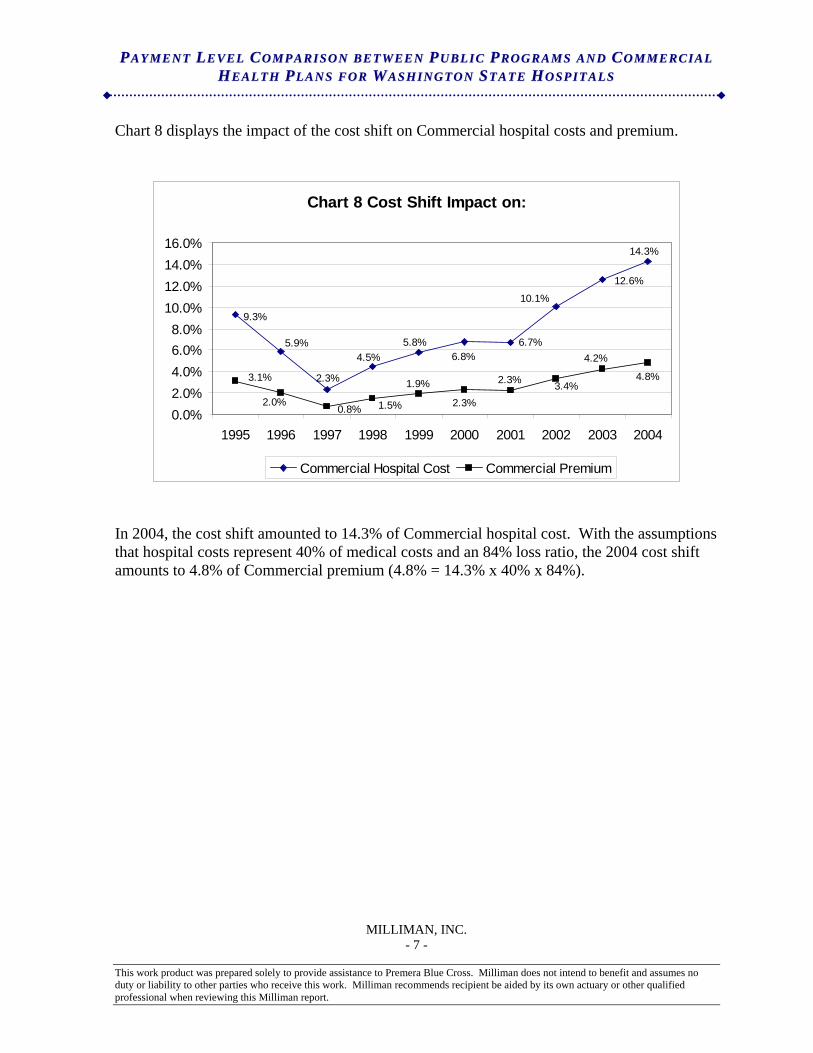
PP AA YY MM EE NN TT LL EE VV EE LL CC OO MM PP AA RR II SS OO NN BB EE TT WW EE EE NN PP UU BB LL II CC PP RR OO GG RR AA MM SS AA NN DD CC OO MM MM EE RR CC II AA LL HH EE AA LL TT HH PP LL AA NN SS FF OO RR WW AA SS HH II NN GG TT OO NN SS TT AA TT EE HH OO SS PP II TT AA LL SS
MILLIMAN, INC. - 7 -
Chart 8 displays the impact of the cost shift on Commercial hospital costs and premium.
Chart 8 Cost Shift Impact on:
6.7%
10.1%
2.3%
5.9%
9.3%
4.5%5.8%
6.8%
12.6%
14.3%
4.2%
3.4%2.3%
2.3%
1.9%
1.5%0.8%2.0%
3.1% 4.8%
0.0%2.0%4.0%6.0%8.0%
10.0%12.0%14.0%16.0%
1995 1996 1997 1998 1999 2000 2001 2002 2003 2004
Commercial Hospital Cost Commercial Premium
In 2004, the cost shift amounted to 14.3% of Commercial hospital cost. With the assumptions that hospital costs represent 40% of medical costs and an 84% loss ratio, the 2004 cost shift amounts to 4.8% of Commercial premium (4.8% = 14.3% x 40% x 84%).
This work product was prepared solely to provide assistance to Premera Blue Cross. Milliman does not intend to benefit and assumes no duty or liability to other parties who receive this work. Milliman recommends recipient be aided by its own actuary or other qualified professional when reviewing this Milliman report.
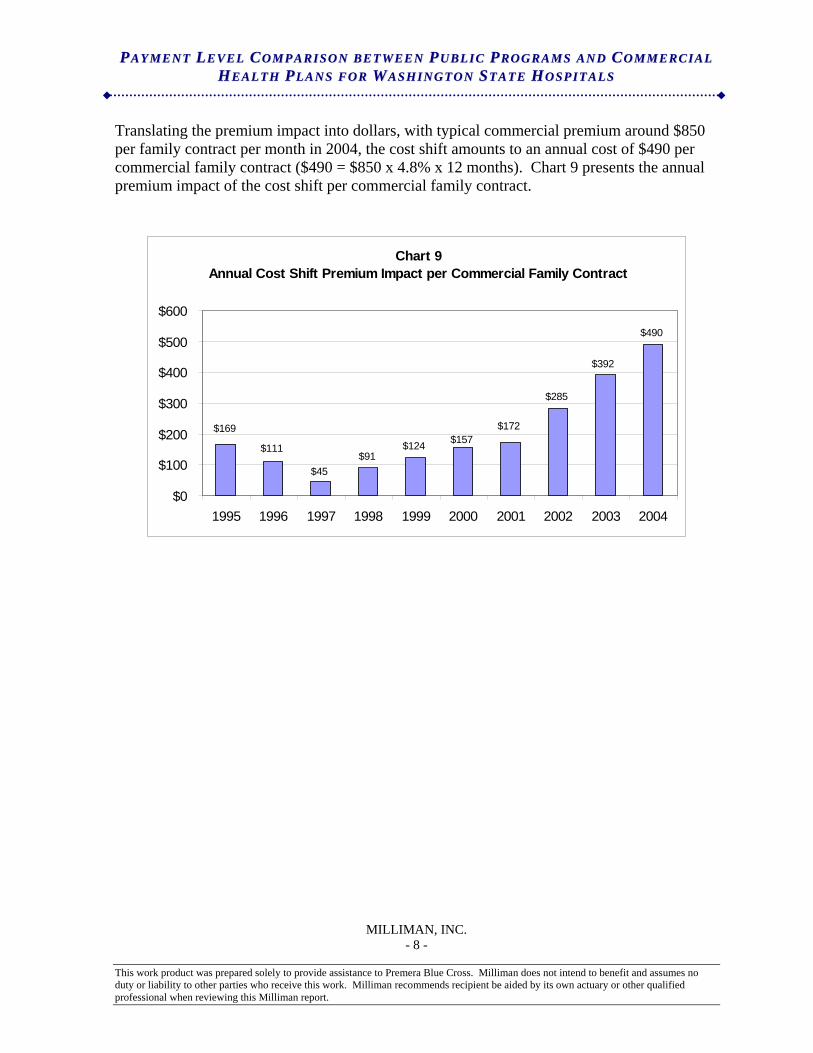
PP AA YY MM EE NN TT LL EE VV EE LL CC OO MM PP AA RR II SS OO NN BB EE TT WW EE EE NN PP UU BB LL II CC PP RR OO GG RR AA MM SS AA NN DD CC OO MM MM EE RR CC II AA LL HH EE AA LL TT HH PP LL AA NN SS FF OO RR WW AA SS HH II NN GG TT OO NN SS TT AA TT EE HH OO SS PP II TT AA LL SS
MILLIMAN, INC. - 8 -
Translating the premium impact into dollars, with typical commercial premium around $850 per family contract per month in 2004, the cost shift amounts to an annual cost of $490 per commercial family contract ($490 = $850 x 4.8% x 12 months). Chart 9 presents the annual premium impact of the cost shift per commercial family contract.
Chart 9 Annual Cost Shift Premium Impact per Commercial Family Contract
$91$124
$285
$490
$157$169
$111
$45
$172
$392
$0
$100
$200
$300
$400
$500
$600
1995 1996 1997 1998 1999 2000 2001 2002 2003 2004
This work product was prepared solely to provide assistance to Premera Blue Cross. Milliman does not intend to benefit and assumes no duty or liability to other parties who receive this work. Milliman recommends recipient be aided by its own actuary or other qualified professional when reviewing this Milliman report.
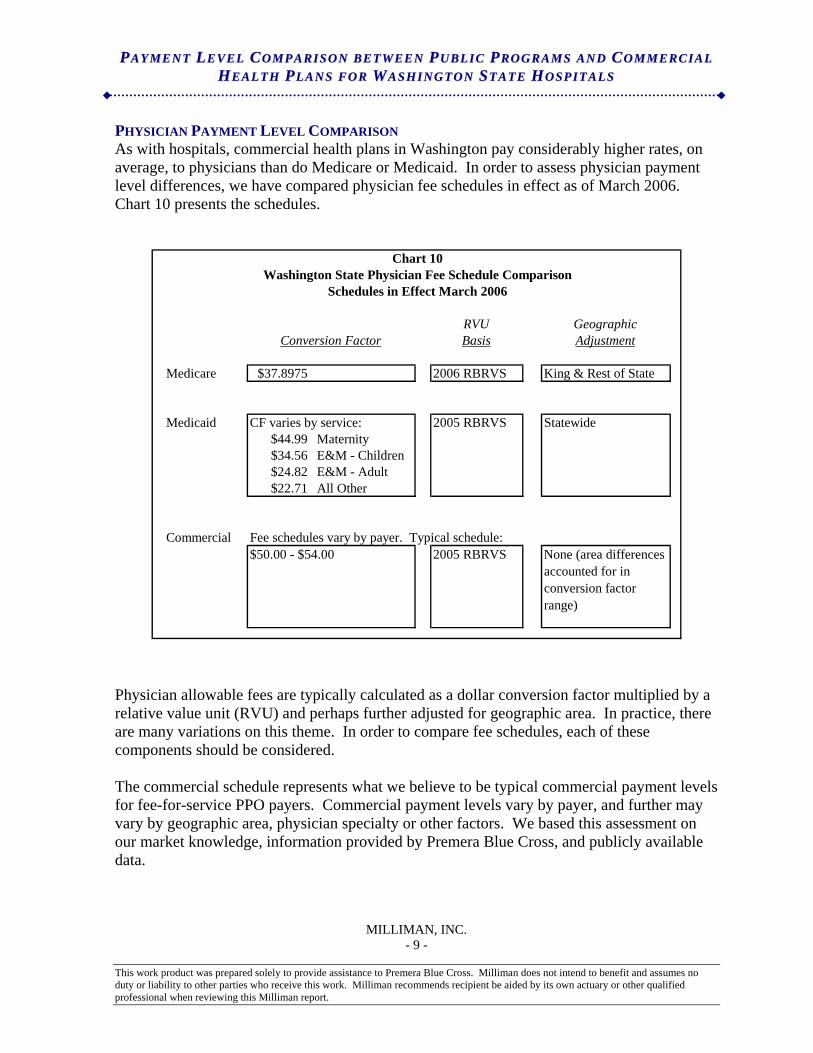
PP AA YY MM EE NN TT LL EE VV EE LL CC OO MM PP AA RR II SS OO NN BB EE TT WW EE EE NN PP UU BB LL II CC PP RR OO GG RR AA MM SS AA NN DD CC OO MM MM EE RR CC II AA LL HH EE AA LL TT HH PP LL AA NN SS FF OO RR WW AA SS HH II NN GG TT OO NN SS TT AA TT EE HH OO SS PP II TT AA LL SS
MILLIMAN, INC. - 9 -
PHYSICIAN PAYMENT LEVEL COMPARISON As with hospitals, commercial health plans in Washington pay considerably higher rates, on average, to physicians than do Medicare or Medicaid. In order to assess physician payment level differences, we have compared physician fee schedules in effect as of March 2006. Chart 10 presents the schedules.
Chart 10Washington State Physician Fee Schedule Comparison
Schedules in Effect March 2006
RVU GeographicConversion Factor Basis Adjustment
Medicare $37.8975 2006 RBRVS King & Rest of State
Medicaid CF varies by service: 2005 RBRVS Statewide$44.99 Maternity$34.56 E&M - Children$24.82 E&M - Adult$22.71 All Other
Commercial Fee schedules vary by payer. Typical schedule:$50.00 - $54.00 2005 RBRVS None (area differences
accounted for in conversion factor range)
Physician allowable fees are typically calculated as a dollar conversion factor multiplied by a relative value unit (RVU) and perhaps further adjusted for geographic area. In practice, there are many variations on this theme. In order to compare fee schedules, each of these components should be considered. The commercial schedule represents what we believe to be typical commercial payment levels for fee-for-service PPO payers. Commercial payment levels vary by payer, and further may vary by geographic area, physician specialty or other factors. We based this assessment on our market knowledge, information provided by Premera Blue Cross, and publicly available data.
This work product was prepared solely to provide assistance to Premera Blue Cross. Milliman does not intend to benefit and assumes no duty or liability to other parties who receive this work. Milliman recommends recipient be aided by its own actuary or other qualified professional when reviewing this Milliman report.
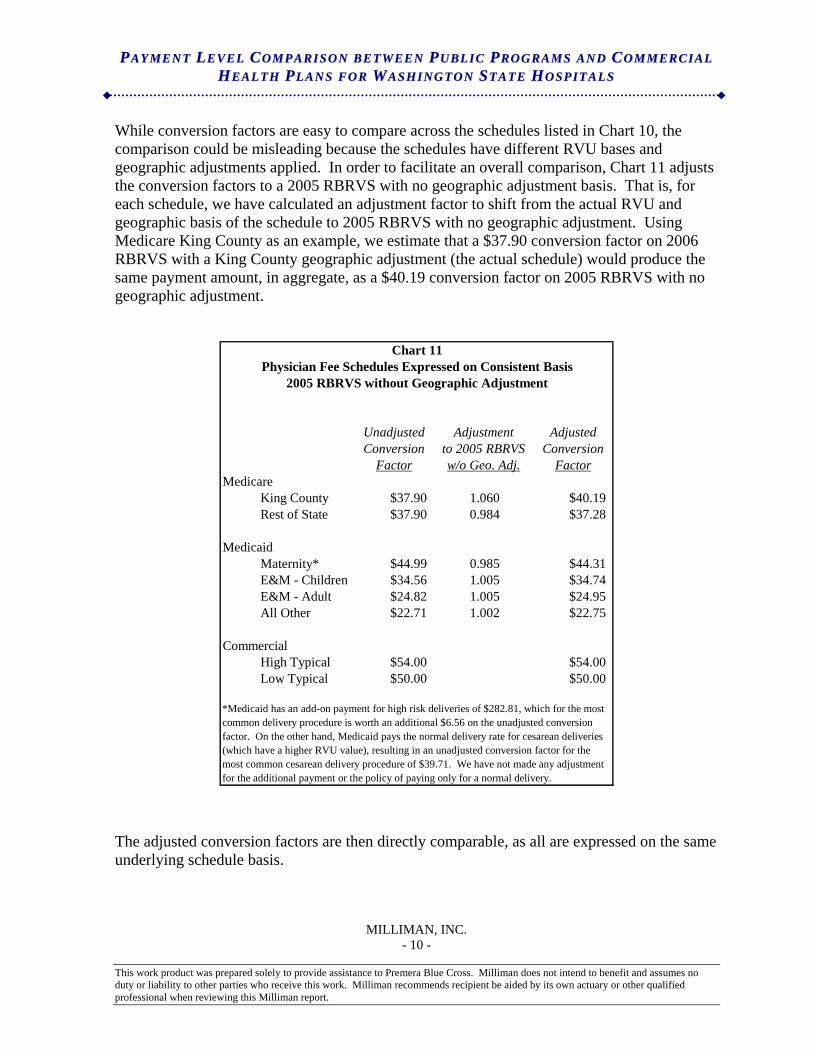
PP AA YY MM EE NN TT LL EE VV EE LL CC OO MM PP AA RR II SS OO NN BB EE TT WW EE EE NN PP UU BB LL II CC PP RR OO GG RR AA MM SS AA NN DD CC OO MM MM EE RR CC II AA LL HH EE AA LL TT HH PP LL AA NN SS FF OO RR WW AA SS HH II NN GG TT OO NN SS TT AA TT EE HH OO SS PP II TT AA LL SS
MILLIMAN, INC. - 10 -
While conversion factors are easy to compare across the schedules listed in Chart 10, the comparison could be misleading because the schedules have different RVU bases and geographic adjustments applied. In order to facilitate an overall comparison, Chart 11 adjusts the conversion factors to a 2005 RBRVS with no geographic adjustment basis. That is, for each schedule, we have calculated an adjustment factor to shift from the actual RVU and geographic basis of the schedule to 2005 RBRVS with no geographic adjustment. Using Medicare King County as an example, we estimate that a $37.90 conversion factor on 2006 RBRVS with a King County geographic adjustment (the actual schedule) would produce the same payment amount, in aggregate, as a $40.19 conversion factor on 2005 RBRVS with no geographic adjustment.
Chart 11Physician Fee Schedules Expressed on Consistent Basis
2005 RBRVS without Geographic Adjustment
Unadjusted Adjustment AdjustedConversion to 2005 RBRVS Conversion
Factor w/o Geo. Adj. FactorMedicare
King County $37.90 1.060 $40.19Rest of State $37.90 0.984 $37.28
MedicaidMaternity* $44.99 0.985 $44.31E&M - Children $34.56 1.005 $34.74E&M - Adult $24.82 1.005 $24.95All Other $22.71 1.002 $22.75
CommercialHigh Typical $54.00 $54.00Low Typical $50.00 $50.00
*Medicaid has an add-on payment for high risk deliveries of $282.81, which for the most common delivery procedure is worth an additional $6.56 on the unadjusted conversion factor. On the other hand, Medicaid pays the normal delivery rate for cesarean deliveries (which have a higher RVU value), resulting in an unadjusted conversion factor for the most common cesarean delivery procedure of $39.71. We have not made any adjustment for the additional payment or the policy of paying only for a normal delivery.
The adjusted conversion factors are then directly comparable, as all are expressed on the same underlying schedule basis.
This work product was prepared solely to provide assistance to Premera Blue Cross. Milliman does not intend to benefit and assumes no duty or liability to other parties who receive this work. Milliman recommends recipient be aided by its own actuary or other qualified professional when reviewing this Milliman report.
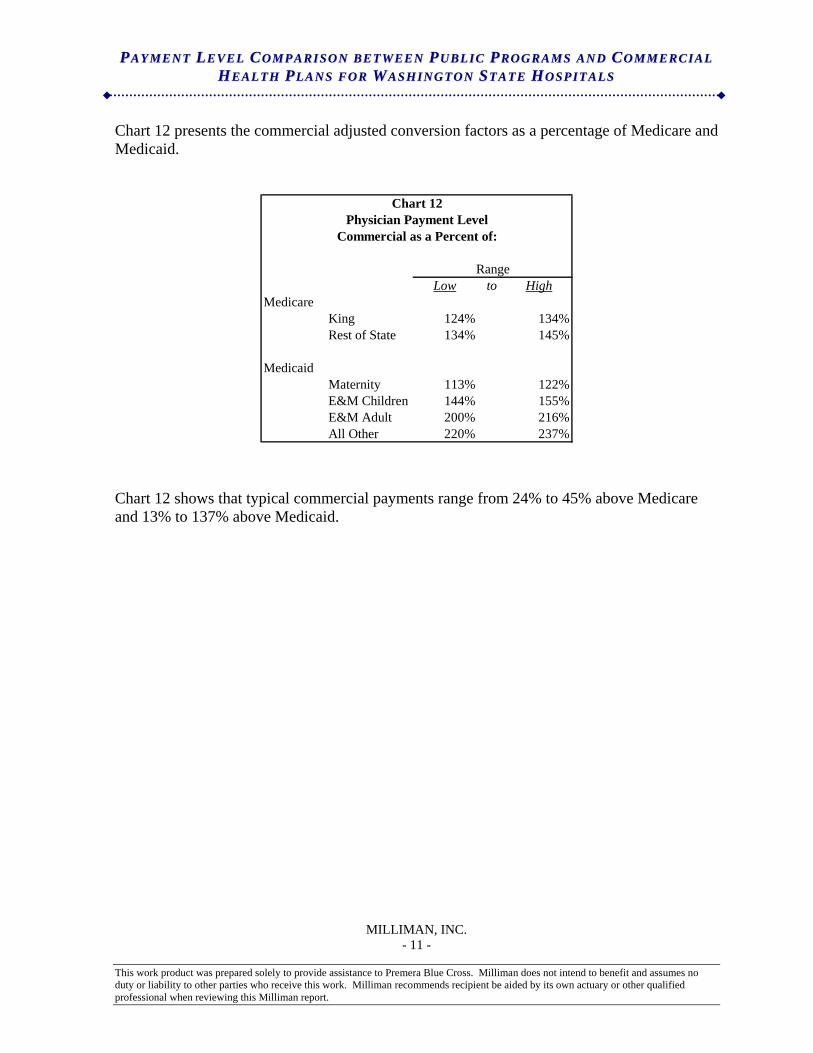
PP AA YY MM EE NN TT LL EE VV EE LL CC OO MM PP AA RR II SS OO NN BB EE TT WW EE EE NN PP UU BB LL II CC PP RR OO GG RR AA MM SS AA NN DD CC OO MM MM EE RR CC II AA LL HH EE AA LL TT HH PP LL AA NN SS FF OO RR WW AA SS HH II NN GG TT OO NN SS TT AA TT EE HH OO SS PP II TT AA LL SS
MILLIMAN, INC. - 11 -
Chart 12 presents the commercial adjusted conversion factors as a percentage of Medicare and Medicaid.
Chart 12Physician Payment Level
Commercial as a Percent of:
RangeLow to High
MedicareKing 124% 134%Rest of State 134% 145%
MedicaidMaternity 113% 122%E&M Children 144% 155%E&M Adult 200% 216%All Other 220% 237%
Chart 12 shows that typical commercial payments range from 24% to 45% above Medicare and 13% to 137% above Medicaid.
This work product was prepared solely to provide assistance to Premera Blue Cross. Milliman does not intend to benefit and assumes no duty or liability to other parties who receive this work. Milliman recommends recipient be aided by its own actuary or other qualified professional when reviewing this Milliman report.
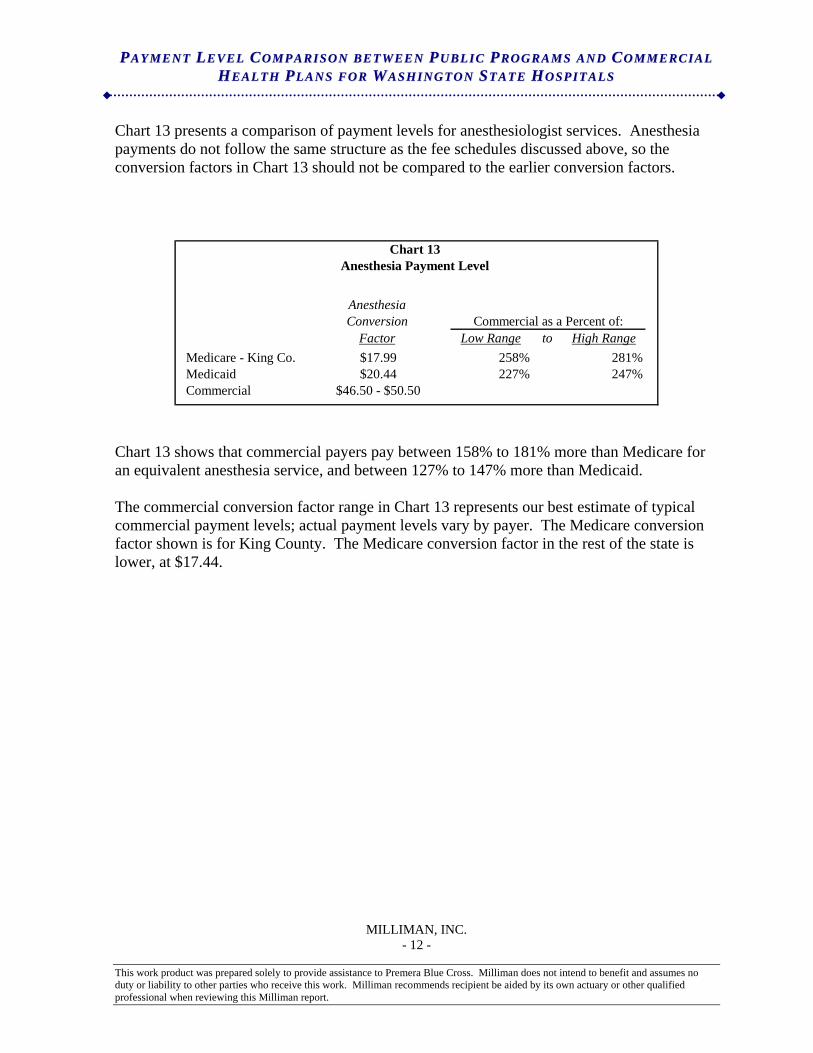
PP AA YY MM EE NN TT LL EE VV EE LL CC OO MM PP AA RR II SS OO NN BB EE TT WW EE EE NN PP UU BB LL II CC PP RR OO GG RR AA MM SS AA NN DD CC OO MM MM EE RR CC II AA LL HH EE AA LL TT HH PP LL AA NN SS FF OO RR WW AA SS HH II NN GG TT OO NN SS TT AA TT EE HH OO SS PP II TT AA LL SS
MILLIMAN, INC. - 12 -
This work product was prepared solely to provide assistance to Premera Blue Cross. Milliman does not intend to benefit and assumes no duty or liability to other parties who receive this work. Milliman recommends recipient be aided by its own actuary or other qualified professional when reviewing this Milliman report.
Chart 13 presents a comparison of payment levels for anesthesiologist services. Anesthesia payments do not follow the same structure as the fee schedules discussed above, so the conversion factors in Chart 13 should not be compared to the earlier conversion factors.
Chart 13
Anesthesia Payment Level
AnesthesiaConversion Commercial as a Percent of:
Factor Low Range to High RangeMedicare - King Co. $17.99 258% 281%Medicaid $20.44 227% 247%Commercial $46.50 - $50.50
Chart 13 shows that commercial payers pay between 158% to 181% more than Medicare for an equivalent anesthesia service, and between 127% to 147% more than Medicaid. The commercial conversion factor range in Chart 13 represents our best estimate of typical commercial payment levels; actual payment levels vary by payer. The Medicare conversion factor shown is for King County. The Medicare conversion factor in the rest of the state is lower, at $17.44.
PP AA YY MM EE NN TT LL EE VV EE LL CC OO MM PP AA RR II SS OO NN BB EE TT WW EE EE NN PP UU BB LL II CC PP RR OO GG RR AA MM SS AA NN DD CC OO MM MM EE RR CC II AA LL HH EE AA LL TT HH PP LL AA NN SS FF OO RR WW AA SS HH II NN GG TT OO NN SS TT AA TT EE HH OO SS PP II TT AA LL SS
MILLIMAN, INC. - 13 -
METHODOLOGY
Hospital The hospital analyses presented in this paper are based on the Year End Hospital Summary Reports for Washington State hospitals reported by the Washington State Department of Health. We have relied upon this data. We have reviewed the data for reasonableness, and in some cases have made adjustments to the data. The data adjustments that we made were based on more detailed year-end financials also reported by the Department of Health. In two cases, the reported financials were internally inconsistent, with the inconsistency materially affecting overall results, so the hospital was excluded (excluded only for the year of the inconsistency). The Department of Health data is sufficient to split billed charges and net patient service revenue between Medicare, Medicaid, and all other. The all other category includes commercial insurance payers, self-pay, Workers’ Compensation, and other government programs. Throughout this paper, we refer to the all other category as “Commercial.” The reported financial data does not split expenses into these payer segments, however. We allocated expenses to payer segment as described below. The financials include gross revenue (billed charges) by payer segment. Deductions from gross revenue are reported for contractual rate agreements by payer segment and for charity care/other deductions. We removed the charity care/other deductions from the Commercial segment’s billed charges. Total operating expenses were then allocated to each payer segment (Medicare, Medicaid, and Commercial) in proportion to the segment’s billed charges. This was performed at the hospital level. In actual practice, the cost to charge ratio will vary by service within a given hospital. Our use of a constant cost to billed charge ratio is an approximation of the actual expense distribution. The split between Medicare, Medicaid, and Commercial is based on each hospital’s reporting of the split. It is likely that some Medicare and Medicaid payments for beneficiaries in health plan managed care programs are reported by hospitals in the Commercial segment, rather than the Medicare or Medicaid segments. To the extent that these managed plans apply payment rates similar to the fee-for-service government programs, this reporting issue serves to lower the cost shift identified in this paper, as the low payment levels for these patients are combined with the higher payment levels for other patients in the Commercial segment. That is, if all payments for Medicare and Medicaid beneficiaries were reported in the Medicare and Medicaid segments, the cost shift would likely be larger than presented here. The results in this paper present only patient related financial results. Specifically, non-operating, tax, and other operating revenue and expense are not included. As total expenses were available only at the operating and non-operating level, we allocated operating expenses associated with other (non-patient) operating revenue by assuming the same margin between
This work product was prepared solely to provide assistance to Premera Blue Cross. Milliman does not intend to benefit and assumes no duty or liability to other parties who receive this work. Milliman recommends recipient be aided by its own actuary or other qualified professional when reviewing this Milliman report.
PP AA YY MM EE NN TT LL EE VV EE LL CC OO MM PP AA RR II SS OO NN BB EE TT WW EE EE NN PP UU BB LL II CC PP RR OO GG RR AA MM SS AA NN DD CC OO MM MM EE RR CC II AA LL HH EE AA LL TT HH PP LL AA NN SS FF OO RR WW AA SS HH II NN GG TT OO NN SS TT AA TT EE HH OO SS PP II TT AA LL SS
MILLIMAN, INC. - 14 -
This work product was prepared solely to provide assistance to Premera Blue Cross. Milliman does not intend to benefit and assumes no duty or liability to other parties who receive this work. Milliman recommends recipient be aided by its own actuary or other qualified professional when reviewing this Milliman report.
patient revenue and other revenue. Further, we did not allocate any expenses to tax revenue. All allocations were performed at the hospital specific level. Group Health Central and Eastside hospitals were excluded from the analyses because they primarily treated only their own members and their summarized financials were not reported in a consistent manner with other hospitals. Physician The physician fee schedule analyses are based on the 2006 Medicare fee schedule after revision for the Deficit Reduction Act of 2005 (which served to maintain the same conversion factor Medicare applied in 2005, rather than decreasing it), the Washington State Medicaid fee schedule effective 7/1/2005, and our assessment of typical commercial fee schedules as of March 2006. The Statewide geographic adjustment applied in the Medicaid schedule is equal to 30% of the Medicare King County adjustment and 70% of the Medicare Rest of State adjustment. The Medicare, Medicaid, and assumed commercial fee schedules all apply the RBRVS site-of-service payment methodology. In addition to fee schedule levels, claims editing rules applied by payers also affect the total reimbursement received by physicians. We have not attempted to compare or quantify claims edit differences between commercial payers and Medicare or Medicaid.

Attachment AWashington State Hospitals
Patient Related Financial Results
FY 95 FY 96 FY 97 FY 98 FY 99 FY 00 FY 01 FY 02 FY 03 FY 04
MedicareBilled Charges $2,248,609,742 $2,417,358,670 $2,626,507,446 $2,781,682,110 $3,119,753,970 $3,747,617,801 $4,302,226,836 $4,993,869,081 $5,815,307,513 $6,580,743,483Net Patient Revenue 1,536,438,850 1,708,320,696 1,838,127,715 1,826,849,103 1,866,423,886 2,039,292,316 2,249,605,454 2,467,422,519 2,653,309,266 2,801,192,463 Allocated Expense 1,578,769,573 1,695,904,638 1,785,143,197 1,848,245,187 1,946,956,986 2,198,646,760 2,381,598,000 2,670,261,764 2,955,009,940 3,231,507,818 Operating Income (42,330,723) 12,416,058 52,984,518 (21,396,084) (80,533,100) (159,354,444) (131,992,546) (202,839,245) (301,700,674) (430,315,355)Margin (1) -2.8% 0.7% 2.9% -1.2% -4.3% -7.8% -5.9% -8.2% -11.4% -15.4%
MedicaidBilled Charges $1,010,354,460 $997,751,086 $1,041,651,054 $1,092,855,314 $1,239,434,718 $1,526,721,157 $1,791,219,748 $2,335,673,061 $2,492,688,331 $2,782,712,122Net Patient Revenue 633,890,955 629,871,946 701,309,988 671,885,554 727,242,497 869,991,688 984,415,659 1,184,696,251 1,163,504,550 1,227,773,606 Allocated Expense 726,288,304 709,469,891 729,721,483 739,876,995 803,099,804 929,049,613 1,039,273,573 1,331,517,814 1,330,685,702 1,419,726,087 Operating Income (92,397,349) (79,597,945) (28,411,495) (67,991,441) (75,857,307) (59,057,925) (54,857,914) (146,821,563) (167,181,152) (191,952,481)Margin (1) -14.6% -12.6% -4.1% -10.1% -10.4% -6.8% -5.6% -12.4% -14.4% -15.6%
CommercialBilled Charges $3,002,818,266 $3,276,586,033 $3,729,107,839 $4,218,867,148 $4,947,174,016 $5,526,701,075 $6,012,154,396 $6,950,924,890 $7,961,867,297 $8,679,514,563Net Patient Revenue 2,443,586,857 2,548,908,059 2,709,892,133 2,990,102,561 3,319,610,865 3,519,184,802 3,659,672,836 4,217,157,009 4,792,023,366 5,156,917,356 Allocated Expense 2,129,205,709 2,317,649,788 2,558,262,861 2,808,695,623 3,087,530,760 3,260,567,265 3,356,043,279 3,722,407,231 4,059,317,482 4,312,338,637 Operating Income 314,381,148 231,258,271 151,629,272 181,406,938 232,080,105 258,617,537 303,629,557 494,749,778 732,705,884 844,578,719Margin (1) 12.9% 9.1% 5.6% 6.1% 7.0% 7.3% 8.3% 11.7% 15.3% 16.4%
TotalBilled Charges $6,261,782,468 $6,691,695,789 $7,397,266,339 $8,093,404,572 $9,306,362,704 $10,801,040,033 $12,105,600,980 $14,280,467,032 $16,269,863,141 $18,042,970,168Net Patient Revenue 4,613,916,662 4,887,100,701 5,249,329,836 5,488,837,218 5,913,277,248 6,428,468,806 6,893,693,949 7,869,275,779 8,608,837,182 9,185,883,425 Allocated Expense 4,434,263,586 4,723,024,317 5,073,127,541 5,396,817,805 5,837,587,550 6,388,263,638 6,776,914,852 7,724,186,809 8,345,013,124 8,963,572,541 Operating Income 179,653,076 164,076,384 176,202,295 92,019,413 75,689,698 40,205,168 116,779,097 145,088,970 263,824,058 222,310,884Margin (1) 3.9% 3.4% 3.4% 1.7% 1.3% 0.6% 1.7% 1.8% 3.1% 2.4%
Cost ShiftFrom Medicare to Commercial $106,294,176 $46,499,138 $9,017,930 $52,909,921 $105,777,190 $173,191,845 $173,031,997 $252,996,697 $395,122,063 $510,461,899From Medicaid to Commercial 121,822,737 104,244,706 53,756,531 80,606,847 86,270,235 64,904,990 72,766,569 171,832,422 209,250,217 227,163,951 Total $228,116,913 $150,743,844 $62,774,462 $133,516,768 $192,047,425 $238,096,835 $245,798,566 $424,829,119 $604,372,280 $737,625,849
As a % of Comm. Hospital Cost 9.3% 5.9% 2.3% 4.5% 5.8% 6.8% 6.7% 10.1% 12.6% 14.3%As a % of Comm. Premium Cost (2) 3.1% 2.0% 0.8% 1.5% 1.9% 2.3% 2.3% 3.4% 4.2% 4.8%Annual Prem. Cost per Comm. Family (3) $169 $111 $45 $91 $124 $157 $172 $285 $392 $490
Notes(1) Margins and other values are patient related only. Other operating, tax, and non-operating revenue and expense are excluded.(2) Assumes hospital cost = 40% of medical cost and an 84% loss ratio(3) Assumes 2004 premium PMPM of $236 and family contract load of 3.6
MILLIMAN, INC. - 15 -
This work product was prepared solely to provide assistance to Premera Blue Cross. Milliman does not intend to benefit and assumes no duty or liability to other parties who receive this work. Milliman
recommends recipient be aided by its own actuary or other qualified professional when reviewing this Milliman report.

Tab 40
August 30, 2006
Proposal to Utilize the Proactive Health Professional Liaison/Consultation Call Center
To Improve Health Outcomes and Decrease Healthcare Costs in Washington State
Contact: Elaine DeLack. RN [email protected] 17317 East Lake Goodwin Rd. Stanwood, WA 98292 888-854-0288 Fax 360-652-6199 cell: 425-870-9366
1
Proposal to Utilize the Proactive Health Professional Liaison/Consultation Call Center To Improve Health Outcomes and Decrease Healthcare Costs in Washington State
Introduction: Proactive Health Team (PHT) is a team of doctors, nurses, and pharmacists who are currently working in the medical community. We came together with one common goal, to improve the healthcare system by making it wellness driven rather than illness driven. As working healthcare professionals we have witnessed first hand the increasing problems of our healthcare system. We propose to strategically address each of these contributing factors by providing the consumer a resource of healthcare professionals that can act as a liaison for the consumer regarding healthcare decisions for a very nominal fee to the consumer. Key factors contributing to the problems of the current healthcare system:
• Increasing insurance costs and larger co-pays. Small business and individuals are finding it harder to afford health insurance.
• Defensive medicine. Malpractice claims have escalated, which has contributed to over-utilization of healthcare services
• Poly-pharmacy (multiple medications, over-the-counter products and supplements). Poly-pharmacy is the greatest risk factor for adverse drug reactions, reduced compliance, increased emergency room visits, hospitalizations, and nursing home admissions1.
• Escalating prescription drug and durable medical equipment costs. • De-personalization of relationships with healthcare providers has contributed to patient
non-compliance. • Use of multiple doctors and pharmacies has contributed to the lack of continuity of care and
to redundancies. • Consumers are utilizing more alternative sources for health information, such as the
television, Internet, and print media, which may not provide relevant or accurate information for their individual health situation.
• The pharmaceutical industry dictates what is considered the standard of care. The pharmaceutical industry pays for most of the medical research, which focuses on drug development, not cures for illness. The US uses more prescription medications and spends more of its gross domestic product on health care than any other country yet it is ranked 37th in the world in quality of health by the World Health Organization2.
PHT recognizes all of the challenges facing the Commission in achieving its goals of improving access, health, affordability, and quality. PHT’s proposed strategy addresses each of the questions of the Commission: 1. What do you propose be done to realize the vision for Washington State established by the Blue Ribbon Commission on Health Care Costs and Access? The most significant link and yet the weakest link in the healthcare dilemma is the consumer. The third party payor system has resulted in the consumer becoming impotent and apathetic. Our illness driven system has fed the consumers’ apathetic behavior in regards to taking a proactive approach to their health and well-being. For the majority, a reactive approach is the norm and this results in greater co-morbidities and greater healthcare expenditures. Consumers must take an active role and responsibility in their health decisions in order to resolve the current healthcare dilemma. In an attempt to lower healthcare expenditures, the health insurance industry is making consumers become more responsible for their healthcare spending by raising deductibles and implementing Consumer Directed Health Plans and Health Savings Accounts. The Carlson School of Management has evaluated the success of these efforts to lower healthcare expenditures and found that this was not effective. Yes, Consumer Directed Health Plans did decrease the number of doctor office visits and the number of prescription medications bought, but it increased
2
the number of hospital admissions3. So either, consumers waited too long to seek medical advice which resulted in a more serious illness or condition developing or they didn’t have adequate information to know what warranted seeking medical advice early on.
The bottom line is that the consumer must be empowered with making informed healthcare decisions. PHT will provide the consumers with proven scientific research facts and a team of licensed healthcare professionals available to answer and discuss their health concerns that are not dictated by the pharmaceutical or health insurance industries. We believe that by communicating one-to-one with each consumer and actively involving each consumer in his or her healthcare decisions, an improved quality of life will be the result.
PHT proposes to provide the following services:
• Comprehensive Health Screens. Our nurses will contact consumers and offer to conduct comprehensive health screens that may identify health risks that are silently festering and if not attended to may result in the manifestation of illness in a few years. Although a person may feel fine today, certain stressors in life such as emotional, financial, diet, lack of exercise or too stringent exercise etc. may be silently eating away at a person’s wellness. The body talks to us through symptoms and because the body is so resilient, these symptoms may come and go without a person giving them much thought. But these may be clues that a person needs to take some action to remain healthy in the years to come. Our very comprehensive health screen explores every system of the body looking for clues of anything lurking that may impede a person’s health if not attended to early on.
• Education and Consultation. Our health professionals will provide education and consultation to the consumer as well as notify the consumer’s Primary Care Physician (PCP) of these possible health risks. Most people will take necessary steps to improve their health if they understand the relevance of the information. Our health professionals will provide the consumer with factual information in terms he/she understands.
• Medication and Supplement Evaluation. Our pharmacists will evaluate prescription medications and OTC supplements and medications for possible interactions, etiology of symptoms and cost effectiveness. Many people see more than one doctor or don’t even have a primary doctor and they may purchase their medications from several pharmacy locations. This often results in taking medications that have duplicating effects or are not compatible with each other and this could result in unnecessary costs and worse yet—harm. Often medications are prescribed for symptoms that may be due to an interaction with another medication, an over-the-counter medication, a supplement, or a food that is incompatible. Our pharmacists will look at the whole picture so that such a scenario can be identified and corrected.
• Provide Scientific Rationale. Our medical researcher will research consumer inquiries regarding products and health information that the consumer may have seen in the media to provide factual answers to the consumer regarding health risks or benefits associated with such products. Consumers are bombarded with information regarding health issues on the television, Internet, and print media, all claiming to be the answer to one’s health issues. Yet not all of this information is correct and some may be very harmful depending on an individual’s health status.
• Available 24 Hours a Day –7 Days a Week. Our nurses and doctors are available 24 hours a day—7 days a week to provide triage or answer questions regarding one’s health.
• Person-to-Person Communication. The PHT will provide person-to-person assessment and individualization of health protocols so as to increase consumer compliance and quality outcomes. Through interactive communication with the consumer, our trained healthcare professionals can get a clearer picture and help the consumer make decisions that will be more apt to accommodate his/her lifestyle.
• Database That Keeps an Ongoing Medical History on Each Consumer. PHT utilizes an extensive database that maintains an ongoing medical history on each consumer. This allows the consumer to shop their healthcare services without sacrificing continuity in care. The database helps to compile all of the consumer’s information as it is gathered into one place,
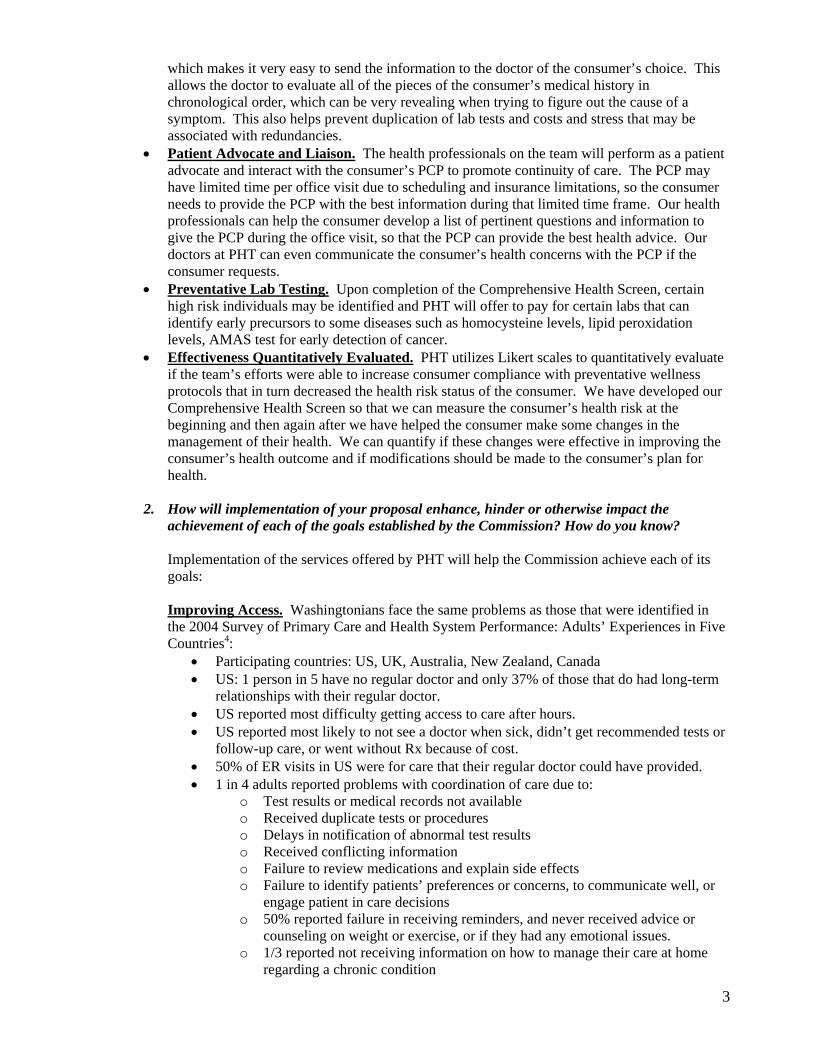
3
which makes it very easy to send the information to the doctor of the consumer’s choice. This allows the doctor to evaluate all of the pieces of the consumer’s medical history in chronological order, which can be very revealing when trying to figure out the cause of a symptom. This also helps prevent duplication of lab tests and costs and stress that may be associated with redundancies.
• Patient Advocate and Liaison. The health professionals on the team will perform as a patient advocate and interact with the consumer’s PCP to promote continuity of care. The PCP may have limited time per office visit due to scheduling and insurance limitations, so the consumer needs to provide the PCP with the best information during that limited time frame. Our health professionals can help the consumer develop a list of pertinent questions and information to give the PCP during the office visit, so that the PCP can provide the best health advice. Our doctors at PHT can even communicate the consumer’s health concerns with the PCP if the consumer requests.
• Preventative Lab Testing. Upon completion of the Comprehensive Health Screen, certain high risk individuals may be identified and PHT will offer to pay for certain labs that can identify early precursors to some diseases such as homocysteine levels, lipid peroxidation levels, AMAS test for early detection of cancer.
• Effectiveness Quantitatively Evaluated. PHT utilizes Likert scales to quantitatively evaluate if the team’s efforts were able to increase consumer compliance with preventative wellness protocols that in turn decreased the health risk status of the consumer. We have developed our Comprehensive Health Screen so that we can measure the consumer’s health risk at the beginning and then again after we have helped the consumer make some changes in the management of their health. We can quantify if these changes were effective in improving the consumer’s health outcome and if modifications should be made to the consumer’s plan for health.
2. How will implementation of your proposal enhance, hinder or otherwise impact the
achievement of each of the goals established by the Commission? How do you know? Implementation of the services offered by PHT will help the Commission achieve each of its goals: Improving Access. Washingtonians face the same problems as those that were identified in the 2004 Survey of Primary Care and Health System Performance: Adults’ Experiences in Five Countries4:
• Participating countries: US, UK, Australia, New Zealand, Canada • US: 1 person in 5 have no regular doctor and only 37% of those that do had long-term
relationships with their regular doctor. • US reported most difficulty getting access to care after hours. • US reported most likely to not see a doctor when sick, didn’t get recommended tests or
follow-up care, or went without Rx because of cost. • 50% of ER visits in US were for care that their regular doctor could have provided. • 1 in 4 adults reported problems with coordination of care due to:
o Test results or medical records not available o Received duplicate tests or procedures o Delays in notification of abnormal test results o Received conflicting information o Failure to review medications and explain side effects o Failure to identify patients’ preferences or concerns, to communicate well, or
engage patient in care decisions o 50% reported failure in receiving reminders, and never received advice or
counseling on weight or exercise, or if they had any emotional issues. o 1/3 reported not receiving information on how to manage their care at home
regarding a chronic condition
4
o Among those with Internet access, more than 50% reported wanting to speak with a doctor rather than communicate via email
The services of PHT can improve the consumer’s access to accurate information regarding their healthcare questions in that a health professional at PHT is available 24 hours a day, 7 days a week by simply calling a toll free number. Access to this health professional assistance at PHT is affordable because the consumer pays only $10.00 a month for a membership.
Improving Health. Health outcomes are dependent on more than just accurate information being provided to the patient. The patient must retain this information, be compliant in following the guidance of the health professional, and the health professional and patient must have a relationship conducive to the sharing of information so that modifications may be made to the plan of care that will accommodate the patients individualized needs. We are all individuals with different needs and a one-size fits all plan of care may not produce the most beneficial health outcomes. A study published in JONA February 2003, showed that the greater the requirement for nurses at call centers to use set protocols, the poorer the quality of outcomes5.
PHT will provide one-to-one communication with each consumer in the comfort of their own environment so that they can take notes and have better retention of the information provided. This will foster a sharing relationship between the PHT staff member and the consumer in which the consumer will be encouraged to share and actively participate in making good healthcare decisions.
PHT has a researcher on staff to provide the latest information based on scientific literature. The health professionals at PHT will provide the rationale supporting the health information shared with the consumer, which will increase the percentage of compliance resulting in overall better health outcomes.
PHT offers a comprehensive health screen that inquires about every system of the body, looking for early precursors that may manifest into disease in years to come if not attended to. Unfortunately most of the common blood chemistry and urine tests used today are not preventative because they do not identify early precursors to disease, but rather only reveal an abnormal indicator usually after the disease process has been established. The comprehensive health screens utilized by PHT will enable health professionals to perform an ongoing evaluation of data from various populations and perhaps identify specific early indicators that can trigger a disease if present with certain coexisting factors. This information can then perhaps lead to better proven preventative testing in the future.
Improving Affordability. With the rising costs of healthcare and insurance premiums, many employers have had to discontinue health insurance benefits for their employees. This has resulted in an increase in the number of uninsured Washingtonians and has increased the burden on the state funded health plans. The insurance industry is attempting to accommodate the need to decrease or limit the amount of expense to small businesses so that employers can afford to provide health benefits for employees by offering Health Savings Accounts or Consumer Driven Health Plans (CDHP). PHT can assist the consumers who are participating in a Health Savings Plan or a CDHP in making informed decisions regarding their health and the $10.00 per month cost for PHT’s services can be deducted from the Health Savings Account or CDHP account, so that it is not an increased expense to the employer. Furthermore, if the consumer (employee) is able to decrease the amount of health expenditures from his/her Health Savings Account or CDHP fund by utilizing the services of PHT, then the employer will be able to roll these savings into the employees plan in the succeeding year.
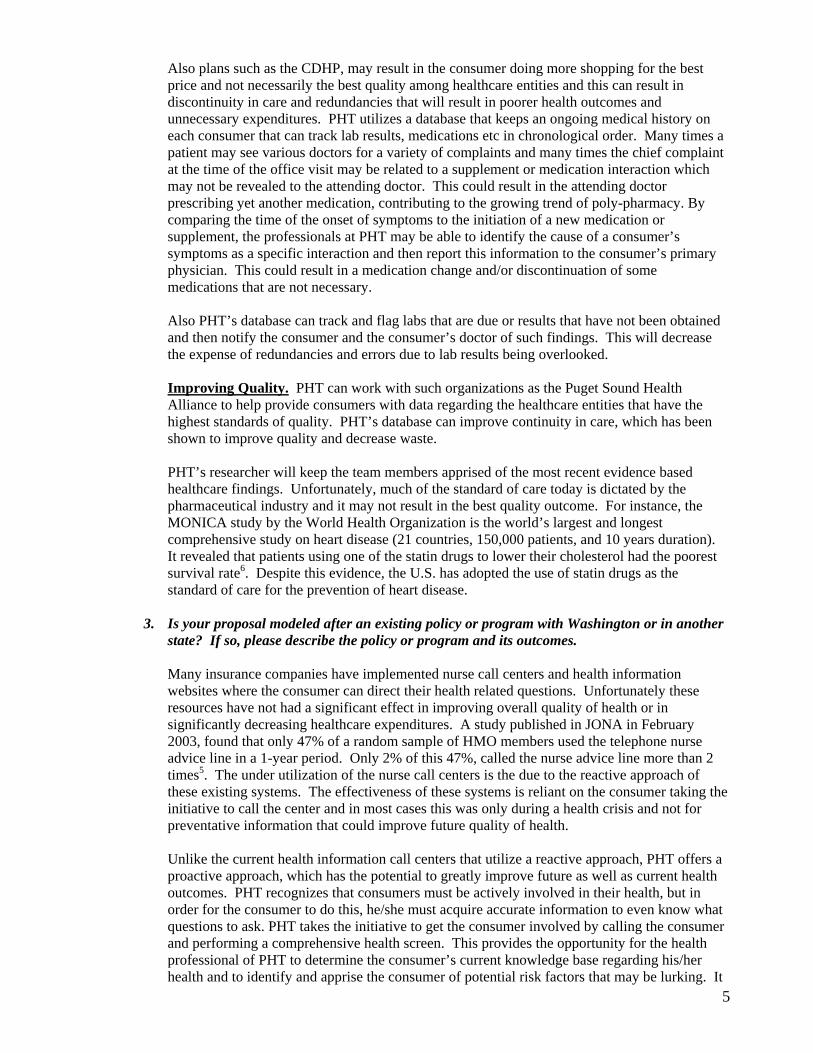
5
Also plans such as the CDHP, may result in the consumer doing more shopping for the best price and not necessarily the best quality among healthcare entities and this can result in discontinuity in care and redundancies that will result in poorer health outcomes and unnecessary expenditures. PHT utilizes a database that keeps an ongoing medical history on each consumer that can track lab results, medications etc in chronological order. Many times a patient may see various doctors for a variety of complaints and many times the chief complaint at the time of the office visit may be related to a supplement or medication interaction which may not be revealed to the attending doctor. This could result in the attending doctor prescribing yet another medication, contributing to the growing trend of poly-pharmacy. By comparing the time of the onset of symptoms to the initiation of a new medication or supplement, the professionals at PHT may be able to identify the cause of a consumer’s symptoms as a specific interaction and then report this information to the consumer’s primary physician. This could result in a medication change and/or discontinuation of some medications that are not necessary. Also PHT’s database can track and flag labs that are due or results that have not been obtained and then notify the consumer and the consumer’s doctor of such findings. This will decrease the expense of redundancies and errors due to lab results being overlooked.
Improving Quality. PHT can work with such organizations as the Puget Sound Health Alliance to help provide consumers with data regarding the healthcare entities that have the highest standards of quality. PHT’s database can improve continuity in care, which has been shown to improve quality and decrease waste. PHT’s researcher will keep the team members apprised of the most recent evidence based healthcare findings. Unfortunately, much of the standard of care today is dictated by the pharmaceutical industry and it may not result in the best quality outcome. For instance, the MONICA study by the World Health Organization is the world’s largest and longest comprehensive study on heart disease (21 countries, 150,000 patients, and 10 years duration). It revealed that patients using one of the statin drugs to lower their cholesterol had the poorest survival rate6. Despite this evidence, the U.S. has adopted the use of statin drugs as the standard of care for the prevention of heart disease.
3. Is your proposal modeled after an existing policy or program with Washington or in another
state? If so, please describe the policy or program and its outcomes. Many insurance companies have implemented nurse call centers and health information websites where the consumer can direct their health related questions. Unfortunately these resources have not had a significant effect in improving overall quality of health or in significantly decreasing healthcare expenditures. A study published in JONA in February 2003, found that only 47% of a random sample of HMO members used the telephone nurse advice line in a 1-year period. Only 2% of this 47%, called the nurse advice line more than 2 times5. The under utilization of the nurse call centers is the due to the reactive approach of these existing systems. The effectiveness of these systems is reliant on the consumer taking the initiative to call the center and in most cases this was only during a health crisis and not for preventative information that could improve future quality of health.
Unlike the current health information call centers that utilize a reactive approach, PHT offers a proactive approach, which has the potential to greatly improve future as well as current health outcomes. PHT recognizes that consumers must be actively involved in their health, but in order for the consumer to do this, he/she must acquire accurate information to even know what questions to ask. PHT takes the initiative to get the consumer involved by calling the consumer and performing a comprehensive health screen. This provides the opportunity for the health professional of PHT to determine the consumer’s current knowledge base regarding his/her health and to identify and apprise the consumer of potential risk factors that may be lurking. It
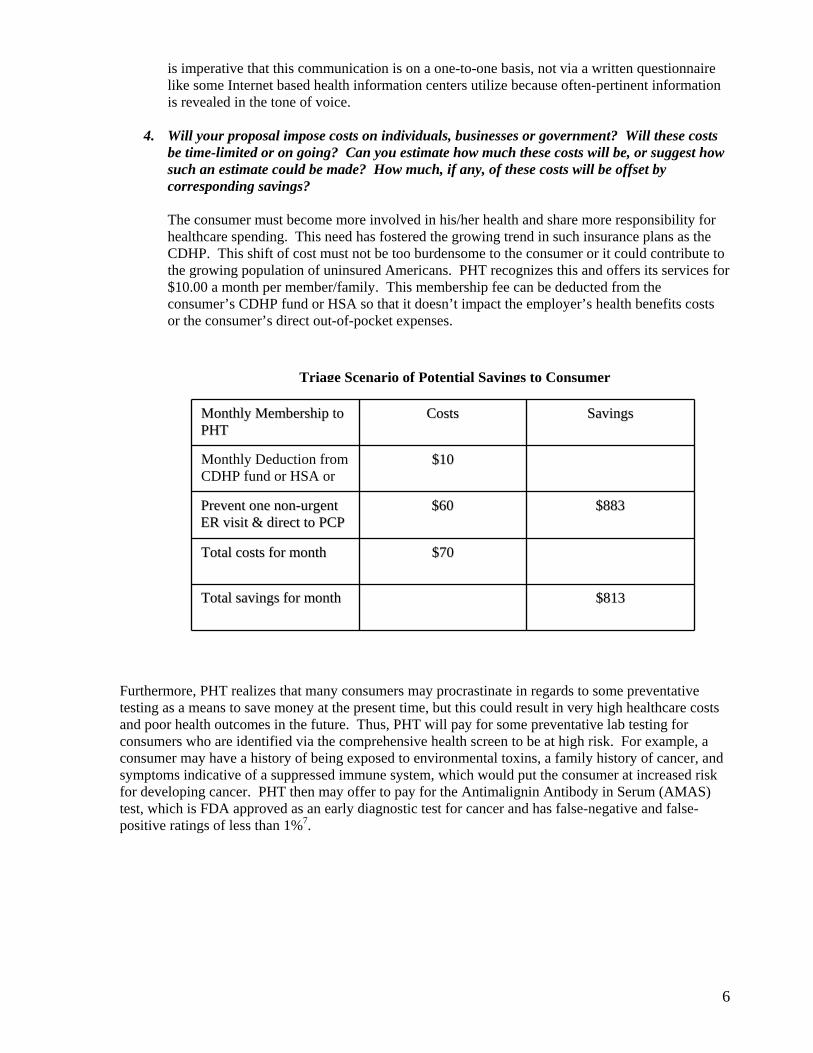
is imperative that this communication is on a one-to-one basis, not via a written questionnaire like some Internet based health information centers utilize because often-pertinent information is revealed in the tone of voice.
4. Will your proposal impose costs on individuals, businesses or government? Will these costs
be time-limited or on going? Can you estimate how much these costs will be, or suggest how such an estimate could be made? How much, if any, of these costs will be offset by corresponding savings? The consumer must become more involved in his/her health and share more responsibility for healthcare spending. This need has fostered the growing trend in such insurance plans as the CDHP. This shift of cost must not be too burdensome to the consumer or it could contribute to the growing population of uninsured Americans. PHT recognizes this and offers its services for $10.00 a month per member/family. This membership fee can be deducted from the consumer’s CDHP fund or HSA so that it doesn’t impact the employer’s health benefits costs or the consumer’s direct out-of-pocket expenses. Triage Scenario of Potential Savings to Consumer
$$881133 TToottaall ssaavviinnggss ffoorr mmoonntthh
$$7700 TToottaall ccoossttss ffoorr mmoonntthh
$$888833 $$6600 PPrreevveenntt oonnee nnoonn--uurrggeenntt EERR vviissiitt && ddiirreecctt ttoo PPCCPP
$$1100 Monthly Deduction from CDHP fund or HSA or
SSaavviinnggss CCoossttssMMoonntthhllyy MMeemmbbeerrsshhiipp ttoo PPHHTT
Furthermore, PHT realizes that many consumers may procrastinate in regards to some preventative testing as a means to save money at the present time, but this could result in very high healthcare costs and poor health outcomes in the future. Thus, PHT will pay for some preventative lab testing for consumers who are identified via the comprehensive health screen to be at high risk. For example, a consumer may have a history of being exposed to environmental toxins, a family history of cancer, and symptoms indicative of a suppressed immune system, which would put the consumer at increased risk for developing cancer. PHT then may offer to pay for the Antimalignin Antibody in Serum (AMAS) test, which is FDA approved as an early diagnostic test for cancer and has false-negative and false-positive ratings of less than 1%7.
6
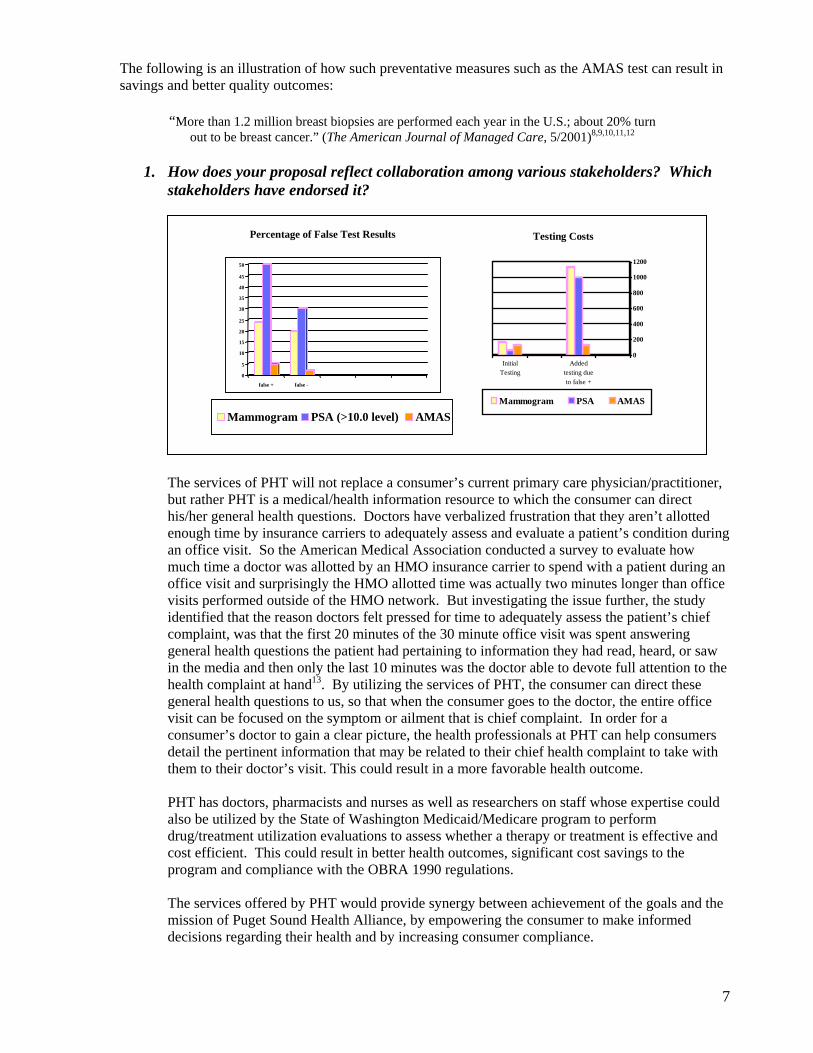
The following is an illustration of how such preventative measures such as the AMAS test can result in savings and better quality outcomes: “More than 1.2 million breast biopsies are performed each year in the U.S.; about 20% turn
out to be breast cancer.” (The American Journal of Managed Care, 5/2001)8,9,10,11,12 1. How does your proposal reflect collaboration among various stakeholders? Which
stakeholders have endorsed it?
0
200
400
600
800
1000
1200
InitialTesting
Addedtesting dueto false +
Testing Costs
Mammogram PSA AMAS
0
5
10
15
20
25
30
35
40
45
50
false + false -
Percentage of False Test Results
Mammogram PSA (>10.0 level) AMAS
The services of PHT will not replace a consumer’s current primary care physician/practitioner, but rather PHT is a medical/health information resource to which the consumer can direct his/her general health questions. Doctors have verbalized frustration that they aren’t allotted enough time by insurance carriers to adequately assess and evaluate a patient’s condition during an office visit. So the American Medical Association conducted a survey to evaluate how much time a doctor was allotted by an HMO insurance carrier to spend with a patient during an office visit and surprisingly the HMO allotted time was actually two minutes longer than office visits performed outside of the HMO network. But investigating the issue further, the study identified that the reason doctors felt pressed for time to adequately assess the patient’s chief complaint, was that the first 20 minutes of the 30 minute office visit was spent answering general health questions the patient had pertaining to information they had read, heard, or saw in the media and then only the last 10 minutes was the doctor able to devote full attention to the health complaint at hand13. By utilizing the services of PHT, the consumer can direct these general health questions to us, so that when the consumer goes to the doctor, the entire office visit can be focused on the symptom or ailment that is chief complaint. In order for a consumer’s doctor to gain a clear picture, the health professionals at PHT can help consumers detail the pertinent information that may be related to their chief health complaint to take with them to their doctor’s visit. This could result in a more favorable health outcome.
PHT has doctors, pharmacists and nurses as well as researchers on staff whose expertise could also be utilized by the State of Washington Medicaid/Medicare program to perform drug/treatment utilization evaluations to assess whether a therapy or treatment is effective and cost efficient. This could result in better health outcomes, significant cost savings to the program and compliance with the OBRA 1990 regulations.
The services offered by PHT would provide synergy between achievement of the goals and the mission of Puget Sound Health Alliance, by empowering the consumer to make informed decisions regarding their health and by increasing consumer compliance.
7
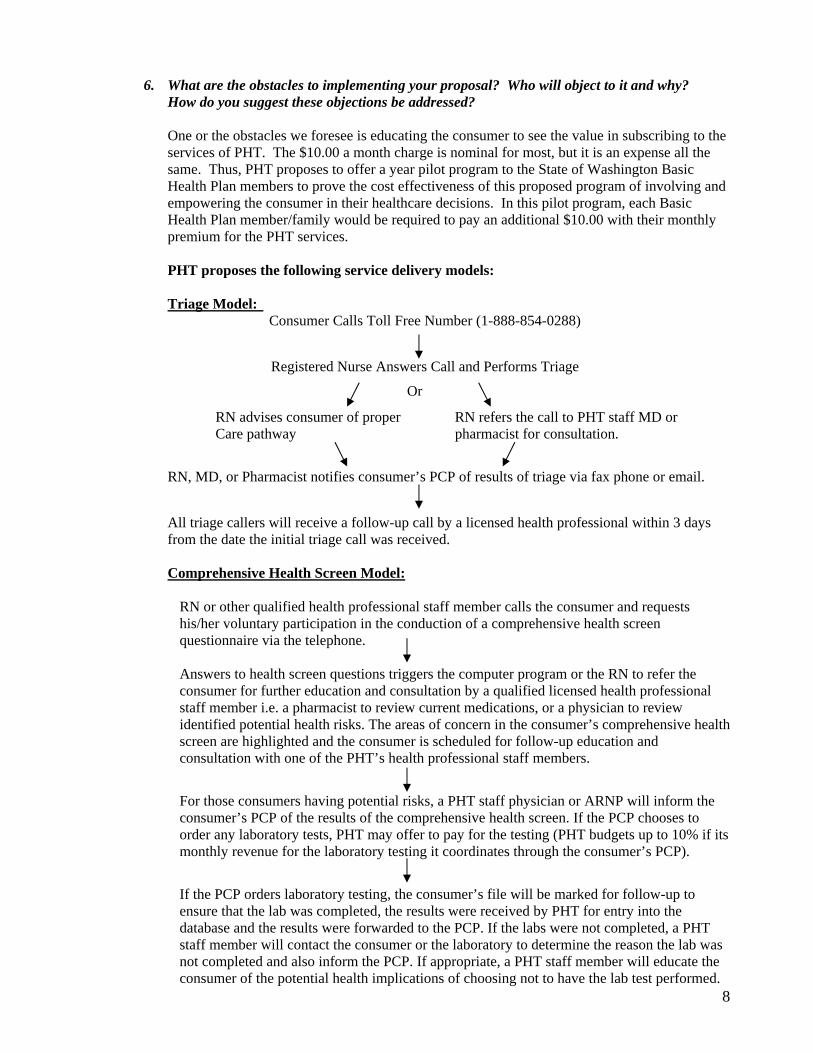
6. What are the obstacles to implementing your proposal? Who will object to it and why?
How do you suggest these objections be addressed? One or the obstacles we foresee is educating the consumer to see the value in subscribing to the services of PHT. The $10.00 a month charge is nominal for most, but it is an expense all the same. Thus, PHT proposes to offer a year pilot program to the State of Washington Basic Health Plan members to prove the cost effectiveness of this proposed program of involving and empowering the consumer in their healthcare decisions. In this pilot program, each Basic Health Plan member/family would be required to pay an additional $10.00 with their monthly premium for the PHT services. PHT proposes the following service delivery models: Triage Model:
Consumer Calls Toll Free Number (1-888-854-0288)
Registered Nurse Answers Call and Performs Triage
Or
RN advises consumer of proper RN refers the call to PHT staff MD or Care pathway pharmacist for consultation.
RN, MD, or Pharmacist notifies consumer’s PCP of results of triage via fax phone or email.
All triage callers will receive a follow-up call by a licensed health professional within 3 days from the date the initial triage call was received. Comprehensive Health Screen Model:
RN or other qualified health professional staff member calls the consumer and requests his/her voluntary participation in the conduction of a comprehensive health screen questionnaire via the telephone.
Answers to health screen questions triggers the computer program or the RN to refer the consumer for further education and consultation by a qualified licensed health professional staff member i.e. a pharmacist to review current medications, or a physician to review identified potential health risks. The areas of concern in the consumer’s comprehensive health screen are highlighted and the consumer is scheduled for follow-up education and consultation with one of the PHT’s health professional staff members.
For those consumers having potential risks, a PHT staff physician or ARNP will inform the consumer’s PCP of the results of the comprehensive health screen. If the PCP chooses to order any laboratory tests, PHT may offer to pay for the testing (PHT budgets up to 10% if its monthly revenue for the laboratory testing it coordinates through the consumer’s PCP).
8
If the PCP orders laboratory testing, the consumer’s file will be marked for follow-up to ensure that the lab was completed, the results were received by PHT for entry into the database and the results were forwarded to the PCP. If the labs were not completed, a PHT staff member will contact the consumer or the laboratory to determine the reason the lab was not completed and also inform the PCP. If appropriate, a PHT staff member will educate the consumer of the potential health implications of choosing not to have the lab test performed.
Conclusion: PHT believes that unless consumers have an active role in their healthcare, the healthcare crisis will continue to grow to catastrophic proportions. Costs will continue to escalate to the point where employers will no longer be able to offer health insurance as an employee benefit and consumers will not be able to afford it on their own. The costs of caring for our citizens will fall more and more on state government and state government cannot afford this added expense. The PHT model and proposal is designed to empower consumers to be more responsible and involved in their healthcare decisions and solutions. Without the consumers involvement and participation, the healthcare system as we know it today will not survive.
Bibliography
1. AMA Report 5 of the Council of Scientific Affairs (A-02) “Improving the quality if Geriatric
Pharmacotherapy”, 2002
2. Press Release, WHO/44, 21 June 2000.
3. Parente S.T., Feldman R., & Christianson J.B., “Evaluation of the effect of a consumer-driven health plan on medical care expenditures and utilization.” Health Services Resources, (39), August 2004, pp. 1189-1210.
4. Schoen, C., Osborn R., Huynh P.T., Doty M., Davis K., Zapert K., & Peugh J., “Primary Care
and Health System Performance: Adults’ Experiences in Five Countries”. Health Systems Primary Care Web Exclusive, 28 October 2004.
5. Valanis B., Tanner C., Moscato S.R., Shapiro S., Izumi S., David M., Keyes C., & Mayo A.,
“A Model for Examining Predictors of Outcomes of Telephone Nursing Advice”, JONA: Journal of Nursing Administration, Vol 33, No 2, February 2003, pp. 91-95.
6. World Health Organization MONICA Study, 1984-1993.
7. AMAS Test Literature Summary, Oncolab Inc., Boston, MA.
8. American Journal of Managed Care, May 2001.
9. http://www.healthtalk.com/breastcancer/interview/pisano/page03.cfm
10. www.cancerfacts.com/Home_News.asp?NewsId=1250
11. www.prostatecancer.realage.com/content.aspx/topic/24
12. www.prostate90.com/prostate_cancer/amas_test.html
9
13. Gabriel, B. A., “The Doctor Will See You Now: Are Physician Office Visits Getting Shorter…or Longer?” AAMC News Room Reporter, Vol 10, No 7, April 2001.

Tab 41
1
Blue Ribbon Commission
Proposal – Project Access efforts in Washington State
Statewide Support
Project Access is a system of care that relies on the generosity of physicians, hospitals and other providers to donate care and services to the low income uninsured. It is a model of care that is currently working in over 50 communities across the country including six communities in Washington. Project Access is typically housed or closely related with the local County Medical Society, and relies on close working relationships with the safety net and private practitioners. Project Access aims to provide all care and services needed by a qualified uninsured patient; primary care, consultative specialty services, in and out-patient hospital services, ancillary services, medications and durable medical equipment.
There are six known Project Access efforts in Washington state at various stages of development and implementation.
Spokane County Project Access – Sept. 2003 Thurston County Project Access – May 2005 King County Project Access – March 2006 (with 2 pilots since 2004) Whatcom County Project Access (a partnership between Whatcom Alliance for Healthcare Access and Whatcom County Medical Society) – September 2006 start date Clark County – developmental Benton/Franklin Counties – developmental
Most of the larger urban areas are included in these efforts. Additional other communities have had initial exploratory meetings.
Project Access is a compelling model for providing healthcare for low income uninsured patients; it builds on the strengths in the current system while minimizing the challenges, asks that various parts of the health care system provide care and services within their area of expertise, and shares the challenge of meeting the medical needs of the uninsured across a broad base of providers. Project Access is locally run , it streamlines, enlarges and improves the amount of charitable giving that physicians and other providers are already doing, it adds to the economic vitaility of the county by improving the health of the community – particularly the health of low income working adults.
While each Project Access is unique to the needs and strengths of its local community, each follows the basic guidelines initially developed in Buncombe County, NC twelve years ago:
Project Access is a physician-led community partnership Project Access develops a coordinated charity care system by working with existing physicians, hospitals and other providers Project Access provides for the full continuum of medical care; primary care, specialty care, ancillary services, medications, and in and out-patient hospital services Project Access asks that each part of the system do what it does best Project Access provides needed access to care for the low-income uninsured while encouraging those who are eligible to enroll in state sponsored health insurance programs.
2
Project Accesses have in common a premise that coordinated care for the uninsured can provide better health at a lower cost than the current non-system that has patients delaying care and/or obtaining care via emergency rooms.
Project Accesses have a history across the country of improving access for the uninsured to health services, reducing inappropriate emergency department usage, lowering hospital admissions through the emergency department and reducing the hospital length of stay for the uninsured served through Project Access. Additionally, Project Accesses have shown to be a benefit to local businesses as the small employer has a healthier base from which to hire, workers lose less time due to illness when they have appropriate access to health care and the enrollees in Project Access are measurably healthier.
While each Project Access has its own eligibility requirements, typical requirements in Washington are that patient income be 200% Federal Poverty Level or below, uninsured (and not eligible for state sponsored insurance) and a Washington state resident.
1. What do you propose be done to realize the vision and goals for Washington State established by the Blue ribbon Commission on Health Care Cost and Access?
With the current efforts underway, state support to strengthen Project Access efforts could catapult these efforts to the next level of coordination and stability while providing expertise to other communities interested in this model.
Organization – At this time, each Project Access effort initially learns what it can by word-of-mouth. Phone calls and web-searches provide a wealth of information, but are not as effective or rich as in-person site-visits and conferences. In Washington State many Project Accesses are members of Communities Connect, a statewide affiliation of community health care collaboratives where information and best practices are shared. State funding for coordination of these efforts and shared learning for Project Access programs could provide a cost-effective mechanism to grow these efforts. With support for semi-annual meetings and site-visits, current Project Accesses could learn and share best practices and new, developing Project Accesses would be able to move much quickly. This funding could be provided as a specific allocation to Project Access efforts exclusively or as part of a larger best practices support for community collaboratives through Communities Connect.
Coordination – Each Project Access develops its own system, protocol, etc. While local autonomy is critical, some areas lend themselves well to cost savings if we had the ability to share infrastructures.Examples include; statewide software for client demographics and outcomes reports, common electronic medical records (EMR) for Project Accesses, and a state-funded, community-located Ombudsman to best connect low-income uninsured to medical care. This Ombudsman concept that the Blue Ribbon Commission is familiar with.
Financial Stability – Project Accesses are a local solution to a much larger problem. With an expected minimum of $5 returned to the community in donated care and services for every $1 invested in Project Access infrastructure, Project Access is a very cost effective model of providing care to the uninsured. Yet the financial viability of each Project Access is an ongoing challenge. Some of the Project
3
Accesses had the advantage of early significant grant dollars (Robert Wood Johnson Foundation, HCAP Federal grants), others have not.Both of these fund sources are no longer available to Project Access programs. All Project Accesses work daily to assure that there are ongoing financial resources to continue to make Project Access services available to the low income uninsured.
State support for those components all Project Accesses have in common would stabilize current efforts and facilitate the growth of other Project Accesses. Interpreter services and medications are typically the two biggest financial commitments for Project Accesses. Access to medications will become less of a challenge with the full implementation of the program the Prescription Drug Assistance Foundation is developing. This is 2-3 years away from statewide implementation. State support to expedite the Prescription Drug Assistance’s program development would have a huge positive impact on Project Accesses. Additionally, the work being led by HCA on the Drug Consortium has the potential to assist in addressing the challenge of low cost medications for the uninsured.
Strengthening and ReplicatingLast year’s passage of SB6459 which promotes the development of community healthcare collaboratives provides access to funds that can be critical to the developing Project Accesses. A similar grant program for existing efforts is also needed. In some communities, local governments have provided resources for Project Access – however with limited funds available to them, a local special tax district, such as a Community Medical Health District would expand the amount of dollars available. Community Medical Health Districts will be more fully described in another proposal being submitted to the Blue Ribbon Commission by Communities Connect.
Forming Project Accesses are relying on existing Project Accesses for technical advice and consultation. Supporting this sharing of expertise allows new efforts to develop the necessary community base and come on-line more rapidly.
2. How will implementation of your proposal enhance, hinder or otherwise impact the achievement of the vision and each of the goals established by the Commission? How do you know?
Project Accesses have a positive impact on the Blue Ribbon Goals.
With a disproportionate number of the low-income uninsured having limited English language skills and being racial or ethnic minorities, the uninsured are more at risk of having health indicators that are poorer than the general population. One of the challenges with this population is getting access to health services that would provide treatment and information to help patients health indicators better match the indicators of the general population. With a Commission goal of having consistent population health indicators across race, gender, and income in Washington, Project Access provides a local way to deliver medical care across those race, gender and income boundaries.
Some Project Accesses are providing a level of medical screening to assure appropriateness of referrals that guarantees that use of expensive physician and hospital services meet nationally recognized standards of care. This will both improve health outcomes and save money.
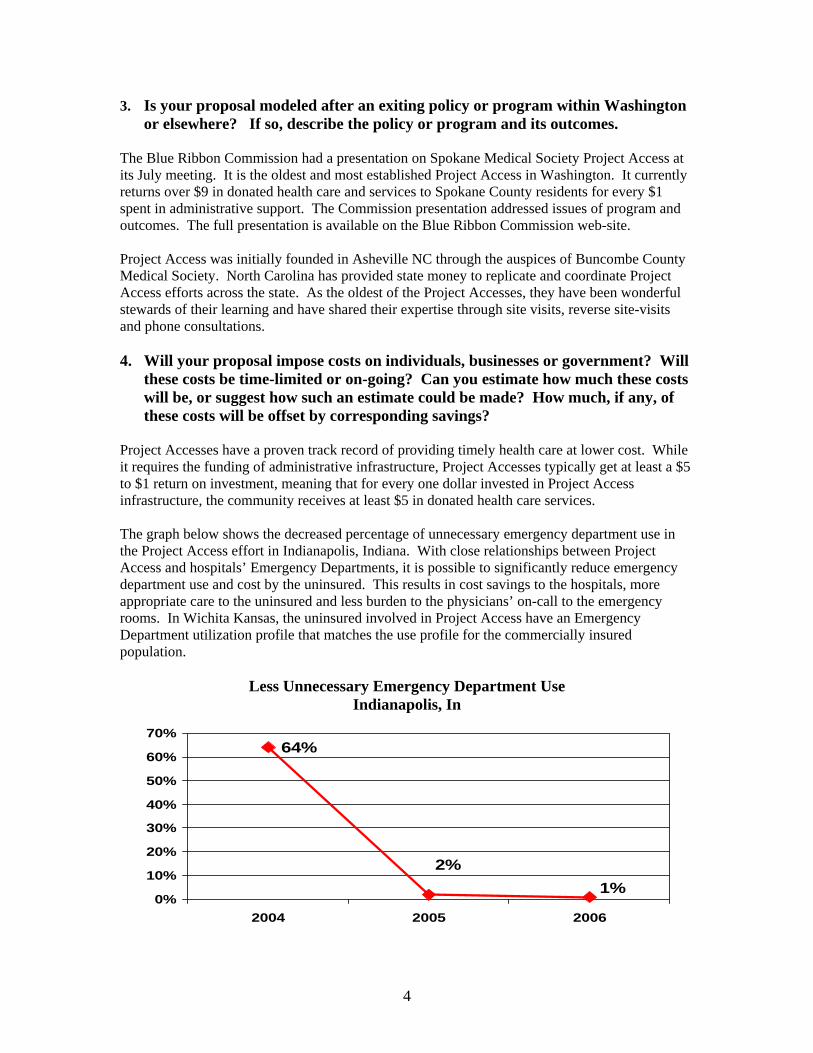
4
3. Is your proposal modeled after an exiting policy or program within Washington or elsewhere? If so, describe the policy or program and its outcomes.
The Blue Ribbon Commission had a presentation on Spokane Medical Society Project Access at its July meeting. It is the oldest and most established Project Access in Washington. It currently returns over $9 in donated health care and services to Spokane County residents for every $1 spent in administrative support. The Commission presentation addressed issues of program and outcomes. The full presentation is available on the Blue Ribbon Commission web-site.
Project Access was initially founded in Asheville NC through the auspices of Buncombe County Medical Society. North Carolina has provided state money to replicate and coordinate Project Access efforts across the state. As the oldest of the Project Accesses, they have been wonderful stewards of their learning and have shared their expertise through site visits, reverse site-visits and phone consultations.
4. Will your proposal impose costs on individuals, businesses or government? Will these costs be time-limited or on-going? Can you estimate how much these costs will be, or suggest how such an estimate could be made? How much, if any, of these costs will be offset by corresponding savings?
Project Accesses have a proven track record of providing timely health care at lower cost. While it requires the funding of administrative infrastructure, Project Accesses typically get at least a $5 to $1 return on investment, meaning that for every one dollar invested in Project Access infrastructure, the community receives at least $5 in donated health care services.
The graph below shows the decreased percentage of unnecessary emergency department use in the Project Access effort in Indianapolis, Indiana. With close relationships between Project Access and hospitals’ Emergency Departments, it is possible to significantly reduce emergency department use and cost by the uninsured. This results in cost savings to the hospitals, more appropriate care to the uninsured and less burden to the physicians’ on-call to the emergency rooms. In Wichita Kansas, the uninsured involved in Project Access have an Emergency Department utilization profile that matches the use profile for the commercially insured population.
Less Unnecessary Emergency Department Use Indianapolis, In
64%
1%2%
0%
10%
20%
30%
40%
50%
60%
70%
2004 2005 2006
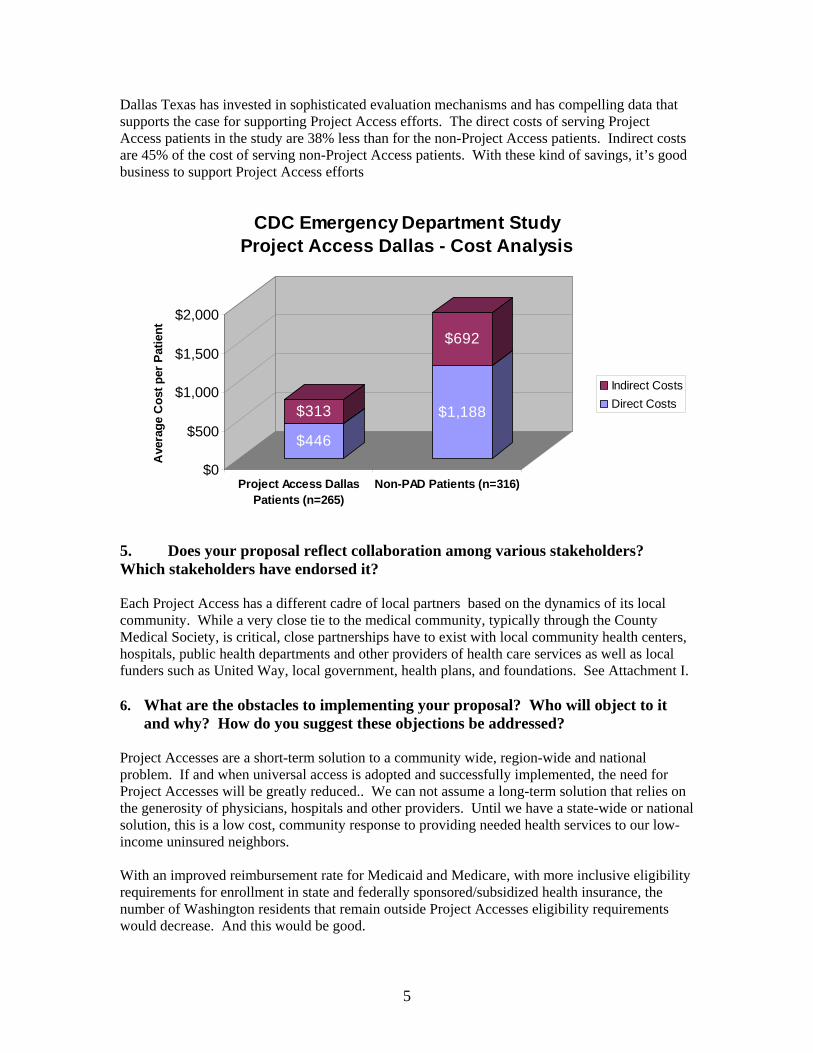
5
Dallas Texas has invested in sophisticated evaluation mechanisms and has compelling data that supports the case for supporting Project Access efforts. The direct costs of serving Project Access patients in the study are 38% less than for the non-Project Access patients. Indirect costs are 45% of the cost of serving non-Project Access patients. With these kind of savings, it’s good business to support Project Access efforts
$446
$313 $1,188
$692
$0
$500
$1,000
$1,500
$2,000
Ave
rage
Cos
t per
Pat
ient
Project Access DallasPatients (n=265)
Non-PAD Patients (n=316)
CDC Emergency Department StudyProject Access Dallas - Cost Analysis
Indirect CostsDirect Costs
5. Does your proposal reflect collaboration among various stakeholders? Which stakeholders have endorsed it?
Each Project Access has a different cadre of local partners based on the dynamics of its local community. While a very close tie to the medical community, typically through the County Medical Society, is critical, close partnerships have to exist with local community health centers, hospitals, public health departments and other providers of health care services as well as local funders such as United Way, local government, health plans, and foundations. See Attachment I.
6. What are the obstacles to implementing your proposal? Who will object to it and why? How do you suggest these objections be addressed?
Project Accesses are a short-term solution to a community wide, region-wide and national problem. If and when universal access is adopted and successfully implemented, the need for Project Accesses will be greatly reduced.. We can not assume a long-term solution that relies on the generosity of physicians, hospitals and other providers. Until we have a state-wide or national solution, this is a low cost, community response to providing needed health services to our low-income uninsured neighbors.
With an improved reimbursement rate for Medicaid and Medicare, with more inclusive eligibility requirements for enrollment in state and federally sponsored/subsidized health insurance, the number of Washington residents that remain outside Project Accesses eligibility requirements would decrease. And this would be good.
6
7. Project Access Ask of the Blue Ribbon Commission
Project Access seeks two categories of support from the Blue Ribbon Commission; 1) support for system efforts that would provide tangential assistance to Project Accesses and 2) direct support to Project Access. System efforts –
a. Fund SB 6459 each biennium. Broaden to include ongoing grant support to existing community efforts that improve local access to health care.
b. Fund the Ombudsman concept. c. Support the further deployment of the Prescription Drug Assistance Foundation.
Direct support to Project Access a. Provide $70k/year totalt o provide technical assistance to new and emerging Project
Accesses. b. Provide $40k/year total to facilitate communication and sharing of best practices through
site visits and semi-annual meeting of all existing and developmental Project Accesses. This could be provided as a specific allocation to Project Access or as part of a larger best practices support for community collaboratives through Communities Connect.
c. Support Project Accesses in obtaining and using a common (EMR). We estimate the cost at approximately $30k/operational Project Access/year. The goal is for this EMR to link the local Project Access with local participating physicians and hospitals.
d. Provide $25 – 35k/operational Project Access/year financial support for interpreter services and/or durable medical equipment to local Project Access. Each Project Access needs the local flexibility to determine how best to spend these dollars.
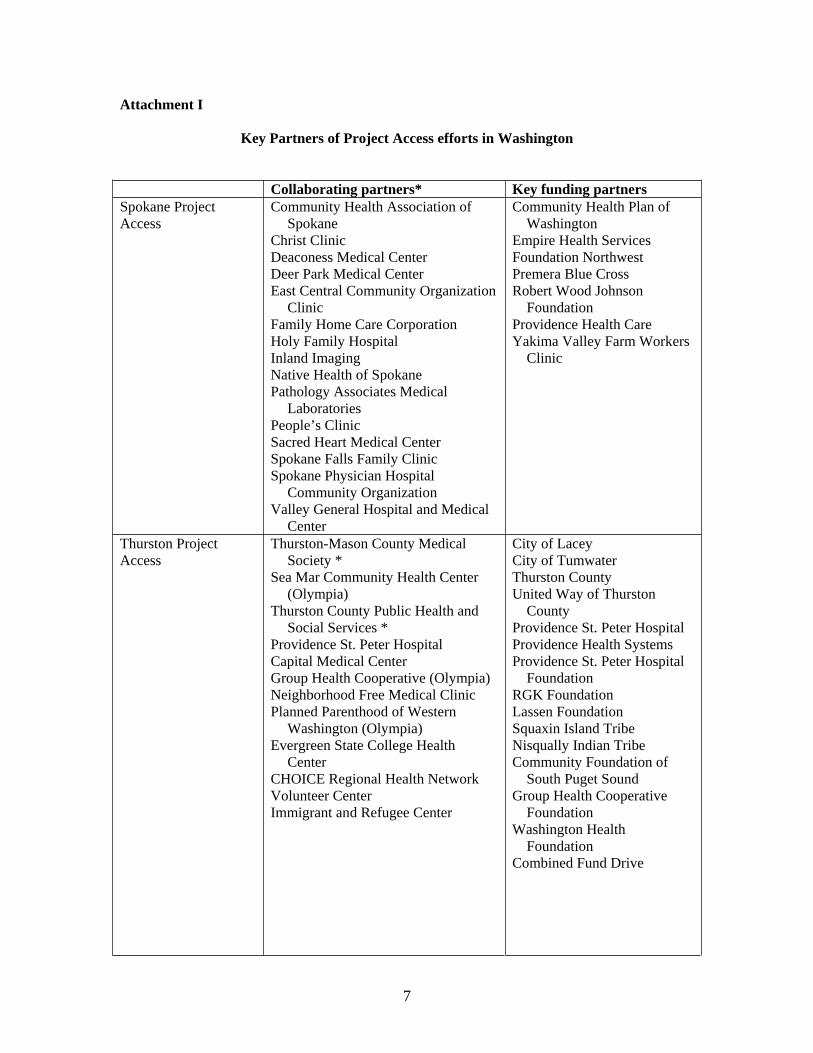
7
Attachment I
Key Partners of Project Access efforts in Washington
Collaborating partners* Key funding partners Spokane Project Access
Community Health Association of Spokane
Christ Clinic Deaconess Medical Center Deer Park Medical Center East Central Community Organization
ClinicFamily Home Care Corporation Holy Family Hospital Inland Imaging Native Health of Spokane Pathology Associates Medical
LaboratoriesPeople’s Clinic Sacred Heart Medical Center Spokane Falls Family Clinic Spokane Physician Hospital
Community Organization Valley General Hospital and Medical
Center
Community Health Plan of Washington
Empire Health Services Foundation Northwest Premera Blue Cross Robert Wood Johnson
Foundation Providence Health Care Yakima Valley Farm Workers
Clinic
Thurston Project Access
Thurston-Mason County Medical Society *
Sea Mar Community Health Center (Olympia)
Thurston County Public Health and Social Services *
Providence St. Peter Hospital Capital Medical Center Group Health Cooperative (Olympia) Neighborhood Free Medical Clinic Planned Parenthood of Western
Washington (Olympia) Evergreen State College Health
CenterCHOICE Regional Health Network Volunteer Center Immigrant and Refugee Center
City of Lacey City of Tumwater Thurston County United Way of Thurston
County Providence St. Peter Hospital Providence Health Systems Providence St. Peter Hospital
Foundation RGK Foundation Lassen Foundation Squaxin Island Tribe Nisqually Indian Tribe Community Foundation of
South Puget Sound Group Health Cooperative
Foundation Washington Health
Foundation Combined Fund Drive
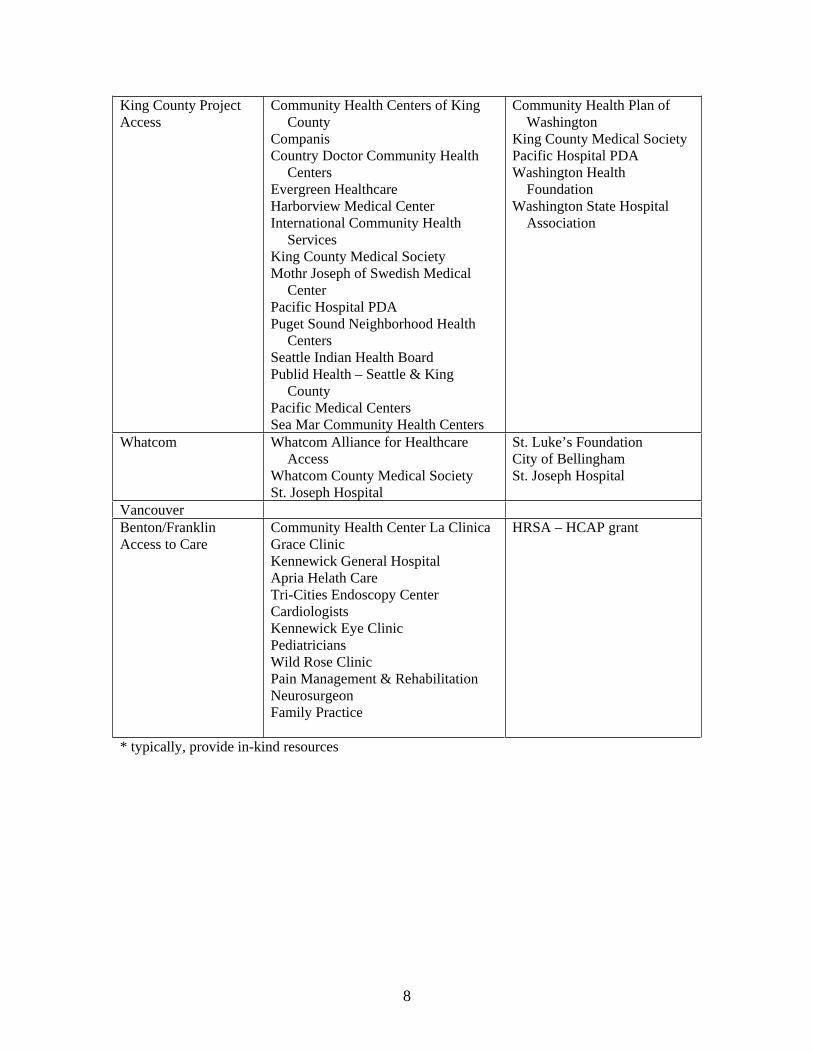
8
King County Project Access
Community Health Centers of King County
Companis Country Doctor Community Health
CentersEvergreen Healthcare Harborview Medical Center International Community Health
ServicesKing County Medical Society Mothr Joseph of Swedish Medical
CenterPacific Hospital PDA Puget Sound Neighborhood Health
CentersSeattle Indian Health Board Publid Health – Seattle & King
County Pacific Medical Centers Sea Mar Community Health Centers
Community Health Plan of Washington
King County Medical Society Pacific Hospital PDA Washington Health
Foundation Washington State Hospital
Association
Whatcom Whatcom Alliance for Healthcare Access
Whatcom County Medical Society St. Joseph Hospital
St. Luke’s Foundation City of Bellingham St. Joseph Hospital
Vancouver Benton/Franklin Access to Care
Community Health Center La Clinica Grace Clinic Kennewick General Hospital Apria Helath Care Tri-Cities Endoscopy Center CardiologistsKennewick Eye Clinic Pediatricians Wild Rose Clinic Pain Management & Rehabilitation NeurosurgeonFamily Practice
HRSA – HCAP grant
* typically, provide in-kind resources

Tab 42
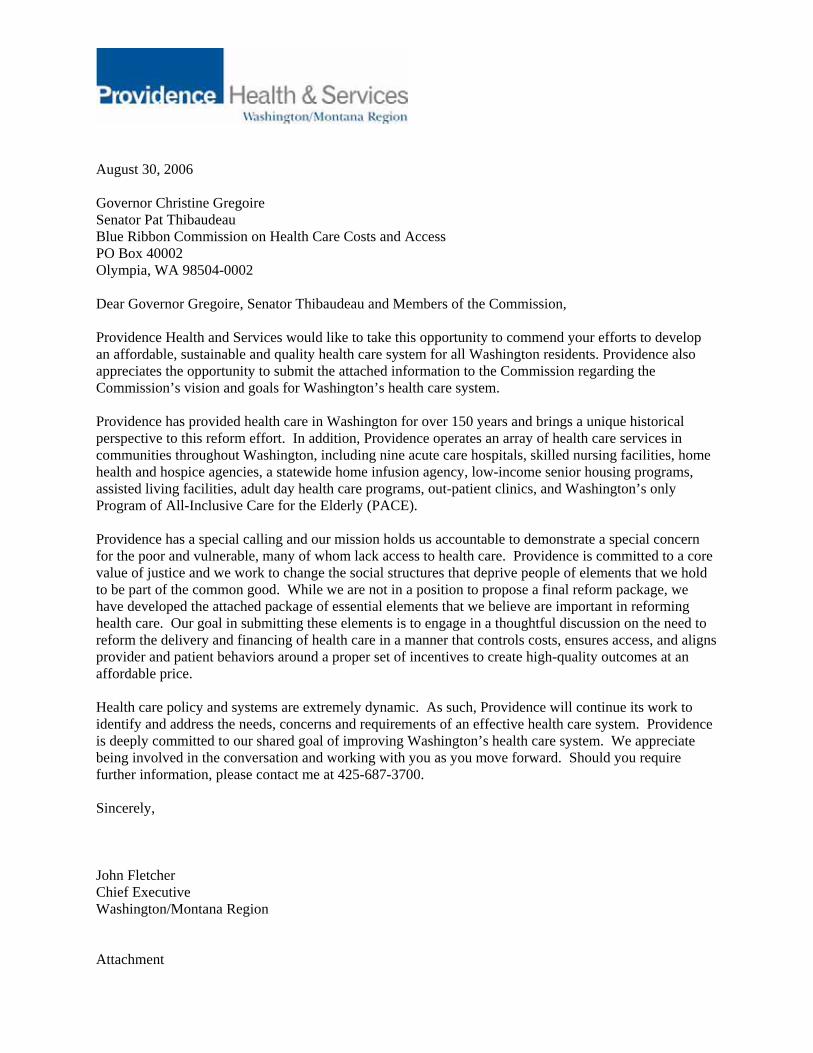
August 30, 2006
Governor Christine Gregoire Senator Pat Thibaudeau Blue Ribbon Commission on Health Care Costs and Access PO Box 40002 Olympia, WA 98504-0002
Dear Governor Gregoire, Senator Thibaudeau and Members of the Commission,
Providence Health and Services would like to take this opportunity to commend your efforts to develop an affordable, sustainable and quality health care system for all Washington residents. Providence also appreciates the opportunity to submit the attached information to the Commission regarding the Commission’s vision and goals for Washington’s health care system.
Providence has provided health care in Washington for over 150 years and brings a unique historical perspective to this reform effort. In addition, Providence operates an array of health care services in communities throughout Washington, including nine acute care hospitals, skilled nursing facilities, home health and hospice agencies, a statewide home infusion agency, low-income senior housing programs, assisted living facilities, adult day health care programs, out-patient clinics, and Washington’s only Program of All-Inclusive Care for the Elderly (PACE).
Providence has a special calling and our mission holds us accountable to demonstrate a special concern for the poor and vulnerable, many of whom lack access to health care. Providence is committed to a core value of justice and we work to change the social structures that deprive people of elements that we hold to be part of the common good. While we are not in a position to propose a final reform package, we have developed the attached package of essential elements that we believe are important in reforming health care. Our goal in submitting these elements is to engage in a thoughtful discussion on the need to reform the delivery and financing of health care in a manner that controls costs, ensures access, and aligns provider and patient behaviors around a proper set of incentives to create high-quality outcomes at an affordable price.
Health care policy and systems are extremely dynamic. As such, Providence will continue its work to identify and address the needs, concerns and requirements of an effective health care system. Providence is deeply committed to our shared goal of improving Washington’s health care system. We appreciate being involved in the conversation and working with you as you move forward. Should you require further information, please contact me at 425-687-3700.
Sincerely,
John Fletcher Chief Executive Washington/Montana Region
Attachment
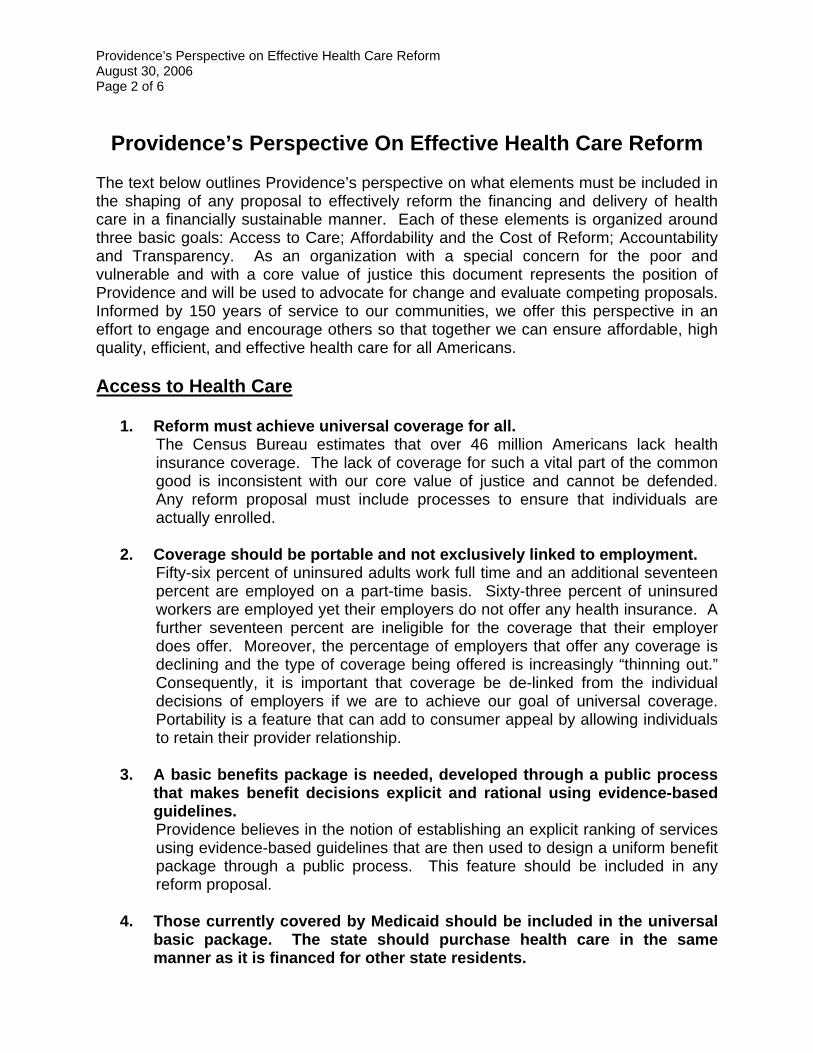
Providence’s Perspective on Effective Health Care Reform August 30, 2006 Page 2 of 6
Providence’s Perspective On Effective Health Care Reform
The text below outlines Providence’s perspective on what elements must be included in the shaping of any proposal to effectively reform the financing and delivery of health care in a financially sustainable manner. Each of these elements is organized around three basic goals: Access to Care; Affordability and the Cost of Reform; Accountability and Transparency. As an organization with a special concern for the poor and vulnerable and with a core value of justice this document represents the position of Providence and will be used to advocate for change and evaluate competing proposals. Informed by 150 years of service to our communities, we offer this perspective in an effort to engage and encourage others so that together we can ensure affordable, high quality, efficient, and effective health care for all Americans.
Access to Health Care
1. Reform must achieve universal coverage for all. The Census Bureau estimates that over 46 million Americans lack health insurance coverage. The lack of coverage for such a vital part of the common good is inconsistent with our core value of justice and cannot be defended. Any reform proposal must include processes to ensure that individuals are actually enrolled.
2. Coverage should be portable and not exclusively linked to employment. Fifty-six percent of uninsured adults work full time and an additional seventeen percent are employed on a part-time basis. Sixty-three percent of uninsured workers are employed yet their employers do not offer any health insurance. A further seventeen percent are ineligible for the coverage that their employer does offer. Moreover, the percentage of employers that offer any coverage is declining and the type of coverage being offered is increasingly “thinning out.” Consequently, it is important that coverage be de-linked from the individual decisions of employers if we are to achieve our goal of universal coverage. Portability is a feature that can add to consumer appeal by allowing individuals to retain their provider relationship.
3. A basic benefits package is needed, developed through a public process that makes benefit decisions explicit and rational using evidence-based guidelines.Providence believes in the notion of establishing an explicit ranking of services using evidence-based guidelines that are then used to design a uniform benefit package through a public process. This feature should be included in any reform proposal.
4. Those currently covered by Medicaid should be included in the universal basic package. The state should purchase health care in the same manner as it is financed for other state residents.
Providence’s Perspective on Effective Health Care Reform August 30, 2006 Page 3 of 6
Medicaid funding and reductions in reimbursement rates have long been a major contributor to the cost-shift problem and the accompanying increase in the number of the uninsured. As a result individuals whose care is financed through Medicaid often have good coverage but lack access to services, especially with respect to primary care. Incorporating the Medicaid program into the basic plan for all residents will require the state to purchase health care on the same basis as the rest of society. It also will serve to create a broader base of support for the poor since all members of society will receive the same basic benefit plan unless they choose to exercise their right to buy additional coverage at their own expense.
5. Insurers must continue to have a role and must participate in providing the basic plan. Market forces and existing competition among competing plans is seen as the best way to establish networks, encourage needed innovation in the delivery of health care, enhance quality, ensure cost containment, and address a strong concern about concentrating too much power in a single government agency. Any plan wishing to offer supplemental coverage must first offer the basic package of services to consumers in order to provide any health insurance in the state.
6. Consumers can choose from any basic plan offered by insurers, similar to the manner in which the Medicare Advantage program operates. What one author describes as “Managed Consumerism” is intended to “blend the patient-centric focus of consumer-driven health care and the provider-centric focus of managed competition.” We believe that promoting informed and cost-conscious choices of consumers - enabled by the criteria outlined in our accountability and transparency goal and in an environment of competing health plans - will support the efforts to reform the delivery of health care while providing needed elements of cost containment.
7. Consumers can buy additional coverage beyond the basic package. Reform proposals should allow an individual to purchase additional coverage beyond the basic package financed through the public system.
Affordability and the Cost of Reform
8. Everyone must contribute: consumers, employers and government share costs.The individual effects of any reform proposal on specific employers, consumers, and government will vary; nonetheless, there is a recognized need to engage all three groups in the financing of the program. While some individuals, employers, and governments may contribute more to the aggregate funding of the program efforts should be undertaken to maintain the existing
Providence’s Perspective on Effective Health Care Reform August 30, 2006 Page 4 of 6
relative distribution of expenses among these sectors. Any proposal should seek to avoid massive re-distributional consequences among these groups.
9. Employers’ contribution to health care costs should be more predictable. Reform proposals must incorporate cost containment features that make all contributions more predictable – especially those for employers whose contributions represent the single largest source of funding for health care, and whose costs continue to rise dramatically. Responsibility for the financing of employers’ share of health care cost must also be equitably shared: tax mechanisms should not allow some employers to avoid participating in the cost of health care. At the same time some protection must be available for small employers and those who are self-employed.
10. Financing provided by consumers should be based on their income: only the lowest-income consumers would not share costs. Our core values of justice and stewardship requires that individuals participate in the cost of their care as a means of helping to pay for the system, encouraging appropriate and efficient utilization of services, and to educate consumers as to the cost of care. Additional subsidies would be provided to low-income individuals by the state to offset the cost of required co-pays and deductibles that are included in the basic package of services. Benefit design should also include incentives that encourage healthy lifestyles, the provision of preventative services, and participation in disease management programs where appropriate.
11. Premiums should be community rated to broadly share risk with premium risk adjustments to prevent problems of adverse selection. There must be broad risk sharing among all members of the state and plans should not be allowed to discriminate against high-risk individuals who choose to enroll in their plan. At the same, premium risk adjustment factors must protect plans against the effects of adverse selection while encouraging plans to adopt delivery models that address the specific and unique needs of certain high-risk categories.
12. The Medicare program should continue but be reformed so that it is financially sound for the future, and is not subsidized by the private sector.Medicare’s payment formulas, benefit design, and relative size in the market collectively create incentives that frustrate the goals of any state-specific reform proposal. While this fact would argue for incorporating Medicare into state health care reform efforts, requiring this as a condition of any reform effort would likely derail needed changes.
13. While moving to universal coverage may require an initial investment of additional funds, reform should lead to more predictable and affordable increases in the cost of care
Providence’s Perspective on Effective Health Care Reform August 30, 2006 Page 5 of 6
Recent analysis has demonstrated at a statistically significant level that a higher percentage of uninsured adults reported that they were in fair or poor health and had lower SF-12 physical component scores than their insured counterparts. Despite the fact that uninsured individuals typically access higher-cost emergency department and hospital care that over time may be replaced by a greater utilization of primary care at an overall lower cost, in the short term it might be expected that there will be a need for a greater infusion of funding until such time as these cost efficiencies are realized. Reforms must also anticipate an initial influx of people (the uninsured) into the health care system and the related administrative costs.
14. Cost control is paramount and must be built into any reform proposal.These elements incorporate the following cost containment features:
o Use of a managed-competition model that requires health plans to compete for enrollment on the basis of being able to deliver a uniform benefit to all individuals choosing to enroll in the plan;
o Premiums that require individuals to participate in the cost of their coverage that are indexed to income;
o Requiring all individuals in the state to have a vested interest in the aggregate cost of the health care since it affects the benefit design and their specific premiums;
o Requiring consumers to fully participate in the additional cost of electing to choose a higher cost plan;
o Use of evidence-based guidelines to rank health care services and to decide on what services are included in the basic benefit package (the notion of “rational rationing”) with a focus on prevention and health promotion; and
o A uniform benefit design and coordinated enrollment process that creates a cost-effective administrative structure and promotes a reduction in overhead expenses by insurers. Any reform proposal should also incorporate features that will lessen administrative burden on providers, insurers, and consumers while eliminating the waste associated with the current system of financing, delivering, and billing for health care services.
Accountability and transparency
15. Consumers deserve quality care based on available evidence and best practice standards: health care providers and insurers should provide consumers with easy access to information about quality and standards of care. While insurance reform is necessary it also must be seen as an enabler to further reform in the delivery of health care services. If individuals are to be encouraged to choose health care services on the basis of good information then the competing and confusing standards for quality must be eliminated. Consequently, any reform proposal must require disclosure and public
Providence’s Perspective on Effective Health Care Reform August 30, 2006 Page 6 of 6
exchange of certain defined measures of patient outcomes and satisfaction using evidence-based guidelines.
16. Consumers also need and deserve easy access to information about cost of services and “plain English” pricing. Health care pricing has been unduly influenced by cost-shifting and reimbursement incentives. Reform proposals should include features that require disclosure of price and cost information; especially since premiums are community-rated and risk adjusted.
17. Hospitals, other providers, and insurers should collaborate and share responsibility for effective cost containment. Payment methodologies, in addition to insurance reforms, should encourage the appropriate utilization of services and reform in the way that health care is delivered. Costs must be predictable and financially sustainable. Collaboration and innovation should be encouraged along with the adoption of appropriate technology that is proven to be cost-effective.
18. Responsibility for improving the health of the community remains. If reforms result in lower rates of charity care and overall community benefit burden, providers and insurers should identify an alternative means of contributing to the greater good in health care. If reform efforts are adopted and prove to be successful, windfall profits could occur, at least in the short term. Reform proposals should plan for this possible outcome so that the financial outcomes and benefits arising from universal coverage accrue to society and are not dissipated or mal-distributed. Providers and insurers should offer their proposals for mitigating windfalls as part of public reform discussions.

Tab 43
Page 1 of 6
2003 Western Avenue, Ste 600, Seattle WA 98121 | (206) 448.2570 | www.pugetsoundhealthalliance.org
Ideas for the Washington State Blue Ribbon Commission on Health Care Costs and Access
Submitted by: Margaret Stanley, Executive Director Puget Sound Health Alliance 2003 Western Avenue, Suite 600, Seattle WA 98121 206.448.2570 ext. 111 [email protected]
1. What do you propose be done to realize the vision and goals for Washington State established by the Blue Ribbon Commission on Health Care Costs and Access? Briefly summarize your proposal.
To realize the vision and goals set forth by the Commission, all three problem areas of improving access, health status and affordability need to be addressed in an interconnected fashion. Rather than approaching each separately, we suggest that the Blue Ribbon Commission support the community-based effort already underway through the Puget Sound Health Alliance (the Alliance) that is fundamentally restructuring health care incentives to consistently recognize, encourage and reward effective and efficient health care.
All people should have access to services and treatments that are effective to improve and promote good health. Yet, even for those who have insurance or are able to get health care services now, research shows that over 40 percent of patients in this area don’t receive care that is consistent with widely-accepted, national standards defining effective care (RAND, 2004). These standards reflect effective care patients ought to receive – such as mammograms, immunizations and other preventive measures, and services like blood glucose (sugar) tests and foot exams for people with diabetes. When care provided to so many falls so short of standards, that means a sizeable chunk of the health care dollar is spent on services that are ineffective or don’t improve health. Through greater health care effectiveness and efficiency in improving health, public and private health care dollars can “stretch” further to provide health care access to all.
At this time, the work of the Alliance is focused on Snohomish, Kitsap, King, Pierce and Thurston counties, targeting four major stakeholder groups: physicians, consumers, purchasers and health plans. As a collaborative, our success is contingent upon the collective ability to coalesce stakeholders around common goals despite sometimes divergent interests.
Thus far, more than 110 organizations participate in the Alliance and many have an interest in expanding the efforts statewide, including the State of Washington represented by Steve Hill, Administrator of the Health Care Authority. We encourage everyone to join, including individual consumers. Private and public employers, consumer groups, physicians, hospitals, health plans and others are actively involved and support our work. Explore these links for more information:
http://www.pugetsoundhealthalliance.org/join/participants.html for a list of Alliance participants
http://www.pugetsoundhealthalliance.org/news/index.html for media coverage and editorials
http://www.pugetsoundhealthalliance.org for general information about the Alliance
Page 2 of 6
2003 Western Avenue, Ste 600, Seattle WA 98121 | (206) 448.2570 | www.pugetsoundhealthalliance.org
The Health Alliance is focused on defining, measuring, reporting and rewarding high quality, efficient care that promotes and improves health. Our initiatives include:
Producing a publicly-available report comparing the performance of medical clinics and hospitals regarding quality, efficiency (i.e., value or cost) and patient experience. This report will be based on data compiled from all health plans in the state, many self-insured employers and the State of Washington, Medicaid and possibly Medicare. The purpose is to inform decision-making by patients, purchasers and providers. The report will also provide public recognition for those who provide higher quality, more efficient care, while creating an incentive for quality improvement across the entire system.
The Alliance will base our initial public report on quality measures drawn from those published by the Institute of Medicine (IOM) in December 2005. Other measures to be included in the Alliance reports will address cost-of-care and patient experience. We expect to have the first quality performance report available for vetting by physicians, health plans, select purchasers and consumer representatives at the end of 2006. After honing the analytic approach, data presentation and format of the reports, based on feedback received during the vetting process, we expect the initial report to be available to the public by the end of the first quarter 2007.
Adopting evidence-based treatment guidelines, in collaboration with physicians and other medical leaders in the region, for use when treating patients. These guidelines – initially for heart disease, diabetes, low back pain, depression, and appropriate prescribing of medications – will be consistent with national standards, reflecting generally accepted standards of care. This Alliance effort is led by our Quality Improvement Committee, comprised mainly of local physician leaders working with specialized Clinical Improvement Teams. The specialized teams are researching and recommending the evidence-based clinical guidelines and related quality measures for each chronic condition.
Recommending specific changes to align incentives to encourage decisions – made by doctors, patients, employers, health plans and others – that improve personal health and treatment outcomes while rewarding quality, affordability and good patient experience. The Alliance has begun meeting with employers and unions who purchase health care on behalf of employees and their families, to share specific recommendations. The specific recommendations thus far focus on elements of health benefit plan design, workplace wellness and health promotion activities, and effective communication with individual consumers.
Supporting the adoption of interoperable health information technology, such as electronic medical records, personal health records and patient registries to improve efficiency and enable more accurate ways to assess health quality outcomes. Increasing the use and interoperability of health care information technology not only increases efficiency through reduction in duplicative paperwork, but also improves the ability for providers to better manage the care for their patient populations by using the system reminders and other clinical support tools imbedded in registry software. Ultimately, as more electronic medical records and other health IT are used, the data currently “locked” in paper-based medical charts will be more accessible across the population to include in the public reports on health care quality. By tapping into chart-level data (de-identified to protect patient confidentiality) the public comparison reports will be able to include more accurate information about treatments actually provided and the resulting impact on improving health status.
Page 3 of 6
2003 Western Avenue, Ste 600, Seattle WA 98121 | (206) 448.2570 | www.pugetsoundhealthalliance.org
Providing a suite of useful informational tools to help guide health care decision-making foreach stakeholder, built on a common set of information, but customized for appropriate use by each group. Materials will be provided to individual consumers regarding about how to work with their doctors to prevent and manage chronic illness, in addition to suggestions for taking better care of themselves. Informational tools for use by employers and union trusts will support better health for employees through benefit plan design, worksite programs and communication suggestions. And, using consistent information, provider-oriented materials will also be developed for use within medical clinics and hospital settings, to help with clinical processes related to the evidence-based guidelines and to use as handouts to patients.
The ultimate long-term sustainability for quality improvement will occur within a health care system structured with incentives for physicians, consumers, health plans, purchasers and others. The incentives need to be aligned to support the ongoing process of measuring, reporting, and improving health care quality. It is this structured system of aligned incentives – one of which is a public report on health care performance – that will drive and sustain quality improvement over the long term. Vital to creating this structured system of incentives is the ability to engage and activate consumers. The key is to find effective ways to build awareness, deeper understanding, and then engage consumers so they choose to incorporate preferred behaviors into health-related decisions and activity.
The government can play a vital role in consumer engagement to promote and improve the health of our next generation in particular. A key question is how to ensure that we have healthy children who grow up into healthy adults. The rates of obesity among our young people are cause for alarm. In 2004, according to the Seattle-King County Department of Public Health, approximately 6.3 % of adults age 18 and older in the state had diagnosed diabetes and about 6% of adults in Washington state have been told by a health professional that they have heart disease. Based on the poor health status of so many people under age 18, a looming crisis in health care (and health care costs) is the upcoming increase in the number of overweight people likely to develop serious chronic illness. For each overweight child, the future is likely filled with health problems, expenses and quality of life limitations that cannot be ignored by the larger community.
Just as success has been achieved in reducing the rate of tobacco use and smoking in Washington state, there is an essential need for a coordinated effort to encourage better health among children, addressing nutritional choices and more physical activity in particular. There is no easy answer to this challenge, as it must involve taking a longer view and tapping into the influences that occur at home, through the schools, in daycare centers, wherever health care is provided and through other people and places of influence. Women are central figures and role models in so many of those environments, so a related issue is how to encourage and promote a healthy lifestyle for them as role models to children, particularly as mothers, teachers, and daycare providers.
The work of the Washington Health Foundation, a member of the Alliance and a close collaborator in our work to promote better health, is a strong place to start to engage in this long-term effort. Ultimately, such collaboration will need to create social change and build a cultural expectation of good health. Based on the experiences of many organizations in leadership roles at the Alliance, we recommend taking an aspirational approach to promote concepts such as “Fit for the Future” or “Eat Smart, Move More” rather than placing blame on those who are least healthy. Consistent with this are programs that provide support to individuals through personal health coaching and weight loss groups such as Weight Watchers™.
Page 4 of 6
2003 Western Avenue, Ste 600, Seattle WA 98121 | (206) 448.2570 | www.pugetsoundhealthalliance.org
In summary, under this proposal, the Blue Ribbon Commission can play a key role in expanding the effectiveness of the collaborative work of the Puget Sound Health Alliance. Specifically, we recommend that the Commission:
(a) provide multi-year funding to the Alliance to expand the reporting, quality improvement and consumer engagement efforts statewide;
(b) apply the power of the State in its purchasing behavior by continuing the work already underway to incorporate Alliance recommendations into health benefits, worksite wellness and health promotion, and communication directed at anyone covered through PEBB coverage, Medicaid, Basic Health, Workers Compensation / L&I and other government-based health programs;
(c) build on the Washington Health Information Collaborative award program and the work of the Health Information Infrastructure Advisory Board (HIIAB) by strongly promoting to providers greater use and interoperability of electronic medical records, patient registries and other health information technology (IT), which might include setting health IT expectations as a part of State program contracts, and providing multi-year funding to the WA Health Information Collaborative for awards given to medical clinics and hospitals to adopt and expand their use of health IT; and,
(d) engage in a long-term effort in collaboration with the Washington Health Foundation and others, to improve the health of children and youth across the entire state, through a coordinated system of policies requiring healthy nutrition and regular exercise in schools, in addition to promotional messages, positive support and incentives for children and the people who influence them.
2. How will implementation of your proposal enhance, hinder or otherwise impact the achievement of the vision and each of the goals established by the Commission? How do you know?
The Commission, in implementing this proposal, will directly address all three problems of access, health status and affordability in the current health care system. These problems are the result of existing incentives that are frequently inconsistent and often unintended. By supporting changes in health care system incentives, the Commission can directly affect decisions and behavior that determine the effectiveness and quality of care, the health status of the population and the affordability of care which leads to greater access.
The current lack of consistent information for all stakeholders regarding effective health care treatments and value received, for example, does nothing to ensure that every health care dollar spent provides the most effective care for the greatest number of people. For those who do have health insurance, reimbursement systems pay more to providers for “doing more” rather than getting people healthier. Promotional messages aimed at consumers to ask doctors for specific treatments, increase demand, whether or not the treatment is needed, and reinforce the notion that “more care is better.” The larger social environment in which the health care system operates does not effectively encourage good decisions about nutrition and physical activity, resulting in a growing population of overweight people living with chronic disease.
By supporting the work of the Alliance, the Commission will help to reduce barriers created by perverse incentives in benefit design and reimbursement structures, in addition to creating positive incentives through effective workplace programs, information, and health promotion activities. Each of these shape expectations and behavior through direct and subtle incentives influencing patients, physicians, health care practitioners, employers, unions, health plans and government.
Page 5 of 6
2003 Western Avenue, Ste 600, Seattle WA 98121 | (206) 448.2570 | www.pugetsoundhealthalliance.org
We know from experience that incentives impact behavior. The system we have today, with all of its problems, is a direct result of the financial incentives and other rewards and recognition currently in place. Logic dictates that by changing the incentives, behavior change will follow. For example, reports to the public that compare health care performance are far more likely to result in quality improvement than no reports at all, or reports that are only shared with providers. Regarding employee engagement in healthy activities, recent experience within King County as an employer illustrated the power of incentives: by offering a significant differential on the deductible level for employees who were willing to take a health risk assessment and get involved in healthier behaviors, about 90% of their employees chose to participate.
3. Is your proposal modeled after an existing policy or program within Washington or elsewhere? If so, describe the policy or program and its outcomes.
The proposal for the Commission is directly tied to activities already underway at the Puget Sound Health Alliance. Elements of the Alliance activities draw from best practices in other cities and regions around the country. Examples include public reporting occurring in Minneapolis/St. Paul, quality improvement efforts in Pittsburgh and other locations. The Alliance is collaborating nationwide, through groups such as the National Business Coalition on Health and the Robert Wood Johnson Foundation (RWJF), which provide technical support and access to national experts to enhance our capabilities in Washington state.
From the “other Washington,” Secretary Mike Leavitt, head of the United States Department of Health and Human Services, met with Alliance leaders in Seattle last month to discuss shared goals and to deliver the great news that HHS wants to work with the Alliance to get us access to Medicare data for our public reports. Secretary Leavitt made it clear that HHS is interested in seeing that the Alliance is added to the growing national network of similar collaboratives working on shifting the incentives in health care toward higher quality, more efficient and affordable care.
4. Will your proposal impose costs on individuals, businesses or government? Will these costs be time-limited or on-going? Can you estimate how much these costs will be, or suggest how such an estimate could be made? How much, if any, of these costs will be offset by corresponding savings?
From a system-wide perspective, this proposal focused on incentives to promote higher quality and better health will yield cost savings rather than increase costs. In the absence of the proposed activities, health care costs will continue to increase at an unacceptable rate for individuals, businesses and government. Interest in creating the Alliance in the first place was based in large part on the keen understanding that cost growth is not sustainable and that the focus on more effective and efficient care and better health outcomes is vitally important to being able to manage health care costs over time. This need is especially strong for the State of Washington, as it uses limited taxpayer dollars to provide coverage to State employees and their dependents, in addition to funding the array of health related programs and services.
Regarding the proposed activities specific to the Commission, we are very interested in receiving significant ongoing financial support from the State of Washington, in addition to the contributions already made by the Health Care Authority. The Alliance is building a key part of the health care information and quality improvement infrastructure to benefit everyone in the state. For example, the report comparing the performance of medical clinics and hospitals will be available to the public, and thus is a community asset. Strong credit should be given to the public and private employers and other organizations that have come to the table to fund the cost of building the Alliance foundation and
Page 6 of 6
2003 Western Avenue, Ste 600, Seattle WA 98121 | (206) 448.2570 | www.pugetsoundhealthalliance.org
“infrastructure” for producing the initial reports. However, over time, as these public reports are a public good which will benefit the entire community, we strongly encourage the Commission to consider ways that the State can provide long-term financial support for the Alliance and its work.
5. How does your proposal reflect collaboration among various stakeholders? Which stakeholders have endorsed it?
The Alliance is unique in that all stakeholders have been represented at the table from the start. Everyone is welcome to join and participate in the Alliance as it continues to grow. Thus far, more than 110 organizations participate from the five counties of Snohomish, Kitsap, King, Pierce and Thurston. Every participating organization and individual consumer contributes to the Alliance financially, to support our work. And, while our initial focus is the Puget Sound region, many of our employer, union, provider, health plan, and consumer group participants have an interest in expanding the Alliance efforts statewide and ensuring that our work is coordinated with others on a national scale. For a list of participants, see http://www.pugetsoundhealthalliance.org/join/participants.html
Beyond funding the work, stakeholders across the community are deeply involved in the decision-making process of the Alliance, which takes place through a committee-based organizational structure. Over 150 physicians and other health care professionals, in addition to business people, and government and community leaders and individual consumers have and continue to contribute a tremendous amount of volunteer time to ensure that the Alliance meets its goals. In a recent calculation, total contributions to the Alliance were estimated to be worth over $4 million – including financial support, discounts on services, in-kind consulting and donated time from some of the areas top medical, technical and business professionals. An additional indication of the support from physicians, hospitals and other providers involved in the Alliance is that many strongly endorsed our first two clinical improvement team reports. See http://www.pugetsoundhealthalliance.org/resources/CITHeartDiabetesSupport_000.html
6. What are the obstacles to implementing your proposal? Who will object to it and why? How do you suggest these objections be addressed?
Based on the level of commitment and support for the Alliance, we see no obstacles to the work which is largely underway. We are not aware of any objections to the work that the Alliance is undertaking.
As leaders representing the State, the Commission has power to assist with the long-term challenge of securing financial support to ensure continued production of the public comparison report on health care quality, affordability and patient experience. Given that the reports are a community asset, it is possible that current and potential funders may decide over time simply to let others pay for it. This is the classic “free rider” problem, which is why government often funds items that provide a public good.

Tab 44
REACH COALITION Aging and Disability Services
American Diabetes Association
American Heart Association
American Lung Association
Center for MultiCultural Health
Harborview Medical Center
International Community Health Services
Kin On Health Centers
National Asian Pacific Center on Aging
Northwest Urban Ministries
Pacific Northwest Research Institute
Public Health – Seattle & King County
Qualis Health
Sea Mar Community Health Centers
Seattle Indian Health Board
Senior Services
Univ. of Washington School of Nursing School of Nutritional Sciences Health Promotion Research Center School of Public Health
Washington State Department of Health
Public Health – Seattle & King County Lead Staff
Cheza Garvin, Ph.D., MPH, MSWPrincipal Investigator
Lois Watkins REACH Program Manager
Roxana Chen REACH Evaluation Manager
Seattle & King County REACH Alliance ProposalBlue Ribbon Commission on Health Care Costs & Access
1. What do you propose be done to realize the vision and goals for Washington State established by the Blue Ribbon Commission on Health Care Costs and Access? We propose that the Blue Ribbon Commission support the Seattle & King County REACH 2010 Coalition (REACH) in becoming the REACH Alliance in order to expand our efforts in providing innovative, culturally relevant diabetes education, social support, and self-management training in King County to all communities of color disproportionately impacted by this disease. In addition to individual level changes, the REACH Alliance will provide technical assistance and training to the health care community on culturally competent diabetes services and health behavioral change strategies. The REACH Alliance sees our approach as having long-range implications by providing accessible, culturally relevant, affordable, quality health care to King County residents. The approach we have taken can be replicated to ensure broader access to healthcare for all Washingtonians, particularly those most at-risk. The comprehensive diabetes services along with community and systems level changes will result in reduced incidence of disease and healthier communities. The Alliance requests support to triple, by the year 2008, the number of health agencies in King County that provide comprehensive, culturally relevant diabetes services to African Americans, Asian Americans and Pacific Islanders, and Latinos/Hispanics. The goal of the Alliance would be to provide all members of our focal groups with access to our diabetes services by 2012.
Providing accessible, affordable quality health care requires the collaboration of groups from diverse industries, occupations, and communities. The REACH Coalition (REACH) has created such a partnership. The REACH Coalition is a partnership of community based agencies, community groups, educational and research institutions, public health agencies, hospitals and health care providers, and people living with diabetes working together to reduce diabetes related health disparities in King County. The coalition believes that all of these groups and many more have to work together if we
are to realize the vision of all Washingtonians having access to affordable, quality health care. For this reason we are working to create the REACH Alliance that would include our current members and expand to include faith
REACH Alliance Proposal
communities, policy makers, health insurers, foundations, and businesses.The uninsured are no strangers to the agencies that comprise REACH. Many of those most at risk for being uninsured (e.g., low income families, racial and ethnic minorities, part-time & seasonal workers, low-wage workers, and small business employees) participate in the diabetes services provided by the REACH Coalition.
Health disparities are the disproportionate burden of disease and death that impacts certain racial/ethnic groups. REACH has been working to reduce these health disparities by providing effective and culturally relevant diabetes services. Community and systems level changes focus on improving case coordination and information systems, developing stronger partnerships among community groups, and influencing organizational and legislative policies. These efforts are not only to improve the quality of life for people living with diabetes but to reduce the health care costs due to emergency room visits, hospitalizations, and preventable medical procedures. The data have shown that lack of access to care results in Washington residents delaying medical care. This behavior exacerbates and complicates the medical condition of people living with diabetes, thus increasing medical costs. The Alliance aims to reverse this trend.
2. How will implementation of your proposal enhance, hinder or otherwise impact the achievement of the vision and each of the goals established by the Commission? How do you know?
The REACH Alliance will make a significant contribution to the achievement of the Commission’s mission and goals. We say this confidently, based on the six-year experience of the REACH Coalition, the demonstration project on which the REACH Alliance we are describing is based. REACH has served more than 1500 persons with diabetes in African American, Asian American and Pacific Islander, and Latino communities in King County. The REACH Alliance would have even broader impact.
Diabetes is one of the costliest chronic diseases facing this country, with direct and indirect annual costs now at $132 billion. (The annual health care cost burden of diabetes on the State of Washington has not yet, so far as we know, been calculated.) It is called a silent killer because its victims die not of diabetes itself, but of the ravaging complications it entails—especially kidney disease, heart disease, and stroke. Diabetes is also an inequitable disease—burdening communities of color at up to, and even more than,
2
REACH Alliance Proposal
twice the rate of white communities. Finally, the disparities in access to effective, affordable diabetes health care (not simply disparities in disease incidence but in access to care that could prevent or control it) are demonstrated by the fact that an African American man with diabetes in King County is twice as likely to die from a diabetes-related cause as his white counterpart.
The REACH Alliance, if fully implemented, will measurably advance the Commission’s five-year vision as it pertains to King County, and thus serve as a model for similar or expanded programs in other areas of the State. It will also advance the goals of the Commission in the following ways:
All communities of color in King County will have access to culturally competent diabetes education and self-management services by 2012.
When people of color have less diabetes, and those with diabetes are empowered to control its complications more effectively, Washington State will be measurably healthier.
Every patient and family that receives the culturally-competent diabetes services of the REACH Alliance will reduce the racial and ethnic disparities of diabetes in Washington.
The chronic-care self-management model of REACH, delivered by peer providers, in language, within a culturally relevant and sensitive framework has been demonstrated to be effective. Its use by the broader constituents of the Alliance—to reach even more patients and communities—will extend effective health care that is evidence-based.
The REACH Alliance will direct its energies at the most cost-effective early stages of diabetes—i.e., before it starts, in educational efforts to promote prevention; in self-management training, to promote good glucose control; even in late stages, to retard the development of additional or more severe complications.
Such benefits are unequivocal. They are already clear in the evaluation results from the REACH Coalition. Assistance from the State in developing the Alliance would therefore make an unprecedented contribution to achieving Washington’s health goals, would have dramatic impact on the State’s diabetes crisis, and would serve its citizens of color with health care that they are now too often excluded from. 3. Is your proposal modeled after an existing policy or program within Washington or elsewhere? If so, describe the policy or program and its outcomes.
3
REACH Alliance Proposal
The REACH Alliance proposal is modeled after the existing Seattle & King County REACH 2010 Diabetes Program. “REACH” stands for Racial and Ethnic Approaches to Community Health and is a CDC-funded nationwide demonstration program whose goal is to reduce and eliminate health disparities among communities of color. The Seattle & King County REACH program is specifically targeting the disparity of diabetes among African Americans, Asians, Pacific Islanders and Hispanic/Latinos within King County.For more information about Seattle & King County REACH 2010, please see http://www.metrokc.gov/health/reach/index.htm. For more information about the REACH Program at the national level, please see http://www.cdc.gov/reach2010/.
Our confidence in The REACH Alliance’s future outcomes is based on the success of its predecessor, the Seattle & King County REACH Program. To date, over 1500 people have participated in REACH activities. Based on 772 matched pre and posttest surveys collected from REACH participants, the program has resulted in improvements in dietary behaviors, physical activity and diabetes knowledge. Participants also report greater confidence in managing their diabetes, particularly in keeping their blood sugar under control, and exercising healthy behaviors. Focus groups with participants generated overwhelmingly positive responses and confirm our survey findings. Participants across the board expressed great appreciation for having activities and materials in their respective native languages, tailored to their own cultures. They especially appreciated learning how to choose and eat healthy foods from their culture. Respondents felt that REACH provided them with helpful diabetes information and skills that they otherwise would not receive and linked them with invaluable peer and professional support.
Primary outcomes of The REACH Alliance will include: increased availability and improved access to culturally competent and tailored diabetes-related resources for people of color, increased diabetes knowledge among REACH participants, increased confidence in self-management of diabetes, other chronic diseases and overall health among REACH participants,improvements in significant diabetes health indicators among REACH participants (e.g., improved HbA1c and blood pressure levels), positive changes in organizational practices that promote health and diabetes care, particularly for people of color, and reduced health costs for organizations/institutions with clients who participate in REACH.
4
REACH Alliance Proposal
4. Will your proposal impose costs on individuals, businesses or government? Will these costs be time-limited or on-going? Can you estimate how much these costs will be, or suggest how such an estimate could be made? How much, if any, of these costs will be offset by corresponding savings? The REACH Program to date has engaged in extensive community outreach to create strong links in the community in order to recruit heretofore inaccessible participants for diabetes education, and self-management support. Since we are a research driven program, we have had a very strong evaluation component. We have also engaged in advocacy and dissemination. It is somewhat complicated to tease these activities out from one another. At best, we estimate that providing the initial twelve hours of diabetic education and ongoing monthly self-management support groups would cost about $600.00 per person for the first year of their care. Ongoing costs for each person would be less as they would include ongoing support groups and occasional refresher courses. The ongoing costs have not been determined. We have been providing population based care in collaboration with community health clinics.
For an example of a population based care that includes self-management support and a consideration of savings, review the chronic care model activities utilized by Group Health Cooperative. According to David McCullough, MD, from Group Health Cooperative of Puget Sound,* Group Health reduced the average cost per patient by $62.00 per month x 12 months x 20,000 patients. This reduction achieved a cost savings of $14 million. At Group Health the mean HbA1c was 7.5 in 2003 as a result of these activities. We believe that payment for the REACH Alliance initiative could be provided by a mix of individuals, businesses, health insurance providers, Medicaid, Medicare, and grants (Foundation & Government).
*footnote: McCullough is Clinical Professor of Medicine, University of Washington, and a diabetologist. He spoke at the 6th Annual Epidemiology, Biostatistics, and Clinical Research Methods summer session (2004) in Seattle. 5. How does your proposal reflect collaboration among various stakeholders? Which stakeholders have endorsed it?
5
REACH Alliance Proposal
The work of the Seattle & King County REACH Coalition is grounded in collaborative principles, with a stress on community participation, a model to be continued through The REACH Alliance. Our collaborative principles stress equal power-sharing among all coalition partners, as demonstrated through decision-making by consensus, and recognition that each partner has distinctive assets to contribute to our mission. The Coalition is comprised of a wide array of public health experts, community organizations, community members and people with diabetes. The Coalition’s lead fiscal agency is Public Health-Seattle & King County. Coalition research partners include the University of Washington (UW) School of Nursing, UW School of Public Health, the UW Health Promotion Research Center and Pacific Northwest Research Institute. Community-based organizations include the Center for MultiCultural Health (CMCH), serving African Americans; and Rainier Health & Fitness, a local gym in Seattle’s Southend providing high quality, low cost physical fitness training to residents in the Rainier Valley area. Health centers include Harborview Medical Center - the local public hospital, International Community Health Services (ICHS), serving Asian and Pacific Islander Americans; and Sea Mar Community Health Centers, serving Latinos/Hispanics. Others include Aging & Disability Services (ADS), Seattle’s local Area Agency on Aging, Qualis Health, a nonprofit healthcare quality improvement organization, the American Diabetes Association and the Washington State Department of Health. We are an active member of the Washington State Diabetes Network and also partner with King County Steps to Health, a US Department of Health and Human Services funded initiative that focuses on reducing the burden of diabetes, obesity, and asthma through prevention.
All of our Coalition members have endorsed the work of the Coalition, its mission to eliminate health disparities, and have expressed support for The REACH Alliance proposal. CMCH, ICHS, Sea Mar and ADS have expressed commitment to implementing REACH activities, such as diabetes education classes, support groups, self-management classes, and individualized care for elderly and homebound people with diabetes. Our collaborators at the University of Washington are dedicated to evaluating the methodology of our work and validating best practices.
We are working to establish and solidify new partnerships with local businesses, health care industry, pharmaceuticals, other community organizations and policy leaders in the region which will increase regional awareness, use and support of The REACH Alliance.
6
REACH Alliance Proposal
6. What are the obstacles to implementing your proposal? Who will object to it and why? How do you suggest these objections be addressed?Present funding for diabetes care does not recognize the value of the group experience in community settings rather than clinic settings or the value of peer educators. Current funding priorities and the established expectations of clinicians and other health care system entities are obstacles and may object to the implementation of this proposal. Our experience in REACH, documents the success of reaching people through community based interventions. Presenting data from other clinicians and other experts in the health care field could address these objections. For example, presenters from MacColl Institute for Healthcare Innovation, Center for Health Studies, and Group Health Cooperative of Puget Sound state that, “Diverse professionals and lay persons can effectively deliver self-management support if they have clearly defined tasks, roles, and are trained in evidenced based interventions. The credential is less important than what they are doing.” The Center for Disease Control also has a position paper supporting the use of peer educators. Good health care management requires enormous behavioral change, not just on part of the patient, but on part of clinicians and the health care system. Health care systems have begun to retool their approaches by participating in the various health care collaborative groups. The REACH Coalition has always worked by bringing the various partners to the table to create a system that is effective for participants and providers. The REACH Alliance will continue to develop that collaboration.
7

Tab 45
Regence BlueShield Recommendations to the Blue Ribbon Commission on Health Care Costs and
Access
September 1, 2006
REGENCE BLUESHIELD RECOMMENDATIONS TO THE WASHINGTON STATE BLUE RIBBON COMMISSION ON HEALTH CARE COSTS AND ACCESS
The number of Washingtonians without health insurance concerns all of us. While estimates vary, the best guess is that around 600,000 Washingtonians lack health insurance during a typical year.1 The impacts of going uninsured are clear. The uninsured receive less preventive care, are diagnosed at more advanced disease stages and tend to receive less medical care and have higher mortality rates than insured individuals.
Health insurance also affects the financial well-being of individuals and families. Insurance reduces the financial uncertainty associated with health care, since illness and health care needs are not always predictable, and medical care can be very expensive.
Reducing the number of uninsured Washingtonians and keeping health care affordable is a top priority for Regence BlueShield. We must act now to make accessible, affordable, quality health care a reality in Washington. Ultimately, the private sector and government must work hand-in-hand to realize this vision and achieve our stated goals.
At the same time, we recognize that there is no magic cure. Research shows the uninsured are not a monolithic group, and there are many reasons why individuals and families are uninsured. The uninsured include:
Low-income populations reachable through some public programs; Employees of small businesses and young adults who cannot afford coverage; and Those with higher incomes who can afford coverage but nevertheless choose to be uninsured.
Our proposal seeks to put into action initiatives specifically designed to meet the needs of these three groups, namely: more effective outreach for the first group, more affordable products available through the existing private market for the middle segment and communication and education about the importance of coverage for the third group.
We believe, working together on these three initiatives, that good progress can be made toward the Blue Ribbon Health Care Commission’s stated goal: In five years, we will create a system providing every Washingtonian the ability to obtain needed health care at an affordable price.
2
1 See 2004 Washington State Population Survey, U.S. Department of Health and Human Services, Health Resources and Services Administration’s Bureau of Professions State Planning Grant #1 P09 HS 00002-02, 2004 Uninsured Population Under Age 65.
OUTREACH: Those Reachable Through Existing Public Programs
The 2004 Census Current Population Survey estimated that 44.7 million non-elderly uninsured individuals in the U.S. were reachable through existing government health programs, such as Medicaid or the State Children’s Health Insurance Program (SCHIP).
Clearly, many of the uninsured in our state are not taking advantage of government programs designed to serve them:
In Washington, 69.9 percent of all uninsured children are potentially eligible for public coverage through Medicaid, SCHIP, or the Basic Health Program.2
Additionally, 63.6 percent of all uninsured adults in Washington are potentially eligible for public coverage through the current Medicaid and Basic Health programs.3
The lack of enrollment in public programs can be attributed to many variables. Some may be unaware they are eligible for these programs, or even that such programs exist. Others may perceive a stigma associated with government programs. Language barriers or other obstacles may also hinder enrollment of many demographic groups. Consider the following example:
Latinos represent the largest segment of the uninsured market: Nationally, nearly 4 in 10 Latinos are uninsured—the highest uninsured rate among all racial or ethnic groups. According to a September 2005 OFM report, Hispanics are more likely than any other racial/ethnic group in Washington to be uninsured. 18 percent of non-elderly Hispanics in Washington are uninsured compared with 10 percent of African Americans, 11 percent of non-Hispanic whites, 11 percent of Asians, 17 percent of Native Americans and 17 percent of Pacific Islanders.4 These statistics suggest generic outreach programs may not be the best use of state dollars; targeted outreach programs to demographic groups with high uninsured rates would likely be most effective.
Any proposal addressing the uninsured in Washington must include a focus on those populations eligible for government assistance. Current state outreach efforts must be amplified. One option for increased activities would be for carriers serving Healthy Options and BHP populations to augment state efforts and assist in targeted outreach programs. In addition to participating in the Healthy Options Medicaid program which serves low-income populations including Latinos and others, Regence is developing a program of outreach to Latino populations
2 See id., Data for 2004 Children Age 0-18 Years. 3 See id., Data for 2004 Adults Age 19-64 Years. 4 Gardner, E., Washington State Population Survey, Research Brief No. 37, Health Insurance by Race/Ethnicity: 2004, Washington State Office of Financial Management (2005).
3
as part of a private-sector emerging markets strategy. We would be pleased to explore working collaboratively with the State on outreach projects for these populations.
We acknowledge that there is a cost to increase public safety net programs. Increased outreach implies a willingness on the part of the state to devote greater resources to these programs and not merely to exacerbate the current cost shift to the private sector.5
AFFORDABLE PRODUCTS: Those Ineligible for Public Programs Who Cannot Afford Coverage
Almost half of the uninsured nationwide struggle to find coverage they can afford.6 This demographic group comprises many Washingtonians who are ineligible for government programs but are still unable to afford coverage. For example, small employers may not offer coverage to their employees due to cost pressures.
Young adults may go without coverage because they cannot afford an individual policy, and they are willing to accept the risks of being uninsured. Statistics reveal the vulnerability of this segment of the population:
Although young adults comprise 17 percent of the under-65 population, they account for 30 percent of the uninsured non-elderly population.
More than half (57 percent) of young adults in the U.S. who lack health insurance reported the cost of health care kept them from seeking needed treatment or services—including filling a prescription or seeing a doctor or specialist when needed.
Yet failing to obtain health insurance can spell financial ruin for many young adults. A serious car accident or illness can result in thousands of dollars in medical bills and fees.
To address this segment of the uninsured population in Washington, Regence BlueShield suggests more affordable products be designed for young adults. These offerings should be tailored to meet the intense focus on cost concerns of this population by, for example, limiting or excluding some benefits such as durable medical equipment, complementary therapies, or brand-name prescription drugs.
In recent years, insurers in many states have created products following this model. BlueCross BlueShield (BCBS) of California reports that 70 percent of the people on one of their “Tonik” plans were previously uninsured.7 Tonik and similar plans show great promise in reducing the number of uninsured young adults in California and elsewhere.
5 See Milliman, Inc. Study, Payment Level Comparison Between Public Programs and Commercial Health Plans For Washington State Hospitals and Physicians, May 2006, https://www.premera.com/stellent/groups/public/documents/pdfs/dynwat%3B5724_97223688_2320.pdf.6 See The Uninsured in America, BlueCross BlueShield Association, http://www.bcbs.com/uninsured/index.html,page 8.
4
7 Laura Vanderkam, Health Insurance Doesn’t Have to Hurt, USA Today, June 7, 2006.
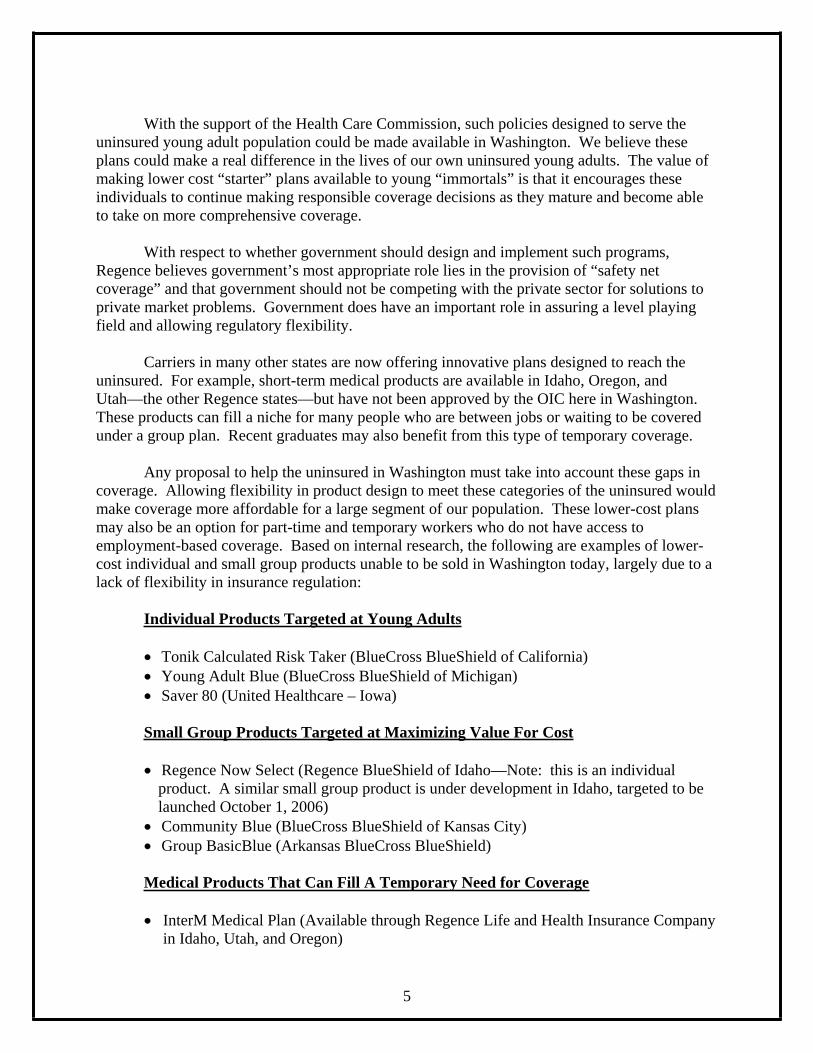
With the support of the Health Care Commission, such policies designed to serve the uninsured young adult population could be made available in Washington. We believe these plans could make a real difference in the lives of our own uninsured young adults. The value of making lower cost “starter” plans available to young “immortals” is that it encourages these individuals to continue making responsible coverage decisions as they mature and become able to take on more comprehensive coverage.
With respect to whether government should design and implement such programs, Regence believes government’s most appropriate role lies in the provision of “safety net coverage” and that government should not be competing with the private sector for solutions to private market problems. Government does have an important role in assuring a level playing field and allowing regulatory flexibility.
Carriers in many other states are now offering innovative plans designed to reach the uninsured. For example, short-term medical products are available in Idaho, Oregon, and Utah—the other Regence states—but have not been approved by the OIC here in Washington.These products can fill a niche for many people who are between jobs or waiting to be covered under a group plan. Recent graduates may also benefit from this type of temporary coverage.
Any proposal to help the uninsured in Washington must take into account these gaps in coverage. Allowing flexibility in product design to meet these categories of the uninsured would make coverage more affordable for a large segment of our population. These lower-cost plans may also be an option for part-time and temporary workers who do not have access to employment-based coverage. Based on internal research, the following are examples of lower-cost individual and small group products unable to be sold in Washington today, largely due to a lack of flexibility in insurance regulation:
Individual Products Targeted at Young Adults
Tonik Calculated Risk Taker (BlueCross BlueShield of California) Young Adult Blue (BlueCross BlueShield of Michigan) Saver 80 (United Healthcare – Iowa)
Small Group Products Targeted at Maximizing Value For Cost
Regence Now Select (Regence BlueShield of Idaho—Note: this is an individual product. A similar small group product is under development in Idaho, targeted to be launched October 1, 2006)
Community Blue (BlueCross BlueShield of Kansas City) Group BasicBlue (Arkansas BlueCross BlueShield)
Medical Products That Can Fill A Temporary Need for Coverage
5
InterM Medical Plan (Available through Regence Life and Health Insurance Company in Idaho, Utah, and Oregon)
Regence urges the Commission to allow carriers to offer at least one lower cost, mandate-light product in both the individual and small group markets. Along with evidence-based approaches to quality and transparency around costs, we believe there is a need in our market for coverage options along a spectrum from basic to comprehensive. We would be pleased to provide further information to Commission members about any of these ideas and products.
EDUCATION: Those Who Can Afford to Enroll
Twenty percent of the uninsured in America earn $50,000 or more annually.8 Of those earning $50,000 or more, 40 percent are young adults, 12 percent are self-employed, and 40 percent are workers or dependents in small firms.
As with the low-income populations described above, there are several reasons why those who can afford health insurance choose not to purchase it – at great potential risk to themselves and their families. Anecdotal evidence suggests these higher-income individuals may believe they do not need coverage because they are young and healthy, or believe they can fund routine medical needs out of pocket. Others may not be aware of the existing coverage options available.
In this group as well, young adults in the 19-30 age range are particularly vulnerable.This group represents the largest and fastest growing segment of the population without health insurance; they are uninsured at twice the rate of adults ages 30 to 64.
Targeted outreach and education must be stepped up to educate young adults and others about the need for health insurance in the event of an emergency or catastrophic illness.Regence and many other carriers have products such as Medical Savings Accounts that appeal to consumers of all income levels, and particularly to this demographic group. Data suggests that thirty percent of new members on a Medical Savings Account were previously uninsured. There may also be tax incentives and credits that could be made available to support those who acquire this type of coverage.
We believe the three-pronged approach outlined here is one way that some immediate progress can be made toward the goal of securing coverage ability for the uninsured. By focusing our efforts, we can increase enrollment in state assistance programs, provide new, lower-cost health plans and educate people with resources to assume responsibility for their health and financial well-being.
6
8 See The Uninsured in America, BlueCross BlueShield Association, page 6.

Tab 46
The Smiles for Life Project
Maintaining Oral Health throughout Life
A Proposal to the Blue Ribbon Commission on Health Care Costs and Access
Submitted by Anita Rodriguez, RDH, BS President, Alliance of Dental Hygiene Practitioners
3915 E. Connecticut Street Bellingham, WA 98226-4437 360-733-3160 fax: 733-8540
INTRODUCTION
When the Governor’s Blue Ribbon Commission asks the question, “How do we reach the goal of becoming one of the healthiest states in the nation in the next five years?” we know the answer must include oral health.
When the Commission asks for evidence-based care, cost-effectiveness and cost containment consistent with personal income growth, visionary utilization of the health care workforce, and universal access across race, gender and income levels, we know that we are already operating within the vision and goals of the Commission.
Our proposal would ultimately lead to the expansion of oral health care services to Washingtonians utilizing teledentistry and professional and community partnerships. This proposal focuses on one underserved population in two Washington counties to demonstrate how the utilization of new technologies and appropriate utilization of all oral health care providers will work in Washington.
The Alliance of Dental Hygiene Practitioners brings this proposal to the Commission. The Alliance is an organization of over 50 community-practicing dental hygienists and their supporters with the mission: “Improve the oral health of our communities by promoting evidence-based, cost-effective, oral health services, access to them and education, and to support consumer choice and community partnerships.”
Our demonstration project would initially serve elders and their caregivers in Clallam and Jefferson Counties, which span the northern part of the Olympic Peninsula. Why? Because “affordable dental care” is the number one expressed need listed by elders in these counties who responded to a recent newspaper survey. Other top concerns were disease prevention services and education, information and assistance in finding services, finding a doctor who accepts new patients, health care product information, and meaningful volunteerism. The survey was conducted by the Community Advocates for Rural Elders (CARE) Partnership, formed with the help of a Robert Wood Johnson grant in order to assess the needs of older adults in an area of the state with an unusual demographic profile.
In 2004, the percent of people 65 years of age and older was 21.4 percent in Clallam County, and 21.8 percent in Jefferson County. According to the recent demographics cited in the CARE Projects Resource Manual, Clallam County has roughly twice the percentage of residents over age 64 than does the State (21.2% and 11.2% respectively). The median age of the population in Clallam County is 43.8 years, nearly a third higher than the state average. Approximately 60% of the population in Sequim alone is over the age of 55. Population forecasts for the State of Washington indicate that Clallam County’s older adult profile foretells the State’s older adult profile fifteen years from now. This demographic profile was one of the reasons the regional Area Agency on Ageing was awarded a planning grant to study the needs of the elders in Clallam County.
1
Both Clallam and Jefferson Counties are designated as rural. Both are designated as federally underserved, yet there are no Federally Qualified Health Centers (FQHCs) in either county. The closest FQHC is in Kitsap County. Because of the larger percent of the population 65 years of age and older, both counties have higher percentages of people on Medicare than the Washington or national average. According to the Centers for Disease Control Behavioral Risk Factor Surveillance System and other community health assessment references, both counties also have higher percentages of citizens on Medicaid. Clallam and Jefferson Counties are not unique in that there are few private dental practices that accept Medicaid coupons, and fewer that accommodate the special needs of elders and older adults with special needs. Travel for elders in this region is difficult, time-consuming, and hazardous because of the frequently rainy conditions. Few bus routes link the cities along the main east-west corridor of the northern Peninsula.
Members of the Alliance of Dental Hygiene Practitioners who are already serving elders and adults with special needs in Clallam County met recently with administrators of the CARE Partnership which focuses on elders in Clallam County, and the regional Area Agency on Ageing, which also serves Jefferson, Gray’s Harbor and Pacific Counties. The meeting explored ways the oral health care needs of the region’s elders might be met, particularly those who are homebound, on Medicaid or limited income, and have special needs.
SMILES FOR LIFE is based on the master’s degree work of Cyndi Newman, the Oral Health Consultant/Program Manager for Clallam and Jefferson County Health Departments and the OlyCAP Oral Health Care Access Program, and on the success of a collaborative model of oral health services delivery pioneered by Apple Tree Dental, a non-profit organization that has been operating in Minnesota for over 20 years. Apple Tree Dental utilizes teledentistry and the judicious use of oral health care providers to reach very rural, underserved populations, especially elders and special needs populations. The CEO and one of four founders of Apple Tree Dental, Dr. Michael Helgeson, has agreed to serve as one of the consultants for this project.
The collaborative model, utilized in several states including Minnesota, links a community-practicing dental hygienist in a formalized relationship with one or more consulting dentists, without obligating those dentists to provide treatment services to the populations the dental hygienist is providing preventive services and education to. The dental hygienist and dentist collaborate on communication and practice protocols and procedures, and routes of referral for dental treatment. Together they develop preventive services plans, which the dental hygienist implements, then reports outcomes back to the consulting dentist and any entities or agencies the community-practicing dental hygienist has contracted with for each outreach program.
2
SMILES FOR LIFE
PROJECT GOALS, OBJECTIVES AND TIMELINE
The Smiles for Life Project will address four needs and part of the fifth expressed need of the elders in Clallam County. It aims at improving and supporting the general health of all elders with a focus on oral health issues. Through access to up-to-date oral health education and information, as well as preventive and restorative oral health therapies, senior citizens will be able to maintain good and affordable oral health throughout their lifetimes. The Smiles for Life Project is committed to working with community partners, such as the CARE Partnership, to ensure that older adults are able to access essential oral health services.
GOALS
The Smiles for Life Project, along with its community partners, will
Increase the awareness of oral health and its importance in total health
Collect and analyze baseline data related to the oral health status of older adults living in Clallam County
Develop education and outreach strategies for oral health promotion and disease prevention that empowers older adults to take responsibility for managing their own oral health
Integrate preventive and restorative oral health services for seniors who are living with low incomes and/or are homebound
Collaborate with community partners to increase access to essential oral health services to all seniors living in Clallam County
OBJECTIVES and TIMELINE
Within the first month of the project research and development phase, the Smiles for Life Project planners will collaborate with known community partners, in particular with the CARE Partnership, to plan the design and implementation phases of the project, identify and recruit additional community partners, consultants, providers and volunteers to the project.
The project planner will immediately begin researching possible funding opportunities for the proposed project, and to gather community support for the project with media assistance, as well as recruit community stakeholders to assist with the search for funding opportunities.
3
Note: The Washington Dental Service Foundation has offered its support of Alliance of Dental Hygiene Practitioner programs that would focus on elders.
Within the first three months, the Project planner will consult closely with advisors to the Project. In particular, these will include experts in geriatric general and oral health care management, the use of telemedicine and teledentistry technology, data collection, management and analysis, and health care team management.
Within the first three months, the Project planner will recruit community stakeholders to serve as a planning and steering committee for the Project. In particular, the planner will begin to recruit dentists, denturists, dental hygienists and dental assistants who are interested in participating in the Project.
Within the first six months, the Project design will be finalized with input from the general community, elders and their advocates.
Once funding has been committed to the Project, implementation of the Project will begin with oral health education information being distributed via media and community partners to all areas of Clallam County.
Within three months of the start of implementation, at least two oral health education classes and oral health screening/exam clinics will be conducted at each Senior Center in Clallam County.
Within six months, clinical dental hygiene services will commence at residential sites and senior centers for program eligible clients who are 55 years of age and older, uninsured, low income and who have become immobile or are otherwise homebound. Elders with insurance or financial means will be referred to participating private practice dentists in the community who have committed to payment plans, senior discounts or other incentives that truly make dental care affordable to this population.
Within nine months, teledentistry will be utilized between field-positioned dental hygienists and one or more participating dentists to confirm and prioritize oral health treatment needs in program-eligible clients via digital radiography and intraoral camera transmissions, and clinical intake protocols agreed upon by the Project dental hygienists and collaborating dentists.
Restorative clinic days will be organized, sites located and coordinated, portable equipment located and committed, providers and clients scheduled. Each participating dentist’s expertise will be maximized and total services multiplied by utilizing dental hygienists for anesthesia and restorative procedures, with dental assistants and volunteer elders completing the on-site teams. The Project planner envisions two to four dental chairs being utilized for each portable restorative clinic.
4
Exit surveys will be conducted to assess client satisfaction with the care they have received, measure oral health outcomes, and direct improvements of the Project. Did the program provide “affordable dental care” that has met other expectations?
The overall timeframe for planning, implementation and adequate assessment of the SMILES FOR LIFE Project is 3 years. This would give time for replication in other counties to achieve at least partial statewide implementation within the Commission’s targeted 5-year goal.
ADDRESSING THE COMMISSION QUESTIONS
1. The vision of the Commission is to have a system developed in five years which provides every Washingtonian the ability to obtain needed health care at an affordable price.
The Commission’s goals are the following: Improve access to health coverage that provides effective care by 2012, with all children having coverage by 2010 Improve health with Washington becoming one of the top ten healthiest states in the nation, with consistent population health indicators across race, gender and income levels throughout the state, and increased use of evidence-based care for better health outcomes and consumer satisfaction Improve affordability by increasing total health care expenditures only as consistent with growth in personal income
SMILES FOR LIFE focuses on the development of a system that ultimately will provide appropriate, effective, and affordable oral health care to elders and populations with special access needs. The project will be initiated in two Washington counties, serve as a demonstration model with refinements over three years, then begin implementation over the next two years in other Washington counties. The SMILES FOR LIFE Introduction summarizes the proposal, and the section on Goals, Objectives and Timeline explains the Project’s realization of the vision and goals of the Commission.
2. The SMILES FOR LIFE Project implementation will address the vision of the Commission by developing an innovative delivery model that will provide oral health care most relevant and accessible to populations that are the least served by the current delivery system, and which have identified affordable oral health care as their number one health care need.The SMILES FOR LIFE Project will enhance all the goals of the Commission by:
Expanding the oral health care options available to a major and rapidly growing population sector in the state, retiring baby boomers Improving health indicators consistent across all ages, as well as across race, gender and income levels across the state
5
Using and actually contributing to the body of evidence base upon which best practices are policies are built (the evidence-base relative to the elder population is almost non-existent at present) Increasing utilization of mid level oral health providers consistent with the medical health care delivery model expansion
How will we know if we are enhancing the vision and goals of the Commission? The Project will demonstrate measurable outcomes through appropriate and consistent data collection throughout the implementation phase of its 3-year demonstration, and tracked through all subsequent years. Data collection will include outcome measurements in terms of services utilization, measurable improvements in oral health status, decreased reliance on the most expensive oral health care providers, cost analyses of the project on an annual basis to determine cost-effectiveness and efficiency, and consumer satisfaction surveys.
3. The SMILES FOR LIFE Project is modeled after existing programs both inside and outside Washington State. Within Washington State, the project is modeled after several mobile preventive oral health care services owned and operated by community-practicing dental hygienists, which specifically serve elders and adults with special needs. Additionally, there are several mobile dental practices in Washington State serving these populations, which also demonstrate the efficacy of providing oral health care services on-site in group homes and other residential centers. These models all take services directly to the consumers rather than asking the consumers to come to the service centers. Many of these models have been in existence for over 20 years. They have served many thousands of Washington State’s most fragile and vulnerable populations. The numbers of community-practicing dental hygienists, particularly those serving Medicaid clients are steadily increasing, while the numbers of dentists serving the same populations have decreased. This fact points to the need to utilize the changing workforce to its best and most cost-effective capacity in order to meet the changing demographics and health care needs of all Washingtonians.
The Project is also modeled after the Apple Tree Dental organization, a non-profit established 20 years ago in Minnesota to meet the special access needs of low income children and their families, elders, especially those in nursing homes, and persons with disabilities. The vision, mission and goals of Apple Tree are entirely consistent with those of the Commission, and after 20 years the organization continues to expand to include more of the state’s underserved populations. Details about Apple Tree’s success can be found in its annual reports, linked to its website at appletreedental.org.
4. The Project will increase costs to the government by asking the state to expand funding to the aged and disabled populations who depend on Medicaid for oral and general health care services. Basic costs to Medicaid will be ongoing, increasing in direct proportion to the number of enrollees. Census data and socioeconomic demographics can be used to estimate the impact on Medicaid funding. There may be additions to services covered by Medicaid such as fluoride applications for elders and reimbursement increases, which would also increase costs to the state. The emphasis of government funding should be on
6
preventive dollars, as recommended to the states by the Robert Wood Johnson Foundation.
The Project will utilize both public and private partnerships and funding for fiscal sustainability. Medicaid funds will certainly be needed for the lowest income clients. Corresponding savings to the state will be accomplished by using a sliding scale for payment of services like that of community clinics and other health care programs. The sliding scale will be utilized for clients of the project that have incomes higher than Medicaid eligibility thresholds. The Project will seek grant funds for its startup and expansions. It will apply for non-profit status within the 3 year demonstration timeframe in order to position itself for broadest eligibility. The Project will utilize volunteers as much as possible. Cost containment will be a priority of the project in order that costs to the consumers will be as low as possible while allowing the project to be sustainable. The project will solicit bids for services included in order to allow and promote competition among providers. This will help to ensure the affordability of services to consumers, while maintaining the highest standards of quality, safety, and confidentiality.
5. The Project is based on collaboration with various stakeholders. At the time of this submission we have no formal endorsements, but meetings with stakeholders have begun and we are certain formal support is forthcoming. A strong coalition of stakeholders already exists on the Olympic Peninsula, which has been seeking solutions to the oral health dilemmas of its most fragile, vulnerable and poorest populations. Initial CARE partners included the Olympic Area Agency on Aging (O3A), Senior Information & Assistance (I&A), older adult representatives, Tribal leaders, Olympic Medical Center, United Way, Peninsula Community Mental Health Center, Clallam County Health Department, Forks Hospital and Outreach, and Olympic Medical Home Health.The area hospitals are likely to endorse the proposal, since they are the most financially impacted by the lack of dental providers for Medicaid, low income and disabled populations. Likewise, advocate organizations of these populations are most likely to endorse the project. Finally, citizen organizations like AARP are very likely to support the SMILES FOR LIFE Project.
6. The legislature will be asked to remove the supervisory barrier in the dental hygiene practice act to allow dental hygienists to access elders wherever is most convenient to the elders themselves. This would include homebound elders, currently restricted from accessing preventive services, and elders living in retirement centers and assisted living facilities. Elders should simply have the right to access preventive oral health care services as freely as possible. In the long term, freedom to access preventive oral health services will result in lowered costs to all: the state, the community, and the consumers. The evidence-base is wide and deep in support of preventive services in relationship to cost savings.
The state dental association is likely to object to the Project because historically, they have been in opposition to any initiative to improve oral health care services coming from the dental hygienist community. They believe community-practicing dental hygienists
7
will take income away from private practices, rather than enrolling more of the community members into oral health care systems. They believe that dental hygienists might cause harm to the public. They believe the reports of need for oral health care services for low income individuals and families, elders and persons with disabilities are grossly exaggerated, and finally, they believe that they are doing their utmost to serve the needs of their entire communities. None of these beliefs are evidence-based.
In order to overcome the likely objections of the state dental association members, the SMILES FOR LIFE Project aims to overcome any arguments against the project with a pro-active approach. Community partnerships and collaboration among providers are its cornerstones. The Project will recruit community-minded dentists to serve on the steering committee, and will recruit dentists who are experts in geriatric and special needs care to serve as advisors to the project. It will recruit from the broad medical field as well, especially those with expertise in geriatric care. The Project will seek to become an externship site for the training of all dental health professionals, which would also contribute to the project’s long-term sustainability. The Project has a faculty member from the University of Washington’s Department of Public Health Sciences in the Dental School recruited as a consultant.
Finally, SMILES FOR LIFE will incorporate the following strategies offered as samples in the development of the vision, mission and goals of the Commission:
Utilize prevention and health promotion Reduce health care administrative costs and pass savings to consumers Provide information and incentives to encourage personal wellness Utilize workforce and technologies to their best potential Allow and promote competition among providers to offer consumers the best price, quality and services
8
REFERENCES
1. Apple Tree Dental can be researched at appletreedental.org.Dr. Michael Helgeson, CEO of Apple Tree Dental, will serve as an advisor to the
project and has stated he would be happy to provide expert testimony.
2. The CARE Projects Resource Manual and other resource materials can be requested from the CARE Partnership from:
Sheryl Lowe, Director, [email protected] Barbara Clarke, Community Coordinator, [email protected] 107 E. 8th Street Port Angeles, WA 98362 360-538-2456, extension 115
3. About The Robert Wood Johnson Foundation® (RWJF) RWJF believes that the best solutions to improve long term care and supportive service systems will originate through strong community partnerships. The Community Partnerships for Older Adults program supports communities in defining and preparing themselves for how best to care for their older adult population now and in the future. A maximum of $20 million will be made available to approximately 30 grantee communities over the life of the program. Grantees are provided financial and technical assistance to develop and implement community-generated approaches to long term care and supportive services system improvements for at risk older adults.
4. Access to Oral Health Services for Low Income People: Policy Barriers and Opportunities for Intervention for the Robert Wood Johnson Foundation, was published Oct. 2002 for the Forum for State Health Policy Leadership, National Conference of State Legislatures. The publication is included with this proposal submission in Adobe format.
5. The master’s degree project, The Smiles for Life Project, Maintaining Oral Health Throughout Life, is available from Cyndi Newman at 360-808-4706 or mail to: [email protected]
F O R U M f o r S T A T E H E A LT H P O L I C Y L E A D E R S H I P
N A T I O N A L C O N F E R E N C E o f S T A T E L E G I S L A T U R E S
ACCESS TO ORAL HEALTH SERVICES
FOR LOW-INCOME PEOPLE:POLICY BARRIERS AND
OPPORTUNITIES FOR INTERVENTION FOR
THE ROBERT WOOD JOHNSON FOUNDATION
Shelly Gehshan, Program DirectorTara Straw, Policy Associate
October 2002
The NATIONAL CONFERENCE of STATE LEGISLATURES (NCSL) serves the legislators and staffs of the nation’s 50states, its commonwealths and territories, and the District of Columbia. NCSL provides research, technicalassistance and the opportunity for policymakers to exchange ideas on the most pressing state issues. NCSLis a bipartisan organization with three objectives:
§ To improve the quality and effectiveness of state legislatures,§ To foster interstate communication and cooperation, and§ To ensure states a strong, cohesive voice in the federal system.
FORUM for STATE HEALTH POLICY LEADERSHIP
The Forum for State Health Policy Leadership is an entity within the National Conference of State Legisla-tures. The central mission of the Forum is to enhance the capacity for informed decision making andleadership within the state legislatures regarding the financing, organization and delivery of health careservices to low-income and vulnerable populations. The Forum is designed to provide a range of informa-tion, training and technical assistance services to new state legislators who are potential future leaders inhealth policy and to serve as a mechanism for established leaders in state health policy to further developand share their expertise.
FORUM for STATE HEALTH POLICY LEADERSHIP NATIONAL CONFERENCE of STATE LEGISLATURES 3
Executive Summary
The National Conference of State Legislatures contracted with The Robert Wood Johnson Foundation(RWJF) in January 2002 to conduct a study of policy barriers to access to oral health care for low-incomepeople and opportunities for the Foundation to address them. Over an eight month period, NCSL gath-ered and analyzed information, hosted meetings of national and state experts, and conducted site visits tofive states (herein labeled States A through E). The site visits offer a rich portrait of the struggle to improveaccess in states and communities through conversations with nearly 75 people on all sides of the issue.Definite themes emerged from the site visits and the meetings about barriers that lead to three sets ofopportunities for intervention by RWJF.
NCSL has documented multiple policy barriers to access to oral health services that are described in detailunder the following sections:
� Supply, distribution and practice patterns of dentists� Federal and state policy and programmatic barriers� Dental education� Research issues� Leadership� Advocacy, and� Public education.
In general, it is much easier for people to identify and describe barriers and harder to generate creativesolutions. Those who work on oral health issues seem very much “mired in the present” and are notthinking about bold new solutions. There were a number of things people interviewed for the study did notmention or request that seem like glaring omissions, such as foundation support to:
� Increase the supply of dentists� Develop a new mid-level practitioner similar to a nurse practitioner or physician’s assistant� Explore the use of expanded function dental auxiliaries� Research and report on scope of practice and supervision requirements for dental hygienists and
dental assistants� Research state dental practice acts for restrictions they impose on medical providers delivering
dental screening and fluoride treatments, and for the impact of the corporate practice of dentistry� Improve advocacy efforts on behalf of water fluoridation� Research and write about dental economics and how they differ from medical economics� Educate governors or governors’ health staff on oral health� Engage in leadership development among dental associations or dentists.
The three areas where RWJF investment would be most useful to breaking down policy barriers so statescan move forward more forcefully to solve their access problems are:
Defining the Policy ProblemThere is much disagreement in states about the nature and dimensions of the oral health access problem.States that have not moved forward need consensus-building activities such as oral health policy academies,task forces and commissions in order to develop a unified vision of the problem at hand. They also needhelp educating the media and working with the media to raise the visibility of oral health issues, and abroad public education effort aimed at the general public and high-risk groups such as immigrants, Med-icaid and SCHIP recipients, low-income mothers and grandparents.
4 FORUM for STATE HEALTH POLICY LEADERSHIP NATIONAL CONFERENCE of STATE LEGISLATURES
Developing Policy SolutionsAssuming that a common definition of the problem has been accepted, states lack realistic and achievablepolicy solutions. There are also big holes in the picture; information is not shared for political reasons, notavailable or not given to people who could use it to make a difference. States need the sort of informationthat has been available in great quantities to spur the debate over health care reform: policy analyses,program evaluations, cost-benefit analyses, reports on best practices, and surveys to gather state-specificand local information. In particular, they need policy work that can explore alternative practice and servicedelivery models, new providers and any new ideas that would help open up the dialogue into new ways tosolve problems in oral health. This work needs to be coupled with a broad dissemination effort to peoplein all areas of the policy process.
Build Political SupportOral health is a low priority for policymakers, most state health officials, advocacy groups and much of thegeneral public. There are very few groups other than state dental and hygiene associations that work withthe legislature on an oral health agenda, and they do not move forward together in any sustained fashion.Coalitions on oral health are either absent, missing members from key constituencies, weak, or poorly-funded and managed. Coalitions need training and tools to generate support for change in oral healthpolicy. Even more serious, there is a dearth of consistent, strong leadership on oral health issues in legisla-tures and state agencies. There is a need for leadership development among legislators, education forlegislative staff and support for state dental directors.
FORUM for STATE HEALTH POLICY LEADERSHIP NATIONAL CONFERENCE of STATE LEGISLATURES 5
I. Supply, Distribution and Practice Patterns of Dentists
Barriers: Supply, Distribution and Practice Patterns of DentistsToo Few Dentists or Just Enough?One clear problem in states is the wide disparity of opinions about whether or not there is a shortage ofdentists in their states. Most people, particularly those who work for state Medicaid agencies or healthdepartments, safety net clinics or advocacy groups, feel that there is clearly a shortage of dentists in theirstate. Dental association officers and staff in the states we visited, on the other hand, generally say there isno shortage of dentists, although they are willing to admit there is a geographic maldistribution. State B’sdental association president said “if there was valid scientific evidence of a shortage, we would supportmore students in existing dental schools, but no new schools.” (The declining number of students admit-ted to dental school is further discussed in the “Dental Education” section.) In every state visited, peoplefrom all sides of the issue cited a maldistribution of dentists, with too few in rural, frontier, border andurban underserved areas to see patients regardless of income. State C has 25 counties without a dentist andState A has 3 counties with no dentists and 15 with fewer than five. About one-fifth of State E’s countiesdo not have a dentist. It is particularly difficult to get specialty care in rural areas. There is also atremendous problem attracting dentists to serve Native Americans on reservations.
According to states, any shortage that does exist is likely to be exacerbated in the coming years by the agingof the dental workforce. For example, 40% of State E’s dentists will be retiring in the next ten years. Thisissue isn’t uniformly understood by people within states as not every state collects this information and thedental associations, which receive the results of the annual American Dental Association surveys, don’tgenerally release or share the information. State regulatory boards also may have the information but don’tanalyze or release it.
Enough Dentists for Whom?Most people agree that there is a shortage of those who are willing to treat low-income clients, particularlythose insured by Medicaid. Some dentists in State D resigned from the Blue Cross Blue Shield networkrather than agree to take low-income patients paid for by a foundation’s program. Part of the problem isthat most dental practices are already full with patients who pay in cash or have private dental insurance soinadequate capacity exists to care for low-income patients. The president of one state dental associationsaid “dentists don’t feel like they need to see more patients” when asked if expanded function dentalauxiliaries would be helpful to solve access problems. Another barrier is dentists’ preconceived notions ofwhat Medicaid patients are like. There is a stigma associated with this population and an assumption—often borne out—that there will be a high no-show rate. A number of people noted that dentists wouldrather donate care at a clinic than have “them” in their waiting rooms.
In every state, people said there are very few dentists who are willing and able to treat children or adultswith special health care needs. Many dentists are taught in dental school to refer disabled patients andyoung children elsewhere, so they lack the training and comfort level to treat them. In State C, there is athree-week wait for oral health services for children with special health care needs. In State A, manyfamilies must drive long distances to the dental school so they delay care until the need is critical becauseaccess is so difficult. In State D, a few disabled patients can receive care at a city hospital through theWICHE program (multi-state exchange program that provides slots in professional schools for state resi-dents from states without schools). A fiscal analyst at the legislature said “it would take four years for themto serve the whole disabled population with one dental visit.”
6 FORUM for STATE HEALTH POLICY LEADERSHIP NATIONAL CONFERENCE of STATE LEGISLATURES
Protecting a Cottage IndustryAnother set of barriers is the way dental practices are organized. Dentists by and large are in solo practices.A large percentage don’t accept any insurance, let alone Medicaid, on philosophical or practical grounds,and ask patients with insurance to pay in full and seek reimbursement on their own. A dental educator inState B said, “in continuing education ‘management’ classes, dentists are taught not to accept insurance.”Many states have a ban on the corporate practice of dentistry in their dental practice act, which preventsdentists from working for any entity other than another dentist. This has been used to prevent the devel-opment of dental managed care and preserve the solo practice model. A state dental association presidentexplained that in his view “the ban on corporate practice is because of quality of care. (Corporate practices)are mega-practices that operate faceless practices that aren’t patient-oriented. (There is a lack of trustbetween dentist and patient so) patients don’t know if care is really needed.” This provision also erects alegal barrier to the development of public health dental clinics or the addition of dental components tocommunity health centers unless exceptions are written into law or regulations. State B experienced thisproblem and had to get an amendment in the law during the 1999 legislative session to allow them to hirerather than contract with dentists. One health center official said “dentists don’t want to care for poorpeople but they don’t want us to either.” State A also has a ban on the corporate practice of dentistry andallows exceptions only for unlicensed or foreign dentists, who can be employed by public health clinics ornonprofits to provide indigent care under the supervision of a licensed State A dentist.
Simmering Resentments Toward Dentists and Organized DentistryOne consistent finding was that there is a steady undercurrent of negative feelings about dentists amongmany of the people interviewed such as employers, purchasers of dental services, policy makers, stateofficials, community program directors, educators and regulators. This is important to describe so it canbe factored into potential solutions. People in each state made some potentially offensive and controversialcomments about typical personality types of dentists: they are difficult to work with, extremely indepen-dent, resistant to change, and don’t partner well with other professionals. Some of the same personalcharacteristics that make dentists capable of performing high-risk tasks that require extreme precision withlittle or no room for error may be what makes them difficult. In State A, one state official said: “Dentistsare perfectionists, anal retentive. They are very high maintenance. Dentists are never really happy.” InState D another state official said: “They’re not willing to negotiate. I’m not as frustrated with them now,but I still think they could give a little bit more.”
Few people understand the economics of dental practice that give rise to many of these complaints. Somepeople express resentment that dentists behave more like business owners than health care providers andshould have more concern about needy individuals and the health of the public. There are legislators andstate officials who view dentists as uncooperative, greedy and lacking in empathy. A State E official said,“Once a dentist has established a practice, they feel no obligation to the community.” While there weredifferences between comments about organized dentistry and individual dentists, there were negative feel-ings and experiences expressed about both by a broad range of people interviewed.
Not Enough ClinicsIn each state visited, people spoke of an inadequate public health infrastructure or safety net for dentalcare. The few community health centers that have dental clinics and the publicly or privately fundeddental clinics are overwhelmed. According to the State C community health association, the pent-updemand is such that “whenever they open a dental site, the waiting list explodes” at all dental clinics in thestate, after media report on low-cost dental services. However, State E’s Medicaid director also cautionsthat support for safety net dental services should not “let dentists off the hook” for providing care. He seesthe safety net as a backup rather than a primary source of care. In State A, the dental director estimatedthat maybe 3% of the dental care in the state is provided with public funding through their 67 county
FORUM for STATE HEALTH POLICY LEADERSHIP NATIONAL CONFERENCE of STATE LEGISLATURES 7
health departments. The rest comes from private dentists. State E has only one community health centerand it can’t keep up with demand for dental care. In the absence of sufficient public clinics, many peoplewithout insurance or a usual source of care go to the emergency room. A foundation-supported project inone part of State E found 800-900 emergency room visits each year for dental problems; 47% of those werefor Medicaid-eligible patients.
Part of the problem is the extreme difficulty in recruiting dentists to work in safety net settings. The StateC community health association says they currently have 15 openings for dentists at their clinics and twoclinics staffed only by hygienists. Hygienists are not sufficient because “in community health centers,20% is preventive and 80% is restorative. New patients are often a heavy investment in time and re-sources.” The dentists and hygienists who staff those clinics are personally and professionally challengedand need networking and support because of the high, unrelenting demands of the workload and thedifficulties in caring for the population. Clinicians say that their patients have a high level of need andsometimes don’t follow up or complete their care, leading to a lot of frustration and worry among theircaregivers.
Other Dental ProvidersIn some states and in areas within states, there is a shortage of hygienists, dental assistants and dental labtechnicians, although this comment cropped up less frequently than the similar comment about dentists.Since most dental hygienists don’t work full-time, it is harder to interpret the numbers on supply. In atleast one state, a university official said, “organized hygienists are the same as dentists in not acknowledgingthere is a shortage.” Another factor that was not often discussed is that it’s difficult to get dental hygieniststo volunteer. Most hygienists are women who balance work and family obligations.
In State C, a community health center official bemoans the fact that opportunities for screening are beingmissed and wants to reach out to non-dentists. She noted that “pediatricians see children up to 15 timesbefore age 3” and could provide dental screening. Whereas, “in our state, we have only 65 pediatricdentists and even they don’t want to see children before 3 years.”
Opportunities for Intervention: Supply, Distribution and Practice Patterns of Dentists� To increase the number of providers willing to serve Medicaid patients, state and local officials all
expressed a need for help in expanding the safety net for oral health services and recruiting full-time public health dentists.
� There is a need for funding to purchase equipment for offices or for outfitting mobile vans; onestate suggested that matching funds be made available for this purpose. In State E, the Medicaiddirector wants funds to provide no-interest or low-interest loans to cover the capital costs of expan-sion for public health dental sites. State B community health centers need funds for capitalexpansions in underserved areas, but an even greater need is for funds to operate new clinics untilthey can become self-sustaining.
� There were also a few requests for assistance in expanding school-based dental services for children� One person requested placing a dental chair in a public hospital if another setting is not available.� It is clear that dentists prefer treating low-income patients in a setting other than their offices. For
services outside the clinic or hospital setting, some communities, particularly in State D, wanthelp in coordinating volunteer dentists to see low-income patients. There is also need for dentiststo supervise hygienists (at whatever level is required by the state) who volunteer to provide screen-ing and hygiene services in schools and other sites in low-income areas.
� In a comment related to dentists’ attitudes, an administrator of the State C dental board said “aclass by Ms. Manners” would be very useful for dentists.
� Only one person, an insurance company foundation executive, expressed the desire to have funds
8 FORUM for STATE HEALTH POLICY LEADERSHIP NATIONAL CONFERENCE of STATE LEGISLATURES
to investigate training of a new type of mid-level dental provider, similar to a nurse practitioner ora physician assistant.
� The State C community health association wants help developing a program to train pediatriciansto do screening for oral health problems in the 0 to 3 population and work with dentists to solvethem. Similarly, an official at the dental school at a public university in State B wants funds toprovide training for physicians, nurse practitioners and physician assistants in oral health screen-ings and application of fluoride varnishes.
� An advocate in State A suggested that a “medical home” model similar to the one the AmericanAcademy of Pediatrics developed for children would be helpful to link children and families with adentist or clinic and to link together medical and dental care.
� Two dental schools expressed a desire for looser licensing requirements to allow foreign-traineddentists to pass exams and establish a practice or teach.
FORUM for STATE HEALTH POLICY LEADERSHIP NATIONAL CONFERENCE of STATE LEGISLATURES 9
II. Federal and State Policy and Programmatic Issues
Barriers: Federal and State Policy and Programmatic IssuesFederal Policy BarriersA number of people, particularly state officials, pointed to obstacles to access created by the federal designof Medicaid and SCHIP. For example, the optional nature of adult dental services in Medicaid and children’sdental services in SCHIP undercuts the importance of dental care and makes it among the first targets forMedicaid or SCHIP cutbacks. Also, since SCHIP is not an entitlement, benefits can be capped. Lowdollar caps ($500 in State C and $300 in State B) mean children with severe oral health needs don’t have“meaningful” coverage and need to pay high out-of-pocket costs for care, seek a source of charity care or gowithout care over the cap. The federal law prohibiting enrolling children with health insurance in SCHIPhas created access problems for children with health insurance but no dental coverage. State D expressedinterest in creating a dental-only wrap-around plan for these kids if the law was changed to permit it. Also,many low-income people who need care but are unable to pay for it are not eligible for Medicaid. Safetynet providers—already stretched treating Medicaid patients—treat these patients without reimbursement.
Another problem relating to federal law mentioned by several states is that the Federal Tort Claims Act—which protects most employees in community health centers from malpractice claims—does not extend todentists. Some states have all but discarded certain options to increase the number of providers, such asemploying volunteer or retired dentists in a clinic, because of the prohibitive cost of providing malpracticeinsurance for them.
Reimbursement RatesCertain state policies adversely affect dentists’ willingness to serve low-income populations (Medicaid,SCHIP, and uninsured). Dental associations in every state claimed that reimbursement is too low, al-though at least one dental association president noted that reimbursement has improved in the last severalyears, and States B and C raised reimbursement rates during the last legislative session. For the most part,the dental association message hits home with legislators and staff. A senator in State E remarked that“most procedures pay below cost.” While this is true for the adult population, rates for children areactually in the 80-90th percentile—certainly not below cost—and Medicaid rates in some parts of the stateare above private-pay rates. The State C dental association went so far as to say that inadequate rates resultin “MASH dentistry” and a “double standard of care” with some profiteering dentists setting up Medicaid-only clinics and performing “factory dentistry.” The representative went on to add that the “crisis in accesswould go away if dentists were paid at the 75th percentile.” Some people suggested that the methods statesuse to calculate reimbursement are outdated and inadequate. (To this end, the Milbank Memorial Fundhas developed an alternative reimbursement model using interactive actuarial software.)Barriers to access also result when some procedures or services receive no reimbursement. For example,coordination between physicians and dentists is rarely funded, though some see the need for it. State C’sSCHIP director believes that “whenever kids interact with the health care system, primary care providersshould refer and link them to needed oral health services. Any case management or follow-up shouldinclude oral health.” However, this type of coordination is rarely funded. Also, states rarely provide extrareimbursement for the elderly or people with disabilities, as State E does, though it is more difficult andtime-consuming to treat these patients than to treat children.
Administrative Barriers and Patient ComplianceOther factors that make dentists unwilling to serve low-income patients are continuing administrativehassles, although some states have instituted electronic billing, begun using ADA billing codes and claimforms, and reduced or eliminated prior authorization requirements. State E’s dental association remarkedthat the time required to receive payment has doubled to 6-9 weeks in 2002 for an unknown reason.
10 FORUM for STATE HEALTH POLICY LEADERSHIP NATIONAL CONFERENCE of STATE LEGISLATURES
Failure to keep appointments is another factor that limits dentists’ willingness to serve low-income pa-tients. State officials agree with dentists that no-shows are problematic but have made little headway inaddressing the problem. There are long waiting lists in both public and private care settings.
Limited Public Employee BenefitsMany feel that oral health is systematically undervalued. The low valuation of dental care is also reflectedin the uneven benefit packages for state employees: dental benefits are not subsidized for State E’s employ-ees and dependents or most State A workers. If benefits are offered, the reimbursement levels are often low.Roughly 60% of full-time public employees have dental insurance, but the services covered, copayments,deductibles and dollar caps vary.
FluoridationAlthough each state we visited has some funds for them, programs to fluoridate water systems are generallysmall and on the defensive. During the last legislative session, State B cut its fluoridation budget by 80%to help offset a small part of the cost of the Medicaid reimbursement rate increase. The state dentaldirector said the current state health commissioner does not believe fluoride is beneficial and has fearsabout its safety. Also in State B, one of the largest cities in the country without fluoride voted a few yearsago to fluoridate after years of contentious debate and an enormous community coalition effort but has yetto implement it. In State D, legislative leaders had been working at the local and state levels to get commu-nities funds to fluoridate water, but county boards voted it down for several years. A grassroots effort in StateD won a referendum approving fluoridation in three cities last year, although implementing it has beenstalled by court challenges and efforts among some smaller communities to opt out of the water system.
Scope of Practice and Supervision BattlesPersistent opposition by state dental associations to the attempts by dental hygienists to expand their scopeof practice and loosen supervision requirements was mentioned in every state we visited. One communityhealth center official said: “Dentists are the most territorial mammals on the face of the earth, exceptmaybe dogs.” This struggle is similar to others between professionals, such as physicians and nursinggroups. These are very difficult issues for legislatures because they pit important groups against each other,involve complex technical issues unique to each profession and have the potential to hurt or help thepublic. Hygienists are trained to provide various preventive and “triage” services but are often preventedfrom doing so under state practice acts. Hygienists feel they can remedy access problems by going directlyto underserved populations (thus removing transportation and outreach barriers and solving the no-showproblem). In their own defense, dental associations disagree that changes in scope of practice or supervi-sion are needed to improve access, arguing that most low-income patients need restorative care which canonly be performed by a dentist.In the states we visited, organized dentistry has consistently opposed hygienists’ attempts to practice to thefull extent of their training under any level of supervision and opposed attempts to perform services off-sitethat they can do under a dentist’s supervision. There seem to be big disparities in practice acts governinghygienists and assistants between and within states. In State A, hygienists need direct supervision to applysealants, while in other states, sealants can be applied by dental assistants. In State E, hygienists canperform a full range of services on reservations, but not in private dental offices a few miles away. In StateC, hygienists can get their own Medicaid provider numbers and set up independent practices. However,the dental practice act in State C will be reauthorized next year and most people expect that independentpractice and the ability to get separate Medicaid provider numbers will be challenged by the dental asso-ciation.
There were several comments from hygienists, advocates and educators about the suspected presence ofsexism and a “good ol’ boys network,” in keeping dental hygienists from expanding their scope of practice
FORUM for STATE HEALTH POLICY LEADERSHIP NATIONAL CONFERENCE of STATE LEGISLATURES 11
or practicing more independently, since the great majority of dentists are men and hygienists are mostlywomen. A dental educator in State B said the newly enacted program that will allow dentists to provideclinical training to prospective hygienists is “a slap in the face of the hygiene profession and to women.”There are also differences in practice between dentists and hygienists that deteriorate their working rela-tionship and reduce mutual respect. For example, dentists believe in applying sealants only to healthyteeth, while hygienists in two states said they have been taught that sealing a decayed tooth preventsfurther decay and still allows a dentist to restore it.
State Fiscal WoesAll of these factors are overlaid by the fact that states are facing budget crises. New state-only initiativesregarding dental health—which many policymakers fail to recognize as an important health concern—areunlikely to be funded. The goal of most state officials is simply preservation of programs, rather thanexpansion. (In fact, since the beginning of this project eight states have cut back on or eliminated adultdental benefits in Medicaid and four more considered doing so.) Hiring freezes in at least two states wevisited (States A and E) mean that open oral health positions cannot be filled. In the case of State E, thehiring freeze has blocked state agency officials from hiring a needed data analyst to complete an evaluationof a case management program, despite CDC funding for the position. (They will attempt to contractwith someone for the life of the CDC grant to circumvent the freeze.)
Opportunities for Intervention: Federal and State Policy Issues� A number of states said they needed funds to make existing programs, such as Medicaid or SCHIP,
work better. State funds to maintain oral health program staff are insufficient. State agencies saidthey needed funds to increase reimbursement rates under Medicaid and SCHIP because revenuesare too scarce and, in some cases, rates are so low that increases to a realistic level are simplyunaffordable. Another state suggested that funds to provide incentives for dentists who treat dis-abled and low-income, high-need patients would be helpful. State A’s dental association wants asmall grant to conduct outreach to dentists to become Medicaid providers. An advocate for specialneeds kids in State A wants the state to establish a referral hotline that would provide informationabout which dentists are accepting new Medicaid patients.
� Fluoridation was a topic on many wish lists. Several states said they needed funds to expandfluoridation, specifically to buy equipment for communities to use to fluoridate their water sup-plies.
� There were a few ideas and requests for assistance to change the current financing or deliverysystem or experiment with new practice models. The State B dental director wants help establish-ing a non-entitlement dental care program for adults. Another state wanted seed money to estab-lish or support “model practices” and demonstration programs to improve access. One state re-quested support for development of a dental HMO that uses evidence-based practices, focuses onprevention and evaluates outcomes.
� Finally, across the board, dental hygienists requested help in working to loosen supervision andexpand scope of practice to the extent of their training so they can help improve access to care forlow-income people.
12 FORUM for STATE HEALTH POLICY LEADERSHIP NATIONAL CONFERENCE of STATE LEGISLATURES
III. Dental Education
Barriers: Dental EducationOther than Public Health Service Act provisions and the National Health Service Corps, which both offerlimited support for dental professionals, there is little federal support for dental education. Federal sup-port ended in the late 1970s in response to concerns about a potential glut of dentists and some reporteddifficulties by new dentists seeking to establish a practice. Other than general support for public univer-sities with dental schools, state support is limited to loan repayment or scholarship plans. Though suchprograms exist in statute, they may be poorly funded by states and limited in number. For example, thereare only five slots in State B. The State E legislature specified population ranges for each of the three loanrepayment slots created in 2000; only the slot in the most populous area has been filled.
Eighteen states (soon to be 16 with new schools in two states) have no dental school. States that solve thatdilemma through cooperative arrangements such as WICHE have increased opportunities for their stu-dents to receive a dental education, but have no guarantees that they will return to their home state. Ashrinking number of dental school applicants are competing for a shrinking number of dental school slots.Even if a school acknowledges a shortage of dentists and wish to increase the number of graduates, expan-sions in class size are limited by a shortage of dental school professors. Dental schools have troublerecruiting faculty because salaries are much lower than a dentist can make in private practice. Further-more, some people, such as the dean of a dental school in State C, believe the lack of diversity in the dentalprofession is detrimental to care of the underserved. According to a state official in State E, young dentistsview their profession “as a business, not healthcare.” Other people raised questions about the lessonsstudents learn in dental school; one state official heard anecdotally from students that their dental schoolblatantly advised them not to treat Medicaid patients.
Opportunities for Intervention: Dental EducationIn states with a dental school. . .
� Non-profit providers need funds to hire dentists to provide supervision for dental graduates anddental students who are doing residencies and externships in sites that provide care to underservedpatients.
� A related request was for changing dental education so that rotations through community clinicsare a condition of graduation.
� Several state officials also wanted funds to promote the dental profession to high schools students,recruit dentists to the state (particularly to rural and underserved locations) and recruit “a differenttype of student” into dentistry (particularly nontraditional students, minorities, women and peopleinterested in public service).
In states without a dental school. . .� States without a dental school have different needs than states with dental schools. For example,
State E needs funds to provide placements for second and third year dental students. (They don’thave the clinic infrastructure to house visiting dental students or the funds to pay someone tosupervise them.)
� States without a dental school need help developing a satellite school with a neighboring state’sdental school.
� These states also want help in designing incentives to ensure that state residents return to the stateafter attending dental school elsewhere.
FORUM for STATE HEALTH POLICY LEADERSHIP NATIONAL CONFERENCE of STATE LEGISLATURES 13
IV. Research Issues
Barriers: Research IssuesIn every state, people expressed the need for more information to help them do their jobs or move thepolicy process forward. There were two general types of requests: one for more data on the nature andextent of current access problems and the second for research, evaluation or policy analyses on financing orprogram models to fix access problems. State A’s Medicaid director said they “need information to supportstate efforts to invest in dental services. It is very difficult to generate support for dental services in thisstate.” One legislative staffer said he needed much more information about the exact nature of the accessproblem, asking, “how much is due to factors specific to low-income people and how much is due to theMedicaid system?”
A number of states want more current and detailed information about the prevalence of oral health prob-lems and unmet need among different populations, not only to spur policy and program development butto develop realistic cost projections of new dental benefits in Medicaid and SCHIP. State A is piecingtogether small amounts of money from several sources to do a surveillance project on Head Start students,3rd and 9th graders. The State C SCHIP director wants to know what true need is for dental services amongchildren in the SCHIP program (between 133% and 185% of the FPL) once previous pent-up demand hasbeen satisfied so accurate cost projections can be made. The State B dental director wants to collect andanalyze data on what happens to children who need more care than the SCHIP benefits provide (over the$300 therapeutic cap), partly to spur changes in benefit design and partly to better assess the true costs ofa comprehensive benefit.
A few states have studied, or wish to study, how much Medicaid spends on emergency care for dental painand avoidable oral health problems that could be treated by a dentist. A related question was posed aboutthe cost of hospital dental care for disabled patients for care that could be delivered in a dental office ifqualified dentists were available. Another fact not available for states or localities is the number of schooldays missed by children due to oral health problems; this is seen to be key to spurring investment in oralhealth programs for children. A disability advocate in State B wants information about the impact ofuntreated dental problems and poor oral health on employability.
The questions on financing and program design either involve how to make the current system work betteror ways to experiment with different models. A nagging question involves the need for research document-ing the impact of raising reimbursement rates. According to the State A Medicaid staff, “legislative staff inState A believe that reimbursement rate increases are a waste of money because they don’t increase dentists’participation.” The State C Medicaid agency wants a detailed study to compare Medicaid and SCHIP oralhealth programs across states with respect to codes, reimbursement rates and administrative processes tohelp them better manage the program. Their second question involves how much of the capitated rate fordental should be spent on education of clients and their families about good oral health practices.
One person said, “new thinking is needed about how to get dentists to see low-income patients. Should itbe a daily rate to see patients one day a week or one day a month?” Another asked, “what works to reach thelow-income population who mostly don’t get information through reading?” State E was in the midst ofevaluating a case management program when the program director left her job and the project was leftuncompleted. State A Medicaid would also like to test a prepaid dental plan for Medicaid beneficiaries ona voluntary basis in one county.
14 FORUM for STATE HEALTH POLICY LEADERSHIP NATIONAL CONFERENCE of STATE LEGISLATURES
Opportunities for Intervention: Research Issues� In every state, someone asked for state-specific data about unmet oral health needs in specific
populations, including surveillance data for children at specific grade levels.� Advocates, legislators and legislative staff need policy analyses to review data in the context of
specific interventions and explore the costs and benefits of each.� Many states want funds for demonstration or pilot projects to help states show what works to fix
system problems and funds to produce objective evaluations to document lessons learned.� Descriptions of best practices and dissemination of information about successful programs are
lacking and very much needed, as well as funds to replicate successful programs once they areidentified.
� Sharing information that now exists—such as program evaluations of state programs or nationaldata sets—is important but is not being done. Information to move policy forward has not beenmade available or is not known to most people working on these issues at the state level.
FORUM for STATE HEALTH POLICY LEADERSHIP NATIONAL CONFERENCE of STATE LEGISLATURES 15
V. Leadership
Barriers: LeadershipA problem consistently mentioned across states is the low level of education, awareness and interest amonglegislators about oral health issues. Advocacy groups expressed a need to have legislative champions in eachchamber of their legislature. In the states visited, State B is losing both of its champions this year toredistricting, State D is losing one of its two champions to retirement, and State A has no champions onhealth issues at all, let alone on dental. At least one legislator in State E considers herself a champion ofdental health, but with a legislature that meets for only 80 days every two years, she finds it difficult todevote too much energy to one of many pressing issues. In State C, a legislative leader pushed to allowindependent practice dental hygienists to bill Medicaid; that leader is now the governor, thwarting thehopes of the dental association to repeal that law. However, there doesn’t appear to be a current legislativechampion in State C. While advocates see legislative awareness and leadership as crucial, not all legislatorsagree they need much education. One legislator suggested that broad education efforts shouldn’t be moreelaborate than bullet-point notes on a single page. Since State E’s legislative session is so short, hercolleagues rely heavily on the relevant committee’s assessment of a bill; therefore, she doesn’t think broadeducation efforts in the legislature need “glossy paper” presentations.
Education about the differences in the economics of dental versus medical practices is clearly needed tolend a rational underpinning to debates about raising Medicaid and SCHIP reimbursement rates. In theabsence of more education on these issues, there are common misperceptions among legislators that giverise to sentiments such as “dentists are rich people who don’t need more money in reimbursement rates.”One State D senator allegedly asked at a hearing: “Did you know dentists make more than physicians?”Education about the importance of oral health, the need among specific populations, and gaps in servicesare also important.
Another related issue is the need for educating legislative staff about oral health issues. They are the“detail” people who work on bill drafting, cost estimates, program analysis, committee hearings, and ex-ecutive branch oversight. Staff are particularly important in the 11 states where term limits have takeneffect (there are 6 more where they have been enacted but not implemented yet), and other states withhigh political turnover because they supply the institutional memory lacking in the new crop of legislators.The level of awareness and knowledge in the legislative staff interviewed for this project was spotty.
In addition to leadership in the legislature, a number of people said it is important to have a full-timedental director in each state department to provide leadership on oral health issues. In California, Mary-land, Nevada, Rhode Island, West Virginia and Wyoming, there is a part-time dental director. In 41 statesthere is a full-time dental director. Currently, Washington, Oregon and Michigan have vacant dentaldirector positions. The dental director is generally the advocate within state government, sometimes inconjunction with a dental analyst or director within the Medicaid agency, for funding for oral healthprograms. They make budget requests and other recommendations to health commissioners and Medicaiddirectors, who in turn make recommendations to health and human service secretaries and to governors.
Many public officials and dental professionals remarked that consumers and policymakers do not under-stand that oral health is a part of overall health. As a result, oral health seems to be a low priority for somestate health agency officials. Without consistent strong leadership within health departments and Medic-aid agencies it is difficult to get support for oral health programs. Dental directors in States A, B, and Dsaid they did not get support from the health commissioner or governor in asking the legislature forfunding for health programs. Strong leadership may have a cost, however. The State B dental director toldus that his two predecessors had been fired for being too “activist” and that he had not been consulted by
16 FORUM for STATE HEALTH POLICY LEADERSHIP NATIONAL CONFERENCE of STATE LEGISLATURES
the Department of Human Services (which runs Medicaid and SCHIP) about the planning or implemen-tation of the dental benefit. Since oral health is a small percentage of overall spending in Medicaid andpublic health, it doesn’t garner much attention in the policymaking or budgeting processes.
Opportunities for Intervention: Leadership� Throughout the visits, people spoke of the need to develop leaders among legislators. In each
state, people said they needed education for legislators and legislative staff to elevate the issue ofaccess to oral health care on the priority list and convince them of the need for investment in oralhealth programs. There was a particular sense of urgency for this task in states that were losingtheir leaders to redistricting or retirement. Special attention should be given to members andchairs of health committees since these legislators may have more power to move the debate andinfluence other members on health issues.
� Some states want funds to hire oral health staff due to state budget shortfalls and hiring freezes.
FORUM for STATE HEALTH POLICY LEADERSHIP NATIONAL CONFERENCE of STATE LEGISLATURES 17
VI. Advocacy
Barriers: AdvocacyLack of A Powerful VoiceA consistent theme in states is the lack of effective advocacy for oral health issues in general, and access todental care for low-income people in particular. The State D legislative staff director for the appropriationscommittee said “there is no constituency for it. Because of the limited time legislators have during a sessionto consider specific populations or services, the burden to push an issue is on the advocacy groups.”
State E expressed the need for a coalition or a “powerful voice” to speak out on behalf of oral health. StateD, while it has a coalition, says “we are flying by the seat of our pants here,” and they lack knowledge abouthow to operate it and funds to staff it. In State E, the maternal and child health director said the state lacks“funds for coalition-building.” The State A health commissioner claims “the state needs funds for a staffperson to support the coalition.” State A has a coalition that grew out of its work with the NGA policyacademy, but it lacks broad representation and political clout. State B has no oral health coalition. Thematernal and child health coalition in State B does not lobby on oral health although it did work to getdental benefits included in SCHIP. The director of the coalition said, “oral health needs to get on the listof needs and become a priority.” State C also lacks a coalition, although advocates did organize for a one-time push to add dental coverage to SCHIP.
Advocacy groups clearly need more and better information to be successful. An advocate in State A said,“there is no objective material available that we can use for advocacy on dental and we have no time todevelop it.” In States A and D, advocates pointed to campaigns on issues that were coordinated by anational office that could supply materials and data to state groups that can be tailored to their needs.They said there is nothing like it for dental access. A reporter for a local newspaper in State A pointed outthat the advocacy groups that lobby for services for children and the elderly are different, and that “be-tween older people and kids, kids rarely win. Children’s issues are a low priority compared to seniorcitizens.”
Oral health is also not a priority for advocacy groups in the disability or special needs kids communities. InStates A and B, the disability community says that oral health is a “back burner issue” because access tohealth care can be a life or death issue.
Dental Associations are Not the Best Advocates for Low-Income ProgramsIn all the states we visited, the only or most visible group lobbying the state legislature is the state dentalassociation. Organized dentistry is extremely powerful at the state level, second in influence perhaps onlyto physicians, and is seen as the main group that determines policy outcomes on oral health programs. InState A, a senior legislative staffer stated, without any awareness that her statement was controversial, that“my chairman won’t support anything the dental association opposes.” Dental associations are poor advo-cates for access to dental services for Medicaid and SCHIP beneficiaries because they are perceived as self-serving in seeking increased reimbursement rates. They are sometimes perceived as providing false leader-ship or “lip service” to access issues for low-income people.
Hygienists are Relatively Politically InactiveOn the contrary, according to the state officials we visited, dental hygiene associations are not powerful.Hygienists are less likely than dentists to belong to and be active in their state associations. This lessens thefunding available for lobbying on their issues and lessens their clout. Their solutions to problems are notbrought before the legislature as often, considered as carefully, and given the same weight as those broughtby the dentists. Besides dental associations and dental hygienist associations, community health centers
18 FORUM for STATE HEALTH POLICY LEADERSHIP NATIONAL CONFERENCE of STATE LEGISLATURES
were mentioned as meeting with legislatures occasionally on oral health issues, primarily to request fund-ing for services.
Decisions are Made Out of the Public EyeAn important issue related to advocacy is that many decisions affecting oral health programs are made inisolation; there seems to be no consensus-building function within the states we visited. Information aboutthe problem at hand (potential budget cuts, workforce shortages, etc.) is not shared, and decisions abouthow to solve them are made with no broad discussion involving different sectors of the policy community.For example, State D recently cut its dental benefits in SCHIP because of state budget shortfalls. Althoughthere were unspent federal SCHIP funds, the state did not have the funds needed to match them. Thedecision to cut dental benefits, rather than cut other benefits or reduce costs in some other way, was madeby the SCHIP director without consulting the legislature, dental association or advocacy groups. Similarly,legislative leaders made the decision to cut adult dental benefits in Medicaid in State D without consultingthe health committee, the health department or advocacy groups.
The relative weakness of advocacy groups allows these important decisions to be kept out of the public eye.They seem ineffective at “spreading the word” to their members and the general public about a pendingdecision so they can attempt to influence it.
Opportunities for Intervention: Advocacy� Advocates universally claimed they needed information and objective data on oral health problems
in their state and an evaluation of policies tried by other states. Other people echoed the need forassistance in translating data and information into a form that motivates people to act.
� Advocacy groups also said they need financial support.� Another theme was the need for support to develop coalitions, staff them and help them be
effective in reaching their goals. A closer working relationship between the legislature, executivebranch agencies, program level administrators, providers and advocacy groups can ensure an ex-change of information and a discussion about the potential impact of a pending policy change,even if consensus is not possible.
FORUM for STATE HEALTH POLICY LEADERSHIP NATIONAL CONFERENCE of STATE LEGISLATURES 19
VII. Public Education
Barriers: Public EducationThe need for educating the public about the importance of oral health and its relationship to overall healthwas mentioned frequently by a wide variety of people. An advocate in State B said “lack of access to oralhealth services is not considered a health care crisis.” Low-income people and immigrants in particularwere singled out as in need of education because they don’t practice preventive measures sufficiently andonly seem to come in for care when they experience pain. Some low-income immigrants and certaincultural groups also feel that losing teeth is a normal part of aging. A legislative staffer to the appropria-tions committee in State D said, “lack of demand for oral health services is a barrier. If more people wantedthe services, they would be willing to pay more taxes to make sure they get them.” Older people withdentures don’t realize they still need care and screening for oral cancer. The lack of education and aware-ness about what constitutes quality oral health care is pervasive.
Compounding this issue is a host of barriers to enlisting the media in the effort to educate the public.Electronic media rarely cover issues in oral health policy because they are too long and complicated toexplain in the short segments reserved for news stories and aren’t considered interesting enough for longerfeatures. Print media reporters said that health policy issues in general are considered by editors to borereaders. Reporters interviewed said they can only write about health policy issues if they get a local angleto the story, such as a local clinic adding or losing a dental component, or if they can cover them as part ofa story about state or local government. Occasionally, reports issued by national groups can be covered ifthey shed light on the state’s performance on an issue or problem. A reporter in State D said he needs helpfinding “success stories and personal examples” in order to provide a local hook and make the story news-worthy or appropriate for a feature story. A State A reporter said “I need more national reports with state-by-state data so I can run state-specific articles; local information would also be helpful.” With regards toeducating the public about the importance of oral health care and the number of low-income people whocan’t get care, one reporter said, “unmet need is not newsworthy.”
Opportunities for Intervention: Public Education� People from all sides of this issue requested financial and operational support to educate the gen-
eral public about the importance of oral health, particularly about disease prevention, fluoridationand the links between poor oral health and low birthweight babies, pre-term births, and cardiovas-cular disease. One coalition executive called for “a big public relations and awareness campaignsimilar to Watch Your Mouth targeted to legislators and the public.”
� The State A disability community suggested that families needed education about what consti-tutes quality oral health care.
� Other suggestions or requests were to educate specific patient groups seen as key to improvingaccess to oral health care or patient behavior. A foundation in State C feels that the group mostimportant to educate are parents and grandparents of low-income children. State E requested helpin providing oral health information to low-income mothers through their home-visiting program.State officials also called for support to educate the Medicaid population about how and when toseek care and how to prevent oral health problems.
� Finally, there were a number of requests to support education for health care reporters, primarilyprint media. Both reporters interviewed said they needed help building their knowledge baseabout oral health and the programs that are used to solve problems. Invitations to conferences onhealth policy issues were suggested as a good method to provide education. Reporters can’t acceptgifts, but waiving registration fees for conferences was one suggestion as a way to promote atten-dance.
20 FORUM for STATE HEALTH POLICY LEADERSHIP NATIONAL CONFERENCE of STATE LEGISLATURES
VIII. What Didn’t Surface on Wish Lists
Long on Barriers, Short on SolutionsOne of the interesting things about the many interviews conducted as part of this study is the lack of a one-to-one relationship between barriers identified and requests for assistance or ideas for foundation invest-ment. Frequently, people identified barriers but requested assistance to do something other than addressthose barriers. This may be because it is always easier to identify problems than to solve them. Also, somepeople interviewed had no idea how foundations work in terms of funding constraints or grantmakinggoals; they had few or inappropriate ideas about how foundation support might help (for example, suggest-ing foundation funds could be used to pay for services or increased reimbursement rates). Other intervieweeswere simply giving “wish lists” without regard to a foundation’s potential role or the financial or politicalbarriers in achieving the change. However, it is very clear that most people are very rooted in the present.They acknowledge the power of the state and national dental associations and the current structure ofdental care financing and service delivery in this country and have trouble looking beyond these institu-tions.
Some Important OmissionsGiven the fact that people assume the status quo will prevail, it is not surprising that almost no onesuggested foundation support to increase the supply of dentists even though many people feel there is ashortage in their states. Also, only one person suggested trying to develop a new mid-level practitionersuch as nurse practitioner or physician’s assistant which could extend the capacity of the existing dentalworkforce and help improve access in rural areas. This may be because of the difficulty dental hygienistshave in expanding their scope of practice and loosening supervision; if an established profession has madeno inroads, how could another a new type of professional hope to deliver any of the services dentists nowprovide? It was interesting that no one suggested researching and writing a report about or working toreduce the wide variations in scope of practice and supervision requirements for dental hygienists anddental assistants. For that matter, although the ban on the corporate practice of dentistry was mentionedas a barrier in several states, no one suggested doing a study on how many states have such a ban, what theimpact has been and how states have fared without it. Another request notable by its absence is support foradvocacy efforts surrounding water fluoridation. Many people asked for funds to provide equipment forfluoridation, but none for information or advocacy, although it could help make difference in these localdecisions. No one requested a paper or other education effort explaining the differences between dentaland medical practice, or “dental economics,” to policymakers but it is clearly needed. Most people don’tknow or appreciate why dentists refuse to see patients for whom reimbursements are below cost. No onesuggested education on oral health for governors or their health policy staffs to increase their support andinvolvement. Finally, no one suggested leadership development among dentists or dental associations eventhough many leaders on low-income access issues in states come from that community.
FORUM for STATE HEALTH POLICY LEADERSHIP NATIONAL CONFERENCE of STATE LEGISLATURES 21
IX. Conclusion
Three Components for Policy ChangeA well-known book, John Kingdon’s Agendas, Alternatives and Public Policy, puts forward a simple frame-work for analyzing the components needed for policy change. He says that three things have to be presentin order to move an issue forward. First, there must be a commonly accepted definition of the problem.Second, there must be a workable policy solution to the problem as it is defined. Third, there must bepolitical support for the solution among all the relevant parties required to enact it. These three thingsmust occur together in proportion to one another for policy change to take place. A huge problem coupledwith a small solution without political support from all important actors will not work. A well-definedproblem with an unpalatable solution will not get the political support to work. There are many examplesof this framework from the site visits that explain why the states visited have not moved forward forcefullyto solve problems and point to interventions that might break the logjams.
Defining the ProblemIn the states NCSL visited, there was not a commonly accepted definition of the problem causing accessdifficulties. In particular, there is strong disagreement about whether there is a shortage of dentists or justa maldistribution and too few who are willing to see publicly insured patients and people with disabilities.There is also disagreement about how to define problems of access within Medicaid. Is it a problem ofpoor oral hygiene, cultural beliefs and compliance among patients? Do patients not want dental care? Isit a problem of low participation in Medicaid among dentists due to reimbursement rates and administra-tive hassles? Or are dental practices already at capacity and therefore acting as any business should tooptimize profits by not substituting low paying patients for those who pay cash in full? Assuming thataccess problems are multi-dimensional and complex, there is little consensus among people working fromdifferent perspectives in states about which specific policies need to be changed—let alone what thosechanges should look like. The process of defining the problem is not simply one of obtaining informationto answer a question, but of perception and momentum behind an issue generated by people working onit from all sectors.
Data that might be used to arrive at a common definition of the problem is either not available at all, notshared for political reasons or not understood by people who are in a position to make decisions. Stateagencies that might have useful data don’t have the funds or staff to retrieve it or have not been asked for it.Dental associations view some data and information as proprietary and potentially harmful to their inter-ests. In State B, the dental association is willing to support some new slots “if valid scientific evidenceshowed a shortage” but this evidence is unlikely to be available to a state agency, the legislature, or advo-cacy groups without dental association cooperation in obtaining it. One state dental director said hewould have to file a Freedom of Information Request in his own state to get SCHIP utilization data,although he has Medicaid data and both programs are in his department. In State A, the state board ofdental examiners claimed they didn’t have personnel with the time or skill to retrieve information on theage of the dental care workforce from individual dental licenses, but they said the dental association hadthe information. The dental association said they don’t have it but the health department does. Thehealth department says they don’t have it either. Therefore, the governor and legislature do not know thata large percentage of the dental workforce may retire in the next decade, without sufficient numbers of newdentists being trained to replace them.
The media—who often generate interest in an issue, broaden awareness of a problem and help shape thedefinition of the problem in its coverage—are largely silent on access to oral health care. For the most part,the public isn’t hearing about these issues on television, radio or in newspapers and pressing policy makersfor action. Television covers shorter stories and local print media rarely cover health policy issues, particu-
22 FORUM for STATE HEALTH POLICY LEADERSHIP NATIONAL CONFERENCE of STATE LEGISLATURES
larly issues without a local angle. Political leaders aren’t convening hearings or public forums to discussaccess to oral health care because these problems aren’t “on the radar screen.”
In order the move the policy process forward, RWJF support could:� Fund consensus-building activities in states such as oral health policy academies, task forces and
commissions and provide ongoing technical assistance to ensure lasting results.� Be used to educate the media and work with editorial boards on oral health issues.� Help educate both the general public and high-risk groups such as immigrants, Medicaid and
SCHIP recipients and low-income mothers and grandparents about prevention, the importance oforal health to overall well-being, and how to use services.
Formulating a Policy SolutionIn the states we visited, there was no agreement about workable policy solutions, putting aside the lack ofconsensus about how to define the problem. For example, if a state has decided that its access problems aredue to workforce shortages, there are a variety of potential policy solutions. One obvious solution might beto expand the number of dentists being trained in the state’s dental schools, or, for states without a dentalschool, to buy slots in a neighboring state’s school or establish a residency program to bring third-yearstudents or graduates to the state. With the exception of State E’s dental association, every state dentalassociation we visited had already opposed that solution in recent years, saying the state had an adequatenumber of dentists and an increased supply would threaten the practices of currently licensed dentists.And, in an exercise of dental association power, a satellite residency program in State B that was passed andfunded by the legislature over dentist opposition died in implementation. As a professor at the dentalschool said “we attempted to establish dental residences but the local dental societies ran us off.”
Even if there is general agreement about expanding the workforce through dental education, a host of additionalproblems arise. How should the state address: a shrinking number of applicants for dental schools? Lack ofdiversity and a public service orientation among prospective dental students? Reduced state funding availablefor dental schools? The dental faculty shortage? A shortage of classrooms and dental chairs for teaching? In StateE, there aren’t enough state funds to establish residency slots for third-year dental students, although mostpeople agree there is a shortage of dentists. In State C, the dental school feels that dentists’ income of more than$160,000 a year attracts a certain kind of student (one who is interested in high earnings) and leads to dentalfaculty shortages. Nationwide, there are more than 300 dental faculty vacancies, 70% in clinical training.
Another potential solution for the problem of workforce shortages is enlisting other providers to deliverservices. Dental hygienists have been working consistently in states to expand their scope of practice andloosen supervision requirements but have met with opposition from the dental association, which arguesthat hygienists’ training cannot address the restorative care needs of low-income patients. Of the statesvisited, only in State C can hygienists practice independently and bill Medicaid directly. In State A, whichhas very tight supervision requirements, a state oral health council was asked to consider independentpractice for hygienists and they said “over my dead body because…dental practices will go bankrupt.”Objective analysts might look at the situation and see that dentists and hygienists each have training toimprove access in two different but equally important ways, through restorative care and prevention, re-spectively. However, crafting a policy that reflects this has proven to be too tough to do in almost all states.
Another potential new source of care is pediatricians, pediatric nurse practitioners and other medicalpersonnel who can be taught to screen for dental caries, apply topical fluoride, educate patients andparents about proper oral hygiene and make referrals to dentists for restorative care. In most states, dentalpractice acts define some of these services as the illegal practice of dentistry if performed by anyone otherthan a dentist licensed to practice in that state, punishable by fines and revocations of license. Potential
FORUM for STATE HEALTH POLICY LEADERSHIP NATIONAL CONFERENCE of STATE LEGISLATURES 23
changes in the dental practice act are fraught with heated discussions about endangering the quality of carefor patients. The dean of a dental school in State C has begun training ear, nose, and throat clinicians inthe basics of oral health and wants to expand to other medical professionals, and in State B, a hygieneprofessor—quietly, to avoid being blocked by the dental association—is considering a similar effort
Each of these potential methods for expanding the workforce has been attempted in a site visit state.However, because of the dearth of data collection and evaluation resources, the innovative state and othersconsidering modeling the policy are left with two unanswerable questions: Did the policy work?, and Whyor why not? Consequently, though facing similar problems and considering similar solutions, each state isneedlessly working in a policy vacuum. In order the move the policy process forward, RWJF support could:
� Fund policy analyses, program evaluations, cost-benefit analyses, reports of best practices andsurveys to gather policy relevant state and local data;
� Fund some policy work that would explore alternative practice and service delivery models, newproproviders, and “out of the box” thinking;
� Support a dissemination effort targeted at people in every part of the policy process is needed.
The PoliticsFinally, in the states we visited, there was not broad political support for policy change in oral health. There are fewgroups working on oral health issues, and they do not speak with one voice. State dental associations are among thetwo or three most powerful groups in state politics and are generally the only people speaking with legislators andstaff about oral health issues. There were overt statements made by people interviewed about their strong influencein state policy matters; in most states at most times, dental associations can stop any initiative they oppose. Orga-nized dentistry is not seen as effective in lobbying for increased reimbursement rates because they appear self-servingrather than interested in access for low-income people. However, in the states we visited, dental associations had notbeen active in seeking many other remedies for access problems. Hygienists aren’t terribly active politically and havea difficult time pursuing their agenda with state legislatures to the extent that it conflicts with the dentists. Com-munity health centers lobby but for many health issues, not just dental care.
Most state-based health advocacy groups are not active on oral health issues, and if they work on it at all,it’s a low priority. The natural allies among advocacy groups are maternal and child health, disability, andpoverty and welfare groups, but none work on oral health in any sustained fashion. Also, the leadersamong state executive branch agencies do not place oral health high on the priority list. Health commis-sioners and Medicaid directors have many important issues on their plates, and dental directors do notgenerally have the clout to raise the profile of their issues any higher. This reflects the generally lowerpriority that the public places on oral health compared to physical health.
Finally, there are few champions for oral health in legislatures. Most legislators are not educated about theseissues and many states don’t have any that are committed and willing to push policy initiatives forward. Somestates with knowledgeable committed legislators are losing them to redistricting or term limits with no one tofill the void. Legislative staffs also need education. Health and appropriations committees cover a broad rangeof issues during hearings and access to Medicaid or oral health may receive only a few minutes. In states witha history of low taxes and an emphasis on personal responsibility rather than government assistance, it cantake extraordinary intervention, such as a lawsuit filed against the state, to spur policy action.
In order the move the policy process forward, RWJF support could:� Be extremely useful in supporting coalition building and advocacy efforts, both outside of govern-
ment and including government;� Assist in educating legislators and legislative staff, and developing legislative leadership on oral
health issues.
FORUM for STATE HEALTH POLICY LEADERSHIP NATIONAL CONFERENCE of STATE LEGISLATURES 25
Appendix I. Methodology
There were three sets of activities involved in this study: data gathering and analysis; conducting a meetingof national experts and a focus group of state officials and advocates; site visits to five states.
NCSL gathered and analyzed a wide variety of reports, peer reviewed articles and other information aboutstate dental programs in Medicaid and SCHIP, and oral health improvement efforts in general. Prior to thebeginning of this contract, NCSL filed a Freedom of Information Request with the Centers for Medicareand Medicaid Services to obtain copies of reports filed with CMS by states about access to dental servicesfor children. NCSL also collected dozens of reports produced in the last five years by state departments,commissions, coalitions and task forces about oral health. These included materials submitted to NGA bystates applying for the oral health policy academies. NCSL prepared summary sheets with two pages ofdata about each state program. The goal was to collect in one place basic information about dental educa-tion, hygiene education, the dental and hygiene workforce, children’s services in Medicaid, reimbursementrates and administrative simplifications in Medicaid, regulatory issues and state program leadership andinterventions.
In order to select states for site visits, NCSL reviewed state documents, collected data and compiled twopage summary sheets on each state. The goal was to identify states that are not considered the frontrunners in oral health programming, nor are they considered the least active and promising as sites forinvestment of RWJF resources. The five states with the highest reimbursement rates and three more thatare considered “best practices” states with respect to the priority placed on oral health and the developmentof their programming were eliminated from consideration. NCSL then identified 11 states that fit the“middle” criteria and presented details on seven that represented a range of states geographically andpolitically. Two states were eliminated from this list for being too advanced. This yielded five statesselected for site visits.
Visits were arranged for 2 ½ days of interviews with as many people as possible who could offer importantinformation about policy barriers and opportunities for intervention. The goal was to include key legisla-tors and legislative staff that chair or staff health committees or health appropriations, or who are leaders onoral health issues; maternal and child health, disability and/or oral health advocates; the state dental board;the state dental association; the state hygiene association; local or state executives from foundations thatsupport oral health programs; community health center or dental clinic representatives; SCHIP and Med-icaid directors and dental officers; the state dental director from the health department; and faculty fromdental and hygiene schools. It wasn’t possible to meet with every representative in each state given timerestrictions and scheduling conflicts.

OCTOBER 2002

Tab 47
PROPOSAL SUBMISSION TO THE WASHINGTON STATE GOVERNOR’S BLUE RIBBON COMMISSION FOR
AFFORDABLE HEALTH CARE 2006
Problem Statement:
Our health care system does not provide accessible, affordable, quality health care to all Washingtonians.
Goals:
- All Washingtonians will have access to health coverage that provides effective care by 2012, with all children having such coverage by 2010.
- Washington will be one of the top ten healthiest states in the nation. - Population health indicators will be consistent across race, gender, and income levels
throughout the state. - Increased use of evidence-based care brings better health outcomes and satisfaction to
consumers. - The rate of increase in total health care spending will be no more than the growth in
personal income.
Definitions:MEDICAL HOMEA medical home is where provision and coordination of a patient’s health care is centered and is based upon the mutual commitment to a “doctor-patient” relationship.
EVIDENCE-BASED MEDICINE (EBM) Evidence-based medicine is a classification system of medical care that ranks diagnostic and treatment recommendations through rigorous analysis of randomized controlled trials with statistical validation and controls for bias.
1. PROPOSAL
Emphasis upon building trust for access, quality, and value in health care can best be achieved by preserving the interpersonal relationship recognized in the traditional doctor-patient relationship. Technological developments and reimbursement mechanisms have caused an erosion, if not the destruction, of a single base of operation for medical care in what can now be labeled a Medical Home. http://www.futurefamilymed.org/x26843.html
This Medical Home is no longer common with typical medical care today and its absence creates a residual of fragmented, duplicative care that is sometimes ineffective or harmful. In addition, the increasing significance of chronic illness underscores the value of longitudinal care over long periods of life illness. Patients who have a regular family physician, internist, or pediatrician may have achieved a reliable medical home relationship with a provider. These providers could also include physician extenders, such as nurse practitioners and physician assistants. Where such care is
established, there exists a base of operation where complex medical care can be anchored, coordinated, expedited, and executed.
Any medical home can be adapted to introduce flexible electronic systems that employ the use of Registry Systems http://content.healthaffairs.org/cgi/reprint/20/6/64 which compel the implementation of evidence-based guidelines while the patient is being seen and treated.Registries do not require the presence of electronic health records. The presence of such registries will guarantee both the flexible employment of evolving standards of care and the tracking of performance accountability.
Washington State, through the Department of Health, has already invested in the development of the CDEMS (Chronic Disease Electronic Management System) http://www.cdems.com/ that is made available for free to Washington practitioners. Practitioners who do not have an electronic health records system have used CDEMS. In addition, a series of educational support for introduction and maintenance classes have already been prepared for the user.
The synthesis of all the transformational care components involving chronic care management, integrated care, community treatment, electronic health records, registries, and point of service web-based information has been packaged by the American Academy of Family Physicians (AAFP) as the New Model of Family Practice http://annfammed.org/content/vol2/suppl_1/index.shtml,http://www.futurefamilymed.org/x26823.html It was initiated in 2005 in Washington State and New Jersey as the Practice Enhancement Project (PEP), http://www.futurefamilymed.org/x28894.html with a pilot project for our state of ten medical practices.
The Integrated Care concept that consolidates mental health, substance abuse, and medical treatment at the clinical level, resurrects the failed holistic effort that became sidetracked and synonymous with alternative care interventions. The need for Integrative Care has been further highlighted by silos of funding streams that have perpetuated wasteful churning of reactive care in individual patients who suffer multiple categories of illness simultaneously. While Washington State has wisely initiated a pilot project to integrate care in Snohomish County,http://www.nsrsn.org/WMIP/Download/WMIP_White_Paper_Update_061404a.pdf#search=%22WMIP%22 that focus has been directed to integrating funding and employing nurse consultant case coordination. The Medical Home is the natural locus to coordinate necessary integrative care at the actual point of service by a provider who is committed to integrated multidisciplinary care.
The information technology component of the New Model includes electronic health records (EHR) that enhance an integrative approach to care. Medication monitoring and drug interaction checks to improve patient safety should be a functional feature of the software employed. Currently there is anticipation for the Avista software based on the VA Hospital system. Hillary Clinton and Newt Gingrich recommended its release as free software about a year ago. http://www.ihealthbeat.org/index.cfm?action=dspItem&itemid=115801
The Certification Commission for Healthcare Information Technology (CCHIT), as of July 2006, has certified 18 products. http://www.healthcareitnews.com/story.cms?id=5244. This certification, sanctioned by the HHS and Secretary Michael Leavitt, guarantees functionality, interoperability, and security and should be a factor in any state recommendation. Furthermore, the need for interoperability extends nationally and recommendations must be coordinated with national guidelines.
Implementation of Web-based electronic information in the examination room during the patient encounter will permit access to such valuable information as evidence-based guidelines, health plan formularies, and patient education material.
Evidence Based Medicine (EBM) has been highly exalted and praised in commission testimony for its cost saving potential, but its limitations need to be recognized. Medical Evidence systems find little in current standard of care that passes the rigor of EBM scrutiny. The basis for medical malpractice litigation is currently breach of standard of care, with no respect given for evidence based standards. The best example is the USPHTF (U.S. Preventative Health Task Force) that does not regard any treatment for cancer of the prostate as being effective. Without a statutory acceptance of an evidence-based standard as an alternative to current standard of care, any savings achieved by its adoption will be overshadowed by litigation costs. A transformed system for future health care must anticipate a statutory change in tort law to accept EBM as an acceptable standard of care.
Innovative detail within the New Model of care includes increased utilization of “group visits” involving more than just a traditional provider. One-on-one encounters between provider and patient will be gradually replaced by more interdisciplinary group visits employinginteractive group learning encounters.
The above fundamental changes to the delivery system infrastructure for health care need to be supplemented with paradigm changes in the superstructure of health care financing.Currently, the highest prices are charged to the uninsured, which are charged the sticker price for services rendered. There is currently a lack of price transparency that would permit any meaningful price shopping by the consumer. Other states, such as Wisconsin, http://www.wipricepoint.org/ have implemented excellent web accessed hospital price disclosure. This was accomplished by the hospital association without mandatory legislation, as was required in California. If necessary, the state legislature could mandate hospital and outpatient care price transparency along with a requirement for lowest pricing for the uninsured. Medicare has initiated the posting of specific hospital Medicare payments to permit comparison shopping. http://www.cms.hhs.gov/HealthCareConInit/01_Overview.asp#TopOfPage.
Well-intended mandates for inclusion into health insurance policies have increased the price http://www.ncpa.org/ba/ba237.html of individual policies http://www.rwjf.org/publications/synthesis/reports_and_briefs/pdf/no4_synthesisreport.pdf#search=%22New%20York%20%22standard%20plan%22%20individual%20health%20insurance%22 without regard to impact upon premiums. Each mandate has a purpose, but also a corresponding price. If the state Basic Health Plan is the only available individual policy
unencumbered by mandates, then affordable intermediate plans can be offered, and with full disclosure of mandated limitations. The OIC can be charged to evaluate plans and rates and then establish tiers of less than full mandated coverage for the affordable consumer plan choices.
Medicaid has experimented with managed care plans that almost always have the feature of designating a primary care physician. While some success of these plans has been attributed to the management component, they happen to feature the assignment of a semi-willing Medical Home. Assigning a designated primary care provider to Medicaid recipients can immediately place this program on a Medical Home platform.
The spectrum of the 9.8% uninsured population in Washington http://www.ofm.wa.gov/researchbriefs/brief031.pdf is dynamic but not necessarily based on poverty, since over 50% exceed 300% of the Federal Poverty Level. Some are uninsured by choice. A noticeable proportion is the young adult (college age) who finds little value in health insurance and has higher priorities for spending. There is always a segment that is eligible for Medicaid but chooses not to apply. One example in the Northwest is the fisherman who works in Alaska bringing home over $100,000 annually, but finding the premium price for health insurance to be excessive. Likewise those recently unemployed find the price of COBRA insurance to be excessive.
Most of those that are uninsured by choice regard the current premium rates to be unaffordable. This would be remedied by the availability of lower priced health insurance. For the young adult population, premiums could be cut in half if normal pregnancy, labor, and delivery were funded by an alternate mechanism. A strategy to reduce the uninsured would be to identify subsets and target the needs of each group. One proposed solution in the legislature last year was to cover young adults under parents’ policies to a later age. This might eliminate a segment of the uninsured without disturbing the risk pool. Another idea - health-equity insurance - could be used to pay premiums during periods between employments, thus reducing another subset of the uninsured. Other identified groups, such as those released from prison, and might be specifically addressed as they are revealed in a detailed analysis of the uninsured. The uninsured may be served with fortified charitable forms of free care. This would serve as a safety net when public and private insurance fails. Public policy and indirect support can insure the success of these programs. The current dilemma with the Medicare ruling that non-citizens are ineligible for coverage is a non-issue to the charitable free care clinics. A comprehensive transformation of the health care system for Washington State should support the momentum and beginnings of charitable health care. (ie., RotaCare http://www.rwjf.org/publications/synthesis/reports_and_briefs/pdf/no4_synthesisreport.pdf#search=%22New%20York%20%22standard%20plan%22%20individual%20health%20insurance%22 and Project Access http://www1.leg.wa.gov/documents/joint/HCCA/ProjectAccess_7-27.pdf#search=%22Project%20Access%22 ).
A specific beneficial partnership would be utilizing and defining a state emergency medication stockpile by its usage at free clinics, rather than to discard expired medications. Likewise free standing - free clinics could be designated in partnership to be first response disaster shelters or coordinators. Charitable care within existing practices may be instantly affected if a tax credit mechanism for documented free care is established.
Finally, it is extremely unlikely that the medical care system will ever be able to fully meet the healthcare needs of Washington’s population unless the demand for healthcare services is reduced. This can be accomplished by creating a healthier population through community-based, primary prevention initiatives that are well funded and evidence-based. An example has been the statewide Tobacco Control and Prevention Program funded by the National Tobacco Settlement funds that started in 1999 and has successfully lowered tobacco use in our state and others with similar initiatives. Other initiatives directed at increasing physical activity, improving nutrition, and reducing obesity could have a major impact on the need for chronic disease healthcare.
2. GOALS
The implementation of the expectation of a Medical Home, along with registry-based care, is designed to achieve the three goals of improving health. Where Washington State may be lagging other states, or where population disparities are noted, the registry focus can be immediately adjusted to insure prompt intervention and results. Improvement in access to health coverage to every Washingtonian must openly recognize the need to care for those state residents who are not United States citizens in order for that goal to be achieved. Currently there has been a surge of openings of “Free Clinics” of various sorts, including Rotacare, faith-based, and Project Access. Previous testimony to the Commission has indicated a high return on investment (ROI) of $9.75 for every dollar invested. In addition Community Connect has witnessed the power of charitable donation when the need exists.Physicians are likely to donate their efforts to a charitable need, but unlikely to donate time to the government. The RotaCare free clinics sponsored by Rotary would cease to receive donations if the funds were channeled to assisting government programs.
Access goals for health care (not insurance) would be met by creating an absolute safety net based on charity that has no expectations of citizenship. Existing efforts for free clinics can be enhanced by logistical and regulatory support by the government.
The increased rate of health care spending may be curtailed by replacing fragmented care with coordinated medical care anchored in a Medical Home. An additional opportunity to curtail cost escalation is curtaining the health care dollars spent on insurance overhead costs, or that portion which is not for health care itself.
While the insurance industry may pride itself in containing the rise of internal paperwork, there has been no curtailment of the indirect paperwork burden on medical providers who have witnessed a doubling of staff per provider required in the last ten years. By fiat, the state government may cap the percentage of the health insurance premium dollar that is consumed by direct insurance company cost and indirect obligatory costs imposed on providers.
3. MODELS
While the concept of a Medical Home was once exemplified by a small town general practitioner who delivered all the babies, cared for the children, young adults and the aged, this
concept has been lost in the modern world. The American Academy of Family Physicians (AAFP) has looked ahead to the future to design a New Model that is centered on the Medical Home. Washington State and New Jersey are the two first states to begin implementing this in 2004. Within Washington State the Group Health organization has recognized the need to emphasize the Medical Home and has started a pilot project at their Factoria facility. This needs to be noted, since Group Health has long offered a strong primary care program with a named provider. The organization offers multidisciplinary care as well, but the substance of the Medical Home, where the coordination of responsibilities is needed, will now be included by definition. This highlights the need for substantive coordinated care over time, customized to the individual patient who is attached to his or her Medical Home. The AAFP has assisted one of the Fortune 500 companies to design a new health care system for their employees to be centered on the Medical Home. http://www.aafp.org/online/en/home/publications/news/news-now/professional-issues/20060815aafpibm.html. This company understands the return on investment by defragmenting their employee health care benefits. A model for the value of registries is the Diabetes Collaborative, which in Washington State, developed the Microsoft Access based registry program called CDEMS (Chronic Disease Electronic Management System). This system is made available for free, and can be utilized by a medical practice that has Microsoft Office Pro and does not require ownership of an electronic health records (EHR). The setup of CDEMS is such that it can be applied to any chronic disease.
4. IMPOSED COSTS
While there are costs for transforming health care to emphasize the Medical Home, some of the ongoing cost of continuing medical education itself can be conformed to the features contained in the more comprehensive New Model. For board certified family physicians, this is already taking place in the restructured cycle of board recertification examinations every seven years and in the adoption of annual Maintenance of Certifications. Other specialties are likewise adopting maintenance of certifications as well. The current licensure requirements amounts to approximately two weeks worth of required continuing education, which in itself can be structured to incorporate transformation of the delivery of health care. The Washington State Department of Health has an established training program to educate users of the CDEMS registry for chronic diseases. This has been developed in a general form to enable application to different chronic diseases. It has the flexibility to apply, adjust, and modify guidelines for standards of care. A $2 million budget allocation by the state to target registry development and application of chronic disease registries should be rapidly recouped while improving the delivery of care. The insurance industry already has experience with manifestations of managed care that includes preferred provider panels, or case management, or preauthorization mechanisms. Reconfiguring these components to reimburse for simpler Medical Home concepts should dedicate the industry to reduce their contribution to the entropy of the health care premium dollar.
Interactive group learning may need to be taught with specific skills and techniques designed to coordinate the complexities of advanced integrated health care delivery. Investment in such training and implementation by the health care system, industry and government may be augmented by private grants to promote this form of real-time learning. The concept of navigators or coaches needs to be introduced into the reimbursement and volunteer mechanism, but this is fortunately being explored by HRSA (Medicaid) to address health care disparities. Likewise the integrated health care concept of unifying medical, mental health and substance abuse treatment is augmented with interactive group patient sessions during this form of patient encounter. The integrated health care and navigator concept can converge by implementing the interactive sessions. Funding of this can be from offsets of conventional patient interactions and the anticipated savings generated from efficiencies currently not possible with fractionated, disconnected care. Much literature is available concerning the cost impact of electronic health records.There is certain data efficiency, clinical efficiency, and safety anticipated, but the implementation direct and indirect costs along with the maintenance expenses generally seems to run higher, not lower, than expected. The privacy liability may also overrun the economic savings unless security can be raised to higher levels. Likewise the liability cost of defaulting to a spartan EBM standard of care may totally engulf any anticipated savings unless EBM is required to be accepted as legally defensible in medical malpractice liability suits. The cost of implementing and maintaining EHR may eventually be offset by the reduction of error liability cost, but that assumes containment of the size of medical liability judgments, which is currently unlimited.
Initial EHR costs are substantial and proposals have been made for the government to bear the cost as they are collectively the largest customer of medical services. Others suggest that the insurance industry has the most to profit from EHR and should bear the expense rather than shifting further claims processing costs on providers.
The cost of structuring a low, affordable price to the uninsured should be minimal if that price were the lowest negotiated rate of a private health plan. In the absence of a single rate for all, that expected price would be below the average private plan rate, but above that of Medicare and Medicaid. Hospitals may see a lower total for uncompensated funds, but this would be equitably, or at least proportionally, applied to all hospitals. The cost for hospitals to display price transparency may help to contain and reverse the widening range of accepted payment for specific services, but the financial data is already there. It just needs to be reconfigured to display it in an open manner. The paradoxical result could be a higher collection rate when after-fact charges are regarded as fair and reasonable, as opposed to unreasonably high and inequitable. The cost of providing regulatory and indirect support to “free clinics” that do not accept funds from the government would be offset by the diminished burden of urgent, but not emergent care, on the emergency system. Blending the dispensing of free medications with stockpiles of disaster medication would allow normally expired and discarded medications to be utilized on a rotating basis. The same free standing “free clinics” could also be designated and supported as disaster shelter clinics, which are free clinics during a disaster. The simple measure of allowing free care to receive a tax-credit on the B&O taxes would be a mechanism of reimbursement without state funds in hand. While this may create angst with state revenuers, the objective of providing affordable care for all Washingtonians will be one step closer to being met.
5. COLLABORATION
Nationally, internists http://www.acponline.org/hpp/statehc06_1.pdf and pediatricianshttp://www.aap.org/advocacy/archives/julymedhome.htm have independently come to the same understanding on the importance of the Medical Home. Together with the American Academy of Family Physicians, they represent the majority of primary care physicians that support longitudinal and comprehensive coordinated health care to the individual. Of note is the submission to the Blue Ribbon Commission by the King County Medical Society that narrows recommendations down to two: 1) Care for all children, and 2) Primary Care. http://www.kcmsociety.org/DocumentFiles/31.pdf. The KCMS proposal, supported by other county medical societies, is significant as it absolutely represents the necessary input from the practicing clinician that is notably underrepresented in much health care planning. The KCMS points out the failure in the past of unbridled enthusiasm for clever, fashionable ideas that have proved deleterious to the delivery of health care. Those concepts included managed care, nurse case management, holistic care, and HIPAA. Many of these ideas still have validity, but the methods of actual implementation have resulted in disappointing results. In a similar manner, the KCMS warns of embracing technological concepts such as electronic health records and information technology, or evidence based medicine, with all the advantages anticipated and none of the pitfalls foreseen. If major changes in the delivery of health care are to be advocated by this commission, a more concerted effort must be made to query the physicians and physician extenders for an “environmental impact statement.” Change is needed and inevitable, but unintended destruction of the medical eco-system and groundwater could be more irreversible as in land development. While there are physicians who lead large organizations, they are often former practitioners who are now morphed into administrators. Input from actively practicing physicians is much needed but increasingly difficult to obtain due to workloads. Physician associations such as the WSMA and the largest component, the WAFP, are resources for such input and support.
6. OBSTACLES
The obstacle to changes inherent in the New Model with respect to providers is inertia - the resistance to change. Fortunately the need for this type of change is recognized by leaders in many fields, including family practice, internal medicine, and pediatrics, that represent the substantial part of primary care. Training for change may be funded by multiple sources and can be incorporated into existing continuing education programs. The University of Washington School of Medicine should configure its long range planning and curriculum to translate New Model concepts for all the affected primary care specialties. There may be some anticipated objection to assigning primary care providers to Medicaid patients. Potential errors and mismatches must be considered with provision for adjustment of misassignments. Objection by the primary care providers may only be theoretical, since assignments seem to have worked well with Healthy Options.
Mental health and substance abuse treatment systems have been working at cooperative care for a number of years to address the “dual diagnosis” needs of patients with mental illness and substance abuse problems. They have met resistance, which has gradually been overcome. That momentum can be carried forward to integrate the medical field as well. The state has begun integrating care at the funding level and heralds a change of direction that needs to proceed to comprehensive integration of care. The funding aspect of health care in recent history has emphasized insurance and pooling of risk to the degree that it paradoxically punishes the individual, such as the young adult or the worker in between jobs who has no affordable price options. If premiums could be reduced for those who are employed, innovative policies could be designed to accumulate days of health insurance to be usable when between jobs. There is resistance and fear that, unless mandates are preserved, policies sold in this state will provide inadequate coverage. The resulting consequence of having no insurance, because it is unaffordable, is far worse than an insurance policy that fails to pay for full benefits. The argument needs to be communicated for this tradeoff. Full disclosure for absent mandates can be displayed in tiered categories for prudent purchasing.
Hospitals may object to open price disclosure, but hospital associations in other states have successfully posted user-friendly price comparisons. Mandatory legislation to display hospital pricing should not be necessary. Objection may be raised by state revenue concerns for a tax credit mechanism in the B&O tax, but this apprehension needs to be held in abatement until the success of this innovation can be measured, as it has not been tried elsewhere. It would be a courageous innovative risk that has tremendous untapped potential.
************************************************************************SUMMARY
Major transformation must occur in order solve the stated problem and to achieve the desired goals. This must extend from the infrastructure of medical care implementation, to the superstructure of medical care funding. This proposal emphasizes the multi-pronged changes in delivery of care presented in the New Model of care that has at its foundation the Medical Home.
With a Medical Home, high-touch interpersonal care is not lost to a high-tech impersonal delivery of care. Included is the recognition of the need to manage chronic illness in a multidisciplinary approach and to shift the reliance upon the one-on-one session to more group interactive learning, augmented by optimal use of electronic technology to minimize error.
Suggested changes to the increasingly failing reimbursement mechanism in this proposal focus upon making available more affordable individual health insurance premiums. Much of the dilemma of poor value results from the extensive list of insurance mandates. Many of these must be sacrificed as a tradeoff to permit bare bones, affordable private insurance.
Furthermore, the uninsured population may be systematically reduced by more detailed analysis and targeted solution for each root cause of their status.
We must not overlook the importance of reducing the community need for healthcare services through implementation of community-based primary prevention and improving the overall population health. Changes in medical systems alone cannot accomplish this.
Finally, it is incredible to note that with all the energy surrounding concern for cost of health care there is precious little good information estimating the average lifetime cost of
medical care to an individual. The fragmented health care we experience today may be just a reflection of the fragmented thinking about health care financing.
The overview of the recommendations in this report is designed to preserve maximum, necessary total system flexibility and sensitivity for response to future changes and adaptations that may be unforeseen. Respect for individual differences and needs, as well as population diversity, is fully appreciated. Any plan that lacks such flexibility may fit existing needs for a fleeting moment, but the absolute certain changes in health care may suddenly render it inappropriate or detrimental.
Co -Authors:
Gerald N. Yorioka, MD Medical Director of the Snoqualmie Tribe 425-339-5210 / [email protected]
M. Ward Hinds, MD MPH Health Officer, Snohomish Health District 425-339-5210 / [email protected]
Endorsement: Snohomish County Medical Society
Additional Suggested Links Multistate Health Informanation Technology legislation http://www.ehealthinitiative.org/State and Regional Free Clinic Associations http://www.rxassist.org/patients/res-free-clinics.cfmNational Association of Free Clinics http://www.freeclinics.us/Physician Surplus now a shortage http://www.annals.org/cgi/content/full/141/9/705#R12-12States with Medical Malpractice Caps Increase Physician Supply http://content.healthaffairs.org/cgi/content/abstract/hlthaff.w5.250Immigrants Account for 26% of Uninsured in the US http://www.californiahealthline.org/index.cfm?Action=dspItem&itemID=11209264% of Illegal Immigrants Uninsured http://www.cis.org/articles/2004/back1204.htmlRotaCare Free Clinics http://www.rotacare.org/about.htmNeighborhood Free Medical Clinic Lacey http://www.nfreemc.org/Trinity Free Medical Clinic Tacoma http://www.tpctacoma.org/outreach.htmCore Safety Net Sites Washingtion http://www.doh.wa.gov/hsqa/ocrh/har/safetynet.xlsInterstate Insurance Options http://cdhc.ncpa.org/commentaries/interstate-competition-in-the-individual-health-insurance-marketplaceMandates add 20-45% http://www.cahi.org/cahi_contents/resources/pdf/TrendsEndsDec2005.pdf#search=%22cost%20of%20state%20mandated%20health%20benefits%22Future of Health Care Spending http://www.ncpa.org/pub/st/st286/Physician Shortage http://www.ncpa.org/sub/dpd/?page=article&Article_ID=3448Medicare “Medical Home” http://www.acponline.org/college/pressroom/pilot_test.htmAetna Price Disclosure http://www.washingtonpost.com/wp-dyn/content/article/2006/08/21/AR2006082101103_pf.html

Tab 48
Spokane CountyMEDICAL SOCIETY
Orange Flag Building 104 S. Freya St., Suite 114 Spokane, WA 99202-4868 (509) 325-5010 Fax (509) 325-5409
August 31, 2006
Blue Ribbon Commission on Health Care Office of the Governor P.O. Box 40002 Olympia, WA 98504-0002
Dear Governor Gregoire:
The Spokane County Medical Society would like to thank you, and the Blue Ribbon Commissioners, for your leadership to improving healthcare access to all Washingtonians. We believe that all people should have access to quality medical care.
An important point for healthcare access are the State Medicaid programs. To help improve physician, and other professional providers participation in Medicaid, we recommend the establishment of a Medicaid Ombudsman program within each community in Washington State. By creating this direct liaison between professional providers and the Medicaid department, satisfaction, efficiency and improved cost effectiveness would be achieved by all parties. The ombudsman system would provide the communication link to assist providers with medical coverage issues, claims processes and problem resolution. The result would increase provider participation as the improved efficiency of the system is demonstrated. The Spokane County Medical Society has established such a process with commercial medical insurance carriers in our area that has proven satisfactory to both organizations. Our Society would welcome the opportunity to serve as a pilot location to begin to implement a state-wide Ombudsman system.
Enclosed is the Blue Ribbon Commission Request for Proposal response for your consideration. We will be pleased to provide the Commission with additional detail should you request it.
Sincerely,
Janet L. Monaco, M.H.S. Chief Executive Officer
Cc: Lisa Brown, Washington State Senator, 3rd Legislative District Brad Benson, Washington State Senator, 6th Legislative District Timm Ormsby, Washington State Representative, 3rd Legislative District Alex Wood, Washington State Representative, 3rd Legislative District John Serben, Washington State Representative, 6th Legislative District John Ahern, Washington State Representative, 6th Legislative District
Blue Ribbon Commission Proposal Spokane County Medical Society
August 29, 2006
1. What do you propose be done to realize the vision and goals for Washington State established by the Blue Ribbon Commission on Health Care Costs and Access?
This proposal is to establish a Medicaid Ombudsman Program in Washington State. The location of the Ombudsman would be identified based on the need in each community. The Ombudsman, if located within the community, is able to serve as a liaison between the Medicaid program and the physicians in the community.
2. How will implementation of your proposal enhance, hinder or otherwise impact the achievement of the vision and each of the goals established by the commission? How do you know?
Implementation of a Medicaid Ombudsman program would help increase physician satisfaction and physician participation in the Medicaid program. With the ability to have provider issues, such as eligibility, claims, or care, resolved locally and quickly, confidence in the Medicaid program will increase. In Spokane County, the best location for the Ombudsman is within the Spokane County Medical Society to increase physician interaction. If the Ombudsman is affiliated with a medical society and not the government, they can serve as a bridge between government and the private sector.
3. Is your proposal modeled after an existing policy or program within Washington State or elsewhere? If so, describe the policy or program and its outcomes.
This proposal is modeled after a successful 10 year Buncombe County Medical Society program in Buncombe County, North Carolina. The Department of Social Services Managed Care Representative is housed within the medical society, and is recognized as a significant benefit to physicians and their offices. The Carolina Access ombudsman provides assistance to practices with Medicaid including retropay, access to Medicaid, assisting Buncombe County Project Access with patients who have applied for Medicaid but their status is unknown, and obtaining payment for physicians who have seen Project Access patients who subsequently received Medicaid. The ombudsman program has resulted in an increase in physicians participating in Medicaid and in an increase and consistently high percentage of physicians participating in Carolina Access, the managed care plan that provides a medical home for patients. Furthermore, this program increases plan/physician communication. The medical society has demonstrated a substantial increase in physician participation in other plans by developing close partnerships that lead to notable problem-solving.
4. Will your proposal impose costs on individuals, businesses or government? Will these costs be time-limited or on-going? Can you estimate how much these costs will be, or suggest how such an estimate could be made? How much, if any, of these costs will be offset by corresponding savings?
Cost for an ombudsman program could be covered by the state with existing personnel. The cost can be paid by the state Medicaid program, utilizing available Federal matching funds. This cost can be offset by increased physician participation, more efficient patient scheduling and treatment, and decreased Medicaid overhead costs due to increased efficiency in problem resolution.
5. How does your proposal reflect collaboration among various stakeholders? Which stakeholders have endorsed it?
A collaboration between the Medicaid program and physicians will lead to better care for Medicaid patients and increased physician satisfaction and willingness to participate. Sponsored by a medical society, it will give physicians additional incentive to actively participate in the program. The Washington State Medicaid program would benefit by having greater physician participation in Medicaid, which would then benefit Medicaid patients with an increased choice of physicians.
Spokane County Medical Society, Communities Connect, the Department of Social and Health services, and the Washington Health Foundation have expressed interest.
6. What are the obstacles to implementing your proposal? Who will object to it and why? How do you suggest these objections be addressed?
The largest obstacle to implementing this proposal is funding. Spokane County Medical Society would like to launch a pilot of this program. Through installation at the Spokane County Medical Society, Medicaid materials could be included in the new physician packets that are distributed when new physicians are credentialed. One month after the receipt of the Medicaid packet, the Medicaid Ombudsman would visit the physician at their practice to answer questions. Members of the Spokane County Medical Society have consulted the medical society and Medicaid office in Buncombe County. A pilot project would be built upon their methods, reporting and accountability but adapted for differences in structure in Washington State. The results, lessons and best techniques of this pilot could then be used to replicate and answer possible objections.

Tab 49
August 25, 2006
RE: Recommendations for the Reform of the Health Care System to the Blue Ribbon Commission
The Spokane Alliance, a countywide organization of 33 diverse religious institutions, education associations, unions, and other interested groups represents over 30,000 Spokane County residents. These member institutions are cornerstones of a vibrant democratic society and hold the key to mending and reweaving the social fabric essential for strong families and healthy communities. Health care access has been one of the principal foci for our organization since its founding in May, 2002. The Alliance recommends the following coverage principles be adopted by the Blue Ribbon Commission.
Expand the Basic Health Plan and Medicaid to cover all uninsured residents under 300% of FPL by 2010, with coverage for children beginning in 2008. Expand the Small Employer Health Insurance Partnership to cover employees up to 300% of FPL by 2010. Give larger employers a choice of providing employee health insurance coverage or contributing to the cost of covering employees through state plans. Combine the private health insurance market pools for individuals, small business and association health plan coverage, and create a reinsurance market for the combined pool. Improve benefit design to include a core group of primary, preventive, emergency, catastrophic, mental health, dental and chronic care services. Implement existing legislative action plans to reduce health care disparities based on race and ethnicity.
Based on these principles, we propose the financing and quality, cost control and access elements be adopted by the 2007 legislature:
The uninsured below 300% of FPL should be required to contribute to the cost of health insurance on a sliding-scale basis at affordable levels. The self-employed above 300% FPL must purchase insurance coverage. The state will ensure quality affordable health plans are available through regulatory oversight or by expanding existing public health plans to accommodate these people. Larger employers should have a choice of providing insurance coverage or paying a sliding scale premium tax based on employer size, phased in by 2010. Create risk-adjusted, value-based outcomes/results reporting and tracking for all providers and insurers. Establish or use an existing, independent group to collect, monitor and distribute the data. Encourage or model innovative benefit design with chronic care/disease management coverage. Ensure transparent pricing of health care services. Build incentives into all public programs that encourage best practices. Link provider pay increases to commitments to expand access and increase quality. Public/private Cost/Quality Oversight Commission, with representatives from government, business, labor and consumers, to implement cost control and quality measures, including recommendations from Certificate of Need (CON) Task Force.
The recommendations come from the work of our Health Team and their collaboration with the Fair Share Health Care Coalition. We encourage the BRC to work closely with them and others as you craft a comprehensive solution to the current crisis in our health care system. We look forward to offering our direct testimony to you regarding our recommendations for reform.


Tab 50
September 1, 2006
TO: Blue Ribbon Commission on Health Care Costs & Access
FROM: Access Committee, State Board of Health
RE: PROPOSED STRATEGY TO MEET COMMISSION VISION AND GOALS
The following is a proposal to the Blue Ribbon Commission on Health Care Costs & Access from the Access Committee of the Washington State Board of Health (SBOH). The committee comprises Kim Marie Thorburn, MD, MPH, Ed Gray, MD, and The Honorable David Crump, PhD, and it is staffed by Craig McLaughlin, the Board’s Executive Director. This proposal has not been reviewed or adopted by the full Board given that it has not met since the Commission issued its request for proposals, but the proposal is consistent with policy directions established by the full Board.
Summary
The Blue Ribbon Commission is interested in providing every Washingtonian with health care access by 2012. But one outstanding question is: Access to what? Governments exist to provide for the health and welfare of the populations they serve, but the state does not have the resources, nor does it necessarily have an obligation, to assure every resident has first- and last-dollar coverage for every medical service she or he desires. At the heart of this proposal, therefore, is a recommendation that Washington State identify a core set of health services to which everyone should have access, and then focus on ways to make it possible for every Washingtonian to obtain those services at an affordable price. This effort can build on the Menu of Critical Health Services developed by the State Board of Health and the Public Health Partnership (see attached).
The Board’s Access Committee also is interested in providing adequate funding for public health activities and promoting greater utilization of preventive health care—two strategies that will avoid illness and reduce the need for expensive medical care. To further control costs, there should be a single administration for claims and payments, which would have the potential to reduce significantly wasteful administrative costs incurred by providers and insurers. An effort should be made also to consolidate as many covered lives as possible into a single risk pool. An entity should be established that plays the role of consumer in a more functional market. And finally, the system should not rely on maintaining or expanding the employer-based system, an anomalous and anachronistic system that employers are already abandoning (although it should ensure that current business investment in the system not be withdrawn).
Blue Ribbon Commission on Health Care Costs & Access September 1, 2006 Page 2 of 10
Response to Commission Questions
1. What do you propose be done to realize the visions and goals for Washington State established by the Blue Ribbon Commission on Health Care Costs & Access?
There are many ways to structure a health care finance and delivery system that would have many of the characteristics described above. All require a stronger role for government, but they do not necessarily require that government run the health care system (national health system) or become the insurer for everyone (single-payer). The following bullets describe one approach that would provide access to critical services, discourage overinsurance, eliminate “free riders,” create market incentives to control costs, support quality initiatives, maintain a niche for private insurers, allow for consumer choice, and keep medical care delivery in the private sector.
Washington State should establish a quasi-governmental entity—for purposes of this proposal, we will call it the health and wellness services board (HWSB)—whose governance structure includes representatives from health plans, consumers, providers, business and labor, along with state and local officials. HWSB should identify a core set of critical health services to which every resident of Washington State should have access. The Board’s Menu of Critical Health Services could serve as a starting point for this effort. This list of core services should distinguish between services that should be financed using an assurance model (preventive services for which utilization should be encouraged) and those that call for an insurance model (services that are required only for some individuals, but the financial risk and cost of which should be shared across the entire population or a large subset). The list of core services should reintegrate the existing “silos” of health by including appropriate services considered to fall within the realms of public health, mental health and dental health, regardless of the delivery model. The state, in cooperation with the private sector, should guarantee, as a matter of policy, that every resident of Washington State will be able to obtain these core services, as well as catastrophic coverage, at an affordable price (in other words, services can by obtained for free or at an affordable rate or are covered by an affordable plan) by 2012 and for all children by 2010.Delivering on this guarantee would almost certainly require increased funding for many core public health services (see the work of the Joint Select Committee on Public Health Finance and the proposal submitted by the Washington State Association of Local Public Health Officials). Delivering on this guarantee would also require subsidization of premiums for low-income families and individuals (below 300 percent of the federal poverty level) not eligible for Medicaid or Medicare and expansion of state programs (see proposal submitted by the Fair Share Coalition for more specific suggestions). HWSB should serve as the sole broker of health care plans for the self-employed, part-time workers, employees of businesses under a certain size, employees of larger businesses that do not offer health insurance through their work, and government
Blue Ribbon Commission on Health Care Costs & Access September 1, 2006 Page 3 of 10
employees, and retirees (exclusive of individuals who are eligible for Medicaid, Medicare, or SCHIP). It should also offer to serve as a broker for any other businesses that purchase health care for employees, regardless of size. HWSB should treat all individuals acquiring coverage through it as members of the same consolidated risk pool. It should not engage in risk selection or pursue policies or plans that will promote risk stratification. HWSB should allow individuals to choose among a state insurance program (i.e., the Basic Health Plan or Uniform Medical Plan) and plans offered by private (commercial or nonprofit) insurers under contract to HWSB. It should also serve as a one-stopping shopping source, capable of enrolling people in Medicaid, Medicare, SCHIP, etc. HWSB should also play an assurance function by funding population-based services and direct access to preventive services as warranted, and private insurers should be required to contribute to this effort out of their premiums. All private plans offered through HWSB must be open to all members of the consolidated risk pool regardless of preexisting conditions and must, at a minimum, cover all core services. These plans may provide additional coverage beyond the required core services. HWSB should require that the insurers with which it contracts:
o Accept claims submitted through HWSB or another public or quasi-public entity using a standardized electronic form (the Utah Health Information Network provides a possible model).
o Provide data necessary for quality measures specific to the insurer (such as the time it takes to pay valid claims, delivery of preventive services, quality consistency across racial and ethnic groups, etc).
o Provide data it possesses that is necessary for tracking quality measures specific to providers that are part of its HMO or provider network.
o Participate with HWSB in developing and implementing cost control and quality improvement measures targeted to providers (e.g., evidence-based coverage decisions, centers of excellence, pay-for-performance, and transparency in cost and quality).
o Participate with HWSB as consumers directly involved in quality improvement partnership teams with HMOs, facilities, and provider associations.
HWSB should identify a “base price,” which shall be the cost of the lowest-priced plan available through HWSB that provides the complete set of core services and meets established quality targets. Government subsidies should not be used to pay for anything beyond the base price. Premiums paid above the base price, whether by employers or individuals, should be taxed as sales, and premiums should not be deductible as a business expense. Business tax policies should seek to capture an established share of the base price for each employee of a business over a certain size that does not purchase insurance on behalf of its employees. Employers who wish to provide insurance to their employees may purchase insurance directly, purchase insurance through the HWSB, or deposit money in a pre-tax health savings account or flexible spending account; however, all payments above the base price
Blue Ribbon Commission on Health Care Costs & Access September 1, 2006 Page 4 of 10
should be treated as a salary expense for the business and as income for the employee to the extent allowed by federal law. HWSB should be held accountable, using a GMAP-type process, for the state’s performance against a set of established performance measures that would ensure its continuing, primary focus on population health and wellness and elimination of health disparities (see, for example, the Washington Health Foundation’s Healthiest State in the Nation Campaign measures). State law should create a de facto mandate that individuals purchase insurance by creating incentives, removing disincentives and establishing “gateways,” such as:
o Requiring proof of health insurance coverage as a pre-condition for issuing or renewing a driver’s license.
o Requiring that all children demonstrate within one year of entering school for the first time that they have insurance and have completed a well-child visit in the last year that includes an immunization status check, an oral health screening, and vision screening to American Academy of Pediatrics standards (this would require additional investments in school nurses, public health nurses, provider access in rural areas, and possibly school-link clinic capabilities).
The state should subsidize health information technology (interoperable electronic medical record systems) for small practices that agree to meet performance targets (e.g., percent of children receiving well-child visits and immunizations on time) and to participate in cost and quality initiatives such as transparent pricing and the tracking and reporting of risk-adjusted outcome measures. Failure to meet targets or to provide cost and quality data would require repayment for the amortized cost of the technology. As a major part of its work, the HWSB would serve as a “macro-consumer” that would be directly involved in quality improvement partnership teams with HMOs, facilities, and provider associations. HWSB should be integrated into the work of the Governor’s Interagency Council on Health Disparities and the Council should continue its work on developing an action plan for eliminating health disparities.
2. How will implementation of your proposal enhance, hinder, or otherwise impact the achievement of the vision and the goals established by the Commission? How do you know?
This proposal would enhance the vision and goals of the Commission in several ways.
Improving Access: It is unrealistic to think that the state can guarantee unlimited access to coverage (first- and last-dollar coverage) for every Washingtonian. Many experts have argued that one of the reasons for rampant health care inflation is overinsurance. Consumers are typically not required to consider the cost implications of their health care decisions, and procedures and services that are not evidence-based, economical, efficient, warranted, or safe are readily paid for by insurers. A “defined benefits” approach, as proposed, will make it more affordable to provide access to the most necessary services. This proposal, however, stops well short of rationing. Any employer or individual can buy any type of health plan that is offered—but the government’s responsibility to assure coverage is affordable, and to facilitate insurance purchasing through direct subsidies and through tax breaks and other incentives, is limited to the
Blue Ribbon Commission on Health Care Costs & Access September 1, 2006 Page 5 of 10
cost of the least expensive plan that meets established thresholds for coverage and quality. The state must be strategic and selective about where it puts its next dollar to promote access—and to do so it must effectively address the question: Access to what?
Improving Health: This proposal attempts to integrate all aspects of health, not just the delivery of illness care. An emphasis on public health protections, prevention and primary care is essential if Washington hopes to be one of the top ten healthiest states in the nation. It would give the HWSB responsibility for funding (although not for administering) some critical public health services of statewide significance, and for engaging actively in an assurance function when it comes to providing proven, evidence-based preventive care of community-wide importance (as opposed to traditional insurance activities that attempt to avoid costs and spread any costs that are incurred across the risk pool).
HWSB’s performance would be judged primarily on population wellness indicators, as compared to metrics related to the delivery of personal health services, on the assumption that what gets measured gets done. Presumably, some of those measures also could relate to how Washington compares to other states, and potentially to other nations or their political subdivisions (e.g., British Columbia). The work of the Washington Health Foundation and the Public Health Improvement Partnership could inform any effort to develop an appropriate set of measures.
Measures for judging HWSB’s performance would include measures about disparities based on race, ethnicity, gender, and income. Work on developing a state plan for addressing health disparities through the Governor’s Interagency Council on Health Disparities would continue.
There are several elements of the proposal that would drive adoption of evidence-based medicine, evidence-based mental health and evidence-based public health practice. These include: (1) incentives for adoption of health IT, which can include provider prompts tied to evidence-based protocols and can provide data for a host of other quality improvement activities; (2) development of an evidence-based set of core health services (defined benefits); (3) asmacro-consumers, HWSB and insurers would be involved with providers in quality improvement teams that would promote evidence-based practices and streamline business processes.
Improving Affordability: The Commission has heard a lot of scary data, information and theories about the escalating cost of health care in this country (although per capita spending on public health has been declining). There are many different theories about why we spend twice or more what any other nation spends on care, yet have relatively poor outcomes. Many of these come down to the fact that most economic sectors in the country rely on the markets to drive decisions—we expect the “invisible hand” of Adam Smith to guide us—but in health care, there is no functioning market; the invisible hand is either absent from the picture, or as is more often the case, guides us in the wrong direction because of false incentives or disincentives.
There are several reasons given for this, but most of these come down to the fact that there is no effective consumer in the picture. In 1963 Nobel laureate Kenneth Arrow defined the causes of market failure and uncertainty as: inequity in information, inequity in resources (especially income), the ethical decision to separate treatment from ability to pay, the importance of trust in
Blue Ribbon Commission on Health Care Costs & Access September 1, 2006 Page 6 of 10
a care relationship, the vulnerability and psychological state of patients, and the longer term implication of the physician-patient relationship.
As recently as this year, Michael Porter and Elizabeth Teisberg, in their book Redefining Health Care: Creating Value-Based Competition on Results, have argued that because there is no true consumer in the mix, major players in the health care system end up shifting costs, restricting services and acquiring bargaining power, rather than ensuring value.
Alan R. Hubbard, director of the National Economic Council and economic adviser to the president, argued in the May 3 New York Times that health care is expensive “because the vast majority of American consumers use it as if it were free.” Several proposed health care reforms attempt to involve consumers in making economic decisions about their care. Perhaps the most popular of these policies currently is health savings accounts (HSAs) and other elements of what has been called “consumer-driven health care.” These strategies, however, do little to address other causes of market failure, such as those identified by Arrow three decades ago. A Commonwealth Fund study published in December found that consumers on such plans were more judicious about their spending, but consumer satisfaction is extremely low. Such plans also result in missed health care and higher out-of-pocket costs. Insurers provided little health information, and consumers tended to mistrust the information they did receive. HSAs and related reforms also increase risk selection, which many analysts, including Porter and Teisberg, have identified as one of the cost-drivers of medical inflation.
Porter and Teisberg have argued that insurance companies should be persuaded to play the role of consumer, acting as a collective surrogate for consumers in advocating not only for cost containment, but also for quality. This committee is not convinced that this is achievable. Insurers would continue to have incentives to prioritize efforts to control their own costs over quality improvement and adoption of high-value, high-cost technologies. The Commission also heard of an example where a large employer—the City of Seattle—played the role of consumer while working as part of a business process improvement team and Virginia Mason Medical Center.
In this proposal, HWSB would serve as a macro-consumer, representing actual consumers in the aggregate on business process and quality improvement teams. It would also encourage insurers and large employers to be partners in this endeavor. At the same time, it would promote some market reforms designed to influence consumer demand.
The introduction of a “consumer with clout” is just one way this proposal would contain costs and make coverage more affordable. It would drive consumers to choose lower cost, streamlined, and more efficient plans—“base price” plans—for economic reasons. With defined benefits built around evidence-based medicine, these plans would make it less likely that consumers would choose unnecessary, uneconomical, or unsafe care.
The proposal would also result in administrative simplification. Estimates of the waste caused by unnecessary administrative overhead (mostly paperwork) vary. Methodologies that compare the efficiency of Medicaid and Medicare to private sector insurance suggest that unnecessary
Blue Ribbon Commission on Health Care Costs & Access September 1, 2006 Page 7 of 10
overhead could easily account for as much as 30 percent of spending. Comparative studies looking at the British and Canadian systems suggest that administrative waste in the U.S. health care system is actually much higher, but it is unrealistic to expect that reforms at the state level could capture all potential savings.
Making insurance more affordable, creating strong incentives for individuals to obtain insurance and emphasizing the delivery of public health services and preventive care would also reduce the extremely expensive overutilization of emergency rooms. This proposal would also dramatically reduce risk selection.
3. Is your proposal modeled after an existing policy or program within Washington or elsewhere? If so, describe the program and its outcomes.
This proposal emphasizes three goals—a defined benefit packet of core health services that incorporates public health activities, a single risk pool, and a combined administrative structure. The remaining specifics describe one model for achieving those goals. That model is based largely on the “managed competition” concept developed by the Jackson Hole Group in the early 1990s. There are many overlaps between the Jackson Hole Group’s work and the Washington State health reforms enacted in 1993 and later rolled back. Managed competition was also at the core of the Clinton Health Security plan. Veterans of the health policy debate will recognize that the HWSB is similar to the “health insurance purchasing cooperatives” (HIPCs) that were proposed by the Jackson Hole Group and incorporated into the 1993 Washington State reforms. Under the Clinton plan HIPCs evolved only slightly into regional health alliances. There were extensive debates around this basic concept in the early 1990s and much can be learned about the strengths and weaknesses of managed competition by revisiting those debates. It should be noted, however, that this plan differs from previous plans in some significant ways—notably, there is no employer mandate. Also, the defeat of previous incarnations of managed competition were driven as much by partisan political considerations, misleading public advertising, and the lobbying and campaign funding activities of some vested special interests, as they were driven by considerations about whether they could effectively meet goals such of those adopted this Commission.
In some ways, this proposal is modeled after efforts and programs already in place in Washington State. It would rely on expansion of existing programs like the Basic Health Plan, SCHIP, and the Uniform Medical Plan, and on an agency much like the Health Care Authority (HCA), but responsible for many more covered lives, expanding many of the cost control and quality improvement activities it has already begun.
There are some parallels with recently enacted health insurance “mandates” in Massachusetts, except this proposal would use incentives and gateways to encourage coverage, rather than costs imposed through taxation. Some health policy tools are not available to Washington because the state does not have an income tax. It is too early to know what outcomes will result from Massachusetts’ policy.
Blue Ribbon Commission on Health Care Costs & Access September 1, 2006 Page 8 of 10
Finally, the “defined benefits” concept in this proposal suggests some similarities with the system in place in some Canadian provinces, where the government negotiates a capitated price for a defined set of services. The difference is that employers and consumers would be free to purchase coverage over and above the basic package. Canada’s health care system has better health outcomes and better customer satisfaction than the U.S. system. There are longer waits for elective procedures, but for emergent conditions, delays are not a problem.
4. Will your proposal impose costs on individuals, businesses or government? Will these costs be time-limited or ongoing? Can you estimate how much these costs would be or suggest how such an estimate should be made? How much, if any, of these costs will be offset corresponding savings?
This proposal assumes that health care is a shared responsibility of business, individuals, and government. The entire premise is that it would result ultimately in savings to individuals, business, and government by slowing medical inflation. There would be costs to individuals, business, and government, and the government costs would have to be picked up by individuals and businesses, but most of these “costs” would be the result of cost-shifting, not new overall system costs.
Some additional costs would stem from increasing funding to areas of health care that are currently underfunded to the detriment of population health. These areas include public health, reimbursement to primary care providers for preventive care, and administrative support services in schools (i.e., nursing and family outreach services).
We believe there is already enough money in “the system” and that the costs of adequately funding areas that are now under-resourced would be offset by significant reductions in administrative expenses, the number of medical errors, and the number of unnecessary procedures, as well as streamlined business processes, better management of chronic conditions, and prevention of avoidable illness and injury. Several studies suggest that it is cheaper to insure people than to pay for their care through unreimbursed care and inappropriate emergency room visits.
The greatest new costs would be to businesses and individuals that currently opt out of the health care system—individuals who are currently choosing not to purchase insurance and businesses that do not provide coverage for their employees. Individuals incurring new costs would include those who are uninsurable or for whom insurance is prohibitively expensive because they are high-risk, but who might be willing to pay for insurance if it were available and affordable, and those who simply cannot afford coverage because they are low income. Some costs for this latter group should be offset by government subsidization, either by direct subsidization of individuals and families under 300 percent of poverty or by subsidizing small businesses that would like to provide some insurance benefits to employees but cannot cover the entire cost, thereby leveraging their resources. The state might also want to look at the minimum wage and determine if it is sufficient to allow individuals to purchase insurance. Individual payments for coverage should be held to five percent of income.
Blue Ribbon Commission on Health Care Costs & Access September 1, 2006 Page 9 of 10
Part of the challenge will be ensuring that businesses currently paying into the system do not withdraw existing funding. Businesses may choose to continue their current level of commitment, but regardless should not be allowed to drop below some threshold of support. The minimum threshold could be set at a percentage—say, 85 percent—of the base price. This minimal level of commitment could be maintained through tax policy. There are several suggestions in the literature for how this might be achieved. One example would be to charge a payroll tax (for example, $1 per hour worked) and allow deductions for premiums paid on employees’ behalf, although deduction should not to exceed the base price.
This proposal would appear to shift costs from business to government and individuals, but it should be noted that those shifts are already taking place. This proposal would manage that shift and keep it within reasonable limits. If you consider entitlement programs, tax subsidies, and insurance for retired military and government employees, government already pays for some 60 percent of health care costs. Increasingly, the government has been left to cover the most expensive, most high-risk populations.
The most extensive actuarial work on the economics of managed competition was done by the U.S. Office of Management and Budget when the Clinton plan was under consideration. Costing out this specific proposal would require extensive actuarial work by HCA and tax policy choices that are best left to the Governor and the Legislature.
5. How does you proposal reflect collaboration among various stakeholders? Which stakeholders have endorsed it?
The time between when the Commission issued its request and the deadline submission made it difficult to both develop a proposal tailored to the Commission’s goals and vision and to conduct the stakeholder work necessary to seek consensus or win endorsements.
Nothing about this proposal is inconsistent with the proposals submitted by the Washington Association of Local Public Health Officials or the Washington Health Foundation, and the Access Committee supports both of those proposals.
There is also considerable alignment between this proposal and drafts of Fair Share proposal, and we suspect there may also be considerable alignment with many of the suggestions that will come from the Office of the Insurance Commission. One difference that we do anticipate between this proposal and the Fair Share Proposal is that there is no explicit employer mandate or play-or-pay component. Business payments into the system would have to be maintained and businesses currently avoiding any contribution to health care costs for their employees would face additional payments in the form of business or payroll taxes. Labor contracts and competition for labor would ensure that many businesses would continue to offer health insurance as part of the compensation packages. Very large businesses could continue to self-insure under ERISA. But the system would allow for a transition away from an employer-based system. As noted above, this is already happening. Our employer-based system is an accident of history, and the system today is already more government-based than employer-based. A health
Blue Ribbon Commission on Health Care Costs & Access September 1, 2006 Page 10 of 10
care financing system should provide continuity of coverage, and an employer-based system expands and contracts with fluctuations in the economy.
6. What are the obstacles to implementing your proposal? Who will object to it and why? How do you suggest these objections be addressed?
Larger businesses that currently provide insurance would probably support efforts to control costs, to make their contributions more predictable, and to allow for a transition away from an employer-based system. Smaller businesses and some larger businesses that currently do not cover employees will object to being required to pay into the system through increased taxes. A recent survey of business leaders found that most prefer PPO systems over HMOs, but it is likely this proposal would drive purchasers toward HMOs. Individuals who are now free riders or who benefit from risk selection will object to returning to a true insurance model where risk is spread across the population. Hospitals will see some benefit to reductions in uncompensated care, although coverage for some technologies will drop. Smaller insurance companies that have built their business model around risk selection will object strenuously, although the larger, traditional insurance companies tend to favor the managed competition model. Providers will like some aspects of the proposal, but not others—for example, there are concerns that pay-for-performance and outcome tracking, even when risk-adjusted, hurts providers that treat sicker or more at-risk patients.
Addressing these obstacles will require building a strong coalition and framing messages in ways that resonate with people’s closely held values. Public opinion tends to favor health care reform initially, but counter messages that appeal to closely held values, or “frames,” can be very effective in turning the tide of public opinion. This proposal is also complex and supporters will have to find a simple and understandable way to present it to the public.
Washington State Board of Health
Access to Critical Health Services
Final Report
July 2001
Committee on Access:Tom Locke, M.D., M.P.H.
Ed Gray, M.D.
2
This report describes the Washington State Board of Health’swork on access to critical health services during
the 1999-2001 biennium. It containsRecommended Critical Health Services for Washington State Residents,
which the Board adopted on September 13, 2000, andCritical Health Services Explained: A Guide to the
Menu of Critical Health Services,
which the Board reviewed on July 11, 2001.
For additional copies or more information, contact the Board staff at:
1102 SE Quince StreetPO Box 47990
Olympia, WA 98504-7990Telephone: (360) 236-4110
Fax: (360) 236-4088E-mail: [email protected]
Web site: www.doh.wa.gov/sboh/
Printed on recycled paper containing 30 percent post-consumer waste.
3
Table of Contents
Executive Summary ................................................................................... 4
Critical Health Services Explained ........................................................... 6
Recommended Critical Health Services for Washington Residents ...... 10
Adopted Menu of Critical Health Service Items ................................. 11Threshold Requirements and Criteria ................................................... 14
About the Washington State Board of Health ........................................ 15
4
Executive Summary
People’s health suffers when they do nothave access to the individual healthservices they need. Communities sufferwhen these services are not available tosignificant numbers of their residents. InWashington, state and local healthjurisdictions monitor access to criticalhealth services and work with the healthcare system—including insurers, medi-cal facilities, and health practitioners—to identify gaps in access and find waysto reduce them.
This role, integral to public health’smission of preventing illness and pro-moting health, is explicitly included inthe Public Health Standards for Wash-
ington State developed by the PublicHealth Improvement Partnership.1
Those standards stipulate that informa-tion should be available at the state andlocal level about “a core set of criticalhealth services that are necessary toprotect the public health.” They also callon public health jurisdictions to providereferrals for clients who need theseservices, and to mobilize their communi-ties to reduce gaps in the availability ofservices.
The Washington State Board ofHealth has been serving as the leadagency at the state level in the develop-ment of public health standards relatingto health care access.
The Board feels it is important tofocus attention on a core set of criticalhealth services because of growing finan-cial pressures in the health insurancemarket and the health care deliverysystem. A consistent theme in publictestimony to the Board in recent yearshas been that cost pressures are result-
ing in the elimination of third-partycoverage for services that have impor-tant public health benefits.
To respond to the needs of the publichealth system, and to concerns aboutadverse public health impacts from cost-containment strategies, the Board cre-ated a Committee on Access that com-prises two Board members, Tom Locke,M.D., M.P.H. and Ed Gray, M.D. Duringthe 1999-2001 biennium, the committeeidentified a menu of core services. Indoing so, it set out to answer the keyquestion: Which health services aretruly essential for maintaining indi-vidual and community health? Theresult is Recommended Critical Health
Services for Washington State Residents,a menu of services adopted by the Boardon September 13, 2000.
MCPP Consulting compiled themenu under contract to the Board, withfunding provided by the Board and thePublic Health Improvement Partner-ship. This list was assembled by a teamof independent medical professionalsand health care consultants using na-tional research regarding the impact ofhealth services on individual and com-munity health without regard to fundingor payment.
The two primary source documentswere:
1. U.S. Department of Health andHuman Services, Healthy People
2010, January 2000
2. United States Preventive ServicesTask Force, Guide to Clinical
Preventive Services, 2nd edition,1996
5
No service appears on the menuunless the provision and availability ofthe service is thought to have a predict-able and demonstrated benefit to the
health status of the community-at-
large—or the absence of this service isthought to adversely affect the healthstatus of the community-at-large.
Any health service that met thisthreshold condition was then measuredagainst four criteria:
� This service addresses a healthissue whose impact or potentialimpact on the population is knownto be great—either in terms ofrelative prevalence/incidence or interms of degree of risk for thecommunity-at-large for events orconditions that occur less fre-quently.
� Key national research, standard-setting and policy-making bodiesconsider this service importantand a relatively high priority.
� There is strong evidence, throughnational or state research and/orevaluation, that the service issafe, effective, and/or cost-effec-tive.
� Policymakers, providers, and thepublic would agree (more likelythan not) that the service is im-portant and necessary.
Services included on the menu werejudged to have met these criteria. ThePHIP Steering Committee and theBoard reviewed the menu before adop-tion.
The list specifically addresses per-sonal health care services. The Boardassumes, for the purposes of this menu,that the full set of public health services,
as described in the PHIP standards,should be available in each community.These essential services include control-ling the spread of communicable dis-eases, educating the public abouthealthy lifestyles, and ensuring thesafety of the air we breathe, the food weeat, and the water we drink.
The Board intends that the menu bereviewed and updated periodically asnew evidence and information becomesavailable. The Board approached thiswork from a population-based perspec-tive. The need for specific services byindividuals should be determined on acase-by-case basis, with considerationgiven to age, gender, risk factors, specificdiagnoses, medical necessity, and poten-tial risks and benefits.
The Board recognizes that a single,standardized list of health serviceswould not serve the needs of every localjurisdiction. Significant local differencesexist in community attitudes,population, geography, health servicecapacity, provider availability, and more.For this reason, the Board offers a true“menu” of services that can inform localefforts to develop lists that areresponsive to local needs.
During 2001-2003, the Board willcollaborate with local health juris-dictions to develop and use localizedlists, explore ways to incorporate themenu into the creation of an insuranceproduct, and develop a list of per-formance measures for assessing access.
1 The Public Health Improvement Partnershipis a collaboration of local health jurisdictions,the Board, the Department of Health and theNorthwest Center for Public Health Practice atthe University of Washington. The partnershipwas formed to develop and implement the bien-nial Public Health Improvement Plan passed intolaw in 1995
6
Critical Health Services Explained
On Sept. 13, 2000, the State Board ofHealth adopted Recommended Critical
Health Services for Washington State
Residents.2 The following questions andanswers explain the reasons for creatingthe menu, its content, and how it might beused.
What is the menu of criticalhealth services?
These are health care services the Boardhas identified as essential to the healthof the community at large. The Boardbelieves that when health purchasersand policy makers decide which medicaland public health services they willmake available, they should consider theservices on this menu as high prioritiesfor all Washington communities.
Why a menu? Why now?
The Board has a longstanding interest inensuring that all Washington residentshave access to health care services thatare necessary from a public healthperspective. It is difficult to talk aboutpromoting access without first beingable to answer the question: Access towhat? One reason the Board developedthis menu was to encourage a dialogue—both within the public health communityand among the regulators andpurchasers of health care. It is theBoard’s hope that participants in thatdiscussion will be able to articulatewhich of the many available health careservices are truly critical to everycommunity’s health.
The Board also created the menu tosupport the efforts of more than 100health professionals at the state andlocal level who have collaborativelydeveloped the Standards for Public
Health in Washington State.3 Thestandards outline what our healthofficials believe must be in placeeverywhere in Washington to provideadequate public health protection. Thestandards detail the specific steps ourstate and local public health agenciesshould take to monitor and report on ourentire population’s health, to respondquickly and effectively to diseaseoutbreaks, to protect us all from unsafeand unhealthy environmental conditionsin our food, air and water, and tostrengthen communitywide healthpromotion and disease preventionefforts.
A final section of the standards out-lines public health’s role in assuring accessto “critical health care services.” Again thequestion arises: Access to what? Thestandards call on the state and each com-munity to determine a specific set ofcritical health services. Once a commu-nity-based set of services has been defined,the standards call on local healthjurisdictions to maintain and disseminateinformation about the availability of thesecritical health care services, to providereferrals for clients who need theseservices, and to mobilize theircommunities to reduce gaps in theavailability of services.
7
How does this relate tostatewide public healthimprovement efforts?
Since the Legislature established thepublic health improvement process in1995, the Board has been a member ofthe partnership that produces the Public
Health Improvement Plan (PHIP).4 Thegoal of the partnership is to create apublic health system that will increasethe level of protection fromenvironmental and communicabledisease health threats and improve thehealth of Washington state residentsthrough effective use of healthpromotion, community assessment data,and personal health care services. Oneelement of the PHIP work plan for 1999-2001 was to develop a “menu of criticalservices.” The Board took on that projectas its contribution to the PHIP. TheBoard’s menu serves as a starting pointfor the state and local healthjurisdictions to begin work oncommunity-specific sets of critical healthservices. Those sets will then provide aframework for efforts to assess theavailability of services and mobilizecommunities to improve access.
Who created the menu?
A team of independent medicalprofessionals and health care researchconsultants produced the menu underthe direction of the State Board ofHealth. The consultants relied oncurrent research findings and theauthoritative thinking of nationalexperts who have analyzed public healthpriorities. The PHIP SteeringCommittee and the Board reviewed themenu before adoption.
What determined whethera service would be on themenu?
No service is on the menu unlessproviding that service would beexpected to have a demonstrablebenefit to the community at large—or its absence would be expected toharm the health of the community.Each service also had to have itseffectiveness documented byscientific research and be broadlysupported by health experts andprofessional organizations.
The following criteria were used toassemble the list:
1. The degree of impact orpotential impact on thecommunity’s health.
2. The level of agreement amongnational research, standardsetting, and policy-makingbodies that providing theservice is an important andrelatively high priority.
3. The strength of the evidence
that the service is safe,effective, and cost-effective.
4. The likelihood that there
would be agreement amongpolicy-makers, health providers,and the public about theimportance of the service.
8
What types of services areincluded?
The services fall into eight generalcategories:
1. Making sure that people havegeneral access to health services
(for example, they are able to seea primary care physician and canget home health care if needed).
2. Preventing risky behaviors andencouraging healthy behaviors(for example, educating peopleabout the dangers of smoking andencouraging healthy diets).
3. Treating and preventing thespread of communicable and
infectious diseases (i.e., screeningfor tuberculosis and providingimmunizations for vaccine-preventable illnesses).
4. Protecting the health of mothers,
infants and children (for example,making sure pregnant mothersget good nutrition and providingwell-child checkups for youngchildren).
5. Improving behavioral health andcaring for people with mentalillnesses and disorders (i.e.,preventing alcohol abuse andproviding intervention services forpeople who are suicidal).
6. Detecting cancer early andtreating it effectively (forexample, providing screenings todetect breast cancer early andspecialty care for treatment ofpeople with various types ofcancers).
7. Dealing with chronic conditions
and improving disease
management (for example,treating diabetes, asthma, andchronic heart disease).
8. Improving people’s oral health
(for example, screening childrenfor oral disease and encouraginguse of fluoride to prevent toothdecay).
So is this simply a list ofcritical health issues?
The menu goes beyond that.
First, it identifies target populationsfor each menu item. For example, itincludes screening for serious mentalillnesses only for people at high risk;screening the general population is noton the menu. And while the menuincludes efforts to decrease tobacco useamong the general population, itspecifically includes preventionprograms aimed at teens.
Second, the menu specifies the typeof service that is needed—screening,education and counseling, or medicalintervention. For example, it does notrecommend screening or medicalintervention for unhealthy dietarybehaviors, but it does recommendcounseling and education.
The menu also considers whetherthere is a need for infrastructureimprovement or policy change.Infrastructure focuses on the availabilityand distribution of providers, facilities,and services throughout the state—areneeded services available from qualifiedproviders within a reasonable distance?Policy on critical health services dealswith decisions made by elected officials,
9
public agencies, health care providers,and insurance purchasers that affectthe availability and quality of neededservices. For example, a law making itmore difficult for minors to purchasetobacco products would decrease teentobacco use. Similarly, requiringinsurers to cover mental health visitswould increase access to behavioraland mental health services.
Why are some servicesthat seem important noton the menu?
Not everything that may be good forpeople’s health is on this menu. Forsome conditions, the degree of risk forthe entire community is relativelysmall. Or there may be someuncertainty about the safety oreffectiveness of particular services.Just because a service is not listed onthe menu does not mean it is lackingin benefit for some people, only thatit did not meet the rigorous selectioncriteria used to determine the menuof critical health services.
For example, the menu does notinclude complementary andalternative medical care (such asnaturopathic and chiropracticservices). Remember that the menuis a starting point for settingcommunity-specific priorities.Community leaders are free to add orsubtract from this menu.
Is the menu prioritized?
No, though the four criteria listed abovemay be used in the future to rank-orderthe menu.
How might the menu beused?
� By measuring access to thesespecific services, researchers candetermine the degree to whichstate residents have access tocritical health services—andwhether initiatives such as PHIPresult in better access and betterhealth.
� Policymakers can use this menuto guide a community discussion
to reach agreement about whichservices, if any, should beuniformly available.
� Local health jurisdictions can usethis menu as a model from whichto build local menus of criticalhealth services. Those commu-nity-specific menus could theninform efforts to mobilize thecommunity to improve access.
� Policymakers may want to usethis menu to help set priorities
and guide policy choices.
� Public and private employers maywant to use this menu to shape
the insurance coverage theypurchase for their employees.
2 http://www.doh.wa.gov/sboh/Priorities/Access/CriticalHealthList.pdf3 http://www.doh.wa.gov/standards/default.htm4 http://www.doh.wa.gov/Publicat/2000_phip/2000_PHIP.htm
10
Recommended Critical Health Servicesfor Washington State Residents
Topic, Target Population, & Service Type
Context
The Proposed Standards for Public
Health in Washington State5 include asection focused on Access to CriticalHealth Services. The intention of thissection of the standards is to ensure thatinformation is collected about a set ofcritical health services for purposes ofmonitoring, assessment of performance,identification of opportunities forimprovement, and communitymobilization efforts to ensure access toservices and to address needs. In orderto carry out the standards, it is firstnecessary to define a set of criticalhealth services, which will become theplatform for assessment and action. Thefollowing menu of critical health serviceshas been adopted by the WashingtonState Board of Health and will serve asthis set.
This menu is meant to be periodi-cally reviewed and updated as newevidence and information becomes avail-able. The perspective of this work ispopulation-based. However, need for andaccess to any of the proposed services isdetermined by the individual patient/consumer circumstance—consideringage, gender, risk factors, specific diag-noses, clinical appropriateness, andmedical necessity.
Key Source Documents
Two sources provided the primaryguidance for inclusion of items in thismenu:
1. Healthy People 2010, U.S.Department of Health andHuman Services, January 2000
2. United States Preventive ServicesTask Force, Guide to Clinical
Preventive Services, 2nd edition,1996
Contents
�� Adopted Menu of Critical Health
Service Items: Services arenamed by clinical or health topicin the left column. Other columnsindicate whether the service istargeted for the generalpopulation and/or a sub-population with specific riskfactors, and the type of service—whether screening/testing/assessment; counseling/education/support; or intervention.
�� Threshold Requirements and
Criteria: This is a summary ofconsiderations and criteria thathave been applied in the selectingservices to be included in themenu.
6 The Standards for Public Health in Washington
State were finalized subsequent to the adoptionof this document.

11
12
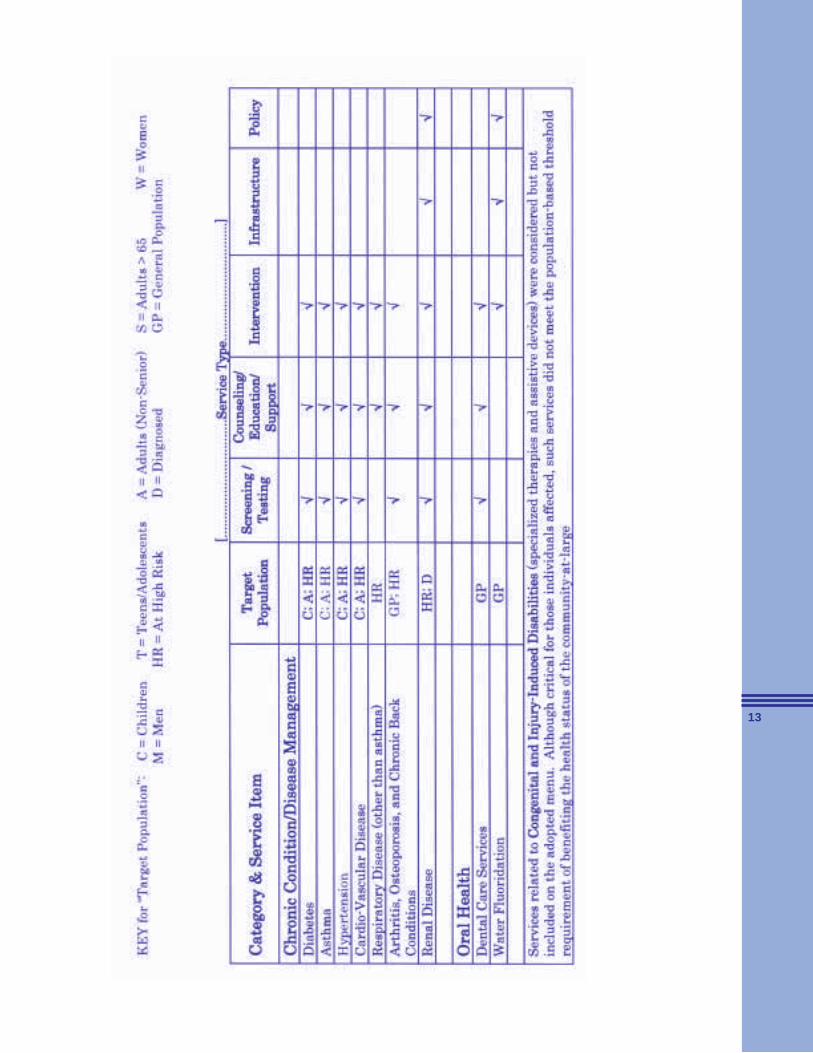
13
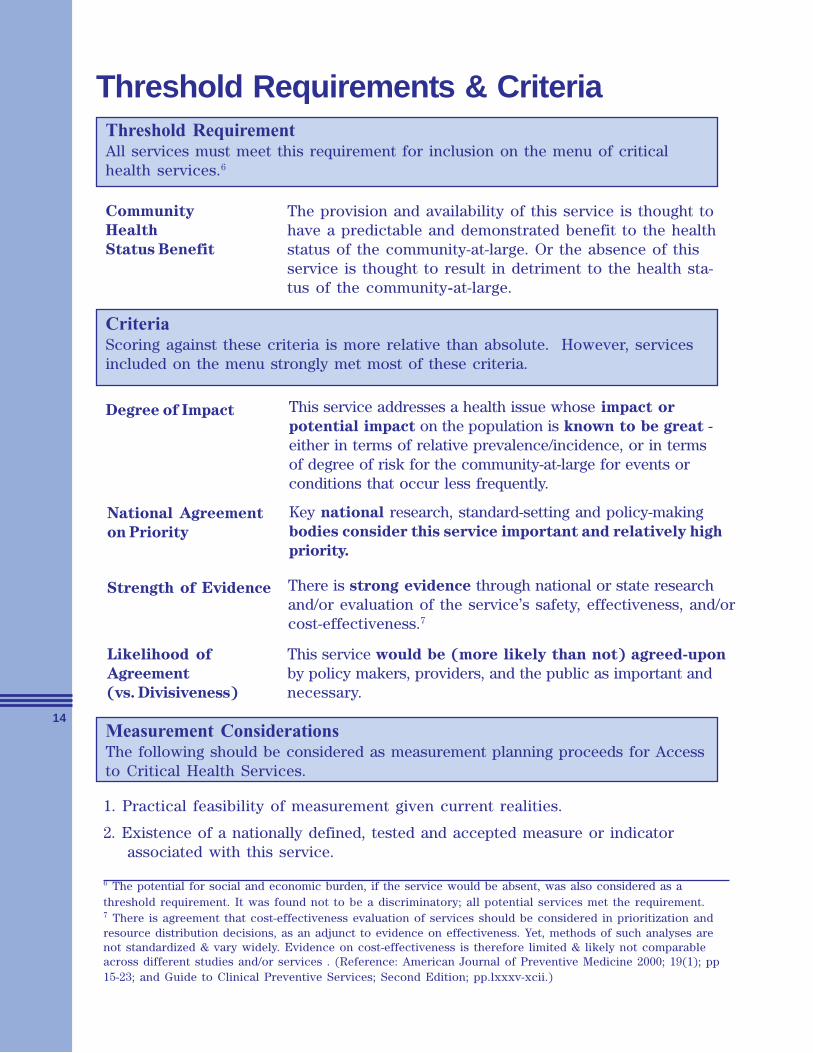
14
Threshold Requirements & Criteria
Community
Health
Status Benefit
The provision and availability of this service is thought tohave a predictable and demonstrated benefit to the healthstatus of the community-at-large. Or the absence of thisservice is thought to result in detriment to the health sta-tus of the community-at-large.
CriteriaScoring against these criteria is more relative than absolute. However, servicesincluded on the menu strongly met most of these criteria.
This service addresses a health issue whose impact or
potential impact on the population is known to be great -either in terms of relative prevalence/incidence, or in termsof degree of risk for the community-at-large for events orconditions that occur less frequently.
National Agreement
on Priority
Key national research, standard-setting and policy-makingbodies consider this service important and relatively high
priority.
Strength of Evidence There is strong evidence through national or state researchand/or evaluation of the service’s safety, effectiveness, and/orcost-effectiveness.7
Likelihood of
Agreement
(vs. Divisiveness)
This service would be (more likely than not) agreed-upon
by policy makers, providers, and the public as important andnecessary.
Measurement ConsiderationsThe following should be considered as measurement planning proceeds for Accessto Critical Health Services.
1. Practical feasibility of measurement given current realities.
2. Existence of a nationally defined, tested and accepted measure or indicatorassociated with this service.
6 The potential for social and economic burden, if the service would be absent, was also considered as athreshold requirement. It was found not to be a discriminatory; all potential services met the requirement.7 There is agreement that cost-effectiveness evaluation of services should be considered in prioritization andresource distribution decisions, as an adjunct to evidence on effectiveness. Yet, methods of such analyses arenot standardized & vary widely. Evidence on cost-effectiveness is therefore limited & likely not comparableacross different studies and/or services . (Reference: American Journal of Preventive Medicine 2000; 19(1); pp15-23; and Guide to Clinical Preventive Services; Second Edition; pp.lxxxv-xcii.)
Threshold RequirementAll services must meet this requirement for inclusion on the menu of criticalhealth services.6
Degree of Impact
15
About the State Board of HealthThe State Board of Health serves the citizens of Washington by working to under-stand and prevent disease across the entire population. Established in 1889 by theState Constitution, the Board provides leadership by suggesting public healthpolicies and actions, by regulating certain activities, and by providing a publicforum. The governor appoints ten members who fill three-year terms.
Board MembersConsumers
Linda Lake, M.B.A, Chair, has 25 yearsof experience in the field of health andsocial services. She has directed severalcommunity health and social serviceorganizations, including the PikeMarket Medical Clinic.
Joe Finkbonner, R.Ph., M.H.A., is anindependent consultant on NativeAmerican health issues. He has servedas chair of the American Indian HealthCommission and director of the LummiLIFE Center.
Elected County Officials
The Honorable Neva J. Corkrum, ViceChair, is a Franklin County commission-er and member of the Benton-FranklinHealth District Board of Health.
Elected City Officials
The Honorable Margaret Pageler, J.D.,
is president of the Seattle City Counciland a member of the Board of PublicHealth in Seattle and King County.
Department of Health
Mary Selecky is secretary of theWashington Department of Health andformer administrator of Northeast Tri-County Health District.
Health and Sanitation
Charles R. Chu, D.P.M., a practicingpodiatrist, is president of theWashington State Podiatry IndependentPhysician Association.
Ed Gray, M.D., is health officer for theNortheast Tri-County Health Districtand chair of the Basic Health Plan Advi-sory Committee.
Carl S. Osaki, R.S., M.S.P.H., formerdirector of environmental health forPublic Health—Seattle & King County,is on the faculty at the University ofWashington.
Vicki Ybarra, R.N., M.P.H., is directorof planning and development for theYakima Valley Farm Workers Clinic.Much of her work is dedicated tosupporting children and families.
Local Health Officers
Thomas H. Locke, M.D., M.P.H., ishealth officer for Clallam and Jeffersoncounties and medical director of the PortGamble S’Klallam tribal health program.
Board Staff
Don Sloma, M.P.H., Executive Director
Craig McLaughlin, M.J., Senior HealthPolicy Manager
Doreen Garcia, M.P.P., Senior HealthPolicy Advisor
Marianne Seifert, M.A., Health PolicyAdvisor
Desiree Day Robinson, ExecutiveAssistant to the Board
Jennifer Dodd, Assistant to the Board
Washington State Board of Health
1102 SE Quince St.
PO Box 47790
Olympia, WA 98504-7990
Telephone: (360) 236-4110
Fax: (360) 236-4088
E-mail: [email protected]
Web: www.doh.wa.gov/sboh/

Tab 51

Tab 52
Washington Academy of Family Physicians
August 31, 2006
Governor Christine Gregoire, Co-Chair Senator Pat Thibaudeau, Co-Chair Blue Ribbon Commission on Heath Care Costs & Access Office of the Governor PO Box 40002 Olympia, WA 98504-0002
Dear Governor Gregoire, Senator Thibaudeau, and Members of the Commission:
The Washington Academy of Family Physicians (WAFP) represents the largest body of primary care doctors in the state. Our 2,600 members offer care to patients in communities in all parts of the state, bridging geographic, economic, social and racial differences.
The WAFP is pleased to have this opportunity to offer our views to the Blue Ribbon Commission on Health Care Costs and Access (BRC) on the critical issues related to health care reform in Washington State. In our view, the goals described in the RFP document are appropriate and desirable, but the complexity of the challenges in the present system facing patients, health care providers, and health care funders makes a single cohesive solution extremely difficult.
At least part of this complexity results from the interrelated nature of the current problems with the health care system. For instance, the inadequate levels of reimbursement for many preventive services dissuade physicians from offering these services while at the same time, restricted insurance coverage for these same services often means that lower-income patients cannot afford health care which would avoid or at least minimize future negative health outcomes, which in turn add to the cost burdens of the entire system. Similarly, low reimbursements and high liability insurance premiums discourage physicians, particularly in rural areas, from providing the level of access to care that would meet the goals defined by the BRC.
As primary care specialists, family physicians are uniquely positioned at the intersection of access and affordability issues for the basic health care needs of Washingtonians throughout the state.
The WAFP believes there are several problems or challenges that today exist as barriers to the attainment of the goals of Accessibility, Affordability and Quality health care:
The myriad of insurance programs (government and privately purchased) increases the paperwork and obstacles between family physicians and our patients There are too few safety net slots for those patients who cannot afford insurance
1050 – 140th Avenue NE, Suite C, Bellevue, WA 98005 Ph: 425-747-3100 WA Only: 800-621-8424 Fax: 425-747-3109
[email protected] www.wafp.net
Physician reimbursement is a significant barrier to access and quality of health care. Currently, preventive care and chronic disease management are not adequately funded by government or private payers. Inadequate reimbursements result in some physicians being unable to treat patients from the lesser-paying insurance programs. The system is fragmented by multiple care-givers without sufficient coordination or communication to provide efficient, effective quality care. Continuing high malpractice insurance costs constitute a burden to the system. Fear of lawsuits leads to “defensive medicine,” causing unnecessary actions, such as additional testing, which further hinders efficient patient care. The future supply of primary care physicians is jeopardized by decreasing numbers of students entering family medicine due to being undervalued by the system and by payers.
The WAFP endorses the Future of Family Medicine Project recommendations for improved health care, recently published by the American Academy of Family Physicians:
Taking steps to ensure every American has a personal medical home Advocating that every American have health care coverage for basic services and protection against extraordinary health care costs Promoting the use and reporting of quality measures to improve performance and serviceDeveloping reimbursement models to sustain family medicine and primary care practices
WAFP believes strongly that the solution to Washington’s health care challenges must come from structural changes that will continue to facilitate access and higher quality health care. It is for this reason that our Academy has adopted the New Model of Care for family medicine specialists, featuring patient-centered care, open access scheduling, individual (in-person or phone/email) and group visits, multidisciplinary team care, and continuous quality improvement. It is important to recognize that innovation in technology and in the practice of family medicine will continue over time, and that the health care system must not only allow, but also enable these improvements. The health coverage that provides “effective care” in 2006 may not, and likely will not, be deemed to be effective care in 2012.
RecommendationsWe believe the vision for Washington’s health care must include the following:
1. Create a plan to ensure that all Washingtonians have a medical home. Numerous studies document that access to primary, preventive, and chronic disease care provided by family physicians and other primary care providers is the most cost-effective manner of improving health outcomes.
2. Expand access to care for the uninsured and working poor through existing safety-net programs. Cost savings through initiatives in preventive care, chronic disease management, and evidence-based medicine will allow these programs to remain affordable for the state and beneficiaries. Increased reimbursement for physicians will insure greater participation by physicians and access to care by beneficiaries. Reimbursement increases should be reasonably tied to physicians providing quality care.
3. Continue current efforts to adopt evidence-based medicine guidelines, pharmaceutical use, technology assessments, and pay-for-performance that is based on physicians’ input and expertise. The WAFP supported the Governor in her initiatives this past legislative session, and strongly believes these efforts will lead to cost savings that preserve and expand access to essential medical services.
4. All physician practices should adopt electronic health records. However,proper funding and incentives for electronic medical records must be facilitated, especially for providers in small practices and communities that have more difficulty affording them. Studies document that increased use of EHRs leads to improved health outcomes, but that payers reap the benefits. We suggest increased grants for those who have not adopted EHRs yet and tax credits for those who have.
5. Facilitate increased entry by medical students into family medicine. In order for primary care to be the foundation of a new system, we must have the personnel needed. We recommend increased state support for the University of Washington’s #1 ranked Department of Family Medicine, and medical student scholarships and loan forgiveness for students and residents who will become family physicians and work in this state, especially in underserved areas. More of our brightest and most compassionate medical students will enter family medicine as they see it rightfully valued in our improving health care system.
The WAFP would be pleased to provide further information on how the New Model practice might operate to achieve the goals for improved access, affordability and quality of health care in the state, and welcomes the opportunity to discuss these issues with the Blue Ribbon Commission. Thank you for your consideration.
Sincerely,
Stephen C. Albrecht, MD, Co- Chair Jeffrey A. Huebner, MD, Co-Chair Commission on Legislative Commission on Legislative and Governmental Affairs and Governmental Affairs

Tab 53
Washington Association of Health UnderwritersPosition Statement on Health Care
Background
Private employers, labor unions, public entities and individuals are all rightfully concerned about the increasing cost of health care coverage. In addition, these health care purchasers in Washington State suffer from inadequate market choices when compared with the options that are available in other states. Increased market competition resulting from the entry of new carriers into the Washington market would bring downward pressure on the cost of coverage. The entry of new carriers into the Washington market would also bring new coverage options for health care purchasers. Washington policymakers should create public policies that are designed to attract new carriers to enter the Washington market.
These factors—the high cost of health care coverage and limited market choices for Washington health care purchasers—are also impacted by benefit design and rating requirements. Increasingly, many health care purchasers are unable or unwilling to bear the costs associated with the comprehensive coverage plans that are required in Washington State. A long line of legislatively-mandated health care benefits prohibit the ability of carriers to offer lower-cost plans that provide meaningful medical benefits but are not subject to current mandates and other requirements. Washington’s laws relating to the establishment of rates for health care coverage also impact the cost of coverage. Frequently the result of these laws drives costs higher for large numbers of lower-risk health care purchasers. Washington policymakers should create public policies that are designed to offer more coverage options with varying benefits that can be tailored to the needs of Washington consumers. Rating laws should be revised to allow lower costs where possible and justified.
Position
The Washington Association of Health Underwriters supports health care policy proposals that result in:
Increased coverage choices for Washington health care purchasers, including the availability of limited benefit coverage plans and more choice of Health Savings Account options; Increased market competition through the entry of new carriers into the Washington market;Rating laws for health care plans that allow for lower premium costs where possible and justified, including rating laws that allow plans that include the use of Health Savings Account to be rated separately from other health insurance business; Educating consumers about the true costs of health care, how individuals impact those costs and increase their responsibility for their own health care; The private market place as the primary financing mechanism for health care and only using public programs as a safety net.
Washington Association of Health Underwriters PO Box 58530
Seattle, WA 98138

Tab 54
1
9500 Roosevelt Way NE, Suite C, Seattle, WA 98115206-547-2130 or 1-877-788-8882; 206-547-2549 (fax)Web: www.wanp.org email: [email protected]
September 1, 2006
Honorable Christine Gregoire, GovernorHonorable Pat ThibaudeauCo-ChairsBlue Ribbon Commission on Health Care Costs and AccessOlympia, WA 98504
Dear Commission Members,
Thank you for this opportunity to submit a proposal to the Blue Ribbon Commission and participate in theachievement of the stated Commission goals. The following proposal, “Evidence-based, Chronic DiseasePrevention (EBCDP) Programs: Access to Cost-Effective Care for Improved Health”, is being submittedby the Washington Association of Naturopathic Physicians (WANP).
The State of Washington is committed to the provision of evidence-based health care and the promotionof prevention, healthy lifestyles, and healthy choices as demonstrated through the Blue RibbonCommission’s stated goals of Improving Access, Improving Health and Improving Affordability.Historically, commitments to evidence-based medicine and health promotion have remained separate inhealth policy discussions despite a growing evidence-base that demonstrates healthy lifestyles areimperative for both prevention and long-term outcomes in many chronic diseases. Washington State isuniquely positioned to combine these commitments by developing innovative programs that promote,create incentives for, and measure evidence-based chronic disease prevention (EBCDP) practices, thusimproving Health care quality and rapidly demonstrating a positive return on investment.
To date our proposal has collected broad support from stakeholders, representing a willingness amongprovider groups and health organizations to cooperate for its implementation. We look forward toworking with the Blue Ribbon Commission and all interested stakeholders to develop an implementationplan for this proposal. In brief, we believe Washington State can excel where others have fallen short inthe creation of an environment focusing on Health care delivery.
Questions can be directed to Terry Kohl, Lobbyist at (206) 568-0991 (office), (206) 850-6030 (cell), [email protected] or Ryan Bradley, ND at (206) 778-1722 or [email protected].
Sincerely,
Ryan Bradley, ND and Erica Oberg, NDWashington Association of Naturopathic Physicians (WANP)
2
Proposal to the WA State Blue Ribbon Commissionon Health Care Costs and Access
September 1, 2006
Evidence-based, Chronic Disease Prevention (EBCDP) Programs:Access to Cost-Effective Care for Improved Health
Submitted by the Washington Association of Naturopathic Physicians (WANP)
Evidence-based, chronic disease prevention (EBCDP) programs will contain health care costs,improve health care outcomes and expand access. EBCDP program development is congruent withcurrent WA State Blue Ribbon Commission goals and visions by combining evidence-basedpractice with chronic disease prevention. EBCDP includes guideline-directed, therapeutic lifestylechange including healthy eating, physical activity, smoking cessation, weight control, and stressreduction. EBCDP includes approaches for both primary and secondary prevention of chronic diseasesand chronic disease complications. EBCDP programs must be developed to include performancemeasures and promoted in a manner that creates incentives for both patients and health care providers.Data collection shall be a requisite component of all EBCDP programs for self-critical performanceappraisal.
1. What do you propose be done to realize the vision and goals for Washington Stateestablished by the Blue Ribbon Commission on Health Care Costs and Access?Briefly summarize your proposal.
In response to the Blue Ribbon Commission’s request for proposals, the Washington Association ofNaturopathic Physicians (WANP) proposes the following strategies by which EBCDP can improveaccess, improve health and improve affordability:
a. Development of performance measures, designed by the State in collaboration with regionalpartners, for use in State-supported quality improvement programs that ensure the delivery ofevidence-based, chronic disease prevention (EBCDP) services by all types of WA State healthcare providers. These performance measures shall be consolidated from current nationalguidelines, e.g. US Preventive Services Task Force, ATP-III, JNC-7, etc. and recommendationsfrom national health associations, e.g. American Heart Association, American DiabetesAssociation, etc. Benchmarks shall be based on current evidence and consensus utilizing localexpertise. Performance measures will be specific, yet tailored to meet the needs of individualhealth care provider types and health-care delivery facilities; the measures will be applicable toindividual physicians in a primary care setting, public-health centers including support staff, andhospital-based programs with multiple provider types.
b. Collection of outcomes and cost effectiveness data to evaluate the impact of implementing theEBCDP performance measures on chronic disease risk factors, e.g. hypertension, and ultimatelyon the incidence of chronic diseases and disease-related events, e.g. diabetes, myocardialinfarction. The collection of this data may initially occur in demonstration projects to ensuredelivery optimization prior to large-scale implementation, at discretion of the State and theDepartment of Health. Because of EBCDP practices are already incorporated into naturopathicmedicine as an element of routine care, demonstration projects with naturopathic clinics mayprovide an appropriate demonstration environment. Cooperation between naturopathicphysicians, State-funded health insurance programs, and the public health sector is an achievableand powerful partnership.
3
c. Development of provider and/or facility incentives, designed by the State in collaboration withregional partners, for the provision of EBCDP education. Examples may include: health careprovider recognition programs, pay-for-performance programs, increased eligibility for Statefunding and direct changes to regional reimbursement structure. Provider incentives may undergotesting in select demonstration projects with diverse types of health care providers to ensureoptimization prior to large-scale implementation, at discretion of the State and the Department ofHealth. Provider incentives are critical for the delivery of EBCDP services due to currentreimbursement challenges.
d. Development of patient incentives, designed by the State in collaboration with regional partners,to be funded by private payers, State-funded health programs and employers that encourage thereceipt of EBCDP education from participating WA State health care providers and facilities.Examples may include: quarterly prevention visits with waived co-pay for high-risk patients;premium reductions or credits for patients who demonstrate reduction in chronic disease riskfactors, adoption of healthful behaviors, and/or improvement in self-management of their healthconcerns; the provision of free community-based, educational programs and choice in theselection of health care providers who demonstrate a commitment to the provision of EBCDPeducation. Patient incentives may undergo testing in select demonstration projects withparticipating health care providers to ensure optimization prior to large-scale implementation, atdiscretion of the State and the Department of Health. The King County Healthy IncentivesProgram is a model for incentive development. In order to reach populations in which healthdisparities are common, incentives must anticipate common obstacles, e.g. transportation access.
e. Focus on cooperative, critical mass del ivery of EBCDP services by a broad provider base,including physicians. Critical mass delivery requires health care facilities to develop systems toensure all patients receive EBCDP services, regardless of facility-type. While primary careproviders (MD, DO, ND, ARNP) may be positioned to deliver these recommendations efficientlyfor most patients, many patients do not have a single medical home. Community public healthclinics and hospitals should also be seen as Health promotion centers.
2. How wil l implementation of your proposal enhance, hinder or otherwise impact theachievement of the vision and each of the goals established by the Commission? Howdo you know?
The Commission has a laudable vision of creating a system in which every Washingtonian will have theability to obtain needed health care at an affordable price; this vision can and will be achieved within 5years. The adoption of this proposal will achieve this vision in the following ways:
In Improving Health:
To become one of the top ten healthiest states in the nation will require shifting the Washingtonhealthcare system away from disease-oriented, crisis care toward a preventive, Health promotion care. Aconsumer-driven, Health-oriented system can be created with wide provider inclusion and improvepatient satisfaction with services and care.
Healthy state rankings include measures of obesity prevalence, lost work time, cardiovascular death, andcancer death among other measures; these scores are improved by the implementation of EBCDPservices. By developing EBCDP programs we can create the infrastructure for the delivery of evidence-based care resulting in better health outcomes. By doing so across a wide base of all provider types, andby eliminating the barriers that reduce provider’s ability to offer such care, population indicators of statehealth will become consistent across race, gender & income.
4
A few critical points are summarized below:
Adoption of a Health Lifestyle = Evidence-based, Chronic Disease Prevention (EBCDP).• 62% of coronary events are preventable by following a healthy lifestyle (The Health
Professionals Follow-up Study (n=42,847) (Circulation 2006; 114;160-167)• 58% of Type 2 diabetes is preventable by lifestyle modification (Diabetes Prevention Program
(DPP); (New Engl J Med 2002)• Cardiovascular disease, diabetes, and cancer are all preventable through lifestyle practices
(Preventing Cancer, Cardiovascular Disease and Diabetes: A Common Agenda American CancerSociety, American Heart Association, and the American Diabetes Association, Circulation, 2004)
EBCDP is more effective than early medication for disease prevention.• Lifestyle (58%) was superior to early metformin (34%) for the prevention of diabetes (DPP, New
Engl J Med, 2002)• Lifestyle change is the only intervention proven to reverse coronary artery disease (Ornish et al.,
JAMA, 1998)• Early TZD class medications were ineffective in diabetes prevention (Knowler et al. Diabetes,
2005)
Few WA State health care providers are making EBCDP recommendations in practice.• Only 16% of adult respondents said they were advised by their doctor, nurse, or other health
professional to eat fewer high fat or high cholesterol foods• Only 20% were advised to eat more fruits and vegetables• Only 23% were advised to be more physically activeSource: The Burden of Heart Disease and Stroke in Washington State 2004; WA State Dept. of Health
This summary of data provides rationale for our proposal. It is known that 1) health is improved andchronic disease is prevented through the adoption of healthy lifestyles 2) EBCDP is more effective thanearly prescription medication for prevention and 3) EBCDP is not currently widely offered in WashingtonState. The adoption of this proposal will improve the health of Washington citizens.
In Improving Access:
The focus on cooperative, critical-mass delivery of EBCDP services will ensure access. Consumer choicewill drive the selection of primary care services to facilities that provide high patient satisfaction. OfferingEBCDP services at a low, or reduced, cost to critical need populations and/or as a routine component forhealth program enrollment will also ensure access. In some populations, including those of lowsocioeconomic status, access is also limited by community factors such as transportation andneighborhood safety, which need to be addressed. With broad participation and provider inclusion,patients will have access to the necessary EBCDP services independent of their choice in medical home.
Chronic disease disproportionately affects people of lower socioeconomic status,• These populations are most in need of EBCDP services and are most dramatically affected by
barriers that limit providers ability to offer such care, including low reimbursement• Once appropriate EBCDP recommendations are given by providers, they are low or no cost to
implement
In Improving Affordability:
The cost effectiveness estimates of prevention programs range considerably depending on the analysisused. In general, primary preventive services are widely recognized as cost-effective, with secondaryprevention programs considered to be more so. Yet EBCDP services apply to both primary and secondaryprevention. Also a major influence on the cost of such programs is the lack of infrastructure andcoordinated care delivery for EBCDP programs. Many economic analyses are limited in that they oftenonly include data on the cost savings from preventing a single condition, when in fact the same EBCDP
5
services may reduce costs on multiple chronic diseases (cardiovascular disease, diabetes, cancer,depression, etc.) simultaneously. The implementation of broad-reaching EBCDP programs focusing oncritical-mass delivery will overcome these obstacles through the development of infrastructure in multiplehealth care settings.
EBCDP programs are cost-effective.• Preventive services are widely accepted as a cost-effective strategy to reduce disease. AHRQ-
supported research shows that health education and lifestyle modification reduce the negativeimpacts, including costs, associated with chronic disease (Research News. AHRQ No 02-0018April 2002)
• A recent demonstration project implemented the Diabetes Prevention Program lifestyleintervention in adults age 50 and prevented 37% of expected cases of diabetes over 15 years at acost of $1288 per QALY. Private insurer investments in this EBCDP program showed recovery ofcosts in the form of medical expenses avoided after three years implementation. (Ackermann et al.,Diabetes Care, 2006)
Ignoring EBCDP is very costly.• Almost 60% of Washington adults are overweight or obese. Obesity is one of the primary
factors in many health problems, including diabetes and heart disease. In one year alone,diabetes-related hospitalizations cost about $1.27 billion
• Escalating costs of chronic disease nationwide despite higher priced treatments• Avoidable medical costs of amputation, blindness, dialysis, kidney transplantation,
cardiovascular surgeries, and long-term hospitalization• Avoidable human costs of blindness, amputation, work-time losses, and depression
Chronic disease care is costly for patients and insurers and the costs are escalating. The advent of newmedications and technologies has not reduced the cost or incidence of chronic disease. In fact both haveincreased and are expected to continue to increase. A new approach to Health care deliver is urgentlyneeded in Washington State.
3. Is your proposal modeled after an existing policy or program within Washington orelsewhere? If so, describe the policy or program and its outcomes.
The proposed EBCDP strategies expand upon existing policies and programs. While numerous qualityimprovement efforts are being implemented throughout the country on local and national levels, effortsare largely being guided by national recommendations referred to as the Clinical Performance Measures“Starter Set” which has been put forth by the Ambulatory care Quality Alliance (AQA), the AmericanAcademy of Family Physicians (AAFP), American College of Physicians (ACP), America's HealthInsurance Plans (AHIP), and Agency for Healthcare Research and Quality (AHRQ). The starter set doesnot include healthy lifestyle measures for most health behaviors- despite substantial evidence suggesting ahealthy lifestyle is critical for prevention and also improves long-term outcomes. This proposal is inalignment with the national measures and expands upon them by proposing the development of measuresto fill in the gaps in the current “Starter Set”.
Additionally, EBCDP is similar to and congruent with programs both here and in other states. Localefforts with which the EBCDP strategies are congruent include the Puget Sound Health Alliance, whichis promoting the use of the “starter set” measures and has committed to emphasizing health promotionand lifestyle interventions in response to the feedback of their membership. EBCDP strategies alsoparallel the King County Healthy Incentives program. State-wide adoption of EBCDP strategies couldprovide improved infrastructure and further development of incentive mechanisms which could increasethe success of this innovative program. The Department of Health and the Washington HealthFoundation (WHF) are working together to bring the Chronic Disease Self Management Program -CDSMP (a program developed and tested by Dr. Kate Lorig from Stanford University) - to Washington’s
6
rural communities. WHF is working on health promotion and prevention in their Healthiest State in theNation campaign and will be in need of mechanisms to measure their success. There will be a need fordeveloping strategies like those in this proposal to ensure consistency in measures and data sharing asadditional health promotion programs are created by health care leaders.
We commend the Governor’s Washington Wellness Works program which states, “Government mustplay a leadership role to promote prevention and wellness. I believe Washington is especially well-suitedto serve as a model by promoting healthy behavior among our own employees and retirees. We not onlyimprove the health of state employees and retirees, but also enhance their ability to serve statecitizens…State agencies are in a position to address the cost of health care. Washington state buys healthinsurance for 1.3 million people (Medicaid, Basic Health, Public Employees Benefits Board) at the costof $8 billion each year; we’re in a position to affect change in the area of health care.”
Many elements of the delivery of the proposed EBCDP strategies are exemplified by the Chronic CareModel, developed by Ed Wagner, MD at the Group Health Cooperative. The Chronic Care Modelincorporates cooperation between the community and the health care delivery system. The model impliespatient empowerment, responsibility, and participation through the design of self-management programsand optimization of care delivery. The Chronic Care Model forms a valuable lens through which to designand implement EBCDP strategies, including critical-mass delivery.
Examples of other state programs and policies where EBCDP-type approaches are being introducedinclude new Medicaid Reforms in Kentucky, West Virginia, and Idaho. These states have been thefirst to use new benefit design and cost-sharing options created by the Deficit Reduction Act (DRA), torestructure Medicaid programs. The goals of such programs are to make patients more responsible fortheir own care which will save money for the state; this portion is congruent with part D of the proposalwhich creates patient incentives. West Virginia’s plan includes a program by which Medicaidbeneficiaries who adhere to a responsibility contract will receive credits that they can use to purchaseadditional benefits. While there is a punitive component to the West Virginia model (which we do notadvocate replicating), the incentives provide an example which, to date, has not increased costs (NAtkins, commissioner of West Virginia's Bureau for Medical Services 2006).
An additional example is Florida’s Healthy State Program. The Healthy State Program provides apersonal, technology-enabled approach to address the critical health care needs of Medicaid patients whilereducing the state's health care cost. The program will ultimately improve access to care forapproximately 50,000 Medicaid patients suffering from four difficult-to-manage chronic illnesses --asthma, diabetes, heart failure and hypertension. The program facilitates access to providers to“proactively address health issues and learn to maintain healthy behaviors”.
The experience of these individuals and organizations is congruent with the proposed approach forimplementation of EBCDP service delivery. Representatives from these regional organizations and otherexperts should be brought forward during the design of specific EBCDP demonstration projects.
4. Wil l your proposal impose costs on individuals, businesses or government? Will thesecosts be time-l imited or on-going? Can you estimate how much these costs will be, orsuggest how such an estimate could be made? How much, if any, of these costs will beoffset by corresponding savings?
EBCDP program costs will be shared by public and private stakeholders. This proposal suggests relevantparties, including providers, purchasers, payers, consumers, and policy makers can come together to formconsensus on the best cost sharing strategies. Published analysis suggests at-risk individuals are willingto pay for risk reduction programs, especially if these programs are subsidized; high-risk individuals weremore likely to pay, and would pay more, depending on the design of the program (Johnson FR, et al.Diabetes Care. 2006).
7
However, regardless of the selected strategy health promotion programs such as EBCDP have beenproven cost effective demonstrating a return on investment within 3-5 years for reduced medical costsassociated with prevented chronic disease. Additionally, models of EBCDP in conditions such asdiabetes, which currently accounts for 12% of all health care expenditures (Hogan, Diabetes Care 2003),show impressive cost-effectiveness. Analysis of the Diabetes Prevention Program (which compared withearly prescription drug treatment, placebo, or diet and physical activity) found that providing the lifestyleintervention at age 50 years could prevent 37% of new cases of diabetes before age 65, at a cost of $1,288per Quality Adjusted Life Year (QALY) gained. A private payer could reimburse $655 (24%) of the$2,715 in total discounted intervention costs during the first 3 intervention years and still recover all ofthese costs in the form of medical costs avoided. If Medicare paid up to $2,136 in intervention costs overthe 15-year period before participants reached age 65, it could recover those costs in the form of futuremedical costs avoided beginning at age 65 (Ackermann, Diabetes Care. 2006). Additional cost analysis ofthe Diabetes Prevention Program in high-risk populations resulted in a cost of $1,100 per QALY for thelifestyle program versus $31,300 per QALY for early prescription drug therapy (Herman, WH. Ann IntMed 2005).
5. How does your proposal reflect collaboration among various stakeholders? Whichstakeholders have endorsed it?
EBCDP has been formally endorsed by:
Bastyr University; Gannady Raskin, MD, ND; Dean of Naturopathic MedicineThe American Association of Naturopathic Physicians; Jane Guiltinan, ND; President
The proposal has been circulated to the following individuals and organizations:
Individuals and Health Organizations:Dan Rubin/Kristen West, Choice Regional Health NetworkBrooke Bascom, King County Benefits Healthy Incentives ProgramDon Sloma, WA Health FoundationRobby Stern, Fair Share Health Care CoalitionMelanie Stewart, American Cancer SocietyNick Federicci, American Lung AssociationMike Shaw, American Heart AssociationDonna Christensen, American Diabetes AssociationBruce Reeves, Washington Senior Citizens' LobbyRick Mockler, Washington State Public Health Association (WSPHA) and theWashington State Association of Local Public Health Officials (WSALPHO).
HospitalsLisa Thatcher, Washington State Hospital Association
Private Insurers:Ken Bertrand, Group HealthRick Wickman, PremeraNancee Wildermuth, Regence, Pacificare of WADavor Gjurasic, Molina Health CareMel Sorenson, American Health Insurance Plans
Health Care Provider Associations:Len Edinger, WSMAKathleen Collins, WA Academy of Family PhysiciansMelanie Stewart, WA Osteopathic Medical Association and American MassageTherapy Assn- WA Chapter
Tamara Warnke, WA State Nurses Association and Advanced Registered Nurse
8
Practitioners UnitedLori Bielinske, WA State Chiropractic AssociationGail McGaffick, Acupuncture Association of WA
6. What are the obstacles to implementing your proposal? Who will object to it and why?How do you suggest these objections be addressed?
Obstacles to implementation are few. Common critiques and possible solutions include:
1. Critique: Decreased utilization of hospitals may result, creating hardship on funding of hospitals.
Possible solution: Development of EBCDP programs within hospitals for those patients who chose thehospital as their medical home; redistribution of hospital resources toward mental health and urgent careservices.
2. Critique: Few third party payers allow reimbursement for provider time discussing EBCDP.Prevention-based service descriptors, i.e. current procedural terminology (CPT), are consumed byvaccinations and screenings, evaluation and management (E&M) services are disease-focused andadjunctive care services, e.g. dieticians, are also coupled to disease diagnoses.
Possible solution: Increase reimbursement for current health counseling, self-management education,and nutrition education to all trained providers. Develop specific codes and/or policy surroundingexisting codes for the delivery of EBCDP services to high-risk patients. Expand preventive visits toinclude EBCDP services. Develop pay-for-performance and other provider incentives based uponperformance measures to be paid for by cost-sharing arrangements between patients, purchasers, andpayers.
3. Critique: The proposal does little for chronic disease treatment.
Possible solution: The proposal is prevention focused. However EBCDP services apply to both primaryand secondary prevention and are critical to successful long-term management and improved outcomesin chronic disease. Similar services can and should be applied to treating those with existing disease,however we suggest it be developed in a different proposal. We are supportive of a hierarchy oftherapeutics beginning with EBCDP services, proceeding to non-drug therapies, and then finally todrug therapy and surgery, yet the evidence available for non-drug treatments remains limited. Weare supportive of an evidence-based initiative and feel EBCDP services are desperately needed forboth prevention and treatment.
4. Critique: The proposal is being submitted by naturopathic providers. Does this mean the intent is forEBCDP to be performed only by naturopathic providers?
Response: We use naturopathic physicians as one example provider group for implementation of thisprogram. However, this proposal is broadly inclusive and includes all trained providers in a wide arrayof health delivery environments. Health promotion and lifestyle recommendations are included in allmajor national guidelines for chronic disease care- but are not being delivered according to theguidelines in Washington State.
5. Critique: Costs increase when EBCDP-programs are initiated.
Response: This is true. As lack of infrastructure for EBCDP services contributed to the cost ofimplementing the programs. This fact further illustrates the services are not currently present in routinehealth care delivery. The cost of infrastructure development, as well as the cost of convening regional
9
expertise for the development of the proposed performance measures, incentives, and data collectioninfrastructure, will be required prior to wide-spread initiation. The development of demonstrationprojects confirming benefit may be a short-term tactic to ensure benefit prior to wide-spreadimplementation. Also, the long term cost savings are notable and substantially less costly than drugtherapies. Also, current economic analyses are limited in that they often only include data on the costsavings from preventing a single condition, when in fact the same EBCDP services may reduce costs onmultiple chronic diseases (cardiovascular disease, diabetes, cancer, depression, etc.) simultaneously.
Summary
The development of performance measures and incentives for both patients and providers for the deliveryof evidence-based, chronic disease prevention (EBCDP) services using a cooperative, critical massdelivery model will assist the Washington State Blue Ribbon Commission in reaching its goals ofimproved health, improved access, and improved cost for the citizens of Washington. The collection ofdata on EBCDP programs will ensure critical self-appraisal of the resulting programs. The delivery ofthese services in all State-funded programs by trained providers will improve chronic disease incidence inat-risk populations reducing health disparities. The proposed strategies are broadly inclusive to providertypes and are relevant in a wide variety of Health care delivery environments. Adopting the strategiesoutlined in this proposal will aid in the development of a Health-oriented care delivery environment in theState of Washington and reduce dependence on expensive medication and surgical intervention.
This proposal was drafted by Erica Oberg, ND and Ryan Bradley, ND on behalf of the WashingtonAssociation of Naturopathic Physicians (WANP) and has been submitted to the Washington State BlueRibbon Commission on Health Care Costs and Access.
Dr. Erica Oberg is naturopathic physician at the Institute of Complementary Medicine in Seattle and a researcher atthe Health Promotion Research Center in the School of Public Health and Community Medicine at the University ofWashington. She has collaborated on several federal research grants including investigations of dietary compositionin weight loss and multifaceted lifestyle interventions in type 2 diabetes. Dr. Oberg recently served on theCardiovascular Disease Clinical Improvement Team as a Bastyr University delegate to the Puget Sound HealthAlliance. Dr. Oberg is currently a consultant to the WA Department of Health on a project to revitalizecardiovascular disease prevention in WA State.
Dr. Ryan Bradley is clinical faculty for the Diabetes & Cardiovascular Wellness Program at the Bastyr Center forNatural Health. He also works as a research fellow at Bastyr University where he is currently conducting clinicaltrials of nutrients in type 2 diabetes. Dr. Bradley is published in the field of evidence-based, chronic diseaseprevention (EBCDP) service delivery, specifically looking at the delivery of these services by naturopathicphysicians. He is committed to improved quality improvements and serves as Chair of the Clinical GuidelineDevelopment committee for the American Association of Naturopathic Physicians. Locally active, he recentlyserved on the Diabetes Clinical Improvement Team as a Bastyr University-delegate to the Puget Sound HealthAlliance.

Tab 55
Washington Coalition for Insurance Parity300 Elliott Avenue West, Suite 300 Seattle, WA 98119-4118
Date: August 31, 2006
To: Blue Ribbon Commission on Health Care Costs and Access
From: Randy Revelle, Chair Sean Corry, Public Education Chair Washington Coalition for Insurance Parity
Re: Parity Coalition Proposal
The Washington Coalition for Insurance Parity, representing 145 organizations, is pleased to assist in the work of the Blue Ribbon Commission on Health Care Costs and Access. The coalition looks forward to collaborating with commission members to make full mental health parity a reality in our state.
Mental health problems are common throughout the state and nation. Each year, one in ten Americans suffers from a severe mental illness and one in five experiences a diagnosable mental illness. Mental illness is the second leading cause of disability and premature mortality. On the other hand, mental illnesses are generally as treatable as physical illnesses. Most mental illnesses improve with treatment, and early intervention yields the best results.
The mission of the Washington Coalition for Insurance Parity is to end discrimination in mental health insurance by pursuing legislation that would provide full mental health parity in Washington State. During the 2005 Legislative Session, the Washington State Senate and House enacted mental health parity by large, bipartisan majorities. The parity law, signed by Governor Gregoire on March 9, 2005, accomplishes three goals:
Extends comparable mental health insurance to more than 1.5 million residents; Reduces insurance discrimination against people living with a mental illness; and Helps thousands of people with a mental illness and their families overcome the stigma.
Insurance discrimination continues in our state within the small business and individual insurance markets; a total of almost 540,000 residents are excluded from the parity law. The individual insurance market currently provides no mental health coverage.
To increase access and promote healthy recovery from mental illness, any recommendations by the Blue Ribbon Commission should include a commitment to full mental health parity. Thecommission has the opportunity to end insurance discrimination against Washington State residents living with a mental illness by recommending mental illnesses be treated in a manner comparable to physical illnesses in the small business and individual insurance markets.
Attached to this memorandum are the coalition’s answers to the Blue Ribbon Commission’s questions. Our representative to the commission is Sean Corry, Public Education Chair. Sean can be reached at Sprague Israel Giles, Inc., 1501 Fourth Avenue, Suite 2000, Seattle, WA 98101, (206) 957-7070, or [email protected].
WASHINGTON COALITION FOR INSURANCE PARITYAnswers to Commission Questions
Question 1: What do you propose be done to realize the vision and goals for Washington State established by the Blue Ribbon Commission on Health Care Costs and Access? Briefly summarize your proposal.
Question 2: How will implementation of your proposal enhance, hinder or otherwise impact the achievement of the vision and each of the goals established by the Commission? How do you know?
The Washington Coalition for Insurance Parity recommends the Blue Ribbon Commission on Health Care Costs and Access extend Washington State’s mental health parity law to include the small business and individual insurance markets. Mental health parity means mental health services are covered by insurance in a manner comparable to other health services. The extension of parity to these markets enhances access and increases affordability of mental health care to 540,000 Washington residents still experiencing discrimination.
In a 2006 study, the Substance Abuse and Mental Health Services Administration concluded that state parity laws have succeeded in expanding access to mental health care for those with relatively moderate and mild mental health problems. The Washington Coalition for Insurance Parity recognizes the need to improve access to affordable health care for all Washington residents and believes that providing mental health services comparable to physical health services is a crucial step toward that goal.
The cost to businesses of absenteeism, lost productivity, and claims for disability and unemployment insurance due to untreated mental illness is greater than the cost of mental health parity. In 1999, the U.S. Surgeon General reported that the indirect costs of mental illness imposed an estimated $79 billion loss on the U.S. economy in 1990. According to the U.S. Department of Labor, the $79 billion would be worth at least $120 billion today.
Question 3: Is your proposal modeled after an existing policy or program within Washington or elsewhere? If so, describe the policy or program and its outcomes.
The coalition’s proposal to expand mental health parity is modeled after Washington State’s 2005 mental health parity law enacted with strong bipartisan support from the state Senate, the state House of Representatives, and the Governor. The 2005 parity law will end insurance discrimination against people living with a mental illness in the large group insurance market.
Many states and the federal government have enacted mental health parity. At least 12 states have documented that with appropriate care management, parity results in less than a one percent increase in premiums. No state has repealed or weakened its parity law. Comprehensive parity has also been provided to nine million federal employees at a premium increase of less than one percent.
The cost of expanding mental health parity would be minimal. In November 2004, PricewaterhouseCoopers published an actuarial analysis of the parity legislation enacted in Washington State. The analysis concluded the legislation would increase premiums by less thanone-half of one percent!
2
WASHINGTON COALITION FOR INSURANCE PARITYAnswers to Commission Questions
The coalition has collected numerous studies documenting that mental health parity results in minimal increases in insurance premiums. Ronald Bachman, a nationally recognized health care actuary, analyzed the results of parity and concluded in the Evaluation of Parity in the FEHBP: Final Report, “…the cost of the [Federal Employees Health Benefits Program] implementation of mental health parity only ranges between 0.24 percent and 0.87 percent.” A March 2006 New England Journal of Medicine article, Behavioral Health Insurance Parity for Federal Employees,analyzes the costs and benefits associated with the federal parity law:
“When coupled with management of care, implementation of parity in insurance benefits for behavioral health care can improve insurance protection without increasing total costs. *** The primary concern has been that the existence of parity would result in large increases in the use of mental health and substance-abuse services and spending on these services. With respect to the seven [Federal Employees Health Benefits] plans we studied, these fears were unfounded.”
In the March 30, 2006 edition of the Washington Post, Ralph Ibson, president of the National Mental Health Association, said, “This study, which is certainly enormous and robust, very decisively puts to rest some of the major myths that opponents have brought to this debate, the principal myth being that to enact and implement parity is to increase health care costs.”
Question 4: Will your proposal impose costs on individuals, businesses or government? Will these costs be time-limited or on-going? Can you estimate how much these costs will be, or suggest how such an estimate could be made? How much if any, of these costs will be offset by corresponding savings?
Extending the state’s mental health parity law to the small business and individual insurance markets would require no funding from the state’s budget. In fact, mental health parity would reduce state government costs for imprisonment, hospitalization, homelessness, and public assistance. Mental health parity will also improve the overall health of the community. Providing appropriate and effective mental health treatment can reduce total health care expenditures for persons with a mental illness. Such treatment reduces the need for costly medical services (such as hospital and emergency room services) and improves outcomes for people with other chronic disorders.
Extending mental health parity would result in minimal cost increases to insurance premiums for small businesses and individuals. These increases, however, would be more than offset by the benefits to businesses through increased productivity, less absenteeism, and fewer claims for disability and unemployment insurance due to untreated mental illnesses. Psychiatric disorders are the most frequent cause of disability and lost work productivity among working adults. Working people with a depressive or anxiety disorder miss at least twice as many days of work due to illness as those without.
In a February 2006 interview for Employee Benefit News, Helen Darling, president of the National Business Group on Health, notes, “Mental health and substance abuse disorders currently cost U.S. employers billions of dollars annually in lost worker productivity. All will
3
WASHINGTON COALITION FOR INSURANCE PARITYAnswers to Commission Questions
benefit if we reduce the terrible burden of depression and other serious mental health problems that sap strength, productivity and a decent quality of life out of employees and their families.”
Echoing the National Business Group on Health’s comment relating to lost productivity, the Institute of Medicine’s 2006 Quality Chasm Series reported: “Indeed, workers with depression have been found to lose 5.6 hours a week of productivity as compared to 1.5 for workers without depression.”
Question 5: How does your proposal reflect collaboration among various stakeholders? Which stake holders have endorsed it?
The proposal to expand mental health parity is supported by 145 organizations of the Wash-ington Coalition for Insurance Parity. (Please see the coalition’s attached membership list.) These organizations represent a broad cross-section of the community, including consumer groups; non-profit organizations; hospitals, physicians, nurses, and other providers; labor unions; an insurance provider; trial lawyers; several businesses; religious organizations; and local governments.
Mental health parity also has broad statewide and nationwide support. A January 2005 poll of 750 likely voters in Washington State showed that 86 percent of them supported mental health parity, while 79 percent of those polled supported parity even if they would experience an increase (less than one percent) in premiums. In 2002, a poll by the National Mental Health Association showed that an overwhelming majority of Americans (79 percent) supported parity legislation, even if it resulted in an increase in their health insurance premiums.
Question 6: What are the obstacles to implementing your proposal? Who will object to it and why? How do you suggest these objections be addressed?
While many small businesses support the coalition’s proposal to expand mental health parity, the coalition believes small business associations would oppose the expansion. Some health insurance companies would also oppose expansion of the parity law. The opposition falsely claims that parity would increase premiums between five and 10 percent. The opposition has yet to produce any study confirming their allegations.
When making a decision on mental health parity, the coalition respectfully urges the Blue Ribbon Commission to follow the overwhelming amount of research, experience, and studies that support parity. Numerous experts cite extensive research supporting the fact that parity does not cost too much, and it actually saves money. Most important, mental health parity is simply the right thing to do!
4
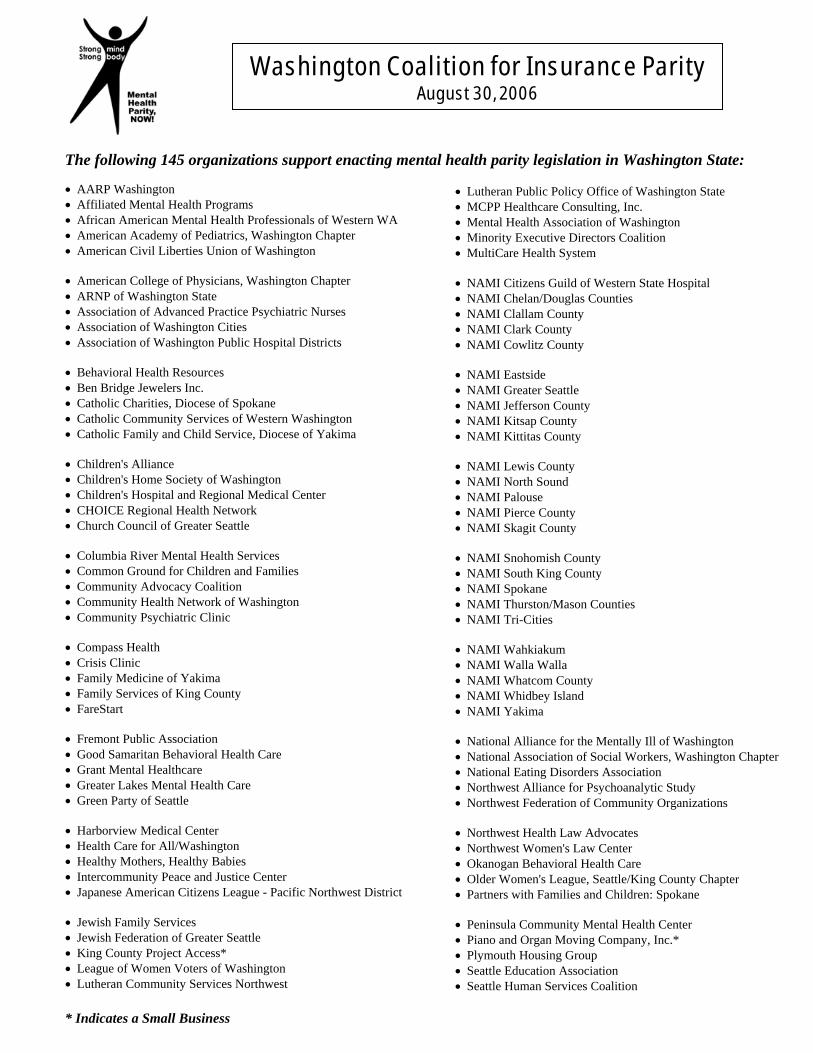
* Indicates a Small Business
Washington Coalition for Insurance Parity August 30, 2006
The following 145 organizations support enacting mental health parity legislation in Washington State:
AARP Washington Affiliated Mental Health Programs African American Mental Health Professionals of Western WA American Academy of Pediatrics, Washington Chapter American Civil Liberties Union of Washington
American College of Physicians, Washington Chapter ARNP of Washington State Association of Advanced Practice Psychiatric Nurses Association of Washington Cities Association of Washington Public Hospital Districts
Behavioral Health Resources Ben Bridge Jewelers Inc. Catholic Charities, Diocese of Spokane Catholic Community Services of Western Washington Catholic Family and Child Service, Diocese of Yakima
Children's Alliance Children's Home Society of Washington Children's Hospital and Regional Medical Center CHOICE Regional Health Network Church Council of Greater Seattle
Columbia River Mental Health Services Common Ground for Children and Families Community Advocacy Coalition Community Health Network of Washington Community Psychiatric Clinic
Compass Health Crisis Clinic Family Medicine of Yakima Family Services of King County FareStart
Fremont Public Association Good Samaritan Behavioral Health Care Grant Mental Healthcare Greater Lakes Mental Health Care Green Party of Seattle
Harborview Medical Center Health Care for All/Washington Healthy Mothers, Healthy Babies Intercommunity Peace and Justice Center Japanese American Citizens League - Pacific Northwest District
Jewish Family Services Jewish Federation of Greater Seattle King County Project Access* League of Women Voters of Washington Lutheran Community Services Northwest
Lutheran Public Policy Office of Washington State MCPP Healthcare Consulting, Inc. Mental Health Association of Washington Minority Executive Directors Coalition MultiCare Health System
NAMI Citizens Guild of Western State Hospital NAMI Chelan/Douglas Counties NAMI Clallam County NAMI Clark County NAMI Cowlitz County
NAMI Eastside NAMI Greater Seattle NAMI Jefferson County NAMI Kitsap County NAMI Kittitas County
NAMI Lewis County NAMI North Sound NAMI Palouse NAMI Pierce County NAMI Skagit County
NAMI Snohomish County NAMI South King County NAMI Spokane NAMI Thurston/Mason Counties NAMI Tri-Cities
NAMI Wahkiakum NAMI Walla Walla NAMI Whatcom County NAMI Whidbey Island NAMI Yakima
National Alliance for the Mentally Ill of Washington National Association of Social Workers, Washington Chapter National Eating Disorders Association Northwest Alliance for Psychoanalytic Study Northwest Federation of Community Organizations
Northwest Health Law Advocates Northwest Women's Law Center Okanogan Behavioral Health Care Older Women's League, Seattle/King County Chapter Partners with Families and Children: Spokane
Peninsula Community Mental Health Center Piano and Organ Moving Company, Inc.* Plymouth Housing Group Seattle Education Association Seattle Human Services Coalition
Seattle Mental Health Seattle Psychoanalytic Society and Institute Senior Citizen’s Lobby Senior Services of Seattle/King County Service Employees International Union/1199NW
Snohomish County Labor Council, AFL-CIO Sprague-Israel-Giles, Inc.* Tacoma Area Coalition of Individuals with Disabilities (TACID) Timberlands Regional Support Network (RSN) Timberlands RSN Advisory Board
Transitional Resources Valley Cities Counseling/Consultation Volunteers of America, Spokane Washington Academy of Family Physicians Washington Academy of Physician Assistants
Washington Association for Marriage and Family Therapy Washington Association for Substance Abuse and Violence Prevention Washington Association of Area Agencies on Aging Washington Association of Churches Washington Association of Community/ Migrant Health Centers
Washington Citizen Action Washington Community Mental Health Council Washington Federation of State Employees Washington Food Coalition Washington Health Care Association
Washington Health Foundation Washington Mental Health Counselors Association Washington Protection and Advocacy System Washington Public Employees Association Washington Re-Education Association
Washington State Association of Counties Washington State Catholic Conference Washington State Coalition of Mental Health Professionals/Consumers Washington State Council of Child and Adolescent Psychiatrists Washington State Council on Aging
Washington State Developmental Disabilities Council Washington State Hospital Association Washington State Labor Council, AFL-CIO Washington State Medical Association Washington State Nurses Association
Washington State Parent Teacher Association Washington State Partners in Crisis Washington State Pharmacy Association Washington State Psychiatric Association Washington State Psychological Association
Washington State Public Health Association Washington State Society for Clinical Social Work Washington State Special Education Coalition Washington State Tourette Syndrome Association Washington State Trial Lawyers Association
* Indicates a Small Business
Whatcom Counseling and Psychiatric Clinic Wyeth Pharmaceuticals Yakima County Health Care Coalition YFA Connections Youth Suicide Prevention Program
Washington Coalition for Insurance Parity (206) 216-2545 [email protected] www.paritywa.org

Tab 56
August 22, 2006
Comments for the Blue Ribbon Commission on Health Care Costs and AccessTracy Garland President & CEO, Washington Dental Service Foundation
Thank you for the opportunity to provide input regarding how to develop a health care system that provides every Washingtonian the ability to obtain needed health care at an affordable price.I attended the Blue Ribbon Commission meetings on June 22 and July 27, and I want to reiterate the importance of including oral health in your work. Oral disease is a major health problem in our state, and prevention and early treatment needs to be an integral part of any effort to address health care access and affordability.
The Washington Dental Service Foundation is the state’s largest foundation dedicated to improving oral health. We support innovative oral health programs focused on preventing oral disease, expanding access to dental care and increasing awareness of the importance of oral health.
Despite the fact that it is almost entirely preventable, dental disease is a serious and growing problem in our state. It affects all ages, harming the health of seniors and the ability of children to do well in school; it even affects the readiness of our soldiers. Consider the following:
About 30 percent of Washington’s National guardsmen called to active duty had dental problems so severe they could not be sent overseas.
A recent state study found that the rates of decay among children are increasing. Forty-five percent of preschool children and 60 percent of elementary school children have decay, numbers that are higher than the national average.
Between 2002 and 2004, Children’s Hospital and Regional Medical Center experienced an astonishing 54 percent increase in the number of children seeking expensive emergency room care for problems that started with dental cavities — cavities that could have been prevented.
Nearly one-third of seniors (about 218,000 in our state) have untreated dental cavities.
Oral disease can be intensely painful, costly and lead to other serious health problems. There is also a significant cost to society in terms of higher health care expenses, reduced productivity, and missed school and opportunities for children. It is well documented that poor oral health interferes with early childhood development and learning.
It is much more expensive for families — and taxpayers — to pay for dental disease treatment than to pay for prevention. Annually more than $50 million is spent in this state treating children for oral disease. Medicaid accounts for about half of this spending. If you add adults
and especially seniors to the equation, the costs become enormous. Many of these costs could be avoided if prevention and early treatment were higher priorities.
2007 policies
There are several policies that can be adopted in 2007 to prevent dental decay and improve access to dental care.
We should engage more primary care medical providers to provide preventive dental care services during well-child checkups. This intervention will catch at-risk kids early when the opportunity for prevention is greatest. The evidence shows this approach is cost effective because typically primary care providers see a child about eight times for well-child exams before a child’s fist visit to the dentist.
We must ensure more people receive the health benefits of fluoridated water. Almost half of Washington residents do not have fluoridated water, even though 60 years of evidence proves it is a safe and effective way to prevent oral disease. More than 170 million Americans drink fluoridated water every day. Studies have shown that every dollar spent on fluoridation saves about $140 in dental care costs.
We should devote more resources to seniors’ oral health. Dental disease is linked to diabetes, heart disease and stroke. Increasing access to preventive and restorative dental care will help keep seniors healthy and reduce overall health care costs.
We need to address disparities in health care by adopting approaches that encourage ethnic minorities to pursue health care careers. A diversified workforce is essential to improve oral health in minority communities.
We need to take action to encourage good nutrition. In addition to causing obesity, today’s sugar-filled diet today is a major contributor to the decline in children’s oral health. The state needs to examine its policies to make certain they do not inadvertently encourage poor nutrition, which leads to dental decay.
Five-year vision
In five years we can significantly reduce dental disease among children and seniors and improve oral health in Washington. The five-year vision should accomplish the following:
Dental disease prevention is identified as an important health priority.By 2010 all kids are covered for dental preventive services and early treatment. Workforce diversity is increased improving access for underserved populations. Dental care is easily accessible and delivered in a culturally competent manner in dental, medical and community settings.Dental, medical and community providers are appropriately reimbursed for delivering cost-effective prevention services.Seniors receive comprehensive preventive and restorative care. State policies reflect and reinforce the importance of good nutrition.
These are simple steps that can and should be taken to protect the oral health of Washington residents. When we make oral disease prevention a priority in this state, the health dividends and cost-savings will be significant.
We look forward to working with the Blue Ribbon Commission and others to address this important health issue.
Sincerely,
Tracy E. Garland President & CEO Washington Dental Service Foundation (206) 528-7388 [email protected]

Tab 57
Washington Fair Share Health Care Coalition
PROPOSAL TO WA State Labor Council WA Community Action WA for Health Care UFCW International Union SEIU State Council WA Federation of State Employees Brown & Cole Corporation Joseph & Associates, P.S. WA State Hospital Association Community Health Network of WA WA State Chapter NOW Don Barbieri, Chairman of the Board, Red Lion Hotels (affiliation noted for identification purposes only) Terry Gardiner, Former CEO, Norquist Seafood Western Council of Industrial Workers WA Society for Clinical Social Work Spokane Alliance Lutheran Policy Office of WA Planned Parenthood Affiliates of WA IUPAT District Council #5 Laborers District Council WA Machinists Council Teamsters Joint Council #28 Center for a Changing Workforce AFT Washington WA Building & Construction Trades Council Labor Roundtable of SW WA UNITE/HERE #8 SPEEA/IFPTE #2001 WA Alliance for Retired Americans Pierce County CLC UFCW, WA State Council WA Senior Lobby WA State NOW Snohomish County LC, AFL-CIO League of Women Voters of WA River Run Venture, LLC BLET/WA State Legislative Board USNU/UFCW #141 UFCW #21 UFCW #44 UFCW #81 UFCW #1439 WPEA/UFCW #365 CWA State Council Sheet Metal Workers #66 IUOE #612 Pacific NW DC of Iron Workers Cowlitz/Wahkiakum CLC Longview/Kelso BCTC ATU Legislative Council ATU #587 ATU #757 ATU #758 ATU #843 ATU#1015 ATU #1576 Laborers #276 Roofers #153 SEIU #775 SEIU #925 SEIU #1199NW IFPTE #17 NW Women’s Law Center
THE BLUE RIBBON COMMISSION ON HEALTH CARE COST AND ACCESS
FROM THE FAIR SHARE COALITION August 30, 2006
Introduction This proposal was developed by the organizations of the Fair Share Coalition of Washington, which includes major health care provider, labor, community, faith-based, and senior citizen organizations. This proposal is different in part from the Coalition’s 2006 legislative proposals; addresses the goals developed by the Blue Ribbon Commission; and is based on existing programs.
Proposal Overview: This proposal is based on the desire of the people of Washington to be healthy and to have a high-quality health care system in which affordable health services are available for everyone. We want a health care system that prepares the next generation for school and allows us to lead productive lives. We want people to take responsibility to improve their own health and to pay what they can reasonably afford to support their health services. We support the present goal of all children having health coverage and achieving that goal by 2008. In addition, health care coverage of adults should be expanded using current effective and proven health care programs.
Proposal Outline The major goals of this proposal are 1) to provide coverage for all Washington residents; 2) share health care costs equitably across government, employers, and individuals; 3) increase access to health care for low-income residents; 4) create high-value health care outcomes; 5) increase financial security for state residents.
Fair Share Plan Coverage Elements: Expanding the Basic Health Plan and Medicaid to cover all uninsured residents under 300% of FPL by 2010. Providing coverage for all children beginning in 2008. Expanding the Small Employer Health Insurance Partnership (SEHIP) to cover employees up to 300% of FPL by 2010, to reduce economic impact of health care costs on small businesses.
314 First Avenue West, Seattle, WA 98119 (206) 281-8901 FAX (206) 285-5805 www.wslc.org
Washington Fair Share Health Care Coalition - Blue Ribbon Commission Proposal August 30, 2006 Page 2
Giving larger employers a choice of providing employee health insurance coverage or contributing to the cost of covering employees through state plans. Combining the private health insurance market pools for individuals, small business and association health plan coverage, and create a reinsurance market for the combined pool. Improving benefit design to include a core group of primary, preventive, emergency, catastrophic, mental health, dental and chronic care services, and maintaining or improving benefits in existing public programs. Implementing existing legislative action plans to reduce health care disparities based on race and ethnicity.
Fair Share Plan Financing Elements: Require uninsured individuals and families below 300% of FPL to contribute to the cost of health insurance on a sliding-scale basis at affordable levels. Self-employed individuals above 300% FPL must purchase insurance coverage, (provided the state certifies that affordable plans are available.) The state will ensure quality affordable health plans are available through regulatory oversight or by expanding existing public health plans to accommodate these people. Cost sharing levels in existing public programs should not be increased. Larger employers have choice of providing insurance coverage or paying a sliding scale premium tax based on employer size, phased in by 2010. This feature is necessary to end cost-shifting by and public subsidization of some large employers.
Fair Share Plan Quality/Cost Control/Access Elements: Create risk-adjusted value-based outcomes/results reporting and tracking for all providers and insurers. Establish or use an existing independent and trusted group to collect, monitor and distribute the data. Encourage or model innovative benefit design with chronic care/disease management coverage. Ensure transparent pricing of health care services, with episode and care-cycle pricing and limits on pricing discrimination. Build incentives into all public programs that incentivize best practices. Link provider pay increases to commitments to expand access and increases in quality. Public/private Cost/Quality Oversight Commission, with representatives from government, business, labor and consumers, to implement cost control and quality measures, including recommendations from Certificate of Need (CON) Task Force.
Proposal Narrative
The Fair Share proposal expands the current employer-based health insurance system, using the existing Medicaid and the Basic Health Plan to initially cover all children by 2008; to cover uninsured employees and other residents, with coverage phased in by 2010; and expanding the Small Employer Health Insurance Partnership, to reduce the economic impact of health care costs on small businesses with low-wage workers, with coverage also phased in by 2010. The proposal would also assist small business by creating a common health insurance risk pool for small business, associations and individuals, followed by creation of a reinsurance mechanism for the combined market. The proposal calls for a minimum level of coverage for state residents, to include basic primary, preventive, emergency, catastrophic, mental health, dental and chronic care services.
To finance the expansion of coverage, the Fair Share proposal envisions contributions from government, employers, and individuals. Individuals would contribute on sliding-scale basis below 300% of FPL at affordable
Washington Fair Share Health Care Coalition - Blue Ribbon Commission Proposal August 30, 2006 Page 3
levels, considering their limited income. To reduce cost shifting from uninsured individuals who can afford insurance, individuals over 300% of FPL would be required to purchase coverage, provided that the state certifies that affordable coverage is available. To reduce cost-shifting and public subsidy of large employers, these employers who choose not to provide insurance to some or all employees would be given a choice of contributing to the state’s health care purchasing fund, using a sliding-scale payroll tax based on size of employer.
The Fair Share Coalition seeks to improve health care quality and value in part using proposals from a recent Harvard Business School book by Michael Porter and Elizabeth Teisberg, “Redefining Health Care: Creating Value-Based Competition on Results” (HBS 2006). Porter and Teisberg propose encouraging providers and insurers to compete on the basis of value (as measured by health outcome per dollar spent). The key to competing on value is to measure risk-adjusted health outcomes, and make this information available to consumers, employers, insurers, and government. This builds on current efforts to promote evidence-based practice guidelines and health outcomes data by the Puget Sound Alliance and similar efforts. We believe state government can play a critical role in setting standards for measurement, and requiring providers and insurers to collect and disseminate this information.
To further expand value-based competition, purchasers need transparent pricing information, including prices for episodic and cycle-of-care costs, and some protection from the current price discrimination that currently benefits only the largest health care purchasers.
Plan designs and coverage should be modified to cover chronic care and disease management services, to encourage consumers to seek needed care and allow providers to intervene appropriately, while reducing hospitalization and overall costs. On the provider side, we need incentives in all public programs that incentivize best practices, including linking provider pay increases to commitments to expand access and increases in quality. Residents who take steps to improve personal health should also be rewarded through financial incentives in plan design and out-of-pocket costs.
Finally, to implement this legislation, Washington needs an ongoing public/private Cost/Quality Oversight Commission, with representatives from employers, labor, government and consumers. Such a Commission would set and review standards for coverage, financing, data collection and dissemination, and implement the recommendations of the Certificate of Need (CON) Task Force for a strategic health planning process.
Responses to Commission Questions
1. The proposal realizes the Commission’s vision by providing access for all residents, making significant changes in benefit design and outcomes measurement to ensure residents get “needed” care as currently defined, and will significantly reduce costs from projected levels through provider and insurer competition based on value, transparent pricing, reduced cost-shifting, and better disease management.
2. The proposal enhances the chances of achieving the Commission’s goals by providing a realistic path, using existing state programs, broad-based financing mechanisms, and existing health improvement plans. More specifically:
a. Goal 1. Provides phased in access for all residents by 2010. Provides for effective care by developing system of health outcomes reporting and chronic care management.
b. Goal 2. Moves Washington towards leading the nation in health by covering chronic care, by rewarding providers of superior care, by promoting practice guidelines, and by providing incentives for state residents to improve their health.
Washington Fair Share Health Care Coalition - Blue Ribbon Commission Proposal August 30, 2006 Page 4
c. Goal 3. Delivers more consistent health indicators by implementing existing action plans to reduce disparities based on race and ethnicity, and by providing affordable access to primary, preventive and chronic care for low-income residents.
d. Goal 4. Incorporates evidence-based medicine and calls for value-based competition among providers and plans, using risk-adjusted outcomes data.
e. Goal 5. Strategy of value-based competition combined with state oversight provides best model for controlling cost increases, along with promotion of evidence-based medicine, chronic care management, transparent pricing, and establishing a strategic health planning process, including a more effective certificate of need process.
3. The Fair Share proposal is based on the existing Medicaid, Basic Health Plan, Puget Sound Alliance, and Certificate of Need task force recommendations. These programs all have a track record of increasing health care access, improving quality, or reducing costs. The proposal for equitable sharing of employer costs shares features with Hawaii’s employer-based health insurance system, which has reduced cost-shifting and increased access.
4. The proposal would share costs of an effective state health care system equitably among individuals, employers and government. These costs would be phased in by 2010. The employer share of these costs would be less than large employers currently pay for employee health insurance, adjusted for medical inflation. The individual share would based on a sliding scale for low-wage workers, and would be less than the current trend line for employee contributions to health insurance, adjusted for medical inflation. For employers who currently provide insurance to most employees, there will be significant savings, not the least of which would be a savings of 25-30% in the share of premiums currently going to uncompensated care. Some of the initial cost to employers not currently providing insurance would be offset by quality improvements and reductions in unneeded health care expenses. The proposal's costs also could be subsidized from federal grants and assistance available to states for innovative health care reforms, if the Health Partnership Act (S.2772) or similar legislation passes in the next session of Congress.
5. This proposal reflects significant collaboration among a large number of participants, including major health care providers, business leaders, unions representing nearly half a million employees, consumer organizations, and others. The proposal was developed over the past six months, the result of numerous meetings, conferences and discussions. This proposal is endorsed by the Fair Share Coalition, which includes the organizations on the attached list.
6. Possible obstacles and responses:
a. The proposal may result in a challenge of the employer choice standards to the federal courts. Any state proposal that includes an employer role may face a legal challenge. It is possible that financing and risk-sharing components may need to be adjusted by future legislative action, depending on federal court action.
b. Some organizations will object to any proposal that includes an employer financing component. The response is that employer participation is necessary to equitably finance health care, to reduce cost-shifting, and to ensure a level playing field between similar sized employers.
c. Some individuals will object to any provision that requires individuals above 300% of FPL to purchase health insurance. The response would be that this provision is essential to prevent cost-
Washington Fair Share Health Care Coalition - Blue Ribbon Commission Proposal August 30, 2006 Page 5
shifting between individuals who can afford health insurance and other purchasers. Individuals would be protected by a state guarantee that such coverage must be affordable.
d. The proposal is subject to changes in Medicaid funding by the federal government. The extent of state funding for health insurance coverage may need to be adjusted by future legislative action, depending on federal legislative action.
e. Some insurers and employers will object to creating a pool in the private insurance market for individuals, small businesses and association plans. The response is that pooling risk and creating a reinsurance mechanism is necessary to make insurance more affordable for many small businesses, older individuals, people with chronic conditions, and families.
f. Some providers and insurers will object to collecting and disseminating risk-adjusted health outcomes data. The response is that results-based competition between providers and insurers won’t work without providing accurate outcomes data to purchasers, and feedback to providers and insurers.
g. Some providers and insurers might object to encouraging value-based competition. The response is that the current competition serves only to shift costs, get more bargaining power, and limit services.
h. Some purchasers and insurers might object to the concept of a Cost/Quality Oversight Commission. The response is that some entity must set the ground rules and make policy adjustments for outcomes data standards, for effective competition, including ensuring transparent pricing, improving benefit design, and implementing a strategic health planning process with input from all purchasers.
The Fair Share Coalition looks forward to working with the Blue Ribbon Commission in meeting its goal of providing needed health care at an affordable price. If we can be of assistance, please contact us.

Tab 58
PROPOSAL TO THE BLUE RIBBON COMMISSION
THE WASHINGTON HEALTH FOUNDATION PROPOSAL:
As the architect and administrator of Washington’s Healthiest State in the Nation Campaign, the Washington Health Foundation (WHF) proposes to work with the Blue Ribbon Commission to advance health and health care. Specifically, we are proposing:
1. To use our Healthiest State Report Card database to help identify measures that offer the greatest potential to improve Washington’s health so that we move into the Top 10 in state health rankings over the next 5 years;
2. To partner with the Blue Ribbon Commission on our long term plans to educate consumers about the health system and their need to take personal responsibility for their health (e.g., in the upcoming Governor’s Community Health Bowl, televised health tips, radio and print publications, health advice to our 23,000 and growing individual Champion list, our website’s free personal health tracking system for use by Washingtonians, etc.);
3. To incorporate specific prevention messages into the Governor’s Community Health Bowl based on areas that the Blue Ribbon Commission would like to prioritize (through paid media, earned media, our website and materials, thrive!magazine, etc.);
4. To provide advice or further analysis on priority issues or specific ideas identified by the Blue Ribbon Commission, including the identified Top 10 health targets, specific policy proposals regarding how to achieve universal access to coverage and care in our state, or specific approaches for incorporating evidence-based medicine into state health strategies.
Our shared goals include: To move Washington from #14 into the Top Ten in state health rankings;To see that all Washingtonians have access to health coverage that provides effective care, with all children having such coverage by 2010; and To see that key health indicators are consistent across race, gender and income levels throughout the state.
The Healthiest State in the Nation Campaign sets forth a broad and balanced set of proposals that echo many of the State’s interests as articulated through the State’s Priorities in Government measures. (Please see Comparison Matrix below.)
States like Massachusetts have demonstrated that progress in health and health care can be made when diverse interests and political philosophies find common ground. We believe a similar approach in Washington State can result in the collaborative effort required to create effective change in health and health care.
Our view regarding health care costs is similar to the Commission’s in that we believe universal access to needed care and significant health improvement should be achieved without increasing total health care spending per person more rapidly than the growth in personal income. We agree that this can be achieved in part, by increasing the use of evidence-based care to bring better health outcomes and satisfaction to consumers. What is more, we believe health care financing reform is essential to enable state government to increase investment in non-health care spending that holds even greater promise for improving our state’s health. Such investments include public health infrastructure, early learning and basic education.
WHF’s attached 2006 Report Card on Washington’s Health summarizes the action areas our Campaign is using to measure progress toward becoming the Healthiest State in the Nation. The Circle of Health portrays the message that building Healthy Systems and promoting Healthy Living are the keys to health improvement. WHF developed this by working directly with the people of Washington from 2001-2003. WHF heard time and again that the public wanted a comprehensive solution to health problems that embraced both the need to address our social systems for health and the need for greater responsibility on the part of individuals.
Within Healthy Systems and Healthy Living, WHF defined a set of action areas to explain how Washington could become healthier. The following action areas are included in the Circle of Health: Promoting Community Health, Investing in Prevention, Increasing Value in Health Services, Protecting Against Injury and Disease, Avoiding Addictions, and Engaging in Healthy Habits. These action areas within WHF’s Circle of Health are a guide to WHF and to our more than 550 Participating Organizations for how Washington can become the Healthiest State in the Nation. The Circle of Health also frames our own strategic intent and application of resources in terms of programs, grants and policy leadership.
But to make these improvements real and lasting we must “go to the next level” – using specific health measures. So WHF constructed a measurement system for our Circle of Health. At the big picture level, we used the United Health Foundation’s annual publication of state health to determine our current state rank, though now WHF’s own 2006 Report Card provides an alternative for making this determination.
More important for this proposal, WHF has selected a series of measures within our action areas that can be measured over time. The attached draft 2006 Report Cardidentifies the 12 measures. For each, it provides the current numbers and state ranks. Note that many of the measures relate strongly to measures used by others in the state, including the Washington State Department of Health. One important difference is that WHF’s measures were selected because of the need to make comparisons to other states, rather than at the county and local public health jurisdiction level. The 2006 Report Cardhas been distributed throughout the state in draft form since May, and we believe it has proven to be a solid analytical approach for measuring Washington’s health relative to other states.
While the core message of the Healthiest State in the Nation Campaign is one of action (designed to bring our now more than 550 Participating Organizations and 23,000 individuals into doing their part to make Washington a healthier state), a strong analytical base helps to leverage our work. The database for our 2006 Report Card was designed to allow “what if” propositions to be tested to tell us how certain changes to programs, policies, timelines and resources might improve our measures.
The Executive Summary of the draft 2006 Report Card offers what WHF considers a fruitful and achievable proposal to attain a top ten ranking for Washington State. Washington could advance into the Top 10 by:
covering all our children for health care;increasing our rate of children’s immunization (now #42);increasing our rate of timely prenatal care (now #37); increasing our rate of timely mammography (now #35); increasing public health system investment (now #44); increasing high school graduation rates (now #35); andreducing binge drinking (now #20).
One key objective under this scenario is to increase Washington’s public health investments to the national average. This includes investments in infectious disease control (including HIV treatment and prevention), food and water safety, maternal and child health, immunizations, mental health, substance abuse, and community health center services. To our state’s credit, some such increased investments have recently been made. Investments in mental health, for example, were made during the last legislative session but are not yet reflected in our data. Investments in public health preparedness for avian flu were also made, but have also not yet been included.
If the Commission would like to explore the impact of other health improvement scenarios to move our state into the Top 10 in state health rankings, WHF is willing to assist. In addition, WHF stands ready to work with the Commission in developing a set of action strategies to achieve these ends. To make real progress we believe an effective long term health improvement effort will require a variety of policy, programmatic and personal behavior change strategies. Some WHF might lead. For others, WHF might enlist the help of our Participating Organizations. Still others might be achieved solely by action by the Blue Ribbon Commission.
Our goal is that this proposal initiates a dialogue between the WHF and the Commission. To that end, we are fortunate that among the members of our Policy Advisory Council is Christina Hulet, Health Advisor to Governor Gregoire and staff to the Commission. Her active engagement in our deliberations holds the promise of expanding and deepening this dialogue. We hope she, on behalf of the Commission or the Commission members themselves, will let us know any specific topics within our broad areas of agreement they believe would be most beneficial for us to develop first. As we finalize our own policy agenda for 2007, we plan to deliver more detailed recommendations later this fall, if not in time for the Commission’s very ambitious timeline, then at least in time for the state’s consideration during the 2007 legislative session.
While there may be other groups or government agencies that are better positioned to work on particular action areas or issues in health or health care, our Healthiest State in the Nation Campaign has already created the potential for a new and broad base of public-private support and action. Since we view the Blue Ribbon Commission as an important part of moving to achieve the Healthiest State aims based on your Vision
Statement & Goals, we would be interested in exploring further your ideas for a direct link to our work.
IMPACT ON THE VISION AND GOALS OF THE COMMISSION
Rather than identify a specific policy or program proposal at this time, we offer the example discussed above, and propose working with you to discern the specific possibilities associated with the Commission’s Vision Statement & Goals statement that “Washington will be one of the top ten healthiest states in the nation.” WHF’s work and proposal also relate strongly to other points in the Improving Health section of your vision statement. The elimination of health disparities is a core and cross-cutting issue in our Campaign. We understand it to be a shared focus with the Commission which identifies the goal: “Population health indicators will be consistent across race, gender and income levels throughout the state.” Also note that while WHF guides action through process measures, our 2006 Report Card includes a strong outcome approach to health. Last but not least, the individual Champions we are recruiting to join the Campaign, backed up by our multiple year effort to understand public values and attitudes regarding health and health care, (through polling, focus groups, and community roundtable meetings across the state) provide an excellent means to test whether Commission approaches truly offer “satisfaction to consumers.”
IS THIS MODELED AFTER ANOTHER PROGRAM?
Our research indicates that the scope and design of the Healthiest State in the Nation Campaign program are unique. While there are other states that have stated - through both private and public organizations and leaders - that they want to be the “healthiest state in the nation,” no other program exists with the breadth of our efforts. In particular, there is no other program that aims to educate and engage the public in such an effort, let alone link this to the Healthy Systems and personal responsibility that are necessary to really improve health outcomes.
A multitude of private and public organizations are working on specific projects or studies on topics within our areas of action and measures. Their programs are in many cases more robust than what WHF may offer in specific action areas, measures or issues.
Our goal has been to include these organizations in our Campaign to recognize this work and provide it even greater value as part of a more comprehensive effort; many have already chosen to create this linkage and are part of our more than 550 Participating Organizations.
An important counterpart and relationship with respect to our work is the State Department of Health and the Public Health Improvement Partnership. Many of our measures, though not all, are part of their fine work to improve health. Again, our intent
has been to connect our work to theirs, through both a partnership with DOH and our active involvement and support of PHIP.
WHF is also beginning to work with other states who are initiating Healthiest State in the Nation efforts. We believe this is an important part of the potential of our Campaign; that is, the potential for competition among states that will lead to a race to the top of health rankings, rather than a race to the bottom on issues that are framed purely around cost.
COSTS TO INDIVIDUALS, BUSINESSES OR GOVERNMENT
While the Healthiest State Campaign does cost money to operate, WHF is currently financing the vast majority of this effort through our own reserves. We anticipate, at a minimum, continuing this Campaign at a very active level for three years through our reserves. We are fundraising to extend this timeline and to expand our activities.
WHF is offering to do the basic work described above through our current budgets, i.e., “what if” modeling for the Commission through our 2006 Report Card database and working with the Commission to identify key target areas for improvement in the next five years. If the Commission were interested in a more extensive analysis on these matters, or organizing specific reports, meetings, or action programs, WHF would request funding support for these.
From a broader point of view, you should note that our framework presumes that we can advance health in this state by reallocating current resources rather than finding new money. To this extent, we find generally common ground with the Commission’s goal of holding health care spending increases to the rate of increase personal income. This WHF system change value comes from our Community Roundtables and Health Leadership Summit of 2003. Our core values, based on public dialogue and voting by more than 400 leaders at our Summit states that Washington should: assure fairness to a redesigned health system through reallocation of existing health resources.
Thus, at a basic level, WHF’s view is that investments and improvements in health can be achieved by reprioritizing and shifting the use of current public, private and personal resources rather than additional costs. The only way to achieve this is over a multiple-year time period of at least five years, and this is part of our interest in the Blue Ribbon Commission. WHF is also working with our Policy Advisory Council on the principles of what a state budget would look like based on becoming the Healthiest State in the Nation - both growth of current health expenditures and general areas of investment of savings over time to a “redesigned health system.”
COLLABORATION AMONG VARIOUS STAKEHOLDERS
WHF’s fundamental strategic intent has been to create a new community of action around an area of agreement for the leaders, organizations and people of Washington: that we can, and should be, the Healthiest State in the Nation. This began in 2004 as a vision proposition, but has over the past 18 months moved to more actionable levels through inviting organizations and individuals to join the Healthiest State Campaign. WHF has already created the largest civic engagement project for health in our state’s history, with the involvement of more than 550 Participating Organizations, 125 schools, and 23,000 individuals. And the Campaign is still growing.
Our 550 Participating Organizations includes representation from all major sectors engaged in health, including health providers, government, private non-profit organizations, business, labor, community organizations, schools, public health and more.Over 150 of these organizations are not only participating, but deeply engaged in our Campaign, which provides a strong collaborative base for action.
Key Leading and Contributing Partners in the Campaign, who are providing explicit resources to the Campaign (cash or in-kind) include:
American Heart Association/American Stroke Association Association of Washington Public Hospital Districts AstraZeneca Children’s Hospital & Regional Medical Center Comprehensive Health Education Foundation First Choice Health Network Greater Seattle Chamber of Commerce Group Health Cooperative Multicare Health System Phrma-Rx Help for Washington Providence Health System- Washington Region Service Employees International Union District 1199NW Swedish Medical Center University of Washington, including UW Medicine Washington State Department of Health Washington State Health Care Authority Washington State Hospital Association Washington State Medical Association Washington State Nurses Association Washington State Pharmacy Association
Uniquely, WHF has set out to ensure the public is directly and substantively involved in our efforts. While this is a long term proposition to build, we intend to do this through far more than a consumer advisory committee. Rather, we are recruiting individual Champions to join the Campaign. To date, we have recruited over 23,000 Washingtonians into the Campaign, and our target for this year is 50,000. We expect this
will give us a representative base to work directly with the public, even as we recruit more into the Campaign.
OBSTACLES
While there are many challenges to making the Healthiest State in the Nation Campaign a success, the major obstacle to our specific proposal is the suggestion that WHF should set our sights on more simple and “achievable” targets. We believe that this is part of the reason our health system is where it is today - a tendency toward too many incremental programmatic efforts that attack specific issues and problems at the unwitting expense of further fragmentation and loss of effectiveness for the overall health system. While we applaud and support many of these efforts, it is imperative for our state, through a blend of public and private leadership, to keep its eye on the prize - and to state this as the outcome of better health, indeed, making Washington the Healthiest State in the Nation.
Greg Vigdor President & CEO Washington Health Foundation 300 Elliott Avenue W. Seattle, WA 98119 (206)[email protected]
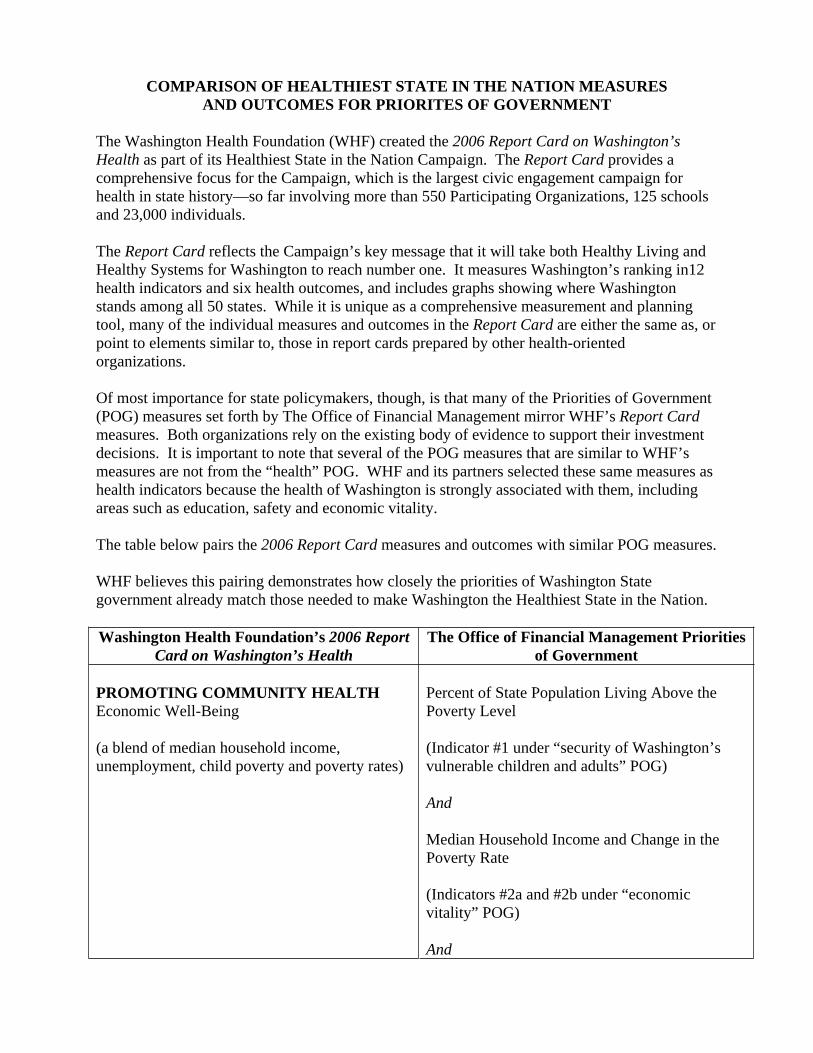
COMPARISON OF HEALTHIEST STATE IN THE NATION MEASURES AND OUTCOMES FOR PRIORITES OF GOVERNMENT
The Washington Health Foundation (WHF) created the 2006 Report Card on Washington’s Health as part of its Healthiest State in the Nation Campaign. The Report Card provides a comprehensive focus for the Campaign, which is the largest civic engagement campaign for health in state history—so far involving more than 550 Participating Organizations, 125 schools and 23,000 individuals.
The Report Card reflects the Campaign’s key message that it will take both Healthy Living and Healthy Systems for Washington to reach number one. It measures Washington’s ranking in12 health indicators and six health outcomes, and includes graphs showing where Washington stands among all 50 states. While it is unique as a comprehensive measurement and planning tool, many of the individual measures and outcomes in the Report Card are either the same as, or point to elements similar to, those in report cards prepared by other health-oriented organizations.
Of most importance for state policymakers, though, is that many of the Priorities of Government (POG) measures set forth by The Office of Financial Management mirror WHF’s Report Cardmeasures. Both organizations rely on the existing body of evidence to support their investment decisions. It is important to note that several of the POG measures that are similar to WHF’s measures are not from the “health” POG. WHF and its partners selected these same measures as health indicators because the health of Washington is strongly associated with them, including areas such as education, safety and economic vitality.
The table below pairs the 2006 Report Card measures and outcomes with similar POG measures.
WHF believes this pairing demonstrates how closely the priorities of Washington State government already match those needed to make Washington the Healthiest State in the Nation.
Washington Health Foundation’s 2006 Report Card on Washington’s Health
The Office of Financial Management Priorities of Government
PROMOTING COMMUNITY HEALTH Economic Well-Being
(a blend of median household income, unemployment, child poverty and poverty rates)
Percent of State Population Living Above the Poverty Level
(Indicator #1 under “security of Washington’s vulnerable children and adults” POG)
And
Median Household Income and Change in the Poverty Rate
(Indicators #2a and #2b under “economic vitality” POG)
And
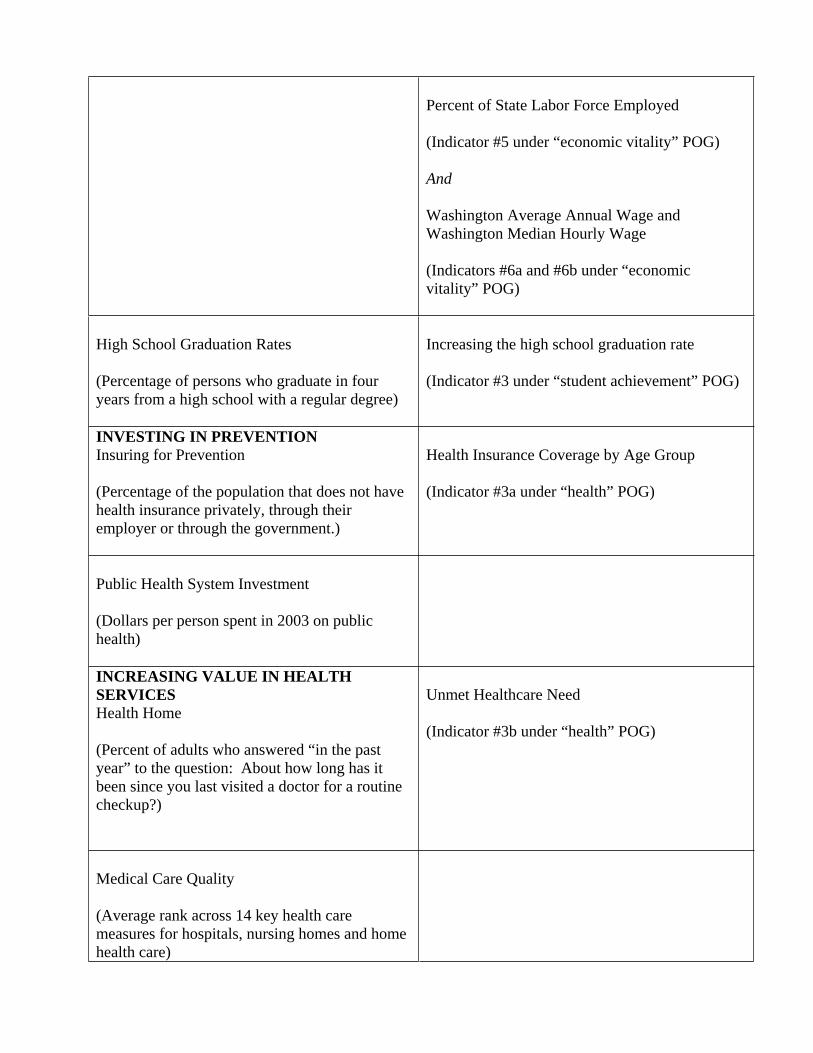
Percent of State Labor Force Employed
(Indicator #5 under “economic vitality” POG)
And
Washington Average Annual Wage and Washington Median Hourly Wage
(Indicators #6a and #6b under “economic vitality” POG)
High School Graduation Rates
(Percentage of persons who graduate in four years from a high school with a regular degree)
Increasing the high school graduation rate
(Indicator #3 under “student achievement” POG)
INVESTING IN PREVENTION Insuring for Prevention
(Percentage of the population that does not have health insurance privately, through their employer or through the government.)
Health Insurance Coverage by Age Group
(Indicator #3a under “health” POG)
Public Health System Investment
(Dollars per person spent in 2003 on public health)
INCREASING VALUE IN HEALTH SERVICES Health Home
(Percent of adults who answered “in the past year” to the question: About how long has it been since you last visited a doctor for a routine checkup?)
Unmet Healthcare Need
(Indicator #3b under “health” POG)
Medical Care Quality
(Average rank across 14 key health care measures for hospitals, nursing homes and home health care)

PROTECTING AGAINST INJURY & DISEASEReceipt of Proven Preventive Care
(Average state ranks for receipt of prenatal care, children’s immunization, mammography, cholesterol screening and colorectal cancer screening combined)
Seat Belt Use
(Percent of adults observed using shoulder belts)
AVOIDING ADDICTIONS Smoking Rates
(Percentage of the population over age 18 that smokes on a regular basis)
Rate of Tobacco Use Among Adults
(Indicator #1a under “health” POG)
Binge Drinking Rates
(Percent of adults who report having five or more drinks on one occasion during the past 30 days)
Drinking Driver Fatalities per 1 Billion Vehicle Miles
(Indicator #1b of “safety” POG)
ENGAGING IN HEALTHY HABITS Physical Activity
(Percent of adults who report 30+ minutes of moderate physical activity five or more days per week or vigorous physical activity 20+ minutes three or more days per week)
Obesity Among Adults
(Indicator #1b under “health” POG)
Proper Nutrition
(Percent of adults who report consuming five or more servings of fruits and vegetables per day)
Obesity Among Adults
(Indicator #1b under “health” POG)
OUTCOMESPremature Death Rate
(Number of years of life lost per 100,000
Average Years of Healthy Life Remaining at 20
(Indicator #2a under “health” POG)
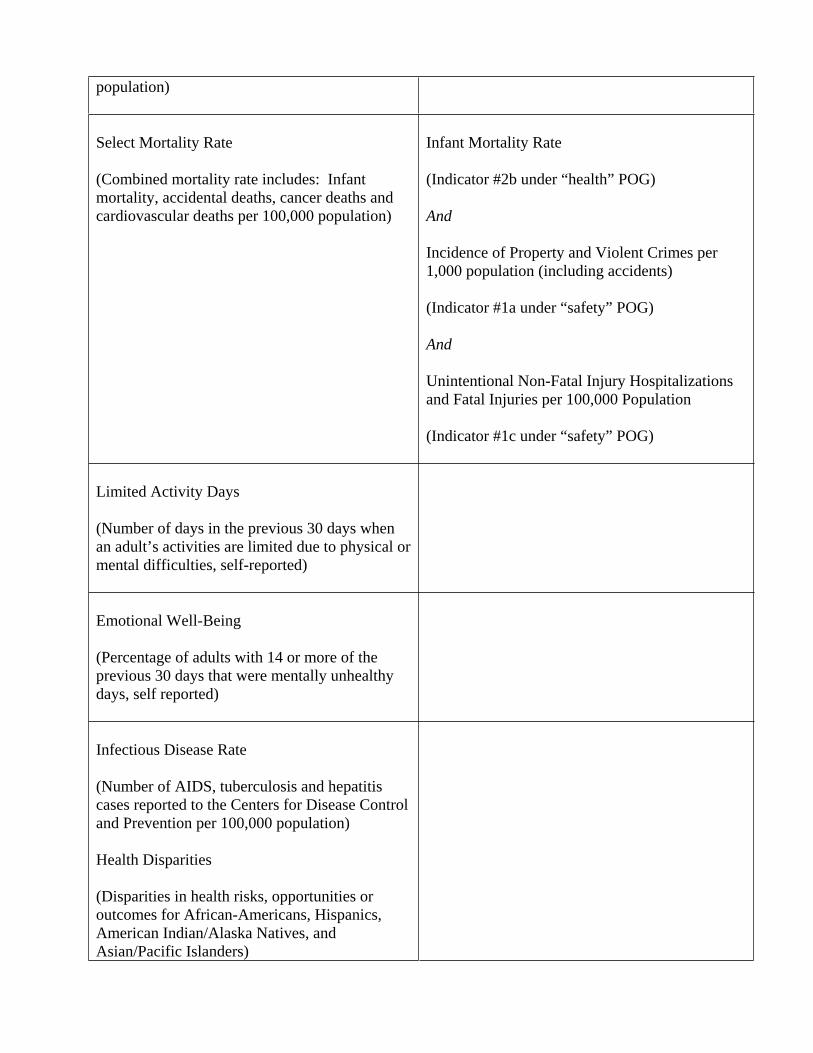
population)
Select Mortality Rate
(Combined mortality rate includes: Infant mortality, accidental deaths, cancer deaths and cardiovascular deaths per 100,000 population)
Infant Mortality Rate
(Indicator #2b under “health” POG)
And
Incidence of Property and Violent Crimes per 1,000 population (including accidents)
(Indicator #1a under “safety” POG)
And
Unintentional Non-Fatal Injury Hospitalizations and Fatal Injuries per 100,000 Population
(Indicator #1c under “safety” POG)
Limited Activity Days
(Number of days in the previous 30 days when an adult’s activities are limited due to physical or mental difficulties, self-reported)
Emotional Well-Being
(Percentage of adults with 14 or more of the previous 30 days that were mentally unhealthy days, self reported)
Infectious Disease Rate
(Number of AIDS, tuberculosis and hepatitis cases reported to the Centers for Disease Control and Prevention per 100,000 population)
Health Disparities
(Disparities in health risks, opportunities or outcomes for African-Americans, Hispanics, American Indian/Alaska Natives, and Asian/Pacific Islanders)


Tab 59
The Center for Health Care Reform’s Proposal to the Blue Ribbon Commission
What Should Be Done?
Washington needs to do three basic things to improve the health care of this state: 1) increase access to health care insurance; 2) determine a baseline of what insurance should cover and what an individual should be responsible for; and 3) restructure the health care delivery system to deliver value to the patient in terms of health outcomes per dollar spent. All three of these items are interconnected; access to health insurance and the coverage terms of that insurance policy impact the cost and ultimate value of the delivery of health care. Moreover, all three items will encourage market competition based on results that would improve the value of the health care delivered to Washingtonians.
Increase access to health care insurance
There is no one-size fits all solution to increasing access to health care insurance because the goal is to create a vibrant market with different products available to consumers. This can be accomplished in different ways, each of which merits closer consideration. The rationale for opening the market is to encourage competition based on value to the consumer, not promote a race to the lowest-cost bare bones package.
Allow insurance carriers to offer reduced mandate insurance plans
State mandates add to the cost of insurance policies, although it is not clear by what magnitude. Regardless of the precise cost associated with each mandate, cumulatively they increase costs, which are passed on to purchasers. By removing at least some of the restrictions to coverage, carriers should be able to offer more economical policies that meet the fundamental benefit needs of the consumer, including small businesses. Given the number and breadth of the mandates in Washington, it is reasonably foreseeable that carriers will continue to offer coverage that includes those mandates that they consider valuable to a purchaser of a health plan. Moreover, by offering some plans with reduced mandates, it does not mean that other plans will not still contain the full number of mandates or have a richer benefit package.
____________________________________________________________________P.O. Box 3643, Seattle, WA 98124-3643 • 888-WPC-9272 • www.washingtonpolicy.org
1
____________________________________________________________________P.O. Box 3643, Seattle, WA 98124-3643 • 888-WPC-9272 • www.washingtonpolicy.org
2
Encourage insurance carriers to offer health care plans that shift away from first dollar coverage
First dollar coverage can contribute to rising health care costs because the consumer is unaware of the cost associated with a given diagnosis and treatment. Thus, first dollar coverage can result in an overuse or inefficient use of health care services. When the consumer has a higher level of responsibility for routine health care decisions, they have greater incentive to include the expected value received per dollar expended in their decision making process. Health savings accounts (HSAs) combined with high deductible health plans (HDHPs) are one mechanism of encouraging movement away from first dollar coverage. However, reform efforts in this direction should have a systematic focus, not merely favor one type of product.
Consider implementing a “Connector” similar to Massachusetts
Massachusetts recently enacted legislation creating a “Connector.” The Connector serves to connect individuals to insurance. The Connector creates a marketplace in which consumers can purchase health care insurance plans from competing insurers. Washington Policy Center would be happy to work with the Commission and others to look more closely at the Connector and how a similar market mechanism could be implemented in Washington.
Determine what insurance covers and what individuals should pay for themselves
As a matter of policy, discussions should be had regarding what insurance should cover and what individuals should be responsible for and how such decisions should be made in the future. Ideally, a minimum standard will be developed at the federal level. Although this is outside the jurisdiction of the Commission, efforts can be made to better define minimum coverage. This discussion should be focused on the health value of each insurance benefit. Hopefully, this discussion would help move Washington State away from the conflict over mandates and towards a basic affordable plan that ensures high value care. Presumably, such a plan would include preventive care benefits and primary care.
Once a minimum standard is accomplished there would be a coverage floor which health insurers are required to meet but could voluntarily exceed. Insurers could still offer a variety of plans with coverage above the minimum, for which they could charge a higher premium or have a higher deductible. Additionally, services that were not covered in the minimum plan could be covered through supplementary insurance policies. Essentially, defining a minimum standard would permit the market to meet consumer’s demands for additional coverage while permitting more Washingtonians to have valuable insurance coverage.
____________________________________________________________________P.O. Box 3643, Seattle, WA 98124-3643 • 888-WPC-9272 • www.washingtonpolicy.org
3
Restructure the health care delivery system to deliver value to the patient
The health care delivery system needs to be restructured to focus on providing the best value for a patient’s health rather than focusing on how to reimburse for treatment of a particular medical condition. Competition needs to be encouraged in terms of results. Such results based competition will promote improvement in the areas of diagnosis, treatment, disease management, and prevention and will ultimately provide patients with high value.
A patient’s health is unique in many ways and the best measure of quality is better patient results in terms of health outcomes versus cost. Simply put, how do services and technologies compare in addressing specific medical conditions over the complete care cycle for a patient. This type of competition will encourage accountability and effective care. Because results are measured and compared, providers have incentive to maintain knowledge of current best practices while having the flexibility to deviate in order to provide better results for a given patient.
Of course, for this results based competition approach to succeed, results information must be collected and disseminated. This type of transparency in the medical system is becoming increasingly desired by consumers. Priority should be given to devising universally accepted outcome measures that are meaningful and agreed to by most participants. Additionally, price information, at least an estimate or range, should be made available to the consumer prior to utilization. Perhaps the ideal starting point for such price information is in routine medical services such as office visits, imaging, and laboratory services.
How Will This Impact the Blue Ribbon Commission’s Vision and Goals?
This proposal will meet the Commission’s vision by providing more access to health insurance coverage, defining what such coverage should include, and restructuring the delivery system to focus on value to a patient’s health in terms of health outcome versus cost (i.e., quality).
This proposal will also satisfy most of the Commission’s goals as described below.
Improving access: By increasing access to health care insurance through market competition based on value to the consumer, determining what valuable, yet basic, health care coverage means, and restructuring the delivery system to focus on delivering value to the patient, more Washingtonians will have access to health care coverage providing quality care in 2012. Improving health:
o By focusing the health care delivery system on value to the patient’s health, Washingtonians will have the opportunity to become one of the healthiest states in the nation. Essentially, Washington’s goal of a healthier state population will also be the
____________________________________________________________________P.O. Box 3643, Seattle, WA 98124-3643 • 888-WPC-9272 • www.washingtonpolicy.org
4
goal of the health care delivery system, on a patient-by-patient basis.
o Measuring results for patients in terms of value to them based on health outcome versus cost and making such information accessible should ultimately enable many health disparities to be lessened or eliminated.
o By promoting competition based on results, providers will be motivated to know the current best practices and to apply them in a fashion that provides the best outcomes for their patients. This approach will not necessitate implementing state wide best practices which could have a negative outcome for some patients, discourage physicians from using their best judgment, and increase the number of medical malpractice lawsuits. Rather providers will have an incentive to use best practices to yield the greatest health outcomes per cost for their patients.
Increasing affordability: Increasing access to health insurance coverage and determining what insurance should cover are closely linked to increasing affordability. Valuable insurance coverage could be available at an affordable cost to Washingtonians. Limiting the rate of increase in total health care spending to no more than the growth in personal income, however, seems to be artificially limiting the options available to Washington. Focusing on a delivery system that provides value to the patient based on health outcome versus cost addresses the issue of health care inflation without creating artificial barriers to improvement. The actual cost of care should be measured over the full cycle of care, from prevention through long-term management, and such measurements do not fit well into a calendar year. Limiting the amount of total spending increases may be acceptable in regards to affordability of access to coverage, but acute spending for a prescription drug or medical procedure might be cost beneficial in the long run. It should be up to the individual to choose how much of their income should be spent on total health care costs.
Modeled on an Existing Policy or Program?
Some of the concepts incorporated in this proposal are drawn from “Redefining Health Care, Creating Value-Based Competition on Results” by Michael Porter and Elizabeth Teisberg and published by the Harvard Business School Press. Many of the concepts are being pursued by other states. For example, Arizona exempts small business health insurance plans from complying with some of the state mandates. (Arizona HB 2698). Massachusetts is in the process of implementing their “Connector.” And transparency and outcome measures are becoming more prevalent. South Dakota requires that prices for hospitals’ commonly performed procedures be published. And efforts have been made to collect results information. Washington Policy Center is available to work with the Commission to examine related policies and programs already in place more closely, and what this might mean for Washington.
____________________________________________________________________P.O. Box 3643, Seattle, WA 98124-3643 • 888-WPC-9272 • www.washingtonpolicy.org
5
What Are the Costs?
It is foreseeable, that the short term costs would be outweighed by the long term savings both in dollars and the health of Washingtonians. Washington Policy Center is willing to work with the Commission and others to determine the costs imposed and saved by this proposal.
Collaboration Among Stakeholders?
Pending.
What Are the Obstacles?
One obstacle to this proposal is creating a neutral environment in which to discuss mechanisms for increasing access to health care insurance and determining what insurance should cover. Perhaps the most difficult obstacle, however, is that of accomplishing a culture shift in the health care delivery system. Although it sounds simple to shift from a reimbursement based system to one focused on providing the best value for a patient’s health, it requires a different approach to the system, the development of different tools to aid in the system’s success, and consumer education. For a system like this to function well, there must be consumer engagement and informed consumers.

Tab 60
Insurance Coverage for the Treatment of Hearing Loss Proposal to the Blue Ribbon Commission on Health Care Access & Cost
Submitted by the Washington Speech & Hearing Association September 1, 2006
“Among the five senses, people depend on vision and hearing to provide the primary cues for conducting the basic activities of daily life…These senses provide the portals for language, whether spoken, signed, or read. They are critical to most work and recreation and allow people to interact more fully. For these reasons, vision and hearing are defining elements of the quality of life.” (From Healthy People 2010, National Institutes of Health)
Background
28 million Americans, or approximately 10% of the total population, have some degree of hearing loss. In fact, hearing loss is the number one birth disorder in the United States. In Washington, this means 650,000 children and adults have a moderate to profound hearing loss.
As the nation’s population ages, the need for hearing aids increases. Hearing loss is now the third most prevalent chronic condition in older Americans. An estimated 23% of individuals between the ages of 65 and 74 have a hearing loss. 31% of those over age 74 have a hearing loss. It is predicted that hearing and related speech impairments will continue to rise.
Studies show that 95% of hearing impaired individuals can improve their communication by using hearing aids. Unfortunately, only 20% of Washingtonians with hearing loss have hearing aids. Children with hearing loss can miss up to 50% of classroom speech, making it likely that they will need special education classes. Adults with hearing loss are also at a disadvantage for education and employment opportunities.
Currently, most insurers do not provide any coverage for hearing aids. Without this coverage, most individuals simply go without. Hearing aids are expensive; typically, a pair of hearing aids costs $3,000-$4,000. This puts an undue financial hardship on individuals and families to buy these necessary instruments.
To address this issue of access to hearing aids, the Washington Speech & Hearing Association (WSHA) proposes that Washington state require all insurers that provide coverage for prosthetic devices also include coverage for hearing aids, if so recommended by a qualified health care provider.
Insurance Coverage for Hearing Aids Achieves the Commission’s Vision and Goals
Insurance coverage for hearing aids realizes the vision and goals of the Blue Ribbon Commission in several ways. First, it realizes the Commission’s vision of providing every Washingtonian the ability to obtain needed, affordable health care. This proposal
1
ensures that individuals with hearing loss have access to affordable hearing aids through their insurance policies.
Second, this proposal improves the health of Washingtonians by providing treatment to a very treatable condition. As stated above, 95% of individuals with hearing loss can improve their communication through the use of hearing aids.
Third, the science behind hearing aids shows that they are an effective form of treatment for individuals with hearing loss. It has been shown that older adults who receive treatment with hearing aids significantly improve their emotional and social functioning, as well as their communication abilities. The same holds true for children. Treating hearing loss in children improves speech, language, social, and emotional development.
Insurance Coverage for Hearing Aids Modeled after Legislation in Other States
Eight states require insurance coverage for hearing aids: Connecticut, Kentucky, Louisiana, Maryland, Minnesota, Missouri, Oklahoma and Rhode Island. Most states with this requirement have limited the amount of the benefit, the frequency of the benefit, or the population who can access the benefit (i.e., children only). In 2005, there were approximately 13 other states contemplating legislation to mandate insurance coverage for hearing aids, as well as efforts on the national level.
California’s Legislature has just passed legislation requiring insurers to help pay for hearing aids for deaf or hard-of-hearing children. This bill awaits Governor Schwarzenegger’s signature.
Insurance Coverage for Hearing Aids Costs and Savings
Fiscal notes on past legislation mandating insurance coverage for hearing aids has stated that the cost to state purchased health care would be approximately $1.5 million per biennium. Premium increases would be $.13 to $.30 per member per month. The addition of coverage for hearing aids would be an extremely small part of any premium.
In fact, some insurers have been taking steps to offer limited hearing benefits. In Washington, Regence offers a “value added” program that gives discounts to their members for hearing exams and hearing aids. Premera and Pacificare also offer similar programs. Clearly, these insurers recognize that these hearing benefits create value for their subscribers.
The cost of adding coverage for hearing aids is outweighed, however, by the savings to our state’s health care and education systems. According to the American Speech-Language-Hearing Association, hearing loss intervention before six months of age results in significantly better language skills than intervention after six months. Children receiving early intervention are likely to develop on par with their peers, while children with untreated hearing loss are ten times more likely to be held back a grade in school or enter special education. Studies have shown that children who do not receive early
2
intervention cost our educational system an additional $420,000 in special education costs and classroom modifications.
Insurance Coverage for Hearing Aids Stakeholder Support
There are many supporters of insurance coverage for hearing aids, from very diverse backgrounds. These supporters include the Department of Health, the Governor’s Committee on Disability Issues and Employment, the Washington State Self-Help for Hard of Hearing People, the Listen for Life Center at Virginia Mason, the Washington Grange, the Rotary Club of Clover Park-Lakewood, the Washington State Special Education Coalition, The Washington Association of Area Agencies on Aging, the Tacoma Area Coalition of Individuals with Disabilities, and the Washington Speech & Hearing Association, among others.
Insurance Coverage for Hearing Aids Implementation Obstacles
Predictably, insurance carriers have opposed past legislation calling for coverage for hearing aids. They cite general concerns for the costs that mandated benefits add to premiums, but they have never cited any specific costs for a hearing aid mandated benefit. Business organizations have also opposed this legislation stating that hearing aids are not medically necessary, can be purchased over time on credit, and are “generally affordable.”
These objections can be addressed by applying a cost-benefit analysis similar to the one conducted by the Department of Health in its sunrise review. That analysis showed that the cost of providing coverage for hearing aids is offset by the savings that can be achieved, including savings to our health care system and education system.
Conclusion
Hearing loss is an illness that needs treatment. Many diverse organizations and individuals have already acknowledged the importance of this treatment through access to hearing aids. It is time that the state of Washington recognizes the issue of hearing loss as a disease and provides access to the necessary treatment for its hearing impaired citizens.
3

Tab 61
WASHINGTON STATE ASSOCIATION OF LOCAL PUBLIC HEALTH OFFICIALS
An Affiliate of Washington State Association of Counties
August 31, 2006
Honorable Christine Gregoire, GovernorHonorable Pat Thibaudeau Co-Chairs Blue Ribbon Commission on Health Care Costs and Access Olympia, WA 98504
Dear Commission Members,
Thank you for the opportunity to submit a proposal to help achieve the Blue Ribbon Commission’s July 27, 2006 Vision Statement and Goals. I am writing on behalf of the Washington State Association of Local Public Health Officials (WSALPHO), a non-profit organization whose membership is comprised of all 35 local public health jurisdictions in Washington State. Public Health’s mission of improved health status cannot fully be realized without access to critical health services and disease prevention and health promotion activities. This fits well with the vision and goals of the Commission.
We recognize that the Commission’s work is focused on finding solutions to our health care access crisis and the skyrocketing costs of medical care provision. As the Commission members are aware, health cannot be achieved through access to “illness care” alone. We must strengthen the ties between medical services and population based services if we are to be successful in achieving affordable care and healthier citizens. Local public health is charged with the responsibility for and uniquely positioned to assure medical care access and provide health promotion and disease prevention in our communities so that the vision and goals of the Commission can be achieved. In addition, we must all work together to provide the physical and social environments that promote healthy behaviors.
Attached is a proposal from WSALPHO that we believe to be critical to the ability of the Blue Ribbon Commission to achieve their goals. We have chosen to use the format requested by the Commission of answering the specific questions about our proposal.
Sincerely,
Janet E. Davis Chair
206 Tenth Avenue SE, Olympia, WA 98501 Telephone: (360) 753-1886 (360) 753-2842
PROPOSAL TO BLUE RIBBON COMMISSION ON HEALTH CARE COSTS AND ACCESS
WASHINGTON STATE ASSOCIATION OF LOCAL PUBLIC HEALTH OFFICIALS
1. What do you propose to be done to realize the vision and goals for Washington State established by the Blue Ribbon Commission on Health Care Costs and Access? Briefly summarize your proposal.
WSALPHO requests the Blue Ribbon Commission support the forthcoming recommendations of the Joint Select Committee on Public Health Financing. The Joint Select Committee has carefully examined the role, the priorities and the capacity of the local public health system and is working on specific funding recommendations that will be finalized in October 2006.
By supporting the Committee’s forthcoming recommendations, the Commission can foster formation of local collaboratives of health care partners to solve local access to care issues. This will allow Local Public Health and the provider community to proactively address preventable chronic diseases like diabetes and heart disease that result in major medical care and hospital costs. These activities are further described in the WSALPHO plan, Creating a Stronger Public Health System: Statewide Priorities for Action, that was presented to the Joint Select Committee on May 25, 2006. It is available at: http://www.wacounties.org/wsalpho/Workbook 7 - Final.pdf (pages 1-13 are an overview).
2. How will implementation of your proposal enhance, hinder or otherwise impact the achievement of the vision and each of the goals established by the Commission?
Commission Goal: Access to healthcare –
Public health has a unique point of view in that we look at health issues not in terms of any particular disease or interest group, but from a population-based perspective. As a result, we believe that local public health has an important role to play regarding affordable and accessible health care. One of the key areas listed in the Standards for Public Health in Washington is Access to Critical Health Care. The Standards include a list of critical health services that should be readily available to all citizens. Public Health’s role is not to necessarily provide such medical care for those who can’t afford to pay but to assure that people have access to those critical health services when they need them.
Local public health understands and sees on a daily basis the impact that lack of access to critical health services has on the health of our community. We see children in schools with rampant tooth decay, pregnant women with no prenatal care, people who have to choose
206 Tenth Avenue SE, Olympia, WA 98501 Telephone: (360) 753-1886 (360) 753-2842
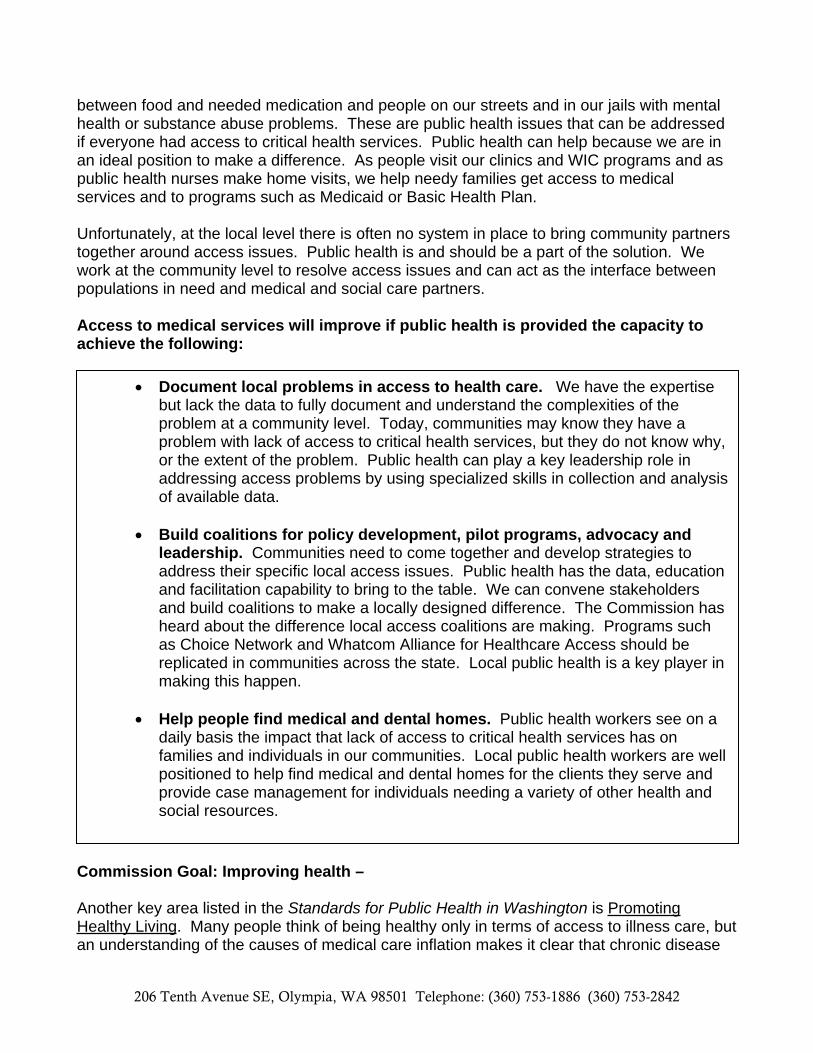
between food and needed medication and people on our streets and in our jails with mental health or substance abuse problems. These are public health issues that can be addressed if everyone had access to critical health services. Public health can help because we are in an ideal position to make a difference. As people visit our clinics and WIC programs and as public health nurses make home visits, we help needy families get access to medical services and to programs such as Medicaid or Basic Health Plan.
Unfortunately, at the local level there is often no system in place to bring community partners together around access issues. Public health is and should be a part of the solution. We work at the community level to resolve access issues and can act as the interface between populations in need and medical and social care partners.
Access to medical services will improve if public health is provided the capacity to achieve the following:
Document local problems in access to health care. We have the expertise but lack the data to fully document and understand the complexities of the problem at a community level. Today, communities may know they have a problem with lack of access to critical health services, but they do not know why, or the extent of the problem. Public health can play a key leadership role in addressing access problems by using specialized skills in collection and analysis of available data.
Build coalitions for policy development, pilot programs, advocacy and leadership. Communities need to come together and develop strategies to address their specific local access issues. Public health has the data, education and facilitation capability to bring to the table. We can convene stakeholders and build coalitions to make a locally designed difference. The Commission has heard about the difference local access coalitions are making. Programs such as Choice Network and Whatcom Alliance for Healthcare Access should be replicated in communities across the state. Local public health is a key player in making this happen.
Help people find medical and dental homes. Public health workers see on a daily basis the impact that lack of access to critical health services has on families and individuals in our communities. Local public health workers are well positioned to help find medical and dental homes for the clients they serve and provide case management for individuals needing a variety of other health and social resources.
Commission Goal: Improving health –
Another key area listed in the Standards for Public Health in Washington is PromotingHealthy Living. Many people think of being healthy only in terms of access to illness care, but an understanding of the causes of medical care inflation makes it clear that chronic disease
206 Tenth Avenue SE, Olympia, WA 98501 Telephone: (360) 753-1886 (360) 753-2842
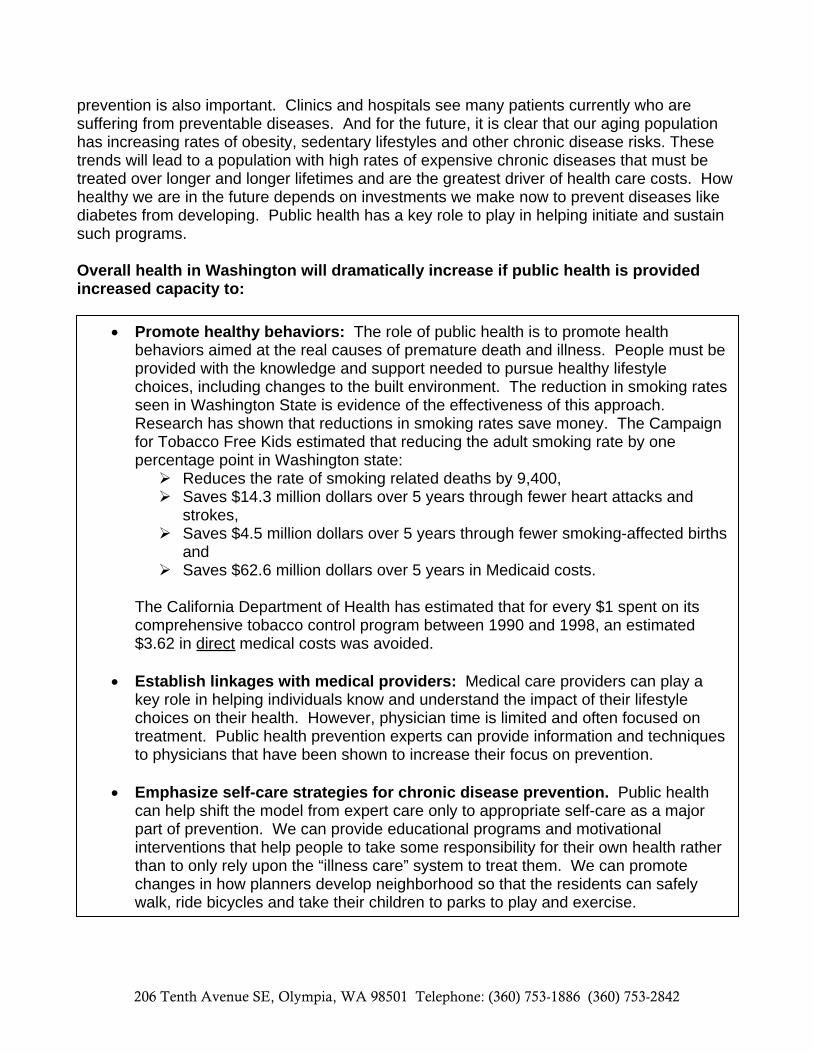
prevention is also important. Clinics and hospitals see many patients currently who are suffering from preventable diseases. And for the future, it is clear that our aging population has increasing rates of obesity, sedentary lifestyles and other chronic disease risks. These trends will lead to a population with high rates of expensive chronic diseases that must be treated over longer and longer lifetimes and are the greatest driver of health care costs. How healthy we are in the future depends on investments we make now to prevent diseases like diabetes from developing. Public health has a key role to play in helping initiate and sustain such programs.
Overall health in Washington will dramatically increase if public health is provided increased capacity to:
Promote healthy behaviors: The role of public health is to promote health behaviors aimed at the real causes of premature death and illness. People must be provided with the knowledge and support needed to pursue healthy lifestyle choices, including changes to the built environment. The reduction in smoking rates seen in Washington State is evidence of the effectiveness of this approach. Research has shown that reductions in smoking rates save money. The Campaign for Tobacco Free Kids estimated that reducing the adult smoking rate by one percentage point in Washington state:
Reduces the rate of smoking related deaths by 9,400, Saves $14.3 million dollars over 5 years through fewer heart attacks and
strokes, Saves $4.5 million dollars over 5 years through fewer smoking-affected births
and Saves $62.6 million dollars over 5 years in Medicaid costs.
The California Department of Health has estimated that for every $1 spent on its comprehensive tobacco control program between 1990 and 1998, an estimated $3.62 in direct medical costs was avoided.
Establish linkages with medical providers: Medical care providers can play a key role in helping individuals know and understand the impact of their lifestyle choices on their health. However, physician time is limited and often focused on treatment. Public health prevention experts can provide information and techniques to physicians that have been shown to increase their focus on prevention.
Emphasize self-care strategies for chronic disease prevention. Public health can help shift the model from expert care only to appropriate self-care as a major part of prevention. We can provide educational programs and motivational interventions that help people to take some responsibility for their own health rather than to only rely upon the “illness care” system to treat them. We can promote changes in how planners develop neighborhood so that the residents can safely walk, ride bicycles and take their children to parks to play and exercise.
206 Tenth Avenue SE, Olympia, WA 98501 Telephone: (360) 753-1886 (360) 753-2842
WSALPHO strongly urges the Commission to make these activities an important part of its eventual recommendations. Health promotion aimed at chronic disease prevention is one of the few measures, short of reorganizing the entire health care system, which can directly address the causes of our medical care cost and access problems.
Commission Goal: Improving affordability –
Promoting healthy, prevention-based behaviors are at the core of public health’s work.These activities and services are demonstrated to be cost-effective strategies that save money that would otherwise be spent later on medical, social and other community services. One well-researched example of a public health intervention program that works, especially for young children, is the Nurse-Family Partnership (NFP). NFP is an evidence-based home visitation service by public health nurses that serves low-income, first time mothers of any age. The outcomes of this program include:
improved prenatal health, fewer childhood injuries, fewer subsequent pregnancies, increased intervals between births, increased maternal employment, improved school readiness, reductions in child abuse/neglect, fewer arrests and convictions of mothers and their children as teens.
The Washington State Institute for Public Policy estimated the implementation costs (in 2003 dollars) of the program at $9,118 per child with the benefits estimated at $26,298 or in other words – every $1 spent produced a benefit of $2.88. This did not take into account any savings from decreases in low birth weight, child injuries or increases in immunization rates.
The 1998 Rand Study which reviewed the Nurse-Family Partnership identified at least four types of significant savings to government:
increased tax revenues from increased employment, decreased welfare costs, reduced expenditures for education, health and other services and lower criminal justice costs
They also estimated that the net reductions in public costs begin to accrue by the time children in the program are four years old.
3. Is your proposal modeled after an existing policy or program within Washington or elsewhere?
206 Tenth Avenue SE, Olympia, WA 98501 Telephone: (360) 753-1886 (360) 753-2842
This proposal is consistent with the current role of public health in Washington State. The key areas defined in the Public Health Standards developed in accordance with RCW 43.70.520 clearly address public health’s role in:
A) Promoting healthy living:The best examples of what public health activities and programs target are tobacco cessation, physical activity, dietary habits, oral health, injury prevention and responsible sexual behavior. One example of public health’s role in health promotion is the Washington State Nutrition and Physical Activity Plan that promotes environmental and policy changes to encourage healthy eating and physical activity.The executive summary can be found at:http://www.doh.wa.gov/cfh/NutritionPA/publications/npe_exec_summary.pdf
B) Helping people get the services they need:This means general access to medical services, maternal and child health and development, behavioral and mental health services, chronic disease and conditions management and dental services. One local example of access initiatives supported by local public health is the Whatcom Alliance for Healthcare Access (WAHA). WAHA is a nonprofit organization dedicated to ensuring access to healthcare services for all members of our community. It is composed of a wide range of partners including leaders from the nonprofit, business and governmental sectors, as well as many local health care organizations and is dedicated to solving community healthcare problems. More information at:http://www.whatcomalliance.org/
4. Will your proposal impose costs on individuals, businesses or government?
WSALPHO estimated the cost of addressing gaps in public health services so that reliable and similar services can be offered statewide. This information was presented to the Joint Select Committee. The cost associated with fully funding the existing gaps in Public Health exceeds $200 million annually with approximately $30 million funding Health Promotion and approximately $29 million funding Access to Critical Health Services. The full recommendation can be found at:http://www.wacounties.org/wsalpho/FINAL%20Additional%20Investment%20Spending%20Plan_detailed%20plan_v1%20(3).doc
5. How does your proposal reflect collaboration among variousstakeholders?
206 Tenth Avenue SE, Olympia, WA 98501 Telephone: (360) 753-1886 (360) 753-2842
All 35 local health jurisdictions reached consensus on the gaps and priorities for public health as presented to the Joint Select Committee. Other partners who provided assistance or endorsement were the WA State Dept. of Health, WA State Board of Health and the Public Health Roundtable that includes the Washington Health Foundation, the Washington State Nurses Association, the Washington State Medical Association, the Washington State Public Hospital Association, the Washington State Hospital Association and the Children’s Alliance.
Public health directly involves collaboration with the medical care providers, community organizations, other government agencies and the community at large. Health is not just about access to appropriate “illness care”, but it is also about societal and political will to address the leading determinants of health, such as income, housing, family protective factors and individual lifestyle choices. Good health is provided through a continuum of activities, ranging from primary prevention (the public health model) to treatment (the medical care model). Both must be present to improve a community’s health status and reduce costs.
6. What are the obstacles to implementing your proposal?
We believe many of the possible objections to increasing public health funding have been addressed during the Joint Select Committee process and will be identified in the report issued by the Committee.
In closing, WSALPHO strongly supports the Commission’s goals of improving health care access, improving the population’s health, and improving health care affordability. However, without a strong public health system, the medical care system and the Commission will be unable to deliver on its goals of improving health to become “one of the top ten healthiest states in the nation” and to have population health indicators that “will be consistent across race, gender and income levels.” To do this, WSALPHO requests that the Commission support the reversing of the decay of the public health system by supporting public health funding as recommended by the Joint Select Committee on Public Health Financing.
206 Tenth Avenue SE, Olympia, WA 98501 Telephone: (360) 753-1886 (360) 753-2842

Tab 62
TOMORROW’S MEDICINE A Report on the Future of Health Care Delivery in Washington State
Tomorrow’s Medicine assembles data from a number of reputable sources and opinions from a variety of health care stakeholders to outline the current status and desirable future course of health care in Washington state. The objective is to foster reasoned discourse on the preferred state of tomorrow’s medicine, and to outline the leadership responsibilities of physicians as the health care system continues to evolve.
Tomorrow’s Medicine was commissioned by the Washington State Medical Association (WSMA). The first section of this report, Where Are We Today?, was derived from quantitative data and analyses provided by the WSMA’s Health Care Economics Department.
In the second half of this report, we took a different approach.
Every conversation touching on health care quickly comes down to a few common questions like these: What’s the best way to make sure everyone has access to good health care? Can we bring costs under control without sacrificing quality? What kind of health care system do we want? How do we pay for it?
Physicians share many of the public’s concerns. We want to increase access to treatment, to use technology to reduce costs, and to assure consistent, high quality care. We know that people without adequate insurance coverage often wait too long to see a doctor, increasing their health risk and further driving up costs. And we realize that current policy debates – in legislative chambers, boardrooms, and lecture halls – often simply re-plow familiar ground.
To inject a fresh perspective, the WSMA chose to look beyond the immediate horizon. We wanted to know what key stakeholders envisioned for our state’s health care system five years from now.
• What should we expect? • What should we be planning for? • Where will the practice of medicine be? • How will we work together to provide high quality, accessible care?
In the section titled, What Should Tomorrow’s Medicine Look Like?, the Washington Research Council asked physicians and university faculty, business and labor, hospitals, insurers, and government leaders to share their views with us. 1 And despite their various professional interests, they emphasized remarkably similar themes.
This report outlines how we can move forward, taking medicine and health care into the future in a productive way that benefits patients, physicians, and purchasers alike – a goal that cannot be achieved without collaboration. This report also includes plans for collaborating with the stakeholders who helped define the issues, and inviting others to join this effort.

______________________________
More than 115,000 jobs economy-wide, 3.2 percent of total employment, were directly or indirectly created by physicians’
practices.______________________________
Where A
re We T
oday?
Where Are We Today?
The Role of Medical Care in Washington’s Economy
The health care industry and physicians’ practices play a prominent role in the national and Washington state economies.2 Beyond providing care and saving lives, medical practices generate jobs and economic development and are integral to the economic health of their communities. The cost of health care, medical services, and the administration of the financing and delivery system also are felt throughout the economy.
The Economic Impact of Physicians’ Practices in Washington State
More than 12,000 men and women worked as physicians (either Doctors of Medicine or Doctors of Osteopathic Medicine) in Washington state in 2003. While physicians were employed in a broad range of settings, including nursing homes, medical schools, research laboratories, and government, the vast majority (about 10,700) provided direct patient care in offices, clinics, and hospitals.3
A 2005 study by the Washington Research Council quantified the economic impacts of these 10,700 physicians and their practices on the Washington state economy in 2003, focusing on four indicators — business revenue, employment, personal income, and taxes.4
For each indicator, practices have both direct impacts (which occur within the practices), and indirect and induced impacts (which occur elsewhere in the economy).
Business Revenue - In 2003, physician practice revenue totaled an estimated $5.97 billion (the direct impact). This revenue was re-injected into the state’s economy via spending by the practices and their employees. That spending generated an additional $5.83 billion in revenue for other businesses (the indirect and induced impacts). Thus, the total business revenue attributable to physicians’ practices was almost $11.80 billion, nearly twice the direct impact.
Employment - Physicians’ practices provided jobs for 10,700 physicians and 48,000 staff. The spending by practices and their 58,700 physicians and employees is responsible for creating 57,000 jobs in other sectors of the economy. Thus, more than 115,000 jobs economy-wide, 3.2 percent of total employment, were directly or indirectly created by physicians’ practices.
Personal Income - The compensation of those working in physicians’ practices - wages, salaries and benefits - totaled $3.5 billion in 2003. The economic activity of physicians’ practices and their employees resulted in $1.7 billion in personal income for people who worked in other industries, an average of $29,960 for each indirectly created job.
Taxes - Physicians’ practices generated significant tax revenue for state and local government. The state collects Business and Occupation (B&O) tax at the rate of 1.5 percent on most practice revenue, in addition to some minor excise taxes. Practices generated $79.7 million in B&O and other state excise revenue in 2003. The indirect and induced activity generated by the practices generated additional tax revenue totaling $127.4 million. Physicians’ practices also generated local sales taxes of $32.8 million. Thus, the total tax revenue generated by physicians’ practices in 2003 was $239.9 million.
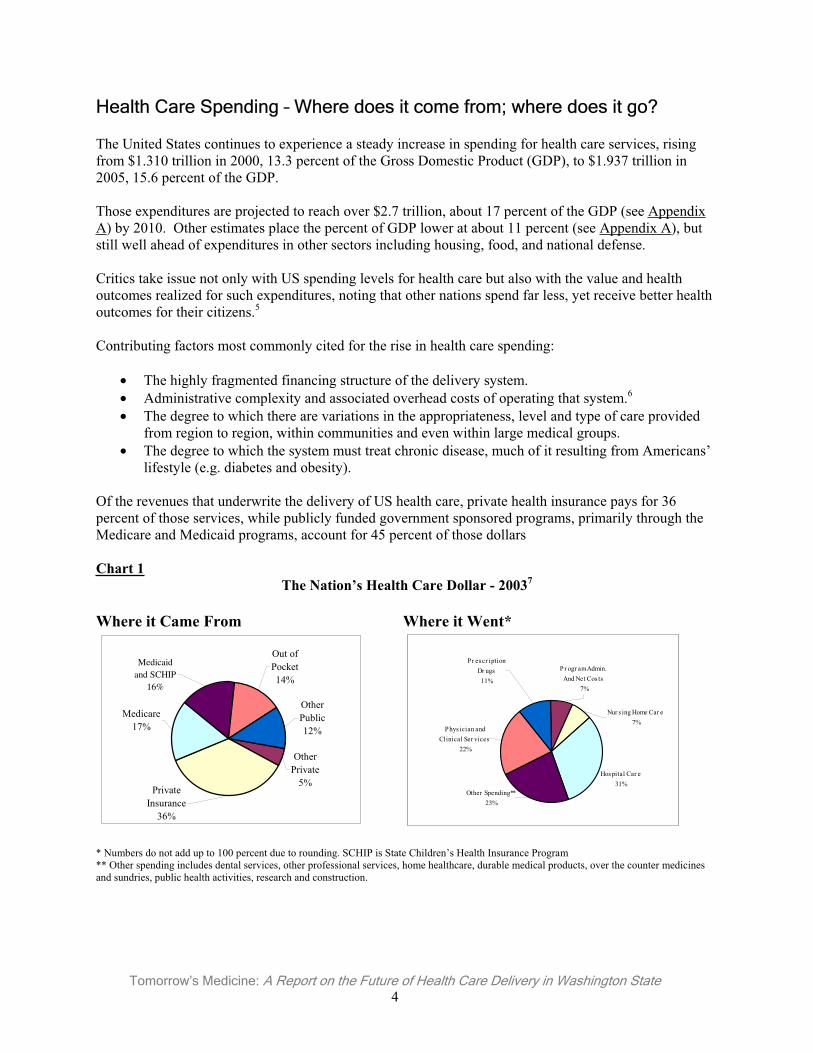
Tomorrow’s Medicine: A Report on the Future of Health Care Delivery in Washington State 4
Health Care Spending – Where does it come from; where does it go?
The United States continues to experience a steady increase in spending for health care services, rising from $1.310 trillion in 2000, 13.3 percent of the Gross Domestic Product (GDP), to $1.937 trillion in 2005, 15.6 percent of the GDP.
Those expenditures are projected to reach over $2.7 trillion, about 17 percent of the GDP (see Appendix A) by 2010. Other estimates place the percent of GDP lower at about 11 percent (see Appendix A), but still well ahead of expenditures in other sectors including housing, food, and national defense.
Critics take issue not only with US spending levels for health care but also with the value and health outcomes realized for such expenditures, noting that other nations spend far less, yet receive better health outcomes for their citizens.5
Contributing factors most commonly cited for the rise in health care spending:
• The highly fragmented financing structure of the delivery system. • Administrative complexity and associated overhead costs of operating that system.6
• The degree to which there are variations in the appropriateness, level and type of care provided from region to region, within communities and even within large medical groups.
• The degree to which the system must treat chronic disease, much of it resulting from Americans’ lifestyle (e.g. diabetes and obesity).
Of the revenues that underwrite the delivery of US health care, private health insurance pays for 36 percent of those services, while publicly funded government sponsored programs, primarily through the Medicare and Medicaid programs, account for 45 percent of those dollars
Chart 1 The Nation’s Health Care Dollar - 20037
Where it Came From Where it Went*
Medicare17%
Private Insurance
36%
Other Private
5%
Other Public12%
Out of Pocket14%
Medicaid and SCHIP
16%
* Numbers do not add up to 100 percent due to rounding. SCHIP is State Children’s Health Insurance Program ** Other spending includes dental services, other professional services, home healthcare, durable medical products, over the counter medicines and sundries, public health activities, research and construction.
Other Spending**23%
Phys ician and Clinical Ser vices
22%
Pr escr iption Dr ugs11%
Pr ogr am Admin. And Net Cos ts
7%
Nur s ing Home Car e 7%
Hospital Car e31%
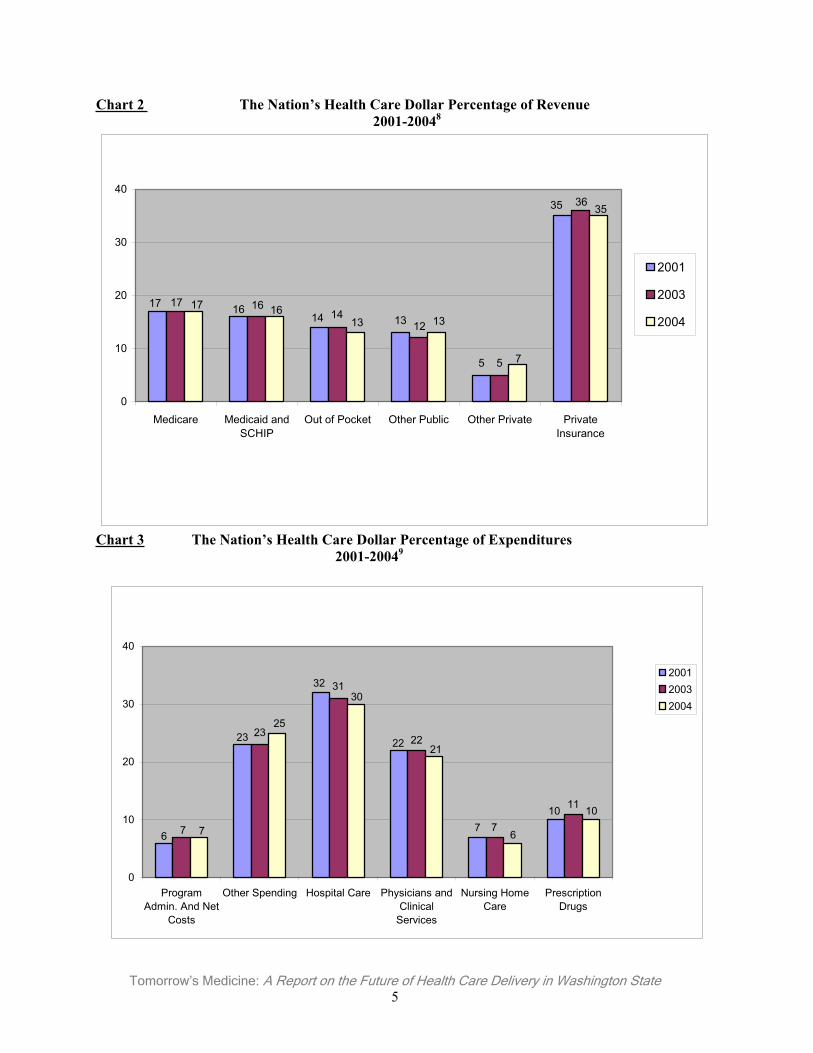
Tomorrow’s Medicine: A Report on the Future of Health Care Delivery in Washington State 5
Chart 2 The Nation’s Health Care Dollar Percentage of Revenue 2001-20048
35
5
13141617
36
5
1214
1617
35
7
13131617
0
10
20
30
40
Medicare Medicaid andSCHIP
Out of Pocket Other Public Other Private PrivateInsurance
2001
2003
2004
Chart 3 The Nation’s Health Care Dollar Percentage of Expenditures 2001-20049
107
22
32
23
6
11
7
22
31
23
7
10
6
21
30
25
7
0
10
20
30
40
ProgramAdmin. And Net
Costs
Other Spending Hospital Care Physicians andClinical
Services
Nursing HomeCare
PrescriptionDrugs
200120032004
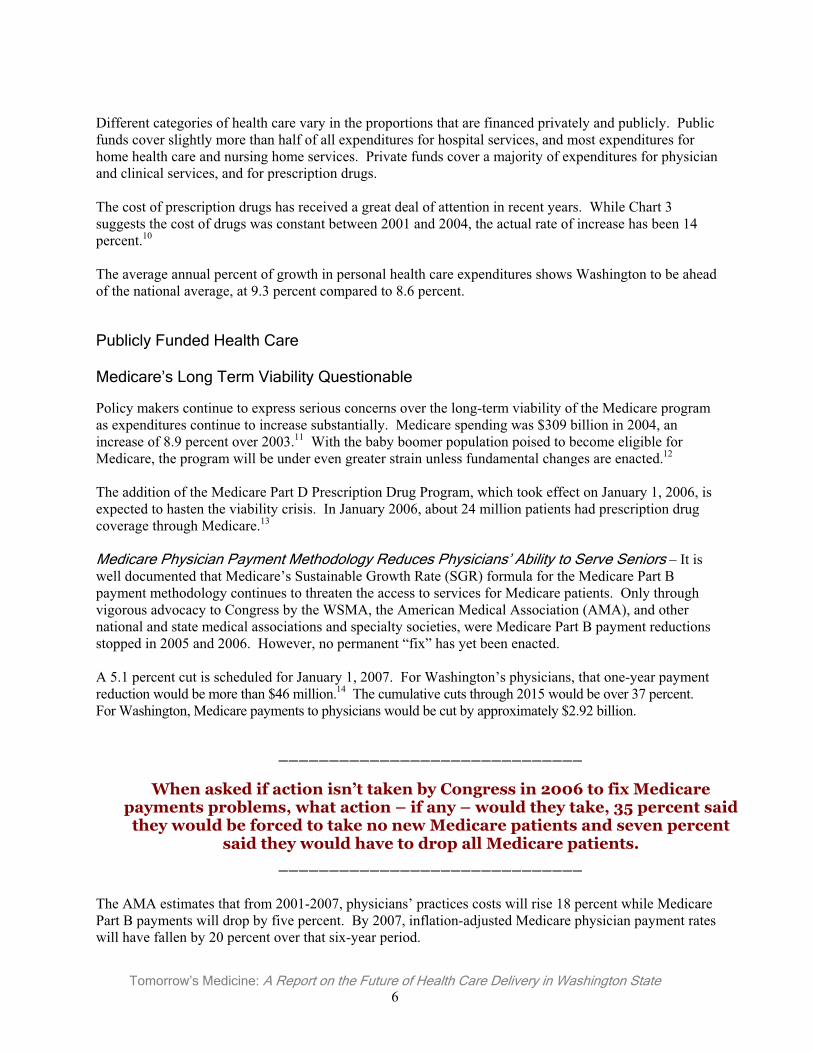
Tomorrow’s Medicine: A Report on the Future of Health Care Delivery in Washington State 6
Different categories of health care vary in the proportions that are financed privately and publicly. Public funds cover slightly more than half of all expenditures for hospital services, and most expenditures for home health care and nursing home services. Private funds cover a majority of expenditures for physician and clinical services, and for prescription drugs.
The cost of prescription drugs has received a great deal of attention in recent years. While Chart 3 suggests the cost of drugs was constant between 2001 and 2004, the actual rate of increase has been 14 percent.10
The average annual percent of growth in personal health care expenditures shows Washington to be ahead of the national average, at 9.3 percent compared to 8.6 percent.
Publicly Funded Health Care
Medicare’s Long Term Viability Questionable
Policy makers continue to express serious concerns over the long-term viability of the Medicare program as expenditures continue to increase substantially. Medicare spending was $309 billion in 2004, an increase of 8.9 percent over 2003.11 With the baby boomer population poised to become eligible for Medicare, the program will be under even greater strain unless fundamental changes are enacted.12
The addition of the Medicare Part D Prescription Drug Program, which took effect on January 1, 2006, is expected to hasten the viability crisis. In January 2006, about 24 million patients had prescription drug coverage through Medicare.13
Medicare Physician Payment Methodology Reduces Physicians’ Ability to Serve Seniors – It is well documented that Medicare’s Sustainable Growth Rate (SGR) formula for the Medicare Part B payment methodology continues to threaten the access to services for Medicare patients. Only through vigorous advocacy to Congress by the WSMA, the American Medical Association (AMA), and other national and state medical associations and specialty societies, were Medicare Part B payment reductions stopped in 2005 and 2006. However, no permanent “fix” has yet been enacted.
A 5.1 percent cut is scheduled for January 1, 2007. For Washington’s physicians, that one-year payment reduction would be more than $46 million.14 The cumulative cuts through 2015 would be over 37 percent. For Washington, Medicare payments to physicians would be cut by approximately $2.92 billion.
The AMA estimates that from 2001-2007, physicians’ practices costs will rise 18 percent while Medicare Part B payments will drop by five percent. By 2007, inflation-adjusted Medicare physician payment rates will have fallen by 20 percent over that six-year period.
______________________________
When asked if action isn’t taken by Congress in 2006 to fix Medicare payments problems, what action – if any – would they take, 35 percent said
they would be forced to take no new Medicare patients and seven percent said they would have to drop all Medicare patients.
______________________________
Tomorrow’s Medicine: A Report on the Future of Health Care Delivery in Washington State 7
Medicare personal health care expenditures for physicians’ services in 2004 in Washington were $1.370 billion, out of the national total of $81.848 billion.15
The average annual percent of growth in Medicare expenditures for physicians’ services in our state (1980-2004) was 10.2 percent, compared to the national percent of growth of 10.1 percent.16 (Additional data are presented in Appendix A.)
Federal data for 2001 reflect a 98 percent participation rate by Washington physicians in the Medicare program. This measure is misleading, however, as it simply indicates physicians who have signed a Medicare participation agreement and does not measure the degree to which physicians’ practices are accepting Medicare patients.17
In January 2006, the WSMA conducted a “snap shot” poll of its membership on whether physicians were continuing to see Medicare patients. Of the 1,092 physicians who responded, 39 percent noted that they had decided to take no new Medicare patients and one percent had decided to drop all Medicare patients. The majority had made that decision within the last three years.
When asked if action isn’t taken by Congress in 2006 to fix Medicare payments problems, what action – if any – would they take, 35 percent said they would be forced to take no new Medicare patients and seven percent said they would have to drop all Medicare patients.
Medicare and Washington Hospitals – Medicare payments to hospitals under Part A are computed differently and have not been subjected to the reductions applied to physician payments. Washington hospitals consume a higher percentage of Medicare expenditures for the five most frequently performed inpatient hospital procedures compared to the national average (Chart 4).
Chart 4Range of Medicare Payments (Low-25th Percentile/High-75th Percentile)
for Top Five Inpatient Hospital Procedures, FY200518
WA$
US$
Hip/Knee Replacement Low 11,491 9,992 Hip/Knee Replacement High 12,874 12,173 Gallbladder Removal By Laparoscope With Complications or Preexisting Conditions Low
10,459 9,156
Gallbladder Removal By Laparoscope With Complications or Preexisting Conditions High
11,358 10,921
Back & Neck Operations Except Back or Neck Fusion Low
5,526 4,749
Back & Neck Operations Except Back or Neck Fusion High
5,993 5,850
Insertion of Heart Defibrillator Low 33,299 28,828 Insertion of Heart Defibrillator High 42,756 38,232 Head and Neck Blood Vessel Operations Low 5,988 5,259 Head and Neck Blood Vessel Operations High 6,658 6,364
Tomorrow’s Medicine: A Report on the Future of Health Care Delivery in Washington State 8
______________________________
Despite overall increases in funding, the Medicaid “per service” fee paid to physicians has decreased. Medicaid pays about one-third the rate of private insurers and for most medical practices, Medicaid payments fail to cover the
cost of the services provided. ______________________________
Medicaid and Other Publicly Funded Health Programs Increase Access for Kids but Put Pressure on Emergency Departments
In most state budgets, Medicaid program expenditures rank second only to education programs, consuming on average around 20 percent of the budget.19 Approximately 27 percent of enrollees who are aged, blind, and disabled account for 72 percent of Medicaid expenditures.20
Nationally, Medicaid enrollment among the aged and disabled grew about 2.9 percent per year between 2000 and 2003. Enrollment for families increased 11.6 percent between 2000 - 2002 , and another 7.1 percent between 2002 and 2003. Enrollment growth was largely attributable to the economic slowdown following the stock market correction of 2001.21
Medicaid Expenditures - In 2004, Medicaid personal health care expenditures for physicians’ services in Washington were $542 million dollars, out of the national total of $27.4 billion. The average annual percent of growth in Medicaid physician services in Washington (1980-2004) was 10.6 percent, identical to the national percent of growth.22
In 2003, the Medicaid spending growth rate in Washington slowed due to continued drug cost containment efforts.23 The spending growth decelerated from 8.8 percent in 2003 to 7.9 percent in fiscal year 2004. Despite this shift, the rate of increase in Medicaid costs in Washington and nationally continues to outpace state revenue growth, straining state finances.
Despite overall increases in funding, the Medicaid “per service” fee paid to physicians has decreased. Medicaid pays about one-third the rate of private insurers and for most medical practices, Medicaid payments fail to cover the cost of the services provided.24
Federal regulations require states to maintain a network of providers adequate to serve the people enrolled in the program. In Washington, this network is disappearing. In a recent sampling of WSMA member physicians: 25
• 30 percent of respondents said they have begun limiting the number of Medicaid Healthy Options and Basic Health Plan (BHP) patients they can treat;
• Another 28 percent have decided to drop all Medicaid Healthy Options patients, up 10 percent from a previous poll conducted earlier in the year;26 and,
• 24 percent have decided to drop all BHP patients, up nine percent from a previous poll conducted earlier in the year.
(For additional data on Medicaid, see Appendix B.)
Tomorrow’s Medicine: A Report on the Future of Health Care Delivery in Washington State 9
In Washington, state-funded health care expenditures in FY2003 were $7.7 billion, compared to $7.3 billion in FY2002 (See Appendix B).27 These figures include expenditures for Medicaid, the State Children's Health Insurance Program, state employees' health benefits, corrections, higher education, insurance and access expansion, public health-related expenditures, state facility-based services, and community-based services.
Increases in the Cost of Insurance Decline in Commercial Health Insurance Market
National trends in health insurance reveal that in 2005, the total costs of health benefits for all employers slowed for the third straight year.28 In 2002, the annual rate of increase peaked at 14.7 percent, followed by rates of 10.1 percent, 7.5 percent, and 6.1 percent for 2003-2005.
Large employers (500+ employees) also have experienced a moderating increase trend since 2001, peaking that year at 12.1 percent, followed by rates of 11.5 percent, 10.2 percent, 9.0 percent and 6.7 percent for 2002-2005. The 2006 increase is estimated to be about 7.2 percent for this population.29
Possible reasons for this declining trend include:
• Employers are shifting costs to employees via changes in health plan offerings (e.g., increases in employee premium participation, coinsurance and deductibles; and tiered prescription drug benefits). Currently in favor: new consumer directed health plans (CDHPs) offerings and preferred provider organizations (PPOs). CDHPs typically offer a Health Savings Account (HSA) in conjunction with a high deductible health insurance policy. The shift to PPOs also rose steadily from 1998-2005, growing from 36 percent to 58 percent of the plans selected.30
• Cost shifting may also be blunting the use of services.
• Reduction in the number of plan options offered to employees, thereby reducing administrative overhead.
• Positive effects and return on investment in implementing “health management” strategies.
Regardless, employers of all sizes have made it abundantly clear that they cannot continue to support the cost of health care benefits.
In the western US, from 2003-2005, the shift to new forms of coverage and/or delivery mechanisms has largely followed national trends:
• PPO enrollment remained relatively flat over that three-year period (86 percent, 88 percent, and 85 percent per year, respectively).
• Indemnity plans lost substantial ground (21 percent, 14 percent, and 10 percent) as did Point of Service (POS) plans, but to a lesser degree (19 percent, 18 percent, 14 percent).
• Not surprisingly, however, HMOs faired better (63 percent, 65 percent, and 62 percent) in the western region, given their long history of acceptance by patients.
Only a small percentage of large employers have offered consumer directed health plans in the western US over the 2003-2005 period (1 percent, 4 percent, 7 percent). Employees’ adoption over that period was minimal (1 percent, 1 percent, 2 percent). (See Appendix C.)
Tomorrow’s Medicine: A Report on the Future of Health Care Delivery in Washington State 10
______________________________
The study estimated that nearly $1.4 billion in medical care costs – $738 million in hospital costs and $620 million in physician costs – were
shifted to Washington employers and other commercial customers in 2004 to offset payment shortfalls from Medicaid and Medicare.
______________________________
Public Program Cost-Shifting: The “Hidden Tax”
In May 2006, Premera Blue Cross publicly released a Milliman study it had commissioned revealing that low Medicare and Medicaid payment rates produce a “cost-shifting” effect, driving up premiums paid by employer-sponsored health insurance -- a so-called “hidden tax”.31
According to the Milliman study, Medicare pays physicians 20 to 26 percent less than commercial insurers in King County, and 25 to 31 percent less elsewhere in the state. Medicaid pays 31 to 36 percent less than commercial insurers for children’s office visits; 50 to 54 percent less for adult office visits; 11 to 18 percent less for maternity services; and 55 to 58 percent less for other medical services.
The study estimated that nearly $1.4 billion in medical care costs -- $738 million in hospital costs and $620 million in physician costs – were shifted to Washington employers and other commercial customers in 2004 to offset payment shortfalls from Medicaid and Medicare. This was an average of $902 per family health insurance contract, and represented 13 percent of all commercial hospital and physician costs.
Physicians’ Practices Face Continued Threats to Their Viability
Physicians’ practices in Washington continue to struggle to maintain their viability, confronted by rising overhead costs and administrative burdens, including significant increases in recent years to physicians’ professional liability (medical malpractice) insurance premiums. Washington practices must compete against other more medical practice-friendly states to recruit physicians and other skilled clinical and administrative staff.
Small and midsize practices are particularly affected in their efforts to remain viable, lacking the economies of scale of larger practices. These practices have less leverage with health insurers to negotiate reasonable reimbursement rates. Yet, without them, there is inadequate system capacity to meet the needs of Washington’s citizens.
Practice Revenues Decline as Costs Rise
Physician practice net revenues have declined as operating costs have increased. For 2003-2004, operating margins per full-time-equivalent physician in primary care practices decreased by:32
• 5.5 percent for internal medicine single specialty groups, • 3.9 percent for primary care multi-specialty practices (not hospital-owned), and • 0.6 percent for family medicine single specialty practices.33
Tomorrow’s Medicine: A Report on the Future of Health Care Delivery in Washington State 11
Between 1995 and 2003, physicians' net income declined about seven percent after adjusting for inflation. This decline in real income contrasts to the wage trends for other professionals who realized a seven percent increase over the same period. Primary care physicians were hardest hit with a 10.2 percent decline, while surgeons' income declined by 8.2 percent.34
Physicians’ practices, especially smaller practices, have difficulty in accessing capital resources to modernize and invest in their operations, especially for accounts receivable management, and health information technology (electronic medical records).35
For example, estimates for the acquisition and implementation of an electronic medical record (EMR) system ranges around $44,000 per physician, with an additional $12,000 in annual maintenance fees.36 In addition to the expense associated with implementing an EMR, medical practices are confronted by the reality that the benefits of such systems accrue largely to those who do not have to foot the bill.
Compliance with federal and state regulatory requirements also imposes substantial costs on practices. A noteworthy example is the federal Health Insurance Portability and Accountability Act of 1996 (HIPAA). The actual costs levied on physicians’ practices to comply with HIPAA are substantial, but difficult to measure with precision. One survey found that 90 percent of small practices surveyed had budgeted less than $100,000 on HIPAA compliance in 2002. The remainder of the groups budgeted between $100,000 and $300,000.37
Nationally, in 2004, the average practice’s operating costs consumed 62 percent of practice revenue.38
For the western US region, an average 70 percent of total practice revenue was consumed by non-medical expenses (primarily overhead costs and personnel).39
Single and multi-specialty physician practices reported in a recent survey that nearly 33 percent of their accounts receivable were over sixty days old.40 This measure indicates the level of delay that practices encounter in obtaining payment from patients and insurance sources. The longer the delay, the greater the amount of labor costs required to collect on services already rendered, further decreasing the practice’s net income.
In 2004, surveys demonstrated that practices limited the combined share of Medicaid and Medicare patients to less than 50 percent and often less than 25 percent of their patients in order to maintain financial viability. Private practices reported that they had no more capacity to see Medicaid, Medicare, and Basic Health Plan patients. Between 65 - 95 percent of private practitioners in urban counties and 20 - 60 percent of private practices with rural health clinic certification report that their clinics are closed to or significantly restrict new public program patients.41
The Medical Tort System Drives Costs Up and Access Down – For many physician specialties – particularly family practice (when obstetrical care is included), obstetrics and gynecology, and neurosurgery – the cost of medical malpractice coverage is becoming prohibitive.
Beyond the insurance premium costs associated with the current tort system, the system promotes unnecessary services (defensive medicine) and compels many physicians to limit their exposure to potentially high risk services.
Physicians Insurance A Mutual Company (owned by its 5,800+ physician policy holders and the largest medical liability insurer in the state with over 60 percent of the market) reports that between 2000 and April 30, 2004:
Tomorrow’s Medicine: A Report on the Future of Health Care Delivery in Washington State 12
______________________________
Beyond the insurance premium costs associated with the current tort system, the system promotes unnecessary services (defensive medicine) and
compels many physicians to limit their exposure to potentially high risk services.
______________________________
• 14 percent of the obstetricians/gynecologists it insured dropped delivery services (37 of 264). • 39 percent of the family physicians it insured dropped delivery services (150 of 386). • Combined – 29 percent of the Ob-Gyns and FPs insured by the company (187 of 650) stopped
providing delivery services over the four-year period.
The system’s impact on access-to-care -- and costs -- is measurable. A 2004 poll found:42
• 51 percent of physicians reported that all, most or some of their patients had had to leave their practice for certain services that they no longer offered.
• 71 percent reported their patients have had to travel further to receive care. • 32 percent reported increasing the number of lower risk patients they see. • 51 percent reported they are less willing to perform high-risk procedures. • 44 percent had stopped certain high-risk services.
Regulations and Mandated Benefits Impose Costs – State regulation plays a major role in driving up the cost and reducing the accessibility of affordable health insurance.43 Some of the reasons costs are going up are clearly beyond the control of state policymakers, but there is one key factor that is often overlooked – the costs imposed by mandates, the laws that limit the kind of health insurance that can be sold in our state.
A mandated health benefit, according to the legal definition is “coverage or offering required by law to be provided by a health carrier to: (a) Cover a specific health care service or services; (b) cover treatment of specific condition or conditions; or (c) contract, pay, or reimburse specific categories of health care providers for specific services…”
Beginning with a single mandate in 1963, the number of new and amended mandates in Washington has now grown to 47 (Chart 5). In recent years, their number has grown rapidly. Between 1982 and 1990, they tripled from 10 to 30, and from 1993 to 2001, their number increased by a further 50 percent.44
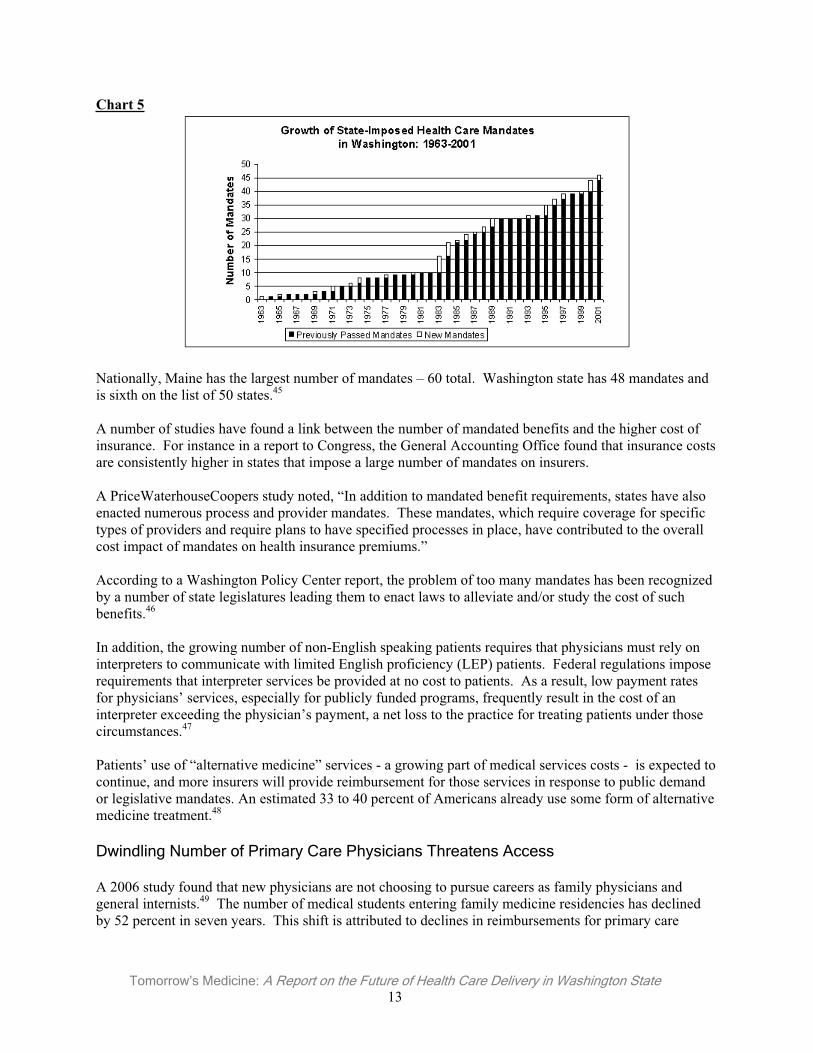
Tomorrow’s Medicine: A Report on the Future of Health Care Delivery in Washington State 13
Chart 5
Nationally, Maine has the largest number of mandates – 60 total. Washington state has 48 mandates and is sixth on the list of 50 states.45
A number of studies have found a link between the number of mandated benefits and the higher cost of insurance. For instance in a report to Congress, the General Accounting Office found that insurance costs are consistently higher in states that impose a large number of mandates on insurers.
A PriceWaterhouseCoopers study noted, “In addition to mandated benefit requirements, states have also enacted numerous process and provider mandates. These mandates, which require coverage for specific types of providers and require plans to have specified processes in place, have contributed to the overall cost impact of mandates on health insurance premiums.”
According to a Washington Policy Center report, the problem of too many mandates has been recognized by a number of state legislatures leading them to enact laws to alleviate and/or study the cost of such benefits.46
In addition, the growing number of non-English speaking patients requires that physicians must rely on interpreters to communicate with limited English proficiency (LEP) patients. Federal regulations impose requirements that interpreter services be provided at no cost to patients. As a result, low payment rates for physicians’ services, especially for publicly funded programs, frequently result in the cost of an interpreter exceeding the physician’s payment, a net loss to the practice for treating patients under those circumstances.47
Patients’ use of “alternative medicine” services - a growing part of medical services costs - is expected to continue, and more insurers will provide reimbursement for those services in response to public demand or legislative mandates. An estimated 33 to 40 percent of Americans already use some form of alternative medicine treatment.48
Dwindling Number of Primary Care Physicians Threatens Access
A 2006 study found that new physicians are not choosing to pursue careers as family physicians and general internists.49 The number of medical students entering family medicine residencies has declined by 52 percent in seven years. This shift is attributed to declines in reimbursements for primary care
Tomorrow’s Medicine: A Report on the Future of Health Care Delivery in Washington State 14
______________________________
Contrary to common belief, most patients who visit emergency departments have health insurance, according to a 2006 study published by ACEP.
______________________________
services, increasing student-loan debts, reductions in funding for the training of family physicians, and the challenges and complexities of caring for an aging population.
Primary care physicians (PCP) are taking care of fewer patients who are hospitalized, with full-time hospitalists assuming the care of these patients. As a result, PCPs are dropping their active medical staff membership to reduce their inpatient care and emergency on-call burdens.50 This, in turn, affects the effective coordination of care and continuity of services.
Emergency Departments are Overburdened
When physician practices begin to limit new patients they can take, or close entirely, patients must find care elsewhere – typically at their local emergency department (ED).
In 2006, the American College of Emergency Physicians (ACEP) released its first national report card, grading each state on the support it provides for its emergency medical system.51 ACEP gave Washington an overall grade of D+. Washington ranked 40th in the nation due to its inadequate support of an emergency care system to meet the needs of its citizens.
Nationally, in 2003, emergency departments received nearly 114 million patients -- a 26 percent increase over the previous decade -- but the country experienced a net loss of 703 hospitals and 425 EDs during the same ten-year period.52
Contrary to common belief, most patients who visit emergency departments have health insurance, according to a 2006 study published by ACEP.53 According to the study conducted by the Robert Wood Johnson Foundation and the University of California - San Francisco:
• About 84 percent of frequent ED users (those visiting EDs four or more times per year) had health insurance.
• 81 percent had a source of coverage for primary care. • Many of these ED patients with insurance use the ED when they cannot get in to see their usual
doctor.• Some ED patients are simply waiting for hospital beds.
A 2001 statewide survey of hospital emergency department directors found:54
• 91 percent of small hospitals and 100 percent of large hospitals reported that they have an overcrowding problem.
• 76 percent of large hospitals reported an overcrowding frequency of two to three times per week or greater.
• 81 percent of large hospitals and 60 percent of small hospitals expect emergency department overcrowding to increase in the future.
Tomorrow’s Medicine: A Report on the Future of Health Care Delivery in Washington State 15
______________________________
The data shows an increase in the number of Washingtonians covered by group insurance and a decrease in the percentage of Washingtonians who
lack health insurance. ______________________________
Overcrowding occurs in an emergency department when its capacity to “move” patients is gridlocked (too many patients arriving and too few patients departing).
The data cast doubt on whether expanding health insurance coverage alone will solve the problem of ED overcrowding.
Health Care in Washington is in Transition
The Number of Uninsureds is Down but System Dysfunctionality is Worsening
The ability of patients to receive health care services – in the right setting, at the right time and appropriate to the needs of the patient – is the true test of the functionality of a health care system.
The data shows an increase in the number of Washingtonians covered by group insurance and a decrease in the percentage of Washingtonians who lack health insurance. However, having health insurance does not guarantee access to care – nor access to cost-efficient, care-efficient services. The health care delivery system remains fraught with inefficiencies, fragmented services, costly variations in the services provided, and a disturbing crease in the capacity of the system to care for the citizens of the state.These issues are discussed elsewhere in this report.
The following data examine the distribution of health insurance across employer-sponsored coverage, government-sponsored programs, as well as those who obtain insurance as individuals, and those who have no health insurance coverage.
Washington state does not require employers or private insurance companies to report statistics on group insurance coverage and benefits utilization. As a result, comprehensive data can be difficult to identify. There are some notable examples of data gathering, however, including the following:
• In 1989, the Basic Health Plan Technical Advisory Committee (TAC) - A Final Report provided accurate survey data on the extent of group health insurance coverage in Washington state. 55
• In 2003- 2004, Insurance Commissioner Mike Kreidler convened the “Let’s Get Washington Covered” Task Force, and complied extensive data on health insurance coverage in Washington.
• In 2005, Washington state released its fourth annual report of its state-planning grant to conduct activities to cover the uninsured, consistent with federal goals set in Healthy People 2010. 56
The Washington State Population Survey (Chart 6) is an important ongoing source of information about the health and welfare of Washington families.57 This survey, conducted in spring 2004 for the fourth time, focused primarily on issues of employment, family poverty, in-migration, health, and health insurance coverage.58
de
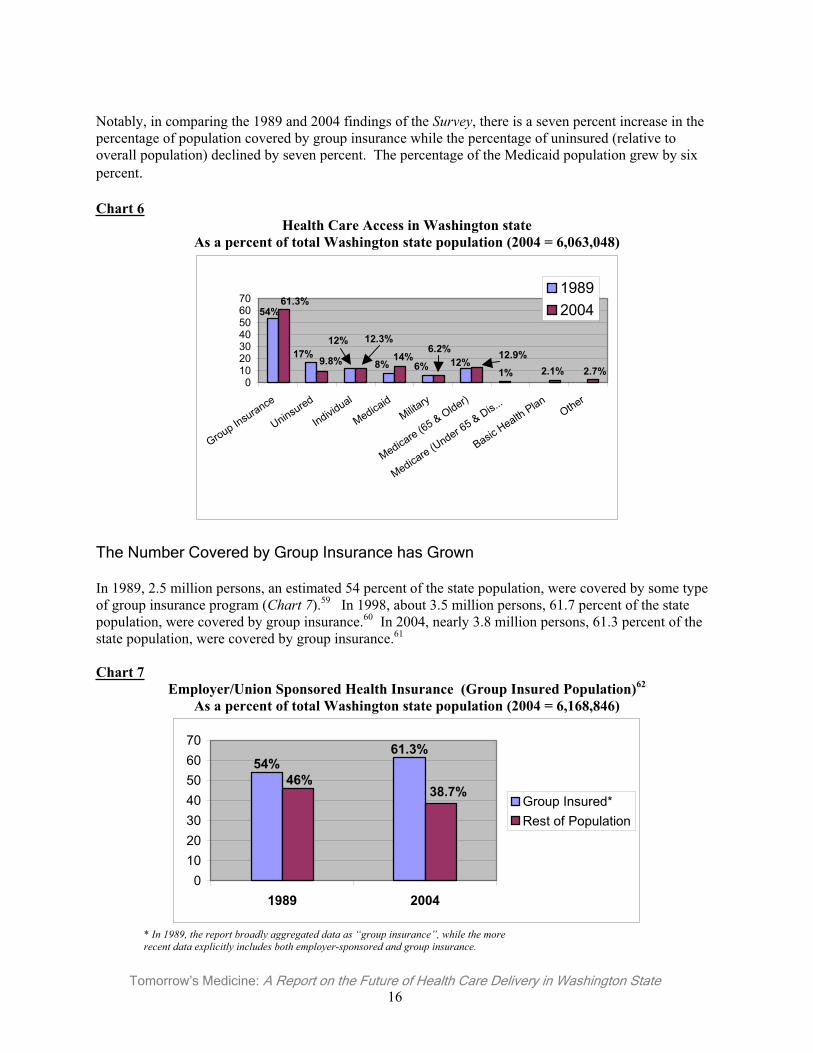
Tomorrow’s Medicine: A Report on the Future of Health Care Delivery in Washington State 16
Notably, in comparing the 1989 and 2004 findings of the Survey, there is a seven percent increase in the percentage of population covered by group insurance while the percentage of uninsured (relative to overall population) declined by seven percent. The percentage of the Medicaid population grew by six percent.
Chart 6Health Care Access in Washington state
As a percent of total Washington state population (2004 = 6,063,048)
1%12%6%8%
12%17%
54%
2.7%2.1%12.9%6.2%
14%
12.3%
9.8%
61.3%
010203040506070
Group Insurance
Uninsured
Individual
MedicaidMilita
ry
Medicare (65 & Older)
Medicare (Under 65 & Dis...
BasicHealth
PlanOther
19892004
The Number Covered by Group Insurance has Grown
In 1989, 2.5 million persons, an estimated 54 percent of the state population, were covered by some type of group insurance program (Chart 7).59 In 1998, about 3.5 million persons, 61.7 percent of the state population, were covered by group insurance.60 In 2004, nearly 3.8 million persons, 61.3 percent of the state population, were covered by group insurance.61
Chart 7Employer/Union Sponsored Health Insurance (Group Insured Population)62
As a percent of total Washington state population (2004 = 6,168,846)
61.3%54%
38.7%46%
010203040506070
1989 2004
Group Insured*Rest of Population
* In 1989, the report broadly aggregated data as “group insurance”, while the more recent data explicitly includes both employer-sponsored and group insurance.
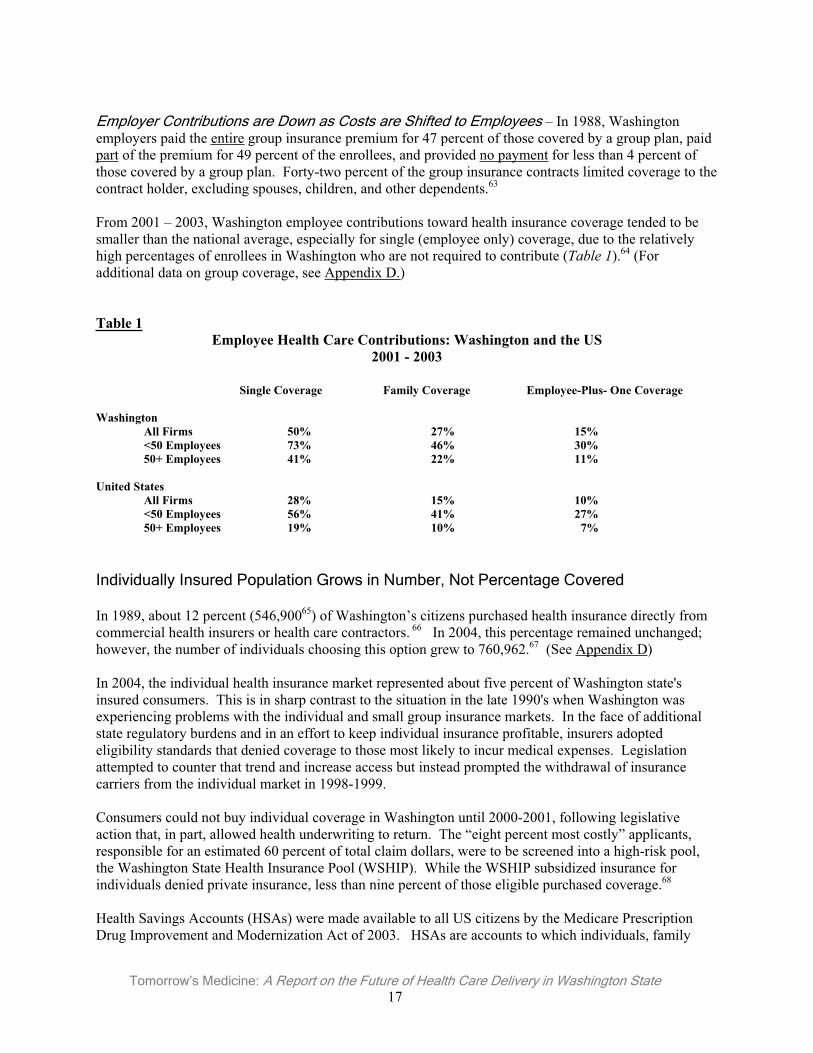
Tomorrow’s Medicine: A Report on the Future of Health Care Delivery in Washington State 17
Employer Contributions are Down as Costs are Shifted to Employees – In 1988, Washington employers paid the entire group insurance premium for 47 percent of those covered by a group plan, paid part of the premium for 49 percent of the enrollees, and provided no payment for less than 4 percent of those covered by a group plan. Forty-two percent of the group insurance contracts limited coverage to the contract holder, excluding spouses, children, and other dependents.63
From 2001 – 2003, Washington employee contributions toward health insurance coverage tended to be smaller than the national average, especially for single (employee only) coverage, due to the relatively high percentages of enrollees in Washington who are not required to contribute (Table 1).64 (For additional data on group coverage, see Appendix D.)
Table 1Employee Health Care Contributions: Washington and the US
2001 - 2003
Single Coverage Family Coverage Employee-Plus- One Coverage
Washington All Firms 50% 27% 15% <50 Employees 73% 46% 30% 50+ Employees 41% 22% 11%
United States All Firms 28% 15% 10%
<50 Employees 56% 41% 27% 50+ Employees 19% 10% 7%
Individually Insured Population Grows in Number, Not Percentage Covered
In 1989, about 12 percent (546,90065) of Washington’s citizens purchased health insurance directly from commercial health insurers or health care contractors. 66 In 2004, this percentage remained unchanged; however, the number of individuals choosing this option grew to 760,962.67 (See Appendix D)
In 2004, the individual health insurance market represented about five percent of Washington state's insured consumers. This is in sharp contrast to the situation in the late 1990's when Washington was experiencing problems with the individual and small group insurance markets. In the face of additional state regulatory burdens and in an effort to keep individual insurance profitable, insurers adopted eligibility standards that denied coverage to those most likely to incur medical expenses. Legislation attempted to counter that trend and increase access but instead prompted the withdrawal of insurance carriers from the individual market in 1998-1999.
Consumers could not buy individual coverage in Washington until 2000-2001, following legislative action that, in part, allowed health underwriting to return. The “eight percent most costly” applicants, responsible for an estimated 60 percent of total claim dollars, were to be screened into a high-risk pool, the Washington State Health Insurance Pool (WSHIP). While the WSHIP subsidized insurance for individuals denied private insurance, less than nine percent of those eligible purchased coverage.68
Health Savings Accounts (HSAs) were made available to all US citizens by the Medicare Prescription Drug Improvement and Modernization Act of 2003. HSAs are accounts to which individuals, family
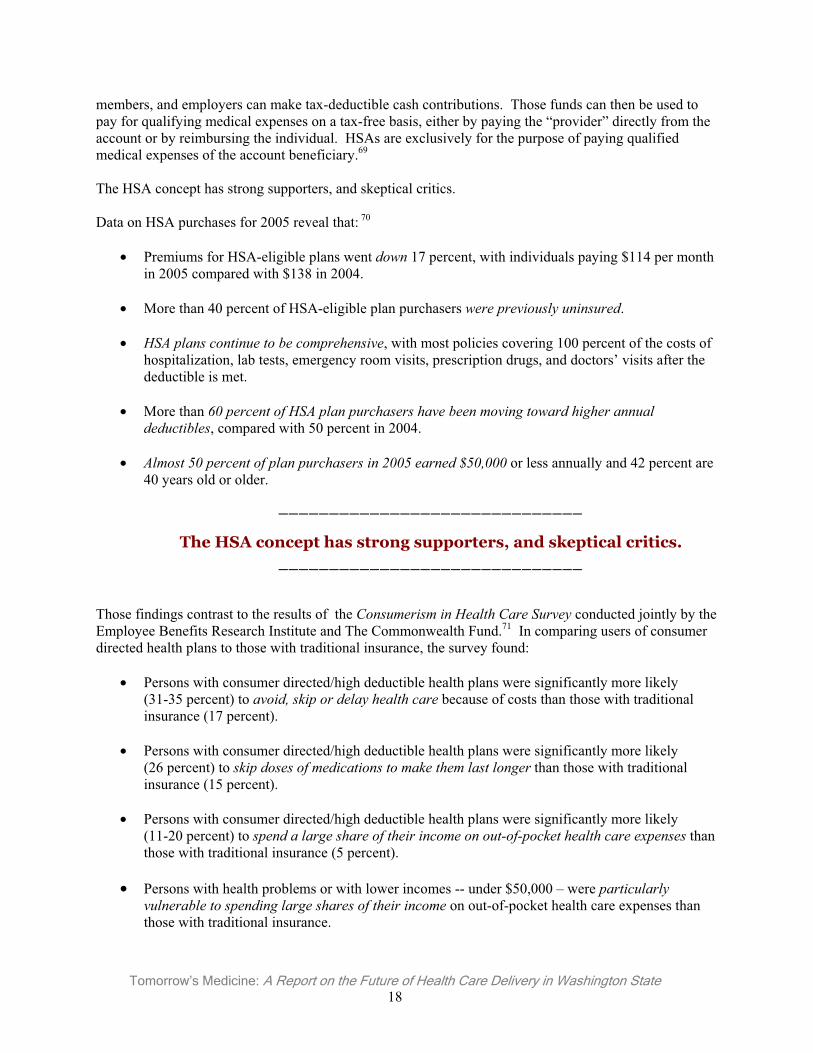
Tomorrow’s Medicine: A Report on the Future of Health Care Delivery in Washington State 18
______________________________
The HSA concept has strong supporters, and skeptical critics. ______________________________
members, and employers can make tax-deductible cash contributions. Those funds can then be used to pay for qualifying medical expenses on a tax-free basis, either by paying the “provider” directly from the account or by reimbursing the individual. HSAs are exclusively for the purpose of paying qualified medical expenses of the account beneficiary.69
The HSA concept has strong supporters, and skeptical critics.
Data on HSA purchases for 2005 reveal that: 70
• Premiums for HSA-eligible plans went down 17 percent, with individuals paying $114 per month in 2005 compared with $138 in 2004.
• More than 40 percent of HSA-eligible plan purchasers were previously uninsured.
• HSA plans continue to be comprehensive, with most policies covering 100 percent of the costs of hospitalization, lab tests, emergency room visits, prescription drugs, and doctors’ visits after the deductible is met.
• More than 60 percent of HSA plan purchasers have been moving toward higher annual deductibles, compared with 50 percent in 2004.
• Almost 50 percent of plan purchasers in 2005 earned $50,000 or less annually and 42 percent are 40 years old or older.
Those findings contrast to the results of the Consumerism in Health Care Survey conducted jointly by the Employee Benefits Research Institute and The Commonwealth Fund.71 In comparing users of consumer directed health plans to those with traditional insurance, the survey found:
• Persons with consumer directed/high deductible health plans were significantly more likely (31-35 percent) to avoid, skip or delay health care because of costs than those with traditional insurance (17 percent).
• Persons with consumer directed/high deductible health plans were significantly more likely (26 percent) to skip doses of medications to make them last longer than those with traditional insurance (15 percent).
• Persons with consumer directed/high deductible health plans were significantly more likely (11-20 percent) to spend a large share of their income on out-of-pocket health care expenses than those with traditional insurance (5 percent).
• Persons with health problems or with lower incomes -- under $50,000 – were particularlyvulnerable to spending large shares of their income on out-of-pocket health care expenses than those with traditional insurance.
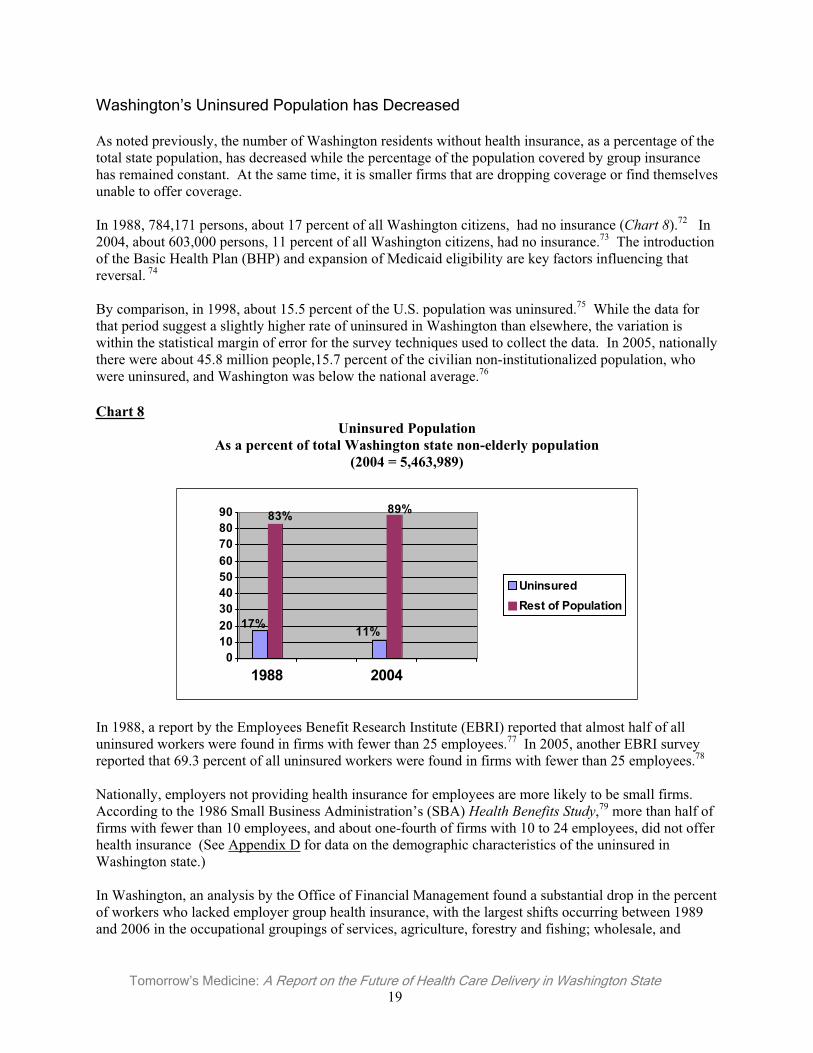
Tomorrow’s Medicine: A Report on the Future of Health Care Delivery in Washington State 19
Washington’s Uninsured Population has Decreased
As noted previously, the number of Washington residents without health insurance, as a percentage of the total state population, has decreased while the percentage of the population covered by group insurance has remained constant. At the same time, it is smaller firms that are dropping coverage or find themselves unable to offer coverage.
In 1988, 784,171 persons, about 17 percent of all Washington citizens, had no insurance (Chart 8).72 In 2004, about 603,000 persons, 11 percent of all Washington citizens, had no insurance.73 The introduction of the Basic Health Plan (BHP) and expansion of Medicaid eligibility are key factors influencing that reversal. 74
By comparison, in 1998, about 15.5 percent of the U.S. population was uninsured.75 While the data for that period suggest a slightly higher rate of uninsured in Washington than elsewhere, the variation is within the statistical margin of error for the survey techniques used to collect the data. In 2005, nationally there were about 45.8 million people,15.7 percent of the civilian non-institutionalized population, who were uninsured, and Washington was below the national average.76
Chart 8Uninsured Population
As a percent of total Washington state non-elderly population (2004 = 5,463,989)
17%
83%
11%
89%
0102030405060708090
1988 2004
UninsuredRest of Population
In 1988, a report by the Employees Benefit Research Institute (EBRI) reported that almost half of all uninsured workers were found in firms with fewer than 25 employees.77 In 2005, another EBRI survey reported that 69.3 percent of all uninsured workers were found in firms with fewer than 25 employees.78
Nationally, employers not providing health insurance for employees are more likely to be small firms. According to the 1986 Small Business Administration’s (SBA) Health Benefits Study,79 more than half of firms with fewer than 10 employees, and about one-fourth of firms with 10 to 24 employees, did not offer health insurance (See Appendix D for data on the demographic characteristics of the uninsured in Washington state.)
In Washington, an analysis by the Office of Financial Management found a substantial drop in the percent of workers who lacked employer group health insurance, with the largest shifts occurring between 1989 and 2006 in the occupational groupings of services, agriculture, forestry and fishing; wholesale, and
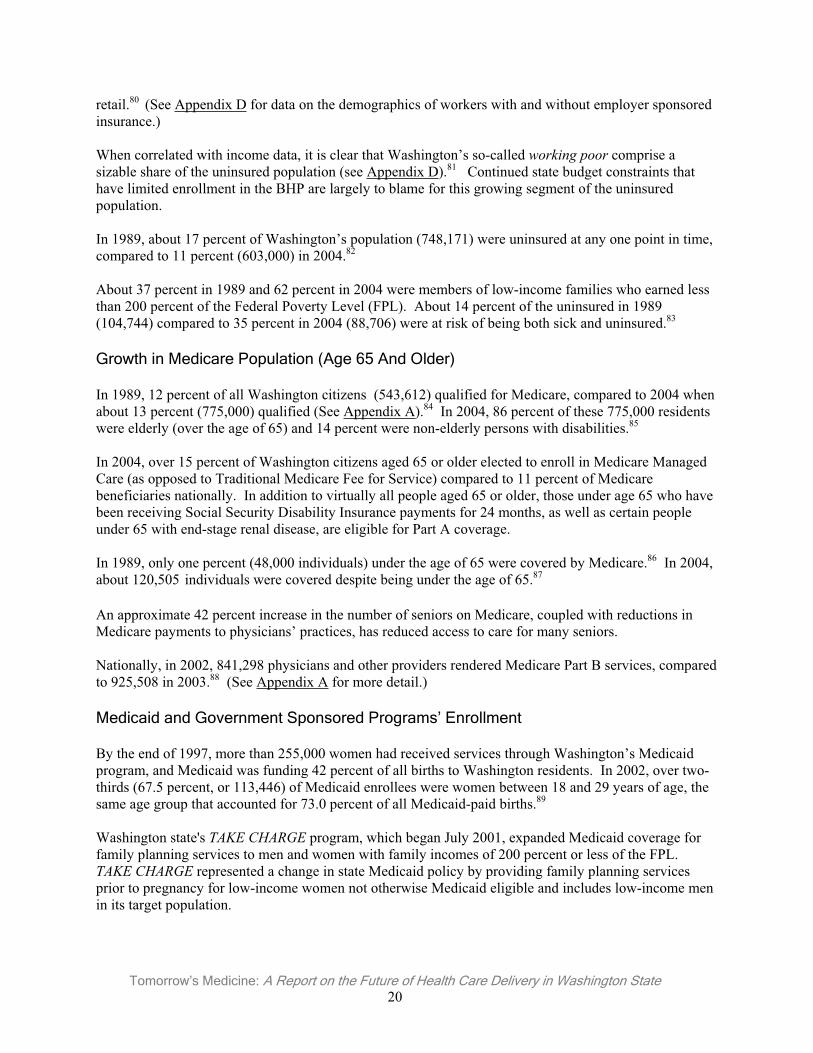
Tomorrow’s Medicine: A Report on the Future of Health Care Delivery in Washington State 20
retail.80 (See Appendix D for data on the demographics of workers with and without employer sponsored insurance.)
When correlated with income data, it is clear that Washington’s so-called working poor comprise a sizable share of the uninsured population (see Appendix D).81 Continued state budget constraints that have limited enrollment in the BHP are largely to blame for this growing segment of the uninsured population.
In 1989, about 17 percent of Washington’s population (748,171) were uninsured at any one point in time, compared to 11 percent (603,000) in 2004.82
About 37 percent in 1989 and 62 percent in 2004 were members of low-income families who earned less than 200 percent of the Federal Poverty Level (FPL). About 14 percent of the uninsured in 1989 (104,744) compared to 35 percent in 2004 (88,706) were at risk of being both sick and uninsured.83
Growth in Medicare Population (Age 65 And Older)
In 1989, 12 percent of all Washington citizens (543,612) qualified for Medicare, compared to 2004 when about 13 percent (775,000) qualified (See Appendix A).84 In 2004, 86 percent of these 775,000 residents were elderly (over the age of 65) and 14 percent were non-elderly persons with disabilities.85
In 2004, over 15 percent of Washington citizens aged 65 or older elected to enroll in Medicare Managed Care (as opposed to Traditional Medicare Fee for Service) compared to 11 percent of Medicare beneficiaries nationally. In addition to virtually all people aged 65 or older, those under age 65 who have been receiving Social Security Disability Insurance payments for 24 months, as well as certain people under 65 with end-stage renal disease, are eligible for Part A coverage.
In 1989, only one percent (48,000 individuals) under the age of 65 were covered by Medicare.86 In 2004, about 120,505 individuals were covered despite being under the age of 65.87
An approximate 42 percent increase in the number of seniors on Medicare, coupled with reductions in Medicare payments to physicians’ practices, has reduced access to care for many seniors.
Nationally, in 2002, 841,298 physicians and other providers rendered Medicare Part B services, compared to 925,508 in 2003.88 (See Appendix A for more detail.)
Medicaid and Government Sponsored Programs’ Enrollment
By the end of 1997, more than 255,000 women had received services through Washington’s Medicaid program, and Medicaid was funding 42 percent of all births to Washington residents. In 2002, over two-thirds (67.5 percent, or 113,446) of Medicaid enrollees were women between 18 and 29 years of age, the same age group that accounted for 73.0 percent of all Medicaid-paid births.89
Washington state's TAKE CHARGE program, which began July 2001, expanded Medicaid coverage for family planning services to men and women with family incomes of 200 percent or less of the FPL. TAKE CHARGE represented a change in state Medicaid policy by providing family planning services prior to pregnancy for low-income women not otherwise Medicaid eligible and includes low-income men in its target population.
Tomorrow’s Medicine: A Report on the Future of Health Care Delivery in Washington State 21
In 1989, about 12 percent90 of the state’s population (361,020) were eligible for some type of state medical assistance91 compared to 2002 when about 15 percent (940,693) were eligible.92 Two Medicaid (Title XIX of the federal Social Security Act) programs protect almost 95 percent of this group: Categorically Needy and Medically Needy (for additional data on Medicaid, see Appendix B).
Basic Health Plan Shows Promise But Stymied by Budget Constraints – In 1986, the Washington Health Care Project Commission (the McPhaden Commission), created by the legislature, issued its report that became the basis for the Basic Health Plan (BHP) and a state high-risk pool.93 The legislature created the BHP via passage of the Health Care Access Act of 1987. At that time, an estimated 12-14 percent of Washington residents were uninsured. The primary goal of the BHP was to provide state subsidized basic health care for the working poor who are otherwise uninsured.
Following pilot projects, open to 4,000 residents in King and Spokane counties, the legislature initially limited enrollment to 30,000 individuals, under age 65, who were ineligible for Medicare, and who had a gross family income at, or below, 200 percent of the FPL. Enrollees obtained care from a managed delivery system and paid part of the cost of their premium under an income-related sliding fee scale.
By June 2006, the BHP enrolled 99,788 individuals.94 Enrollment has fluctuated due to the degree of funding legislators have been willing to provide as the state has experienced its economic cycles since 1994.
Other Mechanisms Pick-up Some, But Not All, of the Slack – In 1989, Community Clinics served about 155,000 medical patients per year. While Medicaid covered 22 percent of these patients, 66 percent had no other health care coverage. In 2002, these centers served 391,246 patients in Washington.95
This population is usually poor or near poor, with 62 percent having incomes below the FPL.96 These patients are typically served in a Community Health Center, Migrant Health Center or in an Indian Health Center.
In 2004, Federally Qualified Health Centers (FQHC), which includes Community Health Centers, Migrant Health Centers, Indian Health Centers, and FQHC “look-alikes”, were responsible for providing a disproportionately large percentage of local primary care to serve low-income patients and especially the uninsured.
In 2004, Washington’s free clinics provided more than 40,000 patient visits. Although the number and capacity of charity clinics has grown along with access concerns, in most areas charity clinics represent far less than one percent of physician capacity.97
Another example of Washington physicians’ commitment to provide charity care is Project Access.These county-level initiatives engage physicians to voluntarily treat indigent patients at no charge. The Spokane County Medical Society began the first Project Access in this state in 2003. Already this project has provided over $2.5 million in charity care, with over 650 physicians participating. The Thurston-Mason County Medical Society launched its project in 2005, and both the Clark and King County Medical Societies have projects under active development.
The Uncompensated Care Burden Continues
Another source of medical care for the uninsured population is uncompensated care -- unpaid bills for medical services provided by hospitals and physicians (where there is no third party payer such as Medicaid or insurance).
Tomorrow’s Medicine: A Report on the Future of Health Care Delivery in Washington State 22
______________________________
The decline in reimbursement by public and private payershas created financial pressures that are limiting physicians’
ability to provide charity care. ______________________________
The traditional view of uncompensated care distinguishes between charity care and bad debt. Charity care is usually provided to medically indigent persons who have no health insurance. Bad debt is generated by persons who are presumed to be able to pay, but do not, even after the practice has exhausted reasonable attempts to collect the debt. The distinction between these two categories is not always well defined and not all uncompensated care is fully reported.
Nationally, a recent study found that there was little change in the amount of charity care provided during the late 1990s and 2000s. From 1996-97 to 2004-05, the average number of hours spent providing charity care and the percentage of practice time spent on charity care both declined slightly.98
The study also showed a decrease in the proportion of physicians providing charity care, dropping from 71.5 percent of those surveyed in 2000-2001 to 68.2 percent in 2004-2005. The actual number of physicians providing charity care, however, has remained relatively stable as the overall number of U.S. physicians engaged in active medical practice has increased from approximately 347,000 in 1996-97 to 397,000 in 2004-05.99
The study suggests that the long-term decline in charity care provided by physicians may have contributed to reductions in uninsured people’s access to medical care. In 2003, 63.1 percent of the uninsured had a regular source of medical care, down from 68.6 percent in 1996-97. Additionally, the percentage of the uninsured with a physician visit in the past year fell from 51.6 percent to 46.1 percent during this period.100
The decline in reimbursement by public and private payers has created financial pressures that are limiting physicians’ ability to provide charity care, the study further suggested.
In 2003, the Washington Office of the Insurance Commissioner convened the “Let’s Get Washington Covered” Task Force and identified data on uncompensated care. For 2001, $318,515,652 in uncompensated care was provided in Washington, with $44,592,191, or 14 percent, provided through physicians’ practices.
Military-Related Population
The state’s military population eligible for some type of military-related health insurance has grown significantly, and is expected to grow through 2010. This population is essentially served by the Department of Veterans Affairs (VA) and has nominal impact on the state’s private insurance and public health care programs (additional data is provided in Appendix E).
Tomorrow’s Medicine: A Report on the Future of Health Care Delivery in Washington State 23
______________________________
Seeking a clinically sound and affordable balance between cost and quality will be a central focus of discussion for the foreseeable future.
______________________________
Quality vs. Costs: Which Way Will We Go?
There is no shortage of ideas on how to improve our health care system.
The upward spiral of health care costs – underwritten primarily by employer-purchasers and publicly funded programs, and exacerbated by variations in services provided from locale to locale, a distorted tort system, and other factors – have driven stakeholders to challenge the system to produce better “value” for that spending. Seeking a clinically sound and affordable balance between cost and quality will be a central focus of discussion for the foreseeable future.
While physicians are being pressed to demonstrate quality, the ability to measure quality is currently limited by statistical anomalies; the inadequacies of information systems; the complexity of health plans; and the availability of funding for such systems.101
Many Initiatives in Play; Consensus Still Being Sought
Quality of Care Projects – Nationally (A Sampling)
Dartmouth Atlas of Health Care - The Dartmouth Atlas Project describes how medical resources are distributed and used in the United States. The project offers comprehensive information and analysis about national, regional, and local markets, as well as individual hospitals and their affiliated physicians, in order to provide a basis for improving health and health care systems.
Those analyses indicate that Washington state makes more efficient and cost-effective use of physicians’ services.102 For example, expenditures for the care of chronically ill Medicare patients are well below the national average, with an effective balance in the use of primary care physicians and medical specialists.103
The Atlas also describes very significant variations in similar services provided from locale to locale, and within locales.
There is emerging evidence that variations in the delivery of care can contribute to higher total costs for health care services. Of course, each patient’s course of treatment is likely to vary, given the specifics of their clinical conditions and their response to care. Such variations, however, can be reduced through the adherence to “best practices” pathways that help identify options that are more clinically effective and cost-efficient.
Care in the last six of months of life is a key area of variations research. For example, one study identified a cohort of end-of-life patients cared for in a New York teaching hospital who made, on average, 67 visits to physicians; 57 percent saw ten or more physicians, and the average patient spent about 30 days in the hospital. Another cohort in Los Angeles made, on average, 44 visits to physicians, spent 9.2 days in intensive care, and 51 percent saw ten or more physicians. In contrast, a cohort in San
Tomorrow’s Medicine: A Report on the Future of Health Care Delivery in Washington State 24
Francisco made, on average, 27 visits to the physicians, spent less than 12 days in the hospital, and only 30 percent saw ten or more physicians.104
The cost of delivering services varies dramatically across the United States and within regions as well.While some degree of this variation is attributable to differing costs of operation across geographic regions (e.g., overhead, labor, professional liability insurance), other key components are attributable to the course of clinical treatment implemented.
Table 2 105
Cost of Care Variations in Medicare, Selected “Pacific States” Regions, 1992-1996
National Services Average Seattle Portland San Diego Los Angeles
Per Enrollee Reimbursements $3,650 $3,223 $2,993 $4,361 $4,179
Professional & Laboratory $ 975 $ 818 $ 648 $1,252 $1,426
Inpatient Hospital $1,852 $1,501 $1,556 $1,865 $2,129
Outpatient $ 319 $ 338 $ 306
AAPCC106 $5,291 $4,902 $4,613 $5,768 $7,049
Institute of Medicine - In 1996, the Institute of Medicine (IOM) introduced a multiphase quality initiative, first documenting the status of the quality of health care in the US and developing a framework for further study.107 The IOM next created the Committee on Quality of Heath Care in America, issuing two reports: To Err is Human: Building a Safer Health System in 1999 and Crossing the Quality Chasm: A New Health System for the 21st Century in 2001. These reports devised six aims for the health care system: health care should be safe, effective, patient-centered, timely, efficient, and equitable.
The IOM is currently focusing on performance measurement as an avenue to improve health care quality, and is examining available measures and frameworks to best use those measures in achieving process improvements.
American Medical Association - The American Medical Association (AMA) created the Physician Consortium for Performance Improvement, which seeks to improve quality of care by establishing performance measures. Many of its performance measures have been endorsed by the Centers for Medicare and Medicaid Services (CMS) and the National Quality Forum.
Quality and Cost of Care Projects - Washington State Initiatives
Governor Gregoire’s Health Care Agenda - In October 2005, Governor Gregoire convened a Health Care Summit to articulate her vision on how health care should be delivered, and afforded attendees the opportunity to recommend new ideas on how to structure the system so that it provides the best quality of care, reduces costs, and provides access to care for all of the people of the state.108
Tomorrow’s Medicine: A Report on the Future of Health Care Delivery in Washington State 25
In November 2005, the governor announced her Five Point Strategy to “make Washington a national leader in health care”: 109
• Emphasize evidence-based health care. • Promote, prevention, healthy lifestyles and healthy choices. • Better manage chronic care. • Create more transparency in the health care system. • Make better use of information technology.
In March 2006, the governor signed ESSHB 2575 into law, creating the State Health Technology Assessment Program (SHTAP) - a key component of her five-point plan.110 SHTAP tasks will include the determination of evidence-based practice center(s) to develop contracts for evidence-based technology assessments, and will form a Health Technology Clinical Committee to guide its work.
Blue Ribbon Commission on Health Care Costs and Access - In March 2006, the governor signed ESSB 6386 into law, funding creation of a Blue Ribbon Commission on Health Care Costs and Access.111
The Commission is charged with making recommendations by December 1, 2006 for a sustainable five-year plan for substantially improving access to affordable health care for all Washington residents.
Puget Sound Health Alliance - The Health Alliance was formed in late 2004, following recommendations from the King County Health Advisory Task Force commissioned by King County Executive Ron Sims.112 The task force recommended driving down the rate of health care cost growth by improving the value of care provided in the Puget Sound region. This is to be done through measuring, reporting and improving the quality of care, drawing from nationally recognized, evidence-based standards and measures such as those published by the Institute of Medicine.
The Health Alliance’s geographic scope covers King, Pierce, Kitsap, Thurston and Snohomish Counties. Its stated strategies include:113
• The use of collaborative approaches among employers, health plans, physicians and hospitals that reward high quality care.
• The involvement of neutral and qualified experts in the measurement, analysis, and reporting of health care quality and cost performance to build trust among all participants.
• The sharing of data in a regional public/private collaborative.• The increased use of evidence-based clinical decision guidelines and self-management tools. • The implementation of quality improvement principles, tools, and techniques.
WSMA Consensus Conference on Clinical Quality Measures -- In May 2005, the WSMA convened a Consensus Conference on Clinical Quality Measures, bringing together organizations and thought leaders to help set the course for quality improvement.114 Key findings from that conference included these recommendations:
• Seek agreement on existing clinical measures, rather than “recreate the wheel”. • Devise a functional set of standard measures as a beginning, rather than strive for a perfect set. • Consider “data aggregation” with adequate sample sizes, compiling data from various sources to
produce uniform reporting tools acceptable to all.• Use clinical measures to influence positive changes in patients’ behaviors, and that are easy to
implement in all physicians’ practices, especially small to midsize practices.
Tomorrow’s Medicine: A Report on the Future of Health Care Delivery in Washington State 26
______________________________
Early experience with P4P raises questions regarding the overall return on investment that P4P will produce.
______________________________
Washington State Medical Association Quality Improvement Initiative – In 2006, the Washington State Medical Association’s Education and Research Foundation (WSM-ERF) received a one million dollar grant to fund a two-year quality improvement program involving six disease states: diabetes, heart disease, asthma, depression, and cervical and breast cancer screening. The funding will support the creation of actionable reports on physician performance as well as patient registries related to chronic and preventive care.
The program is to combine medical and pharmacy claims data from multiple payers to create a single report for each physician. In addition to allowing physicians to see how they compare to peers and best practices, the information will also identify all of a physician’s patients with the above conditions and show the status of those individuals with respect to appropriate tests and medications. Initial reports and registries are expected to become available by the end of 2006.
Health Information Technology: Key to Achieving Quality
Experts agree that the power of electronic medical records (EMRs) to manage health care information will be key to achieving improved treatment outcomes and, ultimately, to controlling costs. However, estimates for the acquisition and implementation of an electronic medical record (EMR) system are approximately $44,000 per physician, with an additional $12,000 in annual maintenance fees.115
In the 2005 session, the legislature passed SSB 5064, mandating the development of a strategy for the adoption and use of EMRs and health information technologies consistent with emerging national standards and the promotion of interoperability of health information systems. The Health Care Authority (HCA) is charged with presenting its final recommendations to the legislature by December 2006.
Pay For Performance (P4P)
A key strategy evolving across commercial health insurers and publicly funded health programs is the Pay For Performance (P4P) mechanism. Generally, P4P uses a methodology whereby payments are made to physicians’ practices for performing specific services or for achieving specified outcomes and care benchmarks.116
Nationally, more than 100 pay-for-performance programs have been implemented by payers. Further, a wide variety of clinical quality measures are in use. The absence of a single core set of quality measures that has been vetted by recognized physician organizations is a source of genuine concern among physicians.117
In December 2005, the Institute of Medicine (IOM) issued its report Performance Measurement: Accelerating Improvement. Under the collective title of Pathways to Quality Health Care, the IOM is to issue two additional reports in 2006-2007 in this series: Payment Incentives, and PerformanceImprovement. The initial report acknowledges the need for the “availability of accurate, reliable and valid performance measures.”
Tomorrow’s Medicine: A Report on the Future of Health Care Delivery in Washington State 27
The report offered six recommendations:
1. Creation of a national quality coordination board. 2. Ensure the independence of the proposed quality coordination board. 3. Encourage local innovation on performance measurement, aligned with national standards,
including the creation of a “recommended starter set of performance measures.” 4. Endorse national [quality] standards through ongoing consensus processes led by major
stakeholders, and ensure that a data repository system and public reporting system are established.
5. Support the development of a national system for performance measurement and reporting. 6. Ensure the availability of financial resources to support a research agenda.
It is noteworthy that the IOM’s recommendations closely align with the findings from the WSMA’s May 2005 Consensus Conference.
Early experience with P4P raises questions regarding the overall return on investment that P4P will produce. A recent study noted that a methodology that provides payment for reaching a common, fixed performance target may produce little gain in quality for the investment and would simply reward those with higher levels of performance at the baseline.118
It remains to be seen whether P4P will be used as a legitimate tool to underwrite improvements in quality of health care services or will be misused as a crude cost containment strategy.

Tomorrow’s Medicine: A Report on the Future of Health Care Delivery in Washington State 29
What S
hould Tom
morrow
’s Medicine Look Like?
What Should Tomorrow’s Medicine Look Like?
Working Together to Shape the Future of Medicine and Health Care
When the topic is health care in Washington, optimism vies with discontent. The status quo has few defenders, yet most think the future holds promise. There’s no clear consensus, however, on how that promise will be realized.
Technology is making record-keeping more comprehensive, accessible, and useful. Greater awareness of “best practices” will lead to more consistency and improve quality. A growing emphasis on wellness, prevention and early detection can lead to better health and reduce treatment costs. For those with good health insurance coverage, health care quality is good – provided they can get in to see their physician on a timely basis.
But rising costs put an increased number of Washingtonians at risk of losing their health insurance. There is still too much variation in the quality of care provided. And too much money is being spent ineffectively.
In June and July 2006 the Washington Research Council, on behalf of the WSMA, surveyed thirty-six opinion leaders regarding their vision for the future of medicine in our state. Respondents consisted of hospital administrators, practicing physicians, business advocates, labor leaders, medical school faculty, third party payers, policy analysts and state officials. About 20 percent of the respondents were physicians. (Physician responses did not vary significantly from the rest of the group.)
In this section of Tomorrow’s Medicine common themes are identified, as well as common ground on which the health care community can stand together to work to improve our state’s health care system. To highlight that emphasis, this report does not identify individuals by name or by the sector they represent. A full list of respondents can be found in Appendix F.
The questionnaire began with a very general question: Where should medicine be in five years? Respondents were then asked a series of questions regarding whether and how physicians were an asset to health care, how they could become greater assets, and what obstacles stand in their way. Further questions probed for specific responses to current issues in health care: evidence-based medicine, universal coverage, Medicaid, medical liability, and pay-for-performance. Finally, respondents were asked their views on cost containment, fair compensation for physicians, improved access, and what must be done to transform health care in the next five years.
The questions were challenging. And the answers – the prescriptions for change – are no less challenging.
Tomorrow’s Medicine: A Report on the Future of Health Care Delivery in Washington State 30
Theme 1: Excellent Health Care Will Reduce Costs, Increase Access, and Improve Lives
Looking ahead, leaders believe that medicine will have incorporated technology and best practices to assure consistently high quality care. Quality improvements will lead to increased access and affordability. Patients will bear more responsibility for both their lifestyle choices and the costs of their care. Wellness programs, prevention, and early detection programs will reduce long-term costs and improve outcomes. Evidence-based medicine, electronic medical records, wise use of new technology, and increased patient involvement and responsibility will characterize a transformed system. But for this to occur there must be a corresponding transformation in the relationship between payers and physicians. Every leader identified physicians as assets, critical to guiding change in the health care system, though sometimes reticent to show leadership in quality and cost control.
Comments:
“Medicine should more effectively align financial resources with medical need, which can drive better health and improved access to health care. … Central to this is the broad adoption of evidence-based best practice guidelines.”
“…medicine should take advantage of 21st Century technology to offer efficient, well coordinated, patient centered care based on industry best practices.”
“Physicians are the bedrock … although we will see greater involvement of patients in provider selection and care decisions, the physician will still be central in clinical decision-making.”
“Medicine should be accessible and affordable without patient insulation from the costs of health care.”
“Every effort to improve quality leads to reduced costs. Increasing quality actually costs less.”
“When involved and engaged, physicians can be the greatest asset toward agreeable evolutionary change with an essential perspective of delivery system down to delivery at the individual patient level.”
“We need to shift dramatically from reactive approaches to late stage disease to focus on early detection, early treatment and early prevention.”
“Reduce variation. Pay for more physician time with the patient – ‘at the bedside’ or in the examination room.”
Theme 2: Universal Access – Laudable Goal, but Difficult to Achieve
More than two-thirds of those surveyed supported some form of universal access to health insurance and care, although their answers revealed different definitions of the idea. The remaining third all favored policies that would increase access to health care. The majority urged strategies for achieving broad access to health care within a framework involving private insurers, public health programs, and patient choice. Only two people called specifically for a single payer or Canadian-style system, although several others described approaches involving a dominant public sector role.
Tomorrow’s Medicine: A Report on the Future of Health Care Delivery in Washington State 31
Comments:
“If by universal coverage, you mean that all Washingtonians have access to health insurance, then universal coverage is a good goal. But in working toward universal coverage, the difficult questions such as cost, individual responsibility, sustainability, and the limited benefits to which everyone can have access must be answered.”
“Ideally we should have universal coverage now and not in five years’ time. However, any mechanism to provide it is unlikely to garner enough national support … unless the number of middle class uninsured continues to rise drastically.”
“No evidence this has ever worked without either prohibitive costs or rationing. Better to work on making health care delivery less expensive so that costs are affordable.”
“Universal coverage is a lightning rod of controversy, in part because it’s not possible to define it to everyone’s satisfaction. [The] difference between universal coverage and universal care is enormous and needs to be respected.”
“Separate access to health care and access to insurance….insurance is not care, it is a financing mechanism.”
“Pay or play. Mandatory health insurance.”
Theme 3: Toward a Seamless, Collaborative Health Care System with Physician Leadership
Throughout the survey responses, leaders often indicated the importance of collaboration among the various elements of the health care system. “System”, however, may be too strong a term to describe the various components of health care delivery – the third-party payers in government and the private sector, public health professionals, hospitals, physicians, and patients. Demands on physicians’ time, as well as the value they place on autonomy and independence, impede physicians’ role as leaders in system integration.
Comments:
“Physicians must step forward and be the leaders for change.”
“Medicine remains largely a cottage industry. Adequate incentives are not in place to reward development of integrated approaches and delivery of quality care vs. quantity of care. … Advances will occur through collaborative approaches, supported by better information and incentives in three key areas: advances in medical quality, efforts to encourage cost-conscious action throughout the health care system, and support for consumers at every stage of health.”
“Medicine should be participating with other health professionals and patients and their families in ways that contribute the best that each can offer to promote a healthy and highly functioning population in the state. This includes translating what we have learned from clinical and basic science research to delivery of care and educating the future health professionals in an inter-professional model of service delivery.”
“We need an integrated system of health care that reduces fragmentation, increases efficiency and is outcome based. The payment system would need to align and incentivize this model.”
Tomorrow’s Medicine: A Report on the Future of Health Care Delivery in Washington State 32
“Physicians will need to shift from being the ultimate provider of health care to being the co-creator of health….part of this is to stop using terms like ‘consumer.’”
Theme 4: Electronic Medical Records: Valuable, Inevitable, and Worth the Cost
More than 80 percent of respondents endorsed electronic medical records (EMR) as a major step forward in health care delivery. Despite concern with the significant investment required, they believed the increased access to information, reduced risk of errors, and potential gains in administrative efficiency justify the conversion.
Comments:
“Just do it! Big savings – a lot of mistakes eliminated.”
“…this is a strong initiative at the federal level and absolutely essential to deal with evidence based medicine...”
“Cost of acquisition and adoption remain high. Risk of failure is still too high. The benefits are possible, however the pitfalls appear great.”
“Medicine should reclaim the medical record and realize that when we turned it into a ‘billing document’ we went down the wrong path.”
“EMR should be the norm and should be integrated into larger clinical data systems that can give physicians concurrent information on patient-specific care opportunities.”
“Essential, but problematic when serving the ‘safety net’ populations, including immigrant and migrant populations.”
Theme 5: Implemented Wisely, Guidelines and Evidence-based Practice Offer Promise
Views on guidelines and evidence-based practice ranged from cautious optimism to enthusiastic endorsement. No one rejected the value of an emphasis on best practices, clinical guidelines, or embracing benchmarks. Some, however, expressed concern that such guidelines not become strictures limiting physician discretion. The great majority of respondents believed that evidence-based practice, implemented prudently, will lead to an overall increase in the quality of care, while controlling costs by reducing error and improving outcomes.
Comments:
“The medical care system should achieve dramatic reduction in unnecessary under- and over-treatment as defined by clinical best practices and evidence-based clinical guidelines. Collaboration between players and physicians is key – learning together the right things to measure and developing a more uniform approach.”
“Continue adoption of these, but warily, recognizing that some use evidence based medicine as a managed care hammer which stifles innovation.”
“Physicians should incorporate guidelines and evidence based medicine into their decision-making process. They should not do so at the expense of other factors such as professional judgment, expertise, and patient values and goals.”
“This is an unambiguous trend and physicians must be seen as embracing the issue.”
Tomorrow’s Medicine: A Report on the Future of Health Care Delivery in Washington State 33
Theme 6: Increased Patient Responsibility for Health Care Will Reduce Costs and Improve Quality
Many respondents believe that the way we pay for health care creates inefficiency that affects both quality and access. Third-party payments insulate patients from the cost of their treatment, making them less careful consumers. With more effective communication of the costs and consequences of treatment alternatives, patients can make better decisions.
Comments:
“A fee-for-service model allows for the most aligned relationship of physician and patient. …Where controlling costs is an agreed goal, increasing patient responsibility for costs will aid in the most responsible decision-making in consuming health care services.”
“Encourage consumers to be more engaged in the cost and quality of care. Put health care on a budget through a pre-paid plan.”
“Employ financial incentives and penalties to move people toward acquiring coverage and changing habits.”
“Every patient should be able to access their file and through a code or password give access to any other provider who needs it – including pharmacists.”
“More people need to pay for their own health care expenses. Removing the third party from the equation will increase cost effectiveness. Re-educate the public about reasonable expectations…the best and the greatest aren’t always necessary.”
Theme 7: When Consumers Embrace Healthy Lifestyles, Everything Gets Better
Patient responsibility goes beyond simply picking up more of the cost of their treatment through higher deductibles and copays. In many of their answers, respondents commented on the degree to which lifestyle choices drive health care costs.
Comments:
“The average health of a 45-year-old American high school dropout is inferior to that of a 65-year-old high school graduate. If we improve education and succeed in getting people to stop smoking, live balanced lives with proper diet and exercise, and generally take care of themselves, we’ll be able to afford the best health care in the world for everyone.”
“Consumerism in health care is creating important new opportunities for collaboration among key stakeholders to support doctor-patient discussions about (a) healthier lifestyles and (b) when necessary, the best course and cost of treatment.”
“Health care should reward wellness programs.”
Tomorrow’s Medicine: A Report on the Future of Health Care Delivery in Washington State 34
Theme 8: To Maintain Quality and Access, There Must Be Financial Stability
No one is satisfied with the current system of reimbursement for services. Reimbursement rates often fall short of covering the cost of service, resulting in cost shifting and underpayment. Government programs like Medicaid represent a source of long-term concern for many physicians. Administrative costs eat up a significant share of limited resources and must be reduced. A sharper focus on cost-benefit evaluation and best practices can help control escalating health care bills, but there must also be a fundamental re-alignment of the relationship between physicians and payers.
Comments:
“Currently we have a crisis in unbridled EXPECTATION with limited dollars, not a crisis in cost. We fail to prepare a thorough economic impact statement for health care expectations. We need to distinguish the difference between actual cost and sticker price, and we need to prohibit the totally unpredictable and irrational pricing policies for health care services.”
“Restructure reimbursements to stop creating incentives that maximize the number of procedures performed.”
“Make available a greater variety of insurance products, at various prices to individuals and business.”
“Decrease mandates, which drive up insurance costs.”
“A relentless pursuit of the elimination of waste must be undertaken, without requiring more money to save money. Collaborative and very promising provider/payer models exist today in Washington.”
“Funding and benefits must be in alignment so that public programs pay their full share of medical care costs.”
Leaders also commented on positive developments in health care and insurance coverage. They differed on what they found most promising: from the Massachusetts insurance mandate to health savings accounts, from evidence-based medicine and electronic medical records to preventive public health measures.
Yet everyone approached recognized that major improvements in health care will require systemic and cultural change. Patients and physicians, payers and purchasers – all will be challenged to alter their behaviors, adjust expectations, and work collaboratively for a more responsive, sustainable, and effective health care system in our state.
Notwithstanding the magnitude of the challenges, there is considerable agreement on the fundamental issues to address. More important, the major stakeholders show a sincere willingness to work together to achieve the common goals, with insight, commitment, and integrity.
Tomorrow’s Medicine: A Report on the Future of Health Care Delivery in Washington State 35
The WSMA’s Guiding Principles forTomorrow’s Medicine The vision of the WSMA is to make Washington state a better place to practice medicine and to receive care.
Achieving that vision requires a viable and robust health care delivery system that is both cost-effective and care-effective, and with adequate capacity to meet the medical needs of the state’s citizens.
In interviewing some of the best minds in business, labor, government, and health care, the consensus was clear: Physicians must be leaders for change.
Physicians must champion quality care that is safe and cost-effective on behalf of the patients and communities they serve. Physicians are in a unique position to promote cooperation among all stakeholders in forging a better approach to the financing and delivery of health care by supporting these Six Guiding Principles that promote the following: 119
Building on the Physician-Patient Relationship
The fundamental physician-patient relationship should be one based on trust, quality care and joint participation in medical care decisions. To achieve this, it will be necessary to acknowledge the responsibilities all parties share – patients, physicians, purchasers, and payers. And, it requires a simpler administrative and regulatory environment. Decisions made by physicians and patients drive the cost and quality of health care. If we are to foster better value in our health care system, with its limited resources, we need to support the physician and the patient with the tools, technologies and support systems for improving both the processes and outcomes of health care.
Acknowledging Responsibility; Promoting Accountability
Physicians must be responsible for practicing high-quality, cost-effective, evidence-based care. Physicians must be held accountable for their performance. Physicians should be open to exploring new and better ways to provide their services.
In recent years it has become apparent that the medical disciplinary system in Washington state is lacking. The WSMA is committed to advocating for dramatic changes to the state’s disciplinary system to make it more fair and effective for patients and physicians. The position of the WSMA is that medical licensure and discipline should be removed from the Department of Health and operate as a freestanding Commission. Today, physicians are included in a licensing and disciplinary system that includes numerous provider groups ranging from massage therapist to “counselors”. The current system prevents adequate resources from being earmarkedappropriately to protect the public.
Patients must take more responsibility for their personal health behaviors, and must become better-educated consumers of health care services. They must take more financial responsibility for their care in order to have an appropriate stake in the decision-making process. They need to be empowered with real freedom of choice – in the type of insurance they choose and the physicians with whom they wish to establish their health care partnership.
Insurance companies must administer their products in a cost-effective manner, providing high levels of accuracy and timeliness in their administrative mechanisms such as eligibility, payment and reporting. Insurance companies must deal with their network physicians as partners, not adversaries.
s
Tomorrow’s Medicine: A Report on the Future of Health Care Delivery in Washington State 36
Employers and other public sector purchasers need to base their purchasing decisions on quality and cost-effective care, as well as investing in the well being of their employees and clients. Purchasers – particularly those in the public sector – must acknowledge the true cost and value of the “product” and adequately fund their programs. The continuing practice of underfunding public programs, while expanding the benefits and types of providers for which payment is made, must stop.
To Maintain Quality and Access, There Must be Financial Stability
Reimbursement for physician services must be adequate. For too long, public programs have relied on the private sector to fund their programs. The private sector is no longer willing to shoulder this expense. Public officials must provide funding that matches the promised benefits – or, be willing to reduce those benefits and non-physician caregivers eligible for reimbursement. Otherwise, we will see a further exodus of physicians and health plans from the public program “market.”
Further, there must be real administrative simplification and standardization. It makes no sense to have multiple “metrics” that physician practices must use to comply with various public and private program reporting requirements. Lack of uniformity drives up administrative costs and drives practices into economic jeopardy.
The impact of the current tort system on the cost of care (i.e. defensive medicine) is well documented. The WSMA will work with other interested parties to restructure the current liability system in order to promote patient safety and error reduction, effective physician oversight and accountability, reduce waste from defensive medicine, and timely and adequate assistance to those harmed by negligence.
Promoting the Use of Information Technology
Emerging information technologies hold great promise for improving care and reducing expenses. However, systems must interoperable (able to transfer data to one another), and there needs to be a way for physicianpractices to invest in these systems with assurance of some degree of return on their investment (ROI).
Wisely Implementing Guidelines and Evidence-Based Practices that Offer Promise
The WSMA is committed to working with physicians, payers, employers and government policymakers to define and advocate for best practices in medical care, including evidenced-based medicine and quality protocols.
The WSMA will seek uniformity of measures and guidelines among payers, including the consistent use of guidelines that support improved quality and are not just crude cost controls in disguise.
Through the WSM-ERF, the WSMA will work to ensure that physicians have clear actionable data in order to improve the care they provide for specific chronic conditions. The WSMA will also work with payers to make available to physicians the “actionable” information they can use to improve the quality of care and health outcomes for their patients. This also requires that payers be willing to provide the data necessary to allow these improvements.
Promoting Access to Affordable Health Insurance and an Adequate Safety Net
There is a limited role for government to promote viable insurance markets and affordable health insurance. A redefinition of what constitutes “insurance” must be promoted, with changes in government-funded programs and with new products in the marketplace. There is a role for government to assist those who otherwise cannot acquire insurance coverage. In Washington state, the tools are in place with the Basic Health Plan and Medicaid
be

Tomorrow’s Medicine: A Report on the Future of Health Care Delivery in Washington State 37
primarily. The legislature and administration must exercise creativity in program design and willingness to adequately fund those programs.
Research and experience have shown that there is no “silver bullet” for what ails health care. However, the concepts reflected in this report show a way to a better system. With the cooperation of all stakeholders Tomorrow’s Medicine can reflect the vision of the WSMA -- that Washington become a better place to practice medicine and to receive care.

Tomorrow’s Medicine: A Report on the Future of Health Care Delivery in Washington State 38
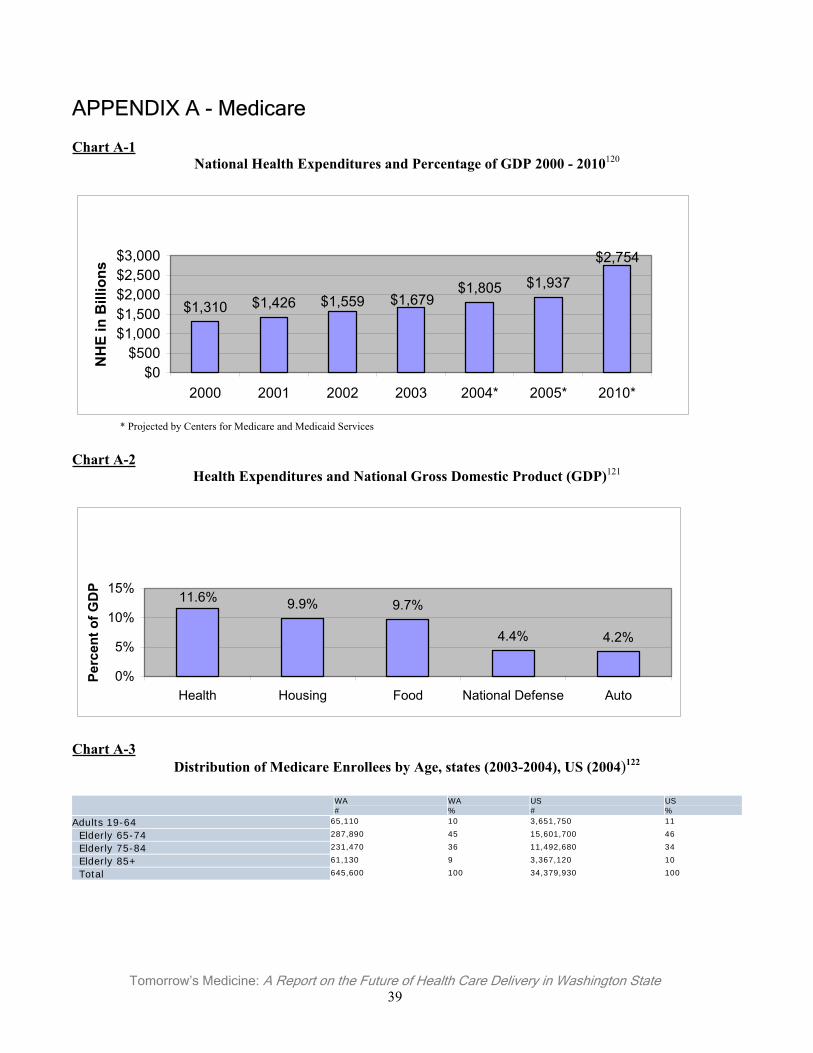
Tomorrow’s Medicine: A Report on the Future of Health Care Delivery in Washington State 39
APPENDIX A - Medicare
Chart A-1National Health Expenditures and Percentage of GDP 2000 - 2010120
$2,754
$1,937$1,805$1,679$1,559$1,426$1,310
$0$500
$1,000$1,500$2,000$2,500$3,000
2000 2001 2002 2003 2004* 2005* 2010*
NH
E in
Bill
ions
* Projected by Centers for Medicare and Medicaid Services
Chart A-2Health Expenditures and National Gross Domestic Product (GDP)121
11.6% 9.9% 9.7%
4.4% 4.2%
0%
5%
10%
15%
Health Housing Food National Defense Auto
Perc
ent o
f GD
P
Chart A-3Distribution of Medicare Enrollees by Age, states (2003-2004), US (2004)122
WA#
WA%
US#
US%
Adults 19-64 65,110 10 3,651,750 11
Elderly 65-74 287,890 45 15,601,700 46
Elderly 75-84 231,470 36 11,492,680 34
Elderly 85+ 61,130 9 3,367,120 10
Total 645,600 100 34,379,930 100
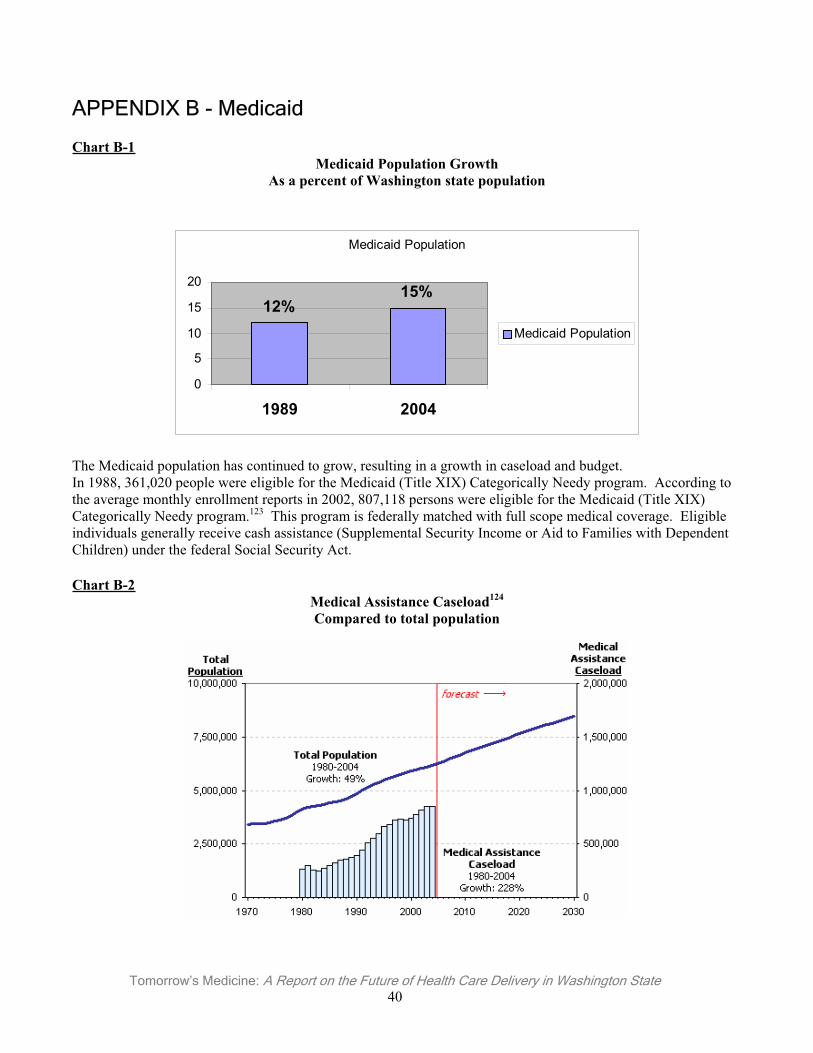
Tomorrow’s Medicine: A Report on the Future of Health Care Delivery in Washington State 40
APPENDIX B - Medicaid
Chart B-1Medicaid Population Growth
As a percent of Washington state population
Medicaid Population
15%12%
0
5
10
15
20
1989 2004
Medicaid Population
The Medicaid population has continued to grow, resulting in a growth in caseload and budget. In 1988, 361,020 people were eligible for the Medicaid (Title XIX) Categorically Needy program. According to the average monthly enrollment reports in 2002, 807,118 persons were eligible for the Medicaid (Title XIX) Categorically Needy program.123 This program is federally matched with full scope medical coverage. Eligible individuals generally receive cash assistance (Supplemental Security Income or Aid to Families with Dependent Children) under the federal Social Security Act.
Chart B-2Medical Assistance Caseload124
Compared to total population
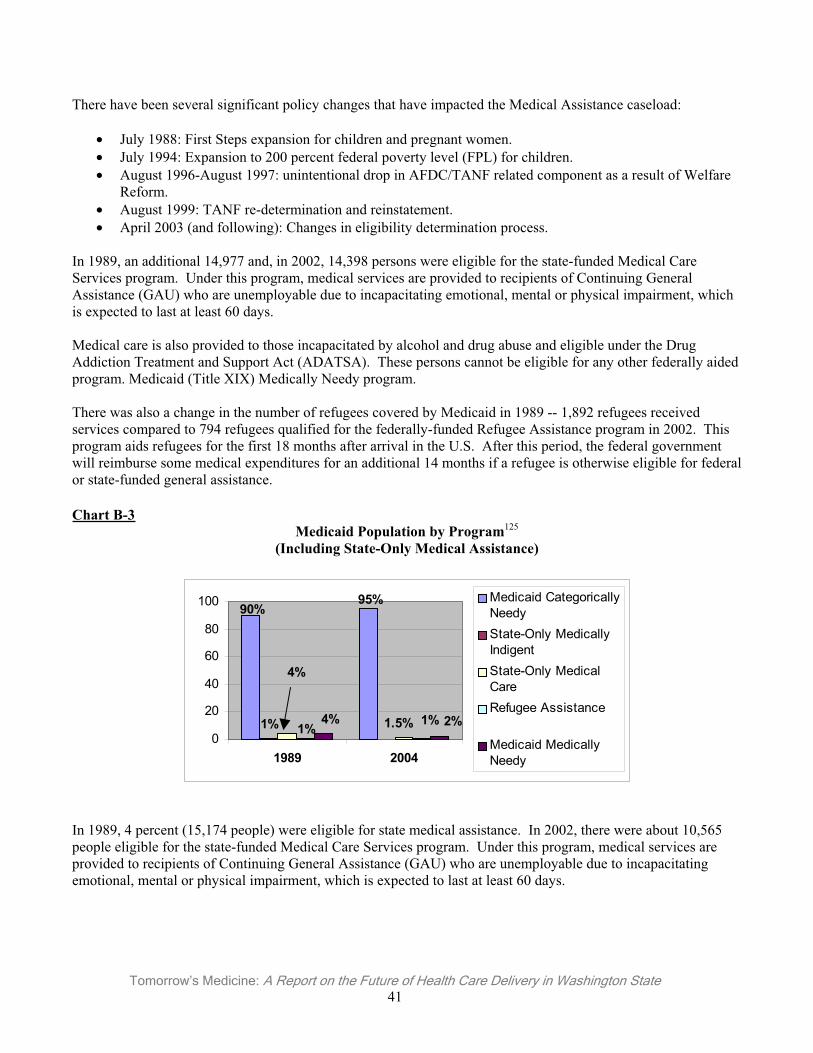
Tomorrow’s Medicine: A Report on the Future of Health Care Delivery in Washington State 41
There have been several significant policy changes that have impacted the Medical Assistance caseload:
• July 1988: First Steps expansion for children and pregnant women. • July 1994: Expansion to 200 percent federal poverty level (FPL) for children. • August 1996-August 1997: unintentional drop in AFDC/TANF related component as a result of Welfare
Reform. • August 1999: TANF re-determination and reinstatement. • April 2003 (and following): Changes in eligibility determination process.
In 1989, an additional 14,977 and, in 2002, 14,398 persons were eligible for the state-funded Medical Care Services program. Under this program, medical services are provided to recipients of Continuing General Assistance (GAU) who are unemployable due to incapacitating emotional, mental or physical impairment, which is expected to last at least 60 days.
Medical care is also provided to those incapacitated by alcohol and drug abuse and eligible under the Drug Addiction Treatment and Support Act (ADATSA). These persons cannot be eligible for any other federally aided program. Medicaid (Title XIX) Medically Needy program.
There was also a change in the number of refugees covered by Medicaid in 1989 -- 1,892 refugees received services compared to 794 refugees qualified for the federally-funded Refugee Assistance program in 2002. This program aids refugees for the first 18 months after arrival in the U.S. After this period, the federal government will reimburse some medical expenditures for an additional 14 months if a refugee is otherwise eligible for federal or state-funded general assistance.
Chart B-3Medicaid Population by Program125
(Including State-Only Medical Assistance)
90%95%
1%
4%
1.5%1%1%4% 2%
0
20
40
60
80
100
1989 2004
Medicaid CategoricallyNeedyState-Only MedicallyIndigentState-Only MedicalCareRefugee Assistance
Medicaid MedicallyNeedy
In 1989, 4 percent (15,174 people) were eligible for state medical assistance. In 2002, there were about 10,565 people eligible for the state-funded Medical Care Services program. Under this program, medical services are provided to recipients of Continuing General Assistance (GAU) who are unemployable due to incapacitating emotional, mental or physical impairment, which is expected to last at least 60 days.
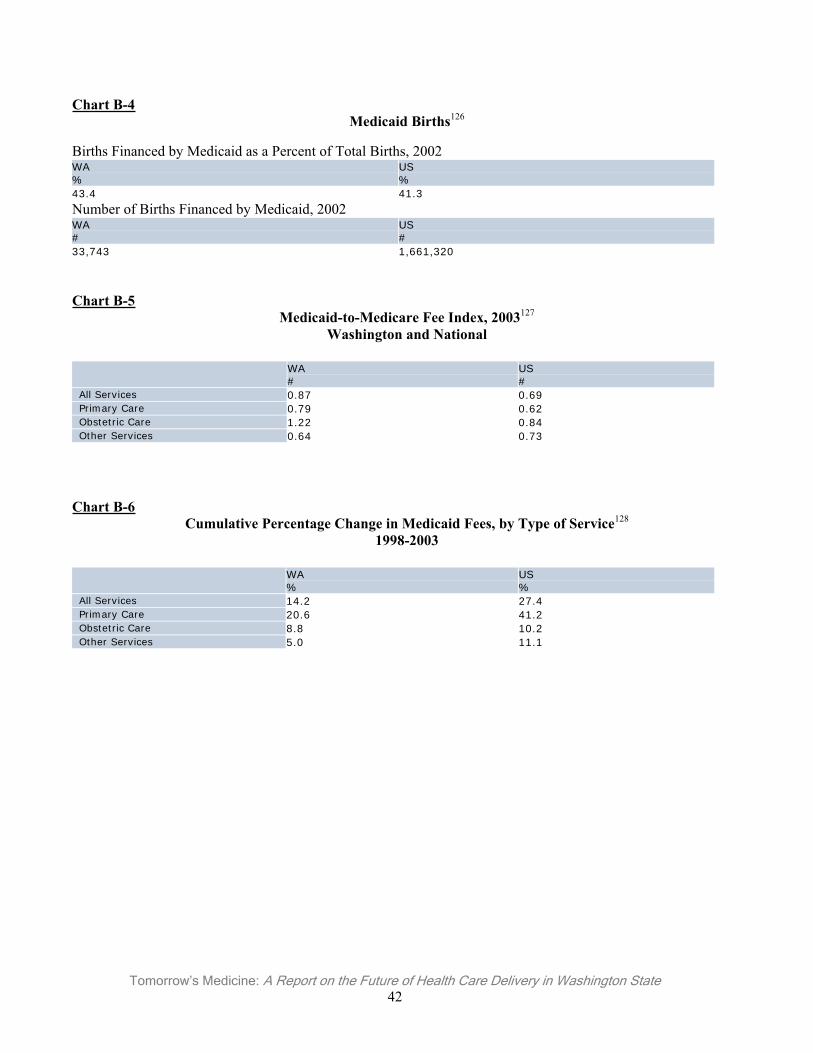
Tomorrow’s Medicine: A Report on the Future of Health Care Delivery in Washington State 42
Chart B-4Medicaid Births126
Births Financed by Medicaid as a Percent of Total Births, 2002WA%
US%
43.4 41.3
Number of Births Financed by Medicaid, 2002 WA#
US#
33,743 1,661,320
Chart B-5Medicaid-to-Medicare Fee Index, 2003127
Washington and National
WA#
US#
All Services 0.87 0.69 Primary Care 0.79 0.62 Obstetric Care 1.22 0.84 Other Services 0.64 0.73
Chart B-6Cumulative Percentage Change in Medicaid Fees, by Type of Service128
1998-2003
WA%
US%
All Services 14.2 27.4 Primary Care 20.6 41.2 Obstetric Care 8.8 10.2 Other Services 5.0 11.1
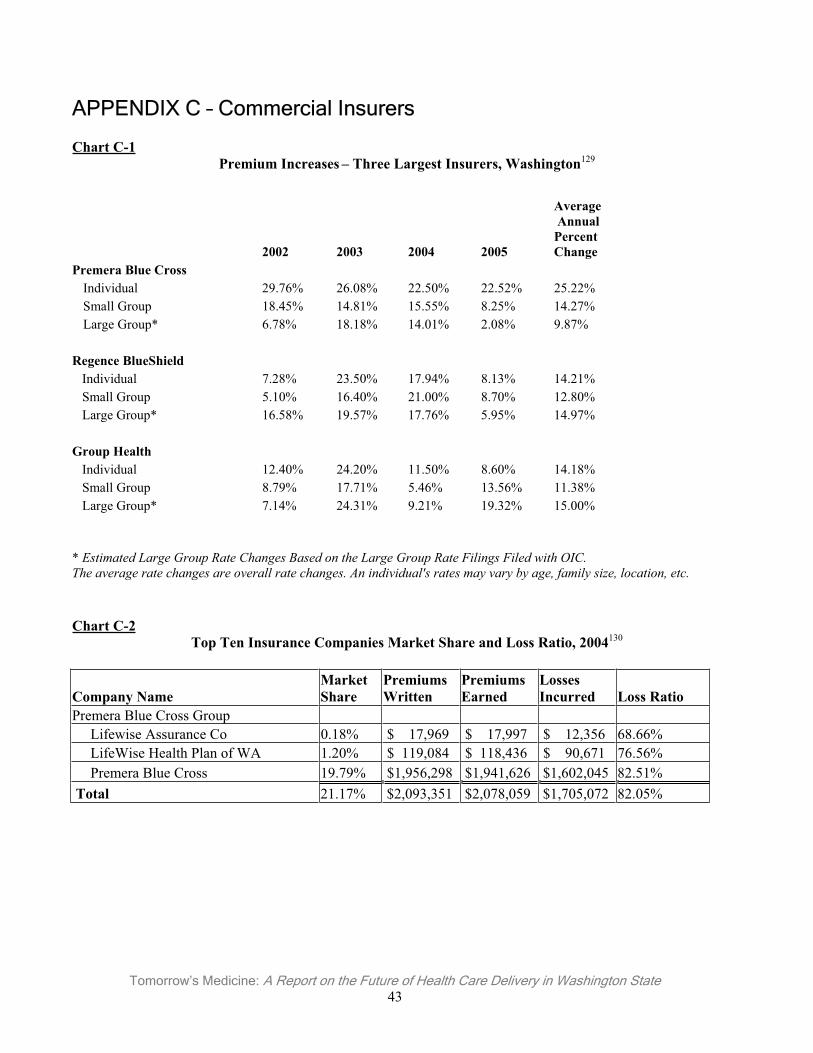
Tomorrow’s Medicine: A Report on the Future of Health Care Delivery in Washington State 43
APPENDIX C – Commercial Insurers
Chart C-1Premium Increases – Three Largest Insurers, Washington129
2002 2003 2004 2005
Average Annual PercentChange
Premera Blue Cross Individual 29.76% 26.08% 22.50% 22.52% 25.22% Small Group 18.45% 14.81% 15.55% 8.25% 14.27% Large Group* 6.78% 18.18% 14.01% 2.08% 9.87%
Regence BlueShield Individual 7.28% 23.50% 17.94% 8.13% 14.21% Small Group 5.10% 16.40% 21.00% 8.70% 12.80% Large Group* 16.58% 19.57% 17.76% 5.95% 14.97%
Group Health Individual 12.40% 24.20% 11.50% 8.60% 14.18% Small Group 8.79% 17.71% 5.46% 13.56% 11.38% Large Group* 7.14% 24.31% 9.21% 19.32% 15.00%
* Estimated Large Group Rate Changes Based on the Large Group Rate Filings Filed with OIC. The average rate changes are overall rate changes. An individual's rates may vary by age, family size, location, etc.
Chart C-2Top Ten Insurance Companies Market Share and Loss Ratio, 2004130
Company Name MarketShare
Premiums Written
Premiums Earned
LossesIncurred Loss Ratio
Premera Blue Cross Group Lifewise Assurance Co 0.18% $ 17,969 $ 17,997 $ 12,356 68.66% LifeWise Health Plan of WA 1.20% $ 119,084 $ 118,436 $ 90,671 76.56% Premera Blue Cross 19.79% $1,956,298 $1,941,626 $1,602,045 82.51% Total 21.17% $2,093,351 $2,078,059 $1,705,072 82.05%
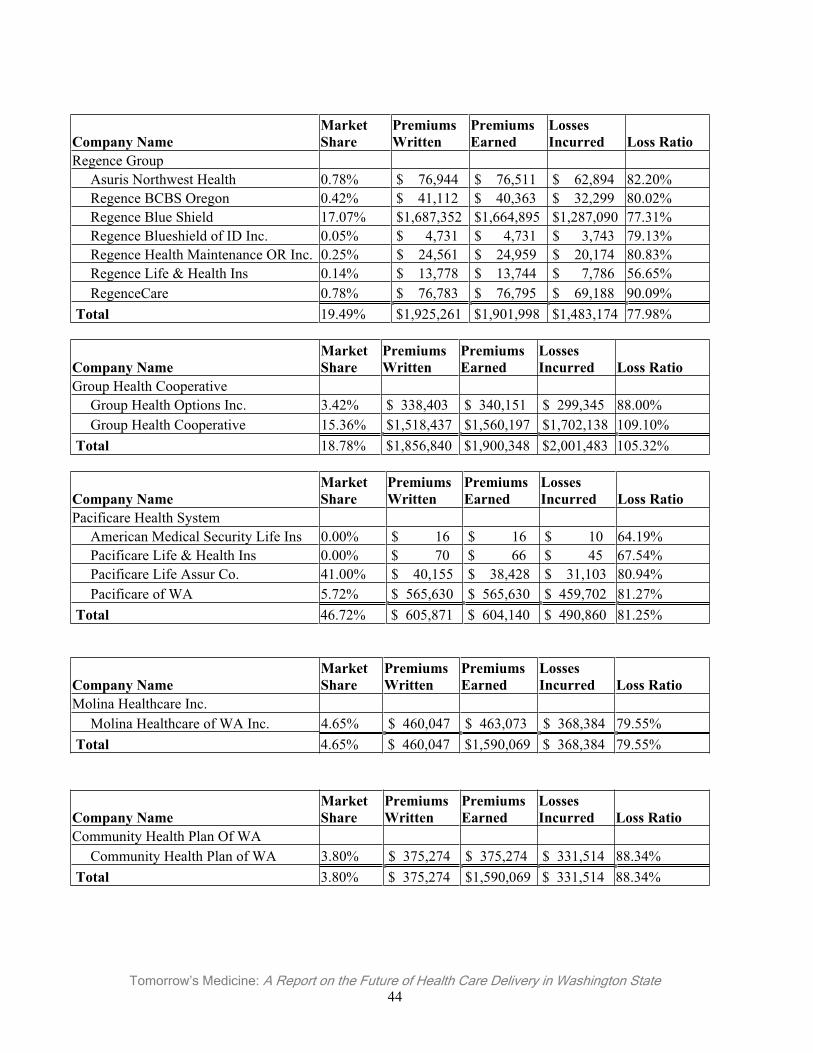
Tomorrow’s Medicine: A Report on the Future of Health Care Delivery in Washington State 44
Company Name MarketShare
Premiums Written
Premiums Earned
LossesIncurred Loss Ratio
Regence Group Asuris Northwest Health 0.78% $ 76,944 $ 76,511 $ 62,894 82.20% Regence BCBS Oregon 0.42% $ 41,112 $ 40,363 $ 32,299 80.02% Regence Blue Shield 17.07% $1,687,352 $1,664,895 $1,287,090 77.31% Regence Blueshield of ID Inc. 0.05% $ 4,731 $ 4,731 $ 3,743 79.13% Regence Health Maintenance OR Inc. 0.25% $ 24,561 $ 24,959 $ 20,174 80.83% Regence Life & Health Ins 0.14% $ 13,778 $ 13,744 $ 7,786 56.65% RegenceCare 0.78% $ 76,783 $ 76,795 $ 69,188 90.09% Total 19.49% $1,925,261 $1,901,998 $1,483,174 77.98%
Company Name MarketShare
Premiums Written
Premiums Earned
LossesIncurred Loss Ratio
Group Health Cooperative Group Health Options Inc. 3.42% $ 338,403 $ 340,151 $ 299,345 88.00% Group Health Cooperative 15.36% $1,518,437 $1,560,197 $1,702,138 109.10% Total 18.78% $1,856,840 $1,900,348 $2,001,483 105.32%
Company Name MarketShare
Premiums Written
Premiums Earned
LossesIncurred Loss Ratio
Pacificare Health System American Medical Security Life Ins 0.00% $ 16 $ 16 $ 10 64.19% Pacificare Life & Health Ins 0.00% $ 70 $ 66 $ 45 67.54% Pacificare Life Assur Co. 41.00% $ 40,155 $ 38,428 $ 31,103 80.94% Pacificare of WA 5.72% $ 565,630 $ 565,630 $ 459,702 81.27% Total 46.72% $ 605,871 $ 604,140 $ 490,860 81.25%
Company Name MarketShare
Premiums Written
Premiums Earned
LossesIncurred Loss Ratio
Molina Healthcare Inc. Molina Healthcare of WA Inc. 4.65% $ 460,047 $ 463,073 $ 368,384 79.55% Total 4.65% $ 460,047 $1,590,069 $ 368,384 79.55%
Company Name MarketShare
Premiums Written
Premiums Earned
LossesIncurred Loss Ratio
Community Health Plan Of WA Community Health Plan of WA 3.80% $ 375,274 $ 375,274 $ 331,514 88.34% Total 3.80% $ 375,274 $1,590,069 $ 331,514 88.34%
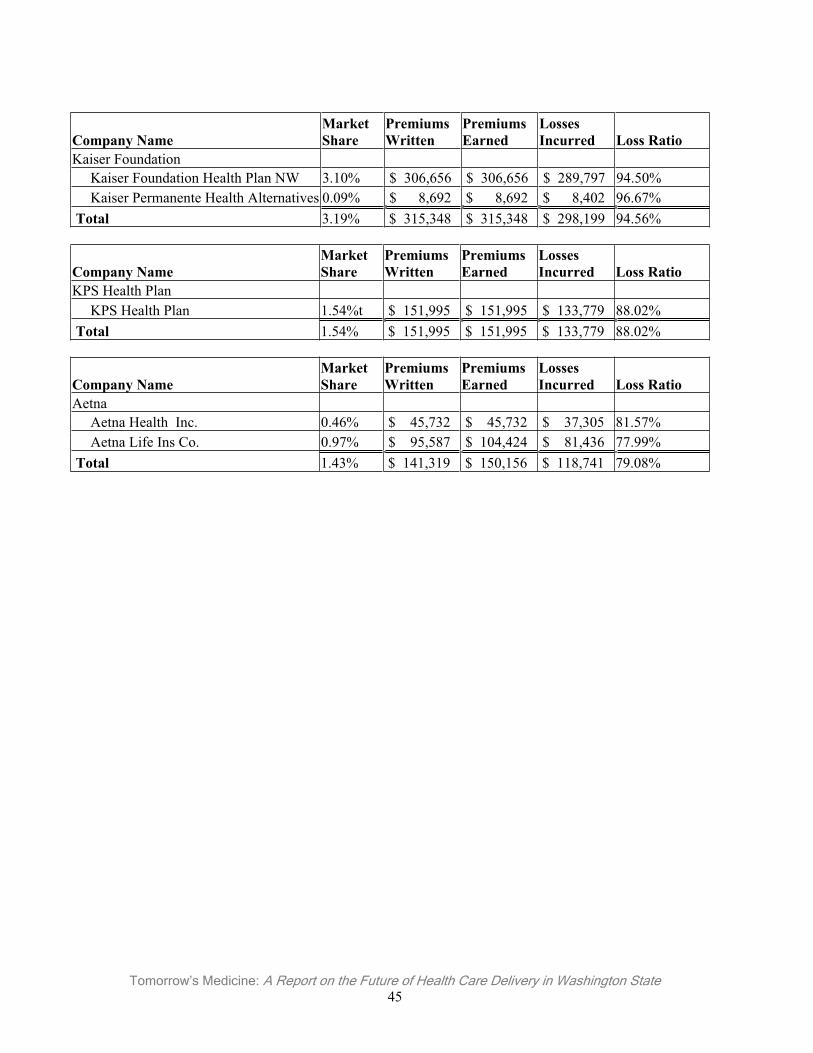
Tomorrow’s Medicine: A Report on the Future of Health Care Delivery in Washington State 45
Company Name MarketShare
Premiums Written
Premiums Earned
LossesIncurred Loss Ratio
Kaiser Foundation Kaiser Foundation Health Plan NW 3.10% $ 306,656 $ 306,656 $ 289,797 94.50% Kaiser Permanente Health Alternatives 0.09% $ 8,692 $ 8,692 $ 8,402 96.67% Total 3.19% $ 315,348 $ 315,348 $ 298,199 94.56%
Company Name MarketShare
Premiums Written
Premiums Earned
LossesIncurred Loss Ratio
KPS Health Plan KPS Health Plan 1.54%t $ 151,995 $ 151,995 $ 133,779 88.02% Total 1.54% $ 151,995 $ 151,995 $ 133,779 88.02%
Company Name MarketShare
Premiums Written
Premiums Earned
LossesIncurred Loss Ratio
Aetna Aetna Health Inc. 0.46% $ 45,732 $ 45,732 $ 37,305 81.57% Aetna Life Ins Co. 0.97% $ 95,587 $ 104,424 $ 81,436 77.99% Total 1.43% $ 141,319 $ 150,156 $ 118,741 79.08%
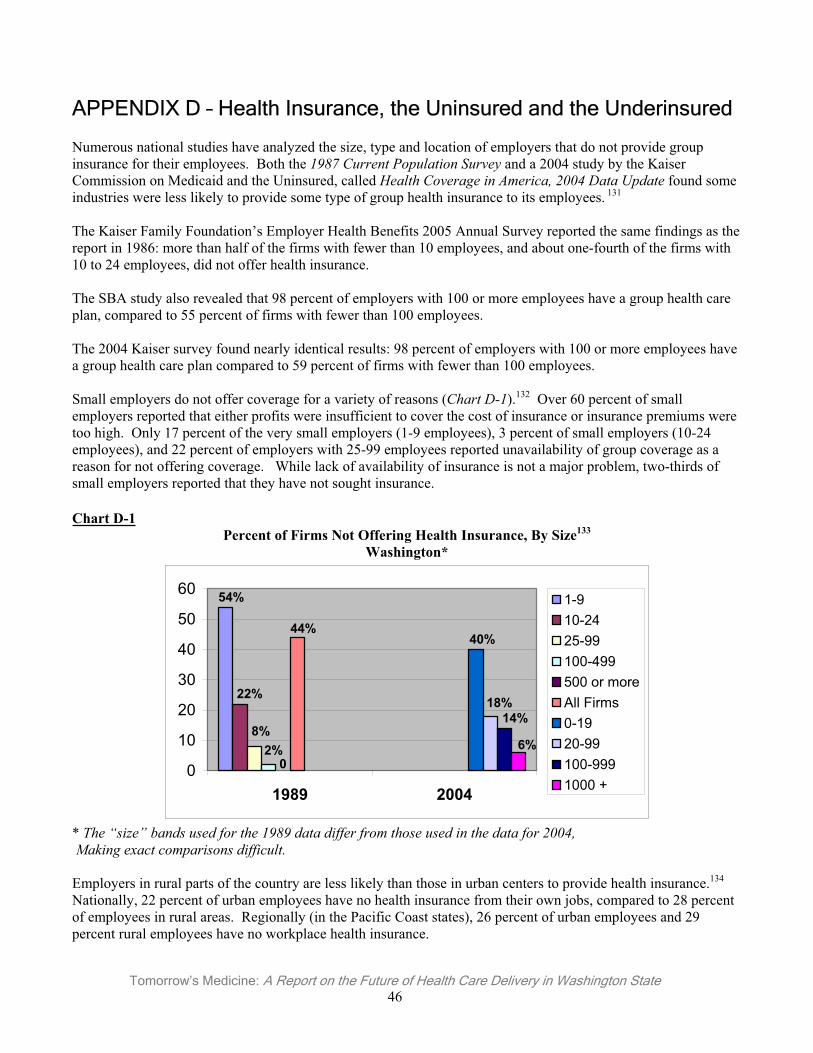
Tomorrow’s Medicine: A Report on the Future of Health Care Delivery in Washington State 46
APPENDIX D – Health Insurance, the Uninsured and the Underinsured
Numerous national studies have analyzed the size, type and location of employers that do not provide group insurance for their employees. Both the 1987 Current Population Survey and a 2004 study by the Kaiser Commission on Medicaid and the Uninsured, called Health Coverage in America, 2004 Data Update found some industries were less likely to provide some type of group health insurance to its employees. 131
The Kaiser Family Foundation’s Employer Health Benefits 2005 Annual Survey reported the same findings as the report in 1986: more than half of the firms with fewer than 10 employees, and about one-fourth of the firms with 10 to 24 employees, did not offer health insurance.
The SBA study also revealed that 98 percent of employers with 100 or more employees have a group health care plan, compared to 55 percent of firms with fewer than 100 employees.
The 2004 Kaiser survey found nearly identical results: 98 percent of employers with 100 or more employees have a group health care plan compared to 59 percent of firms with fewer than 100 employees.
Small employers do not offer coverage for a variety of reasons (Chart D-1).132 Over 60 percent of small employers reported that either profits were insufficient to cover the cost of insurance or insurance premiums were too high. Only 17 percent of the very small employers (1-9 employees), 3 percent of small employers (10-24 employees), and 22 percent of employers with 25-99 employees reported unavailability of group coverage as a reason for not offering coverage. While lack of availability of insurance is not a major problem, two-thirds of small employers reported that they have not sought insurance.
Chart D-1Percent of Firms Not Offering Health Insurance, By Size133
Washington*
54%
22%
8%2%
0
44%40%
18%14%
6%
0
10
20
30
40
50
60
1989 2004
1-910-2425-99100-499500 or moreAll Firms0-1920-99100-9991000 +
* The “size” bands used for the 1989 data differ from those used in the data for 2004, Making exact comparisons difficult.
Employers in rural parts of the country are less likely than those in urban centers to provide health insurance.134
Nationally, 22 percent of urban employees have no health insurance from their own jobs, compared to 28 percent of employees in rural areas. Regionally (in the Pacific Coast states), 26 percent of urban employees and 29 percent rural employees have no workplace health insurance.
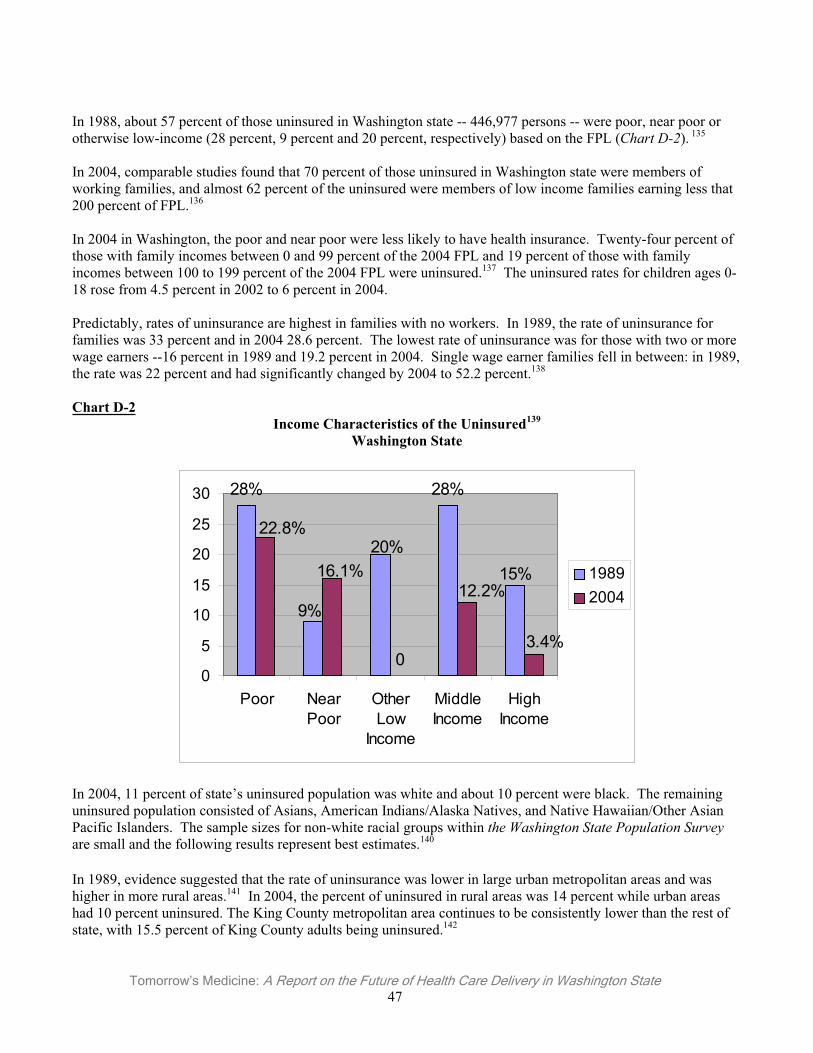
Tomorrow’s Medicine: A Report on the Future of Health Care Delivery in Washington State 47
In 1988, about 57 percent of those uninsured in Washington state -- 446,977 persons -- were poor, near poor or otherwise low-income (28 percent, 9 percent and 20 percent, respectively) based on the FPL (Chart D-2). 135
In 2004, comparable studies found that 70 percent of those uninsured in Washington state were members of working families, and almost 62 percent of the uninsured were members of low income families earning less that 200 percent of FPL.136
In 2004 in Washington, the poor and near poor were less likely to have health insurance. Twenty-four percent of those with family incomes between 0 and 99 percent of the 2004 FPL and 19 percent of those with family incomes between 100 to 199 percent of the 2004 FPL were uninsured.137 The uninsured rates for children ages 0-18 rose from 4.5 percent in 2002 to 6 percent in 2004.
Predictably, rates of uninsurance are highest in families with no workers. In 1989, the rate of uninsurance for families was 33 percent and in 2004 28.6 percent. The lowest rate of uninsurance was for those with two or more wage earners --16 percent in 1989 and 19.2 percent in 2004. Single wage earner families fell in between: in 1989, the rate was 22 percent and had significantly changed by 2004 to 52.2 percent.138
Chart D-2Income Characteristics of the Uninsured139
Washington State
0
15%
28%
20%
9%
28%
3.4%
12.2%16.1%
22.8%
0
5
10
15
20
25
30
Poor NearPoor
OtherLow
Income
MiddleIncome
HighIncome
19892004
In 2004, 11 percent of state’s uninsured population was white and about 10 percent were black. The remaining uninsured population consisted of Asians, American Indians/Alaska Natives, and Native Hawaiian/Other Asian Pacific Islanders. The sample sizes for non-white racial groups within the Washington State Population Surveyare small and the following results represent best estimates.140
In 1989, evidence suggested that the rate of uninsurance was lower in large urban metropolitan areas and was higher in more rural areas.141 In 2004, the percent of uninsured in rural areas was 14 percent while urban areas had 10 percent uninsured. The King County metropolitan area continues to be consistently lower than the rest of state, with 15.5 percent of King County adults being uninsured.142
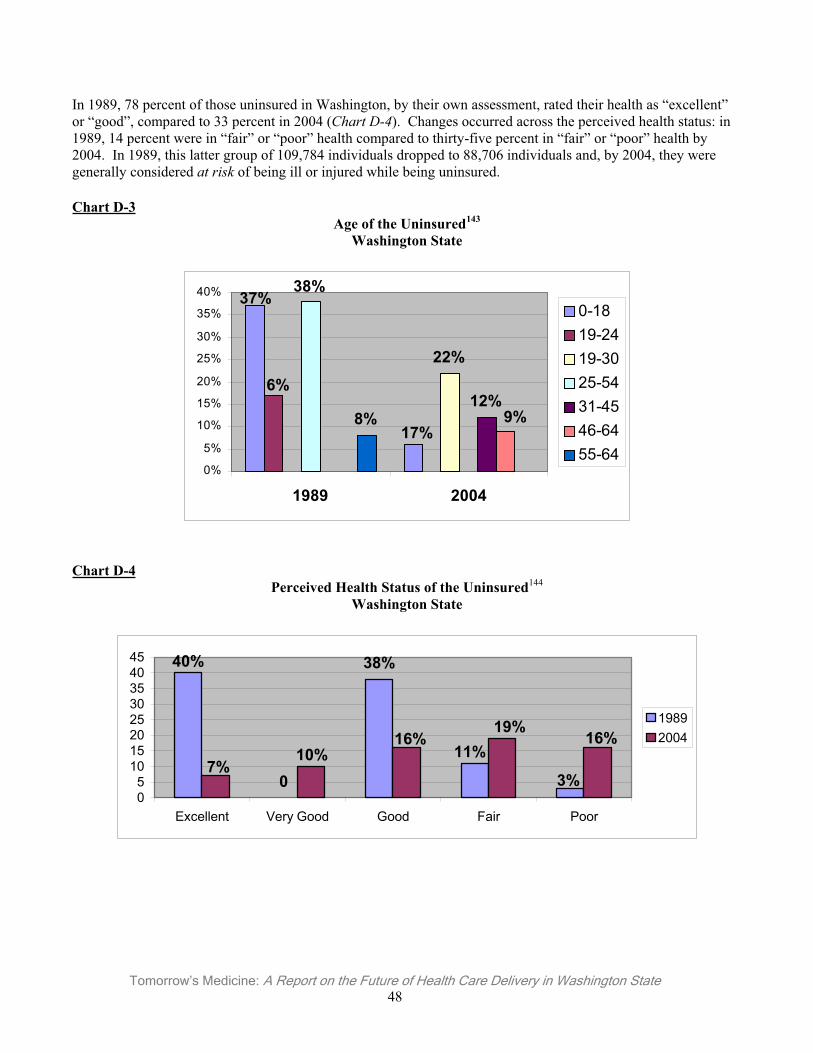
Tomorrow’s Medicine: A Report on the Future of Health Care Delivery in Washington State 48
In 1989, 78 percent of those uninsured in Washington, by their own assessment, rated their health as “excellent” or “good”, compared to 33 percent in 2004 (Chart D-4). Changes occurred across the perceived health status: in 1989, 14 percent were in “fair” or “poor” health compared to thirty-five percent in “fair” or “poor” health by 2004. In 1989, this latter group of 109,784 individuals dropped to 88,706 individuals and, by 2004, they were generally considered at risk of being ill or injured while being uninsured.
Chart D-3Age of the Uninsured143
Washington State
17%
37%
6%
22%
38%
12%9%8%
0%
5%
10%
15%
20%
25%
30%
35%
40%
1989 2004
0-1819-2419-3025-5431-4546-6455-64
Chart D-4Perceived Health Status of the Uninsured144
Washington State
0 3%
11%
38%40%
16%19%
16%10%
7%
05
1015202530354045
Excellent Very Good Good Fair Poor
19892004
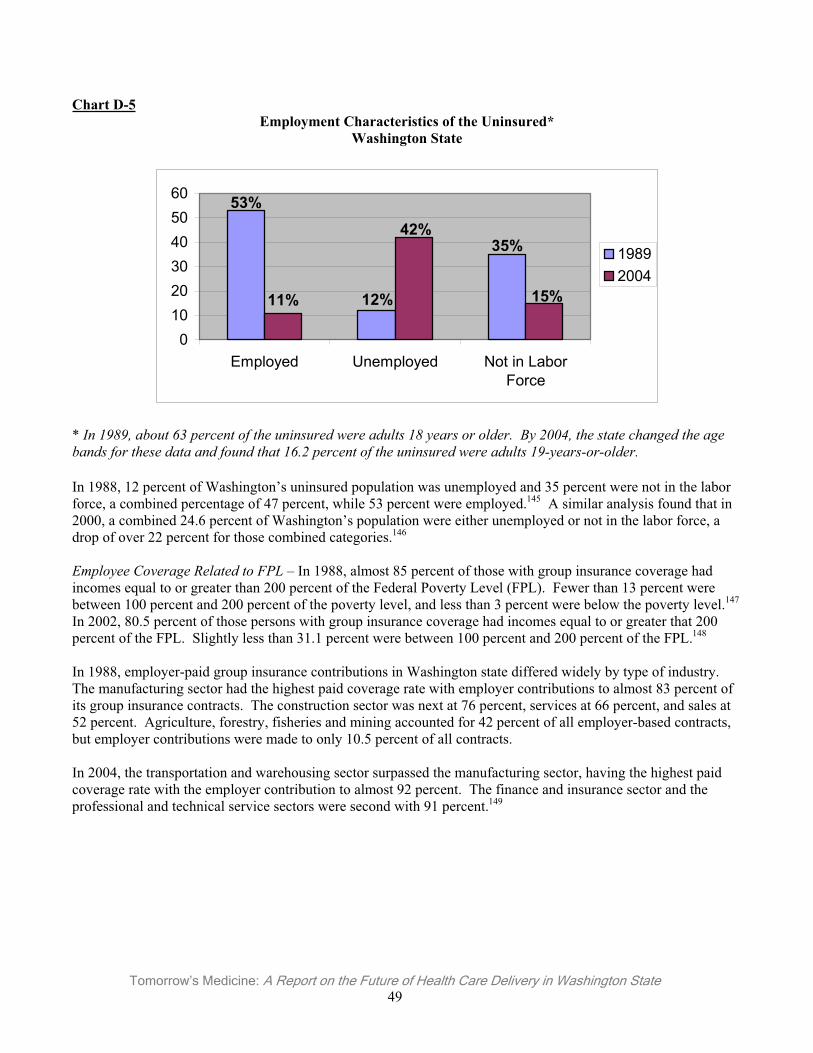
Tomorrow’s Medicine: A Report on the Future of Health Care Delivery in Washington State 49
Chart D-5Employment Characteristics of the Uninsured*
Washington State
35%
12%
53%
15%
42%
11%
0102030405060
Employed Unemployed Not in LaborForce
19892004
* In 1989, about 63 percent of the uninsured were adults 18 years or older. By 2004, the state changed the age bands for these data and found that 16.2 percent of the uninsured were adults 19-years-or-older.
In 1988, 12 percent of Washington’s uninsured population was unemployed and 35 percent were not in the labor force, a combined percentage of 47 percent, while 53 percent were employed.145 A similar analysis found that in 2000, a combined 24.6 percent of Washington’s population were either unemployed or not in the labor force, a drop of over 22 percent for those combined categories.146
Employee Coverage Related to FPL – In 1988, almost 85 percent of those with group insurance coverage had incomes equal to or greater than 200 percent of the Federal Poverty Level (FPL). Fewer than 13 percent were between 100 percent and 200 percent of the poverty level, and less than 3 percent were below the poverty level.147
In 2002, 80.5 percent of those persons with group insurance coverage had incomes equal to or greater that 200 percent of the FPL. Slightly less than 31.1 percent were between 100 percent and 200 percent of the FPL.148
In 1988, employer-paid group insurance contributions in Washington state differed widely by type of industry. The manufacturing sector had the highest paid coverage rate with employer contributions to almost 83 percent of its group insurance contracts. The construction sector was next at 76 percent, services at 66 percent, and sales at 52 percent. Agriculture, forestry, fisheries and mining accounted for 42 percent of all employer-based contracts, but employer contributions were made to only 10.5 percent of all contracts.
In 2004, the transportation and warehousing sector surpassed the manufacturing sector, having the highest paid coverage rate with the employer contribution to almost 92 percent. The finance and insurance sector and the professional and technical service sectors were second with 91 percent.149
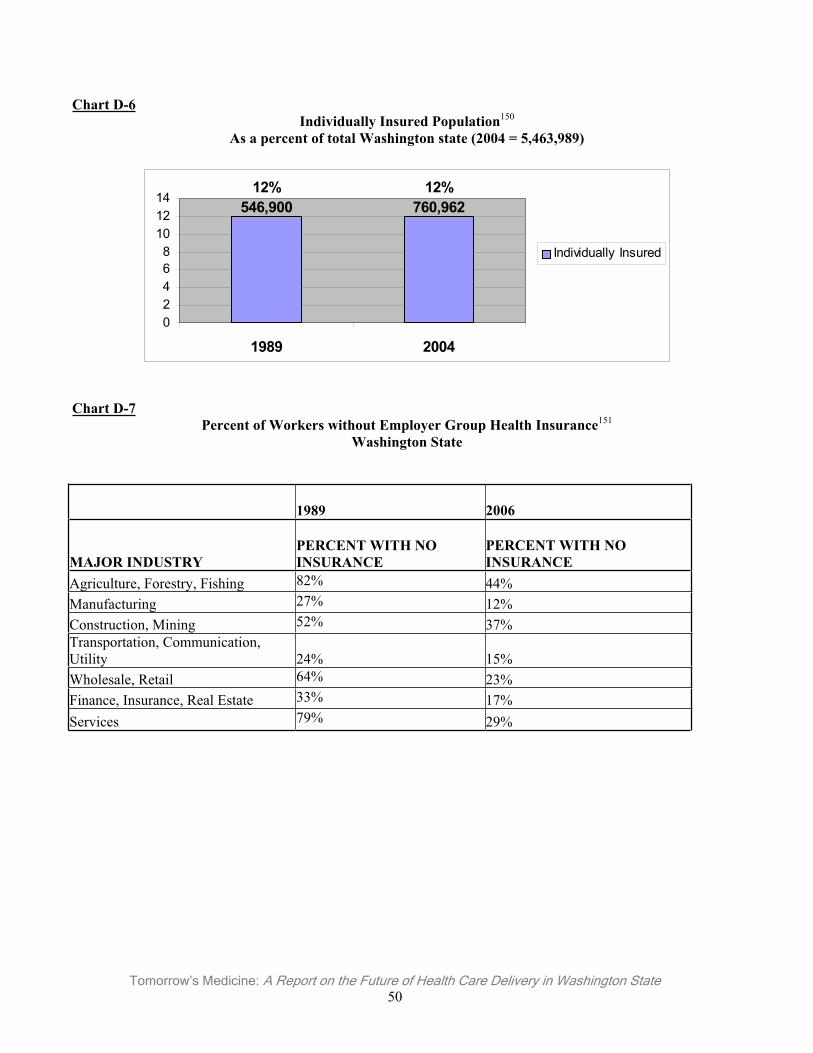
Tomorrow’s Medicine: A Report on the Future of Health Care Delivery in Washington State 50
Chart D-6Individually Insured Population150
As a percent of total Washington state (2004 = 5,463,989)
12%760,962
12%546,900
02468
101214
1989 2004
Individually Insured
Chart D-7Percent of Workers without Employer Group Health Insurance151
Washington State
1989 2006
MAJOR INDUSTRY PERCENT WITH NO INSURANCE
PERCENT WITH NO INSURANCE
Agriculture, Forestry, Fishing 82% 44% Manufacturing 27% 12% Construction, Mining 52% 37% Transportation, Communication, Utility 24% 15% Wholesale, Retail 64% 23% Finance, Insurance, Real Estate 33% 17% Services 79% 29%
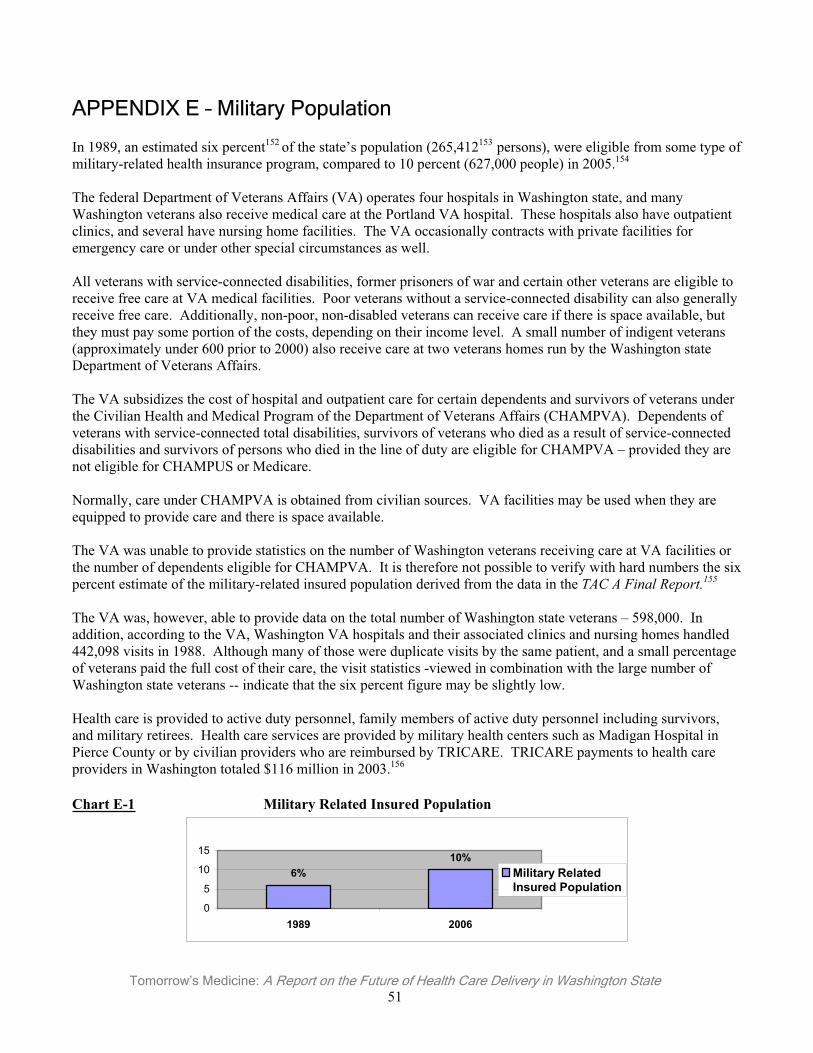
Tomorrow’s Medicine: A Report on the Future of Health Care Delivery in Washington State 51
APPENDIX E – Military Population
In 1989, an estimated six percent152 of the state’s population (265,412153 persons), were eligible from some type of military-related health insurance program, compared to 10 percent (627,000 people) in 2005.154
The federal Department of Veterans Affairs (VA) operates four hospitals in Washington state, and many Washington veterans also receive medical care at the Portland VA hospital. These hospitals also have outpatient clinics, and several have nursing home facilities. The VA occasionally contracts with private facilities for emergency care or under other special circumstances as well.
All veterans with service-connected disabilities, former prisoners of war and certain other veterans are eligible to receive free care at VA medical facilities. Poor veterans without a service-connected disability can also generally receive free care. Additionally, non-poor, non-disabled veterans can receive care if there is space available, but they must pay some portion of the costs, depending on their income level. A small number of indigent veterans (approximately under 600 prior to 2000) also receive care at two veterans homes run by the Washington state Department of Veterans Affairs.
The VA subsidizes the cost of hospital and outpatient care for certain dependents and survivors of veterans under the Civilian Health and Medical Program of the Department of Veterans Affairs (CHAMPVA). Dependents of veterans with service-connected total disabilities, survivors of veterans who died as a result of service-connected disabilities and survivors of persons who died in the line of duty are eligible for CHAMPVA – provided they are not eligible for CHAMPUS or Medicare.
Normally, care under CHAMPVA is obtained from civilian sources. VA facilities may be used when they are equipped to provide care and there is space available.
The VA was unable to provide statistics on the number of Washington veterans receiving care at VA facilities or the number of dependents eligible for CHAMPVA. It is therefore not possible to verify with hard numbers the six percent estimate of the military-related insured population derived from the data in the TAC A Final Report.155
The VA was, however, able to provide data on the total number of Washington state veterans – 598,000. In addition, according to the VA, Washington VA hospitals and their associated clinics and nursing homes handled 442,098 visits in 1988. Although many of those were duplicate visits by the same patient, and a small percentage of veterans paid the full cost of their care, the visit statistics -viewed in combination with the large number of Washington state veterans -- indicate that the six percent figure may be slightly low.
Health care is provided to active duty personnel, family members of active duty personnel including survivors, and military retirees. Health care services are provided by military health centers such as Madigan Hospital in Pierce County or by civilian providers who are reimbursed by TRICARE. TRICARE payments to health care providers in Washington totaled $116 million in 2003.156
Chart E-1 Military Related Insured Population
10%6%
0
5
10
15
1989 2006
Military RelatedInsured Population
Tomorrow’s Medicine: A Report on the Future of Health Care Delivery in Washington State 52
Appendix F – Survey Participants (position held at the time of survey)
Gubby Barlow, Chief Executive Officer, Premera Blue Cross Rob Benedetti, MD, Medical Director, Rockwood Clinic Don Brennan, Chair, Washington Health Care Forum Don Brunell, President, Association of Washington Business Rick Cooper, Chief Executive Officer, Everett Clinic Richard Davis, President, Washington Research Council Jack Faris, President, Washington Biotechnology and Biomedical Association Edward Farrar, MD, President, Washington State Orthopedic Association Michael Gilbert, MD, Past-President, Washington Academy of Eye Physicians & Surgeons Leo Greenawalt, President, Washington State Hospital Association Steve Hill, Administrator, Washington Health Care Authority Tanya Karwaki, Director, Center for Health Care Reform, Washington Policy Center Vicki Kirkpatrick, Administrator, Washington Public Health Officers Society Evelyn LeMoine, Vice President, People Program, Greater Seattle Chamber of Commerce Carolyn Logue, Washington State Director, National Federation of Independent Business W. Hugh Maloney, MD, Governor, Washington State Chapter, American College of Physicians Peter McGough, MD, University of Washington Physicians Mary McWilliams, Chief Executive Officer, Regence BlueShield Zena Minne, RN, MN, Director of Clinical Services, Washington Association of Community & Migrant Health Centers Sid Nelson, Dean, University of Washington School of Pharmacy Peter Neurath, Medical Reporter, Seattle Business Journal Chris Olson, MD, MHPA, President, Washington State Chapter, American Academy of Pediatrics Richard Peterson, Chief Executive Officer, Swedish Medical Center Brian Pitcher for Lane Rawlins, Chancellor WSU Spokane, Washington State University Doug Porter, Assistant Secretary, Medical Assistance Administration Mark Rupp, Health Policy Advisor, Office of Governor Christine Gregoire Richard Seaman, MD, Former Board Chair, Physicians Insurance A Mutual Company Mary Selecky, Secretary, Washington State Department of Health Sue Sharpe, Co-Chair, Whatcom County Alliance for Healthcare Access Stan Sorscher, Labor Representative, Society of Professional Engineering in Aerospace (SPEEA Gary Smith, President, Washington Independent Business Society of Professional in Aerospace Engineering Employees Kim Thorburn, MD, Chair, Washington State Board of Health Greg Van Pelt, Chief Executive Officer, Providence Health System Nancy Woods, PhD, RN, FAAN, Dean, University of Washington School of Nursing Gerald Yorioka, MD, President, Washington Academy of Family Physicians Joseph York, PhD, Associate Dean for Graduate Medical Education, University of Washington School of Medicine

Tomorrow’s Medicine: A Report on the Future of Health Care Delivery in Washington State 53
1 The Washington Research Council surveyed 36 opinion leaders, identifying common themes and compiling input. 2 Health care represents 11.7 percent of all non-governmental jobs in the nation. This makes it second to the retail sector at 13 percent, and more vital than manufacturing at 10.8 percent. A substantial number of people employed in other industries provide support to the health care industry, such as insurance, professional services and financial services. With the growth of the baby boomer population and technological advances in medicine, medical care will become an even more prominent part of the US economy over time. (US Bureau of Economic Analysis, 2005 report of 2003 data). 3 Washington Research Council, Economic Impact Report, August 2005.4 The most recent year for which data is available. 5 These comparisons do not include adjustments for cultural and lifestyle factors. 6 Reinhardt, U.; et al, “US Health Care Spending In An International Context”; Health Affairs, May/June 2004; Volume 23, Number 3. 7 Centers for Medicare and Medicaid Services Office of the Actuary. 8 Centers for Medicare and Medicaid Services (2005b); Blue Cross Blue Shield Association: Medical Cost Reference Guide 2006. 9 Ibid. 10 Smith, C. et al, “National Health Spending in 2004 – Recent Slowdown Led By Prescription Drug Spending”; Health Affairs, January/February 2006, www.healthaffairs.org. 11 Smith, Cynthia, et al. Health Spending Growth Slows In 2004. Health Affairs, 2005;25(1), 189. 12 Health Expenditures by State; Centers for Medicare and Medicaid Services; http://www.cms.hhs.gov/NationalHealthData/01_Overview.asp#TopOfPage. 13 Centers for Medicare & Medicaid Services, Medicare Releases State-by-State Prescription Drug Enrollment Figures, January 19, 2006. 14 Centers for Medicare & Medicaid Services, August 8, 2006 Press Release; http://www.cms.hhs.gov/apps/media/press/release.atp?counter=1939 15 Health Expenditures by State; Centers for Medicare and Medicaid Services; http://www.cms.hhs.gov/NationalHealthExpendData/01_Overview.asp#TopOfPage. 16 Ibid. 17 Nationally, in 2002, 841,298 physicians and other providers rendered Medicare Part B services, compared to 925,508 in 2003 according to the Center for Medicare and Medicaid Services Data Compendia 2002 and 2003. In Washington, in 2002, the Centers for Medicare and Medicaid Services recorded 21,306 “physicians” for the state, however, this figure reflects not only MDs and DOs but other categories of doctoral level practitioners as well. Also that high figure likely includes all physicians who were “enrolled” in the Medicare program for Washington but not necessarily rendering services, so that figure is not representative of Medicare patients’ access to physicians for care. 18 The Centers for Medicare and Medicaid Services (CMS) Health Care Consumer Initiatives, 2005, Top 30 Elective Inpatient Hospital DRGs, Fiscal Year 2005, from the Medicare Provider Analysis and Review File (MedPAR), Centers for Medicare and Medicaid Services, Office of Information Services, the Medicare Decision Support Access Facility. www.cms.hhs.gov/HealthCareConInit/; accessed June 2006. 19 Health Expenditures by State; Centers for Medicare and Medicaid Services; http://www.cms.hhs.gov/NationalHealthExpendData/01_Overview.asp#TopOfPage. 20 Urban Institute, Washington, DC. 21 Holahan and Ghosh, Understanding the Recent Growth in Medicaid Spending, 2000-2003. Health Affairs, 26 January 2005, web exclusive. 22 Health Expenditures by State; Centers for Medicare and Medicaid Services; http://www.cms.hhs.gov/NationalHealthExpendData/01_Overview.asp#TopOfPage. 23 Holahan, John and Ghosh, Arunabh. Understanding the Recent Growth in Medicaid Spending, 2000-2003. Health Affairs,2005, January, web exclusive. 24 Study conducted for the State of Washington by Tucker Alan Inc., June 30, 1999.25 WSMA Membership Memo Spot Poll, December 19, 2001. 26 WSMA Membership Memo Spot Poll, April 27, 2001. 27 Milbank Memorial Fund: 2002-2003 State Expenditure Report; June 2005, www.milbank.org. 28 2005 National Survey of Employer-Sponsored Health Plans, Mercer Health and Benefits. 29 Ibid. 30 Ibid.
Tomorrow’s Medicine: A Report on the Future of Health Care Delivery in Washington State 54
31 Payment Level Comparison Between Public Programs and Commercial Health Plans for Washington State Hospitals and Physicians, Milliman Consultants and Actuaries, May 2006, https://www.premera.com/stellent/groups/public/documents/pdfs/dynwatpercent3B5604_267394122_3168.pdf 32 Operating margin is the ratio of operating income divided by net sales. 33 Medical Group Management Association, Physician Compensation and Production Survey: 2005 Report. 34 Losing Ground: Physician Income, Center for Studying Health System Change, 1995-2003, http://hschange.org/CONTENT/851/ . 35 Trends in Physicians’ Practice Arrangements, American Medical Association, Socioeconomic Characteristics of Medical Practice 1997/98; 17-23. 36 Robert H. Miller, Christopher West, Tiffany Martin Brown, Ida Sim, and Chris GanchoffThe Value Of Electronic Health Records In Solo Or Small Group PracticesHealth Affairs, September/October 2005; 24(5): 1127-1137. 37 Phoenix Health Systems and Healthcare Information Management and Systems Society. 38 Medical Group Management Association, 2005 Cost Survey (Based on 2004 Data). 39 Ibid.40 Ibid. 41 Washington’s Primary Care Safety Net: Structure and Availability, Office of Community and Rural Health, Washington Department of Health, July 9, 2004, Pg. 8, www.doh.wa.gov/hsqa/ocrh/; www.doh.wa.gov/hsqa/ocrh/har/Wapcnet.doc. 42 Elway Research Poll, July 2004. 43 Mandates Increase Costs and Reduce Access to Affordable Insurance, Washington Policy Center Report, February 2006. 44 Ibid.45 Health Insurance Mandates in the States 2005, Council for Affordable Health Insurance, January 2005. 46 Ibid.47 Health Care Trends Report, Council on Long Range Planning and Development, American Medical Association, 2006. 48 Buckner and Fillmore. Is there an Alternative Medicine Clinic in Your Future? Journal of Medical Practice Management.43(5):263. 49 Shortages of Medical Personnel at Community Health Centers, Journal of American Medical Association , March 1, 2006,295, 9; http://jama.ama-assn.org/ . 50 Health Care Trends Report, Council on Long Range Planning and Development, American Medical Association, 2006. 51 American College of Emergency Physicians, http://my.acep.org/site/PageServer?pagename=wp1_homepage.52 Washington Chapter American College of Emergency Physicians, www.washingtonacep.org/Postings/iomreport.doc 53 American College of Emergency Physicians, www.acep.org/webportal/Newsroom/NR/general/2006/061406.htm 54 Spring-Summer 2001 Survey conducted by the Washington Chapter, American College of Emergency Physicians. 55 The 1989 Washington State statistical information is derived from a three year average of the Current Population Survey (CPS), 1983-85, as compiled in the Final Report of the Basic Research/Target Population Technical Advisory Committee (TAC A), Washington Basic Health Project Commission, Basic Health Plan, Olympia, WA, August, 1986. The TAC A Report reported percentages of the under-65 population because the 65-and-over population is covered by Medicare. This report expresses percentages as a percentage of Washington State’s total population. All other data is from sources referenced by endnote. 56 Washington State Planning Grant on Access to Health Insurance, September 30, 2005 www.ofm.wa.gov/healthcare/spg/grantinfo.asp. 57 Washington State Office of Financial Management, 2004 State Population Survey www.ofm.wa.gov/sps/2004/medins.asp. Nationally the number of uninsured has risen; locally our number of uninsured has decreased due to programs such as the Basic Health Plan. 58 The Washington State Office of Financial Management (OFM) designed the original survey with consultation from a legislative staff advisory group and an extended network of more than 80 local governments, and higher education institutions. Gilmore Research Group, a private independent research company in Seattle, administered the 2004 survey. 59 WSMA Executive Committee Report P (A-89), Washington State Medical Association, 1989. 60 Medical Insurance Data Tabulations, Washington State Office of Financial Management, www.ofm.wa.gov/sps/2004/medins.asp. 61 Ibid.62 Medical Insurance Data Tabulations, Washington State Office of Financial Management, www.ofm.wa.gov/sps/2004/medins.asp. 63 WSMA Executive Committee Report P (A-89), Appendix C, page 2, Washington State Medical Association, 1989.
Tomorrow’s Medicine: A Report on the Future of Health Care Delivery in Washington State 55
64 Medical Insurance Data Tabulations, Washington State Office of Financial Management, www.ofm.wa.gov/sps/2004/medins.asp. 65 Based upon the April 1, 1988, OFM estimate of total state population as reported in 1988 Population Trends for Washington State, Forecasting Division, Office of Financial Management, Olympia, WA, 1988. This estimate is developed by a component method. 66 TAC A Report, Basic Research/Target Population Technical Advisory Committee (TAC A), Washington Basic Health Project Commission, Olympia, WA, 1986. The TAC A Report compiled Current Population Survey (CPS) data from the annual March household survey (which includes survey questions on health insurance) for the period 1983-85. The percentages of those reporting individual insurance coverage (versus group insurance, entitlements such as CHAMPUS, Medicare and Medicaid, or Uninsured) has been applied to 1988 population figures to estimate the size of this group. 67 Insurance and Uninsurance Characteristics, 2000-2004, Washington State Office of Financial Management. 68 The Washington State Planning Grant (SPG) on Access to Health Insurance Status report, Washington State Office of Financial Management. 69 Ibid.70 www.ehealthinsurance.com. 71 Consumerism in Health Care Survey, Employee Benefits Research Institute, www.ebri.org. 72 Based upon the April 1, 1988, OFM estimate of total state population as reported in 1988 Population Trends for Washington State, Forecasting Division, Office of Financial Management, Olympia, WA, 1988. This estimate is developed by a component method. 73 Washington State Office of Financial Management Research Brief 32 Characteristics of the Uninsured. 74 The Washington Basic Health Project Commission was created in 1986 by ESHB 2021. In order to design the Basic Health Plan, the Commission charged the Basic Research/Target Population Advisory Committee (TAC A) with researching the size and characteristics of Washington State’s uninsured population. The TAC A Report remains the single most authoritative source of information on the uninsured. Each March, the federal Current Population Survey (CPS) includes survey questions on health insurance coverage. The TAC A Report compiled the CPS data for the period 1983-85 and found 17 percent of Washington’s total population was uninsured ---about 734,800 persons. Of this population, 405,992 were uninsured and under 200percent of the federal poverty level --- about 38,000 to 62,000 individuals were sick, poor and uninsured. The percentages, as determined by the TAC A Report, are used in this report. The raw numbers of the individuals have been extrapolated to reflect Washington’s 1988 population. 75 Uninsured Americans: A 1987 Profile, National Medical Expenditure Survey, National Center for Health Services Research and Health Care Technology Assessment, U.S. Department of Health & Human Services, Rockville, MD, 1988. 76 Overview of the Uninsured in the United States: An analysis of the 2005 Current Population Survey, U.S. Department of Health and Human Services http://aspe.hhs.gov/health/reports/05/uninsured-cps/index.htm#The . 77 A Profile of the Non-elderly Population Without Insurance, Employee Benefit Research Institute, Washington, DC, Issue Brief No. 66, May, 1987. EBRI compiled this data from the May, 1985, Current Population Survey (CPS). 78 Employment-Based Health Benefits: Trends in Access and Coverage, Employee Benefit Research Institute, August 2005. 79 1986 Small Business Administration Health Benefits Survey, U.S. Small Business Administration, Washington, DC, 1987. This survey was conducted for the SBA by ICF, Inc Responses were received from 846 employers, about 20 percent of the survey sample. 80 Medical Insurance Data Tabulations, Washington State Office of Financial Management, www.ofm.wa.gov/sps/2004/medins.asp. 81 Targeting the Uninsured in Washington State, Washington Office of Financial Management, www.ofm.wa.gov/healthcare/spg/targeting/31intro.pdf. 82 Washington State Office of Financial Management Research Brief 32 Characteristics of the Uninsured. 83 Ibid.84 Washington State Office of the Insurance Commissioner. 85 Based upon the April1, 1988, OFM estimate of total state population and the 65 and older state population as reported in 1988 Population Trends for Washington State, Forecasting Division, Office of Financial Management, Olympia, WA, 1988. This estimate is developed by a component method. 86 Washington State Department of Health, Office of Community and Rural Health 87 Based upon the April 1, 1988, OFM estimate of total state population as reported in 1988 Population Trends for Washington State, Forecasting Division, Office of Financial Management, Olympia, WA, 1988. This estimate is developed by a component method. 88 Center for Medicare and Medicaid Services, Data Compendia 2002 and 2003, www.cms.hhs.gov/DataCompendium/03_2002_Data_Compendium.asp#TopOfPage.
Tomorrow’s Medicine: A Report on the Future of Health Care Delivery in Washington State 56
89 Washington State Department of Social and Health Services http://www.dshs.wa.gov/. 90 Washington State Office of Financial Management Research Brief 32 Characteristics of the Uninsured. 91 Annual Report – Washington State Medical Assistance (Fiscal Year 1988), Division of Medical Assistance, Washington State Department of Social & Health Services, Olympia, WA 1988. 92 Based upon the April 1, 1988, OFM estimate of total state population as reported in 1988 Population Trends for Washington State, Forecasting Division, Office of Financial Management, Olympia, WA, 1988. This estimate is developed by a component method. 93 Washington Basic Health, http://www.basichealth.hca.wa.gov/history.shtml. 94 Basic Health Plan - A Study of Washington Basic Health Program, Washington State Health Care Authority (HCA), 2002 95 Washington Association of Community & Migrant Health Centers; http://www1.wacmhc.org/chcstats.html. 96 www.census.gov/hhes/poverty/threshld.html. 97 Washington State Department of Health, Office if Community and Rural Health Washington’s Primary Care Safety Net: Structure and Availability (July 2004) 98 A Growing Hole in the Safety Net: Physician Charity Care Declines Again, Center for Studying Health System Change, http://hschange.org/CONTENT/826. 99 Ibid. 100 Ibid.101 Eddy, David. Performance Measurement: Problems and Solutions. Health Affairs. 1998, 17(4):7-25. 102 The Dartmouth Atlas of Health Care 1998, www.dartmouthatlas.org/atlases/98Atlas.pdf. 103 http://www.dartmouthatlas.org/data_tools.shtm. 104 Wrestling with Variation: An Interview with Jack Wennberg, Health Affairs, October 7, 2004; www.healthaffairs.org. 105 The Dartmouth Atlas of Health Care – The Pacific States, www.dartmouthatlas.org/atlases/region9.pdf. 106 AAPCC = Average Adjusted Per Capita Cost. 107 Institute of Medicine, www.iom.edu/CMS/3718.aspx. 108 www.governor.wa.gov/healthcaresummit/default.htm. 109 www.governor.wa.gov/priorities/policy/healthcare/. 110 Washington State Health Care Authority, www.hca.wa.gov/shtap/. 111 www1.leg.wa.gov/Joint/Committees/HCCA. 112 Puget Sound Health Alliance, www.pugetsoundhealthalliance.org/. 113 www.pugetsoundhealthalliance.org/about/strategy.html. 114 Washington State Medical Association, Practice Resource Center, Practice Operations – Pay For Performance, www.wsma.org. 115 Robert H. Miller, Christopher West, Tiffany Martin Brown, Ida Sim, and Chris GanchoffThe Value Of Electronic Health Records In Solo Or Small Group PracticesHealth Affairs, September/October 2005; 24(5): 1127-1137. 116 Perna, Bob “Pay For Performance: Two Models Demonstrate Continued Evolution”, WSMA Reports www.wsma.org/memresources/memresources_pdf/jan_rep06-Q&A.pdf. 117 NQF, National Quality Forum Issues Report: Pay-for-Performance Programs: Guiding Principles and Design Strategies, October 6, 2005. 118 Rosenthal, M. , et all “Early Experience With Pay-for-Performance, From Concept to Practice”, Journal of the American Medical Association, October 12, 2005, Vol. 294, 14. 119 A compilation of resolves in Executive Committee Report N (A-2000), as approved by the House of Delegates, Washington State Medical Association. 120 Centers for Medicare and Medicaid Services Office of the Actuary. 121 Ibid.122 The Centers for Medicare and Medicaid Services (CMS) Health Care Financing Review Medicare and Medicaid Statistical Supplement, 2003, Table 15, Program Payments for Medicare Beneficiaries Residing in Urban and Rural Areas, by Area of Residence: Calendar Year 2001, Centers for Medicare and Medicaid Services, based on CMS, Office of Information Services, the Medicare Decision Support Access Facility. Available at: http://new.cms.hhs.gov/apps/review/supp/2003/table15.pdf; accessed August 2005. State Health Expenditure Accounts from the Centers for Medicare and Medicaid, formally know as Health Care Financing Administration, website at http://www.cms.hhs.gov/statistics/nhe/state-estimates-residence. 123 Ibid.124 Washington State Office of Financial Management Washington Trends. 125 Washington State Office of Financial Management 2005 Data Book.
Tomorrow’s Medicine: A Report on the Future of Health Care Delivery in Washington State 57
126 MCH Update 2005: States Make Modest Expansions to Health Care Coverage, National Governors Association, Table 1, Draft accessed 6/9/06 by special data request. 127 Stephen Zuckerman, Joshua McFeeters, Peter Cunningham, Len Nichols, Exhibit 3, "Changes in Medicaid Physician Fees, 1998-2003: Implications for Physician Participation," Health Affairs, June 2004; available at http://content.healthaffairs.org/cgi/content/abstract/hlthaff.w4.374v1. 128 Urban Institute and Kaiser Commission on Medicaid and the Uninsured estimates based on data from Centers for Medicare and Medicaid Services-64 reports, September 2005. All spending includes state and federal expenditures. Expenditures include benefit payments and disproportionate share hospital payments; do not include administrative costs, accounting adjustments, or the U.S. Territories. Total spending including these additional items was about $296 billion in FY2004. 129 Washington Office of the Insurance Commissioners Rates and Forms Filings. 130 Washington Office of the Insurance Commissioners 2004 Annual Report. 131 Health insurance and the Uninsured: Background Data and Analysis, prepared by the Committees on Education and Labor and Energy and Commerce (U.S. House of Representatives), by Congressional Research Service, Library of Congress, Washington, DC, June 1988. 132 Ibid.133 Washington State Office of Financial Management Research Brief 34. 134 Health insurance and the Uninsured: Background Data and Analysis, prepared by the Committees on Education and Labor and Energy and Commerce (U.S. House of Representatives), by Congressional Research Service, Library of Congress, Washington, DC, June 1988. 135 Poor = Family income less than 100percent of Federal Poverty Level. Near Poor = Family income between 100percent and 124percent. Other low income = Family Income between 125percent and 199percent. Middle Income = Family Income between 200percent and 400percent. High Income= Family income above 400percent. Income has been adjusted for family size.136 Washington State Office of Financial Management Talking points about Washington’s Uninsured August 2005. 137 Washington State Office of Financial Management Research Brief 32 Characteristics of the Uninsured. 138 Washington State Office of Financial Management Insurance and Uninsurance Characteristics, 2000-2004 (pdf) .139 Washington State Office of Financial Management Research Brief 31 Uninsured Population in Washington State. 140 Washington State Office of Financial Management Research Brief 37 Health Insurance by Race/Ethnicity 2004. 141 The Washington Basic health Project Commission was created in 1986 by ESHB 2021. In order to design the Basic Health Plan, the Commission charged the Basic Research/Target Population Advisory Committee (TAC A) with researching the size and characteristics of Washington State’s uninsured population. The TAC A Report remains the single most authoritative source of information on the uninsured. Each March, the federal Current Population Survey (CPS) includes survey questions on health insurance coverage. The TAC A Report compiled the CPS data for the period 1983-85 and found 17 percent of Washington’s total population was uninsured ---about 734,800 persons. Of this population, 405,992 were uninsured and under 200percent of the federal poverty level --- about 38,000 to 62,000 individuals were sick, poor and uninsured. The percentages, as determined by the TAC A Report, are used in this report. The raw numbers of the individuals have been extrapolated to reflect Washington’s 1988 population. 142 King Country Public Health Data Watch Sept. 2005. 143 Washington State Office of Financial Management Research Brief 32 Characteristics of the Uninsured. 144 Washington State Office of Financial Management Research Brief 32 Characteristics of the Uninsured. 145 WSMA Report of the Executive Committee Report P (A-89), Appendix C, Chart 4. 146 Targeting the Uninsured in Washington State, Washington Office of Financial Management, www.ofm.wa.gov/healthcare/spg/targeting/31intro.pdf. 147 Over time, inflation and changes in methodology have increased the income thresholds for the Federal Poverty Level. This means an individual or family could receive more income in recent years and still qualify under the FPL thresholds. 148 Washington State Office of Financial Management Distribution by income (above & below 200percentFPL), non-elderly 0-64, 2002 (PDF). 149 Washington State Employee Benefit Survey 2005. 150 Washington State Office of Financial Management 2004 State Population Survey http://www.ofm.wa.gov/sps/2004/medins.asp. 151 Washington State Office of Financial Management Research Brief 34. 152 Ibid.153 This percentage is derived from a three year average of the Current Population Survey (CPS), 1983-85, as compiled in the Final Report of the Basic Research/Target Population Technical Advisory Committee (TAC A), Washington Basic Health

Tomorrow’s Medicine: A Report on the Future of Health Care Delivery in Washington State 58
Project Commission, Basic health Plan, Olympia, WA, August, 1986. The TAC A Report reported percentages of the under 65 because the 65 and over population is covered by Medicare. The percentages, as determined by the TAC A Report, are used in this report. The raw numbers of the individuals have been extrapolated to reflect Washington’s 1988 population. 154 Based upon the April 1, 1988, OFM estimate of total state population as reported in 1988 Population Trends for Washington State, Forecasting Division, Office of Financial Management, Olympia, WA, 1988. This estimate is developed by a component method. 155 Washington State Office of Financial Management Economic Impacts of the Military Bases 2003. 156 Ibid.

Tab 63
Yakima County Health Care Coalition
TO: Blue Ribbon Commission on Health Care Costs & Access [email protected]
FROM: Steve Hill, Department of Community Services, Yakima County Chair, Yakima County Health Care Coalition
SUBJECT: Proposal from Yakima County
DATE: August 31, 2006
CONTACTS & INFORMATION
Steve Hill, Director Department of Community Services Yakima County 128 N 2nd Street Yakima, WA 98901 [email protected]
Ladies and Gentlemen,
The Yakima County Health Care Coalition is a group of organizations and individualsadvocating for the health care needs of the people of Yakima County. The Coalition provides broad representation from the health care continuum serving Yakima County residents. The Coalition meets weekly (beginning in January 2002) to identify public policies which disproportionately (good or bad) affect the high number of low income and disadvantaged of our community.
We welcome the opportunity to present one important model for your consideration to further our effort of providing access to affordable care for Washington residents. Our model is built on a network of “Access Specialists” (in some communities referred to as Patient Navigators or Community Health Workers) located at health and social service agencies.
Through a community-developed and community-built system of assessment and education, residents who are uninsured, in need of a medical home, or those who present to a local emergency room for non-urgent conditions are matched up with an Access Specialist for health coverage applications and help finding a medical home.
This pilot project, “Kids Connect”, focuses on children 0-19 years old, and their families.
MISSION OF THE YAKIMA COUNTY HEALTH CARE COALITION Advocate for the health care needs of the people of Yakima County
www.co.yakima.wa.us/hcc
Yakima County Health Care Coalition
1. What do you propose be done to realize the vision and goals for Washington State established by the Blue Ribbon Commission on Health Care Costs and Access? Briefly summarize your proposal.
1. Access Specialists will be located at the earliest point of entry when a resident enters the community, providing early education about how to use the health care system effectively. Access Specialists promote preventive health care, early identification of illness and disease, and help families identify accessible medical homes that address unique financial, cultural, transportation, or other barriers.
2. Access Specialists are also located in hospital Emergency Rooms to interview patients who access the ER for non-urgent conditions. These Access Specialists help the patient and his/her family identify a desirable medical home, arrange for follow up care, and health coverage assistance (if needed), and make the referral to the new medical provider. Everyone has access to emergency care in the case of true emergencies, but primary care problems are most effectively addressed in the primary care setting, where the patient’s history and previous illnesses are known by their primary care provider.
3. A shared, community Information and Referral system, is used to collect information about residents needing assistance, health education needs (why clients chose to use the Emergency Room), and to follow up on health coverage applications in process (avoid duplication of efforts).
4. Patient education and community education are developed based on the information collected from the county’s residents. Access Specialists are provided training on appropriate education topics, and community-specific resource information is developed and available in appropriate languages.
2. How will implementation of your proposal enhance, hinder or otherwise impact the achievement of the vision and each of the goals established by the Commission? How do you know?
Goals by 2012 CommentsAll Washingtonians will have access to health coverage that provides effective care by 2012, with all children having such coverage by 2010.
Access Specialists promote accessible and affordable primary care. They help working families apply for private insurance, Medicaid, Basic Health, SCHIP, Medicare Part D, etc. Access Specialists keep current on available providers in the community, how to access transportation and interpreters. Access Specialists help patients identify how to contact their primary care provider after hours when needed.
Washington will be one of the top Access Specialists provide education about preventive health and MISSION OF THE YAKIMA COUNTY HEALTH CARE COALITION
Advocate for the health care needs of the people of Yakima County www.co.yakima.wa.us/hcc
Yakima County Health Care Coalition
MISSION OF THE YAKIMA COUNTY HEALTH CARE COALITION
Goals by 2012 Commentsten healthiest states in the nation. positive health messages, and partner with other local efforts to
improve healthy practices. Population health indicators will be consistent across race, gender and income levels throughout the state
Access Specialists will be knowledgeable of local evidence-based models, such as Asthma Projects, Diabetes Collaboratives, and programs specifically designed to address health disparities.
3. Is your proposal modeled after an existing policy or program within Washington or elsewhere? If so, describe the policy or program and its outcomes.
The proposed model reflects the experience gained in Yakima County Kids Connect, a multi-agency collaborative effort to: 1) Assist families with children in establishing ongoing care at a “medical home,” 2) Assist families with children in applying for health coverage, track the outcome, and help families maintain coverage,3) Assist families with children in appropriate accessing of medical services, i.e., toutilize primary care settings for primary care problems and the hospital Emergency Department for true emergencies.
Participating agencies (members of the Yakima County Health Care Coalition) are: Community Health of Central Washington (Central WA Family Medicine &
Yakima Pediatric Associates) Educational Service District 105 / KidScreen Medical Associates of Yakima Sunnyside Community Hospital Yakima County Department of Community Services Yakima Health District Yakima Neighborhood Health Services Yakima Valley Farm Workers Clinic Yakima Valley Memorial Hospital
There are eight Access Specialist (three are employed at two different hospitals; the other four are employed at primary care settings, and one also manages a county-wide early childhood screening program. Access Specialists families meet weekly to coordinate services.
As of August 15, 2006, Kids Connect had over 1,600 clients in its on-line case management system. Individuals are entered into the case management system if they are interested in receiving services. Points of entry are the Emergency Department of a participating hospital, participating primary care settings, and KidScreen (which advertises a KidScreen and Kids Connect toll-free number for inquiries.
All Access Specialists offer the following services:
Advocate for the health care needs of the people of Yakima County www.co.yakima.wa.us/hcc
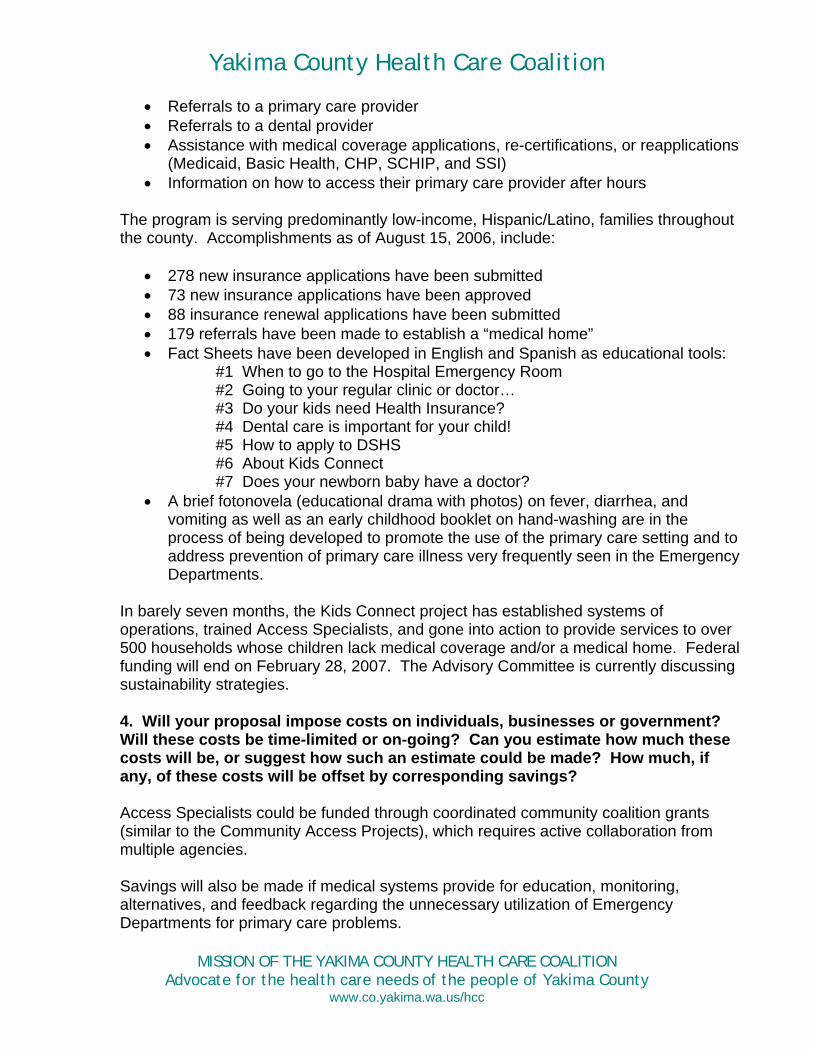
Yakima County Health Care Coalition
Referrals to a primary care provider Referrals to a dental provider Assistance with medical coverage applications, re-certifications, or reapplications
(Medicaid, Basic Health, CHP, SCHIP, and SSI) Information on how to access their primary care provider after hours
The program is serving predominantly low-income, Hispanic/Latino, families throughout the county. Accomplishments as of August 15, 2006, include:
278 new insurance applications have been submitted 73 new insurance applications have been approved 88 insurance renewal applications have been submitted 179 referrals have been made to establish a “medical home” Fact Sheets have been developed in English and Spanish as educational tools:
#1 When to go to the Hospital Emergency Room #2 Going to your regular clinic or doctor… #3 Do your kids need Health Insurance? #4 Dental care is important for your child! #5 How to apply to DSHS #6 About Kids Connect #7 Does your newborn baby have a doctor?
A brief fotonovela (educational drama with photos) on fever, diarrhea, and vomiting as well as an early childhood booklet on hand-washing are in the process of being developed to promote the use of the primary care setting and to address prevention of primary care illness very frequently seen in the Emergency Departments.
In barely seven months, the Kids Connect project has established systems of operations, trained Access Specialists, and gone into action to provide services to over 500 households whose children lack medical coverage and/or a medical home. Federal funding will end on February 28, 2007. The Advisory Committee is currently discussing sustainability strategies.
4. Will your proposal impose costs on individuals, businesses or government?Will these costs be time-limited or on-going? Can you estimate how much these costs will be, or suggest how such an estimate could be made? How much, if any, of these costs will be offset by corresponding savings?
Access Specialists could be funded through coordinated community coalition grants (similar to the Community Access Projects), which requires active collaboration from multiple agencies.
Savings will also be made if medical systems provide for education, monitoring, alternatives, and feedback regarding the unnecessary utilization of Emergency Departments for primary care problems.
MISSION OF THE YAKIMA COUNTY HEALTH CARE COALITION Advocate for the health care needs of the people of Yakima County
www.co.yakima.wa.us/hcc
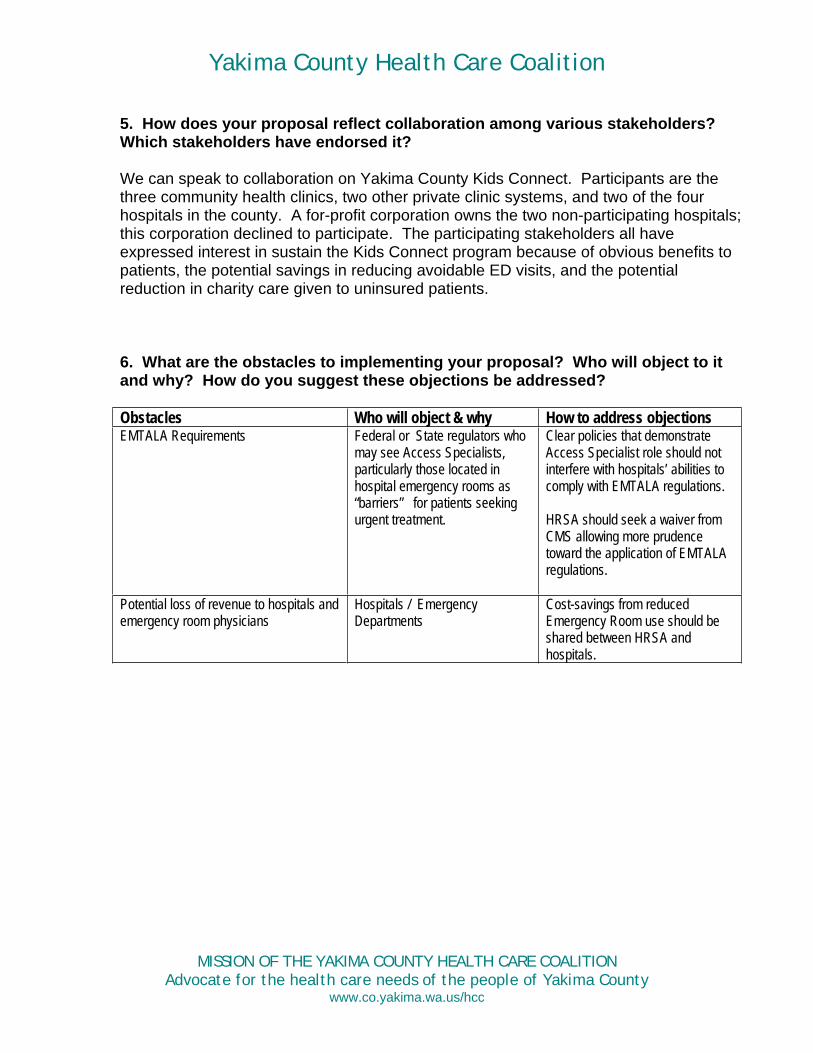
Yakima County Health Care Coalition
5. How does your proposal reflect collaboration among various stakeholders?Which stakeholders have endorsed it?
We can speak to collaboration on Yakima County Kids Connect. Participants are the three community health clinics, two other private clinic systems, and two of the four hospitals in the county. A for-profit corporation owns the two non-participating hospitals; this corporation declined to participate. The participating stakeholders all have expressed interest in sustain the Kids Connect program because of obvious benefits to patients, the potential savings in reducing avoidable ED visits, and the potential reduction in charity care given to uninsured patients.
6. What are the obstacles to implementing your proposal? Who will object to it and why? How do you suggest these objections be addressed?
Obstacles Who will object & why How to address objections EMTALA Requirements Federal or State regulators who
may see Access Specialists, particularly those located in hospital emergency rooms as “barriers” for patients seeking urgent treatment.
Clear policies that demonstrate Access Specialist role should not interfere with hospitals’ abilities to comply with EMTALA regulations.
HRSA should seek a waiver from CMS allowing more prudence toward the application of EMTALA regulations.
Potential loss of revenue to hospitals and emergency room physicians
Hospitals / Emergency Departments
Cost-savings from reduced Emergency Room use should be shared between HRSA and hospitals.
MISSION OF THE YAKIMA COUNTY HEALTH CARE COALITION Advocate for the health care needs of the people of Yakima County
www.co.yakima.wa.us/hcc

Tab 64
Washington StateOffice of theInsurance Commissioner
Proposal to the Blue Ribbon Commission on health care costs
and access
Insurance Commissioner Mike KreidlerSeptember 2006
Proposal to the Blue Ribbon Commission on health care costs and access Universal health care coverage for all Washington residents must be our goal. We cannot maintain the current system where access to health care continues to decrease at the same time that costs are rising. Today, more than 740,000 Washington residents are uninsured. Yet, they do receive health care – either in the form of uncompensated care or through publicly funded community clinics. Only 60 percent of the nation’s employers offered health care coverage in 2005, down from 69 percent in 2000. The costs of providing care are shifted to those employers and individuals who purchase insurance, and to tax-funded programs. From 2002-2004, the amount the Washington health care system and the insurance-buying public spent on providing care for the uninsured has risen $96 million to more than half a billion dollars.This trend puts those employers who do provide coverage at an increasingly competitive disadvantage and diverts millions in state revenues from other public policy priorities.As a society, we have chosen to preserve an employer-based health insurance system. Therefore, the foundation of health care financing should be employer-funded coverage, with individual coverage and public sector programs filling in the gaps.Collectively, employers, the public sector and individuals all have an obligation to contribute to the funding of health care coverage. The Blue Ribbon Commission’s five-year plan for increasing access to health care should clearly establish those obligations. In doing so, the Commission must address five key principles: Availability, affordability, quality care, equity and choice.
1. Every Washington resident is obligated to contribute their fair share toward the cost of health care coverage. However, this coverage obligation should be limited to an amount that is affordable.
• Employer ResponsibilityEmployers with more than ten employees should have two options for providing health insurance to their employees – either fund at least a minimum level of coverage or pay a health care access fee to the state to provide coverage. The access fee should be based on the cost of providing a basic level of coverage which could be approximately one dollar per hour for each employee without coverage. [$160 - $176 per month for a full-time employee] This funding obligation should be extended to all employers over a reasonable period of time. If the courts interpret federal law (ERISA) as preventing the State from establishing this employer obligation, the State should pursue other approaches that are tailored to withstand judicial review.
• Public Sector ResponsibilityThe public sector currently provides more than half of the coverage in this country. This includes funding coverage for low-income individuals through publicly financed insurance and clinic-based programs. In addition to funding these programs, the State should also provide assistance to purchase coverage for those employees and others who do not receive health coverage through their employers and who lack the income to purchase a policy. Subsidized coverage should be made available on a sliding scale for individuals whose incomes are under 300 percent of the federal poverty level, and who have limited savings and/or assets.
• Individual ResponsibilityIndividuals who are unemployed, self-employed, or who do not receive coverage through their employer, should be required to maintain a specified level of health care coverage. The cost of coverage should be subsidized for individuals who have incomes below 300 percent of the federal poverty level [$2,448 for a single person] and no significant assets.
2. Create a non-profit organization or public entity to implement and operate reforms. A new organization (similar to the Massachusetts Health Insurance Connector) should be created to help individuals and small employers shop for health insurance plans. Like the Massachusetts entity, the Washington “Health Insurance Connector” would carry out the following roles:
• Establish the amount that individuals are expected to contribute toward their health care costs.
• Determine the minimum benefits package that employers are expected to provide their employees, and individuals would be required to purchase.
In order for the benefit to be meaningful, it must include coverage for preventative services and provide protection from catastrophic expenses. • Review and certify low-cost and/or high-value health care plans for individuals and small employers that cover additional services to those provided under the minimum benefits package.
• Make it easier for individuals and small employers to shop for cost-effective, quality health plans by providing a one-stop shopping location and information source for all plans.
• Provide an administrative framework that can collect contributions from more than one employer toward health plan coverage for an individual, and that small employers can use to offer a cafeteria (“Section 125”) plan with pre-tax dollars.
• Develop and implement improved mechanisms for pooling risks and for subsidizing coverage for low-income individuals.
3. Require administrative efficiencies in the health insurance systemTo reduce high administrative costs, the state should create a non-profit organization to carry out a centralized provider credentialing program and a single uniform claims processing system.
The Utah Health Information Network and One Health Port in Puget Sound are examples of potential platforms for the implementation of claims processing.
4. Invest in outcomes-based healthcare We must continue to implement evidence-based health care purchasing initiatives and incentives in order to reduce the amount we spend on poor quality and inefficient care. Paying providers to perform higher quality care will be a crucial step in improving the efficiency of health care services. The State should continue to pursue new health care purchasing strategies that offer greater incentives for providing high quality, efficient, and outcomes-focused care. This should include support for the expanded adoption of interoperable electronic health care records and databases to track health care outcomes, building off the work of Inland Northwest Health Services. It should also include continued support for the work of the Puget Sound Health Alliance to enable health care purchasers to use evidence to identify and measure quality health care, and to produce publicly-available comparison reports designed to help improve health care decision-making.

Tab 65

Washington Mental Health Reform Coalition
Washington State Blue Ribbon Commission on Healthcare
CAM-Proposal One
Complementary, Integrative, & Alternative Medicine
September 1, 2006
Integrative Medicine And Its Future The balance between conventional medicine and alternative
medicine is a delicate one. Right now, both schools of thought refuse to work together, and the general public is who suffers.
(12/2004)
Washington Mental Health Reform Coalition’s Consumer-Driven, Mental Health Comprehensive Plan for the Blue Ribbon Commission for Mental Health Coverage Enhancing Consumer-Directed, Recovery-Focused, Consumer-Voiced Proposal. From a Washington Mental Health Reform Coalition (WMHRC) and its members’ perspective, the WA ST Mental Health Comprehensive Plan (MHCP) lacks what many of our members testified in Mental Health Transformation Grant’s Survey #1 & Survey #2 from January to the present. We respectfully request this amendment to the current MHCP and to the Blue Ribbon Commission on Healthcare. The MHCP does not reflect a consumer-directed, recovery MH system.
Washington Mental Health Reform Coalition
Co-Founders Carole Willey, Steve Pearce & Vonne Worth
P.O. Box 19633, Seattle, WA 98109
206-283-1099

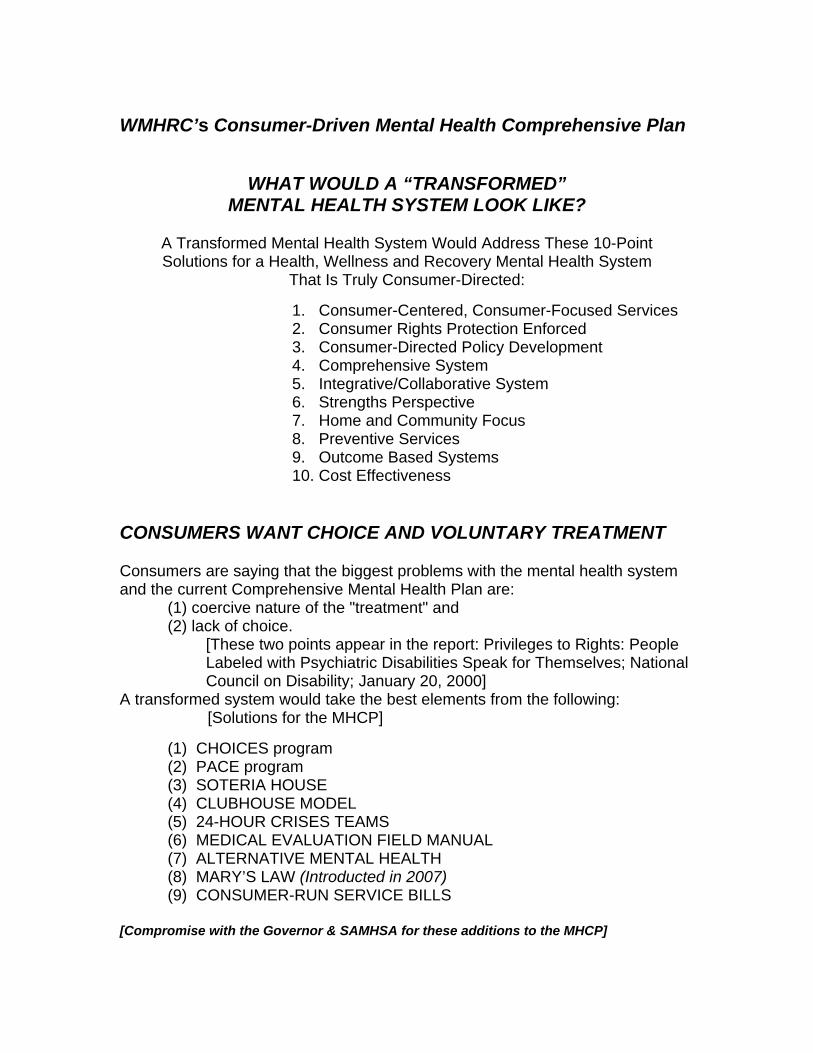
WMHRC’s Consumer-Driven Mental Health Comprehensive Plan
WHAT WOULD A “TRANSFORMED”
MENTAL HEALTH SYSTEM LOOK LIKE?
A Transformed Mental Health System Would Address These 10-Point Solutions for a Health, Wellness and Recovery Mental Health System
That Is Truly Consumer-Directed:
1. Consumer-Centered, Consumer-Focused Services 2. Consumer Rights Protection Enforced 3. Consumer-Directed Policy Development 4. Comprehensive System 5. Integrative/Collaborative System 6. Strengths Perspective 7. Home and Community Focus 8. Preventive Services 9. Outcome Based Systems 10. Cost Effectiveness
CONSUMERS WANT CHOICE AND VOLUNTARY TREATMENT
Consumers are saying that the biggest problems with the mental health system and the current Comprehensive Mental Health Plan are:
(1) coercive nature of the "treatment" and (2) lack of choice.
[These two points appear in the report: Privileges to Rights: People Labeled with Psychiatric Disabilities Speak for Themselves; National Council on Disability; January 20, 2000]
A transformed system would take the best elements from the following: [Solutions for the MHCP] (1) CHOICES program (2) PACE program (3) SOTERIA HOUSE (4) CLUBHOUSE MODEL (5) 24-HOUR CRISES TEAMS (6) MEDICAL EVALUATION FIELD MANUAL (7) ALTERNATIVE MENTAL HEALTH (8) MARY’S LAW (Introducted in 2007) (9) CONSUMER-RUN SERVICE BILLS
[Compromise with the Governor & SAMHSA for these additions to the MHCP]

Alternative Medicine
Welcome to Alternative and Integrative Medicine Infocenter in Holisticonline.com!
Introduction
Definitions
What Is Alternative Medicine?
What is Complementary Medicine?
What is Holistic Medicine?
What is Natural Medicine?
HolisticOnLine Philosophy
What is the Difference Between Conventional and Holistic Medicine?
How Popular Is Alternative Medicine?
Classification of Alternative Systems of Medical Practice
Some of the alternative therapies currently under study with grants from NIH
Approaching Complementary and Alternative Therapies
Assess the Safety and Effectiveness of the Therapy
Examine the Practitioner's Expertise
Consider the Service Delivery
Consider the Costs
Consult Your Health Care Provider
Guest Articles
Integrative Medicine And Its Future The balance between conventional medicine and alternative medicine is a delicate one. Right now, both schools of thought refuse to work together, and the general public is who suffers. (12/2004
CAMLAW : Complementary And Alternative Medicine Law Blog
Published By Michael Cohen, Esq.Complementary, Alternative, & Integrative Medicine Law, Regulation, Ethics & Policy
• Legal Services • Speaking • Books
• About Michael • Contact
Home > Legal Services >
Legal Services
Our firm offers expertise in health law, with a unique focus on alternative, complementary, and integrative
medical therapies, as well as general business law.
Legal Services: Legal Expertise: • Business organization and strategic planning • Contract drafting and negotiation • Corporate structure • Credentialing, licensure, scope of practice • Dietary supplement labeling & regulation • Employment contracts and related issues • Entertainment law • Ethical, regulatory, and institutional guidelines • Food & drug issues; medical devices • General corporate law and business issues • HIPPA and privacy/confidentiality concerns • Hospital policy design and regulatory compliance • Informed consent and medical documentation • Insurance and health plan/CAM benefit design • Intellectual property issues • Licenses, permits, leases • Malpractice liability issues • Professional discipline concerns • Negotiation & alternative dispute resolution • Policy and legislative strategies • Quality assurance & risk management
Michael's legal expertise spans over fifteen years. He received his JD and MBA from the University of California, Berkeley, clerked for Chief Judge Griesa in the Southern District of New York, practiced corporate law on Wall Street, and taught healthcare law before joining the faculty of Harvard Medical School. Read more.
Read about Alan Dumoff, Esq.
• Self-referral; Stark and anti-kicback issues • Vendor contracts with strategic partners • Website, brochure, and literature review
We offer a supportive, results-oriented approach, focusing on key legal issues in CAM and integrative care.
Michael speaks and guides policymakers and the media on health law, tapping specialized knowledge, in-depth
understanding, and an outstanding reputation in industry, academe, and government. Contact us today for a
consultation about legal services involving general business questions and complementary, alternative, and
integrative medical therapies and energy medicine.
Representative Clients
Law Offices of Michael H. Cohen offers general corporate legal services, and expertise in health law, with
a unique focus on alternative, complementary, and integrative medical therapies.
Continue Reading
What Clients Say
"Michael's legal expertise was a valuable asset in helping me become the first Doctor of Chiropractic credentialed at a major teaching hospital in the United States....
Continue Reading
About Alan Dumoff, Esq.
Alan Dumoff, JD, MSW has significant experience helping health care providers establish integrative care clinics.
Continue Reading Categories
• Caribbean
• Chiropractic
• Clinical Research
• Dietary Supplements
• Ethical Issues
• FAQs
• General Business
• Health Trends
• Hospital Policy
• Insurance
• International

• Licensure and Credentialing
• Malpractice and Risk Management
• Mental Healthcare
• Negotiation
• New Regulation
• Professional Discipline
• Resources
• Reviews (Books/Films)
• Spa Legal Issues
• Spirituality in Healthcare
• Yoga
Search This Site
Search Phrase
Subscribe What is RSS?
Featured Books By Michael Cohen Resources
• The Integrator
• Integrative Mental Health
• Ariz Family Law
• The Whole Child
• Gina Smith
• Legal Marketing
• Netlawblog
• Crime and Federalism
• Law, Current Events & Culture
• Bioethics Blog
• Benefits Blog
• Be Spacific
• Dennis Kennedy
• Bag and Baggage
• Law Under the Microscope
• HyScience
• Professor Bainbridge
• The Piper Report
• Noetic Sciences
• Phoenix Divorce Lawyer (Alexander Nirenstein)
• The Radical Middle
• Chess Law
• About the Blawg Rev.
• OK Blawg
• SW Virginia Law
• Notes From the Legal Underground
• Invent Law Blog
• Unintended Consequences
• Texas Law Blog
• Abstract Appeal (11th Cir.)
• New York Civil Law
• Law and Politics Worldwide
• Holland & Hart Health Care Law
• Sanford Hausler's Second Opinions
• Adam Smith, Esq.
• The Legal Reader
• New York Arbitration (Herz)
• Real Lawyers :: Have Blogs
Designed By lexBlogCopyright © 2006, lexBlog, Inc.
• Privacy Policy • Disclaimer • Site Map
Complementary and Alternative Medicine Law Blog (CAMLaw Blog): Health Care Law and Policy for Complementary, Alternative, and Integrative Medicine, Wellness, and Holistic Health. Law Offices of Michael H. Cohen 770 Mass. Ave., POB 391108 Cambridge, MA 02139 Phone: 617 825 3368
&
Providing information about conventional, alternative and integrative approaches in mental health
care
Note: New address January 1, 2006 - Get Directions
Integrative Mental Health represents the work and ideas of Dr. James Lake. There are three major goals:
• Informing patients and medical practitioners about the evidence for non-conventional and integrative approaches in mental health care
• Encouraging open-minded dialog about evolving understandings and novel approaches in assessment and treatment in mental health care
• Providing a gateway to excellent web-based resources covering the range of biological, somatic, mind-body and energy-information therapies in mental health care
Copyright © 2005 James Lake. All rights reserved.
http://www.camlawblog.com/cat-hospital-policy.html
SITE MENU
Site sponsored by Safe Harbor, a nonprofit corporat
Welcome to the world's largest site on non-drug approaches for mental health. Thousands of people around the world have recovered from mental disorders and now enjoy the simple pleasures of a drug-free life. Most were told this was impossible. Yet we hear from these individuals regularly. Many others have been able to significantly reduce their dependency on psychiatric medication. Commonly these people find that underlying their "mental" disorders are medical problems, allergies, toxic conditions, nutritional imbalances, poor diets, lack of exercise, or other treatable physical conditions. Our site has testimonials, over 100 articles, and the Web's only directory of alternative mental health practitioners. You can also get information from our bookstore, support groups, email lists, and our free monthly newsletter. We hope you find the answers you have been looking for...
Find a Doctor / Practitioner Index to Articles
Read Testimonials Events & SeminarsPatients Rights Groups BookstoreLocal Safe Harbor Chapters LecturesHealth Organizations Support Group Listserv Organizations and Facilities
Events & Seminars Make a DonationGet Listed in Our Directory Volunteer OpportunitiesIndex to Articles Contact InformationContact Information Press ClippingsIntegrative Psych. Listserv Online Store Share Your Testimonial Website Keyword Search Similar Site in German
Web Design by Stephen Wendel Webmaster: Chris Daino Please see the contact page if you have questions or comments about this site.
DISCLAIMER: The information of this Website is for educational purposes only and is not intended to replace the advice of phyor health care practitioners. It is also not intended to diagnose or prescribe treatment for any illness or disordeAnyone already undergoing physician-prescribed therapy should seek the advice of his or her doctor before reddosage or stopping such treatment.
http://www.alternativementalhealth.com/
CAM for General Practice - Possibly Non-Objective Views
Each of the below electronic listings has multiple articles
& academic review articles.
ACADEMIA AND CLINIC
COMPLEMENTARY AND ALTERNATIVE MEDICINE SERIES Series Editors: David M. Eisenberg, MD, and Ted J. Kaptchuk, OMD
Potential Physician Malpractice Liability Associated with Complementary and Integrative Medical Therapies
Michael H. Cohen, JD, and David M. Eisenberg, MD
16 April 2002 | Volume 136 Issue 8 | Pages 596-603
http://www.annals.org/cgi/content/abstract/136/8/596
ACADEMIA AND CLINIC
COMPLEMENTARY AND ALTERNATIVE MEDICINE SERIES Series Editors: David M. Eisenberg, MD, and Ted J. Kaptchuk, OMD
Potential Physician Malpractice Liability Associated with Complementary and Integrative Medical Therapies
Michael H. Cohen, JD, and David M. Eisenberg, MD
16 April 2002 | Volume 136 Issue 8 | Pages 596-603
Physicians are increasingly grappling with medical liability issues as complementary and integrative health care practices are made available in conventional medical settings. This article
proposes a framework in which physicians can assess potential malpractice liability issues in counseling patients about complementary and integrative therapies. The framework classifies complementary and integrative therapies according to whether the evidence reported in the medical and scientific literature supports both safety and efficacy; supports safety, but evidence regarding efficacy is inconclusive; supports efficacy, but evidence regarding safety is inconclusive; or indicates either serious risk or inefficacy. Clinical examples in each category help guide the
clinician on how to counsel patients regarding use of complementary and alternative medical therapies in a given clinical situation. Specific strategies to reduce the risk for potential malpractice liability include the following: 1) determine the clinical risk level; 2) document the literature supporting the therapeutic choice; 3) provide adequate informed consent; 4) continue to
monitor the patient conventionally; and 5) for referrals, inquire about the competence of the complementary and alternative medicine provider. This framework provides a basis for clinical decisions involving complementary and integrative care.
http://annals.org/cgi/content/abstract/136/8/596 My twin sister, Teresa Bell, died of lung cancer but at Virginia Mason, Seattle, she requested an appointment for a CAM doctor and receive valuable information that our family utilized but did not help my sister with massive tumors in Stage Four Cancer. Here is where CAM and conventional medicine can work together. Please, consult with the Virginia Mason, Cancer Institute.
Sincerely, Carole Willey Co-Founder of the Washington Mental Health Reform Coalition www.wmhrc.50megs.com360-352-5361 vm [email protected] ARTICLES
Evaluating complementary and alternative therapies for cancer patients
B. R. Cassileth Integrative Medicine Service, Memorial Sloan-Kettering Cancer Center, New York City, NY, USA.
"Complementary and alternative" therapies are actually a vast collection of disparate, unrelated regimens and products, ranging from adjunctive modalities that effectively enhance quality of life and promising antitumor herbal remedies now under investigation, to bogus therapies that claim to cure cancer and that harm not only directly, but also indirectly by encouraging patients to avoid or postpone effective cancer care.
Complementary therapies such as music and massage, herbal teas to aid digestion and relieve nausea, yoga, tai chi, meditation, and the many other well-documented techniques that relieve stress and enhance well-being should be made available to patients to augment and ease the experience of cancer treatment and recovery. Many time-tested herbal and diet-based remedies are now being studied for their abilities to induce or extend remission without toxicity. At the same time, lack of government regulatory authority leaves consumers at the mercy of those who promote unproved
remedies, scores of which the grocery store and pharmacy shelves. Many of these over-the-counter products contain harmful ingredients. Herb-drug interactions, only some of which are documented, occur with frequency and are sufficiently problematic to require that patients stop taking herbal remedies prior to surgery (to prevent interactions with anesthetics and anticoagulant effects); before radiation (due to potential for increased
photosensitivity); and during courses of chemotherapy (to prevent product-drug interactions). Moreover, both good information and misinformation that appear in printed materials and on the Internet appeal to better educated consumers, who are, in fact, the most likely to try complementary and alternative methods. http://caonline.amcancersoc.org/cgi/content/abstract/49/6/362
The Oncologist, Vol. 9, No. 1, 80–89, February 2004 © 2004 AlphaMed Press
CAM for Cancer
ORIGINAL PAPER Symptom Management and Supportive Care
Complementary and Alternative Therapies for Cancer Barrie R. Cassileth, Gary Deng
Integrative Medicine Service, Memorial Sloan-Kettering Cancer Center, New York, New York, USA
Correspondence: Barrie R. Cassileth, Ph.D., Integrative Medicine Service, Memorial Sloan-Kettering Cancer Center, 1275 York Avenue, H13, New York, New York 10021, USA. Telephone: 212-639-8629; Fax: 212-794-5851; e-mail: [email protected]
Many cancer patients use therapies promoted as literal alternatives to conventional medical care. Such "alternative" modalities are unproven or were studied and found worthless. These can be harmful. An even greater proportion of cancer patients uses "complementary" therapies along with mainstream cancer treatment. Most are helpful adjunctive approaches that control symptoms and enhance quality of life. This review describes alternative as well as complementary therapies commonly used today by cancer patients. Herbal remedies also are discussed. Evidence regarding the efficacy and safety of complementary/alternative medicine (CAM) is reviewed, and implications for oncologists are discussed. To encourage open communication of CAM use by patients, oncologists should be knowledgeable about the most popular remedies and know where to find reliable information for themselves and for their patients.
http://theoncologist.alphamedpress.org/cgi/content/abstract/9/1/80?etoc
The Journal of Holisticonline.comWelcome to Holistic Living, a place to relax and nourish your mind, body and spirit. Read inspirational writings, discover healthy recipes, check on the nutrition of the foods you eat, etc. In short, when you want to relax, this is the place to be!
Nutrition for Your Mind, Body and Soul
Healthy Recipes Herbal Teas Great Reading
Healthy and tasty foods from around the world Healthy Recipes
A collection of recipes from around the world. Herbal Teas
Great Prose Health and Lifestyle Poetry | Speeches
Special Prayers Foundation Recipes Great Substitutes
Prayer & Spirituality Selected Prayers Meditation
Beauty and Natural Skincare Infocenter
Nutrition, Vitamin & Diet Infocenter
Holisticonline.com Connections
Holisticonline Home Alternative Therapies Conditions/ Treatments http://www.1stholistic.com/default.htm
For more information Google Search for CAM, go to: http://www.google.com/search?hl=en&q=Complementary%2C+Integrative%2C+and+Alternative+
Medicines&btnG=Google+Search
Washington Mental Health Reform Coalition
Washington State Blue Ribbon Commission on Healthcare
CAM-Proposal Two
Complementary, Integrative, & Alternative Medicine
September 1, 2006
Integrative Medicine And Its Future The balance between conventional medicine and alternative
medicine is a delicate one. Right now, both schools of thought refuse to work together, and the general public is who suffers.
(12/2004)
Washington Mental Health Reform Coalition’s Consumer-Driven, Mental Health Comprehensive Plan for the Blue Ribbon Commission for Mental Health Coverage Enhancing Consumer-Directed, Recovery-Focused, Consumer-Voiced Proposal. From a Washington Mental Health Reform Coalition (WMHRC) and its members’ perspective, the WA ST Mental Health Comprehensive Plan (MHCP) lacks what many of our members testified in Mental Health Transformation Grant’s Survey #1 & Survey #2 from January to the present. We respectfully request this amendment to the current MHCP and to the Blue Ribbon Commission on Healthcare. The MHCP does not reflect a consumer-directed, recovery MH system.
Washington Mental Health Reform Coalition
Co-Founders Carole Willey, Steve Pearce & Vonne Worth
P.O. Box 19633, Seattle, WA 98109
206-283-1099
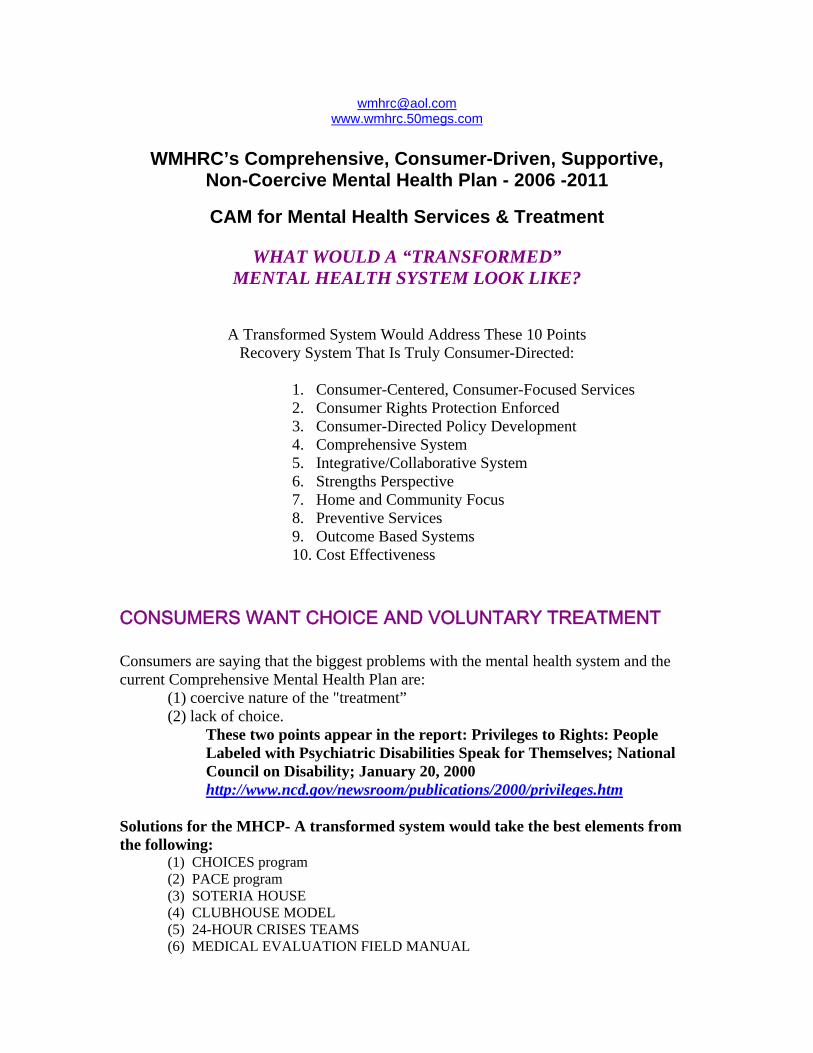
WMHRC’s Comprehensive, Consumer-Driven, Supportive,
Non-Coercive Mental Health Plan - 2006 -2011
CAM for Mental Health Services & Treatment
WHAT WOULD A “TRANSFORMED” MENTAL HEALTH SYSTEM LOOK LIKE?
A Transformed System Would Address These 10 Points Recovery System That Is Truly Consumer-Directed:
1. Consumer-Centered, Consumer-Focused Services 2. Consumer Rights Protection Enforced 3. Consumer-Directed Policy Development 4. Comprehensive System 5. Integrative/Collaborative System 6. Strengths Perspective 7. Home and Community Focus 8. Preventive Services 9. Outcome Based Systems 10. Cost Effectiveness
CONSUMERS WANT CHOICE AND VOLUNTARY TREATMENT
Consumers are saying that the biggest problems with the mental health system and the current Comprehensive Mental Health Plan are:
(1) coercive nature of the "treatment” (2) lack of choice.
These two points appear in the report: Privileges to Rights: People Labeled with Psychiatric Disabilities Speak for Themselves; National Council on Disability; January 20, 2000 http://www.ncd.gov/newsroom/publications/2000/privileges.htm
Solutions for the MHCP- A transformed system would take the best elements from the following:
(1) CHOICES program (2) PACE program (3) SOTERIA HOUSE (4) CLUBHOUSE MODEL (5) 24-HOUR CRISES TEAMS (6) MEDICAL EVALUATION FIELD MANUAL
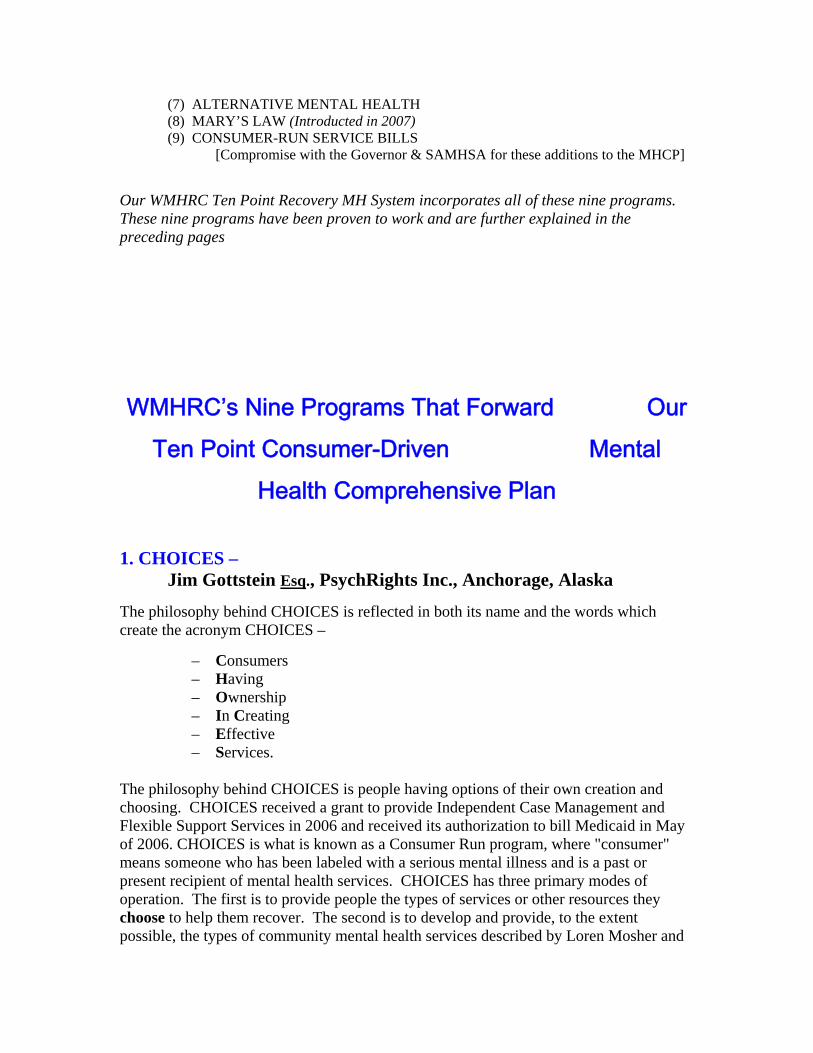
(7) ALTERNATIVE MENTAL HEALTH (8) MARY’S LAW (Introducted in 2007) (9) CONSUMER-RUN SERVICE BILLS
[Compromise with the Governor & SAMHSA for these additions to the MHCP] Our WMHRC Ten Point Recovery MH System incorporates all of these nine programs. These nine programs have been proven to work and are further explained in the preceding pages
WMHRC’s Nine Programs That Forward Our Ten Point Consumer-Driven Mental
Health Comprehensive Plan
1. CHOICES –
Jim Gottstein Esq., PsychRights Inc., Anchorage, Alaska The philosophy behind CHOICES is reflected in both its name and the words which create the acronym CHOICES –
– Consumers – Having – Ownership – In Creating – Effective – Services.
The philosophy behind CHOICES is people having options of their own creation and choosing. CHOICES received a grant to provide Independent Case Management and Flexible Support Services in 2006 and received its authorization to bill Medicaid in May of 2006. CHOICES is what is known as a Consumer Run program, where "consumer" means someone who has been labeled with a serious mental illness and is a past or present recipient of mental health services. CHOICES has three primary modes of operation. The first is to provide people the types of services or other resources they choose to help them recover. The second is to develop and provide, to the extent possible, the types of community mental health services described by Loren Mosher and
Lorenzo Burti in Chapter 9 of their excellent book, Community Mental Health: A Practical Guide. The third is to be a conduit for "pass-through" grants to other Consumer Run programs that do not have tax exempt status or the administrative wherewithal to do so themselves. We are hoping to be able to implement our helping philosophy to those who choose it in the very near future. 2. PACE –
Personal Assistance in Community Existence Dan Fisher, M.D., Ph.D., The Empowerment Center, Lawrence, Massachusetts
The National Empowerment Center (NEC) has described the path to genuine recovery—the empowerment model of recovery - PACE. According to this model, people with mental illnesses can completely recover by taking control of the major decisions of their lives and thereby assuming or resuming major social roles. We emphasize the importance of this distinction because it lies at the heart of the transformation of a MH system. National Empowerment Center aims to be a source of inspiration, information and referral to those seeking to know more about recovery from mental anguish and emotional overwhelm, sometimes referred to as "mental illness". NEC offers a variety of materials available in print, audio and video formats. The National Empowerment Center's information and referral service provides information about consumer/survivor resources throughout the country. Topics include:
• Consumer-Run Organizations • Holistic Alternatives • Information on Recovery • Recovery Stories
NEC staff and affiliates are available both nationally and internationally, to provide workshops, training, and speaking engagements on a variety of topics. Materials may be purchased here at this secure online store, or by calling 800POWER2U (800-769-3728). You may also Fax your order to 978-681-6426. Visit our workshop descriptions page and/or contact us at [email protected] 3. SOTERIA HOUSE – Handling Acute Psychiatric Crises Dr. Loren Mosher, San Diego, California Dr. Loren Mosher's Soteria-House project and study in the 1970's proved that people who are in acute psychiatric crisis, who would normally be hospitalized, can be at least as successfully treated and have better long term outcomes (lives) if they are allowed to get through their initial psychotic episode(s). The Soteria method can be characterized as the 24 hour a day application of interpersonal interventions by a nonprofessional staff,
usually without neuroleptic drug treatment, in the context of a small, homelike, quiet, supportive, protective, and tolerant social environment. [Multi-Faceted Grass-Roots Efforts To Bring About Meaningful Change Toalaska's Mental Health Rogram by Jim Gottstein August 2, 2005 with some updates to February 25, 2006]
Dr. Loren Mosher reviews the clinical and special social environmental data from the Soteria Project and its direct successors. Two random assignment studies of the Soteria model and its modification for long-term system clients reveal that roughly 85% to 90% of acute. and long-term clients deemed in need of acute hospitalization can be returned to the community without use of conventional hospital treatment. Soteria, designed as a drugfree treatment environment, was as successful as anti-psychotic drug treatment in reducing psychotic symptoms in 6 weeks. In its modified form, in facilities called Crossing Place and McAuliffe House where so-called long-term "frequent flyers" were treated, alternative-treated subjects were found to be as clinically improved as hospital-treated patients, at considerably lower cost.
Taken as a body of scientific evidence, it is clear that alternatives to acute psychiatric hospitalization are as, or more, effective than traditional hospital care in short-term reduction of psychopathology and longer- social adjustment. Data from the original drug-free, home-like, nonprofessionally staffed Soteria Project and its Bern, Switzerland, replication indicate that persons without extensive hospitalizations (<30 days) are especially responsive to the positive therapeutic effects of the well-defined, replicable Soteria-type special social environments. Reviews of other studies of diversion of persons deemed in need of hospitalization to "alternati-ve" programs have consistently shown equivalent or better program clinical results, at lower cost, from alternatives. Despite these clinical and cost data, alternatives to psychiatric hospitalization have not been widely implemented, indicative of a remarkable gap between available evidence and clinical practice. (J. Nerv Ment Dis 187:142-149, 1999) 4. CLUBHOUSES Clubhouses believe that recovery from serious mental illness (SMI) must involve the whole person in a vital and culturally sensitive community within which members (adults with SMI) can receive the supports necessary to lead productive and satisfying lives. Members are involved in all operational aspects of the clubhouse, working side-by-side with staff. Clubhouses offer a range of services including vocational supports, community-based employment (Transitional, Supported, and Independent Employment), education, housing, outreach, advocacy, assistance with accessing health care, substance abuse services, as well as social and recreational opportunities. 5. 24-HOUR CRISES TEAMS - Mobile Crises Intervention Teams
We like this approach due the fact that is not a forced treatment program like PACT – Program of Assertive Community Treatment or ACT – Assertive Community Treatment, which by their design require treatment compliance as the prime requirement of the program in order to qualify for services. People don’t graduate from PACT/ACT programs, if people succeed from these programs at all it is because of the support elements of community, employment and meeting basic human needs, and these needs can be met outside of PACT/ACT programs. The reality is that no-one needs the coercion of PACT/ACT programs. PACT/ACT programs are not sustainable budget wise because they do not reduce the need for the services they deliver. This is a common failure of past public mental health planning and delivery and is carried forward by the new effort to transform the system. There is a system designed to prevent expensive and dehumanizing hospitalization. Create and provide 24-HOUR MOBILE CRISES INTERVENTION TEAMS. “If a home intervention is thought to be necessary the team advises the caller of the plan and asks for his or her reaction. If the plan is acceptable, the caller is asked to assemble the parties relevant to the problem and told that the team will arrive in about 15-20 minutes. If it is a call from police on site, they are asked to stay also. A minimum of two team members, preferably a male and a female, should respond… On arrival the team evaluates the nature of the problem utilizing interview techniques…. The actual intervention w ill use a variety of techniques ….” In a properly designed and functioning community mental health system community residential treatment facilities should serve the vast majority of disturbed and disturbing individuals in need of intensive interpersonal care who cannot be adequately treated by in-home crises intervention. Use of these small home-like facilities in conjunction with 24-hour mobile crises intervention will dramatically reduce the need for psychiatric beds in hospitals. The 24-hour mobile crises intervention team should be the center of every community mental health program. In most situations it will function as the gatekeeper to the system. Systematic research on the use of 24-hour mobile crises teams has shown that they reduce hospitalization by at least 50%. The experience in South Verona ( Italy). [See the book, Community Mental Health: A Practical Guide, by Loren Mosher and Lorenzo Burti. You can find chapter 9 of this book online at http://choices-ak.org/grants/ 05TBGIOperating /Ch9.pdf.] The WMHRC primary objective is to point out to the Governor that Soteria House, PACE and Clubhouses would replace PACT and would achieve to be more cost-effective with better Measurable Performance Outcomes for recovery model that the Legislature is seeking in 2001 with HB 1650. Combined with the 24 hour Crises Teams (described below) you employ a complete model of recovery, from crises, to residential environment to empowerment and employment, all with or without psychiatric drugs in a voluntary environment of services individuals choose on their own.
6. MEDICAL EVALUATION FIELD MANUAL Dr. Lorrin Koran, in a study commissioned by the California state legislature, found that a large percentage of mental patients were suffering from undiagnosed physical illness. He developed the Medical Evaluation Field Manual, a screening procedure for finding the medical causes of severe mental symptoms. The manual may be viewed at: http://www.alternativementalhealth.com/articles/fieldmanual.htm.\ For several reasons, mental health professionals working within a mental health system have a professional and a legal obligation to recognize the presence of physical disease in their patients. First, physical diseases may cause a patient's mental disorder. Second, physical disease may worsen a mental disorder, either by affecting brain function or by giving rise to a psychopathologic reaction. Third, mentally ill patients are often unable or unwilling to seek medical care and may harbor a great deal of undiscovered physical disease. Finally, a patient's visit to a mental health program creates an opportunity to screen for physical disease in a symptomatic population. The yield of disease from such screening is usually higher than the yield in an asymptomatic population. [By Lorrin M. Koran, M.D., Department of Psychiatry and Behavioral Sciences, Stanford University Medical Center Stanford, California 1991] A transformed mental health system would employ such a screening procedure and would pay particular attention to nutritional deficiencies, toxic and allergic reactions, and hormonal imbalances, in addition to actual physical illnesses and reactions to other medications that have been prescribed. Thus people would be effectively screened and treated for health concerns so they would not need mental health services. 7. ALTERNATIVE MENTAL HEALTH
Excerpts from: Principles That Identify Orthomolecular Medicine: A Unique Medical Specialty Richard A. Kunin, M.D. Alternative Mental Health is poorly understood, yet anecdotal data shows that the majority of those that do “leave” the public mental health system do so through use of alternatives to psychiatric drugs.
“For the past two centuries, the treatment of severe mental symptoms has been the province of that branch of medicine called psychiatry. The most common treatments psychiatry has offered in the past fifty years have included psychosurgery, electroshock therapy and other forms of shock treatment, and drugs. Today drugs prevail as the accepted and widespread antidote for mental

troubles. The psychiatric approach views "mental illness" primarily as an incurable, genetic ailment that has to somehow be "controlled." However, many people do not want these treatments for themselves or their loved ones. And many do not believe that "mental illness" is a life sentence from one's genes. Indeed, quite a few do not believe "mental illness" even exists as such.
Over the years numerous observant physicians have discovered that psychiatric treatments are not the only answer. There are, in fact, alternatives to standard psychiatric care. The best alternatives find the root causes of the severe mental symptoms and cure them. The sources may be nutritional problems, allergies, glandular ailments, heavy metal poisoning, infections or a combination of these and other problems. Thousands of documented cases exist of people who have successfully recovered from a diagnosis of "mental illness" when they were, in fact, physically ill. They only improved when their physical disorder was discovered and treated. As a simple example, Dr. Carl Pfeiffer, one of the early researchers into nutritional treatment of the mentally disturbed, found that 90% of patients classified as "schizophrenics" could be "socially rehabilitated" through nutritional means. These same patients are generally considered "incurable" by psychiatrists and are normally relegated to a lifetime on drugs. For those who are suffering from mental ailments, even if the root causes can't be found, many alternative remedies exist that soothe symptoms without the toxic effects of drugs. Reflexology massage, special nutrients and herbs are but a few of the treatments that can safely soften the pain of extreme mental suffering. Resolving mental troubles through alternative means is not the same quick fix as drugs. It commonly requires testing of blood, urine, etc., with a Sherlock Holmes attitude, intent on tracking down the physical source of the trouble. Sometimes a number of approaches must be tried before success is achieved. But the reward, of course, is the eradication of the cause of the severe symptoms and,
commonly, the avoidance of a lifetime on psychiatric medication. Alternative mental health is a growing force in today's world - a beacon of hope for the many who seek a choice over the treadmill of daily medication.
Here is a list of 15 principles that identify the spirit" of Orthormolecular Medicine: 1. Orthomolecules come first in medical diagnosis and treatment. Knowledge of the safe and effective use of nutrients, enzymes, hormones, antigens, antibodies and other naturally occurring molecules is essential to assure a reasonable standard of care in medical practice.
2. Orthomolecules have a low risk of toxicity. Pharmacological drugs always carry a higher risk and are therefore second choice if there is an orthomolecular alternative treatment.
3. Laboratory tests are not always accurate and blood tests do not necessarily reflect nutrient levels within specific organs or tissues, particularly not within the nervous system. Therapeutic trial and dose titration is often the most practical test.
4. Biochemical individuality is a central precept of Orthomolecular Medicine. Hence, the search for optimal nutrient doses is a practical issue. Megadoses, larger than normal doses of nutrients, are often effective but this can only be determined by therapeutic trial. Dose titration is indicated in otherwise unresponsive cases.
5. The Recommended Daily Allowance (RDA) of the United States Food and Nutrition Board are intended for normal, healthy people. By definition, sick patients are not normal or healthy and not likely to be adequately served by the RDA.
6. Environmental pollution of air, water and food is common. Diagnostic search for toxic pollutants is justified and a high "index of suspicion" is mandatory in every case.
7. Optimal health is a lifetime challenge. Biochemical needs change and our Orthomolecular prescriptions need to change based upon follow-up, repeated testing and therapeutic trials to permit fine-tuning of each prescription and to provide a degree of health never before possible.
8. Nutrient related disorders are always treatable and deficiencies are usually curable. To ignore their existence is tantamount to malpractice.
9. Don't let medical defeatism prevent a therapeutic trial. Hereditary and so-called 'locatable disorders are often responsive to Orthomolecular treatment.
10. When a treatment is known to be safe and possibly effective, as is the case in much 0 Orthomolecular therapy, a therapeutic trial is mandated.
11. Patient reports are usually reliable, The patient must listen to his body, The physician must listen to his patient.
12. To deny the patient information and access to Orthomolecular treatment is to deny the patient informed consent for any other treatment.
13. Inform the patient about his condition; provide access to all technical information and reports; respect the right of freedom of choice in medicine.
14. Inspire the patient to realize that Health is not merely the absence of disease but the positive attainment of optimal function and well-being.
15. Hope is therapeutic and orthomolecular therapies always are valuable as a source of Hope. This is ethical so long as there is no misrepresentation or deception.”
Excerpts from: Principles That Identify Orthomolecular Medicine: A Unique Medical Specialty Richard A. Kunin, M.D.
Linus Pauling (Steve this was in the middle of the information above. I moved it http://www.alternativementalhealth.com/about/whatis.htm

In 1969 Linus Pauling coined the word "Orthomolecular" to denote the use of naturally occurring substances, particularly nutrients, in maintaining health and treating disease. At that time megadose niacin therapy for schizophrenia and dietary treatment of "hypoglycemia7 were the major focus of the movement. Since then Orthomolecular psychiatry and medicine have emerged as a distinct and important specialty area in medical practice. Alternative therapies have come forward to fill the vacuum left by modern Medicine, which failed to provide effective treatments for the major epidemic diseases and in protest against Medicine's over-reliance on pharmacology, for the drug treatments seem to have fostered the epidemic of drug-dependence which is the major epidemic of our time. The public majority were ready for a new medicine based on nontoxic, non-invasive, "natural" medicines to go with the re-discovered "natural foods". Holistic medicine became a rallying point for the New Medicine by putting nutrition, exercise and meditation ahead of surgery, radiation and drugs. … The love of our grateful patients, those we are privileged to heal and comfort, this must be the ultimate motive. At any rate, I think you will agree that the orthomolecular professional is a different personality, with different beliefs and values than most present-day practitioners of medical orthodoxy. Of course all physicians do cherish our Hippocratic oath, but the orthomolecular identity confers upon us additional values and beliefs. Hippocrates first rule was: "Primum non nocere," i.e. "first, do no harm". We in orthomolecular practice have less need for the primacy of that rule, for it is already implicit in the essence of Orthomolecular practice, which is: "put nutrition first".
8. MARY’S LAW - TRANSFORMING INVOLUNTARY PSYCHIATRIC EVALUATION AND DETENTION LAWS In line with Goal of Consumer Directed Services and Care, the consumers health care choices should be honored where they are prescribed via a Psychiatric Advance Directive or other legal means. Currently the right to refuse medication and control ones health care choices via a Psychiatric Advance Directive or other means can easily be negated by a psychiatrist refusing to honor the Advanced Directive and can override any refusal to be given psychotropic drugs with the consent of two psychiatrists. Overriding a patients wishes is a common practice, limited only by the access to two psychiatrists. Mary’s Law, drafted by Michael Haan, aims to return autonomy to the health (mental health) care recipient. The psychiatrists or treatment provider does not have to agree to the treatment desired, but cannot force their own brand of treatment on the patient either. 9. CONSUMER RUN SERVICES House Bill 1005 & Senate Bill 5753: ‘Creating a consumer or advocate-run mental health service delivery system.’ Sponsors: Representatives O'Brien, Hinkle, Moeller, Campbell, B. Sullivan, Linville, Morris HB 1005 Finds that the involvement of persons with mental illness, their family members, and advocates in designing, implementing, and delivering mental health services reduces unnecessary hospitalizations and incarceration and promotes the recovery and employment of persons with mental illness. Declares that regional support networks shall assume all duties assigned to county authorities by chapter 71.24 RCW and chapter 71.05 RCW. The regional support networks, or its designee, shall provide consumer or advocate-run services. Provides that the department shall not require a consumer or advocate-run service to maintain licensure under chapter 71.24 RCW if the service is non-clinical. If a service is clinical, the service shall comply with the requirements for licensed services in this chapter. Declares that consumer or advocate-run services may include, but are not limited to: (1) Consumer and/or advocate-operated businesses; (2) Clubhouses, including but not limited to the Fountain House model as certified by the International Center for Clubhouse Development; (3) Crisis services; (4) Advocacy and referral services; (5) Vocational and employment services; (6) Self-help and peer counseling and support groups; (7) Community presence in state hospitals; and (8) Mental health Advance Directive training.

WMHRC thinks funding should come from the
MH Transformation Grant (MHTG).
CREATING A SYSTEM OF CHOICES FOR A NEW CONSUMER-DIRECTED RECOVERY WA ST MENTAL HEALTH SYSTEM
WMHRC envisions creating a system of choices for a new Consumer-Directed Recovery WA ST mental health system that is centered on the following principles and values:
A. Make all these program Medicaid eligible:
• CHOICES Program • PACE Program • SOTERIA HOUSE • CLUBHOUSE MODEL • 24-HOUR CRISES TEAMS • MEDICAL EVALUATION FIELD MANUAL • ALTERNATIVE MENTAL HEALTH • MARY’S LAW • CONSUMER-RUN SERVICE BILLS
B. Throughout the system use the principals CHOICES and PACE (Personal
Assistance In Community Existence) – as they align with the New Freedom Commission Report, being recovery-based and consumer-driven.
C. Provide 24-HOUR MOBILE CRISES INTERVENTION TEAM – designed to
keep people out of state psychiatric hospitals [See Loren Mosher/Lorenzo Burti's book, Community Mental Health: A Practical Guide. You can find chapter 9 online at http://choices-ak.org/grants/ 05TBGIOperating /Ch9.pdf.]
D. Create community SOTERIA HOUSES – where an individual can go to be
“nursed through” a psychotic break without the use of psychiatric drugs as an alternative to expensive, in-patient psychiatric hospitalization.
E. Create programs for those existing persons leaving state Hospitals prior to
discharge to arrange housing, support services, connection to programs that will meet the needs of that person – could be a specially developed CHOICES/PACE program, Soteria House, Club House, etc.
F. Offer training on use of Advanced Directives where the client pre-determines the
conditions for determining a relapse and the treatments to be administered in such event would be a feature at this phase.
G. Emphasize CLUBHOUSES as the way to empower consumers and as the means
to gain employment and independence from the system. H. Create a program for homeless people using CHOICES/PACE. There is a
program in Florida already called “CHOICES” that could be a model. [See,
Addressing Self-Defined Goals Improves Psychiatric Status of Homeless People http://akmhcweb.org/ choices/ choices.htm]
I. Begin a program immediately in every facility modeled after the MEDICAL
EVALUATION FIELD MANUAL. How many people have misdiagnosed medical ailments that instead have been given psychiatric labels and treatments? Some studies show this to be up to 75% of those in the psychiatric system. [Created by Lorrin M. Koran, M.D., Department of Psychiatry and Behavioral Sciences, Stanford University Medical Center Stanford, California 1991]
J. Alternative Mental Health – Have a Naturopathic Practitioner at all 50
Community Mental Health Centers in Washington by 2008.
OUTCOMES THAT INDICATE CHANGE
1. Use the model of the King County 2001 Recovery Ordinance and track: A. Recovered - GAF score 81 and above
B. Less Dependent – GAF score 51-80 C. Dependent – GAF score 50 and below
A tool other than the GAF could be used if it graphically tracked objective indicators from complete disability to health and freedom from symptoms. The point is to provide an objective gauge for individuals to estimate their own progress or lack of progress as well as provide system managers and elected officials with true performance data – which is almost non-existent in our current system and “under development” yet again in the Transformation Projects Comprehensive Mental Health Plan
2. # of Clubhouses - following the Clubhouse Model 3. # of Consumers enrolled in Clubhouses (and thereby not needing hospitalization) 4. # of Soteria Houses 5. # of people enrolled in Soteria Houses 6. # and % of people enrolled in employment training programs 7. # and % of people employed by program 8. # of Consumer Run Services and # of people involved 9. # of Consumer Run Services and # of people involved 10. # of people with adequate support services, like housing, proper diet, assistance
and quality of life factors 11. # of participants who were formerly homeless 12. Effect of these programs on recidivism and jail populations 13. Effect of these programs on those with chemical addictions.
OUTCOMES – SUMMARY
• The overall goal is to create a voluntary, non-coercive system of services that people want and need.
• These services aim to give the person hope for their future. • Help the person move towards independence and autonomy while preserving
basic and essential human rights. • The system is for the people in it, not the treatment providers.
REFERENCES FOR WMHRC SOLUTIONS
• CHOICES, go to: http://akmhcweb.org/choices/choices.htm • SOTERIA HOUSE: http://www.moshersoteria.com/soteri.htm • PACE - The National Empowerment Center (NEC), go to:
http://www.power2u.org/index.html • CLUBHOUSE, go to: http://www.iccd.org/default.aspx • MEDICAL EVALUATION FIELD MANUAL, go to:
http://www.alternativementalhealth.com/articles/fieldmanual.htm • 24-HOUR MOBILE CRISES INTERVENTION TEAM: Chapter 9, A
Community Services Smorgasbord, Community Mental Health by Loren R. Mosher, Lorenzo Burti
REFERENCES FOR MHCP’s PROBLEMS
• PACT Analysis – ibid. (Also, see the report: Clark County Assertive
Community Treatment by WIMIRT), • King County Recovery Ordinance, Ordinance #13974 Annual Report:
Recovery Model, for the years 2002, 2003 and 2004. Contact directly for copies of this report, as they do not publish it or make it available without asking. Contact Sherry Hamilton, Communications Manager King County Department of Community and Human Services : email: [email protected] Phone: (206) 205-1324, Fax: (206) 296-5260 TDD: (206) 205-0569
[Note: The original ordinance #13974 was altered in 2005 to “water down” the report and to get away from the “horrible results” the report was designed to reveal. Apparently KC RSN has a greater desire to hide negative results from the public, consumers and legislators than reveal the truth about the lack of recovery from services delivered by the largest RSN in the State. KC RSN would also rather hide the fact the RSN did little to embrace the intent of the original ordinance. One claim the RSN makes during the time period of the ordinance there were budget shortfalls – this is true, but there was ample enough money to fund a salary increase to providers. Take the case of Seattle Mental Health’s top 3 executives and
top 5 psychiatrists getting and increase of $27,000 per year between 2002 and 2004, from an annual average of $133,797 to a new average of over $161,102 per person. ]
• King County, WA, ordinance requiring psychiatrists to keep track of how many people they make well, an ordinance improving customer service and performance measurement for clients in the publicly-funded mental health system; Passed Oct. 16, 2000. Ordinance #13974, Proposed # 2000-0294.2, Sponsors: Pullen, Fimia, Gossette & Irons. http://www.alternativementalhealth.com/articles/kingscounty.htm
REFERENCES ON PACT THE TROUBLE WITH PACT: QUESTIONING THE INCREASING USE OF ASSERTIVE COMMUNITY TREATMENT TEAMS IN COMMUNITY MENTAL HEALTH © PATRICIA SPINDEL and JO ANNE NUGENT Humber College of Applied Arts and Technology ABSTRACT: This article is a critical analysis of the PACT model. It encompasses three major areas of identified deficiency: philosophy, research, and practice. The authors reveal the biomedical bias of PACT, and critique its social control features. They also examine how PACT may prevent the building of community supports for individuals with serious mental health issues rather than promoting them. Programs of Assertive Community Treatment (PACT): A Critical Review. Tomi Gomory, Ph.D. School of Social Work The Florida State University Tallahassee, Florida, 32306-2570 Tel. 850-644-2328 [email protected] Please do not quote without the permission of the author Abstract: Advocates of Programs of Assertive Community Treatment (PACT) make numerous claims for this intensive intervention program, including reduced hospitalization, overall cost, and clinical symptomatology, and increased client satisfaction, and vocational and social functioning. However, a reanalysis of the controlled experimental research finds no empirical support for any of these claims. Instead, there is evidence that the program is both coercive and potentially harmful. The current promotion of PACT appears to be based more on professional enthusiasm for the medical model than upon any benefit to the clients. Introduction: The Programs for Assertive Community Treatment model, commonly known as PACT or ACT, was invented approximately 25 years ago by Marks, Test, and Stein (1973; Stein & Test, 1980). It is the most well researched and promoted community mental health treatment for those labeled persistently and severely mentally ill (SMI's). According to Mueser, Bond, Drake, and Resnick (1998), 27 random assignment and 23 uncontrolled studies have been completed on the model. The growth of the Training in Community Living Program (as PACT was originally named) in just 14 states went from 223 programs in 1992 to 397 programs by 1996. These PACTs treat 24,436 individuals, with total annual costs exceeding 157 million dollars, about half of which is paid through Medicaid (Community Support Network News [CSNN], 1997, p. 3). INDEX OF AVAILABLE APPENDICES
For more information on the issues presented here and on the issues below, please email: [email protected] or ph# 1-877-448-8517
• PACE • SOTERIA HOUSE • CLUBHOUSE • 24 HOUR CRISES TEAMS • PRIVILEGES TO RIGHTS • DECRIMINALIZATION • COST FACTORS
End

Tab 66
Improve Health Care in Washington Proposal September 2006 Blue Ribbon Commission and HCCA Barbara Brewitt, Ph.D., M.Div.
Improving Health Care Safety, Awareness, Self-Responsibility, Accessibility and Quality
Vision Statement and Goals – Washington State Blue Ribbon Commission In five years every Washingtonian obtains needed health care at an affordable price. The care is safe, efficient, cost-effective, patient-centered, prevention-oriented and materially improves the health of the person receiving it. This system is equitable, acknowledges that resources are limited, and reflects the shared responsibilities between individuals, communities, employees, and governing agencies in ensuring our population’s health. By 2012 Washingtonians are the healthiest people in the country and Washington state is a model state for other states to look to as an example of politics and people sharing responsibility for health care.
• Washingtonians will have health coverage that provides access to effective care with children having health care coverage by 2010.
• Population indicators will be consistent across race, gender and income throughout the stste • Total health care spending annually will be less than the growth of personal spending • The annual rate of health insurance costs to individuals and small businesses will be less than the
rate of inflation. • The annual rate of growth in health care expenditures will be less than the rate of growth in state
and impact their functionality in society and ability to contribute productively to the whole coverage and health-related bankruptcies.
• Uncompensated care costs will not exceed 2005 estimates of $726 million for uninsured individuals.
• Medical errors, waste, and variability will decrease and compare better with other countries quality. • Evidence-based standard of care 75% of the time. • Chronic illness will receive 100% compliance within the guidelines for management of the illness.
Introduction and Overview Summary:Washingtonian’s health care, trend-indicators point in the direction of need.1 Professionally trained, provider shortages, insurance premiums and an uninsured populace are increasing. In 2001 all but one county in the State were designated by federal officials as having shortages in primary care health professionals. Increasing numbers of people face underemployment and inadequate or no health care insurance. Thus, the population, in general, requires greater access to cost-effective health care modalities. Furthermore, the population is aging, thus additionally increasing chronically apparent symptoms, without adequate conventional medicines to increase a person’s quality of life or their longevity. The historical health care approach is documented to escalate the cost burden of federal and state government subsidies and entitlements. Washington State’s leadership has the opportunity to provide its population with a fresh option based upon the foundations laid down by federal and state legislation2. This approach recognizes the long valued and historical use of two types of medicine, conventional and alternative. Both forms of medicine were recognized by legislators with the intent to scrutinize new drugs, stimulate new scientific advances in drug discovery, and provide people with safety protection policies2. This legislation was not passed because of political ideologies, rather the acceptance of a historical lesson;
1 Policy Analysis, (HPAP) University of Washington 2002 Pulse Report Health2 Junod, Suzanne White An Alternative Perspective: Homeopathic Drugs, Royal Copeland, and Federal Drug Regulation Food and Drug Law Journal 2000, 55 (1):161-183: Revised Code of Washington (RCW) chapter 18 5557 36th Ave NE 206-522-6076 Seattle WA 98105-2313 [email protected] Copy Right, All rights reserved.
1
Improve Health Care in Washington Proposal September 2006 Blue Ribbon Commission and HCCA Barbara Brewitt, Ph.D., M.Div.
people self-medicate.2, 3 Additionally, Americans using alternative healing modalities (AHM) pay for these self medications out-of pocket.4 Everyone does not respond well to conventional drugs. Death by conventional medicine is a major problem throughout the United States.5 The point of Washington State’s model health care policy is to provide people with "distinct," but not necessarily "inferior" health care approaches. Thus, while this proposal, called ‘The Plan’, involves visible education about wellness and health care responsibility of the individual, it simultaneously creates greater technical assistance within the Department of Health to assure commitments of excellence and quality assurance by health care providers and professionals. A focus on fostering new modalities replaces the mindset currently held that illness, critical care and conventional costly medical approaches will solve the problem. Historically and currently people use complementary and alternative medicines (CAM), especially as preventative health care modalities for themselves and their families. This trend by the public will continue regarding personal and familial health care needs. Professional training in natural modalities of health care, medical sciences, research and biotechnological advances for the purposes of health are signatures of Washington State’s uniqueness. Washington State has a diverse population with a diversely trained set of health care professionals providing care to people with common human health needs. Washington State can be a model for other states and achieve its vision and goal over the next five years. As Wayne Jonas, MD and executive director of the Office of Alternative Medicine at the National Institutes of Health (NIH) said in 1994 “Alternative medicine is here to stay. It is no longer an option to ignore it or treat is as something outside the normal processes of science and medicine. The challenge is to move forward carefully, using both reason and wisdom, as we attempt to separate the pearls from the mud. The opportunity of the Blue Ribbon Commission on Health Care Costs and Access (HCCA) is to motivate Washingtonians to discern viable health care options. Teach them appropriately regarding the gradations of wellness and/or illness while simultaneously protecting health safety. The Plan guides people toward health care providers that are appropriate for their needs, optimizing quality of life while increasing State productivity and functionality in society. Cost-effective, safe and efficient health care is proposed by providing greater knowledge of the wellness movement as well as the illness industry. The Plan proposes collaborations within communities between individuals, businesses and health care facilities. Information regarding greater numbers of health-care-of-choice, point of service physical access locations (access points) will be disseminated while improving the quality systems available at those access points. Interactions and productive dialogue between various health care professionals and disciplines that offer care to the patient will be encouraged and scheduled. Education and messaging about wellness, as well as, illness will be provided growing in numbers of people who seek spiritual as well as physical health. A documented distrust in America’s health care policies, drug discovery processes and regulatory oversight on safety of drugs6 will be changed to one of restored trust. Washingtonians will experience
3 AARP and Natl Assoc for Health Policy, Washingtonpost.com discussion on Medicaid: America's Endangered Healthcare Safety Net 2005 4 Pagán A, Pauly DV Access To Conventional Medical Care And The Use Of Complementary And Alternative... Health Affairs.2005; 24: 255-262 5 Null G, Dean C, Feldman M, Rasio D, Smith D Death by Medicine, Nutrition Institute of America, Nov 2003, www.NutritionInstituteOfAmerica.org
5557 36th Ave NE 206-522-6076 Seattle WA 98105-2313 [email protected] Copy Right, All rights reserved.
2
Improve Health Care in Washington Proposal September 2006 Blue Ribbon Commission and HCCA Barbara Brewitt, Ph.D., M.Div.
collaborations to solve a common health care, costs and access concerns for their families and beloved-ones life and death risks. A program that demonstrates collaborations within Washington State between differing philosophies of health care will become distinctive. Washington State will become a leader in win-win situations related to health, wellness and critical care options available for residents. Washington State will demonstrate that it is a model for other states and other countries facing the same challenges and complexities of global aging and government responsibility and oversight Washingtonians, like citizens throughout the world, are facing socio-economic and population dynamics that lead to underemployment, inadequate health care insurance and aging. Often people are without health insurance which leaves them without private health care and dependent upon what scarce resources governmental agencies make available. The complexity of an increasingly senior aging majority population requires that political attention and resources focus on health care concerns. Other state governance priorities are pushed down the ‘to do’ list or ignored completely. Conventional medical costs related to a health care infra-structure are rising at rates five times inflation rate. This medical model, based upon an ill population use hospitals and highly trained medical personnel, to provide costly technological-device services that may not contribute to longevity or greater quality of care.7, 21 The new technological devices maximize diagnosis yet have failed to treat increasing complexities of aging. Health care concerns rank number two in priority for the Governor from the recent town hall meetings over the summer of 2006. The general population is increasingly dependent upon government programs of coverage, such as Medicaid and Medicare while the government under utilizes alternative health care options available to it. People’s self responsibility will be encouraged via immediate feedback through self-health quality of life measures, greater awareness of gradations of wellness and illness, information on additional access points for their care and diversity of needs. Estimated costs of services will also be provided to them. Care providers will be assisted to increase efficiencies and quality system processes. Many myths exist about Washington State’s health care system. State and local county government employees are at risk of telling an assuming public that a health care safety net is not available to them.7 One of the greatest myths present among Washingtonians is that health insurance is one of the best ways to finance health care. In reality, a minority of less than 15% of health insurance enrollees incur 78% of the costs. At least half of the health insurance enrollees incur less than 5% of the claims cost. The cost-benefit ratio at the State level has led both government entitlement programs to decrease pay-outs while insurance companies have focused on market share versus people’s individual’s needs.
Specifics to Questions: 1. What do you propose be done to realize the vision and goals: People naturally turn toward self medication for minor symptom relief when faced with chronic health care symptoms.8 Given this fact of chronic illness and symptom-relief seeking, the government could offer a new approach to health care. It could provide information about physical locations of affordable
6 Fontanarosa, PB, Rennie, D, DeAngelis, C.D., Postmarketing Surveillance – Lack of Vigilance, Lack of Trust, JAMA. 2004;292:2647-2650. Published online November 22, 2004 (doi:10.1001/jama.292.21.2647) 7 Watts C. Washington’s health care system: ten myths and three realities, Univ.WA Res. Ctr for Health Policy, 2003 8 Chronic illness is one that appears to be permanent or lasts a long time. It may get slowly worse over time. It may lead to death, or it may finally go away. It may cause permanent changes to the body. It will certainly affect the person's quality of life.
5557 36th Ave NE 206-522-6076 Seattle WA 98105-2313 [email protected] Copy Right, All rights reserved.
3
Improve Health Care in Washington Proposal September 2006 Blue Ribbon Commission and HCCA Barbara Brewitt, Ph.D., M.Div.
and easily accessible conventional health care as well as to alternative health care. Washingtonians will become better informed about taking care of themselves for wellness, chronic symptoms and illness. Citizens would increasingly learn how to discern when critical care would be necessary and what providers of entitlements realistically offer them services in their demographic region. Other resources available to them also are provided. Citizens are encouraged to take greater responsibility for their health by increased awareness of quality-of-life assessments of daily functionality. State statutes recognize two types of medicine; conventional medicine, (referred to in this Plan as Illness, Critical Care Conventional Medicine (ICCCM)) and complementary and alternative medicine (CAM) which is expanded in The Plan and called alternative healing modalities (AHM). AHM includes self-medications and treatments that may not involve a licensed health care practitioner such as might be available at a pharmacy, health food store or specialty shop. ICCCM providers are frequently infrastructure-abundant with associated health insurance. This often correlates with higher medical cost, and less health care medical doctor time per patient. AHM providers often lack the infrastructure desired by governmental regulatory authorities, yet provide longer professional time visits per patient. The ICCCM is more adept at critical care, often related to treating illnesses associated with the top ten causes of death while AHM is more adept at supporting the health needs of wellness seeking people or chronically ill persons. These ICCCM and AHM distinctions are not absolute, however, can be used to segment different population types that need health care options.
The goal of providing low-cost, safe medicines to a diverse self-responsible population can be achieved over a five year period according to the objectives outlined below:.
Objectives – Health Care Working Together For You (The Plan) Year One – Communicate, Educate and Assess County Meetings, Discussion Groups, Media Events,& Information Brochures on Two Forms of Medicine:
1. Identify Alternative Healing Modalities (AHM) in each county 2. Identify Illness, Critical Care Conventional Medicine (ICCCM) providers in each county 3. Develop brochures and fact sheets that help people determine needs now and for the future 4. Present information sheets with techniques for recognizing safe, quality care services covered
by your health care insurance and what requires out-of-pocket self-responsibility budgeting. 5. Provide information on the resources available to citizens. Inform where the Access Points
(physical locations) for health and illness care are located 6. Teach what responsibility for Wellness means – A matter of Your Life and Death
Provide citizens easy access to locations where self-health tests for cardio-vascular, oxygen uptake and mental function evaluations are occurring.
7. Collect data and Conduct Personal Assessments on Quality of Life measures (baseline)using Medical Outcomes Study (MOS)9 20=question standardized tests10.
Year Two – Educate and communicate how to discern what health care access points are needed and when to utilize which resource. Encourage maintenance of a Health Log. Teach through lectures, hand-outs and brochures located in the community, the gradations of health needs
9 A standardized, reliable, and validated instrument developed by health professionals representing diverse health care organizations. This 20 question, short-form health survey detects physical, mental, social functioning as well as health and pain perceptions. Stewart, AL, Hays RD, Ware, JE. (1988). The MOS Short-form General Health Survey. Medical Care, 26(7), 724-735. 10 Document scores from urban high professional health care quotients to rural low professional health care quotients in year 1 and year 5 for statistical purposes of measurement and later evaluation.
5557 36th Ave NE 206-522-6076 Seattle WA 98105-2313 [email protected] Copy Right, All rights reserved.
4
Improve Health Care in Washington Proposal September 2006 Blue Ribbon Commission and HCCA Barbara Brewitt, Ph.D., M.Div.
ranging from the risk factors for the top ten leading causes of death11 to the leading chronic ailments in US.12 Emphasize the aging of Washingtonians as well as the global trends of aging. Each Washingtonian can be a model for Wellness to others throughout the world.
Engage the ICCCM institutions to upgrade their communications systems about wellness and how they could interface with AHM access points. Simultaneously engage AHM and help them discern when ICCCM is needed when and how to refer individuals correctly.
Year Three – Increase County Visibilities to Health Care Resources Numerous exist across the spectrum of ICCCM and AHM. Identify weaknesses in AHM services and systems and infrastructure. Provide Department of Health (DOH) technical support to improve, rather than punish these weaknesses. Technical assistance to ICCCM focuses on efficiencies, cost containments and reduced medical errors.
Revise DOH infrastructure to separate the Technical Assistance Division from the Enforcement Division which is currently identical. Train DOH staff and field assistants to increase technical support that builds quality systems within AHM. Diminish enforcement and adjudicative activities against AHM innovators that show merit and potential. Assist ICCCM access points to improve quality control and detect systematic medical errors versus human frailties.13 Measure and identify actions that equate to raising the bar of quality on efficiencies, safety and customer service that educates. Hold events, forums and panel discussions that increase acceptance and tolerance between AHM, regulatory authorities and ICCCM institutions and providers. Strengthen through dialogue and visibilities the merit of scientifically sound, safe, efficient health care to a growing needy population facing a major change in health care economics and functional age. Study and interpret baseline assessments of population health quality in suburban vs rural areas. Provide additional health care support to the counties in most need of information, messaging, education and AHM health care options available to them ranging from better nutrition and exercise to accessing critical health care facilities and health care professionals.
Year Four - Protecting the People Policies, Shore up Weakness Areas Review and revise internal health care policies and associated benefit insurance plans, ICCCM provisions and relationships. Review and revise policies related to AHM access pojnts at professional and grass roots levels. Evaluate the medically needy" program’s criteria and costs to governments at federal, state and county levels. Identify cost-saving efficiencies and brain storm any new opportunities for health cards in specifically needy population segments. Formally assess where this entitlement fits given new government priorities, community commitment to health and wellness and prior to 2006 and since 2006. Determine which direction medical costs for the government are trending. The medically needy program is authorized by the federal government but it is up to each state to set the specific eligibility rules for its program.
11 Leading cause of death – heart disease, cancer, cerebral vascular disease, lower respiratory track infections, unintentional falls & injuries, diabetes mellitus, flu and influenza, Alzheimer’s disease, kidney diseases, Septicemia (U.S. National Center for Health Statistics, Health, United States, 2005) 12 Leading chronic illnesses – asthma, cystic fibrosis, kidney disease, crohn’s disease, muscular-neuronal diseases, arthritis-related, diabetes, proctitis, idiopathic anaphylaxis, leukodystrophy, ulcerative colitis, chemical sensistivities, 13 Jeppesen S Quality Improvement in the Retail Setting, Univ. WA powerpoint presentation to Dept. of Pharmacy
5557 36th Ave NE 206-522-6076 Seattle WA 98105-2313 [email protected] Copy Right, All rights reserved.
5
Improve Health Care in Washington Proposal September 2006 Blue Ribbon Commission and HCCA Barbara Brewitt, Ph.D., M.Div.
Year Five - Measure Strength and Weaknesses Repeat MOS measurements through the same agency locations in rural compared to urban access points as in Year One. Score the survey results and rate improvements by comparing year 1 to year 5, in similar demographic areas. Specifically compare improved health quality in rural vs urban areas in year 5 as well as year 5 to year 1 changes in rural vs rural and urban vs urban. Finalize changes in legislative policies and DOH changes in technical assistance vs enforcement. Is there a cost benefit ratio that improves for all citizens?
ICCCM health care provides the State government officials and insurance agencies with familiar institutional structures to operate efficiently yet at a very high cost and without providing access to medicine for all. Inclusion of AHM increases access to medicine and improves the quality of care provided to those with chronic ailments who may simultaneously be unemployed or underemployed. As a whole, AHM lacks the costly infrastructure and technologically advanced hospital settings of ICCCM approaches yet serves more of the population’s general interests for wellness and is gaining confidence with regard to safety and effectiveness. Both modalities of health care have advantages that could be utilized to achieve the five year goals of the Blue Ribbon Commission. 2. How will implementation of the plan enhance, hinder, or otherwise impact the achievement of vision and goal of the Commission? How do you know? The Plan is a new approach to state-wide health care that serves rural and urban population centers of a diverse nature. The Plan introduces to WA State governing bodies a structured actualization of what already exists, the use of two modalities of health care, conventional and alternative. The Plan takes greater responsibility for statutes of the Federal and State governments and enables patient populations to be protected through technical assistance to providers of AHM. It is presented that the government is better served by fostering both institutional and alternative modalities of health care than supporting a long held conventional approach that has grown too costly to serve the majority of the population. The population has always used two forms of medicine. The 1938 Food, Drug and Cosmetic Act was written during a time when similar problems faced the government.2 In the early 1900’s Americans from a diverse background and heritage used many AHM. Topics such as safety, identity, toxicity of conventional drugs, quality of easily accessible medicinal products and costs were issues for politicians and regulators. Formalizing distribution networks, fostering higher scientific and medical standards of training coupled with proper labeling provided access to people of the health care they desired. Plan implementation has the capability to enhance the health care options available to people while reducing costs, increasing efficiency and making the wellness trend the focus of a win-win message to an aging population versus a message on disease, illness, costly drugs and health care insurance that is reported to provide only 15% of enrollees with 78% of the claims cost7. The Plan might lessen the cost-burden of the institutionalized ICCCM and will impact the DOH infrastructure through restructuring department staffing, training and budgeting. DOH structure would include staff training to foster technical assistance to providers in the AHM community toward quality systems and ICCCM providers toward monitoring system integrity and opportunities for process improvements. The Commission is expected to feel lobby pressure toward ICCCM as well as some increased lobby by those in the naturopathic community with regard to quality controls and professional training and certifications of AHM providers. The tradeoff is enhanced services and lower costs to the public over the five year transition period. Discussions, dialogues and increased tolerance are critical elements to this new Plan to achieve the vision and meet the goals of the Governor’s Commission.
5557 36th Ave NE 206-522-6076 Seattle WA 98105-2313 [email protected] Copy Right, All rights reserved.
6
Improve Health Care in Washington Proposal September 2006 Blue Ribbon Commission and HCCA Barbara Brewitt, Ph.D., M.Div.
3. Is your proposal modeled after an existing policy or program? If so, please describe the policy or program and its outcomes. The Plan represents a potentially successful resolution where other approaches have failed regardless of differing political ideologies and health care approaches such as occurred in the United States and Denmark.14 In the policies attempted by these governments costs, access, health care and safety were all vision measures. However, US attempts to increase efficiencies based on ICCCM support via government subsidies to increase hospital construction, education and training of medical personnel yielded invaluable trade-offs with regard to regulatory controls over costs. The federal government was held accountable for lowered services, less access and costs beyond the government’s ability to pay for the entitlements. In Denmark, limited funds controlled new hospital construction and training of medical professionals. Access to ICCCM health care increased, however, without the proper staffing to handle the demand. Fewer people were served while costs went up. Neither model worked while government officials were held accountable for health care to the public. In Denmark, and to some degree in the United States, the people were lead to believe in the myths that ICCCM, health insurance and government entitlements of medicare or Medicaid would be their safety-nets. The health care approaches in these two countries failed to encourage the natural incentive of people to take responsibility for their own health and for their families’ health needs. The current Plan provides incentives for people to take responsibility for their own health. Increased self awareness of quality of life measures, knowledge about wellness and illness and information about a diversity of options for health care access in their communities will increase services to support a healthier population. Health is a matter of life or death. The town hall meetings ‘Listening to You’ demonstrated that the public values their health care needs as much as they value education of their children. The Wellness Revolution15 by economist Paul Pilzer predicts that people will spend more money, even if out-of-pocket, on wellness and disease prevention than on current expenditures on disease treatment. The Wellness movement is estimated as a $225 Billion industry and characterized by a population of people called Cultural Creatives or those with the Lifestyles of Health and Sustainability (LOHAS).16 This group supports healthy lifestyles. They buy natural products from those that reflect their own ethical business values and provide safe medicines. They are environmentally-conscious and seek products/activities that sustain the planet for the next generation. This group of consumers will pay 30% more for products and services which reflect their values and support their healthy lifestyles. Citizen’s need and demand diverse medical approaches for survival. Professional medical doctors solely trained in ICCCM do not resolve all of their health needs. The Plan involves these people by acknowledging their first choice for health care. This approach invites Cultural Creatives to take greater responsibility in solving the health care cost problem. This educated group once acknowledged for their wellness life-style and values will become a strong trend setter that others will follow. The statistic that 74.6% of Americans use AHM 17,18 demonstrates the
14 Green-Pedersen C, Wilkerson J. Common challenges, different systems : Agenda dynamics and comparative health policy developments in the US and Denmark, 2005 Annual Mtg of the American Political Science Association, WA DC Sept 1-4 15 Pilzer PZ The Wellness Revolution, Wiley, NY 2003 16 French S, Rogers G. LOHAS Market Research Review: Marketplace Opportunities Abound http://www.lohas.com/journal/trends.html 2005 17 Barnes PM, Powell-Griner E, McFann K, Nahin RL Complementary and alternative medicine use among adults: United States, 2002 Adv Data. 2004 May 27;(343):1-19. (A 2002 Survey of 31,044 over 18 years old within civilian, non-institutionalized population)
5557 36th Ave NE 206-522-6076 Seattle WA 98105-2313 [email protected] Copy Right, All rights reserved.
7
Improve Health Care in Washington Proposal September 2006 Blue Ribbon Commission and HCCA Barbara Brewitt, Ph.D., M.Div.
population is already approaches that support the wellness of spirit and body. These people can be characterized as:
• Highly educated – post-secondary and in degree programs. • 63 million people in five consumer segments; Sustainable Economy, Healthy Lifestyles,
Alternative Health Care, Personal Development, Ecological Lifestyles • $355 billion U.S. marketplace focused on health, the environment, social justice, personal
development and sustainable living19 • People display brand loyalty to companies that reflect the person’s ethics and values. This
segment of people actively look for safe and effective medicines and providers • Women outnumber men in selecting AHM • Most consumers using AHM self-prescribe • Health care of choice is AHM. Began as a movement; now a lifestyle 20
4. Will your proposal impose costs on individuals, businesses or government? Will these costs be time limited or on-going? Can you estimate how much these costs will be or suggest how such an estimate could be made? How much money would these predicted costs be offset by corresponding savings?
The Plan is designed to limit further costs and redirect current expenditures toward implementation of new activities. A mind shift to wellness, exercise and good nutrition is predicted to prevent illness attitudes that increase unwarranted hospital and costly ICCCM events that often lower effective health care anyway.21 Savings from unnecessary costs to government entitlement programs are predicted to curb increased costs. A number of historical, political, and economic explanations demonstrate that existing publicly funded healthcare systems increase expenditures of median medicare payments of $3,500 two years ($875/six-mo period) before death that are followed by further failure and death at increased median costs of $20,000/last six months of life.21,22 ICCCM is costly and necessary. However, ICCCM has less experience with safe and longer term interactive care of the chronically ill at younger ages and at less expense (primarily paid out of pocket) than does CAM23 and AHM providers24. Further, there is an imbalance in cost-benefit ratio to discover new drugs and provide for the individual in need without mass market profits in ICCCM.6,22, 25 There is myth that supply of health care options are diminishing as the population ages, since new AHM technologies appear especially in Washington State, a recognized leader in biotechnology advances, a leader in natural medicines and nutritional products.26 The State has the natural resources, the healthy environmental and the professionally trained
18 http://nccam.nih.gov/news/camsurvey_fs1.htm 19 Peterson, Eric Who’s Changing Whom? The LOHAS marketplace is fundamentally changing the structure of the American economy—and not the other way around 20 Eisenberg, D.M. et al. “Trends in Alternative Medicine Use in the United States, 1990-1997: Results of a Follow-up National Survey.” JAMA. 280(18):1569-75, 1998 Nov 11 21 Wennberg J, Expanding the Value Agenda: Addressing Unwarranted Variation in the Delivery of Health Care Institute of Medicine power point presentation 2005 22 Frankel S The limits to demand for health care. BMJ. 2000 July 1; 321(7252): 40–45. 23 Cherkin DC et al. Characteristics of visits to licensed acupuncturists, chiropractors, massage therapists, and naturopathic physicians. J. Am. Board Fam Pract. 2002, 15:463-472 24 French S. Probiotics: A Viable Market? Natural Product Insider August 21, 2006 25 Herper, RML How the drug industry abandoned science for salesmanship, Pill Pushers, Forbes May 08 2006 26http://www.seattle.gov/tda/industry/health.htm; Washington State University, WSU Cooperative Extension Center for Sustaining Ag and Nat Res Fast Company,Factoring Growth Fast 50, March 2004; M.S Baker, Brewitt forges ahead with a new kind of medicine, Puget Sound Business Journal, Oct 6, 2005
5557 36th Ave NE 206-522-6076 Seattle WA 98105-2313 [email protected] Copy Right, All rights reserved.
8
Improve Health Care in Washington Proposal September 2006 Blue Ribbon Commission and HCCA Barbara Brewitt, Ph.D., M.Div.
health care providers to serve a self-motivated public to be healthier without spending huge sums of additional funds.
Shifts in expenditures at the Department of Health27 are predicted to have a net zero effect on current costs. Restructuring the Department may use the same amount of budgeted funds to train regulatory staff more on technical assistance to improve AHM quality and monitor ICCCM systems and processes versus enforcement costs and litigation proceedings.
Costs to businesses related to ICCCM may be increased in terms of staff training about messaging on AHM access points, discernment of the wellness indicators vs illness indicators and improvements in quality control and detection of systematic medical errors.28,29 Quality system information exists in the federal and state regulatory data bases and collaborations through technical assistance with AHM providers will be needed to increase quality systems. The cost of improving the quality system can not be expected to meet those of government subsidized ICCCM facilities or with the same entitlements, yet meet a bar of excellence desired by legislators. Collaborations and discussions between ICCCM and AHM will be critical for successful tolerance of each other. The people choose both types of medicine; let the Plan motivate the people to take greater responsibility and with greater discernment to choose which access point are desired for their health care and when.
Government expenditures at the County level are predicted to increase by the cost of community ‘organizers’ or staff that will schedule county meetings, discussion groups and MOS instrument assessments of health in year 1 and year 5. State level data management and statisticians will be required to evaluate quality of life measures.
A budget and plan for these expenditures can be prepared once further interest by the Commission is shown. The costs of a ‘grass roots’ approach is minimal compared to the savings for the State.
5. How does your proposal reflect collaboration among various stakeholders? Which stakeholders have endorsed it? There will be collaboration between the leadership of governing legislators, Blue Ribbon Commission members, Department of Health, county officials, insurance agencies, medical and scientifically oriented universities, ICCCM and AHM businesses, and to a lesser extent licensed health care professionals using conventional and complementary and alternative medicine (CAM). Grass root organizations and community based organizations will also be involved in getting the word out about meetings and distributing educational materials about health care access points and key indicators of chronic and acute health care symptoms and self-assessments. Citizen action groups supportive of diverse populations of people with varied needs and serving varied age groups will be invited to participate in discussions of needs discernment and access points available to them in their home communities. 6. What are the obstacles to implementing your proposal? Who will object to it and why? How do you suggest these objections be addressed?
27 Perhaps excesses in the Dept of Health’s self supporting fund could be reviewed and applied to staff training programs on technical assistance versus increased enforcement and litigation expenditures 28 Gail Zyla, MS, RD, Preventing Medication Errors online course at http://www.corexcel.com/courses3/body.preventing.medication.errors1.htm 29 Flynn EA, Barker KN, Carnahan BJ National Observational Study of Prescription Dispensing Accuracy and Safety in 50 Pharmacies J Am Pharm Assoc 43(2):191-200, 2003
5557 36th Ave NE 206-522-6076 Seattle WA 98105-2313 [email protected] Copy Right, All rights reserved.
9
Improve Health Care in Washington Proposal September 2006 Blue Ribbon Commission and HCCA Barbara Brewitt, Ph.D., M.Div.
The obstacles to implementing the proposal are two fold. Others may arise. Potential objections are in italics and the possible response to the objections below it. First Objection, This Plan is too novel without adequate infrastructure for successful implementation.
Response to Objection #1: The administrators of the proposal will need to learn about AHM and how to communicate the message of the Wellness approach. The ‘messaging’ about wellness has already been documented as a lifestyle 15,20,24 with best seller, popular books.15, 19,30 Information is readily available via the natural product industry and various affiliated local and national resource information resources such as the University of Washington, Bastyr University and the National Center for Complementary NCCAM. Staff implementing the Plan at the central headquarters will need to learn the messaging points already popularized in the media to communicate themes of wellness, complementary and alternative medicine as well as themes of critical care and acute needs. Discernment of gradations of health care needs and appropriate access points will need to be established. Private industries, insurance companies and many organizations are already spreading the words about needs for care in their market place segments. The ideological differences of those objecting to the Plan will be an obstacle to this Plan. Currently, the ICCCM approach dominates the entitlements available. This will not change, however the reality of people’s needs and out of control costs of existing health with limited access to only a few citizens must be faced. Cost-benefit tables will need to be developed to address the need to working together to solve the problem and support the Plan irregardless of novel ideas that differ from mainstream thinking. Grass roots approaches need to be considered and tested and improved upon as the Plan is further refined. Second Objection: The public have voiced their desire for greater involvement of the Department of Health in enforcement, not less.
Response to Objection #2: The public increasingly distrust conventional medicines because of toxicity, lack of without demonstrated performance of drugs and over marketing to an educated public that has turned increasingly to alternative AHM providers. The performance reviews at the DOH and a restructuring of the activities and interests of the DOH are expected to increase efficiencies and rebalance expenditures to appropriate health care needs and concerns. Health care is a main concern of the public, as demonstrated and voiced at the Town Hall meetings called ‘Listening to You’. When the public is engaged as a participant in their own self and family health care, they will build trust with the DOH. The Plan strives to refocus people’s trust that government is working collaboratively with them to solve a common and growing complex concern, underemployment, limited access to health care that supports their wellness as much as their illness and the options of choices. When people stop feeling the polarization between the two modalities of medicine, they can become motivated to take greater responsibility for their health. They need information and support as they take on greater responsibility for costs and lifestyle adjustments as they age.
30Pilzer P The New Health Insurance Solution: How to Get Cheaper, Better Coverage Without a Traditional Employer Plan
5557 36th Ave NE 206-522-6076 Seattle WA 98105-2313 [email protected] Copy Right, All rights reserved.
10

Tab 67
“A Practical Health Coverage Solution for our Health C isis”
Report #7
Health Plan for Life (HP4LifeSM)
Final Model and Concept Paper
HP4LifeSM
are Cr
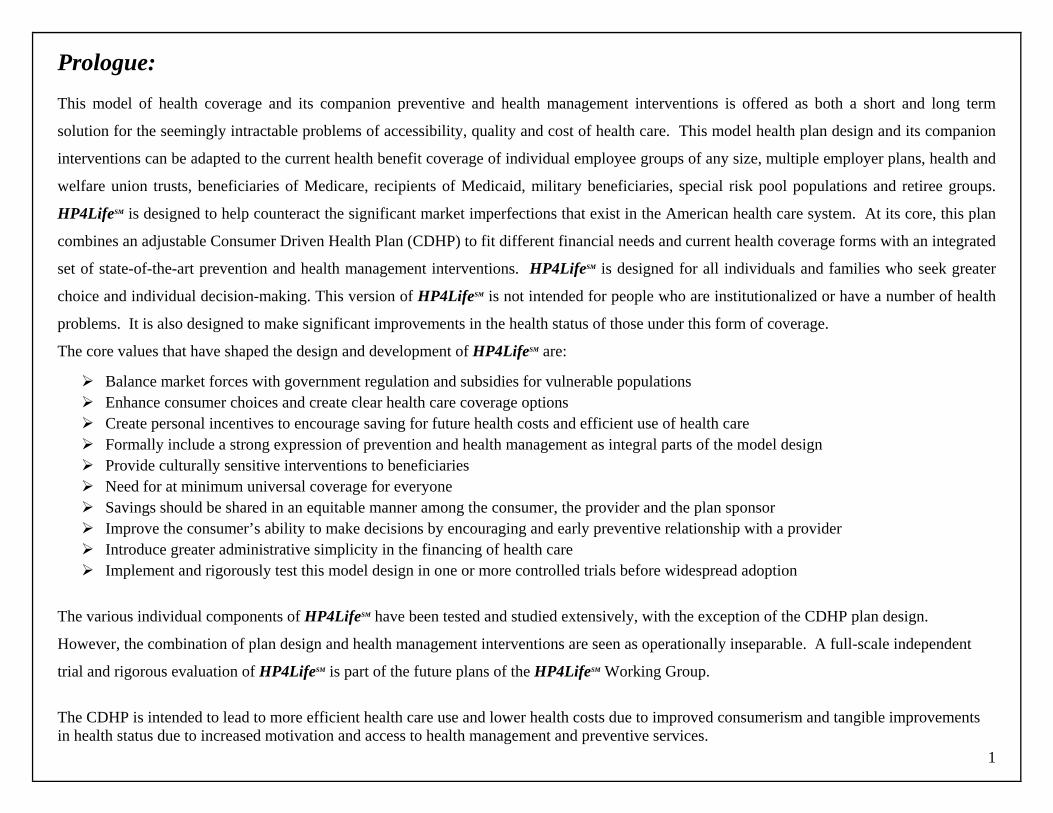
The CDHP is intended to lead to more efficient health care use and lower health costs due to improved consumerism and tangible improvements in health status due to increased motivation and access to health management and preventive services.
1
Prologue: This model of health coverage and its companion preventive and health management interventions is offered as both a short and long term
solution for the seemingly intractable problems of accessibility, quality and cost of health care. This model health plan design and its companion
interventions can be adapted to the current health benefit coverage of individual employee groups of any size, multiple employer plans, health and
welfare union trusts, beneficiaries of Medicare, recipients of Medicaid, military beneficiaries, special risk pool populations and retiree groups.
HP4LifeSM is designed to help counteract the significant market imperfections that exist in the American health care system. At its core, this plan
combines an adjustable Consumer Driven Health Plan (CDHP) to fit different financial needs and current health coverage forms with an integrated
set of state-of-the-art prevention and health management interventions. HP4LifeSM is designed for all individuals and families who seek greater
choice and individual decision-making. This version of HP4LifeSM is not intended for people who are institutionalized or have a number of health
problems. It is also designed to make significant improvements in the health status of those under this form of coverage.
The core values that have shaped the design and development of HP4LifeSM are:
! Balance market forces with government regulation and subsidies for vulnerable populations ! Enhance consumer choices and create clear health care coverage options ! Create personal incentives to encourage saving for future health costs and efficient use of health care ! Formally include a strong expression of prevention and health management as integral parts of the model design ! Provide culturally sensitive interventions to beneficiaries ! Need for at minimum universal coverage for everyone ! Savings should be shared in an equitable manner among the consumer, the provider and the plan sponsor ! Improve the consumer’s ability to make decisions by encouraging and early preventive relationship with a provider ! Introduce greater administrative simplicity in the financing of health care ! Implement and rigorously test this model design in one or more controlled trials before widespread adoption
The various individual components of HP4LifeSM have been tested and studied extensively, with the exception of the CDHP plan design.
However, the combination of plan design and health management interventions are seen as operationally inseparable. A full-scale independent
trial and rigorous evaluation of HP4LifeSM is part of the future plans of the HP4LifeSM Working Group.
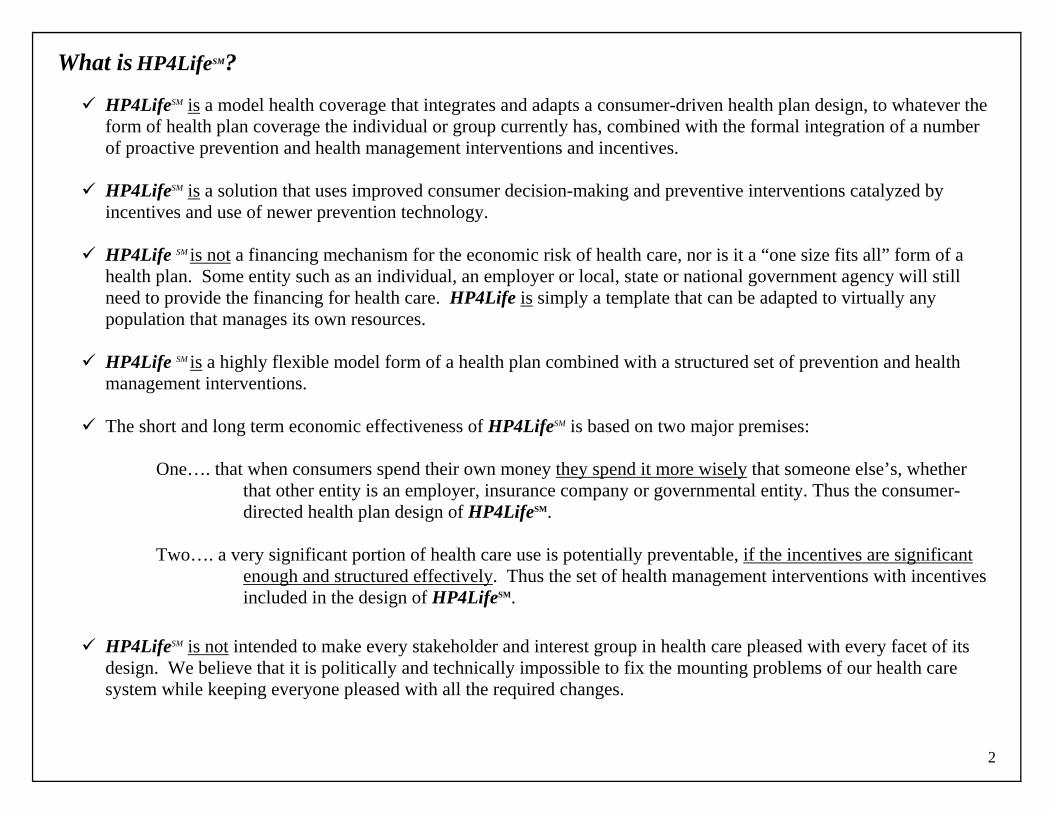
What is HP4LifeSM?
" HP4LifeSM is a model health coverage that integrates and adapts a consumer-driven health plan design, to whatever the form of health plan coverage the individual or group currently has, combined with the formal integration of a number of proactive prevention and health management interventions and incentives.
" HP4LifeSM is a solution that uses improved consumer decision-making and preventive interventions catalyzed by
incentives and use of newer prevention technology.
" HP4Life SM is not a financing mechanism for the economic risk of health care, nor is it a “one size fits all” form of a health plan. Some entity such as an individual, an employer or local, state or national government agency will still need to provide the financing for health care. HP4Life is simply a template that can be adapted to virtually any population that manages its own resources.
" HP4Life SM is a highly flexible model form of a health plan combined with a structured set of prevention and health
management interventions.
" The short and long term economic effectiveness of HP4LifeSM is based on two major premises: One…. that when consumers spend their own money they spend it more wisely that someone else’s, whether
that other entity is an employer, insurance company or governmental entity. Thus the consumer-directed health plan design of HP4LifeSM.
Two…. a very significant portion of health care use is potentially preventable, if the incentives are significant
enough and structured effectively. Thus the set of health management interventions with incentives included in the design of HP4LifeSM.
" HP4LifeSM is not intended to make every stakeholder and interest group in health care pleased with every facet of its
design. We believe that it is politically and technically impossible to fix the mounting problems of our health care system while keeping everyone pleased with all the required changes.
2
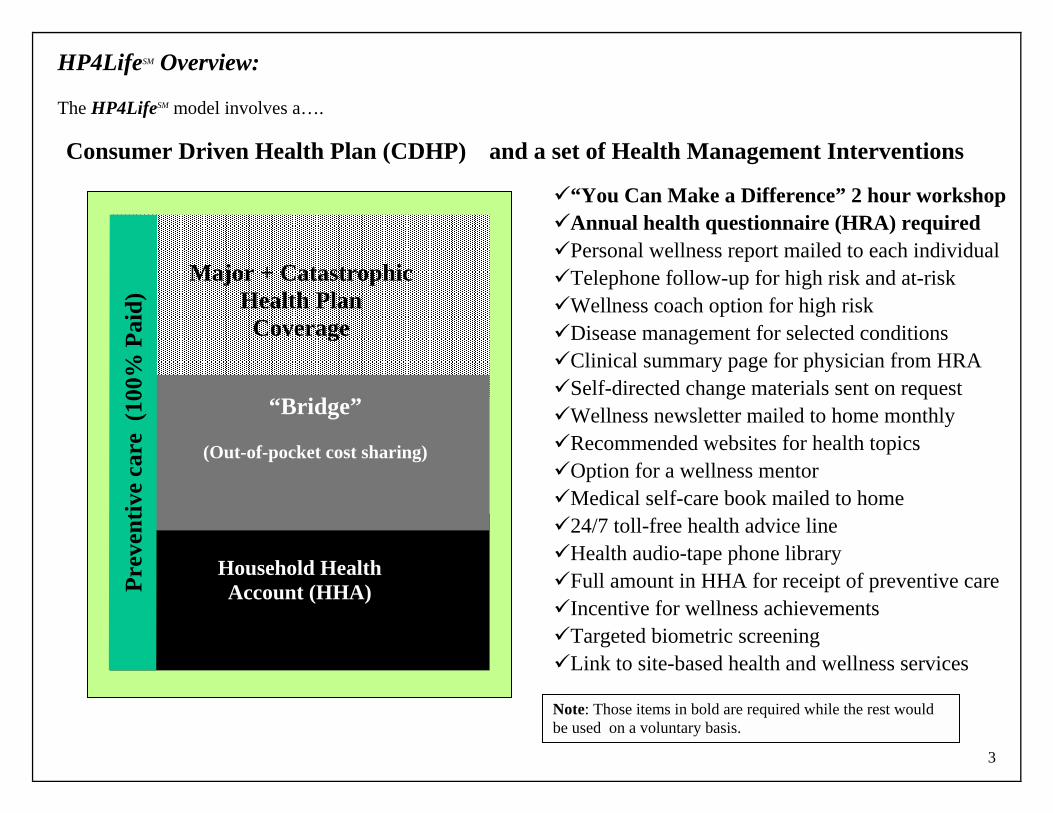
HP4LifeSM Overview:
The HP4LifeSM model involves a…. Consumer Driven Health Plan (CDHP) and a set of Health Management Interventions
"“You Can Make a Difference” 2 hour workshop "Annual health questionnaire (HRA) required "Personal wellness report mailed to each individual "Telephone follow-up for high risk and at-risk "Wellness coach option for high risk "Disease management for selected conditions "Clinical summary page for physician from HRA "Self-directed change materials sent on request "Wellness newsletter mailed to home monthly "Recommended websites for health topics "Option for a wellness mentor "Medical self-care book mailed to home "24/7 toll-free health advice line "Health audio-tape phone library "Full amount in HHA for receipt of preventive care "Incentive for wellness achievements "Targeted biometric screening "Link to site-based health and wellness services
3
Major + Catastrophic Health Plan
Coverage
Household Health Account (HHA)
“Bridge”
(Out-of-pocket cost sharing)
Prev
entiv
e ca
re (
100%
Pai
d)
Note: Those items in bold are required while the rest would be used on a voluntary basis.
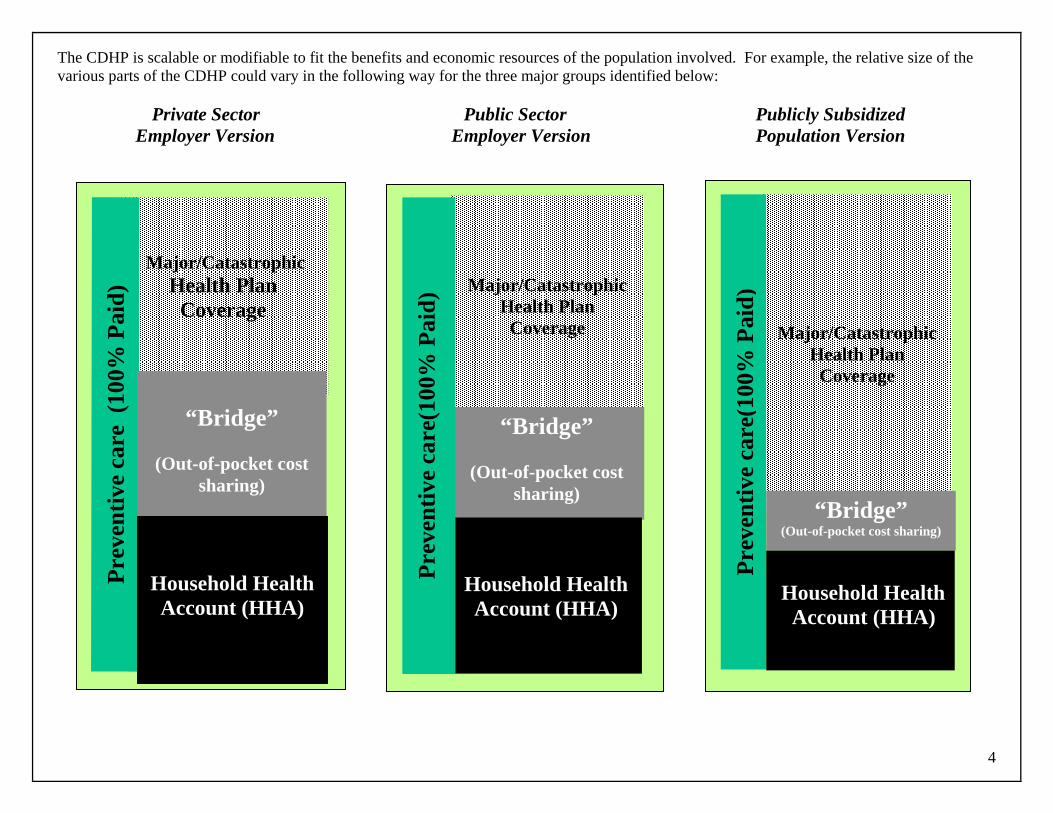
The CDHP is scalable or modifiable to fit the benefits and economic resources of the population involved. For example, the relative size of the various parts of the CDHP could vary in the following way for the three major groups identified below:
Private Sector Public Sector Publicly Subsidized Employer Version Employer Version Population Version
4
Major/Catastrophic Health Plan
Coverage
Prev
entiv
e ca
re (
100%
Pai
d)
“Bridge”
(Out-of-pocket cost
sharing)
Household Health Account (HHA)
Major/Catastrophic Health Plan
Coverage
“Bridge”
(Out-of-pocket cost sharing)
Household Health Account (HHA)
Prev
entiv
e ca
re(1
00%
Pai
d)
Major/CatastrophicHealth Plan
Coverage
“Bridge” (Out-of-pocket cost sharing)
Household Health Account (HHA)
Prev
entiv
e ca
re(1
00%
Pai
d)
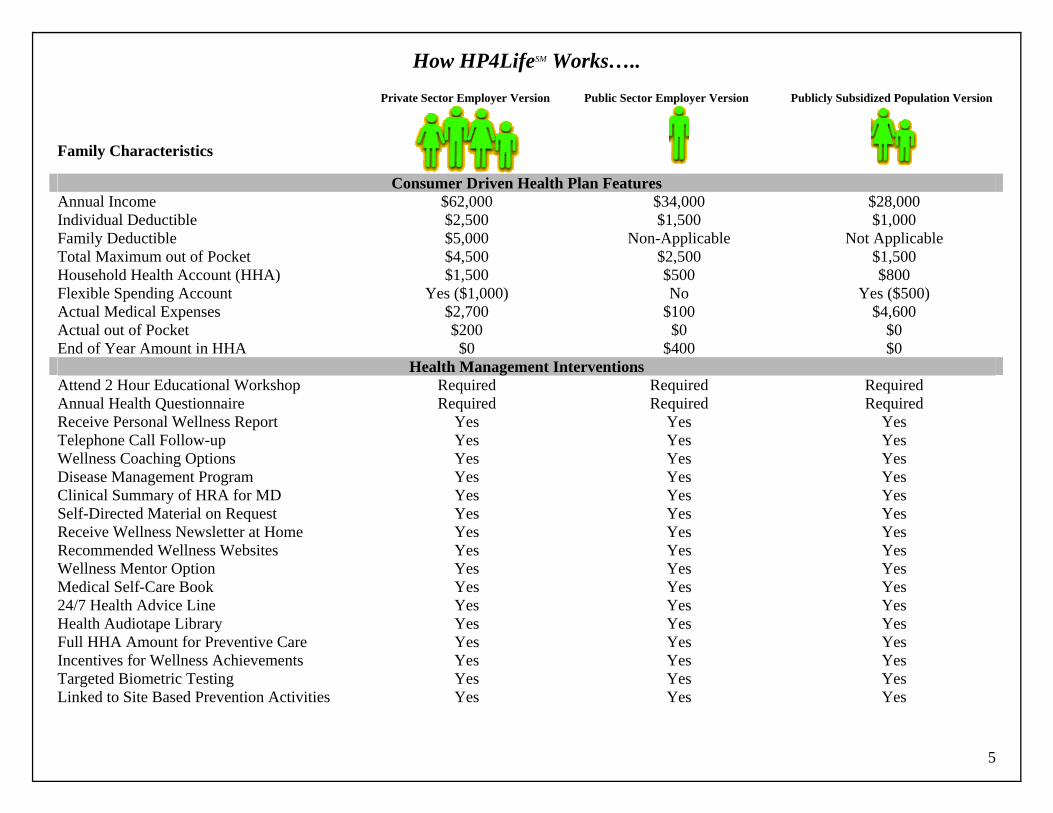
How HP4LifeSM Works….. Private Sector Employer Version Public Sector Employer Version Publicly Subsidized Population Version Family Characteristics
Consumer Driven Health Plan Features
Annual Income $62,000 $34,000 $28,000 Individual Deductible $2,500 $1,500 $1,000 Family Deductible $5,000 Non-Applicable Not Applicable Total Maximum out of Pocket $4,500 $2,500 $1,500 Household Health Account (HHA) $1,500 $500 $800 Flexible Spending Account Yes ($1,000) No Yes ($500) Actual Medical Expenses $2,700 $100 $4,600 Actual out of Pocket $200 $0 $0 End of Year Amount in HHA $0 $400 $0
Health Management Interventions Attend 2 Hour Educational Workshop Required Required Required Annual Health Questionnaire Required Required Required Receive Personal Wellness Report Yes Yes Yes Telephone Call Follow-up Yes Yes Yes Wellness Coaching Options Yes Yes Yes Disease Management Program Yes Yes Yes Clinical Summary of HRA for MD Yes Yes Yes Self-Directed Material on Request Yes Yes Yes Receive Wellness Newsletter at Home Yes Yes Yes Recommended Wellness Websites Yes Yes Yes Wellness Mentor Option Yes Yes Yes Medical Self-Care Book Yes Yes Yes 24/7 Health Advice Line Yes Yes Yes Health Audiotape Library Yes Yes Yes Full HHA Amount for Preventive Care Yes Yes Yes Incentives for Wellness Achievements Yes Yes Yes Targeted Biometric Testing Yes Yes Yes Linked to Site Based Prevention Activities Yes Yes Yes
5
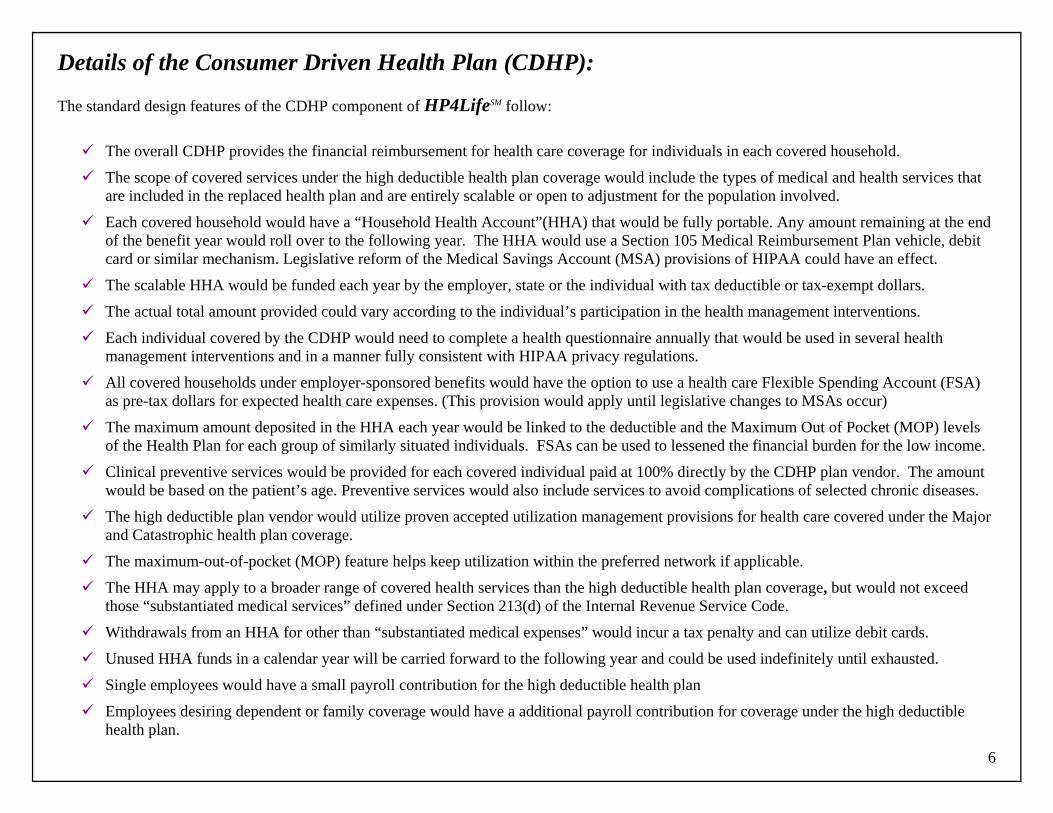
Details of the Consumer Driven Health Plan (CDHP): The standard design features of the CDHP component of HP4LifeSM follow:
The overall CDHP provides the financial reimbursement for health care coverage for individuals in each covered household. " "
"
" " "
"
"
"
"
" "
" " " "
The scope of covered services under the high deductible health plan coverage would include the types of medical and health services that are included in the replaced health plan and are entirely scalable or open to adjustment for the population involved.
Each covered household would have a “Household Health Account”(HHA) that would be fully portable. Any amount remaining at the end of the benefit year would roll over to the following year. The HHA would use a Section 105 Medical Reimbursement Plan vehicle, debit card or similar mechanism. Legislative reform of the Medical Savings Account (MSA) provisions of HIPAA could have an effect.
The scalable HHA would be funded each year by the employer, state or the individual with tax deductible or tax-exempt dollars.
The actual total amount provided could vary according to the individual’s participation in the health management interventions.
Each individual covered by the CDHP would need to complete a health questionnaire annually that would be used in several health management interventions and in a manner fully consistent with HIPAA privacy regulations.
All covered households under employer-sponsored benefits would have the option to use a health care Flexible Spending Account (FSA) as pre-tax dollars for expected health care expenses. (This provision would apply until legislative changes to MSAs occur)
The maximum amount deposited in the HHA each year would be linked to the deductible and the Maximum Out of Pocket (MOP) levels of the Health Plan for each group of similarly situated individuals. FSAs can be used to lessened the financial burden for the low income.
Clinical preventive services would be provided for each covered individual paid at 100% directly by the CDHP plan vendor. The amount would be based on the patient’s age. Preventive services would also include services to avoid complications of selected chronic diseases.
The high deductible plan vendor would utilize proven accepted utilization management provisions for health care covered under the Major and Catastrophic health plan coverage.
The maximum-out-of-pocket (MOP) feature helps keep utilization within the preferred network if applicable.
The HHA may apply to a broader range of covered health services than the high deductible health plan coverage, but would not exceed those “substantiated medical services” defined under Section 213(d) of the Internal Revenue Service Code.
Withdrawals from an HHA for other than “substantiated medical expenses” would incur a tax penalty and can utilize debit cards.
Unused HHA funds in a calendar year will be carried forward to the following year and could be used indefinitely until exhausted.
Single employees would have a small payroll contribution for the high deductible health plan
6
Employees desiring dependent or family coverage would have a additional payroll contribution for coverage under the high deductible health plan.
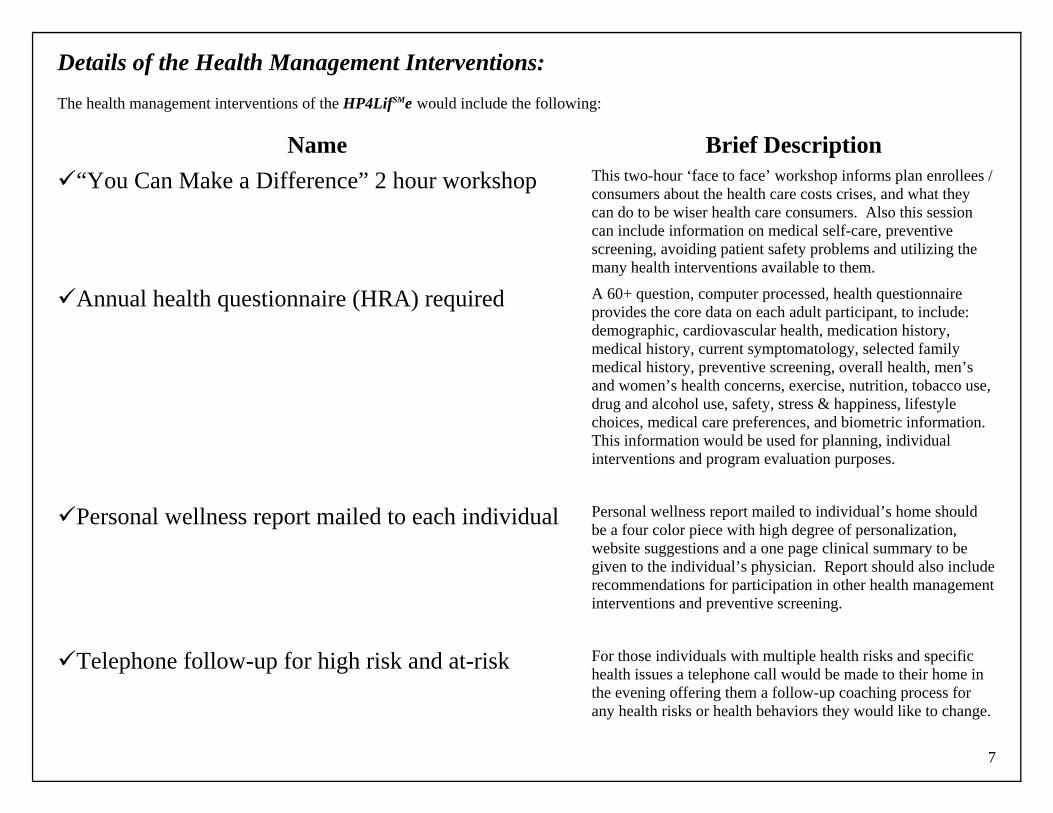
Details of the Health Management Interventions: The health management interventions of the HP4LifSMe would include the following:
Name Brief Description"“You Can Make a Difference” 2 hour workshop This two-hour ‘face to face’ workshop informs plan enrollees /
consumers about the health care costs crises, and what they can do to be wiser health care consumers. Also this session can include information on medical self-care, preventive screening, avoiding patient safety problems and utilizing the many health interventions available to them.
"Annual health questionnaire (HRA) required A 60+ question, computer processed, health questionnaire provides the core data on each adult participant, to include: demographic, cardiovascular health, medication history, medical history, current symptomatology, selected family medical history, preventive screening, overall health, men’s and women’s health concerns, exercise, nutrition, tobacco use, drug and alcohol use, safety, stress & happiness, lifestyle choices, medical care preferences, and biometric information. This information would be used for planning, individual interventions and program evaluation purposes.
"Personal wellness report mailed to each individual Personal wellness report mailed to individual’s home should be a four color piece with high degree of personalization, website suggestions and a one page clinical summary to be given to the individual’s physician. Report should also include recommendations for participation in other health management interventions and preventive screening.
"Telephone follow-up for high risk and at-risk For those individuals with multiple health risks and specific health issues a telephone call would be made to their home in the evening offering them a follow-up coaching process for any health risks or health behaviors they would like to change.
7
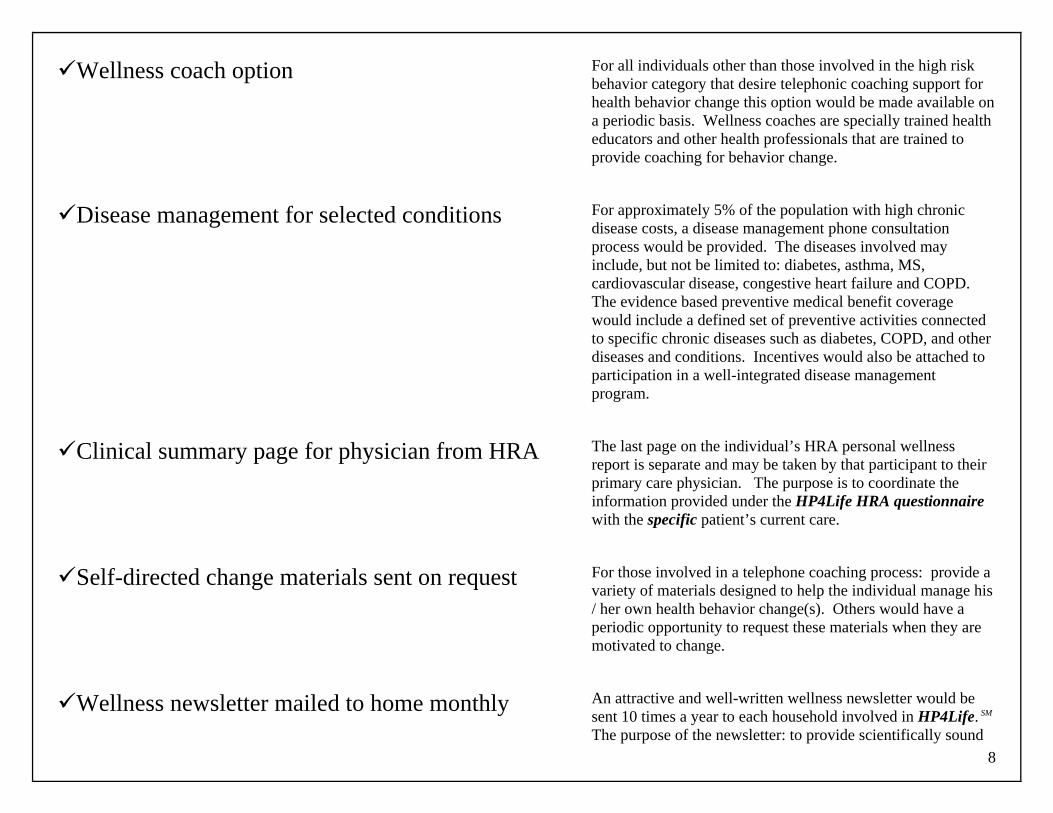
8
"Wellness coach option For all individuals other than those involved in the high risk behavior category that desire telephonic coaching support for health behavior change this option would be made available on a periodic basis. Wellness coaches are specially trained health educators and other health professionals that are trained to provide coaching for behavior change.
"Disease management for selected conditions For approximately 5% of the population with high chronic disease costs, a disease management phone consultation process would be provided. The diseases involved may include, but not be limited to: diabetes, asthma, MS, cardiovascular disease, congestive heart failure and COPD. The evidence based preventive medical benefit coverage would include a defined set of preventive activities connected to specific chronic diseases such as diabetes, COPD, and other diseases and conditions. Incentives would also be attached to participation in a well-integrated disease management program.
"Clinical summary page for physician from HRA The last page on the individual’s HRA personal wellness report is separate and may be taken by that participant to their primary care physician. The purpose is to coordinate the information provided under the HP4Life HRA questionnaire with the specific patient’s current care.
"Self-directed change materials sent on request For those involved in a telephone coaching process: provide a variety of materials designed to help the individual manage his / her own health behavior change(s). Others would have a periodic opportunity to request these materials when they are motivated to change.
"Wellness newsletter mailed to home monthly An attractive and well-written wellness newsletter would be sent 10 times a year to each household involved in HP4Life. SM The purpose of the newsletter: to provide scientifically sound
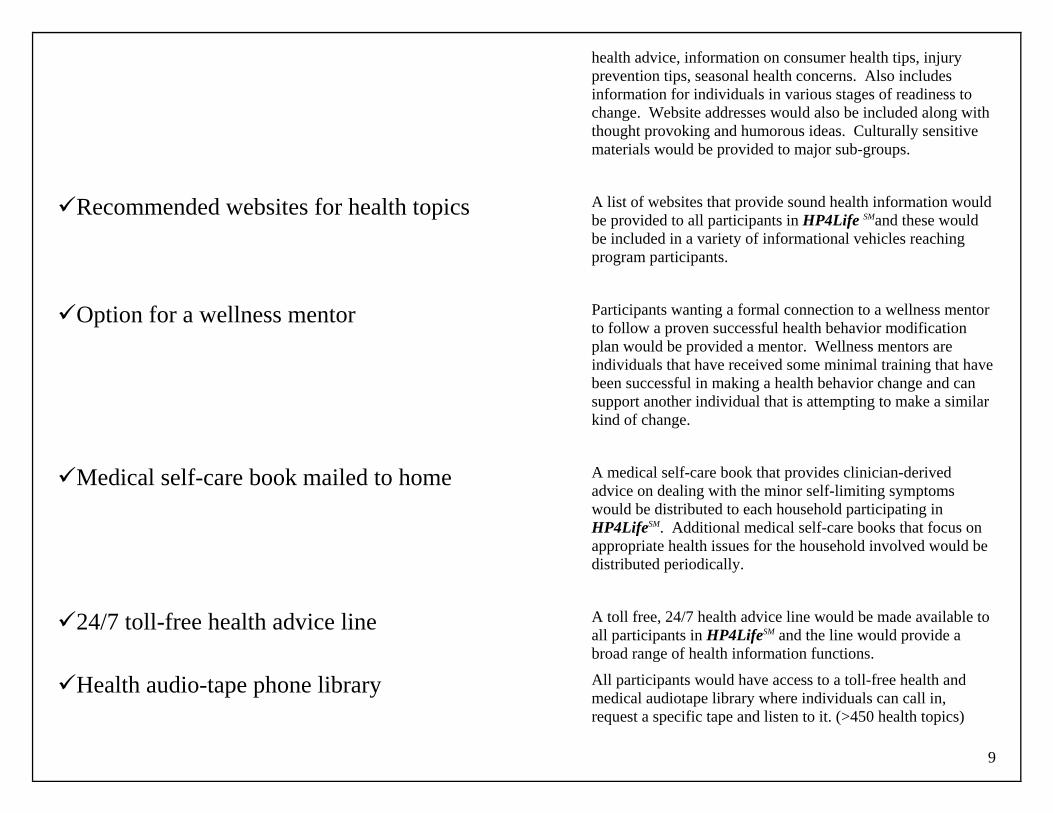
9
health advice, information on consumer health tips, injury prevention tips, seasonal health concerns. Also includes information for individuals in various stages of readiness to change. Website addresses would also be included along with thought provoking and humorous ideas. Culturally sensitive materials would be provided to major sub-groups.
"Recommended websites for health topics A list of websites that provide sound health information would be provided to all participants in HP4Life SMand these would be included in a variety of informational vehicles reaching program participants.
"Option for a wellness mentor Participants wanting a formal connection to a wellness mentor to follow a proven successful health behavior modification plan would be provided a mentor. Wellness mentors are individuals that have received some minimal training that have been successful in making a health behavior change and can support another individual that is attempting to make a similar kind of change.
"Medical self-care book mailed to home A medical self-care book that provides clinician-derived advice on dealing with the minor self-limiting symptoms would be distributed to each household participating in HP4LifeSM. Additional medical self-care books that focus on appropriate health issues for the household involved would be distributed periodically.
"24/7 toll-free health advice line A toll free, 24/7 health advice line would be made available to all participants in HP4LifeSM and the line would provide a broad range of health information functions.
"Health audio-tape phone library All participants would have access to a toll-free health and medical audiotape library where individuals can call in, request a specific tape and listen to it. (>450 health topics)
"Full amount in HHA for current preventive care For those beneficiaries that participate by receiving all preventive screening, immunizations and tests recommended by their Primary Care Physician (PCP) by September 1st each year, they receive the full amount of contribution in their Household Health Account. If they do not provide a Preventive Care Certificate from their PCP then the amount in their HHA is reduced by 25%. Negative co-pays can be used for low income beneficiaries and preventive care would be defined to include services to avoid complications with certain chronic diseases.
"Incentive for wellness achievements All participants meeting any 8 out of 10 wellness criteria by September 1st each year will receive an additional 25% in their HHA the following year. Improvements in health status would be included in the form of the wellness criteria.
"Targeted biometric screening For any participant whose HRA indicates that they need a follow-up biometric screening test, the individual will be contacted by telephone and referred to a site for testing.
"Link to site-based health and wellness services To the extent possible, the health management interventions would be linked to site-based health and wellness services available at the worksite and at community locations. Referral information would be available by phone and through website provided information. Nutrition, mental health, alcohol, drug abuse, and behavioral health topics would be included.
Note: All individuals enrolled in a HP4LifeSM style health plan have access to all the health management interventions identified above but not all would choose to use or need these interventions. The only required interventions are the 2 hour workshop and the completion of the health questionnaire each year. The remainder of the interventions may be promoted to those individuals completing the health questionnaire based on their expressed or clinically determined needs. The health management interventions would be funded by the financial sponsor of the CDHP. It is expected that one or more vendors would be used to integrate all the health management and preventive interventions. This is likely to provide an organizational structure that lends itself to high levels of service integration and better coordinated service delivery.
10
The Economics and Benefits of HP4LifeSM This model form of health coverage, based on a large body of scientific evidence, is expected to produce health cost savings for actuarially credible populations of 5% to 35% of total expected costs along with similar magnitude improvements in health status. The cost of administrative operation of the Household Health Account and the delivery of all the health management interventions is not expected to exceed $300 per person per year or 5% of the cost of the average health plan expenses for the population involved. The major benefits from HP4LifeSM for the individual beneficiary include the following:
" 100% paid preventive medical benefits with increasing coverage with age. " The opportunity to have a tax advantaged savings vehicle for future medical expenses. " Protection against major catastrophic health expenses. " Potential ability to receive coverage through the HHA for a broad array of health expenses not covered by conventional health plans. " Access to a comprehensive array of prevention and health management interventions. " Ability to receive additional resources for participation in programming, wellness achievements and receipt of preventive care. " Support and information for health behavior change. " Reduced health risks, out-of-pocket health costs and improvements in health status and morbidity " Improved productivity and quality of life
Some of the articles used to formulate these economic hypotheses are as follows: Anderson, D., & Staufacker, M. (1996). The Impact of Worksite-based Health Risk Appraisal on Health-related Outcomes: A Review of the Literature. American Journal of Health Promotion, 10(6), 499-508. Christianson, J., et. al., (2002) Defined Contribution Health Insurance Products: Development and Prospects, Health Affairs, January/February, 21(10, 49-64. Edington, D.W., Yen, L.T., & Witting, P. (1997). The Financial Impact of Changes in Personal Health Practices. Journal of Occupational and Environmental Medicine, 39(11), 1037-1046. Editors (2003) Report of the U.S. Preventive Services Task Force. Guide to Clinical Preventive Services (3nd ed.). William & Wilkins, p. 953. Friede, A. (1997). CDC Prevention Guidelines: A Guide for Action. Baltimore, MD: Williams & Wilkins, p. 1556. Glanz, K., Sorenson, G., & Farmer, A. (1996). The Health Impact of Worksite Nutrition and Cholesterol Intervention Programs. American Journal of Health Promotion, 10(6), 453-470. Goetzel, Ron Z., et al. (1998 June). Differences Between Descriptive and Multivariate Estimates of the Impact of Chevron Corporation’s Health Quest Program on Medical Expenditures. Journal of Occupational and Environmental Medicine 40, (6) 538-545.
11

Heaney, C., & Goetzal, R. (1997). A Review of Health Related Outcomes of Multi-Component Worksite Health Promotion Programs. American Journal of Health Promotion, 11(4), 290-307. Hennrikus, D., & Jeffery, R. (1996). Worksite Intervention for Weight Control: A Review of the Literature. American Journal of Health Promotion, 10(6), 471-498. Herzinger, R., (2002) Let’s Put Consumers in Charge of Health Care, Harvard Business Review, July, p. 4-11. Last, J., & Maxcy-Rosenau, (Eds.). Public Health and Preventive Medicine (13th ed.). Norwalk, CT: Appleton & Lange, p. 1257. Murphy, L. (1996). Stress Management in Work Settings: A Critical Review of the Health Effects. American Journal of Health Promotion, 11(2), 112-135. Musich, S., et.al., (2003) Examination of Risk Status Transitions Among Active Employees in a Comprehensive Worksite Health Promotion Program, Journal of Occupational and Environmental Medicine, 45(4), 393-399. Musich, Shirley A., et.al., (2000) Effectiveness of health promotion programs in moderating medical costs in the USA, Health Promotion International, 15(1): 5-15. Newhouse, J., (1991) Free for All? Lessons from the Rand Health Insurance Experiment, Harvard University Press, Cambridge, MA, p. 438. Osinubi, O, et.al., (2003) A Pilot Study of Telephone Based Smoking Cessation Intervention in Asbestos Workers, Journal of Occupational and Environmental Medicine, 45(5), 569-574. Ozminkowski, Ronald J., et.al., (1999) A return on investment evaluation of the Citibank, N.A., Health Management Program, American Journal of Health Promotion, September/October; 14(1):31-43. Ozminkowski, Ronald J., et.al., (2002) Long term impact of Johnson & Johnson’s Health & Wellness Program on health care utilization and expenditures, Journal of Occupational and Environmental Medicine, January; 44(1); 21-29. Roman, P, & Blum, T. (1996). Alcohol: A Review of the Impact of Worksite Interventions on Health and Behavioral Outcomes. American Journal of Health Promotion, 11(2), 136-149. Serxner, Seth, et.al., (2001) The impact of a worksite health promotion program on short term disability usage, Journal of Occupational and Environmental Medicine, January; 43(1): 25-29. Shepard, R. (1996). Worksite Fitness and Exercise Programs: A Review of Methodology and Health Impact. American Journal of Health Promotion, 10(6), 436-452. Wilson, M. (1996). A Comprehensive Review of the Effects of Worksite Health Promotion on Health-related Outcomes: An Update. American Journal of Health Promotion, 11(2), 107-108. Wilson, M., Holman, P., & Hammock, A. (1996). A Comprehensive Review of the Effects of Worksite Health Promotion on Health-related Outcomes. American Journal of Health Promotion, 10(6), 429-435. Wilson, M., Jorgenson, C., & Cole, G. (1996). The Health Effects of Worksite HIV/AIDS Interventions: A Review of the Research Literature. American Journal of Health Promotion, 11(2), 150-157.
12
Woolf, S. (Ed.). (1996). Health Promotion and Disease Prevention in Clinical Practice. Baltimore, MD: William & Wilkins, p. 618.
Conclusion HP4LifeSM is a model form of health coverage that can mirror the features of the health plan it is replacing, but universally adds a larger financial role for the consumer than any existing health plan. In addition the consumer’s financial responsibility can be scaled to their income level and family characteristics. The ability to carry-over unused balances in their Household Health Account (HHA) is intended to allow a significant level of savings for future health care expenses. The wide range of “virtual” health management interventions do not require the individual to go to any particular physical location, but rather are intended to offer help, information and support to individuals in their homes. The only information needed to provide HP4Life is the individual’s name, home address and home telephone number. To reiterate, HP4LifeSM is a health plan model that:
" Places the subscriber/consumer in a much more powerful position to control their own health care choices and alternatives.
" Can be used to replace any kind of health plan with any level of benefits and coverage in either the private or public sectors.
" Provides a more comprehensive set of preventive and health management interventions than virtually any existing health plan.
" Combines economic incentives with the resources and tools to achieve healthier people and healthier populations.
" Is based on a set of values that strive to balance cost, quality and accessibility of care.
" Provides a platform for virtually any range of scope of covered services and benefits.
" Provides a health plan vehicle for any form of risk assumption from fully insured to fully self-insured.
" Uses a set of “demand-side” approaches along with the traditional “supply-side” approaches to achieve long-term stabilization of health care costs.
" Lends itself to a high level of measurement and evaluation.
" Provides a solution for many of the most significant market imperfections that exist in the health care industry.
" Offers a consumer-centric solution coupled with shared risk to effect desired health care reform changes. Since all the combined components of HP4LifeSM are not in operation anywhere at the present time, it is imperative that a rigorous research and demonstration project to test HP4LifeSM be implemented.
13
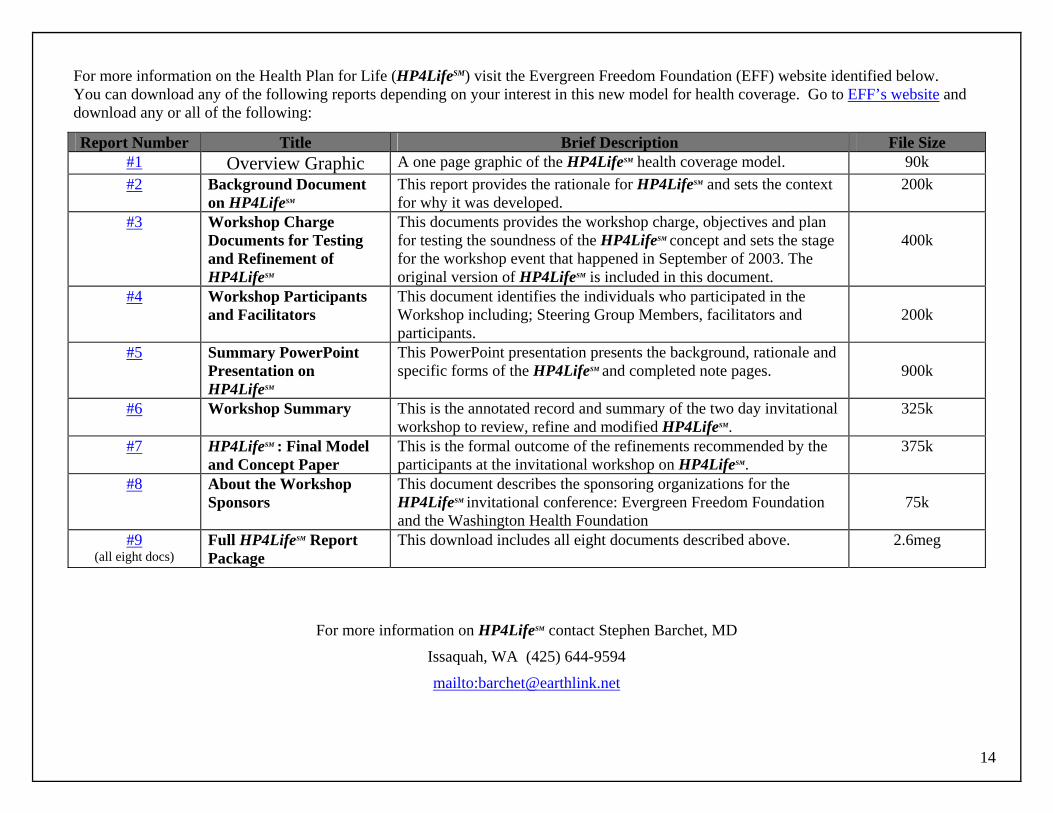
14
For more information on the Health Plan for Life (HP4LifeSM) visit the Evergreen Freedom Foundation (EFF) website identified below. You can download any of the following reports depending on your interest in this new model for health coverage. Go to EFF’s website and download any or all of the following:
For more information on HP4LifeSM contact Stephen Barchet, MD
Issaquah, WA (425) 644-9594
mailto:[email protected]
Report Number Title Brief Description File Size #1 Overview Graphic A one page graphic of the HP4LifeSM health coverage model. 90k #2 Background Document
on HP4LifeSM This report provides the rationale for HP4LifeSM and sets the context for why it was developed.
200k
#3 Workshop Charge Documents for Testing and Refinement of HP4LifeSM
This documents provides the workshop charge, objectives and plan for testing the soundness of the HP4LifeSM concept and sets the stage for the workshop event that happened in September of 2003. The original version of HP4LifeSM is included in this document.
400k
#4 Workshop Participants and Facilitators
This document identifies the individuals who participated in the Workshop including; Steering Group Members, facilitators and participants.
200k
#5 Summary PowerPoint Presentation on HP4LifeSM
This PowerPoint presentation presents the background, rationale and specific forms of the HP4LifeSM and completed note pages.
900k
#6 Workshop Summary This is the annotated record and summary of the two day invitational workshop to review, refine and modified HP4LifeSM.
325k
#7 HP4LifeSM : Final Model and Concept Paper
This is the formal outcome of the refinements recommended by the participants at the invitational workshop on HP4LifeSM.
375k
#8 About the Workshop Sponsors
This document describes the sponsoring organizations for the HP4LifeSM invitational conference: Evergreen Freedom Foundation and the Washington Health Foundation
75k
#9 (all eight docs)
Full HP4LifeSM Report Package
This download includes all eight documents described above. 2.6meg
Related Documents


![Blue Ribbon Presentation[3] - College of Education · The Blue Ribbon Process • Faculty apply for the Blue Ribbon Stipend • Faculty completed QM+UF Markers Rubric focussing on](https://static.cupdf.com/doc/110x72/5ed3546e2058a048c8723c8f/blue-ribbon-presentation3-college-of-education-the-blue-ribbon-process-a-faculty.jpg)


![PLTA-0103 Ribbon Blue/Green - conserveland.org · PLTA-0103 Ribbon Blue/Green 3/19/04 3:58 PM Page 1. A Ribbon of Blue,A Ribbon of Green “The Wissahiccon [sic] is of so remark-able](https://static.cupdf.com/doc/110x72/5d1e780b88c99335368d6d0b/plta-0103-ribbon-bluegreen-plta-0103-ribbon-bluegreen-31904-358-pm-page.jpg)
