Blue Laser Autoflouroscence Dr. Gauree Gattani DNB 2 nd Yr

Blue laser autoflouroscence
Aug 09, 2015
Welcome message from author
This document is posted to help you gain knowledge. Please leave a comment to let me know what you think about it! Share it to your friends and learn new things together.
Transcript

Blue Laser Autoflouroscence
Dr. Gauree Gattani
DNB 2nd Yr

The Fundus Autofluorescence (FAF) phenomenon was identified in the early days of fluorescein angiography, in the late 1960s.
It provides more detailed information on the pathophysiology of disease that is above and beyond that provided by more conventional methods such as fundus photography, fluorescein angiography and OCT.
It is an opportunity to visualise the biochemistry of the retinal pigment epithelium

Principle
FAF imaging is a fast and non-invasive technique developed over the last decade, using the fluorescent properties of a metabolic indicator called lipofuscin to study the health and viability of the retinal pigment epithelium/photoreceptor complex.
Whilst there are other fluorophores in the outer retina that may occur with disease, lipofuscin is the dominant source of intrinsic fluorescence of the ocular fundus which was established by the spectrophotographic work of Francois Delori et al.
Excessive accumulation of lipofuscin granules in the lysosomal compartment of RPE cells represents a common downstream pathogenetic pathway in various hereditary and complex retinal diseases, including age-related macular degeneration (AMD)
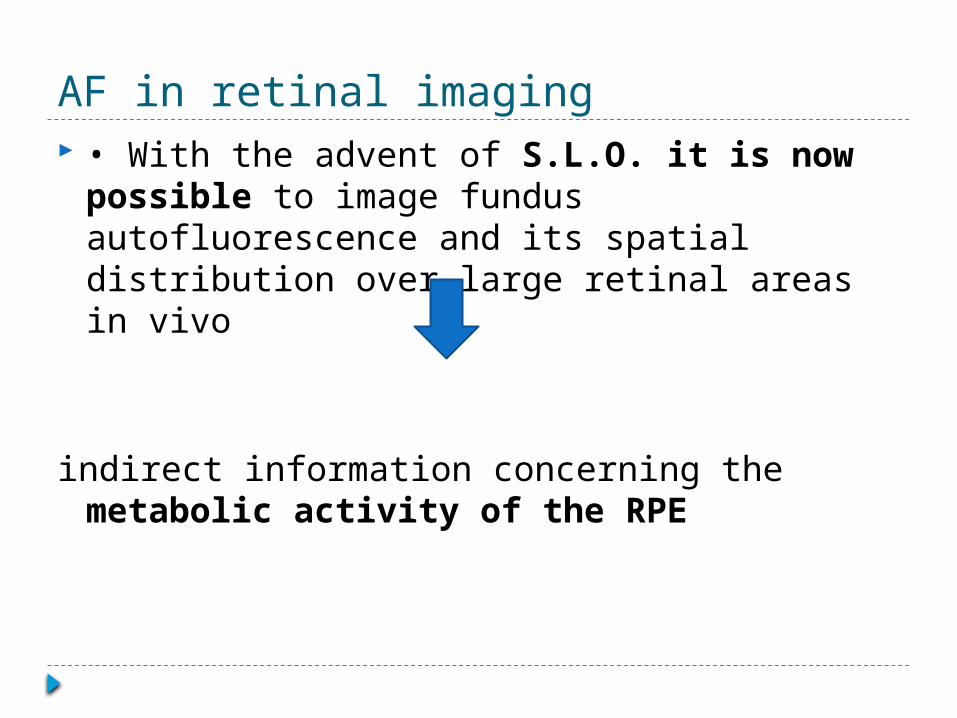
AF in retinal imaging • With the advent of S.L.O. it is now
possible to image fundus autofluorescence and its spatial distribution over large retinal areas in vivo
indirect information concerning the metabolic activity of the RPE

Impaired lysosomal protein degradation
RPE APOPTOSIS
Photoreceptor damage

Autofluorescence Image
Macular pigment

Recording Autoflouroscence
The main barrier is the crystalline lens, which has highly fluorescent characteristics in the short-wavelength range (excitation between 400 and 600 nm resulrs in peak emission at 520 nrn)
With increasing age and development of nuclear lens opacities, the fluorescence of the lens becomes even more prominent.
Therefore, fundus AF imaging with a conventional fundus camera using the excitation and emission filters as applied for fluorescein angiography produces images with low contrast and high background noise in young persons .
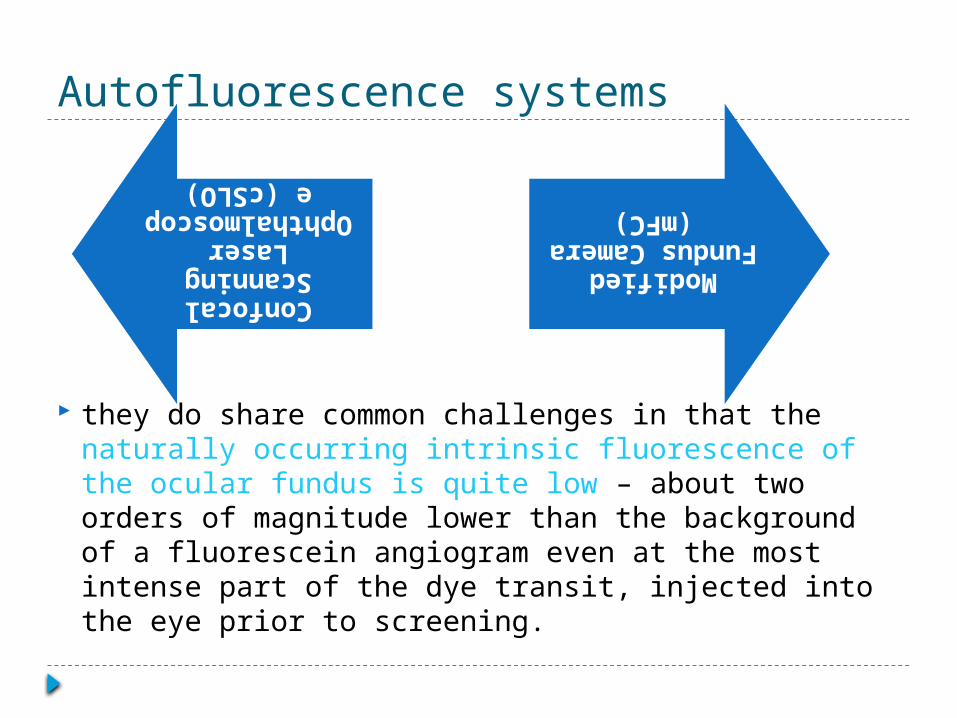
Autofluorescence systems
they do share common challenges in that the naturally occurring intrinsic fluorescence of the ocular fundus is quite low – about two orders of magnitude lower than the background of a fluorescein angiogram even at the most intense part of the dye transit, injected into the eye prior to screening.
Confocal
Scanning Laser Ophthalmoscop
e (cSLO)
Modified
Fundus Camera (mFC)

Mechanism The use of a cSLO optimally addresses the limitations of the
low intensity of the AF signal and the interference of the crystalline lens.
The cSLO projects a low-power laser beam on the retina that is swept across the fundus in a raster pattern.
The intensity of the reflected light at each point, after it passes through the confocal pinhole, is registered by means of a detector and a 2D image is subsequently generated.
The use of confocal optics ensures that out-of-focus light (i.e., light originating outside the adjusted focal plane but within the light beam) is suppressed and thus the image contrast is enhanced.
This suppression increases with distance from the focal plane, and signals from sources anterior to the retina, i.e., the lens or the cornea, are effectively reduced.

Summary of technical differences between the cSLO and the modified fundus camera
for fundus autofluorescence imaging.Confocal Scanning Laser Ophthalmoscope (cSLO)
Modified Fundus Camera (mFC)
One excitation wavelength(laser source)Large emission spectrum(cut-off filter)
Bandwidths filters for excitation and emission
Continuous scanning at low light in a raster pattern intensities
One single flash at maximumintensities
Confocal system Entire cone of light
Laser power fixed by manufacture, gamma detector sensitivity
Flash light intensity, and gain of detector adjustable.
Automatic real time imageprocessing with averaging of singleframes and pixel normalization
Manual contrast and brightness

A new blue perspective Heidelberg’s Spectralis models are a combination
of cSLO fundus imaging and Spectral-Domain OCT imaging.
Use of a pure blue laser can provide clear, high-contrast images of metabolic activity without the scattered light and the low sensitivity inherent in flash photography.
BluePeak – blue laser autofluorescence can be combined with SDOCT.
This fusion of technologies offers multi-modality imaging with BluePeak and SD-OCT and provides ophthalmologists with a new perspective on the structure-function relationship within the retina.

Interpretation of FAF images

Healthy retina

Interpretation of FAF images Unlike OCT images FAF imaging produces a
form of metabolic map visualising not just morphology but also metabolic changes.
The two imaging modalities serve different purposes, One imaging technique does not replace the other.
The novel possibility with simultaneous recordings of cSLO FAF images and high-resolution OCT coupled with active eye tracking now offer the opportunity to study the corresponding microstructural changes in the outer retinal layers

In contrast to fluorescence angiography such as FA and ICG-angiography where the dynamic of the dye in the blood vessel network is of critical importance, there is no dynamic component to read in blue laser autofluorescence images.
This makes these FAF images relatively easy to interpret.

Geographic atrophy
BluePeak Colour Photography
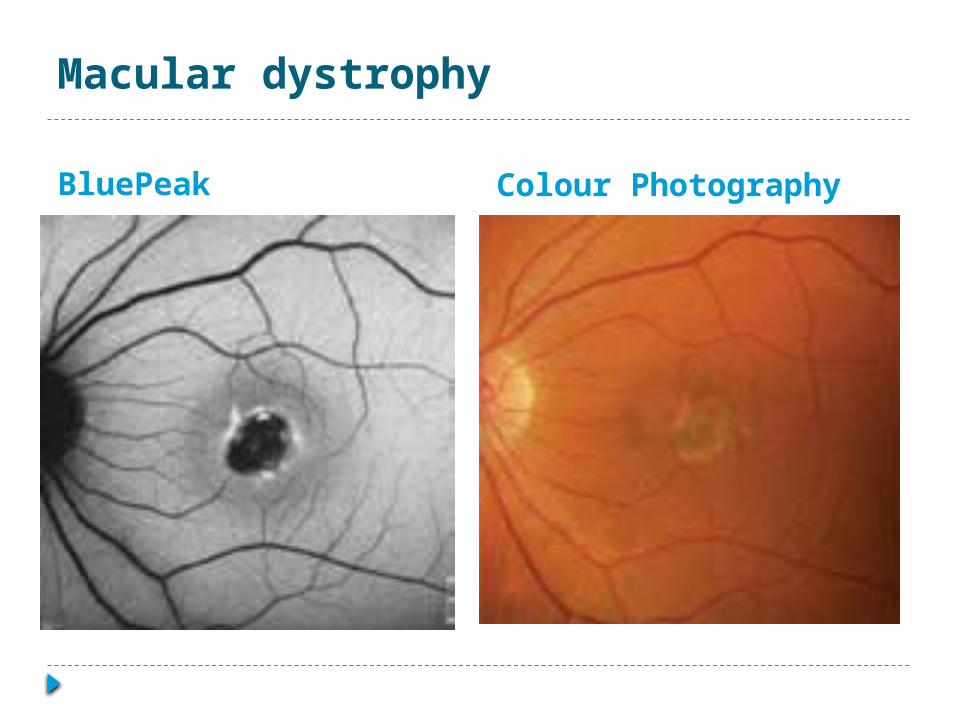
Macular dystrophy
BluePeak Colour Photography
When evaluating a blue laser autofluorescence image, any deviation from a normal recording should be recognized and a potential cause should be sought for the abnormal findings.
In essence, abnormal FAF signals derive either from a change in the amount or composition of
fluorophores in the RPE cell cytoplasm, for example lipofuscin,
or from the presence of absorbing or autofluorescent material anterior to the RPE cell monolayer.

Causes for a reduced FAF signal
Absence or reduction in RPE lipofuscin density
RPE loss or atrophy (e.g., geographic atrophy)
Absorption from extracellular material, cells, or
intraretinal fluid (e.g., macular oedema)
Fresh intraretinal and subretinal haemorrhages
Fibrosis, scar tissue, or borders of laser scars
Retinal vessels
Luteal pigment (lutein and zeaxanthin)

Causes for an increased FAF signal
Excessive RPE lipofuscin accumulation
Lipofuscinopathies including Stargardt disease, Best disease, and adult vitelliform macular dystrophy
Age-related macular degeneration (e.g., RPE in the junctional zone preceding enlargement of occurrence of geographic atrophy)Subretinal fluid leading to separation of the outer segments of the photoreceptors from the underlying RPE, which leads to improper outer segment turnover
Drusen in the sub–pigment epithelial space
Older intraretinal and subretinal haemorrhages
Lack of absorbing material
Optic nerve head drusen

The identification of abnormalities in the FAF image is very much dependent on the quality of the recorded image.
Any opacity in the vitreous, the lens, the anterior chamber or the cornea may affect the detected autofluorescence at the level of the RPE and the neurosensory retina.
For the evaluation and interpretation of a FAF image for an individual patient it may be helpful to correlate the findings with those obtained with reflectance images of the same excitation wavelength and other imaging methods, including fundus photography, OCT and fluorescein angiography.

Clinical applications

General retina health check FAF imaging is a powerful and versatile tool
that can be used to quickly and non-invasively diagnose and monitor a number of retinal diseases, most of which are still largely under-diagnosed and therefore under-treated

Simultaneous FAF and OCT image for a patient with drusen.

cSLO technology allows the general ophthalmologist to accurately identify a wide range of retina diseases, including AMD (drusen, geographic atrophy, choroidal neovascularisation), cystoid macular oedema, uveitis and macular hole, as well as a number of hereditary conditions, including retinitis pigmentosa (RP) and Stargardt’s disease.
The technology produces images of exceptional clarity by identifying distinct patterns for specific conditions, even in the earliest of stages of a disease, thus improving early referral and treatment rates.
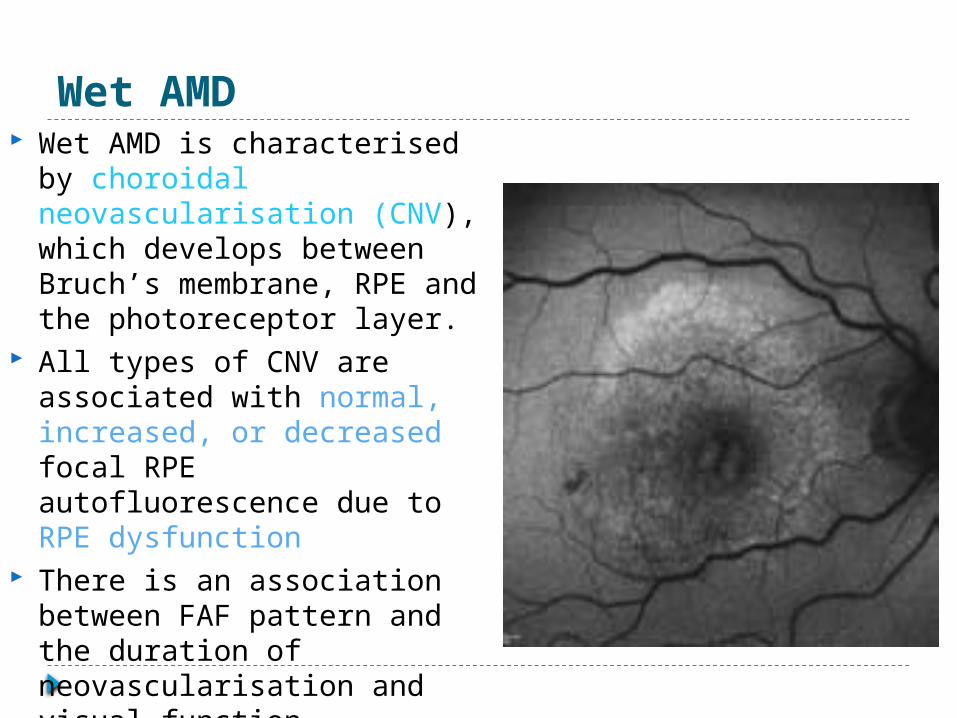
Wet AMD Wet AMD is characterised by
choroidal neovascularisation (CNV), which develops between Bruch’s membrane, RPE and the photoreceptor layer.
All types of CNV are associated with normal, increased, or decreased focal RPE autofluorescence due to RPE dysfunction
There is an association between FAF pattern and the duration of neovascularisation and visual function, suggesting that FAF imaging may be important in identifying and monitoring CNV secondary to AMD
Initial stages FAF shows patches of ‘continuous’ or ‘normal’ autofluorescence preserved RPE viability corresponds with areas of hyperfluorescence on comparative fluorescein angiograms
long-standing CNV more areas of decreased signals photoreceptor loss and scar formation with increased melanin deposition
abnormal FAF intensities visible in eyes with CNV often extend beyond the edge of a lesion defined by fluorescein angiography, which indicates a more widespread disease process, over and above that witnessed on conventional angiograms may reflect the proliferation of RPE cells around the CNV

The classification of CNV, as classic or occult, is also possible with FAF imaging; a report by Spital and co-workers found that focal areas of decreased FAF are more prevalent in classical CNV in comparison to larger occult CNVs

Geographic atrophy Representing the natural end-stage of AMD,
when CNV does not develop, geographic atrophy (GA) is a dynamic disease process, responsible for approximately 35% of all cases of late AMD and legal blindness.
GA is characterised by the development of areas of outer retinal atrophy that slowly enlarge over time at a median rate of 1.5 to 2.1 mm2 per year.

Atrophic areas in GA can be detected by FAF as they appear as dark areas. These images represent the progression of GA, over time, in two patients.

Atrophic areas in GA lack RPE lipofuscin High-contrast difference between atrophic and
non-atrophic retina allows the area of atrophy to be more precisely and accurate identified.
Thus, GA can be diagnosed and quantified precisely by cSLO technology, which allows the non-invasive monitoring of atrophy progression.

There abnormally high levels of FAF in the areas immediately surrounding the atrophic patches, the so called junctional zone between the atrophic and the normal retina.
This is particularly interesting as these FAF abnormalities immediately precede cell death and, therefore absolute scotoma.
These distinct abnormalities do not show up on funduscopy or with any other imaging method, thus highlighting the importance of FAF imaging in tracking the progress of the GA.

Fundus Autofluorescence in Age-related Macular Degeneration (FAM) study group has developed the classification of FAF patterns observed in the junctional zone of patients with GA, secondary to AMD.
The report indicates that eyes with the banded (median 1.81 mm2/year) and the diffuse FAF pattern (1.77 mm2/year) showed a more rapid enlargement of atrophy compared with eyes without FAF abnormalities (0.38 mm2/ year) and the focal FAF pattern (0.81 mm2/year).
Hereditary retina diseases Hereditary retina diseases affect a small
portion of retina disease patients; however, the conditions, which include retinitis pigmentosa (RP), cone and cone-rod dystrophies, Best’s disease, Stargardt’s disease and vitelliform macular dystrophy, are visually debilitating.

In these hereditary diseases, the increased autofluorescence is associated with reduced rod and cone sensitivity, rather than photoreceptor cell death.
Meanwhile, in Stargardt’s disease, the most common form of inherited juvenile macular degeneration, areas of atrophy and abnormal fluorescence obtained using FAF have been clearly demonstrated

FAF imaging (right) is able to highlight Stargardt’s disease clearly, compared to colour photography (left).

In general, FAF imaging is able to highlight abnormalities in these hereditary and other complex retina diseases, even in patients where there are no manifest visual or functional abnormalities.
Prognostic value for treatment outcome In a study, in which FAF images were obtained from 95
eyes with exudative macular lesions and associated drusen before anti-VEGF therapy with bevacizumab (Avastin), it was demonstrated that changes in FAF were significantly associated with decreased visual acuity initially.
Eyes that showed changed FAF activity before anti-VEGF treatment were less likely to respond well to therapy, i.e. the possibility of increasing visual acuity post-therapy was significantly reduced.
This may be related to the reduced initial photoreceptor function associated with stressed RPE, often apparent in wet AMD.
This reduced photoreceptor function would of course explain the lower visual acuity, but it also explains the lower chance of visual recovery, even after treatment.

Simultaneous FAF and OCT imaging provides a new perspective on structure and metabolic activity within the retina.

Thank You
Related Documents