U. S. DEPARTMENT OF LABOR OFFICE OF INFORMATION, WASHINGTON, D. C. 20210 USDL - 74-11 Washington, D. C. 20212 FOR RELEASE: Transmission Embargo J. Bregger (202) 961-2633 10:00 A. M. (EDT) 961-2472 Friday, January 11, 1974 961-2531 K. Hoyle (202) 961-2913 home: 333-1284 THE EMPLOYMENT SITUATION: DECEMBER 1973 (Industry statistics and annual review) The number of nonagricultural payroll jobs and average weekly hours were about the same in mid-December as in mid-November, it was announced today by the Bureau of Labor Statistics, U. S. Department of Labor. Payroll employment, at 76. 7 million (seasonally adjusted) , has expanded by 1. 2 million since July and 2. 7 million over the year. Payroll employment and hours data are derived from the establishment survey and are normally released at the same time as data from the household survey. How- ever, because of collection, transportation, and processing problems brought on by the energy crisis and extra holidays, the release of payroll data was delayed one week for the month of December only. The household data, which in December are custom- arily collected a week earlier than the payroll data, were issued on January 4th. industry.Employment Developments. Although the payroll job total did not change in December, there were some countervailing movements among the industries. (See table B-l. ) Employment reductions occurred in several specific industries which appear to be due to actual or anticipated shortages of gasoline. Jobs in retail trade rose less than seasonally expected, with the seasonally-adjusted decline of 80, 000 concentrated among automo- tive dealerships and service stations (although a strike among grocery workers also had a substantial effect) . The service* industry failed to post its usual large season- ally-adjusted increase, primarily because of employment declines in hotels, motels, and entertainment. Jobholding in transportation and public utilities dropped for the second consec- utive month after registering a sizeable gain in October; the November reduction stemmed from a strike in the airline industry that was not settled until after the December survey period (the 9th through the 15th), whereas the December decline was widely scattered. Manufacturing, which had experienced strong growth in 1973, Digitized for FRASER http://fraser.stlouisfed.org/ Federal Reserve Bank of St. Louis

Welcome message from author
This document is posted to help you gain knowledge. Please leave a comment to let me know what you think about it! Share it to your friends and learn new things together.
Transcript

U. S. DEPARTM ENT OF LABOROFFICE OF INFORMATION, WASHINGTON, D. C. 20210
USDL - 74-11 Washington, D. C. 20212FOR RELEASE: Transmission Embargo J. Bregger (202) 961-2633
10:00 A. M. (EDT) 961-2472Friday, January 11, 1974 961-2531
K. Hoyle (202) 961-2913home: 333-1284
THE EMPLOYMENT SITUATION: DECEMBER 1973 (Industry statistics and annual review)
The number of nonagricultural payroll jobs and average weekly hours were
about the same in mid-December as in mid-November, it was announced today by
the Bureau of Labor Statistics, U. S. Department of Labor. Payroll employment,
at 76. 7 million (seasonally adjusted) , has expanded by 1. 2 million since July and
2. 7 million over the year.
Payroll employment and hours data are derived from the establishment survey
and are normally released at the same time as data from the household survey. How
ever, because of collection, transportation, and processing problems brought on by
the energy crisis and extra holidays, the release of payroll data was delayed one week
for the month of December only. The household data, which in December are custom
arily collected a week earlier than the payroll data, were issued on January 4th.
industry.Employment Developments.Although the payroll job total did not change in December, there were some
countervailing movements among the industries. (See table B-l. ) Employment
reductions occurred in several specific industries which appear to be due to actual
or anticipated shortages of gasoline. Jobs in retail trade rose less than seasonally
expected, with the seasonally-adjusted decline of 80, 000 concentrated among automo
tive dealerships and service stations (although a strike among grocery workers also
had a substantial effect) . The service* industry failed to post its usual large season
ally-adjusted increase, primarily because of employment declines in hotels, motels,
and entertainment.
Jobholding in transportation and public utilities dropped for the second consec
utive month after registering a sizeable gain in October; the November reduction
stemmed from a strike in the airline industry that was not settled until after the
December survey period (the 9th through the 15th), whereas the December decline
was widely scattered. Manufacturing, which had experienced strong growth in 1973,
Digitized for FRASER http://fraser.stlouisfed.org/ Federal Reserve Bank of St. Louis

-2 -
remained close to its November employment level of 20.1 million, and there was
little change among any of the 21 component industries as well.
Contract construction employment was up by 45, 000 after seasonal adjustment.
In addition, a 40, 000 increase in government employment was entirely concentrated
among State and local workers.
Table A . Highlights of the employment situation (seasonally adjusted data)
Selected categories
Quarterly averages Mpnthfy dqta
1972 1973 Oct. Nov.1973
D e c .19734th 1st 2nd | 3rd | 4th 1973
(Millions of persons)
Civilian labor fo rc e .................................... 87.2 87.6 88.6 89.0 89.9 89.8 90.0 90.0Total employment .............................. 82.6 83.2 84.2 84.7 85.7 85.7 85.7 85.5
Adult m e n ......................................... 47.3 47.5 47.7 48.1 48.5 48.4 48 f 5 48.6Adult women.................................... 28.3 28.6 29.2 29.5 29.6 29.7 2 9.7 29.5Teenagers............................................ 6.9 7.1 7.3 7.1 7.5 7.6 7.5 7.5
Unemployment...................................... 4.6 4.4 4.4 4.2 4.3 4.1 4.3 4.4(Percent of labor force)
Unemployment rates:All workers.............................................. 5.3 5.0 4.9 4.8 4.7 4.5 4.7 4.9Adult men................................................. 3.6 3.4 3.4 3.1 3.0 2.9 3.0 3.1Adult women............................................ 5.2 5.0 4.7 4.9 4.7 4.4 4.7 5.1Teenagers................................................. 15.6 14.8 14.7 14.4 14.4 13.9 L4.6 14.7White ......................................................... 4.7 4.5 4.4 4.2 4.2 4.1 4.2 4.4Negro and other races......................... 9.9 9.0 9.0 9.1 8.7 8.3 9. L 8.7Household heads.................................... 3.1 2.9 2.9 2.7 2.8 2.7 2.9 2.9Married m en ............................................ 2.5 2.4 2.3 2.1 2.2 2.1 2.2 2.2Full-time workers................................. 4.8 4.6 4.4 4.2 4.3 4.0 4.4 4.6State insured............................................ 3.1 2.9 2.7 2.7 2.7 2.7 2.7 2.8
(WMkt)
Average duration ofunemployment ......................................... 11.6 10.6 9.9 9.7 10.0 10.4 10.1 9.4
(Millions <>f persons)
Nonfarm payroll employment.............. 73.8 74.6 75.3 75.7 76.6 76.4 76.6 76.7Goods-producing industries ........... 23.4 23.7 24.0 24.2 24.4 24.3 24.4 24.5Service-producing industries........... 50.4 50.9 51.3 51.6 52.1 52.0 52.2 52.2
(Hours of work)
Average weekly hours:Total private nonfarm......................... 37.2 37.1 37.2 37.1 37.0 37.0 37.1 37.0Manufacturing......................................... 40.7 40.7 40.7 40.7 40.7 40.6 40.7 40.7Manufacturing overtim e................... 3.7 3.8 3.9 3.8 3.7 3.7 3,8 3.7
(1967*100)
Hourly Earnings Index, privatenonfarm:
In current dollars ................................. 141.0 142.7 145.0 147.8 150.4P 149.6 150.2p 151.4pIn constant dollars................................. 111.1 110.8 110.3 110.0 N .A . 109.5 109.Ip N .A .
p= prelim inary.
N .A .* not available.SO U R C E : Tables A -1 . A -3 . A -4 . B-1. B-2, and B-4.
Digitized for FRASER http://fraser.stlouisfed.org/ Federal Reserve Bank of St. Louis
-3 -
Hours of Work
The average workweek for production and nonsupervisory workers in December
was 37. 0 hours, seasonally adjusted, about unchanged from the previous month. (See
table B -2.) With the exception of hours in construction, which had increased sharply
in November, a month of unseasonably warm weather, and then receded again in
December, the workweeks of other major industry groups were essentially unchanged.
In manufacturing, the workweek was 40. 7 hours (seasonally adjusted), unchanged
both over the month and over the year. Factory overtime edged back to the October
level of 3. 7 hours; however, since reaching a peak of 4.1 hours in April, they have
been either 3. 7 or 3. 8 hour.s for the last 7 months.
Hourly and Weekly Earnings
Average hourly earnings of production or nonsupervisory workers on nonagri-
cultural payrolls rose 0. 8 percent from November to December, seasonally adjusted.
Since December a year ago, hourly earnings have risen by 7. 2 percent. Weekly earn
ings rose 0. 5 percent over the month and have also advanced by 7. 2 percent from their
year-ago level.
Before adjustment for seasonality, average hourly earnings increased by 1 cent
in December to $4. 01. (See table B -3 .) Since December 1972, hourly earnings have
risen by 27 cents. Weekly earnings averaged $149. 17 in December, up $1. 17 from
November and $10. 04 from December 1972.
Hpurly_Earnings Inde*.
The Hourly Earnings Index--earnings adjusted for overtime in manufacturing,
seasonality, and the effects of changes in the proportion of workers in high-wage and
low-wage industries--was 151. 4 (1967=100) in December, 0. 8 percent higher than in
November. (See table B -4 .) The index was 6. 7 percent above December a year ago.
A ll industries‘recorded gains over the past 12 months, ranging from 6. 1 percent in
finance, insurance, and real estate to 7. 8 percent in mining. During the 12-month
period ended in November, the Hourly Earnings Index in dollars of constant purchas
ing power declined 1. 6 percent.
* age * sjc sjs
As reported on January 4 (USDL. 74-3), unemployment rose in December while
total employment remained unchanged (as measured by the household survey). The
unemployment rate moved from 4. 7 to 4. 9 percent, as the total number of unemployed
Digitized for FRASER http://fraser.stlouisfed.org/ Federal Reserve Bank of St. Louis

-4 -
increased by 170, 00 in December to a total of 4. 4 million. Total employment stood
at 85. 6 million, essentially unchanged for the second consecutive month. Over the
year, employment rose by 2.7 million. Tables A -l through A-9, containing findings
from the household survey, are reprinted in this release .
This release presents and analyzes statistics from two major surveys. Data on labor force, total employment, and unemployment are derived from the sample survey of households conducted and tabulated by the Bureau of the Census for the Bureau of Labor Statistics. Statistics on payroll employment, hours, and earnings are collected by State agencies from payroll records of employers and are tabulated by the Bureau of Labor Statistics. A description of the two surveys appears in the BLS publication Employment and Earnings.
Digitized for FRASER http://fraser.stlouisfed.org/ Federal Reserve Bank of St. Louis

-5 -
THE YEAR IN REVIEW
The Nation' s employment situation during 197 3 was characterized by strong employment growth and a decline in unemployment. On an annual average basis, the number of employed persons increased by 2. 7 million, and the overall jobless rate moved down steadily from a first quarter 1972 high of 5. 8 percent to 4. 7 percent in the fourth quarter of 1973. However, after reaching a 3-1/2-year low of 4. 5 percent in October, the unemployment rate rose to 4. 7 percent in November and to 4. 9 percent in December.
The following sections describe developments in the employment situation during the course of 1973, with special emphasis on quarterly movements.
Civilian Labor Force and Total Employment
The civilian labor force, which had been growing rapidly since the economic recovery began to gain momentum in mid-1971, continued its strong expansion in 197 3. By the fourth quarter of the year, the labor force had reached 89. 9 million, exceeding its second quarter 1971 level by nearly 5. 8 million. On an annual average basis, the labor force expanded by 2. 1 million, the same as in 1972, but considerably more than the 1. 4-million gain in 1971. The extent to which the labor force increase exceeded normal population growth in both 1972 and 1973 was attributable to the rising participation of adult women and teenagers and also, though to a lesser degree, reductions in the size of the Armed Forces.
Total employment rose substantially during the course of 197 3, continuing the expansion evident since mid-1971. Job gains averaging more than half a million each quarter brought employment to an alltime high of 85. 7 million in the final quarter of the year, 6. 5 million above mid-1971. On an annual average basis, employment grew by 3. 3 percent (2. 7 million) from 1972, the largest percentage gain in 18 years. Over half of the employment increase took place among workers 25 years and over. The greatest proportionate gains were posted by men and women 20-24 years of age.
Unemployment
With employment growth exceeding that in the labor force, the number of unemployed declined 535, 000 to an average of 4. 3 million in 1973. The unemployment rate dropped accordingly, from 5. 6 to 4. 9 percent on an annual average basis, and by the last quarter, was 4. 7 percent, marking the ninth successive quarter in which the rate had dropped (despite the increase in unemployment in the last 2 months of the yea r).
Each of the major age-sex groups in the labor force participated in the decline in unemployment. (See table D. ) The jobless rate for adult men averaged 3. 2 percent in 1973, down from 4. 0 percent in 1972. Their rate had moved down to 3. 0 percent by the fourth quarter, its lowest level since the first quarter of 1970. Among women 20 years and over, the unemployment rate fell from its average of 5. 4 percent in 1972 to 4. 8 percent in 1973. A ll of their 1973 decline occurred in the first 2 quarters however. Although unemployment for teenagers remained high relative to other groups it did recede over the year, from 16. 2 to 14. 5 percent. By the last 2 quarters of 1973, it had reached its lowest rate since early 1970.
Digitized for FRASER http://fraser.stlouisfed.org/ Federal Reserve Bank of St. Louis
-6 -
The unemployment rates for both household heads and married men declined from 3. 3 to 2. 9 percent and from 2. 8 to 2. 3 percent, respectively, between 1972 and 1973. By the final quarter of 1973, both had also reached their lowest rates since the first quarter of 1970.
The unemployment rate for full-time workers continued its strong downward trend in 1973, declining through the first 3 quarters before edging up slightly to 4. 3 percent in the last quarter. On the other hand, the rate for part-time workers has not shown quite the same degree of movement since the last recession but, at 7. 9 percent in 1973, was below the 8. 6-percent average of the previous year.
Joblessness among both Negro and white workers fe ll during 1973--the Negro unemployment rate decreasing from 10. 0 percent in 1972 to 8. 9 percent in 1973 and that for whites from 5. 0 to 4. 3 percent. With both rates declining proportionately, the Negro-white unemployment rate ratio remained at about 2 to 1.
Among the major industries, the jobless rate for manufacturing workers dropped most sharply--from 5. 6 to 4. 3 percent between 1972 and 1973. Their rate has fallen continuously from its 13-year high of 7. 0 percent in the firs t quarter of 1971 to 4.1 percent by the fourth quarter of 1973. Although unemployment reductions were more pronounced for durable goods workers, there were substantial decreases among.nondurable goods workers as well. For workers in the construction industry, the unemployment rate was down considerably in 1973 (8. 8 percent) from its 1972 average of 10. 3 percent. Substantial year-to-year declines in unemployment were also registered in transportation and public utilities, finance, and services. (See table D .)
Unemployment reductions in 1973 also took place among most of the major occupational groups. The jobless rate for workers in white-collar occupations declined in 1973 after remaining at close to 3-1/2 percent for over 2 years; unemployment rates for managerial (1. 4 percent) , sales (3. 7 percent), and clerical workers (4. 2 percent) were all substantially lower than a year ago. Although the year-to-year decline for professional and technical workers was more modest (from 2. 4 to 2. 2 percent) , their jobless rate had dropped sharply from its post-World War II high of 3. 1 percent registered in early 1971. For blue*-collar workers, unemployment declined considerably for the second straight year, their rate falling to 5. 3 percent from 6. 5 percent in 1972 and 7. 4 percent in 1971. Operatives (5. 7 percent) experienced the greatest unemployment rate reduction, down from 6. 9 percent in 1972. The rates for craft workers (3. 7 percent) and nonfarm laborers (8. 4 percent) were also substantially below their year-earlier levels.
A strong improvement in the unemployment rate of Vietnam Era veterans 20 to 34, from 6. 7 percent in 1972 to 5. 0 percent last year, reduced the rate to about that of their nonveteran counterparts. During 1973, the veterans' rate dropped from 5. 4 percent in the first 2 quarters to 4. 1 percent by the fourth quarter. Although the average jobless rate for the more recently discharged veterans (20 to 24 years old) also showed a year-to-year decline--from 10. 6 percent to 8. 9 percent--it remained much higher than the 6. 8-percent rate for young nonveterans.
Along with the decline in the number of jobless workers in 1973, the average period of time workers remained unemployed--at 10. 0 weeks--was down considerably from 1972 (12. 1 weeks) Where the number of long-term unemployed (those who are
Digitized for FRASER http://fraser.stlouisfed.org/ Federal Reserve Bank of St. Louis

-7 -
looking for work for 15 or more weeks) averaged 1. 2 million in 1972, it was only slightly over 800, 000 last year. (See table C .) The long-term unemployed represented less than 1 percent of the civilian labor force in 1973, compared with 1. 3 percent in both 1971 and 1972.
About four-fifths of the overall reduction in unemployment on an annual basis between 1972 and 1973 was attributable to a drop in the number of workers who had lost their last jobs. As a result, their proportion of total unemployment fe ll to 39 percent, down from 43 percent in 1972.
In addition to the decline in unemployment in 1973, there was also a drop in the number of "discouraged workers"--from 765, 000 to 680, 000. Discouraged workers are persons who are reported as not seeking work because of a belief that their search for a job would be in vain.
Industry Developments
Total nonagricultural payroll employment rose sharply in 1973, by 2. 8 million on an annual basis to 75. 6 million. This gain surpassed the large increase experienced in 1972 (2. 1 million) , which had followed 2 consecutive years of little change . A resurgence in the goods-producing industries paced the 1973 growth, while the service-producing sector continued its strong expansion.
The employment increase in the goods-producing sector was led by manufacturing, where the number of jobs rose by 890, 000 in 1973. Factory employment, hard hit by the 1969-70 recession, did not start to recover until late 1971, after which it rose every quarter in the subsequent 2 years. The increase in 1973 was more than twice that registered the year before. Despite this surge in factory employment, its level in the last quarter of 1973 (20.1 million) was still some 200, 000 below the alltime high reached in mid-1969, reflecting, in particular, lower employment levels in the ordnance and aerospace industries. The manufacturing job gains were heavily concentrated in the durable goods industries, where 750, 000 jobs were added between 1972 and 1973; employment in the five major metal and metal-using industries--primary metals, fabricated metals, machinery, electrical equipment, and transportation equipment--accounted for over four-fifths of this rise.
Among the other goods-producing industries, employment in mining edged up over the year, and the number of jobs in contract construction rose by 130, 000.
Employment gains were recorded in each of the major service-producing categories with the exception of the Federal government. The increase, amounting to 1. 8 m illion over the year, was concentrated in retail trade, services, and State and local government.
The workweek for production or nonsupervisory workers on private nonfarm payrolls averaged 37. 1 hours in 1973, compared with 37. 2 hours in 1972 and 37. 0 hours in 1971. In manufacturing, the workweek was 40. 7 hours, not up substantially from 1972 but at its highest annual level since 1968. Factory overtime, an important indicator of prospective economic activity, moved up over the year from 3. 5 hours in 1972 to 3. 8 hours in 1973, the highest level since 1966. Although the factory workweek and overtime hours posted gains early in the year, by yearend, both were down to the levels prevailing in late 1972.
Digitized for FRASER http://fraser.stlouisfed.org/ Federal Reserve Bank of St. Louis
-8 -
Table B. Employment status of the noninstitutional population 16 years and over, annual averages, 1971-73
(In thousands)
Employment status 197!. : 1.972 1 9 7 3
Change1971-721 , 1972-73
8 6 , 9 2 9 : 3 6 , 9 9 i 91,040 1,729 2,049Armed forces........................... | 2 , 8 1 7 1 2 , 4 4 9 2,326 -368 -123Civilian labor force..... •....... • • • • • 8 4 , 1 1 3 | 3 6 , 5 4 2 88,714 2,096 2,172
Employed............ ..........• • • • • • • • 79,120 | 81,702 84,409 2,281 2,707Agriculture.... * .................. 3 , 3 8 7 3,472 3,452 72 -20Nonagricultural industries......... 7.5,732 78,230 80,957 2,210 2,727
Unemployed........................... 4,993 4,840 4,304 -185 -536Unemployment rate (percent)....... . . . 5.9 5.6 4.9 -0.3 -.7
Not in labor force.................................................. 55,666 56,785 57,222 665 437
1/ Changes shown incorporate the differences stemming from the introduction of the 1970 Census population controls into the Current Population Survey estimation procedures* They thus will differ from the arithmetic difference in each of the 1971-72 changes by the amount of the specific difference (see tables 1 and 3 in "Revisions in Current Population Survey" in the February 1972 issue of Employment and Earnings).
Table C. Unemployed persons 16 years and over by duration of unemployment, annual averages, 1971-73
Duration of unemployment
1971 1972 1973Thousands'
ofpersons
PercentThousands
ofpersons
PercentThousands
ofpersons
Percent
Total................ 4,993 100.0 4,340 100.0 4,304 100.0Less than 5 weeks....... 2,234 44.7 2,223 45.9 2,196 51.05 to 14 weeks........... 1,578 31.6 1,458 30.1 1,296 30.115 weeks and over....... 1,181 23.7 1,158 23.9 812 18.9
15 to 26 weeks....... 665 13.3 597 12.3 475 11.027 weeks and over.... 517 10.4 562 11.6 337 7.8
Average (mean) duration.• 11.4 — 12.1 — 10.0 —
Digitized for FRASER http://fraser.stlouisfed.org/ Federal Reserve Bank of St. Louis
-9-
Table D. Major unemployment indicators, annual averages, 1968-73 (Persons 16 years and over -- in percents)
Selected categories 1968 1969 1970 1971 1972 1973
Total (all civilian workers).................... 3.6 3.5 4.9 5.9 5.6 4.9
Men, 20 years and over................ 2.2 2.1 3.5 4.4 4.0 3.2Women, 20 years and over..*........... 3.8 3.7 4.8 5.7 5.4 4.8Both sexes, 16-19 years............... 12.7 12.2 15.3 16.9 16.2 14.5
White............... ................. 3.2 3.1 4.5 5.4 5.0 4.3Negro and other races................. 6.7 6.4 8.2 9.9 10.0 8.9
Household heads......................... 1.9 1.8 2.9 3.6 3.3 2.9Married men............................. 1.6 1.5 2.6 3.2 2.8 2.3Full-time workers..... .............. . 3.1 3.1 4.5 5.5 5.1 4.3Part-time workers....................... 6.5 6.2 7.6 8.7 8.6 7.9Unemployed 15 weeks and over........... .5 .5 • 8 1.4 1.3 .9Labor force time lost................................ 4.0 3.9 5.4 6.4 6.0 5.2
Vietnam Era veterans, 20-34 years............ N.A. N.A. 6.6 8.2 6.7 5.0Nonveterans, 20-34 years.... ........... N.A. N.A. 5.2 6.3 5.8 4.9
OCCUPATIONWhite-collar workers.......... ......... 2.0 2.1 2.8 3.5 3.4 2.9
Professional and technical...... .....Managers and administrators,
1.2 1.3 2.0 2.9 2.4 2.2
except farm........ ................ 1.0 .9 1.3 1.6 1.8 1.4Sales workers..... *•••••....................... 2.8 2.9 3.9 4.3 4.3 3.7Clerical workers............................... . 3.0 3.0 4.0 4.8 4.7 4.2
Blue-collar workers...................... ............ 4.1 3.9 6.2 7.4 6.5 5.3Craft and kindred workers.••••.............. 2.4 2.2 3.8 4.7 4.3 3.7Operatives................................................ 4.5 4.4 7.1 8.3 6.9 5.7Nonfarm laborers...................................... 7.2 6.7 9.5 10.8 10.3 8.4
Service workers............ ............................ 4.4 4.2 5.3 6.3 6.3 5.7Farm workers...............................................
INDUSTRY
2.1 1.9 2.6 2.6 2.6 2.5
Private nonagricultural wage andsalary workers....................................... 3.6 3.5 5.2 6.2 5.7 4.8Construction....................................... 6.9 6.0 9.7 10.4 10.3 8.8Manufacturing...................... 3.3 3.3 5.6 6.8 5.6 4.3Durable goods. .............. .. 3.0 3.0 5.7 7.0 5.4 3.9Nondurable goods.................
Transportation and public3.7 3.7 5.4 6.5 5.7 4.9
utilities........ .......................... 2.0 2.2 3.2 3.8 3.5 3.0Wholesale and retail trade......... 4.0 4.1 5.3 6.4 6.4 5.6Finance and service industries..... 3.4 3.3 4.2 5.1 4.8 4.3
Agricultural wage and salary1.8 1.9 2.2 2.9 2.9 2.7
6.3 6.0 7.5 7.9 7.6 6.9
N.A. = Not available
Digitized for FRASER http://fraser.stlouisfed.org/ Federal Reserve Bank of St. Louis

-10-
Table E. Employees on nonagricultural payrolls, by industry* annual averages, 1971-73
(In thousands)
Industry 1971 1972 1973pChange
1971-72 1972-73
T o ta l-------------------------------------- 70,645 72,764 75. 570 2,119 2,806
Goods-producing------------------------------- 22,542 23,061 24, 095 519 1,034Mining ------------------------- ------........... 602 607 625 5 18Contract construction................ .......... 3,411 3, 521 3,649 110 128Manufacturing....................... -............ 18, 529 18.933 19.821 404 888
Durable goods -------------------------- 10.565 10,884 11,634 319 750Ordnance and accessories------- 192. 1 188.2 192.4 -3.9 4.2Lumber and wood products----- 580.8 612.0 630.8 31.2 18.8Furniture and fixtures------------ 458. 5 492.7 522.0 34.2 j 29.3Stone, clay, and glass
products................................... 633. 7 660. 0 692.9 26. 3 32.9Prim ary metal industries------- 1,227.4 1,234.8 1,315.2 7.4 80.4Fabricated metal products----- 1,328.2 1,371. 1 1,451.6 42.9 80.5Machinery, except electrical — 1,805.3 1,864.2 2,042.0 58.9 177.8Electrical equipment — ............ 1,768. 5 1,833.0 1.996. 1 64.5 163. 1Transportation equipment------ 1,723.9 1,746.8 1,858.9 22.9 112. 1Instruments and related --------- 437. 0 455.9 494.2 18.9 38.3Miscellaneous manufacturing— ‘ 409.6 425.2 437.6 15.6 12.4
Nondurable goods ................. -......— 7,964 8,049 8,187 85 .138Food and kindred products----- 1,758.3 1,751. 1 1,735.7 -7.2 -15.4Tobacco manufactures ---------- 76.3 72.0 73.8 -4.3 1.8Textile m ill products................ 957.0 991.0 1,023.9 34.0 32.9Apparel....................................... 1, 335. 7 1,335. 3 1,340.9 -.4 5.6Paper and allied products------ 683.6 697.0 718.0 13.4 21.0Printing and publishing----------- 1,071.2 1,079.6 1,098.3 8.4 18.7Chemicals and allied
products ---------------------------- 1,008.2 1,002.2 1,029.5 -6.0 27.3Petroleum and coal products — 190. 6 189.6 187.2 -1.0 -2.4Rubber......... -............................. 580.9 627. 0 682.7 46. 1 55.7Leather and leather
products.............. -................... • 302.4 304. 4 296.9 2.0 -7.5
Service-producing.......—......-........... ....... 48,103 49,704 51,474 1,601 1,770Transportation and public utilities--- 4. 442 4, 495 4,610 53 115Wholesale and retail trade — ............. 15.142 15, 683 16,294 541 611
Wholesale trade —........................... 3,809 3,918 4,082 109 164Retail trade...................................... 11,333 11,765 12,212 432 447
Finance, insurance, and realestate----------------------------------------- 3,796 3,927 4, 053 131 126
Serv ices-------------------------------------- 11,869 12,309 12,865 440 556Government --------------------------------- 12,856 13,290 13,652 434 362
. F edera l----------------------------------- 2,664 2,650 2,624 -14 -26State and lo ca l-------------------------- 10,191 10,640 11,028 449 388
pspreliminary
Digitized for FRASER http://fraser.stlouisfed.org/ Federal Reserve Bank of St. Louis

TabU A-l: Employment status off tho noninstitufional population sox and ogo
(In thousands)
Dec.1972
Nov.1973
Dec.1973-
Seasonally adjusted
Employment status, age, and sex Dec.'1972
Sept.1973
O ct. 1973
Nov. 1.9 73
Dec.1973
Total
Total labor f o r c e .................................................... 89,A37 92,168 91,983 89,707 91,694 92,053 92,235 92,303Civilian labor force .............................................. 86,997 89,884 89, -/01 87,267 89,403 89,764 89,952 90,021
Em ployed............................................................... 82,881 85,828 85,643 82,780 85,127 85,695 85,688 85,586Agricu ltu re......................................................... 3,163 3, A19 3,202 3,650 3,370 3,471 3,636 3,728Nonagricultural in d u s tr ie s .............................. 79,719 82.A09 82,441 79,130 81,757 82,224 82,052 81,858
On pan time for economic re a so n s .............. 1,990 2,1871,083
2,350 2,181 2,318 2,361 2.413 2,574Usually work full t im e ................................. 917 1,140 968 1,CS0 1,098 1.175 - 1,205Usually work pan time .............................. L,073 1 ,10A 1,210 1,213 1,228 1,26 3 1,238 1,369
Unemployed............................................................ A ,116 4,056 4,058 4,487 4,276 4,069 4,264 4,435
Man, 20 yeors and over
Civilian labor fo rce ................................................. A8,921 49,802 49,870 49,152 49,667 49,918 49,965 50,131Em ployed ............................................................... 47,263 43,443 48,324 47,475 48,132 48,446 48,464 48,570
A gricu ltu re.......................................................... 2 ,A6A 2,536 2,420 2,664 2,462 2,488 2,604 2,619Nonagricultural in d u s tr ie s .............................. AA,799 45,906 45,905 44,811 45,670 45,958 45,860 45,951
Unemployed............................................................ 1,657 1,360 1,545 1,677 1,535 1,472 1,501 1,561
Women, 20 yeors and over
Civilian labor forcp ............................................... 30,291 31,729 31,539 29,869 31,023 31,033 31,154 31,095E m ployed ............................................................... 28,980 30,280 30,168 28,357 29,538 29,660 29,682 29,516
A gricu ltu re.......................................................... AA5 531 473 566 505 530 545 602Nonagricultural in d u s tr ie s .............................. 28,535 29,749 29,695 27,791 29,033 29,130 29,137 28,914
Unemployed............................................................ 1,311 1,450 1,371 1,512 1,485 1,373 1,472 1,579
Both sexes, 16-19 yeors
Civilian labor fo rce ................................................. 7,786 8,352 8,293 8,246 8,713 8,813 8,833 8,795Em ployed ............................................................... 6,638 7,106 7,151 6,948 7,457 7,589 7,542 7,500
Agricu ltu re .......................................................... 253 352 309 420 403 45 3 487 507Nonagricultural in d u s tr ie s .............................. 6 ,38A 6,754 6,842 6,528 7,054 7,136 7,055 6,993
Unemployed............................................................ 1 ,1A8 1,247 1,142 1,298 1,256 1 ,224 1,291 1,295
Table A-2: Full- and part-time status off the civ ilig * labor ffprce by sux opd a g f
(Numbers in thousands)
Full- and part-time employment status, sex,
and age
Dec.1972
Dec.1973
Seasonably adjusted
Dec.1972
Aug.1973
Sept,1973
Oct.1973
Nov.1973
Dec.1973
Full time
Total, 16 years and over:C ivilian labor fo rce ............................................... 73,595 75,673 74,715 75,821 76,056 76,649 76,863 76,910
Em ployed ............................................................ 70,567 72,649 71,224 72,637 72,837 73,576 73,496 73,405Unemployed.......................................................... 3,028 3,025 3,491 3,184 3,219 3,073 3,367 3,505Unemployment r a t e ............................................ 4.1 4.0 4.7 4.2 4.2 4.0 4.4 £.6
Men, 20 years and over:C ivilian labor fo rce ............................................... 46,350 47,270 46,630 47,183 47,233 47,435 47,456 47,584
E m ployed............................................................ 44,854 45,894 45,095 45,798 45,889 46,116 46,085 46,171Unemployed ....................................................... 1,496 1,376 1,535 1,385 1,344 1,319 1,371 1,413Unemployment r a c e ............................................ 3.2 2.9 3.3 2.9 2.8 2.8 2.9 3.0
Women, 20 years and over:C ivilian labor fo rc e .............................................. 23,583 24,484 23,390 24,251 24,107 24,232 24,395 24,306
Employed . . . . ................................................. 22,609 23,394 22,268 23,082 22,958 23,165 23,205 23,048Unemployed ....................................................... 974 1,091 1,122 1,169 1,149 1,067 1,190 1,258
Unemployment r a t e ............................................ 4.1 4.5 4.8 4.8 4.8 4.4 4.9 5.2
Pert time
Total, 16 years and over:Civilian labor fo rc e .............................................. 13,402 14,028 12,705 12,824 13,519 13,214 13,220 13,456
Em ployed............................................................ 12,314 12,995 11,640 11,755 12,447 12,259 12,273 12,282Unemployed......................................................... 1,088 1,033 1,065 1,069 1,072 960 947 1,17^Unemployment s a t e ............................................ 8.1 7.4 8.4 8.3 7.9 7.3 7.2 8.7
NOTE; Persons on part-time schedules for economic reasons are included in the full-time employed categqry; unemployed persons are allocated by whether seeking full- or part-time work.
Digitized for FRASER http://fraser.stlouisfed.org/ Federal Reserve Bank of St. Louis

Table A-3: Major unemployment indicators
(Seasonally adjusted)
Selected categories
Number of persons (In thousands) Unemployment rates
Dec.1972
Dec.1973
Dec.1972
Aug.1973
Sept.1973
Oct.1973
Nov.1973
Dec.1973
Total (all civilian workers)............................................. 4,487 4,435 5.1 4.8 4.8 4.5 4.7 4.9Men. 20 years and over............................................. 1,677 1,561 3.4 3.1 3,1 2.9 3.0 3.1Women. 20 years and over........................................ 1,512 1,579 5.1 4.9 4,6 4.4 4.7 5.1Both sexes, 16-19 years............................................. 1,298 1,295 15.7 14.3 14,4 13.9 14.6 14.7
W hite .......................................................................... 3,542 ‘ 3,540 4.6 4.2 4.2 4.1 4.2 4.4Negro and other races............................................... 938 901 9.6 8.7 9.4 8.3 9.1 8.7
Household heads............................................................. 1,471 1,503 2.9 2.8 2.7 2.7 2.9 2.9Married m e n .................................................................... 945 887 2.4 * 2.1 2.1 2.1 2.2 2.2Full-time w orkers........................................................... 3,491 3,505 4.7 4.2 4.2 4.0 4.4 4.6Part-time workers............................................................. 1,065 1,174 8.4 8.3 7.9 7.3 7.2 8.7Unemployed 15 weeks and over1.................................. 1,001 760 1.1 .9 .9 .9 1.0 .8State insured3 ................................................................. 1,681 1,707 3.1 2.7 2.7 2.7 2.7 2.8Labor force time lost3 .................................................... — — 5.3 5.2 5.1 5.0 5.2 5.4
Occupation4
White-collar workers...................................................... 1,350 1,368 3.3 3.0 2.9 2.7 2.7 3.2Professional and technical........................................ 310 307 2.6 2.3 2.3 2.2 2.0 2.5Managers and administrators, except farm ........... 141 129 1.7 1.2 1.2 1.5 1.3 1.4Sales workers............................................................... 240 264 4.3 3.9 3.6 3.1 3.3 4.9Clerical w orkers........................................................ 659 668 4.4 4.2 4.2 3.6 3.9 4.3
Blue-collar workers........................................................ 1,706 1,655 5.6 5.2 5.1 5.1 5.5 5.2Craftsmen and kindred workers............................... 437 376 3.9 3.8 3.7 3.6 4.0 3.2Operatives.................................................................... 854 873 5.8 5.5 5.2 5.3 5.6 5.8Nonfarm laborers...................................................... 415 406 8.8 8.2 8.1 8.0 8.8 8.4
Service workers............................................................... 732 765 6.2 5.5 5.8 5.1 6.0 6.3Farm workers................ ............................................. 78 77 2.3 2.6 2.4 2.3 2.7 2.3
Industry4
Nonagricultural private wage and salary workers3 . . . 3,286 3,334 5.2 4.7 4.8 4.5 4.9 5.1Construction............................................................... 431 385 9.8 8.2 9.9 9.1 9.6 8.4Manufacturing............................................................. 926 942 4.4 4.1 4.2 3.7 4.2 4.3
Durable goods........................................................ 475 489 3.9 3.6 4.1 3.6 3.5 3.8Nondurable goods............................................... 451 45 3 5.2 4.8 4.4 3.9 5.3 5.1
Transportation and public utilities......................... 125 149 2.7 3.1 2.9 2.9 3.2 3.1Wholesale and retail trade........................................ 947 983 6.1 6.0 5.6 5.2 5.5 6.3Finance and service industries ............................... 842 852 4.9 4.1 3.9 4.1 4.4 4.7
Government workers...................................................... 413 349 3.0 2.7 3.0 2.7 2.6 2.5Agricultural wage and salary workers ......................... 89 91 6.4 7.6 5.8 6.8 8.2 6.1
1 Unemployment rate calculated as a percent o! civilian labor force.3 Insured unemployment under State programs-unemployment rate calculated as a percent of average covered employment. As with the other statistics presented, insured unemployment data
relate to the week containing the 12th.3 Man-hours lost by the unemployed and persons on part time for economic reasons as a percent of potentially available labor force man-hours.4 Unemployment by occupation includes all experienced unemployed persons, whereas that by industry covers only unemployed wage and salary workers. s Includes mining, not shown separately.
Table A-4: Unemployed persons 16 years and over by duration of unemployment
(Numbers in thousands)
Duration of unemployment Dec.1972
Dec.1973
Seasonally adjusted
Dec.1972
Aug.1973
Sept.1973
Oct.1973
Nov.1973
Dec.___1213____
Less than 5 w eeks.......................................................... 1,795 2,097 2,026 2,240 2,167 1,960 2,238 2,3695 to 14 w eeks................................................................. 1,459 1,307 1,444 1,205 1,351 1,303 1,220 1,29515 weeks and over.......................................................... 862 654 1,001 796 778 776 855 760
15 to 26 weeks.......................................................... 473 372 530 457 489 439 490 41827 weeks and over...................................................... 389 282 471 339 289 337 365 342
Average (mean) duration, m w eeks............................. 11.7 9.6 11.4 10.0 9.4 10.4 10.1 9.4
Digitized for FRASER http://fraser.stlouisfed.org/ Federal Reserve Bank of St. Louis

Table A-5: Unem ployed persons by reason for unemployment
(Numbers in thousands)
Reason for unemployment Dec.1972
Dec.1973
Seasonally adjusted
Dec.1972
Aug.1973
Sept.1973
Oct.1973
Nov.1973
Dec.1973
Number of unemployed
Lost last |ob................................................. 1,89 7 1,818 1,846 1,609 1,659 l,4b7 1,700 1,770Left last |ob................................................. 581 695 672 631 666 671 813 805Reentered laboi fo rce .................................... 1,129 1,069 1,322 1,381 1,308 1,236 1,215 1,253Never worked before...................................... 509 4 76 629 59 7 6 37 604 572 589
Percent distribution 1!Total unemployed........................................... 100.0 100.0 100.0 100.0 100.0 100.0 100.0 100.0
Lost last jo b ............................................. 46.1 44.8 41.3 38.1 38.9 36.9 39.5 40.1Left last j o b ............................................. 14.1 17.1 15.0 15.0 15.6 16.9 18.9 18.2Reentered labor force.................................. 27.4 26.3 29.6 32.7 30. f> 31.1 28.3 28.4Never worked before.................................... 12.4 11.7 14.1 14.2 14.9 15.2 13.3 13.3
Unemployed as a percent of thecivilian lobor force
Lost last |ob................................................. 2.2 2.0 2.1 1.8 1.9 1.6 1.9 2.0Left last jo b ................................................. . 7 .8 .8 . 7 . 7 .7 .9 .9Reentered labor force...................................... 1. 3 1.2 1.5 1.6 1.5 1.4 1.4 1.4Never worked before...................................... .6 .5 .7 .7 . 7 .7 .6 .7
Tab le A -6 : U n em ployed persons by age and sex
Thousands of persons Percent looking for full-time
work
Seasonally adjusted unemployment rates
Age and sexi
Dec.1972
Dec. 1973 j
Dec.1972
Aug.1973
Sep t. 1973
Oct.1973
Nov.1973
Dec.1973T ? C7 5 ~
Total, 16 years and o v e r ........................... 4,116 4,058 74.5 5.1 !1 4.8 4.8 4.5 4.7 4.9
16 co 19 years.......................................... 1,148 1,142 48.9 15.7 14.3 ii 14.4 13.9 14.6 14.716 and 17 y ea rs ................................... 545 552 26.8 17.5 16.5 16.9 16.3 17.3 16.618 and 19 y ea rs .................................. 603 590 69.7 14.4 12.7 12.8 12.0 12.8 13.4
20 co 24 years.......................................... 898 859 86.0 8. 7 7.9 7.9 6.6 7.0 7.925 years and o v e r .................................. 2,070 2,057 84.0 3.2 3.0 ■ 2.9 2.9 3.0 3.1
25 co 54 y ea rs ..................................... 1,645 1,696 86.0 3.4 3. 1 3.0 2.9 3.1 3.455 vears and o ver................................ 425 361 74.5 3.0 2.8 2.6 2.7 2.7 2.6
Males, 16 years and o v e r ........................... 2, 328 2,191 77.4 4.41
4.01
3.9 3.9 4.0 4.1
16 (o 19 years.......................................... 671 645 49.6 15.4 !! 14.1 13. 7 13.2 14. 7 13.916 and 17 y ea rs .................................. 330 324 29.3 17.4 || 16.2 15.2 15.8 17.6 16.318 and 19 yea rs .................................. 342 322 69.9 13.7 12.4 12.8 11.0 12.5 12.1
20 co 24 years.......................................... 52 3 466 86.9 8.2 7.4 7.0 6.1 6.7 6.925 years and o v e r .................................. 1,134 1,079 89.8 2.7 2.4 2.4 2.4 2.4 2.5
25 to 54 y ea rs ..................................... 851 852 93. 7 2.6 2.4 2.3 2.2 2.3 2.6283 22 1 75.3 3.0 2.6 2 . S i
1i 2.81
2.8 2.5
Females, 16 years and o v e r ...................... 1,788 1 86C 71.1 6. 3 5.9!
6.0I, 5.6 5.8 6.3
16 co 19 years.......................................... 477 -*'j ‘t 47.9 16.2 14.51
15. J | 14. 7 14.6 15.716 and 17 yea rs ................................... 215 225 23.2 17.6 16.7 n . o | 17.1 17.0 16.9
18 and 19 y ea rs .................................. 262 268 69.0 15.4 13.1 12.8 13.1 13.1 14.920 to 24 years.......................................... 375 39 3 85.0 9.2 8.6 8.9 7.3 7.4 9.225 years and o v e r .................................. 9 36 978 77.4 4.2 4.0 3.8 3.7 4.1 4.2
25 to 54 y ea rs ..................................... 79 3 || 844 78.2 4.6 4.3 4 1 4.0 4.5 4.755 years and over................................
i___ j
142 j
i_ _ _ _ _ _ i! 34
L .73.7 3.0 |
_____________1
1 3.2
L _ . .2.4 2.4 2.7 2.9
Digitized for FRASER http://fraser.stlouisfed.org/ Federal Reserve Bank of St. Louis

HOUSEHOLD DATA HOUSEHOLD DATA
A-7: Employment status of male Vietnam Era veterans and nonveterans 20 to years of age
(Numbers in thousands)
Employment statusSeasonally adjusted
Dec. Nov. Dec. Dec. Aug. Sept. O ct. Nov. uec.1972 1973 1973 1972 1973 1973 1973 1973 1973
VETERANS1
iiii
Total, 20 to 34 years11 i
Civilian noninstitutional population2 .......................... 5,473 5,865 5.900 ! 5,473 ! 5,755 | 5,795 5,833 ! 5,865 j 5,900Civilian labor force ............................................ 5,124 5,511 ! 5,578 . ! 5,119 ; 5,394 5,418 i 5,515 i 5,506 5,568
Employed..................................................... 4,864 5,318 5,357 ! 4,836 | 5,109 5,139 i 5,277 | 5,306 ! 5,324Unemployed................................................. 260 193 221 1 28 3 j 285 279 238 j 200 | 244Unemployment rate ....................................... 5.1 3.5 4.0
I 5‘ 5! 5.3 5,1 4.3 i 3.6 ; 4.4
i
20 to 24 years i!
i1 | i
Civilian noninstitutiona! population2 ......................... 1,837 1,546 1.317 1,837i, 1,626 1,602 1,577 | 1,546 1,517
Civilian labor force ............................................ 1,682 1,375 1,368 1,673 i 1,458 1,430 1,444 1,376 1,361Employed....................................................... 1,535 1,279 1,267 1,524 : 1,311 1 1,321 1,329 1,279 1,258Unemployed................................................... 147 96 101 149 i 147 ! 109 115 97 103Unemployment rate ......................................... 8.7 7.0 7.4 8.9 10.1 I 7-6
;8.0 ■ 7.0 7.6
25 to 29 years
Civilian noninstitutional population2 ........................... 2,811 3,173 3,208 2,811 3,069 3.104 3,139 3,173 3,208Civilian labor force ........................................ .................... 2,648 3,018 3,060 2,665 2,918 2,911 2,976 3,027 ' 3,078
Employed....................................................... 2,564 2,949 2,973 | 2,563 2,799 2,786 2,882 j 2,952 ! 2,973Unemployed................................................... 84 69 87 ! 102 119 125 94 75 105Unemployment rdte ......................................... 3.2 2.3 2.8 1 3.8
i4.1 4.3 3.2 i 2.5
j3.4
30 to 34 years 1 il!j
Civilian noninstitutional population2 ........................... 825 1,146 1,175 825 1.060 1,089 1,117 j 1,146 1,175Civilian labor force ............... , ............................ 794 1,118 1,150 781 1,018 1,077 1,095 ! 1,103 1,129
Employed ..................................................... 765 1,090 1,117 749 999 1,032 1,066 ; 1,075 1,093Unemployed................................................... 29 ji 28 i 33 32 19 45 29 ' 28 36Unemployment rate ......................................... 3,7 ! 2-5
2.9 4.1 1.9 4.2 2.6 j 2.5J V
NONVETERANSi JiIj
Total, 20 to 34 yearsI
i
Civilian noninstitutional population2 ................... 13,804 14,701 14,814 13,804 14,486 14,559 14,626 | 14,701 14,814Civilian labor force .............................................. 12,223 13,234 13,337 12,354 12,948 13,041 13.246 13,372 13,483
Employed..................................................... 11,593 12,674 12,723 11,693 12,299 12,434 12,698 12,742 12,839Unemployed................................................... 630 560 614 661 649 607 548 630 644Unemployment rate ..................................... ,. 5.2 4.2 4.6 5.4 5.0 4.7 4.1 4.7 4.8
20 to 24 years
Civilian noninstitutional population2 ........................... 6,289 6,861 6,929 6,289 6,718 6,770 6,812 6,861 6,929Civilian labor force .............................................. 5,075 5,745 5,804 5,231 5,521 5,599 5,770 5,892 5,977
Employed...................................................... 4,698 5,394 5,439 4,808 5,137 5,233 5,443 5,498 5,567Unemployed...................................., ............. 377 351 365 423 384 366 327 394 410Unemployment rate ......................................... 7.4 6.1 6.3 8.1 7.0 |
15r7 6.7 |
16.9
25 to 29 years1i
j
Civilian noninstitutional population2 .......................... 4,038 4,168 4,193 4,038 4,135 ! 4,144 4,155 4,168 4,193Civilian labor force .............................................. 3,804 3,945 3,976 3,778 3,923 | 3,938 3,949 3,946 3,948
Employed...................................................... 3,645 3,803 3,803 3,631 3,742 , 3,774 3,799 3,777 3,788Unemployed................................................. 159 142 173 147 181 164 j 150 169 | 160UnemDloyment rate......................................... 4.2 3.6 4.4 3.9 4.6 : 4.2 | 3.8 4.3 j ^.1
30 to 34 years j
Civilian noninstitutional population2 ........................... 3,477 3,672 3,692 3,477 3,633 3,645 3,659 j 3,672 ! 3,692Civilian labor force ............................................ 3,344 3,544 3,557 3,345 3,504 3,504 3,527 3,534 ! 3,558
Employed...................................................... 3,250 3,477 3,481 3,254 3,420 3,427 3,456 3,467 ! 3,484Unemployed................................................... 94 67 76 91 84 77 71 67 74Unemployment rate ......................................... 2.8 1.9 2.1 2.7 |
i2.4 2.2 2.0 1.9 2.1
1 Vietnam Era veterans are those who served a f t e r August 4, 1964. At presen t,-----------------1---------------------- - r -----of the Vietnam Era veterans o f a ll ages, 91 per-
cent are 20 to 34 years o f age .2 Since seasonal va r ia t ion s are not present in the population figu res , id en tica l numbers appear in the unadjusted and seasonally
adjusted columns.
Digitized for FRASER http://fraser.stlouisfed.org/ Federal Reserve Bank of St. Louis

Table A-8. Employment status of the civilian noninstitutional population 16 years and over,
by sex, age, and color, seasonally adjusted quarterly averages
(Numbers in thousands)
1971 1972 1973Characteristic
4th 1st 2nd 3rd 4th 1st 2nd 3rd 4th
Total
Civilian noninstitutional population1...................................... 140,830 142,344 143,006 143,674 144,281 144,942 145,606 146,266 146,931Civilian labor fo r c e ............................................................. 84,974 85,809 , 86,391 86,867 87,175 87,586 88,562 88,955 89,912
As percent o f population.......................................... 60.3 60.3 60.4 60.5 60.4 60.4 60.8 60.8 61.2Employment................................................................... 79,922 80,797 81,474 82,033 82,567 83,190 84,205 84,725 85,656
A$ percent of popu lation .................................... 56.8 56.8 57.0 57.1 57.2 57.4 57.8 57.9 58.3Unemployment............................................................. 5,052 5,012 4,917 4,834 4,608 4,396 4,357 4,230 4,256
Unemployment rate3............................................ 5.9 5.8 5.7 5.6 5.3 5.0 4.9 4.8 4.7
Males, 20 years and over
Civilian noninstitutional population1...................................... 58,805 59,330 59,662 59,953 60,212 60,518 60,797 61,078 61,380Civilian labor f o r c e ............................................................. 48,163 48,400 48,714 48,994 49,120 49,162 49,390 49,614 50,005
As percent o f population.......................................... 81.9 81.6 81.6 81.7 81.6 81.2 81.2 81.2 81.5Employment ................................................................. 46,063 46,393 46,707 47,102 47,337 47,507 47,734 48,084 48,493
As percent o f population .................................... 78.3 78.2 78.3 78.6 78.6 78.5 78.5 78.7 79.0Unemployment............................................................. 2,100 2,007 2,007 1,892 1,783 1,655 1,655 1,530 1,511
Unemployment rate3............................................ 4.4 4.1 4.1 3.9 3.6 3.4 3.4 3.1 3.0
Females, 20 years and over
Civilian noninstitutional population1 .................................... 66,894 67,676 67,932 68,232 68,529 68,816 69,095 69,392 69,694Civilian labor fo r c e ............................................................. 29,170 29,432 29,665 29,907 29,859 30,117 30,659 31,011 31,094
As percent o f population ........................................ 43.6 43.5 43.7 43.8 43.6 43.8 44.4 44.7 44.6Employment ............................................................... 27,514 27,847 28,019 28,249 28,310 28,602 29,209 29,508 29,619
As percent o f population .................................... 41.1 41.1 41.2 41.4 41.3 41.6 42.3 42.5 42.5Unemployment............................................................. 1,656 1,585 1,646 1,658 1,549 1,514 1,450 1,503 1,475
Unemployment rate3............................................ 5.7 5.4 5.5 5.5 5.2 5.0 4.7 4.8 4.7
Both sexes, 16-19 years
Civilian noninstitutional population1...................................... 15,130 15,337 15,413 15,489 15,539 15,609 15,715 15,796 15,856Civilian labor fo r c e ............................................................. 7,641 7,977 8,012 7,966 8,196 8,308 8,514 8,330 8,814
As percent o f population ........................................ 50.5 52.0 52.0 51.4 52.7 53.2 54.2 52.7 55.6Employment ................................................................. 6,345 6,557 6,748 6,682 6,920 7,081 7,262 7,134 . 7,544
, As percent o f population .................................... 41.9 42.8 43.8 43.1 44.5 45.4 46.2 45.2 47.6Unemployment ........................................ .................... 1,296 1,420 1,264 1,284 1,276 1,226 1,252 1,197 1,270
Unemployment rate3 .......................................... 17.0 17.8 15.8 16.1 15.6 14.8 14.7 14.4 14.4
White
Civilian noninstitutional population1...................................... 125,341 126,534 127,091 127,650 128,160 128,621 128,986 129,538 130,064Civilian labor fo r c e ............................................................. 75,603 76,303 76,783 77,274 77,514 77,830 78,582 78,857 79,732
As percent o f population.......................................... 60.3 60.3 60.4 60.5 60.5 60.5 60.9 60.9 61.3Em ploym ent................................................................. 71,497 72,301 72,788 73,395 73,855 74,309 75,122 75,558 76,354
As percent o f population .................................... 57.0 57.1 57.3 57.5 57.6 57.8 58.2 58.3 58.7Unemployment............................................................... 4,106 4,002 3,995 3,879 3,659 3,520 3,461 3,299 3,379
Unemployment rate3 ..........................................
Negro and other races
5.4 5.2 5.2 5.0 4.7 4.5 4.4 4.2 4.2
Civilian noninstitutional population1 .................................... 15,489 15,810 15,915 16,025 16,122 16,321 16,620' 16,728 16,866Civilian labor fo r c e ............................................................. 9,385 9,488 9,546 9,597 9,686 9,822 9,957 10,122 10,230
As percent of population ........................................ 60.6 60.0 60.0 59.9 60.1 60.2 59.9 60.5 60.7Employment ................................................................. 8,435 8,480 8,630 8,648 8,726 8,941 9,062 9,197 9,338
As percent o f population .................................... 54.5 53.6 54.2 54.0 54.1 54.8 54.5 55.0 55.4Unemployment............................................................. 950 1,008 916 949 960 881 895 925 892
Unemployment rate3 .......................................... 10.1 10.6 9.6 9.9 9.9 9.0 9.0 9.1 8.7
1 Because seasonality, by definition, does not exist in population figures, these figures are not seasonally adjusted.2 Unemployment as a percent o f civilian labor force.
NOTE: In making quarter-to-quarter comparisons in terms of civilian labor force or employment levels, one should take into account the effect o f 1970 Census population adjustments introduced in January 1972 and in March 1973. The first o f these adjustments had the effect o f increasing the total and white civilian labor force and employment levels for the first quarter of 1972 by about 300,000 (in comparison with prior quarters). The second adjustment had its primary impact upon population, labor force, and employment of the white and Negro and other races groups. For example, the white labor force and employment levels were lowered by about 50.000 in the first quarter of 1973 and 100.000 in the second quarter and the Negro and other races labor force and employment levels were increased by about 70.000 in the first quarter and 140.000 in the second quarter (compared with prior quarters).
Digitized for FRASER http://fraser.stlouisfed.org/ Federal Reserve Bank of St. Louis
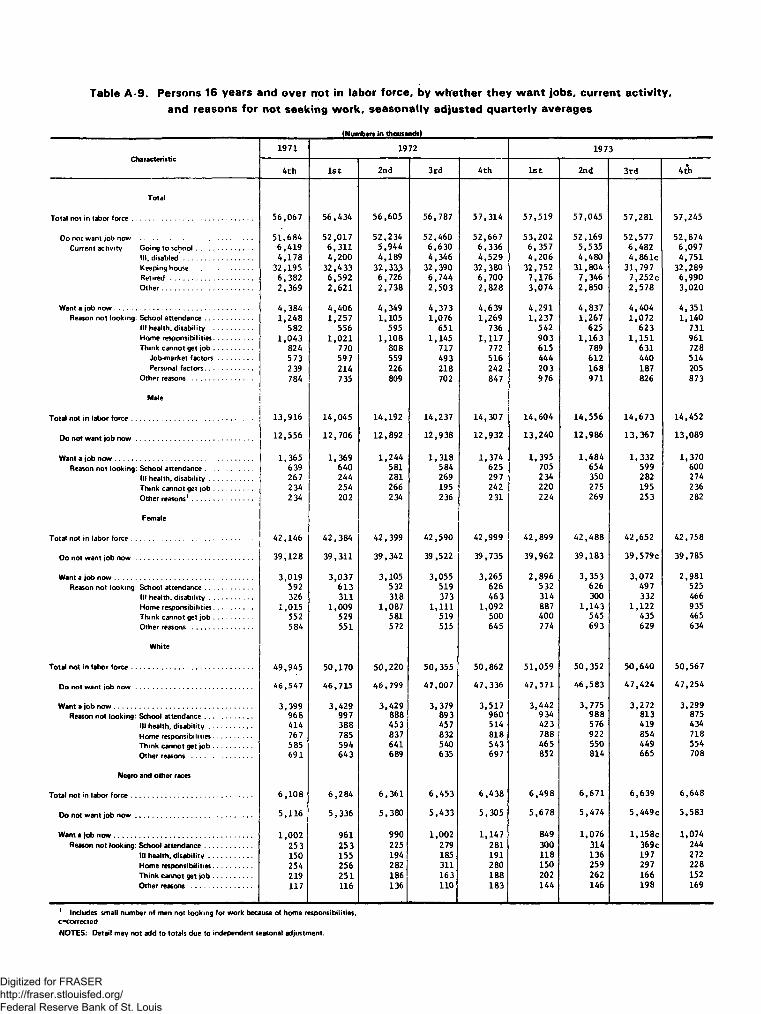
Table A-9. Persons 16 years and over not in labor force, by whether they want jobs, current activity, and reasons for not seeking work, seasonally adjusted quarterly averages
(Numbers in thousands)
Characteristic1971 1972 1973
4th 1st 2nd 3rd 4 th 1st 2nd 3rd 4 th
Total
Total not in labor force.............................................................. 56,067 56,434 56,605 56,787 57,314 57,519 57,045 57,281 57,245
Do nor want job n o w ............................................................ 51,684 52,017 52,234 52,460 52,667 53,202 52,169 52,577 52,874Current activity Going to school............................. 6,419 6,311 5,944 6,630 6,336 6,357 5,535 6,482 6,097
Ill, disabled.................................... 4,178 4,200 4,189 4,346 4,529 4,206 4,480 4,861c 4,751Keepinq house ............................. 32,195 32,433 32,333 32,390 32,380 32,752 31,804 31,797 32,289Retired .......................................... 6,382 6,592 6,726 6,744 6,700 7,176 7,346 7,252c 6,990Other............................................... 2,369 2,621 2,738 2,503 2,828 3,074 2,850 2,578 3,020
Want a job now....................................................................... 4,384 4,406 4,349 4,373 4,639 4,291 4,837 4,404 4,351Reason not looking: School attendance........................ 1,248 1,257 1,105 1,076 1,269 1,237 1,267 1,072 1,140
Ill health, disability...................... 582 556 595 651 736 542 625 623 731Home responsibilities.................... 1,043 1,021 1,108 1,145 1,117 903 1,163 1,151 961Think cannot get jo b .................... 824 770 808 717 772 615 789 631 728
Job-market factors.................. 573 597 559 493 516 444 612 440 514Personal factors........................ 239 214 226 218 242 203 168 187 205
Other reasons ............................... 784 735 809 702 847 976 971 826 873
Male
Total not in labor force.............................................................. 13,916 14,045 14,192 14,237 14,307 14,604 14,556 14,673 14,452
Do not want job n o w ............................................................ 12,556 12,706 12,892 12,938 12,932 13,240 12,986 13,367 13,089
Want a job now ........................................................................ 1,365 1,369 1,244 1,318 1,374 1,395 1,484 1,332 1,370Reason not looking: School attendance........................ 639 640 581 584 625 705 654 599 600
Ill health, disability...................... 26 7 244 281 269 297 234 350 282 274Think cannot get |ob .................... 234 254 266 195 242 220 275 195 236Other reasons'............................... 2 34 202 234 236 2 31 224 269 253 282
Female
Total not in labor force.............................................................. 42,146 42,384 42,399 42,590 42,999 42,899 42,488 42,652 42,758
Do not want job n o w ............................................................ 39,128 39,311 39,342 39 , 5 2 2 39,735 39,962 39,183 39,579c 39,785
Want a job now....................................................................... 3,019 3,037 3,105 3,055 3,265 2,896 3,353 3,072 2,981Reason not looking: School attendance........................ 592 613 532 519 626 532 626 497 525
Ill health, disability...................... 326 311 318 373 463 314 300 332 466Home responsibilities.................... 1,015 1,009 1,087 1,111 1,092 887 1,143 1,122 935Think cannot get jo b .................... 552 529 581 519 500 400 545 435 465Other reasons ............................... 584 551 5 72 515 645 774 693 629 634
White
Total not in labor force............................................................... 49,945 50,170 50,220 50,355 50,862 51,059 50,352 50,640 50,567
Do not want job now .............................................. 46,547 46,715 46,799 47,007 47,336 47,571 46,583 47,424 47,254
Want a job now....................................................................... 3,399 3,429 3,429 3,379 3,517 3,442 3,775 3,272 3,299Reason not looking: School attendance........................ 96 S 997 888 893 960 934 988 813 875
Ill health, disability...................... 414 388 453 457 514 423 576 419 434Home responsibilities.................... 767 785 837 832 818 788 922 854 718Think cannot get jo b .................... 585 594 641 540 543 465 550 449 554Other reasons ............................... 691 643 689 635 697 852 814 665 708
Negro and other races
Total not in labor force............................................................... 6,108 6,284 6,361 6,453 6,438 6,498 6,671 6,639 6,648
Do not want job n o w ............................................................ 5,116 5,336 5,380 5,433 5,305 5,678 5,474 5,449c 5,583
Want a job now....................................................................... 1,002 961 990 1,002 1,147 849 1,076 1,158c 1,074Reason not looking: School attendance........................ 253 253 225 279 281 300 314 369c 244
Ill health, disability...................... 150 155 194 185 191 118 136 197 272Home responsibilities.................... 254 256 282 311 280 150 259 297 228Think cannot get jo b .................... 219 251 186 163 188 202 262 166 152Other reasons ............................... 117 116 136 110 183 144 146 198 169
' Includes small number of men not looking for work because of home responsibilities. cscorrectedNOTES: Detail may not add to totals due to independent seasonal adjustment.
Digitized for FRASER http://fraser.stlouisfed.org/ Federal Reserve Bank of St. Louis
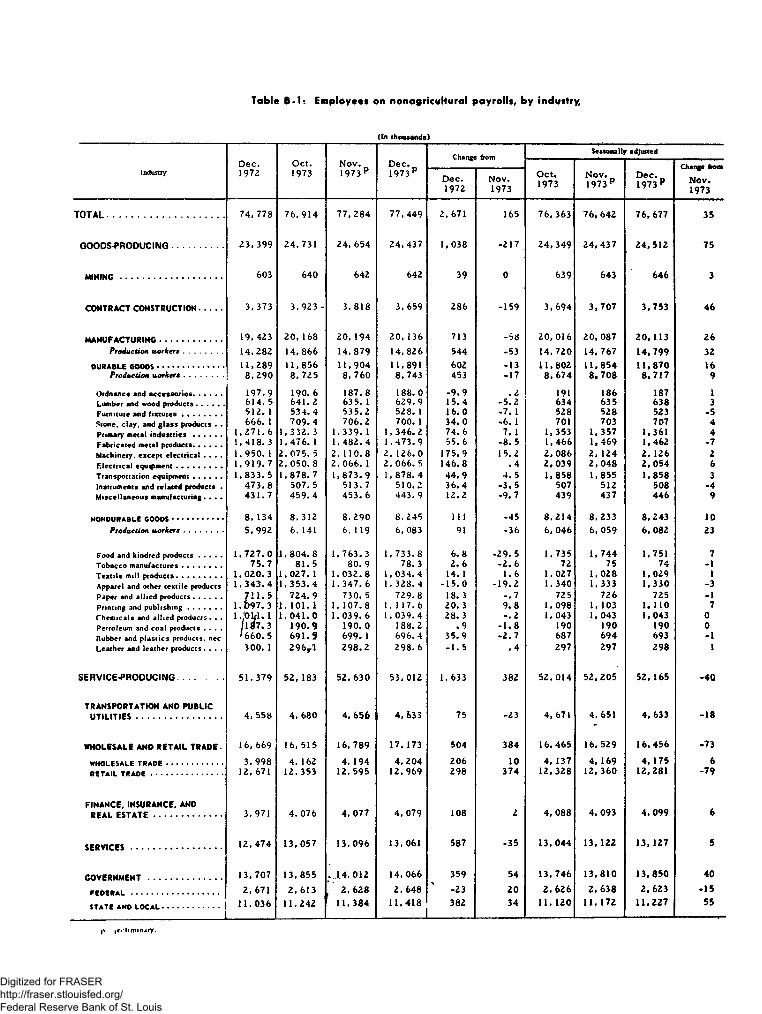
Table B-1: Employees on nonagriculfrural payrolls, by industry,
(In thousands)
I ndustryDec. 1 972
Oct.1973
Nov.1973 P
Dec. 1973 p
Change fromSeasonally adjusted
Oct.1973
Nov. ̂ 1973 P
Dec. „ 1973P
Change from
N o v .1973
Dec.1972
Nov.1973
T O T A L ..................................................... 74,778 76, 914 77,284 77,449 2, 671 165 76,363 76, 642 76, 677 35
GOODS-PRODUCING................... 23,399 24, 731 24, 654 24,437 1,038 -217 24,349 24,437 24,512 75
MINING...................................... 603 640 642 642 39 0 639 643 646 3
CONTRACT CONSTRUCTION........ 3, 373 3,923 - 3.818 3, 659 286 -159 3,694 3,707 3,753 46
MANUFACTURING..................... 19,423 20, 168 20, 194 20, 136 713 -58 20,016 20,087 20, 113 26P roduction w o r k e r s ............. 14,282 14,866 14,879 14, 826 544 -53 14,720 14,767 14,799 32
DURABLE GOODS....................... 11,289 11,856 11,904 11.891 602 -13 11,802 11,854 11,870 16Produ ction w o r k e r s ............. 8,290 8, 725 8, 760 8,743 453 -17 8, 674 8.708 8,717 9
Ordnance and accessories............... 197.9 190. 6 187.8 188. 0 -9.9 .2 191 186 187 1614. 5 641.2 63 5. 1 629.9 15.4 -5.2 634 635 638 3
Furniture and fix tu re s..................... 512. 1 534. 4 535.2 528. 1 16. 0 -7. 1 528 528 523 -5Stone, clay, and glass products . . 666. 1 709. 4 706.2 700. 1 34.0 -6. 1 701 703 707 4Primary metal industries . . . . . . 1,271.6 1,332.3 1,339. 1 1,346. 2 74. 6 7. 1 1. 353 1, 357 1,361 4Fabricated metal products............... 1,418. 3 1.476. 1 1.482.4 1,473.9 55. 6 -8.5 1,466 1.469 1,462 -7Machinery, except electrical . . . . 1,950. 1 2, 075. 5 2, 110.8 2, 126.0 175.9 15.2 2. 086 2, 124 2. 126 2Electrical equipment........................ 1,919.7 2, 050. 8 2, 066. 1 2,066. 5 146.8 .4 2.039 2,048 2,054 6Transportation equipment............... 1,833. 5 1,878.7 1,873.9 1,878.4 44.9 4. 5 1,858 1.855 1.858 3Instruments and related products . 473.8 507. 5 513. 7 510.2 36. 4 -3,5 507 512 508 -4Miscellaneous manufacturing. . . . 431.7 459. 4 453. 6 443. 9 12.2 -9.7 439 437 446 9
NONDURABLE GOODS................. 8, 134 8, 312 8. 290 8, 245 111 -45 8.214 8,233 8,243 10P roduction w o r k e r s ............... 5,992 6, 141 6, 119 6. 083 91 -36 6, 046 6, 059 6.082 23
Food and kindred products............ 1.727.0 1.804. 8 1,763.3 1, 733.8 6. 8 -29. 5 1,735 1,744 1.751 7Tobacco manufactures..................... 75.7 81.5 80. 9 78.3 2. 6 -2.6 72 75 74 -1Textile mill products........................ 1,020.3 1,027. 1 1,032.8 1,034. 4 14. 1 1.6 1,027 1,028 1,029 1Apparel and other textile products 1,343. 4 1,353.4 1,347.6 1. 328.4 -15.0 -19.2 1, 340 1, 333 1,330 -3Paper and allied products............... 711.5 724.9 730. 5 729.8 18. 3 -. 7 72 5 726 725 -1Printing and publishing................. 1.D97. 3 1.101.1 1,107.8 1, 117.6 20. 3 9.8 1.098 1, 103 1, 110 7Chemicals and allied products. . . 1 '01x1. 1 1,041.0 1,039. 6 1.039.4 28. 3 -.2 1.043 1,043 1,043 0Petroleum and coal products . . . . 1 87 . 3 190.91 190. 0 188.2 .9 -1.8 190 190 190 0Rubber and plastics products, nec '660.5 691.Sf 699. 1 696. 4 35.9 -2.7 687 694 693 -1Leather and leather products. . . . 300. 1 296r l 298.2 298.6 -1.5 .4 297 297 298 1
SERVICE-PRODUCING................. 51,379 52,183 52,630 53,012 1, 633 382 52, 014 52,205 52,165 -40
TRANSPORTATION AND PUBLICUTILITIES................................ 4, 558 4, 680 4. 656 4.633 75 -23 4, 671 4. 651 4. 633 -18
WHOLESALE AND RETAIL TRADE- 16, 669 16, 515 16,789 17,173 504 384 16,465 16.529 16,456 -73
WHOLESALE TRADE ............................. 3,998 4. 162 4. 194 4, 204 206 10 4, 137 4. 169 4, 175 6RETAIL T R A D E ..................................... 12, 671 12,353 12,595 12,969 298 374 12,328 12,360 12,281 -79
FINANCE, INSURANCE, ANDREAL ESTATE......................... 3,971 4, 076 4, 077 4, 079 108 2 4, 088 4, 093 4.099 6
SERVICES.................................. 12,474 13,057 13.096 13,061 587 -35 13.044 13.122 13,127 5
GOVERNMENT ........................... 13,707 13.855 -..14, 012 14.066 359 54 13,746 13,810 13.850 40
FEDERAL ............................................. 2, 671 2. 613 r 2, 628 2. 648 -23 20 2. 626 2,638 2,623 -15
STATE AND LO CA L............................. 1________________ 1
11.036 11,242 11.384 11,418____ 1
3821__________
34 11, 120 11,172 11,227 55
p |ir«liminjry.
Digitized for FRASER http://fraser.stlouisfed.org/ Federal Reserve Bank of St. Louis
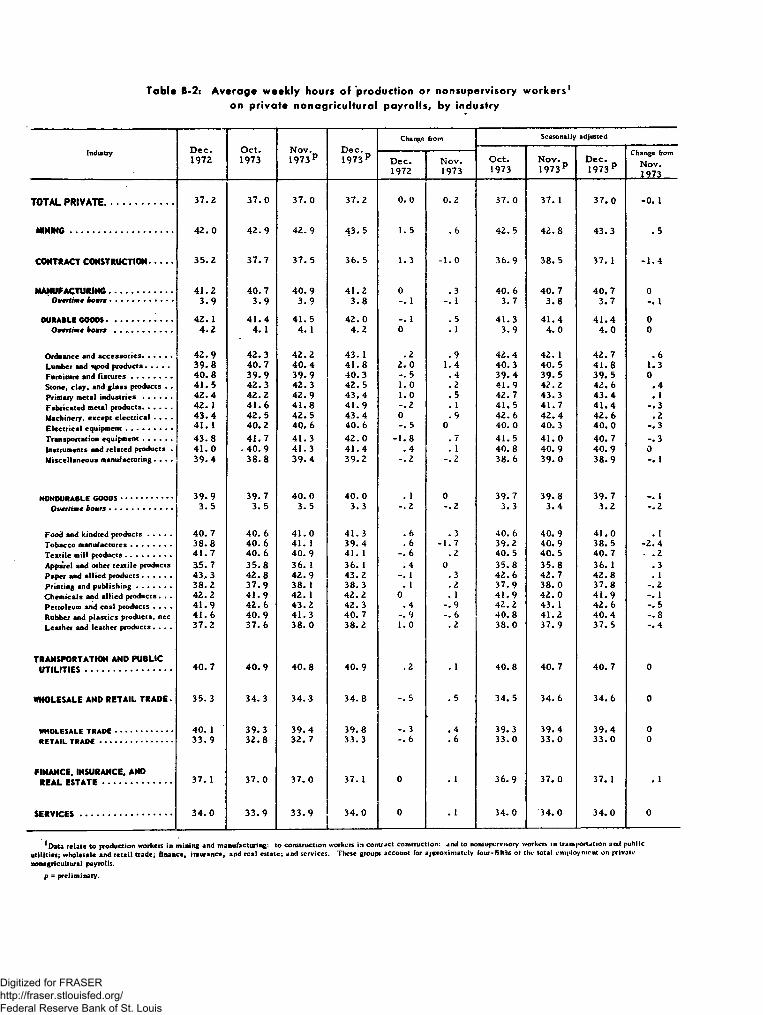
TabU B-2: Average weekly hours of production or nonsupervisory workers'on private nonagricultural payrolls, by industry
Industry Dec.1972
Oct.1973
Nov.1973p
Dec. 1973 P
Change from Seasonally adjusted
Oct.1973
Nov. 1973 P
Dec. 1973 P
Change from Nov.
_ 1973_
Dec.1972
Nov.1973
TOTAL PRIVATE..................... 37.2 37.0 37. 0 37.2 0. 0 0.2 37.0 37. 1 37.0 -0. 1
MINING................................................ 42. 0 42.9 42. 9 43. 5 1. 5 . 6 42. 5 42.8 43.3 . 5
CONTRACT CONSTRUCTION........... 35.2 37.7 37. 5 36. 5 1.3 -1.0 36.9 38. 5 37. 1 -1.4
MANUFACTURING.............................. 41.2 40.7 40.9 41.2 0 . 3 40. 6 40.7 40, 7 0Overtime boars................................. 3.9 3.9 3.9 3.8 - . 1 - . 1 3.7 3.8 3.7 1
DURABLE G O O D S ................ 42. 1 41.4 41. 5 42.0 - . 1 . 5 41.3 41.4 41.4 0Overtime boars . . ....................... 4.2 4. 1 4. 1 4.2 0 . 1 3.9 4.0 4.0 0
Ordnance and accessories............... 42.9 42.3 42.2 43. 1 .2 .9 42.4 42. 1 42.7 .6Lumber and apod products............ 39.8 40.7 40.4 41.8 2.0 1.4 40,3 40. 5 41.8 1.3Furniture and fix tu re s..................... 40.8 39.9 39.9 40.3 - . 5 . 4 39.4 39.5 39.5 0Stone, clay, and glass products . . 41.5 42. 3 42. 3 42. 5 1.0 .2 41.9 42.2 42.6 .4Primary metal in d u strie s ............... 42.4 42.2 42.9 43,4 1.0 . 5 42.7 43. 3 43. 4 . 1Fabricated metal products............... 42. 1 41. 6 41.8 41.9 -.2 . 1 41. 5 41.7 41.4 -.3Machinery, except electrical . . . . 43.4 42. 5 42. 5 43. 4 0 . 9 42.6 42.4 42.6 .2Electrical equipment........................ 41. 1 40.2 40. 6 40. 6 - . 5 0 40. 0 40. 3 40.0 -.3Transportation equipment............... 43.8 41.7 41.3 42. 0 -1.8 . 7 41. 5 41.0 40. 7 -.3Instruments and related products . 41.0 . 40.9 41.3 41.4 . 4 . 1 40.8 40.9 40.9 0Miscellaneous manufacturing. . . . 39.4 38.8 39.4 39.2 -.2 - . 2 38. 6 39. 0 38.9 - . 1
NONDURABLE G O O D S ........................... 39.9 39.7 40. 0 40. 0 . 1 0 39.7 39.8 39.7 - . 1Overtime boars................................. 3. 5 3. 5 3. 5 3. 3 - . 2 -.2 3. 3 3.4 3.2 -.2
Food and kindred products............ 40.7 40. 6 41.0 41.3 . 6 . 3 40. 6 40.9 41.0 . 1Tobacco manufactures..................... 38.8 40. 6 41. 1 39. 4 . 6 -1.7 39.2 40.9 38. 5 -2.4Textile mill products. . . . . . . . . 41. 7 40. 6 40. 9 41. 1 -.6 .2 40. 5 40. 5 40. 7 • .2Apparel and other textile products 3,5.7 35.8 36. 1 36. 1 . 4 0 35.8 35.8 36. 1 .3Paper and allied products............... 43,3 42.8 42.9 43.2 - . 1 . 3 42. 6 42.7 42.8 . 1Printing and publishing.................. 38.2 37.9 38. 1 38. 3 . 1 . 2 37.9 38.0 37.8 -.2Chemicals and allied produers . . . 42.2 41.9 42. 1 42.2 0 . 1 41.9 42.0 41.9 - . 1Petroleum and coal products . . . . 41.9 42. 6 43.2 42. 3 . 4 -.9 42.2 43. 1 42. 6 -.5Rubber and plastics products, nec 41.6 40. 9 41.3 40. 7 -.9 - . 6 40.8 41.2 40.4 -.8Leather and leather products . . . . 37.2 37. 6 38. 0 38.2 1.0 .2 38. 0 37.9 37.5 -.4
TRANSPORTATION AND PUBLICU T IL IT IE S ........................................ 40. 7 40.9 40.8 40. 9 . 2 . 1 40.8 40. 7 40. 7 0
WHOLESALE AND RETAIL TRADE. 35.3 34. 3 34.3 34.8 - . 5 . 5 34. 5 34. 6 34.6 0
WHOLESALE TRADE .............. 40. 1 39. 3 39.4 39.8 - . 3 . 4 39.3 39.4 39.4 0RETAIL T R A D E .................. 33.9 32.8 32. 7 33.3 -.6 .6 33.0 33.0 33. 0 0
FINANCE, INSURANCE, ANDREAL E S T A T E ................................ 37. 1 37.0 37. 0 37. 1 0 . 1 36.9 37. 0 37. 1 . 1
S E R V IC E S ........................................... 34. 0 33.9 33.9 34. 0 0 . 1 34. 0 34. 0 34.0 0
U ata relate to production workers in mining and manufacturing: to construction workers in contract construction: and to nonsupervisory workers in trans|<ortation and public utilities; wholesale and retail trade; finance, iisurance, and real estate; and services. These groups account for approximately four-fifths ol the total employment on private nonagricultural payrolls,
p = preliminary.
Digitized for FRASER http://fraser.stlouisfed.org/ Federal Reserve Bank of St. Louis

Table B-3: Average hourly and weekly earnings of production or nonsupervisory workerson private nonagricultural payrolls, by industry
Average hourly earnings Average weekly earnings
Industry Dec. Oct. Nov. Dec. Change from Dec. Oct. Nov. 1973 P
Dec. 1973 P
Change from
1972 1973 1973 F 1973 p Dec.1972
Nov.1973
1972 1973 Dec.1972
Nov.1973
TOTAL PRIVATE................... $3.74 $3.99 $4.00 $4.01 $0.27 $0. 01 $139.13 $147.63 $148.00 $149.17 $10. 04 $1. 17Seasonally adjusted.................... 3. 75 3.98 3.99 4. 02 .27 .03 138.75 147.26 148. 03 148.74 9.99 .71
MINING.............................................. 4. 55 4.76 4. 84 4.91 . 36 .07 191.10 204. 20 207. 64 213.59 22.49 5.95
CONTRACT CONSTRUCTION----- 6. 32 6. 66 6. 68 6.71 . 39 . 03 222.46 251.08 250. 50 244. 92 22.46 -5.58
MANUFACTURING........................... 3.95 4. 14 4. 16 4.22 .27 . 06 162.74 168.50 170. 14 173.86 11.12 3.72
DURABLE GOOOS • • • ......... 4.21 4. 39 4. 42 4. 49 .28 .07 177.24 181.75 183.43 188.58 11.34 5. 15
Ordnance and accessories............ 4. 18 4.38 4.46 4. 49 . 31 .03 179.32 185.27 188.21 193.52 14.20 5.31Lumber and wood products............ 3.38 3. 67 3. 63 3. 69 . 31 .06 134.52 149.37 146.65 154.24 19. 72 7.59Furniture and f ix tu re s.................. 3. 15 3.34 3.34 3.36 .21 .02 128.52 133.27 133.27 135.41 6. 89 2. 14Stone, clay, and glass products . 4. 02 4.27 4.29 4.29 .27 0 166.83 180. 62 181.47 182.33 15. 50 .86Primary metal in d u strie s ............ 4.81 5. 14 5.22 5.31 . 50 .09 203. 94 216.91 223.94 230. 45 26.51 6.51Fabricated metal products............ 4. 13 4. 32 4. 34 4. 36 .23 . 02 173.87 179.71 181.41 182.68 8.81 1.27Machinery, except electrical . . . 4. 44 4. 63 4. 65 4. 73 .29 .08 192.70 196. 78 197.63 205.28 12.58 7.65Electrical equipment..................... 3.79 3.91 3.93 3.98 . 19 .05 155. 77 157.18 159.56 161.59 5.82 2.03Transportation equipment............ 5.01 5. 14 5. 16 5. 33 . 32 . 17 219.44 214.34 213.11 223.86 4.42 10.75Instruments and related products 3.83 3.93 3.96 4.00 . 17 .04 157.03 160.74 163.55 165. 60 8. 57 2.05Miscellaneous manufacturing. . . 3. 19 3. 31 3.33 3. 35 . 16 .02 125. 69 128.43 131.20 131.32 5. 63 . 12
NONDURABLE GOODS................ 3. 58 3.76 3.78 3.80 .22 . 02 142.84 149.27 151.20 152.00 9. 16 .80
Food and kindred products . . . . 3.72 3.89 3.91 3.95 .23 . 04 151.40 157.93 160.31 163.14 11.74 2.83Tobacco manufactures.................. 3.49 3.73 3.83 3.91 . 42 .08 135.41 151.44 157.41 154.05 18. 64 -3.36Textile mill products..................... 2.83 3.03 3. 05 3. 06 .23 .01 118.01 123.02 124.75 125.77 7.76 1.02Apparel and other textile products 2. 69 2.85 2.86 2.87 . 18 . 01 96. 03 102.03 103.25 103.61 7.58 .35Paper and allied products............ 4.06 4.27 4.29 4. 31 .25 .02 175.80 182.76 184. 04 186. 19 10. 39 2. 15Printing and publishing............... 4. 59 4. 75 4.77 4. 79 .20 . 02 175. 34 180.03 181.74 183.46 8. 12 1.72Chemicals and allied products. . 4. 33 4. 54 4. 56 4. 59 .26 .03 182.73 190.23 191.98 193.70 10.97 1.72Petroleum and coal products . . . 5. 03 5.26 5.29 5.28 .25 -. 01 210. 76 224.08 228. 53 223. 34 12.58 -5. 19Rubber and plastics products, nec 3. 72 3.86 3.90 3.89 . 17 -.01 154.75 157.87 161.07 158.32 3.57 -2.75Leather and leather products . . . 2.74 2. 85 2.87 2.87 . 13 0 101.93 107.16 109.06 109.63 7.70 . 57
TRANSPORTATION AND PUBLIC U T IL IT IE S ...................................... 4.86 5. 18 5. 19 5.21 .35 .02 197.80 211.86 211.75 213.09 15.29 1.34
WHOLESALE AND RETAIL TRADE 3. 07 3.27 3.28 3.28 .21 0 108.37 112. 16 112.50 114.14 5.77 1. 64
WHOLESALE TRADE ........................... 3.99 4. 18 4.20 4.25 .26 .05 160. 00 164.27 165. 48 169. 15 9. 15 3.67RETAIL T R A D E ................................... 2. 75 2.93 2. 94 2.93 . 18 -. 01 93.23 96. 10 96. 14 97.57 4. 34 1.43
FINANCE, INSURANCE, AND134. 68 137.27 6. 68REAL E S T A T E .............................. 3. 52 3. 64 3. 66 3.70 . 18 . 04 130. 59 135. 42 1.85
S E R V IC E S ........................................ 3.27 3. 44 3.45 3.48 .21 .03 111.18 116. 62 116.96 118.32 7. 14 1.36
*Sec footnote I, table B-2. p - preliminary
Digitized for FRASER http://fraser.stlouisfed.org/ Federal Reserve Bank of St. Louis
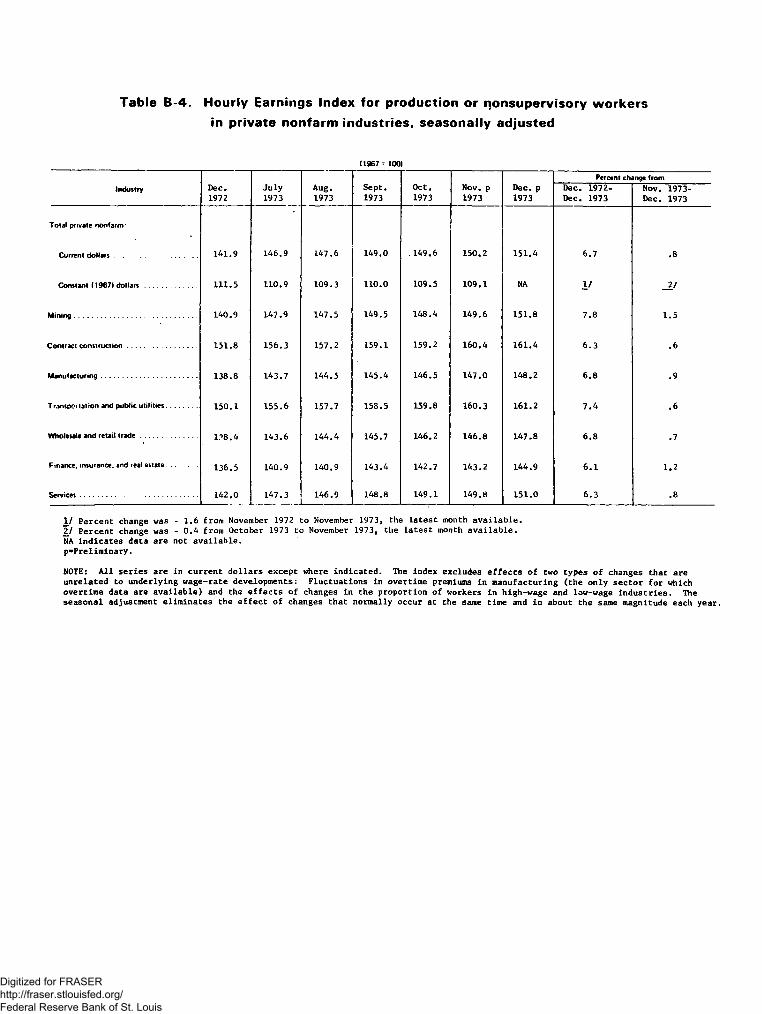
Table B-4. Hourly Earnings Index for production or nonsupervisory workers in private nonfarm industries, seasonally adjusted
(1967 = 100)
Percent change fromIndustry Dec.
1972July1973
Aug.1973
Sept.1973
Oct.1973
Nov. p 1973
Dec. p 1973
Dec. 1972- Dec. 1973
Nov. 1973- Dec. 1973
Total private nonfarnr
141.9 146.9 147.6 149.0 .149.6 150.2 151.4 6.7 .8
Constant (1967) dollars........................... 111.5 110.9 109.3 110.0 109.5 109.1 NA 1/ _2/
Mining............................................................... 140.9 147.9 147.5 149.5 148.4 149.6 151.8 7.8 1.5
Contract construction.................................... 151.8 156.3 157.2 159.1 159.2 160.4 161.4 6.3 .6
Manufacturing.................................................. 138.8 143.7 144.5 145.4 146.5 147.0 148.2 6.8 .9
T^importation and public utilities................ 150.1 155.6 157.7 158.5 159.8 160.3 161.2 7.4 .6
Wholesale and retail trade ............................. 1?8.4 143.6 144.4 145.7 146.2 146.8 147.8 6.8 .7
F inance, insurance, and real estate................ 136.5 140.9 140.9 143.4 142.7 143.2 144.9 6.1 1.2
Services....................... ........................... 142.0 147.3 146.91_____
148.8 149.1 149.8 151.0 6.3 .8
1/ Percent change was - 1.6 from November 1972 to November 1973, the la te s t month a v a ila b le .2/ Percent change was - 0.4 from October 1973 to November 1973, the la te s t month a v a ila b le .NA ind ica tes data are not a va ila b le . p=Prelim inary.
NOTE: A l l s e r ie s are in current d o lla rs except where ind ica ted . The index excludes e f fe c t s o f two types o f changes that areunrelated to underlying wage-rate developments: Fluctuations in overtime premiums in manufacturing (the on ly sector fo r whichovertim e data are a v a ila b le ) and the e f fe c t s o f changes in the proportion o f workers in high-wage and low-wage in d u stries . The seasonal adjustment elim inates the e f fe c t o f changes that normally occur at the same time and in about the same magnitude each year.
Digitized for FRASER http://fraser.stlouisfed.org/ Federal Reserve Bank of St. Louis

LABOR FORCE• EMPLOYMENT, UNEMPLOYMENTHOUSEHOLD DATA - SEASONALLY ADJUSTED
1. LABOR FORCE AND EMPLOYMENTc i v i l i a n la b o r f o r c eTOTAL EMPLOYMENT NONASRJCULTURAL EMPLOYMENT
THOUSANDS95000
90000
85000
80000
75000
70000
6S000
60000
2 . TOTHL EMPLOYMENT______ AOULT MEN............ AOULT WOMEN............ TEENA6ERS
THOUSANDS60000
50000
40000
30000
20000
10000
0
3 . UNEMPLOYMENT______ ALL C IV IL IA N WORKERS______ FU LL-T IM E WORKERS............ MARRIED MEN
THOUSANDS
1964 196S 1966 1967 1968 1969 1970 1971 1972 1973
4 . UNEMPLOYMENT______ AOULT MEN............ AOULT WOMEN............ TEENA6ERS
THOUSANOS
1964 1965 1966 1967 1968 1969 1970 1971 1972 19"3
Digitized for FRASER http://fraser.stlouisfed.org/ Federal Reserve Bank of St. Louis

UNEMPLOYMENT RATESHOUSEHOLD DATA - SEASONALLY ADJUSTED
5 . UNEMPLOYMENT RATES 6♦ UNEMPLOYMENT RATESA L L C IV IL IA N WORKERS S TA T E IN SU REO w KA RRICO KEN
TEENAGERS ADULT WOKEN AOULT KEN
PERCEN T
1964 196S 1966 1961 1966 1969 1910 1911 1916 1916
PERCEN T
1964 196S 1966 1961 .1966 1969 1910 1911 1912 1913
20.0
1 S .0
10,0
$.0
o . q
7 . UNEMPLOYMENT RATES 8 . UNEMPLOYMENT RATES
________ NEGRO ANO OTHER RA CES........... W HITE
PERCEN T
1964 1965 1966 19€*> 1966 1969 1970 1971 1972 1973
________ P A R T - T IK E WORKERSF U L L - T IK E WORKERS
PERCEN T
* State insured unemployment rate pertains to the week including the 12th of the month and represents the insured unemployed under State programs as a percent of average covered employment. The figures are derived from administrative records of unemployment insurance systems.Digitized for FRASER
http://fraser.stlouisfed.org/ Federal Reserve Bank of St. Louis

UNEMPLOYMENTHOUSEHOLD DATA - SEASONALLY ADJUSTED
9 . UNEMPLOYMENT RATES_____ BLUE COLLAR WORKERS........ SERVICE WORKERS____ WHITE COLLAR WORKERS
PERCEN T8.0
7.0
6.0
5.0
4.0
3.0
2.0
1 .01964 1965 1966 1967 1966 1969 1970 1971 1979 1976
11 . AVERAGE DURATION OF UNEMPLOYMENT
WEEKS
1964 196S 1966 1967 1966 1969 1970 1971 1979 1976
10 . UNEMPLOYMENT RATES
________ CONSTRUCTION........... HANUFACTURIN6
PERCEN T 15.0
12.5
10.0
7.5
5.0
2.S
0.01964 196S 1966 1987 1966 1969 1970 1971 1979 1976
-
1■
aH \ j nM/l: 1J \ ,
T ' I 1
tK
V 11r1 i
itt
$t
t\
-
. V v >* \V
> \A s >
i/
Jii
\\ v ■
v y
-
15.0
12.5
10.0
7.5
5.0
2.5
0.0
12 . UNEMPLOYMENT BY REASON________ JOB LO SER S........... REEN TRAN TS_______ HEW ENTRANTS________ JO B LEA V ER S
1967 1966 1969 1970 1971 1979 1976
3000
2500
2000
1500
1000
500
0
Digitized for FRASER http://fraser.stlouisfed.org/ Federal Reserve Bank of St. Louis

NQNAGRICULTURAL EMPLOYMENT ■ AND HOURSESTABLISHMENT DATA - SEASONALLY ADJUSTED
13 . EMPLOYMENT_______ TOTAL NONA6RICULTURAL............ SERVJ CE-PROOUCIN6............ 6000S-PR0DUCIN6_______ MANUFACTURING
THOUSANDS
1964 196S 1966 196? 1968 1969 19?0 1971 1972 19?3
14 . MAN-HOURS_____ TOTAL PR IVATE NONAGRI CULTURAL
PR IVATE SERVICE-PROOUCING GOOOS-PRGOUCING
_______ MANUFACTURING
1964 1965 1966 1967 1968 1969 1970 1971 1972 1973
2250
2000
1*750
1500
1250
1000
750
500
250
15. AVERAGE WEEKLY HOURS
______ MANUFACTURING............ TOTAL PRIVATE
HOURS
1964 196S 1966 1967 1968 1969 1970 1971 1872 1973
16 . AVERAGE WEEKLY OVERTIME HOURS IN MANUFACTURING
HOURS
NOTE: Charts 14 and 15 relate to production or nonsupervisory workers; chart 16 relates to production workers. Data for .the 2 most recent months are preliminary in charts 13-16.Digitized for FRASER
http://fraser.stlouisfed.org/ Federal Reserve Bank of St. Louis