FOR AN URBAN FAMILY OF FOUR PERSONS, 1969-70 Supplement to Bulletin 1570-5 U.S. DEPARTMENT OF LABOR Bureau of Labor Statistics Digitized for FRASER http://fraser.stlouisfed.org/ Federal Reserve Bank of St. Louis

Welcome message from author
This document is posted to help you gain knowledge. Please leave a comment to let me know what you think about it! Share it to your friends and learn new things together.
Transcript
FOR AN URBAN FAMILY OF FOUR PERSONS,
1969-70Supplement to
Bulletin 1570-5
U.S. DEPARTMENT OF LABOR Bureau of Labor StatisticsDigitized for FRASER
http://fraser.stlouisfed.org/ Federal Reserve Bank of St. Louis

U.S. DEPARTMENT OF LABOR J. D. Hodgson, Secretary
BUREAU OF LABOR STATISTICS Geoffrey H. Moore, Commissioner
1972
Digitized for FRASER http://fraser.stlouisfed.org/ Federal Reserve Bank of St. Louis

P re fa c e
This report is a supplement to BLS Bulletin 1570-5: Three Standards o f Living for an Urban Family o f Four Persons, Spring 1967. The basic bulletin describes the historical background of the family budget program, discusses the concepts and procedures of the current budgets, and documents the data sources and estimating methods for each of the budget components. It also lists the average annual quantities of items to determine the costs of the three budget levels (appendix A); describes the specifications used to collect or estimate prices for the lower and higher budgets, which differ from those used in the intermediate budget (appendix B); shows the population weights for combining individual metropolitan area and nonmetropolitan regional costs to U.S. urban averages (appendix C); and provides a list of the Bureau’s previous budgets and related references (appendix D). Specifications for the intermediate budget were published in Bulletin 1570-3.
The complete list of bulletins in the current family budget series is as follows:Bulletin 1570-1 gives the autumn 1966 costs of the City Worker's Family Budget for
a Moderate Living Standard and describes the change in this budget over the last two decades (issued October 1967).
Bulletin 1570-2 describes the Revised Equivalence Scale for estimating budget posts for families of different size, age, and type (issued as preliminary October 1967 and final November 1968).
Bulletin 1570-3 reports on the autumn 1966 Pricing Procedures, Specifications, and Average Prices used for the intermediate budget (issued August 1968).
Bulletin 1570-4 gives the autumn 1966 costs of the Retired Couple's Budget for a Moderate Living Standard (issued June 1968).
Bulletin 1570-5 gives the spring 1967 estimates for Three Standards o f Living for an Urban Family o f Four Persons (issued March 1969).
Bulletin 1570-6 gives the spring 1967 estimates for Three Budgets for a Retired Couple in Urban Areas o f the United States (issued May 1970).
Bulletin 1570-6. A supplement gives the spring 1969 and spring 1970 estimates for Three Budgets for a Retired Couple in Urban Areas o f the United States (issued November 1971).
Digitized for FRASER http://fraser.stlouisfed.org/ Federal Reserve Bank of St. Louis

ContentsPage
Chapter I. Costs of three budget levels ...................................................................................... 1
Chapter II. Comparative cost in d ex es ....................................................................................................... 5
Chapter III. Income and budget c o s t s ...................................................................................................................... 7
Appendix con ten ts ........................................................................................................................................................... 9
iiDigitized for FRASER http://fraser.stlouisfed.org/ Federal Reserve Bank of St. Louis
C hapter I. Costs of T h re e Budget Levels
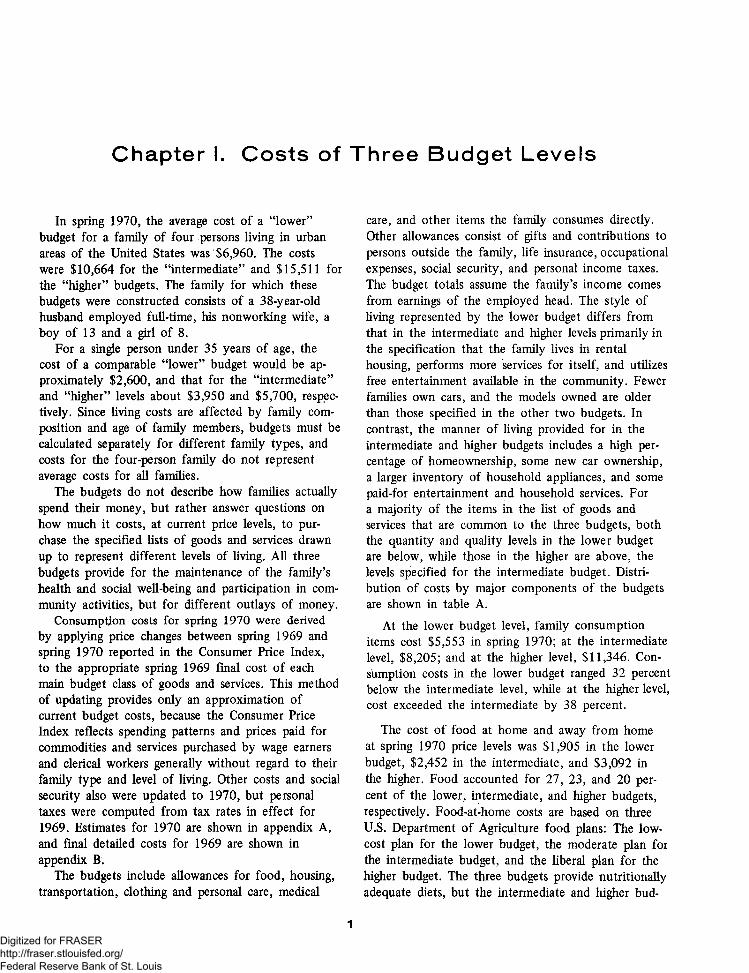
In spring 1970, the average cost of a “lower” budget for a family of four persons living in urban areas of the United States was $6,960. The costs were $10,664 for the “intermediate” and $15,511 for the “higher” budgets. The family for which these budgets were constructed consists of a 38-year-old husband employed full-time, his nonworking wife, a boy of 13 and a girl of 8.
For a single person under 35 years of age, the cost of a comparable “lower” budget would be approximately $2,600, and that for the “intermediate” and “higher” levels about $3,950 and $5,700, respectively. Since living costs are affected by family composition and age of family members, budgets must be calculated separately for different family types, and costs for the four-person family do not represent average costs for all families.
The budgets do not describe how families actually spend their money, but rather answer questions on how much it costs, at current price levels, to purchase the specified lists of goods and services drawn up to represent different levels of living. All three budgets provide for the maintenance of the family’s health and social well-being and participation in community activities, but for different outlays of money.
Consumption costs for spring 1970 were derived by applying price changes between spring 1969 and spring 1970 reported in the Consumer Price Index, to the appropriate spring 1969 final cost of each main budget class of goods and services. This method of updating provides only an approximation of current budget costs, because the Consumer Price Index reflects spending patterns and prices paid for commodities and services purchased by wage earners and clerical workers generally without regard to their family type and level of living. Other costs and social security also were updated to 1970, but personal taxes were computed from tax rates in effect for 1969. Estimates for 1970 are shown in appendix A, and final detailed costs for 1969 are shown in appendix B.
The budgets include allowances for food, housing, transportation, clothing and personal care, medical
care, and other items the family consumes directly. Other allowances consist of gifts and contributions to persons outside the family, life insurance, occupational expenses, social security, and personal income taxes. The budget totals assume the family’s income comes from earnings of the employed head. The style of living represented by the lower budget differs from that in the intermediate and higher levels primarily in the specification that the family lives in rental housing, performs more services for itself, and utilizes free entertainment available in the community. Fewer families own cars, and the models owned are older than those specified in the other two budgets. In contrast, the manner of living provided for in the intermediate and higher budgets includes a high percentage of homeownership, some new car ownership, a larger inventory of household appliances, and some paid-for entertainment and household services. For a majority of the items in the list of goods and services that are common to the three budgets, both the quantity and quality levels in the lower budget are below, while those in the higher are above, the levels specified for the intermediate budget. Distribution of costs by major components of the budgets are shown in table A.
At the lower budget level, family consumption items cost $5,553 in spring 1970; at the intermediate level, $8,205; and at the higher level, $11,346. Consumption costs in the lower budget ranged 32 percent below the intermediate level, while at the higher level, cost exceeded the intermediate by 38 percent.
The cost of food at home and away from home at spring 1970 price levels was $1,905 in the lower budget, $2,452 in the intermediate, and $3,092 in the higher. Food accounted for 27, 23, and 20 percent of the lower, intermediate, and higher budgets, respectively. Food-at-home costs are based on three U.S. Department of Agriculture food plans: The low- cost plan for the lower budget, the moderate plan for the intermediate budget, and the liberal plan for the higher budget. The three budgets provide nutritionally adequate diets, but the intermediate and higher bud-
1Digitized for FRASER http://fraser.stlouisfed.org/ Federal Reserve Bank of St. Louis

Table A. Summary of budgets for a 4-person family at 3 levels of living, spring 1970
Costs Percent distributionItem Lower
budgetIntermediate
budgetHigherbudget
Lowerbudget
Intermediatebudget
Higherbudget
Total budget........................ $6,960 $10,664 $15,511 100.0 100.0 100.0
Total family consumption . . . $5,553 $8,205 $11,346 79.8 76.9 73.2Food...................................... 1,905 2,452 3,092 27.3 22.9 19.9Housing.................................. 1,429 2,501 3,772 20.5 23.4 24.4Transportation................... 505 912 1,183 7.3 8.6 7.6Clothing and personal
care...................................... 807 1,137 1,655 11.6 10.7 10.7Medical ca re ........................ 562 564 588 8.1 5.3 3.8Other family
consumptipn..................... 345 639 1,056 5.0 6.0 6 .8
Other costs................................. 343 539 903 4.9 5.1 5.8
Taxes ........................................... 1,064 1,920 3,262 15.3 18.0 21.0Social security and
disability payments.......... 345 387 387 5.0 3.6 2.5Personal income taxes. . . . 719 1,533 2,875 10.3 14.4 18.5
gets allow a greater variety and more expensive choices than the lower budget.
Variations in total food costs stem also from differences in the number of meals eaten away from home in the three budgets, and in their average price levels. Restaurant meals constitute 20 percent of food costs in the higher budget, but only 16 and 13 percent in the intermediate and lower budgets, respectively.
Whereas the relative importance of housing was second to food in the lower budget, 20 percent, it was highest in the intermediate and higher budgets— 23 and 24 percent, respectively. Outlays for housing, which includes shelter, housefurnishings, and household operations, were $1,429 in the lower budget and $2,501 and $3,772 in the intermediate and higher budgets, respectively. Inter-level differences in housing costs are affected by the proportion of renter and homeowner families and the household equipment specified for each level.
All families at the lower budget level were assumed to live in rented housing. Only 25 percent at the intermediate and 15 percent at the higher level were renters. Rental shelter costs, including contract rent plus estimated costs of fuel and utilities where these are not part of the rent, and insurance on household contents, were calculated from the low, middle, and high thirds of the contract rent distribution for five- room units which met the standards for adequacy.The majority of families at the intermediate and higher levels were assumed to be homeowners, and their shelter included average annual mortgage interest and principal payments on a home purchased 7 years
ago, property taxes, homeowner insurance, fuel, utilities, and repair and maintenance charges. Shelter costs in the higher budget reflected quality differences in the home owned, higher utility consumption for the operation of air conditioning and other major appliances, and a more generous allowance for repairs and maintenance.
Transportation costs for all families ranged from $505 at the lower budget level to $912 and $1,183, respectively, at the intermediate and higher levels. The variation in costs mainly reflects differences in the proportion of families owning cars at each budget level in each area. Total transportation is a weighted cost for automobile owners and nonowners, and budgets with lower proportions of ownership are less costly. Variations in the weights for the mode of transportation are related to location, size, and characteristics of the community, as well as to the general concept of the budget level.
For the automobile owner, the intermediate budget provides for the replacement of his car every 4 years with a 2-year-old car, and allowances for operating the car, insurance, and some public transportation use. The higher budget has the same provisions as the intermediate budget for 40 percent of the families, but for the remaining 60 percent, a 4-year-old car is traded in for a new car. Compared with the other two budgets, the lower budget provides for the purchase of a 6-year-old car every 4 years, fewer repairs, and less mileage allowance. The mileage allowance in 8,053 in the lower budget and 9,465 in both the intermediate and higher budgets.
2Digitized for FRASER http://fraser.stlouisfed.org/ Federal Reserve Bank of St. Louis
Total outlays for clothing and personal care averaged $807, $1,137 and $1,655 in the lower, intermediate, and higher budgets, respectively, buf these costs represented a constant share of the total budget cost at each level. Clothing costs represent replacements to the clothing inventories which an established family is assumed to have, clothing materials, and services. Variations in costs stem primarily from differences in the qualities of items, as reflected in the average price levels used for each budget, and to a lesser extent from adjustment of individual item replacement rates. Personal care costs were higher in the intermediate and higher budgets mainly because of increased allowances for beauty shop services.
Total medical care costs were almost identical in the three budgets, because each budget provides the family with a comprehensive health insurance policy and an allowance for out-of-pocket expenses for medical care not covered by insurance, dental and eye care, and prescriptions. The higher budget also includes a supplementary major medical insurance contract not provided in the other two budgets.
Other consumption costs, including reading, recreation, tobacco, alcohol, and miscellaneous expensesranged from $345 in the lower budget to $1,056 in *the higher budget. The lower budget was almost one- half below and the higher two-thirds above the intermediate budget cost of $639.
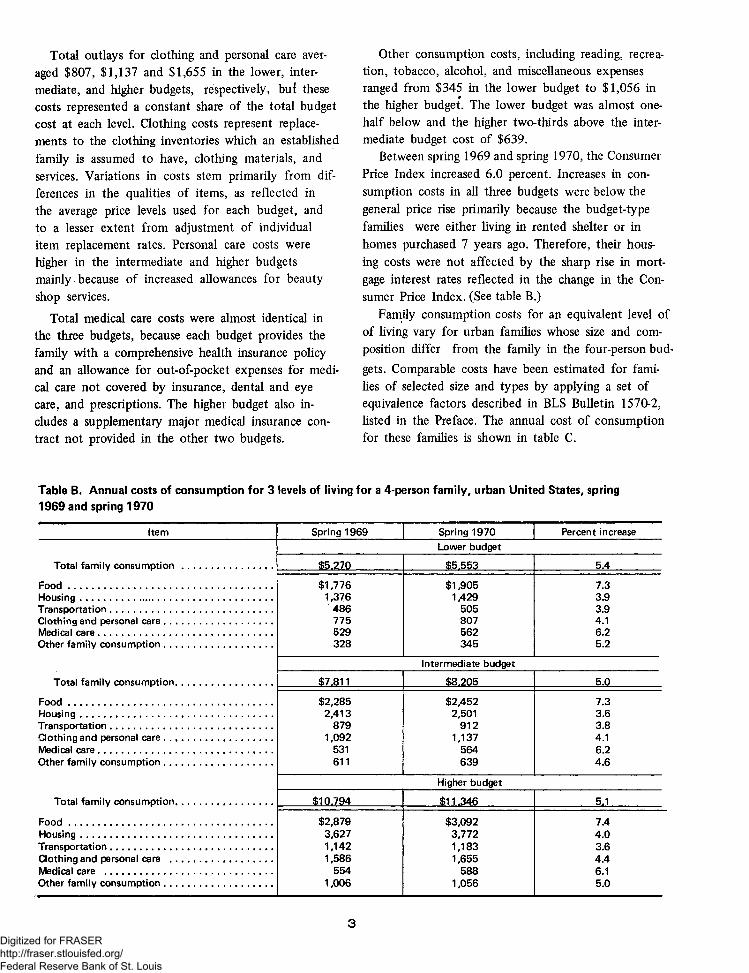
Between spring 1969 and spring 1970, the Consumer Price Index increased 6.0 percent. Increases in consumption costs in all three budgets were below the general price rise primarily because the budget-type families were either living in rented shelter or in homes purchased 7 years ago. Therefore, their housing costs were not affected by the sharp rise in mortgage interest rates reflected in the change in the Consumer Price Index. (See table B.)
Family consumption costs for an equivalent level of of living vary for urban families whose size and composition differ from the family in the four-person budgets. Comparable costs have been estimated for families of selected size and types by applying a set of equivalence factors described in BLS Bulletin 1570-2, listed in the Preface. The annual cost of consumption for these families is shown in table C.
Table B. Annual costs of consumption for 3 levels of living for a 4-person family, urban United States, spring 1969 and spring 1970
Item Spring 1969 Spring 1970 Percent increaseLower budget
Total family consum ption.................................... $5,270 $5,553 5.4
F o o d ............ .................................................................... $1,776 1,376
486
$1,905 1,429
505
7.3Housing........................................... ................................ 3.9Transportation.................................................. ............. 3.9Clothing and personal care........................................... 775 807 4.1Medical care..................................................................... 529 562 6.2Other family consumption........................................... 328 345 5.2
Intermediate budget
Total family consumption...................................... $7.811 $8,205 5.0
F o o d ................................................................................. $2,2852,413
879
$2,4522,501
912
7.3Housing................... ........................................................ 3.6Transportation ........................................ ....................... 3.8Clothing and personal care........................................... 1,092
5311,137
5644.1
Medical care..................................................................... 6.2Other family consumption........................................... 611 639 4.6
Higher budget
Total family consumption...................................... $10,794 $11.346 5.1
F o o d ................................................................................ $2,8793,6271,1421,586
554
$3,0923,7721,1831,655
588
7.4Housing............................................................................ 4.0Transportation................................................................ 3.6Clothing and personal care ........................................ 4.4Medical care .................................................................. 6.1Other family consumption ................... ....................... 1,006 1,056 5.0
3Digitized for FRASER http://fraser.stlouisfed.org/ Federal Reserve Bank of St. Louis
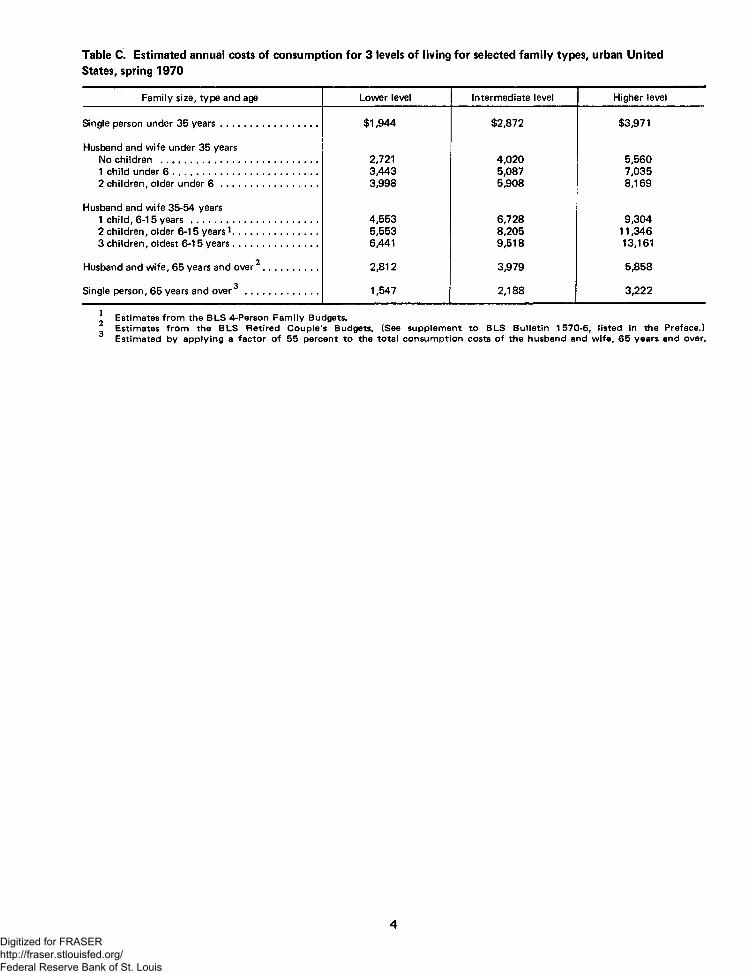
Table C. Estimated annual costs of consumption for 3 levels of living for selected family types, urban United States, spring 1970
Family size, type and age Lower level Intermediate level Higher level
Single person under 35 years...................................... $1,944 $2,872 $3,971
Husband and wife under 35 yearsNo children ................................... .......................... 2,721 4,020 5,5601 child under 6 ......................................................... 3,443 5,087 7,0352 children, older under 6 ...................................... 3,998 5,908 8,169
Husband and wife 35-54 years1 child, 6-15 y e a rs .................................................. 4,553 6,728 9,3042 children, older 6-15 years1................................. 5,553 8,205 11,3463 children, oldest 6-15 years . ............................... 6,441 9,518 13,161
2Husband and wife, 65 years and over ..................... 2,812 3,979 5,858
3Single person, 65 years and over ............................. 1,547 2,188 3,222
Estimates from the BLS 4-Person Family Budgets.Estimates from the BLS Retired Couple's Budgets. (See supplement to BLS Bulletin 1570-6, listed in the Preface.) Estimated by applying a factor of 55 percent to the total consumption costs of the husband and wife, 65 years and over.
4Digitized for FRASER http://fraser.stlouisfed.org/ Federal Reserve Bank of St. Louis
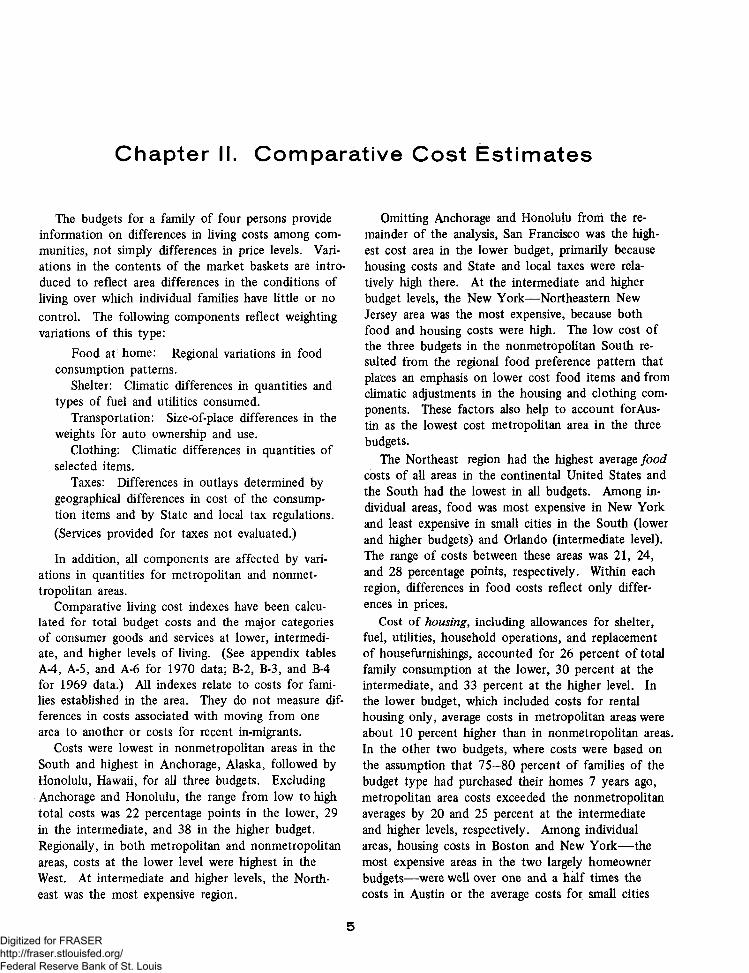
C hapte r II. Com parative Cost Estim ates
The budgets for a family of four persons provide information on differences in living costs among communities, not simply differences in price levels. Variations in the contents of the market baskets are introduced to reflect area differences in the conditions of living over which individual families have little or no control. The following components reflect weighting variations of this type:
Food at home: Regional variations in foodconsumption patterns.
Shelter: Climatic differences in quantities and types of fuel and utilities consumed.
Transportation: Size-of-place differences in the weights for auto ownership and use.
Clothing: Climatic differences in quantities of selected items.
Taxes: Differences in outlays determined by geographical differences in cost of the consumption items and by State and local tax regulations. (Services provided for taxes not evaluated.)
In addition, all components are affected by variations in quantities for metropolitan and nonmet- tropolitan areas.
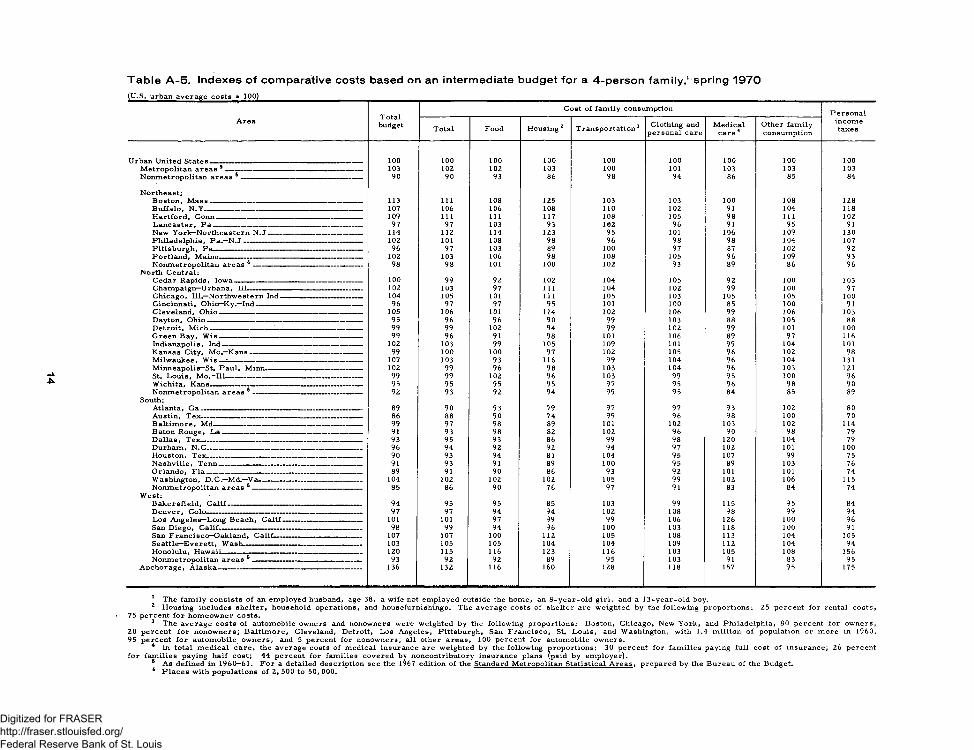
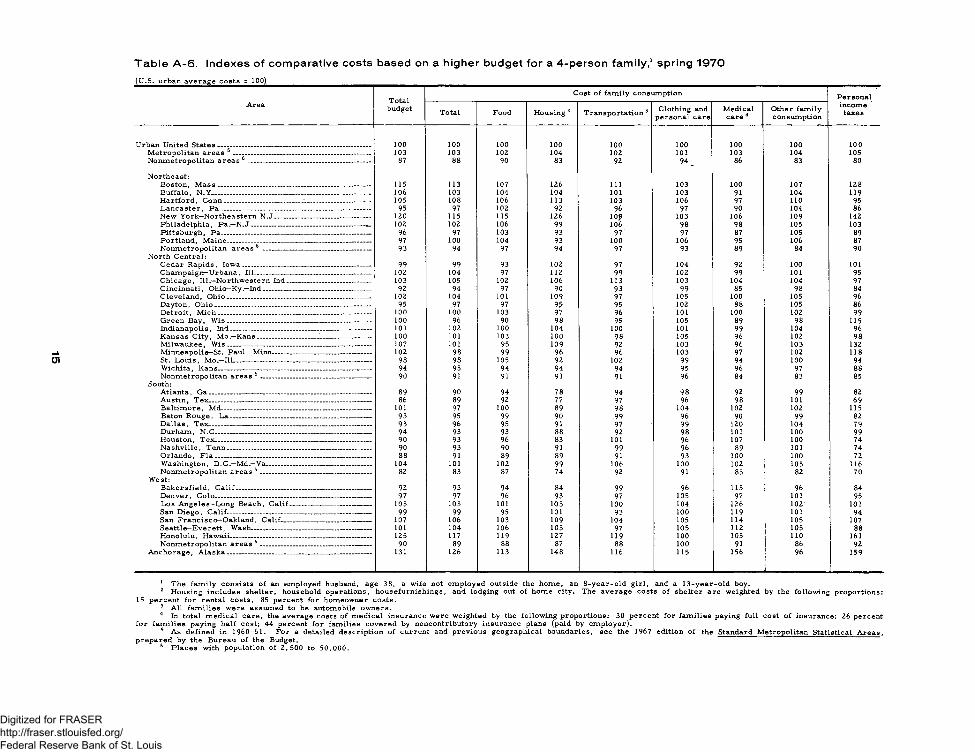
Comparative living cost indexes have been calculated for total budget costs and the major categories of consumer goods and services at lower, intermediate, and higher levels of living. (See appendix tables A-4, A-5, and A-6 for 1970 data; B-2, B-3, and B-4 for 1969 data.) All indexes relate to costs for families established in the area. They do not measure differences in costs associated with moving from one area to another or costs for recent in-migrants.
Costs were lowest in nonmetropolitan areas in the South and highest in Anchorage, Alaska, followed by Honolulu, Hawaii, for all three budgets. Excluding Anchorage and Honolulu, the range from low to high total costs was 22 percentage points in the lower, 29 in the intermediate, and 38 in the higher budget. Regionally, in both metropolitan and nonmetropolitan areas, costs at the lower level were highest in the West. At intermediate and higher levels, the Northeast was the most expensive region.
Omitting Anchorage and Honolulu from the remainder of the analysis, San Francisco was the highest cost area in the lower budget, primarily because housing costs and State and local taxes were relatively high there. At the intermediate and higher budget levels, the New York— Northeastern New Jersey area was the most expensive, because both food and housing costs were high. The low cost of the three budgets in the nonmetropolitan South resulted from the regional food preference pattern that places an emphasis on lower cost food items and from climatic adjustments in the housing and clothing components. These factors also help to account forAus- tin as the lowest cost metropolitan area in the three budgets.
The Northeast region had the highest average food costs of all areas in the continental United States and the South had the lowest in all budgets. Among individual areas, food was most expensive in New York and least expensive in small cities in the South (lower and higher budgets) and Orlando (intermediate level). The range of costs between these areas was 21, 24, and 28 percentage points, respectively. Within each region, differences in food costs reflect only differences in prices.
Cost of housing, including allowances for shelter, fuel, utilities, household operations, and replacement of housefurnishings, accounted for 26 percent of total family consumption at the lower, 30 percent at the intermediate, and 33 percent at the higher level. In the lower budget, which included costs for rental housing only, average costs in metropolitan areas were about 10 percent higher than in nonmetropolitan areas. In the other two budgets, where costs were based on the assumption that 75-80 percent of families of the budget type had purchased their homes 7 years ago, metropolitan area costs exceeded the nonmetropolitan averages by 20 and 25 percent at the intermediate and higher levels, respectively. Among individual areas, housing costs in Boston and New York— the most expensive areas in the two largely homeowner budgets— were well over one and a half times the costs in Austin or the average costs for small cities
5Digitized for FRASER http://fraser.stlouisfed.org/ Federal Reserve Bank of St. Louis

in the South. Fuel requirements and property taxes contributed substantially to the level of costs in the northeastern cities.
The costs of transportation were affected by the specified patterns of automobile ownership within each area, as well as by price levels. For example, in the lower budget, the average metropolitan area allowance for transportation ($481) was about 20 percent below the allowance for nonmetropolitan areas ($610). At this budget level, it was assumed that only half to two-thirds of the families living in the larger cities were auto owners, while the nonmetropolitan budget included a car for all families, because public transportation facilities generally are not available in these areas. At the intermediate level, auto ownership was specified for 80 to 95 percent of families in metropolitan areas, and, as a result, average costs were only 2 percent below those in nonmetropolitan areas. In the higher budget, where ownership of an automobile was specified for all families, metropolitari costs were 10 percent higher than in nonmetropolitan areas, even though it was assumed that families in smaller areas drove more miles than those in large cities and hence had higher operating costs. The greater expense in metropolitan areas results from relatively higher average price levels.
Clothing costs are affected by variation in the kinds and quantities of clothing required by the climate as well as by differences in price. On the other hand, differences in personal care costs among areas are due solely to price differences. The cities in which the clothing and personal care components combined were most expensive were Seattle in the lower and intermediate budgets and Hartford in the higher budget'. The higher cost in Seattle was primarily due to high costs of personal care services,
and, in Hartford, to a combination of colder climate and relatively high clothing prices. Costs were lowest for the three clothing budgets in small cities in the South, where higher average temperatures make heavy clothing unnecessary.
Area differences in the costs of food away from home, housefurnishings and household operations, personal care, reading, recreation, and alcohol result from quantity differences between metropolitan and nonmetropolitan areas, as well as from differences in price levels. For example, recreation in the higher budget costs more in metropolitan than in nonmetropolitan areas because, in addition to price differences, the metropolitan budget included more trips to the movies, and sports events. Reading and recreation costs in nonmetropolitan areas averaged about 70 percent of the U.S. urban average cost at the lower level and 80 percent at the other two levels. Among metropolitan areas, area differences in the cost of these components result wholly from differences in average prices.
Medical care costs also varied from place to place as a result of differences in price levels. The content of this component was essentially the same in the lower and intermediate budgets and differed at the higher level only by the inclusion of a major medical contract. Costs were highest in the Los Angeles area, where they were 26 percent above the U.S. average cost of approximately $560 for the lower and intermediate budgets and $585 for the higher. Medical care was least expensive in small cities in the South— about 17 percent below the U.S. average costs. The range of medical care costs resulting from price differences was $245 for the lower and intermediate budgets and $253 for the higher, or about 43 percentage points at each budget level.
6Digitized for FRASER http://fraser.stlouisfed.org/ Federal Reserve Bank of St. Louis

C hapter III. B udget Costs in Relation to Incom e
How did costs of the three budgets for this very precisely defined family of four persons compare with the actual average income of such families in 1969? Based on Bureau of the Census Surveys, the average mean income of U.S. families headed by a man 35—44 years old, who was employed full time and had a nonworking wife, was $12,856 in 1969 and $13,730 in 1970. The cost of the lower budget was approximately 50 percent, and that of the intermediate a little more than 20 percent, below the average income for this family type, while the cost of the higher budget was about 13 percent above this average income level. The census estimates of income are for a group of about 454 million families very similar to, but not identical with, the budget type family, because the census data do not specify the numbers or ages of children in the family. Also, the census averages are for the total United States, whereas the budget costs are averages for urban areas. However, these data are the only current estimates of income with which the costs of the four-person family budget can be compared.1
The Bureau of the Census survey data also indicate that, although inflationary pressures raised the cost of the budgets from their initial pricing date in 1967, this rise over the 3-year period from 1967 to 1970 was considerably less than the increase in average income for families generally similar to the budget-type family. In the single year from 1969 to 1970, however, these budget costs and incomes increased at about the same rate. The comparisons are as follows:
1 In the most recent BLS Survey of Consumer Expenditures, families of the budget type reported an average mean income of $9,095 in 1960-61. In BLS Bulletin 1570-5, p. 39, estimates of the 1966 income of this family were based on changes between 1960-61 and 1966 in median money income of nonfarm families classified by seven single characteristics of families. Applying the trends in these census data, in which the increases ranged from 25 to 31 percent, to the 1960-61 average income of $9,095 for the budget family suggested that their income had risen to a level between $11,000 and $12,000 by 1966. Based on this same technique, except for substituting trends for all families rather than nonfarm families, the estimated average income level of budget-type families was $14,000 to $15,000 in 1969.
Percent change
1967- 1969-1967 1969 1970 70 70
BLS 4-personbudget costs:
Lower............ . $5,915 $6,544 $6,960 17.7 6.4Intermediate. . 9,076 10,064 10,664 17.5 6.0Higher ..........
Census mean. 13,050 14,571 15,511 18.9 6.5
income (family with male head 35—44, employed fulltime, with nonworking wife) ................. 10,939 12,856 13,730 25.5 6.8
According to the Census Current Population Reports (Series P-60, No. 75), there were about 5Vi million families with a male head 35-44 years old (work status not specified) and. wife not in the paid labor force in 1969 and 1970. About 16 percent of such families had incomes below the lower budget level, and 84 percent had incomes above it. The income of about three-fourths of the families fell short of the higher budget, and about one-fourth exceeded it. The income size distribution of these families, compared with BLS cost levels, is shown in the following tabulation:
Percent of NumberIncome level families (0 0 0 's)
Below lower budget ($6,543 orless).................................................... . 16 887
Between lower and intermediatebudgets ($6,544-$10 ,0 6 4 ) ..............
Between intermediate and higher28 1,552
budgets (10,064-$14 ,5 7 1 ) ..............Above higher budget ($14,572
30 1,662
or more)............................................. 26 1,441
Total Families .............................. 100 5,542
The total costs of the budgets should not be compared with general levels of industrial wages and salaries, or with average earnings in a particular industry or occupation. Such averages relate to all workers in
7Digitized for FRASER http://fraser.stlouisfed.org/ Federal Reserve Bank of St. Louis
the industry, including the young and inexperienced, whereas the husband in the BLS budgets is considered to be an experienced worker.
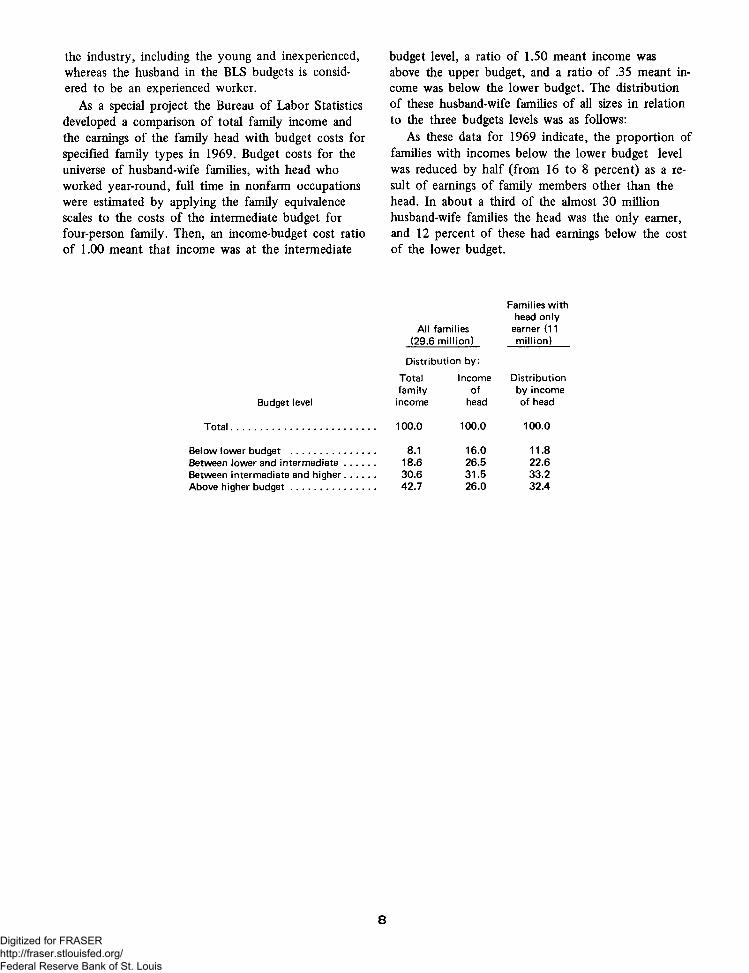
As a special project the Bureau of Labor Statistics developed a comparison of total family income and the earnings of the family head with budget costs for specified family types in 1969. Budget costs for the universe of husband-wife families, with head who worked year-round, full time in nonfarm occupations were estimated by applying the family equivalence scales to the costs of the intermediate budget for four-person family. Then, an income-budget cost ratio of 1.00 meant that income was at the intermediate
Budget level
Total...........................................
Below lower budget ...................Between lower and intermediate Between intermediate and higher Above higher budget...................
budget level, a ratio of 1.50 meant income was above the upper budget, and a ratio of .35 meant income was below the lower budget. The distribution of these husband-wife families of all sizes in relation to the three budgets levels was as follows:
As these data for 1969 indicate, the proportion of families with incomes below the lower budget level was reduced by half (from 16 to 8 percent) as a result of earnings of family members other than the head. In about a third of the almost 30 million husband-wife families the head was the only earner, and 12 percent of these had earnings below the cost of the lower budget.
Families with head only
All families earner (11(29.6 million) million)
Distribution by:
Total Income Distributionfamily of by incomeincome head of head
100.0 100.0 100.0
8.1 16.0 11.818.6 26.5 22.630.6 31.5 33.242.7 26.0 32.4
8Digitized for FRASER http://fraser.stlouisfed.org/ Federal Reserve Bank of St. Louis

A ppend ix contents
Page
Appendix A. Budget costs and indexes at three levels, spring 1970..................................................................... 10Tables:
A-l. Annual costs of a lower budget for a 4-person family, spring 1970 10A-2. Annual costs of an intermediate budget for a 4-person family, spring 1970 ................................ 11A-3. Annual costs of a higher budget for a 4-person family, spring 1970 ............................................ 12A-4. Indexes of comparative costs based on a lower budget for a 4-person family, spring 1970 . . . 13A-5. Indexes of comparative costs based on an intermediate budget for a 4-person family,
spring 1970 ............................................................................................................................................ 14A-6. Indexes of comparative costs based on a higher budget for a 4-person family, spring 1970. . . 15
Appendix B. Budget costs and indexes at three levels, spring 1969 ................................................................... 16Tables:
B-l. Annual costs of budgets at 3 levels, for a 4-person family, urban United States,39 metropolitan areas, 4 nonmetropolitan regions, and Anchorage Alaska,spring 1969 ............................................................................................................................................ 16
B-2. Indexes of comparative costs based on a lower budget for a 4-person family, spring 1969 . . . 28B-3. Indexes of comparative costs based on an intermediate budget for a 4-person family,
spring 1969............................................................................................................................................... 29B-4. Indexes of comparative costs based on a higher budget for a 4-person family, spring 1969 . . . 30
9Digitized for FRASER http://fraser.stlouisfed.org/ Federal Reserve Bank of St. Louis
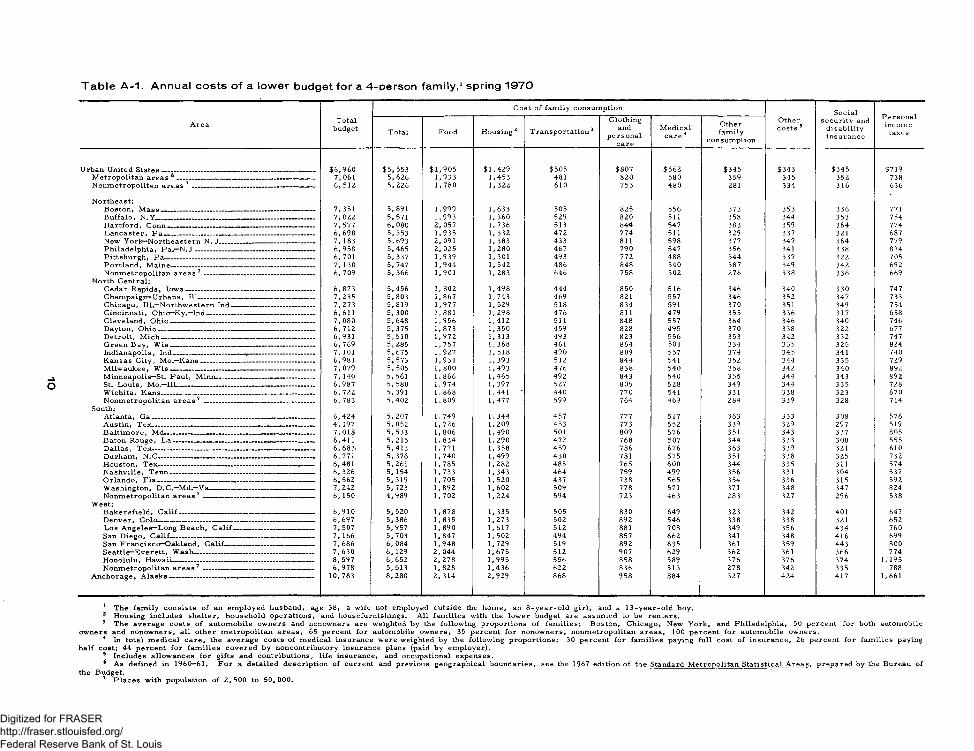
T a b le A -1 . A n n u a l c o s ts o f a lo w e r b ud get fo r a 4 -o e rs o n fa m ily ,1 spring 1 9 7 0
A r e a T o t a l b u d g e t
C o s t o f f a m i l y c o n s u m p t i o n
O t h e r c o s t s 1 2 3 4 5
S o c i a ls e c u r i t y a n d
d i s a b i l i t y i n s u r a n c e
P e r s o n a li n c o m e
t a x e sT o t a l F o o d H o u s i n g 2 T r a n s p o r t a t i o n 3
C l o t h i n ga n d
p e r s o n a lc a r e
M e d i c a l c a r e 4
O t h e rf a m i l y
c o n s u m p t i o n
U r b a n U n i t e d S t a t e s ___________________________ _________________ $ 6 , 9 6 0 $ 5 , 5 5 3 $ 1 , 9 0 5 $ 1 , 4 2 9 $ 5 0 5 $ 8 0 7 $ 5 6 2 $ 3 4 5 $ 3 4 3 $ 3 4 5 $7 19M e t r o p o l i t a n a r e a s 6 - __________ _ — ___ __________________ 7, 061 5, 626 1 , 9 3 3 1 , 4 5 3 481 8 2 0 580 359 345 352 738N o n m e t r o p o l i t a n a r e a s 7 ______________________ ____________ 6, 512 5 , 2 2 6 1 , 7 8 0 1, 322 61 0 753 4 8 0 281 334 316 636
N o r t h e a s t :B o s t o n , M a s s _______________________________ ____________ 7, 351 5, 891 1 , 9 9 9 1 , 6 3 3 505 82 5 556 373 353 336 771B u f f a l o , N . Y _________________________ ____________________ 7, 022 5, 571 1 , 9 9 3 1, 360 529 8 2 0 511 358 34 4 353 754H a r t f o r d , C o n n _______ _____ __________ _________ — 7, 577 6, 080 2, 057 1 , 7 3 6 513 84 4 547 383 359 36 4 774L a n c a s t e r , P a _____________________________________________ 6 , 6 9 8 5, 353 1 , 9 3 5 1, 332 4 7 2 77 4 511 329 337 321 687N e w Y o r k - N o r t h e a s t e r n N . J _____________________________ 7, 183 5 , 6 9 3 2, 091 1, 383 43 3 811 598 377 347 36 4 779P h i l a d e l p h i a , P a - N . J . . . ................................................................... 6 , 9 5 8 5 , 4 6 5 2, 025 1 , 2 8 0 46 7 79 0 547 356 341 338 814P i t t s b u r g h , P a --------------------------------------------------------------------- 6 , 701 5, 337 1 , 9 3 9 1, 301 49 3 77 2 4 8 8 34 4 337 322 705P o r t l a n d , M a i n e ___________________________________________ 7, 130 5, 747 1 , 9 4 4 1, 542 4 86 84 8 540 387 349 342 692N o n m e t r o p o l i t a n a r e a s 7 -------------------------------------------------- 6, 709 5, 366 1 , 9 0 1 1, 283 646 75 8 502 27 6 338 336 669
N o r t h C e n t r a l :C e d a r R a p i d s , I o w a ----------------------------------------------------------- 6 , 873 5 , 4 5 6 1 , 8 0 2 1 , 4 9 8 4 4 4 8 50 516 346 34 0 33 0 747C h a m p a i g n —U r b a n a , 11]__________ _______ ________ 7, 235 5, 803 1 , 8 6 7 1 , 7 4 3 469 821 557 346 352 347 733C h i c a g o , 111.—N o r t h w e s t e r n I n d _________________________ 7, 273 5 , 8 1 9 1 , 9 7 7 1, 529 518 8 34 591 370 351 349 7 54C i n c i n n a t i , O h i c r - K y .—I n d ________________________________ 6 , 6 1 1 5, 300 1 , 8 8 1 1 , 2 9 8 47 6 811 47 9 355 33 6 31 7 658C l e v e l a n d , O h i o ------------------------------------------------------------------ 7 , 0 8 0 5, 648 1 , 9 5 6 1 , 4 1 2 511 8 48 557 364 346 34 0 746D a y t o n , O h i o ______ _______________________________________ 6 , 7 1 2 5, 375 1 , 8 7 3 1 , 3 5 0 459 82 8 4 95 370 338 32 2 677D e t r o i t , M i c h ____________________________ ________ _____ 6 , 9 3 1 5, 510 1 , 9 7 2 1 , 3 1 3 4 93 823 556 353 342 332 747G r e e n B a y , W i s ------------------------------------------------------------------ 6 , 7 6 9 5, 285 1 , 7 5 7 1 , 3 6 8 461 8 64 501 33 4 335 325 824I n d i a n a p o l i s , I n d __________________________________________ 7, 101 5, 675 1 , 9 2 7 1, 518 4 9 0 809 557 37 4 345 341 740K a n s a s C i t y , M o . —K a n s __________________________________ 6 , 9 8 1 5, 573 1 , 9 3 1 1 , 3 9 3 512 8 4 4 541 35 2 34 4 335 729M i l w a u k e e , W i s ___________________________________________ 7, 079 5, 505 1 , 8 0 0 1 , 4 9 3 4 76 83 8 540 358 342 34 0 892M i n n e a p o l i s —St. P a u l , M i n n --------- -------------------------------- 7, 140 5, 561 1 , 8 6 6 1 , 4 6 5 4 92 843 54 0 355 344 343 892St . L o u i s , M o . —I l l --------------------------------------------------------------- 6 , 9 8 7 5, 580 1 , 9 7 4 1, 397 527 805 528 349 34 4 335 728W i c h i t a , K a n s ---------------------------------------------------------------------- 6 , 722 5, 391 1 , 8 6 8 1 , 4 4 1 ‘ 4 4 0 7 70 541 331 338 323 670N o n m e t r o p o l i t a n a r e a s 7 ------------------------------------------------ 6, 783 5 , 4 0 2 1 , 8 0 9 1 , 4 7 7 599 7 64 469 28 4 339 328 714
S o u th :A t l a n t a , G a -------------------------------------------------------------------------- 6 , 4 2 4 5, 207 1, 749 1, 344 4 57 777 517 363 333 308 576A u s t i n , T e x ---------------- ------------------------------------------------------- 4 , 197 5, 052 1, 726 1 , 2 0 9 453 773 552 339 329 297 519B a l t i m o r e , M d____ -__ -___ __ ___________ _____ _____ _____ 7, 018 5, 533 1 , 8 0 6 1 , 4 9 0 501 809 576 351 343 337 805B a t o n R o u g e , L a ---------------------------------------------------------------- 6 , 4 1 1 5, 215 1 , 8 3 4 1 , 2 9 0 4 7 2 7 68 507 344 333 308 555D a l l a s , T e x -------------------------------------------------------------------------- 6, 683, 5 , 4 1 3 1 , 7 7 1 1, 358 45 9 78 6 676 363 339 321 610D u r h a m , N . C ----------------------------------------------------- -------------- 6, 771 5, 376 1 , 7 4 0 1 , 4 9 9 4 3 0 781 575 351 338 325 732H o u s t o n , T e x ----------------------------------------------------------------------- 6 , 4 8 1 5 , 2 6 1 1 , 7 8 5 1 , 2 8 2 4 85 76 5 6 00 34 4 335 311 574N a s h v i l l e , T e n n ------------------------------------------------------------------ 6 , 326 5, 154 1 , 7 3 3 1, 343 4 6 4 759 49 9 356 331 304 537O r l a n d o , F l a --------------------------- - - ----------------------------------- 6, 562 5, 319 1 , 7 0 5 1, 520 43 7 7 38 565 35 4 336 315 592W a s h i n g t o n , D . C . —M d . —Va---------- ----------------------------------- 7 , 2 4 2 5, 723 1 , 8 9 2 1 , 6 0 2 509 77 8 571 371 34 8 347 82 4N o n m e t r o p o l i t a n a r e a s 7 ------------------- ---------------------------- 6, 150 4 , 9 8 9 1, 702 1 , 2 2 4 594 723 46 3 283 327 29 6 538
W e s t :B a k e r s f i e l d , C a l i f ------------------------------------------------------------- 6 , 9 1 0 5, 520 1 , 8 7 8 1, 335 505 8 3 0 649 323 342 401 647D e n v e r , C o l o ----------------------------------------------------------------------- 6 , 6 9 7 5, 386 1 , 8 3 5 1 , 2 7 3 502 89 2 546 33 8 338 321 652L o s A n g e l e s —L o n g B e a c h , C a l i f — ------------------------------ 7 , 507 5 , 9 5 7 1 , 8 9 0 1 , 6 1 7 512 881 70 8 349 356 4 3 4 760S a n D i e g o , C a l i f ------------------------------------------------------------------ 7 , 166 5, 703 1 , 8 4 7 1, 502 4 9 4 857 66 2 341 348 4 1 6 699S a n F r a n c i s c o —O a k l a n d , C a l i f ----------------------------------------- 7, 686 6, 084 1 , 9 4 8 1 , 7 2 9 519 89 2 63 5 361 359 4 43 80 0S e a t t l e —E v e r e t t , W a s h ---------------- --------- ---------------------------- 7, 630 6 , 129 2, 044 1 , 6 7 5 512 9 07 629 362 361 366 7 74H o n o l u l u , H a w a i i ---------------------------------------------------------------- 8, 597 6, 652 2, 278 1 , 9 9 5 556 85 8 589 376 376 37 4 1, 195N o n m e t r o p o l i t a n a r e a s 7 --------------------------- ----------------------- 6 , 9 7 8 5, 513 1 , 8 2 8 1 , 4 3 6 62 2 83 6 513 27 8 342 335 788
A n c h o r a g e , A l a s k a ------------------------------------------------------------------ 1 0 , 7 8 3 8, 280 2 , 3 1 4 2 , 9 2 9 86 8 9 5 8 8 84 327 4 2 4 4 1 7 1 ,6 6 1
1 T h e f a m i l y c o n s i s t s o f a n e m p l o y e d h u s b a n d , a g e 38 , a w i f e n o t e m p l o y e d o u t s i d e t h e h o m e , a n 8 - y e a r - o l d g i r l , a n d a 1 3 - y e a r - o l d b o y .2 H o u s i n g i n c l u d e s s h e l t e r , h o u s e h o l d o p e r a t i o n s , a n d h o u s e f u r n i s h i n g s . A l l f a m i l i e s w i t h t h e l o w e r b u d g e t a r e a s s u m e d t o b e r e n t e r s .3 T h e a v e r a g e c o s t s o f a u t o m o b i l e o w n e r s a n d n o n o w n e r s a r e w e i g h t e d b y t h e f o l l o w i n g p r o p o r t i o n s o f f a m i l i e s : B o s t o n , C h i c a g o , N e w Y o r k , a n d P h i l a d e l p h i a , 50 p e r c e n t f o r b o t h a u t o m o b i l e
o w n e r s a n d n o n o w n e r s ; a l l o t h e r m e t r o p o l i t a n a r e a s , 65 p e r c e n t f o r a u t o m o b i l e o w n e r s , 35 p e r c e n t f o r n o n o w n e r s ; n o n m e t r o p o l i t a n a r e a s , 100 p e r c e n t f o r a u t o m o b i l e o w n e r s .4 In t o t a l m e d i c a l c a r e , t h e a v e r a g e c o s t s o f m e d i c a l i n s u r a n c e w e r e w e i g h t e d b y t h e f o l l o w i n g p r o p o r t i o n s : 30 p e r c e n t f o r f a m i l i e s p a y i n g f u l l c o s t o f i n s u r a n c e ; 26 p e r c e n t f o r f a m i l i e s p a y i n g
h a l f c o s t ; ' 4 4 p e r c e n t f o r f a m i l i e s c o v e r e d b y n o n c o n t r i b u t o r y i n s u r a n c e p l a n s ( p a i d b y e m p l o y e r ) .5 I n c l u d e s a l l o w a n c e s f o r g i f t s a n d c o n t r i b u t i o n s , l i f e i n s u r a n c e , a n d o c c u p a t i o n a l e x p e n s e s .6 A s d e f i n e d i n 196 0 —61. F o r a d e t a i l e d d e s c r i p t i o n o f c u r r e n t a n d p r e v i o u s g e o g r a p h i c a l b o u n d a r i e s , s e e t h e 1967 e d i t i o n o f t h e S t a n d a r d M e t r o p o l i t a n S t a t i s t i c a l A r e a s , p r e p a r e d b y t h e B u r e a u o f
t h e B u d g e t .7 P l a c e s w i t h p o p u l a t i o n o f 2 , 5 0 0 t o 5 0 , 0 0 0 .
Digitized for FRASER http://fraser.stlouisfed.org/ Federal Reserve Bank of St. Louis

T a b le A -2 . A n n u a l co s ts o f an in te rm e d ia te b u d g e t fo r a !4 -p e rs o n fa m ily ,1 spring 1 9 7 0
Area
Cost of fam ily consumption
Other costs 5
Socialsecurity and
disability insurance
Personalincometaxes
Totalbudget Total Food Housing 1 2 Transportation 3
Clothingand
personalcare
Medical care 4 5 6 7
Otherfam ily
consumption
Urban United States----------------------------------------------------------------------- $10,664 $8 ,205 $ 2 ,452 $2, 501 $912 $1, 137 $564 $639 $539 $387 $1, 533Metropolitan areas 6__________________________________________ 10,933 8, 382 2 ,491 2, 579 916 1, 153 582 661 576 389 1,586Nonmetropolitan areas 7---------------------------------------------------------- 9 ,600 7, 421 2, 281 2, 158 894 1, 065 483 540 509 377 1, 293
Northeast:Boston, M a s s ______________________________________________ 12, 037 9, 128 2, 653 3, 120 937 1, 166 562 690 571 374 1,964Buffalo, N .Y _____________________________________________— - 11,425 8,6 67 2, 606 2, 712 1, 005 1, 163 514 667 555 390 1,813Hartford, Conn-------------------------------------------------------------------- 11,584 9, 074 2, 717 2, 918 985 1, 197 550 707 570 374 1, 566Lancaster, P a --------------------------------------------------------------------- 10,301 7, 994 2, 533 2, 323 928 1, 094 512 604 532 374 1,401New York—Northeastern N .J -------------------------------------------- 12,134 . 9, 178 ' . 2, 792 3, 071 865 1, 151 600 699 573 393 1,990Philadelphia, Pa.—N .J ____________________________________ 10,875 8, 308 2, 653 2, 448 879 1, 115 550 663 543 378 1,646Pittsburgh, Pa-------------------- ---------------------------------------------- 10,236 7, 926 2, 536 2, 237 910 1, 100 492 651 529 374 1, 407Portland, Maine------------------------------------------------------------------ 10,835 8,481 2, 599 2, 460 983 1, 198 542 699 549 374 1,431Nonmetropolitan areas 7________________________ ________ 10,419 8, 028 2, 478 2, 508 931 1, 056 504 551 533 388 1,470
North Central:Cedar Rapids, Iow a_______________________________________ 10,614 8, 126 2, 263 2, 561 945 1, 191 521 640 536 374 1,578Champaign—Urbana , 111----------------------------------------------- — 10,864 8,4 56 2, 372 2, 776 949 1, 159 561 639 548 374 1,486Chicago, 111.—Northwestern Ind--------------------------------------- 11,120 8, 655 2, 482 2, 774 961 1, 175 592 671 555 374 1,536Cincinnati, Ohio— Ky — Ind------------------------------------------------ 10,220 7, 921 2, 372 2, 371 921 1, 137 481 639 529 374 1, 396Cleveland, Ohio------------------------------------------------------------------ 11,184 8, 673 2, 465 2, 839 929 1,201 561 678 556 374 1,581Dayton, Ohio------------------------------------------------------------------------ 10,094 7, 846 2, 363 2, 244 901 1, 167 497 674 527 374 1, 347Detroit, Mich _________________ __________________________ 10,588 8, 137 2, 507 2, 354 906 1, 162 560 648 537 374 1,540Green Bay, W is ____________________________________________ 10,596 7, 911 2, 222 2, 441 917 1,210 502 619 529 374 1,782Indianapolis, Ind___________________________________________ ' 10,892 8, 421 2, 435 2, 626 994 1, 143 559 664 547 374 1,550Kansas City, Mo.—K ans__________________________________ 10,599 8, 191 2 ,441 2, 429 931 1, 196 543 651 539 374 1,495Milwaukee, W is_________________ ________________________ 11,405 8, 470 2, 291 2, 892 902 1, 178 542 665 548 374 2, 013Minneapolis—St. Paul, Minn______________________________ 10,897 8, 129 2, 366 2, 441 936 1, 187 543 656 537 374 1, 857St. Louis, M o.—Ill__________________________________________ 10,546 8, 156 2, 513 2, 399 939 1, 131 533 641 537 374 1,479Witchita, Kans--------------------------------------------------------------------- 10,105 7, 828 2, 318 2, 376 881 1,085 544 624 526 374 1, 377Norimetropolitan areas 7______________________•____________ 9, 862 7, 607 2, 265 2, 347 900 1, 075 47 3 546 518 374 1, 363
South:Atlanta, G a--------------------------------------------------------------------------- 9, 523 7 ,4 15 2, 283 1,977 883 1,099 522 651 512 374 1,222Austin, Tex_________________________________________________ 9, 212 7, 257 2, 215 1, 860 905 1,087 554 636 506 374 1,075B altim ore, Md--------------------------------------------------------------------- 10,580 7, 935 2, 394 2, 231 923 1, 156 579 652 530 374 1,741Baton Rouge, L a ----------------------------------------------------------------- 9, 704 7, 605 2, 400 2, 050 931 1, 087 508 629 518 374 1, 207D allas, Tex_________________________________________________ 9, 894 7, 788 2, 286 2, 140 904 1, 114 679 665 525 374 1, 207Durham, N .C_______________________________________________ 10,187 7, 753 2, 264 2, 305 856 1, 104 578 646 523 374 1,537Houston, Tex------------------------------------------------------------------------ 9, 645 7, 603 2, 311 2, 026 947 1,084 603 632 518 374 1, 150Nashville, Tenn ----------------------------------------------------------------- 9, 665 7, 604 2, 228 2, 223 914 1, 082 501 656 518 374 1, 169Orlando, F la ------------------------------------------------------------------------ 9 ,469 7, 451 2, 201 2, 141 847 1, 048 569 645 513 374 1, 131Washington, D .C .—Md.—Va------------------------------------------------ 11, 047 8, 365 2, 489 2, 547 955 1, 120 574 680 545 374 1,763Nonmetropolitan areas 7__________________________________ 9, 041 7, 035 2, 214 1,904 881 1, 034 466 536 498 375 1, 133
W est:Bakersfield, C alif------ _ ------------------------------------------------ 10,040 7, 785 2, 331 2, 127 942 1, 128 651 606 524 448 1, 283Denver, Colo------------------------------------------------------------------------ 10,326 7, 985 2, 298 2, 346 932 1, 227 550 632 531 374 1,436Los Angeles—Long Beach, C a lif------------------------------------- 10,770 8, 307 2, 373 2, 476 902 1, 207 710 639 543 448 1, 472San Diego, C a li f ----------------------------------------------------------------- 10, 467 8, 083 2, 298 2, 397 909 1, 173 667 639 535 448 1,401San Francisco—Oakland, C a li f ---------------------------------------- 11,381 8, 761 2, 461 2, 813 957 1, 228 640 662 557 448 1,613Seattle—Everett, Wash____________________________________ 11,012 8, 649 2, 575 2, 590 948 1,239 632 665 553 374 1, 434Honolulu, Hawaii----------------------------------------------------------------- 12,776 9, 428 2, 855 3, 064 1, 057 1, 171 594 687 586 374 2, 392Nonmetropolitan areas 7__________________________________ 9, 885 7, 555 2, 245 2, 227 867 1, 170 516 530 496 374 1,460
Anchorage, A la sk a ------------------------------------------------------------------ 14,535 10,826 2, 833 3, 992 1, 163 1, 347 885 606 606 417 2, 686
1 The fam ily consists of an employed husband, age 38, a wife not employed outside the home, an 8 -year-o ld girl, and a 13-year-old boy.2 Housing includes shelter, household operations, and housefurnishings. The average costs of shelter are weighted by the following proportions: 25 percent for rental costs, 75 percent for
homeowner costs.3 The average costs of automobile owners and nonowners are weighted by the following proportions: Boston, Chicago, New York, and Philadelphia, 80 percent for owners, 20 percent for
nonowners; Baltim ore, Cleveland, Detroit, Los Angeles, Pittsburgh, San Francisco, St. Louis, and Washington, with 1.4 m illion of population or m ore in I960, 95 percent for automobile owners, and5 percent for nonowners; all other areas, 100 percent for automobile owners.
4 In total m edical care, the average costs of medical insurance were weighted by the following proportions: 30 percent for fam ilies paying full cost of insurance; 26 percent for families payinghalf cost; 44 percent for fam ilies covered by noncontributory insurance plans (paid by employer).
5 Includes allowances for gifts and contributions, life insurance, and occupational expenses.6 As defined in 1960—61. For a detailed description of current and previous geographical boundaries, see the 1967 edition of the Standard Metropolitan Statistical A rea s , prepared by the Bureau
of the Budget.7 P laces with population of 2, 500 to 50, 000.
Digitized for FRASER http://fraser.stlouisfed.org/ Federal Reserve Bank of St. Louis

T a b le A -3 . A n n u a l co s ts o f a h ig h e r b u d g e t fo r a 4 -p e rs o n fa m ily ,1 s p ring 1 9 7 0
Area TotalBudget
Cost of family consumptionOther costs 1 2 3 4 5
Socialsecurity and
disability insurance
Personalincome
taxTotal F ood Housing 2 Transportation 3Clothing
andpersonal
care
Medical care 4
Otherfamily
consumption
Urban United States_______________________________________________ $15,511 $11,346 $3 ,092 $3 ,772 $1, 183 $1 ,655 $588 $1 ,056 $903 $387 $2,875Metropolitan a r e a s 6___________________________________________ 15,971 11,658 3, 162 3 ,915 1,204 1,676 606 1,095 919 389 3, 005Nonmetropolitan areas 7---------------------------------------------------------- 13,459 9,949 2,785 3, 133 1,091 1,555 505 880 833 377 2,300
Northeast:Boston, M a s s _________________________________ ______________ 17,819 12,797 3, 303 4 ,7 61 1,308 1,710 588 1, 127 976 374 3,672Buffalo, N . Y ________________________________________________ 16,424 11,697 3,221 3,939 1, 196 1,702 536 1, 103 921 390 3,416Hartford, Conn_____________________________________________ 16,312 12,255 3, 287 4, 272 1 ,213 1,752 572 1, 159 949 374 2 ,7 34Lancaster, P a ______________________________________________ 14,711 10,978 3, 152 3 ,459 1, 131 1,610 532 1,094 885 374 2,474New York—Northeastern N. J--------------------------------------------- 18,545 13,086 3, 551 4 ,7 61 1,294 1,699 626 1, 155 990 393 4, 076Philadelphia, P a . - N .J ____________________________________ 15,845 11,598 3,292 3, 74 3 1 ,252 1,629 574 1, 108 916 378 2,953Pittsburgh, Pa--------------------------------------------------------------------- 14,876 11,047 3, 170 3 ,494 1, 149 1,610 514 1, 110 888 374 2,567Portland, M aine------------------------------------------------------------------- 15,088 11,318 3,220 3,494 1, 182 1,747 558 1,117 902 374 2,494Nonmetropolitan areas 7----------------------------------------------------- 14,479 10,647 3,007 3,535 1, 145 1,546 525 889 868 388 2,576
North Central:Cedar Rapids, Iow a------------------------------------------------------------ 15,390 11,213 2,891 3,857 1, 152 1,716 540 1,057 897 374 2,906Champaign—Urbana, 111____________________________________ 15,769 11,751 3, 014 4, 233 1, 168 1,689 581 1,066 924 374 2,720Chicago, 111. —Northwestern Ind--------------------------------------- 16,019 11,923 3, 158 4 ,0 1 3 1, 338 1,701 614 1,099 932 374 2,790Cincinnati, Ohio—K y .—Ind_________________________________ 14,329 10,681 2,9 96 3,404 1, 102 1,640 502 1,037 870 374 2,404Cleveland, O h io__________________________ __________________ 15,897 11,824 3, 126 4 , 123 1, 148 1,733 587 1, 107 927 374 2,772Dayton, O hio________________________________________________ 14,724 11,000 2,9 90 3,571 1, 127 1,688 517 1, 107 886 374 2,464Detroit, M ich _______________________________________________ 15,460 11,329 3, 186 3,663 1, 134 1,677 588 1,081 902 374 2,855Green Bay, W is ____________________________________________ 15,582 10,905 2,7 94 3,6 92 1, 126 1,740 523 1,030 881 374 3,422Indianapolis, Ind_____________________________________ ____ 15,620 11,561 3, 102 3 ,927 1, 185 1,665 581 1, 101 914 374 2,771Kansas City, M o .—I l l______________________________________ 15,575 11,461 3, 176 3,755 1, 164 1,730 563 1,073 909 374 2,831Milwaukee, W is ____________________________________________ 16,575 11,493 2,951 4 , 100 1 ,092 1,703 564 1,083 911 374 3,797Minneapolis—St. Paul, M inn_____________________________ 15,808 11, 140 3. 046 3,604 1, 137 1,711 568 1,074 893 374 3,401St. Louis, M o .—Ill--------------------------------------------------------------- 15,125 11,167 3,235 3,477 1,208 1,637 554 1,056 894 374 2,690W ichita, Kans----------------------------------------------------------------------- 14,536 10,757 2,9 20 3,559 1,116 1,575 565 1,022 874 374 2,531Nonmetropolitan areas 7----------------------------------------------------- 13,935 10,273 2,8 00 3,437 1,074 1,590 495 877 850 374 2,438
South:Atlanta, G a _________________________________________________ 13,765 10, 177 2 ,9 08 2 ,9 53 1,113 1,615 543 1,045 845 374 2, 369Austin, Tex--------------------------------------------------------------------------- 13,337 10,142 2,847 2 ,9 14 1, 146 1,590 578 1,067 843 374 1,978B altim ore, Md------------------------------------------------------- ------------ 15,590 11,023 3, 100 3, 359 1, 161 1,719 602 1,082 887 374 3, 306Baton Rouge, L a ___________________________________________ 14,379 10,779 3,051 3, 381 1, 177 1,595 528 1,047 875 374 2, 351D allas, Tex______ __________________ ____ ______________ _____ 14,471 10,946 2 ,923 3 ,4 24 1, 147 1,644 705 1, 103 883 374 2,268Durham, N. C ---------------------------- --------------------------------------- 14 ,630 10,557 2,861 3, 331 1,086 1,624 596 1,059 864 374 2,835Houston, Tex------------------------------------------------------------------------ 13,917 10,556 2,9 54 3, 127 1,199 1,594 629 1,053 864 374 2, 123N ashville , Tenn------------------------------------------------------------------- 13,930 10,569 2 ,777 3,431 1, 173 1,595 522 1,071 864 374 2, 123Orlando, F la ------------------------------------------------------------------------ 13,679 10,375 2 ,752 3, 354 1,081 1,539 590 1,059 855 374 2,075Washington, D. C. —Md. — V a„ ------------------------------------------ 16,125 11,516 3, 142 3 ,7 53 1,253 1,661 597 1,110 912 374 3, 323Nonmetropolitan areas 7----------------------------------------------------- 12 ,643 9,442 2,701 2,7 82 1,088 1,514 488 869 808 375 2,0 18
W est:Bakersfield, C a lif -------------------------- ---------------------------------- 14,283 10,557 2,9 12 3, 185 1, 174 1,597 676 1,013 864 448 2,414Denver, Colo------------------------------------------------- -------------------- 15,005 11,004 2 ,977 3,5 15 1, 143 1,735 572 1,064 886 374 2,741Los Angeles—Long Beach, C a lif_________________________ 15,989 11,704 3, 108 3 ,8 83 1, 184 1,716 741 1,072 921 448 2,916San Diego, Calif ---------------------------------------------------------------- 15,309 11,267 2,9 33 3,8 18 1,095 1,653 699 1,069 899 448 2,6 95San Francisco—Oakland, Calif ---------- ----- -------------- 16,526 12,064 3, 184 4 , 129 1,231 1,746 670 1,104 939 448 3,075Seattle—Everett, W ash_____________________________________ 15 ,626 11,786 3,265 3,871 1, 146 1,742 656 1,106 925 374 2,541Honolulu, Hawaii— -------- ---------------------- ----------------------- 19,311 13,295 3,678 4. 776 1,407 1,658 618 1, 158 1,001 374 4,641Nonmetropolitan areas 7__________________ _____ _______ 13,982 10,134 2 ,722 3. 282 1,039 1,647 537 907 838 374 2,636
Anchorage, A la sk a ----------------------------------------- ----------------------- 20 ,301 14,275 3,496 5,5 75 1,374 1,896 915 1,019 1,050 417 4 ,5 59
1 The fam ily consists of an employed husband, age 38, a wife not employed outside the home, an 8 -year-o ld g irl, a 13 -year-old boy.2 Housing includes sh elter, household operations, housefurnishings and lodging out of home city. The average costs of shelter are weighted by the following proportions: 15 percent for rental
c o sts , 85 percent for homeowner costs.3 A ll fam ilies were assum ed to be automobile owners.4 In total m edical care, the average costs of medical insurance were weighted by the following proportions: 30 percent for fam ilies paying full cost of insurance; 26 percent for fam ilies paying
half cost; 44 percent for fam ilies covered by noncontributory insurance plans (paid by em ployer).5 Includes allowances for gifts and contributions, life insurance, and occupational expenses.6 As defined in 1960—61. For a detailed description of current and previous geographical boundaries, see the 1967 edition of the Standard Metropolitan Statistical A r e a s , prepared by the Bureau
of the Budget. ,7 P laces-w ith population of 2 ,5 0 0 to 5 0 ,0 0 0 .
Digitized for FRASER http://fraser.stlouisfed.org/ Federal Reserve Bank of St. Louis
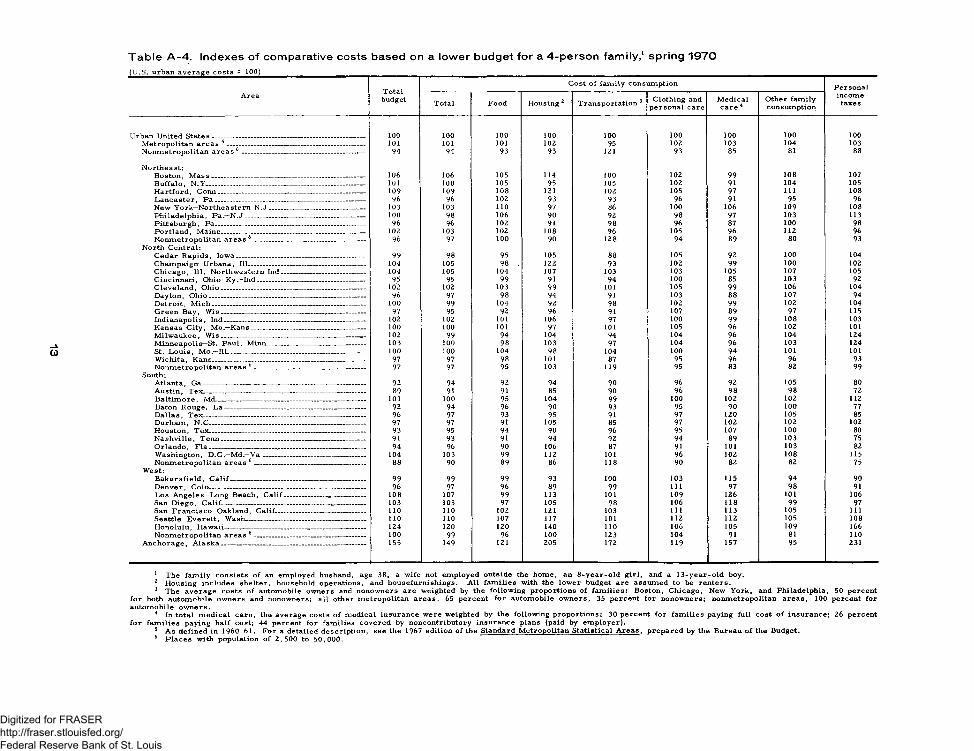
T a b le A -4 . Ind e x e s o f c o m p a ra tiv e costs b ased on a lo w e r b u d g e t fo r a 4 -p e rs o n fa m ily ,1 s p ring 1 9 7 0^IJ^S^^urban^averag^^oost^^l^O^
Area Totalbudget
Cost of family consumption Personalincome
taxesTotal Food Housing 1 2 Transportation 3 Clothing and personal care
Medical care 4
Other fam ily consumption
Urban United States---------------------------------------------------------------------- 100 100 100 100 100 100 100 100 100Metropolitan areas 5 --------------------------------------------------------------- 101 101 101 102 95 102 103 104 103Nonmetropolitan areas 6 -------------------------------------------------------- 94 94 93 93 121 93 85 81 88
Northeast:Boston, M a s s ---------------------------------------------------------------------- 106 106 105 114 100 102 99 108 107Buffalo, N .Y ------------------------------------------------------------------------ 101 100 105 95 105 102 91 104 105Hartford, Conn------ ------------------------------------------------------------ 109 109 108 121 102 105 97 111 108Lancaster, P a -------------------------------------------------------------------- 96 96 102 93 93 96 91 95 96New York—Northeastern N .J -------------------------------------------- 103 103 n o 97 86 100 106 109 108Philadelphia, P a —N .J ------------------------------------------------------- 100 98 106 90 92 98 97 103 113Pitt s bur gh, Pa-------------------------------------------------------------------- 96 96 102 91 98 96 87 100 98Portland, Maine------------------------------------------------------------------ 102 103 102 108 96 105 96 112 96Nonmetropolitan areas 6 --------------------------------------------------- 96 97 100 90 128 94 89 80 93
North Central:Cedar Rapids, Iowa------ ---------------------------------------------------- 99 98 95 105 88 105 92 100 104Champaign—Urbana, 111----------------------------------------------------- 104 105 98 . 122 93 102 99 100 102Chicago, 111—Northwestern Ind-------------------------------------- 104 105 104 107 103 103 105 107 105Cincinnati, Ohio—Ky.—Ind------------------------------------------------- 95 95 99 91 94 100 85 103 92Cleveland, Ohio------------------------------------------------------------------ 102 102 103 99 101 105 99 106 104Dayton, O hio------------------------------------ ------ ---------------------------- 96 97 98 94 91 103 88 107 94Detroit, M ich ______________________________________________ 100 99 104 92 98 102 99 102 104Green Bay, W is ------------------------------------------------------------------ 97 95 92 96 91 107 89 97 115Indianapolis, Ind---------------------------------------------------------------- 102 102 101 106 97 100 99 108 103Kansas City, Mo.—Kans---------------------------------------------------- 100 100 101 97 101 105 96 102 101M ilwaukee, W is_________________________________ _________ 102 99 94 104 94 104 96 104 124Minneapolis—St. Paul, Minn--------------------------------------------- 103 100 98 103 97 104 96 103 124St. Louis, M o.—Ill--------------------------------------------------------------- 100 100 104 98 104 100 94 101 101Wichita, Kans---------------------------------------------------------------------- 97 97 98 101 87 95 96 96 93Nonmetropolitan areas 6 -------------------------------------------------- 97 97 95 103 119 95 83 82 99
South:Atlanta, G a---------------------------------- ------------- - ------ ----------------- 92 94 92 94 90 96 92 105 80Austin, Tex---------------------------------------- --------- ------------------------ 89 91 91 85 90 96 98 98 72Baltim ore, Md______________________ ____ __________________ 101 100 95 104 99 100 102 102 112Baton Rouge, L a ---------------------------------------------------------------- 92 94 96 90 93 95 90 100 77D allas, Tex.............. ......... ...... .................................. ...................— 96 97 93 95 91 97 120 105 85Durham, N .C---------------------------- --------- --------------- ---------------- 97 97 91 105 85 97 102 102 102Houston, Tex------------------------- ------------- -------------------------------- 93 95 94 90 96 95 107 100 80Nashville, Tenn---------------------------------------- ------------------------- 91 93 91 94 92 94 89 103 75Orlando, F la ----------------------------------------------------------------------- 94 96 90 106 87 91 101 103 82Washington, D.C.—Md.—V a -------------------------------------- -------- 104 103 99 112 101 96 102 108 115Nonmetropolitan areas 6 --------------------------------------------------- 88 90 89 86 118 90 82 82 75
W est:Bakersfield, C a lif________________________________________ 99 99 99 93 100 103 115 94 90Denver, Colo----------------------------------------------------------------------- 96 97 96 89 99 111 97 98 91Los Angeles—Long Beach, C alif------------------------------------- 108 107 99 113 101 109 126 101 106San Diego, Calif___________________________________________ 103 103 97 105 98 106 118 99 97San Francisco—Oakland, Calif___________________________ 110 n o 102 121 103 111 113 105 111Seattle—Everett, Wash------------------------------------------------------- n o no 107 117 101 112 112 105 108Honolulu, Hawaii---------------------------------------------------------------- 124 120 120 140 n o 106 105 109 166Nonmetropolitan areas 6 -------------------------------------------------- 100 99 96 100 123 104 91 81 n o
Anchorage, A lask a___________________________________________ 155 149 121 205 172 119 157 95 231
1 The fam ily consists of an employed husband, age 38, a wife not employed outside the home, an 8 -year-o ld girl, and a 13 -year-old boy.2 Housing includes shelter, household operations, and housefurnishings. A ll fam ilies with the lower budget are assumed to be renters.3 The average costs of automobile owners and nonowners are weighted by the following proportions of fam ilies: Boston, Chicago, New York, and Philadelphia, 50 percent
for both automobile owners and nonowners; all other metropolitan areas, 65 percent for automobile owners, 35 percent for nonowners; nonmetropolitan areas, 100 percent for automobile owners.
4 In total m edical care, the average costs of medical insurance were weighted by the following proportions: 30 percent for fam ilies paying full cost of insurance; 26 percent for fam ilies paying half cost; 44 percent for families covered by noncontributory insurance plans (paid by em ployer).
5 A s defined in 1960-61 . For a detailed description, see the 1967 edition of the Standard Metropolitan Statistical A re a s , prepared by the Bureau of the Budget.6 Places with population of 2 ,5 0 0 to 5 0 ,000 .
Digitized for FRASER http://fraser.stlouisfed.org/ Federal Reserve Bank of St. Louis
T a b le A -5 . In d e x e s o f c o m p a ra tiv e costs based on an in te rm e d ia te b u d g e t fo r a 4 -p e rs o n fa m ily ,1 spring 1 9 7 0(IL S u ^ u rb a n ^ a ^
Area Totalbudget
Cost of fam ily consumption PersonalincometaxesTotal Food Housing 1 2 T r ansportation 3 Clothing and
personal careM edical
care 4Other fam ily consumption
Urban United States - . . . _ 100 100 100 100 100 100 100 100 100Metropolitan areas 5 _________________________________________ 103 102 102 103 100 101 103 103 103Nonmetropolitan areas 6 ----------------- — --------------------------------- 90 90 93 86 98 94 86 85 84
Northeast:Boston, M a s s . — _ _ _ _ _ _ 113 111 108 125 103 103 100 108 128Buffalo, N .Y ....................................... ............................... 107 106 106 108 110 102 91 104 118
109 111 111 117 108 105 98 111 102Lancaster, P a — _ - - - ------ 97 97 103 93 162 96 91 95 91New York—Northeastern N.J — 114 112 114 123 95 101 106 109 130Philadelphia, Pa.—N.J __ 102 101 108 98 96 98 98 104 107Pittsburgh, Pa— _ _ ------ _ — 96 97 103 89 100 97 87 102 92Portland, Maine------------- ----- ----- ---------------------------------------- 102 103 106 98 108 105 96 109 93Nonmetropolitan areas 6 ---------------------------------------— ------ 98 98 101 100 102 93 89 86 96
North Central:Cedar Rapids, Iowa _ __ - — 100 99 92 102 104 105 92 100 103Champaign—U rbana, 111___ _ _ __ 102 103 97 111 104 102 99 100 97Chicago, 111.—Northwestern Ind------------------------------------- 104 105 101 111 105 103 105 105 100Cincinnati, Ohio-K y.—Ind- 96 97 97 95 101 100 85 100 91Cleveland, Ohio _ _ 105 106 101 114 102 106 99 106 103Dayton, Ohio - — - 95 96 96 90 99 103 88 105 88Detroit, M ich - 99 99 102 94 99 102 99 101 100Green Bay, W is ----------------------------------------------------------------- 99 96 91 98 101 106 89 97 116Indianapolis, Ind---------------------------------------------------------------- 102 103 99 105 109 101 99 104 101Kansas City, Mo.—Kans _ _ - __ _ _ _ 99 100 100 97 102 105 96 102 98Milwaukee, W is - — 107 103 93 116 99 104 96 104 131Minneapolis—St. Paul, Minn- 102 99 96 98 103 104 96 103 121St. Louis, Mo.—Til_ - . _ . . _ ________________ 99 99 102 96 103 99 95 100 96W ichita, Kans. _ _ — - _ _ _ _ _ _ _ 95 95 95 95 97 95 96 98 90Nonmetropolitan areas 6 -------------------------------------------------- 92 93 92 94 99 95 84 85 89
South:Atlanta, G a__ __ - - __ __ _ — _ 89 90 93 79 97 97 93 102 80Austin, Tpy - . ..... .. - . _ ______ .... ..... 86 88 90 74 99 96 98 100 70Baltim ore, Md— - - _ _ _ _ _ _ _ __ 99 97 98 89 101 102 103 102 114Baton Rouge, La _ _ _ _ _ _ 91 93 98 82 102 96 90 98 79D allas, Tex— -------- _ _ - ------ _ _ — ___ 93 95 93 86 99 98 120 104 79Durham, N .C — __ __ _ ___ 96 94 92 92 94 97 102 101 100Houston, Tex_ _ _____ ___ _ ______ __ _ __ _ ___ 90 93 94 81 104 95 107 99 75Nashville, Tenn _ _ _ _ _ -------- ----- 91 93 91 89 100 95 89 103 76Orlando, F la_____________ ________ _______ _______________ 89 91 90 86 93 92 101 101 74Washington, D .C .—Md.—Va_ _ _ _ _ — — 104 102 102 102 105 99 102 106 115Nonmetropolitan areas 6 __ — _ __ — ----- 85 86 90 76 97 91 83 84 74
W est:B akersfield, C a lif- 94 95 95 85 103 99 115 95 84Denver, Colo — — - _ __ __ -------- 97 97 94 94 102 108 98 99 94Los Angeles—Long Beach, Calif ____ ___ 101 101 97 99 99 106 126 100 96San Diego, Calif- - ------ _ _ _ _ _ _ _ _ 98 99 94 96 100 103 118 100 91San Francisco—Oakland, Calif— 107 107 100 112 105 108 113 104 105Seattle—Everett, Wash— _ _ _ _ 103 105 105 104 104 109 112 104 94Honolulu, Hawaii — — - _ 120 115 116 123 116 103 105 108 156Nonmetropolitan areas 6 _ -_ - 93 92 92 89 95 103 91 83 95
Anchorage, A la sk a . — — - — — — 136 132 116 160 128 118 157 95 175
1 The fam ily consists of an employed husband, age 38, a wife not employed outside the home, an 8 -y ea r-o ld girl, and a 13 -year-old boy.2 Housing includes shelter, household operations, and housefurnishings. The average costs of shelter are weighted by the following proportions: 25 percent for rental costs,
75 percent for homeowner costs.3 The average costs of automobile owners and nonowners were weighted by the following proportions: Boston, Chicago, New York, and Philadelphia, 80 percent for owners,
20 percent for nonowners; B altim ore, Cleveland, Detroit, Los Angeles, Pittsburgh, San Francisco, St. Louis, and Washington, with 1.4 m illion of population or m ore in 1960, 95 percent for automobile owners, and 5 percent for nonowners; all other areas, 100 percent for automobile owners.
4 In total m edical care, the average costs of medical insurance are weighted by the following proportions: 30 percent for fam ilies paying full cost of insurance; 26 percentfor fam ilies paying half cost; 44 percent for fam ilies covered by noncontributory insurance plans (paid by employer).
5 As defined in 1960—61. For a detailed description see the 1967 edition of the Standard Metropolitan Statistical A re a s , prepared by the Bureau of the Budget.6 P laces with populations of 2, 500 to 50, 000.
Digitized for FRASER http://fraser.stlouisfed.org/ Federal Reserve Bank of St. Louis
T a b le A -6 . In d exes o f c o m p a ra tiv e costs b ased on a h ig h e r b u d g e t fo r a 4 -p e rs o n fa m ily ,1 spring 1 9 7 0
(U.S. urban average costs = 100)
Area Totalbudget
Cost of family consumption Personalincome
taxesTotal Food Housing 1 2 Transportation 3 Clothing and personal care
Medical care 4
Other fam ily consumption
Urban United States---------------------------------------------------------------------- 100 100 100 100 100 100 100 100 100Metropolitan areas 5 --------------------------------------------------------------- 103 103 102 104 102 101 103 104 105Nonmetropolitan areas 6 -------------------------------------------------------- 87 88 90 83 92 94 . 86 83 80
Northeast:Boston, M a s s ---------------------------------------------------------------------- 115 113 107 126 111 103 100 107 128Buffalo, N .Y _________________ __________________ ___________ 106 103 104 104 101 103 91 104 119Hartford, Conn------------------------------------"------------------------------ 105 108 106 113 103 106 97 110 95Lancaster, P a ----------- --------- ---------------------------------------------- 95 97 102 92 96 97 90 104 86New York—Northeastern N .J_____________________________ 120 115 115 126 iop 103 106 109 142Philadelphia, Pa.—N .J --------------------- ----------------------------- 102 102 106 99 106 98 98 105 103Pittsburgh, Pa--------------------------------------------------------------------- 96 97 103 93 97 97 87 105 89Portland, Maine------------------------------------------------------------------ 97 100 104 93 100 106 95 106 87Nonmetropolitan areas 6 ------------------------------------------------- 93 94 97 94 97 93 89 84 90
North Central:Cedar Rapids, Iowa----------------------------------------------------------- 99 99 93 102 97 104 92 100 101Champaign—Urbana, 111----------------------------------------------------- 102 104 97 112 99 102 99 101 95Chicago, 111—Northwestern Ind................................ .............. 103 105 102 106 113 103 104 104 97Cincinnati, Ohio-K y.—Ind------------------------------------------------- 92 94 97 90 93 99 85 98 84Cleveland, O hio------------------------------------------------------------------ 102 104 101 109 97 105 100 105 96Dayton, O hio_______________________________________________ 95 97 97 95 95 102 88 105 86Detroit, M ich ---------------------------------------------------------------------- 100 100 103 97 96 101 100 102 99Green Bay, W is ----------------------------------------------------------------- 100 96 90 98 95 105 89 98 119Indianapolis, Ind---------------------------------------- --------- -------------- 101 102 100 104 100 101 99 104 96Kansas City, Mo.—Kans---------------------------------------------------- 100 101 103 100 98 105 96 102 98Milwaukee, W is ___________________________________________ 107 101 95 109 92 103 96 103 132Minneapolis—St. Paul, Minn--------------------------------------------- 102 98 99 96 96 103 97 102 118St. Louis, Mo.—Ill_________________________________________ 98 98 105 92 102 99 94 100 94Wichita, Kans______________________________________________ 94 95 94 94 94 95 96 97 88Nonmetropolitan areas 6 -------------------------------------------------- 90 91 91 91 91 96 84 83 85
South:Atlanta, G a_________________________________________________ 89 90 94 78 94 98 92 99 82Austin, Tex_________________________________________________ 86 89 92 77 97 96 98 101 69Baltim ore, Md--------------------------------------------------------------------- 101 97 100 89 98 104 102 102 115Baton Rouge, L a ________ ________________________ _______ _ 93 95 99 90 .99 96 90 99 82Dallas , Tex-------------------------------------------------------------------------- 93 96 95 91 97 99 120 104 79Durham, N.C_______________________________________________ 94 93 93 88 92 98 101 100 99Houston, Tex----------------------------------------------------------------------- 90 93 96 83 101 96 107 100 74Nashville, Tenn----------------------------------------------------------------- 90 93 90 91 99 96 89 101 74Orlando, F la ___________________________________ ______ ____ 88 91 89 89 91 93 100 100 72Washington, D .C .—M d —Va_______________________________ 104 101 102 99 106 100 102 105 116Nonmetropolitan areas 6 _________________________________ 82 83 87 74 92 91 83 82 70
West:Bakersfield, C a lif---------------------- ------ -------------------------------- 92 93 94 84 99 96 115 96 84Denver, Colo_______________________________________________ 97 97 96 93 97 105 97 101 95Los Angeles—Long Beach, C alif________________________ 103 103 101 103 100 104 126 102 101San Diego, Calif----------------------------------------------------------------- 99 99 95 101 93 100 119 101 94San Francisco—Oakland, Calif----------------------------------------- 107 106 103 109 104 105 114 105 107Seattle—Everett, Wash------------------------------------------------------- 101 104 106 103 97 105 112 105 88Honolulu, Hawaii----------------------------------------------------------------- 125 117 119 127 119 100 105 110 161Nonmetropolitan areas 6 -------------------------------------------------- 90 89 88 87 88 100 91 86 92
Anchorage, A lask a___________________________________________ 131 126 113 148 116 115 156 96 159
1 The fam ily consists of an employed husband, age 38, a wife not employed outside the home, an 8 -year-o ld girl, and a 13 -year-o ld boy.2 Housing includes shelter, household operations, housefurnishings, and lodging out of home city. The average costs of shelter are weighted by the following proportions:
15 percent for rental costs, 85 percent for homeowner costs.3 All fam ilies were assumed to be automobile owners.4 In total m edical care, the average costs of m edical insurance were weighted by the following proportions: 30 percent for fam ilies paying full cost of insurance; 26 percent
for fam ilies paying half cost; 44 percent for families covered by noncontributory insurance plans (paid by em ployer).5 As defined in 1960-61 . For a detailed description of current and previous geographical boundaries, see the 1967 edition of the Standard Metropolitan Statistical A re a s ,
prepared by the Bureau of the Budget.6 Places with population of 2 ,5 0 0 to 5 0 ,000 .
Digitized for FRASER http://fraser.stlouisfed.org/ Federal Reserve Bank of St. Louis
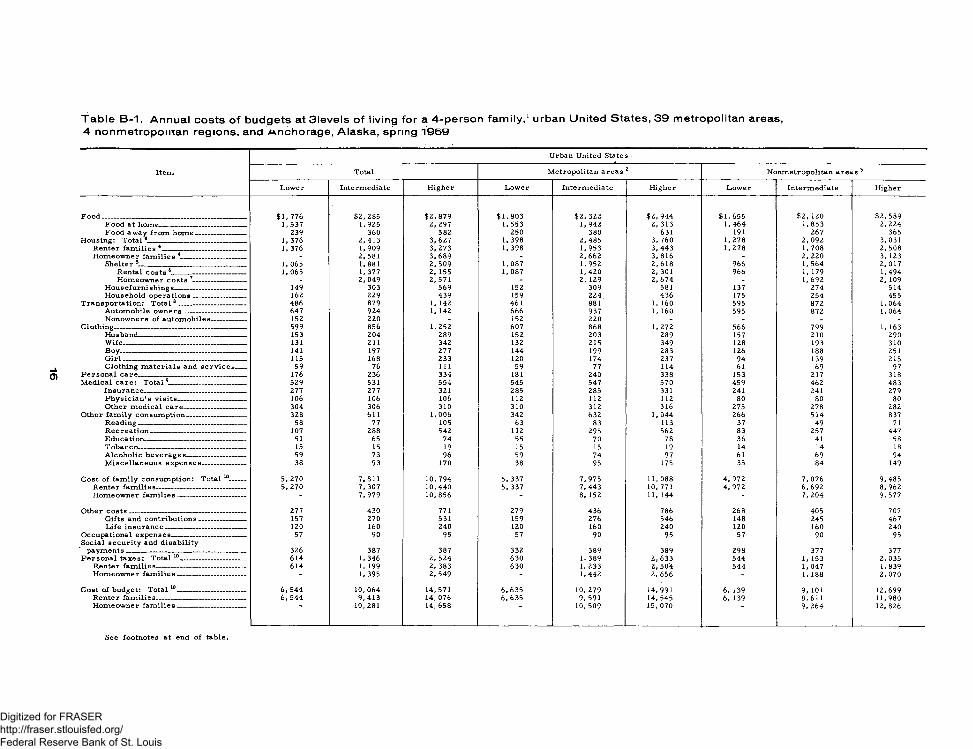
T a b le B -1 . A n n u a l co s ts o f b u d g e ts a t 3 le v e ls o f living fo r a 4 -p e rs o n fa m ily ,1 urban U n ite d S ta te s , 3 9 m etro p o lita n a re a s ,4 n o n m e tro p o in a n reg ion s , and A n c h o ra g e , A la s k a , spring 1 9 6 9
Urban United States -
Item Total Metropolitan areas 2 Nonmetropolitan areas 3
Lower Intermediate Higher Lower Intermediate Higher Lower Intermediate Higher
Food------------------------------------------------------------------ $1, 776 $2 ,285 $ 2 ,8 7 9 $ 1 ,8 0 3 $2, 322 $ 2 ,9 4 4 $1 ,655 $ 2 ,1 2 0 $2 ,589Food at home 1,537 1,925 2 ,2 97 1, 553 1, 942 2, 313 1 ,464 1, 853 2, 224Food away from hom e----------------------- 239 360 582 250 380 631 191 267 365
Housing: T otal4_____________________________ 1, 376 2 ,413 3, 627 1, 398 2 ,4 85 3, 760 1, 278 2, 092 3, 031Renter fa m ilie s4_________________________ 1, 376 1,909 3, 273 1, 398 1, 953 3, 443 1, 278 1,708 2, 508Homeowner fam ilies 4__________________ _ 2, 581 3 ,6 89 - 2, 662 3, 816 - 2, 220 3, 123
Shelter 5________________________________ 1, 065 1, 881 2, 509 1,087 1, 952 2, 618 966 1,564 2, 017Rental costs 6____________________ 1, 065 1,377 2, 155 1, 087 1, 420 2, 301 966 1, 179 1,494Homeowner costs 7------------------------ - 2, 049 2, 571 - 2, 129 2, 674 - 1, 692 2, 109
Housefurnishings_____________________ 149 303 569 152 309 581 137 274 514Household operations________________ 162 229 439 159 224 436 175 254 455
Transportation: Total 8------------------------------- 486 879 1, 142 461 881 1, 160 595 872 1, 064Automobile ow ners____________ ____ 647 924 1, 142 666 937 1, 160 595 872 1,064Nonowners of autom obiles---------------- 152 220 - 152 220 _ - _ _
Clothing---------------------------- ---------------------------- 599 856 1,252 607 868 1, 272 566 799 1, 163Husband__________ ____________________ 153 204 289 152 203 289 157 210 290Wife_____________________________________ 131 211 342 132 215 349 128 193 310Boy______________________________________ 141 197 277 144 199 283 126 188 251G ir l_____________________________________ 115 168 233 120 174 237 94 139 215Clothing m aterials and services___ 59 76 111 59 77 114 61 69 97
Personal care______________________________ 176 236 334 181 240 338 153 217 318M edical care: T ota l9_______ — --------------- 529 531 554 545 547 570 459 462 483
Insurance____________________________ _ 277 277 321 285 285 331 241 241 279P hysician '8 visits------------------------------- 106 106 106 112 112 112 80 80 80Other m edical care___________________ 304 306 310 310 312 316 275 278 282
Other fam ily consumption__________________ 328 611 1,006 342 632 1, 044 266 514 837Reading________________________________ 58 77 105 63 83 113 37 49 71Recreation------------------------------------------- 107 288 542 112 295 562 83 257 447Education_______________________________ 51 65 74 55 70 78 36 41 58Tobacco________________________________ 15 15 19 15 15 19 14 14 18Alcoholic beverages__________________ 59 73 96 59 74 97 61 69 94M iscellaneous expenses-------------------- 38 93 170 38 95 175 35 84 149
Cost of fam ily consumption: Total 10-------- 5, 270 7,811 10 ,794 5, 337 7, 975 11,088 4, 972 7, 076 9, 485Renter fam ilies-------------------------------------- 5, 270 7, 307 10,440 5, 337 7, 443 10, 771 4, 972 6 ,6 9 2 8, 962Homeowner fa m ilies ------------------------------- - 7 ,9 79 10,856 - 8, 152 11, 144 " 7, 204 9, 577
Other c o s ts ----------------------------------------------------- 277 430 771 279 436 786 268 405 707Gifts and contributions______________ 157 270 531 159 276 546 148 245 467Life insurance------------------------------------- 120 160 240 120 160 240 120 160 240
Occupational expenses----------------------------------Social security and disability
57 90 95 57 90 95 57 90 95
paym ents____________________________________ 326 387 387 332 389 389 298 377 377Personal taxes: Total 10------------------------------ 614 1, 346 2, 524 630 1, 389 2, 633 544 1, 153 2, 035
Renter fam ilies------------- --------------------— 614 1, 199 2, 383 630 1, 233 2, 504 544 1,047 1,839Homeowner fa m ilies ------------------------------- ~ 1, 395 2, 549 - 1,442 2, 656 - 1, 188 2, 070
Cost of budget: Total 10____________________ 6, 544 10,064 14,571 6 ,6 35 10,279 14,991 6, 139 9, 101 12,699Renter fam ilies----------------------------------------- 6, 544 9 ,4 13 14,076 6 ,6 35 9,591 14,545 6, 139 8, 611 11,980Homeowner fa m ilies------------------------------- 10,281 14,658 10,509 15,070 9, 264 12,826
See footnotes at end of table,
Digitized for FRASER http://fraser.stlouisfed.org/ Federal Reserve Bank of St. Louis
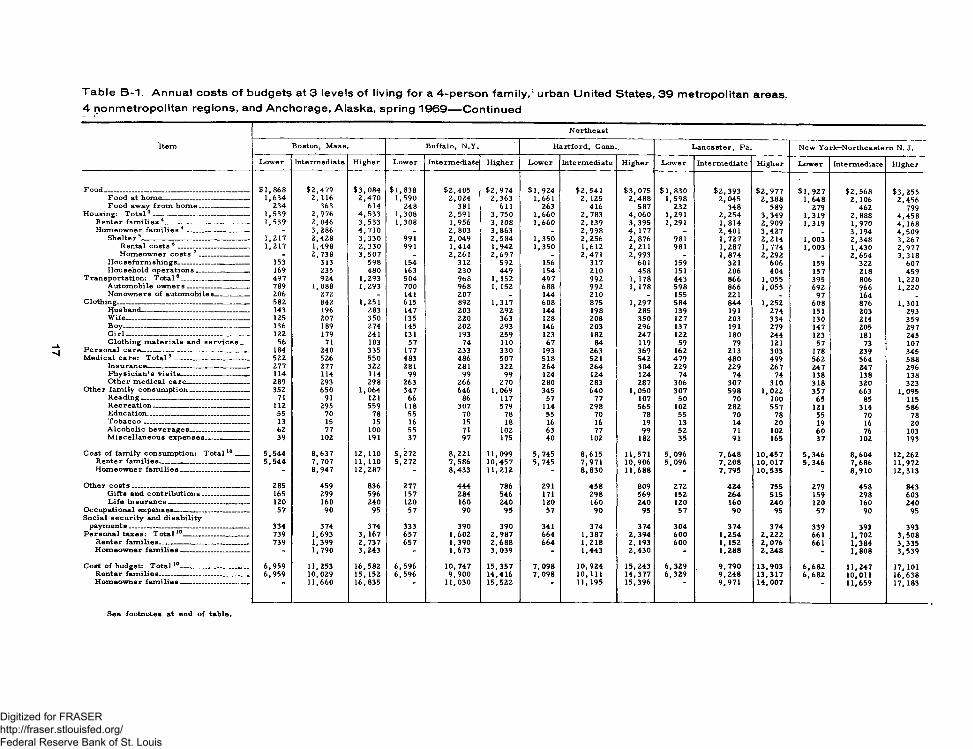
T a b le B -1 . A n n u a l c o s ts o f b ud gets a t 3 levels o f liv ing fo r a 4 -p e rs o n fa m ily ,1 u rban U n ite d S ta te s , 3 9 m etro p o lita n areas ,4 non m e tro p o lita n reg ion s , and A n ch o ra g e , A la s k a , spring 1 9 6 9 — C o n tin u e d
Item
Northeast
Boston, Mass Buffalo, N .Y . Hartford, Conn.. Lancaster, Pa. New York-Northeastern N. J.
Lower Intermediate Higher Lower Intermediate Higher Lower Intermediate Higher Lower Intermediate Higher Lower Intermediate Higher
Food__ _______________________________________ $ 1 ,8 6 8 $ 2 ,4 7 9 $ 3 ,0 8 4 $ 1 ,8 3 8 $ 2 ,4 0 5 $ 2 ,9 7 4 $ 1 ,9 2 4 $ 2 ,5 4 1 $ 3 ,0 7 5 $ 1 ,8 3 0 $ 2 ,3 9 3 $ 2 ,9 7 7 $ 1 ,9 2 7 $ 2 ,5 6 8 $3 ,2 5 5F ood at home______________________ 1 ,634 2, 116 2 ,4 7 0 1,590 2 ,0 2 4 2 ,3 63 1,661 2, 125 2 ,4 8 8 1,5 98 2 ,0 4 5 2 ,3 8 8 1,6 48 2, 106 2 ,4 56Food away from h om e_______________ 234 363 614 248 381 611 263 416 587 232 348 589 279 462 799
Housing: T o ta l4 -------------------------------------------- 1,539 2, 976 4 ,5 3 3 1,308 2,5 91 3, 750 1 ,660 2 ,7 83 4 ,0 6 0 1,291 2 ,2 5 4 3 ,3 4 9 1,319 2,8 88 4 ,4 5 8Renter fam ilies 4____________ __________ 1 ,539 2,0 46 3 ,5 33 1,3 08 1,956 3, 108 1,660 2, 139 3 ,3 95 1,291 1,8 14 2 ,9 0 9 1,319 1,970 4 , 168Homeowner fa m ilie s4 ___________________ - 3 ,2 86 4 , 710 - 2,8 03 3 ,8 63 - 2 ,9 9 8 4 , 177 _ 2 ,4 0 1 3 ,4 2 7 _ 3, 194 4 ,5 0 9
Shelter 5________________________________ 1,217 2,4 28 3 ,3 3 0 991 2, 049 2 ,5 8 4 1,350 2 ,2 5 6 2,8 76 981 1,7 27 2 ,2 1 4 1,003 2,3 48 3,2 67Rental costs 6 _____________________ 1 ,217 1,498 2 ,3 3 0 991 1,414 1,942 1,350 1,612 2,2 11 981 1,2 87 1, 774 1 ,003 1,430 2,9 77Homeowner costs 7 _______________ - 2, 738 3 ,5 0 7 - 2 ,261 2 ,6 9 7 _ 2 ,4 71 2 ,9 93 _ 1 ,8 74 2 ,2 9 2 _ 2 ,6 54 3 ,3 18
Housefurnishings___________ _______ 153 313 598 154 312 592 156 317 601 159 321 606 159 322 607Household operations______________ 169 235 480 163 230 449 154 210 458 151 206 404 157 218 459
Transportation: T o ta l8____________________ 497 924 1,293 504 968 1, 152 497 992 1, 178 443 866 1,055 395 806 1,220Automobile ow ners_________ ________ 789 1,088 1,293 700 968 1, 152 688 992 1, 178 598 866 1,055 692 966 1,220Nonowners of autom obiles__________ 206 272 - 141 207 _ 144 210 _ 155 221 _ 97 164 _
Clothing___________________________ _______ __ 582 842 1,251 615 892 1,317 608 875 1,297 584 844 1,252 608 876 1,301Husband________________________________ 143 196 283 147 203 292 144 198 285 139 191 274 151 203 293W ife_____________________________________ 125 207 350 135 220 363 128 208 350 127 203 334 130 214 359Boy--------------------------------------------------------- 136 189 274 145 202 293 146 203 296 137 191 279 147 205 297G ir l_____________________________________ 122 179 241 131 193 259 123 182 247 122 180 244 123 181 245Clothing m aterials and services___ 56 71 103 57 74 110 67 84 119 59 79 121 57 73 107
P ersonal care____________________ _________ 184 240 335 177 233 330 193 263 369 162 213 303 178 239 345M edical care: T o ta l9 _________ _________ 522 526 550 483 486 507 518 521 542 479 480 499 562 564 588
Insurance— __ ____________ _______ 277 277 322 281 281 322 264 264 304 229 229 267 247 247 296Physician's visits_______________ __ 114 114 114 99 99 99 124 124 124 74 74 74 138 138 138Other m edical care _______________ 289 293 298 263 266 270 280 283 287 306 307 310 318 320 323
Other fam ily consumption__________________ 352 650 1,064 347 646 1,069 345 640 1,050 307 598 1, 022 357 663 1,095Reading ---------- --------------------------- __ 71 91 121 66 86 117 57 77 107 50 70 100 65 85 115Recreation------------ __ _____________ 112 295 559 118 307 579 114 298 565 102 282 557 121 314 586Education-------------------- -------- 55 70 78 55 70 78 55 70 78 55 70 78 55 70 78Tobacco _______________________________ 13 15 15 16 15 18 16 16 19 13 14 20 19 16 20Alcoholic beverages___ ____ _ „ __ 62 77 100 55 71 102 63 77 99 52 71 102 60 76 103M iscellaneous expenses____ _____ 39 102 191 37 97 175 40 102 182 35 91 165 37 102 193
Cost of fam ily consumption: T o ta l10____ 5 ,5 4 4 8,6 37 12 ,110 5 ,2 7 2 8,2 21 11,099 5,7 45 8 ,6 15 11,571 5 ,0 9 6 7 ,6 4 8 10 ,457 5 ,3 4 6 8 ,604 12,262Renter fam ilies ____ ___________ :____ 5 ,5 4 4 7, 707 11 ,110 5 ,2 7 2 7,586 10 ,457 5,7 45 7,9 71 10,906 5 ,0 9 6 7 ,2 0 8 10 ,017 5 ,3 46 7,686 11,972Homeowner fa m ilie s____________________ - 8 ,9 47 12 ,287 - 8 ,433 11,212 " 8 ,8 3 0 11 ,688 - 7 ,7 9 5 10,535 - 8 ,9 10 12,313
Other c o s ts __________ _______ ____________ 285 459 836 277 444 786 291 458 809 272 424 755 279 458 843Gifts and contributions______________ 165 299 596 157 284 546 171 298 569 152 264 515 159 298 603Life insurance— ----------------- _ 120 160 240 120 160 240 120 160 240 120 160 240 120 160 240
Occupational expenses___________ _________ 57 90 95 57 90 95 57 90 95 57 90 95 57 90 95Social security and disability
paym ents. __ ________________ __ __ 334 374 374 333 390 390 341 374 374 304 374 374 339 393 393Personal taxes: T o ta l10_________ - _ ___ 739 1,693 3, 167 657 1,602 2 ,9 8 7 664 1,3 87 2 ,3 94 600 1,2 54 2 ,2 2 2 661 1,702 3 ,5 08
Renter fam ilies __ _____________________ 739 1,399 2 ,7 3 7 657 1,390 2 ,6 8 8 664 1 ,218 2, 193 600 1, 152 2 ,0 76 661 1,384 3,3 35Homeowner fa m ilie s— _____ ____ __ - 1 ,790 3 ,2 43 - 1,673 3 ,0 3 9 - 1 ,443 2 ,4 3 0 - 1 ,2 88 2 ,2 4 8 - 1 ,808 3,5 39
Cost of budget: T o ta l10____________________ 6 ,9 5 9 11,253 16 ,582 6 ,5 9 6 10, 747 15 ,357 7, 098 10 ,924 15,243 6 ,3 2 9 9 , 790 13,903 6 ,6 8 2 11,247 17,101Renter fam ilies __ __ --------------------- __ 6 ,9 59 10,029 15 ,152 6 ,5 9 6 9 ,9 0 0 14 ,416 7 ,0 9 8 1 0 ,111 14,377 6 ,3 2 9 9 ,2 4 8 13 ,317 6 ,6 8 2 10,011 16,638Homeowner fa m ilies___________________ 11 ,660 16 ,835 11,030 15 ,522 11 ,195 15,396 9 ,9 7 1 14 ,007
'
11,659 17,183
See footnotes at end of table,
Digitized for FRASER http://fraser.stlouisfed.org/ Federal Reserve Bank of St. Louis

T a b le B -1 . A n n u a l c o s ts o f b u d g e ts a t 3 levels o f living fo r a 4 -p e rs o n fa m ily ,1 u rban U n ite d S ta te s , 3 9 m etro p o lita n a re a s ,4 n o n m e tro p o lita n reg io n s , and A n c h o ra g e , A la s k a , spring 1 9 6 9 — C o n tin u e d
Item
Northeast— Continued
Philadelphia, P a .—N. J. Pittsburgh, Pa. Portland, Maine Nonmetropolitan areas
Lower Intermediate Higher Lower Intermediate Higher Lower Intermediate Higher Lower Intermediate Higher
Food — — ___ _____ _ _ _ _ _ $ 1 ,909 $2 ,497 $3 ,093 $1 ,801 $2 ,357 $ 2 ,944 $1 ,807 $2 ,413 $ 2 ,989 $1 ,7 7 5 $2 ,312 $2 ,805Food at home _____ ___ 1,646 2 ,0 98 2,4 52 1,549 1,981 2, 324 1 ,568 2,071 2 ,4 2 7 1,576 2 ,0 22 •2, 384Food away from h om e----------------------- 263 399 641 252 376 620 239 342 562 199 290 421
Housing: T o ta l4 ------ 1 ,2 13 2, 351 3 ,584 1,259 2, 144 3, 337 1 ,404 2, 379 3, 383 1,227 2 ,4 0 3 3, 373Renter fam ilies 4__ 1,2 13 1,683 3,711 1,259 1,696 2 ,7 2 0 1,404 1,815 2 ,7 5 2 1,227 1,672 2 ,4 04Homeowner fam ilies 4_ -------- - - _ 2 ,5 73 3,562 - 2 ,2 9 3 3,4 46 - - 2 ,5 67 3 ,4 94 - 2 ,6 46 3,5 44
Shelter5 _ ___ _______ 910 1,820 2,417 950 1,608 2, 178 1 ,067 1,812 2 ,2 03 924 1,888 2, 371Rental c o sts6 __ ----- ------ 910 1, 152 2 ,544 950 1,160 1,561 1,067 1,248 1,572 924 1,157 1,402Homeowner costs 7------------------------ _ 2 ,0 42 2, 395 _ 1,757 2 ,2 87 - 2 ,0 00 2, 314 - 2, 131 2 ,5 42
Housefurnishings--------------------------------- 155 317 614 157 318 604 158 322 609 137 274 496Household operations________________ 148 214 428 152 218 430 179 245 446 166 241 461
Transportation: T o ta l8------------------------------- 445 834 1, 185 470 864 1,092 462 927 1, 115 624 900 1, 107Automobile ow n ers___________________ 715 982 1,185 626 897 1,092 638 927 1, 115 624 900 1, 107Nonowners of autom obiles---------------- 175 241 _ 181 248 - 134 200 - - - -
Clothing------------------------------------------------------------ 590 852 1,262 584 852 1,2 64 630 906 1,335 569 790 1, 151140 190 272 142 195 280 156 212 303 149 201 273
W ife . - - ..................................... 129 210 347 125 211 354 138 221 365 128 186 308147 203 295 138 193 280 147 205 297 139 198 250
G iH ..................................................................... 120 177 238 120 177 240 133 196 264 90 134 222Clothing m aterials and serv ices----- 54 72 110 59 76 110 56 72 106 63 71 98
Personal care------------------------------------------------- 177 231 322 182 240 335 175 228 320 152 215 321M edical care: T o ta l9----------------------------------- 504 507 529 468 471 492 551 553 570 472 474 494
Insurance______________________________ 318 318 359 208 208 249 350 350 385 266 266 306Physician's v is its ------------------------------- 103 103 103 94 94 94 107 107 107 90 90 90Other m edical care---------------------------- 264 267 272 285 288 291 294 296 297 268 270 272
Other fam ily consumption--------------------------- 339 633 1,057 329 624 1,063 368 664 1,061 264 525 847Reading--------------------------- ----------------------- 67 87 117 67 87 117 72 92 122 39 51 73R ecreation-------------------------------------------- 108 292 562 108 296 570 120 311 581 87 266 441Education— - - — — -------------- 55 70 78 55 70 78 55 70 78 36 41 58Tobacco- -------------------------------------- 16 15 20 15 14 19 17 15 22 13 14 20Alcoholic beverages--------------------------- 57 75 106 49 67 113 66 80 88 54 63 96Miscellaneous expenses-------------------- 36 94 174 35 90 166 38 96 170 35 90 159
Cost of fam ily consumption: Total 10-------- 5 , 177 7 ,9 05 11,032 5 ,0 93 7 ,5 52 10,527 5, 397 8 ,0 70 10,773 5 ,0 8 3 7,6 19 10,098Renter fam ilies----------------------------------------- 5, 177 7 ,2 37 11,159 5 ,0 93 7, 104 9 ,9 1 0 5, 397 7 ,5 06 10 ,142 5 ,0 83 6, 888 9, 129Homeowner fa m ilie s____________________ - 8, 127 11,010 - 7 ,7 01 10,636 - 8 ,2 58 10 ,884 7 ,8 6 2 10,269
Other c o s ts ___________________________________ 274 433 783 272 421 758 281 439 770 271 424 737Gifts and contributions--------------- — 154 273 543 152 261 518 161 279 530 151 264 497Life insurance------------------------------------- 120 160 240 120 160 240 120 160 240 120 160 240
Occupational expenses---------------------------------- 57 90 95 57 90 95 57 90 95 57 90 95Social security and disability
paym ents____________________________________ 316 378 378 304 374 374 318 374 374 317 388 388Personal taxes: Total 10------------------------------ 671 1,415 2,5 36 606 1,247 2 ,2 5 8 580 1,236 2, 134 572 1,295 2, 239
Renter fam ilies----------------------------------------- 671 1,242 2,579 606 1, 144 2 ,0 6 8 580 1,106 1,933 572 1,092 1,884Homeowner fa m ilie s ------------------------------- - 1,473 2,529 - 1,281 2, 291 - 1,279 2, 169 1 ,363 2, 301
Cost of budget: Total 10____________________ 6 ,4 9 5 10,221 14,824 6, 332 9 ,6 8 4 14 ,012 6 ,6 33 10,209 14,146 6, 300 9 ,8 16 13,557Renter fam ilies----------------------------------------- 6 ,4 9 5 9 ,3 80 14,994 6 ,3 3 2 9 ,1 3 3 13,205 6 ,6 3 3 9 ,5 1 5 13 ,314 6 ,3 0 0 8 ,8 8 2 12,233Homeowner fa m ilie s -------------------------------
'
10,501 14,795 9, 867 14,154 10,440 14 ,292 10,127 13,790
See footnotes at end of table.
Digitized for FRASER http://fraser.stlouisfed.org/ Federal Reserve Bank of St. Louis
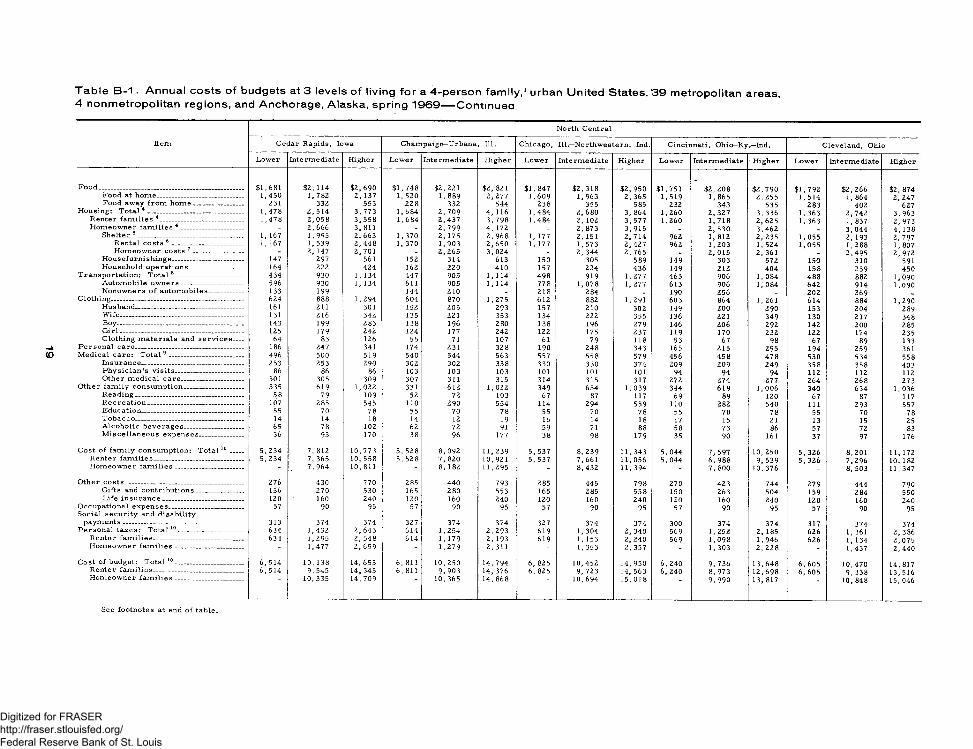
T a b le B -1 . A n n u a l c o s ts o f b udgets at 3 levels o f living fo r a 4 -p e rs o n fa m ily ,1 u rban U n ite d S ta te s , 3 9 m e tro p o litan a re a s ,4 n o n m e tro p o lita n reg io n s , and A n ch o ra g e , A laska , s p ring 1 9 6 9 — C o n tin u e a
Item
North Central
Cedar Rapids, Iowa Champaign—Urbana, 111. Chicago, 111.—Northwestern, Ind. Cincinnati, Ohio—Ky.—Ind. Cleveland, Ohio
Lower Intermediate Higher Lower Intermediate Higher Lower Intermediate Higher Lower Intermediate Higher Lower Intermediate Higher
Food___________________________________________ $1,681 $2 ,114 $2,690 $1, 748 $2,221 $2,821 $1 ,847 $2 ,318 $2 ,950 $1,751 $2 ,208 $2 ,790 $1 ,792 $2,266 $2, 874Food at home__________________________ 1,450 1, 782 2, 137 1, 520 1,889 2 ,277 1,609 1, 963 2, 365 1 ,519 1, 865 2, 255 1 ,5 14 1, 864 2, 247Food away from h om e_______________ 231 332 553 228 332 544 238 355 585 232 343 535 283 402 627
Housing: Total 4 _____________________________ 1 ,478 2 ,5 1 4 3,7 73 1,6 84 2, 709 4, 116 1 ,4 84 2 ,6 8 0 3, 864 1,260 2, 327 3, 336 1 ,363 2, 742 3, 963Renter fam ilies 4_________________________ 1,478 2 ,0 5 8 3 ,5 5 8 1,684 2 ,4 37 3 ,7 9 8 1,484 2, 102 3 ,5 77 1,260 1,7 18 2, 625 1 ,363 1, 837 2, 973Homeowner fam ilies 4 _______________ __ - 2,6 66 3, 811 - 2 ,7 9 9 4, 172 _ 2 ,873 3, 915 _ 2, 530 3 ,4 62 _ 3, 044 4, 138
Shelter 5 _______________________________ 1, 167 1,995 2, 663 1, 370 2, 175 2, 968 1, 177 2 ,151 2, 714 962 1, 812 2, 235 1,055 2, 193 2, 797Rental costs 6 _____________________ 1, 167 1,539 2 ,4 4 8 1, 370 1 ,903 2 ,6 50 1, 177 1 ,573 2,4 27 962 1,203 1 ,524 1,055 1,288 1,807Homeowner costs 7 _______________ - 2, 147 2 ,701 - 2 ,2 6 5 3 ,0 24 - 2, 344 2 ,7 65 _ 2, 015 2, 361 _ 2 ,4 95 2, 972
Housefurnishings_____________________ 147 297 561 152 314 613 150 305 589 149 303 572 150 310 591Household operations________________ 164 222 424 162 220 410 157 224 436 149 212 404 158 239 450
Transportation: Total 8____________________ 434 930 1, 134 447 905 1, 114 498 919 1,277 465 906 1,084 488 882 1,090Automobile ow ners___________________ 596 930 1, 134 611 905 1, 114 778 1,078 1, 277 613 906 1, 084 642 914 1,090Nonowners of autom obiles__________ 133 199 - 144 210 - 218 284 _ 190 256 _ 202 269
Clothing________________________________________ 624 888 1,294 604 870 1,275 612 882 1,291 603 864 1,261 614 884 1,290Husband------------------------------------------------- 161 211 301 152 205 293 157 210 302 149 200 290 153 204 289Wife_____________________________________ 131 216 342 135 221 353 134 222 355 136 221 349 130 217 348Boy— ___________________________________ 143 199 283 138 196 280 138 196 279 146 206 292 142 200 285G ir l_____________________________________ 125 179 242 124 177 242 122 175 237 119 170 232 122 174 235Clothing m aterials and services___ 64 83 126 55 71 107 61 79 118 53 67 98 67 89 133
Personal care________________________________ 186 247 341 174 231 328 190 248 343 165 215 295 194 259 361M edical care: Total 9 _________ ____________ 496 500 519 540 544 563 557 558 579 456 458 478 530 534 558
Insurance______________________________ 253 253 290 302 302 338 330 330 374 209 209 249 358 358 403Physician's visits____________________ 86 86 86 103 103 103 101 101 101 94 94 94 112 112 112Other m edical care__________________ 301 305 309 307 311 315 314 315 317 272 274 277 264 268 273
Other fam ily consumption__________________ 335 619 1,022 331 612 1,022 349 634 1, 039 344 619 1,006 340 634 1,036Reading________________________________ 58 79 109 52 72 103 67 87 117 69 89 120 67 87 117R ecreation-------------------------------------------- 107 285 545 no 290 554 114 294 559 110 282 540 111 293 557Education______________________________ 55 70 78 55 70 78 55 70 78 55 70 78 55 70 78Tobacco________________________________ 14 14 18 14 12 19 16 14 18 17 15 21 13 15 25Alcoholic beverages__________________ 65 78 102 62 72 91 59 71 88 58 73 86 57 72 83M iscellaneous expenses_____________ 36 93 170 38 96 177 38 98 179 35 90 161 37 97 176
Cost of fam ily consumption: Total 10____ 5 ,2 34 7, 812 10,773 5, 528 8, 092 11 ,239 5, 537 8, 239 11,343 5, 044 7, 597 10,250 5, 326 8,201 11, 172Renter fam ilies___________________________ 5 ,2 34 7, 365 10 ,558 5, 528 7, 820 10,921 5, 537 7, 661 11,056 5, 044 6, 988 9, 539 5, 326 7 ,296 10,182Homeowner fa m ilie s____________________ - 7 ,9 64 10,811 - 8, 182 11,295 8,432 11 ,394 - 7, 800 10,376 - 8, 503 11,347
Other c o s ts ___________________________________ 276 430 770 285 440 793 285 445 798 270 423 744 279 444 790Gifts and contributions______________ 156 270 530 165 280 553 165 285 558 150 263 504 159 284 550Life insurance________________________ 120 160 240 120 160 240 120 160 240 120 160 240 120 160 240
Occupational expenses 57 90 95 57 90 95 57 90 95 57 90 95 57 90 95Social security and disability
paym ents________ ____ ______________________ 313 374 374 327 374 374 327 374 374 300 374 374 317 374 374Personal taxes: T o ta l10---------------------------- 634 1,432 2, 643 614 1,254 2 ,2 9 3 619 1,304 2, 340 569 1,252 2, 185 626 1, 361 2, 386
Renter fam ilies___________________________ 634 1,295 2, 548 614 1, 179 2, 193 619 1, 153 2, 240 569 1 ,098 1,946 626 1, 134 2 ,075Homeowner fa m ilie s____________________ - 1,477 2, 659 - 1,279 2,311 - 1,353 2, 357 - 1, 303 2, 228 - 1,437 2,4 40
Cost of budget: Total 10____________________ 6, 514 10,138 14,655 6, 811 10 ,250 14 ,794 6, 825 10,452 14 ,950 6, 240 9, 736 13 ,648 6, 605 10,470 14,817Renter fam ilies 6, 514 9, 545 14,345 6, 811 9, 903 14,376 6, 825 9, 723 14,563 6, 240 8, 973 12 ,698 6, 605 9 ,3 3 8 13,516Homeowner fam ilies 10,335 14,709 10,365 14 ,868 10,694 15 ,018 9, 990 13,817 10,848 15,046
See footnotes at end of table.
Digitized for FRASER http://fraser.stlouisfed.org/ Federal Reserve Bank of St. Louis

T a b le B -1 . A n n u a l c o s ts o f b u d g e ts a t 3 levels o f living fo r a 4 -p e rs o n fa m ily ,1 u rban U n ite d S ta te s , 3 9 m e tro p o lita n areas ,4 n o n m e tro p o lita n reg io n s , and A n c h o ra g e , A la s k a , spring 1 9 6 9 ------C o n tin u e d
Item
North Central— Continued
Dayton, Ohio Detroit, Mich. Green Bay, W is. Indianapolis, Ind. Kansas City, M o .—1<ans.
Lower Intermediate Higher Lower Intermediate Higher Lower Intermediate Higher Lower Intermediate Higher Lower Intermediate Higher
$1 ,7 4 2 $2, 198 $2 ,784 $1,819 $2 ,313 $2 ,942 $1 ,681 $2 ,124 $2 ,665 $1 ,781 $2 ,252 $ 2 ,870 $ 1 ,794 $2 ,266 $2 ,943Food at home__________________________ 1 ,5 14 1,871 2,251 1,570 1,941 2, 358 1,474 1,820 2, 195 1,545 1,906 2, 303 1 ,554 1,925 2, 330
228 327 533 249 372 584 207 304 470 236 346 567 240 341 613Housing: T o ta l4_____________________________ 1, 381 2, 192 3,460 1,259 2 ,2 58 3,505 1,279 2 ,2 92 3,4 58 1,476 2,567 3,825 1, 347 2 ,3 1 8 3, 567
Renter fam ilies 4_________________________ 1, 381 1,892 3,444 1, 259 1 ,818 3, 352 1,279 1,750 2 ,8 52 1,476 2 ,0 33 3,019 1, 347 1 ,912 3, 128Homeowner fam ilies 4____________________ _ 2,292 3,463 _ 2 ,4 05 3, 532 - 2 ,4 72 3,565 - 2 ,7 45 3,967 - 2 ,4 5 3 3,645
Shelter 5________________________________ 1,071 1,670 2, 355 968 1,738 2, 345 969 1,766 2, 341 1, 164 2 ,0 46 2,7 03 1,037 1,785 2,4 23Rental costs 6______________________ 1,071 1, 370 2, 339 968 1,298 2, 192 969 1,224 1,736 1, 164 1,512 1,897 1,037 1,379 1,984Homeowner costs 7------------------------ _ 1,770 2, 358 _ 1,885 2, 372 - 1,946 2 ,4 48 - 2 ,2 24 2,8 45 - 1 ,920 2,501
Housefurnishings--------------------------------- 150 304 583 149 307 591 150 308 594 141 288 556 145 296 570Household operations------------------------ 160 218 397 142 213 444 160 218 398 171 233 441 165 237 449
Transportation: T o ta l8------------------------------- 440 861 1,077 482 889 1,113 424 859 1,054 470 948 1,130 499 952 1, 191Automobile ow ners---------------------------- 594 861 1,077 650 923 1, 113 591 859 1,054 637 948 1,130 651 952 1, 191Nonowners of autom obiles---------------- 154 220 _ 171 237 - 112 178 - 158 224 - 217 283 -
Clothing------------------------------------------------------------ 609 875 1,277 611 881 1,288 601 860 1,252 602 866 1,272 599 865 1,262Husband------------------------------------------------- 158 211 300 159 213 307 149 200 286 156 209 303 151 202 289W ife_____________________________________ 134 220 352 127 217 348 135 218 342 131 215 343 133 220 349Boy--------------------------------------------------------- 144 204 291 139 197 281 136 192 274 138 196 281 141 201 286G ir l_____________________________________ 118 169 229 125 175 234 119 170 230 118 170 231 116 167 227Clothing m aterials and serv ic es----- 55 71 105 61 79 118 62 80 120 59 76 114 58 75 111
Personal care------------------------------------------------- 172 225 314 192 255 352 171 221 301 175 233 329 194 258 36 3M edical care: T o ta l9----------------------------------- 462 464 483 511 515 540 457 458 477 542 544 565 520 522 542
Insurance______________________________ 209 209 249 323 323 370 218 218 218 304 304 345 232 232 274Physician 's visits------------------------------- 97 97 97 103 103 103 73 73 73 98 98 98 100 100 100Other m edical care___________________ 275 277 279 269 273 278 290 291 293 313 315 319 320 322 324
Other fam ily consumption--------------------------- 346 630 1,034 338 621 1,036 316 586 975 364 668 1,076 338 624 1,030Reading------------------------------------------------- 67 87 117 69 89 120 62 82 1 12 67 88 118 66 86 116R ecreation_____________________________ 116 297 560 107 283 544 100 267 523 132 324 590 108 287 548Education---------------------------------------------- 55 70 78 55 70 78 55 70 78 55 70 78 55 70 78Tobacco------------------------------------------------- 14 14 19 13 15 19 12 13 15 13 12 15 13 14 20Alcoholic beverages--------------------------- 58 74 96 58 72 105 53 66 87 60 78 101 59 74 96M iscellaneous expenses-------------------- 36 88 164 36 92 170 34 88 160 38 96 174 37 93 172
Cost of fam ily consumption: Total 10-------- 5, 152 7 ,4 45 10,429 5,212 7 ,7 32 10,776 4 ,9 2 9 7 ,4 0 0 10,182 5,411 8,0 78 11,067 5,291 7 ,8 0 5 10,898Renter fam ilies----------------------------------------- 5, 152 7, 145 10,413 5,212 7 ,2 9 2 10,623 4 ,9 2 9 6 ,8 58 9,5 77 5,411 7 ,5 44 10,261 5,291 7,3 99 10,459Homeowner fa m ilie s ------------------------------- - 7 ,5 45 10,432 " 7 ,8 79 10,803 - 7 ,5 80 10,289 8,2 56 11,209 " 7 ,9 4 0 10,976
Other c o sts ----------------------------------------------------- 273 417 753 275 427 770 267 416 741 281 439 785 278 430 776Gifts and contributions---------------------- 153 257 513 155 267 530 147 256 501 161 279 545 158 270 536Life insurance------------------------------------- 120 160 240 120 160 240 120 160 240 120 160 240 120 160 240
Occupational expenses---------------------------------- 57 90 95 57 90 95 57 90 95 57 90 95 57 90 95Social security and disability
paym ents------------------------------------------------------- 307 374 374 311 374 374 299 374 374 323 374 374 316 374 374Personal taxes: Total 10------------------------------ 608 1, 196 2, 189 626 1,326 2,4 94 678 1,528 2,9 06 649 1,396 2 ,5 03 630 1, 335 2 ,5 19
Renter fam ilies----------------------------------------- 608 1, 123 2, 189 626 1,241 2,4 75 678 1, 359 2 ,6 25 649 1,234 2,2 19 630 1,222 2, 361Homeowner fa m ilie s ------------------------------- - 1 ,220 2, 189 - 1,355 2,4 97 " 1 ,584 2,9 55 " 1,450 2 ,5 53 - 1, 372 2 ,547
Cost of budget: Total 10------------------------------- 6, 397 9, 522 13,840 6,481 9,9 49 14,509 6 ,2 30 9 ,8 0 8 14,298 6,721 10,377 14,824 6 ,5 72 10 ,034 14,662Renter fam ilies----------------------------------------- 6, 397 9, 149 13,824 6,481 9 ,4 2 4 14,337 6 ,2 3 0 9 ,0 97 13,412 6,721 9,681 13,734 6 ,5 7 2 9 ,5 1 5 14,065Homeowner fa m ilie s -------------------------------
'
9,6 46 13,843 10,125 14,539 10,044 14,454 10,609 15,016 10,206 14,768
See footnotes at end of table.
Digitized for FRASER http://fraser.stlouisfed.org/ Federal Reserve Bank of St. Louis
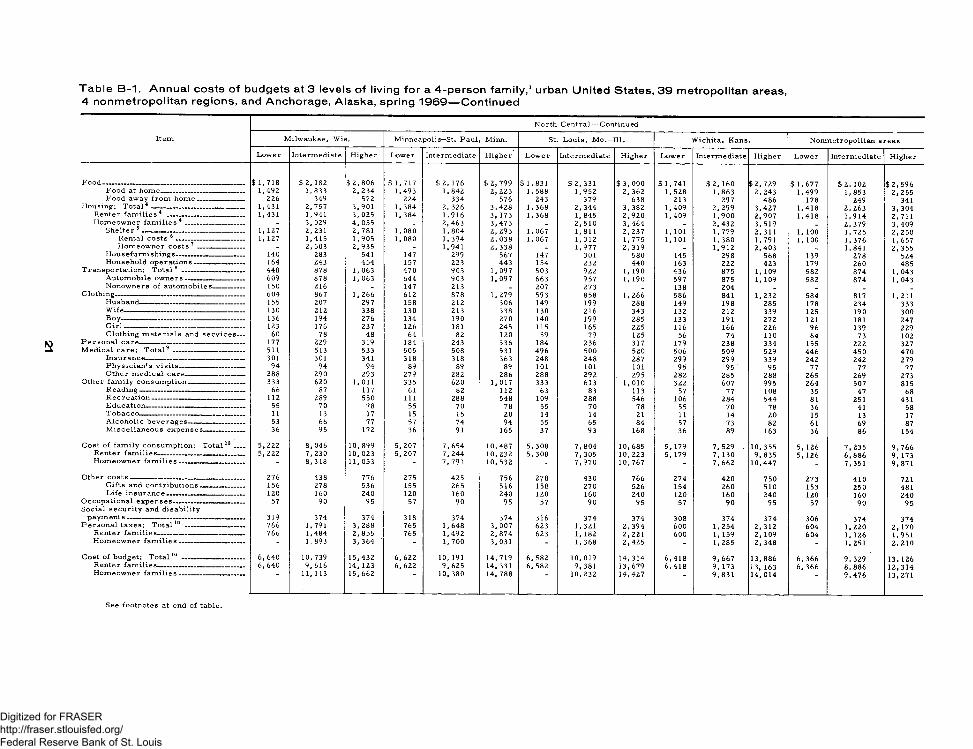
T a b le B -1 . A n n u a l co s ts o f b u d gets at 3 levels o f living fo r a 4 -p e rs o n fa m ily ,1 u rban U n ite d S ta te s , 3 9 m etro p o lita n areas ,4 n o n m e tro p o lita n reg ion s , and A n ch o ra g e , A la s k a , spring 1 9 6 9 — C o n tin u e d
N o r th C e n t r a l — C o n tin u e d
Item lvMilwaukee, Wis. Minneapolis—St. Paul,, Minn. St.. Loui s , M o. —Ill. Wichita, Kans. Nonmetropolitan areas
Lower Intermediate Higher Lower Intermediate Higher Lower Intermediate Higher Lower Intermediate Higher Lower Intermediate Higher
Food------------------------------ _ __________________ $ 1,718 $ 2, 182 $ 2 ,8 0 6 $ 1,717 $ 2 ,1 76 $ 2, 799 $ 1,831 $ 2 ,331 $ 3 ,0 00 $ 1,741 $ 2, 160 $ 2 ,7 2 9 $ 1 ,677 $ 2, 102 $ 2, 596Food at home_________________________ 1,492 1,833 2, 234 1,493 1,842 2, 223 1,588 1,952 2, 362 1 ,528 1,863 2, 243 1,499 1,853 2,2 55Food away from h om e______________ 226 349 572 224 334 576 243 379 638 213 297 486 . 178 249 341
Housing: T ota l4 ---------------------------- _ _ 1,431 2, 757 3, 901 1 ,384 2, 326 3 ,4 28 1,368 2, 344 3, 382 1,409 2 ,2 99 3,4 27 1,418 2, 263 3, 304Renter fa m ilie s4 __________ __ __ 1,431 1,941 3, 025 1, 384 1,916 3, 173 1 ,368 1, 845 2 ,9 20 1,409 1,900 2,9 07 1,4 18 1,914 2,711Homeowner fa m ilie s4 __________________ - 3, 029 4, 055 - 2, 463 3 ,473 _ 2, 510 3 ,4 64 _ 2 ,4 32 3, 519 _ 2, 379 3 ,409
Shelter 5 _________________ _____ ____ 1, 127 2,231 2,781 1,080 1,804 2, 293 1,067 1,811 2, 237 1, 101 1,779 2, 311 1, 100 1 ,725 2, 250Rental costs 6 _______ __________ 1, 127 1,415 1,905 1,080 1,394 2, 038 1 ,067 1,312 1,775 1, 101 1, 380 1,791 1, 100 1 ,376 1,657Homeowner c o s ts 7 ______________ - 2, 503 2, 935 - 1,941 2,3 38 _ 1,977 2, 319 _ 1 ,912 2, 403 _ 1,841 2, 355
Housefurnishings----------------------------- 140 283 541 147 299 567 147 301 580 145 298 568 139 278 524Household operations —___ ______— 164 243 454 157 223 443 154 232 440 163 222 423 179 260 485
Transportation: T o ta l8 ________________ _ 448 878 1,063 470 903 1,097 503 922 1, 190 436 875 1, 109 582 874 1, 043609 878 1, 063 644 903 1, 097 663 957 1, 190 597 875 1, 109 582 874 1,043
Nonowners of autom obiles__ _____ 150 216 - 147 213 _ 207 273 _ 138 204 _ _ _ _Clothing____ _____________ ___ ______________ 604 867 1, 266 612 878 1,279 593 858 1,266 586 841 1,232 584 817 1, 211
Husband------- -------- __ ___________ 155 207 297 158 212 306 149 199 288 149 198 285 178 234 333W ife................................................................... 130 212 338 130 213 338 130 216 343 132 212 339 125 190 300Boy------------- ------------------------ ------------ 136 194 276 134 190 270 140 199 285 133 191 272 121 181 247G ir l— ___ _ --------- _ ___ ____ __ 123 176 237 126 181 245 115 165 225 116 166 226 96 139 229Clothing m aterials and services__ 60 78 48 64 82 120 59 79 125 56 74 110 64 73 102
Personal care________ ______ ____________ 177 229 319 184 243 336 184 236 317 179 238 334 155 222 327M edical care: T ota l9 ------------ _ ________ 511 513 533 505 508 531 496 500 520 506 509 529 446 450 470
Insurance----- ---------------- ---- _ __ 301 301 341 318 318 363 248 248 287 299 299 339 242 242 279Physician 's visits_____ -_____________ 94 94 94 89 89 89 101 101 101 95 95 1 95 77 77 77Other m edical care__________________ 288 290 293 279 282 286 288 292 295 282 285 288 265 269 273
Other fam ily consumption_________________ 333 620 1,011 335 620 1,017 333 613 1,010 322 607 995 264 507 815Reading------------ — _______ _________ 66 87 117 61 82 112 63 83 113 57 77 108 35 47 68Recreation________ ____________ 112 289 550 111 288 548 109 288 546 106 284 544 81 251 431Education------------------------------------ ------ 55 70 78 55 70 78 55 70 78 55 70 78 36 41 58Tobacco— — -------------------- _ ----- 11 13 17 15 15 20 14 14 21 11 14 20 15 13 17Alcoholic beverages— ____________ 53 66 77 57 74 94 55 65 84 57 73 82 61 69 87M iscellaneous expenses____________ 36 95 172 36 91 165 37 93 168 36 89 163 36 86 154
Cost of fam ily consumption: T o ta l10___ 5,2 22 8, 046 10,899 5, 207 7, 654 10,487 5, 308 7, 804 10,685 5, 179 7 ,5 29 , 10 ,355 5, 126 7, 235 9 ,7 6 6Renter fam ilies__________________________ 5, 222 7, 230 10,023 5, 207 7, 244 10 ,232 5, 308 7, 305 10,223 5, 179 7, 130 9, 835 5, 126 6 ,8 86 9, 173Homeowner fa m ilie s___________________ - 8, 318 11,053 - 7, 791 10,532 - 7 ,9 7 0 10,767 - 7 ,6 62 10,447 7,351 9, 871
Other c o s ts__ __ __________ _____ 276 438 776 275 425 756 278 430 766 274 420 750 273 410 721Gifts and contributions 156 278 536 155 265 516 158 270 526 154 260 510 153 250 481Life insurance— — ___ _______ 120 160 240 120 160 240 120 160 240 120 160 240 120 160 240
Occupational expenses— ---------------- -------- 57 90 95 57 90 95 57 90 95 57 90 95 57 90 95Social security and disability
paym ents__ _____________________ _____ 319 374 374 318 374 374 316 374 374 308 374 374 306 374 374Personal taxes: T o ta l10 __________________ 766 1,791 3, 288 765 1,6 48 3, 007 623 1,321 2, 394 600 1,2 54 2, 312 604 1,220 2, 170
Renter fam ilies------ _ ____ ___ 766 1,484 2, 855 765 1,492 2, 874 623 1,182 2, 221 600 1, 159 2, 109 604 1, 126 1,951Homeowner fa m ilie s______ _____ — _ - 1 ,893 3 ,3 6 4 - 1 ,700 3, 031 - 1, 368 2 ,4 25 - 1 ,285 2, 348 - 1, 251 2 ,2 10
Cost of budget: T o ta l10 — --------------------- 6, 640 10,739 15,432 6, 622 10, 191 14,719 6, 582 10,019 14, 314 6 ,4 18 9, 667 13,886 6 ,3 66 9, 329 13,126Renter fam ilies______ _______________ _ 6, 640 9 ,6 16 14,123 6,6 22 9, 625 14,331 6, 582 9, 381 13,679 6 ,4 18 9, 173 13, 163 6 ,3 66 8, 886 12 ,314Homeowner fa m ilie s— ______ ___ _ 11 ,113 15,662 10 ,380 14 ,788 10,232 14,427 9,8 31 14 ,014 “ 9 ,4 7 6 13,271
See footnotes at end of table.
Digitized for FRASER http://fraser.stlouisfed.org/ Federal Reserve Bank of St. Louis

T a b le B -1 . A n n u a l co s ts o f b u d g e ts a t 3 leve ls o f living fo r a 4 -p e rs o n fa m ily ,1 u rban U n ite d S ta te s , 3 9 m etro p o lita n areas,4 n o n m e tro p o lita n re g io n s , and A n c h o ra g e , A la s k a , spring 1 9 6 9 — C o n tin u e d
Item
South
Atlanta, Ga. Austin, Tex. Baltim ore, Md. Baton Rouge, La.
Lower Intermediate Higher Lower Intermediate Higher Lower Intermediate Higher Lower Intermediate Higher
Food---------------------------------------------------------------- $ 1 ,6 4 0 $2 ,141 $2 ,726 $ 1 ,652 $2, 119 $2 ,719 $1 ,6 7 6 $2 ,2 1 8 $2 ,865 $1 ,679 $2, 200 $2, 802Food at home_________________________ 1 ,4 09 1,794 2, 146 1, 422 1,793 2, 139 1, 436 1, 837 2, 205 1,451 1,838 2, 199Food away from hom e--------------------- 231 347 580 230 326 580 240 381 660 228 362 603
Housing: T otal4-------------------------------------------- 1, 295 1, 944 2 ,896 1, 164 1, 820 2 ,841 1,440 2, 163 3, 245 1, 254 2, 004 3 ,2 94Renter fa m ilie s4------------------------------------- 1, 295 1, 741 2, 807 1, 164 1, 605 2, 730 1 ,440 2, 081 3, 152 1,254 1,670 2, 888Homeowner fam ilies 4---------------------------- - 2, 012 2 ,9 12 - 1,891 2, 860 - 2, 190 3, 261 - 2, 115 3, 366
Shelter 5__________________________ ___ 974 1,415 1,829 857 1, 310 1,785 1, 111 1 ,579 2, 049 954 1,499 2, 261Renter costs 6------------------------------- 974 1, 212 1, 740 857 1, 095 1, 674 1, 111 - 1,497 1,956 954 1, 165 1, 855Homeowner costs 7_______________ _ 1,483 1, 845 - 1, 381 1, 804 - 1,606 2,0 65 - 1, 610 2, 333
Housefurnishings____________________ 142 286 523 144 288 536 159 324 608 145 293 538Household operations----------------------- 179 243 419 163 222 395 170 260 463 155 212 370
Transportation: Total 8------------------------------ 446 873 1, 100 443 885 1, 120 486 892 1, 121 465 916 1, 158Automobile ow ners--------------------------- 606 873 1, 100 609 .885 1, 120 658 926 1, 121 646 916 1, 158Nonowners of autom obiles--------------- 147 213 - 134 200 - 165 231 - 129 195 -
Clothing_______________________________________ 562 814 1, 210 554 800 1, 186 578 843 1, 264 555 804 1, 196Husband------------------------------------------------ 142 195 283 140 193 280 147 203 297 139 192 281Wife--------- ---------------------------------------- 132 213 343 127 202 320 127 210 343 130 205 322Boy_____________________________________ 131 189 268 131 190 268 143 201 282 129 187 263G ir l------------------------------------------------------- 106 152 224 102 146 216 109 160 239 101 146 217Clothing m aterials and services— 51 65 92 54 69 102 52 69 103 56 74 113
Personal care------------------------------------------------ 187 245 344 171 219 305 182 244 352 183 240 335M edical care: Total 9______________________ 482 486 506 502 504 526 530 533 554 489 490 509
Insurance--------------------------------------------- 174 174 213 201 201 243 315 315 356 206 206 246Physician 's v is its___________________ 113 113 113 105 105 105 106 106 106 102 102 102Other m edical care--------------------------- 294 298 302 311 313 316 289 292 295 298 299 301
Other fam ily consumption-------------------------- 350 627 1, 006 317 594 999 335 622 1,0 34 332 608 1, 013Reading------------------------------------------------ 63 83 113 53 73 104 60 80 111 56 77 107Recreation____________________________ 104 283 542 104 288 555 111 296 569 104 284 549Education______________________________ 55 70 78 55 70 78 55 70 78 55 70 78Tobacco------------------------------------------------ 13 13 18 15 14 19 15 16 23 17 14 18Alcoholic beverages-------------------------- 80 93 101 57 67 90 58 71 89 66 77 99M iscellaneous expenses------------------- 35 85 154 33 82 153 36 89 164 34 86 162
Cost of fam ily consumption: Total 10------ 4, 962 7, 130 9, 788 4, 803 6, 941 9 ,6 9 6 5, 227 7, 515 10,435 4, 957 7, 262 10,307Renter fam ilies--------------------------------------- 4, 962 6 ,9 27 9,6 99 4, 803 6, 726 9, 585 5, 227 7, 433 10, 342 4 ,9 57 6, 928 9, 901Homeowner fa m ilie s ------------------------------ - 7, 198 9, 804 - 7, 012 9, 715 - 7, 542 10,451 7, 373 10,379
Other c o s ts ---------------------------------------------------- 268 407 722 263 400 717 276 420 753 268 411 747Gifts and contributions-------------------- 148 247 482 143 240 477 156 260 513 148 251 507Life insurance----------------------------------- 120 160 240 120 160 240 120 160 240 120 160 240
Occupational expenses--------------------------------- 57 90 95 57 90 95 57 90 95 57 90 95Social security and disability
paym ents-------------------------- - -------------------- 292 374 374 281 374 374 314 374 374 290 374 374Personal taxes: Total 10---------------------------- 507 1, 116 2, 116 456 977 1,7 84 672 1,499 2 ,8 68 474 1, 074 2, 098
Renter fam ilies--------------------------------------- 507 1,069 2, 092 456 922 1, 744 672 1,480 2, 842 474 1, 000 1, 949Homeowner fa m ilie s ------------------------------ ' - 1, 132 2, 121 - 995 1, 791 " 1 ,5 04 2, 873 1,099 2, 124
Cost of budget: Total 10---------------- ------------- 6, 086 9, 117 13,095 5, 860 8, 782 12,666 6, 546 9, 898 14,525 6, 046 9, 211 13, 621Renter fam ilies--------------------------------------- 6, 086 8, 867 12,982 5, 860 8, 512 12,515 6, 546 9, 797 14,406 6, 046 8, 803 13, 066Homeowner fa m ilie s ------------------------------ 9, 201 13,116 8, 871 12 ,692 9, 930 14,546 9, 347 13, 719
See footnotes at end of table.
Digitized for FRASER http://fraser.stlouisfed.org/ Federal Reserve Bank of St. Louis
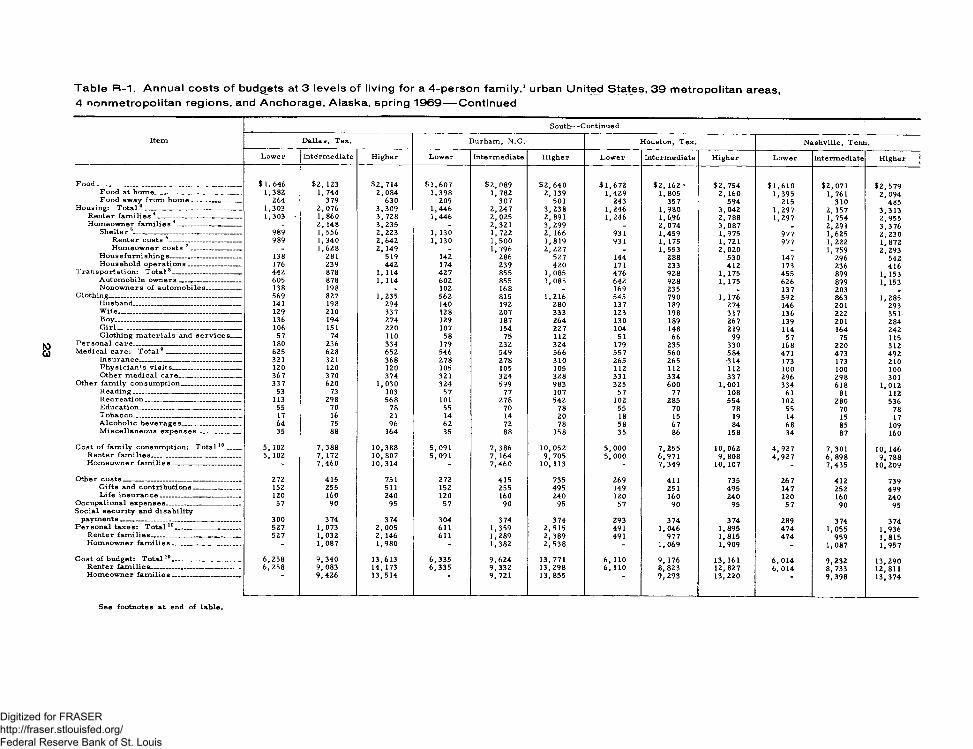
T a b le B -1 . A n n u a l c o s ts o f b udgets at 3 leve ls o f living fo r a 4 -p e rs o n fa m ily ,1 u rban U n ite d S ta te s , 3 9 m e tro p o lita n areas,4 n o n m e tro p o lita n reg io n s , and A n c h o ra g e , A la s k a , sp ring 1 9 6 9 — C o n tin u ed
Item
South— Continued
Dallas, Tex. Durham, N .C . Houston, Tex. Nashville, Tenn.
Lower Intermediate Higher Lower Intermediate Higher Lower Intermediate Higher Lower Intermediate Higher j
F o o d ..._________________________________________ $1, 646 $2, 123 $ 2 ,7 1 4 $ 1 ,6 0 7 $2 , 089 $2, 640 $ 1 ,6 7 2 $2, 162 - $2 , 754 $ 1 ,6 1 0 $2 ,071 $ 2 ,5 7 9Food at home__________________________ 1,382 1, 744 2 ,0 84 1,398 1, 782 2, 139 1 ,429 1, 805 2, 160 1,395 1, 761 2, 094Food away from h om e__ __ ______ 264 379 630 209 307 501 243 357 594 215 310 485
Housing: T o ta l4 _____________________________ 1,303 2,0 76 3 ,3 09 1,446 2 ,2 4 7 3 ,2 3 8 1,246 1,980 3,0 42 1,2 97 2, 157 3 ,3 13Renter fam ilies 4_________________________ 1,303 - 1 ,860 3 ,7 2 8 1,446 2, 025 2, 891 1, 246 1,696 2, 788 1 ,297 1,754 2,9 55Homeowner fa m ilie s4 __________ _________ - 2, 148 3 ,2 35 - 2 ,3 21 3 ,2 9 9 _ 2 ,0 7 4 3 ,0 8 7 2,291 3,3 76
Shelter 5________________________________ 989 1,556 2,2 23 1, 130 1, 722 2, 166 931 1,459 1,975 977 1,625 2, 230Renter costs 6_____________________ 989 1,340 2,6 42 1, 130 1 ,500 1,819 931 1, 175 1, 721 977 1, 222 1, 872Homeowner costs 7 _______________ - 1,628 2, 149 - 1, 796 2, 227 _ 1,553 2, 020 _ 1, 759 2 ,2 93
Housefurnishings_____________________ 138 281 519 142 286 527 144 288 530 147 296 542Household operations________________ 176 239 442 174 239 420 171 233 412 173 236 416
Transportation: T o ta l8. ________________ 442 878 1, 114 427 855 1,085 476 928 1, 175 455 899 1,153Automobile ow ners__ __ _________ 605 878 1, 114 602 855 1,085 642 928 1, 175 626 899 1, 153Nonowners of autom obiles__________ 138 198 - 102 168 _ 169 235 _ 137 203
Clothing___________ 569 827 1, 235 562 815 1,216 545 790 1, 176 592 863 1, 285Husband_________________________ _____ 141 198 294 140 192 280 137 189 274 146 201 293W ife_____________________________________ 129 210 337 128 207 333 123 198 317 136 222 351Boy______________________________________ 136 194 274 129 187 264 130 189 267 139 201 284G irl ---------------------------------- . _______ 106 151 220 107 154 227 104 148 219 114 164 242Clothing m aterials and services___ 57 74 110 58 75 112 51 66 99 57 75 115
Personal care _ 180 236 334 179 232 324 179 235 330 168 220 312M edical care: T o ta l9 625 628 652 546 549 566 557 560 584 471 473 492
Insurance______________________________ 321 321 368 278 278 310 265 265 314 173 173 210Physician's v isits__ ______________ _ 120 120 120 105 105 105 112 112 112 100 100 100Other m edical care---- ---------------------- 367 370 374 321 324 328 331 334 337 296 298 301
Other fam ily consumption 337 620 1,030 324 599 983 325 600 1,001 334 618 1,012Reading____________ __________________ 53 73 103 57 77 107 57 77 108 61 81 112Recreation 113 298 568 101 278 542 102 285 554 102 280 536Education___________ __________________ 55 70 78 55 70 78 55 70 78 55 70 78Tobacco 17 16 21 14 14 20 18 15 19 14 15 17Alcoholic beverages__________________ 64 75 96 62 72 78 58 67 84 68 85 109M iscellaneous expenses. __________ 35 88 164 35 88 158 35 86 158 34 87 160
Cost of fam ily consumption: T o ta l10____ 5, 102 7 ,3 88 10,388 5,0 91 7,386 10 ,052 5 ,0 0 0 7,2 55 10,062 4 ,9 2 7 7,301 10,146Renter fam ilies___________________________ 5, 102 7, 172 10,807 5,0 91 7, 164 9, 705 5, 000 6 ,9 71 9, 808 4 ,9 2 7 6 ,8 9 8 9, 788Homeowner fa m ilie s____________________ - 7,4 60 10,314 - 7 ,4 60 10,113 - 7,3 49 10 ,107 7,435 10,209
Other costs 272 415 751 272 415 735 269 411 735 267 412 739Gifts and contributions_______ _____ 152 255 511 152 255 495 149 251 495 147 252 499Life insurance 120 160 240 120 160 240 120 160 240 120 160 240
Occupational expenses______________________ 57 90 95 57 90 95 57 90 95 57 90 95Social security and disability
paym ents____________________________________ 300 374 374 304 374 374 293 374 374 289 374 374Personal taxes: T o ta l10 __________ _____ 527 1,073 2,0 05 611 1,359 2, 515 491 1,046 1,895 474 1,055 1,936
Renter fam ilies . _ „ 527 1,032 2, 146 611 1,289 2 ,3 8 9 491 977 1,815 474 959 1, 815Homeowner fa m ilies____________________ - 1,087 1,980 - 1 ,382 2 ,5 3 8 - 1 ,069 1,909 - 1 ,087 1 ,957
Cost of budget: T o ta l10____________________ 6 ,2 58 9 ,3 40 13,613 6 ,3 3 5 9 ,6 2 4 13,771 6, no 9, 176 13,161 6 ,0 1 4 9,2 32 13 ,290Renter fam ilies___________________________ 6 ,2 5 8 9, 083 14,173 6 ,3 3 5 9 ,3 3 2 13 ,298 6, no 8,8 23 12 ,827 6, 014 8 ,733 12,811Homeowner fa m ilie s__ _______________ _ 9 ,4 26 13 ,514 9, 721 13 ,855 9 ,2 9 3 13,220 9 ,3 98 13,374
See footnotes at end of table.
Digitized for FRASER http://fraser.stlouisfed.org/ Federal Reserve Bank of St. Louis
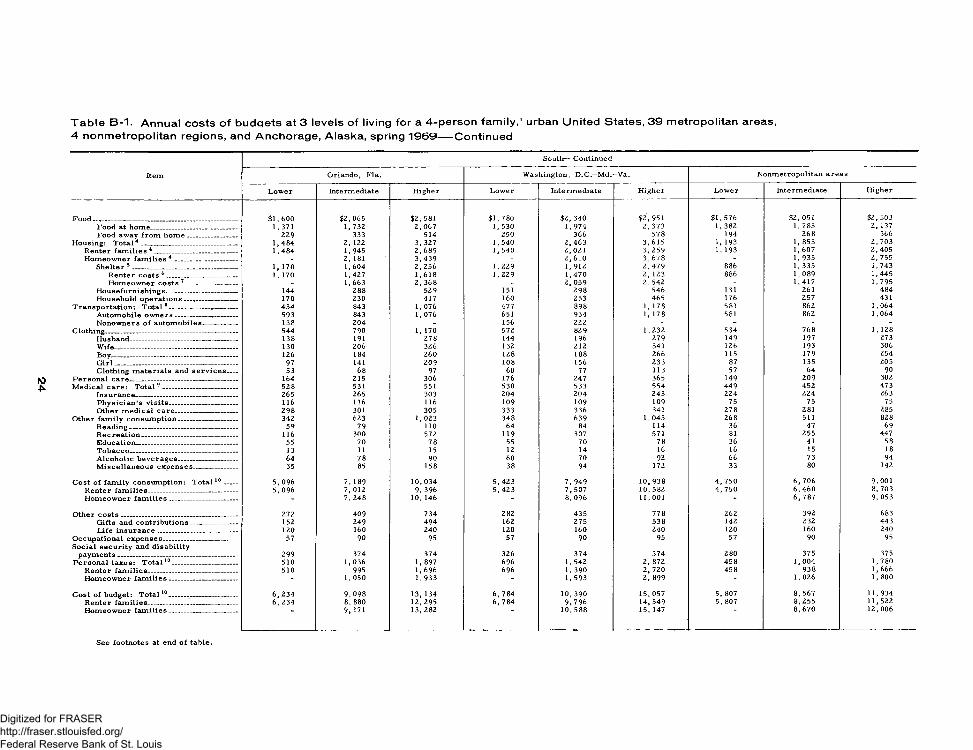
T a b le B -1 . A n n u a l cos ts o f b u d g e ts a t 3 levels o f living for a 4 -p e rs o n fa m ily ,1 urban U n ite d S ta te s , 3 9 m e tro p o litan areas ,4 n o n m e tro p o lita n reg ions, and A n c h o ra g e , A la s k a , spring 1 9 6 9 — C o ntinu ed
South— Continued
Item Orlando, Fla. Washington, D.C.—Md.--V a . Nonmetropolitan areas
Lower Intermediate Higher Lower Intermediate Higher Lower Intermediate Higher
Food___________________________________________ $1 ,600 $2,065 $2,581 $1 ,780 $2 ,340 $2, 951 $1 ,576 $2,051 $2,503Food at hom e............... ...........— ............... 1 ,371 1,732 2 ,0 6 7 1,530 1,974 2, 373 1,382 1,783 2, 137Food away from hom e_______________ 229 333 514 250 366 578 194 268 366
Housing: T ota l4 — ......................................... ...... 1 ,4 84 2, 122 3, 327 1 ,540 2 ,4 6 3 3, 615 1, 193 1, 853 2 ,703Renter fa m ilie s4_________________________ 1 ,4 84 1,945 2, 689 1,540 2, 021
2 ,6 103, 259 1, 193 1, 607 2 ,4 05
Homeowner fam ilies 4 ____________ ______ _ 2,181 3 ,4 39 - 3 ,6 7 8 - 1,935 2, 755Shelter 5 _______________________________ 1, 170 1,604 2, 256 1,229 1,912 2 ,4 7 9 886 1,335 1,743
Renter costs 6---------- ---------------------- 1, 170 1,427 1,6 18 1,229 1,470 2, 123 886 1,089 1,445Homeowner costs 7 ______________ _ 1, 663 2, 368 - 2 ,0 5 9 2,5 42 - 1,417 1,795
Hou s efur ni shing s_____________________ 144 288 529 151 298 546 131 261 484Household operations------------------------ 170 230 417 160 253 465 176 257 431
Transportation: Total 8____________ ________ 434 843 1,076 477 898 1, 178 581 862 1,064Automobile ow n ers___________________ 593 843 1, 076 651 934 1, 178 581 862 1,064Nonowners of autom obiles---------------- 138 204 _ 156 222 - - - -
Clothing_______________________________________ 544 790 1, 170 572 829 1,232 534 768 1, 128Husband— -------------- ------------------------------ 138 191 278 144 196 279 149 197 273W ife-.......................... ............................... ........ 130 206 326 132 212 341 126 193 306Boy______________________________________ 126 184 260 128 188 266 115 179 254G ir l— ........................ ....................... ............... 97 141 209 108 156 233 87 135 205Clothing m aterials and services___ 53 68 97 60 77 113 57 64 90
Personal care________________________________ 164 215 306 176 247 365 149 209 302M edical care: Total 9 ......................................... 528 531 551 530 533 554 449 452 473
Insurance______________________________ 265 265 303 204 204 243 224 224 263Physician's v isits------------------------------- 116 116 116 109 109 109 75 75 75Other m edical care---------------------------- 298 301 305 333 336 341 278 281 285
Other fam ily consumption--------------------------- 342 623 1, 023 348 639 1,043 268 511 828Reading----------------------------------- ------------- 59 79 110 64 84 114 36 47 69Recreation................... ................................. 116 300 572 119 307 571 81 255 447Education....................... ........ .................. ...... 55 70 78 55 70 78 36 41 58Tobacco......... ....................... - ..........- ........... - 13 11 15 12 14 16 16 15 18Alcoholic beverages— ............................ 64 78 90 60 70 92 66 73 94Miscellaneous expenses-------------------- 35 85 158 38 94 172 33 80 142
Cost of fam ily consumption: T o ta l10------ 5, 096 7, 189 10,034 5 ,4 23 7, 949 10 ,938 4, 750 6, 706 9, 001Renter fam ilies----------------------------------------- 5, 096 7, 012 9, 396 5 ,4 23 7, 507 10,582 4, 750 6, 460 8, 703Homeowner fa m ilie s ------------------------------- - 7, 248 10 ,146 - 8, 096 11,001 - 6, 787 9, 053
Other c o s ts ............................... ........ ......................— 272 409 734 282 435 778 262 392 683Gifts and contributions--------------------- 152 249 494 162 275 538 142 232 443Life insurance------------------------------------- 120 160 240 120 160 240 120 160 240
Occupational expenses......................................... 57 90 95 57 90 95 57 90 95Social security and disability
375paym ents____________________________________ 299 374 374 326 374 374 280 375Personal taxes: T ota l10------------------------------ 510 1,036 1, 897 696 1,542 2, 872 458 1,004 1,780
Renter fam ilies----------------------------------------- 510 995 1, 696 696 1,390 2, 720 458 938 1,666Homeowner fa m ilies------------------------------- - 1 ,050 1 ,933 - 1,593 2, 899 - 1 ,026 1, 800
Cost of budget: T o ta l10------------------------------- 6 ,2 3 4 9, 098 13,134 6 ,7 8 4 10 ,390 15,057 5, 807 8, 567 11,934Renter fam ilies----------------------------------------- 6, 234 8, 880 12 ,295 6, 784 9 ,7 96 14 ,549 5, 807 8 ,2 55 11,522Homeowner fam ilies------------------------------- 9, 171 13, 282 10 ,588 15,147 8,6 70 12,006
See footnotes at end of table.
Digitized for FRASER http://fraser.stlouisfed.org/ Federal Reserve Bank of St. Louis
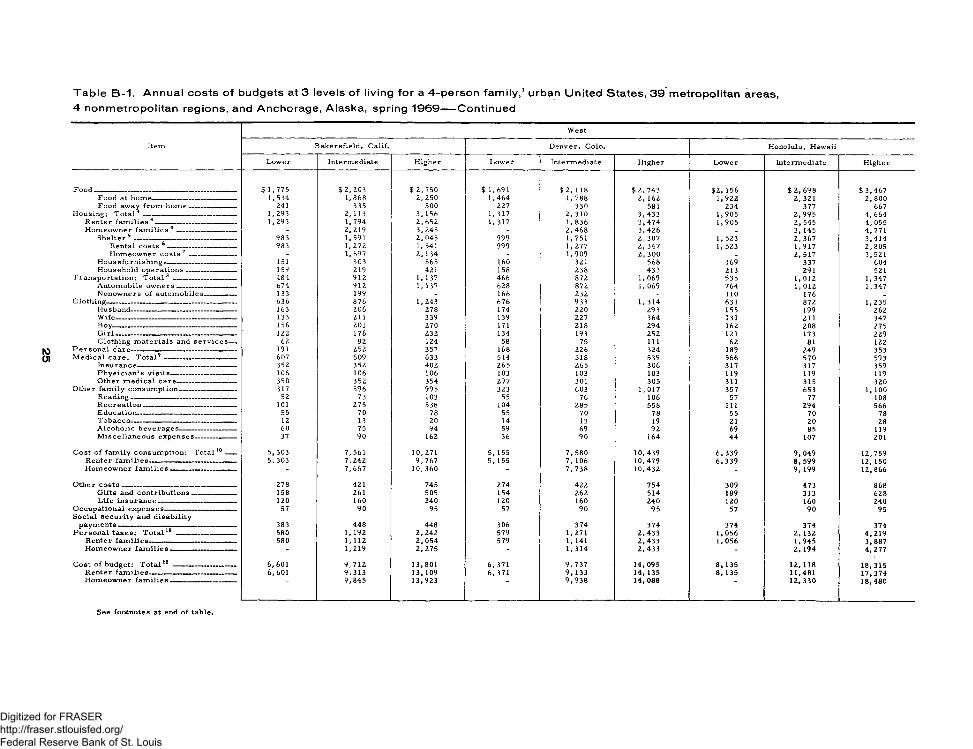
T a b le B -1 . A n n u a l c o s ts o f b ud ge ts at 3 levels o f living fo r a 4 -p e rs o n fa m ily ,1 urban U n ite d S ta te s , 3 9 m etro p o lita n a re a s ,4 n o n m e tro p o lita n reg ion s , and A n ch o ra g e , A la s k a , spring 1 9 6 9 -----C o n tin u ed
W est
Item Bakersfield, Calif. Denver, Colo. Honolulu, Hawaii
Lower Intermediate Higher Lower Intermediate Higher Lower Intermediate Higher
Food— ________ ___________ _ ---------------- $ 1,775 $ 2, 203 $ 2 ,7 50 $ 1,691 $ 2, 118 $ 2 ,7 43 $2, 156 $ 2, 698 $ 3 ,467Food at home— -------- — — ------ - 1,534 1,868 2, 250 1,464 1,788 2, 162 1,922 2, 321 2, 800Food away from h om e____________ 241 335 500 227 330 581 234 .377 667
Housing: T ota l4 ___ —_________-___ —_______ 1,293 2, 113 3, 156 1 ,317 2, 310 3 ,4 33 1,905 2 ,9 9 5 4, 664Renter fa m ilie s4---------------- -------------------- 1,293 1, 794 2, 652 1,317 1,8 36 3 ,4 7 4 1 ,9 05 2, 545 4, 055Homeowner fa m ilie s4 --------------------------- - 2, 219 3, 245 - 2 ,4 6 8 3 ,4 26 _ 3, 145 4, 771
Shelter 5 _ ------------------------------------------ 983 1, 591 2, 045 999 1,751 2, 307 1 ,523 2, 367 3 ,414Rental costs 6 ----------------------------- 983 1, 272 1,541 999 1 ,277 2, 347 1, 523 1 ,917 2,8 05Homeowner c o s ts 7 ______________ - 1,697 2 ,1 34 - 1,909 2, 300 _ 2, 517 3,521
Housefurnishings----------------------- ----- 151 303 565 160 321 568 169 337 604Household operations— ---------------- 159 219 421 158 238 433 213 291 521
Transportation: T o ta l8 ---------------------------- 484 912 1, 137 466 872 1,069 535 1,012 1,347Automobile ow n ers--------------------------- 674 912 1,137 628 872 1,069 764 1,012 1,347Nonowners of autom obiles__ _ _ 133 199 _ 166 232 _ 110 176 _
Clothing____ _____ — _____ ______________ 636 876 1,243 676 933 1,3 14 631 872 1,235Husband___________ ___________________ 163 206 278 174 220 293 155 199 262W ife................................................................ 133 211 339 139 227 364 131 211 347Boy- „ ----------- _ -------- _ ----- 156 201 270 171 218 294 162 208 275G ir l___ ____________________________ ____ 122 176 232 134 193 252 121 173 229Clothing m aterials and services— 62 82 124 58 75 111 62 81 122
P erson al care------------------------------------------------ 191 252 357 168 226 324 189 249 353M edical care: T otal9 --------------------------------- 607 609 633 514 518 539 566 570 593
Insurance--------------------------------------------- 352 352 402 265 265 306 317 317 359Physician 's v isits_________ _____ _ 106 106 106 103 103 103 119 119 119Other m edical care_ _____ -_ 350 352 354 297 301 305 311 315 320
Other fam ily consumption----------- 317 596 995 323 603 1,017 357 653 1,100Reading------------------------------------------------ 52 73 103 55 76 106 57 77 108Recreation— ------ „ - -------- 101 275 538 104 285 558 111 294 566Education______ — _ _ _ ________ 55 70 78 55 70 78 55 70 78Tobacco- — _ _____ __________ 12 13 20 14 13 19 21 20 28Alcoholic beverages-------------------------- 60 75 94 59 69 92 69 85 119M iscellaneous expenses------------------- 37 90 162 36 90 164 44 107 201
Cost of fam ily consumption: T o ta l10----- 5,303 7, 561 10,271 5, 155 7 ,5 8 0 10 ,439 6, 339 9 ,0 4 9 12,759Renter fam ilies- 5, 303 7, 242 9 ,7 6 7 5, 155 7, 106 10 ,479 6, 339 8, 599 12,150Homeowner fam ilies _ _ ___ - 7, 667 10,360 - 7, 738 10,432 - 9, 199 12,866
Other c o s ts - - 278 421 745 274 422 754 309 473 868Gifts and contributions 158 261 505 154 262 514 189 313 628Life insurance 120 160 240 120 160 240 120 160 240
Occupational expenses- ------ 57 90 95 57 90 95 57 90 95Social security and disability
payments - 383 448 448 306 374 374 374 374 374P ersonal taxes: T o ta l10 - __ 580 1,192 2 ,2 42 579 1,271 2 ,4 3 3 1,0 56 2, 132 4 ,2 19
Renter fam ilies 580 1, 112 2 ,0 5 4 579 1, 141 2 ,4 33 1,0 56 1,945 3,8 87Homeowner fam ilies - 1,219 2, 275 - 1 ,314 2 ,4 33 - 2, 194 4 ,2 77
Cost of budget: T o ta l10 — — — 6, 601 9 ,7 12 13,801 6, 371 9 ,7 3 7 14 ,095 8, 135 12 ,118 18,315Renter fam ilies _ — — 6,601 9,3 13 13,109 6,3 71 9, 133 14,135 8, 135 11,481 17,374Homeowner fam ilies 9 ,8 45 13 ,923 9 ,9 3 8 14 ,088 12 ,330 18,480
See footnotes at end of table,
Digitized for FRASER http://fraser.stlouisfed.org/ Federal Reserve Bank of St. Louis
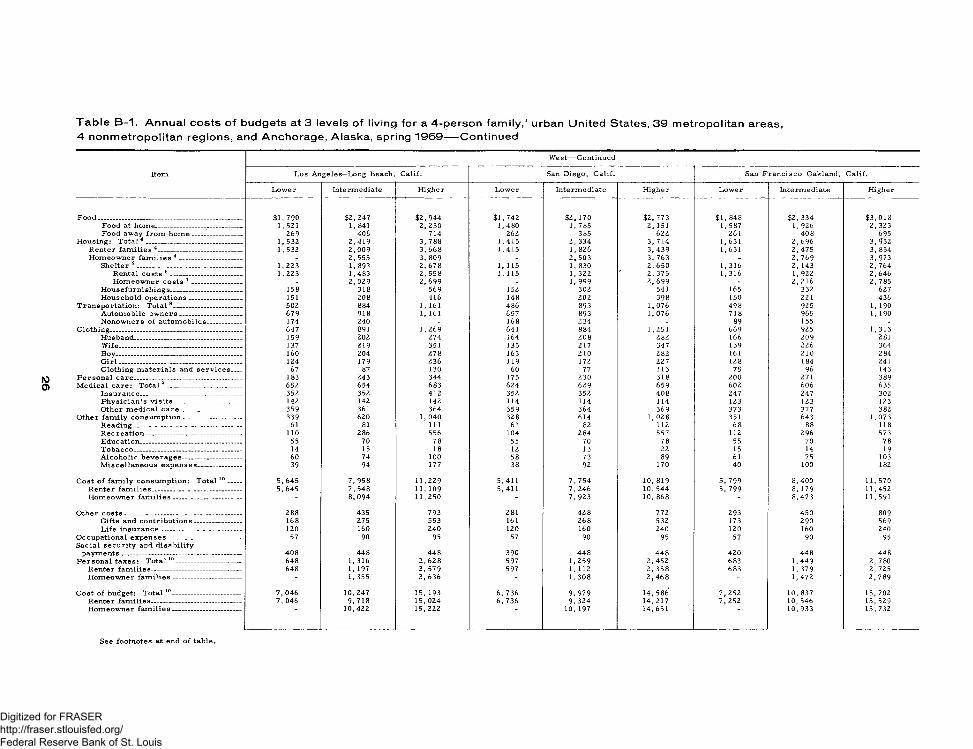
T a b le B -1 . A n n u a l co s ts o f b u d g e ts at 3 levels o f living fo r a 4 -p e rs o n fa m ily ,1 urban U n ite d S ta te s , 3 9 m e tro p o lita n a re a s4 n o n m e tro p o lita n reg ion s , and A n c h o ra g e , A la s k a , spring 1 9 6 9 — C o n tin u ed
West— Continued
Item Los Angeles—Long Beach Calif. San Diego, Calif. San Francisco—Oakland, Calif.
Lower Intermediate Higher Lower Intermediate Higher Lower Intermediate Higher
Food___________________________________________ $1 ,790 $2,247 $2 ,944 $1,742 $2, 170 $2, 773 $1 ,848 $2 ,334 $3 ,018Food at home__________________________ 1,521 1, 841 2, 230 1,480 1,785 2, 151 1 ,587 1,926 2, 323Food away from h om e_______________ 269 406 714 262 385 622 261 408 695
Housing: Total 4 __________________________ 1 ,532 2, 419 3, 788 1,415 2, 334 3, 714 1, 631 2 ,6 96 3, 952Renter fa m ilie s4. . . . . . . _ ..... 1 ,532 2 ,0 09 3, 668 1,415 1,826 3, 439 1,631 2,4 75 3, 834Homeowner fam ilies 4 ___________________ _ 2,555 3, 809 _ 2, 503 3, 763 . 2, 769 3, 973
Shelter 5 ------------------------------------------------ 1 ,223 1, 893 2, 678 1, 115 1, 830 2, 650 1 ,316 2, 143 2, 764Rental costs 6 _____________________ 1 ,223 1,483 2, 558 1, 115 1, 322 2 ,3 75 1, 316 1,922 2,646Homeowner costs 7 _______________ - 2, 029 2 ,6 99 - 1, 999 2 ,6 9 9 - 2, 216 2, 785
Hous efurni shing s...... ................ ................ 158 318 569 152 302 541 165 332 627Household operations------------------------ 151 208 416 148 202 398 150 221 436
Transportation: Total 8____________________ 502 884 1, 161 486 893 1,076 498 925 1, 190Automobile ow n ers---------------------------- 679 918 1, 161 657 893 1,076 718 965 1, 190Nonowners of autom obiles---------------- 174 240 - 168 234 - 89 155 -
Clothing________________________________________ 647 891 1,269 641 884 1,251 669 925 1,313Husband________________________________ 159 202 274 164 208 282 166 209 281Wife_____________ ______ — ______ ________ 137 219 351 135 217 347 139 226 364Boy-------------- ------ ------------------------------------ 160 204 278 163 210 282 161 210 284G ir l-------------------------------------------------------- 124 179 236 119 172 227 128 184 241Clothing m aterials and services----- 67 87 130 60 77 113 75 96 143
Personal care________________________________ 183 243 344 175 230 318 200 271 389Medical care: Total 9 ---------------------------------- 652 654 683 624 629 659 602 606 635
Insurance______________________________ 352 352 412 352 352 408 247 247 302Physician's visits ------------------------------ 142 142 142 114 114 114 123 123 123Other m edical care---------------------------- 359 361 364 359 364 369 373 377 382
Other fam ily consumption...................... .......... 339 620 1,040 328 614 1, 028 351 643 1,073Reading------------------------------------------------- 61 81 111 61 82 112 68 88 118Recreation-------------------------------------------- 110 286 556 104 284 557 112 296 573Education........................... ............................ 55 70 78 55 70 78 55 70 78Tobacco......................................... ................ 14 15 18 12 13 22 15 14 19Alcoholic beverages--------------------------- 60 74 100 58 73 89 61 75 103Miscellaneous expenses_____________ 39 94 177 38 92 170 40 100 182
Cost of fam ily consumption: T o ta l10------ 5, 645 7, 958 11,229 5,411 7 ,7 5 4 10, 819 5, 799 8, 400 11,570Renter fam ilies___________________________Homeowner fa m ilie s____________________
5, 645 7 ,5 48 8, 094
11 ,109 11,250
5,411 7, 246 7, 923
10 ,54410 ,868
5, 799 8, 179 8,473
11,452 11,591
Other c o s ts ............... .................. ..................... ........ 288 435 793 281 428 772 293 450 809Gifts and contributions--------------------- 168 275 553 161 268 532 173 290 569Life insurance________________________ 120 160 240 120 160 240 120 160 240
Occupational expenses---------------------------------- 57 90 95 57 90 95 57 90 95Social security and disability
paym ents------------------------------------------------------ 408 448 448 390 448 448 420 448 448Personal taxes: T o ta l10------------------------------ 648 1, 316 2, 628 597 1,259 2 ,4 52 683 1,449 2, 780
Renter fam ilies----------------------------------------- 648 1, 197 2, 579 597 1, 112 2, 358 683 1,379 2, 725Homeowner fa m ilie s ------------------------------- - 1 ,355 2, 636 ~ 1,3 08 2 ,4 6 8 - 1,472 2, 789
Cost of budget: Total 10------------------------------- 7, 046 10,247 15,193 6, 736 9, 979 14,586 7, 252 10,837 15,702Renter fam ilies----------------------------------------- 7, 046 9, 718 15 ,024 6, 736 9 ,3 2 4 14,217 7, 252 10,546 15,529Homeowner fa m ilies------------------------------- 10,422 15,222 10,197 14,651 10,933 15,732
See footnotes at end of table.
Digitized for FRASER http://fraser.stlouisfed.org/ Federal Reserve Bank of St. Louis
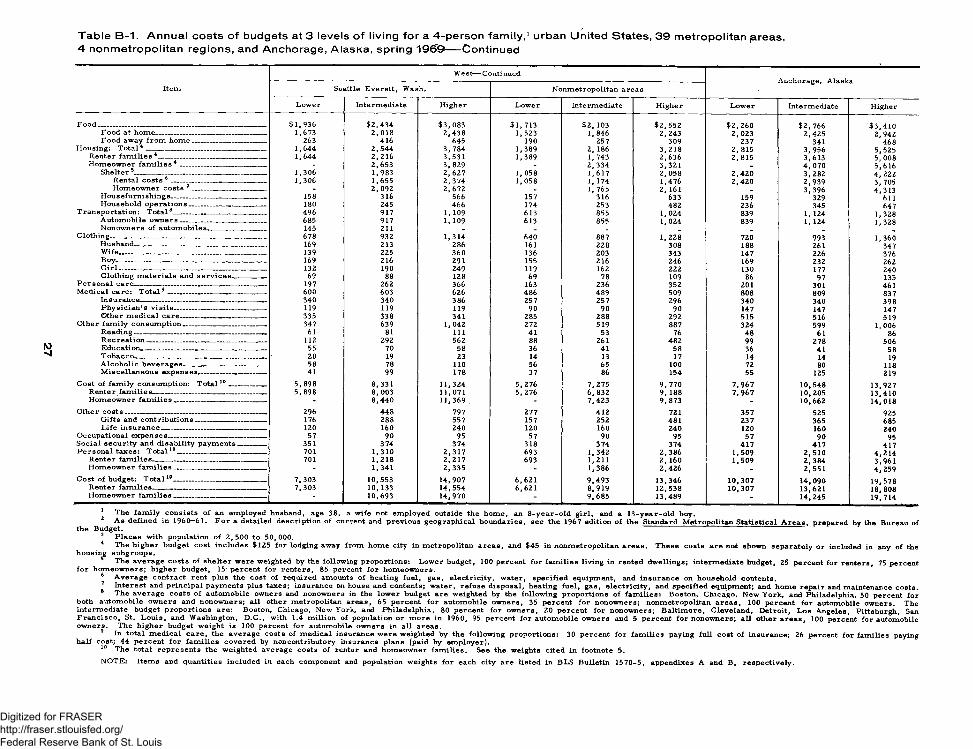
T a b le B -1 . A n n u a l c o s ts o f budgets at 3 levels o f liv ing fo r a 4 -p e rs o n fa m ily ,1 u rb an U n ite d S ta te s , 3 9 m e tro p o lita n jareas.4 n o n m e tro p o lita n reg io n s , and A n ch o ra g e , A lasK a, sp ring 19691-----C on tinu ed
Item
W e st— ContinuedAnchorage, Alaska
Seattle—Everett, Wash. Nonmetropolitan areas
Lower Intermediate Higher Lower Intermediate Higher Lower Intermediate Higher
F ood $ 1 ,9 3 6 $ 2 ,4 3 4 $ 3 ,0 8 3 $1, 713 $2 , 103 $ 2 ,5 5 2 $ 2 ,2 6 0 $2 ,7 6 6 $ 3 ,4 1 0Food at home_________________________________ 1,673 2, 018 2 ,4 3 8 1,523 1, 846 2 ,2 43 2 ,0 23 2,4 25 2,9 42Food away from h om e______________________ 263 416 645 190 257 309 237 341 468
Housing: T ota l1 2 3 4 ____________________________________ 1 ,644 2 ,5 4 4 3 ,7 8 4 1,389 2, 186 3, 218 2, 815 3 ,9 56 5,525Renter fam ilies 4________________________________ 1,644 2 ,2 16 3,5 31 1,389 1, 743 2 ,6 36 2, 815 3 ,6 13 5, 008Homeowner fa m ilie s4 __________________________ - 2 ,6 53 3, 829 _ 2 ,3 3 4 3,3 21 _ 4 ,0 7 0 5,6 16
Shelter 5_______________________________________ 1,306 1,983 2 ,6 2 7 1, 058 1 ,6 17 2, 058 2 ,4 2 0 3 ,2 82 4 ,2 2 2Rental costs 6 ____________________________ 1,306 1,655 2 ,3 7 4 1,058 1, 174 1,476 2 ,4 2 0 2,9 39 3,705Homeowner costs 7 ______________________ - 2, 092 2 ,6 7 2 _ 1, 765 2, 161 _ 3 ,3 96 4,3 13
Hous efurni shing s_____________________________ 158 316 566 157 316 633 159 329 611Household operations_______________________ 180 245 466 174 253 482 236 345 647
Transportation: T o ta l8________ __________________ 496 917 1, 109 613 855 1, 024 839 1, 124 1,328Automobile ow ners__________________________ 685 917 1, 109 613 855 1,024 839 1, 124 1,328Nonowners of automobiles_________________ 145 211 «. _ _ _
Clothing___ ____________________ ___________________ 678 932 1,314 640 887 1,2 28 720 993 1,360Husband________________________________________ 169 213 286 161 228 308 188 261 347Wife ____________________________________ 139 225 360 136 203 343 147 226 376Boy________________________________ __________ 169 216 291 155 216 246 169 232 262G ir l___________________ ______________________ 132 190 249 119 162 222 130 177 240Clothing m aterials and services ________ 69 88 128 69 78 109 86 97 135
Personal care 197 262 366 163 236 352 201 301 461M edical care: T o ta l9 600 603 626 486 489 509 808 809 837
Insurance---------------- ---------------- -----__---------- 340 340 386 257 257 296 340 340 398Physician's v isits____________________ _____ 119 119 119 90 90 90 147 147 147Other m edical care. __ __ — _______ 335 338 341 285 288 292 515 516 519
Other fam ily consumption_________________________ 347 639 1,042 272 519 887 324 599 1,006Reading______________________ __________ 61 81 111 41 53 76 48 61 86R ecreation________________ __________________ 112 292 562 88 261 482 99 278 506Education________________ _______ ________ 55 70 58 36 41 58 36 41 58Tobacco __________________ ________________ 20 19 23 14 13 17 14 14 19Alcoholic beverages— _ ---------------------------- 58 78 110 56 65 100 72 80 118M iscellaneous expenses_________ _______ 41 99 178 37 86 154 55 125 219
Cost of fam ily consumption: T o ta l10___________ 5 ,8 9 8 8,3 31 11 ,324 5 ,2 76 7 ,275 9, 770 7 ,9 6 7 10,548 13,927Renter fam ilies-—_ ___ _________ __________ _ 5 ,8 9 8 8 ,0 03 11,071 5, 276 6 ,8 3 2 9, 188 7 ,9 6 7 10,205 13,410Homeowner fa m ilie s____________________________ - 8 ,4 4 0 11,369 - 7 ,4 23 9,8 73 - 10,662 14,018
Other c o sts__________________________________________ 296 448 797 277 412 721 357 525 925Gifts and contributions— _____ __________ 176 288 557 157 252 481 237 365 685Life in suran ce. - ________________________ 120 160 240 120 160 240 120 160 240
Occupational expenses____________ _________ __ 57 90 95 57 90 95 57 90 95Social security and disability paym ents_______ 351 374 374 318 374 374 417 417 417Personal taxes: T o ta l10 _________________ ______ 701 1,3 10 2 ,3 1 7 693 1,342 2 ,3 86 1,509 2 ,5 10 4 ,2 1 4
Renter fam ilies__________________________ _ 701 1,2 18 2 ,2 1 7 693 1,211 2, 160 1,509 2 ,3 84 3,961Homeowner fa m ilie s________________________ - 1 ,341 2 ,3 35 - 1 ,386 2 ,4 2 6 - 2,5 51 4 ,2 5 9
Cost of budget: T o ta l10____________________________ 7 ,3 03 10,553 14 ,907 6 ,6 21 9 ,4 9 3 13,346 10 ,307 14 ,090 19,578Renter fam ilies______ ______________ _____ 7,303 10,133 14 ,554 6,6 21 8,9 19 12 ,538 10 ,307 13,621 18,808Homeowner fam ilies _ _ - 10 ,693 14 ,970 - 9 ,6 8 5 13,489 - 14,245 19.714
1 The fam ily consists of an employed husband, age 38, a wife not employed outside the hom e, an 8 -y ea r-o ld g irl, and a 13 -year-o ld boy.2 A s defined in 19 60 -61 . F or a detailed description of current and previous geographical boundaries, see the 1967 edition of the Standard Metropolitan Statistical A re a s , prepared bv the Bureau of
the Budget.3 P laces with population of 2 ,5 0 0 to 5 0 ,000 .4 The higher budget cost includes $125 for lodging away from home city in metropolitan areas, and $45 in nonmetropolitan areas. These costs are not shown separately or included in any of the
housing subgroups.The average costs of shelter were weighted by the following proportions: Lower budget, 100 percent for fam ilies living in rented dwellings; intermediate budget, 25 percent for renters, 75 percent
for homeowners; higher budget, 15’ percent for renters, 85 percent for homeowners. *6 A verage contract rent plus the cost of required amounts of heating fuel, gas, electricity, water, specified equipment, and insurance on household contents.7 Interest and principal payments plus taxes; insurance on house and contents; water, refuse disposal, heating fuel, gas, electricity, and specified equipment; and home repair and maintenance costs.8 The average costs of automobile owners and nonowners in the lower budget are weighted by the following proportions of fam ilies: Boston, Chicago, New York, and Philadelphia, 50 percent for
both automobile owners and nonowners; all other metropolitan areas, 65 percent for automobile owners, 35 percent for nonowners; nonmetropolitan areas, 100 percent for automobile owners. The intermediate budget proportions are: Boston, Chicago, New York, and Philadelphia, 80 percent for owners, 20 percent for nonowners; B altim ore, Cleveland, Detroit, Los Angeles, Pittsburgh, San F ran cisco, St. Louis, and Washington, D .C ., with 1.4 m illion of population or m ore in I960, 95 percent for automobile owners and 5 percent for nonowners; all other areas, 100 percent for automobile owners. The higher budget weight is 100 percent for automobile owners in all areas.
9 In total m edical care , the average costs of m edical insurance were weighted by the following proportions: 30 percent for fam ilies paying full cost of insurance; 26 percent for families payinghalf cost; 44 percent for fam ilies covered by noncontributory insurance plans (paid by em ployer).
10 The total represents the weighted average costs of renter and homeowner fam ilies. See the weights cited in footnote 5.NOTE: Items and quantities included in each component and population weights for each city are listed in BLS Bulletin 1570-5, appendixes A and B, respectively.
Digitized for FRASER http://fraser.stlouisfed.org/ Federal Reserve Bank of St. Louis
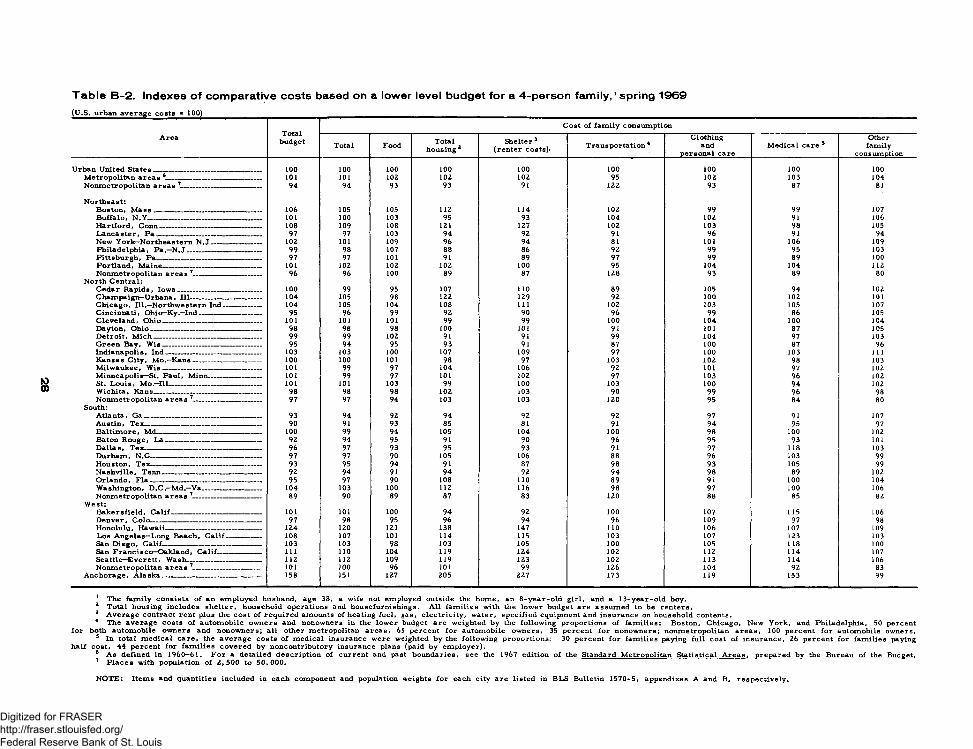
T a b le B -2 . In d exes o f c o m p a ra tiv e c o s ts based on a low er leve l b u d g e t fo r a 4 -p e rs o n fa m ily ,1 sp ring 1 9 6 9
(U.S. urban average costs ■ 100)
Area Totalbudget
Cost of fam ily consumption
Total Food Total housing 1 2
Shelter 3 (renter costs)< Transportation 4
Clothingand
personal careM edical care 5
Otherfamily
consumption
Urban United States _________ __________ ____ - 100 100 100 100 100 100 100 100 100Metropolitan areas 6_____________________________ 101 101 102 102 102 95 102 103 104Nonmetropolitan areas 7___________________ 94 94 93 93 91 122 93 87 81
Northeast:Boston, M a s s ________________ — - _____ 106 105 105 112 114 102 99 99 107Buffalo, N .Y .......................................................... 101 100 103 95 93 104 102 91 106Hartford, Conn___________ _____ - 108 109 108 121 127 102 103 98 105Lancaster, Pa ----- ---- ------ -------------------- 97 97 103 94 92 91 96 91 94New York—Northeastern N .J _______________ 102 101 109 96 94 81 101 106 109Philadelphia, P a -N .J ...................................... 99 98 107 88 86 92 99 95 103Pittsburgh, Pa_______ _________ — _____ _ 97 97 101 91 89 97 99 89 100Portland, Maine_______________ __________ 101 102 102 102 100 95 104 104 112Nonmetropolitan a r e a s 7 — __ ____ 96 96 100 89 87 128 93 89 80
North Central:Cedar Rapids, Iow a_________________________ 100 99 95 107 110 89 105 94 102Champaign—Urbana, 111— _ ------------- ------ 104 105 98 122 129 92 100 102 101Chicago, 111.—Northwestern Ind___________ 104 105 104 108 111 102 103 105 107Cincinnati, Ohio—K y .-In d ------------- ------ 95 96 99 92 90 96 99 86 105Cleveland, Ohio--------------------------------------------- 101 101 101 99 99 100 104 100 104Dayton, Ohio___________ _ __ _ 98 98 98 100 101 91 101 87 105Detroit, M ich ---------------- ------ 99 99 102 91 91 99 104 97 103Green Bay, W is ______________________________ 95 94 95 93 91 87 100 87 96Indianapolis, Ind ___ - ___ ________ 103 103 100 107 109 97 100 103 111Kansas City, Mo.—Kans _ _ -------- ------ 100 100 101 98 97 103 102 98 103Milwaukee, W is______________________________ 101 99 97 104 106 92 101 97 102Minneapolis—St. Paul, Minn__________ ___ 101 99 97 101 102 97 103 96 102St. Louis, M o.—Ill-------- ------------------------------- 101 101 103 99 100 103 100 94 102Wichita, Kans............................................................ 98 98 98 102 103 90 99 96 98Nonmetropolitan areas 7------------------------------- 97 97 94 103 103 120 95 84 80
South:Atlanta, G a------------------------ ---------------------- ---- 93 94 92 94 92 92 97 91 107Austin, Tex------------- _ _ ------------ 90 91 93 85 81 91 94 95 97Baltim ore, Md— — - __ — ____ _ 100 99 94 105 104 100 98 100 102Baton Rouge, L a -------------------------------------------- 92 94 95 91 90 96 95 93 101D allas, Tex___ ___ ______ — ___ 96 97 93 95 93 91 97 118 103Durham, N.C_________________________________ 97 97 90 105 106 88 96 103 99Houston, Tex_ — _ — ----------------- 93 95 94 91 87 98 93 105 99Nashville, Tenn---------- _ — _ ------------- 92 94 91 94 92 94 98 89 102Orlando, F la — -------------------- __ --------------- 95 97 90 108 no 89 91 100 104Washington, D .C .—Md.—Va__________________ 104 103 100 112 116 98 97 100 106Nonmetropolitan areas 7_ ______ _____ 89 90 89 87 83 120 88 85 82
W est:Bakersfield, C alif— _ — ----- ---------- _ 101 101 100 94 92 100 107 115 106Denver, Colo______________ __________ __ 97 98 95 96 94 96 109 97 98Honolulu, Hawaii— __________________________ 124 120 121 138 147 no 106 107 109Los Angeles—Long Beach, C a lif— --------- 108 107 101 114 115 103 107 123 103San Diego, Calif------------------- ------ ----------- 103 103 98 103 105 100 105 118 100San Francisco—Oakland, C alif---------------- 111 110 104 119 124 102 112 114 107Seattle—Everett, Wash------------------------ _ _ 112 112 109 119 123 102 113 114 106Nonmetropolitan areas 7------------------------------- 101 100 96 101 99 126 104 92 83
Anchorage, A lask a— ______ ________ ________ 158 151 127 205 227 173 119 153 99
1 The fam ily consists of an employed husband, age 38, a wife not employed outside the home, an 8 -year-o ld girl, and a 13-year-old boy.2 Total housing includes shelter, household operations and housefurnishings. A ll fam ilies with the lower budget are assumed to be renters.3 Average contract rent plus the cost of required amounts of heating fuel, gas, electricity, water, specified equipment and insurance on household contents.4 The average costs of automobile owners and nonowners in the lower budget are weighted by the following proportions of fam ilies: Boston, Chicago, New York, and Philadelphia, 50 percent
for both automobile owners and nonowners; a ll other metropolitan areas, 65 percent for automobile owners, 35 percent for nonowners; nonmetropolitan areas, 100 percent for automobile owners.5 In total m edical care, the average costs of medical insurance were weighted by the following proportions: 30 percent for fam ilies paying full cost of insurance, 26 percent for fam ilies paying
half cost, 44 percent for fam ilies covered by noncontributory insurance plans (paid by em ployer).6 A s defined in 1960—61. For a detailed description of current and past boundaries, see the 1967 edition of the Standard Metropolitan Statistical A rea s , prepared by the Bureau of the Budget.7 P laces with population of 2 ,5 0 0 to 5 0 ,0 0 0 .
NOTE: Items and quantities included in each component and population weights for each city are listed in BLS Bulletin 1570-5, appendixes A and B, respectively.
Digitized for FRASER http://fraser.stlouisfed.org/ Federal Reserve Bank of St. Louis
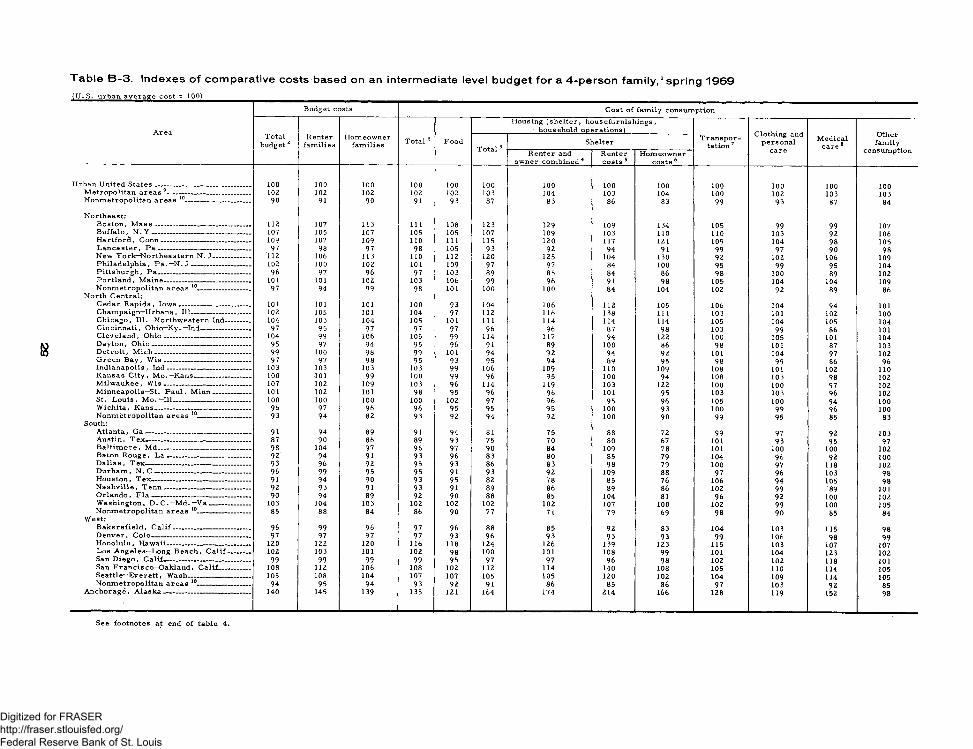
T a b le B -3 . In d e x e s o f c o m p a ra tiv e costs based on an in te rm e d ia te level b u d g e t fo r a 4 -p e rs o n fa m ily /s p r in g 1 9 6 9^l^S^jirbar^averagj^cos^^J^O ^
Area
Budget cc5StS Cost of family consumption
Total budget 2
Renterfamilies
Homeownerfam ilies Total 2 Food
Housing (shelter, housefurnishings , • household operations)
Transportation 7
Clothing and personal
careMedical
care 8Otherfamily
consumptionTotal 3Shelter
Renter and owner combined4
Renter costs 5
Homeowner costs 6
Urban United S tates_____________________________ 100 100 100 100 100 100 100 100 100 100 100 100 100Metropolitan a r e a s9-------------------------------------- 102 102 102 102 102 103 104 103 104 100 102 103 103Nonmetropolitan areas 10------------------------------ 90 91 90 91 93 87 83 86 83 99 93 87 84
Northeast:Boston, M a s s _____________________________ 112 107 113 111 108 123 129 109 134 105 99 99 107Buffalo, N . Y ______________________________ 107 105 107 105 105 107 109 103 110 110 103 92 106Hartford, Conn___________________________ 109 107 109 110 111 115 120 117 121 109 104 98 105L ancaster, P a ____________________________ 97 98 97 98 105 93 92 94 91 99 97 90 98New York—Northeastern N. J___________ 112 106 113 110 112 120 125 104 130 92 102 106 109Philadelphia, P a .—N .J __________________ 102 100 102 101 109 97 97 84 100 95 99 95 104Pittsburgh, Pa____________________________ 96 97 96 97 103 89 85 84 86 98 100 89 102Portland, M aine---------------------------------------- 101 101 102 103 106 99 96 91 98 105 104 104 109Nonmetropolitan areas 10________________ 97 94 99 98 101 100 100 84 104 102 92 89 86
North Central:Cedar Rapids, Iow a_____________________ 101 101 101 100 93 104 106 112 105 106 104 94 101Champaign—Urbana, 111__________________ 102 105 101 104 97 112 116 138 111 103 101 102 100Chicago, 111.—Northwestern Ind________ 104 103 104 105 101 111 114 114 114 105 104 105 104Cincinnati, Ohio—Ky. —Ind_______________ 97 95 97 97 97 96 96 87 98 103 99 86 101Cleveland, O hio__________________________ 104 99 106 105 99 114 117 94 122 100 105 101 104Dayton, O h io______________________________ 95 97 94 95 96 91 89 100 86 98 101 87 103Detroit, M ic h _____________________________ 99 100 98 99 101 94 92 94 92 101 104 97 102Green Bay, W is __________________________ 97 97 98 95 93 95 94 89 95 98 99 86 96Indianapolis, Ind-------------------------------------- 103 103 103 103 99 106 109 110 109 108 101 102 110Kansas C ity, M o .—Kans_________________ 100 101 99 100 99 96 95 100 94 108 103 98 102M ilwaukee, W is __________________________ 107 102 109 103 96 114 119 103 122 100 100 97 102Minneapolis—St. Paul, M inn----------------- 101 102 101 98 95 96 96 101 95 103 103 96 102St. Lou is, M o .—Ill_______________________ 100 100 100 100 102 97 96 95 96 105 100 94 100W ichita, Kans_____________________________ 96 97 96 96 95 95 95 100 93 100 99 96 100Nonmetropolitan areas 10________________ 93 94 82 93 92 94 92 100 90 99 95 85 83
South:Atlanta, G a ------------------------------------------------ 91 94 89 91 94 81 75 88 72 99 97 92 103Austin, T ex------------------------------------------------ 87 90 86 89 93 75 70 80 67 101 93 95 97B altim ore, Md____________________________ 98 104 97 96 97 90 84 109 78 101 100 100 102Baton Rouge, L a _________________________ 92 94 91 93 96 83 80 85 79 104 96 92 100Dallas , T ex__________ -____________________ 93 96 92 95 93 86 83 98 79 100 97 118 102Durham , N . C _____________________________ 96 99 95 95 91 93 92 109 88 97 96 103 98Houston, T ex______________________________ 91 94 90 93 95 82 78 85 76 106 94 105 98N ash ville , T en n ---------------- -------------------- 92 93 91 93 91 89 86 89 86 102 99 89 101Orlando, F la --------------------------------------------- 90 94 89 92 90 88 85 104 81 96 92 100 102Washington, D. C. —Md. —V a ____________ 103 104 103 102 102 102 102 107 10 0 102 99 100 105Nonmetropolitan areas 10________________ 85 88 84 86 90 77 71 79 69 98 90 85 84
W est:Bakersfield , C a lif_______________________ 96 99 96 97 96 88 85 92 83 104 103 115 98Denver, Colo______________________________ 97 97 97 97 93 96 93 93 93 99 106 98 99Honolulu, Hawaii_________________________ 120 122 120 116 118 124 126 139 123 115 103 107 107Los Angeles—Long Beach, C a lif_______ 102 103 101 102 98 100 101 108 99 101 104 123 102San D iego, Calif---------------------------------------- 99 99 99 99 95 97 97 96 98 102 102 118 101San Fran cisco—Oakland, C alif_________ 108 112 106 108 102 112 114 140 108 105 110 114 105Seattle—Everett, Wash___________________ 105 108 104 107 107 105 105 120 102 104 109 114 105Nonmetropolitan areas 10________________ 94 95 94 93 92 91 86 85 86 97 103 92 85
Anchorage, A la sk a __________________________ 140 145 139 135 121 164 174 214 166 128 119 152 98
See footnotes at end of table 4.
Digitized for FRASER http://fraser.stlouisfed.org/ Federal Reserve Bank of St. Louis
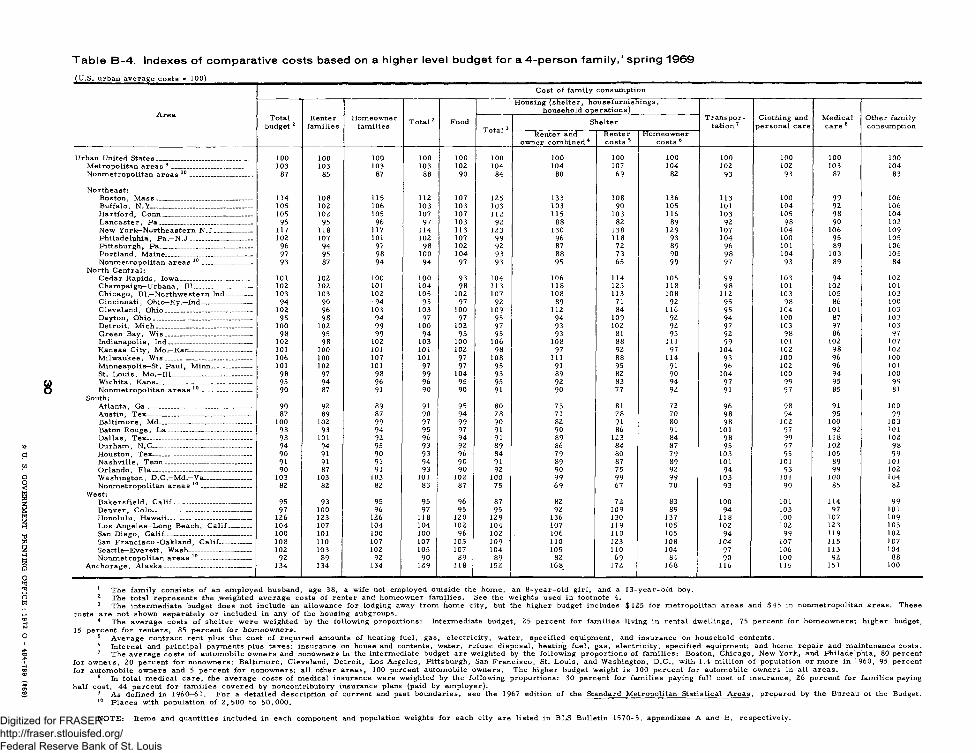
☆ U.
S. GO
VE
RN
ME
NT
PR
INTIN
G O
FF
ICE
: 1972 O - 484-789
(#69)
T a b le B -4 . Ind exes o f c o m p a ra tiv e cos ts based on a h ig h er level b u d g e t fo r a 4 -p e rs o n fa m ily ,1 s p ring 1 9 6 9
(U.S. urban avera^e c o s ts ^ J OO)__________________________________________________________________Cost of fam ily consumption
Area Total budget 2
Renterfam ilies
Homeownerfam ilies Total 2 Food
Housing (shelter, housefurnishings, household operations)
Clothing and personal care
Medical care 8
Other family consumptionTotal 3
Shelter Transportation 7
Renter and owner combined 4
Renter costs 5
Homeowner costs 6
Urban United States................ ......................... ........... 100 100 100 100 100 100 100 100 100 100 100 100 100Metropolitan areas 9 ________________________ 103 103 103 103 102 104 104 107 104 102 102 103 104Nonmetropolitan areas 10___________________ 87 85 87 88 90 84 80 69 82 93 93 87 83
Northeast:Boston, M a ss_____________________________ 114 108 115 112 107 125 133 108 136 113 100 99 106Buffalo, N .Y -________ _____________________ 105 102 106 103 103 103 103 90 105 101 104 92 106Hartford, Conn___________________________ 105 102 105 107 107 112 115 103 116 103 105 98 104Lancaster, P a ____________________________ 95 95 96 97 103 92 88 82 89 92 98 90 102New York—Northeastern N .J ___________ 117 118 117 114 113 123 130 138 129 107 104 106 109Philadelphia, P a —N .J —_________________ 102 107 101 102 107 99 96 118 93 104 100 95 105Pittsburgh, Pei____________________________ 96 94 97 98 102 92 87 72 89 96 101 89 106Portland, Maine__________________________ 97 95 98 100 104 93 88 73 90 98 104 103 105Nonmetropolitan areas 10_______________ 93 87 94 94 97 93 95 65 99 97 93 89 84
North Central:Cedar Rapids, Iowa_____________________ 101 102 100 100 93 104 106 114 105 99 103 94 102Cham paign-Urbana, 111--------------------------- 102 102 101 104 98 113 118 123 118 98 101 102 101Chicago, 111.—Northwestern Ind------------ 103 103 102 105 102 107 108 113 108 112 103 105 103Cincinnati, Ohio—K y —Ind----------------------- 94 90 94 95 97 92 89 71 92 95 98 86 100Cleveland, Ohio__________________________ 102 96 103 103 100 109 112 84 116 95 104 101 103Dayton, Ohio______________________________ 95 98 94 97 97 95 94 109 92 94 100 87 103Detroit, M ich _____________________________ 100 102 99 100 102 97 93 102 92 97 103 97 103Green Bay, W is ........... ............. ........... ........... 98 95 99 94 93 95 93 81 95 92 98 86 97Indianapolis, Ind_________________________ 102 98 102 103 100 106 108 88 111 99 101 102 107Kansas City, Mo.—Kan___________________ 101 100 101 101 102 98 97 92 97 104 102 98 102Milwaukee, W is__________________________ 106 100 107 101 97 108 111 88 114 93 100 96 100Minneapolis—St. Paul, Minn____________ 101 102 101 97 97 95 91 95 91 96 102 96 101St. Louis, Mo.—Ill________________________ 98 97 98 99 104 93 89 82 90 104 100 94 100Wichita, Kans_____________________________ 95 94 96 96 95 95 92 83 94 97 9-9 95 99Nonmetropolitan areas 10----------------------- 90 87 91 90 90 91 90 77 92 91 97 85 81
South:Atlanta, G a------------------------------------------------ 90 92 89 91 95 80 73 81 72 96 98 91 100Austin, Tex------------------------------------------------ 87 89 87 90 94 78 71 78 70 98 94 95 99Baltim ore, Md____________________________ 100 102 99 97 99 90 82 91 80 98 102 100 103Baton Rouge, L a _________________________ 93 93 94 95 97 91 90 86 91 101 97 92 101D allas, Tex------------------------ ------------ ----------- 93 101 92 96 94 91 89 123 84 98 99 118 102Durham, N .C--------------------------------------------- 94 94 95 93 92 89 86 84 87 95 97 102 98Houston, Tex--------------------------------------------- 90 91 90 93 96 84 79 80 79 103 95 105 99Nashville, Tenn------------------------------- T------ 91 91 91 94 90 91 89 87 89 101 101 89 101Orlando, F la --------------------------------------------- 90 87 91 93 90 92 90 75 92 94 93 99 102Washington, D.C.—Md.—Va---------------------- 103 103 103 101 102 100 99 99 99 103 101 100 104Nonmetropolitan areas 10 ----------------------- 82 82 82 83 87 75 69 67 70 93 90 85 82
West:Bakersfield, C a lif_______________________ 95 93 95 95 96 87 82 72 83 100 101 114 99Denver, Colo--------------------------------------------- 97 100 96 97 95 95 92 109 89 94 103 97 101Honolulu, Hawaii_________________________ 126 123 126 118 120 129 136 130 137 118 100 107 109Los Angeles—Long Beach, C a lif---------- 104 107 104 104 102 104 107 119 105 102 102 123 103San Diego, Calif__________________________ 100 101 100 100 96 102 106 110 105 94 99 119 102San Francisco—Oakland, Calif_________ 108 110 107 107 105 109 110 123 108 104 10 7 115 107Seattle—Everett, Wash----------------------------- 102 103 102 105 107 104 105 110 104 97 106 113 104Nonmetropolitan areas 10----------------------- 92 89 92 90 89 89 82 69 84 90 100 92 88
Anchorage, A lask a__________________________ 134 134 134 129 118 152 168 172 168 116 115 151 100
1 The fam ily consists of an employed husband, age 38, a wife not employed outside the hom e, an 8 -y ea r-o ld girl, and a 13 -year-o ld boy.2 The total represents the .weighted average costs of renter and homeowner fam ilies. See the weights used in footnote 4.3 The intermediate budget does not include an allowance for lodging away from fiome city, but the higher budget includes $125 for metropolitan areas and $45 in nonmetropolitan areas. These
costs are not shown separately or included in any of the housing subgroups.4 The average costs of shelter were weighted by the following proportions: Intermediate budget, 25 percent for fam ilies living in rental dwellings, 75 percent for homeowners; higher budget,
15 percent for renters, 85 percent for homeowners.5 Average contract rent plus the cost of required amounts of heating fuel, gas, electricity, water, specified equipment, and insurance on household contents.6 Interest and principal payments plus taxes; insurance on house and contents, water, refuse disposal, heating fuel, gas, electricity, specified equipment; and home repair and maintenance costs.7 The average costs of automobile owners and nonowners in the intermediate budget are weighted by the following proportions of fam ilies: Boston, Chicago, New York, and Philadelphia, 80 percent
for owners, 20 percent for nonowners; B altim ore, Cleveland, Detroit, Los Angeles, Pittsburgh, San Francisco, St. Louis, and Washington, D .C ., with 1.4 m illion of population or m ore in I960, 95 percent for automobile owners and 5 percent for nonowners; all other areas, 100 percent automobile owners. The higher budget weight is 100 percent for automobile owners in all areas.
8 In total m edical care, the average costs of medical insurance were weighted by the following proportions: 30 percent for fam ilies paying full cost of insurance, 26 percent for fam ilies paying half cost, 44 percent for fam ilies covered by noncontributory insurance plans (paid by em ployer).
9 As defined in 19 60 -61 . For a detailed description of current and past boundaries, see the 1967 edition of the Standard Metropolitan Statistical A re a s , prepared by the Bureau of the Budget.10 Places with population of 2 ,5 0 0 to 5 0 ,0 0 0 .
NOTE: Items and quantities included in each component and population weights for each city are listed in BLS Bulletin 1570 -5, appendixes A and B, respectively.Digitized for FRASER http://fraser.stlouisfed.org/ Federal Reserve Bank of St. Louis