Analysis of Work Stoppages Bulletin No. 1460 UNITED STATES DEPARTMENT OF LABOR W. Willard Wirtz, Secretary BUREAU OF LABOR STATISTICS Arthur M. Ross, Commissioner Digitized for FRASER http://fraser.stlouisfed.org/ Federal Reserve Bank of St. Louis

Welcome message from author
This document is posted to help you gain knowledge. Please leave a comment to let me know what you think about it! Share it to your friends and learn new things together.
Transcript
Analysis of
Work Stoppages
Bulletin No. 1460
UNITED STATES DEPARTMENT OF LABOR W. Willard Wirtz, Secretary
BUREAU OF LABOR STATISTICS Arthur M. Ross, Commissioner
Digitized for FRASER http://fraser.stlouisfed.org/ Federal Reserve Bank of St. Louis

BUREAU OF LABOR STATISTICS REGIONAL OFFICES
Digitized for FRASER http://fraser.stlouisfed.org/ Federal Reserve Bank of St. Louis

Analysis of
Work Stoppages
1964
Bulletin No. 1460
Trends • Size and D uration • Issues
Industries and L oca lities A ffected • Details o f M ajor Stoppages
C hronology o f National E m ergency Dispute
October 1965
UNITED STATES DEPARTMENT OF LABOR W. Willard Wirtz, Secretary
BUREAU OF LABOR STATISTICS A rth u r M. Ross, C om m iss ioner
For sale by the Superintendent of Documents, U.S. Government Printing Office, Washington, D.C., 20402 - Price 40 cents.
Digitized for FRASER http://fraser.stlouisfed.org/ Federal Reserve Bank of St. Louis

Digitized for FRASER http://fraser.stlouisfed.org/ Federal Reserve Bank of St. Louis

Preface
This bulletin presents a detailed statistical analysis of work stoppages in 1964, continuing an annual feature of the Bureau of Labor Statistics program in the field of industrial relations. Prelim inary monthly estimates of the level of strike (or lockout) activity for the United States as a whole are issued about 30 days after the end of the month of reference and are available on request. P r e liminary estimates for the entire year are available at the year’ s end; selected final tabulations are issued in the spring of the following year.
A chronology of the shipping industry dispute, in which the emergency provisions of the Taft-H artley Act were invoked by President Johnson in 1964, is presented in appendix B.
The methods used in preparing work stoppage statistics are described in appendix C.
The Bureau wishes to acknowledge the cooperation of employers and employer associations, labor unions, the Federal Mediation and Conciliation Service, and various State agencies in furnishing information on work stoppages.
This bulletin was prepared by Edward D. Onanian under the direction of Joseph W. Bloch, in the Bureau's Division of Industrial and Labor Relations, under the general direction of L. R. Linsenmayer, Assistant C om m issioner for Wages and Industrial Relations. Dixie L. King prepared the chronology which appears in appendix B.
iii
Digitized for FRASER http://fraser.stlouisfed.org/ Federal Reserve Bank of St. Louis

Digitized for FRASER http://fraser.stlouisfed.org/ Federal Reserve Bank of St. Louis

Contents
Page
S um m ary____________________________________________________________________________________ 1Trends in work stoppages_______________________________________________________________ 1Contract statu s____________________________________________________________________________ 2Size of stoppages___________________________________________________________________________ 3Type of em ployer u n it____________________________________________________________________ 3D uration_____________________________________________________________________________________ 4M ajor is s u e s ______________________________________________________________ 5Industries affected_________________________________________________________________________ 6Stoppages by location_____________________________________________________________________ 7
R egions__________________________________________________________________________________ 7States_____________________________________________________________________________________ 7M etropolitan a r e a s ____________________________________________________________________ 7
Monthly trends_____________________________________________________________________________ 8Unions involved____________________________________________________________________________ 8M ediation____________________________________________________________________________________ 8Settlement___________________________________________________________________________________ 9Procedure for handling unsettled is s u e s ______________________________________________ 9
Tables:1. W ork stoppages in the United States, 1927—64_________________________________ 102. W ork stoppages involving 10 ,000 w orkers or m ore,
selected periods_________________________________________________________________ 113. W ork stoppages by month, 1963—64____________________________________________ 114. W ork stoppages by contract status and m ajor issu es, 1964_______________ 125. M ajor issues involved in work stoppages, 1964_____________________________ 126. W ork stoppages by industry group, 1964---------------------------------------------------------- 147. W ork stoppages by region, 1964 and 1963------------------------------------------------------- 158. W ork stoppages by State, 1964----------------------------------------------------------------------------- 169. W ork stoppages by metropolitan area, 1964--------------------------------------------------- 17
10. W ork stoppages by affiliation of unions involved, 1964____________________ 1811. W ork stoppages by contract status and size of stoppage, 1964___________ 1912. W ork stoppages by number of establishm ents involved, 1964_____________ 2013. W ork stoppages involving 10, 000 w orkers or m ore
beginning in 1964________________________________________________________________ 2114. W ork stoppages by duration and contract status ending in 1964__________ 2415. Mediation in work stoppages by contract status ending in 1964__________ 2516. Settlement of stoppages by contract status ending in 1964_________________ 2617. P rocedure for handling unsettled issues in work stoppages
by contract status ending in 1964--------------------------------------------------------------------- 27
Chart. Trends in work stoppages, 1964---------------------------------------------------------------------- 2
Appendixes:A . Tables— W ork stoppages:
A - 1. W ork stoppages by industry, 1964---------------------------------------------------------- 28A -2 . W ork stoppages by industry group and m ajor issu es , 1964----------- 31A - 3. W ork stoppages in States having 25 stoppages or m ore
by industry group, 1964------------------------------------------------------------------------- 35A -4 . W ork stoppages by industry group and contract status, 1964------ 40
B. Chronology— The Atlantic and Gulf Coast Longshorem en's strike,1964 -65___________________________________________________________________________ 43
C. Scope, m ethods, and definitions----------------------------------------------------------------------- 51
v
Digitized for FRASER http://fraser.stlouisfed.org/ Federal Reserve Bank of St. Louis

Digitized for FRASER http://fraser.stlouisfed.org/ Federal Reserve Bank of St. Louis
Analysis of Work Stoppages, 1964
Sum m ary
A ll m easu res of strike activity in 1964 rose above the re la tively low leve ls o f the preceding 4 yea rs , but rem ained substantially below the average for the postw ar period . A total o f 3, 655 w ork stoppages, 1 involving 1 ,640 ,000 w ork ers , began in 1964. Idleness resulting from stoppages in e ffect during the year totaled 22 .9 m illion m an-days, or 0 .18 percent of the estim ated total w orking tim e of the nonagricultural w ork fo r c e (exclu sive of governm ent).
Strike id leness during the f ir s t tw o-th irds of 1964 continued at the low leve l o f the p re ceding year, only to r ise sharply during the final 4 months o f the year. This latter period w itnessed the start o f 10 o f the y e a r ’ s 18 m ajor stoppages (strik es involving 10, 000 w orkers or m ore ), including the y e a r 's la rg est s t r i k e — the 45-day nationwide walkout against the G eneral M otors C orp . , 2 which at its height involved m ore than a quarter o f a m illion w ork ers . A lso beginning during the final third o f the year was the Atlantic and Gulf Coast lon gsh orem en 's dispute in which the "national em ergen cy " p rov is ion s o f the T aft-H artley A ct w ere invoked. The latter stoppage was resum ed in 1965, 3 weeks after the expiration o f the 80-day injunction, and was the only one of the m a jor strikes to con tinue into 1965. (A ch ron ology of this dispute appears as appendix B .)
The num ber o f strikes beginning in 1964 which involved as many as 1, 000 w orkers (246) was substantially higher than the p ostwar low of 181 record ed in 1963. The a v e rage duration o f strikes ending during the year (22. 9 days) was slightly low er than in 1963, but stoppages continued to rem ain long by postw ar standards.
As in the preceding year, m ore than tw o-fifths of the strikes beginning in 1964 o ccu rre d during the renegotiation o f a g re e m ents, and 36 percent took p lace while a g re e m ents w ere in e ffect. Demands fo r general wage changes a n d /or supplem entary benefits w ere the m a jor issu es in approxim ately tw o- fifths o f the y e a r 's stoppages. Strikes over m atters o f plant adm inistration constituted *
* The terms "work stoppage" and "strike" are used interchangeably in this bulletin. Strikes, in this special use, would thus include lockouts.
The General Motors Corp. was involved in two major strikes in 1964, the nationwide stoppage and one confined to the State of Michigan. Unless noted otherwise, subsequent references in this bulletin are to the former stoppage.
on e-six th of the 1964 total, but accounted fo r a la rger proportion o f the y e a r 's w orker and id len ess tota ls . Six m a jor stoppages, in cluding the G eneral M otors strike, w ere in cluded in this group.
Strikes beginning in 1964 w ere divided about equally between m anufacturing and nonm anufacturing industries, with the fo rm e r group accounting fo r th ree -fifth s o f th e .w ork ers involved and slightly m ore than tw o-th irds o f total id len ess . As a consequence of five m a jor strikes by autom obile w ork ers , the transportation equipment industries sustained the greatest volum e of id len ess during the year (6 .4 m illion m an-days).
Trends in W ork Stoppages
Work stoppages beginning in 1964 which involved as many as six w orkers and lasted a full day or shift, o r longer, totaled 3 ,655 , 9 percent greater than the 1963 total, and the highest figure record ed since 1959 (table 1). The num ber o f w orkers involved in these strikes (1 ,6 4 0 ,0 0 0 ) was 74 percent higher than the postw ar low record ed in the p re ce d ing year. These strike participants r e p r e sented 3 .4 percent of the total nonagricultural w ork fo rce (exclu sive o f governm ent), again the highest figure since 1959.
Idleness resulting f r o m all strikes in e f f e c t in 1964 amounted to 2 2 .9 m illion m an-days, or 0. 18 percent o f estim ated total working t i m e in nonagricultural estab lish m ents (exclu sive of governm ent). The id le ness total was 42 percent greater than the postw ar low reached in 1963, but substantia lly below t h e 1947—63 average o f 31. 3 m illion m an-days.
D espite the in crea sed strike activity in 1964, the 5 -yea r p eriod which it brought to a c lo se was, in relative term s, one o f su stained industrial peace, p ara lle led in nonwar years only during the Great D epression . As the follow ing tabulation ind icates, strike id le ness averaged 0. 16 percent o f the estim ated total w orking tim e during the 1960—64 period , as com pared with 0. 30 and 0. 34 percent during the 1955—59 and 1950—54 p eriods, r e s p e c tively . The average num ber o f strikes and of w orkers d irectly involved in them w ere a lso substantially low er during the 1960—64 period than in either o f the two preceding 5 -year p eriods.
1Digitized for FRASER http://fraser.stlouisfed.org/ Federal Reserve Bank of St. Louis

2
Chart. Trends in Work Stoppages, 1964
[Semilog scale]
_________ Annual averages__________
1950-54 1955-59 1960-64
Work stoppages--------------------- 4,651 3 ,844 3,466Workers involved----------------- 2 ,4 2 0 ,0 0 0 1 ,9 7 6 ,0 0 0 1 ,316 ,000Man-days of idleness----------- 34 ,340 ,000 34 ,1 4 0 ,0 0 0 18 ,600 ,000Percent of estimated
total working t im e ----------- 0. 34 0. 30 0. 16
Contract Status
The distribution of work stoppages in 1964 by contract status fo llowed the same pattern as in 1963. Stoppages o ccu rr in g in 1964 during the renegotiation of agreem ents amounted to 44 percent of the total, while those arising during the term of agreements represented 36 percent of all strikes. D is putes occu rr in g during the negotiation of the initial agreement or in the union’ s quest for recognition led to 18 percent of the y e a r 's total. The proportions of stoppages and id le ness, by contract status, in the 1962—64 p e riod appear in the following tabulation:
____________ Percent of— _________
Man-days Stoppages of idleness
1962 1963 1964 1962 1963 1964
A ll stoppages----------------- 100.0 100.0 100.0 100.0100.0 100.0
Negotiation of firstagreement or union recognition--------------------------- 16.8 18.1 17.7 6.6 7.0 6.5
Renegotiation of agreement (expiration or reopening)--------------------------- 48.3 43.4 44.1 80.3 81.6 83.2
During term of agreement (negotiation of new agreement not involved)----------------------------- 29.8 35.8 36.1 12.2 11.1 9.9
Other---------------------------------------Insufficient information
2.5 1.9 1.6 .5 .2 .3
to classify----------------------------- 2.5 .9 .5 .4 .1 .1
NOTE: Because of rounding, sums of individual items maynot equal totals.
Strikes w h i c h began while agreements were in effect involved 28 percent of all w ork ers , but, because of their re latively short duration (an average of 9. 1 days), accounted for only 10 percent of total strike idleness . In term s of s ize, 54 percent of these stoppages involved fewer than 100 w orkers , while 7 percent involved as many as 1, 000 w orkers each. The large m ajority of these sm aller strikes o c cu rre d in the construction industry; severa l of the larger ones took place in the transportation equipment industry. Job se cu rity or plant administration matters were the principal issues in 47 percent of these stoppages, while another third resulted from in terunion or intraunion disputes (table 4).
Digitized for FRASER http://fraser.stlouisfed.org/ Federal Reserve Bank of St. Louis

3
Strikes o ccu rrin g during the renegotiation o f agreem ents involved m ore than tw o-th irds o f all w orkers and w ere respon sib le for fiv e -s ix th s o f total strike id len ess during the year. As in 1963, m ore than fou r-fifth s o f these stoppages resu lted from disputes over general wage changes a n d /or supplem entary benefits. Issues relating to job secu rity or plant adm inistration accounted for 8 percent o f all renegotiation strik es, but they caused 43 percent o f the id len ess resulting from such stoppages, la rge ly because they included the G eneral M otors strike. M ore than on e-fou rth o f the renegotiation disputes o ccu rre d in con struction and trade.
Since 85 percent o f the 646 stoppages occu rr in g during the establishm ent of a c o l lective bargaining relationship involved few er than 100 w orkers each, these stoppages a c counted for only 4 percent o f the total number o f w orkers participating in strikes and for 6 . 5 percent o f total id len ess . Only nine stoppages in this ca tegory involved as many as 1 ,000 w ork ers , the la rgest o f which was a m a jor strike in the paper industry. 3 As would be expected, the average duration of these stoppages (41 .7 days) was substantially higher than the average fo r all strikes ending in 1964. Disputes over union organization and secu rity accounted fo r m ore than th ree-fifth s o f these stoppages, while another 27 percent resu lted from d e m a n d s fo r general wage changes or supplem entary benefits.
Size o f Stoppages
Strikes involving 1, 000 w orkers or m ore o ccu rre d with greater frequen cy and im pact than in 1963. The 246 stoppages of such m agnitude accounted for 7 percent of all strikes in 1964, but involved a lm ost th ree-fou rth s of
3This stoppage involved the Pacific Coast Association of
Pulp and Paper Manufacturers and the newly formed Independent Association of Western Pulp and Paper Workers. The developments leading to the strike were as follows: In May 1964, the International Brotherhood of Pulp, Sulphite, and Paper Mill Workers and the United Papermakers and Paperworkers— two unions which had been serving as bargaining agents for the production employees of the Association's member firms—negotiated a new 1-year agreement to replace that scheduled to expire at the end of the month. This agreement was rejected by the rank and file, an action reportedly resulting more from dissension within the unions than from dissatisfaction with the contract provisions. The independent union formed by the dissident group within the established unions petitioned the NLRB for a representation election in June 1964. In the election which was held in September, this union polled a majority of the votes and was certified as bargaining agent. The work stoppage, which began in mid-November, occurred during the independent union's efforts to negotiate its initial agreement with the employer association.
Since there had been a change in bargaining agents, and since the strike occurred while the new union was striving to negotiate its first agreement, the stoppage was classified for statistical purposes as one arising during the negotiation of the initial agreement, rather than as a contract renegotiation dispute.
all w orkers participating in strikes and w ere respon sib le fo r a like proportion o f total strike id len ess (table 11). In the preceding year, when a postw ar low o f 181 such stoppages was record ed , t h e y accounted for 54 percent of all w orkers and 62 percent of total strike id len ess .
Of these large stoppages, 18 involved as many as 10, 000 w orkers each; 7 such strikes w ere record ed in 1963, and an a verage of 16 fo r the 1954—63 period (table 2). These stoppages in 1964 involved a total of 607, 000 w orkers and resu lted in approx im ately 8 m illion m an-days o f id len ess . The la rgest stoppage during the year was a 4 5 -day (interstate) strike against the General M otors C orp . (table 13). Each of the other leading autom obile m anufacturers— Ford, C h rysler , and A m erican M otors— was also involved in a m a jor stoppage in 1964. Am ong the other m a jor strikes w ere two stoppages against the C aterp illar T ractor C o. ; two involving co n struction w orkers in Ohio; an interstate bitum inous coa l s t r i k e ; a 2 -day " r e c e s s " by sch ool teach ers in Utah; and the Atlantic and Gulf Coast longsh orem en ’ s dispute. The longsh orem en 's strike was the only m a jor stoppage to continue into 1965.
At the other extrem e, 2, 131 stoppages involving few er than 100 w orkers each a c counted for approxim ately th ree -fifth s of all strikes beginning in 1964, thus continuing the pattern of recen t yea rs . While significant in num ber, these stoppages accounted fo r le ss than 6 percent o f total strike id leness during the year. Thirty percent of these sm aller strikes occu rred in the construction industry, while another 11 percent o ccu rred in w holesale and retail trade. In the latter group, these stoppages represen ted fou r-fifth s of all strikes beginning in 1964.
As in 1963, 78 percent of all strikes b e ginning in 1964 w ere confined to single e s tablishm ents (table 12). These stoppages, how ever, accounted for sm aller proportions of the w orker and id len ess totals than in the preceding year. At the other extrem e, strikes involving 11 establishm ents or m ore r e p r e sented only 4 percent o f the total, but a c counted for m ore than tw o-fifths of strike id len ess during t h e year. Included in the latter group was the G eneral M otors strike.
Type o f E m ployer Unit
Single em ployers operating one estab lish ment or m ore w ere involved in 86 percent of all w ork stoppages beginning in 1964. Of the rem aining strik es, 309, or 8 percent o f the y e a r 's total, involved two em ployers or m ore
Digitized for FRASER http://fraser.stlouisfed.org/ Federal Reserve Bank of St. Louis

4
who w ere m em bers of a form a l association . These latter stoppages accounted for 22 and 20 percent, resp ective ly , o f the y e a r 's w orker and id len ess tota ls.
Stoppages beginning in 1964
Man-days idle Workers during 1964
Type of employer unit Number involved (all stoppages)
All stoppages---------------- 3,655 1,640,000 22,900,000
Single establishment or more than 1 but under the same ownership or management — 3,154 1,220,000 17,700,000
2 employers or more— no indication of a formal association or jointbargaining arrangement------ 192 56,300 498,000
2 employers or more in a formal association-------------- 309 364,000 4,690,000
NOTE: Because of rounding, sums of individual items maynot equal totals.
Since the subject o f co lle ctiv e bargaining by em ployer association s was under co n g re s sional scrutiny in 1964, 4 the Bureau studied the ch a ra cte r is t ics o f the 309 w ork stoppages involving such groups during the yea r. A pp roxim ately tw o-th irds o f these stoppages, in volving 45 percent o f the w ork ers , o ccu rred in the con stru ction industry. Four industry groups— transportation a n d com m unication, trade, s e rv ice s , and fabrica ted m etal parts— accounted fo r m ore than th ree-fifth s o f the rem aining associa tion stoppages.
With regard to existing contractual re la tionsh ips, the large m a jority o f these stoppages (92 p e r c e n t ) occu rred during the renegotiation o f agreem ents. Demands for general wage changes a n d /or supplem entary benefits p recip ita ted m ore than fou r-fifth s of the associa tion stoppages.
In term s of s ize , 30 percent o f these stoppages involved few er than 100 w orkers each, approxim ately half the proportion which strikes o f this s ize constituted o f the total stoppages beginning in 1964. At the other extrem e, n early on e-fifth of these stoppages involved 1,000 w orkers or m ore . The a verage duration o f strikes involving em ployer association s was 25. 5 days, as com pared with an average of 22 .9 days fo r a l l disputes, and 27. 1 days for all contract renegotiation disputes.
4 Multiemployer Association Bargaining and Its Impact on theCollective Bargaining Process (U. S. House of Representatives, Committee on Education and Labor, General Subcommittee on Labor, 88th Cong., 2d sess., December 1964, Committee Print).
Of the a ssocia tion stoppages which o c cu rred outside o f the con struction industry, at least seven involved elem ents o f both a strike and a lockout. 5 In e a c h instance, strike action against one or m ore m em bers of the associa tion led to a shutdown by som e or all o f the rem aining m em b ers . These situations involved a total o f approxim ately 33, 000 w orkers and resu lted in approxim ately 870, 000 m an-days o f id len ess . Four o f these stoppages o ccu rre d in trade, while the r e maining three involved firm s engaged in the m anufacturing o f food and kindred products.
Duration
Significant in the N ation 's strike e x p e r ience since 1959 has been the length o f the stoppages. A verage duration o f strikes ending in 1964 declined by one-tenth o f a day from the 1963 leve l, but at 22 .9 days, it r e m ained high by postw ar standards. Strikes during the 1959~64 p eriod averaged 23.7 days in length, as com pared with an average of 20 days during the 1948—58 period .
A pproxim ately 42 percent o f all strikes ending in 1964, involving 36 percent o f all w ork ers , w ere settled in le ss than a week (table 14). B ecause of their short duration, these stoppages accounted fo r only 5 percent of total id len ess . On the other hand, about on e -fifth o f the stoppages, involving on e-th ird o f all w ork ers , lasted 30 days or longer. Included in this group, which accounted for 76 percent of total id len ess , w ere two m a jor stoppages— the G eneral M otors strike and a stoppage involving 22, 000 con struction w ork ers in Ohio.
Am ong t h e fa c tors contributing to the longer average duration o f strikes in recent years has been the re la tive ly large num ber o f stoppages lasting 90 days or lon ger. While the num ber o f stoppages o f such length in 1964 (189) was the low est since 1958, it was co n siderably higher than the average o f 131 r e cord ed during the 1955—58 period . These stoppages, m ore than th ree -fifth s of which o ccu rre d in m anufacturing indu stries, a c counted fo r on e -fifth o f total id len ess in 1964. A pprox im ately half o f these protracted stoppages involved disputes over general wage changes a n d /or supplem entary benefits, while another third a rose from d ifferen ces over u n i o n organization and secu rity m atters. Am ong the la rg er o f these long stoppages w ere a 114-day stoppage at plants o f the T orrington C o. in C onnecticut and a 149-day
As noted in appendix C, the Bureau makes no effort to distinguish between strikes and lockouts in its work stoppage statistics program. For the situations under discussion here, information was derived largely from press reports.
Digitized for FRASER http://fraser.stlouisfed.org/ Federal Reserve Bank of St. Louis
5
stoppage involving the G eneral Telephone Co. o f C aliforn ia , both o f which began in 1963; a 94-day strik e -lock ou t involving retail food stores in M aryland; and a 132-day dispute involving the D etroit Publishers A ssocia tion .
Continuing the pattern o f recen t yea rs , stoppages in m anufacturing industries w ere, on the average, longer (26 .7 days) than those in nonmanufacturing (19. 3 days). Am ong in dustry groups experiencing 50 stoppages or m ore in 1964, average duration ranged from13. 5 days in con struction to 3 6 .4 days in the rubber industry. The re la tively short duration of the con struction stoppages stem s from the fact that th ree -fifth s o f them o ccu rre d while agreem ents w ere in e ffect. In the printing industry, where 9 of the 47 strikes ending during the year lasted 90 days or lon ger, the average duration was 57 .9 days, the highest figure record ed fo r any industry in 1964.
Significant variations a lso o ccu rred in average duration accord in g to the issu es in volved. As might be expected , stoppages over union organization and secu rity m atters w ere the m ost drawn out, averaging 38. 8 days in duration in 1964. At the other ex trem e, disputes over interunion and intraunion m atters proved ea siest to re so lv e , averaging10. 2 days in length. N early th ree -fifth s o f these latter stoppages w ere settled in le ss than a week. Disputes over general wage changes a n d /or supplem entary benefits a veraged 26 .9 days, while those over questions o f job secu rity and plant adm inistration a veraged 13. 6 days in length.
M ajor Issues
Although the distribution o f w ork stoppages in 1964 by m a jor issu es varied little from the 1963 pattern, d ifferen ces appeared in the d istribution o f w orkers and id leness among the various issu e s . The m ost p ro nounced changes o ccu rre d in plant adm inistration disputes which accounted for 36 p e r cent o f total id leness in 1964, as com pared with 10 percent in 1963, and in stoppages over general wage changes a n d /or supplem entary benefits which led to 45 percent of 1964 s t r i k e id len ess, as com pared with 68 percent in 1963 (table 5).
A m o n g the stoppages involving 1,000 w orkers or m ore , the d istribution by issu es d iffered slightly from that o f the previous year, the principa l changes being an in crea se in the proportion o f strikes over general wage changes and a decline in the proportion o f plant adm inistration disputes. As noted above, how ever, the percentage o f t o t a l id leness attributable to plant adm inistration strikes in
1964 was con siderab ly higher than in 1963. No significant changes appear when the 1964 distribution o f large strikes by issu es is c o m pared with the average d istribution fo r the 1961—63 period . The percent distribution o f issu es in the 246 strikes beginning in 1964 involving 1, 000 w ork ers or m ore is shown in the tabulation that fo llow s:
Percentof
Major issue stoppages
All large strikes----------------------------------------------- 100.0
General wage changes------------------------------------------- 41.5Supplementary benefits; no general
wage change------------------------------------------------------- 4 .1Wage adjustments-------------------------------------------------- 6 .9Hours of work--------------------------------------------------------- .4Other contractual matters---------------------------------------- 1.6Union organization and security------------------------------- 5. 7Job security------------------------------------------------------------ 10. 2Plant administration---------------------------------------------- 24.4Other working conditions---------------------------------------- 1.2Interunion or intraunion matters
(generally involves 2 unions)--------------------------------- 3 .7Not reported---------------------------------------------------------- . 4
NOTE: Because of rounding, sums of individual items maynot equal totals.
In slightly m ore than tw o-fifth s o f all work stoppages, demands fo r general wage changes a n d /or supplem entary benefits w ere the principa l issu e s . These stoppages in volved 39 percent o f all w orkers participating in strik es, as com pared with 45 percent in 1963. In absolute term s, how ever, the number of w orkers involved in such stoppages rose by m ore than 50 percent over the 1963 leve l. Strikes over these issu es alone resu lted in m ore than 1 m illion m an-days o f id len ess in each of two industry groups— contract co n struction, and transportation and com m u nica tion (table A - 2).
D isputes over plant adm inistration m atters led to on e -s ix th o f all stoppages, but accounted fo r m ore than on e-th ird o f all w orkers involved in strik es. Included in this group w ere six o f the m a jor stoppages begin ning during the year. Am ong the host o f lo ca l issu es in dispute in the la rgest o f these stop pages (the G eneral M otors strike), w ere p r o duction standards, overtim e p ra ctice s , sen iority , shift p re fe re n ce s , and re lie f tim e. On an industry b asis , d isagreem ents over plant adm inistration m atters led to tw o-fifth s o f the stoppages in the transportation equipment in dustry and n early half o f the m ining strik es.
As in 1963, job secu rity issu es accounted for approxim ately 6 percent o f all stoppages. H owever, the num ber o f w orkers involved in these stoppages, and the resultant id len ess, in crea sed in both absolute and relative term s
Digitized for FRASER http://fraser.stlouisfed.org/ Federal Reserve Bank of St. Louis

6
over the 1963 le v e ls . N early half o f the id le ness resulting from job secu rity disputes was divided alm ost equally between the food and kindred products industry and the e le c tr ica l m achinery industry. The la rgest num ber of these strikes (33) o ccu rre d in the tran sporta tion and com m unication industries, a group which accounted fo r 56 percent o f the w orkers involved in such disputes.
Union organization and secu rity w ere the principa l issu es in 15 percent of all strikes begun in 1964, but they accounted for a m uch sm aller percentage o f the total w orker and id len ess figu res. The latter resu lt is attributable to the fact that m ore than fou r-fifth s of these stoppages involved few er than 100 w ork ers each. The la rgest concentration o f these d isputes, approxim ately on e-fou rth o f t h e total, o ccu rre d in the con struction industry.
Strikes over interunion and intraunion m atters represen ted one-eighth o f the y e a r 's stoppages, but accounted for only 4 and 1 p e r cent, resp ective ly , o f the w orker and id leness totals in 1964. Included in this group w ere 384 union riv a lry and ju risd iction a l disputes, the highest leve l ever re cord ed fo r stoppages o f this nature; the previous high o f 313 was record ed in 1963. In term s of s ize , m ore than th ree-fou rth s o f the strikes in this group involved few er than 100 w orkers each. As in the past 4 yea rs , over fou r-fifth s o f these strikes o ccu rre d in the con struction industry.
Industries A ffected
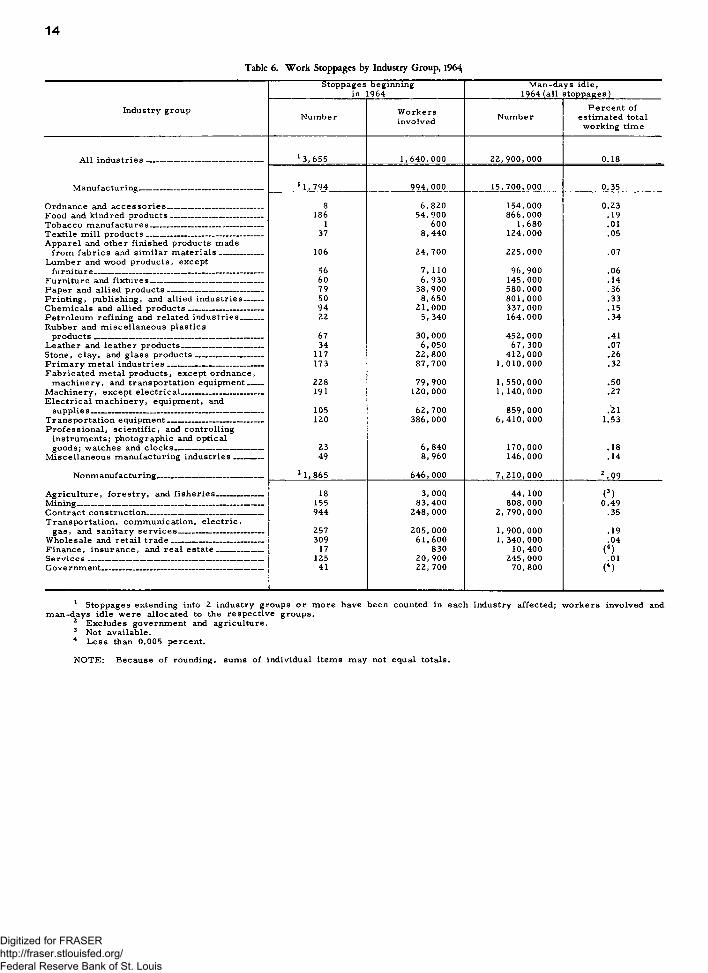
W ork stoppages beginning in 1964 w ere divided about equally between m anufacturing and nonm anufacturing indu stries, but the f o r m er group accounted fo r th ree -fifth s o f the w orkers involved and fo r slightly m ore than tw o-th irds o f total id len ess (table 6). In m anufacturing, where all m easu res o f strike activity reached their highest leve l since 1959, id len ess totaled 15.7 m illion m an-days, an in crea se o f 5. 3 m illion over the 1963 leve l. As has been true since 1944, the percentage o f w orking tim e lo st in m anufacturing industr ie s (0. 35) greatly exceeded that lost in nonm anufacturing (0 .0 9 ).
Am ong m anufacturing industries, substantial in crea ses in id len ess over the 1963 leve l w ere record ed iii the m etalw orking, transportation equipm ent, ordnance and a c c e s s o r ie s , food and kindred products, and paper in du stries. In transportation equipm ent, which sustained the greatest volum e of id len ess during the year ( 6 . 4 m illion m an- days), m ore than fou r-fifth s o f the tim e lost resu lted fro m five m a jor strikes o f autom ob ile w ork ers . Two o f the latter stoppages a lso accounted fo r a substantial proportion o f
the id len ess in the fabrica ted m etal products group. T h ree-fou rth s o f the id len ess in the ordnance industry resu lted from an 86-day strike in W est V irgin ia , while in the food industry, m ore than on e-fou rth o f the id len ess was attributable to a 7 -w eek stoppage in vo lv ing b rew eries in C aliforn ia . In the paper in dustry, the com bination o f a m a jor stoppage in the P a cific Northwest and severa l single plant stoppages o f long duration served to ra ise strike id len ess to 580, 000 m an-days— its highest leve l since 1952.
On the other hand, in four m anufacturing groups— lum ber and wood products, printing and publishing, petroleum , and rubber— id le ness declined m arkedly from the p r io r y e a r 's leve l. In the lum ber industry, which sustained 1 .3 m illion m an-days o f id len ess in 1963, the tim e lo st from strikes declined to 96 ,900 m an-days, the low est figure since 1956. In the other three indu stries, despite the decline in id len ess , the percentage of estim ated w ork ing tim e lo st rem ained substantially above the national average. None o f the three was d irectly a ffected by any o f the y e a r 's m a jor strik es, but each did experien ce severa l stop pages o f long duration.
Am ong nonm anufacturing indu stries, substantial in crea ses in id leness w ere record ed in m ining, con struction , and t r a d e . The strik e-in du ced lo ss o f 0 .49 percent o f e s t im ated w orking tim e in m ining was la rge ly attributable to a m a jor stoppage in the bitu m inous coa l industry and an 80-day strike at m ines o f the Kennecott C opper C orp . In co n stru ction , id leness in crea sed by m ore than 40 percent over the 1963 leve l, but rem ained con siderab ly below the industry average for the precedin g decade. The num ber o f stop pages in con struction (944), how ever, reached its highest l e v e l since 1953. Idleness in w holesa le and reta il trade rose to its highest leve l since 1959> but accounted for a sm all percentage (0 .04 ) o f total estim ated w orking tim e.
In the transportation and com m unication industries, which experien ced four o f the y e a r 's m a jor stoppages, the num ber o f w ork ers involved in new strikes (205, 000) rose m ore than tw ofold over the 1963 leve l. Id leness in this group, how ever, declined by approxim ately on e-fou rth from the leve l o f the 2 previous yea rs . The Atlantic and Gulf Coast lon gsh orem en 's dispute involved m ore than a fourth o f the w orkers participating in strikes in this group, but accounted for a m uch sm aller p roportion o f total 1964 strike id len ess in these indu stries. 6
The bulk of the idleness in this dispute occurred in 1965 (appendix B).
Digitized for FRASER http://fraser.stlouisfed.org/ Federal Reserve Bank of St. Louis

7
R egion s, The greatest reg ional con cen tration o f strike id leness in 1964 occu rred in the East North Central States, which w ere affected by 13 o f the y e a r 's m a jor strik es. As com pared with 1963, id len ess in this r e gion (9. 9 m illion m an-days) showed a tw ofold in crea se , as did the num ber o f w orkers in volved in strikes (table 7). On the other hand, strike id len ess declined from the 1963 leve l in five reg ion s, including the M iddle Atlantic States, which accounted fo r 18 percent o f total id len ess in 1964,
As in 1963, the M iddle Atlantic and East North Central States com bined accounted for m ore than half o f the y e a r 's strik es. The greatest percentage in crea se in the incidence o f strike activity was record ed in the East South Central reg ion w here the number of strikes rose by 38 percent; the greatest absolute in crea se o ccu rre d in the East North Central States where 206 m ore strikes began in 1964 than in 1963. In the South Atlantic, and East and W est South Central States co m bined, the num ber o f stoppages (824) in 1964 was nearly 30 percent greater than the level o f the 2 previous yea rs .
States. As a consequence o f the m ajor autom obile stoppages which accounted f o r th ree -fou rth s o f the total id len ess (4. 5 m illion m an-days) within its b o rd e rs , M ichigan led all States in strike id len ess in 1964 (table 8). The im pact o f the G eneral M otors stoppage was felt a lso in Ohio, which ranked second in id len ess ( 2. 7 m illion m an -days). F ive other States experien ced m ore than 1 m i l l i o n m an-days o f id len ess each in 1964. In New York and Pennsylvania, how ever, id leness was at its low est s i n c e 1945 and 1942, resp ective ly . 7
F ive States— D elaw are, M aryland, N evada, Utah, and W est V irgin ia— which did not sustain as m uch id len ess as t h o s e noted above, nonetheless experien ced a percentage lo ss in total estim ated w orking tim e that was substantially greater than the national a verage. In D elaw are, the high percent o f w ork ing tim e lost (0 .4 1 ) was attributable m ainly to the G eneral M otors strike, which accounted fo r m ore than th ree-fou rth s of the State's strike id len ess . In M aryland, a strik e -lock ou t involving retail food stores accounted for m ore than half o f the y e a r 's id leness in the State, while in West V irgin ia , m ore t h a n on e-fou rth o f the id len ess resu lted from an 86 -day stoppage at the F ood M achinery and
Stoppages by L o c a tio n
In Colorado and Oklahoma, idleness was also at its lowest postwar level; in Minnesota, all measures of strike activity fell to their lowest postwar levels.
C hem ical C orp . The high percent o f w ork ing tim e lo st in Nevada was in good m easure due to a 3-w eek stoppage at the Reynolds E lec tr ic and E ngineering Co. , while in Utah, the Kennecott C opper strike accounted for a lm ost seven-eighths o f the State's id len ess .
The States leading in strike id len ess, M ichigan and Ohio, a lso ranked fir s t and second, resp ective ly , in the number o f w ork ers involved in stoppages. In M ichigan, the number of s trik ers (249,000) in crea sed six fold over the 1963 leve l, while in Ohio, the 191, 000 strikers represen ted a tw ofold in crea se over the previous y e a r 's leve l. Other States with large num bers of w orkers involved w ere New York (160,000), Illinois (127,000), and Pennsylvania (119 ,000).
Ten States, experiencing 100 stoppages or m ore e a c h , accounted for m ore than tw o-th irds of the strikes beginning in 1964. As in 1963, New York a n d Pennsylvania ranked fir s t and second , resp ective ly , in this ca tegory . In F lorida , which ranked tenth, both the num ber o f stoppages (106), and w ork ers involved (37, 900) reached the highest levels ever re cord ed fo r the State. 8 At the other extrem e, 10 stoppages or le ss w ere record ed in the D istrict of Colum bia, A laska, North Dakota, South Dakota, and Wyoming.
M etropolitan A re a s . In D etroit, which sustained the greatest id len ess (2, 060, 000 m an-days) o f any m etropolitan area in 1964 (table 9), m ore than th ree-fifth s o f the id le ness resu lted from three m a jor strikes o f autom obile w ork ers , with the G eneral M otors stoppage having by far the greatest im pact. Ranking second and third in id leness w ere C leveland, Ohio, and Flint, M ichigan, both of which w ere a lso ser iou sly a ffected by the General M otors strike. In C leveland, that stoppage and a con struction industry strike com bined to provide m ore than half of the y ea r 's id len ess , while in Flint, the nationwide General M otors strike, plus a m a jor strike in January involving the same firm , accounted for w ell over 90 percent o f the y e a r 's total. On the other hand, strike id len ess in the New York m etropolitan area (668, 000 m an-days) declined m arkedly from the l e v e l o f the 2 previous y ea rs .
The G eneral M otors strike a lso strongly affected the w orker totals in severa l m e tro politan areas as m ore than 5, 000 w orkers w ere involved in this stoppage in each of
The construction industry accounted for nearly four-fifths of the 1964 strikes in Florida, and for 71 percent of the workers involved in stoppages. Idleness from construction strikes, however, accounted for only 13 percent of the year's total in the State.
Digitized for FRASER http://fraser.stlouisfed.org/ Federal Reserve Bank of St. Louis
8
13 areas. As in the case of id len ess , the y e a r 's la rgest strike accounted for a large proportion o f the w orkers involved in stoppages in D etroit and Flint, M ichigan.
With regard to the incidence o f strike activity, the New Y ork (286) and Philadelphia (134) m etropolitan areas ranked fir s t and second, resp ective ly . None o f the other m etropolitan areas record ed as many as 100 stoppages in 1964.
Monthly TrendsD espite an in crea se in both the num ber o f
stoppages and w orkers involved, strike id le ness during the f ir s t tw o-th irds o f 1964 was slightly below the low leve l o f the corresp on d ing p eriod in the preceding year (table 3). Through the 8 months ending with August, id len ess fro m w ork stoppages amounted to 11 .2 m illion m an-days, or 0. 13 percent of total estim ated w orking tim e. During the final third of the year, how ever, strike id le ness rose sharply over the leve l fo r the com parable p eriod in 1963. A pproxim ately 770, 000 w orkers becam e involved in new strikes during this period , bringing the total id len ess from all w ork stoppages in the final p eriod to 11. 8 m illion m an -days. Much o f this id len ess resu lted from 10 m a jor stop pages, the la rgest o f which was the strike against the G eneral M otors C orp .
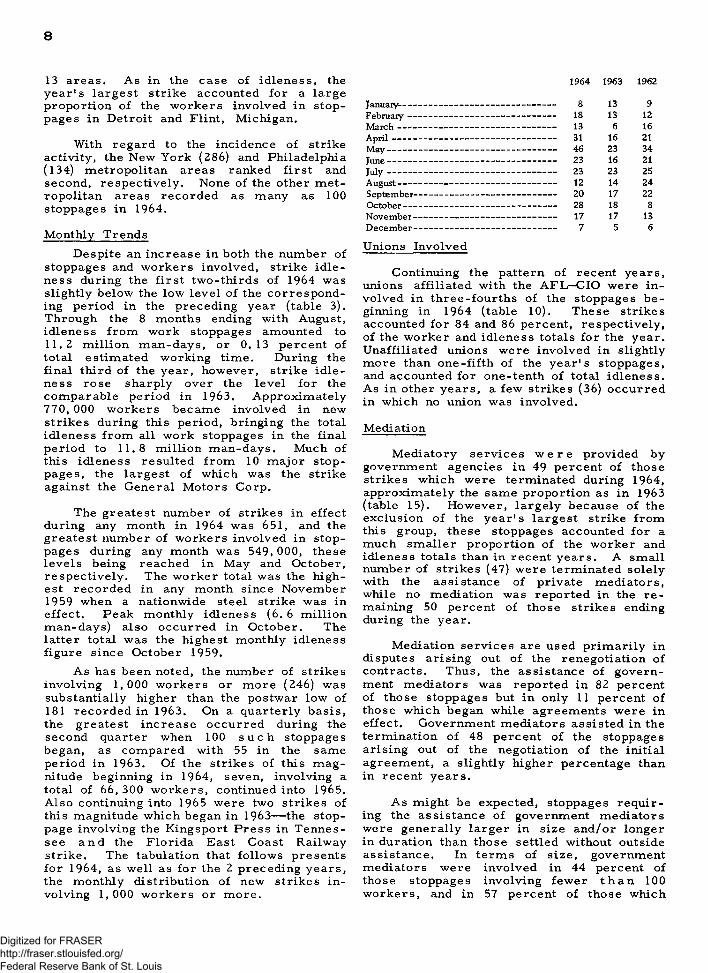
The greatest number o f strikes in e ffect during any month in 1964 was 651, and the greatest num ber of w orkers involved in stoppages during any month was 549, 000, these leve ls being reached in May and O ctober, resp ective ly . The w orker total was the highest re cord ed in any month since N ovem ber 1959 when a nationwide steel strike was in e ffect. Peak m onthly id len ess (6. 6 m illion m an-days) also o ccu rre d in O ctober. The latter total was the highest m onthly id leness figure since O ctober 1959.
As has been noted, the num ber o f strikes involving 1 ,000 w orkers or m ore (246) was substantially higher than the postw ar low of 181 record ed in 1963. On a quarterly basis , the greatest in crea se o ccu rre d during the second quarter when 100 s u c h stoppages began, as com pared with 55 in the same p eriod in 1963. Of the strikes o f this m agnitude beginning in 1964, seven, involving a total o f 66, 300 w ork ers , continued into 1965. A lso continuing into 1965 w ere two strikes of this magnitude which began in 1963— the stoppage involving the K ingsport P ress in Tennessee a n d the F lorid a East Coast Railw ay strike. The tabulation that fo llow s presents fo r 1964, as w ell as fo r the 2 preceding yea rs , the m onthly d istribution o f new strikes in volving 1, 000 w orkers or m ore .
1964 1963 1962
January----February —March-----A pril------May--------June--------July.........August----September October—November December
Unions Involved
Continuing the pattern o f recen t yea rs , unions a ffiliated with the AFLr-CIO w ere in volved in th ree -fou rth s of the stoppages b e ginning in 1964 (table 10). These strikes accounted fo r 84 and 86 percent, resp ective ly , o f the w orker and id len ess totals fo r the yea r. Unaffiliated unions w ere involved in slightly m ore than on e -fifth o f the y e a r 's stoppages, and accounted fo r one-tenth o f total id len ess . As in other yea rs , a few strikes (36) o ccu rre d in which no union was involved.
M ediation
8 13 918 13 1213 6 1631 16 2146 23 3423 16 2123 23 2512 14 2420 17 2228 18 817 17 137 5 6
M ediatory s e rv ice s w e r e provided by governm ent agencies in 49 percent o f those strikes which w ere term inated during 1964, approxim ately the sam e proportion as in 1963 (table 15). H ow ever, la rge ly because o f the exclu sion o f the y e a r 's la rgest strike from this group, these stoppages accounted fo r a m uch sm aller p roportion o f the w orker and id len ess totals than in recent yea rs . A sm all number o f strikes (47) w ere term inated so le ly with the assistan ce o f private m ed iators, while no m ediation was reported in the r e m aining 50 percent o f those strikes ending during the year.
M ediation serv ices are used p rim arily in disputes arising out o f the renegotiation o f con tracts . Thus, the assistan ce o f govern ment m ediators was reported in 82 percent of those stoppages but in only 11 percent o f those which began while agreem ents w ere in e ffect. G overnm ent m ediators a ssisted in the term ination o f 48 percent o f the stoppages arising out o f the negotiation o f the initial agreem ent, a slightly higher percentage than in recen t yea rs .
As m ight be expected, stoppages req u ir ing the assistan ce o f governm ent m ediators w ere gen erally la rg er in size a n d /or longer in duration than those settled without outside assistan ce . In term s of s ize , governm ent m ediators w ere involved in 44 percent o f those stoppages involving few er t h a n 100 w orkers , and in 57 percent o f those which
Digitized for FRASER http://fraser.stlouisfed.org/ Federal Reserve Bank of St. Louis

9
involved as many as 1, 000 w ork ers . As for duration, governm ent m ediation was reported in 27 percent o f those strikes lasting le ss than a week, and in 75 percent o f the situations which lasted 30 days or lon ger. The a verage duration o f strikes involving governm ent m ediation was 31. 8 days, as com pared with an average o f 14. 6 days fo r those in which no m ediation was reported . Part o f this d ifferen ce is attributable to the d ifferen ce b e tween contract renegotiation s t r i k e s and strikes during the term of agreem ents.
The se rv ice s o f governm ent m ediators w ere u tilized to a greater extent in manufacturing industries than in nonm anufacturing in 1964. Governm ent m ediation was reported in m ore than th ree-fifth s o f all m anufacturing stoppages as against slightly m ore than on e-th ird of the nonm anufacturing strikes. This d isparity is due in large m easure to the fact that the latter group o f industries a c counted fo r m ore than th ree -fifth s o f all stoppages arising while agreem ents w ere in e ffect, a group of stoppages in which, as noted above, m ediative assistan ce is not often u tilized .
Settlem ent
As in the precedin g year, fo rm a l settle m ents w ere reached in 90 percent o f all strikes ending in 1964 (table 16). In another 9 percent o f the stoppages term inated during the year, em p loyers resum ed operations without a form a l settlem ent, either with new em p loyees or with returning s tr ik ers . Thirty-two stoppages, involving 1 ,350 w ork ers , cam e to a c lo se with the em p lo y e r 's d ecis ion to d is continue operation s.
A f o r m a l settlem ent was reached in 95 and 92 percent, resp ective ly , o f those stoppages arising during con tract ren egotia tions or during the term o f an agreem ent.
Stoppages
On the other hand, a form a l settlem ent t e r m inated only 7 5 percent o f those strikes which o ccu rre d during e fforts to estab lish a c o l le c tive bargaining relationship .
P roced u re fo r Handling Unsettled IssuesW ork stoppages are often term inated with
the understanding that unsettled issu es w ill be reso lved follow ing the resum ption o f n o r m al operations. Inform ation was available on the m anner in which such issu es would be reso lved in 542 strikes ending in 1964, in cluding two o f the y e a r 's m a jor stoppages (table 17). In approxim ately on e-fou rth o f these strik es, continued d irect negotiations w ere chosen as the m eans o f settlem ent, while in slightly le ss than on e-fifth o f these ca se s , the issu es w ere to be submitted to a r bitration. In approxim ately 6 p e r c e n t of these strik es, involving few er w orkers than in recent yea rs , the issu es w ere to be r e fe rred to a governm ent agency. V arious other d ev ices w ere to be utilized to reso lve the rem aining issu es in approxim ately half o f these ca se s .
Continued d irect negotiations w ere the m eans se lected to reso lv e unsettled issu es in approxim ately half o f the strikes arising during the negotiation o f the initial agreem ent or in the renegotiation o f an agreem ent. A pproxim ately th ree -fifth s o f the ca ses in which arbitration was se lected w ere disputes which arose during the term of an agreem ent.
The issu es awaiting resolu tion in all but 1 o f these 542 stoppages are presented in the tabulation that fo llow s. Interunion m atters w ere the issu es outstanding in m ore than half o f these disputes, but accounted fo r a m uch sm aller proportion o f all w ork ers . On the other hand, stoppages in which w orking conditions constituted the u n resolved issu es accounted fo r on e-fifth o f the total, but in cluded tw o-fifth s o f all w orkers involved.
Workers involved_______ ________ Man-days idle
Percent Percent Percentof of of
Number total Number total Number total
Total stoppages covered1---------- 541 100.0 168,000 100.0 2,160,000 100.0
Wages and hours------------------------------- 33 6.1 14,300 8.5 175,000 8.1Fringe benefits-------------------------------- 30 5.5 10,100 6.0 126,000 5.8Union organization--------------------------- 35 6.5 8,850 5.3 59,000 2.7Working conditions------------------------- 109 20.1 68,600 40.7 1,120,000 51.6Interunion matters------------------- ------ 51.8 26,500 15.7 210,000 9.7Combination- ---------------------------------- 5.5 12,500 7.4 222,000 10.2Other---------------------------------------------- 4.4 27,500 16.4 255,000 11.8
Excludes 1 stoppage for which information was insufficient to classify.
NOTE: Because of rounding, sums of individual items may not equal totals.
Digitized for FRASER http://fraser.stlouisfed.org/ Federal Reserve Bank of St. Louis

10
Table 1. Work Stoppages in the United States, 1927—64 1
Year
Work stoppages Workers involved1 2 Man-days idle during year
NumberAverageduration(calendar
days)3
Number(thousands)
Percentof
totalemployed
Number(thousands)
Percent of estimated
total working
time
Perworker
involved
1927.................................... ....................................... 707 26. 5 330 1 .4 26,200 0 .37 79. 51928....................... — .......................................... 604 27 .6 314 1.3 12,600 . 17 40. 21929.................................... - 921 2 2 . 6 289 1 . 2 5,350 .07 18.51930.......................................... — ............................ 637 22 .3 183 . 8 3,320 .0 5 18. 1
1931.......................................... ............ 810 18.8 342 1 . 6 6 , 8 9 0 . 11 2 0 . 21932.................................................................... 841 1 9 . 6 324 1 . 8 10,500 .2 3 3 2 .41933............................................ ......................... 1, 695 16.9 1, 170 6 .3 1 6 , 9 0 0 .3 6 14 .41934....................... - - - 1,856 19.5 1,470 7 .2 1 9 , 6 0 0 .3 8 13 .41935 ....................................... - 2, 014 23.8 1, 12 0 5 .2 15,500 .2 9 13.8
1936..................................................................................... 2, 172 23.3 789 3. 1 13,900 . 2 1 17.61 9 3 7 __________________________________________________ 4, 740 20 .3 1 , 8 6 0 7 .2 28,400 .43 15.31938--------- ----- 2, 772 23 .6 6 8 8 2 . 8 9,150 . 15 13.31939.................................... — 2,613 2 3 .4 1, 170 4 .7 17,800 .2 8 15. 21940........................................................................................... 2, 508 20.9 577 2 .3 6 ,700 . 10 1 1 . 6
1941.............................. 4, 288 18.3 2 ,360 8 .4 23,000 .3 2 9 .81942............................ ......................... 2 , 9 6 8 11.7 840 2 . 8 4, 180 . 05 5. 01943— - ____ _____________ 3, 752 5 .0 1 , 9 8 0 6 .9 13,500 . 15 6 . 81944— . — . 4 ,956 5 .6 2 , 120 7 .0 8 ,720 .0 9 4. 11945..................................................................... 4 ,750 9 .9 3, 470 1 2 . 2 38,000 .47 1 1 . 0
19 4 5 _____________________________ ____________________ 4, 985 24. 2 4, 600 14.5 1 1 6 , 0 0 0 1.43 25. 21 9 4 7 ... . . . . .___ ,_______ „_______ ,______________________ 3, 693 25 .6 2, 170 6 . 5 34 ,600 .41 15.91948................................................. 3 ,419 2 1 . 8 1 , 9 6 0 5 .5 34, 100 . 37 17 .41949............................................... 3 ,606 22. 5 3, 030 9 .0 50 ,500 .5 9 16.71950........................................................................................... 4, 843 1 9 . 2 2,410 6 .9 38 ,800 .4 4 1 6 . 1
1951.......................................... - ............................................. 4 ,737 17 .4 2 , 2 2 0 5 .5 2 2 , 9 0 0 .2 3 10.319 5?.___,_____ ______ ________________________________ 5, 117 1 9 . 6 3, 540 8 . 8 59, 1 0 0 . 57 16.71953........................................................................................... 5, 091 20.3 2, 400 5 .6 28,300 .2 6 1 1 . 819 54________________________ __ _____________________ 3,468 22. 5 1, 530 3 .7 2 2 , 6 0 0 . 2 1 14. 71955.......................................................... .................. 4 ,320 18. 5 2 ,650 6 . 2 28,200 .26 10.7
1956........................................................................................ . 3 ,825 18.9 1 , 9 0 0 4 .3 33,100 .2 9 17 .41957__________________________________________________ 3, 673 1 9 . 2 1,390 3 .1 16,500 . 14 11 .41958__________________________________________________ 3, 694 19.7 2 , 06 0 4 .8 23,900 . 2 2 1 1 . 61959__________________________________________________ 3,708 24 .6 1,880 4 .3 6 9 , 0 0 0 . 6 1 36.7I9 6 0 ........................................................................................... 3, 333 2 3 .4 1,320 3 .0 1 9 , 1 0 0 . 17 14. 5
1 9 6 1 — ______________________________________________ 3, 367 23.7 1,450 3. 2 16,300 . 14 1 1 . 21 9 6 2 __________________________________________________ 3 ,614 24 .6 1, 230 2 .7 18,600 . 16 15. 019 6 3 3, 362 23 .0 941 2 . 0 1 6 , 1 0 0 . 13 17. 11964 3, 655 22 .9 1,640 3 .4 2 2 , 9 0 0 . 18 14. 0
1 The number of stoppages and workers relate to those beginning in the year; average duration, to those ending in the year. Man-days of idleness include all stoppages in effect.
Available information for earlier periods appears in Handbook of Labor Statistics (BLS Bulletin 1016, 1951), table E -2 . For a discussion of the procedures involved in the collection and compilation of work stoppage statistics, see Techniques of Preparing Major BLS Statistical Series (BLS Bulletin 1168, 1955), ch. 12.
2 In these tables, workers are counted more than once if they were involved in more than 1 stoppage during the year.3 Figures are simple averages; each stoppage is given equal weight regardless of its size.
Digitized for FRASER http://fraser.stlouisfed.org/ Federal Reserve Bank of St. Louis

11
Table 2. Work Stoppages Involving 10,000 Workers or More, Selected Periods
Period Number
Workers involved Man-days idle
Number(thousands)
Percent of total for
periodNumber
(thousands) 1
Percent of total for
period
1935-39 (average)_________________________________ 11 365 32.4 5, 290 31.21947—49 (average)_________________________________ 18 1, 270 53.4 23 ,800 59.91945........................................................................ 42 1, 350 38.9 19, 300 50.71946........................................................................................ 31 2 , 920 63.6 66 ,400 57.21947................................................................................... 15 1, 030 47.5 17, 700 51.21948..................................................................................... 2 0 870 44.5 18,900 55.31949 .......... ................................................. 18 1, 920 63.2 34,900 69.01950............................... ....................... ...... 22 738 30.7 21,700 56.01951 T- .... ... . , .._________ T--______ _____________ 19 457 2 0 . 6 5, 680 24.81952________________________________________________ 35 1, 690 47.8 36,900 62.61953.................................................................. 28 650 27.1 7, 270 25.7195 4 _________^__________________________________________________ 18 437 28.5 7, 520 33.31955................................................................... 26 1 , 2 1 0 45.6 12, 300 43.41956 ............._______________ ___ _______ _______ 12 758 39.9 19, 600 59.11 9 57n, , r -- - , ____________________________________ 13 283 20.4 3, 050 18.51 9 5 8 ........ ........ . _______________________________ r 21 823 40.0 1 0 , 600 44.21959............................ ....... ................... 2 0 845 45.0 50, 800 73.71960................................................................................... 17 384 2 9 . 2 7, 140 37.41 9 6 1 .................................- .............................................. 14 601 41.4 4 ,950 30.41 9 6 2 .............................. . . . . . 16 318 25.8 4, 800 25.81963 ............................................................ 7 102 1 0 .8 3, 540 2 2 . 01964........................................................................................ 18 607 37.0 7,990 34.8
1 Includes idleness in stoppages beginning in earlier years.
Table 3. Work Stoppages by Month, 1963—64
Month
Number of stoppages Workers involved in stoppages
Man-days idle during month
Beginningin
month
In effect during month
Beginning in month
(thousands)
In effect during month
(thousands)
Number(thousands)
Percent of estimated
totalworking time
1963
J anuary-------------------------------------------------------------------- 230 366 68 175 2, 240 0 . 2 2F ebruary —--------------------------------------------------------------- 198 323 53 109 1, 0 0 0 .1 1Mar ch --------------------------------------- ---------- -------------------- 214 348 40 90 984 . 1 0Apr il------ ------ ------------------------------------------------------------ 291 423 89 119 937 .09M ay--------------------------------------------------------------------------- 377 543 118 148 1,430 .14J une----------------— -------------— ------------------------------------- 380 593 128 181 1, 550 .16July......................................... 372 606 94 183 1 , 810 .17Au gu st----------------------------------------------------------------------- 312 545 67 167 1, 350 .13September---------------------------------------------------------------- 287 500 81 155 985 . 1 0October-------------------------------------------------------------------- 346 574 96 153 1, 420 .13November ---------------------------------- ----------------------------- 223 467 80 152 1, 410 .15December —------------------------------------------------------------- 132 336 27 82 977 . 1 0
1964
J anuar y ---------------------------------- —------------------------------ 211 375 53 91 898 .09F ebruary----------------------------------------------------------------- 233 375 81 116 1, 040 . 11Mar ch ——------------------ ------------------ ------------- ---------- — 241 399 79 123 816 .08Apr il-----—----------------------------------------- — -------------------- 364 529 140 187 1, 170 .11May - - - ------------------ ------ ----------------■■ .1- -— — -.I.- — m m m m -r -. 442 651 192 249 2, 400 .24June—— —— — — — — — — — — — — — —— — —— 376 586 124 22 2 1, 900 .18July- - .................................................... 416 639 126 195 1, 740 .15August----------------------------------------------------------------— 306 556 73 133 1 , 2 0 0 .1 2.September—-------------- ---------------------------------------------- 336 574 374 432 2, 390 .23October --------------- —------------------ — --------------------- 346 584 214 549 6 , 590 .61November —— ------ ----------------- ------ — ---------------------- 238 469 141 274 1, 730 .17December — — — — ----- 146 346 42 149 1 , 060 . 1 0
Digitized for FRASER http://fraser.stlouisfed.org/ Federal Reserve Bank of St. Louis

12
Table 4. Work Stoppages by Contract Status and Major Issues, 1964
Contract status and major issue
All stoppages____________________________________
Negotiation of first agreement_____________________General wage changes and supplementary
benefits__________________________________________Wage adjustments________________________________Hours of work_____________________________________Union organization and security________________Job security and plant administration---------------Interunion or intraunion m atters-----------------------Other______________________________________________
Renegotiation of agreement (expirationor reopening)_______________________________________
General wage changes and supplementarybenefits-----------------------------------------------------------------
Wage adjustments________________________________Hours of work_____________________________________Union organization and security________________Job security and plant administration__________Interunion or intraunion m atters_______________Other_______________________________________________
During term of agreement (negotiation ofnew agreement not involved)______________________
General wage changes and supplementary
Wage adjustments________________________________Hours of work_____________________________________Union organization and security-------------------------Job security and plant administration__________Interunion or intraunion m atters-----------------------Other________ ______________________________________
No contract or other contract status_____________General wage changes and supplementary
benefits__________________________________________Wage adjustments_________________________________Hours of work---------------------------------------------------------Union organization and security-------------------------Job security and plant administration---------------Interunion or intraunion m atters------------------------Other______________________________________________
No information on contract status__________________
Stoppages beginning in 1964 Man-days idle, 1964 (all stoppages!
Number PercentWorkers involved
Number Percent Number Percent
3,655 1 0 0 .0 1 ,640 ,000 1 0 0 .0 22 ,900 ,000 1 0 0 .0
646 17.7 67,000 4.1 1 ,490 ,000 6.5
175 14,500 341,0006 330 4, 780- - 1 870
408 48,700 1,060 ,00041 2 , 810 65,300
9 540 2 , 8107 140 1 1 , 6 0 0
1,613 44.1 1 , 1 0 0 , 0 0 0 67.0 19 ,100 ,000 83.2
1, 312 609 , 0 0 0 9 ,9 4 0 ,0 0 029 1 0 , 0 0 0 146,000
9 2,950 2 1 , 2 0 066 18,800 513,000
132 441,000 8 ,240 ,0002 680 1,370
63 17,600 224,000
1, 317 36.0 462,000 28.2 2 ,280 ,000 9.9
126 52,900 190,0003 350 1 , 02 0
75 19,100 191,000616 306,000 1,510 ,000441 63,700 302,000
56 19,400 80,400
59 1.6 1 1 , 0 0 0 .7 63,100
29 9 , 0 0 0 48,8006 490 3, 940
3 190 69016 880 8 , 160
1 20 2704 390 1 , 2 0 0
20 .5 850 .1 15,300 .1
1 Idleness in 1964 resulting from a stoppage that began in 1963.
NOTE: Because of rounding, sums of individual items may not equal totals.
Table 5. Major Issues Involved in Work Stoppages, 1964
Major issue
Stoppages beginning in 1964Man-days idle,
1964 (all stoppages!Number Percent
Workers involved
Number Percent Number Percent
All issu e s_______________
General wage changes__________________ ______General wage in crease___________________________General wage increase plus
supplementary benefits__________________________General wage increase, hour decrease_________General wage decrease___________________________General wage increase and escalation__________Wages and working conditions___________________
3,655 1 0 0 .0 1 ,640 ,000 1 0 0 .0 22 ,900 ,000 1 0 0 .0
1,419474
7093610
190
38.8 588.0001 1 0 . 0 0 0
357,0002 2 , 0 0 0
900
98,100
35.9 9 .3 7 0 .0 0 01.660 .000
5 .010 .000385.000116.000
2 .1 9 0 .0 0 0
40.9
Digitized for FRASER http://fraser.stlouisfed.org/ Federal Reserve Bank of St. Louis

13
Table 5. Major Issues Involved in Work Stoppages, 1964----Continued
Major issue
Stoppages beginning in 1964 Man-d«lys idle, stoppages^
Number PercentWorkers involved 1964 (all
Number Percent Number Percent
Supplementary benefits__________ __ _ _ 101 2 . 8 44,300 2. 7 9 6 6 , 0 0 0 4. 2Pensions, insurance, other welfare
programs---------------------------------------------------------------- 46 26,500 518,000Severance or dism issal pay; other
payments on layoff or separation______________ 6 880 16,500Premium pay_______________________________________ 12 4,710 2 8 9 , 0 0 0Other___________________ _______ 37 12,300 143,000
Wage adjustments_____________________________________ 168 4. 6 63,800 3.9 345,000 1. 5Incentive pay rates or administration___________ 70 25,300 87,900Job classification or ra tes . ________ _________ 55 23,200 163,000Downgrading________________________________________ - - -Retroactivity_______________________________________ 6 1 , 0 1 0 25,800Method of computing pay__________________________ 37 14,300 67,600
Hours of work_________________________________________ 12 . 3 3, 310 . 2 23,000 . 1Increase____________________________________________ 3 270 1 , 260D ecrease___________________________________________ 9 3,030 21,800
Other contractual m atters___________________________ 61 1. 7 17,900 1 . 1 180,000 . 8Duration of contract____ _ _ ______________ ___ 12 4, 340 1 0 9 , 0 0 0Unspecified________ __________ ________ 49 13,500 71,300
Union organization and security____________________ 556 15. 2 86,800 5. 3 1 ,770 ,000 7. 7Recognition (certification)_____ _ _______ _____ 189 7, 860 181,000Recognition and job security issu es_____________ 12 830 8 , 640Recognition and economic issues________________ 139 1 6 , 9 0 0 443,000Strengthening bargaining position or
union shop and economic issu es_______________ 80 18,000 535,000Union security __ _______________ __ _ __ __ 37 2 8 , 9 0 0 532,000Refusal to sign agreement________________________ 17 490 9,270Other union organization m atters_______________ 82 13,800 57,700
Job security___________________________________________ 213 5. 8 175,000 1 0 . 6 1 ,470 ,000 6 .4Seniority and/or layoff___________________________ 104 36,100 624,000Division of work___________________________________ 12 12,500 68,500Subcontracting_________ _ 26 1 1 , 9 0 0 179,000New machinery or other technological
issu es_____________________________________________ 22 80,000 444,000Job transfers, bumping, etc_____________________ 6 5,410 57,000Transfer of operations or prefabricated
goods______________________________________________ 6 400 3, 130Other_______________________________________________ 37 28,400 9 9 , 1 0 0
Plant administration_________________________________ 596 16. 3 576,000 35. 1 8 ,3 60 ,000 36. 4Physical facilities, surroundings, etc__________ 25 12,700 1 0 0 , 0 0 0Safety m easures, dangerous
equipment, e t c _ _ ____ _____ ___ _ _ __ 33 13,500 47,100Supervision________________________________________ 21 3,500 7 ,990Shift w ork__________________________________________ 26 1 2 , 2 0 0 51,500Work assignm ents_______ ____ ____ ________ 44 9, 850 79,400Speedup (workload)___________ ______ _ ___ 68 31,500 241,000Work rules_________________________________________ 38 49,700 523,000Overtime work_____________________________________ 12 2 , 9 6 0 38,600Discharge and discipline__________________________ 224 96,400 542,000Other1______________________________________________ i | 105 344,000 6 ,7 3 0 ,0 0 0
Other working conditions____________________________ 51 1 .4 16,700 1. 0 132,000 . 6Arbitration_________________________________________ 9 1 , 0 9 0 11,400Grievance procedures____________________________ 24 1 2 , 0 0 0 1 0 2 , 0 0 0Unspecified contract violations__________________ 18 3,680 17,700
Inter union or intraunion m atters___________________ 454 12. 4 64,900 4. 0 307,000 1. 3Union rivalry 2 ________________________ ___________ 9 520 2,670Jurisdiction— representation
of w orkers3 _ _ _ . 16 2 , 0 0 0 9 , 280Jurisdictional— work assignment________________ 359 31,100 161,000Union administration4 ____________________________ 5 1,080 3, 240Sympathy__ ____________ _____ ______ 64 26,700 116,000Other_______________________________________________ 1 3,500 14,200
Not reported___________________________________________ 24 . 7 3, 140 . 2 7,970 (5)
1 Includes the nationwide General Motors strike and the Ford strike, both of which involved a variety of issues at the plant level.
2 Includes disputes between unions of different affiliation, such as those between AFD—CIO affiliates and independent organizations.
3 Includes disputes between unions, usually of the same affiliation or 2 locals of the same union, over representation of workers.
4 Includes disputes within a union over the administration of union affairs or regulations.5 Less than 0.05 percent.
NOTE: Because of rounding, sums of individual items may not equal totals.
Digitized for FRASER http://fraser.stlouisfed.org/ Federal Reserve Bank of St. Louis
14
Table 6. Work Stoppages by Industry Group, 196Stoppages beginning
in 1964Man-days idle,
1964 (all stoppages)
Industry groupNumber Workers
involved NumberPercent of
estimated total working time
All industries--------------------------------------------- >3,655 1, 640,000 22 ,900 ,000 0.18
Manufacturing------------------------------------------------ 1 1,794 994,000 15 ,700 ,000 0.35
Ordnance and accessories------------------------------------- 8 6 ,820 154,000 0.23Food and kindred products_______________________ 186 54,900 8 6 6 , 0 0 0 .19Tobacco manufactures-------------------------------------------- 1 600 1,680 . 01Textile m ill products---------------------------------------------Apparel and other finished products made
37 8,440 124,000 .05
from fabrics and similar m aterials-----------------Lumber and wood products, except
106 24,700 225,000 .07
furniture----------------------------------------------------------------- 56 7, 110 96,900 .06Furniture and fixtures____________________________ 60 6 , 930 145,000 .14Paper and allied products------------------------------------- 79 38,900 580,000 .36Printing, publishing, and allied industries------- 50 8,650 801,000 .33Chemicals and allied products----------------------------- 94 2 1 , 0 0 0 337,000 .15Petroleum refining and related industries-----Rubber and miscellaneous plastics
22 5, 340 164,000 .34
products ____ _________________________________ ___ 67 30,000 452,000 .41Leather and leather products------ ----- ------------ 34 6,050 67,300 .07Stone, clay, and glass products------------- ---------- 117 22,800 412,000 .26Primary metal industries------------------------------------Fabricated metal products, except ordnance,
173 87,700 1 , 0 1 0 , 0 0 0 .32
machinery, and transportation equipment------ 228 79,900 1 ,550 ,000 .50Machinery, except electrical____ _____________ -Electrical machinery, equipment, and
191 1 2 0 , 0 0 0 1 ,140 ,000 .27
supplies____ __________________________________ — 105 62,700 859,000 .21Transportation equipment________________________Professional, scientific, and controlling
instruments; photographic and optical
120 386,000 6 ,4 1 0 ,0 0 0 1.53
goods; watches and clocks---------—---------------------- 23 6 , 840 170,000 .18Miscellaneous manufacturing industries------— 49 8 ,960 146,000 .14
Nonmanufacturing______________________ — 1 1,865 646,000 7 ,210 ,000 2 .09
Agriculture, forestry, and fisheries------------------ 18 3, 00Q 44,100 (3)Mining _______________ ______________________________ 155 83,400 808,000 0.49Contract construction_________________________ —Transportation, communication, electric,
944 248,000 2 ,7 9 0 ,000 .35
gas, and sanitary services--------------------------------- 257 205,000 1,900 ,000 .19Wholesale and retail trade------------- — ------------ 309 61,600 1,340 ,000 .04Finance, insurance, and real estate----- ---------- 17 830 10,400 (4)S e r v i c e s _ _ ______ 125 20,900 245,000 .01Government--------------- -------------------------------------------- 41 22,700 70,800 (4)
1 Stoppages extending into 2 industry groups or more have been counted in each industry affected; workers involved and man-days idle were allocated to the respective groups.
2 Excludes government and agriculture.3 Not available.4 Less than 0.005 percent.
NOTE: Because of rounding, sums of individual items may not equal totals.
Digitized for FRASER http://fraser.stlouisfed.org/ Federal Reserve Bank of St. Louis

15
Table 7. Work Stoppages by Region,1 1964 and 1963
RegionStoppages
beginning in—Workers involved
in stoppages beginning in—
Man-days idle (all stoppages)
Percent of estimated total
working time
1964 1963 1964 1963 1964 1963 1964 1963
United States------------------------------
New England
2 3, 655 2 3 ,362 1 ,640 . 000 941, 000 22 ,900 ,000 16, 1 0 0 , 0 0 0 0 . 18 0. 13
273 1, 051
987 253 397 239 188 172 365
227 1, 055
781 246 311 173 156 144 402
63.900354.000671.000
63,500151.000 74, 8006 0 . 9 0 0 69, 400
132, 000
52,300270.000219.000
79.700 75, 400 46,40020.700 48,600
129, 0 0 0
712.000 4, 090,000 9 ,8 8 0 ,0 0 0
925.000 2 ,420 , 0 0 01 .150 .000
627.000776.000
2 .3 50 .000
911, 00 0 4, 500,000 3, 220, 000
931.000 1 ,540 ,000 1, 000 , 000
929 . 0 0 0482.000
2, 580, 000
0.08 . 15 .37 . 10 . 14 . 18 .06 . 19 . 16
0 . 11 . 17 . 12 . 10 . 10 . 16 . 10 . 12 . 18
Middle Atlantic_____________________F a st TMrvrtVi P .p n tral
West North Central---------------------------South Atlantic-------------- ----------------------East South Central-----------------------------West South Central---------------------------
1 The regions are defined as follows: New England— Connecticut, Maine, Massachusetts, New Hampshire, Rhode Island,and Vermont; Middle Atlantic-— New Jersey, New York, and Pennsylvania; East North Central-— Illinois, Indiana, Michigan, Ohio, and Wisconsin; West North Central-— Iowa, Kansas, Minnesota, M issouri, Nebraska, North Dakota, and South Dakota; South Atlantic— Delaware, District of Columbia, Florida, Georgia, Maryland, North Carolina, South Carolina, Virginia, and West Virginia; East South Central— Alabama, Kentucky, M ississippi, and Tennessee; West South Central— Arkansas, Louisiana, Oklahoma, and Texas; Mountain— Arizona, Colorado, Idaho, Montana, Nevada, New Mexico, Utah, and Wyoming; and Pacific — Alaska, California, Hawaii, Oregon, and Washington.
2 Stoppages extending across State lines have been counted in each State affected; workers involved and man-days idle were allocated among the States.
NOTE: Because of rounding, sums of individual items may not equal totals.
Digitized for FRASER http://fraser.stlouisfed.org/ Federal Reserve Bank of St. Louis

16
Table 8. Work Stoppages by State, 1964
State
Stoppages beginning in 1964
Man-days idle, 1964 (all stoppages)
Number Workersinvolved Number
Percent of estimated total
working time
United States----------------------------- ------------------- 13.655 1. 640.000 22 .900 .000 0. 18
Alabam a---------------------- ----------------------------- - ------ 83 27, 000 243,000 0. 14Alaska-------------------------- ------- -------------------------------- 8 160 10,200 . 11A rizo n a ................. .,......... __________ _______________ 18 2,610 69,000 .0 9Arkansas___ ______________________________________ 27 9, 290 95,600 . 10California-------------- --------------------------------------------- 266 92,400 1,9 1 0 ,0 0 0 . 16
Colorado____________________________________________ 35 6, 270 45,400 .0 4C onne c ti cut — — —— —— — —— — — ——— ———— 66 23,600 172,000 .08Delaware------------ ---------------------------- — ----------- 19 9, 930 154,000 .41District of Columbia---------------------------------------------- 10 770 10,900 . 01Florida---------------------------------------------------------------------- 106 37,900 662,000 .20r > r > r g i a 42 19,100 331,000 . 13Hawaii-------------------------------------- - ------ ---------- — 26 3, 040 7, 960 . 02
- - __ ___ — 23 1,990 36,300 . 11lllinoi s ——————— ——————— ———————— — 247 127,000 1, 520, 000 . 18Indiana — — -------------- ----------------- - ------------------ — -------- 122 53,800 537,000 . 1 6
Iowa---------------------------------------------- ------------------------------------------ --------------- 69 24, 800 245, 000 .16Kansas ____ ________ ______________ ... - ......- _____ 20 5, 880 128,000 . 1 1Kentucky____________________ ,_____________ „_______ 69 28,100 265,000 . 17Louisiana--------- ---------------------------- ------------ -------------------------- ------- 48 23,400 184,000 . 1 0Maine---------------------------------- ------------ ------------------------------------ — — 14 5, 390 90,600 . 15
Maryland ------- -------------------- -------------------- -------------------- ---------------- 41 34,100 686,000 . 32Massachusetts - __— _____— __— -------------------------------------------------- 137 25,900 306,000 . 07Michigan__________________________________________________________________ 197 249,000 4 ,5 4 0 ,0 0 0 .83Minnesota_____- ___ - __________ _______________________ __ 37 2, 380 35,300 .02M ississippi ---------------------------------------------------------------------------------------------- 22 8 ,470 135,000 . 14
M issouri-------------------------------------------------------------------------------- ------------------ 95 26,500 422,000 . 14Montana______ _ _____ ___________________________ 21 20, 700 93,900 .28Nebraska --------------- ------------ — ------------------------------------ --------------- 19 1, 930 41,900 . 05Nevada ---------------------- — — -------------------- ------------ _ ------------------ 34 14,700 114,000 . 36New Hampshire------- — — ------------ — ---------- --------------- 15 1,400 15,600 . 03
New Jersey________________________________________ 243 75, 000 1 ,320 ,000 . 27New Mexico____— ___________________ __________ r____________ 14 3, 420 40,600 .09New V<~>~rk____________________ -n-_____T-.T-T-— _____1- -T ______ 420 160,000 1, 590, 000 .11North Carolina----------------------- -------------------------------- ------------------ 18 2, 120 15,000 . 0 1North Dakota------------------------------------------------------------------------------------------ 10 1 , 280 7, 670 . 03
Ohio-------------- — ------------ ------------------------------------------------ ---------------- 340 191,000 2,6 9 0 ,0 0 0 . 38Oklahoma-___ ____________________________________________________________ 22 2, 020 12, 400 . 0 1Oregon ---------------------------------- ------------------------ --------- ------------ -------- 17 13,000 147,000 . 1 2Pennsylvania — ------------- ---------------------------------- ------- — 388 119,000 1 ,180 ,000 . 14Rhode Island-------------------------------------------------------------------------------------------- 30 6,430 63,100 .09
South Carolina________________________________________________________ 14 1 , 810 17,700 . 0 1South Dakota----------------------- — -------- — _______________ — 3 670 45,100 . 16Tennessee -------------- ------------------------------------------------------------------ --------- 65 11,200 509,000 . 23Texas------------------------------------------ ------------ ------------------------------------------------ 91 26,200 336,000 . 06Utah------------------------------------------------------------------------------------------------------------------ 23 19,300 375,000 . 6 6
Verm ont------------------------------------------------------------------------------------------ -------- 11 1 , 2 1 0 63,700 .26Virginia_____________________________________________ 52 14,200 103,000 .0 4W a shington_________________________________________ 48 23,200 273,000 . 16W est Virginia_________________________________________________________ 95 31,100 441,000 .45Wis consin — — ______ __ ___ ,________ — __________________ 81 49 ,900 582,000 . 2 1Wyoming------ — ------------- -------- -------- -------------- 4 550 1,990 . 0 1
1 Stoppages extending across State lines have been counted in each State affected; workers and man-days idle were allocated among the States.
NOTE: Because of rounding, sums of individual items may not equal totals.
Digitized for FRASER http://fraser.stlouisfed.org/ Federal Reserve Bank of St. Louis

17
Table 9. Work Stoppages by Metropolitan Area, 1964'1
Metropolitan area
Stoppages beginning in
1964Man-days idle, 1964
(all stoppages)Metropolitan area
Stoppages beginning in
1964Man-days idle, 1964
Number
Workersinvolved
Number
Workersinvolved
(all stoppages)
Akron, Ohio-------- - — 32 15, 400 59,000 Jacksonville, F la -------------------------- 7 1, 150 82, 900Albany—S chene ctady— Jersey City, N .J - ------ -------- 35 7, 200 60, 200
Troy, N. Y —-^tt______ -_-____ 22 3, 850 21, 800 |Johnstown, P a ____ 7 1, 440 10, 500Albuquerque, N. M ex--------------------- 5 380 2, 470 BKansas City, Mo.—Kans - ----- - 34 12, 300 196,000Allentown—Bethlehem—Easton, I King s t o n—N e wbur gh—
Pa.—N. J ___________________________ 40 9, 260 168,000 | Poughkeepsie, N .Y -----------------— 16 1, 030 17, 500Anaheim—Santa Ana—Garden
Grove, C alif2------------ ------ ---------— 17 3, 080 42,100 Knoxville, Tenn------ — — 7 600 16,200Lake Charles, La--------- — — - 9 4, 610 91,200
Ann Arbor, Mich----------------------------- 8 13,600 260, 000 Lancaster, P a ------------- — — - 11 2, 020 16,90020 16,300 294,000 T.ansing^ Mir'Vi 13 17, 400 349, 000
Atlantic City, N.J---------------------------- 7 * 690 19*, 500 Las Vegas, N ev----------------- - 12 530 7, 370Bakersfield, C alif_- - - ____ 9 840 7, 570Baltimore, Md- - ----- - - 33 27,500 561,000 Lawr en c e—Have r hill,
M ass.—N .H _______________________ 10 750 30, 400Baton Rouge, L a ----------------------------- 11 4, 300 34, 000 Lincoln, Nebr-_____ — _— 5 90 440Bay City, Mich —---------------------- ------ 8 3, 660 61,500 Little Rock-North Little
9 1, 490 52,700 Rnrlfj Ark 10 2, 410 12,500Birmingham, A la --------------------------- 25 5i 760 9 1 ,200 Lorain—Elyria, Ohio_____________ 18 9, 100 163,000Boston, M a ss ---------------------------------- 60 16,100 198, 000 Los Angeles—Long
Beach, C alif2------------------- ------------ 84 38,700 997, 000Bridgeport, Conn-------------- —---------- 22 15,000 55, 200Buffalo, N. Y - - - .......................... 34 18,400 346,000 I Louisville, Ky.—Ind------------------------ 21 9, 310 60, 400Canton, Ohio__r_ „____^ __,_..rMn, 20 3, 040 33, 500 Manchester, N.H------------------------— 5 240 1, 680Cedar Rapids, Iowa----------------------- 7 3, 120 26,100 Memphis, Tenn.—A rk -------------------- 12 4, 250 24,200Charleston, S .C .------ —-------------- — - 5 970 5, 020 Miami, Fla - - - - ----- - - 19 7,890 218,000
Milwaukee, W is ------ — - 31 23,000 267,000Charleston, W. Va--------- 10 5, 100 150, 000Chattanooga, Tenn.—Ga- ------ 8 1, 190 26, 000 Minneapolis—St. Paul, Minn — 24 1, 550 18,900Chicago, T11_________________________ 77 39,100 515,000 Mobile, Ala— — - — ----- 12 3, 090 5, 920Cincinnati, Ohio—Ky.—Ind—----------- 30 8, 780 197,000 Muncie, Ind- ___ - — - 8 5, 640 79, 200Cleveland, Ohio - - - ----- 68 81, 100 1, 310, 000 Muskegon—Muskegon
Heights, Mich— — - _ - 6 1, 230 38,900Colorado Springs, C olo—------------— 6 300 1, 960 Nashville, Tenn- 13 1, 720 25,800Columbus, Ohio—---------------------------- 25 8, 720 128,000Corpus Christi, T ex—-------------- ----- 5 780 12, 300 New Bedford, M a ss---------------------- 13 1, 200 6 ,490Dallas, Tex— ------ - — — - 11 3, 170 26, 100 New Haven, Conn—------------------------ 20 3, 100 20, 100Davenport—Rock Island—Moline, New Orleans, La---------------------------- 16 10, 900 24, 400
Iowa—111 -------------- - -------------- 24 15,600 125,000 New York, N .Y ____________________ 286 96,300 668,000Newark, N. J - . , . „ ________________ 82 26,000 370,000
Dayton, Ohio — - - 19 6, 230 74, 600Decatur, 111 - - ---------- - 11 5, 180 33,300 Norfolk—Portsmouth, Va_________ 8 2, 610 6, 260Dpnypr f.nl r> ...... 16 3, 350 28, 800 TTtaV* 5 1, 230 5, 570Des Moines, Iowa— ------ —---------- — 18 4, 590 51, 900 Oklahoma City, Okla------------------ — 8 270 2, 920Detroit, M ich---------------------------------- 95 114, 000 2, 060, 000 Omaha, Nebr.—Iowa- ---------- 15 1,850 26,000
Pate r s on—Clifton—Dubuque, low a —------------------------------ 6 4, 090 4, 760 Passaic, N .J ____ - - — 49 14,500 453,000Eugene, Or e g — ---------— — -----— 6 760 8, 190Evansville, Ind.—K y------------------------ 18 8, 090 53, 600 Pensacola, F la ____________________ 5 440 2, 780Fall River, M ass.—R.I—----------------- 12 3, 690 9, 900 Peoria, 111--------- — 31 39, 600 413,000Fitchburg—Leominster, M a ss------ 5 190 7, 300 Philadelphia, P a .-N .J ------ 134 66,000 670, 000
Phoenix, A riz---------- —------------------- 6 750 11, 400Flint, Mich ----- — — - 10 62,700 1, 130, 000 Pittsburgh, Pa------------------------------- 83 16,600 184, 000Fort Lauderdale—
Hollywood, F la ----------------------------- 12 1, 650 7, 460 Portland, Maine------—-------------------- 7 490 6, 220Fort Worth, T ex -----— --------------- — 9 3, 880 93, 400 Portland, Or eg.—Wash--------— ----- 10 4, 840 47, 800Fresno, C alif—-------------------------------- 10 720 3, 900 Providence—Pawtucket—
P-ity Toy . . 6 1, 750 8, 030 W a rk R T —M ass .... ..... 31 6, 290 52,800Provo—Orem, Utah— ------------------- 6 1, 520 8, 330
Gar y—Hammond—Ea s t Pueblo, Colo___ — — — - 7 480 7, 200Chicago, Ind— — — — — —— 16 4, 450 17, 000
Grand Rapids, Mich---------- ------ ------ 12 10, 300 186,000 Reading, Pa —______ — __——_____ 13 1, 650 21, 900Great Falls, M ont---------------— ------ 6 1, 470 15,200 Reno, Nev-------- - — — 7 250 5, 860Hamilton—Middletown, Ohio— — — 6 3, 180 58,300 Richmond, Va— — — — — — 10 940 10, 300
r . f i f i f i . __ ................. 8 750 10, 600 Rnrkpstpr N Y 19 12,700 335,000Sacramento, C alif———— ——-----— 17 2, 870 18,400
Honolulu, Hawaii— -----— — ----- 21 2, 140 6, 680Houston, Tex------- — ——— -----— 23 6 ,930 53,900 Saginaw, Mich —-----— —— — —— 12 8, 800 207,000Huntington—Ashland, St. Louis, Mo.—Ill______________ — 58 18,200 312,000
W. Va.—Ky.—Ohio-------------------------- 20 7, 040 28,400 Salt Lake City, Utah------------------— 13 8, 110 157,000Indianapolis, Ind—-------------------------- 18 5 ,830 96,500 San Bernardino—Riverside—Jacks on, Mi s s --------------- ----------------- 5 1, 040 30, 500 Ontario, Calif------------------------------ 13 2, 240 62,600
See footnotes at end of table.
Digitized for FRASER http://fraser.stlouisfed.org/ Federal Reserve Bank of St. Louis

18
Table 9. Work Stoppages by In ' 'V» 4s..r ’f***1----Continued
Metropolitan area
Stoppages beginning in
______1964______Man-days idle, 1964
(all stoppages)Metropolitan area
Stoppages beginning in
1964Man-days idle, 1964
(all stoppages)Number
Workersinvolved
Number
Workersinvolved
13 3, 850 79,900 7 1, 400 19, 500San Francisco—Oakland, Calif------ 81 2 7 , 700 511' 000 Tampa-6t. Petersburg, F la-------- 16 2, 210 32,600San Jose, C alif-------------------------------- 11 4, 420 34,400 Terre Haute, Ind---------------------------- 7 1, 550 22,500Savannah, G a -...- . .— — . — — 6 1, 040 4, 040 Toledo, Ohio—M ich------------------------ 20 8, 570 77, 800
Scranton, P a ------------------------------------ 13 810 8, 700 Trenton, N.J - 12 6,870 157,000Seattle—Everett, Wash-------------------- 20 10, 100 127,000 Tuscaloosa, Ala----------------------------- 5 2, 140 15,400South Bend, Ind-------------------------------- 5 560 9 ,590 Utica—Rome, N .Y _________________ 8 4, 370 23,000Spokane, Wash — 7 * 900 11,800 Washington, D .C .-M d.—Va — - 18 1, 920 23,400
Springfield, 111. - ----- 11 7, 300 240, 000Springfield, Mo-------------------------------- 5 680 3, 140 Water bury, C onn——— ——— ——. . . 5 2, 150 17, 100Springfield, Ohio---------------- ----------- 7 750 7 ,470 Waterloo, Iowa 6 4, 190 53,600Spr ingf ield—Chicope e—Holyoke, Wheeling, W. Va.-Ohio___ 10 1,840 39,700
M ass.—Conn - - . . . . 13 560 8, 910 W ilkes-B arre—Hazleton, P a . .— . 24 3, 310 25, 900
Stamford, Conn-------------------------------- 7 830 2, 620Steubenville—W eirton, Wilmington, Del.—N .J.-M d 15 9, 200 136,000
17 2, 590 19, 800 10 620 16,80012 2, 580 35, 500 Y nrltj P a ___ . 9 1, 760 14, 30019 9,460 23,000 Y oungstown—W ar r en, Ohio - 25 8, 970 69,400
1 Includes data for each of the metropolitan areas that had 5 stoppages or more in 1964.Some metropolitan areas include counties in more than 1 State, and hence, an area total may equal or exceed the total
for the State in which the major city is located.Stoppages in the mining and logging industries are excluded.Intermetropolitan area stoppages are counted separately in each area affected; the workers involved and man-days idle
were allocated to the respective areas.2 From 1952 through 1963, the Los Angeles metropolitan area included the Anaheim—Santa Ana—Garden Grove area,
shown separately beginning in 1964.
Table 10. Work Stoppages by Affiliation of Unions Involved, 1964
Stoppages beginning in 1964 Man-days idle,Affiliation
Number PercentWorkersi involved 1964 (all stoppages)
Number Percent Number Percent
3,655 100.0 1 ,640 ,000 100.0 22 ,900 ,000 100.0
AFL-CIOl____ ______________ _______________________ 2, 771 75.8 1, 380,000 84.1 19 ,700 ,000 85.9Unaffiliated unions------------------------------------------------------ 782 21.4 193,000 11.7 2 ,3 5 0 ,0 0 0 10.3Single firm unions------------------------------------------------------ 12 .3 13,300 .8 54,300 .2Different affiliations 1 -------------------------- -------------------- 51 1.4 48,700 3.0 808,000 3.5No union involved------ --------- -------------------------------- 36 1.0 5,780 .4 18,400 .1Not reported----------------------------------------------------------------- 3 .1 210 (2) 330 (2)
1 Includes work stoppages involving unions of different affiliations— either 1 union or more affiliated with AFL—CIO and 1 unaffiliated union or m ore, or 2 unaffiliated unions or m ore.
2 Less than 0.05 percent.
NOTE: Because of rounding, sums of individual items may not equal totals.
Digitized for FRASER http://fraser.stlouisfed.org/ Federal Reserve Bank of St. Louis

19
Table 11. Work Stoppages by Contract Status and Size of Stoppage, 1964
Stoppages beginning in 1964 Man-days idle,Contract status and size of stoppage
(number of workers involved) Number PercentWorkers involved 1964 (all stoppages)
Number Percent Number Percent
All stoppages_____ _____________________________ 3,655 100.0 1,640 ,000 100.0 22 ,900 , 000 100.0
6 and under 20 __ ____________________________________ 718 19.6 8,560 0.5 178,000 0.820 and under 100--------- _ — ------ ----------------- 1,413 38.7 68,400 4.2 1 ,090 ,000 4.8100 and under 250____________________________________ 697 19.1 108,000 6.6 1,530 ,000 6.7250 and under 500____________________________________ 358 9.8 122,000 7.5 1 ,640 ,000 7.2500 and under 1 ,000- ------ --------------------------------- 223 6.1 151,000 9.2 2 ,270 ,000 9.91,000 and under 5, 000____________ -_________________ 206 5.6 432,000 26.3 5 ,750 ,000 25.15, 000 and under 10, 00 0______ ____________________ _ 22 .6 144,000 8.8 2 ,480 ,000 10.810,000 and over________________ — — -------- ----- 18 .5 607,000 37.0 7 ,990 ,000 34.8
Negotiation of first agreement orunion recognition___________________________________ 646 17.7 67,000 4.1 1 ,490 ,000 6.5
6 and under 2 0 _____ ____________________________ 248 6.8 2, 890 .2 91,000 .420 and under 100__________ _______ __________ 301 8.2 13,200 .8 380,000 1.7100 and under 250____________ __________________ 69 1.9 10,500 .6 327,000 1.4250 and under 500_________________________________ 15 .4 5, 140 .3 106,000 .5500 and under 1 ,000_________ _ ________________ 4 .1 2,890 .2 143,000 .61, 000 and under 5, 000___________________________ 8 .2 13,100 .8 274,000 1.25, 000 and under 10, 0 0 0 __________________________ - - - - _ _10, 000 and o v er_______ __ ___________________ _ 1 ( ' ) 19,300 1.2 167,000 .7
Renegotiation of agreement (expiration orreopening)____________ _______________ __ ____ 1,613 44.1 1,10 0 ,0 0 0 67.0 19 ,100 ,000 83.2
6 and under 2 0 _______ -____________________________ 187 5.1 2, 300 .1 49,200 .220 and under 100_________________________________ 623 17.0 31,600 1.9 559,000 2.4100 and under 250_________________________________ 371 10.2 56,800 3.5 985,000 4.3250 and under 500_____ ______ _________________ 187 5.1 64,600 3.9 1 ,300 ,000 5.7500 and under 1 ,000_____________ ______________ 106 2.9 73,300 4.5 1 ,830 ,000 8.01, 000 and under 5, 000___________________________ 108 3.0 222,000 13.5 4 ,6 4 0 ,0 0 0 20.25, 000 and under 10, 0 0 0 __________________________ 18 .5 120,000 7.3 2 ,300 ,000 10.010, 000 and o v er_________________________________ - 13 .4 529,000 32.3 7 ,430 ,000 32.4
During term of agreement (negotiationof new agreement not involved)___________________ 1, 317 36.0 462,000 28.2 2 ,280 ,000 9.9
6 and under 2 0 __________________________ ______ - 255 7.0 2,990 .2 27,000 .120 and under 100_____ __ ______________________ 455 12.4 22,100 1.3 145,000 .6100 and under 250___________________________ - __ 252 6.9 39,800 2.4 209,000 .9250 and under 500__________ — — ----- ----- 150 4.1 50,500 3.1 226,000 1.0500 and under 1 ,000 ------------ ------------------------ ----- 109 3.0 72,800 4.4 269,000 1.21, 000 and under 5, 000________ ___________________ 88 2.4 191,000 11.7 829,000 3.65, 000 and under 10, 00 0 ---------------------------------------- 4 .1 24,100 1.5 182,000 .810,000 and o v er------------------------------------------- ------ 4 .1 58,100 3.5 390,000 1.7
No contract or other contract status _ ------------------ 59 1.6 11,000 .7 63,100 .36 and under 2 0 ___________________________ 17 .5 240 (*) 8 ,240 (!)20 and under 100- ____________________________ 26 .7 1, 150 .1 3,380 ( )100 and under 250 __ --------------------------------- ------ 5 .1 700 7, 540250 and under 500- --- ------------------------------------ - 5 .1 1,670 .i 4 ,420 V)500 and under 1 ,000 - ___ - ______________ ____ 4 .1 2, 110 .i 33,700 .11,000 and under 5, 000_____— ------------------------------ 2 .1 5, 100 .3 5, 850 ( l )5, 000 and under 10, 000 - ---------------------------------- - - - - -10,000 and ov er____ ________ ________________ - - - - - -
No information on contract status---------------------------- 20 .5 850 .1 15,300 .16 and under 2 0 ____ _____ _ ________ _____ — 11 .3 140 (M 2,440 (!)20 and under 100 - ------ — -------------------------- — 8 .2 410 ( l ) 3,820 ( l )100 and under 250_________________________________ - - - -
250 and under 500_________________________________ 1 (1) 300 C1) 9,000 (r)500 and under 1, 000------- --------------------------------------- - - . - - -1 ,000 and under 5, 000___________________________ - - - - -5, 000 and under 10, 0 0 0 __________________________ - - - - - .10, 000 and o v er__________________________________
Less than 0.05 percent.
NOTE: Because of rounding, sums of individual items may not equal totals.
Digitized for FRASER http://fraser.stlouisfed.org/ Federal Reserve Bank of St. Louis
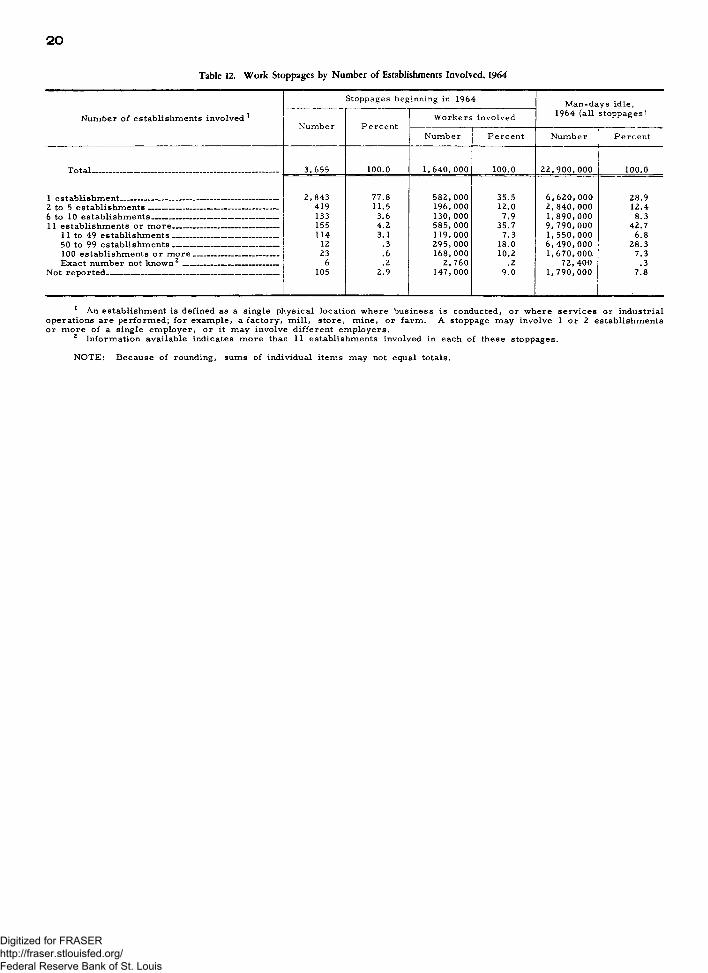
20
Table 12. Work Stoppages by Number of Establishments Involved, 1964
Number of establishments involved 1
Stoppages beginning in 1964 Man-days idle, 1964 (all stoppages^
Number PercentWorkers! involved
Number Percent Number Percent
Total_______________________________________________ 3, 655 100.0 1,640, 000 100.0 2 2 ,900 ,000 100.0
1 establishment------------------------------------------------------------- 2 ,843 77.8 582,000 35.5 6 ,6 2 0 ,0 0 0 28.92 to 5 establishments-------------------------------------------------- 419 11.5 196,000 12.0 2 ,8 4 0 ,0 0 0 12.46 to 10 establishments________________________________ 133 3.6 130,000 7.9 1,8 9 0 ,0 0 0 8.311 establishments or m ore__________________________ 155 4.2 585,000 35.7 9 ,7 9 0 ,0 0 0 42.7
11 to 49 establishments----------------------------------------- 114 3.1 119,000 7.3 1 ,550 ,000 6.850 to 99 establishments----------------------------------------- 12 .3 295,000 18.0 6 ,4 9 0 ,0 0 0 28.3100 establishments or m ore_____________________ 23 .6 168,000 10.2 1,670,000. 7.3Exact number not known2 ------------------------------------- 6 .2 2,760 .2 72,400 .3
Not reported_________________________________ _______ 105 2.9 147,000 9.0 1 ,790 ,000 7.8
1 An establishment is defined as a single physical location where business is conducted, or where services or industrial operations are performed; for example, a factory, m ill, store, mine, or farm . A stoppage may involve 1 or 2 establishments or more of a single employer, or it may involve different employers.
2 Information available indicates more than 11 establishments involved in each of these stoppages.
NOTE: Because of rounding, sums of individual items may not equal totals.
Digitized for FRASER http://fraser.stlouisfed.org/ Federal Reserve Bank of St. Louis
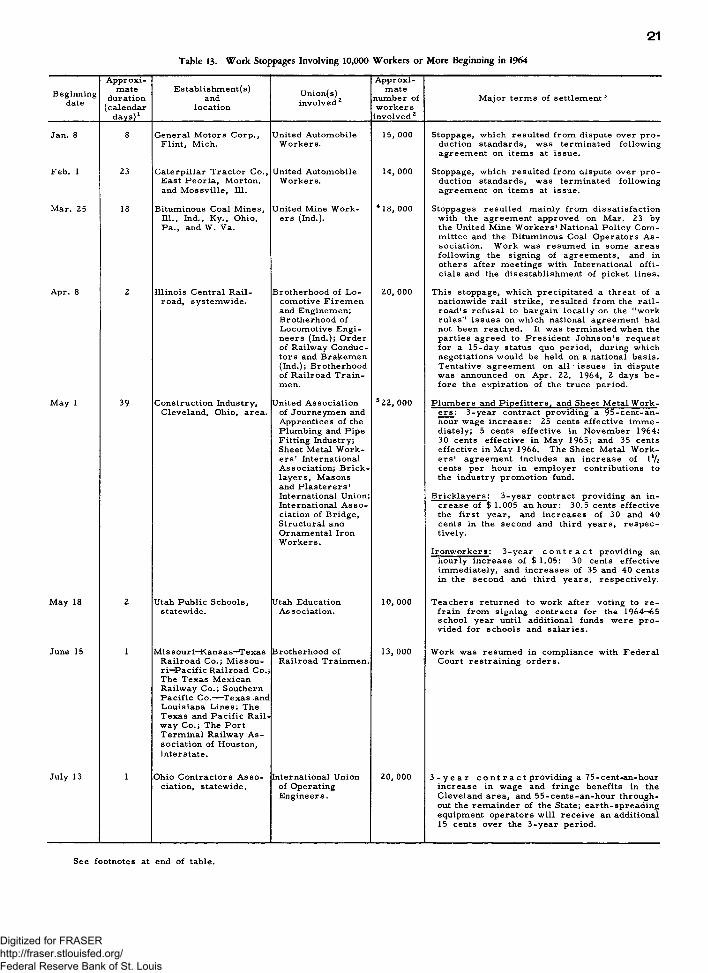
21Table 13. Work Stoppages Involving 10,000 Workers or More Beginning in 1964
Beginningdate
Approximate
duration (calendar
days)1
Establishment(s)and
locationUnion(s)involved2
Approximate
number of workers
involved 2
Major terms of settlement3
Jan. 8 8 General Motors Corp., Flint, Mich.
United Automobile Workers.
15,000 Stoppage, which resulted from dispute over production standards, was terminated following agreement on items at issue.
Feb. 1 23 Caterpillar Tractor Co., East Peoria, Morton, and M ossville, 111.
United Automobile Workers.
14, 000 Stoppage, which resulted from dispute over production standards, was terminated following agreement on items at issue.
Mar. 25 18 Bituminous Coal Mines, 111., Ind., Ky., Ohio, Pa., and W. Va.
United Mine Workers (Ind.).
4 18,000 Stoppages resulted mainly from dissatisfaction with the agreement approved on Mar. 23 by the United Mine Workers' National Policy Committee and the Bituminous Coal Operators A ssociation. Work was resumed in some areas following the signing of agreements, and in others after meetings with International officials and the disestablishment of picket lines.
Apr. 8 2 Illinois Central Railroad, systemwide.
Brotherhood of Locomotive Firemen and Enginemen; Brotherhood of Locomotive Engineers (Ind.); Order of Railway Conductors and Brakemen (Ind.); Brotherhood of Railroad Trainmen.
20, 000 This stoppage, which precipitated a threat of a nationwide rail strike, resulted from the railroad's refusal to bargain locally on the "work rules" issues on which national agreement had not been reached. It was terminated when the parties agreed to President Johnson's request for a 15-day status quo period, during which negotiations would be held on a national basis. Tentative agreement on all issues in dispute was announced on Apr. 22, 1964, 2 days before the expiration of the truce period.
May 1 39 Construction Industry, Cleveland, Ohio, area.
United Association of Journeymen and Apprentices of the Plumbing and Pipe Fitting Industry; Sheet Metal Workers' International Association; Bricklayers, Masons and Plasterers' International Union; International A sso ciation of Bridge, Structural and Ornamental Iron Workers.
5 22, 000 Plumbers and Pipefitters, and Sheet Metal Work- ers; 3-year contract providing a 95-cent-an- hour wage increase: 25 cents effective im m ediately; 5 cents effective in November 1964; 30 cents effective in May 1965; and 35 cents effective in May 1966. The Sheet Metal Workers' agreement includes an increase of 1V2 cents per hour in employer contributions to the industry promotion fund.
Bricklayers: 3-year contract providing an in- crease of $ 1,005 an hour: 30.5 cents effective the first year, and increases of 30 and 40 cents in the second and third years, respectively.
Ironworkers: 3-year c o n t r a c t providing an hourly increase of $ 1.05: 30 cents effective immediately, and increases of 35 and 40 cents in the second and third years, respectively.
May 18 2 Utah Public Schools, statewide.
Utah Education Association.
10, 000 Teachers returned to work after voting to re frain from signing contracts for the 1964—65 school year until additional funds were provided for schools and salaries.
June 15 1 M issouri—Kansas—Texas Railroad Co.; M issouri-P acific Railroad Co.; The Texas Mexican Railway Co.; Southern Pacific Co.— Texas .and Louisiana Lines; The Texas and Pacific Railway Co.; The Port Terminal Railway A ssociation of Houston, interstate.
Brotherhood of Railroad Trainmen.
13, 000 Work was resumed in compliance with Federal Court restraining orders.
July 13 1 Ohio Contractors A ssociation, statewide.
International Union of Operating Engineers.
20, 000 3 - y e a r c o n t r a c t providing a 75-cent-an-hour increase in wage and fringe benefits in the Cleveland area, and 55-cents-an-hour throughout the remainder of the State; earth-spreading equipment operators will receive an additional 15 cents over the 3-year period.
See footnotes at end of table.
Digitized for FRASER http://fraser.stlouisfed.org/ Federal Reserve Bank of St. Louis
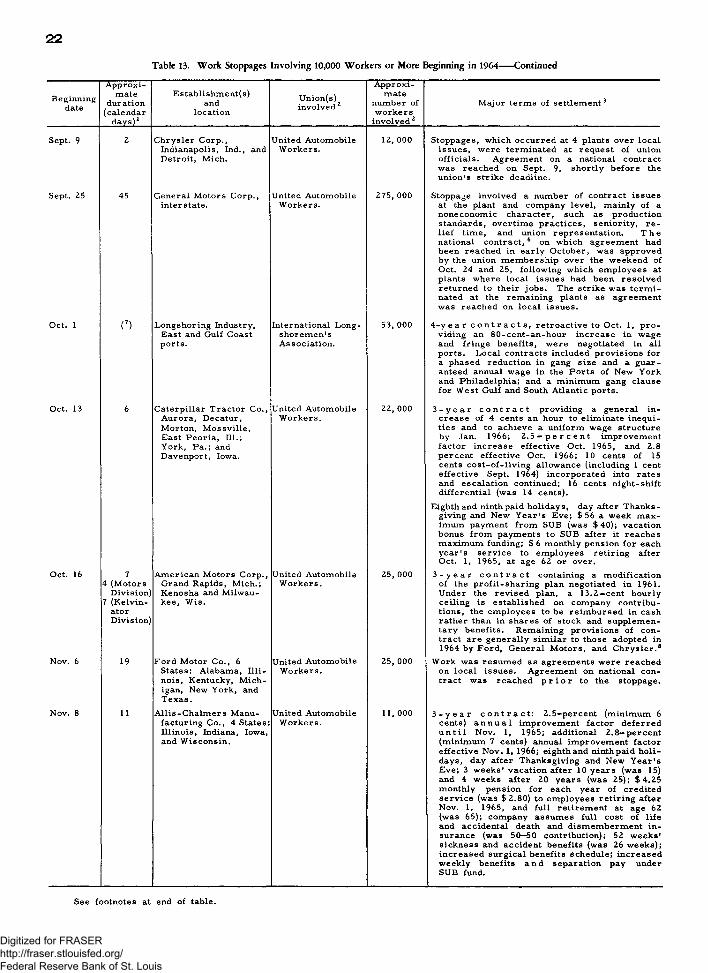
22
Table 13. Work Stoppages Involving 10,000 Workers or More Beginning in 1964----Continued
Beginningdate
Approximate
duration(calendar
days)1
Establishment(s)and
locationUnion(s) involved 2
Approximate
number of workers
involved2
Major terms of settlement3
Sept. 9 2 Chrysler Corp., Indianapolis, Ind., and Detroit, Mich.
United Automobile Workers.
12,000 Stoppages, which occurred at 4 plants over local issues, were terminated at request of union officials. Agreement on a national contract was reached on Sept. 9, shortly before the union's strike deadline.
Sept. 25 45 General Motors Corp., interstate.
United Automobile Workers.
275,000 Stoppage involved a number of contract issues at the plant and company level, mainly of a noneconomic character, such as production standards, overtime practices, seniority, re lief time, and union representation. T h e national contract, 6 on which agreement had been reached in early October, was approved by the union membership over the weekend of Oct. 24 and 25, following which employees at plants where local issues had been resolved returned to their jobs. The strike was term inated at the remaining plants as agreement was reached on local issues.
Oct. 1 (7) Long shoring Industry, East and Gulf Coast ports.
International Longshoremen's Association.
53,000 4 - y e a r c o n t r a c t s , retroactive to Oct. 1, providing an 80-cent-an-hour increase in wage and fringe benefits, were negotiated in all ports. Local contracts included provisions for a phased reduction in gang size and a guaranteed annual wage in the Ports of New York and Philadelphia; and a minimum gang clause for West Gulf and South Atlantic ports.
Oct. 13 6 Caterpillar Tractor Co., Aurora, Decatur, Morton, M ossville, East Peoria, 111.;York, Pa.; and Davenport, Iowa.
United Automobile Workers.
22,000 3 - y e a r c o n t r a c t providing a general increase of 4 cents an hour to eliminate inequities and to achieve a uniform wage structure by Jan. 1966; 2 . 5 - p e r c e n t improvement factor increase effective Oct. 1965, and 2.8 percent effective Oct. 1966; 10 cents of 15 cents cost-of-living allowance (including 1 cent effective Sept. 1964) incorporated into rates and escalation continued; 16 cents night-shift differential (was 14 cents).
Eighth and ninth paid holidays, day after Thanksgiving and New Y ear's Eve; $ 56 a week maximum payment from SUB (was $40); vacation bonus from payments to SUB after it reaches maximum funding; $ 6 monthly pension for each year's service to employees retiring after Oct. 1, 1965, at age 62 or over.
Oct. 16 74 (Motors
Division) 7 (Kelvin-
atorDivision)
American Motors Corp., Grand Rapids, Mich.; Kenosha and Milwaukee, W is.
United Automobile W orkers.
25,000 3 - y e a r c o n t r a c t containing a modification of the profit-sharing plan negotiated in 1961. Under the revised plan, a 13.2—cent hourly ceiling is established on company contributions, the employees to be reimbursed in cash rather than in shares of stock and supplementary benefits. Remaining provisions of contract are generally similar to those adopted in 1964 by Ford, General Motors, and Chrysler.8
Nov. 6 19 Ford Motor Co., 6 States; Alabama, Illinois, Kentucky, Michigan, New York, and Texas.
United Automobile Workers.
25, 000 Work was resumed as agreements were reached on local issues. Agreement on national contract was reached p r i o r to the stoppage.
Nov. 8 11 Allis-Chalm ers Manufacturing Co., 4 States; Illinois, Indiana, Iowa, and Wisconsin.
United Automobile Workers.
11,000 3 - y e a r c o n t r a c t ; 2.5-percent (minimum 6 cents) a n n u a l improvement factor deferred u n t i l Nov. 1, 1965; additional 2.8—percent (minimum 7 cents) annual improvement factor effective Nov. 1, 1966; eighth and ninth paid holidays, day after Thanksgiving and New Y ear's Eve; 3 weeks' vacation after 10 years (was 15) and 4 weeks after 20 years (was 25); $4 .25 monthly pension for each year of credited service (was $ 2.80) to employees retiring after Nov. 1, 1965, and full retirement at age 62 (was 65); company assumes full cost of life and accidental death and dismemberment insurance (was 50—50 contribution); 52 weeks' sickness and accident benefits (was 26 weeks); increased surgical benefits schedule; increased weekly benefits an d separation pay under SUB fund.
See footnotes at end of table.
Digitized for FRASER http://fraser.stlouisfed.org/ Federal Reserve Bank of St. Louis

23
Table 13. Work Stoppages Involving 10,000 Workers or More Beginning in 1964— Continued
Beginningdate
Approximate
duration(calendar
days)1
Establishment(s)and
locationUnion(s) involved 2
Approximate
number of workers
involved2
Major terms of settlement3 4 5 6 7 8
Nov. 12 13 Pacific Coast A ssociation of Pulp and Paper Manufacturers, California, Oregon, and Washington.
Association of Western Pulp and Paper Workers (Ind.).9 10
19,000 Contract, which expires on Mar. 15, 1967, provides a 4-percent general wage increase, plus an additional 5 cents to women, retroactive to June 1, 1964; additional 10 cents effective Junel, 1965; eighth paid holiday, July 3; companies to pay $2 .5 0 a month toward em ployee's cost of dependents' hospitalization, surgical, and medical benefits; improved meal allowance; improved provision for down time.
The agreement provides also for a full union shop under certain conditions: All workers hired after June 1, 1964, must join, and those who were members prior to that date must remain in the union. In individual plants, a full union shop is to apply where 80 percent of the workers join within 120 days of the effective date of the agreement, or where the union is able to win the vote of 70 percent of the employees in an election.
Nov. 12 8 New York Telephone Co., statewide.
Communications Workers of Am erica.
10 19, 000 Workers returned to their jobs at request of union officials. Issue in dispute was submitted to arbitration.
Dec. 7 12 Food Employers Council— Retail Food Stores, southern California.
Amalgamated Meat Cutters.
10, 000 3 - y e a r c o n t r a c t providing increases of $ 5 a week for head meatcutters, $ 4 a week for journeymen and $ 3 a week for wrappers in December of each of the 3 years; $6.25 hourly Sunday rate for journeymen (was $ 6 ); f o u r t h week vacation after 20 years; effective 1966, 14 cents hourly company payment to pension fund (was 10 cents) to provide $3.50 monthly pension for each year's credited service (was $2 .75), normal retirement at age 60 (was 65) and early retirement at age 50; companies to pay additional 2 cents hourly maximum to health and welfare fund (previously paid $11 .76 monthly), and 3 cents an hour to SUB and disability benefit fund (was 2 cents); company-paid prescription drug plan established; funeral leave; 2-year apprenticeship schedule (was 3) and ratio of apprentices to journeymen increased.
1 Includes nonworkdays, such as Saturdays, Sundays, and established holidays.2 The unions listed are those directly involved in the dispute, but the number of workers involved may include members
of other unions or nonunion workers idled by disputes in the same establishments.Number of workers involved is the maximum number made idle for 1 shift or longer in establishments directly involved
in a stoppage. This figure does not measure the indirect or secondary effects on other establishments or industries whose employees are made idle as a result of material or service shortages.
3 Adapted largely from Current Wage Developments, published monthly by the Bureau of Labor Statistics.4 Peak idleness occurred during the Apr. 1—6 period.5 Peak idleness occurred during the May 11—27 period.6 See Current Wage Developments, Nov. 1, 1964, for details of this agreement.7 1-day s t o p p a g e , on Oct. 1 was terminated by a 10-day Federal Court restraining order, issued under provisions
of the Labor-Management Relations (Taft-Hartley) Act. Sporadic stoppages occurred in several ports in late December, following the expiration of the 80-day injunction. The stoppage was resumed in all ports on Jan. 11, 1965, and remained in effect at some ports until Mar. 12. For additional details, see appendix B of this report.
8 For details, see Current Wage Developments, Nov. 1, 1964.9 See discussion on p. 3, footnote 3.10 The number of workers involved increased as the stoppage progressed, reaching its peak on Nov. 19.
Digitized for FRASER http://fraser.stlouisfed.org/ Federal Reserve Bank of St. Louis

24
Table 14. Work Stoppages by Duration and Contract Status, Ending in 1964 1
Duration and contract status
Stoppages Workers involved Man-days idle
Number Percent Number Percent Number Percent
All stoppages_________________________________ 3, 660 100.0 1 ,590 ,000 100.0 22 ,700 ,000 100.0
1 day--------------------------------------------------------------------------- 414 11.3 180,000 11.3 180,000 0.82 to 3 days_____________ _______ __ . . . . . . . . . . . . . ____ 564 15.4 202,000 12.7 415,000 1.84 to 6 days_________________________________________ 548 15.0 186,000 11.7 616,000 2.77 to 14 days-------------------------------------------------------------- 816 22.3 285,000 17.9 1 ,800 ,000 7.915 to 29 days------------------------------------------------------------ 548 15.0 198,000 12.4 2 ,3 8 0 ,0 0 0 10.530 to 59 d ays------------------------------------------------------------ 442 12.1 458,000 28.7 11 ,000 ,000 48.260 to 89 d ays_______________________________________ 139 3.8 32,200 2.0 1 ,640 ,000 7.290 days and o v er__________________________________ 189 5.2 53,100 3.3 4 ,7 5 0 ,0 0 0 20.9
Negotiation of first agreement orunion recognition_________________________________ 651 17.8 69,100 4.3 1 ,650 ,000 7.3
1 day--------- --------------------------------------------------------- 33 .9 2,950 .2 2,950 (1 2)2 to 3 d ays______________________________________ 58 1.6 4, 560 .3 9 ,970 (2)4 to 6 days______________________________________ 70 1.9 6, 320 .4 22,500 .17 to 14 days--------------------------------------------------------- 136 3.7 28,700 1.8 230,000 1.015 to 29 days------------------------------------------------------ 105 2.9 6, 140 .4 93,600 .430 to 59 days------------------------------------------------------ 124 3.4 9, 760 .6 268,000 1.260 to 89 d ay s------------------------------------------------------ 41 1.1 4 ,330 .3 246,000 1.190 days and o v er_______________________________ 84 2.3 6, 280 .4 780,000 3.4
Renegotiation of agreement (expirationnr rpnppning)r 1,600 43.7 1 ,050 ,000 65.8 18 ,700 ,000 82.2
1 day--------------------------------------------------------------------- 94 2.6 77,100 4.8 77,100 .32 to 3 days_________________ ____________________ 150 4.1 74,700 4.7 140,000 .64 to 6 days----------- -------------------------------------------- 186 5.1 95,700 6.0 324,000 1.47 to 14 days _ _____ _____ 412 11.3 157,000 9.9 1 ,030 ,000 4.515 to 29 days___________________________________ 319 8.7 140,000 8.8 1 ,570 ,000 6.930 to 59 days ______________________ _________ 271 7.4 434,000 27.2 10 ,300 ,000 45.560 to 89 days_______________________ ____________ 78 2.1 25,500 1.6 1 ,280 ,000 5.690 days and o v er_______________________________ 90 2.5 46,000 2.9 3 ,920 ,000 17.2
During term of agreement (negotiation ofnew agreement not involved)___________________ 1, 333 36.4 463,000 29.1 2, 320,000 10.2
1 day_____________________________________________ 271 7.4 94,800 5.9 94,800 .42 to 3 days---------------------------------------------------------- 340 9.3 122,000 7.6 262,000 1.24 to 6 days---------------------------------------------------------- 281 7.7 82,800 5.2 263,000 1.27 to 14 days--------------------------------------------------------- 252 6.9 96,600 6.1 530,000 2.315 to 29 days------------------------------------------------------ 117 3.2 51,400 3.2 695,000 3.130 to 59 days_________________ __. . . . ___ _______ 41 1.1 13,700 .9 330,000 1.560 to 89 days_______ __________________________ 17 .5 1, 730 .1 89,500 .490 days and o v er_______________________________ 14 .4 820 .1 54,100 .2
No contract or other contract status____________ 57 1.6 11,000 .7 57,000 .31 day_____________________________________________ 15 .4 4, 640 .3 4 ,640 (2)2 to 3 days______________________________________ 14 .4 1,610 .1 2,980 (2)4 to 6 days______ ______________________________ 8 .2 1,480 .1 5, 840 (2)7 to 14 days_________ __________________________ 11 .3 1,880 .1 4, 040 (2)15 to 29 days__________ _________ ___________ 4 .1 660 0 11,700 .130 to 59 days_. . .___________________________ 2 .1 40 (2) 1, 040 (2)60 to 89 days___________________________________ 3 . 1 650 (2) 26,70090 days and ov er________ ____________________ - - - - -
No information on contract status_______________ 19 .5 830 .1 14,900 .11 d a y ------------------------------ ---------------------------------- 1 (2) 90 (2) 90 02 to 3 days------------- ------------- ------ ----------- 2 . 1 20 ( ) 50 (2)4 to 6 d ays-___________ . . . . . ______ _______ ______ 3 .1 90 ( ) 340 (2)7 to 14 days_____________________________________ 5 .1 150 ( ) 880 (2)15 to 29 days_______ ___ _________________ 3 .1 110 ( ) 1,950 (2)30 to 59 days______________________ ________ 4 .1 370 (2) 11,000 (2)60 to 89 days___ ______________ _____________ - - - _90 days and o v er. ___ ._ _ . . . ______________ 1 (2) 10 (2) 530 (*)
1 The totals in this table differ from those in preceding tables as these (like the average duration figures shown in table 1) relate to stoppages ending during the year, and thus include idleness occurring in prior years.
2 Less than 0.05 percent.
NOTE: Because of rounding, sums of individual items may not equal totals.
Digitized for FRASER http://fraser.stlouisfed.org/ Federal Reserve Bank of St. Louis

25
Table 15. Mediation in Work Stoppages by Contract Status, Ending in 1964
Mediation agency and contract status
Stoppages Workers involved Man-days idle
Number Percent Number Percent Number Percent
All stoppages 3 ,660 100.0 1, 590, 000 100.0 22, 700, 000 100.0
Government mediation1--------------——— —------ ------ 1, 775 48.5 730, 000 45.8 13, 800, 000 60.6F e de r al _____________________________,_____ ._ 1, 229 33.6 524,000 32.9 10, 500, 000 46.2State ■___ ___ - _________ -______ ............... .... 224 6.1 19,700 1.2 279,000 1.2Federal and State mediation combined—— — 276 7.5 140, 000 8.8 2, 220, 000 9.8Other ----- — ----- ----- . 46 1.3 46 ,700 2.9 783,000 3.4
Private mediation---------- ——— -------------- —------ — 47 1.3 5, 290 .3 23, 700 . lNo mediation reported—------- —------------—------------— 1, 837 50.2 858,000 53.8 8, 920, 000 39.3No information __ 1 (2) 20 (2) 60 (2)
Negotiation of first agreement— -----------------— — 651 17.8 69, 100 4.3 1, 650, 000 7.3Government mediation-------—------------------------— 311 8.5 49, 700 3.1 1, 250, 000 5.5
Fe de r a l_ri_________,,_____T___r_______________ 211 5.8 44 ,100 2.8 1, 070, 000 4.7State___________________ „„________________ „_ 60 1.6 2, 810 .2 93, 300 .4Federal and State mediation combined— 35 1.0 2, 230 .1 76, 500 .3Other —________ -____—______-____________ __ 5 .1 540 (2) 2, 180 (2)
Private mediation--------------------------------------------- 9 .2 390 (2) 4, 030 (2)No mediation reported—— --------------------------— 331 9.0 18,900 1.2 404,000 1.8No information-------------------------------------------------- - - - - - -
Renegotiation of agreement (expirationor reopening)_______________ —— ________________ 1, 600 43.7 1, 050, 000 65.8 18, 700, 000 82.2
Government mediation— __________ — —— 1, 306 35.7 591,000 37.1 11, 700, 000 51.3Federal----------------------------------- „---------r_____ 936 25.6 419,000 26.3 8, 780, 000 38.6State — ------ - - — - 122 3.3 13,200 .8 162, 000 .7Federal and State mediation combined— 225 6.1 120, 000 7.6 1, 960, 000 8.6Other____________________ ,___________ r____ 23 .6 38,400 2.4 756,000 3.3
Private mediation—_____— — __— ____— 13 .4 930 .1 3, 550 (2)No mediation reported - — __ 281 7.7 457,000 28.7 7, 020, 000 30.9No information - — — — - - - - - -
During term of agreement (negotiation ofnew agreement not involved)—-------------— — 1, 333 36.4 463,000 29.1 2, 320, 000 10.2
Government mediation - - — - ------ - 152 4.2 88 ,800 5.6 867, 000 3.8Federal___________ ____ „m___________________ 79 2.2 60, 200 3.8 636,000 2.8State ---------- — — — 40 1.1 3, 550 .2 21, 700 .1Federal and State mediation combined— 16 .4 17, 200 1.1 186,000 .8Other_______________________________________ 17 .5 7, 810 .5 23,700 .1
Private mediation— ------ — ------ — — ------ --------- 22 .6 3, 350 .2 13, 400 .1No mediation reported— ___________________ 1, 159 31.7 371,000 23.3 1,440, 000 6.3No information-------------------------------------------------- - - - - - -
No contract or other contract status —---------- --- 57 1.6 11,000 .7 57, 000 .3Government mediation_________________—— — 2 .1 70 (2) 510 (2)
Federal „_____.____ _____ _____ r______________ 1 (2) 60 (2) 180 (2)State_________ ,_______________________________ - - _Federal and State mediation combined— . _ _ _ _ _Other —__— . — — - 1 (2) 10 (2) 330 (2)
Private mediation-------------- —-----—______ ——__ 3 .1 620 (2) 2, 750 (2)No mediation reported — — — — - - 52 1.4 10, 300 .6 53, 700 .2No information - - - - - -
No information on contract status---------------------- 19 .5 830 .1 14,900 .1Government mediation________________________ 4 .1 420 (2) 11, 000 (2)
F ederal „___ .TTnr -TT-^_Tr-T-----,------- „n------------------- 2 . 1 310 (2) 9, 210 (2)State -___ — - - — 2 .1 100 (2) 1, 770 (2)Federal and State mediation combined— - _ - _Other —— _ - — — — — — — - _ _ - _ _
Private mediation— __ - ___ _ _ _ - _No mediation reported—---------------------------------- 14 .4 400 (2) 3,850 (2)No information ______ —— — — — 1 (2) 20 (2) 60 (2)
1 Includes 8 stoppages, involving 940 workers, in which private mediation, also, was employed.2 Less than 0.05 percent.
NOTE: Because of rounding, sums of individual items may not equal totals.
Digitized for FRASER http://fraser.stlouisfed.org/ Federal Reserve Bank of St. Louis

26
Table 16. Settlement of Stoppages by Contract Status Ending in 1964
Contract status and settlement
Stoppages Workers involved Man-days idle
Number Percent Number Percent Number Percent
A ll stoppages_________________________________ 3,600 100. 0 1 ,590 ,000 100. 0 22, 700, 000 100. 0
Settlement reached________________________________ 3, 295 90. 0 1 ,520 ,000 95. 5 21 ,800 ,000 95. 8No formal settlement— work resumed (with
old or new workers)_____________________________ 333 9. 1 70,500 4. 4 818,000 3. 6Employer out of business_________________________ 32 .9 1, 350 . 1 141,000 .6
Negotiation of first agreement or unionrecognition________________________________________ 651 17. 8 69,100 4. 3 1 ,650 ,000 7. 3
Settlement reached____________________________ 487 13. 3 62,300 3 .9 1 ,260 ,000 5. 5No form al settlement__________________________ 150 4. 1 6, 260 .4 371,000 1. 6Employer out of business_____________________ 14 .4 470 n 22,900 . 1
Renegotiation of agreement (expirationor reopening)____________________________________ 1,600 4 3 .7 1 ,050 ,000 65. 8 18 ,700 ,000 82. 2
Settlement reached____________________________ 1,525 41. 7 1 ,030 ,000 64. 5 18 ,300 ,000 80. 5No form al settlement__________________________ 68 1.9 21,100 1. 3 277,000 1. 2Employer out of business_____________________ 7 . 2 470 ( M 106,000 . 5
During term of agreement (negotiation ofnew agreement not involved)___________________ 1, 333 36.4 463,000 29. 1 2 ,320 ,000 10. 2
Settlement reached____________________________ 1, 222 33.4 421,000 26 .4 2 ,150 ,000 9 .5No form al settlem ent__________________________ 101 2. 8 42,000 2 .6 158,000 . 7Employer out of business_____________________ 10 . 3 350 (M 12,300 * 1
No contract or other contract status____________ 57 1. 6 11,000 . 7 57,000 . 3Settlement reached____________________________ 43 1. 2 9, 800 .6 45 ,600 . 2No formal settlement__________________________ 13 .4 1, 090 . 1 11,200 (MEmployer out of business_____________________ 1 ( * ) 60 ( l ) 120 ( M
No information on contract status_______________ 19 . 5 830 14,900 . i
Settlement reached____________________________ 18 . 5 820 ; i 14,700 . i
No formal settlement__________________________ 1 ( * ) 10 140 i 1 )Employer out of business_____________________
1 Less than 0. 05 percent.
NOTE: Because of rounding, sums of individual items may not equal totals.
Digitized for FRASER http://fraser.stlouisfed.org/ Federal Reserve Bank of St. Louis

27
Table 17. Procedure for Handling Unsettled Issues in Work Stoppages by Contract Status Ending in 1964
Procedure for handling unsettled issues and contract status
Stoppages Workers involved Man-days idle
Number Percent Number Percent Number Percent
All stoppages covered1-------------------- —------ — 542 100.0 168.000 100.0 2, 160, 000 100.0
Arbitration 102 18.8 57, 100 33.9 1 ,260 ,000 58.1Direct negotiations------------------------------------------------- 136 25.1 84, 900 50.4 748,000 34.6Referral to a government agency-— ----------— ----- 32 5.9 3, 440 2.0 47, 500 2.2Other means__________ , __________ n________________ 270 49.8 19, 200 11.4 95,300 4.4Other information----------------------- —---------------------- — 2 .4 3. 740 2.2 15,400 .7
Negotiation of first agreement or unionrecognition-------------------------------------------------------- — 53 9.8 6, 320 3.8 245,000 11.3
Arbitration--_______ -___________________________ 12 2.2 660 .4 7, 190 .3Direct negotiations------------------------------------— — 26 4.8 5, 140 3.1 217,000 10.0Referral to a government agency------------------ - 14 2.6 520 .3 19,800 .9Othe r me ans _____ _____________________________ 1 .2 10 (2) 400 (2)Other information---------------------------------------------- - - - -
Renegotiation of agreement (expirationor re opening)_______ --------------------- , ----------------------r 79 14.6 o4, 300 38.2 1, 520, 000 70.3
Arbitrati nn 31 5.7 23, 500 14.0 1, 130, 000 52.1Direct negotiations.-------------—---------- ----------- — 40 7.4 38, 800 23.0 377, 000 17.4Referral to a government agency—-------------— 8 1.5 2, 030 1.2 17,600 .8Othe r me ans____________________________________ - - - - - -Other information—__________________________— - - - - - -
During term of agreement (negotiation ofnew agreement not involved)------------------------------ 405 74.7 97, 300 57.8 396,000 18.3
Arbitration^_______ _____________________________ 59 10.9 32,900 19.6 123,000 5.7Direct negotiations____________________________ 67 12.4 40, 600 24.1 152,000 7.0Referral to a government agency------------------- 8 1.5 870 .5 9, 740 .4Other me ans—____ — — — ___,-,,.r„T-r1------------ 269 49.6 19, 100 11.4 94,900 4.4Other information-_____________________________ 2 .4 3, 740 2.2 15,400 .7
No contract or other contract status-------------- — 3 .6 390 .2 900 (2)Ar bitratio n--^_______________________________—_r - - - - -
Direct negotiations —______ ____________________ 3 .6 390 .2 900 (2)Referral to a government agency-------------------- - - - - - -Other means - - ----- - - - - - -
Other information - — — — - - - - - - -
No information on contract status------------------------ 2 .4 20 (2) 450 (2)A-rhitratirm---------------------------------------------------------- - - - - - -
Direct negotiations ——————————————— — - - - - - -Referral to a government agency— —— — 2 .4 20 (2) 450 (2)Other means ----- — — ----- - - - - - -
Other information— - - - - —
1 Excludes stoppages on which there was no information on issues unsettled or no agreement on procedure for handling.2 Less than 0.05 percent.
NOTE: Because of rounding, sums of individual items may not equal totals.
Digitized for FRASER http://fraser.stlouisfed.org/ Federal Reserve Bank of St. Louis

28
Appendix A. Tables----Work Stoppages
Table A-l. W ork Stoppages by Industry, 1964
Industry
Stoppages beginning in
1964
Man-daysidle,1964(all
stoppages)
Industry
Stoppages beginning in
1964
Man-daysidle,1964(all
stoppages)Number Workersinvolved Number Workers
involved
A ll in d u stries______________________ l3,655 1,640,000 2 2 , 9 0 0 , 0 0 0 Manufacturing— Continued
M anufacturing_______________________ 11,794 994,000 15,700,000 Furniture and fix tu res___________________ 60 6,930 145,000Household fu rn itu re___________________ 39 3,740 75,400O ffice furniture________________________ 7 1,570 31,300
Ordnance and a cce s s o r ie s ------------------------- 8 6,820 154,000 Public building and relatedAm m unition, except for furniture. __ _ 3 570 20,400
sm all a r m s ___________________________ 3 2,440 12,800 Partitions, shelving, lo ck ers , andTanks and tank com ponents----------------- 2 3,920 130,000 office and store fix tu res___ ___ 7 650 5, 350Ordnance and a cce sso r ie s , not M iscellaneous furniture and
elsew here c la s s if ie d _________________ 3 470 10,900 fix tu re s ----------------------------------------------- 4 400 12,700
Food and kindred p rod u cts_______________ 186 54,900 866,000 Paper and a llied p rod u cts_______________ 79 38,900 580,000Meat products__________________________ 35 8,900 85,900 P u lpm ills__________________________ - - 2 470D airy products_________________________ 14 1,680 8, 360 P a p erm ills , except buildingCanning and preservin g fru its, p a p erm ills___________________________ 17 28,000 369,000
vegetables, and sea food s ------------------ 14 5, 070 74,500 Paperboard m il ls _____________________ 10 1,570 22,000Grain m ill p rod u cts___________________ 15 4,770 146,000 Converted paper and paperboardBakery products________________________ 29 6,010 61, 100 products, except containers
4 2, 750 7,740 and boxes ... . . ... 24 2, 830 55,200C onfectionery and related Paperboard containers
6 3, 890 62,600 and boxes______________ _ __ 25 3,530 52,400Beverage industries___________________ 46 18,300 377,000 Building paper and buildingM iscellaneous food preparations board m il ls __________________________ 3 2,960 80,600
and kindred products_________________ 23 3, 540 43, 000
Printing, publishing, and alliedT ob acco m anufactures------------------------------- 1 600 1,680 in du stries_______________________________ 50 8,650 801,000
C igars___________________________________ 1 600 1,680 N ewspapers: Publishing, publishingand printing__________________________ 14 5,320 324,000
P eriod ica ls : Publishing, publishingTextile m ill p rod u cts_____________________ 37 8,440 124,000 and printing 1 20 860
Broadwoven fabric m ills , co tton _____ 2 1, 140 42,700 3 150 3362,000Broadwoven fabric m ills , manmade C om m ercia l printing__________________ 21 1,400 81,800
fiber and silk_________________________ 2 390 7,200 Manifold business form sBroadwoven fabric m ills , w ool: m anufacturing________________________ 1 50 100
Including dyeing and fin ish ing_______ 3 1,630 3,530 Bookbinding and relatedN arrow fabrics and other sm all- in du stries____________________________ 6 1,520 31,500
w ares m ills: Cotton, w ool, Serv ice industries for thesilk , and manmade fib er_____________ 3 400 5,740 printing tra d e________________________ 4 200 800
Knitting m il ls __________________________ 5 290 24,400Dyeing and finishing textiles , except
w ool fabrics and k n itgoods---------------- 3 220 8,020 Chem icals and allied p rod u cts__________ 94 21,000 337, 000F loor covering m ills ___________________ 2 170 690 Industrial inorganic and organicYarn and thread m il ls _________________ 4 190 3,010 ch e m ica ls____________________________ 34 11,000 155,000M iscellaneous textile goods___________ 13 4, 020 28,600 P la stics m aterials and synthetic
res in s, synthetic rubber,synthetic and other
A pparel and other finished products manmade fib e rs , exceptmade from fabrics and sim ilar g lass---------------------------------------------------- 19 4,940 94,800m atprials . .. ... _ 106 24,700 225,000 D ru gs .......................... 10 2,430 52,700
M en 's , youths', and b oys ' suits, Soap, detergents and cleaningcoats, and overcoats_________________ 2 20 90 preparations, perfum es,
M en 's , youths', and boys ' cosm etics , and other toiletfurnishings, w ork clothing, preparations_________________________ 9 800 6,440and allied garm en ts__________________ 8 1, 140 26,300 Paints, varn ishes, lacquers,
W om en 's, m is s e s ', and ju n iors ' enam els, and alliedo u te rw e a r _ _ ___ 59 14,000 38,000 p ro d u cts ..... 6 220 4, 390
W om en 's, m is s e s ', ch ild ren 's , Gum and w ood ch e m ica ls_____________ 20 120a«rl infants' nnd erga rm ents ............ 8 1, 510 9,920 A g r ic u ltu r a l c h e m i c a l s _________ 8 610 13,800
Hats, caps, and m illin ery ________________ 2 30 1,060 M iscellaneous chem icalG ir ls ', ch ild ren 's , and infants' p rod u cts______________________________ 7 990 10,600
ou terw ea r___________________________________ 9 1, 310 4,820Fur g o o d s _____________________________________ 1 20 140M iscellaneous apparel and P etroleum refining and related
flrrpfisnriftfi . ...... 5 280 9,860 industries _ . .... .. 22 5, 340 164,000M iscellaneous fabricated textile P etroleum refin in g________________________ 14 4,960 162,000
p r o d u c t s . 12 6,400 134,000 Paving and roofing m aterials 7 340 2,620M iscellaneous products o f
petroleum and c o a l______________________ 1 40 200Lumber and w ood products, except
furniture ------------------------------------------------------------- 56 7, 110 96,900Logging cam ps and logging Rubber and m iscellaneous plastics
c o n tr a c to r s _ ___ _ __________ 1 100 1,650 products . . . . . 67 30,000 452,000Sawmills and planing m ills _______________ 13 2,840 46,100 T ires and inner tubes_________________ 17 21,500 201,000M illw ork, ven eer, plywood, and Rubber footw ear_________ _ _ 2 980 6,300
prefabricated structural wood Fabricated rubber products, notp ro d u cts _ _ _ _ _ ___ ____ 25 3,040 32,900 elsew here cla ssified 15 2,640 20,700
Wooden containers_____________________ 4 230 3,990 M iscellaneous plasticsM iscellaneous wood products____________ 13 900 12,300 p rod u cts ____________________________________ 33 4,830 223,000
See footnotes at end of table.
Digitized for FRASER http://fraser.stlouisfed.org/ Federal Reserve Bank of St. Louis

29
Table A-l. W ork Stoppages by Industry, 1964----Continued
Industry
Manufacturing— Continued
Leather and leather products_____________Leather tanning and finishing_________Industrial leather belting
and pack in g___________________________Boot and shoe cut stock and
find ings------------ -----------------------------------Footw ear, except ru b b er______________Leather gloves and m itten s___________Luggage--------------------------------------------------Handbags and other personal
leather goods_________________________Leather goods, not elsew here
c la ssified _____________________________
Stone, clay , and glass p rod u cts_________Flat g la s s ______________________________Glass and glassw are, p ressed
or blow n______________________________G lass products, made of
purchased g la s s ______________________Cement, hydraulic_____________________Structural clay p rod u cts ----------------------P ottery and related p rod u cts ---------------C on crete, gypsum , and p laster
Cut stone and stone p rod u cts_________A b ra sive , a sbestos, and
m iscellaneous nonm etallic m ineral products_____________________
P rim ary m etal in d u stries________________Blast furnaces, steelw orks, and
rolling and finishing m ills -----------------Iron and steel foundries_______________P rim ary smelting and refining o f
nonferrous m eta ls___________________Secondary sm elting and refining of
nonferrous m etals and a lloys________Rolling, drawing and extruding o f
nonferrous m e ta ls___________________N onferrous fou n d ries__________________M iscellaneous prim ary m etal
in du stries_____________________________
Fabricated m etal products, except ordnance, m achinery, andtransportation equipm ent------------------------
M etal ca n s______________________________Cutlery, handtools, and general
Heating apparatus (except e lectric)and plumbing fix tu res.._______________
Fabricated structural m etalp rod u cts -----------------------------------------------
Screw machine products, and bolts, nuts, screw s, r ivets , and
Metal stam pings________________________Coating, engraving, and allied
s e r v ic e s ______________________________M iscellaneous fabricated w ire
p rod u cts______________________________M iscellaneous fabricated m etal
p rod u cts______________________________
M achinery, except e lectrica l---------------- ---Engines and turbines-----------------------------Farm m achinery and equipm ent----------C onstruction, m ining, and
m aterials handling m achineryand equipment________________________
M etalworking m achinery andequipm ent--------------------------------------------
Special industry m achinery, exceptmetalworking m achinery--------------------
G eneral industrial m achineryand equipment_______________________ —
O ffice , com puting, and accountingm ach in es______________________________
S erv ice industry m ach in es-------------------M iscellaneous m achinery, except
e le ctr ica l---------------------------------------------
Stoppages Man-days Stoppages M an-daysbeginning in idle, beginning in idle,
1964 1964 Industry 1964 1964Number W orkers
involved(all
stoppages) Number W orkersinvolved
(allstoppages)
Manufacturing— Continued
34 6,050 67,300 E lectrica l m achinery, equipment,9 1,960 48,900 and supplies _ _ 1105 62,700 859,000
E lectr ica l transm ission and1 30 1,980 distribution equipment______________ 14 6,480 78, 300
E lectr ica l industrial apparatus______ 19 4,450 90,0001 30 590 Household app liances_________________ 10 12, 800 60,100
14 2,570 7, 560 E lectric lighting and wiring1 30 100 equipm ent__________________________ _ 13 6,990 44,6002 220 660 Radio and telev ision receiving
sets , except com m unication5 1, 160 5,990 types__________________________________ 4 5,600 42,400
Com munication equipment____________ 15 16,500 412,0001 60 1,440 E lectron ic components and
a cce s s o r ie s __________________________ 11 1,520 12,600117 22,800 412,000 M iscellaneous e le ctr ica l
4 3,020 92,900 m achinery, equipmentand supplies . . ---------------------------------- 20 8, 300 118,000
3 460 53, 300
3 230 5,960 Transportation equipment ‘ 120 386,000 6 ,410 ,0001 1, 120 7, 380 M otor veh icles and m otor vehicle
28 4,810 97,600 equipm ent____________________________ 66 344,000 5,920 ,00011 3,720 58,200 A ircra ft and p a r ts _______________ ___
Ship and boat building and19 20,300 160,000
47 4,520 53,000 r epa ir ing ___________________________ 20 7,650 149,0001 20 90 Railroad equipment. _________________ 7 12,500 163,000
M otorcycles , b icy c le s , and parts____M iscellaneous transportation
2 600 1,630
19 4, 890 43,600 equipment 7 900 24,700
87,700 1,010,000 p ro fe ss io n a l, sc ien tific , and4652
26.30022.300
181,000316,000
I controlling instruments;1 photographic and optica l goods;
6,840 170,000watches and clocks _. __________________ 2311 11,900 170,000 Engineering, laboratory , and
1 scien tific and resea rch7 1,740 11,700 instruments and associa ted
equipment _ _________________ 1 20 5034 18,100 217,000 Instruments for m easuring,15 2,600 41,800 controlling, and indicating
physical ch a ra cte r is t ics____________ 10 5, 120 115,0009 4,690 75,000 Surgical, m edica l, and dental
instruments and su p p lies_________. . . 6 630 13, 100Ophthalmic g o o d s_____________________Photographic equipment and
5 940
140
33,600
*228 79,900 1,550,000 supplies----------------------------------- -------- 1 8,5107 2, 220 17,700
M iscellaneous manufacturing12 14,600 302,000 industries .... 49 8,960 146,000
Jew elry, s ilverw are , and19 4,920 129,000 plated ware 2 20 290
M usical instruments and parts----------- 6 1,090 14,300101 14,800 304, 000 T oys , am usem ent, sporting and
athletic g o o d s ------------------------------------P en s, pen cils , and other o ffice
and a rtists ' m a te r ia ls __ ________
10 3, 290 71,200
8 2, 200 78,500 5 1,240 30,80030 35, 200 635,000 Costum e jew elry , costum e
novelties, buttons, and16 1, 120 20,100 m iscellaneous notions, except
preciou s metal 3 460 2,08010 590 9,210 M iscellaneous manufacturing
in du stries____________________________ 23 2,860 27,50026 4, 320 59,700
1191 120,000 1, 140,000 Nonmanufacturing---------------------------- ‘ l . s o s 646,000 7 ,210 ,0008 16,300 73, 000
27 31,500 159,000A griculture, fo res try , and
fish er ies ........... . _ 18 3,000 44,10032 46,500 440,000
32 10,200 196,000 Mining 155 83,400 808,000M eta 1 . . . 23 24,800 427,000
25 2,530 79,000 Anthracite ..... ....... 5 220 950Bituminous coa l and lign ite__________ 111 56,800 340,000
30 4,430 71,800 Mining and quarrying o fnonm etallic m in era ls,
2 60 690 except fuels__________________________ 16 1,600 40,80025 5,440 68,000
12 3, 170 49,600 Contract construction------------------------------- 944 248,000 2,790 ,000
See footnote at end o f table.
Digitized for FRASER http://fraser.stlouisfed.org/ Federal Reserve Bank of St. Louis
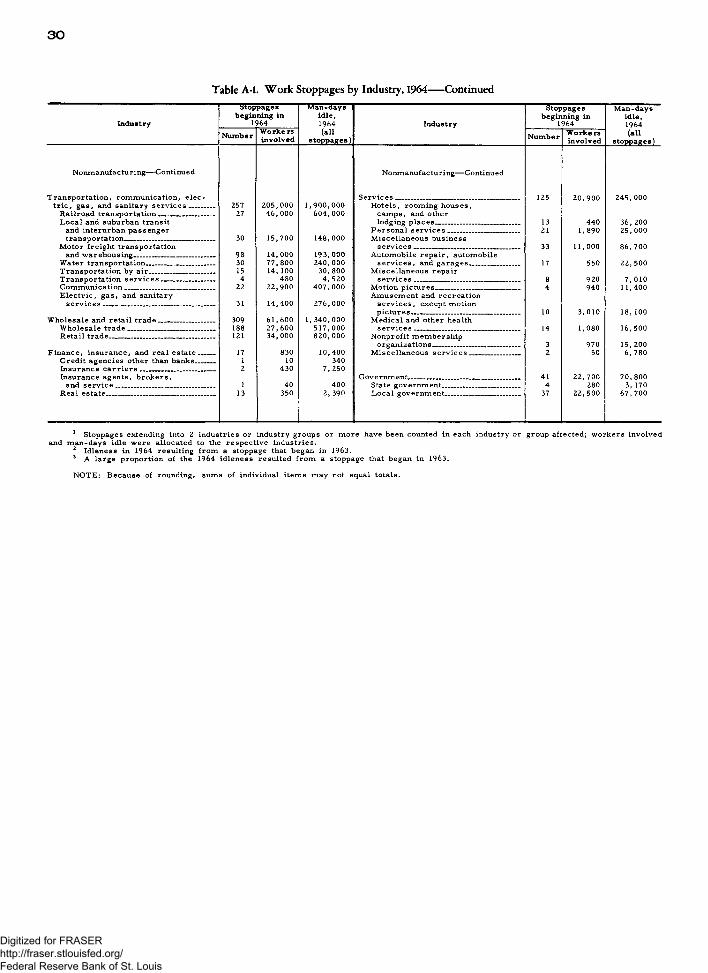
30
Table A-l. Work Stoppages by Industry, 1964----Continued
Industry
stoppages beginning in
1964
Man-daysidle,1964(all
stoppages)
Industry
Stoppages beginning in
1964
M an-daysidle,1964(all
stoppages)Number W orkersinvolved Number W orke rs
involved
Nonmanufacturing— Continued Nonmanufacturing— Continued
Transportation, com m unication, e le c - S e rv ice s . _____ _ _ 125 20, 900 245,000tr ie , gas, and sanitary s e r v ic e s _______ 257 205,000 1,900,000 H otels, room ing houses,
Railroad transportation_______________ 27 46,000 604,000 cam ps, and otherL oca l and suburban transit lodging p la ces_______________________ 13 440 36,200
and interurban passenger P erson al serv ices _ _ 21 1,890 25,000transportation________________________ 30 15,700 148,000 M iscellaneous business
M otor freight transportation s e r v ic e s _____________________________ 33 11,000 86,700and w arehousing______________________ 98 14,000 193,000 Autom obile repa ir , autom obile
Water transportation .... . 30 77,800 240,000 s e rv ice s , and garages 17 550 22,500Transportation by a ir__________________ 15 14,100 30,800 M iscellaneous repairTransportation s e r v ic e s ---------------------- 4 480 4,520 s e r v ic e s _____________________________ 8 920 7, 010C o m m u n ic a t io n ... . 22 22,900 407,000 Motion pictures 4 940 11,400E le c tr ic , gas, and sanitary Am usem ent and recreation
s e r v ic e s ______________________________ 31 14,400 276,000 s e rv ice s , except m otionp ictu res--------------------------------------------- 10 3,010 18,100
W holesale and retail tra d e _______________ 309 61,600 1,340,000 M edical and other healthW holesale trade . ......................... 188 27,600 517,000 serv ices _ _ __ 14 1,080 16,500Retail trade-------------------------------------------- 121 34,000 820,000 N onprofit m em bership
organizations__ _ 3 970 15,200Finance, insurance, and rea l esta te____ 17 830 10,400 M iscellaneous s e r v ic e s ______________ 2 50 6,780
Credit agencies other than banks_____ 1 10 340Insurance c a r r ie r s ____________________ 2 430 7, 250Insurance agents, b rok ers , G overnment______________________________ 41 22,700 70,800
and s e r v ic e ___________________________ 1 40 400 State governm ent __ _ 4 280 3, 170Real estate . _ ....... 13 350 2, 390 Local government 37 22,500 67,700
1 Stoppages extending into 2 industries or industry groups or m ore have been counted in each industry or group affected; w orkers involved and m an-days idle w ere allocated to the respective industries.
2 Idleness in 1964 resulting from a stoppage that began in 1963.3 A large proportion of the 1964 idleness resulted from a stoppage that began in 1963.
NOTE: Because of rounding, sums of individual item s m ay not equal totals.
Digitized for FRASER http://fraser.stlouisfed.org/ Federal Reserve Bank of St. Louis

31
Table A-2. W ork Stoppages by Industry Group and Major Issues, 1964
Total General wage changes Supplementary benefits
Industry group Stoppages beginning in
1964Man* days
id le , 1964 (all
stoppages)
Stoppages beginning in
________ 1964_______M an-days
id le , 1964 (all
stoppages)
Stoppages beginning in
________ 1964_______M an-days
id le , 1964 (all
stoppages)NumberW orkersinvolved Number W orkers
involved Number W orkersinvolved
A ll in d u stries-------------------------------------------- *3,655 1 ,640,000 22,900 ,000 *1,419 588,000 9, 370,000 101 44,300 966,000
Manufacturing____ _______________________ *1,794 994,000 15,700,000 *813 282,000 4 ,700 ,000 57 27,200 426,000
Ordnance and a cce s s o r ie s ______________________ 8 6,820 154,000 3 2,480 205,000Food and kindred prod u cts_____________ ______ 186 54,900 866,000 91 21,000 424,000 8 3,950 32,500T obacco m anufactures__________________________ 1 600 1, 680 _ _ _ _ _ _Textile m ill p rod u cts___________________________ 37 8,440 124,000 20 3, 180 44,800 2 260 5,480
Lumber and wood products, except106 24,700 225,000 21 10,900 48,800 - - -
fu r ni tu r e ___________ _________________ _________ 56 7, 110 96,900 37 4,580 58,600 2 100 7, 100Furniture and fixtures__________________________ 60 6,930 145,000 22 2, 340 40,300 5 620 10,300Paper and allied prod u cts ---------------------------------- 79 38,900 580,000 39 9, 160 222,000 4 1,060 17,700
Printing, publishing, and alliedindustries 50 8,650 801,000 23 3,730 421,000 2 2,630 238,000
Chem icals and allied p rod u cts_________________Petroleum refining and related
94 21, 000 337,000 46 9,860 178,000 9 3.290 12,100
in d u stries____ ___________________________ — 22 5, 340 164,000 7 370 3,760 1 380 14,700
Rubber and m iscellaneous plasticsprodiirts 67 30,000 452,000 29 6, 260 176,000 3 10,600 19, 300
Leather and leather products___________________ 34 6,050 67,300 9 670 7, 150 2 1,230 32,000Stone, clay, and glass p rod u cts----------------------- 117 22,800 412,000 73 13,500 294,000 3 280 3, 110Prim ary m etal in d u stries______________________ 173 87,700 1 ,010,000 68 26,100 546,000 7 1, 110 14,200Fabricated m etal products 3 ____________________ 228 79,900 1 ,550,000 120 20,600 529,000 3 180 1,580
M achinery, except e le ctr ica l___________________E lectrica l m achinery, equipment, and
191 120,000 1, 140,000 86 53,900 505,000 1 60 540
supplies________________________________________ 105 62,700 859,000 41 21,700 243,000 - - -Transportation equipm ent---------------------------------- 120 386,000 6 ,410 ,000 42 60,800 689,000 2 340 7,760Instruments, etc. 4 --------------------------------------------- 23 6,840 170,000 15 5, 320 156,000 - - -M iscellaneous manufacturing in d u stries---------- 49 8,960 146,000 25 5, 380 88,600 3 1, 110 9,850
Nonmanufacturing________________________ l l , 865 646,000 7 ,210 , 000 607 307,000 4 ,670 ,000 44 17,100 540,000
A griculture, fo res try , and fish er ies ---------------- 18 3,000 44,100 7 1,730 37,600Mining_________________________________________ __ 155 83,400 808,000 22 29,700 558,000 3 440 10,500Contract construction-----------------------------------------Transportation, com m unication, e le ctr ic ,
944 248,000 2 ,790 ,000 234 153,000 1,960, 000 20 3, 130 54,800
gas, and sanitary s e rv ice s ------------------------- — 257 205,000 1 ,900,000 103 73,600 1 ,510,000 3 110 2,500W holesale and reta il tra d e__-__________________ 309 61,600 1 ,340,000 164 31,900 517,000 10 8,660 407,000
Finance, insurance, and rea l es ta te ---------------- 17 830 10,400 9 350 2, 100 1 120 5,710S ervice s 125 20,900 245,000 49 7,210 59,100 5 4,610 59,400G overnment---------------------------------------------------------- 41 22,700 70,800 19 8, 860 31,200 2 50 120
See footnotes at end of table.
Digitized for FRASER http://fraser.stlouisfed.org/ Federal Reserve Bank of St. Louis

32
Table A-2. Work Stoppages by Industry Group and Major Issues, 1964----Continued
Industry group
Wage adjustments Hours o f w ork Other contractual m atters
Stoppages beginning in
1964Man* days
id le , 1964 (all
stoppages)
stopbegin
1<
pages ning in Man-days
id le , 1964 (all stoppages)
Stoppages beginning in
1964M an-days
id le , 1964 (all
stoppages)Number W orkersinvolved Number W orkers
involved Number W orkersinvolved
A ll in d u stries__ ----------------------------------------- 1168 63,800 345,000 12 3, 310 23,000 61 17,900 180,000
Manufacturing--------------------------------------------- 122 50,800 278,000- 6 710 7,210 33 13,300 133,000
Ordnance and a c ce s s o r ie s -----------------------------------Food and kindred prod u cts ---------------------------------- 4 530 1,710 2 60 1, 010 1 110 110T obacco m anufactures— -------- --------------------- - - - - - - - - -Textile m ill p rod u cts ------------------------------------------- 3 2, 110 26,400 - " ' 1 30 1,190
A pparel, etc. 2------------------ -— — ---------------------- - 27 3,370 10,500 _ - . 3 190 600Lumber and wood products, except
furniture________ ______________________________ 1 20 290 - - - - - -Furniture and fix tu res----------------------------------------- 2 390 500 1 450 4,500 1 20 200Paper and allied p rod u cts----------------------------------- 4 440 8, 570 - - - 2 1,020 1,450
Printing, publishing, and alliedin d u str ies------------------------------------ -------------------- _ - 5 200 2 50 680 - - 556,700
C hem icals and allied prod u cts--------------------------- - - - - - - 1 620 2,480Petroleum refining and related
in d u str ies----------------------------------------------------------- 1 40 240 - " - 1 100 6,630
Rubber and m iscellaneous plasticsproducts _____________ __________________ _________ 5 4, 130 21,900 - - - - - -
Leather and leather products-------------------------- - 9 1,590 7,400 - - - 2 600 2,450Stone, clay , and glass products —---------------------- 3 200 660 - - - 1 140 1,260P rim ary m etal in d u str ies ----------------------------------- 17 12,400 42,500 1 150 450 4 310 2, 300Fabricated m etal products 3 __ __ _______ — 10 2,280 61,000 - " - 6 1, 130 23,800
M achinery, except e le ctr ica l------------------------------ 14 8,470 29,600 - _ - 4 4, 120 23,500E lectr ica l m achinery, equipment, and
supplies--------------------------------------------------------------- 11 6,740 16,000 - - 5 560 1 250 250Transportation equipm ent_______________________ 7 7, 330 36, 500 - - - 2 4 ,630 8,020Instrum ents, etc. 4 ----------------------------------------------- l 190 570 - - - - - -M iscellaneous manufacturing in d u stries ----------- 3 610 13,500 “ “ 3 50 2,550
Nonmanufacturing--------------------------------------- 47 13,000 66,400 6 2, 590 15,800 28 4,570 46,500
A gricultu re, forestry , and fish er ies ----------------- 2 920 970Mining----------- ------------------------------------------------------ 6 4 ,200 18,400 - - - 3 250 2,800C ontract construction------------------------------------------- 23 2,810 20,500 1 2, 120 14,800 9 2,570 28,400Transportation, com m unication, e le ctr ic ,
gas, and sanitary se rv ice s ------------------------------- 6 4, 140 16,400 2 130 150 3 960 6,910W holesale and retail tra d e --------------------------------- 5 410 3, 370 - - - 9 600 1,930
Finance, insurance, and rea l es ta te___________ _ _ _ _ _ _ _ _ _S e rvie e s ___________ ___________________________________ 3 130 1,720 - - _ 4 190 6,440Governm ent— — ----------- -------------------------- ------ 2 370 5, 070 3 340 860
See footnotes at end of table.
Digitized for FRASER http://fraser.stlouisfed.org/ Federal Reserve Bank of St. Louis

33
Table A-2. Work Stoppages by Industry Group and Major Issues, 1964----Continued
Industry group
Union organization and security Job security Plant administration
Stoppages beginning in
________ 1964________Man-days
id le , 1964 (all
stoppages)
Stoppages beginning in
________ 1964_______M an-days
id le , 1964 (all
stoppages)
Stoppages beginning in___ 1964
M an-days id le ,
1964 (all stoppages)Number W orkers
involved Number W orkersinvolved Number W orkers
involved
A ll in du stries__ ___________ __________ _ 556 86,800 1 ,770,000 1213 175,000 1,470, 000 1596 576,000 8, 360, 000
Manufacturing_____________________________ 243 43, 200 1,020,000 111 49,700 985,000 1 338 506,000 8 ,040 ,000
Ordnance and a c ce sso r ie s— ------ --------------------- j 1,910 118,000 1 1,720 8,610 2 440 6, 160Food and kindred p rod u cts______________________ 24 2,820 30,800 20 15,700 331, 000 30 9,540 35,300Tobacco m anufactures____ — _ ____ ___ ____ _ - . 1 600 1,680 _ _ .Textile m ill p rod u cts____________________________ 2 200 7,940 1 430 1,430 6 2, 180 36, 300
Apparel, etc. 2___________________________________ 24 960 24,800 5 190 830 14 8,030 135,000Lumber and wood products, except
fu rn itu re ____ — _________ _ _____________ 6 630 13,100 2 150 2, 350 6 970 8,650Furniture and fix tu res___________________________ 15 1, 160 60,000 3 260 1,490 9 860 9,430Paper and allied products _ ___________ __ _ __ 8 19,500 179,000 10 1,610 54,800 10 5, 590 94,200
Printing, publishing, and alliedindustries -___________________ ________________ 11 1, 160 57,800 6 540 20,600 5 510 6,280
Chem icals and allied p rod u cts__________________ 9 770 13,500 8 2, 200 22,700 19 3,680 71,700Petroleum refining and related
in du stries----------------------------------------------------------- 4 210 13,200 2 2,820 85,200 5 760 39,900
Rubber and m iscellaneous plasticsprodu cts_______________________ ________________ 11 790 139,000 5 1, 110 21,300 10 4, 210 50,800
Leather and leather products______________ ___ 5 240 6,060 - . . 4 640 8,680Stone, clay , and glass p rod u cts________________ 7 280 12,100 8 2, 130 9, 540 18 4, 760 82,500Prim ary m etal in d u stries_______________________ 9 500 12,800 6 3,990 26,000 54 41, 300 362,000Fabricated m etal products 3 ------------------------------- 41 2,020 78,300 8 2,420 6,290 35 49,800 847,000
M achinery, except e le ctr ica l____—___ —_________ 29 3, 190 117,000 12 2, 380 36,800 41 47, 700 424,000E lectrica l m achinery, equipment, and
supplies------------ -------------------- ------------------------ 15 3,810 90,700 9 8,220 341,000 22 17,000 160,000Transportation equipm ent_______________________ 9 890 8,620 3 3,280 12,400 50 308,000 5 ,650 ,000Instruments, e t c .4 ____ ________ _____ _______ 5 1,280 13,200 - - - 1 20 50M iscellaneous manufacturing in d u stries_______ 8 910 18,800 1 30 420 5 760 11,900
Nonmanufacturing______________________ „ 313 43,600 752,000 1103 125,000 489,000 259 69,700 319,000
Agriculture, fo res try , and fish e r ie s ----------------- 5 n o 4, 750 2 210 420Mining------------------------------ ----- ----- - — - ------ 7 290 15,400 26 16,700 69, 300 73 26,800 118,000Contract construction____________________________ 142 25,000 404,000 24 1,750 22,400 86 10,300 55,700Transportation, com m unication, e le ctr ic ,
gas , and sanitary se r v ic e s .. _____ _ . . __ 32 2,680 19,000 33 98,700 227,000 53 14,000 69,700W holesale and retail t ra d e ______________________ 74 8,570 205,000 16 7,290 167,000 24 3,950 29,100
Finance, insurance, and rea l e s ta te ----------------- 4 40 400 1 310 1, 540 _ _ _S e rv ice s --------------------------------------------------------------— 41 4,440 95,900 4 200 2,400 14 3, 810 19,400Government----------------------------------------------------------- 8 2,550 7,680
' '7 10,600 25,900
See footnotes at end of table.
Digitized for FRASER http://fraser.stlouisfed.org/ Federal Reserve Bank of St. Louis

34
Table A-2. Work Stoppages by Industry Group and Major Issues, 1964----Continued
Other working conditions Interunion o r intraunion m atters Not reported
Industry group Stoppages beginning in
1964Man-days
id le , 1964 (all
stoppages)
Stoppages beginning in
1964M an-days
id le , 1964 (all
stoppages)
Stoppages beginning in
1964M an-days
id le , 1964 (all
stoppages)Number W orkersinvolved Number W orkers
involved Number W orkersinvolved
A ll industries __ ---------------------------------------- 51 16,700 132,000 454 64,900 307,000 24 3, 140 7, 970
Manufacturing 33 14,000 116,000 26 5, 300 22,100 12 2, 160 3,910
Ordnance and a c ce s s o r ie s _______________________ 1 270 540Food and kindred p rod u cts____________ ________ 2 140 670 4 1, 100 8, 790 - - -T obacco m anufactures___________________________ - - - - - - - - -Textile m ill p rod u cts ------------------------------------------- - - " 1 20 340 1 20 40
A pparel, e t c .2 „ _________ __________ _ _____Lumber and wood products, except
3 270 1,700 3 40 310 6 730 2,430
furniture— ------ — — -------------- ------------------- 1 290 6,450 1 380 380 - - -Furniture and fix tu res___________________________ 2 830 18,500 - - - _ _ _Paper and allied p rod u cts----------------------------------- 1 420 1,680 1 80 160 - - -
Printing, publishing, and alliedindustrie s ______________________ ________ _____ - - - 1 30 700 - -
C hem icals and allied p rod u cts---------------------------Petroleum refining and related
“ " 534,200 2 580 2,310 - -
industries - — ---- — ------------ ----- — — - - - 1 660 660 - -
Rubber and m iscellaneous plasticsprndiirts ________ ___ 2 2,830 22,900 2 50 370 - - -
Leather and leather products____________________ 3 1,090 3, 550 - - - - - -Stone, clay , and glass p rod u cts_______ _______ 2 1,290 8, 590 2 210 690 - - -P rim ary m etal in d u stries ----------------------------------- 4 560 4,400 - - - 3 1,260 1, 300Fabricated m etal products 3 _ _______________ 4 930 5, 390 1 550 2,200 - " -
M achinery, except e le c t r i c a l_______ _ ___ __E lectr ica l m achinery, equipment, and
2 220 1, 330 - - - 2 150 150
supplie s ___________________ __________ _________ 4 4,680 5,720 2 210 890 - - -Transportation equipm ent_______________________ - - - 5 1,400 4,290 - - -Instruments, e t c .4 __ _________ ________________ 1 40 390 - - - - - -M iscellaneous manufacturing in d u str ies_____ — 1 110 430 - “ - - - *
Nonmanufacturing- ------- ---------- ----- ----- 18 2,770 15,100 428 59,600 285,000 12 980 4,060
A gricultu re, fo res try , and fish e r ie s___________ j 20 270 1 10 10Mining____________________ ______________________ 3 1, 350 8,580 9 3,030 4,950 3 680 1, 300Contract construction----------------------------- -----------Transportation, com m unication, e le ctr ic ,
6 720 4,800 396 46,000 224,000 3 40 1, 500
gas, and sanitary se rv ice s______ —------------------- 7 670 1,100 13 10,300 50,000 2 70 120W holesale and retail t ra d e ______________________ 1 30 30 5 180 5,490 1 10 510
Finance, insurance, and real es ta te ------- --------- 1 10 580 1 10 60 _ _ _S e r v ic e s _________ _____________ _ ______ ____ _ _ - - 3 120 500 2 170 620G overnment-----------------------------------------------------------
1 Stoppages affecting m ore than 1 industry group have been counted in each group affected; w ork ers involved and m an-days idle w ere allocated to the respective groups.
2 Includes other finished products made from fabrics and sim ilar m aterials.3 Excludes ordnance, m achinery, and transportation equipment.4 Includes professional, sc ien tific , and controlling instrum ents; photographic and optica l goods; w atches and clock s .5 Idleness in 1964 resulting from a stoppage that began in 1963.
NOTE: Because of rounding, sums of individual item s m ay not equal totals.
Digitized for FRASER http://fraser.stlouisfed.org/ Federal Reserve Bank of St. Louis

35
Table A-3. W ork Stoppages in States Having 25 Stoppages or More by Industry Group, 19641
Industry group
Alabama Arkansas C aliforniaStoppages
beginning in1964
M an-days id le ,
1964 (all stoppages)
Stoppages beginning in
1964’Man-days
id le , 1964 (all
stoppages)
Stoppages beginning in
1964M an-day 3
id le , 1964 (all
Number W orkersinvolved Number W orkers
involved Number W orkersinvolved stoppages)
A ll in d u str ie s .. _ _ _ 83 27,000 243,000 27 9.290 95. 600 266 92,400 1.910, 000
Manufacturing ___. . . — . . . . 42 17,100 193, 000 11 3, 110 62, 100 103 41,700 945, 000
Ordnance and a cce sso r ie s - ----- _ . .Food and kindred prod u cts___________ _________ 3 240 4, 220 1 50 230 15 12,000 269,000Tobacco manufactures . _ . _ - - - - -Textile m ill products — ------------ . . . . . - - 1 770 17, 600 - - - 1 120 1,960Apparel and other finished products made
from fabrics and sim ilar m a ter ia ls_________ 1 240 1,410 1 50 2, 250 1 20 840Lumber and w ood products, except
furniture. ____ - ------ ------ . - - - 1 100 500 5 390 10, 600Furniture and fixtures--------- ------ ----------- --------- - - - 2 1,760 1 n o 11,800 6 670 4, 000Paper and allied products ----- ----- 2 100 1, 270 - - - 4 5,290 48,100Printing, publishing, and allied industries— — 1 20 260 - - - 1 10 3 57,200Chem icals and allied prod u cts--------------------— — 2 1, 100 28,100 - - - 9 900 22, 100Petroleum refining and related industries------- 1 30 100 - - - 3 60 2,720Rubber and m iscellaneous p lastics products— 1 2, 650 15,900 - - - 6 780 41, 500Leather and leather products------------ ---------------- - - - 2 740 1,940 - - -Stone, clay , and glass prod u cts— ____________ 6 690 9, 300 1 340 27,400 8 1,450 29, 900P rim ary metal in d u stries---------------------— -------- 7 6,140 57,700 - - - 5 2, 120 2 9 ,1 0 0Fabricated metal products, except ordnance,
m achinery, and transportation equipment — 10 1,040 28, 900 2 100 1,200 13 1, 580 20, 200M achinery, except e le ctr ica l--------------------- — __ 3 1,380 7, 310 - - - 3 80 1, 600E lectrica l m achinery, equipment, and
supplies— — ----- -— — - - - - 1 1, 200 15, 600 6 790 7,990Transportation equipm ent---------------------------------- 4 2,740 19,100 1 430 1,280 12 14,200 371,000P rofession a l, scien tific , and controlling
instrum ents; photographic and opticalgoods; watches and c lo c k s .— — — __— ----- - - - - - - 2 40 90
M iscellaneous manufacturing industries - - - - - - 3 1, 140 26, 600
Nonmanufacturing „„ _ 41 9,860 50, 200 16 6, 180 33,500 163 50,700 968, 000
A griculture, forestry , and fish eries . . _ . . . 9 1, 570 35, 300Mining------------------------------------------------------------------- 10 4, 130 26,400 - - - 1 620 4,350Contract construction ------------ ------ 12 1,370 4, 320 13 4, 770 32,100 77 9,690 82,500Transportation, com m unication, e le ctr ic ,
gas, and sanitary serv ices ---------------—------------ 11 2, 510 6, 360 3 1,410 1,440 26 3, 500 328, 000W holesale and retail tra d e --------------------------------- 5 200 1, 570 - - - 36 28, 300 469,000Finance, insurance, and real esta te -------- ------- - - - - - - 1 20 30S ervices — ...-x - .. »- . , _■........... 3 1, 650 11,600 - - - 10 3,240 31,400G overnm ent----- _ — — ------------------------- - - - - - - 3 3,750 17,900
C olorado Connecticut F lorida
A ll in du stries_ . — . . ------ 35 6, 270 45.400 66 23,600 172,000 106 37,900 662, 000
Manufacturing _ --------------------------- — . 8 2,330 25, 500 35 20,200 134,000 10 1,930 37,200
Ordnance and a ccessoriesFood and kindred products ------ ------- ----------- 5 2, 150 22,800 1 20 640 - - -T obacco m anufactures-------- -----------------------------— - - - - - - - - -Textile m ill products . -------- --------------- ------ - - - - - - - - -Apparel and other finished products made
from fabrics and sim ilar m a ter ia ls_______ _ - - - 1 60 60 2 550 2, 330Lumber and wood products, except
furniture- ------------------------------------------- . . . . 2 160 2, 310 - - - 1 160 1, 280Furniture and fix tures- ------ — —-----------— _ . - - - - - 1 50 500Paper and allied prod u cts ------------------------------- — - - - 4 690 19,300 - -Printing, publishing, and allied industries------ 1 20 340 - - - - - *1, 260Chem icals and allied prod u cts-------------------------- - - - - - - 2 90 1, 680Petroleum refining and related industries------- - - - - - - - - -Rubber and m iscellaneous plastics products— - - - 5 1,890 11,700 - - 21, 590Leather and leather products— — ------ . . . . - - - 1 30 120 - - -Stone, clay , and glass products — ----------------— - - - - - - 1 260 3,430Prim ary m etal in d u stries_______ —----------------- - - - - 3 1,660 3, 590 1 140 17,200Fabricated m etal products, except ordnance,
m achinery, and transportation equipm ent-— - - - 4 1 , 020 5, 880 1 520 6, 240M achinery, except e le ctr ica l— - ------ — — - - - 4 780 29,700 - - -E lectrica l m achinery, equipment, and
supplies ---------- — ------------------------------------------------------------ - - - 6 1, 650 11,300 - - -Transportation equipm ent------ -------------— ------------ - - - 4 11,300 48,500 1 170 1,730P rofession a l, scien tific , and controlling
instruments; photographic and optica lgoods; watches and c lo ck s — ---------------------- — . - - - 2 1,080 3, 290 - - -
M iscellaneous manufacturing in d u stries— -------- - - - - - - - -
Nonmanufacturing---------------------------------------------------- 27 3,940 20, 000 31 3, 390 38,100 96 35,900 625, 000
Agriculture, forestry , and fish er ies ---------------------- _ _ _ _ _ . _ _ .Mining--------------------------------------------------------------------------------------------- 4 500 2, 580 - - - - - -Contract construction . ______________________________ 12 1 , 160 6, 880 13 1 , 280 17,200 82 26,800 88, 400Transportation, com m unication, e le ctr ic ,
gas, and sanitary serv ices — ------------------------- - 5 1,930 3,400 9 1, 560 15,200 8 8 , 9 2 0 535, 000W holesale and retail tra d e— -------- —-----------------------— 6 350 7, 110 8 420 5,460 1 20 20Finance, insurance, and real esta te ---------------------- - - - - - - - - -S e rv ice s . ______________________________ ________________ - - - - - - 5 200 1,780Government--------------------------------------------------------------------------------- ■ ■ ■ 1 140 280 ~ ■ ~
See footnotes at end of table.
Digitized for FRASER http://fraser.stlouisfed.org/ Federal Reserve Bank of St. Louis
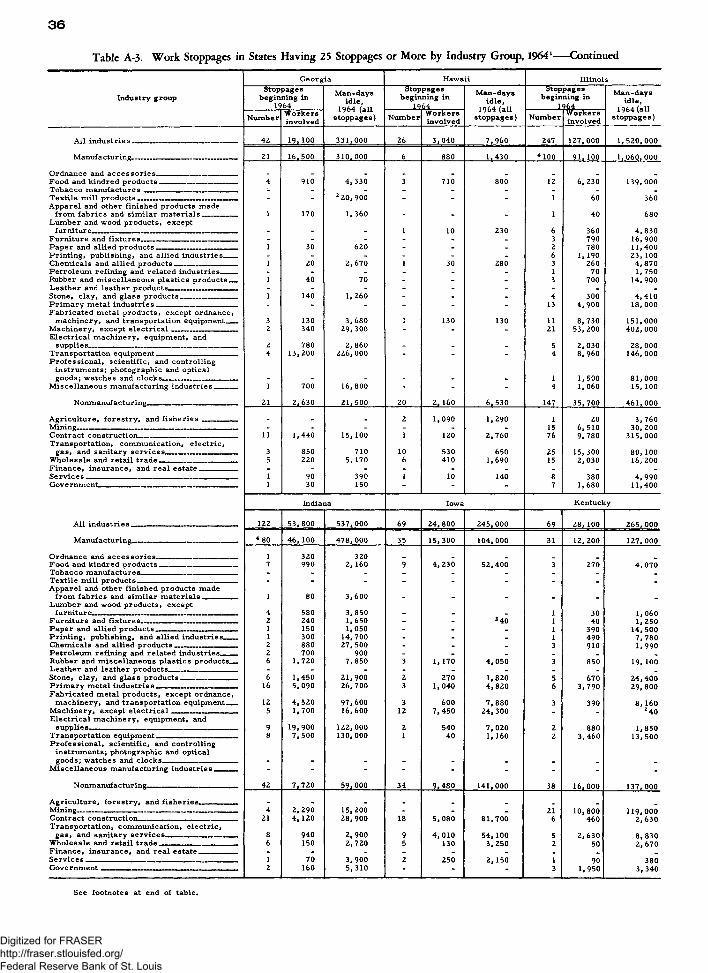
36
Table A-3. Work Stoppages in States Having 25 Stoppages or More by Industry Group, 1964*— Continued
Industry group
G eorgia Hawaii IllinoisStoppages
beginning in1964
M an-days id le,
1964 (all stoppages)
Stoppages beginning in
_______ 1964_________M an-days
id le , 1964 (all
stoppages)
Stoppages beginning in
________ 1964________
M an-daysidle,
1 0 fallNumber W orkers
involved Number W orkersinvolved Number W orkers
involvedX 70rr
stoppages)
A ll in d u stries— ------------- — — - 42 19,100 331,000 26 3,040 7,960 247 127,000 1 ,520 ,000
Manufacturing_________________________ __ 21 16,500 310,000 6 880 1,430 4 100 91. 100 1,060 ,000
Ordnance and a c ce sso r ie s— _ _________ _ _ _Food and kindred products 4 910 4, 330 3 710 800 12 6, 230 139,000T obacco m anufactures - - - - . - _ . _Textile m ill products - - 2 20, 900 - - - 1 60 360Apparel and other finished products made
from fab r ics and sim ilar m a ter ia ls ._________ 1 170 1,360 - - - 1 40 680Lumber and wood products, except
furniture.___ „ __ _ ......_ - - - 1 10 230 6 360 4 ,830Furniture and fixtures _ - _ - - _ . 3 790 16,900Paper and allied products 1 30 620 - - - 2 780 11,400Printing, publishing, and allied industries------ - - - - - - 6 1,190 23,100Chem icals and allied p rod u cts . _ ____ 1 20 2, 670 1 30 280 3 260 4 ,870P etroleum refining and related industries— - - - - - - 1 70 1,750Rubber and m iscellaneous plastics produ cts—. 1 40 70 - - - 3 700 14,900Leather and leather products— - - - - - - - - -Stone, clay, and glass p rod u cts .. ____________ 1 140 1,260 - - - 4 300 4,410P rim ary m etal in d u str ies .__________ — .. —■ - - - - - - 13 4,900 18,000F abricated m etal products, except ordnance,
m achinery, and transportation equipment___ 3 130 3,680 1 130 130 11 8,730 151,000M achinery, except e le c t r ic a l ---------------- ----------- 2 340 29,300 - - - 21 53,200 402,000E lectr ica l m achinery, equipment, and
supplie s-------— — _______ __________________ . — 2 780 2,860 - - - 5 2, 030 28,000Transportation equipment — ._ 4 13,200 226,000 - - - 4 8, 960 146,000P ro fess ion a l, sc ien tific , and controlling
instrum ents; photographic and opticalgoods; w atches and clock s____________________ - - - - - - 1 1,500 81,000
M iscellaneous manufacturing in d u stries . 1 700 16,800 - - - 4 1,060 15,100
Nonmanufacturing 21 2,630 21,500 20 2, 160 6,530 147 35,700 461,000
A gricu ltu re, fo res try , and f is h e r ie s _____. . 2 1,090 1,290 1 20 3,760Mining - - - - - - 15 6,510 30,200Contract construction________ 11 1,440 15,100 1 120 2,760 76 9,780 315,000Transportation, com m unication, e le ctr ic ,
gas. and sanitary serv ices .......... .. 3 850 710 10 530 650 25 15,300 80, 100W holesale and reta il trade — 5 220 5, 170 6 410 1,690 15 2, 030 16,200Finance, insurance, and real estate ............. . - - - _ - _ . . .S ervices 1 90 390 1 10 140 8 380 4,990Government____ — 1 30 150 - - - 7 1,680 11,400
Indiana Iowa Kentucky
A ll in d u stries . . 122 53,800 537,000 69 24,800 245,000 69 28,100 265,000
Manufacturing . . . . 4 80 46,100 478,000 35 15,300 104,000 31 12,200 127,000
Ordnance and a cce sso r ie s 1 320 320Food and kindred products _ ... _ ... .. 7 990 2, 160 9 4,230 52,400 3 270 4 ,070T obacco m anufactures— _ . . . - - - . - _ _ _ _Textile m ill products . . . - - - - - - - _ _Apparel and other finished products made
from fab r ics and sim ilar m aterials __ 1 80 3,600 - - _ _ . _Lum ber and wood products, except
furnitur e______________________________ _____ __ 4 580 3,850 - . . 1 30 1,060Furniture and fix tu res.__________—..- ----------— 2 240 1,650 _ _ 2 40 1 40 1,250Paper and allied p rod u cts . 1 150 1,050 - - - 1 390 14,500Printing, publishing, and a llied industries— . 1 300 14,700 - - - 1 490 7,780Chem icals and allied products 2 880 27,500 - - . 3 910 1,990Petroleum refining and related industries------- 2 700 900 . . _ _ _Rubber and m iscellaneous plastics products__ 6 1,720 7,850 3 1,170 4,050 3 850 19, 100Leather and leather products __ — - - - - - - . . _Stone, clay, and glass products . ... . 6 1,450 21,900 2 270 1,820 5 670 24,400P rim ary m etal industries — 16 5,090 26,700 3 1,040 4 ,820 6 3,790 29,800Fabricated m etal products, except ordnance,
m achinery, and transportation equipm ent----- 12 4 ,520 97,600 3 600 7,880 3 390 8, 160M achinery, except electrica l 5 1,700 16,600 12 7,450 24,300 . . 2 40E lectrica l m achinery, equipment, and
supplies ................................... --....... 9 19,900 122, 000 2 540 7,020 2 880 1,850Transportation equipment _ — 8 7,500 130,000 1 40 1, 160 2 3,460 13,500P rofession a l, sc ien tific , and controlling
instrum ents; photographic and opticalgoods; watches and c lock s - - - - _ . _ _ _
M iscellaneous manufacturing in du stries______ - - - - “ - - - -
Nonmanufacturing 42 7,720 59,000 34 9,480 141,000 38 16,000 137,000
A gricu ltu re, forestry , and fish er ies____ _Mining. __ . . . . __ ___ 4 2,290 15,200 - - . 21 10,800 119,000Contract construction...................... ....... .................... 21 4, 120 28, 900 18 5,080 81,700 6 460 2,630Transportation, com m unication, e le ctr ic ,
gas, and sanitary serv ices _ — 8 940 2, 900 9 4,010 54,100 5 2,630 8 ,830W holesale and retail t r a d e -------------------- ----- — 6 150 2,720 5 130 3,250 2 50 2,670Finance, insurance, and real estate.. . - - . . . _ .S e rv ice s ______ ____ ____ ................. . 1 70 3,900 2 250 2,150 1 90 380Government ... . ---- 2 160 5,310 - - 3 1,950 3,340
See footnotes at end of table.
Digitized for FRASER http://fraser.stlouisfed.org/ Federal Reserve Bank of St. Louis

37
Table A-3. W ork Stoppages in States H aving 25 Stoppages or M ore by Industry Group, 19641----- Continued
I n d u s t r y g r o u p
L o u i s i a n a M a r y l a n d M a s s a c h u s e t t s
S t o p p a g e s b e g in n in g in
1 9 6 4
M a n - d a y s i d l e ,
1 9 6 4 ( a l l s t o p p a g e s )
S t o p p a g e s b e g in n in g in
1 9 6 4
M a n - d a y si d l e ,
1 QA4. f a l l
S t o p p a g e s b e g in n in g in
1 9 6 4
M a n - d a y si d l e ,
i qla /a l l
N u m b e rW o r k e r sin v o l v e d
N u m b e rW o r k e r sin v o l v e d
170*1 \aUs t o p p a g e s ) N u m b e r
W o r k e r sin v o lv e d
" i 7 0 4s t o p p a g e s )
A l l i n d u s t r i e s __________ _____________________________ 4 8 2 3 , 4 0 0 1 8 4 , 0 0 0 4 1 3 4 , 1 0 0 6 8 6 , 0 0 0 1 3 7 2 5 , 9 0 0 ( _ _ 3 0 6 iB0 0 0 ss!!_B
M a n u f a c t u r i n g —___—______ - _______________ _______ 18 4 , 8 3 0 9 5 , 5 0 0 18 9 , 2 2 0 2 2 5 , 0 0 0 6 8 1 4 , 9 0 0 2 1 7 , 0 0 0
O r d n a n c e a n d a c c e s s o r i e s - - - 1 1 , 7 2 0 8 , 6 1 0F o o d a n d k i n d r e d p r o d u c t s 2 6 4 0 6 , 5 2 0 1 1 7 0 2 3 , 3 0 0 11 1 , 0 6 0 7 , 9 2 0T o b a c c o m a n u f a c t u r e s — ____ _______ ____________________ - - - - - _ _ _ _T e x t i l e m i l l p r o d u c t s — — - - - - - - 3 4 8 0 1 , 5 4 0A p p a r e l a n d o t h e r f in is h e d p r o d u c t s m a d e
f r o m f a b r i c s a n d s i m i l a r m a t e r i a l s - - - - - - - 11 3 , 3 3 0 7 , 2 2 0L u m b e r a n d w o o d p r o d u c t s , e x c e p t
f u r n i t u r e - - - 1 2 5 0 5 1 0 1 6 0 5 5 0 _ _ _F u r n i t u r e a n d f i x t u r e s ------------------------ -------- ---------- ------------ 1 3 0 1 , 2 1 0 2 no 3 , 0 3 0 _ . 2 3 , 1 7 0P a p e r a n d a l l i e d p r o d u c t s — — — — ------------------------ 1 9 0 5 1 0 1 1 0 1 , 2 8 0 4 7 6 0 3 2 , 2 0 0P r in t i n g , p u b l i s h in g , a n d a l l i e d i n d u s t r i e s -------- 1 2 0 5 8 0 - - - 2 1 6 0 2 , 4 3 0C h e m i c a l s a n d a l l i e d p r o d u c t s — — — ------------------- 2 6 5 0 2 , 5 4 0 - - - 1 1 2 0 7 7 0P e t r o l e u m r e f i n i n g a n d r e l a t e d i n d u s t r i e s — 2 2 , 0 1 0 4 9 , 1 0 0 1 4 0 4 0 _ _ 2 1 3 0R u b b e r a n d m i s c e l l a n e o u s p l a s t i c s p r o d u c t s — - - - - - - 3 9 8 0 4 , 7 8 0L e a t h e r a n d l e a t h e r p r o d u c t s - - - - - - 7 1 , 8 7 0 3 4 , 3 0 0S t o n e , c l a y , a n d g l a s s p r o d u c t s — 1 3 0 7 6 0 4 3 3 0 2 , 5 6 0 6 4 0 0 5 , 3 6 0P r i m a r y m e t a l i n d u s t r i e s ___________ ___— — — 3 5 9 0 1 2 , 0 0 0 1 7 0 1 4 0 3 1 6 0 6 , 9 5 0F a b r i c a t e d m e t a l p r o d u c t s , e x c e p t o r d n a n c e ,
m a c h i n e r y , a n d t r a n s p o r t a t i o n e q u ip m e n t — 3 4 3 0 6 , 7 2 0 2 6 4 0 2 0 , 0 0 0 6 8 6 0 3 3 , 4 0 0M a c h i n e r y , e x c e p t e l e c t r i c a l ______________ ______ — 1 1 0 0 1 5 , 0 0 0 1 8 0 1 , 5 8 0 3 1 7 0 1 , 6 1 0E l e c t r i c a l m a c h i n e r y , e q u ip m e n t , a n d
s u p p l i e s — - - - - - - 3 6 3 0 5 , 4 1 0T r a n s p o r t a t i o n e q u ip m e n t - - - - 2 5 , 9 9 0 1 6 3 , 0 0 0 3 3 , 6 2 0 6 4 , 7 0 0P r o f e s s i o n a l , s c i e n t i f i c , a n d c o n t r o l l in g
in s t r u m e n t s ; p h o t o g r a p h i c a n d o p t i c a lg o o d s ; w a t c h e s a n d c l o c k s - - - - - - - - -
M i s c e l l a n e o u s m a n u f a c t u r in g in d u s t r i e s - - 1 3 0 4 2 0 2 2 9 0 5 , 2 9 0
N o n m a n u f a c t u r in g 3 0 1 8 , 6 0 0 8 8 , 1 0 0 2 3 2 4 , 9 0 0 4 6 1 , 0 0 0 6 9 1 1 , 0 0 0 8 9 , 3 0 0
A g r i c u l t u r e , f o r e s t r y , a n d f i s h e r i e s — -------— . . . _
M i n i n g ------ ------- — ------------------------------------------------------ - - - - - - 1 4 0 1 4 0C o n t r a c t c o n s t r u c t io n 19 5 , 2 6 0 6 9 , 6 0 0 1 0 1 2 , 1 0 0 5 3 , 6 0 0 3 4 4 , 3 9 0 3 7 , 0 0 0T r a n s p o r t a t i o n , c o m m u n ic a t i o n , e l e c t r i c ,
g a s , a n d s a n i t a r y s e r v i c e s — 11 1 3 , 3 0 0 1 6 , 3 0 0 7 5 , 2 2 0 3 2 , 3 0 0 17 5 , 6 1 0 3 8 , 4 0 0W h o l e s a l e a n d r e t a i l t r a d e ---------------------------------------------- - - 5 2 , 2 0 0 6 7 , 5 9 0 3 7 6 , 0 0 0 16 9 4 0 1 3 , 7 0 0F i n a n c e , i n s u r a n c e , a n d r e a l e s t a t e _ - _ - _ - _ _ _S e r v i c e s - - --------------- -• — - - - - - _ 1 3 0 8 0G o v e r n m e n t --------------------------------------------------------------------------------- - - - - - - -
M i c h i g a n M i n n e s o t a M i s s o u r i
A l l i n d u s t r i e s __ . — 1 9 7 2 4 9 , 0 0 0 4 , 5 4 0 , 0 0 0 3 7 2 , 3 8 0 3 5 , 3 0 0 9 5 2 6 , 5 0 0 4 2 2 . 0 0 0
M a n u f a c t u r i n g 4 1 1 5 2 2 6 , 0 0 0 4 . 0 7 0 , 0 0 0 1 4 9 1 0 1 1 , 1 0 0 4 1 2 0 , 1 0 0 3 8 4 , 0 0 0
O r d n a n c e a n d a c c e s s o r i e s ___________________ ____ —F o o d a n d k in d r e d p r o d u c t s - - - 1 0 3 , 6 1 0 6 8 , 7 0 0 5 3 4 0 1 , 9 7 0 5 1 , 2 2 0 5 , 1 7 0T o b a c c o m a n u f a c t u r e s --------------- ---------- ------------------------------ - - - _ _ _ _ _ .T e x t i l e m i l l p r o d u c t s - 2 9 8 0 9 , 7 2 0 - - - - - -A p p a r e l a n d o t h e r f in is h e d p r o d u c t s m a d e
f r o m f a b r i c s a n d s i m i l a r m a t e r i a l s _____________ 1 5 , 9 2 0 1 2 4 , 0 0 0 - - - 1 1 4 0 5 5 0L u m b e r a n d w o o d p r o d u c t s , e x c e p t
3 1 , 0 9 0 6 , 1 4 0 - - _ _ _ .F u r n i t u r e a n d f i x t u r e s 4 8 5 0 1 4 , 0 0 0 _ _ 1 1 0 0 2 , 7 0 0P a p e r a n d a l l i e d p r o d u c t s — — -------- — — ___ — — — 5 1 , 6 9 0 1 8 , 6 0 0 - - - 2 2 9 0 • 1, 8 3 0P r in t i n g , p u b l i s h in g , a n d a l l i e d i n d u s t r i e s — 5 2 , 9 2 0 2 4 4 , 0 0 0 1 4 0 2 4 0 - - 2 5 0 0C h e m i c a l s a n d a l l i e d p r o d u c t s — — 2 1 4 0 4 1 0 1 8 0 4 , 0 5 0 3 3 3 0 1 , 8 3 0P e t r o l e u m r e f i n i n g a n d r e l a t e d i n d u s t r i e s — - _ _ _ _ _ _ _ _R u b b e r a n d m i s c e l l a n e o u s p l a s t i c s p r o d u c t s — 4 3 0 0 4 , 8 8 0 1 3 0 3 4 0 1 5 0 3 , 5 6 0L e a t h e r a n d l e a t h e r p r o d u c t s — ______ — ____ — 2 1 5 0 5 , 0 6 0 _ - - _ _ _S t o n e , c l a y , a n d g l a s s p r o d u c t s — ------------------------------ 4 6 4 0 4 , 3 5 0 - - - 2 1 4 0 8 , 5 8 0P r i m a r y m e t a l in d u s t r i e s —— ------- 1 ? 1 2 , 9 0 0 2 1 0 , 0 0 0 - - - 2 1 3 0 6 9 0F a b r i c a t e d m e t a l p r o d u c t s , e x c e p t o r d n a n c e ,
m a c h i n e r y , a n d t r a n s p o r t a t i o n e q u ip m e n t — 13 1 2 , 6 0 0 2 2 5 , 0 0 0 1 1 0 1 6 0 6 7 0 0 9 , 5 4 0M a c h i n e r y , e x c e p t e l e c t r i c a l — ------ --------------------- 2 1 1 1 , 3 0 0 1 6 7 , 0 0 0 3 4 0 0 3 , 9 0 0 7 4 3 0 3 , 9 9 0E l e c t r i c a l m a c h i n e r y , e q u ip m e n t , a n d
s u p p l i e s - _ 6 6 , 9 9 0 5 8 , 5 0 0 - - - 2 2 9 0 2 7 , 5 0 0T r a n s p o r t a t i o n e q u i p m e n t ----------------------------------------------- 19 1 6 4 , 0 0 0 2 , 9 1 0 , 0 0 0 1 1 0 3 0 8 1 6 , 3 0 0 3 1 7 , 0 0 0P r o f e s s i o n a l , s c i e n t i f i c , a n d c o n t r o l l in g
i n s t r u m e n t s ; p h o t o g r a p h i c a n d o p t i c a lg o o d s ; w a t c h e s a n d c l o c k s — — — — —— — —— - - - - - - 1 1 0 3 4 0
M i s c e l l a n e o u s m a n u f a c t u r in g i n d u s t r i e s — 2 6 0 6 0 0 1 1 0 3 7 0 - - -
N o n m a n u f a c t u r i n g ---------------------—— ---------------------- 8 2 2 2 , 6 0 0 4 6 8 , 0 0 0 2 3 1 , 4 7 0 2 4 , 2 0 0 5 4 6 , 3 8 0 3 8 , 2 0 0
A g r i c u l t u r e , f o r e s t r y , a n d f i s h e r i e s — _ _ _ _ _ . _ . .M in in g . - — 3 1 , 6 4 0 5 5 , 0 0 0 - - - - - -C o n t r a c t c o n s t r u c t io n 4 8 1 7 , 6 0 0 3 0 9 , 0 0 0 6 4 1 0 3 , 9 5 0 2 4 1 , 8 8 0 6 , 7 8 0T r a n s p o r t a t i o n , c o m m u n ic a t i o n , e l e c t r i c ,
g a s , a n d s a n i t a r y s e r v i c e s ------------------------------------------ 15 2 , 9 3 0 9 5 , 6 0 0 5 2 6 0 4 , 1 0 0 11 2 , 8 8 0 8 , t>30W h o l e s a l e a n d r e t a i l t r a d e — — —— — — — 6 2 7 0 3 , 9 3 0 9 7 3 0 1 5 , 9 0 0 1 0 8 0 0 1 0 , 9 0 0F in a n c e , i n s u r a n c e , a n d r e a l e s t a t e ----------------------- 3 9 0 1 , 6 1 0 - - - 1 6 0 60S e r v i c e s —— —— —— — — — — — — — 7 1 4 0 2 , 7 3 0 3 7 0 3 2 0 5 3 8 0 1 1 . 0 0 0G o v e r n m e n t --------------------------------------------------------------------------------- " - - - " " 3 3 8 0 850
See footnotes at end of table.
Digitized for FRASER http://fraser.stlouisfed.org/ Federal Reserve Bank of St. Louis

38
Table A-3. W ork Stoppages in States H aving 25 Stoppages or M ore by Industry Group, 1964*----- Continued
I n d u s t r y g r o u p
N e v a d a N e w J e r s e y N e w Y o r k
S to pb e g in
1
p a g e s n in g in9 6 4
M a n - d a y 8 i d l e ,
1 9 6 4 ( a l l s t o p p a g e s )
S t o p p a g e s b e g in n in g in
1 9 6 4
M a n - d a y si d l e ,
S t o p p a g e s b e g in n in g in
1 9 6 4
M a n - d a y si d l e ,
1 O UA /a l lN u m b e r
W o r k e r sin v o l v e d
N u m b e rW o r k e r sin v o l v e d
1V o 4 \ aii s t o p p a g e s ) N u m b e r
W o r k e r sin v o l v e d
1 7 0 4 t a ns t o p p a g e s )
A l l i n d u s t r i e s . __ ______________________________ 3 4 1 4 , 7 0 0 1 1 4 , 0 0 0 2 4 3 7 5 , 0 0 0 1 , 3 2 0 , 0 0 0 4 2 0 1 6 0 , 0 0 0 1 , 5 9 0 , 0 0 0
M a n u f a c tu r in g ________________________________________ 2 8 3 0 2 , 7 4 0 4 1 5 6 4 2 , 0 0 0 8 3 6 , 0 0 0 4 2 1 8 6 8 , 2 0 0 9 6 0 , 0 0 0
O r d n a n c e a n d a c c e s s o r i e s ______________________________ . .
F o o d a n d k in d r e d p r o d u c t s _____________________________ 1 30 2 3 0 11 3 , 4 1 0 2 6 , 7 0 0 21 6 , 9 6 0 7 2 , 1 0 0T o b a c c o m a n u f a c t u r e s ____________________________________ - - - - - . _ _ _T e x t i l e m i l l p r o d u c t s _____________________________________ - - - 5 6 6 0 6 , 3 0 0 6 4 3 0 2 6 , 3 0 0A p p a r e l a n d o t h e r f in is h e d p r o d u c t s m a d e
f r o m f a b r i c s a n d s i m i l a r m a t e r i a l s _____________ - - - 7 6 0 0 3 , 7 9 0 2 3 4 , 8 7 0 1 4 , 9 0 0L u m b e r a n d w o o d p r o d u c t s , e x c e p t
f u r n i t u r e _______________________________________________________ - - - 5 6 7 0 8 , 5 1 0 4 2 6 0 3 , 5 7 0F u r n i t u r e a n d f i x t u r e s ______ ___________ _____________ - - - 5 2 4 0 1 , 5 7 0 10 1 , 8 0 0 2 8 , 1 0 0P a p e r a n d a l l i e d p r o d u c t s ______________________________ - - - 9 9 4 0 1 3 , 4 0 0 9 6 8 0 1 1 , 2 0 0P r i n t i n g , p u b l i s h i n g , a n d a l l i e d i n d u s t r i e s _____ - - - 4 4 4 0 1 0 , 4 0 0 11 9 8 0 2 6 , 2 0 0C h e m i c a l s a n d a l l i e d p r o d u c t s ________________________ - - - 2 4 4 , 7 2 0 3 7 , 9 0 0 7 1 , 1 9 0 4 0 , 8 0 0P e t r o l e u m r e f i n i n g a n d r e l a t e d i n d u s t r i e s ______ - - - 3 1 , 4 2 0 7 6 , 4 0 0 4 1 1 0 5 1 0R u b b e r a n d m i s c e l l a n e o u s p l a s t i c s p r o d u c t s ___ - - - 7 9 1 0 9 , 1 4 0 9 3 3 0 1 5 , 1 0 0L e a t h e r a n d l e a t h e r p r o d u c t s __________________________ - - - 1 2 6 0 2 , 3 4 0 7 1 , 1 2 0 2 , 7 2 0S t o n e , c l a y , a n d g l a s s p r o d u c t s _____________________ - - - 1 2 2 , 3 0 0 5 1 , 8 0 0 11 2 , 7 2 0 1 5 , 6 0 0P r i m a r y m e t a l i n d u s t r i e s ______________________________ 1 8 0 0 2 , 5 1 0 1 2 3 , 9 1 0 4 2 , 9 0 0 12 8 , 6 6 0 1 4 3 , 0 0 0F a b r i c a t e d m e t a l p r o d u c t s , e x c e p t o r d n a n c e ,
m a c h i n e r y , a n d t r a n s p o r t a t i o n e q u i p m e n t ____ - - - 11 5 , 2 0 0 1 3 1 , 0 0 0 2 6 1 0 , 8 0 0 1 4 2 , 0 0 0M a c h i n e r y , e x c e p t e l e c t r i c a l __________________________ - - - 14 1 , 4 8 0 1 4 , 5 0 0 2 0 2 , 4 0 0 3 7 , 9 0 0E l e c t r i c a l m a c h i n e r y , e q u ip m e n t , a n d
s u p p l i e s ________________________________________________________ - - - 10 3 , 8 0 0 2 1 9 , 0 0 0 17 1 0 , 1 0 0 6 7 , 8 0 0T r a n s p o r t a t i o n e q u i p m e n t _______________________ ______ - - - 8 8 , 9 3 0 1 7 3 , 0 0 0 4 1 2 , 7 0 0 2 8 8 , 0 0 0P r o f e s s i o n a l , s c i e n t i f i c , a n d c o n t r o l l in g
i n s t r u m e n t s ; p h o t o g r a p h i c a n d o p t i c a lg o o d s ; w a t c h e s a n d c l o c k s ___— ______________________ - - - 2 4 7 0 2 , 0 3 0 4 3 0 0 1 , 4 3 0
M i s c e l l a n e o u s m a n u f a c t u r in g i n d u s t r i e s _________ - - - 7 1 , 5 9 0 5 , 4 5 0 14 1 , 8 4 0 2 3 , 0 0 0
N o n m a n u f a c t u r i n g __________________________________ 3 2 1 3 , 8 0 0 1 1 1 , 0 0 0 8 7 3 3 , 0 0 0 4 8 8 , 0 0 0 2 0 2 9 1 , 9 0 0 6 2 7 , 0 0 0
A g r i c u l t u r e , f o r e s t r y , a n d f i s h e r i e s ______________ _ _ . 1 2 0 2 9 0 .M i n i n g ____ ________________________________________________ ______ 4 1 , 5 7 0 2 3 , 8 0 0 3 4 5 0 1 0 , 1 0 0 - _ -C o n t r a c t c o n s t r u c t i o n ______________________ ______________ 13 4 , 6 0 0 2 6 , 5 0 0 2 7 9 , 5 7 0 1 6 4 , 0 0 0 51 2 2 , 9 0 0 3 3 3 , 0 0 0T r a n s p o r t a t i o n , c o m m u n i c a t i o n , e l e c t r i c ,
g a s , a n d s a n i t a r y s e r v i c e s ___________________________ 4 1 3 0 1 , 4 9 0 21 1 6 , 8 0 0 1 5 9 , 0 0 0 5 2 5 9 , 6 0 0 2 1 7 , 0 0 0W h o l e s a l e a n d r e t a i l t r a d e _____________________________ 3 2 2 0 6 3 0 2 4 4 , 7 4 0 1 5 2 , 0 0 0 5 5 2 , 8 1 0 2 4 , 6 0 0F i n a n c e , i n s u r a n c e , a n d r e a l e s t a t e . . ____________ - - - _ _ . 8 5 3 0 2 , 6 3 0S e r v i c e s _______________________________________________________ 8 7 , 3 2 0 5 8 , 9 0 0 8 5 9 0 1 , 8 5 0 3 2 3 , 6 5 0 4 4 , 6 0 0G o v e r n m e n t ____________________________________________________ “ - - 3 8 1 0 1 , 1 3 0 4 2 , 4 9 0 5 , 4 9 0
O h io P e n n s y l v a n i a R h o d e I s la n d
A l l i n d u s t r i e s . . — --------------------------------------------- 3 4 0 1 9 1 , 0 0 0 2 , 6 9 0 , 0 0 0 3 8 8 1 1 9 , 0 0 0 1 , 1 8 0 , 0 0 0 3 0 6 , 4 3 0 6 3 , 1 0 0
M a n u f a c t u r i n g . ._____________________________________ 4 2 0 6 1 2 4 , 0 0 0 2 , 0 1 0 , 0 0 0 2 4 2 7 3 , 3 0 0 8 6 1 , 0 0 0 11 2 , 9 6 0 2 5 , 2 0 0
O r d n a n c e a n d a c c e s s o r i e s ______________________________ 3 4 7 0 1 0 , 9 0 0F o o d a n d k in d r e d p r o d u c t s ________________ ____________ 14 3 , 2 4 0 9 1 , 0 0 0 1 8 2 , 5 9 0 1 9 , 9 0 0 1 7 0 7 0T o b a c c o m a n u f a c t u r e s ______ ____ ____ ______ ________ . . . . 1 6 0 0 1 , 6 8 0 - _ _ _ _ _T e x t i l e m i l l p r o d u c t s _____________________________________ 3 2 , 0 2 0 9 , 4 0 0 1 2 1 , 1 3 0 1 7 , 4 0 0 1 1 , 0 2 0 1 , 0 2 0A p p a r e l a n d o t h e r f in is h e d p r o d u c t s m a d e
f r o m f a b r i c s a n d s i m i l a r m a t e r i a l s . . _________ - - - 4 3 6 , 7 3 0 2 2 , 5 0 0 1 4 5 0 4 5 0L u m b e r a n d w o o d p r o d u c t s , e x c e p t
f u r n i t u r e _________________________ ___________________________ 1 4 0 1 , 1 4 0 2 3 0 1 , 0 4 0 _ _ _F u r n i t u r e a n d f i x t u r e s ____________ __________ 3 2 6 0 3 , 8 5 0 7 8 2 0 7 , 1 5 0 _ _ _P a p e r a n d a l l i e d p r o d u c t s ______________________________ 8 1 , 3 9 0 4 4 , 8 0 0 1 0 2 , 2 7 0 3 1 , 7 0 0 1 4 0 9 2 0P r i n t i n g , p u b l i s h i n g , a n d a l l i e d i n d u s t r i e s _____ 3 1 , 3 4 0 5 9 , 5 0 0 5 2 0 0 2 , 9 8 0 - _ _C h e m i c a l s a n d a l l i e d p r o d u c t s ________________________ 1 2 2 , 5 0 0 2 6 , 5 0 0 7 2 , 7 0 0 6 2 , 1 0 0 1 8 0 7 5 0P e t r o l e u m r e f i n i n g a n d r e l a t e d i n d u s t r i e s ______ - - - 1 1 5 0 8 8 0 _ . _R u b b e r a n d m i s c e l l a n e o u s p l a s t i c s p r o d u c t s ___ 14 1 3 , 4 0 0 2 1 6 , 0 0 0 4 9 7 0 7 0 , 6 0 0 1 7 3 0 5 , 8 0 0L e a t h e r a n d l e a t h e r p r o d u c t s __________________________ 1 2 6 0 1 , 2 9 0 6 8 5 0 1 2 , 6 0 0 - _ _S t o n e , c l a y , a n d g l a s s p r o d u c t s _____________________ 2 4 4 , 5 6 0 8 4 , 5 0 0 10 2 , 1 5 0 3 2 , 1 0 0 1 2 0 2 0 0P r i m a r y m e t a l i n d u s t r i e s ______________________________ 3 4 1 2 , 9 0 0 7 3 , 1 0 0 19 7 , 2 0 0 5 8 , 8 0 0 2 4 8 0 1 4 , 0 0 0F a b r i c a t e d m e t a l p r o d u c t s , e x c e p t o r d n a n c e ,
m a c h i n e r y , a n d t r a n s p o r t a t i o n e q u i p m e n t ____ 3 3 1 5 , 9 0 0 3 1 4 , 0 0 0 4 1 7 , 6 0 0 1 1 2 , 0 0 0 - - -M a c h i n e r y , e x c e p t e l e c t r i c a l ___ ____________________ 2 0 6 , 5 3 0 1 1 1 , 0 0 0 25 1 9 , 0 0 0 9 0 , 2 0 0 2 8 0 2 , 0 8 0E l e c t r i c a l m a c h i n e r y , e q u ip m e n t , a n d
s u p p l i e s ______________________ ____________________________ _ . 8 2 , 7 8 0 8 1 , 3 0 0 17 8 , 1 2 0 1 6 1 , 0 0 0 - - _T r a n s p o r t a t i o n e q u i p m e n t ._____________________________ 2 0 5 5 , 5 0 0 8 6 3 , 0 0 0 8 8 , 4 2 0 1 2 4 , 0 0 0 - - -P r o f e s s i o n a l , s c i e n t i f i c , a n d c o n t r o l l in g
in s t r u m e n t s ; p h o t o g r a p h i c a n d o p t i c a lg o o d s ; w a t c h e s a n d c l o c k s ____________________________ 4 3 6 0 1 1 , 9 0 0 1 1 , 5 4 0 2 0 ., 0 0 0 - . _
M i s c e l l a n e o u s m a n u f a c t u r in g i n d u s t r i e s ______ _ 5 7 1 0 1 1 , 0 0 0 3 3 7 0 2 , 2 8 0 - - -
N o n m a n u f a c tu r in g ____________________ _____________ 1 3 4 6 7 , 2 0 0 6 8 4 , 0 0 0 1 4 6 4 5 , 7 0 0 3 1 6 , 0 0 0 19 3 , 4 7 0 3 7 , 9 0 0
A g r i c u l t u r e , f o r e s t r y , a n d f i s h e r i e s ______________ 1 10 10 1 2 0 2 7 0 . . .
M i n i n g . _— _____ . . . ---------------------- --------------- . . . . . _______ 11 4 , 9 5 0 3 4 , 9 0 0 2 6 1 1 , 0 0 0 4 4 , 2 0 0 - - _C o n t r a c t c o n s t r u c t i o n _____ _____________________________ 7 6 5 6 , 8 0 0 5 3 7 , 0 0 0 5 8 9 , 4 9 0 9 6 , 6 0 0 8 1 , 9 0 0 2 5 .5 0 0T r a n s p o r t a t i o n , c o m m u n i c a t i o n , e l e c t r i c ,
g a s , a n d s a n i t a r y s e r v i c e s ___________________________ 1 2 3 , 6 6 0 7 5 , 5 0 0 2 6 2 0 , 4 0 0 8 2 , 7 0 0 5 7 3 0 t>. 380W h o l e s a l e a n d r e t a i l t r a d e _____________________________ 22 1 , 0 1 0 1 6 , 8 0 0 2 3 3 , 9 1 0 7 7 , 0 0 0 4 4 8 0 3. 280F i n a n c e , in s u r a n c e , a n d r e a l e s t a t e ---------------------- 1 10 6 0 1 1 2 0 5 , 7 1 0 _ _ -S e r v i c e s . _____________________________________________________ 9 6 8 0 1 9 , 7 0 0 11 6 9 0 9 , 4 8 0 1 10 220G o v e r n m e n t _____________________________________ ____________ 2 1 0 0 2 4 0 - - - 1 30 0 2,4 'H )
See footnotes at end of table.
Digitized for FRASER http://fraser.stlouisfed.org/ Federal Reserve Bank of St. Louis

39
Table A-3. W ork Stoppages in States Having 25 Stoppages or More by Industry Group, 19641-----Continued
T e n n e s s e e T e x a s V ir g in i .a
In d u s t r y g r o u pS to p p a g e s
b e g in n in g in 1 9 6 4
M a n -d a y sid l e ,
1QA4 {■*11
S to p p a g e s b e g in n in g in
1 9 6 4
M a n -d a y s id l e ,
1 9 6 4 ( a l l s t o p p a g e s )
S to pb e g in
1<
p a g e s n in g in164
M a n -d a y s id le ,
1 9 6 4 (a l l s t o p p a g e s )N u m b e r
W o r k e r sin v o lv e d
A 7 0 4* ^ctlls t o p p a g e s ) N u m b e r
W o r k e r sin v o lv e d
N u m b e rW o r k e r sin v o lv e d
A l l in d u s t r i e s ____________________________________ 6 5 1 1 , 2 0 0 5 0 9 .0 0 0 91 2 6 , 2 0 0 3 3 6 ,0 0 0 52 1 4 .2 0 0 1 0 3 ,0 0 0
M a n u f ac tu r in g --------------------------------------------------------- 4 0 6 , 9 7 0 4 4 3 ,0 0 0 2 8 8 , 8 8 0 2 5 0 ,0 0 0 17 5 . 3 3 0 5 6 .8 0 0
O r d n a n c e an d a c c e s s o r i e s - ---------------- -------- _ _ 1 3 9 0 3 , 9 1 0F o o d an d k in d r e d p r o d u c t s ------------------------------------------ 3 2 8 0 1 , 2 1 0 6 1 , 0 9 0 8 , 9 4 0 1 1 , 3 0 0 6 , 4 9 0T o b a c c o m a n u f a c t u r e s ---------------------------------------------------- - - - - - - - - -T e x t i le m i l l p r o d u c t s ----------------------------------------------------- - - - - - - 1 2 2 0 6 , 1 60A p p a r e l an d o th e r f in is h e d p r o d u c t s m a d e
f r o m f a b r ic s an d s i m i l a r m a t e r i a l s - ------------- 4 4 9 0 1 6 ,3 0 0 1 1 0 0 4 , 8 0 0 - - -L u m b e r an d w o o d p r o d u c t s , e x c e p t
fu r n it u r e — ------------------------------------------------------------ ------ 1 80 6 8 0 - - - - - -F u r n it u r e an d f i x t u r e s - -------------------------------------- 2 3 0 0 7 , 1 3 0 - - 2 2 1 , 2 0 0 1 4 0 4 8 0P a p e r an d a l l i e d p r o d u c t s — ------------------------------ 2 70 2 , 4 0 0 3 1 5 0 9 , 1 2 0 2 1 0 0 8 3 0P r in t in g , p u b lis h in g , an d a l l i e d in d u s t r ie s ------ 2 4 0 6 3 4 7 ,0 0 0 1 10 10 - - -C h e m ic a ls an d a l l i e d p r o d u c t s --------------------------------- 5 1 ,4 6 0 1 2 ,4 0 0 2 7 50 4 8 , 4 0 0 2 1 ,4 6 0 1, 5 2 0P e t r o le u m r e fin in g an d r e la t e d in d u s t r ie s _____ - - - 2 5 3 0 2 5 , 1 0 0 - - -R u b b e r and m is c e l l a n e o u s p l a s t ic s p r o d u c t s — 1 1 , 10 0 1 , 1 0 0 - - - - - -L e a t h e r an d le a t h e r p r o d u c t s — ------------------------------ 2 2 0 0 1 , 8 6 0 - - - 1 3 0 1 , 2 6 0S to n e , c l a y , an d g l a s s p r o d u c t s ------------------------------ 1 3 8 0 4 , 1 3 0 1 30 2 , 3 7 0 1 2 2 0 1 , 3 0 0P r i m a r y m e t a l i n d u s t r i e s ------------------------- — — 2 4 1 0 1 9 , 1 0 0 1 n o 2 ,7 5 0 - - -F a b r ic a t e d m e t a l p r o d u c t s , e x c e p t o r d n a n c e ,
m a c h i n e r y , and t r a n s p o r t a t io n e q u ip m e n t — 6 7 3 0 8 , 9 0 0 3 1 7 0 1 5 ,4 0 0 - - -M a c h in e r y , e x c e p t e l e c t r i c a l - _ ------ — 1 2 0 4 0 0 4 1, 3 1 0 9 , 2 7 0 5 1, 0 4 0 6 , 4 8 0E l e c t r i c a l m a c h i n e r y , e q u ip m e n t, and
s u p p lie s ___ _ __ — — 2 1 0 0 1 , 3 3 0 1 40 4 3 0 - - -T r a n s p o r t a t io n e q u ip m e n t ------------- --------------------- _ 2 6 4 0 7 , 4 4 0 3 4 , 5 8 0 1 0 2 , 0 0 0 1 30 2 0 0P r o f e s s i o n a l , s c i e n t i f i c , and c o n t r o ll in g
in s t r u m e n t s ; p h o to g r a p h ic an d o p t ic a lg o o d s ; w a tc h e s an d c l o c k s ---------------------------------------- 2 8 0 5 1 0 - - - 1 8 0 0 3 1 ,2 0 0
M i s c e l la n e o u s m a n u fa c tu r in g i n d u s t r i e s ----------- 1 2 1 0 6 , 8 5 0 - - - 1 1 0 0 9 0 0
N o n m a n u fa c tu r in g ------------------------------------------------ 2 5 4 , 2 8 0 6 6 ,4 0 0 6 3 1 7 ,3 0 0 8 6 , 1 0 0 35 8 , 8 4 0 4 6 , 0 0 0
A g r ic u l t u r e , f o r e s t r y , an d f i s h e r i e s -------------------- 1 16 0 1 ,7 3 0 _ . _ _ _ _
M in in g — — — ------------- --------------------------------------------- 5 5 6 0 3 2 ,4 0 0 1 60 1, 9 7 0 7 2 ,4 3 0 1 2 ,3 0 0C o n t r a c t c o n s t r u c t io n ----------------------------------------------------- 12 9 2 0 1 7 ,1 0 0 4 2 4 , 1 7 0 3 2 ,4 0 0 11 1 , 1 2 0 1 4 ,3 0 0T r a n s p o r t a t io n , c o m m u n ic a t io n , e l e c t r i c ,
g a s , an d s a n it a r y s e r v i c e s — — --------- 4 2 , 5 0 0 5 , 190 9 1 2 , 3 0 0 4 3 , 8 0 0 11 4 , 8 3 0 1 2 , 0 0 0W h o le s a le an d r e t a i l t r a d e ------------------------------------------ 3 1 40 9 , 9 9 0 9 5 5 0 7 , 4 4 0 4 2 4 0 7 , 0 8 0F in a n c e , in s u r a n c e , an d r e a l e s t a t e -------------------- - - - - - - - - -S e r v i c e s ---------------------------------------------------------------------------------- - - - - - - - - -G o v e r n m e n t --------------------------------------------------------------------------- - - " 2 2 6 0 5 2 0 2 2 2 0 3 5 0
W a s h in g to n W e s t V i r g i n i a W is c o n s in
A l l in d u s t r i e s -------------------------------------------------------- 4 8 2 3 ,2 0 0 2 7 3 ,0 0 0 9 5 3 1 , 1 0 0 4 4 1 , 0 0 0 81 4 9 ,9 0 0 5 8 2 ,0 0 0
M a n u fa c tu r in g — _______________________ ___ 4 20 1 5 .2 0 0 1 2 2 . 0 0 0 27 1 2 .5 0 0 3 5 1 .0 0 0 52 4 6 .9 0 0 5 2 0 ,0 0 0
O r d n a n c e an d a c c e s s o r i e s ------------------------------------------- _ _ _ 2 3 , 9 2 0 1 3 0 , 0 0 0 _ _ .
F o o d an d k in d r e d p r o d u c t s — - -------------------- 1 30 1 9 0 1 80 4 2 0 4 2 5 0 8 , 4 4 0T o b a c c o m a n u f a c t u r e s --------------------------------------------------- - - - - - - - - -T e x t i le m i l l p r o d u c t s — ---------------------------- ------------- - - - - - - - -A p p a r e l an d o th e r f in is h e d p r o d u c t s m a d e
f r o m f a b r ic s an d s i m i l a r m a t e r i a l s ------------------ 1 10 4 6 0 1 1 6 0 1 6 0 3 3 6 0 7 , 4 9 0L u m b e r an d w o o d p r o d u c t s , e x c e p t
fu r n itu r e _____ ____________________________________________ 6 9 3 0 1 1 , 1 0 0 - - - 6 1 , 140 2 4 ,0 0 0F u r n it u r e an d f i x t u r e s --------------------------------------------------- 1 30 8 0 - - - 3 2 1 0 5 , 3 4 0P a p e r an d a l l i e d p r o d u c t s ------------------------------------------- 1 1 0 ,4 0 0 8 8 ,5 0 0 2 2 0 0 3 , 3 2 0 1 4 2 0 1 ,6 8 0P r in t in g , p u b lis h in g , a n d a l l i e d i n d u s t r ie s ------ 2 60 1 ,0 4 0 - - - 1 20 8 1 0C h e m ic a ls an d a l l i e d p r o d u c t s --------------------------------- - - - 2 5 8 0 7 , 6 9 0 - - -P e t r o le u m r e f in in g an d r e la t e d in d u s t r ie s -------- - - - 2 2 2 0 6 , 7 5 0 - - -R u b b e r an d m is c e l l a n e o u s p l a s t ic s p r o d u c t s — - - - - - - - - -L e a t h e r a n d le a t h e r p r o d u c t s ------------------------------------ - - - 1 70 2 , 4 7 0 2 3 1 0 9 5 0S to n e , c l a y , an d g l a s s p r o d u c t s ------------------------------ 3 2 1 0 2 , 0 5 0 5 2 , 0 4 0 5 9 ,6 0 0 3 1 2 0 3 , 0 6 0P r i m a r y m e t a l i n d u s t r i e s ------------------------------------------- 2 7 7 0 3 , 8 7 0 3 2 , 0 0 0 4 , 6 6 0 1 3 , 8 0 0 5 7 ,0 0 0F a b r ic a t e d m e t a l p r o d u c t s , e x c e p t o r d n a n c e ,
m a c h in e r y , and tr a n s p o r t a t io n e q u ip m e n t — - - - 2 1 , 2 7 0 7 2 ,1 0 0 8 3 , 3 4 0 1 1 3 ,0 0 0M a c h in e r y , e x c e p t e l e c t r i c a l ------------------------------------ 2 1, 0 3 0 5 , 1 3 0 1 60 5 , 6 6 0 9 7 , 3 1 0 1 0 8 ,0 0 0E l e c t r i c a l m a c h i n e r y , e q u ip m e n t , an d
s u p p lie s ----------- -------------------------------------------------------------- - - - 2 4 3 0 1 0 ,3 0 0 1 7 3 0 1 1 ,7 0 0T r a n s p o r t a t io n e q u ip m e n t ------------------------------------------- 2 1, 7 1 0 8 , 4 9 0 2 8 4 0 1 8 ,6 0 0 4 2 8 ,0 0 0 1 5 9 ,0 0 0P r o f e s s io n a l , s c ie n t i f i c , and c o n t r o ll in g
in s t r u m e n t s ; p h o to g r a p h ic an d o p t ic a lg o o d s ; w a tc h e s an d c l o c k s ---------------------------------------- - - - - - - 4 6 7 0 1 8 ,5 0 0
M i s c e l la n e o u s m a n u fa c tu r in g i n d u s t r i e s ----------- 1 7 0 1 , 1 0 0 1 6 0 0 2 8 , 7 0 0 2 180 1 , 3 8 0
N o n m a n u fa c tu r in g - __________________________ 2 8 7 , 9 6 0 1 5 1 ,0 0 0 6 8 1 8 , 6 0 0 9 0 , 4 0 0 29 3 , 0 1 0 6 2 ,2 0 0
A g r ic u l t u r e , f o r e s t r y , an d f i s h e r i e s ---------------- _ - - 1 1 0 0 1 , 0 4 0 _ _ .M in in g — — ------------- ---------- ----------------------- — — - - - 36 1 5 , 2 0 0 5 6 , 9 0 0 - - -C o n t r a c t c o n s t r u c t io n — ------------------------------ ---------- 18 5 , 3 8 0 1 1 2 , 0 0 0 21 2 , 7 9 0 2 0 ,6 0 0 14 2 , 1 5 0 4 4 , 9 0 0T r a n s p o r t a t io n , c o m m u n ic a t io n , e l e c t r i c ,
g a s , an d s a n it a r y s e r v i c e s — -------------------------- 5 2 4 0 3 , 1 6 0 2 80 1 7 0 6 2 0 0 5 , 2 3 0W h o le s a le and r e t a i l t r a d e ------------------------------- — 5 2 , 3 4 0 3 6 ,0 0 0 6 2 2 0 1 1 , 2 0 0 6 5 1 0 1 1 , 1 0 0F in a n c e , in s u r a n c e , an d r e a l e s t a t e --------- - - - - - - 1 10 2 8 0Se r v ic e s ———— — —— —— — — —— __— —__- ____ _ _ - 1 1 5 0 3 3 0 _ - -G o v e r n m e n t -------------- — ----------------------------------------------- - - 1
n o n o 2 140 6 1 0
1 N o w o r k s t o p p a g e s w e r e r e c o r d e d d u r in g 1 9 6 4 fo r th e in d u s tr y g r o u p s fo r w h ic h no d a ta a r e p r e s e n t e d .2 I d le n e s s in 1 9 6 4 r e s u lt in g f r o m a s to p p a g e th a t b e g a n in 1 9 6 3 .3 A la r g e p r o p o r t io n o f th e 1 9 6 4 id l e n e s s r e s u lt e d f r o m s to p p a g e s th a t b e g a n in 1 9 6 3 .4 S to p p a g e s a f fe c t in g m o r e th a n 1 in d u s tr y g r o u p h a v e b e e n c o u n te d in e a c h g r o u p a f fe c t e d ; w o r k e r s in v o lv e d an d m a n -d a y s id le w e r e
a llo c a t e d to th e r e s p e c t i v e g r o u p s .5 I d le n e s s in 1 9 6 4 r e s u lt in g f r o m s to p p a g e s th a t b e g a n in 1 9 6 3 .6 A l a r g e p r o p o r t io n o f th e 1 9 6 4 i d le n e s s r e s u lt e d f r o m a s to p p a g e th a t b e g a n in 1 9 6 3 .
N O T E : B e c a u s e o f r o u n d in g , s u m s o f in d iv id u a l i t e m s m a y n o t e q u a l t o t a ls .
Digitized for FRASER http://fraser.stlouisfed.org/ Federal Reserve Bank of St. Louis

40
Table A-4. W ork Stoppages by Industry G roup and Contract Status, 1964
T o t a lN e g o t ia t io n o f f i r s t a g r e e m e n t
o r u n io n r e c o g n i t io nR e n e g o t ia t i o n o f a g r e e m e n t
( e x p i r a t i o n o r r e o p e n in g )
I n d u s t r y g r o u pS t o p p a g e s
b e g in n in g in 1 9 6 4
M a n - d a y s i d l e ,
1 9 6 4 ( a l l s t o p p a g e s )
S t o p p a g e s b e g in n in g in
1 9 6 4
M a n - d a y s i d l e ,
1 9 6 4 ( a l l s t o p p a g e s )
S t o p p a g e s b e g in n in g in
1 9 6 4
M a n - d a y s i d l e ,
1 9 6 4 ( a l l s t o p p a g e s )N u m b e r
W o r k e r si n v o l v e d
N u m b e rW o r k e r si n v o l v e d
N u m b e rW o r k e r sin v o l v e d
A l l i n d u s t r i e s . . ____________________________________ * 3 , 6 5 5 1 , 6 4 0 , 0 0 0 2 2 , 9 0 0 , 0 0 0 6 4 6 6 7 , 0 0 0 1 , 4 9 0 , 0 0 0 * 1 , 6 1 3 1 , 1 0 0 , 0 0 0 1 9 , 1 0 0 , 0 0 0
M a n u f a c t u r i n g ------------- --------------------------------------------- 1 1 , 7 9 4 9 9 4 , 0 0 0 1 5 , 7 0 0 , 0 0 0 3 5 1 4 9 , 2 0 0 1 , 2 4 0 , 0 0 0 * 9 3 5 6 8 1 , 0 0 0 1 3 , 1 0 0 , 0 0 0
O r d n a n c e a n d a c c e s s o r i e s . . . _ . ___________ _____ 8 6 , 8 2 0 1 5 4 , 0 0 0 3 4 , 0 4 0 1 3 6 , 0 0 0 2 4 7 0 8 , 4 7 0F o o d an d k in d r e d p r o d u c t s ----------------------------------------------- 1 8 6 5 4 , 9 0 0 8 6 6 , 0 0 0 4 4 1 , 9 5 0 6 6 , 9 0 0 9 3 3 8 , 8 0 0 7 4 9 , 0 0 0T o b a c c o m a n u f a c t u r e s _____________________________________ 1 6 0 0 1 , 6 8 0 - - - - - _T e x t i l e m i l l p r o d u c t s ______ _________ _____ __________ 3 7 8 , 4 4 0 1 2 4 , 0 0 0 8 3 7 0 3 1 , 2 0 0 2 2 5 , 1 9 0 7 4 , 9 0 0
L u m b e r an d w o o d p r o d u c t s , e x c e p t1 0 6 2 4 , 7 0 0 2 2 5 , 0 0 0 2 3 1 , 1 0 0 3 5 , 9 0 0 31 1 7 , 8 0 0 1 6 9 , 0 0 0
f u r n i t u r e ________________________________________________________ 5 6 7 , 1 1 0 9 6 , 9 0 0 11 8 2 0 2 1 , 6 0 0 3 7 4 , 9 3 0 6 6 , 8 0 0F u r n i t u r e a n d f i x t u r e s _____________________________________ 6 0 6 , 9 3 0 1 4 5 , 0 0 0 2 0 1 , 4 1 0 7 5 , 2 0 0 2 8 3 , 6 3 0 4 7 , 7 0 0P a p e r a n d a l l i e d p r o d u c t s __ ___________________________ 7 9 3 8 , 9 0 0 5 8 0 , 0 0 0 1 2 2 0 , 0 0 0 1 8 7 , 0 0 0 5 1 1 4 , 6 0 0 3 8 0 , 0 0 0
P r i n t i n g , p u b l i s h in g , an d a l l i e din d u s t r i e s ______ ______ _______ ______ __________ _____________ 5 0 8 , 6 5 0 8 0 1 , 0 0 0 18 7 8 0 5 5 , 9 0 0 2 4 7 , 0 0 0 7 4 3 , 0 0 0
C h e m i c a l s a n d a l l i e d p r o d u c t s __________ ________P e t r o l e u m r e f i n i n g a n d r e l a t e d
9 4 2 1 , 0 0 0 3 3 7 , 0 0 0 17 1 , 0 8 0 1 4 , 9 0 0 6 3 1 6 , 9 0 0 3 1 3 , 0 0 0
i n d u s t r i e s ________________________ __ . ------------------------ 2 2 5 , 3 4 0 1 6 4 , 0 0 0 3 2 2 0 1 0 , 8 0 0 1 3 4 , 2 4 0 1 5 2 , 0 0 0
R u b b e r a n d m i s c e l l a n e o u s p l a s t i c sp r o d u c t s _____________________________ — . . — _________ 6 7 3 0 , 0 0 0 4 5 2 , 0 0 0 15 1 , 1 4 0 1 5 6 , 0 0 0 3 1 1 7 , 4 0 0 2 5 0 , 0 0 0
L e a t h e r a n d l e a t h e r p r o d u c t s . _______________ 3 4 6 , 0 5 0 6 7 , 3 0 0 5 2 4 0 6 , 0 6 0 15 2 , 9 9 0 5 1 , 1 0 0S t o n e , c l a y , a n d g l a s s p r o d u c t s ______________________ 1 1 7 2 2 , 8 0 0 4 1 2 , 0 0 0 1 4 6 5 0 2 1 , 9 0 0 8 2 1 6 , 2 0 0 3 6 6 , 0 0 0P r i m a r y m e t a l i n d u s t r i e s ____________ ___________________ 1 7 3 8 7 , 7 0 0 1 , 0 1 0 , 0 0 0 18 1 , 2 5 0 5 4 , 7 0 0 8 3 4 2 , 2 0 0 7 8 2 , 0 0 0F a b r i c a t e d m e t a l p r o d u c t s 3 ____________________________ 2 2 8 7 9 , 9 0 0 1 , 5 5 0 , 0 0 0 6 0 5 , 4 0 0 1 9 2 , 0 0 0 1 2 0 6 2 , 5 0 0 1 , 2 9 0 , 0 0 0
M a c h i n e r y , e x c e p t e l e c t r i c a l ______________ _______E l e c t r i c a l m a c h i n e r y , e q u ip m e n t , a n d
1 9 1 1 2 0 , 0 0 0 1 , 1 4 0 , 0 0 0 3 6 1 , 6 5 0 5 2 , 4 0 0 1 0 3 7 1 , 4 0 0 7 5 7 , 0 0 0
s u p p l i e s _______________________________________________ ____ ___ 1 0 5 6 2 , 7 0 0 8 5 9 , 0 0 0 15 3 , 2 7 0 6 9 , 7 0 0 5 1 3 9 , 5 0 0 7 1 5 , 0 0 0T r a n s p o r t a t i o n e q u i p m e n t ------------------------------------------------- 1 2 0 3 8 6 , 0 0 0 6 , 4 1 0 , 0 0 0 15 1 , 3 3 0 1 5 , 6 0 0 4 8 3 0 2 , 0 0 0 5 , 8 9 0 , 0 0 0I n s t r u m e n t s , e t c . 4 ___________________ _____________________ 2 3 6 , 8 4 0 1 7 0 , 0 0 0 5 1 , 3 1 0 1 3 , 1 0 0 15 5 , 3 2 0 1 5 6 , 0 0 0M i s c e l l a n e o u s m a n u f a c t u r in g i n d u s t r i e s __________ 4 9 8 , 9 6 0 1 4 6 , 0 0 0 9 1 , 1 5 0 1 9 , 7 0 0 3 5 7 , 2 5 0 1 2 1 , 0 0 0
N o n m a n u f a c t u r i n g _ ___ ___________ ______ _ * 1 , 8 6 5 6 4 6 , 0 0 0 7 , 2 1 0 , 0 0 0 2 9 5 1 7 , 8 0 0 2 5 2 , 0 0 0 * 6 8 1 4 1 9 , 0 0 0 6 , 0 0 0 , 0 0 0
A g r i c u l t u r e , f o r e s t r y , an d f i s h e r i e s ---------------------- 18 3 , 0 0 0 4 4 , 1 0 0 6 1 3 0 5 , 6 4 0 5 6 9 0 6 , 0 4 0M jr > ip g r ____ , _____ ________________ ____________ 1 5 5 8 3 , 4 0 0 8 0 8 , 0 0 0 6 6 1 0 1 6 , 1 0 0 31 3 2 , 9 0 0 6 1 1 , 0 0 0C o n t r a c t c o n s t r u c t i o n _____ ____ ___________________________T r a n s p o r t a t i o n , c o m m u n i c a t i o n , e l e c t r i c ,
9 4 4 2 4 8 , 0 0 0 2 , 7 9 0 , 0 0 0 8 7 4 , 5 3 0 3 6 , 7 0 0 2 7 9 1 7 2 , 0 0 0 2 , 4 1 0 , 0 0 0
g a s , a n d s a n i t a r y s e r v i c e s ------------------------------------------- 2 5 7 2 0 5 , 0 0 0 1 , 9 0 0 , 0 0 0 3 8 2 , 4 2 0 2 5 , 7 0 0 1 2 0 1 4 4 , 0 0 0 1 , 7 1 0 , 0 0 0
W h o l e s a l e a n d r e t a i l t r a d e ----------------------------------------------- 3 0 9 6 1 , 6 0 0 1 , 3 4 0 , 0 0 0 9 7 3 , 3 4 0 7 5 , 4 0 0 1 7 4 4 7 , 6 0 0 1 , 0 9 0 , 0 0 0F i n a n c e , i n s u r a n c e , a n d r e a l e s t a t e - - __ ------- 17 8 3 0 1 0 , 4 0 0 7 1 7 0 7 8 0 9 6 5 0 9 , 0 2 0S e r v i c e s _ . ___ . ______________ ___ ___ ___________ 1 2 5 2 0 , 9 0 0 2 4 5 , 0 0 0 4 4 3 , 9 8 0 8 3 , 3 0 0 5 7 1 5 , 3 0 0 1 4 9 , 0 0 0G o v e r n m e n t ____ ______ ________________________________________ 4 1 2 2 , 7 0 0 7 0 , 8 0 0 10 2 , 6 4 0 8 , 0 6 0 7 4 , 9 4 0 2 1 , 8 0 0
S e e f o o t n o t e s a t e n d o f t a b le .
Digitized for FRASER http://fraser.stlouisfed.org/ Federal Reserve Bank of St. Louis
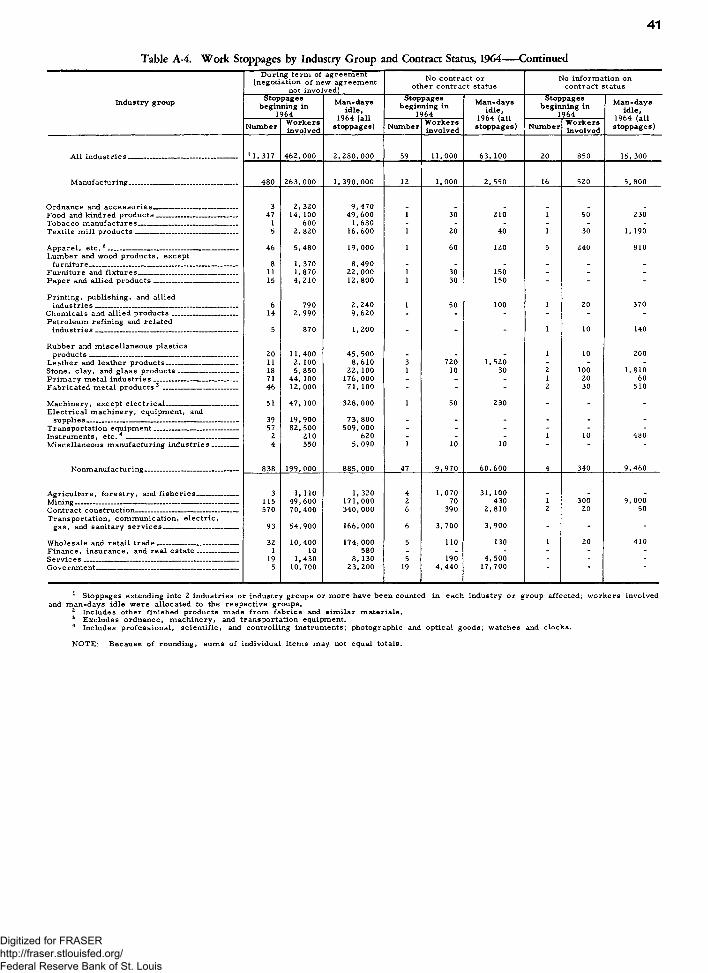
41
Table A -4. W ork Stoppages by Industry G roup and Contract Status, 1964----- ContinuedD u r i n g t e r m o f a g r e e m e n t
( n e g o t ia t i o n o f n e w a g r e e m e n t n o t in v o lv e d )
N o c o n t r a c t o r o t h e r c o n t r a c t s t a t u s
N o i n f o r m a t i o n o n c o n t r a c t s t a t u s
I n d u s t r y g r o u pS t o p p a g e s
b e g in n in g in1 9 6 4
M a n - d a y s i d l e ,
1 9 6 4 ( a l l s t o p p a g e s )
S to pb e g in
1<
p a g e s n in g in? 6 4
M a n - d a y s i d l e ,
1 9 6 4 ( a l l s t o p p a g e s )
S t o p p a g e s b e g in n in g in
1 9 6 4
M a n - d a y s i d l e ,
1 9 6 4 ( a l l s t o p p a g e s )N u m b e r
W o r k e r si n v o l v e d N u m b e r
W o r k e r sin v o l v e d
N u m b e rW o r k e r si n v o l v e d
A l l i n d u s t r i e s ___________________ ___________________ 1 1 , 3 1 7 4 6 2 , 0 0 0 2 , 2 8 0 , 0 0 0 5 9 1 1 , 0 0 0 6 3 , 1 0 0 2 0 8 5 0 1 5 , 3 0 0
M a n u f a c t u r i n g ------------- --------------------------------------------- 4 8 0 2 6 3 , 0 0 0 1 , 3 9 0 , 0 0 0 12 1 , 0 0 0 2 , 5 5 0 16 5 2 0 5 , 8 0 0
O r d n a n c e an d a c c e s s o r i e s ------------ --------------------------------- 3 2 , 3 2 0 9 , 4 7 0F o o d an d k in d r e d p r o d u c t s ----------------------------------------------- 4 7 1 4 , 1 0 0 4 9 , 6 0 0 1 3 0 2 1 0 1 5 0 2 3 0T o b a c c o m a n u f a c t u r e s _____________________________________ 1 6 0 0 1 , 6 8 0 - - - - - -T e x t i l e m i l l p r o d u c t s ______________________________________ 5 2 , 8 2 0 1 6 , 6 0 0 1 2 0 4 0 1 3 0 1 , 1 9 0
A p p a r e l , e t c . 2 _____________________________________________ ___L u m b e r an d w o o d p r o d u c t s , e x c e p t
4 6 5 , 4 8 0 1 9 , 0 0 0 1 6 0 1 2 0 5 2 4 0 8 1 0
f u r n i t u r e -------------------------------------------------------------------------------------- 8 1 , 3 7 0 8 , 4 9 0 - - - - - -F u r n i t u r e an d f i x t u r e s ______________________ ____ _____ 11 1 , 8 7 0 2 2 , 0 0 0 1 3 0 1 5 0 - - -
P a p e r an d a l l i e d p r o d u c t s __ _______________ _________ 15 4 , 2 1 0 1 2 , 8 0 0 1 3 0 1 5 0 - - -
P r in t i n g , p u b l i s h in g , a n d a l l i e di n d u s t r i e s _____________________________________________________ 6 7 9 0 2 , 2 4 0 1 5 0 1 0 0 1 2 0 370
C h e m i c a l s a n d a l l i e d p r o d u c t s _________________________P e t r o l e u m r e f i n i n g a n d r e l a t e d
14 2 , 9 9 0 9 , 6 2 0 “ - - -
i n d u s t r i e s ___________ _____________ ________________ _____ 5 8 7 0 1 , 2 0 0 - - - 1 10 1 4 0
R u b b e r a n d m i s c e l l a n e o u s p l a s t i c sp r o d u c t s ____ ___________________ __________ _______________ 2 0 1 1 , 4 0 0 4 5 , 5 0 0 - - - 1 10 2 0 0
L e a t h e r an d l e a t h e r p r o d u c t s ---------------------- ---------- - 11 2 , 1 0 0 8 , 6 1 0 3 7 2 0 1 , 5 2 0 - - -S t o n e , c l a y , a n d g l a s s p r o d u c t s ----------------------------------- 18 5 , 8 5 0 2 2 , 1 0 0 1 10 3 0 2 1 0 0 1 , 8 1 0P r i m a r y m e t a l i n d u s t r i e s ________________________________ 7 1 4 4 , 1 0 0 1 7 6 , 0 0 0 - - - 1 2 0 6 0F a b r i c a t e d m e t a l p r o d u c t s 3 __ -------- ------------------------ 4 6 1 2 , 0 0 0 7 1 , 1 0 0 - - 2 3 0 5 1 0
M a c h i n e r y , e x c e p t e l e c t r i c a l ___________________________E l e c t r i c a l m a c h i n e r y , e q u ip m e n t , an d
5 1 4 7 , 1 0 0 3 2 8 , 0 0 0 1 5 0 2 3 0 - - -
s u p p l i e s ____________________ — ------- ----------------------------------- 39 1 9 , 9 0 0 7 3 , 8 0 0 - - - - - -T r a n s p o r t a t io n e q u i p m e n t ________________________________ 5 7 8 2 , 5 0 0 5 0 9 , 0 0 0 - - - - - -I n s t r u m e n t s , e t c . 4 ________________ ________________________ 2 2 1 0 6 2 0 - - - 1 10 480M i s c e l l a n e o u s m a n u f a c t u r in g i n d u s t r i e s --------------- 4 5 5 0 5 , 0 9 0 1 1 0 1 0 ~ " _
N o n m a n u f a c t u r i n g ------------------------------------------------------ 8 3 8 1 9 9 , 0 0 0 8 8 5 , 0 0 0 4 7 9 , 9 7 0 6 0 , 6 0 0 4 3 4 0 9 , 4 6 0
A g r i c u l t u r e , f o r e s t r y , a n d f i s h e r i e s ------ -------------- 3 1 , 1 1 0 1 , 3 2 0 4 1 , 0 7 0 3 1 , 1 0 0t*? ng . . . . . . 1 1 5 4 9 , 6 0 0 1 7 1 , 0 0 0 2 7 0 4 3 0 1 3 0 0 9 , 0 0 0
C o n t r a c t c o n s t r u c t i o n ---------------------------------------- ---------------T r a n s p o r t a t i o n , c o m m u n i c a t i o n , e l e c t r i c ,
5 7 0 7 0 , 4 0 0 3 4 0 , 0 0 0 6 3 9 0 2 , 8 1 0 2 2 0 5 0
g a s , an d s a n i t a r y s e r v i c e s ____________________________ 9 3 5 4 , 9 0 0 1 6 6 , 0 0 0 6 3 , 7 0 0 3 , 9 0 0 - " -
W h o l e s a l e an d r e t a i l t r a d e -------------- -------------------------- 3 2 1 0 , 4 0 0 1 7 4 , 0 0 0 5 1 1 0 1 3 0 1 2 0 4 1 0F i n a n c e , in s u r a n c e , a n d r e a l e s t a t e ------------------------ 1 10 5 8 0 - - - - - -S e r v i c e s ________________________________________ _________________ 19 1 ,4 3 0 8 , 1 3 0 5 1 9 0 4 , 5 0 0 - - -G o v e r n m e n t __________ ______________ _____________________ 5 1 0 , 7 0 0 2 3 , 2 0 0 19 4 , 4 4 0 1 7 , 7 0 0
1 S t o p p a g e s e x t e n d in g in to 2 i n d u s t r i e s o r in d u s t r y g r o u p s o r m o r e h a v e b e e n c o u n t e d in e a c h in d u s t r y o r g r o u p a f f e c t e d ; w o r k e r s in v o lv e d an d m a n - d a y s id l e w e r e a l lo c a t e d to th e r e s p e c t i v e g r o u p s .
2 Includes other finished products made from fabrics and sim ilar m aterials.3 E x c l u d e s o r d n a n c e , m a c h i n e r y , an d t r a n s p o r t a t i o n e q u ip m e n t .4 I n c lu d e s p r o f e s s i o n a l , s c i e n t i f i c , an d c o n t r o l l i n g in s t r u m e n t s ; p h o t o g r a p h ic a n d o p t i c a l g o o d s ; w a t c h e s an d c l o c k s .
N O T E : B e c a u s e o f r o u n d in g , s u m s o f in d iv i d u a l i t e m s m a y n o t e q u a l t o t a l s .
Digitized for FRASER http://fraser.stlouisfed.org/ Federal Reserve Bank of St. Louis

Digitized for FRASER http://fraser.stlouisfed.org/ Federal Reserve Bank of St. Louis

Appendix B. Chronology— The Atlantic and Gulf Coast Longshoremen’s Strike, 1964—65
June 16, 1964
R epresentatives of the International L ongshorem en 's A ssoc ia tion 's (ILA) Atlantic Coast D istrict and its South Atlantic and Gulf Coast D istrict m et in New York City to draft contract p rop osa ls for subm ission to the New York Shipping A ssocia tion (N YSA).1
June 25
R epresentatives of the NYSA m et b r ie fly with ILA negotiators to accept the union 's contract p rop osa ls . The latter, presented by ILA P residen t Thom as W. G leason, ca lled for a 3 -yea r agreem ent provid ing, among other things, a wage in crea se of 35 cents over the term of the contract; an 8 -hour daily guarantee; an in crea se in pensions; an additional holiday each year, ra ising the number to 12; and retention of the 20-m an w ork gang.
July 1
Jam es J. R eynolds, A ssistant S ecreta ry of L abor, presented cop ies of the U.S. Departm ent of L a b o r 's rep ort on m anpower utilization and job secu rity in the P ort of New Y ork to 22 union and m anagem ent represen tatives. This rep ort, 1 of 10 prepared by the Departm ent on Atlantic and Gulf Coast p orts , was authorized by the January 1963 "M e m o randum of Settlem ent" which brought the 1962—63 longshore strike to a c lo s e .2
July 7
Contract negotiations began in New Y ork. A lexander Chopin, Chairm an of the New Y ork Shipping A ssocia tion , sought to begin the sess ion with a d iscu ss ion of the Labor D epartm ent's findings, a cou rse of action re je cted by Thom as Gleason, who insisted on firs t rece iv in g the e m p loy er ’ s cou n terproposa ls . Management represen tatives agreed to present their p rop osa ls at the next m eeting.
July 14
The cou n terproposa ls presented by the NYSA ca lled for a 5 -yea r agreem ent with a w a ge -reop en er clause after the third year, and providing, am ong other things, for the elim ination of royalty paym ents on containerized cargo. Counterdem ands to the union’ s request for wage in crea ses w ere d e ferred until d iscu ssion s had been held on m anpower utilization. A m anagem ent prop osa l that a joint com m ittee be established to d iscuss this latter m atter was accep ted by the union. This joint com m ittee was scheduled to hold daily m eetings during the w eek of July 20, and was to rep ort its findings to the full negotiating com m ittee on July 27.
July 29
F ed era l M ediators R obert H. M oore , J. Andrew Burke, and H erbert Schm ertz re ce iv ed a p ro g re ss rep ort in separate m eetings with each of the parties.
1 The New York Shipping Association is authorized to bargain for employer associations in the North Atlantic area with respect to wages, hours, employer contributions to the welfare and pension funds, and the term of the agreement. Settlements on these issues, generally referred to as the Master Contract, are then incorporated into local agreements in these ports. Negotiations on working conditions and other matters are conducted on the local level.
In the South Atlantic and Gulf Coast ports, there are several employer associations and groupings, with separate negotiations being conducted in Miami, Mobile, New Orleans, and Galveston. Negotiations in these ports are influenced by the New York settlement, but there is a general tendency to follow the New Orleans agreement on economic issues.
2 Reports were subsequently issued for the following ports: Baltimore, Boston, Charleston, Galveston, Houston, Jacksonville,Mobile, New Orleans, and Philadelphia.
43Digitized for FRASER http://fraser.stlouisfed.org/ Federal Reserve Bank of St. Louis

44
July 30
The p arties , in a cco rd with the January 1963 M em orandum of Settlem ent, se lected a neutral board to a ss is t them in the resolu tion of their d ifferen ces . At their request, S ecreta ry of Labor W. W illard W irtz appointed to this board the m en who had participated in the settlem ent of t h e 1962—63 longshore strike : Senator Wayne M orse , Chairm an;T h eodore W. Kheel, New Y ork City attorney and a rb itra tor ; and P ro f. Jam es A. Healy of the H arvard School of B usiness A dm inistration. Due to the p ressu re of his senatorial com m itm ents, Senator M orse was unable to serve , and, at the p a rties ' request, A ssistant Labor S ecre ta ry Reynolds served as chairm an in his p lace . David Stowe, D irector of the Labor Departm ent study, was assigned as advisor to the board.
Contract talks opened in New O rleans.
August 11
The neutral board held separate m eetings with ILA and NYSA represen ta tives. The board subsequently m et regu larly with the p arties , both separately and jo in tly , through Septem ber 30.
August 18
During a 5-hour m eeting with the neutral board, the union exp ressed a w illingness to con sider a reduction in gang s ize in return fo r a guaranteed annual wage.
August 29
N egotiators for the South Atlantic ports opened 7 days of contract talks in M iam i.
Septem ber 3
The neutral board asked the ILA negotiating com m ittee to submit its p rop osa l for changes in the operation of the h iring centers in the P ort of New York. W hile the union hailed this request as a p oss ib le break in the stalem ate, the s ize of the w ork gang rem ained the key u n resolved issue. The board scheduled a Septem ber 8 m eeting with the W aterfront C o m m iss io n 3 to d iscu ss the hiring center issue.
Septem ber 16
Contract negotiations began in G alveston fo r the W est Gulf ports.
Septem ber 18
Union and m anagem ent representatives for the South Atlantic ports resum ed n egotiations. M eetings w ere held daily through Septem ber 30.
Septem ber 21
The NYSA o ffered to submit all u nresolved issu es to final and binding arbitration .
Septem ber 23
Union m em bers in North Atlantic ports voted to re je c t the NYSA's arbitration p roposa l.
Septem ber 25
The neutral board, in a cco rd with its mandate, subm itted to the parties the r e c om m endations it had prepared for resolu tion of the rem aining issu es in the P ort of New York. At the p arties ' request, the recom m endations w ere not confined to the job security----
3 The hiring of longshoremen in the Port of New York is supervised by the Waterfront Commission of New York Harbor, a bi-State regulatory agency created in 1953.
Digitized for FRASER http://fraser.stlouisfed.org/ Federal Reserve Bank of St. Louis

45
m anpower utilization p rob lem s, but cov ered all aspects of the dispute. Am ong the r e c o m mendations w ere a phased reduction in gang s ize in return fo r a guaranteed annual wage, greater flex ib ility in the assignm ent of men, and the ea rly curtailm ent of new entrants into the longshore labor fo r ce .
Septem ber 26—29
The neutral board continued its intensive e fforts to help the parties achieve a settlem ent on the basis of its recom m endations.
Septem ber 29
N egotiators in New O rleans reported that they had reached “ agreem ent in princip le" on all noneconom ic issu e s .
Septem ber 30
N egotiations broke off during the afternoon follow ing Thom as W. G leason ’ s announcement that the union 's "n o contract— no w ork" p o licy would go into e ffect at midnight when the old agreem ent expired .
P residen t Johnson invoked the "national em ergen cy" p rov is ion s of the T a ft-H artley Act and appointed the follow ing th ree-m an B oard of Inquiry to investigate the d isp u te :4 H erbert Schm ertz, W ashington attorney and arb itrator, Chairm an; Jam es J. Healy; and Theodore W. Kheel. The latter two m en had served on the neutral board se lected in late July.
O ctober 1
Longshorem en in ports fro m Maine to Texas stopped w ork. The B oard of Inquiry 's report, sum m arizing the background and present status of the dispute, was subm itted to the President. The B oard concluded: "T h e rig id ity of positions on m any of the m ain issu es,plus the com plexity of item s concerned with the related cra fts , m akes the p oss ib ility of an early settlem ent m ost rem ote ."
P residen t Johnson d irected the Justice Departm ent to seek an injunction on the grounds that a continuation of the strike would im p eril the national health and safety. U.S. D istrict Judge F re d e r ick van P elt Bryan signed a 10-day restrain ing ord er at 8 p .m . and ordered both sides to appear b e fore him on O ctober 8 to show cause why the injunction should not be extended for the 80-day p eriod p re scr ib e d by the T a ft-H artley Act.
ILA o ffic ia ls com plied with the court order and notified their m em bers to returnto w ork.
O ctober 8
A d ecis ion on the G overnm ent's petition for an injunction was d e ferred after the ILA questioned its legality . Judge Irving Ben C ooper, who heard the argum ents, asked union and m anagem ent attorneys to file additional papers by 2:30 p .m ., O ctober 9.
O ctober 10
Judge C ooper extended the injunction to 80 days, thus prohibiting a resum ption of the strike until D ecem ber 20.
O ctober 21—31
Contract talks in New Y ork resum ed on O ctober 21, centering in itia lly on the demands of the carpen ters, coop ers and maintenance men. At the p arties ' request, this m eeting and those held subsequently w ere conducted by A ssistant Labor S ecreta ry R eynolds, assisted by David Stowe.
4 This marked the 24th time since 1947 that such action was deemed necessary, and the 6th time that Atlantic Coast longshoremen were involved in a "national emergency" dispute.
Digitized for FRASER http://fraser.stlouisfed.org/ Federal Reserve Bank of St. Louis

46
November 1
A ssistant Labor S ecreta ry Reynolds reported that the negotiations rem ained s ta le m ated over the sam e m anpower utilization issu es w hich had sparked the strike. A m anagement demand fo r greater flex ib ility in assigning w ork to cargo ch eck ers was one of the m ain points at issu e.
N ovem ber 5
The S ecreta ry of Labor, con cern ed by the deadlocked negotiations, ca lled union and em ployer negotiating team s to W ashington fo r separate m eetings on N ovem ber 6.
N ovem ber 9—25
Frequent m eetings, both jo in t and separate, w ere held under the d irection o f A ssistant Labor S ecreta ry Reynolds and David Stowe.
N ovem ber 20
The ILA petitioned the NLRB to allow its s ix crafts to vote separately on the em p loy ers ' "fin a l" o ffer . Ivan C. M cL eod , NLRB R egional D irector , denied this request on N ovem ber 25. Voting was scheduled for D ecem ber 10—15.
N ovem ber 24
A ssistant Labor S ecreta ry Reynolds suggested that the parties a ccept a 1 -year contract on w ages and fringe benefits while they continued to negotiate the u n resolved m anpow er issu es. This approach was acceptable to the union, but was re je cte d by m anagem ent.
Labor and m anagem ent representatives in New O rleans m et fo r their f ir s t talks since Septem ber 30.
N ovem ber 28
The B oard of Inquiry heard the em p loy ers ' " fin a l" o ffer at a 2 -hour m eeting with union and m anagem ent o ffic ia ls .
N ovem ber 30
The B oard of Inquiry, in its second rep ort to the P resident, stated that contract term s for three craft groups had been agreed upon, but that an im passe had been reach ed in d iscu ssion s on the w ork assignm ents of c le rk s , ch eck ers , and term inal labor.
The B oard reported that the parties had a ffirm ed their "w illin gn ess to engage in negotiations as extensively as n ecessa ry to use any and all opportunities to ach ieve a settlem ent p r io r to the expiration of the injunction."
D ecem ber 6N egotiations for the South Atlantic ports w ere resum ed in M iam i; talks continued
through D ecem ber 12.
D ecem ber 9The ILA entered into a M em orandum of Understanding with o ffic ia ls of the B rook lyn
A rm y Term inal, stating that m ilita ry cargo would be handled should the union strike at the expiration of the injunction. Although the union has trad itionally fo llow ed a p o licy o f handling m ilita ry ca rg oes , it rep orted ly had never be fore bound itse lf to do so by a w ritten agreem ent.D ecem ber 16
E m ployer and union represen tatives announced that tentative agreem ent had been reached on a 4 -yea r contract for the P ort o f New Y ork. Included in the agreem ent, w hich provided an 80-cen t w a ge-fr in ge package, w ere p rov is ion s fo r a phased reduction in gang s ize and a guaranteed annual wage. Voting on ra tifica tion of the agreem ent was scheduled for January 8, 1965.
Digitized for FRASER http://fraser.stlouisfed.org/ Federal Reserve Bank of St. Louis

47
ILA o ffic ia ls in all but the W est Gulf ports agreed to extend contract talks through January 10; in t}ie W est Gulf, talks w ere continued on a d a y -to -d a y basis only.D ecem ber 20
The 80-day injunction exp ired at 8 p .m .D ecem ber 21
Longshorem en at m ore than half of the p iers in the port of New York walked off their jo b s , prom pting union o ffic ia ls to undertake a cam paign to advise the m em bersh ip of the m erits of the new agreem ent. During the week w hich follow ed , b r ie f sporad ic walkouts a lso o ccu rred at the ports of B altim ore , Boston, G alveston, and Houston.D ecem ber 22
N egotiations for the W est Gulf ports w ere resum ed under the d irection of A ssistant Labor S ecreta ry R eynolds. M ediative assistan ce was subsequently provided by David Stowe an d /or A ssistant Labor S ecreta ry Reynolds in talks held in G alveston during D ecem ber 23—24, D ecem ber 28—31, and January 5—10. Am ong the host of u nresolved issu es w ere the estab lishm ent of a m inim um gang s ize , the m onetary s ize of the agreem ent, and the retroa ctiv ity of the agreem ent.January 8, 1965
Longshorem en in the port o f New Y ork voted down the agreem ent reached on D ecem ber 16. Thom as W. G leason, ILA P residen t, ord ered a strike to begin at 12:01 a.m . on January 11.January 10
Steam ship opera tors appealed to P residen t Johnson through A ssistant Labor S e c re tary Reynolds to seek leg is lation forc in g the ILA to com pu lsory arbitration .January 11
L ongshorem en fro m Maine to Texas resum ed the s tr ik e .5 Union o ffic ia ls in New Y ork began a cam paign to explain the advantages of the re je cte d agreem ent to the m em bersh ip .
January 12The National M aritim e Union and the S e a fa re rs ’ International Union notified steam
ship com panies that they would honor the lon gsh orem en 's p icket lines.
January 13ILA P residen t G leason ca lled upon union leaders at ports fro m B oston to G alveston
to resu m e negotiations on lo ca l issu es.
January 14Contract negotiations resum ed in B altim ore.
January 15In G alveston, David Stowe provided m ediative assistan ce in daily negotiations through
January 20, and fro m January 22—31.
January 21L ongshorem en in the P ort of New Y ork approved by m ore than a 2—1 m argin the
4 -y ea r agreem ent they had p rev iou sly re jected , 6 but continued the strike pending settlem ents in other ports .
5 This marked the fifth time that a longshore strike had occurred or resumed after an 80-day "cooling-off" period.The agreement provided for a 10-cent-an-hour wage increase, retroactive to October 1, and additional increases of 10 cents
on Oct. 1, 1965, and 8 cents on Oct. 1, 1966, and 1967. Three additional paid holidays were provided, bringing the total to 12; and a fourth week of vacation for most workers with 12 years of service.
The present 20-man general cargo gang is to be reduced to 18 men on Apr. 1, 1966, and to 17 men on Oct. 1, 1967. Effective Apr. 1, 1966, all employees with 700 hours' employment in the previous year are to be guaranteed 1,600 hours of work or pay annually if they make themselves available for work.
Employer payments to the pension fund are to increase to 47 cents per man-hour, from 23 cents, on Oct. 1, 1965. Pension benefits were increased and a monthly benefit was established for widows of men with 25 years' service who die before retirement.
Digitized for FRASER http://fraser.stlouisfed.org/ Federal Reserve Bank of St. Louis

48
The ILA lifted its em bargo on U .S .-flag passenger v e s s e ls and on perish able ca rgoes in the P ort of New York.
J a n u a r y 22
January 24
L ongshorem en in B oston voted to a ccept the term s of the m aster contract; n egotiations continued over lo ca l issu es.
January 27
B altim ore longshorem en re je cte d a new contract.
January 28
The New Y ork Shipping A ssocia tion , in a te legram m ade public, appealed to the P residen t to take action Mto term inate this sen se less , su icidal and unjustified strike and reopen our p orts , pending con gression a l action tow ards com pu lsory a rb itration .”
A settlem ent was reported at M obile, A la.
January 29
In New O rleans, w here A ssistant Labor S ecreta ry Reynolds had a ss isted in n egotiations since January 16, longshorem en ratified a 4 -y ea r agreem ent.
January 31
A ssistant Labor S ecreta ry R eynolds, who had been in G alveston since January 29, announced that bargaining talks for the W est Gulf p orts had collapsed .
F eb ru a ry 1
B altim ore longshorem en voted to a ccept a rev ised vers ion of the agreem ent they had re je c te d ea r lie r .
P residen t Johnson, through Labor S ecreta ry W irtz, urged longshore lead ers to ease the im pact of the strike by sending m en back to w ork at p orts w here agreem ents had been reached . Union action on the P res id en t 's appeal was d e ferred pending the outcom e of n egotiations in Philadelphia. A ssistant Labor S ecreta ry R eynolds a rrived in the latter port w here he provided m ediative assistan ce through F ebru ary 8, when agreem ent on the longshore contract was reached .
The ILA rescin d ed its exem ption on p erish a b les, stating that the exem ption applied only to ships in the harbor at the tim e it was ord ered . N egotiations fo r the South Atlantic ports resum ed in M iam i. David Stowe was in attendance at these talks which continued through F ebru ary 6.
F ebru ary 2
The C om m erce and Industry A ssocia tion appealed to the P residen t to invoke the T a ft-H artley A ct again. Ralph C. G ross , E xecutive V ice -P re s id e n t of the A ssocia tion , re je cte d the argum ent that the a ct 's p rocedu res had been exhausted, stating that entirely new issu es w ere now at stake.
F ebru ary 4
In M obile, A la . , C ircu it Court Judge W ill G. C affey ruled that the lo ca l union was lega lly obligated to ca rry out the contract it had signed with the M obile Steam ship A ssocia tion , and ord ered the longshorem en to return to their jo b s . On F ebru ary 8, follow ing the lon g -
Digitized for FRASER http://fraser.stlouisfed.org/ Federal Reserve Bank of St. Louis

49
sh orem en 's fa ilu re to return to w ork, Judge Caffey fined the lo ca l $ 5 ,000 , and stated the penalty would be in crea sed by an additional $ 1, 000 for each day the walkout continued. On F ebruary 11, som e longshorem en began reporting for w ork.
ILA L oca l 1814 in B rooklyn voted to return to w ork as soon as agreem ent was reached in the P ort of Philadelphia.
F ebru ary 5
The NYSA once again urged the P residen t to act so as to get trade m oving in those ports w here agreem ents had been reached.
F ebru ary 9
The NYSA charged the ILA with violation of the National Labor Relations A ct by their refu sal to fu lfill the contract ratified in January; s im ila r charges w ere filed in New Orleans by the New O rleans Steam ship A ssocia tion .
A ssistant Labor S ecreta ry Reynolds a rrived in G alveston w here negotiations resum ed the follow ing day.
F ebruary 10
P residen t Johnson announced the appointment of a th ree-m an panel to m eet in W ashington with com pany and union representatives from South Atlantic and W est Gulf p orts , and make recom m endations for a fa ir and equitable settlem ent of the issu es in dispute. Panel m em bers w ere : W. W illard W irtz, S ecretary of Labor, Chairm an; John T. Connor, S ecretaryof C om m erce ; and Senator Wayne M orse of O regon. The panel was to rep ort to the P r e s i dent whether its recom m endations had been accepted by 12 noon on February 12. In announcing the pan el's appointment, the P residen t stated: "T h e injury to the econ om y r e sulting from this shutdown has reached staggering proportion s. Continuation of this strike is totally unjustified in the North Atlantic and East Gulf ports w here agreem ent has a lready been reach ed ."
F ebruary 11
The panel heard rep orts from the parties on the u nresolved issu es in the South Atlantic and W est Gulf p orts . The establishm ent of a m inim um gang size was a key issue in both areas.
A 5-day restrain ing ord er , requested by the NLRB, was signed in New Y ork by Federa l D istrict Judge Sidney Sugarman. A hearing on the extension of this order was scheduled for F ebru ary 16. R estrain ing ord ers w ere a lso issued by F ed era l Judges in B altim ore and New O rleans.
F ed era l M ediator John R. M urray announced that tentative settlem ents had been reached with all lo ca ls involved in the strike in the P ort of Philadelphia.
February 12
The panel presented its findings and recom m endations fo r settlem ent in the South Atlantic and W est Gulf p orts . E m ployer representatives from both areas accepted the panel's recom m endations. Union lead ers , on the other hand, re je cted the pan el's recom m endations. Follow ing the re je ctio n of the panel's p rop osa ls , m ediation sess ion s by Labor S ecreta ry W irtz continued until about 5 p ,m .
ILA P residen t G leason announced at the conclusion of the pan el's hearings that longshorem en would be ord ered to return to w ork at 8 a.m . the follow ing day in those ports where agreem ents had been reached. He stated, how ever, that the ILA would not w ork any diverted ships or cargoes in these ports.
February 13
W ork resum ed in the " con tract-settled " ports.
Digitized for FRASER http://fraser.stlouisfed.org/ Federal Reserve Bank of St. Louis
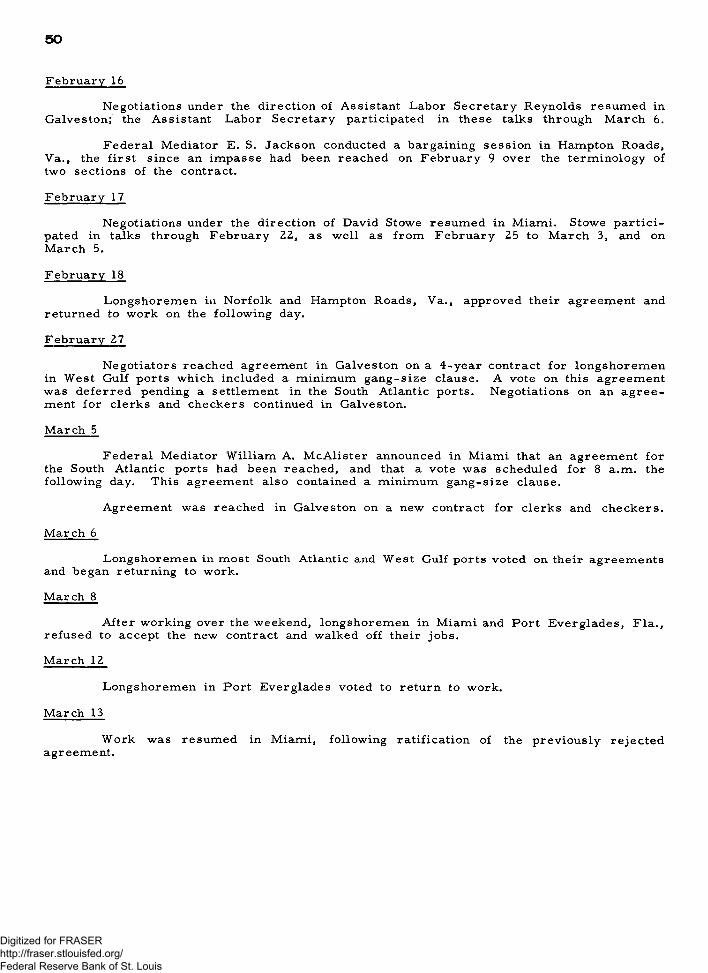
50
F ebru ary 16
N egotiations under the d irection of A ssistant Labor S ecreta ry Reynolds resu m ed in G alveston; the A ssistant Labor S ecreta ry participated in these talks through M arch 6.
F edera l M ediator E. S. Jackson conducted a bargaining sess ion in Hampton R oads, Va., the f ir s t since an im passe had been reach ed on F ebru ary 9 over the term in ology of two sections of the contract.
F ebru ary 17
N egotiations under the d irection o f David Stowe resu m ed in M iam i. Stowe p a r t ic ipated in talks through F ebru ary 22, as w ell as from F ebru ary 25 to M arch 3, and on M arch 5.
F ebru ary 18
Longshorem en in N orfolk and Hampton R oads, Va., approved their agreem ent and returned to w ork on the follow ing day.
F ebru ary 27
N egotiators reached agreem ent in G alveston on a 4 -y ea r contract for longsh orem en in W est Gulf ports w hich included a m inim um ga n g -size clause. A vote on this agreem ent was d e ferred pending a settlem ent in the South Atlantic p orts . N egotiations on an a g re e ment fo r clerk s and ch eck ers continued in Galveston.
M arch 5
F ed era l M ediator W illiam A. M cA lister announced in M iam i that an agreem ent for the South Atlantic ports had been reached , and that a vote was scheduled fo r 8 a .m . the follow ing day. This agreem ent a lso contained a m inim um ga n g -size clause.
A greem ent was reached in G alveston on a new contract for clerk s and ch eck ers .
M arch 6
L ongshorem en in m ost South Atlantic and W est Gulf ports voted on their agreem ents and began returning to w ork.
M arch 8
A fter w orking over the weekend, longshorem en in M iam i and P ort E verglades, F la ., re fu sed to accept the new contract and walked off their job s .
M arch 12
Longshorem en in P ort E verglades voted to return to w ork.
M arch 13
W ork was resum ed in M iam i, follow ing ra tifica tion of the p rev iou sly re je cte d agreem ent.
Digitized for FRASER http://fraser.stlouisfed.org/ Federal Reserve Bank of St. Louis
Appendix C. Scope, Methods, and Definitions1
W ork Stoppage Statistics
The B ureau 's statistics include a ll w ork stoppages occu rr in g in the United States involving as many as six w ork ers and lasting the equivalent o f a full day or shift or longer.
D efinitions
Strike or L ockout. A strike is defined as a tem porary stoppage o f w ork by a group o f em ployees (not n e ce ssa r ily m em bers o f a union) to exp ress a grievan ce or en force a demand. A lockout is a tem porary withholding o f w ork from a group of em ployees by an em ployer (or group o f em ployers) in ord er to induce the em ployees to a ccep t the em p loyer 's term s. B ecause o f the com plex ities involved in m o s t labor-m anagem ent d isputes, the Bureau m akes no e ffort to determ ine whether the stoppages are initiated by the w ork ers or the em ployers. The term s "s tr ik e " and "w ork stoppage" are used interchangeably in this bulletin.
W orkers a,nd Id len ess. F igures on "w ork ers involved" and "m an -days id le" include a ll w ork ers m ade idle for one shift o r longer in establishm ents d irectly involved in a stop p a g e .2 They do not m easu re secondary id len ess— that is , the e ffects o f a stoppage on other establishm ents or industries w h o se em ployees m ay be made idle as a resu lt o f m ateria l or se rv ice shortages.
The total num ber o f w ork ers involved in strikes in a given year includes w orkers counted m ore than once if they w ere involved in m ore than one stoppage during that year. (Thus, in 1949, 365,000 to 400 ,000 coa l m iners struck on three d ifferent o cca s ion s ; they accounted for 1. 15 m illion o f the year*s total o f 3 .03 m illion w o rk e rs .)
In som e prolonged stoppages, it is n e ce ssa ry to estim ate in part the total m an-days o f id leness if the exact num ber o f w orkers idle each day is not known. Significant changes in the num ber o f w ork ers idle a re secu red from the parties for use in com puting m an-days o f id len ess.
Idleness as P ercen t o f Total W orking T im e . In com puting the num ber o f w orkers involved in strikes as a p ercen t o f total em ploym ent and id len ess as a percen t o f total w orking tim e, the follow ing figu res for total em ploym ent have been used:
F rom 1927 to 1950, a ll em ployees w ere counted, except those in occupations and p ro fe ss io n s in w hich little , if any, union organization existed o r in w hich stoppages ra re ly , if ever , o ccu rre d . In m ost industries, a ll wage and sa lary w ork ers w ere in cluded except those in executive, m anageria l, or high su p erv isory p osition s, or those perform in g p ro fess ion a l w ork the nature o f which m ade union organization or group action unlikely. The figu re excluded a ll se lf-em p loyed p erson s; dom estic w ork ers ; w ork ers on farm s em ploying few er than six p erson s; a ll F ed era l and State Governm ent em ployees; and o ffic ia ls , both elected and appointed, in lo ca l governm ents.
Beginning in 1951, the B ureau 's estim ates o f total em ploym ent in nonagricultural estab lishm ents, exclu sive o f governm ent, have been used. Idleness com puted on the basis o f nonagricu ltural em ploym ent (exclu sive o f governm ent) usually d iffers by less than one-tenth o f a percentage point from that obtained by the fo rm e r m ethod, w hile
* More detailed information is available in Techniques of Preparing Major BLS Statistical Series (BLS Bulletin 1168, December 1954), p. 106.
2 Aggregate figures on workers and strike idleness are rounded to three significant digits. Figures to the right of the third significant digit appear as zeros; the last digit is always rounded to zero. To illustrate: an unrounded figure of 5,014,000 man-days would appear as 5,010,000; an unrounded total of 26,457 would be presented as 26,500; and a figure of 493 woikers would appear as 490. Totals and percentages, however, are computed from unrounded figures.
51Digitized for FRASER http://fraser.stlouisfed.org/ Federal Reserve Bank of St. Louis

52
the percentage o f w ork ers idle (com pared with total em ploym ent) d iffers by about 0. 5 o f a point. F or exam ple, the percentage o f w ork ers idle during 1950 com puted on the sam e base as the figu res for ea rlier years was 6 .9 , and the percen t o f id leness was0 .4 4 , com pared with 6 .3 and 0 .4 0 , resp ectiv e ly , com puted on the new base.
nEstim ated w orking tim e" is com puted by m ultiplying the average num ber o f w ork ers em ployed during the year by the num ber o f days typ ica lly w orked by m ost em ployees. In the com putations, Saturdays (when cu stom arily not w orked), Sundays, and established holidays as p rovided in m ost union contracts a re excluded.
D uration. Although only w orkdays a re used in com puting m an-days o f total id len ess, duration is exp ressed in term s o f calendar days, including nonworkdays.
State Data. Stoppages o ccu rrin g in m ore than one State a re listed separately in each State a ffected . The w ork ers and m an-days o f id leness are a lloca ted among each of the a ffected States. 3 The procedu res outlined on the preceding page have a lso been used in preparing estim ates o f id leness by State.
M etropolitan A rea Data. Inform ation is tabulated separately for the areas that c u r rently co m p rise the lis t o f standard m etropolitan areas issued by the Bureau o f the Budget in addition to a few com m unities h is to r ica lly included in the strike se r ie s b e fo re the standard m etropolitan area list was com piled . The areas to w hich the strike statistics apply are those established by the Bureau o f the Budget. Inform ation is published only fo r those areas in w hich at least five stoppages w ere record ed during the year.
Som e m etropolitan areas include counties in m ore than one State, and, hence, s ta tis t ics fo r an area m ay occa s ion a lly equal or exceed the total for the State in w hich the m a jor city is located. Stoppages in the m ining and logging industries are excluded from m etropolitan area data.
Unions Involved. Inform ation includes the union(s) d irectly participating in the d is pute, although the count o f w ork ers includes a ll who are m ade idle for one shift or longer in establishm ents d irectly involved in the dispute, including m em bers o f other unions and nonunion w ork ers .
S ou rces o f Inform ation
O ccu rren ce o f S trik es. Inform ation as to actual or probable existence o f w ork stoppages is co lle cte d from a num ber o f sou rces . Clippings on labor disputes a re obtained from a com preh ensive covera ge o f daily and w eekly new spapers throughout the country. Inform ation is re ce iv ed regu larly from the F ed era l M ediation and C onciliation S erv ice . Other sou rces o f inform ation include State boards o f m ediation and arb itration ; re se a rch d iv ision s o f State labor departm ents; lo ca l o ffice s o f State em ploym ent secu rity agen cies , channeled through the Bureau o f Em ploym ent Security o f the U .S . D epartm ent o f L abor; and trade and union jou rna ls. Som e em ployer a ssocia tion s , com pan ies, and unions a lso furnish the Bureau with w ork stoppage in form ation on a voluntary coop erative basis either as stoppages o ccu r or p er iod ica lly .
Respondents to Q uestionnaire. A questionnaire is m ailed to the parties reported as involved in w ork stoppages to obtain inform ation on the num ber o f w orkers involved, duration, m a jor issu e s , location , m ethod o f settlem ent, and other pertinent inform ation .
L im itations o f Data. Although the Bureau seeks to obtain com plete cov era ge , i. e. , a “ cen su s" o f a ll strikes involving six w orkers or m ore and lasting a fu ll shift or m o re , inform ation is undoubtedly m issing on som e of the sm aller strik es. P resu m ab ly , a llow ance fo r these m issing strikes would not substantially a ffect the figu res fo r num ber o f w ork ers and m an-days o f id len ess.
3 The same procedure is followed in allocating data on stoppages occurring in more than one industry, industry group, or metropolitan area.
Digitized for FRASER http://fraser.stlouisfed.org/ Federal Reserve Bank of St. Louis

53
In its e fforts to im prove the com pleten ess of the count o f stoppages, the Bureau has sought to develop new sou rces o f inform ation as to the probab le existence o f such stoppages. O ver the y e a rs , these sou rces have probably in creased the num ber o f strikes re cord ed , but have had little e ffect on the num ber o f w ork ers or total id len ess.
Beginning in m id -1950, a new sou rce o f strike " le a d s" was added through a c o o p erative arrangem ent with the Bureau o f Em ploym ent S ecurity o f the U. S. D epartm ent o f Labor by w hich lo ca l o ffice s o f State em ploym ent secu rity agencies supply m onthly reports on w ork stoppages com ing to their attention. It is estim ated that this in creased the number o f strikes reported in 1950 by about 5 p ercen t, and in 1951 and 1952, by approxim ately 10 p ercen t. Since m ost o f these stoppages w ere sm all, they in crea sed the num ber o f w ork ers involved and m an-days o f id len ess by le ss than 2 percent in 1950 and by less than 3 percent in 1951 and 1952. T ests o f the e ffect o f this added sou rce o f inform ation have not been m ade since 1952.
A s new lo ca l agen cies having knowledge o f the ex isten ce o f w ork stoppages are established or changes a re m ade in their co lle ction m ethods, every e ffort is m ade to e s tablish coop erative arrangem ents with them.
* U.S. GOVERNMENT PRINTING O FFICE : 1965 0 - 7 9 0 - 6 3 2
Digitized for FRASER http://fraser.stlouisfed.org/ Federal Reserve Bank of St. Louis

Digitized for FRASER http://fraser.stlouisfed.org/ Federal Reserve Bank of St. Louis

Recent Work Stoppage Studies
Analysis of Work Stoppages, 1963 (BLS Bulletin 1420, 1964), p r ice 35 cents.
Analysis of Work Stoppages, 1962 (BLS Bulletin 1381, 1963), p r ice 40 cents.
Analysis of Work Stoppages, 1961 (BLS Bulletin 1339, 1962), p r ice 35 cents.
Analysis of Work Stoppages, I960 (BLS Bulletin 1302, 1961), p r ice 30 cents.
Analysis of Work Stoppages, 1959 (BLS Bulletin 1278, I960), p r ice 40 cents.
The Dim ensions of M ajor Work Stoppages, 1947—59 (BLS Bulletin 1298, 1961), p r ice 30 cents.
National E m erg en cy Disputes Under the Labor-Management Relations (Taft-H artley) Act, 1947—62 (BLS Report 169, rev ised August 1963), free .
Work Stoppages: A ircra ft and Parts Industry, 1927—59 (BLS Report 175, 1961), free .
Work Stoppages: B as ic Steel Industry, 1901—60 (BLS Report 206, 1961), free .
Work Stoppages: Water Transportation Industry, 1927—59 (BLS Report 176, 1961), free .
Work Stoppages: Motor V ehic les and Motor Vehic le Equipment Industry, 1927—58 (BLS Report 148, 1959), free .
Work Stoppages by States, 1927—62 (BLS Report 256, 1963), free .
Work Stoppages: Contract Construction Industry, 1927—60 (BLS Report 207, 1962), free .
Work Stoppages: Meat Products Industry, 1927—60 (BLS Report 214, 1962), free .
Work Stoppages: E lec tr ica l Machinery, Equipment, and Supplies Industry, 1927—60 (BLS Report 213, 1962), free .
Work Stoppages: M etropolitan A reas, 1952—62 (BLS Report 236, rev ised May 1963), free .
Work Stoppages: Government E m ployees , 1942—61 (BLS Report 247, 1963), free .
(For a listing of other industrial relations studies, write for
A D irec tory of BLS Studies in Industrial Relations, 1954—64)
Digitized for FRASER http://fraser.stlouisfed.org/ Federal Reserve Bank of St. Louis
Related Documents


![H20youryou[2] · 2020. 9. 1. · 65 pdf pdf xml xsd jpgis pdf ( ) pdf ( ) txt pdf jmp2.0 pdf xml xsd jpgis pdf ( ) pdf pdf ( ) pdf ( ) txt pdf pdf jmp2.0 jmp2.0 pdf xml xsd](https://static.cupdf.com/doc/110x72/60af39aebf2201127e590ef7/h20youryou2-2020-9-1-65-pdf-pdf-xml-xsd-jpgis-pdf-pdf-txt-pdf-jmp20.jpg)


