Wages and Related Benefits PART II: METROPOLITAN AREAS, UNITED STATES AND REGIONAL SUMMARIES, 1964-65 Bulletin No. 1430-83 UNITED STATES DEPARTMENT OF LABOR W. Willard Wirtz, Secretary BUREAU OF LABOR STATISTICS Arthur M. Ross, Commissioner Digitized for FRASER http://fraser.stlouisfed.org/ Federal Reserve Bank of St. Louis

Welcome message from author
This document is posted to help you gain knowledge. Please leave a comment to let me know what you think about it! Share it to your friends and learn new things together.
Transcript

Wages and Related Benefits
PART II: METROPOLITAN AREAS,UNITED STATES AND REGIONAL SUMMARIES,1964-65
Bul le t in N o . 1 4 3 0 - 8 3
UNITED STATES DEPARTMENT OF LABOR W. Willard Wirtz, Secretary
BUREAU OF LABOR STATISTICS Arthur M. Ross, Commissioner
Digitized for FRASER http://fraser.stlouisfed.org/ Federal Reserve Bank of St. Louis

Digitized for FRASER http://fraser.stlouisfed.org/ Federal Reserve Bank of St. Louis

Wages and Related Benefits
PART II: METROPOLITAN AREAS, UNITED STATES AND REGIONAL SUMMARIES, 1964-65
B u l le t in N o . 1 4 3 0 - 8 3
May 1966
UNITED STATES DEPARTMENT OF LABOR bureau of labor statistics
W. Willard Wirtz, Secretary Arthur M Ross’ commissioner
For sale by the Superintendent of Documents, U .S. Government Printing Office Washington, D .C ., 20402 - Price 60 cents
Digitized for FRASER http://fraser.stlouisfed.org/ Federal Reserve Bank of St. Louis

Digitized for FRASER http://fraser.stlouisfed.org/ Federal Reserve Bank of St. Louis

Preface
The Bureau of Labor Statistics annually conducts areawide surveys in 80 Standard Metropolitan Statistical Areas. These studies provide data on occupational earnings and related supplementary benefits. A bulletin is published for each area, providing data as follows:
For each occupation— employment and the mean, median, middle range of earnings, and distributions of workers by earnings intervals, areawide and by selected industry group.
For each related ’'fringe1' benefit and supplementary wage practice studied— selective distributions of frequency of the practice and service requirements (where pertinent), by areawide and industry-group proportions of office and plant workers to whom th e benefit or practice is applicable.
A scope table— showing the number of establishments within scope of the survey, the number studied, and corresponding employment, in the area and industry groups, as defined.
An earlier consolidated bulletin summarized the results of the individual area bulletins for the surveys made during the period July 1964 to June 1965. A list of the bulletins for the areas surveyed appears on the last page of this bulletin.
The present bulletin contains information on occupational earnings, employer practices, and supplementary wage benefits for all metropolitan areas combined and by industry division within regions. Also provided are analyses of wage trends, wage dispersions, and interarea pay comparisons.
This bulletin was prepared in the Bureau's Division of Occupational Pay, Toivo P. Kanninen, Chief, under the general direction of L. R. Linsenmayer, Assistant Commissioner, Office of Wages and Industrial Relations. The analysis was prepared by Donald J. Blackmore, John E. Buckley, Kenneth J. Hoffmann, and James N. Houff, under the immediate supervision of Alexander N. Jarrell. Area studies were supervised by the Bureau*s Assistant Regional Directors for Wages and Industrial Relations.
ContentsPage
Introduction____________________________________________________________________ 1Characteristics of the 212 a reas________________________________________ 1
Occupational earnings._______________________________________________________ 3Office clerical occupations_______________________________________________ 3Professional and technical occupations_________________________________ 4Maintenance and power plant occupations_______________________________ 4Custodial and material movement occupations________________________ 4
Wage differences among metropolitan areas______________________________ 61Method of computing area pay relatives________________________________ 61Interarea comparisons ___________________________________________________ 61Movement of area pay relatives, 1961 to 1965________________________ 65
Trends of occupational earnings.___________________________________________ 69Coverage and method of computing wage trends_______________________ 70Limitations of the data___________________________________________________ 70
Wage dispersion______________________________________________________________ 75Area indexes______________________________________________________________ 75Range of regional indexes________________________________________________ 76Dispersion trends_________________________________________________________ 76
Establishment practices and supplementary wage provisions------------------ 81Late-shift pay provisions and practices in manufacturing____________ 81Scheduled weekly hours__________________________________________________ 82
Paid vacations_____________________________________________________________ 83Health, insurance, and pension plans___________________________________ 84Formal provisions for paid sick leave____________ 85
Labor-management agreement coverage___________________________________ 101
Tables:
Wage differences among metropolitan areas:1. Interarea pay comparisons_______________________________________ 66
Trends of occupational earnings:2. Percentage increases, office and plant—all
metropolitan areas______________________________________________ 733. Wage indexes, office and plant—all
metropolitan areas______________________________________________ 74
Wage dispersion:4. Dispersion of rates within occupations_________________________ 785. Dispersion of rates within occupations by region______________ 80
Hi
Digitized for FRASER http://fraser.stlouisfed.org/ Federal Reserve Bank of St. Louis

Contents— Continued
P age
T ab les— Continued
A . O ccupational earnings:A - 1. O ffice occu pation s—United States__________________ 6A - 2. O ffice occu pation s—N orth east______________________ 13A - 3. O ffice occu pation s—South___________________________ 19A -4 . O ffice occu pation s—North C entral_________________ 24A - 5. O ffice occu pation s—W est____________________________ 29A -6 . P ro fe ss io n a l and tech n ica l occupations—w om en—
United States and r e g io n s ________________________ 34A -7 . M aintenance and pow erplant occupations—
United States______________________________________ 35A - 8. M aintenance and pow erplant occu pation s—
N orth east__________________________________________ 37A -9 . M aintenance and pow erplant occu pation s—
South_______________________________________________ 39A - 10. M aintenance and pow erplant occupations—
North C entral______________________________________ 41A - 11. M aintenance and pow erplant occupations—
W est________________________________________________ 43A - 12. Custodial and m a teria l m ovem ent occu pation s—
United States______________________________________ 45A - 13. Custodial and m a teria l m ovem ent occu pation s—
N orth east__________________________________________ 48A - 14. C ustodial and m a teria l m ovem ent occu pation s—
South_______________________________________________ 51A - 15. Custodial and m a teria l m ovem ent occu pation s—
North C en tra l_____________________________________ 54A - 16. Custodial and m a teria l m ovem ent occupations—
W est________________________________________________ 57
P age
T ab les— Continued
B. E stablishm ent p ra ctice s and supplem entarywage prov is ion s :
B - 1. Shift d iffe r e n t ia ls____________________________________ 88B -2 . Scheduled w eek ly h o u r s _____________________________ 89B -3 . Paid h olidays_________ ________________________________ 90B -4 . Paid v a ca tio n s_______________________________________ 92B -5 . Health, insu ran ce, and pension p lans_____________ 97B -6 . Paid sick le a v e ______________________________________ 98
Charts:T rends o f occupational earnings:
1. Annual wage in cre a se s , 1960—65, 3 occupationalgrou p s___________________________________________________ 71
2. Wage in crea ses for o ffic e c le r ic a l and unskilledplant w o rk e rs—all industries and m anufacturing, F ebru ary 1961 to F ebru ary 1965______________________ 72
A ppendixes:A . Scope and m ethod o f su r v e y _______________________________ 103B. O ccupational em ploym ent:
Appendix table 1. P ercen t o f w ork ers in se lected occu pation s by industry d iv ision in a ll m e tr o politan areas , F ebruary 1964__________________________ 107
Appendix table 2. P ercen t o f w ork ers in se lected occupations by s ize o f establishm ent in all m etropolitan a re a s_____________________________________ 109
C. O ccupational d e scr ip tio n s__________________________________ 115
iv
Digitized for FRASER http://fraser.stlouisfed.org/ Federal Reserve Bank of St. Louis

Wages and Related Benefits—
Metropolitan Areas, United States and Regional Summaries, 1964-65
Introduction
Surveys of occupational earnings and related practices in 80 metropolitan areas were conducted by the Bureau of Labor Statistics between July 1964 and June 1965. 1 2 These studies were part of a program designed to provide detailed data for each of the individual areas* and to permit projection of these data to all 212 Standard Metropolitan Statistical Areas in the United States.3
This current publication is the second of two summary bulletins. The first summary, Wages and Related Benefits, Part I. 80 Metropolitan Areas, 1964—65 (BLS Bulletin 1430-83, 1965), incor- porated data for each of the 80 areas surveyed. This second summary offers data for all metropolitan areas combined, nationally; for four broad regions; and for six major industry divisions. Data are presented on occupational earnings, interarea differences in wages, wage trends, wage dispersions, work schedules, supplementary wage benefits, and labor-management agreement coverage.
Occupations common to a variety of manufacturing and non- manufacturing industries were studied on a communitywide basis in the selected areas. Earnings data are provided for the following types of occupations: (a) Office clerical; (b) professional and technical; (c) maintenance and power plant; and (d) custodial and material movement. Data were also collected and summarized on shift operations and differentials, paid vacations, paid holidays, and health, insurance, and pension plans.
Characteristics of the 212 Areas
The 212 metropolitan areas had a combined population of nearly 113 million in I960, or over three-fifths of the Nation1 s total.
The program also covered two nonmetropolitan areas (Boise City, Idaho, and Burlington, V t .). Data for these two areas are not included in this bulletin.
2See last page for listing of area bulletins.3As established by the Bureau of the Budget through 1961. For a detailed description of the
scope and method of survey, see appendix A.
By region, 77 of the areas were located in the South, 59 in the North Central region, 47 in the Northeast, and 29 in the West. Even though over a third of the areas were located in the South, less than a fourth of the population was in these areas. The Northeast, on the other hand, with less than a fourth of the areas, accounted for about a third of the population. In the South, the average area population was less than half of the average in the Northeast.
Regional data are greatly influenced by the larger m etropolitan areas. In the W est, Los Angeles and San Francisco account for almost half of the population. New York, Philadelphia, and Boston account for half of the population in the Northeast, and Chicago and Detroit for almost a third of the North Central population. In the South, however, the five largest areas 'combined account for only a fourth of the population.
Estimates of earnings, employer practices, and supplementary benefits in urban employment are composites representing 66, 300 establishments employing over 18.1 million workers within scope of the survey. The average size of establishment within scope of the study ranged from 209 employees in the South to 318 in the North Central region. By industry group, the average size of establishment ranged from 116 employees in wholesale trade to 410 in public utilities.
Differences in pay levels among geographic areas reflect the influence of a variety of factors, including variation in industrial com position. More than half of all workers within the scope of the survey were employed in manufacturing establishments (by region, the proportion varied from about three-fifths of the workers in the Northeast and North Central regions to slightly less than half in the South and West). Furthermore, within manufacturing, the concentration of com paratively high-wage industries (such as rubber, steel, transportation equipment, metal products, chemicals, and petroleum refining) characterizes the North Central and West.
Among nonmanufacturing industries, retail trade accounted for a larger proportion of workers in.the South than in other regions.
1
Digitized for FRASER http://fraser.stlouisfed.org/ Federal Reserve Bank of St. Louis

2
In form ation on the d istribution of total em ploym ent, as s u r veyed fo r this study, aids in interpreting the estim ates presented. The percentage d istribution of such total em ploym ent by industry d iv is ion and r e g io n 4 is shown in the tabulation below .
4For a further breakdown by industry divisions w ithin regions, see appendix A table.
Of the total em ploym ent of 18, 118,000 within scope o f the survey in all reg ion s , 33 percen t w ere in the N ortheast, 32 percent in the North C entral, 20 percen t in the South, and 15 percen t in the W est. These data, and the percen tages shown in the text tabulation below , m ay be in terpreted further. F or exam ple, 20 percent of the total em ploym ent in all m etropolitan areas was found in manufacturing in the N orth C entral reg ion (62 percen t x 32 percen t = 20 percent).
Percent distribution of total em ploym ent by region and industry division, 1964—65
A ll
metropolitan NorthIndustry division ar^as Northeast South Central West
A ll industries------------ 100 100 100 100 100
M anufacturing--------------- 54 56 46 62 46N onm anufacturing------------ 46 4 4 54 38 5 4
Public u t i l i t ie s ------------ 12 11 15 10 15W holesale tr a d e ---------- 6 5 6 5 6R etail trade---------------- 14 12 19 12 14
Finance -------------------- 8 9 8 6 9
S ervices------------------- 7 7 7 5 10
NOTE: Because of rounding, sums of individual items may not equal totals.
Digitized for FRASER http://fraser.stlouisfed.org/ Federal Reserve Bank of St. Louis

Occupational Earnings
O ccupational earnings data a re presen ted in this bulletin fo r a ll industries com bined , m anufacturing, nonm anufacturing, and fo r the fiv e nonm anufacturing industry d iv is ion s studied. N um bers o f w o rk e rs , m eans, m ed ian s, m iddle ranges, and d istribu tions o f w ork ers by earnings a re presen ted , by industry d iv is ion , fo r the United States, and four broad Census reg ion s.
The earnings data follow ing the job titles are fo r a ll industr ie s com bined . The om iss ion o f an occupation , o r an industry d iv is ion within an occu pation , indicates that either no w ork ers w ere found in that group , o r not enough w ork ers w ere rep orted to provide a re liab le estim ate.
The averages and d istributions w ere com piled by com bining varying pay le v e ls from establishm ents in m any d ifferen t industries and areas having w idely d ivergent pay le v e ls .5 No attem pt is m ade to iso la te a ll o f the fa c to rs w hich a ffe ct the lev e ls o f earn ings, but the tables p rov ide in form ation on d iffe re n ce s in occupational earnings by industry d iv is ion , reg ion , and sex.
O ffice C le r ic a l O ccupations
Nationwide, average w eekly sa la rie s o f w om en se c re ta r ie s em ployed in m etropolitan areas exceeded $100 fo r the fir s t tim e, reaching a new high o f $102. 50 in F ebru ary 1965. A fourth o f the ov er 200,000 se c re ta r ie s within scope o f this study earned less than $89 a w eek and a fourth earned m o re than $116. C lass B typists and general stenograph ers, n u m erica lly the next m ost im portant o ffic e jobs studied, averaged $68 and $81. 50, re sp e ctiv e ly . The m ost populous job s fo r m en w ere c la s s A accounting c le rk s , with an average o f $116 .50 , and o ff ic e boys with an average o f $66.
On a nationwide and reg ion a l b a s is , a ll-in d u stry averages fo r m en exceeded those fo r w om en in each o f the o ffic e c le r ic a l job s fo r w hich data w ere published fo r both m en and w om en. H ow ever, nationally, within industry d iv is ion s , o f f ic e g ir ls em ployed in m anufacturing and w om en tabulating-m achine op era tors (c la ss C) in re ta il trade earned slightly h igher sa la ries than did their m ale counterparts.
It should not be assu m ed that d iffe re n ce s in average pay lev e ls fo r m en and w om en re fle c t d iffe re n ce s in pay treatm ent o f the sexes within individual establishm ents. Industries and establishm ents d iffer in pay lev e ls and job staffing, thus contributing d ifferen tly to
An analysis o f pay relatives o f office cler ic a l, skilled m aintenance, and unskilled plant workers in 8 0 areas is presented on pp. 6 1 —66.
the estim ates fo r each job (and s e x ) .6 Even within establishm ents, d iffe ren ces m ay o c cu r becau se o f v a ria n ces in p ro g re ss io n within established rate ranges and d iffe ren ces in sp ecific duties p e r form ed , although the w ork ers are appropria te ly c la s s ifie d within the sam e m ore g en era lized su rvey job d escr ip tion .
C onsidering the n early consistent pattern o f higher nationwide averages fo r m en within industry d iv is ion s , and the m agnitude o f these pay d iffe re n ce s , the explanation undoubtedly involves a com bination o f fa c to rs . An e a r lie r study indicated that, on an area b a s is , d if fe r en ces between m en 's and w om en 1 s earnings w ere grea tly reduced when com p a rison s w ere d irected to establishm ents em ploying both sexes in the job s studied. 7
A vera ge w eekly sa la ries o f o ffic e w ork ers tended to be higher in m anufacturing than in the total nonm anufacturing group, and higher in the W est than in the three other reg ion s. Am ong the six industry d iv is ion s included in the survey , o ffic e c le r ic a l job averages w ere highest in public u tilitie s , fo llow ed next by m anufacturing. The fo llo w ing tabulation presen ts pay lev e ls o f o ffic e c le r ic a l w ork ers in each o f the six industry d iv is ion s by reg ion . T h ese lev e ls are ex p ressed as a percen tage o f national a ll-in d u stry pay le v e ls . 8
______ Office clerica l worker pay lev els_____
(Percent of nationwide all-industry average)
A ll
metropolitan North
areas Northeast South Central West
A ll industries-------- -------- 1 00 9 9 9 3 101 107
M anufacturing------------............. 105 103 100 106 113Nonmanufacturing-------- 9 7 98 91 9 7 104
Public u t i l i t ie s -------- -------- 109 110 104 111 115W holesale trade--------............. 1 00 102 9 3 100 107R etail trade------------- .......... 9 0 9 0 8 4 91 99Finance -----------------............ 91 93 8 4 91 9 7
S erv ices---------------- 99 93 96 108
6 See data on occupational em ploym ent by industry division and size of establishm ent in appendix B, pp. 1 0 7 - 1 1 3 .
7 "Differences in Pay Rates for Men and W om en," Wages and R elated Benefits, 2 0 Labor
Markets. 195 8 - 5 9 (BLS Bulletin 1 2 4 0 - 2 2 , 1 959 ), now out o f print.
8 Based on aggregates obtained by m ultiplying occupational averages for 19 office jobs by the nationwide em ploym ent in each job.
3
Digitized for FRASER http://fraser.stlouisfed.org/ Federal Reserve Bank of St. Louis
4
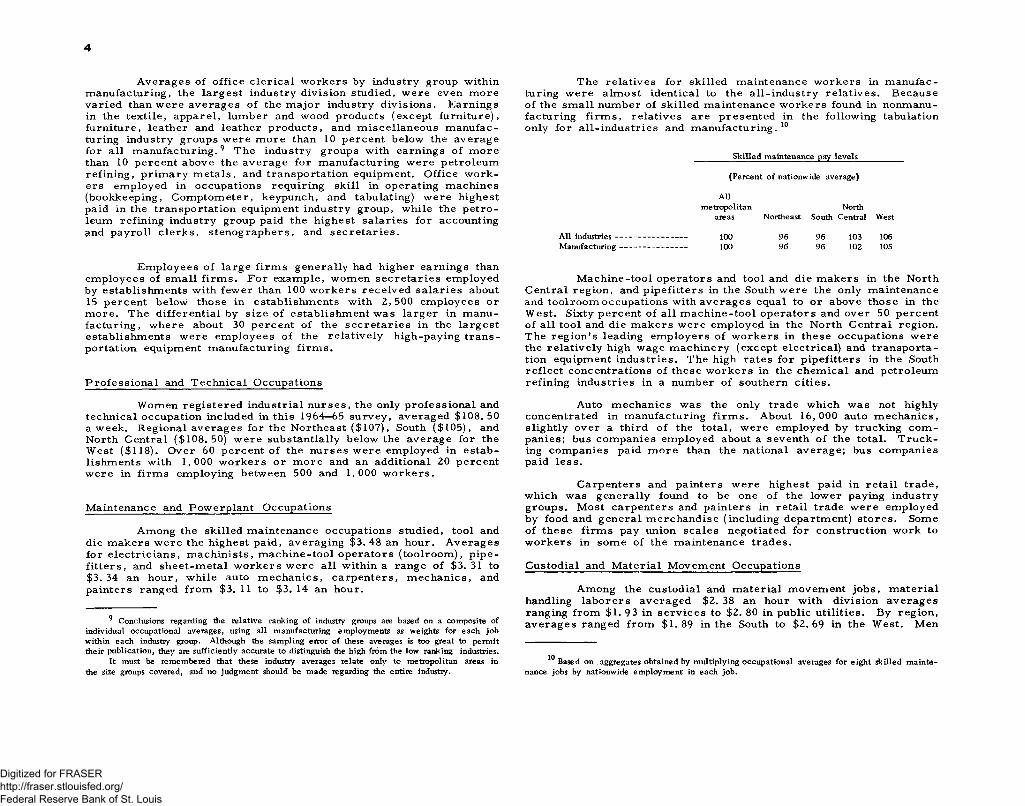
A vera ges o f o ffic e c le r ic a l w ork ers by industry group within m anufacturing, the la rg est industry d iv ision studied, w ere even m ore v aried than w ere averages o f the m a jor industry d iv is ion s . Earnings in the textile , apparel, lum ber and w ood products (except furn iture), furn iture, leather and leather p rod u cts , and m isce lla n eou s m anufacturing industry groups w ere m o re than 10 p ercen t below the average fo r a ll m anu factu ring .9 The industry groups with earnings o f m ore than 10 p ercen t above the average fo r m anufacturing w ere petroleu m refin ing, p r im a ry m e ta ls , and transportation equipm ent. O ffice w o rk ers em ployed in occupations requiring sk ill in operating m achines (bookkeeping, C om ptom eter, keypunch, and tabulating) w ere highest paid in the transportation equipm ent industry group, w hile the p e tro leum refining industry group paid the highest sa la ries fo r accounting and p a y ro ll c le rk s , sten ograph ers , and se c re ta r ie s .
E m ployees o f la rge firm s genera lly had higher earnings than em ployees o f sm all f irm s . F or exam ple, w om en se c re ta r ie s em ployed by establishm ents with few er than 100 w ork ers re ce iv e d sa la ries about 15 percen t below those in establishm ents with 2, 500 em ployees o r m o re . The d ifferen tia l by size o f establishm ent w as la rger in m anufacturing , w here about 30 percen t o f the se c re ta r ie s in the la rg est establishm ents w ere em ployees o f the re la tive ly high-paying tra n sportation equipm ent m anufacturing firm s .
P ro fe ss io n a l and T ech n ica l O ccupations
W om en re g is te re d industria l n u rses , the only p ro fe ss io n a l and tech n ica l occupation included in this 1964—65 survey , averaged $108. 50 a w eek. R egional averages fo r the N ortheast ($107), South ($105), and North C entral ($108. 50) w ere substantially below the average fo r the W est ($118). O ver 60 percen t o f the n urses w ere em ployed in estab lishm ents with 1,000 w ork ers o r m ore and an additional 20 percen t w ere in firm s em ploying between 500 and 1,000 w ork ers .
M aintenance and P ow erplant O ccupations
Am ong the sk illed m aintenance occupations studied, too l and die m akers w ere the highest paid, averaging $3 .48 an hour. A v era ges fo r e le c tr ic ia n s , m a ch in ists , m a ch in e -too l op era tors (too lroom ), p ip e fit te rs , and sh eet-m eta l w ork ers w ere a ll within a range o f $3. 31 to $3. 34 an hour, w hile auto m ech a n ics , carp en ters , m ech an ics , and painters ranged fro m $3. 11 to $3. 14 an hour.
9 Conclusions regarding the relative ranking of industry groups are based on a com posite of
individual occupational averages, using all manufacturing em ploym ents as weights for each job
within each industry group. Although the sam pling error of these averages is too great to perm it
their publication, they are sufficiently accurate to distinguish the high from the low ranking industries.
It must be remembered that these industry averages relate only to m etropolitan areas in
the size groups covered, and no judgm ent should be made regarding the entire industry.
The re la tives fo r sk illed m aintenance w ork ers in m anufacturing w ere a lm ost identica l to the a ll-in d u stry re la tives . B ecause o f the sm all num ber o f sk illed m aintenance w ork ers found in nonmanufacturing firm s , re la tives are p resen ted in the follow ing tabulation only fo r a ll-in d u str ies and m anufacturing. 10
S killed m aintenance pay le v els
(Percent o f nationwide average)
A ll
metropolitan
areas Northeast South
North
Central West
A ll industries------------ ............ 100 9 6 9 6 103 106M anufacturing------------------- 100 96 9 6 102 105
M ach in e-too l op era tors and too l and die m akers in the North Central reg ion , and p ip efitters in the South w ere the only m aintenance and to o lro o m occupations with averages equal to o r above those in the W est. Sixty percen t o f a ll m a ch in e -too l op era tors and ov er 50 percen t o f a ll too l and die m akers w ere em ployed in the North C entral region . The re g io n 's leading em p loyers o f w ork ers in these occupations w ere the re la tive ly high w age m ach in ery (except e le c tr ica l) and tran sp orta tion equipm ent industries . The high rates fo r p ip efitters in the South re fle ct concentration s o f these w ork ers in the ch em ica l and petroleum refining industries in a num ber o f southern c itie s .
Auto m ech an ics was the only trade w hich w as not highly concentrated in m anufacturing firm s . About 16,000 auto m ech an ics , slightly over a third o f the total, w ere em ployed by trucking c o m panies; bus com panies em ployed about a seventh o f the total. T ru ck ing com panies paid m o re than the national average; bus com panies paid le s s .
C arpenters and painters w ere highest paid in re ta il trade, w hich was gen era lly found to be one o f the low er paying industry groups. M ost carpen ters and painters in re ta il trade w ere em ployed by food and g en era l m erchandise (including departm ent) s tores . Some o f these firm s pay union sca les negotiated for con struction w ork to w ork ers in som e o f the m aintenance trades.
Custodial and M ateria l M ovem ent O ccupations
Am ong the custod ia l and m ateria l m ovem ent jo b s , m ateria l handling la b o re rs averaged $2. 38 an hour with d iv is ion averages ranging from $1. 93 in se rv ice s to $2. 80 in public u tilities . By reg ion , averages ranged from $1. 89 in the South to $2. 69 in the W est. Men
Based on aggregates obtained by m ultiplying occupational averages for eigh t skilled m ainte
nance jobs by nationwide em ploym ent in each job.
Digitized for FRASER http://fraser.stlouisfed.org/ Federal Reserve Bank of St. Louis

ja n ito rs , the m a jor custod ia l occupation , averaged $1 .97 with d iv ision averages ranging from $1. 56 in re ta il trade to $2. 20 in m anufacturing, and reg ion a l averages ranging from $1. 54 in the South to $2. 16 in the W est.
Understanding the industrial com p os ition o f an average often c la r if ie s what seem to be unusual relationsh ips to other occupational a v erag es . The a ll-in d u str ies average fo r w om en jan itors ($1. 67) was 30 cents below the average fo r m en ($ 1 .9 7 ). P art o f the d ifferen ce is traceab le to a la rg er proportion o f m en than w om en em ployed in the higher paying m anufacturing d iv is ion . C alcu lations based on an a s sumption that m en and w om en w ere distributed s im ila r ly among m a jor industry d iv isions w ould elim inate 10 cents o f the d iffe ren ce . An analysis o f re lationsh ips o f job averages within establishm ents in d icated that the w age advantage favoring m en ja n itors w as greatly reduced when exam ined on a p lan t-by -p lan t ba s is . 11
Pay leve ls fo r unskilled w ork ers by reg ion and industry d iv ision are exp ressed as p ercen ta ges o f national pay lev e ls in the follow ing tabulation :12
11 "Occupational Wage Relationships in M etropolitan Areas, 1961—6 2 ," Monthly Labor R eview ,
D ecem ber 1963, pp. 1 4 2 6 - 1 4 3 1 .
Based on aggregates obtained by m ultiplying occupation averages for men janitors and
m aterial handling laborers by nationwide em ploym ent in each job.
5
________Unskilled woiker pay lev els_________
(Percent o f nationwide all-industry average)
A ll
m etropolitan North
areas Northeast South Central West
A ll in d u stries--------- ------ 1 00 103 79 107 112
M anufacturing------------- ------ 103 103 86 110 114Nonmanufacturing--------- ------ 98 103 74 102 111
Public u t i l i t ie s --------- ------ 115 118 9 7 119 122W holesale tr a d e -------- ------ 93 98 71 102 112R etail trade------------- ------ 86 87 69 90 102Finance ----------------- ( i ) o t 1) (») C1)S erv ices----------------- ------ 8 4 t o t o t o (1 )
* Data do not m eet publication criteria.
F or each industry d iv ision for w hich data w ere availab le , pay lev e ls w ere highest in the W est and low est in the South. Pay lev e ls w ere h ighest in the public u tilities industry d iv is ion and low est in re ta il trade fo r each region . C om parisons based on average rates for m en and w om en jan itors suggest that pay lev e ls for unskilled w ork ers in the finance and se rv ice s d iv isions exceed those in re ta il trade; nationw ide, m ateria l handling la b orers had a low er average in se rv ice s than in re ta il trade.
Digitized for FRASER http://fraser.stlouisfed.org/ Federal Reserve Bank of St. Louis

6
A. Occupational Earnings
Table A-l. Office Occupations—United States
(A v e ra g e s tra ig h t-t im e w eek ly h ou rs and earn in gs fo r s e le c te d occu p a tio n s by in du stry d iv is io nin a ll m etro p o lita n a re a s , F e b ru a ry 1965 r)
S e x , o c c u p a t io n , an d in d u s t r y d iv is io n
MEN
B ILLE RS, MACHINE (BILLINGM A C H IN E !----------------------------------------------------
NONMANUFACTURING-------------------------------PUBLIC U T IL IT IE S 4---------------------------
BOOKKEEPING-MACHINE OPERATORS,CLASS A -------------------------------------------------------
NONMANUFACTURING -------------------------------FINANCE5----------------------------------------------
BOOKKEEPING-MACHINE OPERATORS,
NONMANUFACTURING--------------------------------FINANCE5----------------------------------------------
CLERKS, ACCOUNTING, CLASS A --------------MANUFACTURING --------------------------------------NONMANUFACTURING --------------------------------
PUBLIC U T IL IT IE S 4---------------------------WHOLESALE TRADE -----------------------------RETAIL TRADE ------------------------------------FINANCE 5----------------------------------------------S E R V IC E S --------------------------------------------
CLERKS, ACCOUNTING, CLASS B --------------MANUFACTURING--------------------------------------NONMANUFACTURING -------------------------------
PUBLIC U T IL IT IE S 4---------------------------WHOLESALE TRAD E-----------------------------RETAIL TRADE-----------------------------------FINANCE5----------------------------------------------S E R V IC E S --------------------------------------------
CLERKS, F IL E , CLASS A ---------------------------MANUFACTURING--------------------------------------NONMANUFACTURING -------------------------------
PUBLIC U T IL IT IE S 4---------------------------
CLERKS, F IL E , CLASS B ---------------------------MANUFACTURING--------------------------------------NONMANUFACTURING --------------------------------
PUBLIC U T IL IT IE S 4 ---------------------------F INANCE 5----------------------------------------------
CLERKS, F IL E , CLASS C ---------------------------NONMANUFACTURING-------------------------------
FINANCE5----------------------------------------------
CLERKS, O RO ER--------------------------------------------MANUFACTURING--------------------------------------NONMANUFACTURING-------------------------------
WHOLESALE TRADE -----------------------------RETAIL TRADE------------------------------------
CLERKS, PAYRO LL----------------------------------------MANUFACTURING--------------------------------------NONMANUFACTURING --------------------------------
PUBLIC U T IL IT IE S4 ---------------------------WHOLESALE TRADE -----------------------------
N u m b er of w o r k e r s r e c e iv in g s t r a ig h t - t im e w e e k ly e a r n in g s of—
N um b erof
A v e ra g e $ $ $ $ $ $ $ $ $ $ $ $ $ t $ %w e e k lyh o u rs2
(s ta n d a rd
U n d er 4 0 50 6 0 70 80 9 0 1 0 0 110 1 2 0 1 30 1 40 1 5 0 1 60 1 70 1 8 0 1 90w o rkers M e a n 3 M e d ia n 3 M id d le ra n g e 3 $
4 0and
u n d e r - - - - - - - - - - - - - - and
5 0 6 0 70 80 9 0 1 0 0 1 1 0 1 20 1 30 1 40 1 5 0 1 6 0 1 7 0 180 1 9 0 ovex
$ $ $ $1 ,2 8 9 3 9 .5 1 0 0 .5 0 1 0 5 .5 0 9 0 .0 0 - 1 1 4 .5 0 - - 3 6 8 90 1 6 5 172 3 2 5 4 1 2 5 0 2 2 1 - - - -1 ,1 5 6 3 9 .5 1 0 2 .0 0 1 0 7 .0 0 9 2 .5 0 - 1 1 5 .5 0 - — 3 4 0 71 1 41 1 3 7 3 1 3 3 9 8 5 0 - 2 1 - - - -
927 4 0 .0 1 0 4 .0 0 1 0 8 .5 0 9 4 . 5 0 - 1 1 6 . 0 0 ~ 17 54 1 2 7 91 2 11 3 8 4 4 0 2 1 ~ — “
6 9 4 3 9 .5 9 8 .0 0 1 0 1 .0 0 8 5 .5 0 - 1 1 2 .5 0 _ _ 1 45 6 2 1 20 98 1 53 1 73 2 0 19 4 1 _ _ _ _52 3 3 9 .5 9 6 .0 0 9 9 .0 0 8 3 .5 0 - 1 1 1 .5 0 - - 1 3 8 6 2 100 6 9 1 0 3 1 2 5 10 9 4 1 - - - -
2 6 8 3 8 .5 9 6 .0 0 1 0 2 .0 0 8 1 .5 0 - 1 1 2 .0 0 ~ ~ 1 11 52 41 9 6 7 70 8 8 ~ “ ~
9 55 3 9 .0 7 8 .0 0 7 5 .0 0 6 6 . 0 0 - 8 7 .5 0 _ 87 2 5 8 1 88 2 3 2 57 92 37 1 3 _ _ _ _ _774 3 9 .0 7 6 .5 0 7 3 .5 0 6 5 . 0 0 - 8 6 .0 0 - - 72 2 3 7 1 4 4 1 81 47 60 34 - - - - - - - -2 9 8 3 8 .5 6 9 .5 0 6 7 .5 0 6 2 . 0 0 - 7 6 .0 0 4 7 1 36 55 4 2 12 5 - -
2 6 ,0 4 6 3 9 .0 1 1 6 .5 0 1 1 6 .0 0 1 0 1 .5 0 - 1 3 0 .0 0 - _ 3 65 6 25 1 7 2 6 3 3 3 9 4 5 7 1 4 8 8 4 4 3 1 7 3 2 3 1 1 56 5 9 2 7 5 1 7 136 1 0 8 3 41 2 ,8 4 1 3 9 .5 1 2 1 .0 0 1 2 1 .5 0 1 0 5 .5 0 - 1 3 5 .5 0 - - - 9 2 0 0 6 0 4 1 2 7 9 1 8 9 1 2 0 7 2 2 4 7 0 2 0 5 9 1 0 1 2 6 9 4 3 75 96 69 151 3 ,2 0 5 3 9 .0 1 1 1 .5 0 1 1 1 .0 0 9 8 .5 0 - 1 2 4 .0 0 - - 3 56 4 2 5 1 12 3 2 0 6 0 2 6 8 1 2 8 1 1 1 8 4 7 117 2 5 5 4 2 3 3 142 4 0 4 0 19
4 ,4 3 6 3 9 .5 1 1 6 .5 0 1 1 6 .5 0 1 0 6 .5 0 - 1 2 7 .5 0 - - - - 83 2 48 3 35 7 7 5 1 2 8 1 7 85 5 10 2 7 1 8 8 35 22 5 —3 ,6 9 5 3 9 . 0 1 1 2 .5 0 1 1 0 .5 0 9 7 .0 0 - 1 2 7 .0 0 - - - 1 1 6 0 2 51 726 6 88 6 0 0 4 6 3 4 0 7 2 0 0 1 03 6 4 6 15 121 ,1 3 4 3 9 .5 1 0 6 .5 0 1 0 5 .5 0 9 7 .0 0 - 1 1 9 .0 0 - - 3 3 31 1 1 4 2 2 5 2 8 2 2 2 3 1 9 0 41 12 9 1 1 l 12 ,7 5 1 3 7 .5 1 0 3 .5 0 1 0 3 .0 0 9 1 .5 0 - 1 1 5 .5 0 - - - 41 1 3 6 4 3 4 5 48 6 7 1 4 33 2 9 2 125 4 3 3 25 1 - -
1 ,1 8 9 3 8 .0 1 1 2 .5 0 1 1 0 .0 0 9 9 .0 0 - 1 2 2 .0 0 - 10 14 77 2 2 7 2 6 6 2 7 6 1 1 9 90 29 31 17 10 19 6
1 5 ,1 2 0 3 9 .0 9 3 .0 0 9 2 .5 0 7 9 .5 0 - 1 0 7 .0 0 _ 15 2 2 9 1 3 4 6 2 3 4 9 3 0 1 0 2 4 8 9 2 6 5 2 1 7 3 3 7 8 8 382 87 38 2 _ _ _
5 ,4 8 7 3 9 .5 9 7 .0 0 9 7 .0 0 8 2 .5 0 - 1 1 0 .5 0 - 1 34 3 5 0 7 1 7 9 8 9 9 12 1 0 6 6 6 7 6 5 0 5 147 55 3 4 2 - - -
9 ,6 3 4 3 9 .0 9 1 .0 0 9 0 .0 0 7 7 .0 0 - 1 0 4 .5 0 - 14 1 9 6 9 9 6 1 6 3 2 2 02 1 1 5 7 8 1 5 8 6 10 57 2 83 235 32 4 - - - —
3 ,2 6 5 3 9 .5 1 0 1 .5 0 1 0 3 .5 0 9 0 .0 0 - 1 1 3 .0 0 - - 21 1 55 2 9 6 3 4 5 4 6 4 9 5 4 6 21 197 200 10 2 - - - -
2 ,9 2 3 3 9 .0 9 1 .0 0 8 9 .5 0 7 9 .5 0 - 1 0 3 .0 0 - - 28 2 53 4 8 9 712 580 4 3 5 2 96 7 5 35 2 0 - - - - -5 1 7 3 9 .5 8 1 .0 0 8 1 .5 0 7 1 . 0 0 - 9 1 .0 0 - 3 16 92 1 1 6 1 4 8 93 19 30 1 - - - - - - -
2 ,3 2 7 3 7 .0 8 0 .0 0 7 9 .5 0 7 0 . 0 0 - 8 9 .0 0 - - 1 09 4 54 6 1 7 6 0 6 3 2 4 1 2 1 92 4 - - - - - - -
6 02 3 8 .0 8 4 .5 0 8 6 .0 0 7 5 . 5 0 - 9 3 .5 0 11 22 41 1 1 4 2 1 0 1 1 9 5 8 18 6 - 2 2
855 3 9 . 0 1 0 3 .0 0 1 0 1 .5 0 8 7 .0 0 - 1 1 5 .0 0 - - - 29 121 1 02 1 5 8 1 46 1 42 6 7 35 24 18 2 13 _ _
2 7 5 3 9 .5 1 1 3 .0 0 1 0 7 .5 0 - 9 2 .0 0 - 1 3 3 .5 0 - - - - 9 51 4 5 4 6 38 17 17 20 18 2 13 - -
5 8 0 3 9 .0 9 8 .5 0 9 9 .0 0 8 1 . 5 0 - 1 1 2 .5 0 - - - 29 112 51 112 100 1 04 50 19 4 - - - - -
3 1 0 3 9 .5 1 1 0 .0 0 1 1 1 .0 0 1 0 3 .0 0 - 1 1 9 .0 0 12 7 4 34 8 4 98 4 8 19 4 - - - -
1 ,4 9 5 3 8 .5 8 0 .0 0 7 8 .5 0 6 7 . 0 0 - 9 3 .0 0 _ 4 2 1 4 2 45 3 2 4 2 4 4 2 5 0 1 4 1 50 23 i _ _ _ _ _ _
521 3 9 .0 8 4 .0 0 8 1 .0 0 7 2 . 5 0 - 9 4 .0 0 - - 1 4 6 9 1 67 1 0 5 77 4 5 23 21 _ _ _ - _ _ -
975 3 8 .5 7 8 .0 0 7 6 .5 0 6 3 . 0 0 - 9 2 .5 0 - 4 201 1 7 6 1 5 7 1 3 9 1 73 95 27 2 1 - - - - - -
3 57 3 9 .5 9 3 .0 0 9 5 .0 0 8 7 .0 0 - 1 0 2 .0 0 - - 12 23 32 50 1 1 7 9 3 27 2 1 - - - - - -3 54 3 8 .0 6 3 .5 0 6 0 .0 0 5 6 . 0 0 - 7 1 .0 0 4 1 75 80 6 2 2 6 6 “ " - - - -
7 1 4 3 8 .0 6 8 .0 0 6 3 .5 0 5 8 .0 0 - 7 5 .0 0 - 23 2 1 9 2 52 63 6 9 57 2 4 6 _ _ _ _ _ _ _ _5 6 9 3 8 .0 6 5 .5 0 6 2 .0 0 5 7 . 0 0 - 6 9 .0 0 - 2 3 2 1 0 2 0 6 36 25 4 0 22 6 - - - - - - - -3 24 3 7 .5 5 8 .5 0 5 9 .0 0 5 6 . 0 0 - 6 2 .5 0 21 1 69 1 22 10 1 - - - - -
1 8 ,4 0 2 3 9 .5 1 0 6 .5 0 1 0 5 .0 0 9 1 .0 0 - 1 2 2 .5 0 - - 1 93 5 68 1 3 2 2 2 2 0 0 3 0 8 6 3 0 6 6 2 8 0 0 2 2 1 5 1 57 3 8 08 2 9 5 141 1 09 20 76 ,6 6 7 3 9 .5 1 1 1 .5 0 1 1 0 .5 0 9 4 .0 0 - 1 2 8 .5 0 - - 35 98 3 79 7 5 0 1 0 3 2 1 0 1 3 8 6 4 1008 709 4 2 8 172 1 05 66 8 2
1 1 ,7 3 5 3 9 .5 1 0 4 .0 0 1 0 3 .0 0 8 9 .5 0 - 1 1 8 .5 0 - - 1 58 471 9 43 1 45 1 2 0 5 4 2 0 5 4 1 9 3 5 1 2 0 6 8 64 3 8 0 1 23 36 43 12 51 0 ,8 4 3 3 9 .5 1 0 4 .5 0 1 0 3 .5 0 9 0 .0 0 - 1 1 9 .0 0 - - 1 47 3 58 8 2 6 1 3 5 2 1 8 6 1 1 9 1 4 1 8 5 1 1 1 3 5 823 3 6 9 1 13 3 4 4 3 12 5
6 8 3 4 0 .0 9 4 .5 0 9 5 .5 0 7 6 .0 0 - 1 0 7 .5 0 - 9 105 96 7 0 141 1 12 38 62 30 11 10 - - -
5 , 033 3 9 .5 1 0 9 .5 0 1 0 9 .5 0 9 5 .0 0 - 1 2 4 .0 0 _ _ 11 9 5 3 07 592 6 42 9 1 5 8 32 711 4 7 9 3 0 3 81 4 9 10 4 23 ,1 6 4 3 9 .5 1 1 1 .5 0 1 1 0 .5 0 9 6 .0 0 - 1 2 8 .0 0 - - 6 65 1 72 341 4 0 6 5 6 9 4 1 8 4 6 4 375 2 2 7 6 7 4 3 10 3 -
1 ,8 6 9 3 9 .0 1 0 6 .5 0 1 0 8 .5 0 9 2 . 5 0 - 1 1 9 .5 0 - - 5 31 1 36 2 5 1 2 3 6 3 4 6 4 1 4 2 4 8 10 3 77 14 6 - 1 21 ,0 9 3 3 9 .5 1 0 9 .0 0 1 1 1 .5 0 1 0 0 .0 0 - 1 1 9 .5 0 - - - 9 4 9 1 1 8 95 2 2 0 351 1 43 6 6 38 4 - — 1 -
2 75 3 9 .0 1 0 3 .0 0 1 0 4 .5 0 8 9 .0 0 - 1 2 1 .0 0 - - - - 38 3 7 46 4 6 29 6 9 7 2 - 1 - - -
See foo tn otes at end o f tab le .
Digitized for FRASER http://fraser.stlouisfed.org/ Federal Reserve Bank of St. Louis
7
Table A-l. Office Occupations—United States---- Continued
(A v e ra g e s tra ig h t-t im e w eek ly h ou rs and ea rn in gs fo r s e le c te d occu p a tion s b y in du stry d iv is io n.in a ll m etro p o lita n a re a s , F e b ru a ry 1965 r)
Number of workers receiving straight-time weekly earnings of—$ $ $ $ $ $ $ $ $ $ $ $ $ $ * $Number 4 0 50 6 0 70 80 90 1 0 0 1 1 0 1 2 0 1 30 140 1 5 0 160 1 70 1 80 1 90
S e x , o c c u p a t io n , an d in d u s t r y d iv is io n ofworkers (standard Mean3 Median3 Middle range 3
4 0and
u n d e r - - - - - - - - - - - - - - and
5 0 60 70 80 90 1 0 0 110 120 1 3 0 140 150 1 60 170 180 1 90 o v e r
MEN - CONTINUED $ $ $ $COMPTOMETER OPERATORS --------------------------- 3 0 6 4 0 .0 1 0 2 .5 0 1 0 0 .0 0 8 5 .0 0 - 1 1 6 .5 0 - - 3 36 15 59 4 0 52 31 3 19 4 8 - - - - •
DUPLICATING-MACHINE OPERATORS(MIMEOGRAPH OR DITTO1 ------------------------- 1 ,0 7 5 3 8 .0 7 8 .0 0 7 5 .0 0 6 7 . 5 0 - 9 1 .0 0 - 7 98 2 46 2 86 1 5 7 185 71 25 1 - - - - - - -
MANUFACTURING-------------------------------------- 3 92 3 9 .0 8 2 .5 0 8 3 .0 0 7 0 . 0 0 - 9 5 .5 0 - - 14 82 78 75 1 04 29 9 - - - - - - - -NONMANUFACTURING------------------------------- 683 3 7 .5 7 5 .5 0 7 3 .0 0 6 6 . 5 0 - 8 4 .0 0 " 7 84 1 64 2 0 8 82 81 42 16 1 - - - - - - -
KEYPUNCH OPERATORS* CLASS A -------------- 511 3 9 .5 9 7 .5 0 9 9 .0 0 8 7 .0 0 - 1 1 0 .0 0 _ _ 7 18 50 71 121 115 116 7 6 - - - - - -NONMANUFACTURING------------------------------- 315 3 9 .5 9 8 .5 0 1 0 3 .0 0 9 0 .0 0 - 1 1 1 .0 0 - - 3 17 34 25 59 88 87 4 - “ “ ~
KEYPUNCH OPERATORS, CLASS B -------------- 5 74 3 9 .0 8 9 .0 0 9 5 .0 0 7 7 .5 0 - 1 0 3 .0 0 _ _ 31 66 61 1 0 4 95 2 02 15 - - - - - - - -NONMANUFACTURING------------------------------- 4 61 3 9 .0 9 0 .5 0 9 8 .0 0 8 0 .0 0 - 1 0 3 .5 0 - - 31 4 8 35 71 73 1 92 12 - - - - - - - -
PUBLIC U T IL IT IE S 4--------------------------- 276 3 9 .5 1 0 1 .5 0 1 0 2 .0 0 9 8 .0 0 - 1 0 5 .0 0 - - 7 17 6 4 1 75 12 - - “ - -
OFFICE BOYS ------------------------------------------------ 2 0 ,6 6 9 3 8 .0 6 6 .0 0 6 4 .0 0 5 7 . 0 0 - 7 3 .0 0 1 5 7 6 7 0 0 5 6 6 9 9 3 2 6 1 1 5 8 7 1 08 1 3 6 6 78 13 _ - - - - - -MANUFACTURING------------------------------------- 6 ,9 4 1 3 8 .5 6 8 .0 0 6 5 .5 0 5 9 . 0 0 - 7 5 .5 0 - 59 1 9 1 9 2 4 9 3 1 2 4 9 6 4 6 4 35 73 63 4 - - - - - - -NONMANUFACTURING------------------------------- 1 3 , 7 28 3 8 .0 6 5 .5 0 6 2 .5 0 5 6 . 5 0 - 7 2 .0 0 1 5 18 5 0 8 6 4 2 0 6 2 0 1 2 942 6 47 2 9 3 15 9 - - - - - - -
PUBLIC U T IL IT IE S 4--------------------------- 2 , 5 1 9 3 9 .0 7 6 .0 0 7 2 .0 0 6 1 . 5 0 - 9 1 .5 0 - 13 530 6 1 8 311 3 31 4 2 7 2 7 1 13 6 - - - - - - -WHOLESALE TRADE ----------------------------- 1 , 755 3 8 .5 6 5 .0 0 6 4 .0 0 5 7 . 0 0 - 7 2 .5 0 - 12 6 1 9 5 9 7 3 24 1 2 8 66 7 2 1 - - - - - - -RETAIL TRAD E----------------------------------- 7 02 3 8 .0 6 2 .5 0 6 0 .5 0 5 6 . 0 0 - 7 0 .0 0 - 26 315 183 131 2 7 15 6 - - - - - - - - -FINANCE5---------------------------------------------- 6 ,2 6 5 3 7 .5 6 1 .5 0 6 0 .0 0 5 5 . 0 0 - 6 7 .0 0 - 3 8 1 2 7 3 4 2 0 7 5 801 1 84 91 - - - - - - - - - -S E R V IC E S ------------------------------------------- 2 ,4 8 7 3 7 .5 6 5 .5 0 6 3 .5 0 5 7 . 0 0 - 7 3 .0 0 1 86 8 89 733 4 46 2 73 4 8 9 - 2 “ “ ~ - ”
SE C R E TA R IE S------------------------------------------------ 1 ,4 0 4 3 9 .5 1 1 9 .5 0 1 2 0 .0 0 1 0 6 .0 0 - 1 3 3 .0 0 _ _ _ 33 34 57 1 20 1 7 8 286 2 6 9 2 35 87 4 6 30 15 7 7MANUFACTURING------------------------------------- 4 0 7 3 9 .0 1 2 1 .0 0 1 1 9 .5 0 1 0 3 .0 0 - 1 3 6 .0 0 - - - - 18 30 4 3 52 67 6 0 67 26 9 1 7 9 6 5NONMANUFACTURING------------------------------- 997 3 9 .5 1 1 8 .5 0 1 2 0 .0 0 1 0 7 .5 0 - 1 3 2 .0 0 - - - 33 16 27 77 1 28 2 1 9 2 1 0 168 62 3 7 13 6 1 2
PUBLIC U T IL IT IE S 4--------------------------- 7 5 0 4 0 .0 1 2 5 .0 0 1 2 4 .5 0 1 1 5 .0 0 - 1 3 4 .0 0 - - 3 10 23 7 4 179 189 161 61 29 13 5 1 2
STENOGRAPHERS, GENERAL------------------------ 7 3 9 3 9 .5 1 0 3 .5 0 1 0 5 .5 0 1 0 0 .0 0 - 1 1 1 .0 0 _ _ - 8 52 46 7 4 3 5 7 163 33 7 _ - - - - -NONMANUFACTURING ------------------------------- 6 5 3 3 9 .5 1 0 3 .5 0 1 0 6 .0 0 1 0 0 .5 0 - 1 1 1 .0 0 - - - 5 50 34 61 3 1 9 157 25 3 - - - - - -
PUBLIC U T IL IT IE S 4--------------------------- 556 4 0 .0 1 0 7 .0 0 1 0 7 .0 0 1 0 2 .5 0 - 1 1 2 .0 0 - - 2 11 2 54 3 03 157 25 3 “ “ “ -
ST BIOGRAPHERS, SE N IO R --------------------------- 3 6 1 3 9 .5 1 1 4 .5 0 1 1 3 .0 0 1 0 6 .0 0 - 1 2 5 .5 0 - - - 15 1 7 22 9 4 116 4 8 17 28 16 - - -
TABULATING-MACHINE OPERATORS,CLASS A ------------------------------------------------------ 8 ,5 8 3 3 9 .0 1 1 7 .0 0 1 1 6 .0 0 1 0 5 .0 0 - 1 2 9 .0 0 - - - 1 4 7 3 4 9 961 1 8 2 9 183 9 153 5 113 8 4 6 8 2 5 9 123 23 10 -
MANUFACTURING------------------------------------- 4 ,2 5 5 3 9 .5 1 2 1 .0 0 1 2 0 .0 0 1 0 8 .5 0 - 1 3 2 .5 0 - - - - 4 1 12 341 7 11 9 5 4 867 675 308 186 84 6 7 -NONMANUFACTURING ------------------------------- 4 , 3 2 9 3 8 .5 1 1 3 .0 0 1 1 1 .5 0 1 0 2 .0 0 - 1 2 5 .0 0 - - - 1 43 2 3 8 6 2 0 1 1 1 7 8 86 6 6 9 4 63 1 60 73 3 9 17 3 -
PUBLIC U T IL IT IE S4 --------------------------- 822 3 9 .5 1 2 4 .5 0 1 2 4 .5 0 1 1 3 .0 0 - 1 3 5 .5 0 - - - 1 1 2 24 1 1 5 206 162 178 75 4 4 10 3 - -WHOLESALE TRADE ----------------------------- 6 7 0 3 9 .5 1 1 9 .5 0 1 1 8 .5 0 1 0 5 .5 0 - 1 3 0 .5 0 - - - - 5 8 9 3 92 156 1 47 72 54 19 15 7 3 -RETAIL TRAD E----------------------------------- 313 3 8 .5 1 0 8 .5 0 1 0 6 .5 0 1 0 1 .0 0 - 1 1 7 .5 0 - - - - 2 11 4 8 125 6 4 33 23 6 - 1 - - -FINANCE5--------------------------------------------- 2 ,2 1 4 3 8 .0 1 0 6 .5 0 1 0 6 .5 0 9 7 .0 0 - 1 1 6 .0 0 - - - - 35 2 1 4 4 2 8 7 4 9 4 0 6 2 43 125 3 - 12 - - -S E R V IC E S ------------------------------------------- 3 10 3 8 .5 1 2 2 .0 0 1 2 3 .0 0 1 1 2 .0 0 - 1 3 3 .0 0 - - “ 3 28 37 54 84 65 22 10 1 7
TABULATING-MACHINE OPERATORS,CLASS B ------------------ ---------------- ------------------ 1 3 ,9 3 4 3 9 .0 9 9 .0 0 9 9 .0 0 8 7 .5 0 - 1 1 0 .0 0 - - 19 4 5 2 1 1 4 6 2 4 4 2 3 1 8 6 3 1 6 9 187 7 1 09 9 4 48 72 21 2 - - -
MANUFACTURING------------------------------------- 5 ,4 2 9 3 9 .5 1 0 3 .0 0 1 0 2 .5 0 9 2 .0 0 - 1 1 5 .0 0 - - 4 96 2 75 7 40 1 2 2 5 1 3 3 4 8 10 6 37 239 56 13 1 - - -NONMANUFACTURING------------------------------- 8 ,5 0 5 3 8 .5 9 6 .5 0 9 6 .5 0 8 5 .0 0 - 1 0 8 .0 0 - - 15 3 57 871 1 7 0 3 1 9 6 2 1 8 3 5 1 06 8 4 62 2 09 16 8 1 - - -
PUBLIC U T IL IT IE S4 --------------------------- 1 ,5 3 9 3 9 .5 1 0 6 .0 0 1 0 7 .0 0 9 7 .5 0 - 1 1 5 .5 0 - - 2 35 52 1 4 6 2 1 6 4 3 5 4 0 6 142 9 9 4 1 1 - - -WHOLESALE TRADE ----------------------------- 1 ,6 9 0 3 9 .0 1 0 0 .0 0 9 9 .5 0 8 9 .5 0 - 1 1 1 .0 0 - - - 28 96 3 13 4 2 9 3 79 2 53 141 50 3 - - - - -RETAIL TRADE ----------------------------------- 6 82 3 9 .0 9 2 .5 0 9 2 .5 0 8 4 .0 0 - 1 0 4 .0 0 - - 1 16 90 1 7 7 1 77 1 38 67 13 3 1 - - - - -FINANCE5 ---------------------------------------------- 4 ,0 8 6 3 8 .0 9 1 .5 0 9 1 .5 0 8 1 .0 0 - 1 0 1 .5 0 - - 11 2 70 605 9 7 9 1 0 3 7 7 7 8 2 59 1 07 36 5 - - - - -SERVICES -------------------------------------------- 5 0 8 3 8 .0 1 0 3 .0 0 1 0 2 .0 0 9 0 .0 0 - 1 1 6 .0 0 - - - 8 29 87 1 02 1 07 84 60 21 3 7 - -
TABULATING-MACHINE OPERATORS,CLASS C ----------------— —------------------------------- 5 ,2 1 8 3 8 .5 8 1 .0 0 8 0 .0 0 6 9 . 5 0 - 9 1 .0 0 - 4 2 6 8 1 0 6 8 1 2 9 4 1 2 0 8 6 7 7 4 9 5 178 27 - - - - - - -
MANUFACTURING------------------------------------- 1 ,6 5 1 3 9 .5 8 6 .0 0 8 6 .0 0 7 6 . 0 0 - 9 6 .5 0 - - 39 1 4 0 366 4 6 4 3 3 0 2 3 9 62 12 - - - - - - -NONMANUFACTURING------------------------------- 3 ,5 6 6 3 8 .5 7 8 .5 0 7 6 .0 0 6 7 . 5 0 - 8 7 .5 0 - 4 2 3 0 9 28 9 2 7 744 3 46 2 57 115 15 - - - - - - -
PUBLIC U T IL IT IE S4 --------------------------- 3 91 3 9 .5 9 2 .5 0 9 5 .5 0 7 7 .0 0 - 1 0 9 .0 0 - 3 14 31 71 4 8 52 89 74 9 - - - - - - -WHOLESALE TRADE ----------------------------- 563 3 9 .0 7 9 .5 0 8 1 .0 0 6 9 .5 0 - 8 9 .0 0 - - 35 115 1 19 171 91 2 0 8 3 - - - - - - -RETAIL TRADE----------------------------------- 3 26 3 9 .0 7 5 .0 0 7 5 .0 0 6 6 . 0 0 - 8 4 .0 0 - 1 2 0 102 92 6 7 2 8 15 - - - - - - - - -FINANCE5---------------------------------------------- 2 ,0 3 0 3 7 .5 7 5 .0 0 7 3 .0 0 6 6 . 5 0 - 8 2 .5 0 - - 157 6 4 7 6 04 4 0 7 1 30 5 9 25 1 - - - - - - -S E R V I C E S ------------------------------------------- 2 5 6 3 8 .5 8 8 .5 0 9 0 .0 0 7 6 .5 0 - 1 0 1 .5 0 - - 3 3 2 42 50 4 6 74 8 2 - - - -
See foo tn o te s at end o f table.
Digitized for FRASER http://fraser.stlouisfed.org/ Federal Reserve Bank of St. Louis

8
Table A-l. Office Occupations—United States---- Continued
(A v e ra g e s tra ig h t-t im e w eek ly hou rs and earn in gs fo r s e le c te d o ccu p a tion s b y in du stry d iv is io nin a ll m etro p o lita n a re a s , F e b ru a ry 1965
S e x , o c c u p a t io n , an d in d u s t r y d iv is io n
MEN - CONTINUED
T Y P IST S , CLASS A --------------------------------------MANUFACTURING --------------------------------------NONMANUFACTURING -------------------------------
PUBLIC U T IL IT IE S 4---------------------------
T Y P IST S , CLASS B --------------------------------------NONMANUFACTURING-------------------------------
PUBLIC U T IL IT IE S 4---------------------------
WOMEN
B IL L E R S, MACHINE (BILLINGMACHINE! ----------------------------------------------------
MANUFACTURING--------------------------------------NONMANUFACTURING--------------------------------
PUBLIC U T IL IT IE S4 ---------------------------WHOLESALE TRAD E-----------------------------RETAIL TRAD E-----------------------------------S E R V IC E S --------------------------------------------
B IL L E R S, MACHINE (BOOKKEEPINGM A C H IN E !----------------------------------------------------
MANUFACTURING --------------------------------------NONMANUFACTURING-------------------------------
PUBLIC U T IL IT IE S 4---------------------------WHOLESALE TRADE -----------------------------RETAIL TRADE -----------------------------------S ERV I C E S --------------------------------------------
BOOKKEEPING-MACHINE OPERATORS,CLASS A -------------------------------------------------------
MANUFACTURING -------------------------------------NONMANUFACTURING-------------------------------
PUBLIC U T IL IT IE S 4---------------------------WHOLESALE TRADE -----------------------------RETAIL TRAD E-----------------------------------FINANCE5----------------------------------------------S E R V IC E S -------------------- ------------------------
BOOKKEEPING-MACHINE OPERATORS,CLASS B ------------------------------------------------------
MANUFACTURING-------------------------------------NONMANUFACTURING -------------------------------
PUBLIC U T IL IT IE S4 ---------------------------WHOLESALE TRADE -----------------------------RETAIL TRADE -----------------------------------FINANCE5----------------------------------------------S E R V IC E S --------------------------------------------
CLERKS, ACCOUNTING, CLASS A --------------MANUFACTURING--------------------------------------NONMANUFACTURING-------------------------------
PUBLIC U T IL IT IE S4 ---------------------------WHOLESALE TRADE -----------------------------RETAIL TRADE ------------------------------------FINANCE5----------------------------------------------SERV IC ES----------------------------------------------
N u m b er of w o r k e r s r e c e iv in g s t r a ig h t - t im e w e e k ly e a r n in g s of—
Average S $ $ $ % $ $ $ $ $ $ $ $ $ $ Sof weekly
U n d er 4 0 50 6 0 70 8 0 90 1 00 110 120 130 140 1 5 0 1 60 170 1 80 1 9 0woikers (standard Mean3 Median 3 Middle range 3 $
4 0and
u n d e r - - - - - - - - - - - - - and
5 0 6 0 7 0 80 9 0 1 00 1 10 120 1 3 0 140 1 5 0 1 60 1 70 1 80 1 9 0 o v e r
$ $ $ $8 51 3 9 .0 9 6 .5 0 9 9 .0 0 8 4 .0 0 - 1 0 8 .0 0 — - - 28 91 1 7 6 1 44 2 5 2 1 52 4 5 _ _ _ _ _ _2 8 2 4 0 . 0 9 0 .5 0 8 8 .5 0 8 1 .5 0 - 1 0 1 .0 0 - - - 2 46 1 0 0 5 7 5 9 16 1 1 _ _ _ _5 6 9 3 8 .5 9 9 .0 0 1 0 2 .5 0 8 9 . 5 0 - 1 1 0 . 0 0 - - - 26 45 76 87 1 92 1 36 3 4 _ _ _ _ _3 2 4 3 9 .0 1 0 1 .5 0 1 0 4 .0 0 9 7 .5 0 - 1 0 9 .0 0 ~ “ - 3 14 4 4 3 4 1 63 64 2 - - - - - -
1 ,4 5 7 3 9 .0 8 3 .0 0 8 1 .0 0 7 1 . 5 0 - 9 7 .5 0 - 1 141 1 64 3 92 2 7 0 1 8 7 1 36 167 _ _ _1 ,2 1 7 3 9 .0 8 3 .5 0 8 1 .0 0 7 1 . 5 0 - 9 8 .5 0 - 1 1 14 1 30 32 9 2 2 4 142 1 13 1 6 4 _ _ _ _ _ _
8 66 3 9 .5 8 9 .5 0 6 7 .0 0 7 7 .0 0 - 1 0 5 .5 0 23 68 1 8 3 201 1 1 9 1 10 162
'
1 0 ,5 4 8 3 9 .0 7 6 .5 0 7 4 .0 0 6 5 . 0 0 - 8 8 .0 0 2 0 0 133 1 2 6 4 1 2 2 1 8 1 8 0 6 1 1 2 5 6 9 6 4 9 1 35 53 ,8 5 4 3 9 .5 7 6 .5 0 7 5 .5 0 6 6 . 5 0 - 8 6 .0 0 - 6 4 1 4 931 941 893 3 8 9 1 89 70 17 2 _ _ _ _ _6 ,6 9 4 3 9 .0 7 6 .5 0 7 3 .5 0 6 3 . 5 0 - 9 0 .0 0 - 1 9 4 9 15 1 7 0 9 1 2 7 7 913 7 36 5 0 7 4 2 1 18 3 _ _ _ _ _1 ,6 4 3 3 9 .5 8 7 .0 0 8 5 .5 0 7 0 . 0 0 - 1 0 5 . 5 0 - - 135 2 6 7 3 12 1 99 193 2 2 5 297 11 3 _ _ _ _ — _2 ,1 9 6 3 9 .0 7 8 .0 0 7 7 .0 0 6 6 . 5 0 - 9 1 .5 0 - 3 2 4 5 5 6 9 3 7 2 3 8 0 3 1 9 2 47 57 4 _ _ _ _ _ _1 ,7 5 6 3 9 .0 6 5 .5 0 6 4 .5 0 5 5 . 0 0 - 7 3 .0 0 - 1 88 4 5 5 5 47 3 2 8 97 55 22 66 _ _ _ • _ _ _ _
6 1 5 3 9 .0 7 4 .0 0 7 2 .5 0 6 4 . 5 0 - 8 3 .0 0 3 71 1 58 2 0 3 7 9 85 13 1 3 - “ -
7 , 0 35 3 9 .0 7 0 .5 0 7 0 .0 0 6 0 . 0 0 - 8 2 .0 0 13 2 3 5 1 5 1 6 1 7 5 3 1 5 3 1 1 2 1 0 6 1 7 1 0 9 47 3 11 ,6 3 9 3 9 .0 7 7 .0 0 7 7 .5 0 6 7 . 0 0 - 8 6 .5 0 - - 1 96 2 8 4 4 5 0 4 3 3 1 7 6 6 4 32 3 _ _ _ _ _5 ,3 9 6 3 9 .0 6 8 .5 0 6 7 .0 0 5 8 . 5 0 - 7 9 .0 0 13 2 35 1 3 1 9 1 4 6 9 1 0 8 0 776 4 4 1 4 5 15 _ 1 _ _ _ _ _ _
4 9 4 3 7 .0 8 3 .5 0 8 3 .5 0 7 6 . 5 0 - 9 2 .0 0 - - 2 48 1 4 9 1 0 9 1 5 8 19 9 — _ _ _ _ _6 1 4 3 9 .0 7 6 .0 0 7 7 .0 0 6 3 . 0 0 - 9 0 .0 0 - - 1 25 1 10 94 1 2 9 1 3 7 17 3 _ _ _ _ _ _ _ _
3 ,2 5 5 3 9 .0 6 5 .0 0 6 3 .5 0 5 7 . 0 0 - 7 3 .0 0 5 2 0 7 9 37 1 0 6 0 5 84 3 71 83 5 2 _ 1 _ _ _ _ _ _9 01 4 0 .0 6 9 .5 0 7 0 .0 0 5 9 . 0 0 - 8 0 .0 0 8 27 2 1 2 2 06 2 25 1 57 63 2 1 - - - -
1 1 ,7 4 7 3 9 .0 8 8 .0 0 8 8 .0 0 7 8 . 0 0 - 9 8 .0 0 _ _ 2 8 7 1 0 6 2 2 0 7 6 2 9 5 8 2 8 9 8 1 4 6 2 6 4 3 2 9 5 6 7 14 ,6 2 6 3 9 .5 9 2 .5 0 9 2 .5 0 8 4 .0 0 - 1 0 1 .0 0 - - 18 1 4 9 5 8 8 1 1 2 7 1 5 0 4 7 4 8 3 32 1 35 26 1 _ _ _ - _7 ,1 2 1 3 9 .0 8 5 .0 0 8 4 .0 0 7 4 . 5 0 - 9 5 .5 0 - - 2 6 9 9 13 1 4 8 8 1 83 1 1 3 9 4 7 1 5 3 11 1 6 0 4 2 _ _ _ _ _
4 5 5 3 9 .0 9 3 .5 0 9 4 .0 0 8 4 .5 0 - 1 0 3 .5 0 - - - 35 51 81 1 51 59 50 13 15 _ _ _ _ _2 ,3 4 6 3 9 .5 8 8 .5 0 8 7 .0 0 7 7 . 5 0 - 9 9 .5 0 - - 18 1 6 5 5 75 5 2 8 4 9 0 3 1 1 1 46 9 0 23 _ _ _ _1 ,2 1 8 3 9 .5 8 5 .0 0 8 4 .5 0 7 7 . 0 0 - 9 5 .0 0 - - 45 1 23 2 2 4 3 9 5 2 4 8 1 06 6 2 15 _ _ _ _ _ _2 ,5 1 0 3 8 .0 7 9 .5 0 7 9 .5 0 6 8 . 0 0 - 8 9 .5 0 - - 2 0 5 5 44 531 6 2 8 3 75 1 66 30 31 _ _ _ _ _ _ _
592 3 9 .5 8 7 .5 0 8 6 .0 0 7 9 . 5 0 - 9 5 .5 0 ~ ~ 1 45 1 07 1 9 8 1 3 0 73 23 11 4 - - - - - -
3 0 ,6 7 0 3 9 .0 7 1 .5 0 7 0 .0 0 6 1 . 0 0 - 8 1 . CO _ 2 81 6 5 2 4 8 6 8 6 7 0 5 0 4 7 2 4 2 0 1 3 8 71 4 1 6 1 06 27 ,4 0 1 3 9 .0 7 8 .0 0 7 7 .5 0 6 8 . 5 0 - 8 7 .5 0 - 17 5 76 1 5 4 3 2 0 7 9 1781 8 1 9 3 8 4 162 4 0 1 _ _ _ _ _
2 3 ,2 6 9 3 9 .0 6 9 .5 0 6 7 .5 0 5 9 . 5 0 - 7 8 .0 0 - 2 6 4 5 9 4 8 7 1 4 3 4 97C 2 9 4 3 1 1 9 4 4 8 8 2 5 4 66 1 _ _ _ _ _8 6 9 3 9 .0 8 6 . 50 8 4 .5 0 7 1 . 0 0 - 1 0 3 . 5 0 - - 37 159 1 7 4 161 96 7 9 1 44 19 _ _ _ _ _ _
5 ,3 6 3 3 9 .5 7 4 .0 0 7 4 .0 0 6 3 . 5 0 - 8 4 .5 0 - 6 7 76 1 3 7 4 1 2 3 4 1 2 2 8 5 22 1 5 4 4 7 22 _ _ _ _ _ _4 ,0 2 1 3 9 .5 6 8 .5 0 6 7 .5 0 5 9 . 5 0 - 7 7 .0 0 - 1 6 7 863 1 3 2 6 872 5 5 9 1 73 51 10 _ _ _ _ _ _
1 1 ,7 9 1 3 8 .5 6 5 .5 0 6 4 .0 0 5 7 . 5 0 - 7 2 .0 0 - 74 4 1 3 2 4 0 4 5 2 3 9 6 7 6 8 2 9 2 81 3 2 _ _ _ _ _1 ,2 2 5 3 9 .0 7 9 .0 0 7 6 .0 0 6 6 . 0 0 - 9 0 .0 0 - 16 1 40 2 4 0 2 9 4 2 2 7 111 1 2 3 4 9 23 1 - - - - - -
3 8 ,2 8 0 3 9 .0 9 6 .5 0 9 5 .5 0 8 5 .0 0 - 1 0 8 .5 0 _ 2 2 47 1 3 7 4 4 1 2 0 8022 8 9 4 7 7 0 0 9 4 6 3 9 2 3 9 4 9 90 4 0 2 1 0 4 2 8 31 4 ,3 6 3 3 9 .5 1 0 1 .5 0 1 0 1 .0 0 8 9 .5 0 - 1 1 3 .0 0 - - 33 1 5 5 8 90 2 7 0 0 3 1 6 3 3 0 8 6 2 2 0 0 1 2 5 8 5 7 4 2 07 74 19 3 _2 3 ,9 1 7 3 8 .5 9 4 .0 0 9 3 .0 0 8 3 .0 0 - 1 0 4 .5 0 - 2 2 14 1 2 1 9 3 2 30 5 32 2 5 7 8 4 3 9 2 3 2 4 4 0 1 1 3 6 4 15 1 95 3 0 9 _ _
5 ,4 3 1 3 9 .0 1 0 1 .5 0 1 0 0 .0 0 9 1 .5 0 - 1 1 2 .5 0 - - 2 53 2 2 6 7 3 6 1 7 0 2 1 0 1 4 1 1 2 4 3 42 169 56 8 1 _ _ _3 ,5 3 8 3 9 .0 9 8 .5 0 9 8 .0 0 8 7 .5 0 - 1 0 8 .0 0 - - 20 65 2 84 6 93 872 8 3 0 3 17 2 6 0 116 62 16 4 _ _ _4 ,8 3 7 3 9 .5 8 9 .0 0 8 8 .0 0 7 9 . 0 0 - 9 9 .0 0 - 2 78 2 52 9 58 1 4 0 2 9 98 6 9 3 2 38 1 66 27 23 _ _ _7 ,0 4 3 3 8 .0 8 7 .0 0 8 6 .5 0 7 6 . 0 0 - 9 6 .5 0 - - 111 7 58 1 4 5 4 1 9 8 0 1 4 3 4 7 65 355 158 23 6 _ _ _ _ _3 ,0 6 8 3 8 .5 9 8 .5 0 9 7 .5 0 8 7 .5 0 - 1 1 0 .0 0 - - 4 91 3 09 512 7 7 8 6 2 1 4 06 2 12 80 4 8 6 4 - - -
See foo tn otes at end o f tab le .
Digitized for FRASER http://fraser.stlouisfed.org/ Federal Reserve Bank of St. Louis

9Table A-l. Office Occupations—United States---- Continued
(A v e ra g e s tra ig h t-t im e w eek ly hou rs and earn in gs fo r s e le c te d o ccu p a tion s b y in du stry d iv is io nin a ll m e tro p o lita n a re a s , F e b ru a ry 1965 f )
Sex, occupation, arid industry division
WOMEN - CONTINUED
CLERKS, ACCOUNTING, CLASS B --------------MANUFACTURING --------------------------------------NON MANUFACTURING-------------------------------
PUBLIC U T IL IT IE S 4---------------------------WHOLESALE TRADE -----------------------------RETAIL TRADE -----------------------------------FINANCE5----------------------------------------------S E R V IC E S --------------------------------------------
CLERKS, F IL E , CLASS A ---------------------------MANUFACTURING--------------------------------------NONMANUFACTURING-------------------------------
PUBLIC U T IL IT IE S4 ---------------------------WHOLESALE TRADE -----------------------------RETAIL TRADE-----------------------------------FINANCE5----------------------------------------------S E R V IC E S -------------------------------------------
CLERKS, F IL E , CLASS B ---------------------------M AN UF ACTURIN G -------------------------------------NONMANUFACTURING-------------------------------
PUBLIC U T IL IT IE S4 ---------------------------WHOLESALE TRADE -----------------------------RETAIL TRAD E-----------------------------------FINANCE5 ----------------------------------------------S E R V IC E S --------------------------------------------
CLERKS, F IL E , CLASS C ---------------------------MANUFACTURING-------------------------------------NONMANUFACTURING -------------------------------
P U B L I C U T I L I T I E S 4 -------------------------------------WHOLESALE TRADE -----------------------------RETAIL TRADE-----------------------------------FINANCE5----------------------------------------------S E R V IC E S --------------------------------------------
CLERKS, ORDER--------------------------------------------MANUFACTURING-------------------------------------NONMANUFACTURING -------------------------------
WHOLESALE TRADE -----------------------------RETAIL TRADE -----------------------------------SE R V IC E S --------------------------------------------
CLERKS, PAYROLL---------------------------------------MANUFACTURING -------------------------------------NONMANUFACTURING -------------------------------
PUBLIC U T IL IT IE S4 ---------------------------WHOLESALE TRADE -----------------------------RETAIL TRAD E-----------------------------------FINANCE5 ----------------------------------------------S E R V IC E S --------------------------------------------
COMPTOMETER OPERATORS --------------------------MANUFACTURING--------------------------------------NONMANUFACTURING-------------------------------
PUBLIC U T IL IT IE S 4---------------------------WHOLESALE TRADE -----------------------------RETAIL TRADE-----------------------------------FINANCE5----------------------------------------------SE R V IC E S --------------------------------------------
W e e k ly e a rn in g s 2 (s ta n d a rd )
N um ber of w o rk e rs re c e iv in g s tra ig h t -tim e w ee k ly earn in g s of—
N um b erof
A v e rag e $ S * $ $ $ $ $ $ $ $ $ $ $ $ $
w e e k ly Under 4 0 50 6 0 70 80 9 0 1 00 110 1 2 0 130 1 4 0 1 50 1 60 n o 1 80 1 9 0w o rkers
(s tan d ard ] M e a n 3 M e d ia n 3 M id d le r a n g e 3 $ and _ _ _ _ _ _ _ _ _ _ _ _ _ and4 0 under
5 0 60 70 80 9 0 1 00 110 120 1 30 140 1 50 1 60 1 70 1 80 1 9 0 o v e r
$ $ $ $7 8 ,5 5 1 3 9 .0 7 6 .5 0 7 5 .0 0 6 5 . 5 0 - 8 6 .5 0 - 6 5 2 9 2 8 0 1 8 8 6 0 1 9 2 7 6 1 7 0 3 7 7 4 2 0 3 5 3 7 1 77 1 4 9 6 175 33 15 — — — 22 3 ,4 -1 7 3 9 .5 8 1 .0 0 8 0 .0 0 7 0 . 0 0 - 9 0 .5 0 - 3 1 3 0 0 4 3 9 3 6 1 3 3 5 5 9 4 3 0 0 8 1 7 8 1 7 8 7 3 30 59 18 12 - - - 25 5 ,1 3 4 3 8 .5 7 4 .5 0 7 3 .0 0 6 3 . 5 0 - 8 4 .5 0 - 6 4 9 7 9 8 0 1 4 4 6 7 1 3 1 4 3 1 1 4 4 3 4 4 1 3 1 7 5 6 9 8 3 1 66 116 15 3 - - - -1 3 ,7 6 6 3 8 .5 8 1 .5 0 8 2 .0 0 7 0 . 5 0 - 9 0 .0 0 - 7 7 03 2 541 3 1 1 4 4 0 9 5 1 5 8 9 8 6 5 6 5 6 115 79 3 - - - - -
8 ,9 3 9 3 9 .5 7 8 .0 0 7 8 .0 0 6 6 . 5 0 - 8 8 .5 0 - 2 7 9 97 1 7 9 5 2 0 4 0 2 2 0 4 1 1 3 5 4 8 0 1 84 36 34 6 2 - - - -1 3 ,0 0 7 3 9 .5 7 0 .0 0 6 9 .5 0 6 1 .5 0 - 7 9 .0 0 - 3 9 1 2 3 3 7 3 9 1 4 3 4 2 8 2 076 602 1 4 9 99 4 2 3 1 - - - -1 4 ,7 8 5 3 8 .0 6 8 .5 0 6 7 .5 0 6 0 . 0 0 - 7 6 .5 0 - 1 76 3 4 4 7 5 067 3 4 0 5 2 0 5 7 5 64 6 6 3 - - - - — — - -4 ,6 3 8 3 8 .5 7 5 .5 0 7 4 .5 0 6 6 . 0 0 - 8 5 .5 0 4 8 4 9 6 1 15 1 1 1 5 6 1 01 3 5 23 1 94 42 11 1 3 - ~
9 ,9 6 3 3 8 .5 8 2 .5 0 8 1 .0 0 7 1 . 0 0 - 9 2 .0 0 _ 35 51C 1 7 4 8 2 4 2 0 2 4 0 2 1 4 7 7 7 7 8 3 9 5 1 25 52 14 5 1 - - -3 ,3 0 8 3 9 .5 8 9 .0 0 8 7 .5 0 7 9 . 0 0 - 9 8 .5 0 - 11 68 2 6 8 5 5 3 9 86 7 0 7 3 63 2 39 60 35 14 5 1 - - -6 ,6 5 5 3 8 .0 7 9 .0 0 7 7 .0 0 6 8 . 5 0 - 8 8 .5 0 - 2 4 4 4 2 1 4 8 0 1 8 6 7 1 4 1 7 7 70 4 1 5 157 65 17 - — - - - -
755 3 9 .0 9 6 .0 0 9 6 .5 0 8 4 .5 0 - 1 0 7 .0 0 - - 3 26 1 00 1 3 8 177 1 61 92 51 8 - - - - — -795 3 8 .5 8 2 .5 0 8 3 .5 0 7 1 . 0 0 - 9 2 .5 0 - - 22 158 1 56 2 2 6 1 1 9 86 25 4 - - - - - - -282 3 8 .5 7 2 .5 0 7 1 .5 0 6 3 . 5 0 - 8 2 .5 0 - - 33 99 64 54 2 0 11 1 - - - - - - - -
4 ,0 9 7 3 8 .0 7 5 .0 0 7 3 .5 0 6 6 . 5 0 - 8 3 .0 0 - 2 4 3 6 9 1 1 1 8 1 3 0 9 8 5 0 3 1 0 88 21 7 1 - - - - - -725 3 8 .5 8 4 .0 0 8 1 .5 0 7 3 . 0 0 - 9 4 .0 0 - - 17 79 2 39 1 5 0 1 4 4 6 9 17 4 8 ~ - " “ ~
3 5 ,4 0 6 3 8 .5 6 6 .5 0 6 4 .5 0 5 8 . 0 C - 7 3 .5 0 _ 9 6 6 1 0 7 5 0 1 2 1 6 3 6 4 4 1 3 0 9 7 1 3 3 4 4 8 9 141 27 - - - - - - -7 ,8 2 3 3 9 .0 7 3 .0 0 7 1 .5 0 6 3 .5 0 - 8 1 .0 0 - - 1 2 1 2 2 3 3 9 2 1 4 9 1 181 6 1 9 2 21 86 17 - — - - - — -
2 7 ,5 8 3 3 8 .5 6 4 .5 0 6 3 .0 0 5 7 . 0 0 - 7 0 .5 0 - 9 6 6 9 5 3 8 9 8 2 4 4 2 9 2 1 9 1 6 715 2 6 9 55 10 - - - - - - -2 ,3 4 3 3 9 .5 7 9 .5 0 7 8 .5 0 6 6 . 5 0 - 9 2 .0 0 - - 2 55 4 9 4 4 9 6 4 1 7 3 7 7 2 4 9 4 9 8 - - - - - - -3 ,6 0 2 3 9 .5 6 8 .0 0 6 6 .0 0 6 0 . 0 0 - 7 7 .0 0 - 5 9 1 2 1 2 6 3 7 05 5 56 1 4 9 10 3 - - — - - - — -3 ,1 9 2 3 9 .0 6 0 .5 0 5 9 .0 0 5 2 .5 0 - 6 8 .5 0 - 3 8 2 1 30 1 7 9 0 5 04 1 82 31 1 1 - - - — - — - -
1 5 ,9 8 6 3 8 .0 6 2 .5 0 6 1 .5 0 5 6 . 5 0 - 6 7 .5 0 - 4 8 6 6 4 1 0 6 2 1 9 2 1 7 5 5 9 9 9 4 2 1 - - - - - - - -2 ,4 6 0 3 8 .5 6 5 .0 0 6 4 .0 0 5 8 . 5 0 - 7 0 .5 0 - 9 3 6 6 0 1 0 5 8 4 12 1 6 3 65 7 1 2 - •
2 7 ,9 8 7 3 8 .5 5 9 .5 0 5 8 .0 0 5 3 . 0 0 - 6 4 .5 0 8 1 9 0 8 1 5 0 7 4 7 1 9 6 2 4 2 3 9 27 3 8 3 52 19 _ - - - - - -4 , 4 3 0 3 9 .0 6 6 .0 0 6 4 .0 0 5 7 . 0 0 - 7 4 .0 0 - 72 1 4 3 0 1 4 7 9 6 62 584 1 72 18 13 - - - - - - - -
2 3 ,5 5 7 3 8 .0 5 8 .0 0 5 7 .0 0 5 2 . 5 0 - 6 3 .0 0 8 1 8 3 6 1 3 6 4 2 5 7 1 6 1 7 6 0 3 4 4 2 12 3 4 6 - - - - — - - -1 ,4 9 2 3 9 .0 7 0 .5 0 6 8 .0 0 6 1 . 0 0 - 7 9 .5 0 - 4 322 522 2 9 0 122 1 94 3 4 6 - - - - - — - -
1 ,9 6 9 3 9 .0 6 0 .5 0 5 9 .0 0 5 3 .5 0 - 6 7 .5 0 - 2 7 1 0 3 2 5 16 291 92 11 - - - - - - - - - -2 ,9 2 8 3 9 .0 5 5 .5 0 5 4 .5 0 5 1 . 0 0 - 6 0 .0 0 - 4 5 4 1 7 4 2 5 39 152 38 3 - - - - - - - - - -
1 5 ,3 7 2 3 8 . C 5 7 .0 0 5 6 . 50 5 2 .5 0 - 6 1 .5 0 - 1 2 6 9 9 4 6 9 3 6 4 9 9 13 6 9 4 - - - - - - - - - -1 ,7 9 5 3 9 .0 5 8 .5 0 5 8 .0 0 5 4 . 0 0 - 6 3 .0 0 8 82 1 0 7 8 4 91 1 1 4 23 - - ~ “
1 8 , 9 00 3 9 . 0 7 7 .5 0 7 6 .0 0 6 5 . 5 0 - 8 7 .5 0 _ 1 5 2 2 3 0 2 4 0 9 8 4 7 7 3 3 6 7 8 1 8 9 6 1 0 0 5 6 0 3 3 1 8 5 2 8 9 8 - - -
8 ,4 8 8 3 9 .0 8 0 .0 0 7 9 .0 0 6 9 . 5 0 - 9 0 .0 0 - - 6 6 5 1 5 2 7 2 2 5 5 1 9 4 5 1 0 9 9 5 2 7 2 77 1 54 29 3 5 2 — - —1 0 ,4 1 2 3 9 .5 7 5 .0 0 7 3 .5 0 6 3 . 0 0 - 8 4 .5 0 - 1 5 2 1 6 3 6 2 5 7 1 2 5 1 8 1 73 2 797 4 7 8 3 26 1 6 4 2 3 5 4 6 — - -
5 ,6 2 6 3 9 .5 8 0 .5 0 7 9 . 50 6 8 .5 0 - 9 1 .0 0 - - 5 40 1 0 5 5 1 3 1 2 1 2 5 0 6 45 3 9 3 2 48 151 2 3 1 4 6 - - -
4 ,0 1 4 3 9 .5 6 6 .5 0 6 6 . 00 5 8 .5 0 - 7 4 .5 0 - 1 51 9 97 1 3 3 5 1 0 0 0 3 7 7 1 06 3 8 11 1 - - - - - — -
3 98 3 9 .0 7 2 .5 0 6 9 . 00 6 2 . 0 0 - 7 7 .5 0 1 70 142 1 09 3 9 2 10 14 7 - 4 -
3 0 ,2 3 5 3 9 .0 8 5 .5 0 8 4 .5 0 7 2 . 5 0 - 9 8 .0 0 _ 7 1 1 74 1 4 3 6 0 5 9 40 6 3 6 0 5 1 2 5 3 1 5 3 1 9 6 0 9 2 9 3 75 1 8 4 2 7 11 - _ -
1 7 ,2 2 7 3 9 .5 8 6 .0 0 8 4 .0 0 7 2 . 5 0 - 9 7 .5 0 - - 1 0 5 0 2 4 2 7 3 4 3 5 3 7 00 2 8 5 7 1 7 6 3 9 7 3 591 285 1 19 21 7 - - -1 3 ,0 0 8 3 9 .0 8 5 .5 0 8 5 .5 0 7 2 . 0 0 - 9 8 .0 0 - 71 6 9 2 1 9 3 3 2 5 0 5 2 6 6 0 2 2 6 8 1 3 8 9 9 87 3 3 8 90 66 6 4 - - -
3 ,1 0 2 3 9 .0 9 4 .0 0 9 3 .5 0 8 0 .0 0 - 1 1 0 .0 0 - 2 99 2 8 0 3 93 5 83 512 444 5 26 182 3 4 4 7 - - - - -1 ,9 6 3 3 9 .5 8 9 .5 0 9 0 .0 0 7 8 .0 0 - 9 9 .5 0 - - 39 2 13 2 97 4 3 8 4 9 9 1 9 1 1 69 70 36 9 2 - - - -3 , 7 90 3 9 .0 7 7 .0 0 7 6 .0 0 6 7 . 0 0 - 8 8 .0 0 - 39 3 66 8 09 1 0 7 5 6 8 3 4 9 8 2 3 8 45 31 3 5 - - - - -2 ,1 7 1 3 7 .5 8 6 .5 0 8 6 .0 0 7 3 . 5 0 - 9 8 .5 0 - 2 1 01 2 9 0 4 01 4 8 4 4 1 0 2 7 0 167 30 14 1 1 - — - -1 ,9 8 2 3 9 . C 8 3 .5 0 8 5 .0 0 7 1 . 0 0 - 9 5 .0 0 - 30 86 341 341 471 3 5 0 2 4 6 80 25 3 4 3 4 - “
2 7 ,3 6 8 3 9 .0 8 1 .5 0 8 0 .0 0 6 9 . 5 0 - 9 4 .0 0 - 2 6 7 1 8 6 3 4 8 8 7 6 6 8 3 5 4 6 4 3 4 9 3 2 8 0 0 1 3 3 5 5 2 9 4 7 3 - _ _ _ _
9 ,1 1 8 3 9 .5 8 7 .5 0 8 6 .5 0 7 4 .0 0 - 1 0 1 .5 0 - 15 3 6 9 1 2 4 4 1 7 0 4 1 8 1 2 1 4 1 7 1 2 7 3 8 92 3 7 0 23 - - - - - -1 8 ,2 5 0 3 9 .0 7 9 .0 0 7 7 .5 0 6 8 .0 0 - 8 9 .0 0 - 2 5 2 1 4 9 4 3 6 4 3 4 9 7 9 3 6 5 2 2 0 7 5 1 5 2 7 4 4 3 1 5 9 2 4 3 - - - - -
2 ,3 0 2 3 9 .5 9 6 . 50 1 0 0 .0 0 8 9 .5 0 - 1 0 6 .5 0 - - 35 1 10 201 2 4 5 5 4 9 9 1 0 211 26 16 - - - - - -
4 ,7 3 3 3 9 .5 7 8 .5 0 7 7 .0 0 6 8 . 5 0 - 8 8 .0 0 - 4 8 3 3 7 9 4 7 1 4 4 6 9 79 555 2 8 3 66 71 1 - - - - - -
8 ,7 0 2 3 8 .5 7 4 .5 0 7 4 .5 0 6 5 . 0 0 - 8 4 .0 0 - 2 0 4 953 2 0 4 1 2 5 0 7 1 8 4 5 7 13 2 3 2 146 53 4 3 - - - - -
1 ,2 2 2 3 7 .5 7 5 .0 0 7 4 .0 0 6 5 . 0 0 - 8 3 .5 0 - - 1 39 2 8 4 3 88 241 91 6 8 6 5 - - - - - — -
1 ,2 9 0 3 8 .5 7 8 .5 0 7 7 .5 0 7 0 . 5 0 - 8 7 .5 0 - 29 2 61 4 3 7 3 42 1 6 7 35 14 4 3
See foo tn otes at end o f tab le .
Digitized for FRASER http://fraser.stlouisfed.org/ Federal Reserve Bank of St. Louis

10Table A-l. Office Occupations—United States---- Continued
(A v e ra g e s tra ig h t -t im e w eek ly h ou rs and ea rn in gs fo r s e le c te d o ccu p a tion s b y in du stry d iv is io nin a ll m e tro p o lita n a re a s , F e b ru a ry 1965 1)
Sex, occupation, and industry division
WOMEN - CONTINUEDDUPLICATING-MACHINE OPERATORS(MIMEOGRAPH OR DITTO I --------------
MANUFACTURING---------------------NONMANUFACTURING------------------
PUBLIC UTILITIES4---------------WHOLESALE TRADE ----------------FINANCE5--------------------------
KEYPUNCH OPERATORS* CLASS A --------MANUFACTURING---------------------NONMANUFACTURING------------------
PUBLIC UTILITIES4---------------WHOLESALE T R A D E ----------------RETAIL TRADE --------------------FINANCE5--------------------------S E R V I C E S -------------------------
KEYPUNCH OPERATORS, CLASS B --------MANUFACTURING---------------------NONMANUFACTURING------------------
PUBLIC UTILITIES4---------------WHOLESALE TRAOE ----------------RETAIL TRADE --------------------F IN A N C E 5------------------------------------------S E R V I C E S -------------------------
OFFICE GIRLS --------------------------MA NUFACTURING---------------------NONMANUFACTURING-----------------
PUBLIC UTILITIES4---------------WHOLESALE T R A D E ----------------RETAIL T R A D E --------------------FINANCE5--------------------------S E R V I C E S -------------------------
SECRETARIES---------------------------MANUFACTURING ---------------------NONMANUFACTURING-----------------
PUBLIC UTILITIES4---------------WHOLESALE TRADE ----------------RETAIL T R A D E --------------------FINANCE5--------------------------S E R V I C E S -------------------------
STENOGRAPHERS* G E N E R A L --------------MANUFACTURING ---------------------NONMANUFACTURING------------------
PUBLIC UTILITIES4---------------WHOLESALE TRADE ----------------RETAIL T R A D E --------------------FINANCE5--------------------------SE R V I C E S -------------------------
STENOGRAPHERS, S E N I O R ---------------MANUFACTURING---------------------NONMANUFACTURING------------------
PUBLIC UTILITIES4---------------WHOLESALE TRADE ----------------RETAIL T R A D E --------------------FINANCE5--------------------------S E RV IC ES-------------------------
Numb er of workers receiving straight-time weekly earnings of—
N um b erof
w oxkers
$ $ $ $ $ $ $ $ $ $ $ $ $ $ $ Sw e e k lyh o u rs2
(s tan d ard ] M e a n 3 M e d ia n 3 M id d le r a n g e 3Under$
4 0and
50 60 70 80 90 100 110 120 130 140 150 160 170 180 190
and40 under
50 60 70 80 90 100 110 120 130 140 150 160 170 180 190 over
$ $ $ $2 ,6 7 0 3 9 .0 7 2 .0 0 7 0 .0 0 6 1 . 0 0 - 8 3 .0 0 - 48 538 753 516 423 272 102 17 3 - — — — — - —
1 ,2 7 2 3 9 .5 7 7 .0 0 7 5 .0 0 6 4 . 0 0 - 8 9 .0 0 - 3 168 327 248 235 2 02 71 16 3 - - - - - - -
1 ,3 9 8 3 8 .5 6 8 .0 0 6 6 .0 0 5 8 .5 0 - 7 6 .5 0 - 45 370 426 268 188 70 31 1 - - - - - - - -
3 50 3 8 .0 7 0 .0 0 6 7 .0 0 6 0 . 5 0 - 7 7 .0 0 - - 78 130 67 40 18 16 1 - - - - - - - -
259 4 0 .0 6 6 .5 0 6 3 .5 0 5 8 .0 0 - 7 3 .0 0 - 5 84 82 46 34 - 8 - - - - - - - - -
410 3 8 .0 6 3 . 50 6 2 .5 0 5 6 .0 0 - 6 9 .5 0 25 134 157 56 31 7 “ - - “ - -
3 1 ,0 8 8 3 9 .0 8 7 .5 0 8 7 .0 0 7 7 . 0 0 - 9 8 .0 0 . _ 14 383 245 0 6911 8390 6288 4 55 7 1495 4 37 154 9 - 1 - - _
1 3 ,3 1 0 3 9 .5 9 0 .5 0 9 0 .0 0 8 0 .5 0 - 1 0 0 .5 0 - - 70 587 2 43 7 3588 3168 2312 828 257 57 5 - 1 - - -
1 7 ,7 7 8 3 8 .5 8 5 .5 0 8 4 .5 0 7 5 . 0 0 - 9 5 .5 0 - 14 313 1862 4 47 4 4 803 3120 2 2 4 4 668 180 97 4 - - - - -
4 ,2 9 4 3 9 .5 9 6 .0 0 9 8 .0 0 8 6 .0 0 - 1 0 6 .0 0 - - 1 185 577 648 893 1393 401 123 73 - - - - - -
2 ,8 4 1 3 9 .5 8 7 .5 0 8 6 .5 0 7 8 . 0 0 - 9 7 .0 0 - - 31 197 624 867 589 382 107 35 9 - - - - - -
1 ,3 7 9 3 9 .0 8 2 .0 0 8 2 .5 0 7 3 . 5 0 - 9 1 .5 0 - 4 24 193 3 29 438 298 66 22 5 - - - - - - -
7 ,8 5 7 3 8 .0 7 9 .5 0 7 9 .0 0 7 1 . 5 0 - 8 7 .0 0 - 10 257 1246 2624 2452 927 236 105 - - - - - - - -
1 ,4 0 7 3 8 .5 8 8 .5 0 8 8 .5 0 7 9 .5 0 - 9 7 .0 0 ~ 43 321 397 412 167 32 17 15 4 - - -
4 8 , 864 3 9 .0 7 4 .5 0 7 2 .5 0 6 4 . 0 0 - 8 3 .5 0 _ 2 75 6 596 1 35 09 12829 7993 437 3 2347 727 2C4 11 _ _ _ _ _ _
1 6 ,9 7 2 3 9 .5 7 8 .5 0 7 7 .0 0 6 8 .0 0 - 8 9 .0 0 - - 1235 3756 4 68 4 3 376 2301 1042 441 131 7 - - - - - -
3 1 ,8 9 2 3 8 .5 7 2 .5 0 7 0 .5 0 6 2 .5 0 - 8 0 .5 0 - 275 5362 9753 8145 4 61 7 2072 1306 286 73 4 - - - - - -
7 ,1 1 8 3 9 .0 8 0 .5 0 7 7 .5 0 6 8 . 0 0 - 9 2 .5 0 - 2 317 1861 171 9 1276 706 999 220 18 - - - - - - -5 ,1 9 1 3 9 .5 7 5 .5 0 7 5 .0 0 6 6 . 5 0 - 8 3 .5 0 - 14 * 609 1152 1627 1113 450 175 18 32 - - - - - — -
3 ,9 7 3 3 9 .0 6 9 .0 0 6 8 .0 0 6 1 . 0 0 - 7 6 .5 0 - 23 793 1471 103 0 431 164 35 26 - - - - - - — -
1 3 ,2 9 6 3 8 .0 6 7 .5 0 6 6 .5 0 5 9 . 5 0 - 7 4 .0 0 - 237 3312 4 797 3155 1205 515 68 8 - - - - - - - -2 ,3 1 4 3 9 .0 7 5 .0 0 7 6 .0 0 6 6 . 0 0 - 8 4 .0 0 - - 330 473 613 592 237 29 14 23 4 - - - - -
1 2 ,6 7 0 3 8 .5 6 3 .5 0 6 2 .0 0 5 6 .0 0 - 6 9 .0 0 3 398 4 990 4 41 4 1 689 656 383 88 49 _ _ _ _ _ _ _ _
3 ,2 2 3 3 9 .5 6 8 .5 0 6 6 .5 0 5 8 .5 0 - 7 5 .5 0 - 41 955 981 640 325 199 42 41 - - - - - - - -
9 ,4 4 7 3 8 .5 6 2 .0 0 6 1 .0 0 5 5 . 0 0 - 6 7 .0 0 3 3 57 4035 3 434 1 050 331 184 46 8 - - - - - - - -
1 ,6 1 6 3 8 .5 7 0 .0 0 6 6 .5 0 6 1 . 5 0 - 7 4 .5 0 - 3 258 825 219 127 137 42 6 - - - - - - - -
1 ,0 7 3 3 9 .5 6 3 .0 0 6 1 .0 0 5 5 .0 0 - 6 9 .0 0 - 16 4 80 331 148 87 6 3 2 - - - - - - - -
1 , C60 3 9 .0 6 0 .5 0 6 0 .5 0 5 5 .0 0 - 6 4 . 50 3 37 465 413 108 31 2 1 - - - - - - - - -4 ,9 9 1 3 8 .0 5 9 .5 0 5 9 .0 0 5 4 .0 0 - 6 4 .5 0 - 2 82 2536 1651 469 43 11 - - - - - - - - - -
707 3 8 .5 6 3 .0 0 6 1 .0 0 5 5 . 0 0 - 7 0 .0 0 - 19 298 214 106 43 28 ~ “ - - - - -
2 0 5 ,8 6 7 3 8 .5 1 0 2 .5 0 1 0 2 .0 0 8 9 .0 0 - 1 1 6 .0 0 _ 56 1204 5734 15338 31987 4 03 65 3 93 60 3 30 26 19290 10932 5222 1864 989 332 121 519 0 ,0 9 4 3 9 .0 1 0 6 .5 0 1 0 6 .0 0 9 3 .0 0 - 1 1 9 .0 0 - - 92 1246 4 88 0 11415 1 64 66 17988 17115 9979 6145 2918 1 059 516 174 86 18
1 1 5 ,7 7 3 3 8 .0 1 0 0 .0 0 9 9 .0 0 8 6 .5 0 - 1 1 3 .0 0 - 56 1111 4 48 9 1 04 58 2 0573 2 39 00 21374 15911 9311 4787 2303 8 04 473 158 35 331 8 ,3 4 1 3 8 .5 1 1 0 .0 0 1 1 0 .0 0 9 6 .5 0 - 1 2 2 .0 0 - - 23 179 830 1773 2685 3 68 6 3987 2405 1328 876 320 156 64 14 171 9 ,5 1 7 3 8 .5 1 0 1 .0 0 1 0 1 .0 0 8 8 .0 0 - 1 1 5 .5 0 - 16 107 686 1580 3092 3941 3 591 3142 1731 1059 331 169 64 9 1 -
1 0 ,1 2 1 3 9 .0 9 3 .0 0 9 2 .5 0 8 1 .5 0 - 1 0 5 .5 0 - 16 186 679 1365 2203 2132 1552 1078 562 238 81 20 3 4 - 34 3 ,6 0 6 3 8 .0 9 5 .0 0 9 4 .0 0 8 3 .0 0 - 1 0 6 .5 0 - 11 678 2 409 5436 9132 9 618 7751 4 208 2408 1133 503 122 129 54 6 82 4 ,1 8 8 3 7 .5 1 0 2 .0 0 1 0 0 .5 0 8 9 .5 0 - 1 1 4 .0 0 - 13 117 536 1247 4372 5524 4 79 4 3496 2206 1030 5 12 173 121 27 14 5
9 6 ,8 7 8 3 9 .0 8 1 .5 0 8 0 .5 0 7 0 . 0 0 - 9 2 .0 0 7 234 6158 17332 23 572 2 24 72 1 35 48 9637 3124 624 168 3 _ _ _ _
4 2 ,0 2 5 3 9 .0 8 4 .5 0 8 4 .0 0 7 4 . 0 0 - 9 5 .5 0 - 11 1152 5402 9692 10785 7651 5844 1092 272 125 - - - - - -
5 4, 854 3 8 .5 7 8 .5 0 7 7 .0 0 6 7 . 5 0 - 8 8 .5 0 7 223 5007 11931 13880 1 16 87 5 897 3793 2032 352 43 3 - - - - -
1 4 ,2 4 3 3 9 .0 8 8 .5 0 8 7 .5 0 7 4 .0 0 - 1 0 4 .0 0 - - 339 2081 2591 2 872 1968 2 550 1599 2 20 24 - - - - - -
8 ,9 5 5 3 9 .0 7 9 .5 0 8 0 .0 0 6 9 . 0 0 - 9 0 .0 0 - 8 745 1628 2 118 222 9 1406 522 229 64 4 3 - - - - -
3 ,8 7 7 3 9 .0 7 2 .5 0 7 2 .5 0 6 4 . 5 0 - 8 1 .0 0 7 48 494 1068 1205 669 302 52 22 12 - - - - - - -
2 2 ,9 5 4 3 8 .0 7 2 .5 0 7 2 .0 0 6 4 . 0 0 - 8 1 .0 0 - 162 3232 6527 6 663 4 563 1486 2 94 27 - - - - - - - -
4 ,8 2 6 3 8 .5 8 2 .5 0 8 2 .0 0 7 2 .5 0 - 9 1 .0 0 " 7 197 627 1305 1 35 4 735 375 154 56 15 - - " -
5 8 , 922 3 9 .0 9 3 .5 0 9 3 .0 0 8 3 .0 0 - 1 0 4 .5 0 _ _ 279 2 766 7 710 1 37 88 1 41 56 1 1 8 9 4 5545 2332 317 109 19 5 2 _ _
3 0 ,5 2 4 3 9 .5 9 6 .5 0 9 6 .5 0 8 6 .0 0 - 1 0 7 .0 0 - - 93 686 3042 6575 7405 7345 3570 1555 211 39 5 - - - -2 8 ,3 9 8 3 8 .5 9 0 .5 0 9 0 .0 0 8 C .0 0 - 1 0 0 .5 0 - - 186 2081 4 6 6 9 7212 6751 4 55 0 1975 777 106 70 14 5 2 - -
5 ,7 2 3 3 9 .5 9 9 .0 0 9 9 .0 0 8 8 .0 0 - 1 0 9 .5 0 - - 3 95 538 1042 1 304 1 397 811 432 50 47 2 1 - - -
3 ,7 2 7 3 9 .0 9 4 .5 0 9 4 .5 0 8 4 .0 0 - 1 0 6 .0 0 - - 9 226 428 721 940 766 4 59 142 30 6 - - - - -
1 ,4 9 4 3 9 .5 8 6 .0 0 8 7 .0 0 7 9 . 0 0 - 9 4 .0 0 - - 13 132 269 500 387 133 51 9 - - - - - - -
1 1 ,7 0 4 3 8 .0 8 4 .0 0 8 4 .0 0 7 4 . 5 0 - 9 2 .5 0 - - 143 1 40 0 2 88 3 3602 2 5 2 9 9 10 199 33 - 8 - - - - -
5 ,7 5 0 3 8 .5 9 4 .0 0 9 4 .0 0 8 5 .5 0 - 1 0 3 .5 0 - - 18 228 551 1346 1593 1345 455 161 26 9 12 4 2 - -
See footn otes at end o f ta b le .
Digitized for FRASER http://fraser.stlouisfed.org/ Federal Reserve Bank of St. Louis

11
Table A-l. Office Occupations—United States----Continued
(A v e ra g e s tr a ig h t -t im e w eek ly h ou rs and earn in gs fo r s e le c te d o ccu p a tion s b y in du stry d iv is io nin a ll m e tro p o lita n a re a s , F e b ru a ry 1965 *)
W e e k ly e a r n in g s 2 (s ta n d a rd ) Numb er of workers receiving straight-time weekly earnings of—
N um b erof
w o rkers
A v e rag e $ * $ $ $ $ $ S $ $ $ % 4 % $ $w e e k lyh o u rs2
(stan dard ' M e a n 3 M e d ia n 3 M id d le ra n g e 3Under(40
4 0and
under
50 60 70 80 90 100 110 120 130 140 1 50 160 170 1 80 190
and
50 60 70 80 90 100 110 120 1 30 140 150 160 170 180 190 over
$ $ $ $3 2 ,3 0 0 3 9 ,5 7 7 .5 0 7 8 .0 0 6 4 . 5 0 - 9 1 .5 0 557 1383 4 089 4 55 5 732 3 5435 4 9 0 0 2722 1051 2 34 43 5 — 2 — — —
8 ,2 7 4 3 9 .5 8 8 .0 0 8 7 .0 0 7 7 .5 0 - 9 9 .5 0 1 - 182 466 2311 1710 1 620 1 21 7 618 132 11 5 - 2 - — -2 4 , 026 3 9 .5 7 4 .0 0 7 3 .5 0 6 0 . 5 0 - 8 8 .0 0 556 1 383 3908 4092 5012 3725 3 27 9 1505 4 32 102 32 - - - - — —
3 ,7 2 4 3 9 .0 9 4 .0 0 9 6 .0 0 8 7 .5 0 - 1 0 2 .5 0 - - 62 154 2 82 578 140 5 987 214 24 19 - — - - - —2 ,2 3 3 3 8 .5 8 2 .0 0 8 3 .0 0 7 1 . 5 0 - 9 3 .5 0 - - 200 284 452 602 4 0 0 186 77 21 12 - - - - - -4 ,6 0 3 3 9 .5 6 5 .0 0 6 4 .5 0 5 6 . 0 0 - 7 4 .0 0 6 397 1233 1387 897 491 148 21 23 - - - - - - - -6 ,4 2 3 3 8 .0 7 7 .0 0 7 6 .0 0 6 8 . 0 0 - 8 6 .5 0 - 98 513 126 8 1995 1411 866 188 77 8 - - — - — — —7 ,0 4 3 4 0 .5 6 4 .0 0 6 1 .5 0 5 2 . 0 0 - 7 6 .0 0 551 887 1900 999 1387 644 461 124 41 49 1 - “ ~ “
2 9 ,4 0 2 3 9 .0 7 7 .0 0 7 6 .5 0 6 7 . 0 0 - 8 7 .0 0 _ 125 2756 6485 765 4 680 6 3482 1306 589 176 12 9 _ - - - -
1 3 ,9 4 4 3 9 .5 7 8 .0 0 7 8 .0 0 6 9 . 0 0 - 8 8 .0 0 - 6 1026 2 750 394 8 3405 1 8 3 6 645 244 82 2 1 - - — - -1 5 ,4 5 9 3 9 .0 7 6 .0 0 7 5 .5 0 6 5 . 5 0 - 8 6 .5 0 - 123 1730 373 6 3705 3401 1 645 6 63 344 94 10 8 - - - - -
1 ,9 5 1 3 9 .5 8 1 .5 0 8 0 .0 0 6 8 . 5 0 - 9 5 .5 0 - 11 156 378 437 356 264 1 69 168 13 - - - - - - -5 ,7 7 4 3 9 .0 7 8 .0 0 7 8 .0 0 6 8 . 5 0 - 8 8 .0 0 - - 498 1 150 1512 1463 726 2 50 107 62 - 8 - - — — —
2 ,8 0 0 4 0 .0 6 8 .5 0 6 6 .0 0 6 0 .0 0 - 7 5 .0 0 - 68 628 1 104 482 275 149 61 22 l 10 - - — - — -
2 ,6 4 7 3 8 .0 7 4 .0 0 7 3 .0 0 6 5 .0 0 - 8 3 .0 0 - 17 308 732 700 615 201 59 15 - - - - - - — -
2 ,2 8 7 3 8 .5 7 9 .0 0 8 0 .5 0 7 0 . 5 0 - 8 8 .5 0 27 142 372 574 694 305 1 24 33 18 “ ~ ~ -
1 ,4 4 5 3 9 .0 1 1 0 .0 0 1 0 8 .0 0 9 6 .5 0 - 1 2 3 .5 0 _ _ 5 1 27 122 3 30 291 227 192 202 37 9 2 _ _ _696 3 9 .5 1 1 4 .5 0 1 1 5 .5 0 1 0 1 . 0 0 -1 3 0 .0 0 - - 5 - 2 44 114 123 123 108 150 22 5 - - - -
750 3 8 .5 1 0 5 .5 0 1 0 3 .0 0 9 4 .0 0 - 1 1 7 .5 0 - - - 1 25 79 217 169 104 84 52 15 4 2 - - -
4C9 3 7 .5 1 0 0 .CO 9 9 .0 0 9 1 .5 0 - 1 0 8 .5 0 “ 1 15 69 135 104 54 21 11 ~ 1 ~ ~
7 ,3 6 1 3 8 .5 9 0 .5 0 9 0 .0 0 8 0 .5 0 - 1 0 0 .0 0 _ 81 534 1111 2009 181 9 101 0 4 6 3 206 107 20 2 _ _ _ _2 ,0 7 2 3 9 .5 9 8 .0 0 9 8 .5 0 8 7 .5 0 - 1 0 8 .0 0 - - 5 43 209 346 511 547 191 149 59 13 - - - - -
5 ,2 8 9 3 8 .0 8 7 .5 0 8 7 .5 0 7 8 .5 0 - 9 5 .0 0 - - 77 491 902 1663 1 307 463 2 72 57 48 7 2 - - - -
2 ,7 0 3 3 8 .0 8 8 .0 0 8 8 .0 0 7 8 .0 0 - 9 5 .5 0 - - 45 300 426 781 6 34 270 191 35 18 2 - - - - -651 3 9 .5 8 6 .5 0 8 4 .0 0 7 8 .0 0 - 9 6 .0 0 - - - 44 159 220 131 49 32 14 1 2 - - - - -
37 8 3 9 .5 8 7 .5 0 9 0 .0 0 8 0 . 5 0 - 9 7 .5 0 - - 10 10 63 106 152 32 5 - - - - - - - -
1 ,3 2 2 3 7 .5 8 5 .5 0 8 6 .5 0 7 8 . 5 0 - 9 2 .5 0 ~ 23 133 215 519 2 97 84 19 7 25 ~ ~
5 ,3 3 6 3 8 .5 7 4 .0 0 7 3 .0 0 6 4 .5 0 - 8 2 .0 0 _ 27 453 1718 1546 937 4 30 140 7 4 10 _ _ _ _ _ _ _935 3 9 .5 8 2 .5 0 8 1 .5 0 7 2 .5 0 - 9 2 .5 0 - - 31 145 246 2 4 9 150 85 22 8 - - - - — - -
4 ,4 0 1 3 8 .0 7 2 .5 0 7 1 .0 0 6 4 .0 0 - 8 0 .0 0 - 27 421 1575 1300 689 280 55 52 2 - - - - - - -
2 ,2 1 9 3 8 .C 7 3 .0 0 7 1 .0 0 6 4 . 0 0 - 8 0 .0 0 - - 163 858 653 346 150 23 28 1 - - - - - - -
4 17 3 9 .5 7 4 .5 0 7 4 .0 0 6 4 . 5 0 - 8 3 .0 0 - - 28 144 110 55 73 8 — - - - - - - — -
321 3 9 .0 7 5 .5 0 7 6 .5 0 6 8 . 5 0 - 8 3 .5 0 - - 21 71 113 86 21 10 — - - - - - — - -
1 ,3 2 2 3 7 .5 6 9 .5 0 6 9 .0 0 6 2 . 0 0 - 7 7 .5 0 27 209 461 388 198 25 4 10 ~ ~ “
2 2 ,6 0 2 3 8 .5 7 5 .0 0 7 4 .0 0 6 5 .0 0 - 8 4 .5 0 _ 75 3C80 5665 5688 4672 2 402 729 227 31 31 2 2 _ _ _7 ,2 4 1 3 9 .0 7 7 .5 0 7 7 .0 0 6 9 . 0 0 - 8 7 .0 0 - 3 565 1 44 9 2 1 7 6 1657 9 86 3 04 7 0 14 18 - - - — — -
1 5 ,3 6 1 3 8 .5 7 3 .5 0 7 2 .0 0 6 3 . 0 0 - 8 3 .5 0 - 72 2516 4 216 3513 3 014 1415 425 15T 17 13 2 2 - - - -704 3 9 .5 9 1 .0 0 9 2 .5 0 7 9 .0 0 - 1 0 4 .5 0 - - 14 67 104 138 124 180 72 3 3 - - - - - -
3 ,6 8 6 3 9 .0 7 5 .5 0 7 5 .0 0 6 5 . 0 0 - 8 7 .0 0 - - 468 921 775 855 534 99 29 6 - - - - - - -612 3 9 .5 7 3 .0 0 7 3 .0 0 6 3 . 5 0 - 8 2 .5 0 - 12 75 156 156 158 52 3 1 - - - - - - - -
8 ,6 8 3 3 8 .0 7 0 .5 0 6 9 .0 0 6 1 .5 0 - 7 9 .0 0 - 60 1762 2 805 2 019 1415 4 56 107 45 8 3 2 2 - - - -1 ,6 7 5 3 9 .0 7 7 .5 0 7 7 .0 0 6 8 .5 0 - 8 8 .0 0 197 266 4 59 4 49 250 37 10 - 7 - ~ “ ~
4 9 ,4 2 1 3 8 .5 8 2 .0 0 8 1 .0 0 7 2 .0 0 - 9 1 .0 0 - 22 1699 8178 1 33 85 1 29 36 7315 4 0 9 8 1 43 4 294 47 4 2 4 4 _ _
2 0 ,4 0 8 3 9 .5 8 6 . CO 8 5 .0 0 7 6 . 5 0 - 9 6 .0 0 - - 246 1 939 4 7 0 8 5945 3943 2 60 2 911 87 13 4 2 4 4 - -
2 9 , 013 3 8 .0 7 9 .0 0 7 7 .5 0 6 9 . 5 0 - 8 7 .5 0 - 22 1454 6239 8677 6991 3372 1495 5 23 2 07 34 - - - - - -4 ,4 9 3 3 9 .0 8 5 .0 0 8 3 .5 0 7 2 . 0 0 - 9 7 .5 0 - - 95 804 1021 1009 575 555 310 107 18 - - - - - -
2 ,7 8 9 3 9 .0 8 3 .5 0 8 3 .5 0 7 4 . 5 0 - 9 2 .0 0 - - 58 358 681 867 5 10 207 85 19 7 - - - - - -1 ,5 6 9 3 9 .5 7 6 .0 0 7 4 .0 0 6 7 .5 0 - 8 4 .5 0 - - 66 486 483 311 151 56 13 3 - - - - - - -
1 5 ,2 0 2 3 7 .5 7 4 .5 0 7 4 .5 0 6 7 . 0 0 - 8 2 .0 0 - 22 1120 4 0 4 0 5325 3353 1138 178 24 3 - - - - - - -
4 ,9 6 0 3 8 .0 8 4 .5 0 8 4 .5 0 7 4 . 5 0 - 9 4 .0 0 ~ 115 552 1 168 1452 999 5 00 91 75 9 * “ ~ ~
Sex, occupation, and industry division
WOMEN - CONTINUED
SWITCHBOARD OPERATORS----------------MA NUFACTURING---------------------NONMANUFACTURING -----------------
PUBLIC UTILITIES4--------------WHOLESALE TRADE ----------------RETAIL T R A D E -------------------FINANCE5-------------------------SERVICES ------------------------
SWITCHBOARD OPERATOR-RECEPTION ISTS-M AN UFACTURING--------------------NONMANUFACTURING -----------------
PUBLIC UTILITIES4--------------WHOLESALE T R A D E ----------------RETAIL T R A D E -------------------FINANCE5 -------------------------S E R V I C E S ------------------------
TABULATING-MACHINE OPERATORS,CLASS A ------------------------------
MA NU FACTURING--------------------NONMANUFACTURING -----------------
FINANCE5-------------------------
TABULATING-MACHINE OPERATORS,CLASS B ------------------------------
MANU FA CT UR IN G---------------------NONMANUFACTURING-----------------
PUBLIC UTILITIES4---------------WHOLESALE TRADE ----------------RETAIL TRADE -------------------FINANCE5-------------------------
TABULATING-MACHINE OPERATORS,CLASS C -------------------------------
MANUFACTURING---------------------NONMANUFACTURING-----------------
PUBLIC UTILITIES4---------------WHOLESALE T R A D E ----------------RETAIL TRADE --------------------FINANCE5--------------------------
TRANSCRIBING-MACHINE OPERATORS,GENERAL ------------------------------
MANUFACTURING ---------------------NONMANUFACTURING -----------------
PUBLIC UTILITIES4---------------WHOLESALE TRADE ----------------RETAIL T R A D E --------------------FINANCE5--------------------------S E R V I C E S ------------------------
TYPISTS, CLASS A ---------------------MANUFACTURING ---------------------NONMANUFACTURING-----------------
PUBLIC UTILITIES4---------------WHOLESALE T R A D E ----------------RETAIL TRADE --------------------FINANCE5--------------------------S E R V I C E S -------------------------
S ee foo tn otes at end o f table.
Digitized for FRASER http://fraser.stlouisfed.org/ Federal Reserve Bank of St. Louis

12
Table A-l. Office Occupations—United States— Continued
(A v e ra g e s tra ig h t-t im e w eek ly h ou rs and earn ings fo r s e le c te d o ccu p a tio n s by in du stry d iv is io n in a ll m e tro p o lita n a re a s , F e b ru a ry 1965 f )
W e e k ly e a rn in g s 1 2 (s ta n d a rd ) Number of workers receiving straight-time weekly earnings of—
Sex, occupation, and industry divisionN um b er
ofw o rkers
A v e rag ew e e k lyh o u rs2
(s ta n d a rd ) M e a n 3 M e d ia n 3 M id d le r a n g e 3Under$40
$40
andunder
$5C
$60
$70
S80
$90
$100
$110
(120
$130
$ $140 150
$160
$170
$180
$190
and
50 60 70 80 90 100 110 120 130 140 150 160 170 180 190 over
WOMEN - CONTINUED
TW rtl TTf n ACC O 106,250 38.5$68.00
$67.00 59.5C- 75.50 1525 26885 35303 303 721Tr1j 1j » LLAj O o
MANUFACTURING --------------------- 31,401 39.5 73.50 72.00 64.50- 81.00 - 28 4216 9350 9360 4825 1845 1493 230 53 _ _ _ _ _ _ _NONMANUFACTURING ----------------- 74,849 38.5 66.00 65.00 58.00- 73.00 - 1498 22668 25953 16362 6111 1418 748 73 19 - - _ _ _ _
PUBLIC UTILITIES4--------------- 6,368 39.0 75.50 73.50 65.00- 83.50 - 16 654 1921 1769 921 482 568 37 l - - _ _ _ _WHOLESALE TRADE ---------------- 9,742 39.0 68.50 68.00 60.00- 76.50 - 40 2385 3C66 2696 1074 379 80 12 12 - - - _ _ _ _ .RETAIL T R A D E -------------------- 6,979 39.5 65.00 64.50 57.00- 72.50 - 24C 2051 2475 1425 645 97 35 10 2 - _ _ _ _ _FINANCE5-------------------------- 43,382 38.0 63.50 63.00 56.50- 69.50 - 1115 15831 16140 8003 2048 224 21 - - - - _ _ _ _ _SERVICES ------------------------- 8,378 38.5 69.50 70.00 61.00- 78.00 88 1747 2352 2469 1424 237 43 14 4
1 A v e ra g e m onth o f r e fe r e n c e . D ata w e re co l le c te d during the p e r io d July 1964 through June 1965.2 Standard h ou rs r e f le c t the w ork w eek fo r w h ich em p lo y e e s re c e iv e th e ir re g u la r s tra ig h t-t im e s a la r ie s and the ea rn in gs co r re s p o n d to th ese w eek ly h o u rs .3 The m ean is com p u ted fo r ea ch jo b by totalin g the earn ings o f a ll w o rk e r s and d iv id ing b y the num ber o f w o rk e r s . The m edian d es ig n a tes p o s it io n — h a lf o f the e m p lo y e e s su rvey ed r e c e iv e m o re
than the ra te show n; h a lf r e c e iv e le s s than the rate show n. The m id dle range is defin ed b y 2 ra tes o f pay; a fourth o f the w o rk e r s ea rn le s s than the lo w e r o f these ra tes and a fou rth ea rn m o re than the h igh er ra te .
4 Transportation, communication, and other public utilities.5 F in a n ce , in su ra n ce , and re a l esta te .
Digitized for FRASER http://fraser.stlouisfed.org/ Federal Reserve Bank of St. Louis

13
Table A-2. Office Occupations—Northeast
(A v e ra g e s tra ig h t -t im e w eek ly h ou rs and ea rn in gs fo r s e le c te d o ccu p a tio n s b y in d u stry d iv is io nin the N o r th e a s t ,1 F e b ru a ry 1 96 5 2)
W eekly earnings 3 (standard)
N um ber o f w o rk e r s rec e iv in g stra igh t-tim e_weekly earnings of—
Number Average t S * t $ $ $ $ $ $ $ $ $ $ t $ $w eek ly 3 0 4 0 5 0 6 0 7 0 8 0 9 0 1 0 0 1 1 0 1 2 0 1 3 0 1 4 0 1 5 0 1 6 0 1 7 0 1 8 0 1 9 0
workers hours3[standard] M ean 4 M edian 4 M iddle ran ge4 and
under - - - - - - - - - - - - - - - and
4 0 5 C 6 0 7 0 8 0 9 0 1 0 0 n o 1 2 0 1 3 0 1 4 0 1 5 0 1 6 0 1 7 0 1 8 0 1 9 0 over
$ $ $ $3 6 5 3 8 . 0 9 5 . 5 0 1 0 0 . 5 0 8 5 . 5 0 - 1 0 7 . 5 0 - - - 3 4 2 7 6 5 9 1 4 2 4 0 - - 2 1 - - - —3 C 2 3 8 . 0 9 6 . 5 0 1 0 3 . 0 0 8 6 . 0 0 - 1 0 8 . 0 0 ~ “ 3 2 6 6 5 3 7 1 3 4 3 4 ~ 2 1 “ -
2 9 3 3 8 . 5 1 0 4 . 0 0 1 0 6 . 5 0 1 0 0 . 5 0 - 1 1 4 . 5 0 - - - 2 3 0 7 2 9 1 0 4 9 2 1 0 1 8 - - - - - -
3 0 1 3 7 . 5 8 0 . 5 0 8 1 . 5 0 7 2 . 5 0 - 8 9 . 0 0 - - 2 1 4 3 6 5 1 0 3 4 4 8 1 6 1 - - - - - - -
7 , 8 6 5 3 8 . 0 1 1 3 . 5 0 1 1 3 . 5 0 9 9 . 0 0 - 1 2 7 . 5 0 - - 1 4 1 2 1 7 5 9 3 1 2 2 9 1 4 3 0 1 4 0 9 1 3 1 6 8 6 3 4 1 4 1 7 5 5 0 6 6 3 5 2 73 , 7 5 6 3 9 . 0 1 1 7 . 5 0 1 1 8 . 0 0 1 0 1 . 5 0 - 1 3 2 . 0 0 - - - 5 8 9 2 1 0 5 2 4 6 0 4 5 6 3 7 2 4 5 5 2 2 5 8 1 1 5 2 9 4 9 2 0 1 54 , 1 0 9 3 7 . 0 1 1 0 . 0 0 1 0 9 . 5 0 9 7 . 5 0 - 1 2 2 . 5 0 - - 1 3 6 1 2 8 3 8 5 7 0 5 8 2 6 8 4 6 5 9 1 3 1 1 1 5 6 6 0 2 1 1 7 1 5 1 21 , 2 5 4 3 8 . 5 1 1 5 . 5 0 1 1 6 . 5 0 1 0 6 . 5 0 - 1 2 4 . 5 0 - - - - 8 4 0 1 2 0 2 3 2 4 4 8 2 2 6 1 0 3 5 3 1 1 5 9 - -
9 5 2 3 7 . 0 1 1 4 . 5 0 1 1 1 . 5 0 9 8 . 5 0 - 1 3 0 . 0 0 - - - - 1 6 7 8 1 8 6 1 6 9 1 5 3 1 1 3 1 2 1 6 3 1 9 3 6 1 5 1 22 5 4 3 7 . 5 1 0 2 . 5 0 1 0 1 . 5 0 9 1 . 5 0 - 1 2 0 . 0 0 - - 1 - 1 6 4 0 5 8 5 7 1 8 4 9 6 2 6 1 - - —
1 , 0 6 2 3 6 . 0 1 0 2 . 0 0 1 0 2 . 0 0 8 8 . 5 0 - 1 1 6 . 0 0 - - - 2 9 8 4 1 9 1 1 7 8 2 0 7 1 5 6 1 5 7 3 1 2 8 1 - - - -5 8 6 3 7 . 0 1 0 9 . 0 0 1 0 3 . 5 0 9 7 . 5 0 - 1 1 9 . 5 0 “ 7 4 3 5 1 6 3 1 6 2 7 2 4 7 5 0 1 0 2 3 1 2 2 - -
5 , 7 7 0 3 8 . 0 9 1 . 5 0 8 9 . 5 0 7 7 . 5 0 - 1 0 5 . 5 0 - 4 Ill 5 4 6 1 0 1 5 1 2 7 4 8 8 5 9 7 7 4 8 6 2 4 6 1 9 4 2 0 1 4 2 _ _
1 , 9 3 0 3 8 . 5 9 7 . 0 0 9 6 . 0 0 8 2 . 5 0 - 1 0 9 . 5 0 - 1 7 1 3 7 2 2 6 4 0 2 3 1 2 3 9 2 1 8 2 1 7 6 6 1 1 9 1 4 2 - - -3 , 8 4 0 3 7 . 5 8 8 . 5 0 8 7 . 0 0 7 5 . 0 0 - 1 0 2 . 0 0 - 3 1 0 4 4 0 8 7 8 9 8 7 1 5 7 3 5 8 4 3 0 3 7 0 1 3 3 1 - - - - -1 , 1 5 4 3 9 . 0 1 0 3 . 0 0 1 0 3 . 0 0 9 4 . 5 0 - 1 1 2 . 5 0 - - 3 3 4 9 2 9 9 1 9 8 3 9 9 1 5 3 4 5 1 3 0 1 - - - - -
8 1 3 3 7 . 5 8 7 . 0 0 8 5 . 5 0 7 5 . 5 0 - 9 8 . 5 0 - - 1 6 8 6 1 6 8 2 4 7 1 1 1 8 2 7 9 2 0 3 - - - - - -1 , 2 7 0 3 6 . 0 7 9 . 5 0 7 8 . 0 0 7 0 . 5 0 - 8 9 . 0 0 - - 6 0 2 4 1 4 0 1 2 6 9 1 6 8 6 4 6 3 4 - — - - - - -
3 9 5 3 7 . 0 8 4 . 5 0 8 6 . 0 0 7 8 . 5 0 - 9 2 . 0 0 ~ 1 3 1 1 8 3 1 6 6 8 6 3 5 1 - - - ~
4 3 3 3 9 . 0 1 0 2 . 0 0 9 7 . 0 0 8 4 . 0 0 - 1 1 4 . 0 0 - - - 1 4 7 2 7 1 1 0 3 4 6 4 3 2 5 1 7 1 5 1 2 2 1 3 _ _
2 7 4 3 8 . 5 9 1 . 0 0 9 2 . 5 0 7 8 . 0 0 - 9 9 . 5 0 1 4 7 2 3 9 8 6 3 1 2 3 9 - - - - - -
5 2 3 3 8 . 0 8 2 . 0 0 8 0 . 5 0 7 0 . 0 0 - 9 2 . 5 0 _ 4 4 8 8 2 1 1 7 1 1 5 7 7 3 6 2 3 2 1 _ - _ _ _ _
2 8 8 3 7 . 0 7 5 . 0 0 7 5 . OC 6 4 . 0 0 - 8 5 . 5 0 - 4 4 6 6 1 6 4 6 0 4 6 4 3 - - -
3 4 2 3 7 . 0 6 8 . 5 0 6 5 . 0 0 6 0 . 5 0 - 7 7 . 5 0 - 1 7 9 1 4 8 3 3 3 8 4 0 2 _ _ _ _ _ _ _ _ _
2 6 6 3 6 . 5 6 4 . 5 0 6 3 . 0 0 5 9 . 0 0 - 6 8 . 0 0 ~ 1 7 9 1 4 1 1 6 5 2 3 “ - -
4 , 1 0 5 3 8 . 5 1 0 5 . 0 0 1 0 1 . 0 0 8 8 . 0 0 - 1 2 2 . 5 0 - - 5 2 8 6 3 2 9 6 9 4 8 3 1 5 0 9 4 4 9 5 2 3 2 8 1 1 3 7 8 3 7 5 4 9 8 22 , 2 3 2 3 9 . 5 1 1 2 . 0 0 1 1 1 . 0 0 9 0 . 5 0 - 1 2 9 . 5 0 - - 1 6 1 7 1 9 8 3 0 2 2 9 8 2 5 9 2 3 0 3 8 7 2 0 9 1 2 1 7 9 6 7 4 5 4 21 , 8 7 2 3 8 . 0 9 7 . 0 0 9 6 . 5 0 8 6 . 0 0 - 1 1 0 . 0 0 - - 3 6 6 9 1 3 1 3 9 0 5 3 3 2 5 0 2 1 9 1 3 6 7 2 1 6 4 8 4 4 -1 , 6 8 9 3 8 . 0 9 7 . 5 0 9 7 . 0 0 8 6 . 0 0 - 1 1 1 . 0 0 - “ 3 2 5 8 1 0 3 3 7 2 4 5 7 2 2 7 2 0 7 1 2 6 7 1 1 6 4 8 4 4
1 , 5 3 3 3 8 . 5 1 0 5 . 5 0 1 C 3 . 0 0 8 9 . 0 0 - 1 2 1 . 0 0 - _ 3 1 9 1 2 4 2 8 2 2 4 3 2 8 6 1 6 7 1 6 8 1 0 7 1 0 4 1 8 1 1 _ 1 _
9 2 9 3 9 . 0 1 0 9 . 0 0 1 0 5 . 0 0 9 0 . 0 0 - 1 2 5 . 5 0 - - 2 1 1 6 7 1 5 1 1 4 6 1 4 0 9 4 1 2 0 7 0 1 0 1 1 6 1 1 - - -6 0 5 3 8 . 0 1 0 0 . CO 1 0 0 . 5 0 8 7 . 0 0 - 1 1 1 . 5 0 - - 1 8 5 6 1 3 1 9 7 1 4 6 73 4 8 3 8 3 2 - - 1 -2 5 5 3 8 . 5 1 0 5 . 5 0 1 0 6 . 0 0 8 9 . 5 0 - 1 1 9 . 5 0 ~ ~ ~ 2 2 0 4 3 2 3 6 2 44 3 0 2 4 3 2 1
5 5 3 3 7 . 0 7 5 . 5 0 7 3 . 5 0 6 8 . 0 0 - 8 2 . 5 0 _ 7 3 3 1 3 7 2 1 0 6 8 6 7 1 7 1 3 1 _ _ _ _ _ _
4 0 0 3 6 . 5 7 5 . 0 0 7 3 . 0 0 6 8 . 0 0 - 8 1 . 5 0 7 2 5 9 8 1 5 8 4 5 3 9 1 5 1 3 1 - - -
9 , 4 0 2 3 7 . 0 6 5 . 5 0 6 3 . 5 0 5 7 . 5 0 - 7 1 . 5 0 - 2 0 8 3 1 9 6 3 3 4 8 1 5 2 3 5 1 7 3 5 7 230 22 1 - _ _ _ _ _ _
3 , 3 7 0 3 7 . 5 6 5 . 5 0 6 4 . 0 0 5 8 . 0 0 - 7 2 . 5 0 - 3 9 1 0 6 0 1 2 2 4 6 5 8 2 3 3 1 2 0 18 1 7 - - - - — - - -6 , 0 3 2 3 7 . 0 6 5 . 0 0 6 3 . 0 0 5 7 . 5 0 - 7 1 . 0 0 - 1 6 9 2 1 3 6 2 1 2 4 8 6 6 2 8 3 2 3 8 2 1 2 5 1 - - - - - - -1 , 0 2 9 3 8 . 0 7 8 . 5 0 7 3 . 5 0 6 3 . 0 0 - 9 6 . 5 0 - 8 1 7 1 2 5 8 1 4 2 8 0 1 6 1 2 0 9 3 - - - - - - - -
8 7 3 3 7 . C 6 4 . OC 6 5 . 0 0 5 7 . 5 0 - 7 1 . 0 0 - - 2 9 3 3 3 2 2 0 2 2 4 1 9 - 2 1 - - - - — - -3 4 2 3 7 . 0 6 0 . 5 0 5 9 . 5 0 5 6 . 0 0 - 6 5 . 0 0 - 8 1 7 9 1 0 6 33 1 3 - 3 - - - — - - - - —
2 , 4 3 5 3 6 . 5 6 2 . 5 0 6 1 . 5 0 5 6 . 5 0 - 6 7 . 5 0 - 8 8 9 6 1 9 3 3 3 2 9 6 6 5 8 - - - - - - - - - -1 , 3 5 4 3 7 . 0 6 2 . 5 0 6 1 . 5 0 5 6 . 5 0 - 6 8 . 5 0 ~ 6 5 5 3 2 4 9 6 1 6 0 1 0 1 ~ ~ ~ - -
Sex, occupation, and industry division
BILLERS, MACHINE (BILLINGMACHINE I -------------------------
NONMANUFACTURING -------------
BOOKKEEPING-MACHINE OPERATORS, CLASS A --------------------------
BOOKKEEPING-MACHINE OPERATORS,
CLERKS, ACCOUNTING, CLASS A ---MANUFACTURING ----------------NONMANUFACTURING-------------
PUBLIC UTILITIES5---- -------WHOLESALE TRADE -----------RETAIL T R A D E ---------------FINANCE6---------------------S E R V I C E S --------------------
CLERKS, ACCOUNTING, CLASS B ---MANUFACTURING----------------NONMANUFACTURING-------------
PUBLIC UTILITIES5----------WHOLESALE TRADE ------------f- INANCE6---------------------S E R V I C E S --------------------
CLERKS, FILE, CLASS A ----------NONMANUFACTURING-------------
CLERKS, FILE, CLASS 8 ----------NONMANUFACTURING-------------
CLERKS, FILE, CLASS C ----------NONMANUFACTURING -------------
CLERKS, ORDER --------------------MANUFACTURING ----------------NONMANUFACTURING-------------
WHOLESALE T R A D E ------------
CLERKS, P A Y R O L L ------------------MANUFACTURING ----------------NONMANUFACTURING -------------
PUBLIC UTILITIES5----------
OUPLICATING-MACHINE OPERATORS(MIMEOGRAPH OR D I T T O ) ---------
NONMANUFACTURING-------------
OFFICF BOYS ----------------------MANUFACTURING ----------------NONMANUFACTURING-------------
PUBLIC UTILITIES5----------WHOLESALE T R A D E ------------RETAIL T R A D E ---------------FINANCE6---------------------SERVICES --------------------
See foo tn o te s at end o f ta b le .
220-617 0 - 6 6 - 2
Digitized for FRASER http://fraser.stlouisfed.org/ Federal Reserve Bank of St. Louis

14
Table A-2. Office Occupations—Northeast— Continued
(A v e ra g e s tra ig h t-t im e w eek ly hours and ea rn in gs fo r s e le c te d o ccu p a tio n s b y in du stry d iv is io nin the N o r th e a s t ,1 F e b ru a ry 1965 2)
Sex, occupation, and industry division
MEN - CONTINUED
SECRETARIES---------------------------
TABULATING-MACMINE OPERATORS*
MANUFACTURING ---------------------NONMANUFACTURING------------------
PUBLIC UTILITIES5---------------FINANCE6--------------------------
TABULATING-MACHINE OPERATORS*CLASS B -------------------------------
MANUFACTURING — -------------------NONMANUFACTURING------------------
PUBLIC UTILITIES5---------------WHOLESALE TRADE ----------------FINANCE6--------------------------
TABULATING-MACHINE OPERATORS*CLASS C -------------------------------
MANUFA CT UR IN G---------------------NONMANUFACTURING ------------------
FINANCE6--------------------------
TYPISTS* CLASS A ---------------------NONMANUFACTURING------------------
TYPISTS* CLASS B ---------------------NONMANUFACTURING------------------
WOMEN
BILLERS* MACHINE (BILLINGMACHINE) -----------------------------
MANUFACTURING---------------------NONMANUFACTURING ------------------
PUBLIC UTILITIES5---------------WHOLESALE TRADE ----------------RETAIL T R A D E --------------------
BILLERS* MACHINE (BOOKKEEPINGM A C H I N E ) -----------------------------
MANUFACTURING ---------------------NONMANUFACTURING -----------------
RETAIL TRADE --------------------S E R V I C E S -------------------------
BOOKKEEPING-MACHINE OPERATORS*
MANUFACTURING ---------------------NONMANUFACTURING------------------
WHOLESALE TRAOE ----------------FINANCE6--------------------------
BOOKKEEPING-MACHINE OPERATORS*CLASS B -------------------------------
MANUFACTURING---------------------NONMANUFACTURING------------------
WHOLESALE TRADE ----------------RETAIL T R A D E --------------------FINANCE6--------------------------S E R V I C E S -------------------------
Number of workers receiving straight-time weekly earnings of—
Number Avenge $ $ $ * J * i ) i $ * $ $ $ $ $ Sweekly 30 40 50 60 70 80 90 100 110 120 130 140 150 160 170 180 190
workers hours3(standard) Mean4 Median4 Middle range 4 and
under - - - - - - - - - - - - - - - and
40 50 60 70 80 90 100 110 120 130 140 150 160 1/0 180 190 over
$ $ $ $412 38.0 116.00 112.50 94.50-133.50 ~ 7 13 45 48 75 60 48 54 12 13 16 9 6 6
2,948 38.0 113.50 112.00 101.00-125.00 _ _ _ _ 32 211 435 663 620 411 298 159 76 24 11 91,424 39.0 116.50 116. 00 104.00-127.50 - - - - 4 71 175 275 329 266 115 115 55 13 - 6 -1,524 37.5 110.50 108.50 98.00-122.50 - - - - 28 140 260 388 292 145 183 44 21 11 11 3 -
288 39.5 127.50 129.50 117.00-137.50 — - - - - - 6 27 63 52 96 26 15 - 3 - -891 37.0 103. 50 104.50 93.50-112.50 ~ 27 127 196 278 153 56 53 1 ~ 1 “
4,730 37.5 96.00 95.50 84.00-106.50 _ _ 1 236 525 960 1141 999 417 2 89 138 22 2 _ _ _1,739 38.5 99.00 99.00 87.50-109.50 - — - 46 148 316 406 411 149 180 62 20 2 - - - -2,991 37.0 94.00 94.00 82.50-104.50 - - 1 190 378 644 736 587 268 109 76 2 - - - - -
534 39.0 105.50 105.50 99.00-114.00 - - - 12 15 28 93 195 125 39 27 1 - - - — _405 37.5 96.50 96.50 85.50-107.00 - - - 14 22 94 116 80 49 24 6 1 - - _ - -
1,641 36.5 89.50 88.50 78.50- 99.00 152 301 414 397 252 57 34 34 “ - **
2*128 37.5 78.50 77.00 68.50- 87.00 _ 1 128 487 649 469 190 153 50 . _ _ _596 38.5 81.50 81.00 73.00- 90.00 - - 20 86 174 170 75 47 24 - - - - - - - —
1,532 37.0 77.00 75.00 67.50- 85.50 - 1 108 401 475 299 115 106 26 - - - - - - - _949 36.5 74. 50 73.00 66.50- 82.00 91 263 325 181 56 34 “ - - - - - -
344 37.5 98.00 99.50 86.50-110.00 - - - 7 27 70 74 79 81 4 1 _ _ _ _ _ _261 36.5 101.00 103.00 93.00-112.00 ~ ~ 6 8 42 58 65 78 3 - - - - - -
517 38.0 78.50 80.00 71.00- 85.50 _ 1 31 76 152 175 32 47 3 _ _ _ _ _ _ _ _391 38.0 79.50 80.50 72.50- 86.00 1 5 51 124 153 19 36 2 “ ~ ~ ~
3,591 38.0 76.00 74.00 65.50- 88.50 101 338 981 709 661 507 186 97 121*384 38.5 77.00 77. 50 67.00- 87.50 - 6 119 338 291 369 165 64 32 2 - - - - - _ _2,207 37.5 75.00 72.50 64.50- 89.50 - 95 219 644 418 292 342 121 65 10 - - - - - - _
332 39.0 84.50 82.00 68.50- 99.50 - - 17 76 66 25 65 28 48 5 - - - - - - -755 37.5 80.00 78.50 68.50- 93.50 - - 60 178 153 77 185 82 16 4 - - - - - - _479 37.5 58.00 61.00 51.00- 67.50 95 129 189 59 8 ~ ~ -
2*310 38.0 73.50 74.00 61.00- 85.50 31 518 375 527 491 308 38 19 3646 38.0 76.50 76.50 65.50- 87.50 - - 108 96 165 156 82 22 13 3 - - - - - - _
1*665 37.5 72.00 73.00 59.50- 84.50 - 31 410 278 362 336 226 16 6 - - - - - - - -912 38.5 66.50 65.00 57.00- 76.50 - 22 319 209 189 154 21 - - - - - - - - - _274 38.0 69.50 71.50 58.50- 79.50 9 75 39 85 53 12 1 ~ • - -
3,325 38.0 87.50 89.50 79.00- 97.50 _ 63 297 524 823 1006 401 135 49 27 1 _ _ .1,425 38.5 90.00 91.50 83.00- 97.50 - - 11 63 173 380 564 130 68 29 9 1 - - - _ _1,900 37.5 86.00 85.50 76.00- 98.00 - - 52 235 351 444 442 271 67 20 18 _ - _ _ _ _
568 37.5 92.00 93.50 80.50-103.50 - - - 17 121 86 145 130 41 10 18 - - - - - _926 37.0 81.50 82.00 71.00- 94.00 37 181 183 239 190 69 16 10 - - - -
8,865 38.0 72.50 72.00 62.50- 82.50 _ 70 1482 2395 2297 1522 819 207 56 17 1 . . _ _2,521 38.5 76.00 76.00 67.50- 85.50 - 10 239 531 789 569 279 67 27 8 l - _ _ _ _ —6,344 37.5 71.00 70.00 61.50- 81.00 - 60 1243 1864 1508 953 540 140 29 9 - - - - - _ _1,549 38.5 76.00 78.00 67.50- 87.50 - - 189 276 390 383 257 41 11 2 - - - - — - -
991 38.5 67.00 67.00 58.50- 76.00 - 20 283 318 181 163 26 3 - - - - - - - - -3,258 37.5 68.00 66.50 60.00- 76.00 - 35 748 1190 780 296 164 40 2 2 - - - - - - -
299 37.5 80.00 78.50 70.00- 96.00 - 5 18 53 84 49 51 26 14 - - - - - - - -
See foo tn otes at end o f table.
Digitized for FRASER http://fraser.stlouisfed.org/ Federal Reserve Bank of St. Louis

15
Table A-2. Office Occupations—Northeast---- Continued
(A v e ra g e s tra ig h t-t im e w eek ly hours and ea rn in gs fo r s e le c te d occu p a tio n s b y in du stry d iv is io nin the N o r th e a s t ,1 F e b ru a ry 1965 2)
Sex, occupation, and industry division
WOMEN - CONTINUED
CLERKS* ACCOUNTING, CLASS A --------MA NU FA CT UR IN G---------------------NONMANUFACTURING -----------------
PUBLIC UTILITIES5---------------WHOLESALE TRADE ----------------RETAIL T R A D E --------------------FINANCE6--------------------------S E R V I C E S ------------------------
CLERKS, ACCOUNTING, CLASS B --------MANUFACTURING ---------------------NONMANUFACTURING -----------------
PUBLIC UTILITIES5---------------WHOLESALE TRAOE ----------------RETAIL T R A D E --------------------FINANCE6-------------------------SERVICES ------------------------
CLERKS, FILE, CLASS A ---------------MA NU FACTURING---------------------NONMANUFACTURING ------------------
WHOLESALE TRADE ----------------FINANCE6--------------------------
CLERKS, FILE, CLASS B ---------------MA NUFACTURING---------------------NONMANUFACTURING------------------
PUBLIC UTILITIES5---------------WHOLESALE TRADE ----------------RETAIL TRADE --------------------FINANCE6--------------------------S E R V I C E S -------------------------
CLERKS, FILE, CLASS C ---------------MANUFACTURING ---------------------NONMANUFACTURING-----------------
PUBLIC UTILITIES5---------------WHOLESALE TRADE ----------------RETAIL T R A D E --------------------FINANCE6--------------------------S E R V I C E S -------------------------
CLERKS, ORDER ------------------------MANUFACTURING---------------------NONMANUFACTURING-----------------
WHOLESALE TRADE ----------------RETAIL T R A D E --------------------
CLERKS, P A Y R O L L ----------------------MA NUFACTURING---------------------NONMANUFACTURING-----------------
PUBLIC UTILITIES5---------------WHOLESALE T R A D E ----------------RETAIL T R A D E --------------------F I N A N C E --------------------------S E R V I C E S -------------------------
Number of workers receiving straight-time weekly earnings of—
Average % $ $ $ $ $ $ $ $ $ $ $ $ $ t $ $weekly 30 40 50 60 70 80 90 100 110 120 130 140 150 160 170 180 190
woikers hours3 Mean4 Median 4 Middle range4 and(iUnJiiJ)under ~ ~ and
40 50 60 70 80 90 100 110 120 130 140 150 160 170 180 190 over
$ $ $ $11,600 38.0 95.50 94.50 85.00-107.00 - - 87 417 1329 2404 2 877 2140 1347 635 252 105 6 2 - - -4,737 39.0 98.50 98.00 88.50-109.00 - - 11 35 400 883 1277 1063 547 348 143 29 1 2 - - -6,862 37.5 93.50 92.50 82.50-104.50 - - 76 382 929 1522 1600 1077 800 2 87 109 76 5 - - - -1,684 38.0 99.50 94.50 89.50-111.50 - - - 22 64 349 542 229 321 100 38 20 - - - - -
898 37.5 100.50 101.00 90.00-110.00 - - 1 9 48 170 177 268 90 50 47 33 5 - - - -1,078 38.0 88.50 89.00 77.50-101.00 - - 44 63 194 278 204 192 64 18 - 22 - - - - -2,351 37.0 86.00 84.50 75.50- 95.50 - - 29 268 564 628 432 218 148 54 9 - - - - - -
852 36.5 100.50 100.00 91.50-112.50 - 2 19 59 97 247 170 178 65 15 1 - - - - -
20,471 38.0 76.00 74.50 65.50- 85.00 _ 238 1965 5113 5597 4381 1925 667 397 148 28 10 3 _ _ _6,669 39.0 79.50 78.50 70.00- 88.00 - - 409 1273 1946 1668 749 328 181 109 7 2 - - - - -
13,802 37.0 74.00 73.00 64.00- 83.50 - 238 1557 3840 3652 2714 1176 340 217 39 21 8 3 - - - -3,535 37.0 80.00 79.50 68.00- 89.50 - - 198 851 773 862 478 174 158 34 7 1 - - - - _2,043 37.5 79.00 80.00 70.50- 89.00 - - 138 346 548 560 359 53 21 1 12 4 2 - - - -3,513 37.5 69.00 69.00 61.00- 78.00 - 20 2 570 1088 951 504 95 57 36 4 2 3 1 - - - _3,368 36.5 69.00 68.00 61.50- 76.50 - 33 594 1311 886 386 123 36 - - - - - - - _ -1,344 37.0 76.50 76.50 70.50- 84.00 3 56 244 495 403 121 19 2 - * - - -
3,511 37.5 82.00 81.50 71.50- 90.00 _ 11 93 647 849 1051 396 259 126 61 16 2 _ _ _ _1,173 38.5 85.50 83.50 75.00- 95.00 - 11 22 165 220 402 130 99 81 31 10 - 2 - - - _2,338 36.5 80.50 80.00 70.50- 89.00 - - 71 482 630 649 266 159 45 30 6 - - - - _ _
298 36.5 85.00 86.50 79.50- 91.50 - - - 26 52 134 53 24 8 1 - - - - _ _ _1,481 36.5 78.00 76.50 68.50- 86.50 - 50 375 447 387 139 65 10 6 1 - - - - - -
11 ,480 37.5 67.00 65.00 58.50- 74.50 _ 244 3199 3949 2300 1144 411 159 62 13 _ _ _ _ _ _ _2,777 38.5 73.50 71. 50 63.00- 82.50 - - 432 855 642 461 198 126 56 7 - - - - - - _8, 703 37.0 65.00 63.50 57.50- 72.00 - 244 2766 3095 1658 683 212 33 6 6 - - - - - - -
435 38.5 82.50 85.50 73.50- 91.00 - - 20 35 123 136 80 30 4 6 - - - - - - _796 38.0 69.00 68.00 61.00- 77.50 - - 162 292 174 133 33 1 1 - - - - - - _ _946 38.0 59.50 58.00 53.00- 65.50 - 39 514 251 120 18 3 - - - - - - - - - _
5,546 36.5 64.00 63.00 57.50- 70.50 - 185 1777 2154 1018 331 77 2 1 - - - - _ _ _ _980 37.5 65.50 64.00 58.50- 72.00 19 292 362 223 65 19 - - - - - -
11,749 37.0 61.50 60.50 55.00- 67.50 _ 665 5054 3877 1477 473 185 15 4 _ _ _ _ _ _ _2,287 38.0 66.50 64. 50 58.00- 75.00 - 56 721 676 405 320 93 15 3 - - - - - - _ _9,462 37.0 60.00 59.50 54.50- 65.50 - 609 4333 3201 1072 154 92 - 1 - - - - - _ _ -
651 38.0 70.00 68.50 62.50- 77.00 - - 109 270 145 35 92 - 1 - - - - - _ _ _625 37.0 65.50 67.00 60.50- 73.50 - - 138 232 189 66 - - - - - - - - - _ _
1,240 38.0 55.00 54.00 50.50- 60.50 - 262 656 272 38 11 - - - - - - - - - _ _6,300 36.5 59.50 59.50 54.50- 64.50 - 293 3103 22C9 654 42 - - - - - - - - - _ _
647 37.5 .58.50 58.50 55.50- 64.50 - 54 329 219 46 “ ~ ~ - - - - - -
6,141 38.5 77.00 75.50 66.50- 86.00 - 17 657 1364 1791 1215 572 289 90 126 12 2 6 2 _ _ _
3,341 38.5 79.50 78. 50 68.00- 89.50 - - 306 647 858 727 376 254 64 90 11 2 4 2 _ _ _
2, 800 38.0 73.50 73.00 65.00- 81.50 - 17 350 716 933 488 196 35 26 36 1 - 2 - _ _ _1,546 38.0 76.50 76.00 67.50- 84.00 - - 104 405 470 364 131 17 20 32 1 - 2 - _ _ _1,105 38.5 70.00 71.50 62.00- 76.50 - 17 210 245 444 110 63 11 4 1 - - - - - -
10,197 38.5 82.50 81.50 70.50- 93.50 _ 29 783 1672 2233 2224 1585 891 469 195 81 32 3 _ _ _ _
6,337 39.0 81.00 81.00 69.00- 92.50 - - 551 1124 1352 1417 976 494 217 114 66 26 - - _ _ _3,860 37.5 84.00 83.50 72.00- 96.00 - 29 232 548 881 808 609 397 252 81 15 6 3 _ _ - _
853 38.0 88.00 87.00 74.50-101.50 - - 42 98 138 251 95 83 104 35 5 1 - - - _ _427 38.0 91.50 91.00 79.50-102.00 - - 5 12 97 86 109 50 45 18 2 1 2 - _ _ _
1,095 38.0 75.00 75.00 65.00- 85.00 - 21 124 265 335 150 141 33 16 5 3 2 - - - _ _843 36.5 86.50 85.00 74.00- 99.50 - 2 34 96 193 168 149 130 60 6 3 1 1 _ _ _ _
642 37.5 86.00 86.00 73.50- 99.00 - 6 26 76 117 152 116 102 26 17 2 1 - - - - -
See fo o tn otes at end o f table.
Digitized for FRASER http://fraser.stlouisfed.org/ Federal Reserve Bank of St. Louis

16
Table A-2. Office Occupations—Northeast— Continued
(A v e ra g e s tra ig h t-t im e w eek ly hours and earn in gs fo r s e le c te d o ccu p a tion s by in du stry d iv is io nin the N o r th e a s t ,1 F e b ru a ry 1965 2)
Sex, occupation, and industry division
Weekly earnings3 (standard) N u m b e r o f w o rk e r s re c e iv in g s t ra ig h t - t im e w e e k ly e a rn in g s o f—
Number Average $ $ $ $ $ $ $ $ $ $ $ $ $ $ $ $ $weekly 3 0 4 0 50 6 0 7 0 8 0 9 0 100 n o 120 1 3 0 1 4 0 1 5 0 1 6 0 1 7 0 1 8 0 1 9 0
workers hours3[standard) Mean4 Median 4 Middle range 4 and
u n d e r - - - - - - - - - - - - - - - and
4 0 5 0 60 7 0 80 9 0 100 110 120 1 3 0 1 4 0 1 5 0 1 6 0 1 7 0 180 1 9 0 o v e r
$ $ $ $7 , 6 0 5 3 7 . 5 8 3 . 0 0 8 2 . 0 0 7 2 . 0 0 - 9 4 . 5 0 - 10 3 5 3 1122 1 9 4 5 1 7 7 7 1 2 7 9 7 5 1 2 5 6 1 0 4 5 3 — - - - -2 , 3 2 4 3 8 .0 8 6 . 5 0 8 5 . 0 0 7 5 . 5 0 - 9 7 . 0 0 - - 85 2 1 7 5 0 8 59 3 5 0 2 2 2 7 12 5 6 4 3 - - - - — -5 , 2 8 1 3 7 . 5 8 1 . 5 0 8 0 . 0 0 7 1 . 0 0 - 9 2 . 5 0 - 10 2 6 8 9 0 5 1 4 3 7 1 1 8 4 7 7 8 5 2 4 1 3 1 4 0 2 3 - - - - -
7 3 0 3 8 . 5 9 5 . 5 0 9 8 . 5 0 8 8 . 5 0 - 1 0 4 . 0 0 - - 10 3 6 61 9 0 2 3 3 2 4 5 54 1 - - - - - - -9 4 2 3 8 . 5 8 2 . 5 0 8 1 . 0 0 7 1 . 0 0 - 9 3 . 5 0 - - 3 202 2 4 0 2 2 8 14 1 9 2 12 2<t - - - - - - -
2 , 7 7 0 3 7 . 0 7 7 . 0 0 7 7 . 0 0 6 8 . 5 0 - 8 6 . 5 0 - 10 2 2 7 5 2 9 9 3 9 6 4 7 2 5 3 101 5 0 10 2 3 - - - - -5 3 0 3 6 . 0 8 0 . 0 0 7 9 . 50 6 8 . 0 0 - 8 9 . 5 0 - - 22 1 3 0 1 1 7 1 3 6 4 7 6 7 6 5 - - - - - - -3 1 0 3 6 . 5 8 6 .0 0 8 7 . 5 0 7 4 . 5 0 - 9 5 . 0 0 ~ 6 7 81 8 3 1 0 5 1 9 9 ~ ~ “ - ~
7 3 9 3 8 . 5 7 0 . 5 0 6 9 .0 0 6 0 . 5 0 - 7 9 . 0 0 12 1 5 9 2 2 5 1 6 8 9 9 6 3 12 1 _ _ _ _ _ _ _ _
4 6 6 3 9 . 0 7 3 . 0 0 7 1 . 0 0 6 2 . 0 0 - 8 2 . 5 0 - - 88 1 3 2 1 1 4 6 9 51 12 1 - - - - - - - -2 7 3 3 7 . 5 6 6 . 5 0 6 6 .5 0 5 8 . 5 0 - 7 4 . 0 0 12 71 94 54 3 0 12 ~ “ - - -
9 , 2 3 8 3 8 . 0 8 5 . 5 0 8 5 . 5 0 7 7 . 0 0 - 9 4 . 0 0 _ - 122 6 8 3 2 2 7 1 2 8 9 9 2 0 6 3 8 2 9 2 5 6 90 2 3 3 _ _ _ _4 , 3 9 2 3 9 . 0 8 6 .0 0 8 5 . 0 0 7 7 . 5 0 - 9 4 . 0 0 - - 54 2 6 5 1 0 8 5 1 4 2 1 1 0 4 0 3 5 9 1 1 3 4 5 8 3 - - - - -4 , 8 4 7 3 7 .5 8 5 . 5 0 8 5 . 5 0 7 6 . 5 0 - 9 3 . 5 0 - - 68 4 1 9 1 1 8 6 1 4 7 8 1 0 2 3 4 7 0 1 4 3 4 5 15 - — - - - -1 , 1 3 4 3 9 . 0 9 6 . 0 0 9 6 . 5 0 8 8 . 0 0 - 1 0 4 . 0 0 - - - 2 3 9 9 2 2 8 3 3 8 2 9 8 9 9 37 12 - - - - - -
5 7 4 3 8 . 0 8 9 . 0 0 8 8 .0 0 7 9 . 0 0 - 9 7 . 0 0 - - - 3 7 1 1 8 1 8 0 1 1 4 81 33 8 3 - - - - - -3 7 6 3 7 . 5 8 3 . 5 0 8 5 . 0 0 7 5 . 0 0 - 9 3 . 5 0 - - 3 2 7 100 100 1 3 2 1 4 - - - - - - - - -
2 , 4 3 7 3 6 . 5 8 0 . 0 0 8 1 . 0 0 7 3 . 0 0 - 8 8 . 0 0 - - 65 3 2 7 7 6 2 8 5 3 3 8 2 4 1 8 - - - - - - - -3 2 5 3 7 .5 8 4 . 5 0 8 4 . 0 0 7 6 . 5 0 - 9 1 . 5 0 “ 4 1 0 7 1 1 8 57 3 6 3 - - - - -
1 5 ,0 8 3 3 8 . 0 7 3 . 5 0 7 2 . 0 0 6 4 . 5 0 - 8 2 . 0 0 - 7 6 1 9 3 3 4 5 3 9 4 2 2 8 2 3 8 9 1 4 4 1 3 8 5 91 1 1 _ _ _ _ _ _5 , 2 8 5 3 8 .5 7 5 . 5 0 7 4 . 0 0 6 6 . 0 0 - 8 5 . 0 0 - - 5 4 9 1 4 1 2 1 4 2 0 1 0 0 7 7 1 5 112 6 9 1 1 - - - - - _9 , 7 9 8 3 7 . 5 7 2 . 0 0 7 1 . 0 0 6 3 . 5 0 - 8 0 . 0 0 - 76 1 3 8 2 3 1 2 7 2 8 0 8 1 3 8 3 7 2 7 2 7 4 22 - - - - - - - -2 , 3 0 0 3 7 . 5 7 8 . 0 0 7 5 . 5 0 6 7 . 0 0 - 8 9 . 0 0 - - 1 0 3 6 9 6 57 2 391 3 1 8 2 1 3 9 - - - - - - - -1 , 1 3 1 3 8 . 0 7 4 . 0 0 7 5 . 5 0 6 3 . 0 0 - 8 3 . 5 0 - 1 4 2 3 5 13 0 3 7 4 2 4 5 1 0 9 2 4 2 - - - - - - - -1 , 3 7 9 3 8 . 0 6 8 . 5 0 6 8 .0 0 6 0 . 0 0 - 7 6 . 0 0 - 13 3 3 6 4 3 6 3 8 4 1 3 7 6 7 5 — - - - - — - - -4 , 3 8 2 3 7 . 0 6 9 . 5 0 6 9 . 0 0 6 2 . 5 0 - 7 5 . 5 0 - 4 9 6 9 3 1 6 7 2 1 2 3 9 4 8 8 202 3 2 8 - - - - - - - -
6 0 6 3 7 .5 7 4 . 0 0 7 4 . 0 0 6 7 . 0 0 - 8 0 . 5 0 ~ “ 16 1 9 4 2 4 0 12 3 31 ~ 3 - - - "
4 , 4 8 2 3 7 . 5 6 4 . 0 0 6 3 . 0 0 5 7 . 5 0 - 6 9 . 0 0 - 91 1 4 8 1 1 9 7 1 5 8 3 2 0 7 1 0 9 33 8 _ _ - _ _ - _ _1 , 0 9 8 3 8 . 5 6 7 . 0 0 6 4 . 5 0 5 7 . 0 0 - 7 4 . 0 0 - 2 4 3 7 2 35 0 1 4 6 1 0 9 82 1 4 — - - - - - - - -3 , 3 8 4 3 7 . 0 6 3 . 0 0 6 2 . 5 0 5 7 . 5 0 - 6 8 . 0 0 - 66 1 1 0 9 1 6 2 0 4 3 7 98 2 7 1 9 8 - - - — - - - -
6 4 7 3 7 . 5 6 8 .0 0 6 6 .0 0 6 2 . 0 0 - 6 9 . 5 0 - - 6 7 4 4 6 58 2 9 2 3 1 8 6 - - - - - - - _2 5 2 3 8 . 0 6 5 . 0 0 6 1 . 5 0 5 4 . 0 0 - 7 4 . 5 0 - - 1 1 9 4 1 4 6 42 1 1 2 - - - - - - _ _3 6 9 3 8 . 0 6 1 . 0 0 6 1 . 0 0 5 6 . 0 0 - 6 4 . 5 0 - 20 1 3 3 1 7 3 30 1 3 - - - - - - - - - _
1 , 8 2 7 3 6 . 5 6 2 . 0 0 6 2 . 0 0 5 7 . 0 0 - 6 7 . 0 0 36 6 5 7 8 6 7 2 5 5 9 3 “ - - - - - - -
8 2 ,7 8 8 3 7 . 5 10 3 . 5 0 1 0 2 . 5 0 9 0 . 5 0 - 1 1 6 . 0 0 - 3 211 1 6 3 8 5 9 4 4 1 2 4 1 9 1 7 0 5 4 1 6 7 9 4 1 3 0 6 3 7 5 4 6 3 9 9 8 2 2 9 4 9 2 6 5 6 9 19 9 9 7 333 7 ,1 0 3 3 8 . 0 1 0 5 .0 0 1 0 4 .0 0 9 2 . 0 0 - 1 1 7 . 0 0 - - 1 6 4 7 9 2 2 8 0 4 9 9 1 7 5 4 4 8 0 5 7 6 1 2 1 3 5 0 1 1 9 8 6 1 1 4 7 5 2 5 2 7 5 9 4 7 9 84 5 , 6 8 5 3 7 . 0 1 0 2 .0 0 1 0 1 .0 0 8 9 . 0 0 - 1 1 4 . 5 0 - 3 1 9 4 1 1 5 9 3 6 6 6 7 4 2 9 9 5 1 1 8 7 3 7 6 9 4 2 4 0 4 5 2 C11 1 1 4 7 4 0 1 2 9 4 10 5 18 2 5
6 , 6 1 2 3 7 . 5 1 1 2 .5 0 1 1 1 .0 0 9 9 . 0 0 - 1 2 4 . 5 0 - - 3 32 2 2 8 4 8 1 1 0 1 7 1 3 6 0 1 4 4 5 8 1 2 521 4 1 2 1 4 7 101 3 7 4 128 , 6 1 3 3 7 . 0 1 0 3 .5 0 1 0 3 .5 0 9 2 . 0 0 - 1 1 6 . 5 0 - - 1 9 1 2 3 509 1 2 7 5 1 6 8 8 1 7 2 7 1 7 1 9 7 6 8 50 7 15 9 83 3 4 4 _ -2 , 9 6 3 3 7 . 5 9 5 . 5 0 9 4 . 5 0 8 4 . 0 0 - 1 0 9 . 0 0 - - 51 1 4 8 3 5 5 582 6 1 4 5 1 4 3 1 8 2 4 0 7 4 4 5 13 3 3 _ 1
1 6 ,7 7 1 3 6 . 5 9 8 . 5 0 9 7 . 0 0 8 5 . 5 0 - 1 1 1 . 0 0 - 3 100 6 7 4 1 9 6 7 3 0 6 7 3 5 9 2 2 9 6 4 2 1 0 3 1 1 6 0 53 6 3 6 6 9 5 88 4 6 2 81 0 ,7 2 7 3 6 . 5 1 0 1 .5 0 9 9 . 5 0 8 9 . 5 0 - 1 1 2 . 5 0 - - 21 1 8 3 6 0 6 2 0 2 4 2 6 0 0 2 1 7 2 1 3 5 6 1 0 6 5 3 7 4 1 6 5 63 68 1 5 12 4
3 1 , 5 5 0 3 7 . 5 8 1 . 0 0 8 0 . 5 0 7 1 . 0 0 - 9 0 . 0 0 7 9 0 1 5 9 8 5 1 9 3 8 6 2 6 8 0 9 7 4 3 9 0 2 4 7 1 868 18 8 19 3 _ _ _ _ _
1 4 ,1 4 9 3 8 . 5 8 3 . 0 0 8 3 . 0 0 7 4 . 0 0 - 9 2 . 0 0 - 11 4 7 3 1 8 4 4 3 4 1 2 4 2 6 5 2221 1 4 6 5 3 7 1 7 3 1 4 - - - - _ _
1 7 , 4 0 1 3 7 . 0 7 9 . 0 0 7 8 . 0 0 6 9 . 5 0 - 8 8 . 5 0 7 7 9 1 1 2 5 3 3 4 9 5 2 1 4 3 8 3 1 2 1 6 8 1 0 0 8 4 9 7 1 1 5 5 3 _ _ - _
3 , 3 5 6 3 7 . 5 8 9 . 5 0 9 0 . 0 0 7 6 . 5 0 - 1 0 3 . 0 0 - - 6 4 0 7 6 3 0 6 4 7 7 0 0 5 6 2 3 4 7 56 2 - - - - - _
2 , 6 3 8 3 7 .0 8 4 . 0 0 8 5 . 5 0 7 4 . 5 0 - 9 3 . 5 0 - - 80 2 3 0 6 4 1 8 0 0 5 5 6 2 1 3 84 2 9 3 3 - _ _ _ _
1 , 3 4 5 3 7 . 0 7 2 . 5 0 7 3 . 0 0 6 6 . 5 0 - 7 9 . 5 0 7 11 1 0 9 3 9 9 5 1 8 1 9 0 87 12 8 5 - - - - _ _ _
8 , 2 3 4 3 6 . 5 7 3 . 5 0 7 3 . 5 0 6 6 . 5 0 - 8 1 . 5 0 - 6 9 8 3 6 2 1 4 5 2 8 3 9 1 7 0 8 4 9 2 1 4 0 6 - - - - - - - -1 , 8 2 9 3 7 . 5 8 1 . 5 0 8 1 . 0 0 7 3 . 5 0 - 9 0 . 5 0 " “ 93 1 6 8 5 8 8 4 8 7 3 3 4 81 52 25 ~ ~ ~ ~ “ “
WOMEN - CONTINUED
COMPTOMETER OPERATORS -------MA NU FA CT UR IN G-------------NONMANUFACTURING ---------
PUBLIC UTILITIES5-------WHOLESALE TRADE --------RETAIL T R A D E ------------FINANCE6------------------SERVICES ----------------
DUPLICATING-MACHINE OPERATORS(MIMEOGRAPH OR D I T T O ) -------
MANUFACTURING --------------NONMANUFACTURING-----------
KEYPUNCH OPERATORS, CLASS A -MANUFACTURING --------------NONMANUFACTUR I M G -----------
PUBLIC UTILITIES5--------WHOLESALE TRADE ---------RETAIL T R A D E -------------FINANCE6-------------------S E R V I C E S ------------------
KEYPUNCH OPERATORS, CLASS BMANUFACTURING ------------NONMANUFACTURING--------
PUBLIC UTILITIES5------WHOLESALE TRADE -------RETAIL T R A O E -----------FINANCE6-----------------S E R V I C E S ---------------
OFFICE G I R L S -----------------MANUFACTURING ------------NONMANUFACTURING --------
PUBLIC UTILITIES5------WHOLESALE T R A D E -------RETAIL T R A D E -----------FINANCE6-----------------
SECRETARIES------------------MANUFACTURING------------NONMANUFACTURING--------
PUBLIC UTILITIES5------WHOLESALE TRADE -------RETAIL TRADE -----------FINANCE6-----------------S E R V I C E S ----------------
STENOGRAPHERS, G E N E R A L -----MANUFACTURING------------NONMANUFACTURING --------
PUBLIC UTILITIES5------WHOLESALE T R A D E -------RETAIL T R A D E -----------FINANCE6-----------------S E R V I C E S---------------
See foo tn otes at end o f ta b le .
Digitized for FRASER http://fraser.stlouisfed.org/ Federal Reserve Bank of St. Louis

17
Table A-2. Office Occupations—Northeast— Continued
(A v e ra g e s tra ig h t -t im e w eek ly hours and earn in gs fo r s e le c te d o ccu p a tion s by in du stry d iv is io nin the N o r th e a s t ,1 F e b ru a ry 1965 2)
Sex, occupation, and industry division
WOMEN - CONTINUED
STENOGRAPHERS, S E N I O R ---------------MANUFACTURING ---------------------NONMANUFACTURING ------------------
PUBLIC UTILITIES5---------------WHOLESALE TRAOE ----------------FINANCE6--------------------------SERV I C E S -------------------------
SWITCHBOARD OPERATORS----------------MANUFACTURING---------------------NONMANUFACTURING-----------------
PUBLIC UTILITIES5---------------WHOLESALE TRADE ----------------RETAIL T R A D E --------------------FINANCE6--------------------------S E R V I C E S -------------------------
SWITCHBOARO OPERATOR-RECEPTIONISTS-MANUFACTURING ---------------------NONMANUFACTURING -----------------
PUBLIC UTILITIES5---------------WHOLESALE TRADE ----------------RETAIL T R A D E --------------------FINANCE6 --------------------------SERV I C E S -------------------------
TABULATING-MACHINE OPERATORS,a ASS A -----------------------------
MANUFACTURING ---------------------
TABULATING-MACHINE OPERATORS,CLASS B -------------------------------
MANUFACTURING---------------------NONMANUFACTURING-----------------
PUBLIC UTILITIES5---------------FINANCE6--------------------------
TABULATING-MAC HINE OPERATORS,CLASS C -------------------------------
MAN UF/C T U R I N G ---------------------NONMANUFACTURING-----------------
PUBLIC UTILITIES5---------------FINANCE6--------------------------
TRAN SCR I BING-MAC HINE OPERATORS,G E N E R A L -------------------------------
MANUFACTURING---------------------NONMANUFACTURING -----------------
WHOLESALE TRADE ----------------FINANCE6--------------------------
TYPISTS, CLASS A ---------------------MANUFACTURING---------------------NONMANUFACTURING------------------
PUBLIC UTILITIES5---------------WHOLESALE TRADE ----------------RETAIL TRADE --------------------FINANCE6--------------------------SE RV IC ES-------------------------
Number of workers receiving straight-time weekly earnings of—
Number$ $ $ $ $ $ $ $ $ S $ $ $ $ S $ $
weekly 30 4 0 50 6 0 7 0 8 0 9 0 1 0 0 1 1 0 1 2 0 13 0 1 4 0 1 5 0 1 6 0 17 0 18 0 1 9 0woikers hours3
(standard) Mean* Median4 Middle range4 andunder - - - - - - - - - - - - - - - and
4 0 5C 6 0 7 0 80 9 0 1 0 0 1 1 0 1 2 0 1 3 0 1 4 0 15 0 1 6 0 1 7 0 18 0 1 9 0 o v e r
$ $ $ $1 5 , 5 9 7 3 8 . 0 9 1 . 0 0 9 0 . 5 0 8 1 . 5 0 - 1 0 0 . 0 0 - - 1 1 4 6 6 1 2 3 6 1 4 4 4 8 4 1 6 9 2 3 0 9 9 8 4 4 1 6 1 0 1 32 3 - - - -
8 , 8 4 8 3 8 . 5 9 2 . 5 0 9 1 . 5 0 8 3 . 0 0 - 1 0 1 . 0 0 - - 62 2 8 7 1 1 3 3 2 4 4 3 2 5 2 5 1 4 0 5 6 1 4 2 8 5 7 4 18 3 - - - -6 , 7 4 9 3 7 . 0 8 9 . 0 0 8 8 . 5 0 8 0 . 0 0 - 9 8 . 0 0 - - 52 3 7 3 1 2 2 9 2 0 0 4 1 6 4 4 9 0 4 3 7 1 1 3 0 2 7 14 - - - - -1 , 0 9 2 3 7 . 5 9 6 . 0 0 9 5 . 5 0 8 6 . 0 0 - 1 0 5 . 0 0 - - - 15 1 0 9 2 6 2 2 5 8 2 6 4 1 2 8 5 5 2 - - - - - -
9 8 7 3 7 .5 9 9 . 0 0 9 9 . 0 0 9 0 . 0 0 - 1 0 9 . 5 0 - - - 1 7 7 9 15 1 2 6 2 2 4 9 1 4 6 53 2 4 6 - - - - -3 , 3 0 4 3 7 . 0 8 4 . 0 0 8 4 . 5 0 7 6 . 5 0 - 9 3 . 0 0 - - 4 3 2 9 6 7 8 9 1 0 8 3 80 3 2 3 8 29 16 - 8 - - - - -1 , 2 3 5 3 8 . 0 8 8 . 0 0 8 7 . 5 0 8 1 . 0 0 - 9 5 . 5 0 “ 8 32 2 2 8 4 7 1 2 9 3 1 3 1 6 6 5 1 - - - •
1 2 ,5 7 8 3 8 . 0 8 1 . 0 0 8 0 . 0 0 7 2 . 5 0 - 9 2 . 0 0 9 2 5 9 7 7 9 1 1 3 4 4 2 1 0 2 4 6 6 2 3 1 1 1 0 4 2 3 0 7 4 3 16 1 _ 2 - _ -3 , 7 8 7 3 9 .0 8 4 . 5 0 8 0 . 5 0 7 7 . 0 0 - 9 3 . 0 0 - - 4 0 1 0 0 1 7 3 2 7 3 0 6 7 0 3 9 0 10 6 14 2 1 - 2 - - -8 , 79 2 3 7 . 5 7 9 . 5 0 7 9 . 5 0 7 0 . 5 0 - 9 2 . 0 0 9 2 5 9 7 3 9 1 0 3 4 2 4 7 8 1 7 3 5 1 6 4 2 6 5 2 2 0 1 2 9 14 - - - - - -1 , 4 6 4 3 8 . 5 9 4 . 0 0 9 6 . 0 0 8 7 . 5 0 - 1 0 2 . 0 0 - - 17 3 7 1 1 4 2 4 7 5 6 3 3 9 9 78 7 3 - - - - - -
9 7 2 3 7 . 0 8 5 . 5 0 8 5 . 5 0 7 8 . 0 0 - 9 5 . 0 0 - - 57 32 195 3 3 6 2 1 4 9 0 2 4 1 4 1 1 - - - - - —1 , 3 7 5 3 8 . 0 6 7 . 5 0 6 8 . 5 0 5 7 . 5 0 - 7 7 . 0 0 - 1 2 7 3 0 3 3 2 0 3 6 0 1 7 7 6 4 13 1 1 - - - - - - - -2 , 8 5 0 3 6 . 5 8 0 . 5 0 8 0 . 0 0 7 1 . 5 0 - 9 0 . 0 0 - - 53 4 6 3 9 2 7 6 9 4 5 5 0 8 6 6 9 8 - - - - - - -2 , 1 3 1 3 7 . 0 7 3 . 0 0 7 3 . 5 0 6 5 . 0 0 - 8 2 . 5 0 9 1 3 2 3 1 1 1 8 3 88 2 28 1 2 5 0 6 4 19 - - -
8 ,9 5 1 3 8 . 0 7 7 . 5 0 7 8 . 5 0 6 9 . 5 0 - 8 7 . 5 0 _ 2 0 7 2 2 1 5 5 1 2 6 2 5 2 4 1 3 1 1 1 3 3 6 3 1 0 7 2 8 1 0 _ _ _ _ _ _4 , 9 8 6 3 8 . 5 7 7 . 5 0 7 8 . 5 0 6 9 . 5 0 - 8 7 . 5 0 - 6 3 9 4 8 9 8 1 4 4 0 1 3 4 5 6 3 7 1 9 7 67 3 - - - — - - -3 , 9 6 5 3 7 . 5 7 7 . 5 0 7 8 . 5 0 7 0 . 0 0 - 8 7 . 5 0 - 14 3 2 9 6 5 3 1 1 8 4 1 0 6 9 4 7 7 1 6 5 4 0 25 1 0 - - - - - -
4 4 7 3 9 . 0 7 8 . 0 0 7 8 . 0 0 6 9 . 0 0 - 8 8 . 0 0 - - 28 93 1 2 6 11 3 5 6 3 2 - - - - - - - - -1 , 5 9 3 3 8 . 0 7 9 . 5 0 8 1 . 5 0 7 2 . 5 0 - 9 0 . 0 0 - - 1 2 5 1 6 8 4 0 9 5 0 1 2 6 7 98 9 16 - - - - - — -
5 4 4 3 8 . 0 6 9 . 0 0 6 7 . 0 0 6 1 . 5 0 - 7 6 . 5 0 - 13 89 2 3 8 1 0 8 51 33 - 2 - 1 0 - - - - - -5 1 3 3 6 . 5 7 8 . 0 0 8 0 . 0 0 7 1 . 5 0 - 8 5 . 5 0 - - 41 61 1 5 0 2 2 5 2 1 - 15 - - - - - - - -8 6 7 3 7 . 5 7 8 . 5 0 7 8 . 0 0 7 3 . 0 0 - 8 6 . 5 0 “ 1 4 4 9 3 39 1 1 7 9 1 0 0 35 1 4 9 - “ “ ~ -
5 7 7 3 8 . 5 1 0 5 .5 0 1 0 3 .0 0 9 4 . 5 0 - 1 1 7 . 0 0 _ _ 5 _ 5 5 9 1 8 0 1 2 2 95 57 4 3 1 1 _ _ _ _3 2 9 3 9 . 0 1 0 5 .5 0 1 0 4 .0 0 9 5 . 5 0 - 1 1 6 . 5 0 *■ 5 1 36 91 81 58 3 4 13 9 ~ ~ “
2 , 7 2 1 3 7 . 5 8 8 . 0 0 8 8 . 5 0 7 9 . 0 0 - 9 5 . 5 0 _ _ 13 2 5 3 4 9 6 7 3 2 7 5 3 3 0 1 1 1 0 38 25 1 _ _ _ _
7 9 2 3 9 . 5 9 5 . 0 0 9 5 . 5 0 8 5 . 5 0 - 1 0 4 . 5 0 - - 5 9 85 1 7 9 2 1 4 2 1 7 4 4 3 0 8 - - - - - -1 , 9 2 9 3 6 . 5 8 5 . 0 0 8 5 . 5 0 7 6 . 5 0 - 9 3 . 0 0 - - 9 2 4 4 4 1 1 552 5 3 8 8 4 6 5 8 17 1 - - - - -1 , 0 1 4 3 6 . 0 8 5 . 0 0 8 5 . 0 0 7 5 . 5 0 - 9 2 . 5 0 - - - 1 5 8 2 2 7 2 5 2 2 7 7 4 4 43 4 9 - - - - - -
5 1 7 3 6 . 5 8 6 . 0 0 8 7 . 0 0 8 0 . 0 0 - 9 3 . 0 0 8 4 7 75 2 0 7 1 3 7 2 3 1 1 1 8 ~ ~ ~ ~ “
2 , 1 4 9 3 7 . 0 7 3 . 0 0 7 2 . 0 0 6 4 . 0 0 - 8 0 . 0 0 _ 8 2 3 4 7 0 6 6 6 2 2 9 0 18 2 3 8 29 1 _ _ _ _ _ _ _
3 0 0 3 9 . 0 8 1 . 5 0 7 8 . 5 0 7 0 . 5 0 - 9 3 . 0 0 - - 9 6 3 95 45 4 8 3 2 7 1 - - - - - - -1 , 8 4 9 3 6 . 5 7 2 . 0 0 7 1 . 0 0 6 3 . 5 0 - 7 9 . 0 0 - 8 2 2 5 6 4 3 5 6 9 2 4 6 1 3 4 6 2 2 - - - — - - - -1 , 1 1 6 3 6 . 0 7 2 . 0 0 7 0 . 0 0 6 3 . 0 0 - 7 8 . 0 0 - - 1 3 8 4 1 0 3 3 7 1 1 9 92 - 2 2 - - - — - - - -
4 7 1 3 6 . 5 7 1 . 0 0 7 2 . 0 0 6 3 . 5 0 - 7 9 . 0 0 ~ 8 49 1 5 3 1 6 4 84 1 4 ~ ~ ~ ~ ~ -
7 , 0 9 7 3 7 . 5 7 6 . 5 0 7 6 . 0 0 6 7 . 0 0 - 8 7 . 0 0 _ 1 A 7 6 3 1 5 8 4 1 8 1 4 1 6 8 9 9 3 0 2 1 1 6 6 1 2 1 0 2 2 _ _ _ _2 , 4 8 8 3 8 . 5 7 7 . 0 0 7 6 . 5 0 6 8 . 5 0 - 8 6 . 5 0 - 3 2 1 9 4 9 2 7 3 5 6 3 9 3 1 3 6 4 2 2 3 - - - - - - -4 , 6 0 9 3 7 . 0 7 6 . 5 0 7 5 . 5 0 6 6 . 0 0 - 8 7 . 0 0 - 1 1 5 4 5 1 0 9 2 1 0 7 9 1 0 5 0 6 1 7 1 4 8 45 9 1 0 2 2 - - - -1 , 1 0 4 3 7 . 5 8 3 . 0 0 8 6 . 5 0 7 6 . 5 0 - 9 3 . 0 0 - - 4 7 82 2 3 2 3 4 5 3 4 3 4 4 1 0 1 - - - - - - -2 , 7 7 7 3 6 . 5 7 3 . 5 0 7 2 . 0 0 6 4 . 0 0 - 8 3 . 0 0 7 3 7 4 8 8 3 641 5 6 9 1 9 0 7 0 27 8 3 2 2 - - -
1 6 ,6 1 2 3 7 . 5 8 1 . 0 0 8 0 . 0 0 7 2 . 0 0 - 8 9 . 5 0 - 2 4 3 9 2 6 3 3 5 1 4 2 4 4 9 1 2 3 9 3 9 5 2 3 0 9 2 1 6 2 2 4 2 4 4 _ -6 , 4 8 7 3 9 . 0 8 2 . 5 0 8 2 . 0 0 7 4 . 0 0 - 9 1 . 0 0 - - 1 1 6 7 8 8 1 7 7 4 2 0 4 1 1 1 8 3 3 9 3 1 3 6 31 1 2 4 2 4 4 - -
1 0 ,1 2 5 3 7 . 0 8 0 . 0 0 7 8 . 5 0 7 1 . 0 0 - 8 8 . 5 0 - 2 3 2 3 1 8 4 5 3 3 6 8 2 4 5 0 1 2 1 0 5 5 9 17 2 1 8 5 1 0 - - - - - -1 , 3 4 6 3 8 . 0 9 0 . 5 0 9 0 . 0 0 7 7 . 0 0 - 1 0 2 . 5 0 - - 16 17 1 2 1 3 2 6 9 2 6 0 2 2 1 9 3 10 3 - - - - - - -
7 5 8 3 7 . 0 8 6 . 0 0 8 5 . 0 0 7 6 . 5 0 - 9 6 . 0 0 - - 1 2 5 9 2 3 2 2 0 7 1 1 4 96 18 13 7 - - - - - -4 4 1 3 7 . 5 7 4 . 5 0 7 5 . 5 0 6 8 . 0 0 - 8 1 . 5 0 - - 19 1 3 2 1 6 2 1 0 0 2 3 6 - - - - - - - - -
5 , 7 5 6 3 6 . 5 7 6 . 0 0 7 6 . 0 0 6 9 . 0 0 - 8 3 . 0 0 - 2 2 7 0 1 2 9 2 2 2 4 3 1 4 1 5 4 6 3 6 4 6 3 - - - - - - -1 , 8 2 4 3 6 . 5 8 5 . 5 0 8 4 . 0 0 7 5 . 0 0 - 9 4 . 5 0 - ~ 6 1 9 2 5 1 9 4 6 0 3 5 2 1 7 2 55 6 6 3 - - - ~ -
See foo tn otes at end o f table,
Digitized for FRASER http://fraser.stlouisfed.org/ Federal Reserve Bank of St. Louis

18
Table A-2. Office Occupations—Northeast----Continued
(Average straight-time weekly hours and earnings for selected occupations by industry division in the Northeast,1 February 1965 2)
Sex, occupation, and industry division
Weekly earnings 3 (standard) N u m b e r o f w o rk e r s re c e iv in g s t ra ig h t - t im e w e e k ly e a rn in g s o f—
Number Average $ $ $ $ $ $ $ $ $ $ $ $ $ $ $ $ $weekly 30 4 0 50 6 0 70 80 9 0 1 0 0 1 1 0 1 2 0 13 0 14 0 1 5 0 16 0 17 0 180 1 9 0
workers hours3(standard) Mean4 Median4 Middle range4 and
andu n d e r ~ ~ ~ ~ " — ~ ~
4 0 5C 6 C 7 0 80 9 0 1 0 0 1 1 0 1 2 0 1 3 0 1 4 0 1 5 0 160 17 0 180 19 0 o v e r
$ $ $ $3 6 , 7 2 9 3 7 . 5 6 8 . 0 0 6 7 . 5 0 6 0 . 5 0 - 7 5 . 0 0 - 3 7 2 6 2 4 7 1 2 9 3 8 1 0 0 3 2 3 7 2 9 9 9 4 3 6 0 42 15 - - - - - _ _1 1 ,1 5 4 3 9 . 0 7 0 . 5 0 7 0 . 0 0 6 3 . 0 0 - 7 8 . 0 0 - 2 8 1 7 9 9 3 6 8 2 3 4 2 2 1 5 2 9 53 0 1 4 3 24 - - - - _ _ _ _2 5 ,5 7 5 3 7 . 0 6 7 . 0 0 6 6 .5 0 5 9 . 5 0 - 7 4 . 0 0 - 3 4 6 6 4 4 8 9 2 5 7 6 6 1 1 2 2 0 0 4 6 4 2 1 7 18 15 - - _ _ _ _ _
2 , 2 7 9 3 7 .5 7 6 . 0 0 7 6 .0 0 6 7 . 0 0 - 8 4 . 0 0 - - 18 7 58 4 73 3 4 4 9 1 6 4 1 5 4 1 0 1 - - - _ _ _ _2 , 7 6 5 3 8 . 0 7 1 . 0 0 7 1 .5 0 6 3 . 5 0 - 7 9 . 0 0 - - 4 1 1 82 9 9 4 7 4 3 2 95 33 6 1 2 - - - - - _ _2 , 1 5 5 3 8 . 0 6 4 . 5 0 6 4 .5 0 5 6 . SO - 7 2 . 0 0 - 31 7 3 6 72 1 5 0 3 1 3 3 2 3 7 1 2 - - - - - - _
1 5 ,8 6 9 3 6 . 5 6 4 .5 0 6 4 .5 0 S S . 0 0 - 7 1 . 5 0 - 30 6 4 6 6 8 6 3 5 4 3 6 5 2 8 0 8 75 5 - - - - - - - - _2 , 5 0 6 3 7 . 5 7 0 . 0 0 7 0 .5 0 6 2 . 5 0 - 7 8 . 0 0 9 4 4 7 77 1 7 7 5 3 7 8 1 0 7 18 1
CONTINUED
TYPISTS, CLASS B ------------------MANUFACTURING------------------NONMANUFACTURING--------------
PUBLIC UTILITIES5------------WHOLESALE T R A D E -------------RETAIL TRADE -----------------FINANCE6----------------------S E R V I C E S ---------------------
1 For definition of regions, see footnote 3 to the table in appendix A.2 Average month of reference. Data were collected during the period July 1964 through June 1965.3 Standard hours reflect the workweek for which employees receive their regular straight-time salaries and the earnings correspond to these weekly hours.4 For definition of terms, see footnote 3, table A-l.5 Transportation, communication, and other public utilities.6 Finance, insurance, and real estate.
Digitized for FRASER http://fraser.stlouisfed.org/ Federal Reserve Bank of St. Louis

19Table A-3. Office Occupations—South
(A v e r a g e s tr a ig h t -t im e w eek ly hou rs and earn in gs fo r s e le c te d occu p a tio n s by in du stry d iv is io nin the South, 1 F e b ru a ry 1965 2)
Weekly earnings 3 (standard) N u m b e r o f w o rk e r s re c e iv in g s t ra ig h t - t im e w e e k ly e a rn in g s o f—
Numberof
Average $ * $ t $ * $ i $ $ % $ $ $ $weekly
U n d e r4 0 50 6 0 7 0 8 0 9 0 1 0 0 n o 1 2 0 1 3 0 14 0 1 5 0 1 6 0 1 7 0 1 8 0
workers (standard) Mean* Median* Middle range* $4 0
andu n d e r - - - - - - - - - - - - and
5 0 6 0 7 0 8 0 9 0 1 0 0 1 1 0 1 2 0 - 13 0 14 0 1 5 0 1 6 0 1 7 0 1 8 0 o ve r.
$ $ $ $1 33 7 9 4 0 . 0 7 1 . 5 0 6 8 . 0 0 6 2 . 5 0 - 7 4 . 5 0 — — 5 4 1 7 2 7 0 4 7 5 1 6 — 3 — — — — —
3 3 8 4 0 . 0 7 0 . 5 0 6 7 . 50 6 2 . 0 0 - 7 3 . 5 0 - - 54 16 1 5 7 3 3 5 1 6 1 3 - - ~ -
5 , 6 1 2 3 9 . 5 1 1 2 . 5 0 1 1 1 . 0 0 9 5 . 5 0 - 1 2 7 . 5 0 _ _ 2 1 6 2 9 4 5 7 9 8 8 6 9 3 0 9 7 5 7 3 2 4 9 6 3 0 4 1 5 8 1 8 5 2 4 3 22 , 2 5 6 4 0 . 0 1 2 1 . 0 0 1 2 0 . 5 0 1 0 3 . 0 0 - 1 3 8 . 0 0 - - - - 62 1 7 9 2 3 4 3 0 8 3 3 3 3 4 9 2 9 8 1 9 6 1 2 0 1 5 3 5 2 13 , 3 5 7 3 9 . 5 1 0 7 . 0 0 1 0 6 .0 0 9 3 . 0 0 - 1 1 9 . 0 0 - - 2 1 6 2 3 3 4 0 1 6 5 3 6 2 2 6 4 1 3 8 2 1 9 8 1 0 8 4 0 3 2 1 9 1 11 * 3 6 0 3 9 .5 1 1 2 . 0 0 1 1 2 . 5 0 9 9 . 0 0 - 1 2 3 . 5 0 - - — — 7 2 1 6 5 1 1 6 2 4 1 3 6 0 1 9 2 10 6 5 4 19 1 8 1 Z 5
98 3 4 0 . 0 1 0 4 .5 0 1 0 1 . 0 0 9 1 . 5 0 - 1 1 8 . 5 0 - - - - 1 1 7 76 2 8 2 1 5 8 1 2 4 9 3 6 6 4 2 16 1 1 — —2 7 1 4 1 . 0 1 0 2 . 0 0 1 0 1 .5 0 9 2 . 0 0 - 1 1 5 . 5 0 - - 2 3 1 2 3 9 6 7 5 3 4 3 4 0 1 0 2 1 — - -519 3 8 . 5 9 9 . 5 0 9 8 . 5 0 8 9 . 0 0 - 1 0 8 . 0 0 - 1 2 2 7 1 0 2 1 4 6 1 2 5 58i 2 4 15 5 2 3 1
3 * 4 8 6 4 0 . 0 9 0 . 5 0 8 9 . 0 0 7 6 , 0 0 - 1 0 4 . 0 0 _ _ 7 4 4 2 4 60 1 7 0 3 6 0 3 4 9 7 3 4 0 1 4 7 4 4 39 1 6 _ _ _
1 , 0 4 2 3 9 . 5 9 4 . 5 0 9 3 . 5 0 7 4 . 0 0 - 1 0 9 . 5 0 — - 8 9 4 1 7 6 1 9 1 1 4 4 1 7 1 1 1 8 91 18 16 16 — — —2 , 4 4 4 4 0 . 0 8 9 . 0 0 8 8 . 0 0 7 5 . 0 0 - 1 0 2 . 0 0 - - 6 6 3 3 0 4 2 5 5 1 2 4 5 9 3 2 6 2 2 2 5 5 2 6 2 3 - - — —
83 1 4 0 . 0 9 4 . 5 0 9 5 . 0 0 8 0 . 0 0 - 1 0 8 . 5 0 - - 17 71 1 1 8 1 3 7 1 2 5 1 9 0 1 3 7 3 0 3 3 _ - - —1 * 0 0 6 4 0 . 0 9 2 . 0 0 9 0 . 5 0 8 0 . 0 0 - 1 0 1 . 0 0 - - 1 2 8 2 1 5 4 2 4 5 2 5 6 1 1 6 7 8 2 1 2 3 2 0 - - - -
381 3 9 . 5 7 4 . 5 0 7 2 . 5 0 6 7 . 0 0 - 8 2 . 0 0 - 3 1 1 2 7 1 0 8 8 9 1 4 1 5 - ~ ~ ~
3 9 6 3 9 . 5 7 3 . 5 0 6 8 . 5 0 5 8 . 0 0 - 9 0 . 5 0 _ _ 1 3 9 7 2 5 0 3 5 5 9 3 7 5 _ _ _ _ _ _ _
35 1 3 9 . 5 7 2 . 5 0 6 6 . 5 0 5 7 . 5 0 - 9 1 . 0 0 - 1 2 9 71 3 9 1 8 5 2 3 7 5 ~ - - - ~
3 , 4 5 0 4 0 . 0 9 2 . 5 0 9 1 . 5 0 7 7 . 0 0 - 1 0 4 . 0 0 _ _ 1 3 6 3 1 0 5 7 9 6 1 2 6 9 5 5 2 7 2 4 8 1 3 2 1 0 7 6 8 5 15 15 587 1 4 0 . 5 1 0 0 . 0 0 9 7 . 0 0 8 6 . 0 0 - 1 1 2 . 5 0 - - 1 8 4 2 7 3 1 6 8 1 9 4 1 4 4 85 37 4 8 3 2 2 1 5 1 5 -
2 , 5 7 9 4 0 . 0 9 0 . 0 0 8 8 . 5 0 7 5 . 0 0 - 1 0 2 . 0 0 - - 1 1 8 2 6 8 5 0 6 4 4 4 5 0 1 3 8 3 1 6 3 95 5 9 35 3 — - 52 * 4 2 1 4 0 . 0 9 1 . 0 0 9 0 . 0 0 7 6 . 0 0 - 1 0 2 . 5 0 - 1 0 9 2 3 2 4 4 9 4 2 7 4 7 2 3 7 4 1 6 1 95 5 9 3 5 3 - 5
1 , 0 5 7 4 0 . 0 1 0 5 . 5 0 1 0 6 .0 0 8 8 . 5 0 - 1 1 9 . 5 0 _ _ 6 53 92 13 1 1 3 1 1 9 5 1 9 9 81 4 7 8 8 3 2 6 _
6 3 0 4 0 . 0 1 0 8 .0 0 1 0 5 . 0 0 9 1 . 0 0 - 1 2 7 . 5 0 - - 3 3 4 3 2 81 8 9 1 2 5 8 5 3 6 4 4 6 8 3 0 6 - -4 2 8 4 0 . 0 1 0 2 . 0 0 1 0 7 .0 0 8 4 . 0 0 - 1 1 7 . 5 0 - — 3 1 9 6 0 5 0 4 2 7 0 1 1 4 4 4 3 2 0 2 - — —2 9 4 4 0 . 0 1 0 7 .0 0 1 1 1 . 0 0 9 7 . 0 0 - 1 1 8 . 0 0 - ~ 7 1 6 3 5 2 6 5 6 1 1 0 31 3 8 2 -
3 * 6 4 0 3 9 . 0 6 2 . 0 0 5 8 . 50 5 3 . 5 0 - 6 6 . 5 0 1 2 2 1 1 8 9 2 8 6 8 3 0 3 1 8 8 1 3 1 2 0 1 1 7 _ _ _ _ _
7 0 4 3 9 . 5 6 5 . 0 0 6 2 . 0 0 5 4 . 5 0 - 7 1 . 0 0 - - 3 0 3 2 1 9 6 6 6 3 3 8 7 9 1 - - - - - -2 * 9 3 6 3 9 . 0 6 1 . 0 0 5 8 . 0 0 5 3 . 5 0 - 6 5 . 0 0 1 2 2 1 1 5 8 9 6 4 9 2 3 7 1 2 4 9 5 1 3 2 6 - - - - - -
7 4 8 3 9 . 5 7 0 . 0 0 6 5 . 0 0 5 7 . 5 0 - 8 6 . 0 0 - 4 2 5 7 2 0 6 6 4 1 0 3 9 4 13 2 6 - — - - - -3 3 2 4 0 . 0 6 2 . 0 0 6 0 . 0 0 5 5 . 5 0 - 6 7 . 5 0 - 1 2 1 5 3 9 8 55 15 - — - - - - - - - -
1 , 5 2 9 3 8 .5 5 6 . 0 0 5 5 . 5 0 5 1 . 5 0 - 5 9 . 5 0 1 9 7 9 8 7 2 8 7 5 5 3 ~ - ~ - - -
4 1 9 4 0 . 0 1 1 7 .0 0 1 2 0 . 0 0 1 0 6 . 0 0 - 1 2 9 . 0 0 - - - 1 0 13 6 51 4 0 9 1 1 1 4 6 2 1 6 9 7 _3 7 0 4 0 . 0 1 1 8 .5 0 1 2 1 . 0 0 1 1 1 . 0 0 - 1 2 9 . 5 0 - - - 1 0 3 - 4 5 2 6 9 0 1 0 8 6 2 1 0 9 7 - —3 1 5 4 0 . 0 1 2 3 . 5 0 1 2 3 . 5 0 1 1 5 . 0 0 - 1 3 1 . 0 0 - “ 3 ~ 9 1 9 9 0 10 6 6 2 1 0 9 7 -
2 7 1
oo*
1 0 2 . 0 0 1 0 5 .0 0 1 0 0 . 0 0 - 1 0 9 . 0 0 - - - - 19 2 6 2 2 1 5 0 4 7 7 - - - - - -
1 , 5 0 5 3 9 . 5 1 1 3 . 5 0 1 1 2 . 5 0 1 0 0 . 5 0 - 1 2 6 . 5 0 _ _ _ 1 1 4 8 9 2 4 7 3 2 7 3 0 7 2 5 3 1 2 6 5 7 5 5 2 4 55 8 2 4 0 . 0 1 2 0 . 5 0 1 1 8 .0 0 1 0 5 . 5 0 - 1 3 4 . 5 0 - - - - - 2 3 5 7 1 0 5 1 3 1 82 7 2 3 7 5 4 2 0 2 -92 3 3 9 . 0 1 0 9 .5 0 1 0 8 .0 0 9 7 . 5 0 - 1 2 2 . 0 0 - - - 1 1 4 6 7 1 9 0 2 2 3 1 7 5 171 5 4 2 0 1 4 3 —4 3 5 3 8 .5 1 0 2 . 0 0 1 0 1 . 0 0 9 2 . 5 0 - 1 0 9 . 5 0 ~ ~ 8 5 9 1 3 9 1 2 3 4 7 52 6 ~ ~
2 , 3 5 9 3 9 . 5 9 2 . 5 0 9 2 . 0 0 8 0 . 5 0 - 1 0 4 . 5 0 _ 18 17 1 3 6 6 4 9 3 5 0 7 4 3 1 2 3 2 93 36 2 9 _ _
666 4 0 . 0 1 0 1 . 0 0 1 0 0 .5 0 8 9 . 0 0 - 1 1 3 . 0 0 - - 4 3 6 4 4 95 1 4 6 1 3 5 1 0 8 5 8 3 0 1 9 - — _1 , 6 9 3 3 9 .5 8 9 . 5 0 8 9 . 5 0 7 8 . 0 0 - 1 0 1 . 0 0 - - 14 1 3 5 32 2 3 9 9 3 6 1 2 9 6 1 2 4 3 6 6 1 - - - _
3 6 4 3 9 . 5 9 8 . 5 0 1 0 1 .5 0 8 7 . 5 0 - 1 1 0 . 5 0 - - 3 19 33 5 9 51 1 0 4 6 9 2 4 3 - _ - - _3 0 6 4 0 . 5 9 4 . 0 0 9 4 . 0 0 8 6 . 0 0 - 1 0 4 . 5 0 - - - 1 0 4 7 4 9 1 0 7 4 3 4 0 6 3 1 - - — -8 0 8 3 9 . 0 8 3 . 5 0 8 3 . 0 0 7 3 . 0 0 - 9 3 . 5 0 ~ — 1 1 1 0 6 2 0 0 2 2 6 1 4 4 1 1 5 5 ~ - ~
Sex, occupation, and industry division
BOOKKEEPING-MACHINE OPERATORS*CLASS B -------------------------------
NONMANUFACTUR I N G -----------------
CLERKS* ACCOUNTING* CLASS A --------MANUFACTURING ---------------------NONMANUFACTURING -----------------
PUBLIC UTILITIES5---------------WHOLESALE TRADE ----------------RETAIL TRADE
c 6 ____ ___FINANCE *-------------
CLERKS* ACCOUNTING* CLASS B MANUFACTURINGNONMANUFACTURING
PUBLIC UTILITIES3----------WHOLESALE T R A D E -----------F I N A N C E ---------------------
CLERKS* FILE* CLASS B ---------NONMANUFACTURING ------------
CLERKS* O R D E R -------------------MANUFACTURING ---------------NONMANUFACTURING-----------
WHOLESALE TRADE ----------
CLERKS* P A Y R O L L ----------------MA NU FA CT UR IN G---------------NONMANUFACTURING
PUBLIC UTILITIES9---------
OFFICE BOYS ---------------------MANUFACTURING---------------NONMANUFACTURING ------------
PUBLIC UT IL IT IE S---------WHOLESALE T R A D E -----------FINANCE6--------------------
SECRETARIES---------------------NONMANUFACTURING------------
PUBLIC UTILITIES5---------
STENOGRAPHERS. G E N E R A L --------
TABULATING-MACHINE OPERATORS*CLASS A -------------------------
MA NUFACTURING---------------NONMANUFACTURING ------------
F INANCE6--------------------
TABULATING-MACHINE OPERATORS.
MANUFACTURING---------------NONMANUFACTURING-----------
PUBLIC UTILITIES5---------WHOLESALE T R A D E ----------F I N A N C E --------------------
S ee foo tn otes at end o f ta b le .
Digitized for FRASER http://fraser.stlouisfed.org/ Federal Reserve Bank of St. Louis

20Tabic A-3. Office Occupations—South— Continued
(A v e ra g e s tr a ig h t -t im e w eek ly hou rs and earn in gs fo r s e le c te d o ccu p a tion s by in du stry d iv is io nin the South, 1 F e b ru a ry 1965 2)
Sex, occupation, and industry division
MEN - CONTINUED
TABULATING-MACHINE OPERATORS*
NONMANUFACTURING------------------FINANCE6--------------------------
TYPISTS, CLASS B ---------------------NONMANUFACTURING ------------------
PUBLIC UTILITIES5---------------
WOMEN
BILLERS, MACHINE (BILLINGMACHINE) ------------------------------
MA NU FA CT UR IN G---------------------NONMANUFACTURING -----------------
PUBLIC UTILITIES5---------------WHOLESALE TRADE ----------------RETAIL T R A D E --------------------
BILLERS, MACHINE (BOOKKEEPINGM A C H I N E ) -----------------------------
MANUFACTURING ---------------------NONMANU FAC T U R I N G ------------------
RETAIL T R A O E --------------------
BOOKKEEPING-MACHINE OPERATORS,
MA NU FACTURING---------------------NONMANUFACTURING------------------
WHOLESALE TRADE ----------------RETAIL T R A D E --------------------FINANCE6--------------------------
BOOKKEEPING—MACHINE OPERATORS,
MA NU FACTURING---------------------NONMANUFACTURING -----------------
WHOLESALE TRAOE ----------------RETAIL T R A D E --------------------FINANCE6--------------------------
CLERKS, ACCOUNTING, CLASS A --------MANUFACTURING---------------------NONMANUFACTURING ------------------
PUBLIC UTILITIES5---------- ----WHOLESALE T R A D E ----------------RETAIL T R A D E --------------------F I N A N C E --------------------------SE R V I C E S -------------------------
CLERKS, ACCOUNTING, CLASS B --------MA NUFACTURING---------------------NONMANUFACTURING — ----------------
PUBLIC UT I L I T I E S ---------------WHOLESALE T R A O E ----------------RETAIL T R A D E --------------------FINANCE6--------------------------S E R V I C E S -------------------------
Numberof
workers
Averageweeklyhours3
(standard)
Weekly earnings 3 (standard) Number of workers receiving straight-time weekly earnings of-
Mean4 Median4 Middle range4Under140
$40
andunder
50
$50
60
$60
70
$70
80
$80
90
$90
100
$100
110
$110
120
$120
130
$130
140
$140
150
*150
160
$160
170
$170
180
$180
and
over
957 39.5 $5.00 $2.00 Is.50- $4.00 3 106 305 232 163 82 40 25 1759 39.0 73.00 70.00 64.00- 80.50 - 3 103 279 176 113 50 12 23 1 - - - - — -455 39.0 69.00 68. 50 63.50- 74.00 - ~ 59 212 124 49 12 " - - - ~
625 39.5 86.50 84.00 70.00-109.50 - _ 92 61 131 54 73 59 154 - _ _ - _ _ -594 39.5 87.00 86.50 70.00-110.00 - - 92 54 112 52 72 57 154 - - — - - - -491 40.0 92.50 95.00 77.00-111.00 23 39 100 48 71 57 154
2,008 40.0 70.00 68.50 60.50- 78.00 38 432 645 462 288 59 68 11 4 2652 40.0 71.00 71.00 63.50- 78.50 - - 114 178 219 109 10 13 6 2 2 — - - — -
1,356 40.0 69.00 67.00 59.50- 77.50 - 38 318 46 8 244 179 49 55 5 2 - - - - - -415 39.5 75.50 73.00 60.00- 88.00 - - 106 80 63 86 27 49 5 2 - - - - - -447 40.0 68.50 66.00 61.00- 75.00 - 3 91 213 66 60 8 6 - - - - - - - -332 40.5 62.50 63.50 56.50- 70.50 32 92 122 78 9 ~ — ~ ~ * ~ ~
1,995 39.5 64.00 63.00 55.50- 72.50 13 162 587 633 366 167 50 16 2 . . _366 39.5 72.50 74.50 63.00- 80.00 - - 62 73 138 66 12 13 2 - _ _ _ _ _ _
1,629 39.5 62.00 61.50 55.00- 69.00 13 162 525 560 228 101 38 3 - - - - - _ -1,096 39.5 60.00 61.00 53.50- 66.50 5 144 351 401 134 42 20
2,739 39.5 79.50 78.50 70.50- 88.00 _ _ 126 523 858 656 398 105 60 12 1752 39.5 85.50 84.00 76.50- 93.50 - - - 64 220 218 162 34 42 12 - - - - - —
1,987 39.5 77.00 76.00 68.50- 85.00 - - 126 459 638 438 237 71 17 _ 1 _ _ - _ _595 40.0 77.00 77.50 71.00- 84.00 - - 9 127 243 139 56 21 - - _ _ _ - _ _375 40.5 76.50 78.00 69.00- 84.50 - - 28 78 104 100 61 - 2 _ _ _ — _ _ _801 39.0 76.00 73.00 66.50- 85.00 ~ 88 214 231 152 69 40 5 - - “ -
7,407 39.5 66.50 64. 50 58.50- 73.50 _ 123 2153 2699 1379 784 141 85 41 3 .1,280 39.5 73.00 72.50 65.00- 82.50 - 7 130 398 342 312 53 14 20 2 - - — - _ -6,127 39.5 65.00 63.50 58.00- 71.00 - 116 2022 2300 1037 473 88 71 21 ' 1 - - - - - -1,442 40.0 68.00 65.50 60.50- 75.00 - 6 296 600 269 223 31 17 - - _ - _ _ _ _1,206 40.0 65.00 65.00 57.50- 73.00 - 87 288 453 239 111 25 4 - - - - - - _ _3,031 39.5 63.00 61.00 57.00- 68.00 13 1369 1108 427 75 25 14 - - - -
7,816 39.5 91.50 90.50 80.00-102.00 - 2 109 532 1325 1840 1779 1066 637 263 152 56 41 14 _2,079 39.5 98.00 95.50 85.00-110.50 - - 22 60 201 507 422 332 266 120 81 26 32 9 - _5,737 39.0 89.50 89.00 77.50- 99.50 - 2 87 471 1124 1333 1358 734 371 144 71 30 9 5 _ _1,598 39.0 100.50 98.50 93.00-107.50 - - - 8 68 141 687 383 180 71 40 13 5 1 _ _
740 40.0 92.00 88.00 80.50-101.50 - - 17 39 118 236 128 88 43 21 28 17 4 4 _ _1,189 40.0 83.50 82.50 73.50- 92.50 - 2 16 116 355 334 187 111 47 20 1 _ _ - _ _1,710 38.5 82.00 81.00 72.00- 89.50 - - 52 281 484 487 219 110 49 28 2 _ - — _ _
501 39.5 89.50 89.00 79.50- 98.00 2 29 98 135 136 4 4 53 4 -
19,835 39.0 72.00 70.50 61.50- 82.50 - 221 4017 5463 4416 3660 1097 582 238 65 49 14 12 _ _ 23,767 39.5 76.50 74. 50 66.50- 84.50 - 3 382 893 1129 744 306 176 50 30 29 12 12 _ _ 216,068 39.0 71.00 69.00 60.50- 81.50 - 218 3635 4570 3287 2916 791 405 189 35 20 2 _ - _ -4,893 38.5 79.50 83.00 69.00- 88.50 - 7 364 929 993 1865 401 180 131 24 _ _ _ _ _ _2,446 40.0 75.50 72.50 61.00- 87.50 - 27 521 543 427 388 246 204 58 11 20 2 - - _ _3,275 40.0 66.00 66.50 59.50- 73.50 - 100 743 1209 873 283 66 3 - - _ _ _ - _4,370 38.5 64.00 62.50 57.00- 70.00 - 63 1679 1545 780 255 49 - - - _ - _ _ _ _1,084 40.0 66.50 64.50 58.00- 74.50 ~ 22 329 347 215 125 29 18
'“ ~ ~ “ “
See foo tn o te s at end o f tab le .
Digitized for FRASER http://fraser.stlouisfed.org/ Federal Reserve Bank of St. Louis

21
Table A-3. Office Occupations—South— Continued
(A v e ra g e s tr a ig h t -t im e w eek ly hours and earn in gs fo r s e le c te d occu p a tio n s by in du stry d iv is io nin the South, 1 F e b ru a ry 1965 *)
Sex, occupation, and industry division
WOMEN - CONTINUED
CLERKS. FILE, CLASS A ---------------MA NUFACTURING---------------------NONMANUFACTURING -----------------
FINANCE6--------------------------
CLERKS, FILE, CLASS B ---------------MANUFACTURING ---------------------NONMANUFACTURING -----------------
PUBLIC UTILITIES5---------------WHOLESALE TRADE ----------------RETAIL TRADE --------------------FINANCE6--------------------------S E R V I C E S ------------------------
CLERKS, FILE, CLASS C ---------------MANUFACTURING ---------------------NONMANUFACTURING-----------------
PUBLIC UTILITIES5---------------WHOLESALE TRADE ----------------RETAIL TRADE --------------------FINANCE 6--------------------------S E R V I C E S -------------------------
CLERKS, ORDER -------------------------MA NU FA CT UR IN G---------------------NONMANUFACTURING -----------------
WHOLESALE TRADE ----------------RETAIL T R A D E --------------------
CLERKS, P A Y R O L L ----------------------MA NUFACTURING---------------------NONMANUFACTURING ------------------
PUBLIC UTILITIES5---------------WHOLESALE TRADE ----------------RETAIL T R A D E --------------------FINANCE 6--------------------------S E R V I C E S -------------------------
COMPTOMETER O P E R A T O R S ---------------MANUFACTURING ---------------------NONMANUFACTURING------------------
PUBLIC UTILITIES5---------------WHOLESALE TRADE ----------------RETAIL T R A D E --------------------
DUPLICATING-MACHINE OPERATORS(MIMEOGRAPH OR DITTO I --------------
NONMANUFACTURING------------------
KEYPUNCH OPERATORS, CLASS A --------MA NU FACTURING---------------------NONMANUFACTURING -----------------
PUBLIC UTILITIES5---------------WHOLESALE TRADE ----------------RETAIL TRADE --------------------FINANCE6--------------------------
Numberof
wodcers
Weekly earnings 3 (standard) Number of workers receiving straight-time weekly earnings of-
Averageweeklyhours3
(standard) M ean4 M edian4 Middle range 4Under$40
$40
andunder
50
$50
60
*60
70
$70
80
$80
90
$90
100
$100
110
$110
120
$120
130
%130
140
S140
150
$150
160
$160
170
$170
180
$180
and
over
2,114 39.5 79.50 75.50 66.50- 90.50 3 205 540 493 322 307 80 85 37 25 14 3 1650 39.5 94.50 92. 50 86. 00-100. 00 - - 8 39 56 158 227 41 52 27 23 14 3 1 — —
1,464 39.0 73.00 70.50 64.00- 79.00 - 3 197 500 437 164 81 40 32 10 2 - - - - —1,017 39.0 69.00 68.50 62.50- 74.00 - 3 160 416 334 75 24 5 1 -
5,767 39.0 63.00 59.50 55.00- 68.00 _ 283 2676 1588 656 275 218 53 20 - - - - - - -732 39.0 72.00 70.00 63.00- 79.00 - - 123 242 203 80 71 13 — - - — - - - —
5, 035 39.0 61.50 59.00 54.00- 66.00 - 283 2553 1347 453 195 147 40 20 - - - - - - -607 39.0 76.00 72.00 59.50- 93.00 - - 161 120 95 47 132 32 20 - - - - - - —665 40.0 65.00 62.50 56.50- 73.50 - 5 251 214 86 94 11 4 - - - - - - - -672 40.0 56.00 55.00 51.00- 63.00 - 130 311 162 66 4 — — - - - - - - — —
2,832 38.5 58.50 57.50 54.00- 62.00 - 129 1783 766 140 14 - - - — - - — - - -259 40.0 67.00 67.50 59.50- 75.50 19 47 84 67 34 4 4 ~ “
6,317 39.0 57.00 54.50 51.50- 60.00 8 756 3948 1035 301 253 8 4 3 - - - - - - -804 39.5 67.50 67.50 55.00- 80.50 - 8 258 163 148 226 2 - - — - - - - - -
5,512 39.0 55.00 54.00 51.50- 59.00 8 749 3691 872 153 27 6 4 3 — - - — — - —273 39.0 65.50 63.50 58.50- 70.00 - 4 80 124 33 20 6 4 3 - - — - - - -388 40.0 58.50 56.50 53.00- 62.00 - 3 269 65 51 — - - - - - - - - - -775 40.0 54.00 54.00 51.50- 58.50 - 67 569 124 13 2 - - - - - — — - - —
3,806 38.5 54.00 53.50 51.00- 57.50 - 654 2641 485 23 3 - - — — — — - - - -270 40.0 58.00 58.00 52.50- 66.50 8 22 131 75 33 2 ~ “* - ~ -
3,029 40.0 71.00 70.00 60.50- 81.00 _ 73 635 810 690 547 158 77 25 8 7 1 - _ - -821 39.5 77.00 77.00 67.50- 86.00 - - 96 140 258 180 95 32 13 - 7 - - - — -
2,208 40.0 68.50 67.00 59.00- 79.00 - 73 539 669 432 367 63 45 12 8 - 1 — — - -1,148 40.0 73.50 74.50 62.50- 82.00 - - 231 248 302 254 58 35 12 8 - 1 - - - —
999 40.0 63.00 6 2.50 56.00- 69.00 73 309 403 111 94 3 10 ~ ~ - -
6,141 39.5 80.50 78.00 67.50- 90.50 _ 32 538 1316 1459 1219 689 424 270 85 63 29 16 3 _ _
2,692 39.5 81.50 78.50 68.50- 91.00 - - 245 522 684 539 296 172 91 48 52 25 16 3 - -3,448 39.5 79.50 77.00 67.00- 90.50 - 32 293 792 775 680 394 252 180 37 11 5 — - - —
817 39.0 91.00 89.00 74.00-107.50 - 2 35 113 106 187 76 128 126 35 7 5 - — - -551 40.0 80.50 80.50 69.50- 91.00 — - 20 128 119 135 91 22 28 2 4 - - - — -
1,162 40.0 73.50 72.50 65.00- 82.00 - 6 142 322 358 163 99 67 6 - — - - - - -553 38.5 80.00 80.50 67.50- 91.50 - - 50 116 103 129 107 31 15 - - — - - — -366 40.5 70.50 70.00 62.00- 80.50 24 46 115 89 66 20 4 5 - -
5,389 39.5 73.00 71.50 62.50- 82.00 _ 193 744 1523 1429 763 328 297 63 37 12 _ _ _ _
1,169 40.0 78.00 74. 50 65.00- 88.50 - 1 123 321 258 199 93 96 36 34 8 - - - - -4,220 39.5 71.50 70.50 62.00- 80.00 - 192 621 1202 1171 564 235 201 28 3 4 — - - — —
471 40.0 90.00 92.00 79.00-102.50 - - 10 40 78 79 99 150 15 2 1 - - - - —1,283 39.5 71.50 70.50 62.00- 79.00 - 48 181 381 377 172 82 30 12 1 1 - - - - -2,164 39.0 68.00 69.00 61.00- 77.00 ~ 14A 334 691 610 308 55 21 1 “ 2 ~
587 39.0 67.50 63.50 58.50- 74.50 _ 7 187 199 75 79 23 17 _ _ _ _ _ _ _ _
451 38.5 64.00 62.00 58.00- 69.00 - 7 165 175 55 43 “ 8 ~ - -
5,752 39.5 82.50 80.50 71.50- 93.50 _ 14 2C7 914 1695 1249 623 850 158 28 11 1 _ 1 _ _
1,512 40.0 89.50 88.50 77.50-102.00 - - 16 100 361 323 288 326 76 9 9 1 - 1 - -4,240 39.0 80.50 78.00 70.50- 88.50 - 14 191 813 1335 926 335 524 81 19 2 — — - — —
1,051 39.5 93.00 96.50 80. 00-105.00 - - - 95 168 172 120 426 61 10 - - - - - -941 40.0 81.50 80.50 73.00- 88.50 - - 31 144 287 273 92 87 19 7 2 — — - — —287 40.0 76.00 76.00 69.50- 84.50 - 4 21 50 99 71 42 1 - - - - - - - -
1,787 38.5 73.00 72.50 67.00- 79.00 10 139 507 742 318 65 6
S ee foo tn o te s at end o f table.
Digitized for FRASER http://fraser.stlouisfed.org/ Federal Reserve Bank of St. Louis

2 2
Table A-3. Office Occupations—South— Continued
(A v e ra g e s tra ig h t -t im e w eek ly hours and ea rn in gs fo r s e le c te d o ccu p a tion s b y in du stry d iv is io nin the South, 1 F e b ru a ry 1965 *)
Sex, occupation, and industry division
WOMEN - CONTINUED
KEYPUNCH OPERATORS, CLASS B --------MANUFACTURING ---------------------NONMANUFACTURING------------------
PUBLIC UTILITIES5---------------WHOLESALE TRADE ----------------RETAIL TRAOE --------------------FINANCE6--------------------------
OFFICE GIRLS --------------------------MANUFACTURING---------------------NONMANUFACTURING------------------
PUBLIC UTILITIES5---------------FINANCE 6--------------------------
SE CR ET AR IE S---------------------------MA NU FA CT UR IN G---------------------NONMANUFACTURING ------------------
PUBLIC UTILITIES5---------------WHOLESALE T R A D E ----------------RETAIL TRADE --------------------FINANCE6--------------------------S ER V I C E S -------------------------
STENOGRAPH® S, G E N E R A L --------------MA NUFACTURING---------------------NONMANUFACTURING ------------------
PUBLIC UTILITIES5---------------WHOLESALE TRADE ----------------R ETAIL T R A D E --------------------FINANCE6--------------------------S E R V I C E S ------------------------
STENOGRAPHER S, S E N I O R ---------------MA NU FACTURING---------------------NONMANUFACTURING -----------------
PUBLIC UTILITIES5---------------WHOLESALE TRADE ----------------RETAIL T R A D E --------------------FINANCE6--------------------------S E R V I C E S -------------------------
SWITCHBOARD OPERATORS----------------MA NU FA CT UR IN G---------------------NONMANUFACTURING ------------------
PUBLIC UTILITIES5---------------WHOLESALE TRADE ----------------RETAIL TRADE --------------------FINANCE6--------------------------S E R V I C E S -------------------------
SWITCHBOARD OPERATOR-RECEPTIONISTS-M AN UF AC T U R I N G ---------------------NONMANUFACTURING ------------------
PUBLIC UTILITIES5---------------WHOLESALE TRADE ----------------RETAIL T R A D E --------------------FINANCE6--------------------------S E R V I C E S -------------------------
Number of workers receiving straight-time weekly earnings of—
Numberat
Average $ $ $ $ s . $ S % $ S $ $ $ S $weekly Under 40 50 60 70 80 90 100 110 120 130 140 150 160 170 180
workers[standard) Mean4 Median4 Middle range4 $
40and
under - - - - - - - - - - - and
50 6 C 70 80 90 100 lio 120 130 140 150 160 170 180 over
8,849 39.0$69.00
$67.00
$ $ 60.00- 76.00 155 2048 3072 1948 978 343 276 30
1,816 40.0 75.00 71.50 64.00- 83.50 - - 179 650 391 293 155 121 30 - - - — - — -7, 031 39.0 67.50 66.00 59.0C- 74.50 - 155 1871 2422 1555 687 188 155 - - — - - - - -1,536 39.0 76.50 73.50 65.50- 87.00 - 2 142 435 378 329 122 129 - - - - - - - -1,101 40.0 71.50 71.50 63.50- 78.50 - - 144 348 377 168 40 24 - - - - — - - -
880 40.0 63.50 64.00 59.00- 69.50 - 10 250 414 170 37 1 - - - - - - - - -3,207 38.5 62.00 61.50 56.50- 68.00 143 1294 1172 483 92 23 “ - - ~ -
1,886 39.0 59.50 57. 50 53.00- 64.00 3 166 1027 456 117 71 37 11 - _ _ _ _ _ _ _385 39.5 64.00 60.50 55.50- 70.00 - 8 178 101 41 42 10 5 - - - — — - - -
1,501 39.0 58.00 56.50 52.50- 62.50 3 157 849 353 76 29 27 6 — - - - - _ - -332 38.5 66.00 61.50 57.50- 69.50 - 3 144 105 27 23 24 6 - - - - - - - -689 38.5 54.00 53.00 50.50- 57.00 “ 144 440 90 15 - - - - -
34,201 39.5 94.50 92.50 81.00-107.50 - 46 653 2470 4691 7341 6525 5066 3775 1934 1003 437 157 67 21 199,988 39.5 99.00 97.50 85.00-113.00 - - 45 427 1168 1852 1973 1613 1477 699 421 199 73 32 8 4
24,213 39.0 92.50 91.00 79.50-105.00 - 46 608 2044 3523 5489 4552 3453 2298 1235 582 238 83 35 13 154,770 39.5 106.00 106.50 92.50-118.50 - - 6 91 320 595 739 1000 959 613 234 127 39 23 9 143,619 40.0 93.00 90.50 78.00-106.00 - 16 60 356 571 773 662 445 353 194 107 39 30 10 4 12,655 40.0 84.50 84.00 74.50- 95.00 - 9 88 335 554 723 525 216 131 32 39 2 2 _ _ _9,721 38.5 86. 50 85.50 74.50- 96.50 - 8 417 1107 1841 2609 1859 1135 393 264 61 28 - _ - _3,447 39.5 97.00 96.00 86.00-108.50 13 39 155 237 788 767 657 462 132 142 41 12 2
21,127 39.5 76.50 74.00 65.00- 86.50 _ 123 2627 5545 4749 3934 1874 1632 565 60 18 _ _ _ _6,526 40.0 81.50 80.50 71.00- 92.00 - - 231 1264 1671 1543 988 653 140 19 17 - _ - _ _14,601 39.0 74.50 71.50 63.00- 84.00 - 123 2396 4281 3078 2392 886 978 425 41 l _ _ _ —4,730 39.0 84.00 82.50 69.50-100.00 - - 269 997 884 1011 387 746 404 32 1 _ - - _ -
2,516 40.0 73.00 71.50 63.00- 82.50 - 8 412 760 589 445 213 62 18 9 _ _ - _ _ —1,078 39.5 68.50 68.50 60.50- 78.00 - 26 231 337 246 169 53 15 2 _ _ _ _ _ _ _5,289 38.5 67.00 66.00 59.00- 73.50 - 83 1419 2001 1088 537 153 9 - - - _ _ _ - _
988 39.5 80.00 78.50 69.50- 89.00 7 65 187 272 230 80 146 1 - - - - -
9,608 39.5 91.00 90.00 78.50-104.50 _ _ 76 870 1742 2100 1850 1618 905 350 82 13 2 1 _ _3,527 40.0 98.00 100.00 85.00-109.50 - - 11 117 451 541 634 949 532 214 70 11 - - — _6, 081 39.0 87.00 86.00 75.50- 96.50 - - 65 754 1292 1560 1216 669 374 135 12 2 2 1 - -1,730 39.5 94.50 93.00 84.00-105.50 - - 3 57 246 408 408 307 180 109 9 2 2 1 _ _1,089 40.0 89.50 90.00 78.00-101.00 - - - 104 222 215 260 157 106 22 3 _ _ _ _ _
295 40.5 80.00 81.50 74.00- 88.50 - - 4 54 70 107 52 9 - _ - _ _ _ _ _2,412 38.5 80.00 79.00 70.50- 88.00 - - 49 495 705 682 323 116 43 - - - - _ - -
556 39.5 90.50 91.00 83.00- 99.00 - 9 44 49 148 175 80 46 5 - - -
6,462 41.0 67.00 64.50 54.00- 80.00 468 624 1470 1350 923 670 534 281 112 22 6 3 _ _ _976 39.5 83.50 82.50 70.00- 95.00 1 - 101 144 187 206 130 118 62 18 6 3 _ _ _ _
5,486 41.0 64.00 62.00 52.00- 75.00 467 624 1368 1206 736 464 404 163 51 4 _ _ _ _ _ _820 39.5 8 8 .0 0 92.00 78.00- 99.00 - - 35 92 98 127 307 129 32 - - - _ _ _ _393 40.0 72.00 67.00 60.00- 82.50 - - 101 124 58 54 18 19 15 3 - - _ _ _ _
1,359 40.0 60.50 60.50 53.00- 68.50 6 189 449 430 191 91 4 — - - _ _ _ _ _ _1,236 39.0 67. 50 67.00 59.00- 75.00 - 84 253 385 339 131 31 12 1 - - _ _ _ _ _1,678 45.0 50.50 50.50 38.50- 58.50 461 351 531 175 50 62 43 3 2 1 ~ - - - -
5,925 40.0 70.50 69.00 62.00- 78.50 - 68 1043 2095 1426 805 281 88 93 26 1 _ _ _ _ _2,088 39.5 72.50 70.50 63.00- 79.50 - - 276 728 594 302 100 35 31 21 1 _ _ _ _3,836 40.0 69.50 6 8 .0 0 61.00- 77.50 - 68 767 1368 832 503 180 53 61 5 _ _ _ _ _ _
553 40.0 78.00 74.50 64.00- 90.00 - - 77 159 90 90 55 26 53 3 _ _ _ _ _ _1,262 40.0 71.00 69.50 62.50- 79.00 - - 208 435 325 205 63 17 8 2 _ _ _ _ _ _
896 41.0 64.00 65.00 57.50- 70.00 - 3A 260 373 166 61 3 - - _ _ _ _ _ _
811 38.5 67.00 67. 00 6C.50- 73.00 - 11 180 336 200 75 10 - - _ _ _ _ _ _ _
315 40.0 73.50 75.50 62.00- 88.00 - 23 43 66 52 73 49 10 - - - - - - - -
S ee foo tn o te s at end o f table.
Digitized for FRASER http://fraser.stlouisfed.org/ Federal Reserve Bank of St. Louis

23
Tabic A-3. Office Occupations—South— Continued
(Average straight-time weekly hours and earnings for selected occupations by industry division in the South, 1 February 1965 2)
Sex, occupation, and industry divisionNumberof
woikers
Averageweekly
[standard)
Weekly earnings3 (standard) Number of workers receiving straight-time weekly earnings of—
Mean4 Median4 Middle range4Under$40
%40
andunder
50
$50
60
$60
70
$70
80
$80
90
$90
100
$100
110
$110
120
S120
130
$130
140
$140
150
$150
160
$160
170
$170
180
$180
and
over
WOMEN - CONTINUED
TABULATING-MACHINE OPERATORS, $ $ $ $CLASS A ------------------------------ 281 38.5 103.00 100.00 94.50-113.00 - - 19 35 85 65 31 8 39 -
TABULATING-MACHINE OPERATORS,CLASS B ------------------------------- 1,385 38.5 83.00 84.50 73.00- 90.50 - - 61 216 244 498 222 65 39 15 23 1 - - - -
NONMANUFACTURING ----------------- 1,139 38.5 81.50 83.50 72.00- 89.00 - - 61 191 198 448 170 33 12 8 20 - - - - -PUBLIC UTILITIES5-------- ------- 5 92 38.0 80.50 85.50 68.00- 89.00 - - 45 126 74 238 64 27 12 6 - - - - - -FINANCE6-------------------------- 331 38.0 82.50 82.50 73.00- 90.00 8 52 67 123 66 - 16 - - “
TABULATING-MACHINE OPERATORS,CLASS C ------------------------------- 906 38.5 73.00 72.50 64.50- 80.50 - 7 71 286 308 167 47 12 9 1 - — - - - -
NONMANUFACTURING ----------------- 763 38.5 72.00 72.00 64.00- 79.50 - 7 59 251 271 134 32 4 6 - - - - - - -FINANCE 6-------------------------- 313 37.0 67.00 6 7.00 61.50- 73.50 - 7 40 134 114 17 - - - - -
TRANSCRIBING-MACHINE OPERATORS,G E N E R A L ------------------------------ 5,047 39.0 68. 50 67.00 60.50- 75.00 - 32 113C 1842 1191 549 204 65 25 7 - - - - - -
MA NU FA CT UR IN G--------------------- 833 39.5 70.50 69. 50 62.50- 76.00 - - 109 322 257 82 41 14 - 7 - - - - - -NONMANUFACTURING----------------- 4,215 39.0 68.50 67.00 60.00- 75.00 - 33 1020 1521 934 466 164 51 25 - - - - - - -
WHOLESALE TRADE ---------------- 1,076 40.0 67.00 65.50 60.00- 72.50 - - 257 481 228 74 16 13 9 - - - - - - -FINANCE 6-------------------------- 2,446 38.5 65. 50 64.50 58.50- 72.00 - 33 712 951 539 175 34 3 - - -
TYPISTS, CLASS A --------------------- 7,896 39.0 74.50 73.00 65.50- 83.00 _ 20 844 2244 2354 1501 515 325 83 10 3 _ _ _ _MA NU FA CT UR IN G--------------------- 2,047 39.5 81.50 81.00 72.00- 90.00 - - 51 317 602 578 280 184 30 4 1 - - - - -NONMANUFACTURING ----------------- 5,850 39.0 72.50 71.00 64.00- 79.00 - 20 793 1926 1751 924 234 141 53 6 2 - - - - -
PUBLIC UTILITIES5--------------- 1,308 39.0 78.50 76.50 67.50- 87.00 - - 54 380 329 341 76 83 44 1 2 - - - - -WHOLESALE TRADE ---------------- 468 39.5 75.00 73.50 68.50- 82.00 - - 34 103 196 86 34 14 3 1 - - - - - -RETAIL T R A D E -------------------- 345 40.5 70.50 68.50 64.50- 74.00 - - 30 175 87 28 15 9 - - _ _ _ - - -FINANCE 6-------------------------- 3,121 38.5 68. 50 68.00 61.50- 74.50 - 20 610 1175 944 316 57 - - - - - - - - -S E R V I C E S ------------------------- 608 39.5 77.00 75.00 69.50- 85.50 “ 66 93 197 154 53 35 6 4 - - - -
TYPISTS, CLASS B --------------------- 18,6 34 39.0 62.00 60.50 55.00- 68.50 - 768 8284 5 725 2762 821 185 78 11 _ _ _ _ _ _
MANUFACTURING--------------------- 3,020 39.5 67.00 66.00 59.00- 74.00 - - 854 1117 646 304 90 11 - - - - - - - -NONMANUFACTURING------------------ 15,614 39.0 61.00 59.50 54.50- 67.00 - 768 7431 4609 2116 517 95 68 11 - - - - - - -
PUBLIC UTILITIES5--------------- 1,351 39.5 69.00 66.00 60.50- 75.00 - 12 301 520 297 110 50 50 11 - - - - - - -WHOLESALE TRADE ---------------- 1,765 40.0 62.50 61.50 56.00- 69.00 - 20 738 618 325 40 14 10 — - - - - - - -RETAIL T R A D E -------------------- 1,526 40.0 60.50 61.00 53.50- 67.50 - 146 548 528 212 80 6 5 - - - - - - - -FINANCE 6-------------------------- 9,452 38.5 59.00 5 8.00 53.50- 63.50 - 535 5374 2663 774 103 3 1 - - - - - - - -S E R V I C E S ------------------------- 1,521 40.0 66.50 68.00 57.00- 76.00 56 470 280 508 183 22 1
1 For definition of regions, see footnote 3 to the table in appendix A.2 Average month of reference. Data were collected during the period July 1964 through June 1965.3 Standard hours reflect the workweek for which employees receive their regular straight-time salaries and the earnings correspond to these weekly hours.4 For definition of terms, see footnote 3, table A-l.5 Transportation, communication, and other public utilities.6 Finance, insurance, and real estate.
Digitized for FRASER http://fraser.stlouisfed.org/ Federal Reserve Bank of St. Louis

2 4
Table A-4. Office Occupations—North Central
^ A v era ge s tra ig h t-t im e w eek ly h ou rs and ea rn in gs fo r s e le c te d o ccu p a tion s b y in du stry d iv is io nin the N orth C en tra l reg io n , 1 F e b ru a ry 1965 2)
N u m ber o f w o rk e r s re c e iv in g s tr a ig h t -t im e w eek ly ea rn in gs o f—
Numberof
wodeers
Average $ $ $ S $ S t $ t $ $ $ $ $ $ $Sex, occupation, arid in du s t ry d iv is ion
weekly hours ̂
[standard] Mean4 Median4 Middle range43 0
andunder
4 0 50 6 0 7 0 8 0 9 0 1 0 0 1 1 0 1 2 0 1 30 140 1 5 0 1 6 0 1 7 0 1 8 0
and
4 0 5 0 6 0 70 80 90 1 0 0 1 1 0 1 2 0 1 3 0 1 4 0 1 5 0 1 6 0 1 7 0 1 8 0 o v e r
HEN
BILLERS* MACHINE (BILLING $ $ $ $MACHINE 1 ------------------------------------------------- 3 3 9 4 0 . 0 9 4 . 50 9 7 . 5 0 8 5 . 5 0 - 1 0 8 . 5 0 - - - 36 31 53 6 8 7 3 6 2 1 6 - - - - - -
NONMANUFACTURING----------------------------- 3 2 6 4 0 . 0 9 6 . 0 0 9 8 . 5 0 8 7 . 0 0 - 1 0 9 . 0 0 - _ - 2 4 31 52 6 8 73 6 2 16 - - - - - -PUBLIC U TILITIES 5------------------------- 2 8 4 4 0 . 0 9 6 . 0 0 9 8 . 0 0 8 7 . 0 0 - 1 0 6 . 5 0 " - 1 4 2 8 52 6 2 73 4 9 6 - _ ~ ~ **
CLERKS* ACCOUNTING, CLASS A --------------- 9 , 4 2 3 3 9 . 5 1 1 9 . 5 0 1 1 9 . 0 0 1 0 5 . 5 0 - 1 3 3 . 50 _ _ 8 1 0 0 4 8 4 925 1 5 9 0 1 7 4 6 1 6 3 7 1 4 9 1 7 0 0 4 3 0 2 43 32 38MANUFACTURING --------------------------------------- 5 , 5 3 2 3 9 . 5 1 2 3 . 0 0 1 2 3 . 5 0 1 0 9 . 0 0 - 1 3 6 . 5 0 _ _ - 4 4 3 1 9 9 4 2 6 7 8 5 9 3 4 1 1 1 0 1 0 1 7 4 8 0 3 1 7 1 6 4 30 2 4NONMANUFACTURING-------------------------------- 3 , 8 9 1 3 9 . 5 1 1 5 . 0 0 1 1 3 . 5 0 1 0 2 . 0 0 - 1 2 8 . 5 0 - _ - 4 57 2 8 6 4 9 9 8 0 6 8 1 2 5 26 4 7 5 2 2 0 1 1 3 79 2 1 4
1 , 3 1 3 4 0 . 0 1 2 1 . 0 0 1 2 0 . 0 0 1 1 0 . 5 0 - 1 3 3 . 0 0 32 55 2 2 6 3 43 2 4 5 233 43 8 13WHOLESALE TRADE ------------------------------ 1 , 2 4 3 3 9 . 5 1 1 5 . 0 0 1 1 3 . 5 0 9 8 . 5 0 - 1 3 1 . 5 0 _ _ _ 1 2 7 97 2 0 8 2 2 9 2 1 7 1 1 7 1 56 78 6 6 4 9 - -RETAIL TRADE ------------------------------------- 4 5 5 4 0 . 0 1 0 9 . 0 0 1 0 8 . 0 0 1 0 0 . 0 0 - 1 1 9 . 0 0 _ _ _ - 3 30 8 0 1 3 5 1 0 2 7 7 18 6 2 - 1 —
7 1 4 3 7 . 5 1 0 6 . 0 0 1 0 3 . 5 0 9 2 . 5 0 - 1 1 7 . 5 0 2 3 1 1 5 1 3 8 1 8 2 1 0 6 81 36 1 0 22" 1
CLERKS, ACCOUNTING, CLASS B --------------- 4 , 5 8 5 3 9 . 5 9 5 . 5 0 9 6 . 0 0 8 1 . 5 0 - 1 0 9 . 0 0 _ 1 1 37 3 3 9 6 3 4 7 84 7 74 9 2 1 6 4 7 3 48 6 9 1 6 5 _ - -MANUFACTURING --------------------------------------- 2 , 0 1 4 3 9 . 5 9 8 . 0 0 9 8 . 0 0 8 3 . 5 0 - 1 1 4 . 0 0 _ _ 1 2 1 0 5 2 6 1 332 3 7 3 3 3 8 2 9 8 222 56 1 4 5 - - -NONMANUFACTURING -------------------------------- 2 , 5 7 1 3 9 . 5 9 3 . 5 0 9 4 . 5 0 8 0 . 0 0 - 1 0 6 . 5 0 _ 1 1 25 233 3 7 4 4 5 2 4 0 1 5 8 3 3 4 9 1 2 6 1 3 2 - - - -
PUBLIC U T IL IT IE S 5---------------------------- 957 4 0 . 0 1 0 2 . 5 0 1 0 4 . 5 0 9 6 . 0 0 - 1 1 3 . 5 0 - 1 43 76 78 1 1 4 3 1 2 2 2 5 1 0 4 4 2 - - - -WHOLESALE TRAD E------------------------------ 877 4 0 . 0 9 2 . 5 0 9 2 . 5 0 7 9 . 0 0 - 1 0 5 . 0 0 _ _ _ 83 1 6 0 1 4 3 1 5 5 2 0 7 99 22 9 - - - - -FINANCE6----------------------------------------------- 5 2 5 3 8 . 5 8 3 . 0 0 8 3 . 5 0 7 3 . 0 0 - 9 1 . 5 0 - 19 75 9 9 1 8 5 92 3 4 22 - - “
CLERKS, F IL E , CLASS B ---------------------------- 4 5 0252
3 8 . 5 8 1 . 0 08 3 . 5 0
7 8 . 0 08 6 . 0 0
7 0 . 0 0 - 9 3 . 0 0 6 9 . 5 0 - 9 7 . 0 0
- - 2826
814 0
1 3 74 3
704 3
755 3
5 14 1
63
2 11
- - - - -N UNMAN Ur At 1 UK1 Nb 3 8 . 5 2
CLERKS, ORDER --------------------------------------------- 7 , 0 1 9 4 0 . 0 1 1 1 . 0 0 1 1 1 . 5 0 9 7 . 0 0 - 1 2 5 . 5 0 _ 7 1 0 4 3 4 3 6 3 3 9 3 8 1 3 1 0 1 3 2 2 1 0 1 0 769 3 79 1 2 5 31 3 9 8MANUFACTURING--------------------------------------- 2 , 5 3 5 4 0 . 0 1 1 3 . 5 0 1 1 4 . 5 0 1 0 0 . 5 0 - 1 2 8 . 5 0 - - 1 3 1 93 1 6 9 3 26 5 0 0 4 1 2 4 1 9 305 2 1 5 58 7 - -NONMANUFACTURING -------------------------------- 4 , 4 8 4 4 0 . 0 1 0 9 . 5 0 1 1 0 . 5 0 9 5 . 0 0 - 1 2 3 . 5 0 _ _ 6 73 2 5 0 4 6 4 6 1 3 8 0 9 9 1 0 5 91 4 6 4 1 6 5 6 7 2 4 3 9 8
WHOLESALE TRADE ------------------------------ 4 , 0 9 4 4 0 . 0 1 1 0 . 5 0 1 1 1 . 5 0 9 6 . 5 0 - 1 2 4 . 5 0 * - 6 29 2 2 3 4 0 0 5 3 3 7 3 8 866 5 6 3 4 36 1 6 4 6 7 22 3 9 8
CLERKS, PAYROLL ----------------------------------------- 1 , 7 6 5 3 9 . 5 1 1 2 . 0 0 1 1 2 . 0 0 1 0 0 . 0 0 - 1 2 5 . 5 0 _ _ 2 23 74 1 3 8 2 0 7 3 3 8 3 7 0 2 6 7 237 60 1 6 2 6 3 3MANUFACTURING --------------------------------------- 1 , 2 5 5 3 9 . 5 1 1 3 . 5 0 1 1 4 . 0 0 9 9 . 5 0 - 1 2 9 . 0 0 _ _ 1 1 9 5 7 9 0 1 5 1 2 3 0 1 9 0 2 1 8 2 05 50 1 4 22 3 3NONMANUFACTURING-------------------------------- 5 1 1 4 0 . 0 1 0 8 . 5 0 1 1 1 . 0 0 1 0 0 . 0 0 - 1 1 7 . 0 0 - - 1 4 1 7 4 9 55 1 0 8 1 8 0 49 32 10 2 4 - -
piipi j r IITII TTTF<T5 4 0 . 0 1 0 9 . 0 0 1 1 1 . 0 0 1 0 2 . 5 0 - 1 1 6 . 5 0 1 3 3 7 3 7 85 1 5 8 3 6 22r UDL 11# U 1 XL 11 ICO "" "■
OFFICE BOYS -------------------------------------------------- 5 , 1 0 9 3 9 . 0 6 7 . 5 0 6 5 . 0 0 5 8 . 0 0 - 7 5 . 0 0 _ 92 1 5 6 8 1 6 1 2 889 5 2 8 3 1 5 84 21 1 _ _ _ _ _MANUFACTURING--------------------------------------- 2 , 0 7 6 3 9 . 5 6 9 . 5 0 6 7 . 0 0 6 0 . 5 0 - 7 7 . 0 0 - 3 4 7 3 7 92 391 2 1 8 1 4 7 3 6 15 1 - - - - - -NONMANUFACTURING --------------------------------- 3 , 0 3 4 3 8 . 5 6 6 . 5 0 6 3 . 5 0 5 6 . 5 0 - 7 3 . 5 0 - 8 9 1 0 9 5 8 21 4 9 9 3 0 9 1 6 7 4 8 6 - - - - - - -
mini T r u r n t r i e r 1 3 9 . 5 7 9 . 0 0 8 1 . 5 0 6 5 . 0 0 - 9 0 . 5 0 1 71 98 7 0 1 3 0 9 0 4 0r UDL I t U 1 lL. 1 f lC o ——— — —————————WHOLESALE TRADE ------------------------------ 4 0 3 4 0 . 0 6 7 . 5 0 6 3 . 5 0 5 6 . 0 0 - 8 1 . 0 0 - _ 1 5 0 1 0 6 4 0 7 9 2 9 - - - - - - - - -FINANCE6------------------------------------------------ 1 , 3 8 8 3 8 . 0 6 2 . 0 0 6 0 . 5 0 5 5 . 5 0 - 6 8 . 0 0 - 58 6 1 8 4 2 8 2 3 1 2 8 2 6 - - - ~ - - - - -S E R V IC E S ---------------------------------------------
r c r o c T in t e c . . ...
533
3 8 5
3 7 . 5 6 6 . 0 0 6 3 . 0 0
1 2 5 . 0 0
5 7 . 0 0 - 7 3 . 0 0
1 1 4 . 0 0 - 1 3 6 . 5 0
“ 1 8 1 9 6 1 3 6
1 6
9 4 6 6 1 7
1 3
5
4 8 73 70 84 4 7 1 1 c■”
O tLn 1 1 AK 1 C j 8 2 7 5 2NONMANUFACTURING --------------------------------- 2 6 3 4 0 . 0 1 2 2 . 0 0 1 2 4 . 0 0 1 0 9 . 5 0 - 1 3 6 . 5 0 - - 1 6 8 2 6 3 7 4 3 4 6 53 36 5 6 4 2
TABULATING-MACHINE OPERATORS,CLASS A --------------------------------------------- --------— 2 , 9 0 8 3 9 . 5 1 1 9 . 0 0 1 1 8 . 0 0 1 0 7 . 5 0 - 1 3 0 . 0 0 - - - - 1 4 2 2 5 0 6 5 5 6 6 2 5 7 3 4 0 3 1 6 3 85 7 0 4 1
MANUFACTURING--------------------------------------- 1 , 6 4 8 4 0 . 0 1 2 2 . 0 0 1 2 1 . 0 0 1 0 9 . 5 0 - 1 3 3 . 0 0 - - - - - 1 8 1 0 2 3 0 7 3 7 0 3 4 8 2 6 4 1 1 7 7 0 4 8 4 1NONMANUFACTURING-------------------------------- 1 , 2 6 0 3 9 . 0 1 1 5 . 5 0 1 1 3 . 5 0 1 0 5 . 0 0 - 1 2 5 . 0 0 - - - - 1 2 4 1 4 8 3 4 8 2 9 2 2 2 5 1 3 9 4 6 1 5 22 - -
FINANCE6----------------------------------------------- 589 3 8 . 5 1 1 1 .0 0 1 0 8 . 5 0 1 0 3 . 0 0 - 1 1 8 . 0 0 ~ ~ - - 21 72 2 4 4 1 3 6 65 4 0 2 11 -
TABULATING-MACHINE OPERATORS,CLASS B -------------------------------------------------------- 4 , 8 3 8 3 9 . 5 1 0 1 . 5 0 1 0 1 . 5 0 9 0 . 5 0 - 1 1 2 . 5 0 - - - 4 4 2 2 0 8 68 1 1 2 3 1212 7 6 0 3 9 7 168 4 2 3 2 - -
MANUFACTURING --------------------------------------- 2 , 4 0 6 3 9 . 5 1 0 4 . 5 0 1 0 3 . 5 0 9 4 . 0 0 - 1 1 7 . 0 0 - - - 1 4 82 3 1 6 5 6 3 5 85 4 0 2 2 8 4 123 33 2 1 - -NONMANUFACTURING--------------------------------- 2 , 4 3 1 3 9 . 0 9 8 . 5 0 9 8 . 5 0 8 8 . 0 0 - 1 0 8 . 5 0 - _ _ 30 1 3 7 5 51 5 6 0 6 2 7 3 5 8 1 1 2 4 5 9 1 1 - -
PUBLIC U T IL IT IE S 5---------------------------- 4 0 7 4 0 . 0 1 0 6 . 5 0 1 0 9 . 0 0 9 7 . 5 0 - 1 1 4 . 5 0 - - - 4 4 52 5 4 1 0 0 1 4 2 17 28 3 1 1 - -WHOLESALE TRADE ------------------------------ 7 1 4 3 9 . 5 1 0 0 . 0 0 1 0 1 . 5 0 8 9 . 5 0 - 1 1 0 . 0 0 - - - 4 2 6 1 5 5 1 4 0 2 1 6 101 57 14 1 - - - -RETAIL TRADE------------------------------------- 2 5 1 3 9 . 5 9 4 . 5 0 9 3 . 5 0 8 4 . 5 0 - 1 0 7 . 0 0 - - - 8 2 3 6 4 56 56 39 3 1 - - - - -r i n * u r c 6 . . 3 8 . 5 9 4 . 5 0 8 5 . 5 0 - 1 0 2 . 5 0 1 2 7 0 261 2 9 2 2 1 9 57 23r lfiANLC ' ■■ - - - - - **t. uu ~ ~ 2 5
See foo tn otes at end o f ta b le .
Digitized for FRASER http://fraser.stlouisfed.org/ Federal Reserve Bank of St. Louis

25
Table A-4. Office Occupations—-North Central— Continued
(A v e ra g e s tra ig h t-t im e w eek ly hou rs and ea rn in gs fo r s e le c te d o ccu p a tio n s by in du stry d iv is io n in the N orth C e n tra l re g io n , 1 F e b ru a ry 1965 2 )
Weekly earnings3 (standard) N u m ber o f w o rk e r s re c e iv in g s tr a ig h t - t im e w eek ly ea rn in gs of-
Sex, o ccu p a tio n , and in du stry d iv is io nNumber
ofworkers
Averageweeklyhours3
(standard) Mean4 Median 4 Middle range 4S
3 0and
under4 0
$4 0
5 0
$50
6C
$6 0
70
%7 0
80
$80
9 0
$9 0
1 0 0
$1 0 0
1 1 0
$1 1 0
1 2 0
$1 2 0
1 3 0
$1 3 0
1 4 0
$ $1 4 0
1 5 0
1 5 0
1 6 0
$1 6 0
1 7 0
$1 7 0
1 8 0
$1 8 0
and
o v e r
MEN - CONTINUED
TABULATING-MACHINE OPERATORS,1 , 6 4 7 3 9 . 5
$8 3 . 5 0 8 3 . 5 0
^ $ 7 2 . 5 0 - 9 3 . 0 0 34 2 5 9 3 7 1 4 65 3 0 6 1 4 0 51 22
MANUFACTURING-------------------------------------------- 7 1 3 3 9 . 5 3 8 . 5 0 8 8 . 5 0 8 0 . 5 0 - 9 7 . 5 0 - - 16 2 8 1 2 5 2 2 4 1 8 9 9 1 29 12 - - - _ _ _NONMANUFACTUR IN G ------------------------------------- 934 3 9 . 5 7 9 . 5 0 7 8 . 5 0 6 9 . 5 0 - 8 8 . 5 0 - - 1 8 2 3 1 2 4 6 2 41 1 1 7 4 9 22 10 — _ _ _ _
FINANCE6 ------------------------------------------- 4 8 0 3 9 . 0 7 7 . 0 0 7 4 . 0 0 6 8 . 0 0 - 8 5 . 0 0 ~ 7 1 5 5 1 3 3 1 2 6 3 8 1 4 7 1 - -
WOMEN
BILLERS, MACHINE (BILLINGMACHINE)------------------------------------------------- 3 , 4 7 3 3 9 . 5 7 7 . 0 0 7 5 . 0 0 6 5 . 5 0 - 8 7 . 5 0 - 6 1 4 1 7 795 7 7 3 6 9 0 3 4 1 2 1 9 1 6 9 7 - - - — - -
MANUFACTURING----------------------------------- 1 , 4 9 1 3 9 . 5 7 7 . 5 0 7 7 . 0 0 6 7 . 0 0 - 8 7 . 0 0 - - 1 5 9 3 3 7 3 2 9 3 8 0 1 6 2 96 21 7 - - - - - -NONMANUFACTURING----------------------------- 1 , 9 8 3 4 0 . 0 7 6 . 5 0 7 4 . 0 0 6 4 . 5 0 - 8 8 . 5 0 - 6 1 258 4 5 8 4 4 4 3 1 1 1 7 9 1 2 3 1 4 8 - - — - - - -
PUBLIC UTILITIES5 ------------------------- 6 4 0 4 0 . 0 8 7 . 5 0 8 6 . 0 0 7 2 . 5 0 - 1 0 4 . 5 0 - - 13 1 0 3 1 5 7 7 7 6 9 95 1 2 8 - — - - - - -WHOLESALE TRADE ------------------------------ 6 9 8 3 9 . 5 7 7 . 0 0 7 7 . 5 0 6 6 . 5 0 - 8 7 . 5 0 - - 86 1 5 5 1 5 3 1 8 0 80 2 6 20 - - - - - - -RETAIL TRADE------------------------------------ 503 3 9 . 5 6 4 . 0 0 6 4 . 5 0 5 4 . 0 0 - 7 3 . 0 0 “ 6 1 1 3 5 1 4 4 1 0 2 3 9 2 3 ~ “ - -
BILLERS, MACHINE (BOOKKEEPINGMACHINE) ------------------------------------------------------ 1 , 8 4 9 3 9 . 5 7 0 . 5 0 6 9 . 0 0 6 1 . 5 0 - 7 9 . 5 0 - 42 33 8 6 0 3 4 2 3 2 5 3 1 4 3 3 8 9 - - - - - - -
MANUFACTURING --------------------------------------- 3 6 4 3 9 . 5 7 8 . 5 0 7 9 . 5 0 6 7 . 5 0 - 8 8 . 0 0 - - 1 8 96 73 1 0 7 4 0 25 6 - - - - - - -NONMANUFACTURING -------------------------------- 1 , 4 8 4 3 9 . 5 6 8 . 5 0 6 7 . 5 0 6 0 . 0 0 - 7 6 . 5 0 - 4 2 3 2 0 5 07 3 51 1 4 6 1 0 3 1 3 3 - - - - - - -
RETAIL TRADE --------------------------------- 8 60 3 9 . 5 6 4 . 0 0 6 3 . 5 0 5 8 . 0 0 - 7 0 . 0 0 - 4 2 2 28 3 7 2 1 4 6 66 5 - - - - - - - - —S E R V IC E S ----------------------------------------- 3 23 4 0 . 0 7 0 . 0 0 7 0 . 5 0 6 1 . 5 0 - 7 7 . 0 0 “ 64 90 1 25 1 7 2 8 ~ ~ - - “
BOOKKEEPING-MACHINE OPERATORS,CLASS A ----- --------------------------------------------- 3 , 6 3 3 3 9 . 5 9 0 . 0 0 9 0 . 0 0 8 1 . 0 0 - 9 9 . 5 0 - - 98 1 9 6 5 1 5 1 0 0 7 9 4 1 5 0 1 2 5 6 1 0 9 1 2 - - - - -
MANUFACTURING ----------------------------------- 1 , 6 7 5 3 9 . 5 9 5 . 5 0 9 4 . 5 0 8 7 . 0 0 - 1 0 4 . 0 0 - - 7 1 3 1 4 2 4 1 2 5 34 3 4 7 1 4 6 6 7 8 - - - - -NONMANUFACTURING----------------------------- 1 , 9 59 3 9 . 5 8 5 . 5 0 8 4 . 5 0 7 6 . 0 0 - 9 5 . 0 0 - - 9 1 1 8 3 3 72 595 4 0 8 1 5 4 1 1 0 4 2 4 - - - - -
WHOLESALE TRADE --------------------------- 803 3 9 . 5 8 9 . 0 0 8 7 . 5 0 7 9 . 0 0 - 9 6 . 5 0 - - 9 21 1 8 3 2 3 3 1 9 7 6 1 77 22 - - - - - -RETAIL TRADE --------------------------------- 2 84 4 0 . 0 8 6 . 5 0 8 5 . 5 0 7 9 . 5 0 - 9 5 . 5 0 - - 3 5 68 105 69 2 5 8 1 - - - - - -FINANCE6------------------------------------------- 535 3 9 . 0 7 8 . 5 0 7 9 . 5 0 6 3 . 5 0 - 8 8 . 0 0 ~ 79 1 2 6 6 7 1 5 1 62 3 1 1 1 9 -
BOOKKEEPING-MACHINE OPERATORS,CLASS B --------------------------------------------------- 9 , 8 1 0 3 9 . 5 7 2 . 0 0 7 1 . 0 0 6 0 . 5 0 - 8 2 . 0 0 - 87 2 2 6 7 2 3 4 8 2 3 5 2 1 5 3 2 7 0 0 3 2 9 1 6 3 33 - — - - - -
MANUFACTURING----------------------------------- 2 , 9 3 7 3 9 . 5 8 0 . 5 0 7 9 . 0 0 7 0 . 5 0 - 8 9 . 5 0 - - 1 9 4 4 9 8 8 55 6 9 0 3 6 1 2 3 0 87 22 - - — - - -NONMANUFACTURING-------------------------------- 6 , 8 7 4 3 9 . 5 6 8 . 5 0 6 7 . 0 0 5 8 . 0 0 - 7 7 . 0 0 - 87 2 0 7 4 1 8 4 9 1 4 9 9 8 41 3 3 9 9 9 76 1 1 - - - - - -
WHOLESALE TRAOE ------------------------------ 1 , 6 2 6 4 0 . 0 7 5 . 0 0 7 5 . 5 0 6 5 . 5 0 - 8 4 . 5 0 - - 2 3 1 379 3 64 4 4 0 16 2 1 4 36 - - — - - - -RETAIL TRADE------------------------------------ 1 , 2 3 8 4 0 . 0 7 0 . 0 0 6 9 . 5 0 6 0 . 5 0 - 7 8 . 0 0 - 6 0 2 27 3 5 4 3 38 1 5 3 72 23 9 - - - - - - -FINANCE6----------------------------------------------- 3 , 5 0 6 3 9 . 0 6 4 . 0 0 6 1 . 5 0 5 6 . 0 0 - 7 0 . 5 0 - 2 5 1 5 7 5 1 0 0 5 6 87 1 4 1 4 6 2 7 1 - - — - - - -SE R VICE S --------------------------------------------- 2 9 7 3 8 . 5 7 9 . 5 0 7 8 . 0 0 6 9 . 0 0 - 8 9 . 0 0 - 2 22 57 79 73 3 8 4 1 1 11 - - ~
CLERKS, ACCOUNTING, CLASS A -------------- 1 1 , 5 8 8 3 9 . 5 9 7 . 5 0 9 5 . 5 0 8 6 . 0 0 - 1 0 9 . 5 0 - - 4 8 3 7 3 1 1 4 2 2 4 4 8 2 7 9 9 2 0 2 1 1 4 3 1 745 4 1 5 1 2 0 4 1 4 3 _MANUFACTURING --------------------------------------- 4 , 8 6 6 3 9 . 5 1 0 2 . 5 0 1 0 1 .0 0 8 9 . 5 0 - 1 1 4 . 5 0 - - - 60 2 6 2 9 7 6 1 0 2 7 9 4 3 7 3 1 4 5 8 287 80 34 4 3 -NONMANUFACTURING -------------------------------- 6 , 7 2 2 3 9 . 0 9 4 . 0 0 9 3 . 0 0 8 3 . 5 0 - 1 0 5 . 0 0 - - 4 8 3 1 3 8 80 1 4 7 0 1 7 7 1 1 0 7 8 7 0 0 2 8 8 1 28 4 0 7 - - -
PUBLIC UTILITIES5---------------------------- 1 , 4 6 6 4 0 . 0 1 0 3 . 0 0 1 0 4 . 5 0 9 2 . 0 0 - 1 1 4 . 0 0 - - - 1 4 79 1 7 8 3 4 7 3 0 3 3 9 3 72 8 1 1 - - - -WHOLESALE TRADE--------------------------- 1 , 0 8 5 4 0 . 0 9 7 . 5 0 9 6 . 0 0 8 8 . 0 0 - 1 0 5 . 5 0 - - 2 1 7 87 2 1 0 3 9 2 1 8 0 85 6 9 25 1 1 7 - - -RErAIL TRADE--------------------------------- 1 , 4 7 0 4 0 . 0 8 7 . 5 0 8 8 .0 0 7 8 . 5 0 - 9 6 . 5 0 - - 18 6 9 3 2 1 3 9 7 4 0 5 2 0 4 42 11 1 1 - - - -FINANCE6------------------------------------------- 1 , 8 3 2 3 8 . 5 8 8 . 5 0 8 8 . 0 0 7 8 . 0 0 - 9 7 . 5 0 - - 2 8 1 8 4 309 5 1 6 4 1 1 2 2 3 9 6 4 8 12 6 - - - -SE R VICE S----------------------------------------- 8 69 3 8 . 5 9 7 . 5 0 9 7 . 0 0 8 5 . 5 0 - 1 0 9 . 0 0 - - - 28 84 1 7 0 2 1 7 1 6 7 86 88 9 2 1 - - -
CLERKS, ACCOUNTING, CLASS B ------------- 2 5 , 9 0 4 3 9 . 5 7 7 . 0 0 7 5 . 5 0 6 6 . 0 0 - 8 7 . 0 0 - 1 8 9 2 6 7 3 6 3 5 1 6 3 8 3 5 3 3 0 2 5 9 9 1 4 6 0 7 0 1 2 03 12 4 - _ _ -MANUFACTURING --------------------------------------- 9 , 2 4 9 3 9 . 5 8 1 . 5 0 8 0 . 0 0 7 0 . 0 0 - 9 2 . 0 0 - - 4 7 0 1 8 1 7 2 3 2 1 2 1 1 8 1 1 4 7 8 3 4 3 7 9 150 9 4 - - - -
NONMANUFACTURING -------------------------------- 1 6 , 6 5 5 3 9 . 0 7 4 . 5 0 7 3 . 0 0 6 4 . 0 0 - 8 4 . 5 0 - 1 8 9 2 2 0 5 4 5 3 5 4 0 6 2 3 2 1 2 1 4 5 2 6 2 5 3 22 53 3 - - - - -PUBLIC UTILITIES5 ---------------------------- 3 , 3 9 7 4 0 . 0 8 3 . 0 0 8 1 . 5 0 7 0 . 5 0 - 9 4 . 5 0 - - 1 3 9 6 40 8 1 9 7 12 4 4 7 3 5 2 245 4 3 1 - - - - -WHOLESALE TRADE ------------------------------ 2 , 9 5 5 3 9 . 5 7 8 . 5 0 7 8 . 0 0 6 8 . 0 0 - 8 7 . 5 0 - - 2 03 6 77 7 5 3 7 96 3 0 2 1 6 7 4 4 1 0 2 - - - - -RETAIL TRADE------------------------------------ 4 , 095 3 9 . 5 6 9 . 0 0 6 8 . 5 0 6 0 . 5 0 - 7 8 . 5 0 - 86 8 84 1 2 1 4 1 0 2 7 6 5 4 2 0 0 27 4 - - - - - - -
FINANCE6------------------------------------------- 4 , 7 1 6 3 8 . 0 7 0 . 0 0 6 9 . 0 0 6 1 . 5 0 - 7 9 . 0 0 - 80 8 78 1 5 7 3 1 1 3 9 742 2 7 2 2 9 3 - - - - - - -
SERVICES ----------------------------------------- 1 , 4 9 2 3 9 . C 7 7 . 0 0 7 5 . 5 0 6 6 . 5 0 - 8 7 . 5 0 23 1 0 0 4 3 1 325 3 0 6 2 3 2 5 0 26 ~ ” “
S ee foo tn otes at end o f table.
Digitized for FRASER http://fraser.stlouisfed.org/ Federal Reserve Bank of St. Louis

26
Table A*4. Office Occupations—North Central— Continued
(A v e ra g e s tra ig h t-t im e w eek ly hours and ea rn in gs fo r s e le c te d o ccu p a tion s by in du stry d iv is io nin the N orth C en tra l re g io n , 1 F e b ru a ry 1965 2)
Weekly earnings3 (standard) N u m ber o f w o rk e r s re ce iv in g s tra ig h t-t im e w eek ly ea rn in gs o f
N L Average $ $ $ $ $ $ $ $ $ $ $ $ $ $ $ $weekly 30 40 50 60 70 80 90 100 110 120 130 140 150 160 170 180
workers hours3(standard) Mean4 Median4 Middle range4 and
under - - - - - - - - - - - - - and
40 50 60 70 80 90 100 110 120 130 140 150 160 1 (0 180 o v e r
$ $ $ $3 ,0 1 2 3 9 .0 8 2 .0 0 8 2 .0 0 7 2 .0 0 - 9 2 .0 0 - 21 213 384 741 7 73 463 248 145 18 5 - - - - -1 ,1 6 6 3 9 .5 8 6 .5 0 8 6 .0 0 7 8 . 0 0 - 9 4 .5 0 - - 38 64 256 367 229 112 99 2 2 - _ - _ _1 ,8 4 5 3 9 .0 7 9 .5 0 7 8 . CO 6 9 . 0 0 - 8 9 .5 0 - 21 176 320 486 407 235 137 46 16 3 - - - - -
287 3 9 .5 8 3 .0 0 8 2 .0 0 7 0 .5 0 - 9 7 .5 0 - - 2 62 67 69 26 46 12 3 - _ _ - _ -1 ,0 1 3 3 8 .5 7 4 .0 0 7 4 .5 0 6 5 .5 0 - 8 3 .0 0 - 21 160 191 316 226 72 14 10 1 - _ _ _ _ _
2 57 3 8 .5 8 4 .0 0 8 4 .5 0 7 3 . 5 0 - 9 3 .0 0 - - 6 21 72 65 75 19 ~ - - - - - -
1 3 ,0 0 5 3 9 .0 6 6 .5 0 6 4 .5 0 5 8 .0 0 - 7 3 .5 0 _ 419 3750 4618 245 5 1179 387 139 45 12 _ __ _ _ _ _
3 ,5 4 2 3 9 .5 7 1 .0 0 7 0 .5 0 6 2 . 5 0 - 7 8 .0 0 - - 627 110 0 1131 439 144 61 30 10 _ _ _ _ - _9 ,4 6 3 3 9 .0 6 5 .0 0 6 3 .0 0 5 7 . 5 C - 7 0 .0 0 - 419 3124 3519 1324 741 243 78 15 2 _ _ _ _ - _
929 4 0 .0 7 9 .0 0 7 7 .5 0 6 8 . 0 0 - 8 9 .5 0 - - 66 222 236 185 134 72 13 2 _ _ _ _ _1 ,6 0 3 4 0 .0 6 7 .5 0 6 5 .0 0 5 9 .5 0 - 7 5 .5 0 - - 418 603 302 212 61 4 2 _ _ _ _ _ _ _1 ,2 2 6 3 9 .0 6 2 .0 0 6 1 .0 0 5 2 .5 0 - 7 2 .0 0 - 205 37C 290 197 157 8 - - _ _ - _ _ _ _4 ,9 8 6 3 8 .5 6 2 .0 0 6 1 .0 0 5 7 . 0 0 - 6 6 .5 0 - 158 2067 2 05 9 536 149 17 - - - _ _ - _ _ _
719 3 9 .0 6 3 .0 0 6 2 . 50 5 6 .5 0 - 6 8 .0 0 55 205 344 54 37 23 2 - - - - - - - -
7 ,0 4 2 3 9 .0 5 7 .5 0 5 5 .0 0 5 2 .0 0 - 6 1 .0 0 - 443 4 668 1406 292 106 118 8 _ _ _ _ _ _ _
1 ,0 9 5 3 9 .5 6 2 .5 0 6 2 .0 0 5 5 .0 0 - 6 7 .5 0 - 9 429 504 85 34 32 3 - - _ _ - _ - -5 , 946 3 9 .0 5 6 .5 0 5 4 .5 0 5 2 . 0 0 - 5 9 .5 0 - 434 4 23 9 903 207 72 86 5 - - _ - - _ _ _
464 4 0 .0 7 0 .5 0 6 9 .0 0 5 9 .0 0 - 8 2 .5 0 - - 127 114 83 52 82 5 - - - - - _ - _746 4 0 .0 5 6 .0 0 5 4 . 50 5 2 . 0 0 - 5 9 .0 0 - 24 561 146 2 12 - - - - - _ _ _ _ _633 4 0 .0 5 4 .5 0 5 3 .5 0 5 0 .5 0 - 5 8 .5 0 - 119 389 95 30 - - - - - _ _ _ _ _ _
3 ,5 8 7 3 9 .0 5 5 .0 0 5 4 .0 0 5 1 . 5 0 - 5 8 .0 0 - 285 2784 426 80 8 4 - - _ _ _ _ _ _ _517 3 9 .5 5 6 .5 0 5 6 .5 0 5 3 . 0 0 - 6 0 .0 0 - 6 377 122 12 - - - - - - - -
6 ,9 4 3 3 9 .5 7 6 .5 0 7 6 .0 0 6 6 . 0 0 - 8 6 .0 0 - 46 827 1532 1787 1462 668 325 222 61 9 1 1 _ _
3 ,5 5 2 3 9 .5 7 9 .5 0 7 8 . 50 7 0 . 0 0 - 8 8 .5 0 - - 232 649 1035 821 480 166 112 48 7 1 1 _ _ _3 ,3 9 0 4 0 .0 7 3 .5 0 7 2 .0 0 6 2 . 0 0 - 8 4 .0 0 - 46 595 883 754 643 188 1 59 110 13 2 _ _ _1 ,7 9 9 4 0 .0 7 7 .5 0 7 8 .0 0 6 6 .0 0 - 8 7 .5 0 - - 198 397 390 4 80 139 111 71 13 2 _ _ _ _ _1 ,1 9 0 3 9 .5 6 5 .0 0 6 4 .0 0 5 7 . 0 0 - 7 3 .0 0 45 358 4 07 255 102 16 8 - - - - - - -
1 0 ,0 2 4 3 9 .5 8 8 .5 0 8 7 .5 0 7 5 .5 0 - 1 0 1 .0 0 - 12 365 1 196 1835 2132 1 869 1268 790 355 152 43 5 4 _ _
6 ,4 3 7 3 9 .5 8 9 .5 0 8 7 .5 0 7 6 .0 0 - 1 0 2 .5 0 - - 235 721 1192 1393 1096 841 489 301 130 28 5 4 _ _3 ,5 8 7 3 9 .5 8 6 .5 0 8 7 .0 0 7 4 .0 0 - 9 9 .0 0 - 12 131 475 643 738 773 4 27 300 54 21 15 _ _ _
986 4 0 .0 9 4 .0 0 9 5 .0 0 8 2 .0 0 - 1 0 8 .0 0 - - 21 66 126 128 255 177 174 25 10 4 _ _ _ _623 3 9 .5 8 9 .5 0 9 0 .0 0 8 0 .5 0 - 9 9 .0 0 - - 14 73 62 162 171 67 45 10 10 8 _ _ _ _937 3 9 .5 7 8 .0 0 7 8 .0 0 6 9 . 5 0 - 8 7 .5 0 - 12 67 164 272 238 125 39 17 1 3 _ _ _ _442 3 8 .5 8 8 .5 0 8 7 .5 0 7 3 .0 0 - 1 0 2 .0 0 - - 17 68 78 76 75 63 51 14 1 _ _ _ _ _598 3 9 .0 8 4 .0 0 8 5 .5 0 7 3 . 5 0 - 9 5 .0 0 “ 10 103 105 135 147 81 13 4 - - - - - -
9 ,8 3 8 3 9 .5 8 2 .0 0 7 9 .5 0 7 0 .0 0 - 9 3 .5 0 - 60 648 1730 2553 1933 1229 9 99 438 238 12 _ _ _ _
4 ,1 6 3 3 9 .5 8 7 .5 0 8 6 .0 0 7 4 .0 0 - 1 0 1 .5 0 - 14 154 564 837 841 589 585 340 229 12 _ _ _ _ _5 ,6 7 5 3 9 .5 7 7 .5 0 7 6 .5 0 6 8 .0 0 - 8 7 .0 0 - 46 494 1166 1718 1092 6 40 413 98 9 _ _ _ _
738 4 0 .0 9 6 .5 0 1 C 1 .0 0 9 1 .0 0 - 1 0 7 .0 0 - - 15 34 62 59 175 325 64 4 _ _ _ _1 ,4 3 6 4 0 .0 7 8 .0 0 7 7 .0 0 7 0 .0 0 - 8 5 .0 0 - - 100 258 532 312 135 65 31 5 _ _ _ _ _ _2 ,5 2 3 3 9 .5 7 3 .5 0 7 4 .0 0 6 4 . 5 0 - 8 3 .5 0 - 46 342 592 680 556 282 24 1 _ _ _ _ _
324 3 8 .5 7 1 .5 0 7 2 .0 0 6 3 . 5 0 - 7 9 .0 0 ' "37 95 119 64 9 ~ - - - ~ - -
977 3 9 .5 7 4 .0 0 7 2 .0 0 6 3 .0 0 - 8 3 .5 0 _ 29 132 279 212 175 88 45 15 3520 4 0 .0 7 7 .0 0 7 4 .0 0 6 4 .5 0 - 8 8 .5 0 - 3 51 157 98 93 62 38 15 3 _ _ _ _ _ _457 3 9 .0 7 0 .0 0 7 0 .0 0 6 0 . 5 0 - 8 0 .0 0 26 81 122 114 82 27 7 - - - - - -
9 ,4 0 7 3 9 .5 8 8 .5 0 8 7 .5 0 7 8 . 0 0 - 9 8 .5 0 - - 35 705 2 046 2 541 1992 1516 378 150 43 1 _ _ _
4 ,7 8 6 3 9 .5 9 1 .0 0 9 0 .5 0 8 1 . 5C-1 0 0 .5 0 - - - 204 803 1319 1 19 4 872 230 124 39 1 _ - _ _4 , 621 3 9 .0 8 5 .5 0 8 4 .0 0 7 5 .0 0 - 9 5 .5 0 - - 35 501 1243 1222 798 644 148 26 4 _ _ _ _1 ,3 9 1 4 0 .0 9 5 .0 0 9 8 .0 0 8 5 .0 0 - 1 0 6 .5 0 - - 1 66 211 158 326 476 132 22 - _ _ _ _
692 3 9 .5 8 8 .5 0 8 7 .0 0 8 0 . 5 0 - 9 8 .0 0 - - - 10 151 242 165 100 16 4 4 _ _ _ _ _460 3 9 .5 8 0 .0 0 8 1 .5 0 7 1 . 0 0 - 8 9 .5 0 - - - 107 94 148 90 20 - _ _ • _ _ •
1 ,8 3 6 3 8 .5 7 8 .5 0 7 8 .0 0 7 2 . 0 0 - 8 5 .0 0“ "
34 300 713 577 178 35 ~ - - - - - -
Sex, o ccu p a tion , and in du stry d iv is io n
WOMEN - CONTINUED
CLERKS. F IL E . CLASS A -----------M AN U FACT UR IN G ----------------------NONMANUFACTURING---------------
WHOLESALE TRADE -------------FINANCE6------------------------------SERVICES ----------------------------
CLERKS, F IL E , CLASS B ----------MANUFACTURING---------------------NONMANUFACTURING---------------
PUBLIC U TILITIES5 ----------WHOLESALE TRADE ------------RETAIL TRAD E-------------------FINANCE6------------------------------SE R V IC E S ----------------------------
CLERKS, FILE, CLASS C ------—MANUFACTURING---------------------NONMANUFACTURING---------------
PUBLIC UTILITIES5-----------WHOLESALE TRAD E-------------RETAIL T RAD E-------------------FINANCE6------------------------------S E R V IC E S----------
CLERKS, ORDER ---------------------MANUFACTURING---------------NONMANUFACTURING ----------------------
WHOLESALE TRAD E--------------------RETAIL TRADE --------------------------
CLERKS, PAYROLL -------------------------------MANUFACTURING----------------------------NONMANUFACTURING----------------------
PUBLIC U TILITIES5 ------------------WHOLESALE TRADE --------------------RETAIL TRAD E--------------------------FINANCE6-------------------------------------S E R V IC E S-----------------------------------
COMPTOMETER OPERATORS------------------MANUFACTURING-----------------------------NONMANUFACTURING----------------------
PUBLIC UTILITIES5 ------------------WHOLESALE TRADE --------------------RETAIL TRADE - - ----------------------FINANCE6-------------------------------------
DUPL ICATING-MACHINE OPERATORSI MIMEOGRAPH OR DITTO) ------------
MANUFACTURING ----------------------------NONMANUFACTURING----------------------
KEYPUNCH OPERATORS, CLASS A ----MANUFACTURING----------------------------NONMANUFACTURING ----------------------
PUBLIC U TILITIES5 -----------------WHOLESALE TRAOE -------------------RETAIL TRAD E--------------------------FINANCE6-------------------------------------
S ee foo tn otes at end o f tab le .
Digitized for FRASER http://fraser.stlouisfed.org/ Federal Reserve Bank of St. Louis

27
Table A-4. Office Occupations—North Central----- Continued
(A v e ra g e s tra ig h t -t im e w eek ly h ou rs and ea rn in gs fo r se le c te d o ccu p a tio n s b y in du stry d iv is io nin the N orth C en tra l r e g io n , 1 F e b ru a ry 1965 2)
Weekly earnings3 (standard) N u m ber o f w o rk e r s re c e iv in g s tr a ig h t -t im e w e e k ly ea rn in gs o f—
Number $ $ " t $ $ i $ $ $ $ $ S $ $ % $weekly 30 4 0 50 60 70 80 90 100 110 120 130 140 150 160 170 180
workers hours3(standard' Mean4 Median4 Middle range4 and
under - - - - - - - - - - - - - - and
40 50 60 70 80 90 100 110 120 130 140 150 160 170 180 o v e r
$ $ $ $19 ,0 0 7 3 9 .5 7 6 .0 0 7 4 .0 0 6 5 .0 0 - 8 4 .5 0 - 45 2400 487 1 5126 3 136 183 7 1050 381 156 6 — - - — - ‘
8 ,0 8 7 3 9 .5 8 0 .5 0 7 8 .0 0 7 0 . 0 0 - 9 0 .5 0 - - 502 154 8 2 414 1555 1 11 6 5 50 273 124 6 - - - — -1 0 , 920 3 9 .0 7 2 .5 0 7 0 .5 0 6 2 . 5 0 - 8 1 .0 0 - 45 1898 3323 2713 1581 721 4 99 108 32 — — — - - -
2 ,0 3 0 4 0 .0 8 2 .5 0 7 8 .0 0 6 9 .0 0 - 1 0 1 .0 0 - - 64 484 521 227 186 4 47 101 - - - — - — —2 ,2 2 0 3 9 .5 7 5 .0 0 7 5 .0 0 6 6 . 5 0 - 8 3 .0 0 - - 180 625 662 532 163 20 7 32 - - - - - -1 ,3 4 5 4 0 . C 6 9 .0 0 6 8 .5 0 6 2 . 5 C - 7 7 .0 0 - - 177 552 396 176 3 9 4 - - - - — - - -4 ,2 5 6 3 8 .5 6 7 .0 0 6 6 .0 0 5 9 . 0 0 - 7 3 .0 0 - 45 1225 1526 966 322 172 2 - - - - - - - -1 ,0 6 9 3 9 .5 7 4 .5 0 7 8 .5 0 6 1 .0 0 - 8 6 .0 0 - 253 136 168 325 161 26 - - ~
4 ,3 6 6 3 9 .0 6 3 .5 0 6 1 .0 0 5 5 .5 0 - 6 9 .0 0 132 1925 1327 570 241 119 21 32 - _ - - - -1 ,1 7 2 3 9 .5 6 9 .0 0 6 7 .UO 5 9 . 0 0 - 7 6 .5 0 - 8 332 348 258 128 53 14 32 - - — - - — -3 ,1 9 3 3 9 .0 6 1 .0 0 5 9 .5 0 5 4 . 5 C - 6 5 .5 0 - 124 1594 979 312 113 66 7 - - - - - - - -
432 3 9 .5 7 2 .0 0 6 8 .5 0 6 3 . 0 0 - 8 1 .5 0 _ - 37 202 79 59 49 6 - - - - - - - -475 4 0 .0 6 2 .0 0 6 0 .5 0 5 5 .0 0 - 6 7 .5 0 - 11 215 154 62 31 2 1 - - - - - - - -407 3 9 .5 5 9 .0 0 5 9 .5 0 5 4 .0 0 - 6 4 .0 0 - 11 203 154 37 2 - - - - - - - — - -
1 ,6 6 5 3 8 .5 5 8 .0 0 5 7 .5 0 5 3 . 5 0 - 6 2 .0 0 93 1065 401 92 15 *“ - “ ~
5 4 ,9 5 4 3 9 .0 1 0 3 .5 0 1 0 2 .0 0 8 9 .5 0 - 1 1 7 .0 0 _ 7 289 1395 3 77 9 8796 10703 10562 8125 5460 3337 1611 567 2 19 93 162 7 ,6 6 7 3 9 .5 1 0 8 .0 0 1 0 6 .5 0 9 3 .0 0 - 1 2 1 .5 0 - - 24 280 1250 3 872 4 88 5 5361 4 451 3388 2 349 1177 391 164 68 92 7 ,2 8 7 3 9 .0 9 9 .0 0 9 8 .0 0 8 6 .0 0 - 1 1 1 .5 0 - 7 265 1114 252 9 4 924 5818 5201 3674 2 072 987 4 34 175 55 25 7
4 ,2 8 6 3 9 .5 1 1 0 .0 0 1 1 0 .5 0 9 8 .0 0 - 1 2 2 .0 0 - - 14 39 169 445 527 900 1001 583 297 191 82 22 17 15 ,1 5 6 3 9 .5 1 0 0 .5 0 1 0 0 .0 0 8 7 .5 0 - 1 1 5 .0 0 - - 28 192 452 763 1 144 939 769 518 222 87 30 11 - -3 ,1 5 4 3 9 .5 9 4 .5 0 9 5 .0 0 8 3 .5 0 - 1 0 7 .5 0 - 7 42 182 346 651 676 572 433 162 71 8 2 - - 29 ,5 3 3 3 8 .5 9 4 .0 0 9 3 .0 0 8 2 .5 0 - 1 0 4 .0 0 - - 154 553 1223 2 066 2 263 1713 759 488 198 63 27 13 8 45 ,1 5 9 3 7 .5 1 0 0 .0 0 9 9 .0 0 8 8 .0 0 - 1 1 1 .0 0 - - 27 148 339 1000 1 209 107 7 713 319 199 85 34 9
3 0 ,3 8 9 3 9 .5 8 1 .5 0 8 0 .0 0 7 0 . 5 0 - 9 2 .0 0 _ 21 1783 5 32 9 7895 6 737 4 53 0 277 8 1068 238 8 _ _ _ - -1 5 , 3 86 3 9 .5 8 3 .5 0 8 3 .0 0 7 3 . 0 0 - 9 4 .0 0 - - 439 2151 4 0 5 4 3 68 4 2874 1585 437 159 4 - - - — -1 5 ,0 0 3 3 9 .0 7 9 .5 0 7 7 .5 0 6 7 . 5 0 - 8 9 .5 0 - 21 1344 3178 3 843 3053 1 658 1193 6 31 79 4 - - - - -
4 ,3 4 2 4 0 .0 9 0 .5 0 9 1 .0 0 7 5 .5 0 - 1 0 5 .5 0 - - 60 535 812 704 685 918 556 67 4 - - — - -2 ,8 6 5 3 9 .5 7 9 .0 0 7 9 .5 0 6 9 . 0 0 - 8 9 .0 0 - - 211 551 713 736 4 30 164 48 12 - - - - — -1 ,1 1 4 3 9 .5 7 3 .0 0 7 3 .0 0 6 4 . 0 0 - 8 1 .5 0 - 11 146 269 385 149 132 18 5 - - - - - - -5 ,3 6 8 3 8 .5 7 2 .0 0 7 1 .0 0 6 3 . 0 0 - 8 0 .0 0 - 10 887 1581 1 54 7 1035 241 55 12 - - - - - - -1 ,3 1 4 3 8 .0 7 9 .0 0 7 9 .5 0 7 1 . 0 0 - 8 7 .0 0 - - 38 242 386 4 29 170 38 10 - - - “
2 1 ,1 4 9 3 9 .5 9 4 .5 0 9 4 .5 0 8 4 .0 0 - 1 0 5 .5 0 _ _ 85 995 262 8 4602 4 86 6 4 5 5 8 2305 1016 82 11 2 - - _1 3 ,3 4 2 3 9 .5 9 7 .5 0 9 8 .0 0 8 7 .0 0 - 1 0 7 .5 0 - - 21 262 1313 2 77 7 2 994 3 32 7 1738 840 58 10 2 - — -
7 ,8 0 8 3 9 .0 8 9 .5 0 9 0 .0 0 7 8 .5 0 - 1 0 0 .5 0 - - 64 734 1314 1 824 1871 1231 568 176 24 1 - - - -1 ,7 4 7 4 0 .0 1 0 0 .5 0 1 0 2 .0 0 9 1 .0 0 - 1 1 1 .0 0 - - - 24 143 2 1 9 383 508 314 135 20 1 — - - —
972 3 9 .5 9 1 .5 0 9 2 .0 0 8 2 .5 0 - 1 0 1 .5 0 - - 9 91 84 241 273 166 92 15 1 - - - - -8C5 3 9 .5 8 7 .0 0 8 8 .0 0 8 0 . 0 0 - 9 4 .5 0 - - 6 39 162 255 252 76 14 3 - - - - - -
2 ,9 9 6 3 8 .5 8 3 .5 0 8 3 .0 0 7 2 . 5 0 - 9 3 .0 0 - - 48 4 45 752 764 680 231 60 16 - - - - - -1 ,2 8 7 3 7 .5 9 0 .0 0 9 0 .0 0 8 0 .5 0 - 1 0 1 .0 0 - 1 135 175 344 2 84 251 88 7 3 - - _ -
7 ,5 1 7 4 0 .0 7 8 .5 0 7 8 .5 0 6 2 . 5 0 - 9 3 .5 0 73 318 1116 1333 1072 1 276 1191 691 356 86 5 1 _ _ _ _2 ,2 7 8 3 9 .5 9 2 .0 0 9 1 .5 0 8 1 .5 0 - 1 0 3 .0 0 - - 19 195 273 572 526 354 266 71 3 1 — - - -5 ,2 3 9 4 0 .0 7 2 .5 0 7 0 .0 0 5 8 . 0 0 - 8 6 .5 0 73 3 18 1097 1138 800 704 665 337 90 15 2 - - - - -
860 4 0 .0 9 5 .5 0 9 7 .0 0 9 0 .5 0 - 1 0 3 .0 0 - - 6 20 43 136 324 255 64 11 - — - - - -516 4 0 .0 8 0 .0 0 7 9 .5 0 7 0 . 5 0 - 9 0 .5 0 - - 35 85 143 117 92 24 17 2 1 - - - - -
1 ,1 3 5 3 9 .5 6 5 .0 0 6 4 .0 0 5 7 . 0 0 - 7 1 .5 0 - 68 326 4 2 0 192 85 36 7 1 - - — - - - —1 ,1 2 7 3 8 .5 7 5 .5 0 7 5 .0 0 6 6 . 5 0 - 8 4 .5 0 - 14 167 180 343 245 136 40 2 - - - - - - -1 ,6 0 2 4 1 .5 6 0 .5 0 5 8 .0 0 5 1 . 0 0 - 6 6 .5 0 73 2 36 564 433 79 121 76 11 6 2 1
9 ,6 9 4 3 9 .5 7 7 .5 0 7 6 .5 0 6 7 . 5 0 - 8 7 .0 0 _ 42 802 2132 2 658 2215 1222 4 29 135 59 1 1 _ _ - -4 ,8 8 3 3 9 .5 7 9 .0 0 7 8 .5 0 7 0 . 0 0 - 8 8 .0 0 - - 311 879 1 477 1 2 0 0 716 176 92 31 1 1 - - — -4 ,8 1 1 3 9 .5 7 6 .0 0 7 4 .5 0 6 5 . 5 0 - 8 6 .0 0 - 42 492 1253 1181 1015 508 2 52 43 28 - - - - - -
612 3 9 .5 8 1 .0 0 8 0 .0 0 7 1 .5 0 - 9 4 .0 0 - 11 28 88 183 105 117 71 3 6 - — - - - -1 ,9 0 2 3 9 .5 7 7 . 00 7 6 .0 0 6 7 . 5 0 - 8 6 .0 0 - - 145 431 564 480 186 4 0 39 18 - - — - — -
851 4 0 .0 6 8 .5 0 6 5 .5 0 5 9 . 5 0 - 7 7 .5 0 - 21 208 304 143 112 38 24 - - - - - - - -818 3 8 .0 7 5 .5 0 7 2 . 50 6 5 . 5 0 - 8 4 .5 0 - 6 68 249 203 167 73 51 - - - - - - - -6 28 3 9 .0 7 8 .5 0 8 0 .0 0 6 7 . 0 0 - 9 1 .0 0 3 42 181 87 151 93 66 1 4 ~
Sex, o ccu p a tio n , and in du stry d iv is io n
WOMEN - CONTINUEDKEYPUNCH OPERATORS* CLASS B --------------
MANUFACTURING --------------------------------------NONMANUFACTURING-------------------------------
PUBLIC U T IL IT IE S 5---------------------------WHOLESALE TRADE-----------------------------RETAIL TRAO E------------------------------------FINANCE6-----------------------------------------------S E R V IC E S--------------------------------------------
OFFICE GIRLS -----------------------------------------------MANUFACTURING --------------------------------------NONMANUFACTURING-------------------------------
PU3LIC U T IL IT IE S 5---------------------------WHOLESALE TRADE -----------------------------RETAIL TRAD E------------------------------------FINANCE6----------------------------------------------
SECRETARIES-------------------------------------------------M ANUFACTUR IN G --------------------------------------NONMANUFACTURING-------------------------------
PUBLIC U T IL IT IE S 5---------------------------WHOLESALE TRAOE-----------------------------RETAIL TRADE ------------------------------------FINANCE6----------------------------------------------S E R V IC E S--------------------------------------------
STENOGRAPHERS* GENERAL-------------------------MANUFACTURING --------------------------------------NONMANUFACTURING-------------------------------
PUBLIC U T IL IT IE S 5---------------------------WHOLESALE TRADE -----------------------------RETAIL T RAD E------------------------------------FINANCE6-----------------------------------------------S E R V IC E S---------------------------------------------
STENOGRAPHERS, SE N IO R ---------------------------MANUFACTURING --------------------------------------NONMANUFACTURING--------------------------------
PUBLIC U T IL IT IE S 5---------------------------WHOLESALE TRAD E-----------------------------RETAIL TRAD E------------------------------------FINANCE6-----------------------------------------------SER V I C E S ---------------------------------------------
SWITCHBOARD OPERATORS-----------------------------MANUFACTURING --------------------------------------NONM ANUFACTUR IN G --------------------------------
PUBLIC U T IL IT IE S 5----------------------------WHOLESALE TRADE------------------------------RETAIL TRAD E------------------------------------FINANCE6-----------------------------------------------SERVICES ---------------------------------------------
SWITCHBOARD OPERATOR-RECEPTION ISTS-MANUFACTUR IN G --------------------------------------NONMANUFACTURING--------------------------------
PUBLIC U T IL IT IE S 5---------------------------WHOLESALE TRADE -----------------------------RETAIL TRAOE ------------------------------------FINANCE6-----------------------------------------------S E R V IC E S ---------------------------------------------
S ee foo tn otes at end o f tab le .
Digitized for FRASER http://fraser.stlouisfed.org/ Federal Reserve Bank of St. Louis

28
Table A-4. Office Occupations—North Central-----Continued
(A v e ra g e s tra ig h t-t im e w eek ly h ou rs and ea rn in gs fo r se le c te d o ccu p a tio n s by in du stry d iv is io n in the N orth C en tra l re g io n , 1 F e b ru a ry 1965 2)
Sex, o ccu p a tio n , and in du stry d iv is io nNumber
ofworkers
Averageweeklyhours3
(standard)
Weekly earnings3 (standard) N u m ber o f w o rk e r s re ce iv in g s tr a ig h t -t im e w eek ly ea rn in gs o f—
Mean4 Median4 Middle range4$
30and
under40
$40
50
$50
6C
$60
7C
$70
80
i80
90
$90
100
*100
110
$110
120
$120
130
$130
140
$140
150
$150
160
$160
170
*1 7 0
180
*180
and
o v e r
WOMEN - CONTINUED
TABULATING-MACHINE OPERATORS, $ $ $ $CLASS A -------------------------------------------------------- 359 39*5 1 1 3 .5 0 1 1 3 .0 0 1 0 2 .5 0 -1 2 6 .0 0 - - " 1 3 26 40 88 78 54 40 19 8 1 -
TABULATING-MACHINE OPERATORS,CLASS B -------------------------------------------------------- 1 ,9 5 7 3 9 .5 9 5 .0 0 9 3 .5 0 8 3 .5 0 - 1 0 5 .5 0 - - 7 61 277 413 4 77 372 212 84 44 11 - - - -
MANUFACTURING--------------------------------------- 790 3 9 .5 1 0 1 .0 0 1 0 1 .0 0 9 0 .5 0 - 1 0 9 .0 0 - - - 7 73 105 180 2 44 74 62 36 9 - - - -NQNMANUFACTURING -------------------------------- 1 ,1 6 7 3 9 .5 9 1 .0 0 9 0 .0 0 8 1 .0 0 - 1 0 0 .5 0 - - 7 54 204 308 297 128 138 21 8 2 - - - -
PUBLIC U T IL IT IE S 5---------------------------- 489 4 0 .0 9 6 .0 0 9 3 .5 0 8 5 .0 0 - 1 1 1 .0 0 - - - 16 62 75 155 40 110 20 8 2 - - - -FINANCE6----------------------------------------------- 332 3 8 .5 8 5 .5 0 8 7 .0 0 7 7 .5 0 - 9 2 .5 0 - - 7 35 55 125 69 36 5 ~ - - - -
TABULATING-MACHINE OPERATORS,CLASS C -------------------------------------------------------- 1 ,8 3 4 3 9 .5 7 5 .0 0 7 3 .5 0 6 4 . 5 0 - 8 4 .0 0 - 13 135 572 447 416 171 63 10 7 - - - - - -
MANUFACTURING--------------------------------------- 464 3 9 .5 8 3 .5 0 8 3 .0 0 7 4 . 0 0 - 9 2 .0 0 - - 11 46 111 168 82 31 10 6 - - - - - ~
NONMANUFACTURING-------------------------------- 1 ,3 7 0 3 9 .5 7 2 .0 0 7 0 .5 0 6 3 . 0 0 - 8 1 .0 0 - 13 124 526 336 249 89 32 - 1 - - - - - -
PUBLIC U T IL IT IE S 5---------------------------- 681 4 0 .0 7 3 .0 0 7 1 .5 0 6 4 . 0 0 - 8 0 .5 0 - - 16 288 198 131 27 21 - 1 - - - - - -FINANCE6 ----------------------------------------------- 422 3 8 .5 6 9 .0 0 6 7 .0 0 5 8 .5 0 - 7 8 .5 0 - 13 108 123 84 83 11 2 ~ - - - -
TRANSCRIBING-MACHINE OPERATORS,GENERAL-------------------------------------------------------- 8 ,1 9 8 3 9 .5 7 5 .5 0 7 4 .5 0 6 5 . 5 0 - 8 5 .0 0 - 27 1CS5 1 956 2081 1676 878 361 91 12 21 _ - _ - _
MANUFACTURING --------------------------------------- 3 ,4 4 8 3 9 .5 7 9 .5 0 7 8 .5 0 7 0 . 5 0 - 8 9 .0 0 - - 226 603 1034 791 546 183 43 4 18 - _ - - _NONMANUFACTURING -------------------------------- 4 .7 5 C 3 9 .0 7 3 .0 0 7 1 .0 0 6 2 . 0 0 - 8 2 .5 0 - 27 869 1354 1048 885 332 177 48 8 3 - - - - -
PUBLIC U T IL IT IE S 5---------------------------- 276 4 0 .0 9 3 .0 0 9 9 .5 0 7 8 .0 0 - 1 0 8 .0 0 - - 4 38 34 42 21 99 32 3 3 - _ _ _ _WHOLESALE TRADE ------------------------------ 1 ,2 4 7 4 0 .0 7 5 .0 0 7 4 .0 0 6 4 .5 0 - 8 4 .0 0 - - 158 325 280 329 105 36 7 5 - - - _ - _RETAIL TRADE ------------------------------------- 267 3 9 .5 7 2 .5 0 7 0 .5 0 6 2 . 5 0 - 8 2 .5 0 - 8 31 90 60 42 34 2 1 - _ - - - — —FINANCE6 ----------------------------------------------- 2 ,4 5 2 3 8 .5 6 9 .0 0 6 7 . 50 6 0 . 0 0 - 7 6 .0 0 - 19 6G8 806 562 3 30 105 19 4 _ _ _ _ _ _ _S E R V IC E S--------------------------------------------- 509 3 9 .0 7 7 .0 0 7 7 .5 0 6 6 . 0 0 - 8 8 .0 0 “ 68 94 111 142 67 22 4 - - - - - -
TYPISTS, CLASS A --------------------------------------- 1 6 ,5 3 4 3 9 .0 8 4 .0 0 8 3 .0 0 7 3 . 0 0 - 9 4 .5 0 - _ 330 2464 4C44 434 9 2 925 1538 840 46 _ _ _ _ _ _
MANUFACTURING --------------------------------------- 8 ,9 8 5 3 9 .5 8 7 .5 0 8 6 .5 0 7 7 . 5 0 - 9 8 .0 0 - - 64 758 1968 2 496 191 7 1053 692 39 _ — _ _ _ _
NONMANUFACTURING-------------------------------- 7 ,5 4 8 3 8 .5 7 9 .5 0 7 8 . 50 6 9 .5 0 - 8 8 .5 0 - - 266 1707 2 076 1853 1007 485 148 7 - - - _ - -
PUBLIC U T IL IT IE S 5---------------------------- 1 ,1 0 7 4 0 .0 8 6 .5 0 8 6 .5 0 7 3 .5 0 - 1 0 0 .0 0 - - 25 133 262 244 168 178 97 1 - _ _ - _ _
WHOLESALE T RAD E------------------------------ 900 3 9 .5 8 3 .5 0 8 4 .5 0 7 3 . 5 0 - 9 3 .5 0 - - 10 161 162 278 209 46 30 4 - - - _ _ _
RETAIL TRADE ------------------------------------- 537 4 0 .0 7 7 .0 0 7 4 .5 0 6 7 . 5 0 - 8 5 .5 0 - - 13 156 170 115 54 29 1 _ _ _ _ _ _ _
FINANCE6 ----------------------------------------------- 3 ,4 4 9 3 8 .0 7 5 .0 0 7 4 .0 0 6 7 . 0 0 - 8 2 .5 0 - - 197 102 9 1093 791 290 39 12 _ _ _ _ _ - _
S E R V IC E S--------------------------------------------- 1 ,5 5 5 3 8 .0 8 3 .5 0 8 2 .5 0 7 4 . 0 0 - 9 3 .5 0 - 22 230 390 425 286 193 8 2 - - - -
TYPISTS, CLASS B --------------------------------------- 3 4 ,2 3 3 3 9 .0 6 8 .5 0 6 7 .0 0 5 9 .5 0 - 7 5 .5 0 - 377 8702 11361 8017 3651 1314 6 00 158 53 _ _ _ _ _ _MANUFACTURING --------------------------------------- 1 2 ,9 0 0 3 9 .5 7 3 .5 0 7 2 .0 0 6 5 . 0 0 - 8 1 .0 0 - - 1492 3 968 3 978 2 124 83 7 308 140 53 _ _ _ _ _ _NONMANUFACTURING -------------------------------- 2 1 ,3 3 3 3 9 .0 6 5 .5 0 6 3 .5 0 5 7 . 5 0 - 7 2 .0 0 - 377 7 210 7394 4 03 9 1527 4 7 7 2 92 18 - _ _ _ _ _
PUBLIC U T IL IT IE S5---------------------------- 2 ,0 2 0 3 9 .5 7 7 .0 0 7 3 .0 0 6 6 . 0 0 - 8 9 .0 0 - 5 158 645 477 254 193 274 15 _ _ _ _ _ _ _
WHOLESALE TRADE ------------------------------ 3 ,7 1 5 3 9 .5 6 7 .5 0 6 6 .5 0 5 9 . 0 0 - 7 5 .0 0 - 20 1047 1169 983 333 150 9 3 _ _ _ — _ _
RETAIL TRAD E------------------------------------- 2 ,4 7 0 3 9 .5 6 6 .5 0 6 5 .5 0 5 8 . 5 0 - 7 5 .0 0 - 62 695 832 539 281 57 6 - - _ _ _ _ _ _
FINANCE6 ----------------------------------------------- 1 0 ,6 4 2 3 8 .5 6 2 .0 0 6 0 .5 0 5 6 .0 0 - 6 7 .0 0 - 274 4 714 3 85 8 1402 365 30 - - _ _ _ _ _ _
S E R V IC E S--------------------------------------------- 2 ,4 8 6 3 8 .5 6 7 .5 0 6 7 .0 0 6 0 .0 0 - 7 4 .0 0 16 597 891 638 295 47 3
1 F o r d e fin it io n o f r e g io n s , s e e foo tn ote 3 to the table in appendix A .2 A v e ra g e m onth o f r e fe r e n c e . D ata w e re co l le c te d du ring the p e r io d July 1964 through June 1965.3 Standard h ou rs r e f le c t the w ork w eek fo r w h ich e m p lo y e e s r e c e iv e th e ir re g u la r s tra ig h t -t im e s a la r ie s and the ea rn in gs co r re sp o n d to th ese w eek ly h o u rs .4 F o r d e fin ition o f te r m s , s e e foo tn ote 3, table A - l .5 T ra n sp o rta tio n , co m m u n ica tio n , and o th er pu blic u tilit ie s .6 F in a n ce , in su ra n ce , and r e a l esta te .
Digitized for FRASER http://fraser.stlouisfed.org/ Federal Reserve Bank of St. Louis

2 9
Table A-5. Office Occupations—West
(A v e ra g e s tra ig h t-t im e w eek ly h ou rs and ea rn in gs fo r s e le c te d o ccu p a tion s b y in d u stry d iv is io nin the W est, 1 F e b ru a ry 1 96 5 2)
Sex, occupation, and industry division
HEN
BILLERS, MACHINE (BILLINGMACHINE! -----------------------------------------------
NONMANUFACTURING ----------------------------PUBLIC U TILITIE S5 ------------------------
CLERKS, ACCOUNTING, CLASS A -------------MANUFACTURING----------------------------------NONMANUFACTURING----------------------------
PUBLIC U T IL IT IE S5------------------------WHOLESALE TRADE--------------------------FINANCE6-----------------------------------------
CL ERKS, ACCOUNTING, CLASS B -------------MANUFACTURING---------------------------------NONMANUFACTURING ----------------------------
PUBLIC UT IL IT IE S5------------------------
CLERKS, ORDER ---------------------------------------MANUFACTURING---------------------------------NONMANUFACTURING ----------------------------
WHOLESALE TRADE --------------------------
CLERKS, PAYROLL-----------------------------------MANUFACTURING ---------------------------------NONMANUFACTURING----------------------------
OFFICE 30YS -------------------------------------------MANUFACTURING---------------------------------NONMANUFACTURING ----------------------------
FINANCE6-----------------------------------------S E R V I C E S ---------------------------------------
TABUL AT ING—MACHINE OPERATORS,a ASS A -----------------------------
MANUFACTURING----------------------------------NONMANUFACTURING ----------------------------
FINANCE6-----------------------------------------
TABULATING-MACHINE OPERATORS,CLASS B -------------------------------------------------
MANUFACTURING----------------------------------NONMANUFACTURING----------------------------
WHOLESALE TRADE--------------------------FINANCE^-----------------------------------------
TABULATING-MACHINE OPERATORS,
NONMANUFACTURING ----------------------------
WOMEN
BILLERS, MACHINE (BILLINGMACHINE)-----------------------------------------------
MANUFACTURING----------------------------------NONMANUFACTURING----------------------------
PUBLIC UT ILITIE S5 ------------------------RETAIL TR ADE--------------------------------
Weekly earnings3 (standard) N u m ber o f w o rk e rs re c e iv in g stra ig h t- tim e w eek ly ea rn in gs of-
Numberof
workers
Averageweeklyhours3
(standard' Median4 Middle range4 U nder$50
$50
andunder
60
$60
70
$70
80
$80
90
S90
1 00
$100
110
$110
120
%120
130
$130
140
$140
150
$150
160
$160
170
*170
and
o v e r
388 4 0 .0$1 1 1 .5 0
$1 1 5 .5 0
$ $ 1 0 8 .0 0 -1 1 8 .0 0 3 11 5 23 75 2 48 24
384 4 0 .0 1 1 2 .0 0 1 1 5 .5 0 1 C 8 .5 0 - 1 1 8 .0 0 - - 3 11 5 23 71 2 48 24 - - - - -352 4 0 .0 1 1 4 .5 0 1 1 6 .0 0 1 1 0 .5 0 -1 1 8 .5 0 “ 4 5 71 2 48 24 - “ -
3 ,1 4 7 3 9 .5 1 1 9 .0 0 1 1 8 .0 0 1 0 6 .5 0 -1 2 9 .5 0 - - - 12 69 299 622 754 632 382 149 163 39 251 ,2 9 8 4 0 .0 1 2 4 .0 0 1 2 2 .5 0 1 1 0 .5 0 -1 3 6 .0 0 - - - 5 17 96 195 241 285 19 3 78 142 29 161 ,8 4 9 3 9 .5 1 1 5 .0 0 1 1 5 .0 0 1 0 5 .0 0 -1 2 5 .5 0 - - - 7 52 203 426 513 347 189 71 21 10 9
5 10 4 0 .0 1 1 9 .5 0 1 1 9 .5 0 1 1 0 .0 0 -1 3 0 .0 0 - - - - 11 43 76 131 123 6 8 40 15 4 -517 4 0 .0 1 1 6 .0 0 1 1 5 .5 0 1 0 5 .5 0 -1 2 7 .0 0 - - - - 1 49 133 107 142 64 17 2 1 -456 3 9 .0 1 0 8 .0 0 1 0 7 .5 0 1 0 0 .0 0 -1 1 7 .0 0 2 27 85 156 112 30 43 - -
1 ,2 7 9 4 0 .0 1 0 0 .5 0 1 0 1 .0 0 8 7 .5 0 - 1 1 3 .5 0 - 7 38 100 2 48 228 259 2 60 47 76 13 4 _ _5 00 4 0 .0 9 9 .5 0 1 0 1 .5 0 8 8 .5 0 - 1 0 9 .0 0 - 7 13 55 64 83 166 78 15 13 7 - - -779 3 9 .5 1 0 1 .0 0 9 9 .5 0 8 7 .0 0 - 1 1 5 .5 0 - - 24 45 185 145 94 182 32 63 6 4 - -323 4 0 .0 1 1 1 .5 0 1 1 3 .0 0 1 C 2 .5 0 -1 2 2 .5 0 7 10 30 28 54 107 18 63 4 2 ~
3 ,8 2 9 4 0 .0 1 1 2 .5 0 1 1 2 .0 0 9 9 .0 0 - 1 2 6 .5 0 - - 68 71 262 622 722 7 8 2 549 4 17 224 82 20 101 ,0 2 9 4 0 .0 1 1 4 .5 0 1 1 5 .5 0 9 6 .5 0 - 1 3 0 .5 0 - - 7 15 111 215 110 138 166 149 60 33 16 102 ,8 0 0 4 0 .0 1 1 2 .0 0 1 1 1 .5 0 IC O .5 0 - 1 2 4 .0 0 - - 61 56 1 51 408 612 644 384 268 164 49 4 -2 ,6 3 9 4 0 .0 1 1 2 .0 0 1 1 1 .5 0 1 0 0 .0 0 -1 2 4 .0 0 - 40 51 151 4 00 575 6 18 351 257 154 39 4 -
677 4 0 .0 1 1 9 .0 0 1 2 1 .0 0 1 0 5 .5 0 -1 3 0 .0 0 - - _ 16 41 62 98 95 196 87 52 16 6 9351 4 0 .0 1 1 7 .5 0 1 1 9 .5 0 1 0 4 .5 0 -1 2 8 .0 0 - - - 15 19 20 75 4 9 90 56 8 8 4 7326 3 9 .5 1 2 0 .5 0 1 2 2 .0 0 1 0 8 .5 0 -1 3 1 .5 0 1 22 42 22 46 105 31 44 8 2 2
2 ,5 1 7 3 9 .0 7 3 .0 0 7 0 .0 0 6 4 . 0 0 - 8 1 .5 0 55 350 871 546 356 278 33 24 4 _ _ _ _ _791 3 9 .5 7 6 . CO 7 2 .5 0 6 5 . 5 0 - 8 7 .5 0 17 84 259 135 1 30 130 12 22 2 - - - - -
1 ,7 2 6 3 9 .0 7 1 .5 0 6 9 .5 0 6 3 .0 0 - 7 9 .0 0 38 267 613 4 10 226 148 21 2 2 - - — - -913 3 9 .0 6 7 .0 0 6 6 .5 0 6 0 . 5 0 - 7 2 .0 0 38 167 429 186 87 7 - - - - - — - _384 3 8 .5 7 6 .0 0 7 7 .0 0 7 0 . 0 0 - 8 3 .0 0 ~ 42 56 145 104 31 4 ~ 2 ~ ” ~
1 ,2 2 3 3 9 .5 1 2 4 .0 0 1 2 4 .0 0 1 1 3 .0 0 -1 3 4 .0 0 _ _ _ 8 29 184 253 299 311 88 4 4 5 3600 4 0 .0 1 2 7 .5 0 1 2 8 .0 0 1 1 9 .5 0 -1 3 5 .0 0 - - - - - 8 25 124 172 223 38 8 3 -622 3 9 .0 1 2 1 .0 0 1 1 9 .5 0 1 0 8 .0 0 -1 3 2 .0 0 - - - - 8 21 159 129 127 87 50 36 2 32 99 3 9 .0 1 1 4 .0 0 1 1 2 .5 0 1 C 6 .0 0 - 1 2 2 .5 0 ~ ~ ~ ~ 8 21 103 70 70 26 ~ ~ “
2 ,0 0 7 3 9 .5 1 0 8 .0 0 1 0 7 .5 0 9 8 .5 0 - 1 1 8 .5 0 _ _ _ 36 121 416 527 4 68 321 106 6 7618 4 0 .0 1 0 9 .5 0 1 0 9 .0 0 1 0 1 . 0 0 -1 1 9 .0 0 - - — 2 12 110 202 150 116 24 2 - - -
1 ,3 9 0 3 9 .5 1 0 7 .5 0 1 0 7 .0 0 9 6 . 5 0 -1 1 8 .5 0 - - - 34 108 306 325 319 205 82 4 7 - -265 3 9 .5 1 1 0 .5 0 1 1 1 .5 0 9 7 .5 0 - 1 2 3 .0 0 - - - - 16 66 39 62 54 27 - - - -698 3 9 .0 1 0 1 .5 0 1 0 1 .5 0 9 3 .0 0 - 1 1 1 .0 0 ~ ~ 33 77 204 193 139 50 ~
486 3 9 .5 9 5 .0 0 9 7 .0 0 8 5 .0 0 - 1 0 4 .5 0 _ _ 17 42 111 98 162 51 4 _ _ _ _
341 3 9 .5 9 4 .0 0 9 3 .5 0 8 3 .5 0 - 1 0 4 .0 0 17 30 91 65 90 44 4
1 ,4 7 6 3 9 .5 8 6 .0 0 8 4 .5 0 7 0 .0 0 - 1 0 2 .5 0 142 219 274 166 219 225 215 12 3327 4 0 .0 8 0 .5 0 7 6 .0 0 6 8 . 5 0 - 9 2 .0 0 - 23 79 102 35 53 17 11 6 - - - - -
1 ,1 4 8 3 9 .5 8 7 .5 0 9 0 .5 0 7 1 .5 0 - 1 0 4 .0 0 - 119 14C 172 131 166 208 2 04 6 3 - - - -256 3 9 .5 1 0 5 .5 0 1 0 9 .5 0 9 7 .5 0 - 1 1 7 .0 0 - - 9 26 12 32 53 1 17 4 3 - - - -441 4 0 .0 7 6 .5 0 7 2 .0 0 6 1 . 0 0 - 9 1 .5 0 IOC 92 89 41 32 22 66 ~ ~ ~ “ ~
See foo tn o te s at end o f tab le .
220-617 0 - 6 6 - 3
Digitized for FRASER http://fraser.stlouisfed.org/ Federal Reserve Bank of St. Louis
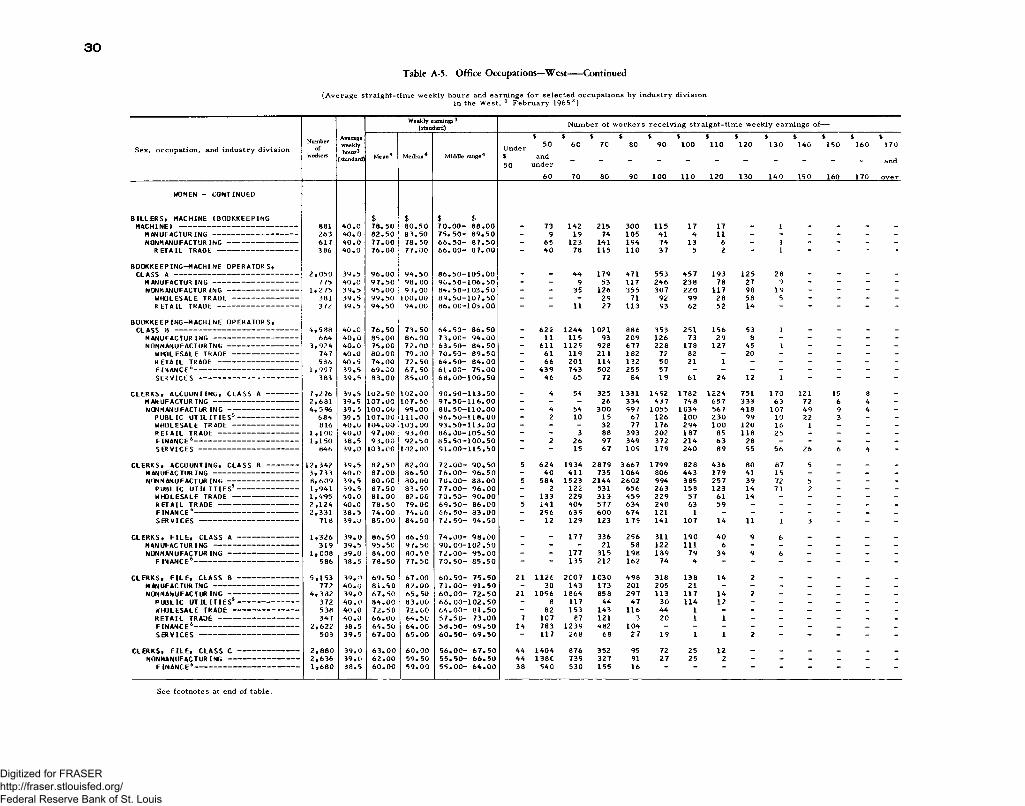
3 0
Table A-5. Office Occupations—West---- Continued
(A vera g e s tra ig h t -t im e w eek ly hours and ea rn in gs fo r se le c te d o ccu p a tion s by in du stry d iv is io nin the W est, 1 F e b ru a ry 196 5 2)
Sex, o ccu p a tio n , and in du stry d iv is io n
WOMEN - CONTINUED
BILLERS* MACHINE (BOOKKEEPINGMACHINE) ------------------------------------------------------
MANUFACTURING ---------------------------------------NONMANUFACTURING--------------------------------
RETAIL TRADE-------------------------------------
BOOKKEEPING-MACHINE OPERATORS*CLASS A --------------------------------------------------------
MANUFACTURING---------------------------------------NONMANUFACTURING--------------------------------
WHOLESALE T R A D E ------------------------------RETAIL TRAD E-------------------------------------
BOOKKEEPING-MACHINE OPERATORS,CLASS B --------------------------------------------------------
MANUFACTURING ---------------------------------------NONMANUFACTURING --------------------------------
WHOLESALE TRADE ------------------------------RETAIL TRAD E-------------------------------------FINANCE6-----------------------------------------------SE R V IC E S---------------------------------------------
CLERKS, ACCOUNTING, CLASS A --------------MANUFACTUR IN G ---------------------------------------NONMANUFACTUR IN G --------------------------------
PUBLIC U TILITIES5 ----------------------------WHOLESALE TRADE ------------------------------RETAIL TRAD E-------------------------------------FINANCE6-----------------------------------------------S ER V IC E S ---------------------------------------------
CLERKS, ACCOUNTING, CLASS B ---------------MANUFACTURING---------------------------------------NONMANUFACTURING--------------------------------
PUBLIC UTILITIES5 ----------------------------WHOLESALE TRAD E------------------------------RETAIL TRAD E------------------------------------FINANCE6-----------------------------------------------S E R V IC E S ---------------------------------------------
CLERKS, F ILE, CLASS A ----------------------------MANUFACTURING---------------------------------------NONMANUFACTURING --------------------------------
FINANCE6------------------------------------------------
CLERKS, FILE, CLASS B ----------------------------MANUFACTURING---------------------------------------NONMANUFACTURING --------------------------------
PUBLIC UTILITIES5 ----------------------------WHOLESALE TRADE ------------------------------RETAIL TRADE -------------------------------------FINANCE6------------------------------------------------SE R V IC E S---------------------------------------------
CLERKS, FILE, CLASS C ----------------------------NONMANUFACTURING --------------------------------
FINANCE6------------------------------------------------
Weekly earnings3 (standard) Number of w o r k e r s r ec e iv in g s t r a ig h t - t im e we ek ly earn ings of-
Numberof
woriters
Averageweeklyhours3
(standard) Mean4 Median4 Middle range4UnderS50
$5 0
andunder
60
$6 C
70
$7 0
80
S80
90
$90
100
$100
110
$110
120
$120
1 30
$1 3 0
1 4 0
$1 4 0
1 5 0
$1 5 0
160
$1 60
1 7 0
$1 7 0
and
o v e r
8 81 4 0 . 0$7 8 . 5 0
$8 0 . 5 0
$ $ 7 0 . 0 0 - 8 8 . 0 0 73 1 4 2 2 15 300 1 1 5 1 7 17 1
2 63 4 0 . 0 8 2 . 5 0 8 3 . 5 0 7 5 . 5 0 - 8 9 . 5 0 - 9 1 9 74 1 0 5 4 1 4 11 - - - - - -6 1 7 4 0 . 0 7 7 . 0 0 7 8 . 5 0 6 6 . 5 0 - 8 7 . 5 0 - 65 1 2 3 1 4 1 1 9 4 7 4 1 3 6 - 1 - - - -3 86 4 0 . 0 7 6 . 0 0 7 7 . 0 0 6 6 . 0 0 - 8 7 . 0 0 ~ 4 0 78 1 1 5 110 3 7 5 2 1 “ ~ ~
2 , 0 5 0 3 9 . 5 9 6 . 0 0 9 4 . 5 0 8 6 . 5 0 - 1 0 5 . 0 0 _ _ 4 4 1 7 9 4 7 1 5 53 4 5 7 1 9 3 1 2 5 28 _ _ _ _775 4 0 . 0 9 7 . 5 0 9 8 . 00 9 0 . 5 0 - 1 0 6 . 5 0 - - 9 53 1 1 7 2 4 6 2 3 8 78 27 9 - - - -
1 , 2 7 5 3 9 . 5 9 5 . 0 0 9 3 . 0 0 8 4 . 5 0 - 1 0 3 . 5 0 - - 35 1 2 6 355 3 0 7 220 1 1 7 98 1 9 - - - -3 81 3 9 . 5 9 9 . 5 0 1 0 0 .0 0 8 9 . 5 0 - 1 0 7 . 5 0 - - - 29 71 92 99 2 8 58 5 - - - -372 3 9 . 5 9 4 . 5 0 9 4 . 0 0 8 6 . 0 0 - 1 0 3 . 0 0 ~ “ 11 27 1 1 3 93 62 52 1 4 ~ ~ ~ “
4 , 5 8 8 4 0 . 0 7 6 . 5 0 7 3 . 5 0 6 4 . 5 0 - 8 6 . 5 0 _ 6 2 2 1 2 4 4 1021 886 3 5 3 2 5 1 1 5 6 53 1 _ _ _ _664 4 0 . 0 8 5 . 0 0 8 6 .0 0 7 3 . 0 0 - 9 4 . 0 0 - 11 1 1 5 93 2 0 9 1 2 6 73 2 9 8 - - - - -
3 , 9 2 4 4 0 . 0 7 5 . 0 0 7 2 . 0 0 6 3 . 5 0 - 8 4 . 5 0 - 6 1 1 1 1 2 9 9 28 677 2 2 8 1 7 8 1 2 7 45 1 - - - -747 4 0 . 0 8 0 . 0 0 7 9 . 0 0 7 0 . 5 0 - 8 9 . 5 0 - 6 1 1 1 9 211 1 8 2 72 82 - 20 - - - - -5 86 4 0 . 5 7 4 . 0 0 7 2 . 5 0 6 4 . 5 0 - 8 4 . 0 0 - 66 201 1 1 4 1 32 50 21 1 - - - - - -
1 , 9 9 7 3 9 . 5 6 9 . 0 0 6 7 . 5 0 6 1 . 0 0 - 7 5 . 0 0 - 4 3 9 743 502 2 55 57 - - - - - - - -383 3 9 . 5 8 3 . 0 0 8 5 . 0 0 6 8 . 0 0 - 1 0 0 . 5 0 46 65 72 84 1 9 6 1 2 4 12 1 - - -
7 , 2 76 3 9 . 5 1 0 2 . 5 0 1 0 2 .0 0 9 0 . 5 0 - 1 1 3 . 5 0 _ 4 54 3 25 1 3 3 1 1 4 9 2 1 7 8 2 1 2 2 4 7 5 1 1 7 0 121 15 8 _2 , 6 8 1 3 9 . 5 1 0 7 . 0 0 1 0 7 . 5 0 9 7 . 5 0 - 1 1 6 . 0 0 - - - 26 3 3 4 4 3 7 748 6 5 7 3 3 3 63 72 6 4 -4 , 5 96 3 9 . 5 1 0 0 .0 0 9 9 . 0 0 8 8 . 5 0 - 1 1 0 . 0 0 - 4 54 3 0 0 997 1 0 5 5 1 0 3 4 567 4 1 8 1 0 7 4 9 9 4 -
6 8 4 3 9 . 5 1 0 7 . 0 0 1 1 1 .0 0 9 6 . 5 0 - 1 1 8 . 0 0 - 2 10 1 5 67 1 2 6 100 2 3 0 99 10 22 3 - -8 16 4 0 . 0 1 0 4 . 0 0 1 0 3 . 0 0 9 3 . 5 0 - 1 1 3 . 0 0 - - - 32 77 1 7 6 2 9 4 100 120 1 6 1 - - -
1 ,1 0 0 4 0 . 0 9 7 . 0 0 9 3 . 0 0 8 6 . 0 0 - 1 0 5 . 5 0 - - 3 88 393 202 1 8 7 85 1 1 8 25 - - - -1 , 1 5 0 3 8 . 5 9 3 . 0 0 9 2 . 5 0 8 5 . 5 0 - 1 0 0 . 5 0 - 2 2 6 97 349 372 2 1 4 6 3 28 - - - - -
846 3 9 . 0 1 0 3 . 0 0 1 0 2 .0 0 9 1 . 0 0 - 1 1 5 . 5 0 -* 15 67 1 0 9 1 7 9 2 4 0 89 55 56 26 6 4 -
1 2 , 3 4 2 3 9 . 5 8 2 . 5 0 8 2 . 0 0 7 2 . 0 0 - 9 0 . 5 0 5 6 2 4 1 9 3 4 2 8 7 9 3 6 6 7 1 7 9 9 82 8 4 3 6 80 87 5 _ _ _3 , 7 3 3 4 0 . 0 8 7 . 0 0 8 6 . 5 0 7 6 . 0 0 - 9 6 . 5 0 - 4 0 4 1 1 7 35 1 0 6 4 806 4 4 3 1 7 9 41 15 - - - -8 , 6 0 9 3 9 . 5 8 0 . 0 0 8 0 . 0 0 7 0 . 0 0 - 8 8 . 0 0 5 5 8 4 1 5 2 3 2 1 4 4 2 6 0 2 9 94 3 85 2 5 7 39 72 5 - - -1 , 9 4 1 3 9 . 5 8 7 . 5 0 8 3 . 5 0 7 7 . 0 0 - 9 6 . 0 0 - 2 122 531 6 5 6 2 6 3 1 5 8 1 2 3 1 4 7 1 2 - - -1,4 -95 4 0 . 0 8 1 . 0 0 8 2 . 0 0 7 0 . 5 0 - 9 0 . 0 0 - 1 3 3 2 29 3 1 3 4 5 9 2 2 9 57 6 1 1 4 - - - - -2 , 1 2 4 4 0 . 0 7 8 . 5 0 7 9 . 0 0 6 9 . 5 0 - 8 6 . 0 0 5 1 4 1 4 0 4 577 6 3 4 2 4 0 63 5 9 - - - - - -2 , 3 3 1 3 8 . 5 7 4 . 0 0 7 4 . 0 0 6 6 . 5 0 - 8 3 . 0 0 - 2 96 639 6 0 0 6 7 4 121 1 - - - - - - _
7 1 8 3 9 . 0 8 5 . 0 0 8 4 . 5 0 7 2 . 5 0 - 9 4 . 5 0 - 12 1 29 1 23 1 7 9 1 4 1 1 0 7 1 4 11 1 3 - - -
1 , 3 2 6 3 9 . 0 8 6 . 5 0 8 6 . 5 0 7 4 . 0 0 - 9 8 . 0 0 - _ 1 7 7 336 2 56 3 1 1 1 9 0 4 0 9 6 _ _ _ _3 1 9 3 9 . 5 9 5 . 5 0 9 7 . 5 0 9 0 . 0 0 - 1 0 2 . 5 0 - - - 21 58 122 111 6 - - - - - -
1 , 0 0 8 3 9 . 0 8 4 . 0 0 8 0 . 5 0 7 2 . 0 0 - 9 5 . 0 0 - - 1 7 7 3 1 5 1 9 8 1 8 9 7 9 34 9 6 - - - -5 86 3 8 . 5 7 8 . 5 0 7 7 . 5 0 7 0 . 5 0 - 8 5 . 5 0 1 3 5 212 1 62 74 4 “ - - - -
5 , 1 5 3 3 9 . 0 6 9 . 5 0 6 7 . 0 0 6 0 . 5 0 - 7 5 . 5 0 21 1 1 2 6 2 0 0 7 1C3C 4 9 8 3 18 1 3 8 14 2 _ _ _7 7 2 4 0 . 0 8 1 . 5 0 8 2 . 0 0 7 1 . 0 0 - 9 1 . 5 0 - 30 1 4 3 1 7 3 201 205 21 - - - - - - -
4 , 3 3 2 3 9 . 0 6 7 . 5 0 6 5 . 5 0 6 0 . 0 0 - 7 2 . 5 0 21 1 0 9 6 1 8 6 4 8 5 8 2 9 7 1 1 3 1 1 7 1 4 2 - - - - -372 4 0 . 0 8 4 . 0 0 8 3 . 0 0 6 6 . 0 0 - 1 0 2 . 5 0 - 8 1 1 7 4 4 4 7 30 1 1 4 12 - - - - - -538 4 0 . 0 7 2 . 5 0 7 2 . 0 0 6 4 . 0 0 - 8 1 . 5 0 - 82 1 5 3 1 4 3 1 1 6 4 4 1 - - - - - - -347 4 0 . 0 6 6 .0 0 6 4 . 5 0 5 7 . 5 0 - 7 3 . 0 0 7 1 0 7 87 121 3 20 1 1 - - - - - -
2 , 6 2 2 3 8 . 5 6 4 . 5 0 6 4 . 0 0 5 8 . 5 0 - 6 9 . 5 0 1 4 7 8 3 1 2 3 9 4 82 1 0 4 - - - - - - _ - _503 3 9 . 5 6 7 . 0 0 6 5 . 0 0 6 0 . 5 0 - 6 9 . 5 0 1 1 7 268 68 2 7 1 9 1 1 2 - - ~ -
2 , 8 8 0 3 9 . 0 6 3 . 0 0 6 0 . 0 0 5 6 . 0 0 - 6 7 . 5 0 4 4 1 4 0 4 876 352 95 72 25 12 _ _ _ _ _2 , 6 3 6 3 9 . 0 6 2 . 0 0 5 9 . 5 0 5 5 . 5 0 - 6 6 . 5 0 4 4 138 C 7 39 327 91 2 7 25 2 - - - - - -1 , 6 8 0 3 8 . 5 6 0 . 0 0 5 9 . 0 0 5 5 . 0 0 - 6 4 . 0 0 38 9 40 5 30 1 5 5 1 6 ~ “ “ ** ~ ~
See fo o tn otes at end o f table.
Digitized for FRASER http://fraser.stlouisfed.org/ Federal Reserve Bank of St. Louis

31
Table A-5. Office Occupations—West-----Continued
(A v e ra g e s tra ig h t -t im e w eek ly hours and earn in gs fo r s e le c te d occu p a tio n s b y in d u stry d iv is io nin the W est, 1 F e b ru a ry 196 5 2)
Sex, o ccu p a tion , and in dustry d iv is io n
WOMEN - CONTINUED
CLERKS, ORDER----------------------------------------MANUFACTURING---------------------------------NONMANUFACTURING ----------------------------
WHOLESALE TRADE --------------------------RETAIL TR ADE-------------------------------
CLERKS, PAYROLL -----------------------------------MANUFACTURING ---------------------------------NONMANUFACTUR I N G ----------------------------
PUBLIC UT IL IT IE S5 ------------------------WHOLESALE TR ADE--------------------------RETAIL TRADE-------------------------------FINANCE6-----------------------------------------S E R V I C E S ---------------------------------------
COMPTOMETER OPERATORS ------------------------MANUFACTURING---------------------------------NONMANUFACTURING ----------------------------
PUBLIC U T IL IT IE S5------------------------WHOLESALE TRADE --------------------------RETAIL TRADE --------------------------------
DUPLICATING-MACHINE OPERATORS (MIMEOGRAPH OR DITTO 1 ----------------------
KEYPUNCH OPERATORS, CLASS A ------------MANUFACTURING----------------------------------NONMANUFACTURING ----------------------------
PUBLIC UT IL IT IE S5 ------------------------WHOLESALE TR ADE-------------------------RETAIL TRADE --------------------------------FINANCE6-----------------------------------------S E R V I C E S ---------------------------------------
KEYPUNCH OPERATORS, CLASS B ------------MANUFACTURING---------------------------------NONMANUFACTURING----------------------------
PUBLIC UT IL IT IE S5------------------------WHOLESALE TRADE --------------------------RETAIL TRADE--------------------------------FINANCE6-----------------------------------------S E R V I C E S ---------------------------------------
OFFICE GIRLS -----------------------------------------MANUFACTURING ---------------------------------NONMANUFACTURING ----------------------------
FINANCE6-----------------------------------------
SECRE TA RIES -------------------------------------------MANUFACTURING----------------------------------NONMANUFACTUR I N G ------------------------- —
PUBLIC UT IL IT IE S5------------------------WHOLESALE TRADE --------------------------RETAIL TRADE--------------------------------FINANCE6-----------------------------------------S E R V I C E S ---------------------------------------
Weekly earnings 3 (standard) Nu mb er of workers receiving straight-time weekly earnings of—
Numberof
wodcers
Averageweeklyhours3
(standard' Mean* Median4 Middle range4Under$50
$50
andunder
60
$60
70
$70
80
*80
90
$90
100
S100
110
$110
120
$120
130
$130
140
$140
150
$150
160
S160
170
$170
and
over
2,787 40.0$87.50
$87.00
$ $ 72.50-101.00 17 184 393 505 453 496 314 267 123 24 4 2 6
774 40.0 88.50 88.00 7 7.5 0- 99.00 - 30 91 103 218 147 75 89 16 4 — - - -2,013 40.0 87.00 86.00 71.00-101.50 17 153 302 401 235 349 239 178 107 20 4 2 6 -1,133 39.5 98.50 98.00 88.50-109.00 - 7 7 151 151 316 230 145 98 20 - 2 6 -
720 40.0 69.00 68.00 61.50- 77.00 17 120 280 192 72 24 9 7 - “ ~ -
3,874 39.5 96.50 94.50 84.50-108.50 _ 56 176 413 785 983 571 430 294 80 80 3 4 _1,761 40.0 96.00 94.00 83.50-108.00 - 19 57 207 351 490 258 175 128 37 40 - - -2,113 39.5 96.50 95.00 85.50-109.50 - 36 118 206 435 493 313 255 166 43 40 3 4 -
446 39.5 110.00 112.00 98.00-121.50 - - 4 22 16 87 57 121 87 12 37 - - -362 39.5 101.50 98.50 91.00-113.00 - - - 18 55 127 51 51 40 20 - - - -596 40.0 87.00 88.00 75.50- 98.50 - 32 58 110 132 133 99 6 25 - - - - -333 39.0 95.00 93.50 85.00-103.50 - - 10 26 111 79 46 41 10 10 - - - -375 39.5 92.00 89.50 85.00-103.00 4 46 30 118 67 60 36 4 1 3 3 4 -
4,535 39.5 90.50 89.00 77.00-104.50 4 117 514 756 991 656 752 578 150 18 _ _ _ _1,462 40.0 98.00 101.00 87.00-113.50 - 6 141 102 180 234 364 392 43 - - - - -3,074 39.5 87.00 85.50 74.50- 98.50 4 111 372 654 812 423 388 186 107 18 - - - -
363 39.5 107.50 107.50 103.50-111.50 - - - - 17 44 189 78 19 15 - - - -1,073 40.0 84.50 85.00 73.00- 94.50 - 53 107 297 269 199 96 11 41 - - — - -1,246 40.0 83.50 81.50 71.50- 93.00 4 51 230 279 335 123 86 94 43 ~ ~ “
367 39.0 79.00 81.50 64.00- 94.50 - 60 49 60 71 97 28 1 - - - - - -
6,690 39.5 94.00 93.50 84.50-104.00 _ 18 146 899 1701 1610 1362 703 169 77 4 _ _2,620 40.0 98.00 99.00 89.00-108.00 - - 18 188 525 646 756 408 79 1 - — - -4,071 39.5 91.50 90.00 81.50-100.50 - 18 130 711 1177 964 607 295 90 76 4 - - -
717 40.0 101.50 102.50 88. 50-113.50 - - 1 100 92 109 192 109 54 61 - - - -633 40.0 93.50 92.50 86.00- 101.00 - - 6 67 173 218 114 39 16 - - - - -256 39.5 90.00 87.00 81.50- 98.00 - - 8 36 119 34 31 22 5 - - - - -
1,797 39.0 86.00 85.50 77.50- 93.00 - 18 113 406 705 303 155 97 - - - - - -667 39.5 94.50 95.50 88.00-100.50 1 101 88 301 115 28 15 15 4 - - -
5, 925 39.5 82.50 81.00 71.50- 92.00 - 215 1028 1528 1490 753 636 224 47 4 _ _ _1,782 40.0 86.00 86.00 75.50- 95.00 - 4 147 45 9 522 317 258 68 6 — - - - -4,143 39.5 81.00 79.00 69.50- 89.50 - 211 881 1069 967 436 378 156 41 4 - - - -1,253 40.0 86.00 82.50 73.00-101.50 - 9 246 250 330 80 210 110 18 - - - - -
739 39.5 83.50 82.00 73.00- 95.50 - 50 50 215 170 138 107 9 - - - - - -369 40.0 82.50 80. 50 69.00- 94.50 - 31 68 80 80 57 26 26 - - - - - -
1,450 39.0 75.00 73.50 67*00— 83.00 - 100 427 468 304 118 34 - - - - - - -333 39.5 82.50 79. 50 68.00- 90.00 ~ 21 90 57 83 43 1 11 23 4 -
1,936 39.0 68.00 66.50 58.50- 74.50 10 557 663 420 138 118 23 9 _ _ _ _ _ _568 39.5 73.50 71.00 66.00- 78.50 - 73 181 195 47 54 9 9 - - - - - -
1,369 39.0 66.00 64.00 57.00- 72.00 10 484 481 225 91 64 14 - - - - - - -811 39.0 62.00 60.50 55.50- 67.50 10 375 293 107 19 8 - - - -
33,924 39.5 108.50 109.00 96.50-119.50 - 52 231 924 3432 6084 6939 8063 4350 2596 880 215 134 2615,336 40.0 112.00 113.00 103.00-121. 50 - 7 61 184 701 2065 2956 5067 2391 1389 395 70 45 818,588 39.0 105.50 103.50 92.50-117.50 - 45 170 740 2731 4020 3983 2998 1959 12 07 485 145 89 182,673 39.5 111.50 112.50 97.00-124.00 - - 17 113 253 403 426 581 397 275 146 52 10 12,130 39.5 107. 50 105.00 94.50-121.00 - - 15 47 281 447 481 303 251 223 46 26 9 11,350 40.0 100.50 99.50 88.50-113.50 - 5 13 110 247 317 250 196 127 54 26 3 - 17,581 39.0 101.00 100.00 90.00-110.00 - 8 75 406 1390 1904 1939 953 495 339 46 - 28 -4,856 39.0 109.50 109.00 95.50-122.00 31 51 65 560 949 888 966 690 316 221 64 42 15
See fo o tn otes at end o f tab le .
Digitized for FRASER http://fraser.stlouisfed.org/ Federal Reserve Bank of St. Louis

32
Table A-5. Office Occupations—West---- Continued
(A v e ra g e s tra ig h t-t im e w eek ly h ou rs and ea rn in gs fo r s e le c te d occu p a tion s by in du stry d iv is io nin the W est, 1 F e b r u a r y 1965 2)
N um ber o f w o rk e r s re c e iv in g s tra ig h t-t im e w e e k ly ea rn in gs o f—
Sex, occupation, and industry divisionNumberof
workers
Average weekly hours ̂
(standard) Mean4 Median4 Middle range4Under$50
$50
andunder
60
$60
70
$70
80 .
$80
90
$90
100
$100
110
$110
120
$120
130
S130
140
$140
150
$150
160
S160
170
$170
and
over
WOMEN - CONTINUED$ $ $ $
STENOGRAPHERS, G E N E R A L -------------- 13,813 39.5 89.00 88.50 79.00-100.50 - 150 1265 2301 3703 2755 2755 622 138 123 - - - -MANUFACTURING --------------------- 5,963 40.0 94.50 96.50 86.50-102.50 - 8 143 557 1293 1569 2141 143 20 90 - - - -NONMANUFACTURING------------------ 7,8 50 39.5 85.00 84.00 74.00- 93.00 - 142 1122 1745 2411 1186 614 479 118 33 - - - -
PUBLIC UTILITIES5--------------- 1,816 40.0 93.00 89.50 80.50-108.00 - 4 142 265 509 198 324 292 66 17 - - - -WHOLESALE TRADE ---------------- 936 40.0 87.00 87.00 75.00- 97.00 - 41 88 175 248 207 83 79 14 l - - - -RETAIL T R A D E -------------------- 339 40.0 81.00 82.00 72.50- 86.50 - 8 64 56 162 30 7 7 7 - - - - -FINANCE6-------------------------- 4,063 39.0 79.50 79.50 71.00- 87.50 - 90 801 1191 1283 600 90 9 - - - - - -S E R V I C E S ------------------------- 695 39.0 95.00 92.00 85.50-106.00 - 30 58 209 151 110 91 31 15 - ~
STENOGRAPHERS, S E N I O R --------------- 12,568 39.5 97.00 97.00 87.50-107.00 _ 5 240 979 2638 3273 3410 1350 551 52 53 12 4 2MA NU FA CT UR IN G--------------------- 4,808 40.0 100.50 101.50 91.50-108.50 - - 19 145 815 1251 1663 688 217 9 - - - -NONMANUFACTURING ------------------ 7,760 39.5 95.00 94.50 85.50-104.50 - 5 221 833 1824 2021 1745 663 334 43 53 12 4 2
PUBLIC UTILITIES5--------------- 1,154 40.0 105.00 105.00 95.00-114.50 - - - 42 153 255 318 191 132 19 44 - - -WHOLESALE TRADE ---------------- 679 39.5 100.00 101.50 90.00-110.00 - - 14 44 113 145 193 115 52 2 - - - -RETAIL TRADE -------------------- 263 40.0 90.50 89.50 84.50-100.00 - 2 27 11 102 56 26 35 5 - - - - -FINANCE6-------------------------- 2,993 39.0 87.00 86.50 79.50- 94.50 - 3 163 638 1074 724 326 67 1 - - - - -S E R V I C E S ------------------------- 2,671 39.5 99.50 100.00 92.00-106.50 - 17 99 383 841 884 255 144 22 9 12 4 2
SWITCHBOARO OPERATORS---------------- 5,743 40.0 81.50 81.00 66.50- 96.50 189 725 742 1119 1023 864 708 275 83 16 - _ _ _MANUFACTURING --------------------- 1,234 40.0 96.50 98.50 87.00-108.00 - 21 28 .121 201 295 356 184 29 - - - - -NONMANUFACTURING ----------------- 4,509 40.0 77.50 76.50 63.00- 89.50 189 704 714 998 822 569 352 91 54 16 - - - -
PUBLIC UTILITIES5--------------- 580 39.5 99.00 99.00 93.00-105.00 - 4 6 27 68 211 203 40 6 16 - - - -WHOLESALE T R A D E ---------------- 3 52 40.0 87.50 88.00 77.50- 98.50 - 8 43 55 95 75 53 21 2 - - - - -RETAIL T R A D E -------------------- 735 40.0 70.50 69.00 60.50- 80.50 15 156 216 153 13 8 44 1 11 - - - - - -FINANCE6-------------------------- 1,210 39.5 79.00 78.00 70.50- 87.00 - 41 241 386 341 147 49 5 - - - - - -SERVICES ------------------------- 1,632 40.0 69.50 64.50 57.00- 79.50 174 495 209 377 180 92 46 14 46 “
SWITCHBOARO OPERATOR-RECEPTIONISTS- 4,833 39.5 84.00 84.00 73.00- 94.00 _ 189 708 944 1374 866 429 254 62 8 _ _ _MANUFACTURING --------------------- 1,986 40.0 84.50 84.50 74.00- 93.50 - 46 246 436 558 385 235 54 26 - - - - -NONMANUFACTURING ------------------ 2,847 39.5 84.00 83.50 72.00- 94.00 - 143 463 509 815 481 193 200 36 - 8 - - -
PUBLIC UTILITIES5--------------- 338 39.5 92.50 94.50 74.50-111.50 - 21 40 39 47 36 40 111 4 - - - - -WHOLESALE TRADE ---------------- 1,017 40.0 86.50 86.50 75.50- 96.50 - 19 116 214 278 209 95 51 26 - 8 - - -RETAIL TRADE -------------------- 509 40.5 76.00 69.50 62.50- 90.50 - 71 190 64 50 76 37 20 1 - - - - -FINANCE6-------------------------- 506 38.0 79.50 80.00 71.50- 87.50 - 19 86 146 149 97 8 - - - - - - -SERVICES ------------------------- 478 38.5 84.50 85.00 81.00- 89.50 13 31 44 291 63 13 18 5 - - -
TABULATING-MACHINE OPERATORS,CLASS B ------------------------------- 1,299 39.5 96.50 96.50 86.50-104.00 - - 5 93 367 367 272 102 69 15 7 2 - -
NONMANUFACTURING ------------------ 1,054 39.5 94.00 95.50 85.00-101.00 3 88 357 303 218 57 19 3 4 2 - -
TABULATING-MACHINE OPERATORS,CLASS C ------------------------------- 446 39.5 78.50 75.50 67.50- 85.50 - 14 155 129 65 30 27 26 1 - - - - -
NONMANUFACTURING ------------------ 419 39.5 77.50 74. 50 67.00- 83.00 14 155 125 61 26 13 24 1 - - -
TRANSCRIBING-MACHINE OPERATORS,GENERAL ------------------------------- 2,260 39.0 81.50 81.50 73.00- 89.50 - 93 282 601 757 391 91 45 - - — - - -
MA NU FACTURING--------------------- 473 40.0 82.50 82.00 74.00- 91.00 - 10 33 150 144 87 43 5 - - - - - -NONMANUFACTURING ------------------ 1,787 39.0 81.00 81.50 7 2.50- 89.00 - 81 249 451 613 304 48 40 - - - - - -
WHOLESALE TRADE ---------------- 259 39.5 83.50 86.00 76.50- 91.00 - 6 34 34 106 70 6 3 - - - — - -FINANCE6-------------------------- 1,008 38.0 78.50 80.00 70.50- 86.00 - 68 166 276 341 127 15 14 ~ ~ - - -
TYPISTS, CLASS A --------------------- 8,379 39.5 86.00 85.50 76.50- 94.50 _ 87 838 1846 2 594 1482 1283 203 22 22 _ _ _MANU FA CT UR IN G--------------------- 2,889 40.0 92.50 92.00 83.00-105.50 - 16 76 363 831 563 973 53 13 - - - - -NONMANUFACTURING ------------------ 5,490 39.0 83.00 82.50 74.00- 90.50 - 71 761 1482 1764 920 310 150 9 22 - - - -
PUBLIC UTILITIES5--------------- 732 40.0 86.00 81.50 73.50- 98.00 - - 120 218 156 72 73 76 2 16 - - - -WHOLESALE TRADE ---------------- 663 39.5 87.50 87.00 81.50- 93.00 - 2 35 91 296 152 51 34 1 - - - - -FINANCE6-------------------------- 2,876 39.0 78.50 78.50 71.50- 85.50 - 46 545 1047 831 328 75 6 - - - - - -S E R V I C E S ------------------------- 973 39.5 89.00 89.50 85.50- 95.50 21 38 62 413 308 100 22 3 6 -
See foo tn o te s at end o f table,
Digitized for FRASER http://fraser.stlouisfed.org/ Federal Reserve Bank of St. Louis

33
Table A-5. Office Occupations—West-----Continued
(Average straight-time weekly hours and earnings for selected occupations by industry division in the West, 1 February 19652)
Weekly earnings 3 (standard) Number of workers receiving straight-time weekly earnings of—
Sex, occupation, and industry divisionNumber
ofworker's
Averageweeklyhours3
(standard) Mean4 Median4 Middle range4Under$50
$50
andunder
60
$60
7C
$70
80
$80
90
$90
100
$100
110
$110
120
$120
130
$130
140
$ $140 150
150 160
$160
170
$170
and
over
WOMEN - CONTINUED
TYPISTS, CLASS B -------------------------------------------- 16,654 39.0$74.50
$72.50
$ $ 65.50- 81.50 7 1651 5279 4913 2735 771 1202 92 4
MANUFACTURING -------------------------------------------- 4,326 40.0 83.50 81.50 73.00-100.00 - 72 584 1316 868 388 1031 66 - - - _ _ -NONMANUFACTURING ------------------------------------- 12,328 39.0 71.00 70.00 63.50- 77.50 7 1579 4695 3597 1867 383 171 26 4 - - _ _ _
PUBLIC UTILITIES5 -------------------------------- 718 39.5 79.50 77.00 70.00- 85.00 - 8 174 262 1 C8 75 90 1 - - - _ _WHOLESALE T R A D E ---------------------------------- 1,499 40.0 73.00 73.00 65.00- 81.00 - 188 451 440 268 120 28 3 - - - - - _RETAIL TRADE ----------------------------------------- 827 40.0 72.00 68.50 63.50- 79.00 - 73 396 171 150 11 17 9 - - - - - _FINANCE6------------------------------------------------------ 7,419 38.5 69.00 68.50 63.00- 74.00 - 1076 3266 2176 771 116 15 - - - - _ _ _S E R V I C E S --------------------------------------------------- 1,865 39.0 74.00 74.50 65.00- 82.50 7 234 409 548 568 61 21 13 4
1 For definition of regions, see footnote 3 to the table in appendix A.2 Average month of reference. Data were collected during the period July 1964 through June 1965.3 Standard hours reflect the workweek for which employees receive their regular straight-time salaries and the earnings correspond to these weekly hours.4 For definition of terms, see footnote 3, table A-l.5 Transportation, communication, and other public utilities.6 Finance, insurance, and real estate.
Digitized for FRASER http://fraser.stlouisfed.org/ Federal Reserve Bank of St. Louis

34
Table A-6. Professional and Technical Occupations—W omen—United States and Regions
(Average straight-time weekly hours and earnings for selected occupations by industry divisio in all metronolitan areas, and in regions. 1 2 Februarv 1965 H
Weekly earnings3 (standard) Nu mb er of workers receiving straight-1time weekly earnings of—
Number$ $ $ $ i $ * % $ * $
Region, occupation, and industry division Under70 80 90 100 110 120 130 140 150 ISO 170
ofMiddle range 4workers (standard Mean4 Median4 $ and _ _ _ _ _ _ _ _ and70 under
80 90 100 110 120 130 140 150 160 170 over
UNITED STATES$ $ $ $
NURSES. INDUSTRIAL (REGISTERED)--- 9,188 39.5 108.50 108.00 97.50-120.00 58 175 843 1652 2330 1841 1344 754 154 18 12 7MA NU FACTURING--------------------- 7,588 39.5 1Q8.50 108.00 98.00-120.00 50 132 650 1339 1987 1527 1119 640 123 8 8 6NONMANUFACTURING------------------ 1,599 38.5 107.50 107.00 96. 00-119.50 8 44 193 315 343 314 225 113 31 10 4 1
PUBLIC UTILITIES5--------------- 478 39.0 114.50 113.50 103.00-125.50 1 24 63 100 119 99 44 13 10 3 1RETAIL TRADE --------------------FINANCE6--------------------------
407 39.0 96.00 96.00 86.00-106.50 7 36 101 105 72 53 28 6 - - - -482 37.5 104.50 104.00 95.50-114.00 - 5 62 119 136 98 48 12 2 “
NORTHEAST
NURSES* INDUSTRIAL (REGISTERED) --- 3,228 39.0 107.00 106.50 96.50-117.50 26 83 241 694 88 2 63 8 419 172 59 5 2 6MANUFACTURING --------------------- 2,545 39.5 106.50 106.00 96.50-117.00 25 64 184 554 739 470 312 137 49 3 2 5NONMANUFACTUR I N G ---------- -------- 683 37.5 108.00 108.50 97.00-119.00 1 19 56 140 143 168 107 35 10 2 1
SOUTH
NURSES. INDUSTRIAL (REGISTERED) --- 1,435 40.0 105.00 103.50 91.50-118.00 26 47 252 276 315 202 156 118 37 4 3 1MANUFACTURING --------------------- 1,115 40.0 106.50 105.00 92.50-121. 00 24 29 175 189 247 153 145 113 34 4 3 1NONMANUFACTURING----------------- 320 39.0 98.00 97.50 88.00-108.50 2 18 77 88 69 50 11 5 3
NORTH CENTRAL
NURSES. INDUSTRIAL (R EGISTERED)--- 3,485 40.0 108.50 108.50 98.50-119.00 7 45 330 605 919 797 482 255 30 9 7 -MA NUFACTURING--------------------- 3,098 40.0 108.50 108.50 98.50-118.50 2 38 282 543 824 726 420 234 25 1 3 -NONMANUFACTURING ------------------ 3 87 39.5 108.00 107.50 97.00-120.50 5 7 48 63 95 70 61 21 5 8 4 ~
WEST
NURSES. INDUSTRIAL (REGISTERED)--- 1,039 40.0 118.00 120.00 107.50-129.00 - - 20 77 214 203 288 209 28 - - -MA NUFACTURING--------------------- 830 40.0 118.00 120.00 108.50-12 8.00 9 53 178 177 242 157 15
1 For definition of regions, see footnote 3 to the table in appendix A.2 Average month of reference. Data were collected during the period July 1964 through June 1965.3 Standard hours reflect the workweek for which employees receive their regular straight-time salaries and the earnings correspond to these weekly hours.4 For definition of terms, see footnote 3, table A-l.5 Transportation, communication, and other public utilities.6 Finance, insurance, and real estate.
Data are not presented for draftsmen and tracers due to a revision of occupational descriptions to facilitate improved classification. Earnings data for these occupations, based on the revised descriptions, will be presented next year.
Digitized for FRASER http://fraser.stlouisfed.org/ Federal Reserve Bank of St. Louis

35
Table A-7. Maintenance and Powerplant Occupations—United States
(A v e ra g e s tra ig h t -t im e h ou rly earn ings fo r mfen in s e le c te d occu p a tion s by in du stry d iv is io nin a ll m e tro p o lita n a r e a s , F e b ru a ry 1965 1)
Hourly earnings Number of workers receiving straight-time hourly earnings of—
$ * $ S * $ * S * $ $ $ $ $ $ S $ S1.70 1.80 1.S0 2.00 2.10 2.20 2.30 2.40 2.50 2.60 2.33 3.00 3.20 3.40 3.60 3.80 4.00 4.20
Occupation and industry division woricers Mean3 Median 3 Middle range 3 UnderS and . and1.70 under
1.80 1.90 2.00 2.10 2.20 2.30 2.40 2.50 2.60 2.80 3.03 3.20 3.40 3.60 3.80 4.00 4.20 over
CARPENTERS, MA IN TE NA NC E------------- 19,237 u$3.16 2.79- 1.49 85 59 78 155 276 181 266 275 482 678 2409 2102 3069 3195 364 0 941 303 330 715
MANUFACTURING --------------------- 13,769 3.13 3.20 2.91- 3.47 40 30 55 124 156 123 166 196 301 310 1254 1533 2616 2742 3166 666 126 99 69NUNMANUFACTURING ----------------- 5,468 3.16 2.99 2.68- 3.58 46 29 23 31 120 58 100 79 181 368 1156 569 453 455 474 273 177 232 646
PUBLIC UTILITIES4 -------------------------------- 2,020 2.92 2.77 2.65- 3.15 - - - - - 14 - 14 112 244 772 285 106 103 228 61 54 18 9RETAIL T R A D E ------------------------------------------ 1,488 3.53 3.56 3.01- 4.16 2 10 10 7 15 15 29 16 28 49 107 72 173 136 85 171 99 121 344F INANCE 5------------------------------------------------------ 912 3.31 3.14 2.66- 4.21 7 9 2 13 52 16 12 24 16 30 115 112 85 69 63 11 5 41 230S E R V I C E S --------------------------------------------------- 900 2.98 2.93 2.54- 3.39 37 10 11 11 47 14 51 12 22 27 148 90 69 134 68 25 19 43 63
ELECTRICIANS, MA IN TE NA NC E ---------------------- 53,004 3.34 3.37 3.11- 3.61 10 1 51 98 188 232 333 268 387 725 3018 4827 7305 10601 11154 9094 2297 1304 1112MA NU FA CT UR IN G -------------------------------------------- 46,177 3.33 3.36 3.11- 3.59 - - 33 92 167 186 296 229 349 603 2465 3947 6840 9833 10095 8333 1207 685 821NONMANUFACTURING ------------------------------------- 6,827 3.43 3.48 2.99- 3.84 10 1 18 6 21 45 37 38 38 122 553 881 467 768 1059 762 1091 619 292
PUBLIC UTILITIES4-------------------------------- 3,926 3.52 3.60 3.20- 3.87 - - - - - 3 - 2 2 22 227 620 107 297 675 542 997 386 49WHOLESALE TRADE ---------------------------------- 363 3.15 3.19 2.91- 3.42 - 1 - - - - 6 1 4 3 56 39 83 70 55 38 6 - 2RETAIL T R A D E ----------------------------------------- 648 3.40 3.41 2.99- 3.81 - - 1 - 3 4 10 8 6 25 41 64 95 62 79 84 43 80 43FINANCE5------------------------------------------------------ 764 3.37 3.27 2.79- 3.78 - - 5 - 5 17 9 8 8 34 105 91 72 129 46 56 25 8 147S E R V I C E S --------------------------------------------------- 1,125 3.27 3.31 2.82- 3.57 10 - 13 6 14 21 12 19 18 39 124 69 110 211 204 4? 20 145 51
ENGINEERS, S T AT IO NA RY -------------------------------- 22,091 3.20 3.26 2.84- 3.58 124 50 104 162 250 325 466 496 456 753 1849 2466 2595 3523 3360 3043 776 664 630MANUFACTURING--------------------- 13,673 3.26 3.31 2.94- 3.59 9 6 35 54 86 108 214 280 233 329 1016 1640 1820 2148 2470 1845 415 493 476NONMANUFACTURING ----------------- 8,418 3.09 3.19 2.66- 3.54 114 44 69 108 164 218 253 216 223 424 833 827 776 1375 891 1199 362 171 154
PUBLIC UTILITIES4--------------- 1,611 3.17 3.24 2.79- 3.54 - 1 1 4 7 7 29 8 21 68 267 263 76 282 239 235 78 21 5WHOLESALE T R A D E ---------------- 304 3.17 3.17 2.90- 3.42 2 2 2 - 3 - — 5 9 2 10 62 67 58 29 29 6 16 -RETAIL T R A D E ----------------------------------------- 1,549 3.23 3.27 2.82- 3.73 10 13 12 9 30 18 70 27 43 61 82 106 203 176 189 265 78 75 83FINANCE5 ------------------------------------------------------ 2,128 3.16 3.32 2.67- 3.69 12 11 10 12 53 77 70 60 28 94 223 127 190 285 229 530 65 6 46S E R V I C E S --------------------------------------------------- 2,827 2.90 2.96 2.47- 3.30 90 17 45 82 70 116 84 115 122 198 252 269 238 576 205 140 135 53 20
FIREMEN, STATIONARY B O I L E R ------------------- 15,369 2.65 2.71 2.33- 3.09 1515 268 277 296 403 477 380 847 1075 966 2315 2037 1375 1632 799 483 94 23 109MANUFACTURING -------------------------------------------- 12,575 2.66 2.71 2.35- 3.10 1194 213 181 2 32 345 354 329 656 964 824 1919 1682 1066 1288 708 471 58 2 89NONMANUFACTURING ------------------------------------- 2,794 2.60 2.70 2.19- 3.06 321 55 96 64 58 123 51 191 111 142 396 355 309 344 91 12 36 21 20
PUBLIC UTILITIES4-------------------------------- 800 2.92 2.88 2.63- 3.17 10 - - - 3 14 2 16 54 73 196 79 164 83 48 5 33 20 -RETAIL T R A D E ------------------------------------------ 339 2.74 2.84 2.18- 3.31 24 - 19 5 16 25 14 16 3 9 22 44 36 80 15 1 - 1 10FINANCE5------------------------------------------------------ 455 2.55 2.49 2.17- 2.97 73 5 2 13 5 26 1 92 13 3 37 81 2 93 - - - - 10S E R V I C E S ------------------------- 987 2.28 2.34 1.79- 2.83 201 50 68 40 34 58 28 39 24 52 125 120 69 69 5 3 3 - -
HELPERS, MAINTENANCE T R A D E S -------- 29,304 2.58 2.63 2.40- 2.88 1161 481 401 681 769 700 1356 1711 2281 3840 6628 6083 2512 533 133 4 2 _ 30MANUFACTUR I N G --------------------- 23,027 2.60 2.63 2.42- 2.90 794 372 309 529 516 525 1017 1368 1696 3483 4769 5083 1976 441 118 3 ' 1 - 30NONMANUFACTURING----------------- 6,276 2.53 2.64 2.32- 2.81 368 109 93 152 253 175 339 343 585 357 1859 1000 536 92 15 l 1 - -
PUBLIC UTILITIES4--------------- 4,739 2.59 2.66 2.42- 2.82 111 17 56 72 175 97 252 273 534 309 1543 831 40 8 61 1 - 1 - -WHOLESALE TRADE ---------------- 333 2.34 2.39 1.76- 2.88 63 33 5 24 10 8 19 6 4 10 33 62 56 1 - - - - -RETAIL T R A D E -------------------- 376 2.14 2.10 1.71- 2.59 90 35 13 25 25 14 18 26 16 24 52 19 10 8 - 1 - - -FINANCE5-------------------------- 352 2.50 2.63 Z.17- 2.75 26 7 12 8 3 46 28 7 10 2 128 20 43 — 14 - - - -S E R V I C E S ------------------------ 477 2.33 2.44 1.97- 2.78 80 17 7 22 40 10 23 31 21 12 103 69 20 22 - - -
MACHINE-TOOL OPERATORS, TOOLROOM — 25,505 3.31 3.39 3.07- 3.61 3 _ 38 74 38 63 145 108 221 449 1440 2830 2717 4816 5962 5586 833 75 109MANUFACTURING--------------------- 25,384 3.31 3.39 3.08- 3.61 3 38 74 37 62 141 108 221 449 1391 28 20 2689 4813 5951 5571 833 75 109
MACHINISTS, MA IN TE NA NC E------------- 44,298 3.32 3.34 3.08- 3.57 _ 12 15 79 142 207 358 198 294 597 2915 4058 5597 11027 9109 5535 1979 1280 901MANUFACTURING--------------------- 41,760 3.32 3.34 3.09- 3.57 - 12 15 79 141 202 339 198 291 590 2569 3556 5491 10740 8792 5 338 1570 939 900NONMANUFACTURING----------------- 2,539 3.39 3.40 2.93- 3.86 - - - - 1 5 19 - 3 7 346 501 106 287 317 198 409 340 1
PUBLIC UTILITIES4--------------- 2,055 3.32 3.35 2.91- 3.81 - - - - 1 5 19 - 2 5 328 486 89 140 272 179 373 157 -S E R V I C E S ------------------------- 331 3.75 4.10 3.36- 4.15 - - ~ 1 2 16 3 12 80 12 15 16 174 1
MECHANICS, AUTOMOTIVE(MAINTENANCE) ----------------------- 45,795 3.11 3.21 2.87- 3.40 124 126 334 376 724 618 960 760 954 1517 3485 4736 7747 11924 6236 4169 799 86 120
MANUFACTURING--------------------- 13,235 3.06 3.15 2.76- 3.44 83 66 111 20 2 391 204 264 2 91 339 528 1093 1818 1838 2259 2362 1029 198 46 114NONMANUFACTURING----------------- 32,560 3.13 3.22 2.92- 3.39 40 60 224 174 333 414 696 470 615 989 2392 2918 5910 9663 3874 3141 601 40 6
PUBLIC UTILITIES4--------------- 27,084 3.15 3.25 2.98- 3.40 3 28 160 105 250 286 595 332 491 800 1613 2445 4858 8291 3300 2992 533 2 -WHOLESALE T R A D E ---------------- 2,617 3.04 3.13 2.78- 3.34 6 - 48 17 41 44 16 35 33 96 363 290 509 641 370 77 31 — -RETAIL T R A D E ----------------------------------------- 1,448 2.97 3.07 2.71- 3.32 12 8 14 31 21 38 33 40 44 52 208 113 352 269 96 64 37 17 -SERVICES --------------------------------------------------- 1,361 2.93 3.05 2.63- 3.26 9 23 2 21 21 46 52 63 47 39 208 60 173 456 107 7 - 21 6
S ee foo tn otes at end o f table.
Digitized for FRASER http://fraser.stlouisfed.org/ Federal Reserve Bank of St. Louis

36
Table A-7. Maintenance and Powerplant Occupations—United States-----Continued
(A v e ra g e s tra ig h t -t im e h ou r ly ea rn in gs fo r m en in s e le c te d occu p a tion s b y in du stry d iv is io nin a ll m etro p o lita n a r e a s , F e b ru a ry 1965*)
Hourly earnings Number of workers receiving straight-time hourly earnings of—
N um b ero f
w o rkers
$ $ $ $ $ $ $ $ $ $ $ $ $ $ $ $ $ $
Occupation and industry divisionM e a n 1 2 3 M e d ia n 3 M id d le r a n g e 3
Under$
1.70and
1.80 1.50 2.00 2.10 2.20 2.30 2.40 2.50 2.60 2.80 3.00 3.20 3.40 3.60 3.80 4.00 4.20
and1.70 under
1.80 1.90 2.00 2.10 2.20 2.30 2.40 2.50 2.60 2.80 3.00 3.20 3.40 3.60 3.80 4.00 4.20 over
MECHANICS, MAINTE NA NC E-------------- 66,57261,358
$3.143.13
$3.193.18
$ $2.88- 3.472.88- 3.46
9170
9063
134119
299294
693660
839773
871757
1081 102 0
16901589
18491700
62385731
87148331
1151010766
1111610307
1227911093
68646467
1164842
617374
434405
NONMANUFACTURING ----------------- 5,215 3.21 3.27 2.92- 3.55 21 28 15 5 33 67 115 62 101 149 507 383 744 808 1186 398 322 243 29PUBLIC UTILITIES4 5--------------- 2,505 3.50 3.53 3.31- 3.76 - - - - - 13 — - 4 5 125 85 213 297 870 334 310 239 10WHOLESALE TRADE ---------------- 1,180 2.95 3.03 2.66- 3.23 - - - - - 15 50 27 36 64 208 148 284 221 114 6 4 - -RETAIL T R A D E -------------------- 753 3.03 3.07 2.70- 3.28 2 - 4 1 14 1 8 26 45 35 112 60 185 100 81 48 8 4 19SE R V I C E S ------------------------- 638 2.82 2.96 2.28- 3.32 19 28 12 4 20 36 57 5 5 38 59 50 47 145 109 6 -
MI LLWRIGHTS--------------------------- 24,537 3.28 3.33 3.09- 3.54 _ 4 _ _ 39 14 77 83 138 330 1162 2615 53 76 4140 6807 3145 384 173 51MA NU FA CT UR IN G--------------------- 24,346 3.28 3.33 3.09- 3.54 - 4 - 39 14 77 82 138 321 1153 2601 5363 4071 6757 3122 381 173 51
01L E R S -----------------------—-------- 13,583 2.65 2.69 2.44- 2.92 728 90 166 193 190 213 515 834 1052 1572 2552 3291 1119 678 287 33 9 20 43MANUFACTURING ---------------------ai nil kA Ait a ic irnan tiin
13,118 2.65 2.692.75
2.44- 2.91 71512
89 158 187 185 208 514 8331
950i no
1542 2479 3266 961 649 287 33 9 20 34NUNN AN U r At 1 UK INu * "■ 2 8 6 5 5 1 lUl
3.02 2.63- 3.10 1 29 24 57 10 151z ft> z.oo
PAINTERS, MAIN TE NA NC E --------------- 14,134 3.12 3.16 2.80- 3.47 159 58 94 104 158 193 23 9 211 227 560 1501 1848 2109 2223 2714 683 329 118 606MA NUFACTURING--------------------- 9,680 3.16 3.21 2.94- 3.46 32 22 19 60 28 90 89 97 160 212 749 1384 1829 1825 2313 506 140 50 76NONMANUFACTURING ------------------ 4,454 3.03 2.92 2.58- 3.49 128 36 75 44 130 104 150 115 67 348 753 464 280 397 401 177 189 68 530
PUBLIC UTILITIES4--------------- 936 3.12 3.06 2.81- 3.45 - - 2 4 - 1 3 8 5 53 149 218 62 125 205 79 17 3 1RETAIL TRADE -------------------- 52 7 3.37 3.43 2.89- 3.87 - 1 5 - 10 8 10 23 18 16 24 40 67 40 36 59 64 32 78
1,535 3.07 2.76 2.54- 4.01 24 22 56 116 77 80 12 10 41 381r iiiAiit c — ———— ———— ———— — - - - • — f 8 5S E R V I C E S ------------------------- 1,346 2.77 2.73 2.21- 3.32 120 27 44 18 65 59 32 54 17 67 272 68 56 142 112 25 68 30 70
PIPEFITTERS, MAIN TE NA NC E-----------UAiiiicarTianTiir _l
28,553 3.343.33
3.413.41
3.13- 3.563.14- 3.55
8 - 3 22
3838
6969
1616
9292
172170
213 1339 20231833
44214250
55765401
101749896
34683349
407244
277198
258169PlANUrAt 1 UK IN O — — — - — > »■ - -
iiniiuiiiiicarTian fair . 1,392 119 163 89NUNNANUrAt 1 UK 1NU —— — — — 3 • UH — 5 m f o 111PUBLIC UTILITIES4--------------- 831 3.33 3.32 2.88- 3.81 - - - - - - - - - 9 111 187 88 63 70 84 153 65 -SERVICES ------------------------- 285 3.50 3.45 3.36- 3.53 “ - - 1 1 23 58 165 8 7 4 18
PLUMBERS, MAIN TE NA NC E--------------- 2,566 3.09 3.08 2.85- 3.37 14 2 12 12 19 18 28 45 39 69 302 540 408 492 390 53 8 53 65MA NU FACTURING--------------------- 1,621 3.10 3.13 2.93- 3.37 4 - 8 8 12 9 16 26 26 33 132 281 355 352 295 34 6 11 15NONMANUFACTURING ----------------- 945 3.07 2.95 2.74- 3.36 10 2 4 4 7 9 12 19 12 36 170 259 53 140 95 19 2 42 50
PUBLIC UTILITIES4--------------- 404 2.98 2.92 2.80- 3.07 - - - - - 1 3 3 6 - 85 192 16 29 59 6 - - 1S E R V I C E S ------------------------- 255 3.04 2.94 2.61- 3.45 10 2 4 4 4 3 9 11 2 13 46 30 11 34 23 2 1 30 17
SHEET-METAL WORKERS, MAINTENANCE — 6,204 3.31 3.36 3.11- 3.53 _ _ _ _ 2 34 15 3 20 63 246 731 816 1501 2113 443 111 50 55MANUFACTURING--------------------- 5,859 3.32 3.37 3.14- 3.54 - - - - - 34 15 3 20 63 195 617 780 1446 2065 426 111 26 54NONMANUFACTURING------------------ 345 3.16 3.05 2.89- 3.41 - 2 - - 51 113 36 55 48 17 24 1
TOOL AND DIE MAKERS ----------------- 50,445 3.48 3.55 3.23- 3.77 _ _ _ _ 1 3 25 81 Ill 233 1425 3781 59 56 7606 8451 12347 9064 917 444MA NUFACTURING--------------------- 49,893 3.48 3.55 3.23- 3.77 - 1 3 25 76 111 229 1415 3680 5885 7582 8261 12284 9004 906 430
1 Average month of reference. Data were collected during the period July 1964 through June 1965.2 Excludes premium pay for overtime and for work on weekends » holidays, and late shifts.3 For definition of terms, see footnote 3, table A-l.4 Transportation, communication, and other public utilities.5 Finance, insurance, and real estate.
Digitized for FRASER http://fraser.stlouisfed.org/ Federal Reserve Bank of St. Louis

37
Table A-8. Maintenance and Powerplant Occupations—Northeast
(A v e ra g e s tra ig h t-t im e h ou rly ea rn in gs fo r m en in s e le c te d o ccu p a tion s by in du stry d iv is io nin the N o r th e a s t ,1 F e b ru a ry 1965 2)
Occupation and industry division
CARPENTERS* MAINTENANCE--------------------MANUFACTURING---------------------------------NONMANUFACTURING ----------------------------
PUBLIC U T IL IT IE S5------------------------RETAIL TRAOE-------------------------------S E R V I C E S ---------------------------------------
ELECTRICIANS, MAINTENANCE ----------------MANUFACTURING---------------------------------NONMANUFACTURING ----------------------------
PUBLIC U T IL IT IE S5------------------------RETAIL TRADE -------------------------------FINANCE6-----------------------------------------S E R V I C E S ---------------------------------------
ENGINEERS, STATIONARY------------------------MANUFACTURING---------------------------------NONMANUFACTURING ---------------------------
PUBLIC U T IL IT IE S5------------------------RETAIL TRADE-------------------------------FINANCE6-----------------------------------------S E R V I C E S ---------------------------------------
FIREMEN, STATIONARY BOILER ---------------MANUFACTURING---------------------------------NONMANUFACTURING----------------------------
PUBLIC U T IL IT IE S 5------------------------S E R V I C E S ---------------------------------------
HELPERS, MAINTENANCE TRAOES-------------MANUFACTURING ---------------------------------NONMANUFACTURING ----------------------------
PUBLIC UT ILITIE S5 ------------------------
MACHINE-TOOL OPERATORS, TOOLROOM — MANUFACTURING---------------------------------
MACHINISTS, MAINTENANCE --------------------MANUFACTURING ---------------------------------NONMANUFACTURING ----------------------------
PUBLIC U T IL IT IE S 5------------------------
MECHANICS, AUTOMOTIVE( MAINTENANCE) -------------------------------------
MANUFACTURING---------------------------------NONMANUFACTURING----------------------------
PUBLIC UTILITIE S5 ------------------------WHOLESALE TRADE--------------------------S E R V I C E S ---------------------------------------
MECHANICS, MAINTENANCE----------------------MANUFACTURING---------------------------------NONMANUFACTURING ----------------------------
PUBLIC UTILITIE S5------------------------RETAIL TRADE-------------------------------
MILLWRIGHTS-------------------------------------------MANUFACTURING----------------------------------
Hourly earnings N um ber o f w o rk e r s re c e iv in g s tra ig h t-t im e h ou rly earn in gs o f—
Numberof
% S $ S $ $ $ $ * $ $ $ S $ $ $ $ $1.70 1.80 1.50 2.00 2.10 2.20 2.30 2.40 2.50 2.60 2.70 2.80 3.00 3.20 3.40 3.60 3.80 4.00
workers M ean4 M edian4 Middle range4 $ and and1.70 under
1.80 1.90 2.00 2.10 2.20 2.30 2.40 2.50 2.60 2.70 2.80 3.00 3.20 3.40 3.60 3.80 4.00 over
$ $ $ $6,399 3.04 3.02 2.74- 3.32 16 - 5 46 110 74 102 131 236 212 421 666 988 1368 716 631 367 31 279A, 545 2.98 3.02 2.73- 3.24 - - 2 34 82 69 64 111 187 166 309 376 672 1213 551 416 251 2 401,855 3.16 2.99 2.75- 3.52 16 - 3 12 28 5 39 21 49 46 112 290 316 155 164 215 116 29 239
641 3.00 2.84 2.74- 3.30 - - - - - - - 3 1 22 54 193 164 28 37 84 34 1 20584 3.64 3.63 3.14- 4.31 - - 2 1 6 3 7 3 21 12 1 26 21 69 42 66 76 13 214352 2.70 2.73 2.44- 2.95 16 - 9 20 2 31 4 17 8 52 53 65 28 30 3 15
14,953 3.20 3.21 2.95- 3.44 _ _ 3 12 60 39 77 85 186 365 729 718 2Q6 2 3023 3357 2040 1377 465 35412,910 3.19 3.20 2.96- 3.41 - - 3 10 52 19 75 73 175 310 557 643 1749 2823 3052 1710 1172 234 2522,043 3.29 3.29 2.93- 3.63 - - - 2 9 21 2 12 10 55 172 75 313 200 30 5 330 205 231 102
913 3.41 3.47 2.98- 3.78 - - - - - 1 — 1 2 15 3 50 183 46 96 169 130 193 25291 3.48 3.47 3.12- 3.79 - - - - 1 4 - 2 2 19 3 7 26 25 22 58 56 14 52348 3.12 3.14 2.69- 3.36 - - - - - 9 1 3 6 2 74 7 49 31 108 28 4 1 24392 2.99 3.00 2.66- 3.30 2 8 7 1 6 19 92 11 51 74 44 59 1 17 1
6,902 3.15 3.10 2.79- 3.47 3 19 30 16 45 107 139 188 206 251 319 469 1198 943 982 767 530 228 4634,34 7 3.13 3.04 2.77- 3.41 - - 28 8 29 21 86 154 111 186 207 349 848 682 538 434 280 82 3022,555 3.18 3.23 2.81- 3.55 3 19 2 8 16 85 53 34 95 65 111 119 351 262 442 333 250 146 161
705 3.38 3.42 3.20- 3.70 - 1 - 1 4 1 4 2 4 14 9 32 75 28 166 141 149 58 17347 3.50 3.53 3.10- 3.98 - 9 2 - - - 2 - 10 1 3 2 31 48 46 47 27 33 86651 3.15 3.20 2.69- 3.43 - - - - - 51 21 7 4 13 78 9 38 103 140 108 22 7 50743 2.87 2.85 2.49- 3.19 3 9 7 12 34 26 25 77 37 21 67 162 82 70 37 27 43 4
5,745 2.58 2.61 2.31- 2.87 346 137 103 143 247 214 207 418 586 431 508 644 771 466 262 118 35 _ 1104,677 2.58 2.59 2.32- 2.85 245 120 75 120 227 115 195 341 525 398 422 554 613 361 163 81 34 - 891,068 2.58 2.67 2.18- 2.98 101 17 28 23 20 100 12 77 61 33 87 89 158 104 99 37 1 - 21
323 2.91 2.88 2.66- 3.25 - - - - - 11 2 6 20 18 38 57 29 35 76 30 - - -345 2.31 2.41 1.94- 2.81 46 17 15 20 11 45 8 8 15 7 48 12 62 25 6 - - -
8,769 2.55 2.58 2.36- 2.77 98 120 103 223 290 303 756 526 755 1570 1261 854 1199 626 52 2 1 1 306,460 2.54 2.55 2.33- 2.75 71 94 90 173 204 226 622 422 540 1460 702 493 776 551 5 1 - - 302,309 2.59 2.66 2.43- 2.79 27 25 13 50 86 77 135 104 216 110 559 361 423 75 47 1 1 1 -1,766 2.64 2.68 2.49- 2.81 9 1 4 21 37 14 109 74 193 95 408 335 359 59 46 1 1
5,302 3.12 3.10 2.83- 3.44 _ _ _ 29 21 27 46 25 76 257 360 251 1199 723 747 742 691 38 725,268 3.12 3.11 2.84- 3.44 - 29 21 27 46 25 76 257 343 243 1198 717 745 742 691 38 72
15,114 3.20 3.21 2.93- 3.41 _ _ 4 4 52 60 117 112 201 350 635 973 2171 2595 3994 1537 1145 762 40414,314 3.19 3.21 2.93- 3.40 - - 4 4 52 55 116 112 201 348 614 898 1887 2569 3898 1484 1077 667 331
800 3.27 3.06 2.90- 3.71 - - - — - 5 1 - - 2 21 75 285 26 96 53 68 95 73682 3.26 2.98 2.88- 3.77 ~ ~ 5 1 ~ 2 21 74 273 22 24 37 63 87 73
11,067 3.07 3.12 2.84- 3.29 14 20 77 68 54 90 148 126 329 273 458 749 1566 3056 2163 1124 436 191 1252,821 3.08 3.10 2.78- 3.36 14 14 9 61 4 13 20 80 76 60 168 220 490 548 388 237 277 24 1198,246 3.07 3.12 2.86- 3.28 - 6 67 7 50 78 129 46 253 213 290 529 1077 2508 1776 886 159 167 66,689 3.06 3.11 2.86- 3.26 - - 58 5 40 41 99 30 209 175 266 425 918 2279 1164 695 143 142 -
701 3.15 3.22 2.89- 3.39 - - - - - - - 7 8 18 - 84 98 119 203 156 8 - -661 3.01 3.22 2.79- 3.27 - 6 2 9 37 30 7 36 18 13 9 33 53 376 29 4
18,887 3.06 3.09 2.83- 3.30 14 29 20 22 99 176 220 307 579 635 1145 1121 3566 4426 3358 1673 902 194 40217,463 3.05 3.07 2.82- 3.29 14 29 15 22 99 143 207 306 535 596 1115 1080 3455 4123 3072 1477 717 123 3351,424 3.26 3.25 3.03- 3.57 - - 5 - - 33 13 1 44 39 30 41 111 302 286 197 185 71 67
665 3.47 3.52 3.18- 3.73 - - - - - - - - 1 2 8 8 44 120 105 114 151 59 53378 3.10 3.10 2.83- 3.27 - - - 1 1 32 20 11 25 34 114 65 30 23 8 14
5,623 3.22 3.19 3.04- 3.47 _ - _ _ 12 11 27 38 65 110 240 166 528 1718 773 1141 641 71 835,548 3.21 3.19 3.03- 3.47 12 11 27 37 65 110 238 165 520 1713 735 1134 62 8 71 83
See fo o tn otes at end o f ta b le .
Digitized for FRASER http://fraser.stlouisfed.org/ Federal Reserve Bank of St. Louis

38
(Average straight-time hourly earnings for m e n in selected occupations by industry division in the Northeast,1 February 19652 3)
Table A-8. Maintenance and Powerplant Occupations—Northeast— Continued
Hourly earnings Number of workers receiving straight-time hourly earnings of—
* $ $ i % i S i % % $ $ $ ( $ $ $ $
Occupation and industry division of Under 1.70 1.80 1.50 2.00 2.10 2.20 2.30 2.40 2.50 2.60 2.70 2.80 3.00 3.20 3.40 3.60 3.80 4.00workers Mean4 M ed ian 4 Middle range4 t and
1.70 under ~ and
1.80 1.90 2.00 2.10 2.20 2.30 2.40 2.50 2.60 2.70 2.80 3.00 3.20 3.40 3.60 3.80 4.00 over
$ $ $ $O I L E R S ---- — --------— --------------- 3,986 2.58 2.56 2.35- 2.85 117 41 130 122 87 77 286 280 455 619 347 251 667 289 102 44 _ 8 63
MA NU FA CT UR IN G--------------------- 3,835 2.57 2.56 2.34- 2.85 114 41 127 119 83 75 285 280 427 612 319 246 656 249 96 44 - 8 54
PAINTERS. MAINTE NA NC E--------------- 4,366 2.92 2.93 2.67- 3.21 39 20 27 25 62 82 123 103 134 263 314 474 916 661 469 438 73 67 77MA NUFACTURING--------------------- 2,713 2.98 2.98 2.78- 3.22 - - 4 21 20 38 56 68 100 93 147 174 722 545 324 341 11 6 43NONMANUFACTURING------------------ 1,654 2.83 2.76 2.56- 3.17 39 20 22 4 42 44 68 35 35 170 167 300 194 116 144 97 62 61 34
PUBLIC UTILITIES5--------------- 372 3.11 2.99 2.78- 3.44 - - - - - - - 3 1 32 19 50 87 20 44 73 29 14FINANCE6-------------------------- 527 2.66 2.65 2.51- 2.80 1 - 1 - 17 23 58 12 7 126 39 113 41 24 59 3 3S E R V I C E S ------------------------- 506 2.58 2.69 2.28- 2.79 38 20 21 4 20 17 8 12 2 11 107 132 35 31 29 3 16
PIPEFITTERS. M A IN TE NA NC E----------- 7,940 3.16 3.13 2.96- 3.43 - - - - 23 21 12 36 119 170 325 46 7 1076 2282 1241 1378 671 22 95MANUFACTURING--------------------- 7,431 3.15 3.11 2.96- 3.40 - - - - 23 21 12 36 117 161 324 441 1014 2199 1211 1254 566 2 49NONMANUFACTURING------------------ 509 3.41 3.44 3.07- 3.74 - - - - - - - - 2 9 1 27 62 83 30 124 105 20 46
PUBLIC UTILITIES5--------------- 257 3.40 3.59 2.88- 3.78 “ ~ ” ~ 9 1 26 59 16 2 17 80 14 33
PLUMBERS. MAINTE NA NC E--------------- 1,197 3.02 2.99 2.82- 3.23 - - 3 2 10 1 16 14 14 32 93 98 347 243 169 83 41 1 33MA NUFACTURING--------------------- 749 2.99 2.99 2.84- 3.11 - - 3 - 8 - 15 12 14 26 32 62 219 211 76 25 31 1 16NONMANUFACTURING------------------ 448 3.07 2.98 2.80- 3.35 ” 2 2 1 1 2 “ 6 61 36 127 32 93 58 10 17
SHEET-METAL WORKERS. MAINTENANCE — 1,921 3.21 3.21 2.99- 3.45 - - - - - 5 4 - 7 13 26 120 316 438 390 512 69 6 15MA NU FACTURING ---------------------------------------------- 1,771 3.22 3.23 3.02- 3.45 ~ — 5 4 ” 7 13 26 93 262 416 365 504 58 6 11
TOOL AND DIE MAKERS -------------------------------------- 15,960 3.29 3.28 3.02- 3.58 - - - - - 3 16 78 87 185 273 653 2290 3151 2586 2883 2379 1152 224MANUFACTURING ---------------------------------------------- 15,599 3.29 3.28 3.02- 3.59 3 16 73 87 181 273 645 2206 3117 2576 2697 2349 1152 224
1 For definition of regions, see footnote 3 to the table in appendix A.2 Average month of reference. Data were collected during the period July 1964 through June 1965.3 Excludes premium pay for overtime and for work on weekends, holidays, and late shifts.4 For definition of terms, see footnote 3, table A-l.5 Transportation, communication, and other public utilities.6 Finance, insurance, and real estate.
Digitized for FRASER http://fraser.stlouisfed.org/ Federal Reserve Bank of St. Louis

39
Table A-9. Maintenance and Powerplant Occupations—South
(A v e ra g e s tra ig h t -t im e h ou rly earn ings fo r m en in s e le c te d o ccu p a tion s by in dustry d iv is io nin the S o u th ,1 F e b ru a ry 196 5 2)
Occupation and industry division
CARP CM T F R S , M A I N T E N A N C E ---------------------M A N U F A C T U R I N G ----------------------------------N U N M A N U F A C T U R I N G -----------------------------
P U B L I C U T I L I T I E S 5 ------------------------R E T A I L T R A D E --------------------------------
E L E C T R I C I A N S * M A I N T E N A N C E ----------------M A N U F A C T U R I N G ----------------------------------N O N M A N U F A C T U R I N G ----------------------------
P U B L I C U T I L I T I E S 5 -------------------------
E N G I N E E R S * S T A T I O N A R Y ------------------------M A N U F A C T U R I N G ----------------------------------N O N M A N U F A C T U R I N G ----------------------------
P U B L IC U T I L l T I E S 5 ------------------------R E T A I L T R A D E --------------------------------F I N A N C E 6 ------------------------------------------S E R V I C E S ----------------------------------------
F I R E M E N , S T A T I O N A R Y B O I L E R ---------------MA NUFA C TUR IN G ----------------------------------N O N M A N U F A C T U R IN G ----------------------------
H E L P E R S , M AINTENA NC E T R A D E S -------------M ANUFA CTUR I N G ----------------------------------N O N M A N U F A C T U R I N G -----------------------------
P U B L I C U T I L I T I E S 5 -------------------------
M A C H IN E -T O O L O P E R A T O R S , TOOLROOM — M A N U F A C T U R I N G ----------------------------------
M A C H I N I S T S , M A I N T E N A N C E ---------------------M A N U F A C T U R I N G ----------------------------------N O N M A N U F A C T U R I N G -----------------------------
P U B L I C U T I L I T I E S 5 -------------------------
M EC H A N I C S , A UTO M O T IV E( M A I N T E N A N C E ) --------------------------------------
M ANUFACTUR I N G ----------------------------------N O N M A N U F A C T U R IN G -----------------------------
P U B L I C U T I L I T I E S 5 -------------------------W H O LE S A LE T R A D E ---------------------------R E T A I L T R A D E --------------------------------S E R V I C E S ----------------------------------------
M EC H A NI C S , M A I N T E N A N C E -----------------------M A N U F A C T U R I N G ----------------------------------N O N M A N U F A C T U R I N G -----------------------------
P U B L I C U T I L I T I E S 5 -------------------------W H O LE S A LE T R A D E --------------------------R E T A I L TR A D E --------------------------------
M I L L W R I G H T S --------------------------------------------M A N U F A C T U R I N G ----------------------------------
O I L E R S ------------------------------------------------------M A N U F A C T U R I N G ----------------------------------
P A I N T E R S , MA INTE NA NCE -------------------------M A N U F A C T U R I N G ----------------------------------N O N M A N U F A C T U R IN G -----------------------------
S E R V I C E S ----------------------------------------
Hourly earnings 3 N um ber o f w o rk e r s re ce iv in g s tra ig h t -t im e h ou rly ea rn in gs o f—S $ $ * S $ $ $ $ $ $ $ $ $ $ $ $ $
of TTnrl *»■»• 1 . 7 0 1 . 8 0 1 . 9 0 2 . 0 0 2 . 1 0 2 . 2 0 2 . 3 0 2 . 4 0 2 . 5 0 2 . 6 0 2 . 7 0 2 . 8 0 3 . 0 0 3 . 2 0 3 . 4 0 3 . 6 0 3 . 8 0 4 . 0 0
workers M ean 4 Me dia n4 Middle r ange 4 s and and1 . 7 0 under
1 . 8 0 1 . 9 0 2 . 0 0 2 . 1 0 2 . 2 0 2 . 3 0 2 . 4 0 2 . 5 0 2 . 6 0 2 . 7 0 2 . 8 0 3 . 9 0 3 . 2 0 3 . 4 0 3 . 6 0 3 . 8 0 4 . 0 0 over
$ $ $ $A , 2 9 9 3 . 0 1 3 . 2 0 2 . 6 2 - 3 . 5 3 6 8 5 4 7 3 9 9 1 5 6 1 0 1 1 5 1 6 6 1 0 9 1 6 3 1 6 4 2 3 6 2 3 2 4 7 1 5 8 9 1 2 7 0 2 1 1 7 4 1 43 , 1 8 8 3 . 1 1 3 . 3 0 2 . 9 0 - 3 . 5 4 4 0 3 0 5 3 9 0 7 4 5 4 9 5 3 3 5 0 6 2 7 9 8 2 1 7 4 3 8 8 4 8 9 1 2 1 3 1 6 4 1 8 21 , 1 1 1 2 . 7 4 2 . 7 1 2 . 3 3 - 3 . 1 9 3 0 2 5 2 0 9 8 2 4 7 5 6 3 3 5 9 1 0 1 8 6 1 5 4 5 7 8 3 1 0 0 5 7 4 7 5 7 1 2
3 4 3 2 . 8 1 2 . 7 4 2 . 6 1 - 3 . 0 4 - - - - - 1 4 - 7 4 5 1 8 4 1 1 1 3 1 7 3 7 4 4 0 8 -3 8 9 3 . 0 1 3 . 0 4 2 . 5 4 - 3 . 6 5 2 1 0 8 6 9 1 1 2 2 1 2 5 3 4 2 3 1 6 3 1 2 4 6 8 5 3 9 5 7 9 '
9 , 9 2 0 3 . 2 3 3 . 3 5 2 . 9 9 - 3 . 5 6 1 0 1 4 6 8 5 1 2 7 1 7 3 2 2 0 1 2 3 1 1 9 2 2 4 3 2 5 3 1 5 7 4 7 1 2 3 0 1 8 2 0 2 5 2 3 1 2 0 5 2 4 5 3 8 38 , 9 4 9 3 . 2 5 3 . 3 6 3 . 0 3 - 3 . 5 7 - - 2 9 8 2 1 1 5 1 5 5 2 0 2 1 0 4 1 1 0 1 9 0 2 9 8 2 1 6 6 0 8 1 1 5 1 1 6 6 2 2 2 5 0 1 1 7 7 2 2 7 3 7 5
9 7 0 3 . 0 8 3 . 2 0 2 . 7 8 - 3 . 4 5 1 0 1 1 7 3 1 2 1 8 1 8 1 9 9 3 4 2 7 9 9 1 3 9 7 9 1 5 8 2 7 4 2 8 1 8 85 9 4 3 . 2 5 3 . 3 8 2 . 9 6 - 3 . 4 8 - - " “ 2 - - - - 6 7 3 1 0 8 3 1 1 0 0 2 5 3 1 5 8 2
4 , 5 4 5 2 . 9 1 3 . 0 0 2 . 4 4 - 3 . 4 4 1 1 3 3 0 6 7 1 1 5 1 8 4 1 7 9 2 3 1 1 6 4 1 5 1 2 6 6 2 1 3 1 6 5 3 9 7 4 5 5 5 5 6 7 0 6 4 3 4 5 8 6 32 , 6 8 0 3 . 1 1 3 . 2 5 2 . 8 0 - 3 . 5 3 9 6 7 4 6 5 6 7 6 9 7 7 4 9 1 7 3 9 2 4 7 2 3 8 3 1 5 4 5 3 5 9 7 3 6 2 1 6 3 21 , 8 5 9 2 . 6 3 2 . 5 8 2 . 1 8 - 3 . 0 7 1 0 3 2 4 6 0 6 9 1 2 9 1 0 2 1 3 4 9 0 6 0 1 9 3 1 2 1 1 1 3 1 5 8 1 4 0 1 0 3 1 0 9 7 2 4 2 3 1
2 8 8 2 . 8 7 2 . 8 1 2 . 5 7 - 3 . 2 5 - - 1 3 3 6 2 2 2 5 4 2 3 0 2 7 4 6 1 9 2 5 4 4 9 5 -4 7 1 2 . 8 3 2 . 7 2 2 . 2 9 - 3 . 2 8 1 0 4 9 8 2 1 1 7 5 6 1 5 1 7 4 0 3 4 2 6 3 3 3 5 4 8 1 3 4 8 2 4 1 34 6 1 2 . 5 3 2 . 5 4 2 . 2 1 - 2 . 7 7 1 2 1 1 8 9 4 9 2 2 3 7 4 8 9 6 9 3 3 5 7 2 4 3 6 4 1 4 7 1 2 -5 7 6 2 . 4 0 2 . 2 2 1 . 9 4 - 2 . 8 7 7 9 8 4 0 4 8 5 2 5 8 2 0 2 0 2 0 4 1 2 3 8 4 7 3 3 2 5 3 2 4 1 1 8
2 , 8 5 7 2 . 2 2 2 . 1 9 1 . 5 1 - 2 . 9 4 1 0 7 2 8 1 4 5 8 9 7 9 7 2 9 3 1 7 7 8 2 6 3 4 6 1 0 3 2 3 9 1 3 9 3 8 9 7 4 9 9 _
2 , 5 3 3 2 . 2 7 2 . 2 5 1 . 5 2 - 2 . 9 9 9 0 8 7 1 4 2 7 3 6 5 6 4 8 7 1 4 8 6 2 5 2 2 8 1 0 1 2 1 8 1 3 9 3 3 8 7 4 9 9 -3 2 5 1 . 8 6 1 . 7 0 1 . 3 9 - 2 . 3 7 1 6 4 9 4 1 6 1 4 9 6 2 9 2 1 1 1 1 8 2 2 1 - 1 - - -
8 , 9 4 4 2 . 4 9 2 . 6 2 2 . 1 3 - 2 . 9 3 9 9 4 3 4 3 2 4 2 3 2 7 2 7 1 2 0 0 2 6 5 4 2 0 3 7 9 8 6 9 1 0 1 8 4 1 6 2 0 8 8 9 3 5 1 6 1 1 5 1 _ _
7 , 2 2 7 2 . 5 4 2 . 6 5 2 . 3 0 - 2 . 9 5 6 9 2 2 7 2 1 8 1 2 6 1 1 2 0 1 4 8 1 3 7 3 2 5 2 1 9 7 6 9 9 1 6 2 3 3 1 9 9 5 7 8 8 1 6 1 1 5 1 - -1 , 7 1 7 2 . 2 6 2 . 3 3 1 . 8 9 - 2 . 7 0 3 0 2 7 1 6 2 6 6 1 5 1 5 2 1 2 8 9 6 1 6 0 1 0 1 1 0 2 1 8 6 9 3 1 4 8 - - - - -1 , 3 0 0 2 . 3 Q 2 . 4 4 2 . 0 9 - 2 . 7 4 1 0 2 1 6 4 3 5 0 1 3 1 4 1 1 1 8 8 8 1 4 8 9 9 6 9 1 8 . ) 9 3 1 2 4 - - -
2 , 6 C 7 3 . 1 9 3 . 3 1 2 . 9 9 - 3 . 4 6 _ _ 3 8 4 5 5 3 4 2 8 6 8 2 0 7 5 7 0 1 2 8 1 5 5 3 2 7 5 8 5 8 7 0 9 5 2 8 3 72 , 5 7 6 3 . 2 0 3 . 3 2 3 . 0 0 - 3 . 4 6 - - 3 8 4 5 4 3 3 2 5 6 8 2 0 7 5 6 0 1 2 5 1 5 5 3 1 4 5 8 5 8 7 0 9 5 2 8 3 7
8 , 8 7 7 3 . 2 6 3 . 3 5 3 . 0 3 - 3 . 5 6 _ 1 2 1 0 7 5 9 0 1 4 7 2 2 8 7 5 7 0 1 2 5 2 2 7 3 6 6 5 9 9 9t>5 1 9 6 9 2 5 1 5 7 1 7 1 6 2 5 2 68 , 2 1 9 3 . 2 7 3 . 3 5 3 . 0 6 - 3 . 5 6 - 1 2 1 0 7 5 8 9 1 4 7 2 1 0 7 5 6 7 1 2 0 2 2 4 1 8 1 4 9 9 9 3 9 1 9 2 1 2 2 9 9 6 9 6 1 5 0 5 0 6
6 5 9 3 . 1 5 3 . 1 4 2 . 7 7 - 3 . 5 3 - - - - 1 - 1 8 - 3 5 3 1 8 6 1 0 1 2 7 4 7 2 1 6 2 1 1 2 2 06 1 3 3 . 1 4 3 . 1 4 2 . 7 8 - 3 . 5 2 ~ ~ “ 1 “ 1 8 2 3 ~ 1 7 2 9 8 2 7 4 5 2 1 6 2 1 “ 1 1
1 1 , 8 0 8 2 . 8 1 2 . 9 4 2 . 3 6 - 3 . 2 5 1 0 7 9 9 . 2 5 6 2 7 5 6 4 4 4 6 9 7 5 5 5 3 6 3 5 0 6 2 6 3 7 3 6 2 7 1 3 0 3 1 5 1 9 2 6 6 8 9 8 7 1 9 8 1 3 53 , 1 7 2 2 . 6 3 2 . 5 5 2 . 1 3 - 3 . 1 7 7 0 5 3 1 0 1 1 3 4 3 7 6 1 7 8 2 2 6 1 7 9 1 5 7 2 2 5 9 0 9 0 3 1 6 2 3 2 3 7 2 3 1 3 4 3 1 3 58 , 6 3 5 2 . 8 8 3 . 0 2 2 . 5 4 - 3 . 2 6 3 7 4 7 1 5 4 1 4 0 2 6 8 2 9 1 5 2 8 3 5 7 1 9 4 4 0 1 2 8 2 5 3 7 9 8 7 1 2 8 6 2 2 9 o 6 7 5 1 5 5 - -7 , 1 1 2 2 . 9 4 3 . 1 0 2 . 6 0 - 3 . 2 3 - 2 2 1 0 2 7 5 2 0 3 2 2 1 4 6 7 2 6 2 1 2 7 3 0 1 1 8 3 2 3 9 8 5 2 1 C 4 1 2 2 0 0 6 7 5 1 4 4 - -
5 4 0 2 . 6 6 2 . 7 5 2 . 1 9 - 3 . 1 0 6 - 4 8 1 7 3 7 3 0 1 6 1 3 1 6 3 7 3 1 3 8 8 0 1 0 3 5 8 - 1 1 - -6 4 5 2 . 6 1 2 . 7 1 2 . 3 6 - 2 . 9 9 1 2 8 4 3 1 1 7 3 8 3 0 3 8 4 0 4 9 4 4 1 2 8 4 6 1 3 1 2 8 - - - -3 2 6 2 . 5 1 2 . 7 0 2 . 3 2 - 2 . 7 6 9 1 6 - 1 7 1 2 1 1 6 4 4 1 0 1 1 2 4 1 3 2 1 1 1 2 1 0 - - -
1 7 , 3 9 4 2 . 9 9 3 . 0 8 2 . 6 0 - 3 . 4 6 7 7 6 2 1 1 4 2 6 8 5 8 2 6 4 0 5 5 7 5 7 8 7 8 7 6 4 7 9 3 0 7 5 1 1 7 0 7 2 1 6 3 2 4 7 5 3 3 4 2 1 3 6 8 2 3 0 1 1 21 5 , 8 7 8 3 . 0 0 3 . 0 9 2 . 6 1 - 3 . 4 7 5 6 3 4 1 0 4 2 6 3 5 5 9 6 0 9 4 6 9 5 2 6 7 3 6 5 7 7 7 1 5 6 6 1 1 6 2 4 1 9 7 2 2 3 1 4 3 G3 8 1 2 9 8 2 1 4 n o
1 , 5 1 6 2 . 9 2 2 . 9 8 2 . 6 0 - 3 . 4 1 2 1 2 8 1 1 5 2 3 3 1 8 8 5 3 5 1 7 0 2 1 5 9 3 8 4 1 9 6 1 6 1 3 0 4 7 1 1 6 26 1 7 3 . 2 7 3 . 4 2 3 . 0 6 - 3 . 5 5 - - - - - 1 3 - - 3 3 8 0 9 2 1 7 3 9 5 2 5 4 5 1 1 6 -4 2 9 2 . 7 2 2 . 6 7 2 . 4 5 - 3 . 0 7 - - - - - 1 5 5 0 2 7 3 1 3 5 8 1 4 1 2 8 6 4 4 5 1 1 - - -2 6 3 2 . 8 4 2 . 7 4 2 . 4 9 - 3 . 2 3 2 “ 4 1 1 4 1 7 2 5 1 3 1 2 4 2 2 5 8 3 9 1 6 3 3 2 0 - 2
3 , 3 5 6 3 . 2 9 3 . 3 6 3 . 1 4 - 3 . 5 3 - 4 _ _ 2 7 3 3 2 2 0 5 4 8 9 2 7 2 5 1 7 5 5 0 1 1 1 1 8 9 4 5 2 3 1 1 0 7 -3 , 3 4 5 3 . 2 9 3 . 3 6 3 . 1 4 - 3 . 5 3 - 4 - 2 7 3 3 2 2 0 5 4 8 9 2 7 2 5 1 7 5 5 0 0 1 1 1 1 9 4 4 2 3 0 1 0 7 -
2 , 8 5 7 2 . 3 8 2 . 5 2 1 . 9 8 - 2 . 8 3 6 1 1 5 0 2 8 3 4 5 1 7 9 8 2 2 7 0 1 7 2 2 5 6 2 2 6 1 6 8 5 5 2 1 6 1 1 1 0 7 _ _ _
2 , 8 0 8 2 . 3 9 2 . 5 2 1 . 9 8 - 2 . 8 3 6 0 2 4 8 2 7 3 1 5 1 7 9 8 2 2 7 0 1 7 2 2 3 8 2 1 0 168 5 5 2 1 6 1 n o 7 - - -
3 , 4 6 1 3 . 0 3 3 . 2 1 2 . 6 7 - 3 . 5 3 1 2 0 3 4 6 8 6 6 9 4 6 3 9 9 5 0 2 8 1 4 9 1 2 9 9 3 2 2 3 4 9 6 4 1 4 9 7 3 3 3 7 8 1 42 , 6 4 2 3 . 2 0 3 . 3 4 3 . 0 3 - 3 . 5 5 3 2 2 2 1 5 3 6 8 3 9 2 6 1 5 1 7 5 4 9 1 a 1 7 0 4 4 6 3 6 7 9 2 5 3 0 5 1 4
8 1 9 2 . 4 7 2 . 4 9 2 . 0 3 - 2 . 9 5 8 9 1 2 5 3 3 0 8 6 2 4 7 2 3 5 1 2 9 5 3 9 2 8 5 2 5 0 4 7 4 9 3 2 7 1 03 1 9 2 . 1 3 2 . 0 9 1 . 6 8 - 2 . 5 6 8 2 3 2 3 1 1 4 5 1 5 1 9 1 0 4 4 7 8 3 1 5 6 1 9 5 ~ ~
See foo tn otes at end o f tab le .
Digitized for FRASER http://fraser.stlouisfed.org/ Federal Reserve Bank of St. Louis

40
Table A-9. Maintenance and Powerplant Occupations—South---- Continued
(Average straight-time hourly earnings for m e n in selected occupations by industry division in the South,1 February 19652)
Nu mb er of workers receiving straight-time hourly earnings of—
Numberof
$ $ $ $ $ $ $ » $ $ $ $ $ $ $ iO ccu pa tion and in du stry d iv is io n Under 1 .7 0 1 .8 0 1 .9 0 2 .0 C 2 . 1 0 2 . 2 0 2 .3 C 2 .4 0 2 .5 0 2 .6 0 2 . 7J 2 .8 0 3 .0 0 3 .2 0 3 .^ 0 3 .6 0 3 .8 0 4 .0 0
workers M ean4 M edian4 Middle range 4 $ and and1 .7 0 under " ~ ~ ~ ~ - ~ ~ ~ ~ ~
1 .8 0 1 ,9 0 2 . CO 2 .1 C 2 . 2 0 2 .3 0 2 .4 0 2 .5 0 2 .6 0 2 .7 0 2 .8 0 3 .0 0 3 .2 0 3 .4 0 3 .6 0 3 . MO 4 .0 0 ov e r
$ $ $ $PIPEFITTERS, MAINTENANCE--------------------- 7 ,3 0 0 3 .4 3 3 .5 3 3 .3 6 - 3 .5 9 8 - 3 2 15 48 3 2 0 19 37 30 L32 20 3 420 1288 3489 1513 45 20
MANUFACTURING--------------------------------------- 7 ,1 7 3 3 .4 4 3 .5 4 3 .3 7 - 3 .5 9 8 - 3 2 15 48 3 2 0 1 9 34 18 10 3 132 40 8 1247 3485 151 3 45 2 0
PLUM8ERS, MAINTENANCE------------------------ 282 2 .7 0 2 .6 7 2 .3 6 - 3 .1 3 14 2 8 9 9 14 4 17 1 2 26 35 1 1 2 9 32 26 27 l 5 1
SHEET-METAL WORKERS, MAINTENANCE — 1 ,0 9 0 3 .3 1 3 .3 8 3 .1 5 - 3 .5 7 _ _ _ 2 15 11 3 _ 41 7 2 1 80 1 2 1 2 86 311 147 39 5MANUFACTURING---------------------------------- 1 ,0 3 3 3 .3 3 3 .3 9 3 .2 0 - 3 .5 8 - - - - - 15 1 1 3 - 41 7 19 4 9 n o 275 311 147 39 5
TOOL AND OIF MAKERS---------------------------- 2 ,9 7 1 3 .3 1 3 .3 5 3 .0 6 - 3 .6 2 _ _ _ _ 1 _ 9 _ 2 2 19 51 187 29 4 413 764 418 715 72 7u AKiiiCArTiio inr 3 .3 1 3 .0 7 - 3 .6 2 1 2 2 19 51 72M ANUrAL 1 UK INb —— ——————— — —
1 For definition of regions, see footnote 3 to the table in appendix A.2 Average month of reference. Data were collected during the period July 1964 through June 1965.3 Excludes premium pay for overtime and for work on weekends, holidays, and late shifts.4 For definition of terms, see footnote 3, table A-l.5 Transportation, communication, and other public utilities.6 Finance, insurance, and real estate.
Digitized for FRASER http://fraser.stlouisfed.org/ Federal Reserve Bank of St. Louis

41
Table A-10. Maintenance and Powerplant Occupations—North Central
(A v e ra g e s tra ig h t-t im e h ou rly earn ings fo r m en in se le c te d occu p a tion s by in dustry d iv is io nin the N orth C en tra l r e g io n ,1 F e b ru a ry 1965 2 )
Hourly earnings N um ber o f w o rk e r s re ce iv in g s tra ig h t -t im e hou rly earn ing: o f—
O ccu pa tion and in du stry d iv is io n
C A R P E N T E R S , M A I N T E N A N C E ---------------M A NU FA C TUR I NG ----------------------------NONMANUFACTUR I N G -----------------------
P U B L I C U T I L I T I E S 5-------------------R E T A I L T R A D E ---------------------------F I N A N C E 6------------------------------------
E L E C T R I C I A N S , MA INTENA NCE -----------M A N U F A C T U R I N G -----------------------------N UN M AN UFA CT URI NG -----------------------
P U B L I C U T I L I T I E S 5-------------------F I N A N C E 6------------------------------------
E N G I N E E R S , S T A T I O N A R Y -------------------M A NU FA C TUR IN G ----------------------------N O N M A N U F A C T U R I N G -----------------------
P U B L I C U T I L I T I E S 5-------------------R E T A I L T R A D E ---------------------------F I N A N C E 6-------------------------------------S E R V I C E S ----------------------------------
F I R E M E N , S T A T I O N A R Y 3 0 I L F R ---------M A NUFA C TUR IN G -----------------------------N U N M A N U F A C T U R I N G -----------------------
P U 3 L IC U T I L I T I E S 5-------------------S E R V I C E S -----------------------------------
H E L P E R S , M AINTENA NCE T R A D E S -------MANUFACTUR I N G -----------------------------N O N M A N U F A C T U R IN G -----------------------
P U B L I C U T I L I T I E S 5--------- ---------
M A C H IN E -T O O L O P E R A T O R S , TOOLROOM M ANU FA CT UR IN G -----------------------------
M A C H I N I S T S , M AINTENA NCE ---------------M A N U F A C T U R I N G -----------------------------NONMAN UFACTUR ING -----------------------
P U B L I C U T I L I T I E S 5-------------------
M E C H A N I C S , A UTO M O T IV E{ M A I N T E N A N C E ! ---------------------------------
M A NU FA C TURI NG -----------------------------NONMANUFACTURING -----------------------
P U B L I C U T I L I T I E S 5-------------------W H O L E S A L E T R A D E ---------------------R E T A I L T R A D E ---------------------------
M EC H A N I C S , M A I N T E N A N C E -----------------M A N U F A C T U R I N G -----------------------------NONMAN UFACTU RING -----------------------
P U B L I C U T I L I T I E S 5-------------------W H O L E S A L E T R A D E ---------------------
M I L L W R I G H T S ---------------------------------------M A N U F A C T U R I N G -----------------------------
O I L E R S ------------------------------------------------M A N U F A C T U R I N G -----------------------------
____ i S S $ $ $ $ $ $ $ $ r $ $ $ $ t $ $of Under 1.90 2.00 2.10 2.20 2.30 2.40 2.50 2.60 2.70 2.80 2.90 3.00 3.20 3.40 3.60 3.80 4.00 4.20
workers Mean4 Median4 Middle range4 $ and1.90 under ~ ~ ~ ~ ~ - ~ and
2.00 2.10 2.2C 2.30 2.40 2.50 2.60 2.70 2.80 2.90 3.00 3.20 3.4C 3.60 3.80 4.00 4.20 over$ $ $ $
5,95 8 3.27 3.24 2.91- 3.53 4 10 7 6 13 72 112 185 374 356 289 443 902 973 1339 167 128 154 4264,341 3.2? 3.25 2.98- 3.49 - - - - 8 49 45 68 173 220 216 382 111 912 121 3 120 84 62 131,617 3.40 3.15 2.68- 4.22 4 10 7 6 5 23 67 117 202 136 73 60 125 61 126 47 43 93 413
601 2.82 2.69 2.58- 2.92 - - - - - 4 63 102 140 81 57 24 26 18 74 7 5 - -3S9 3.84 4.02 3.09- 4.57 - - - 1 - 1 2 3 5 29 1 12 61 17 6 24 30 53 145436 3.82 4.22 2.95- 4.64 - 9 - ~ 13 2 7 55 8 6 19 32 7 2 9 5 37 225
21,717 3.42 3.46 3.19- 3.66 1 1 1 19 36 59 83 118 229 594 701 1056 2733 4147 4420 5413 893 644 56819,197 3.40 3.44 3.19- 3.64 - - - 12 19 52 64 95 161 522 646 826 260 7 3948 4136 4945 528 307 3282,519 3.59 3.66 3.21- 3.97 1 1 1 7 17 7 19 22 68 71 55 231 126 199 284 468 3t>4 337 2411 »60C 3.63 3.72 3.50- 3.96 - - - - - 1 - 6 - 62 13 188 31 86 179 368 338 285 43
3 30 3.83 3.77 3.15- 4.73 1 - - - 1 13 6 7 1.7 17 39 15 16 44 23 2 129
7,516 3. 32 3.39 3.02- 3.68 16 16 15 26 92 136 83 177 218 316 315 4U1 860 1134 1238 1730 32 5 307 1004,697 3.37 3.42 3.08- 3.65 - - 1 10 31 46 26 70 90 228 175 293 615 661 995 893 221 247 942, 819 3.25 3.32 2.87- 3.71 16 16 14 26 61 90 57 107 128 87 139 108 245 473 244 837 104 60 6
465 3.13 3.03 2.80- 3.47 - - - - 3 4 12 9 44 41 75 39 23 77 49 71 12 - 4551 3.33 3.43 3.05- 3. 74 1 1 9 1 12 13 15 15 3 8 16 20 90 60 80 157 6 44 -837 3.51 3.71 3.35- 3.76 3 3 4 4 12 3 4 4 23 9 23 11 41 115 29 501 46 2 -858 3.00 3.10 2.55- 3.41 12 12 1 21 34 70 25 77 58 29 23 33 46 199 66 108 39 2 2
5,976 2.90 2.92 2.57- 3.30 278 58 61 190 78 210 361 387 402 450 434 371 675 921 599 394 85 22 -4,796 2.92 2.92 2.58- 3.30 129 36 48 176 46 163 338 317 368 340 369 321 490 677 545 383 49 2 -1,180 2.80 2.92 2.47- 3.32 149 22 13 14 33 47 23 70 35 110 65 50 185 244 54 11 36 20 -
361 3.07 3.03 2.74- 3.18 - - 1 3 - 3 13 28 29 34 17 22 129 7 18 5 33 20 -454 2.41 2.51 1.86- 2.95 136 13 8 11 15 31 9 36 l 60 12 16 32 63 5 3 3 - -
8, C75 2.64 2.64 2.45- 2.85 124 98 195 173 285 654 981 1100 1054 1021 702 519 866 271 31 2 1 _ _6,763 2.63 2.62 2.45- 2.83 76 87 186 127 225 583 871 1021 848 909 522 467 572 250 17 2 . 1 - -1,312 2 .69 2.72 2.48- 3.00 48 11 9 46 60 71 109 79 206 112 180 52 294 21 14 - - - -
966 2.72 2.73 2.54- 2.96 9 - - 42 15 54 1C1 59 176 97 146 45 211 13 * - -
15,192 3.4 0 3.48 3.21- 3.65 - - 12 2 70 16 125 117 217 389 492 798 1384 2681 3536 4536 743 60 1515,160 3.40 3.48 3.22- 3.65 ~ “ 12 2 70 16 125 117 216 378 48 7 794 1375 2680 3535 4536 743 60 15
14,389 3.40 3.40 3.20- 3.62 - - - - 13 12 22 108 195 444 413 790 1608 3634 3258 2 540 526 528 29913,843 3.4G 3.39 3.20- 3.61 - - - - 13 12 22 108 190 425 405 688 1571 3602 3226 2457 374 453 298
547 3.52 3.65 3.01- 3.95 - - - - - - - - 5 19 8 102 37 32 32 83 152 75 1495 3.52 3.67 2.99- 3.95
* ~ “ ~ ~ ~ 5 19 8 102 37 15 14 79 150 65
14,776 3.21 3.29 3.00- 3.44 12 24 25 57 54 84 221 46 C 511 640 686 >888 2369 4219 2914 1442 131 30 _4,828 3.18 3.20 2.93- 3.45 - 6 10 13 15 23 106 168 135 274 288 556 839 814 1320 198 35 28 -9, 947 3.22 3.31 3.06- 3.43 12 27 14 44 38 61 115 292 376 366 399 332 1529 3405 1594 1244 96 2 -8,500 3.25 3.33 3.10- 3.45 9 25 6 22 29 39 102 259 200 298 292 285 1161 3055 1425 1205 85 2 -
956 3.02 3.07 2.73- 3.29 - - 4 14 - 10 9 32 154 56 78 32 219 244 87 8 10 - -362 3.21 3.18 3.07- 3.41 ~ ■ 4 “ 3 “ 4 “ 3 10 15 15 139 74 61 31 1 - -
22,296 3.24 3.27 2.97- 3.56 - 9 12 24 87 193 278 516 977 1077 1236 1790 3647 3371 4411 3843 53 8 248 4120,537 3.23 3.26 2.96- 3.55 - 9 2 21 73 185 273 486 889 1036 1169 1713 3483 3171 3872 3728 336 67 271, 759 3.39 3.46 3.13- 3.74 - - 10 3 14 8 5 30 88 41 67 11 164 200 539 115 202 181 141,034 3.65 3.59 3.46- 3.92 - - - - - - - - - 20 2 1 19 75 419 108 202 178 10
32 8 2.98 3.02 2.81- 3.18 ~ “ ~ ~ - 5 4 69 - 39 39 102 53 16 1 - -
14,863 3.30 3.35 3.10- 3.55 - - - - 19 25 19 73 164 541 554 1342 3112 2094 4510 2092 190 105 2414,799 3.30 3.35 3.10- 3.55 “ ~ - 19 25 19 64 164 535 550 1339 3105 2085 4487 2092 187 105 24
5,266 2. 81 2.82 2.58- 2.98 4 27 44 51 131 244 32 9 631 482 476 879 866 391 462 236 9 1 _ _5,081 2.81 2.83 2.58- 2.97 27 43 49 131 243 255 627 476 462 878 864 339 439 236 9 1 ~
See foo tn otes at end o f table.
Digitized for FRASER http://fraser.stlouisfed.org/ Federal Reserve Bank of St. Louis

42
Table A-10. Maintenance and Powerplant Occupations—North Central---- Continued
(Average straight-time hourly earnings for m e n in selected occupations by industry division in the North Central region,1 February 19652 3)
Hourly earnings Number of workers receiving straight-time hourly earnings of—
II U $ $ S $ $ $ $ $ $ $ $ $ $ % $ $ * $
Occupation and industry division of Under 1.90 2.00 2.10 2.20 2.30 2.40 2.50 2.60 2.70 2.80 2.90 3.00 3.20 3.40 3.60 3.80 4.00 4.20workers Mean4 Median4 Middle range4 * and
1.90 under ~ ~ ” 'and
2.00 2.10 2.2 0 2.30 2.40 2.50 2.60 2.70 2.80 2.90 3.00 3.20 3.40 3.60 3.80 > o 1° 4.20 over
PAINTERS, MAIN TE NA NC E--------------- 4,285$3.29
$3.29
$ $ 2.96- 3.54 4 13 48 17 52 64 105 213 165 171 389 591 726 896 130 195 28 478
MANUFACTURING --------------------- 2,954 3.22 3.27 2.98- 3.46 - 3 - 13 7 14 44 65 128 127 111 268 507 635 8G0 94 91 19 29NONMANUFACTURING------------------ 1,331 3.46 3.46 2.89- 4.24 4 10 - 35 1C 38 20 40 85 38 60 121 84 91 96 36 104 9 449
PUBLIC UTILITIES5--------------- 281 3.07 2.99 2.86- 3.41 - 4 - 1 1 4 1 13 10 19 28 62 12 53 61 7 3 - 1FINANCE6-------------------------- 621 3.70 4.22 2.95- 4.40 - 3 - 4 4 2 8 16 70 4 21 45 27 18 9 10 38 3 338SERVICES ------------------------- 262 3.22 3.32 2.38- 3.99 4 3 ~ 27 5 32 11 10 3 9 4 8 14 9 16 6 39 - 63
PIPEFITTERS, MAINTE NA NC E----------- 10,917 3.39 3.43 3.20- 3.56 - - - - _ 35 33 5 84 289 282 36 5 1626 2116 4431 1C16 276 236 123MA NU FACTURING--------------------- 10,346 3.37 3.43 3.20- 3.55 - - - - - 35 33 5 84 251 277 32 5 1551 2044 4353 1013 134 194 47NONMANUFACTURING----------------- 571 3.64 3.55 3.16- 3.96 - - - - - - - - - 38 5 40 75 72 78 3 142 42 76
PUBLIC UTILITIES5--------------- 388 3.46 3.44 3.04- 3.89 ~ ~ ~ ~ 38 5 40 69 39 25 1 139 32 -
PLUMBERS, M A I N TE NA NC E--------------- 625 3.20 3.17 2.90- 3.37 - 1 - 3 8 14 12 10 13 26 69 71 113 138 87 6 _ 10 44MANUFACTURING--------------------- 367 3.22 3.22 3.10- 3.39 - - - - - - - 5 7 12 19 28 96 110 79 3 - 7 1NUNMANUFACTURING------------------ 259 3.17 2.94 2.80- 3.31 1 3 8 14 12 5 6 14 50 43 17 28 8 3 " 3 43
SHEET-METAL WORKERS, MAINTENANCE — 2,664 3.35 3.43 3.21- 3.55 - - - 13 - - 13 9 6 6 6 47 26 7 206 612 1146 201 48 12 18MANUFACTURING --------------------- 2,584 3.36 3.43 3.22- 3.55 ~ ~ 13 13 9 6 44 43 258 203 604 1116 197 48 12 18
TOOL AND DIE M A K E R S ------------------ 26,772 3.60 3.71 3.40- 3.83 - - - - - - - 30 6 8 168 281 82 0 1967 3357 4102 7590 7601 53 7 251MANUFACTURING -------------------------------------------- 26,762 3.60 3.71 3.40- 3.83 “ ~ “ ~ - 30 6 8 168 280 818 1965 3356 4099 7589 7601 537 251
1 For definition of regions, see footnote 3 to the table in appendix A.2 Average month of reference. Data were collected during the period July 1964 through June 1965.3 Excludes premium pay for overtime and for work on weekends, holidays, and late shifts.4 For definition of terms, see footnote 3, table A-l.5 Transportation, communication, and other public utilities.6 Finance, insurance, and real estate.
Digitized for FRASER http://fraser.stlouisfed.org/ Federal Reserve Bank of St. Louis

43
Table A-ll. Maintenance and Powerplant Occupations—West
(A v e ra g e s tra ig h t -t im e h o u r ly ea rn in gs fo r m en in se le c te d occu p a tio n s b y in du stry d iv is io nin the W est, 1 F e b ru a ry 1965 2)
Occupation and industry division
Hourly earnings 3 Numb er of workers receiving straight-time hourly earnings of—
Numberof
$ $ $ $ $ $ $ $ $ $ $ % $ $ $ $ $ $
Under2.20 2.30 2.40 2.50 2.60 2.70 2.80 2.90 3.00 3.10 3.20 3.30 3.40 3.50 3.60 3.80 4.00 4.20
woAers Mean4 Median 4 Middle range4 $2.20
ami _ _ _ _ _ _ _ _ _ _ andunder2/ 3O 2.40 2 *50 2.60 2,70 2a 8Q 2a 9Q 3*QQ 3*L0 3*20 3.30 3.40 3.50 3.60 3.80 4.00 4.20 over
2,581$3.31
$3.32
$ $ 3.12- 3.46 3 1 6 26 119 24 168 71 81 99 230 321 597 305 94 196 71 72 100
1,69b 3.34 3.34 3.22- 3.44 - - 4 19 14 1 14 22 66 66 173 241 548 269 55 131 22 12 39886 3.24 3.19 2.75- 3.64 3 1 2 7 105 23 154 49 15 33 57 80 50 36 39 65 49 60 61435 3.01 2.77 2.62- 3.36 " 4 102 13 137 23 - 11 4 17 27 15 15 12 48 ~ 7
6,415 3.54 3.53 3.35- 3.69 _ _ _ _ 19 28 80 64 198 154 166 52 3 754 875 1296 1099 695 227 2395,121 3.52 3.51 3.35- 3.63 - - - - 8 11 57 35 83 137 122 453 718 829 1171 1038 217 10 2331,2 94 3.62 3.81 3.30- 3.88 - - - - 11 17 23 28 115 18 44 69 37 46 126 61 478 217 6
816 3.64 3.83 3.52- 3.88 - - - - - 17 17 27 101 _ _ 7 7 14 61 29 45 8 74 6355 3.67 3.58 3.39- 4.14 - - - 11 - 7 1 2 7 2 37 26 31 65 24 2 142 “
3,128 3.42 3.39 3.21- 3.64 24 5 7 16 60 74 76 130 26 101 234 357 494 424 226 350 166 207 1541,943 3.53 3.47 3.32- 3.70 - - 5 5 - 2 — 77 9 78 129 121 373 264 181 310 96 151 1431,185 3.23 3.26 2.89- 3.45 24 5 2 11 60 72 76 52 17 24 105 235 121 160 45 40 70 56 11
6 50 3.24 3.26 3.14- 3.41 24 5 - 43 45 1 3 1 13 64 198 85 62 8 1 52 47
790 2.84 2.86 2.60- 3.03 22 1 43 46 85 95 67 59 163 45 51 47 14 5 3 45 _ _ -569 2.91 2.91 2.66- 3.14 9 1 5 40 57 50 56 55 106 32 44 47 14 5 3 45 -
3,516 2.75 2.81 2.64- 2.93 92 50 112 166 300 42 8 575 675 900 57 27 25 24 85 _ - - - -2,578 2.79 2.84 2.68- 2.94 37 33 39 67 233 279 391 501 822 38 27 25 - 85 - - - - -
938 2.64 2. 70 2.49- 2.83 55 17 73 100 68 149 184 174 77 19 - - 24 - - - - - -707 2.67 2.70 2.51- 2.82 9 11 58 93 57 127 151 116 71 14 - 2 ~
2,403 3 . 3 3 3.36 3.22- 3.47 3 _ _ _ _ 1 24 90 98 113 171 531 270 729 86 265 23 - -2,379 3 . 3 3 3.36 3.22- 3.47 3 " - 1 24 90 98 113 171 531 270 729 75 251 23 “
5,918 3.52 3.51 3.33- 3.69 _ _ 1 14 22 53 51 34 167 262 583 847 858 942 1132 529 219 2045,384 3.50 3.50 3.33- 3.66 - - - 1 14 22 15 46 32 163 250 569 751 854 930 1107 379 47 204
534 3.71 3.84 3.36- 4.12 ~ - “ 38 4 2 4 12 14 96 4 12 25 150 172
8,145 3.41 3.39 3.29- 3.63 3 3 14 54 158 12 115 127 166 408 396 634 2239 560 651 2094 464 44 22,414 3.34 3.38 3.20- 3.61 - 3 9 - 76 10 105 83 88 108 109 380 306 258 235 511 126 8 -5,731 3.43 3.39 3.32- 3.64 3 - 5 54 83 2 10 44 79 300 287 253 1934 302 417 1583 338 36 24,783 3.45 3.40 3.32- 3.65 3 - 1 53 65 1 1 25 75 159 218 196 1676 218 287 1500 306 - -
421 3.37 3.39 3.25- 3.54 4 9 - ~ 4 41 27 38 98 69 58 50 2 1
7,995 3.35 3.40 3.19- 3.49 _ 8 3 46 51 48 189 143 272 951 318 1052 859 2354 500 751 203 166 817,480 3.35 3.40 3.19- 3.49 - 8 3 45 41 48 187 109 263 876 311 918 832 2244 463 724 170 158 81
516 3.32 3.29 3.10- 3.48 “ - 1 10 2 34 10 75 7 134 27 1 1 0 37 27 3 3 8 “
695 3.42 3.45 3.32- 3.65 _ _ _ _ 57 - _ 16 _ 46 23 133 141 71 181 16 _ 1 2654 3.41 3.45 3.32- 3.65 - - 57 ~ - 16 - 46 23 119 141 52 172 16 1 2
1,476 2.78 2.77 2.65- 2.97 26 16 40 96 65 262 338 147 179 157 121 4 _ _ _ 24 _ _ _1,394 2.76 2.76 2.64- 2.94 26 16 40 96 65 261 335 140 175 157 55 4 - - - 24 -
2 ,0 2 2 3.31 3.29 3.12- 3.47 3 _ 7 1 44 62 46 91 58 162 199 375 239 348 59 143 60 40 871,372 3.30 3.27 3.14- 3.44 - - - - - 1 12 75 38 141 189 313 186 213 36 96 42 6 25
650 3.34 3.39 2.88- 3.59 3 - 7 1 44 61 34 16 21 20 10 62 53 135 23 47 18 34 62258 3.50 3.43 3.29- 3.63 - - 4 1 2 4 5 - 57 26 83 8 16 13 30 7
2,396 3.43 3.41 3.32- 3.49 _ _ _ 1 1 _ 12 68 24 67 26 286 646 774 1 0 1 267 64 4 562 , 2 1 1 3.44 3.41 3.32- 3.49 - - 1 1 5 12 24 67 25 282 618 731 72 256 63 - 56
461 3.36 3.40 3.28- 3.46 _ _ - - 1 2 25 8 17 10 10 56 103 179 14 5 2 29 1340 3.37 3.40 3.32- 3.45 1 2 10 10 41 1 0 1 166 8 1
CARPENTERS, MAIN TEN ANCE --------------------MAN UFA CTU RI NG ------------------------------------NONMANUFACTURING ------------------------------
PU BLIC U T I L I T I E S 5-------------------------
E L E C T R I C I A N S , MA INTEN ANCE---------------MANUFACTURING -------------------------------------NONMANUFACTURING ------------------------------
P U B L IC U T I L I T I E S 5-------------------------S E R V I C E S -------------------------------------------
ENGINEERS, S T A T I O N A R Y -------------------------M ANU FAC TURING------------------------------------NONMANUFACTURING-----------------------------
SE RV IC ES -------------------------------------------
FIREMEN, STATIONARY BOILER -------------MANUFACTURING ------------------------------------
HE LP ERS , MAINTENANCE T R A D E S -----------MANUFACTURING -------------------------------------NONMANUFACTURING------------------------------
PU B LI C U T I L I T I E S 5-------------------------
MACHINE-TOOL OPERATORS, TOOLROOM MA NU FAC TU RING -------------------------------------
M A C H I N I S T S , MAINTENANCEMANUFACTURING ---------------NONMANUFACTURING---------
MECHANICS, AUTOMOTIVE( M A I N T E N A N C E ! --------------------
MANUFA CTU RING ---------------NONMANUFACTURING---------
PU B LI C UT IL IT IE S 5 — WHOLESALE TRADE
MECHANICS, MAINTENANCEMANUFACTURING-------------NONMANUFACTURING ------
M I L L W R I G H T S ------------------------------MANUFACTURING ------------------
OI LE RS ------------------------------------------MANUFAC TURING------------------
P A I N T E R S , MAINTEN ANCE-------MA NUFAC TURING------------------NUNMANUFACTURING -----------
S E R V I C E S -------------------------
P I P E F I T T E R S , MAINTENANCE MANUFACTUR I N G ------------------
PLUMBERS, MAINTENANCE -------MANUFAC TURING------
See foo tn otes at end o f table.
Digitized for FRASER http://fraser.stlouisfed.org/ Federal Reserve Bank of St. Louis

44Table A-ll. Maintenance and Powerplant Occupations—West— Continued
(A v e ra g e s tra ig h t -t im e h o u r ly ea rn in gs fo r m en in s e le c te d o ccu p a tion s b y in du stry d iv is io n in the W est, 1 F e b ru a ry 196 5 2)
O ccupation and in du stry d iv is io n
Hourly earnings 3 Number of workers receiving straight-time hourly earnings of— '
Numberof
workers
$ S $ % $ $ $ $ $ $ $ $ $ $ $ $ $ $
Mean4 5 Median 4 Middle range4Under$2 .2 0
2 .2 0
andunder
2.30 2.40 2.50 2.60 2.70 2.80 2.90 3.00 3.10 3.20 3.30 3.40 3.50 3.60 3.80 4.00 4.20
and
2.30 2.40 2.50 2.60 2.70 2 . 80 2.90 3.00 3.10 3.20 3.30 3.40 3.50 3.60 3.80 o o 4.20 over
529$3.48
$3.39
$ $ 3.31- 3.49 2 1 33 19 50 163 1 17 27 26 18 2 1 34
471 3.47 3.38 3.31- 3.46 ~ - ~ “ “ 5 33 19 48 154 1 1 2 23 24 18 - 34
4,743 3.53 3.57 3.35- 3.69 - - 3 3 - 24 2 34 64 98 327 404 494 533 515 1663 238 275 674,627 3.52 3.56 3.34- 3.68 3 3 24 2 34 64 98 327 404 494 532 515 1632 178 264 53
SHEET-METAL WORKERS. MAINTENANCE — MANUFACTURING ---------------------
TOOL AND DIE M A K E R S ------------------MANUFACTURING ---------------------
1 F o r d e fin ition o f r e g io n s ,, see foo tn ote 3 to the table in appendix A.2 A v e ra g e m onth o f r e fe r e n c e . Data w e re c o lle c te d during the p e r io d July 1964 through June 1965.3 E x clu d es p rem iu m pay fo r o v e r t im e and fo r w ork on w eek en d s, h o lid a y s , and late sh ifts .4 F o r d e fin ition o f t e r m s , se e foo tn ote 3, table A - l .5 T ra n sp o r ta tio n , co m m u n ica tio n , and o th e r pu blic u t ilit ie s .
Digitized for FRASER http://fraser.stlouisfed.org/ Federal Reserve Bank of St. Louis

45
Table A-12. Custodial and Material Movement Occupations—United States
(A v e ra g e s tra ig h t- t im e h o u rly e a rn in g s fo r se le c te d occu p ation s by in d u s try d iv is io nin a ll m etro p o lita n a re a s , F e b ru a ry 196 5* )
H o u r ly e a rn in g s 3 Nu mb er of workers receiving straight-time hourly earnings of—
$ $ S $ $ $ $ $ $ $ $ $ $ $ $ $ $ $N um b er 1.00 1.10 1.20 1.30 1.40 1.50 1.60 1.70 1.80 2.00 2.20 2.40 2.60 2.80 3.00 3.20 3.40 3.60
o f Underw o rkers M e a n 4 M e d ia n 4 M id d le r a n g e 4 $ and _ _ _ _ _ _ _ _ _ _ and
1.00 under
1.10 1.20 1.30 1.40 1.50 1.60 1.70 1.80 2.00 2.20 2.40 2.60 2.80 3.00 3.20 3.40 3.60 over
$ $ $ $6,658 1.89 2.02 1.54- 2.32 295 104 127 444 404 179 300 497 176 432 1693 1002 843 139 13 10 - - 1
474 2.05 2.18 1.81- 2.36 - - - 30 25 12 26 11 8 70 66 127 78 14 6 - - - 1— 6,184 1.87 2.02 1.52- 2.32 295 104 127 414 379 167 273 486 168 362 1629 875 765 125 7 10 — - -
257 2.41 2.51 2.23- 2.63 - - - - - - 6 6 4 9 35 48 74 69 7 - — - -
696 1.56 1.49 1.25- 1.77 6 - 107 133 55 47 51 79 67 44 37 31 38 1 - - - - -3,359 2.03 2.07 1.31- 2.38 35 27 3 120 245 10 129 237 21 165 1004 684 634 45 - - - - -
1,718 1.59 1.67 1.26- 2.04 254 77 13 141 69 102 86 161 76 116 511 110 3 ~ ~ ~
7,681 1.32 1.27 1.12- 1.58 1280 299 1415 1275 588 396 646 436 282 296 559 76 125 8 1 _ . _ _— 7,470 1.31 1.26 1.12- 1.56 1280 299 1415 1264 573 387 633 423 265 241 519 58 116 4 1 - - - -
293 1.99 1.98 1.79- 2.17 - - - - 1 11 25 22 16 83 89 11 33 2 1 - - - -2,927 1.31 1.23 1.15- 1.40 15 49 1223 627 279 213 117 165 81 75 55 16 11 - - - - - -1,289 1.48 1.41 1.24- 1.63 112 31 108 201 187 51 264 39 61 40 143 - 50 2 - - - - -
— 2,895 1.15 1.19 .72- 1.55 1153 219 84 385 100 108 226 186 107 43 232 31 22 - - - - - -
77,822 2.08 2.11 1.45- 2.68 240 117 194 9508 6531 5247 4 894 2437 217 3 4930 5832 703 9 6982 8173 8207 4404 747 100 69— 38,548 2.42 2.55 2.10- 2.84 20 - 5 1255 1153 867 824 900 740 2400 3639 4031 4786 6699 6892 3 978 206 89 66
39,274 1.74 1.53 1.32- 2.13 220 117 189 8253 5378 4380 4070 1537 1433 2530 2193 3009 2196 1475 1315 426 542 11 3
26,318 2.63 2.74 2.42- 2.92 20 - - 97 80 168 170 171 229 872 1941 2416 3664 5888 6425 3901 126 87 66
12,230 1.96 1.95 1.52- 2.34 - - 5 1158 1074 699 654 729 512 1529 1699 1615 1122 810 466 77 80 2 -
— 206,258 1.97 2.04 1.56- 2.39 3136 1957 5084 15071 10933 9297 10893 9049 10737 20499 29179 30234 26916 18844 3418 757 98 134 2397,020 2.20 2.26 1.92- 2.56 - - 56 2134 3188 33SC 3043 3326 3829 9314 13624 18105 16867 16547 2743 639 64 129 21
109,238 1.77 1.76 1.35- 2.16 3136 1957 5027 12937 7745 5907 7850 5723 6908 11185 15556 12129 10048 2298 675 118 34 5 214,195 2.17 2.26 1.93- 2.44 - - 3 248 258 373 591 661 588 1353 2000 3696 3072 1046 249 52 5 _ _
5,166 1.87 1.81 1.49- 2.26 - - 18 466 449 412 507 371 341 565 563 56 9 532 288 57 19 10 _ -— 26,145 1.56 1.51 1.25- 1.80 748 804 3081 3569 2474 2125 2931 2114 1750 2465 1680 874 1161 163 159 21 19 5 2
2 0, 768 1.82 1.86 1.43- 2.16 354 157 439 2 509 1488 949 1191 1243 1186 2791 3801 1856 26 76 96 25 8 _ _ _— 42,965 1.73 1.76 1.30- 2.10 2034 995 1486 6145 3076 2048 2631 1335 3042 4013 7512 5135 2607 705 185 18 -
60,063 1.67 1.71 1.36- 1.92 1332 644 2606 8113 3848 3908 4857 4464 4210 18517 2838 2312 1720 602 86 8 .— 9,182 1.97 2.01 1.64- 2.28 - - 29 609 702 372 403 421 571 1418 1704 1249 1139 529 31 8 - _ -— 50,882 1.61 1.66 1.32- 1.88 1332 644 2577 7504 3146 3537 4454 4044 3639 17100 1134 1063 581 73 5 5 - _ -— 4,137 1.83 1.79 1.62- 1.98 - - - 98 159 235 450 490 699 1060 203 477 257 8 _ _ _ - —— 892 1.56 1.51 1.27- 1.79 - - 18 300 78 39 86 50 112 111 63 16 17 3 _ _ _ _ _
4,640 1.33 1.26 1.16- 1.46 120 129 1537 925 613 264 274 314 168 194 44 39 18 - _ _ _ _ _— 21,021 1.60 1.63 1.40- 1.85 783 266 436 2800 960 2071 2603 1898 1739 6766 267 207 225 _ _ _ _ _ _— 20,191 1.65 1.79 1.33- 1.92 430 248 587 3380 1337 927 1041 1291 921 8969 558 324 64 62 5 5 - “ - -
237,300 2.38 2.47 2 .01- 2.80 4 30 819 8068 7433 5923 7732 6166 6830 15549 21531 27342 29773 39880 29545 21439 6406 1228 1603126,661 2.32 2.37 1.99- 2.69 - - 73 3097 3530 3577 3762 3383 4077 10593 15575 18316 16875 26084 11603 2280 1540 782 1515110,638 2.46 2.61 2.04- 2.96 4 30 746 4570 3903 2346 3969 2783 2753 4956 5956 9027 12899 13796 17942 19159 4866 446 8849,537 2.80 2.90 2.59- 3.11 - - - 270 199 275 369 388 389 518 325 2904 7206 6124 11114 15348 3844 263 -
— 34,710 2.20 2.27 1.62- 2.74 - - - 2867 2476 951 2176 1015 1100 2128 3255 3617 3126 5030 4328 2135 357 142 1125,367 2.15 2.17 1.62- 2.71 - 27 743 1729 1168 1047 1350 1345 1206 2158 2240 2416 2459 2544 2487 1667 66 5 41 77
924 1.93 1.89 1.50- 2.38 4 3 3 93 59 72 74 25 52 127 112 77 103 97 13 10 - -
80,694 2.40 2.49 2.03- 2.82 - - 22 1711 1797 2075 2444 2805 2 703 5129 7316 8211 12045 12503 14729 3678 2415 586 52825,693 2.43 2.46 2.11- 2.75 - - 14 195 371 557 611 686 631 1738 2443 3593 4907 4642 3406 735 366 502 300
— 55,001 2.39 2.52 1.99- 2.84 - - 8 1517 1427 1519 1833 2119 2072 3391 4872 4618 7139 7860 11324 2943 2049 84 228— 1,356 2.68 2.84 2.55- 2.96 - - - - - - 11 32 20 146 32 12 146 214 579 133 30 1 _
37,2 84 2.36 2.50 1.96- 2.81 - - - 1406 119] 1154 1203 1375 1340 2072 2833 3431 5815 5625 7020 1864 894 - 62. . . 16,033 2.46 2.59 2.02- 2.91 — ~ 8 101 219 345 595 646 689 1153 1984 1167 1138 1967 3724 924 1125 83 166
Occupation2 and industry division
ELEVATOR OPERATORS, PASSENGER -M ANUFACTUR I N G ----------------NONMANUFACTURING -------------
PUBLIC UTILITIES5----------RETAIL T R A D E ---------------FINANCE6---------------------S E R V I C E S --------------------
ELEVATOR OPERATORS, PASSENGER (W O M E N ) -------------------------
NONMANUFACTURING --------------PUBLIC UT I L I T I E S ------------RETAIL T R A D E ----------------FINANCE6----------------------S E R V I C E S ---------------------
GUARDS AND W A T C H M E N -----------MANUFACTURING---------------NONMANUFACTURING------------
GUARDS:MANUFACTURING
WATCHMEN:MA NU FA CT UR IN G----
JANITORS, PORTERS, AND CLEANERSM ANUFACTUR I N G -----------------NONMANUFACTURING--------------
PUBLIC UTILITIES5------------WHOLESALE T R A D E -------------RETAIL T R A D E ----------------FINANCE6----------------------S E R V I C E S ----------------------
JANITORS, PORTERS, AND CLEANERS(WOMEN) ---------------------------
MANUFACTURING------------------NONMANUFACTURING---------------
PU3LIC UTILITIES5------------WHOLESALE T R A D E -------------RETAIL T R A D E -----------------FINANCE6----------------------S E R V I C E S ---------------------
LABORERS, MATERIAL H A N D L I N G ----MANUFACTURING------------------NONMANUFACTURING --------------
PUBLIC UTILITIES5------------WHOLESALE T R A D E -------------RETAIL TRADE ----------------S E R V I C E S ---------------------
ORDER F I L L E R S --------------------MA NUFACTURING-----------------NONMANUFACTURING --------------
PUBLIC UTILITIES5------------WHOLESALE TRADE -------------RETAIL T R A D E ----------------
See footn otes at end of ta b le .
220-617 0 - 66 -4
Digitized for FRASER http://fraser.stlouisfed.org/ Federal Reserve Bank of St. Louis

46
Table A-12. Custodial and Material Movement Occupations—United States---- Continued
(Average straight-time hourly earnings for selected occupations by industry division in ail metropolitan areas, February 1965*)
Hourly earnings 3 Number of workers receiving straight-time hourly earnings of—
Numberof
$ $ $ $ $ $ $ $ * $ % S % $ $ * S $
Occupation2 and industry divisionMean4
Under 1.00 1.10 1.20 1.30 1.40 1.50 1.60 1.70 1.80 2.00 2.20 2.40 2.60 2.80 3.00 3.20 3.40 3.60woikers Median4 Middle range4 $ and and1.00 under
1.10 1.20 1.30 1.40 1.50 1.60 1.70 1.80 2.00 2.20 2.40 2.60 2.80 3.00 3.20 3.40 3.60 over$2.28
$2.35
$ $ 1.91- 2.69 813 1575 1380 1993 2305 1755 4424 5384 6011 7720 7237 5542 1229 528 208 415
MANUFACTURING--------------------- 33,812 2.31 2.38 1.96- 2.67 1.78- 2.74 88
384429
971603
811569
1229763
15 91 715
1100655
30231402
38441539
43691642
60211699
56011637
29952547
884346
408120
17236
4096
WHOLESALE TRADE ---------------- 11,469 2.29 2.38 1.87- 2.78 - - - 256 362 329 563 455 439 972 1260 1195 1447 1536 2373 183 99 1 1RETAIL TRADE -------------------- 3,086 1.96 1.89 1.52- 2.33 - 5 88 173 229 231 191 237 216 369 238 420 236 97 174 163 17 - 5
PACKERS* SHIPPING ( W O M E N ) ---------- 18,667 1.86 1.79 1.51- 2.15 _ 17 64 1003 1765 1674 1379 1937 1753 2578 2237 1817 763 1325 189 83 46 22 13MANUFACTURING --------------------- 14,030 1.89 1.80 1.52- 2.21 - - - 679 1417 1277 809 1371 1527 1682 1677 1344 705 1265 116 79 46 22 13NONMANUFACTURING----------------- 4,638 1.77 1.71 1.50- 2.02 - 17 64 324 349 397 570 566 227 897 559 473 58 60 73 5 - - -
WHOLESALE T R A D E ---------------- 1,594 1.82 1.78 1.56- 2.02 - - - 88 21 162 220 272 47 377 159 121 25 53 50 - - - -RETAIL TRADE -------------------- 2,878 1.72 1.68 1.43- 1.99 - 17 64 237 328 231 345 272 178 519 400 221 32 7 23 5 - -
RECEIVING CLERKS --------------------- 24,135 2.46 2.53 2.12- 2.85 5 _ 10 133 153 379 567 715 757 1973 2597 2620 3459 3896 3847 1957 717 191 159MA NUFACTURING--------------------- 11,961 2.57 2.62 2.31- 2.89 - - - 12 44 81 130 214 206 635 963 1403 2102 2356 2264 1021 280 139 105NONMANUFACTURING----------------- 12,175 2.36 2.38 1.95- 2.80 5 - 10 121 109 299 437 501 551 1338 1633 1211 1357 1541 1583 936 437 52 54
PUBLIC UTILITIES5--------------- 864 2.792.36
2.772.41
2.67- 2.92 1.95- 2.83
~11 49 181 157
2162
2245
2594
41629
5412
81572
365528
240842
31360
31163
219
13
RETAIL T R A D E -------------------- 6,018 2.31 2.29 1.92- 2.70 - - 9 99 55 116 259 302 2 82 703 913 768 665 627 450 466 236 29 39S E R V I C E S ------------------------- 319 2.26 2.26 1.77- 2.84 5 1 11 2 l 17 29 20 32 41 22 37 16 50 28 6 2 2
SHIPPING CLERKS ----------------------U All 1 1 r A TTI in Tkli"' . .
15,980 2.58 2.602.63
2.28- 2.94 2.34- 2.94
- - - 1511
5611
4321
14059
213120
321162
934500
1552 19641275
27412021
24041742
26821831
16061014
909605
219187
183153H ANU rAC* I UK INvj — —
Ainiiu AiiitCArTiin tAir 5,’383 2.528886642.54 2.15- 2.93 45 22 81 93 160 434 690 720 662 852 592 304 32 30nunnAnurAt i u k inu 4
uuni CC Al C TD Anc .... 3,738 2.52 2.58 2.16- 2.92 29 10 55 74 105 302 422 44 8 480 519 721 3 70 179 22M rtUL CoAL C IKAUtD CTA II TD AHC 3
231,406 2.49 2.44 2.12- 2.95 16 12 26 19 54 129 166 229 194 120 126 175 102 10K 1 1 A 11> 1 K AU C
eurnnnir Aim n rr c: to uin ri r nw r
4
112.59 2.65 2.26- 2.89 253 38 8 882 1656 2070 2100 3049 2782 1668 820 374 280onlr rllib ANU KCUClv INb ILtKAo 1 o £ 3£MANUFACTURING --------------------- 9,976 2.56 2.63 2.27- 2.85 - - - - - 46 144 85 245 5 37 990 1373 1355 1994 1899 682 273 188 166NONMANUFACTURING----------------- 6,673 2.63 2.70 2.26- 3.03 - - 16 11 4 18 109 147 143 346 667 697 745 1055 883 987 547 186 115
PUBLIC UTILITIES5 --------------- 751 2.83 2.82 2.71- 2.97 - - - - - - — - 2 10 7 4 104 213 256 87 45 23 -WHOLESALE T R A D E ---------------- 3,320 2.72 2.75 2.33- 3.13 - - - - - 8 42 60 75 121 270 416 322 515 276 553 405 151 109RETAIL TRADE -------------------- 2,135 2.46 2.53 2.10- 2.92 - - 16 7 4 10 63 76 53 172 307 230 271 229 322 278 84 11 3S E R V I C E S ------------------------- 436 2.48 2.49 2.13- 2.80 4 3 11 13 40 74 46 44 94 23 68 14 1 3
TRUCKDRIVERS7 ------------------------- 227,949 2.85 3.10 2.60- 3.25 141 227 565 3461 3839 3206 3765 3206 3011 6569 7425 8841 12345 19772 20487 57972 54915 12557 5644MANUFACTURING--------------------- 59,492 2.78 2.84 2.36- 3.19 15 - 88 487 896 1030 1253 1133 1126 2680 2821 4252 43B2 7959 7507 9745 6618 3136 4365NONMANUFACTURING ----------------- 168,457 2.88 3.13 2.69- 3.26 126 227 477 2574 2942 2176 2513 2072 1886 3890 4604 4590 7964 11813 12981 48228 482 98 9421 1279
PUBLIC UTILITIES5 --------------- 94,844 3.09 3.18 3.09- 3.28 - - - 34 81 3 215 304 339 940 1315 980 2558 5182 5247 36424 3 7400 3666 159WHOLESALE T R A D E ---------------- 46,298 2.66 2.87 2.21- 3.22 18 - 48 1825 1622 1315 1095 1257 803 1941 1549 2057 3530 4314 4373 7565 8611 3987 386RETAIL TRADE -------------------- 20,823 2.54 2.81 1.89- 3.14 15 92 347 954 1045 684 775 407 515 748 1167 988 1238 1366 2854 3503 2199 1219 710FINANCE6-------------------------- 298 2.30 2.46 1.99- 2.67 1 - - 4 2 26 13 5 4 20 24 35 43 99 15 8 - - -S E R V I C E S ------------------------- 6,196 2.38 2.51 1.80- 2.93 92 134 82 158 194 145 415 99 225 243 550 531 595 854 491 729 87 550 24
TRUCKDRIVERS, LIGHT (UNDER1-1/2 T O N S ) ----------------------- 24,756 2.34 2.40 1.70- 3.03 110 214 407 1325 1257 1147 1016 692 820 1931 1776 1662 1969 2160 1601 3012 2464 1151 43MANUFACTURING--------------------- 7,364 2.49 2.56 2.01- 3.03 - - - 120 233 290 277 244 201 459 551 62 0 876 806 724 565 1168 197 34NONMANUFACTURING------------------ 17,392 2.28 2.27 1.57- 3.C3 110 214 407 1205 1C24 857 739 448 619 1472 1225 1043 1094 1354 878 2447 1296 954 9
PUBLIC UTILITIES5--------------- 3,699 3.03 3.14 2.91- 3.25 - - - - 9 - 10 4 12 41 43 115 265 357 184 1338 896 417 8WHOLESALE T R A D E ----------------n err a v i rn a r\ e ...
6,493 2.111.83
1.941.61
1.53- 2.63 1.32- 2.27
1815 92
48286
602452
411499
446306
307256
2 89 123
324151
1027226
530323
414307
406135
35269
141297
423223
38119
37612 1K cl A IL IKAUt
SE R V I C E S ------------------------- 3,129 2.27 2.38 1.64- 2.91 76 122 73 147 104 92 159 27 128 160 316 173 205 505 241 455 - 149 -
TRUCKDRIVERS, MEDIUM (1” 1 /2 TOAND INCLUDING A TONS) ----------- 86,907 2.79 3.04 2.50- 3.20 31 13 116 1812 2046 1642 1711 1468 1239 2034 3119 3896 5568 8152 7774 24970 16434 2667 2217MANUFACTURING--------------------- 21,939 2.76 2.83 2.27- 3.18 15 - 45 320 535 525 384 574 616 890 114? 1690 1327 2417 2783 3551 2199 904 2024NONMANUFACTURING------------------ 64,968 2.80 3.09 2.58- 3.20 16 13 71 1492 1512 1117 1328 894 623 1144 1978 2207 4240 5734 4991 21419 14236 1763 193
PUBLIC UTILITIES5--------------- 37,183 3.04 3.15 3.02- 3.22 - - - - 67 3 196 15 78 274 790 482 1544 2885 2088 17285 10769 627 84WHOLESALE T R A D E ---------------- 19,023 2.58 2.79 2.08- 3.17 - - - 995 921 717 495 626 234 444 606 82 3 1858 1883 1804 3242 3255 1057 62RETAIL T R A D E -------------------- 6,584 2.26 2.34 1.59- 2.89 - - 61 486 433 331 3 75 193 276 347 385 562 503 679 927 7 74 156 62 38S E R V I C E S ------------------------- 2,120 2.27 2.36 1.76- 2.65 16 13 10 11 90 53 256 60 36 78 187 340 328 267 173 118 56 18 9
See footnotes at end o f ta b le .
Digitized for FRASER http://fraser.stlouisfed.org/ Federal Reserve Bank of St. Louis

47
Table A-12. Custodial and Material Movement Occupations—United States— Continued
(A v era g e s tra ig h t- t im e h o u rly earn in g s fo r se le c te d occupations by in d u s try d iv is io nin a ll m etro p o lita n a re a s , F e b ru a ry 1965 *)
Hourly earnings Number of workers receiving straight-time hourly earnings of—
$ s S t $ i $ $ * i $ % $ S $ $ $ S
Occupation1 2 3 and industry division of Under 1.00 1.10 1.20 1.30 1.40 1.50 1.60 1.70 1.80 2.00 2.20 2.40 2.60 2.80 3.00 3.20 3.40 3.60w o rkers M e a n 4 M e d ia n 4 M id d le r a n g e 4 6 $ and
1.00 under and
1.10 1.20 1.30 1.40 1.50 1.60 1.70 1.80 2.00 2.20 2.40 2.60 2.80 3.00 3.20 3.40 3.60 over
TRUCKDRIVERS7 - CONTINUED
TRUCKDRIVERS. HEAVY (OVER 4 TONS, $ $ $ $TRAILER T Y P E ) --------------------- 68,411 3.07 3.19 3.01- 3.33 - - 167 272 121 311 552 515 967 1295 1288 2135 3784 5321 18 746 26059 5530 1350MANUFACTURING --------------------- 10,745 2.88 2.99 2.62- 3.23 - - - 27 59 63 98 175 164 314 313 552 795 15C0 1353 2348 1478 985 521NONMANUFACTURING----------------- 57,666 3.10 3.21 3.08- 3.33 ~ - - 140 212 58 213 377 350 653 983 735 1340 2285 396 8 16399 24581 4545 829
PUBLIC UTILITIES5--------------- 36,819 3.17 3.24 3.14- 3.34 - - 34 - - - 10 118 340 319 272 206 818 1442 11893 19344 1966 56WHOLESALE TRADE ---------------- 13,294 2.93 3.11 2.73- 3.27 - - - 106 191 40 110 300 175 203 330 373 86 7 981 1597 2950 3533 1414 126RETAIL TRADE -------------------- 7,385 3.06 3.17 2.87- 3.39 ~ ~ 21 18 103 67 58 110 326 84 231 470 889 1540 1703 1120 647
TRUCKDRIVERS, HEAVY (OVER 4 TONS,OTHER THAN TRAILER T Y P E ) -------- 25,704 2.90 3.04 2.63- 3.26 ~ - - 38 114 193 568 119 250 1159 961 1426 1204 3899 2379 4 726 5179 ‘ 2180 1311MANUFACTURING--------------------- 11,770 2.79 2.76 2.28- 3.18 ~ - - 20 58 152 440 92 56 863 710 1017 708 2467 928 1530 996 568 1215NONMANUFACTURING----------------- 13,934 3.00 3.15 2.82- 3.28 - - - 18 56 42 127 26 194 296 251 408 497 1432 1451 3196 4233 1612 96
PUBLIC UTILITIES5--------------- 6,900 3.08 3.20 3.04- 3.27 ~ ~ - - - 5 - 131 65 20 67 115 622 519 1923 2 924 509 _WHOLESALE TRADE ---------------- 5,272 2.96 3.10 2.72- 3.37 ~ ~ ~ 12 25 23 94 20 - 184 73 295 274 733 529 318 1038 1082 72RETAIL T R A O E -------------------- 1,601 2.83 2.98 2.60- 3.16 ~ ~ ~ 5 30 19 28 1 3 46 128 35 108 73 379 455 246 21 24
TRUCKERS, POWER (FORKLIFT)--------- 84,197 2.61 2.70 2.35- 2.89 - - 46 379 1078 1185 764 1151 1309 2885 4596 10937 11021 16156 21000 6219 2814 1452 1207MANUFACTURING--------------------- 66,680 2.60 2.68 2.35- 2.86 - 43 183 551 779 455 686 981 1992 3878 10019 9434 14037 17595 3125 1009 793 1122NONMANUFACTURING----------------- 17,517 2.64 2.82 2.33- 3.07 - 3 196 527 406 309 465 32 8 892 718 919 1587 2119 3405 3094 1805 659 85
PUBLIC UTILITIES5--------------- 5,095 2.72 2.95 2.44- 3.18 ~ - 13 257 34 59 95 153 350 71 144 505 443 590 1242 895 243 _WHOLESALE TRADE ---------------- 8,023 2.56 2.74 2.23- 2.98 ~ - - 55 213 295 243 342 154 390 221 459 85 8 1239 1670 1128 345 353 18RETAIL T R A D E -------------------- 4,165 2.72 2.88 2.36- 3.06 ~ 3 86 57 77 8 19 21 119 408 312 195 387 1074 722 553 63 61
TRUCKERS, POWER (OTHER THANFO RK L I F T ) ---------------------------- 19,156 2.63 2.67 2.40- 2.84 ~ - 7 3 88 147 268 183 161 648 939 2296 3318 5373 2 906 919 1426 255 221
MA NUFACTURING--------------------- 15,450 2.63 2.71 2.37- 2.86 ~ ~ - 61 147 217 122 154 614 887 2115 1669 4375 2803 836 1010 228 214NONMANUFACTURING----------------- 3, 706 2.61 2.58 2.50- 2.68 - - 7 3 28 - 51 61 7 35 52 181 1649 997 103 83 416 27 7
PUBLIC UTILITIES5--------------- 2,869 2.54 2.57 2.50- 2.64 - - 3 2 - 42 50 2 2 20 158 1541 985 39 2 24 - _RETAIL T R A O E -------------------- 377 2.76 3.07 2.20- 3.33 ~ ~ 7 ~ 26 2 10 2 33 14 23 14 4 44 54 138 - 7
1 Average month of reference. Data were collected during the period July 1964 through June 1965.2 Data limited to m e n workers except where otherwise indicated.3 Excludes premium pay for overtime and for work on weekends, holidays, and late shifts.4 For definition of terms, see footnote 3, table A-l.5 Transportation, communication, and other public utilities.6 Finance, insurance, and real estate.7 Includes all drivers regardless of size and type of truck operated.
Digitized for FRASER http://fraser.stlouisfed.org/ Federal Reserve Bank of St. Louis

48
Table A-13. Custodial and Material Movement Occupations—Northeast
(A v era g e s tra ig h t- t im e h o u rly earn in g s fo r s e le c ted occupations by in d u s try d iv is io nin the N o rth e a s t ,1 F e b ru a ry 1 9 6 5 2 )
Occupation3 and industry division
ELEVATOR OPERATORS, PASSENGER —MA NU FA CT UR IN G-----------------NONMANUFACTURING--------------
RETAIL T R A D E ----------------FINANCE6----------------------S E R V I C E S ---------------------
ELEVATOR OPERATORS, PASSENGER(WOMEN) ---------------------------
NONMANUFACTURING --------------RETAIL T R A D E ----------------
GUARDS AND W A T C H M E N --------------MANU FA CT UR IN G-----------------NONMANUFACTURING--------------
GUARDS:MA NU FA CT UR IN G-----------------
WATCHMEN:MANUFACTURING ------------------
JANITORS, PORTERS, AND CLEANERSM A N U F A C T U R I N G -------------------------------------------NONMANUFACTURING--------------
PUBLIC UTILITIES7------------WHOLESALE T R A D E ------------RETAIL T R A D E ----------------FINANCE6----------------------S E R V I C E S ---------------------
JANITORS, PORTERS, AND CLEANERS(WOMEN) ---------------------------
MA NU FA CT UR IN G-----------------NONMANUFACTURING--------------
PUBLIC UTILITIES7-----------RETAIL T R A D E ----------------FINANCE6----------------------SERVICES ---------------------
LABORERS, MATERIAL H A N D L I N G ----MANUFACTURING------------------NONMANUFACTURING--------------
PUBLIC UTILITIES7------------WHOLESALE TRADE -------------RETAIL T R A D E ----------------
ORDER F I L L E R S --------------------MANUFACTUR I N G -----------------NONMANUFACTURING --------------
WHOLESALE T R A D E -------------RETAIL T R A D E ----------------
PACKERS, S H I P P I N G ----------------MANUFACTURING ------------------NONMANUFACTURING--------------
WHOLESALE TRADE -------------RETAIL TRADE ----------------
Hourly earnings Number of workers receiving straight-time hourly earnings of—i $ $ $ $ $ $ $ $ $ $ $ $ $ $ $ $ $
TTnrl >=-r 1 . 1 0 1 . 2 0 1.30 1.40 1.50 1.60 1.70 1.80 1.90 2 .0 0 2 .2 0 2.40 2.60 2.80 3.00 3.20 3.40 3.60workers Mean3 Median5 Middle range 5 $ and and
1 . 1 0 under
1 . 2 0 1.30 1.40 1.50 1.60 1.70 1.80 1.90 2 .0 0 2 .2S 2.40 2.60 2.80 3.00 3.20 3.40 3.60 over
$ $ $ $4,116 2 .0 0 2.05 1.78- 2.31 6 37 229 134 69 250 224 97 158 1 1 2 1564 956 207 55 7 10 — — 1
329 2 . 1 0 2.23 1.85- 2.37 - - 5 19 8 18 1 1 8 26 1 1 37 12 0 61 4 - - - - 13,786 1.99 2.05 1.77- 2.30 6 37 224 115 61 231 213 89 132 1 0 1 1527 836 146 51 7 10 - - -
500 1.62 1.58 1.31- 1.78 - 24 95 46 46 46 71 61 2 1 16 15 29 29 1 - - - - -2,146 2.08 2.07 2.01- 2.33 - - 1 39 3 119 125 19 94 36 960 678 49 23 - - - - -
920 1 . 8 8 2.03 1.58- 2.08 6 13 1 2 1 31 1 2 60 14 8 16 49 495 92 3 ~ ~ ~ ~
2,117 1.58 1.47 1.25- 2.01 87 287 334 251 140 119 1 1 0 1 1 1 43 78 475 54 22 5 1 _ _ _ _
1,992 1.56 1.43 1.24- 2.01 87 287 334 247 139 115 97 94 33 37 446 49 22 4 1 - - - -830 1.38 1.31 1.19- 1.46 9 215 180 154 105 34 55 19 1 22 16 16 4 - -
29,667 1.96 1.95 1.41- 2.46 10 31 3461 3564 2515 1724 1226 853 996 843 2583 3639 3244 2851 1330 630 117 36 1312,024 2.30 2.34 2.02- 2.71 - - 225 337 450 253 450 270 624 325 1582 1936 1887 2198 896 512 35 36 1017,643 1.73 1.52 1.34- 2.19 10 31 3236 3227 2066 1471 776 584 373 518 10 0 1 1704 1356 654 434 118 82 ~ 3
7,668 2.50 2.54 2.25- 2.76 - - - 36 56 54 85 78 161 145 938 1229 1463 2085 774 485 34 34 10
4,356 1.94 1.92 1.58- 2.27 - - 225 3C2 393 199 36 5 192 463 180 643 706 423 114 12 2 27 1 2 -
65,744 2 . 0 1 2.06 1.70- 2.32 150 217 2635 2578 2889 4662 3009 4073 3390 3991 13221 14669 6271 2642 655 146 14 116 192 8,379 2.14 2 .2 0 1.89- 2.40 - - 361 547 862 1257 1241 1307 1604 1780 5296 6967 42 85 2162 442 128 12 1 1 1 173 7,366 1.91 1.98 1.57- 2.27 150 217 2274 2432 2027 3404 1768 2766 1785 2 2 1 1 7925 7701 1986 480 213 18 2 5 24,664 2.28 2.32 2.13- 2.46 - - 30 13 9 75 42 161 186 153 795 1628 1154 284 12 2 13 - - -1 ,2 2 0 1.90 1.91 1.55- 2.20 - - 84 63 87 137 59 86 89 45 263 162 87 55 1 2 1 — -6,476 1.63 1.56 1.36- 1.82 4 10 2 927 919 755 853 696 544 365 375 422 2 96 76 54 77 3 1 5 27,988 1.96 2 . 0 1 1.74- 2.20 - 7 343 246 271 498 409 544 587 883 2195 1651 278 66 10 - - - -
17,017 1.89 2 .0 0 1.56- 2.22 146 107 891 1191 906 1841 562 1431 558 756 4250 3965 392 2 1 2 ~ -
24,674 1.77 1.84 1.56- 1.95 1 2 1 198 1 1 1 2 1206 232C 2094 1374 1818 4870 6834 1395 862 370 72 30 _3,237 1.97 2 . 0 1 1.74- 2.19 - - 64 2 12 143 155 144 239 305 283 938 414 294 47 - - - _ _
21 ,437 1.74 1.83 1.54- 1.93 1 2 1 198 1C48 594 2177 1939 1230 1578 4565 6551 457 448 76 25 30 - - _ _1,484 1 . 8 8 1 . 8 8 1.71- 2.00 - - 7 1 1 15 229 106 50 394 302 118 194 57 1 - - - - _1,161 1.45 1.37 1.25- 1.63 9 142 262 233 108 76 155 52 40 33 26 19 6 - _ - - _ _8,169 1 .6 6 1.67 1.49- 1.89 17 52 464 206 1455 1437 663 812 1175 1736 145 5 3 - _ - _ _ _
10,421 1.81 1.89 1.80- 1.95 95 4 274 531 571 177 281 612 2 952 4470 161 230 10 24 30 - - - -
64,218 2.45 2.52 2.10- 2.84 _ 200 768 1016 95 8 1894 1792 1797 2342 2195 7606 6470 8534 9643 12343 4672 333 402 125533,056 2.34 2.31 2.00- 2.65 - - 140 421 543 12 2 0 1335 1246 1453 1917 5816 4631 4747 4916 2481 524 184 316 116731,162 2.56 2.74 2.35- 2.93 - 200 628 595 415 674 457 551 889 278 1790 1839 3787 4727 9862 4148 149 86 8816,078 2 .8 6 2.90 2.78- 3.00 - - - - - - - - 1 - 2 1 75 2057 2044 7949 3879 4 49 -7,576 2.34 2.50 2.03- 2.69 - - 296 126 71 175 85 303 528 94 827 783 1148 2098 833 71 130 _ 1 17,101 2.15 2.18 1.62- 2.66 - 200 313 445 304 449 349 245 330 147 900 929 514 578 1072 198 15 37 77
19,120 2.45 2.47 2 .10- 2.82 _ 14 61 206 342 437 576 602 556 692 2142 2507 3507 2382 3057 1113 431 78 4178,832 2.35 2.41 2.04- 2.62 - 14 47 84 227 296 326 367 319 264 1050 12 83 2209 1098 509 388 133 14 204
10,288 2.53 2.60 2.19- 2.91 - - 14 12 2 115 141 250 235 237 428 1091 1224 1299 1284 2548 725 298 64 2136 , C81 2.43 2.44 2.11- 2.76 - - 14 94 58 103 127 145 180 290 888 927 1132 730 782 271 279 _ 623, 897 2.70 2 .8 6 2.49- 2.97 - 24 48 31 115 73 48 128 175 286 133 518 162 9 454 19 64 151
16,025 2.19 2.19 1.87- 2.47 - 29 173 421 356 695 882 735 989 1144 2652 2418 2 864 1407 532 281 175 67 19612,310 2 .2 2 2 . 2 1 1.92- 2.49 - - 85 271 298 504 579 478 699 1019 2 1 1 2 1631 2491 1067 394 248 171 67 1963,716 2.08 2.13 1.74- 2.38 - 29 88 160 58 191 303 258 291 125 540 787 373 340 138 33 4 -2,445 2.15 2.19 1.84- 2.43 - - 15 65 9 128 163 157 189 68 456 528 254 294 98 18 3 - -1,235 1.93 1 . 8 8 1.61- 2.28 29 73 89 46 63 137 1 0 1 95 56 75 255 119 42 40 15 1
See footn otes a t end of tab le .
Digitized for FRASER http://fraser.stlouisfed.org/ Federal Reserve Bank of St. Louis

49
Table A-13. Custodial and Material Movement Occupations—Northeast Continued
(A v era g e s tra ig h t- t im e h o u rly earn ing s fo r se le c ted occupations by in d u stry d iv is io nin the N o rth e a s t ,1 F e b ru a ry 1965 2 )
Hourly earnings' N umber o f w o rk e rs eceiving itra ig h t- t im e h o u rly earn in g s of—
Occupation3 and industry division
PACKERS, SHIPPING (WOMEN) ----------MANUFACTURING ---------------------NONMANUFACTURING-----------------
RETAIL TRADE --------------------
RECEIVING CLERKS ---------------------MA NUFACTURING---------------------NONMANUFACTURING-----------------
WHOLESALE TRADE ----------------RETAIL T R A D E --------------------
SHIPPING CLERKS ----------------------MA NU FA CT UR IN G---------------------NONMANUFACTURING -----------------
WHOLESALE TRADE ----------------RETAIL T R A D E --------------------
SHIPPING AND RECEIVING C L E R K S -----MANUFACTURING---------------------NONMANUFACTURING------------------
WHOLESALE T R A D E ----------------RETAIL TRADE --------------------
TRUCK DRIVERS8 ------------------------MANUFACTURING---------------------NONMANUFACTUR I N G -----------------
PUBLIC UTILITIES7---------------WHOLESALE T R A D E ----------------RETAIL TRADE --------------------S E R V I C E S ------------------------
TRUCK DR IVERS , LIGHT (UNDER1-1/2 T O N S ) -----------------------MANUFACTURING---------------------NONMANUFACTURING-----------------
PUBLIC UTILITIES7---------------WHOLESALE T R A D E ----------------RETAIL T R A D E --------------------S E R V I C E S -------------------------
TRUCKDR IVERS, MEDIUM I 1-1/2 TOAND INCLUDING 4 TONS) -----------MANUFACTURING ---------------------NONMANUFACTURING-----------------
PUBLIC UTILITIES7---------------WHOLESALE TRADE ----------------RETAIL T R A D E --------------------
TRUCKDRIVERS, HEAVY (OVER 4 TONS,TRAILER TYPE) ---------------------MANUFACTURING---------------------NONMANUFACTURING-----------------
PUBLIC UTILITIES7---------------WHOLESALE TRADE ----------------RETAIL TRADE --------------------
TRUCKDRIVERS, HEAVY (OVER 4 TONS,OTHER THAN TRAILER T Y P E ) --------MA NU FA CT UR IN G---------------------NONMANUFACTURING-----------------
PUBLIC UTILITIES7---------------WHOLESALE TRADE ----------------
Numberof
workers
$ $ $ $ $ $ $ $ $ $ $ $ $ $ $ $ $ $
M ean 5 Median 5 Middle r ange5
1 . 1 0Under t and 1 . 1 0 under
1 . 2 0 1.30 1.40 1.50 1.60 1.70 1.80 1.90 2 .0 0 2 . 2 0 2.40 2 . 6 0 2 . 80 3.00 3.20 3.40 3 . 6 0
and
1 . 2 0 1.30 1.40 1.50 1 . 60 1.70 1.80 1.90 2 .0 0 2 .2 0 2.40 2 . 6 0 2.80 3.00 3.20 3.40 3.60 over
5,387$1.73
$1.64
$ $ 1.46- 2.00 273 694 686 691 802 260 203 420 696 295 2 1 4 10 1 2 0 19 5 3 3
3,989 1.74 1.65 1.46- 2.00 - - 100 567 552 457 685 188 133 292 475 2 0 7 2 1 0 84 3 19 5 3 31,398 1.71 1.63 1.44- 1.99 - - 173 127 134 234 117 72 70 128 222 8 8 4 17 12 - - - -1,124 1.73 1.69 1.45- 2.01 - 10 1 124 108 164 72 66 66 125 193 8 8 4 - 12 “ “
7,072 2.42 2.46 2.09- 2.75 9 31 26 93 140 226 288 314 298 900 864 1185 1142 867 402 163 23 1 0 23,798 2.49 2.50 2.23- 2.75 - - 4 - 32 38 92 104 98 127 377 6 0 3 780 744 42 8 208 87 18 593,274 2.34 2.36 1.93- 2.75 9 27 26 61 10 2 135 184 216 171 523 260 405 398 439 194 76 5 431,140 2.38 2.45 2 .02- 2.82 - - 4 1 1 17 35 17 61 49 70 2 2 1 54 2 1 0 89 216 34 49 4 -1,826 2.29 2.23 1 .86- 2.68 9 19 13 44 64 107 115 157 97 269 1 9 0 171 223 161 1 31 20 1 35
5,390 2.54 2.53 2.23- 2.90 - 1 2 12 27 50 10 1 138 157 133 590 7 3 6 1048 826 700 438 297 74 503,774 2.53 2.51 2.25- 2.84 - - 1 1 1 1 16 31 71 84 119 89 360 577 792 602 432 3 00 172 69 381,616 2.55 2.58 2.17- 2.95 - l 1 1 1 20 30 54 37 43 230 159 256 225 269 138 125 5 12
944 2.63 2.64 2.34- 2.95 - - - - 3 17 10 - 9 12 2 9 8 172 183 203 46 77 2 3610 2.44 2.40 2.00- 2.98 " 1 1 1 1 17 12 43 37 32 94 56 70 30 66 84 46 3 7
5,278 2.44 2.48 2.15- 2.76 _ 4 1 20 85 129 207 174 159 720 897 872 854 579 400 1 10 50 1 63,359 2.39 2.37 2.11- 2.69 - - - - 20 55 70 152 118 104 515 743 543 456 278 197 54 40 161,919 2.53 2.61 2 .21- 2.86 - - 4 1 - 30 59 55 57 55 206 154 329 399 302 203 57 10 -
811 2.64 2 .6 8 2.44- 2.88 - - - - - - - 13 2 14 97 61 150 243 69 123 34 1 -812 2.34 2.43 1.97- 2.68 4 1 - 30 58 40 44 39 105 72 152 106 118 3 1 12 1 “
68,645 3.03 3.12 2.81- 3.27 23 64 159 242 359 299 403 1080 484 1293 2144 3800 6335 7292 19458 18855 2486 387118,905 3.04 2.93 2.57- 3.28 - 14 18 84 158 193 197 251 350 859 1232 1605 2727 2455 2496 2336 577 335249, 740 3.02 3.14 2.95- 3.26 23 50 141 158 2 0 1 106 205 829 134 434 913 2196 3608 4837 16960 16519 1909 5193 0,5 29 3.11 3.17 3.06- 3.27 - - - - - 2 6 296 16 23 93 555 1379 2438 12 841 12661 142 7914,466 2.94 3.06 2.74- 3.27 - - 24 76 62 127 43 104 428 42 186 382 1182 1578 1631 3335 3416 1715 1343»6C5 2.77 2.94 2.38- 3.12 23 13 56 78 65 53 94 62 29 135 308 250 301 692 677 411 52 3061 , 0 1 0 2.46 2.57 2.22- 2.73 13 9 18 9 7 “ 42 45 84 1 2 2 180 267 62 1 0 0 31 —
4,735 2.50 2.56 2.07- 2.95 23 44 67 85 162 133 1 0 1 241 167 385 442 688 748 410 370 276 361 341,896 2.41 2.45 2.06- 2.75 - - 14 4 45 91 90 13 68 85 225 2 2 2 377 243 89 163 133 1 342, 840 2.56 2.64 2.09- 3.00 23 30 63 40 71 43 88 173 82 161 2 2 0 312 505 321 207 143 360 -
746 2.74 2.75 2.56- 3.01 - - - - - - 2 6 19 3 1 2 34 165 186 125 125 69 - -894 2.73 3.10 1.88- 3.44 - - 4 36 14 44 13 33 105 28 36 28 30 16 16 58 74 360 -552 2.23 2.24 1.74- 2.91 23 13 26 12 22 24 48 7 10 53 97 43 13 144 17 - - -529 2.34 2.58 2.03- 2.67 _ - 13 14 5 2 ~ 42 39 56 53 50 234 2 2 ~ “ “
25,242 3.04 3.08 2.81- 3.24 _ _ 20 76 134 71 56 106 200 199 545 984 1503 2 2 22 3145 8034 5622 704 16227,492 3.16 3.02 2.65- 3.35 - - - 1 1 39 12 41 69 12 0 170 340 550 335 937 1060 1067 1032 2 2 1 1487
17,75 0 2.99 3.08 2.92- 3.22 - 20 64 95 59 16 36 79 29 205 434 1168 1286 2085 6967 4590 483 1359,900 3.12 3.13 3.03- 3.24 - - - - - - - - l 8 9 2 0 130 368 1060 4851 3385 - 706,370 2.92 3.04 2.71- 3.22 - - 20 26 25 18 - - 74 9 145 164 788 642 761 1979 1176 480 621,129 2.45 2.59 2.25- 2.87 ~ “ ~ 29 65 36 1 1 36 3 6 28 182 170 227 258 42 29 3 3
20,612 3.11 3.19 3.04- 3.30 _ _ _ _ _ _ 9 41 360 41 86 204 555 1 1 0 2 1809 6522 8916 391 5773,242 2.93 2.94 2.66- 3.20 - - - - - - 5 51 26 78 1 2 1 350 615 641 523 533 15 285
17,370 3.14 3.21 3.10- 3.31 - - - - - - 9 37 309 16 7 83 205 486 1168 5999 8383 3 76 29212,770 3.15 3.22 3.12- 3.32 - - — - - - - 276 - - - - 344 484 4804 6710 142 93,196 3.08 3.20 2.99- 3.28 - - - - - 9 37 33 5 5 56 132 135 392 783 1421 188 -1,345 3.21 3.13 2.99- 3.39 — “ “ ~ ~ 10
'27 35 3 281 4 07 252 46 283
10,077 3.09 3.13 2.76- 3.28 _ _ _ 14 23 64 53 32 206 60 200 326 432 1501 962 2048 2457 633 10693,479 3.26 3.11 2.71- 4.10 - - - - - 3 3 29 - 52 144 157 251 561 351 578 346 1 9776,598 3.00 3.13 2.80- 3.27 - - 14 23 64 20 3 206 8 56 169 181 938 610 1471 2 1 1 1 632 923,054 3.09 3.20 3.05- 3.25 - - - - - - - - 5 2 32 42 227 252 9 5 0 1544 - -3,147 2.93 3.01 2.71- 3.35 — ~ 14 2 3 64 20
'165
' "135 139 651 327 477 431 629 72
See footnotes a t end of tab le .
Digitized for FRASER http://fraser.stlouisfed.org/ Federal Reserve Bank of St. Louis

50
Table A-13. Custodial and Material Movement Occupations—Northeast----Continued
(Average straight-time hourly earnings for selected occupations by industry division in the Northeast, 1 February 1965 2)
Occupation3 and industry division
H o u rly e a rn in g s4
M e d ia n 5 6
Number of workers receiving straight-time hourly earnings of—
Under$1.10
$1.10and
under
S1.20 $1.40
$1.60
$1.70
~I-----1.80
*2.00 $2.20 %2.40
S3.00
% $ 3.20 3.
S3.60
TRUCKERS* POWER (FORKLIFT)MANUFACTURING-----------NONMANUFACTURING-------
PUBLIC UTILITIES7 8----WHOLESALE TRADE -----RETAIL T R A D E ---------
$ $ $19,53415,1014,4331,3481,8381,213
2.632.582.803.032.652.79
2.632.532.903.062.732.93
2.32- 2. 28- 2. 66- 2.91- 2.52- 2.73-
1.20
$2.892.813.033.212.913.02
1.30 1.4C 1.50 1.60 1.70 1.80 1.90
oo.(M 2.20 2 . 4 0 2 . 6 0 2 . 8 0 3 . 0 0 3 . 2 0 3 . 4 0
14 73 67 138 160 188 308 1669 3 8 0 7 2 9 5 2 3 5 0 3 3 8 2 4 1 3 9 8 5 7 9- 5 - 67 129 159 148 268 1493 3 6 2 5 2 5 3 4 2 7 2 5 2 4 1 0 5 4 3 2 0 4- 9 73 - 9 1 40 39 175 1 8 1 4 1 9 7 7 9 1 4 1 4 8 5 0 3 7 5- - - - - - - - 1 1 4 6 9 6 3 3 5 3 4 9 0 3 5 9- - 18 - 9 - 23 34 114 5 6 3 0 3 6 6 6 5 0 1 1 0 8 -- 9 55 - - 1 9 5 58 1 1 0 2 6 4 8 5 5 9 2 5 2 1 6
3.60
176167
9
63
over
68C61961
61
TRUCKERS, POWER (OTHER THANFORKLIFT)-------------------
MANUFACTURING ------------NONMANUFACTURING--------
5,0274,266
761
2.622.632.59
2.592.60 2.58
2.36-2.32-2.52-
2.832.872.66
2020 1 1 28 13 13f 452 752 1147 1130 42 8 260 479 113 631 28 13 103 452 73 9 769 870 415 234 453 113 56
10 “ 27 “ 14 378 260 13 26 26 7
1 For definition of regions, see footnote 3 to the table in appendix A.2 Average month of reference. Data were collected during the period July 1964 through June 1965.3 Data limited to m e n workers except where otherwise indicated.4 Excludes premium pay for overtime and for work on weekends, holidays, and late shifts.5 For definition of terms, see footnote 3, table A-l.6 Finance, insurance, and real estate.7 Transportation, communication, and other public utilities.8 Includes all drivers regardless of size and type of truck operated.
Digitized for FRASER http://fraser.stlouisfed.org/ Federal Reserve Bank of St. Louis

51
Table A-l4. Custodial and Material Movement Occupations—South
(A v e ra g e s tra ig h t- t im e h o u r ly earn in g s fo r se le c te d occupations by in d u s try d iv is io nin the South, 1 F e b ru a ry 1965 2 )
Occupation 3 and industry division
ELEVATOR OPERATORS, PASSENGER---------NONMANUFACTURING ----------------------------
ELEVATOR OPERATORS, PASSENGER
NQNMANUFACTURING ----------------------------RETAIL TRADE--------------------------------FINANCE6-----------------------------------------S E R V I C E S ---------------------------------------
GUARDS AND WATCHMEN----------------------------MANUFACTURING ---------------------------------NONMANUFACTURING----------------------------
GUARDS:MANUFACTURING ---------------------------------
WATCHMEN:MANUFACTURING---------------------------------
JANITORS, PORTERS, AND CLEANERS-----MANUFACTURING---------------------------------NONMANUFACTURING----------------------------
PUBLIC U T IL IT IE S7------------------------WHOLESALE TRADE --------------------------RETAIL TRADE -------------------------------FINANCE6-----------------------------------------S E R V I C E S ---------------------------------------
JANITORS, PORTERS, AND CLEANERS(WOMEN! ------------------------------------------------
MANUFACTURING ---------------------NONMANUFACTURING ----------------------------
PUBLIC U T IL IT IE S 7------------------------WHOLESALE TR ADE--------------------------RETAIL TRADE--------------------------------FINANCE6-----------------------------------------S E R V I C E S ---------------------------------------
LABORERS, MATERIAL HANDLING------------MANUFACTURING---------------------------------NONMANUFACTURING----------------------------
PUBLIC UT ILITIE S7 ------------------------WHOLESALE TRADE --------------------------RETAIL TRADE-------------------------------
ORDER FILLERS -------------------------------------MANUFACTURING---------------------------------NONMANUFACTURING ----------------------------
WHOLESALE TRAOE --------------------------RETAIL TR ADE-------------------------------
PACKERS, SHIP PING --------------------------------MANUFACTURING---------------------------------NONMANUFACTURING----------------------------
WHOLESALE TRADE --------------------------RETAIL TR A DE-------------------------------
PACKERS, SHIPPING (WOMEN)----------------MANUFACTURING---------------------------------NONMANUFACTURING----------------------------
RETAIL TR ADE-------------------------------
Hourly earnings Numb er of workers receiving straight-time hourly earnings of—
Numberof
$ S $ $ S S $ $ $ $ $ $ $ $ $ $ $ $TTn̂ o-r 1 .0 0 1 . 1 0 1 . 2 0 1.30 1.40 1.50 1.60 1.70 1.80 1.90 2 .0 0 2 .2 0 2.40 2.60 2.80 3.00 3.20 3.40
workers Mean5 Median 5 Middle range5 $ and and1 .0 0 under
1 . 1 0 1 . 2 0 1.3C 1.40 1.50 1.60 1.70 1.80 1.90 2 .0 0 2 .2 0 2.40 2.60 2.80 w o o 3.20 3.40 over$ $ $ $
603 1.08 1 . 2 0 0.67- 1.32 230 27 45 132 105 8 1 2 3 3 1 10 18 10 — — — — — —585 1.06 1.18 .66- 1.31 230 27 45 126 100 7 9 3 3 1 7 18 10 - “
2,332 .97 1 . 1 2 .66- 1.20 977 65 706 364 130 20 22 13 1 2 7 22 3 . . _ _ _2,321 .97 1 . 1 2 .65- 1.20 977 65 706 353 130 20 22 13 1 2 7 22 3 - - - - - -
861 1.17 1.16 1.13- 1.20 15 40 598 156 29 4 1 1 7 - - - - - _ - - - _ _442 1.13 1.18 .99- 1.27 1 1 2 22 108 127 58 6 4 6 - - - - - - - - - - -942 .65 .57 .45- .81 851 3 44 41 1 3 ~ - - - -
14,058 1 .8 6 1.62 1.28- 2.42 196 78 130 3828 1469 564 686 517 337 438 370 902 954 985 619 1139 63 8 100 1087,348 2.16 2 . 2 1 1.50- 2.81 - - 5 860 676 298 415 2 86 156 244 168 547 531 753 528 1073 634 69 1086,709 1.53 1.30 1.24- 1.76 196 78 125 2968 793 266 271 231 181 194 202 356 424 233 92 67 4 31 -
4,348 2.55 2.65 2.24- 2.92 - - - 59 44 79 106 71 79 125 81 357 405 613 517 1004 634 69 108
3,000 1.59 1.43 1.29- 1.79 - - 5 801 632 219 309 215 77 118 88 191 126 140 1 1 69 - - -
44,978 1.54 1.39 1.24- 1.82 2519 1215 3620 10071 5360 3785 2729 2430 1736 1724 1238 2248 2527 1978 1580 200 17 _ _18,C03 1.84 1.75 1.43- 2.25 - - 56 1588 2285 2 1 1 0 1194 1275 1082 1094 716 1558 1744 1595 1526 165 15 - -26,975 1.35 1.27 1.18- 1.48 2519 1215 3563 8483 3075 1675 1536 1155 654 630 522 691 783 383 55 35 2 - -3,683 1.87 1.84 1.57- 2.23 - - 3 164 2 1 1 312 314 537 188 267 334 351 678 282 28 1 1 2 - _1,585 1.55 1.46 1.32- 1.73 - - 18 317 339 188 227 73 76 141 54 39 28 71 12 3 _ - _8,162 1.27 1.23 1.13- 1.39 614 633 2369 1774 793 539 525 319 175 116 69 118 59 30 15 14 _ _ -4,614 1.30 1.29 1.22- 1.39 354 146 258 1796 959 418 300 135 152 42 37 13 4 1 _ _ _ _ _8,932 1.18 1.24 1.13- 1.29 1551 436 915 4431 773 217 169 93 64 64 28 170 15 - - 7 - -
10,473 1.27 1.24 1.16- 1.32 1228 425 1752 4305 e62 509 259 296 160 94 113 168 158 113 30 2 _
1,544 1.61 1.39 1.28- 1.94 - - 2 1 470 307 151 34 49 44 41 10 2 10 7 95 95 29 2 - _ -8,928 1 . 2 1 1.23 1.13- 1.29 1228 425 1731 3835 555 359 224 248 117 53 1 1 62 63 18 1 - - - -
931 1.64 1.59 1.43- 1.71 - - - 75 103 183 113 220 88 24 - 44 63 18 1 _ _ _ _294 1.37 1.27 1.23- 1.34 - - 7 20 1 31 2 2 - 15 18 3 16 _ _ _ - - _ _
1,832 1.16 1 . 1 6 1 .12- 1.21 106 65 1160 315 99 41 35 - 6 3 1 1 _ _ _ _ _3,197 1.13 1 . 2 2 1.01- 1.27 783 229 194 1600 197 113 53 16 6 5 1 1 _ _ _ _ _ _ _2,674 1.16 1.23 1.15- 1.27 340 131 371 1645 125 20 2 1 12 1 3 6 - - - -*
52,349 1.89 1.77 1.41- 2.33 4 24 445 6528 5838 4357 4042 3 009 2705 2387 2305 4433 4852 3994 3679 2592 903 151 1032 8,2 99 1.91 1.83 1.44- 2.27 - - 73 2771 3013 2829 1760 1362 1858 1526 1474 3118 2720 1599 2645 1319 59 86 8824,050 1.87 1.67 1.37- 2.38 4 24 372 3757 2825 1527 2282 1647 847 861 830 1314 2133 2395 1034 1274 844 65 158,419 2.34 2.41 1.93- 2.71 - - - 270 199 269 356 385 344 217 260 280 1491 1647 729 1092 801 65 159, 843 1.55 1.44 1.30- 1.65 - - - 2435 2184 794 1525 810 236 311 162 431 417 337 157 37 7 - -5,668 1.72 1.63 1.30- 2.03 ~ 24 372 1018 427 464 393 451 252 332 409 560 224 412 148 145 36 - -
18,130 1.91 1.83 1.51- 2.32 - - 8 1613 1357 1459 1458 1681 1 1 1 0 1141 874 2220 1196 1887 1093 889 99 14 313,410 2.08 2.06 1.62- 2.49 - - - 136 236 257 183 223 168 178 236 312 281 624 275 187 71 13 31
14,720 1.87 1.79 1.49- 2.21 - - 8 1477 1 1 2 1 12 0 2 1275 1459 94 2 963 639 1908 915 1265 817 702 28 1 _9,225 1.75 1.64 1.40- 2.03 - - - 1372 972 944 947 1058 659 553 282 538 490 802 378 207 23 1 -5,248 2.09 2.05 1.75- 2.43 ~ 8 95 139 256 311 359 264 311 322 1357 425 46 3 439 495 5 "
7,624 1 .8 8 1 .6 8 1.45- 2.40 - 5 54 569 92 4 754 848 845 457 387 350 302 2 2 1 686 499 475 177 9 654 ,67C 1.94 1.70 1.48- 2.48 - - - 285 546 401 482 627 313 172 183 100 167 569 472 105 177 9 652, 954 1.79 1.62 1.41- 2.02 - 5 54 284 378 353 367 218 144 215 167 202 54 116 27 370 _ _ -2,219 1 . 8 6 1.67 1.44- 2.14 - - - 2C7 253 224 300 184 72 196 1 1 1 142 35 10 1 27 370 _ _ _
686 1.55 1.47 1.33- 1.77 “ 5 54 77 118 12 2 62 25 73 19 53 52 12 16 - - - -
3,174 1.55 1.44 1.32- 1.67 - 17 12 576 783 555 191 364 98 135 1 0 1 142 45 100 35 _ 1 18 _
2,702 1.52 1.41 1.32- 1.62 - - - 544 742 534 146 309 84 94 2 1 73 14 87 35 _ 1 18 _
472 1.72 1.79 1.47- 1.99 - 17 12 32 42 2 1 45 55 14 41 80 69 31 13 _ _ _
265 1.67 1.63 1.32- 2.05 17 12 32 33 9 2 1 27 8 17 1 1 43 31 4 - - - -
See footnotes at end of tab le .
Digitized for FRASER http://fraser.stlouisfed.org/ Federal Reserve Bank of St. Louis

52
Table A-l4. Custodial and Material Movement Occupations—South- continued
(A v e ra g e s tra ig h t-t im e h o u r ly ea rn in gs fo r s e le c te d o ccu p a tion s b y in du stry d iv is io nin the South, 1 F e b ru a ry 1965 2)
Hourly earnings N u m ber o f w o rk e r s re c e iv in g s tra ig h t -t im e h o u r ly ea rn in gs o f—
O ccu p a t io n 3 and in d u stry d iv is io n
RECEIVING CLERKS ---------------------------------------MANUFACTURING ---------------------------------------NONMANUFACTURING --------------------------------
WHOLESALE TRAOE ------------------------------RETAIL TRADE-------------------------------------
SHIPPING CLERKS -----------------------------------------MANUFACTURING---------------------------------------NONMANUFACTURING --------------------------------
WHOLESALE TRADE ------------------------------
SHIPPING AND RECEIVING CLERKS ----------MANUFACTURING---------------------------------------NONMANUFACTURING --------------------------------
WHOLESALE TRADE ------------------------------RETAIL TRADE -------------------------------------
TRUCK DRIVERS8 ------------------------MANUFACTURING------------------NONMANUFACTURING-----------
PUBLIC U T IL IT IE S 7-------WHOLESALE TRADE ---------RETAIL TRA D E ---------------S E R V IC E S------------------------
TRUCKDRIVERS* LIGHT (UNDER1 - 1 /2 TONS) -------------------------------------------MANUFACTURING---------------------------------------NONMANUFACTURING --------------------------------
WHOLESALE TRADE ------------------------------RETAIL TRAD E------------------------------------S E R V IC E S---------------------------------------------
TRUCKDR IVERS. MEDIUM ( 1 - 1 / 2 TOAND INCLUDING 4 T O N S )---------------------MANUFACTURING---------------------------------------NONMANUFACTURING --------------------------------
PUBLIC U T IL IT IE S 7----------------------------WHOLESALE TRADE ------------------------------RETAIL TRADE-------------------------------------SE R V IC E S---------------------------------------------
TRUCKDRIVERS, HEAVY (OVER 4 TONS,TRAILER TYPE) ---------------------------------------MANUFACTURING---------------------------------------NONMANUFACTURING --------------------------------
PUBLIC U T IL IT IE S7----------------------------WHOLESALE TRAO E------------------------------RETAIL TRAD E------------------------------------
TRUCKDR IVERS, HEAVY (OVER 4 TONS,OTHER THAN TRAILER T Y P E ) ---------------MANUFACTURING---------------------------------------NONMANUFACTURING--------------------------------
PUBLIC U T IL IT IE S 7----------------------------
TRUCKERS, POWER (FORKLIFT) -----------------MANUFACTURING---------------------------------------NONMANUFACTURING --------------------------------
PUBLIC U T IL IT IE S 7----------------------------WHOLESALE TRADE------------------------------RETAIL TRADE -------------------------------------
Number $ $ $ $ $ $ $ $ $ $ $ $ $ $ $ $ $ $TTndpr 1 . 0 0 1 . 1 0 1 . 2 0 1 .3 0 1 . 4 0 1 . 5 0 1 . 6 0 1 . 7 0 1 . 8 0 1 . 9 0 2 . 0 0 2 . 2 0 2 . 4 0 2 . 6 0 2 . 8 0 3 . 0 0 3 . 2 0 3 . 4 0
workers Mean5 Median5 Middle range 5 $ and _v and1 .0 0 u n d e r
1 . 1 0 1 . 2 0 1 . 3 0 1 . 4 0 1 . 5 0 1 . 6 0 1 . 7 0 1 . 8 0 1 . 9 0 2 . 0 0 2 . 2 0 2 . 4 0 2 . 6 0 r\j 00 o 3 . 0 0 3 . 2 0 3 . 4 0 o v e r
5 , 3 3 0 2 . 1 8$2 . 1 1
$ $ 1 . 7 7 - 2 . 5 8 5 1 6 4 1 1 0 2 6 0 3 0 5 3 7 1 3 2 8 3 8 4 4 4 4 8 0 5 4 7 1 5 1 9 3 3 7 4 0 4 3 7 7 6 3 81
2 , 1 5 0 2 . 4 3 2 . 4 4 1 . 9 6 - 2 . 9 4 - - — - 3 6 4 9 6 3 1 0 4 7 4 1 2 3 1 4 3 2 3 3 2 0 8 2 4 0 1 5 6 3 0 3 3 1 3 4 1 6 63 , 1 7 9 2 .0 1 1 . 9 7 1 . 6 7 - 2 . 2 8 5 - 1 6 4 73 2 1 2 2 4 3 2 6 8 2 5 4 2 6 1 3 0 1 5 7 1 2 6 4 2 8 0 1 8 1 101 65 22 151 ,3 4 1 1 .9 3 1 . 8 7 1 . 6 3 - 2 . 1 8 - - - 7 3 4 1 5 3 1 0 5 1 2 4 1 5 0 1 4 0 1 5 6 1 5 3 8 8 1 1 6 5 8 29 16 3 1 01 , 6 2 9 2 . 0 3 2 . 0 5 1 . 7 0 - 2 . 2 8 - 5 6 38 57 1 3 5 1 2 4 93 1 1 7 1 4 2 37 0 1 7 3 1 3 8 92 6 6 18 11 -
2 , 7 7 3 2 . 3 7 2 . 3 2 1 . 9 8 - 2 . 6 9 - - - 2 4 2 1 5 6 4 9 2 1 4 4 1 9 8 1 7 7 3 9 1 4 1 5 4 1 7 2 5 6 2 0 3 1 7 2 8 3 1 0 51 ,6 0 2 2 . 5 0 2 . 5 0 2 . 1 2 - 2 . 8 1 - - - - - 5 1 8 3 7 6 3 82 8 4 1 7 5 2 3 9 2 9 1 1 9 9 1 1 8 121 74 1 011 ,1 7 1 2 . 18 2 . 1 2 1 . 8 5 - 2 . 4 5 - - - 2 4 2 10 4 7 55 81 1 1 6 9 3 2 1 8 1 7 7 1 2 6 5 7 85 52 9 4
855 2 .1 5 2 . 0 5 1 . 8 1 - 2 . 4 2 ” “ - - 2 9 1 0 3 8 52 7 6 1 1 4 6 8 1 2 8 1 1 8 7 8 19 7 9 35 8 4
2 , 7 4 5 2 .3 8 2 . 2 9 1 . 9 6 - 2 . 8 0 - - 1 6 - - 32 1 1 0 8 7 1 4 6 2 1 2 1 4 9 4 7 1 3 3 3 2 3 1 2 7 6 2 7 0 1 5 3 1 1 8 1 4 01 , 5 5 7 2 . 4 5 2 . 3 7 1 . 9 9 - 2 . 83 - - - - - 1 6 6 5 1 6 7 6 1 4 6 7 6 2 2 6 1 9 0 1 6 3 1 5 1 1 5 9 81 6 6 1 2 41 ,1 3 8 2 .2 9 2 . 1 9 1 . 9 2 - 2 . 7 2 - - 16 - - 1 6 4 5 7 1 7 0 6 5 7 3 2 4 5 1 4 3 6 8 1 2 6 1 1 0 7 2 52 16
7 0 4 2 .2 6 2 . 1 6 1 . 8 2 - 2 . 6 8 - - — - - 8 4 2 6 0 5 6 4 3 3 7 1 4 3 8 6 19 7 6 50 2 7 42 163 0 2 2 . 2 4 2 . 1 6 1 . 9 7 - 2 . 7 1 ~ ~ 16 - - 8 - 9 1 2 0 31 7 6 4 8 10 2 2 33 28 1 -
5 5 ,4 7 3 2 . 3 0 2 . 3 6 1 . 6 2 - 3 . 0 7 1 2 6 2 2 7 5 2 6 3 3 2 8 3 5 3 8 2 6 8 1 2 8 8 3 2 4 5 7 1 8 8 6 2 5 4 1 1 3 0 3 3 4 4 5 3 4 8 0 3 5 4 2 5 6 2 0 2 8 7 7 1 0 2 7 5 4 5 6 7 1 7 21 4 ,5 7 2 2 . 1 4 2 . 1 1 1 . 6 3 - 2 . 7 0 - - 8 8 4 7 3 8 51 9 3 0 1 0 2 6 8 8 4 6 9 9 1 1 3 3 5 7 3 1 1 5 2 1 5 5 0 7 8 6 2 1 9 9 8 6 4 9 7 5 3 5 2 364 0 ,9 0 1 2 . 3 5 2 . 5 2 1 . 6 2 - 3 . 1 3 1 2 6 2 2 7 4 3 8 2 8 5 5 2 6 8 7 1 7 5 0 1 8 5 6 1 5 7 2 1 1 8 7 1 4 0 8 7 3 0 2 2 9 3 1 9 3 0 2 7 5 7 3 4 2 2 2 0 1 2 9 3 0 0 4 2 1 6 1 3 72 0 , 2 1 4 2 . 8 7 3 . 1 3 2 . 6 4 - 3 . 1 9 - - - 3 4 81 3 2 1 5 3 0 2 3 3 0 2 3 3 1 8 2 1 0 3 9 6 4 6 1 3 7 7 2 0 8 6 1 0 5 0 8 3 5 5 4 2 0 7 7 71 1 ,1 4 5 1 . 8 3 1 . 6 4 1 . 3 6 - 2 . 2 7 18 - 4 8 1 7 7 9 1 5 1 8 1 0 8 6 7 4 2 9 3 3 4 5 6 8 3 3 3 2 3 4 3 6 6 0 5 6 4 3 6 0 6 5 3 8 5 1 6 5 6 0
6 , 8 1 2 1 . 8 6 1 . 6 6 1 . 3 4 - 2 . 4 0 15 9 2 3 0 8 8 9 3 9 0 7 5 1 2 5 2 3 2 7 2 2 5 5 2 8 0 1 6 0 5 3 4 3 6 0 5 4 8 4 3 7 2 8 4 4 3 0 4 -2 ,6 7 1 1 . 8 9 1 . 8 0 1 . 4 3 - 2 . 3 8 92 1 3 4 82 1 4 5 1 8 0 1 2 5 3 6 7 6 5 1 4 5 55 6 5 2 7 5 32C 188 2 9 3 1 4 0 ~
8 ,2 9 3 1 .7 0 1 . 5 3 1 . 3 1 - 1 .9 6 1 1 0 2 1 4 3 6 8 1 2 3 1 1 0 7 7 9 3 5 6 1 6 4 0 4 3 9 0 6 8 3 3 3 4 4 4 5 3 1 9 3 4 1 2 9 9 3 2 7 2 0 3 _ _1 , 9 6 8 2 .0 2 1 . 8 4 1 . 4 7 - 2 . 7 2 - - - 1 0 6 2 1 1 2 3 6 1 4 7 1 3 3 1 1 2 9 9 8 7 1 2 7 9 2 8 5 8 0 2 9 6 1 5 9 - -6 ,3 2 5 1 .6 0 1 . 4 7 1 . 2 8 - 1 . 8 6 1 1 0 2 1 4 3 6 8 1 1 2 5 8 6 6 6 9 9 4 6 9 2 7 1 2 7 8 5 8 4 2 4 7 3 1 8 2 2 7 2 5 6 2 1 9 31 4 4 - -2 ,8 0 1 1 . 5 7 1 . 5 1 1 . 3 2 - 1 . 8 3 18 - 4 8 5 7 6 3 5 3 3 9 5 2 0 6 1 8 5 1 6 7 4 6 6 1 9 9 1 3 7 2 8 5 1 8 - _ - -2 , 0 2 8 1 . 4 9 1 .3 6 1 . 2 4 - 1 .6 1 15 9 2 2 4 7 4 1 1 3 9 8 2 1 4 1 3 4 6 6 5 8 7 7 2 5 9 5 6 9 8 3 31 1 4 - - -1 , 2 3 3 1 . 6 9 1 .5 3 1 . 2 3 - 2 . 2 9 7 6 1 2 2 73 1 3 4 1 0 4 78 1 1 5 1 7 4 9 3 3 19 7 8 7 4 1 4 9 1 1 3 - -
2 5 , 6 0 9 2 .2 8 2 . 3 4 1 . 5 8 - 3 . 1 1 16 1 3 1 1 6 1 7 7 2 1 9 5 7 1 4 3 0 1 4 2 5 1 2 0 9 7 8 7 6 8 7 5 7 3 1 6 5 1 1 7 6 3 1 8 6 5 2 2 4 0 8 5 8 4 5 3 7 2 6 0 2 1 1 05 , 5 6 7 2 . 0 0 1 .8 7 1 . 5 1 - 2 . 4 0 - - 4 5 3 2 0 5 2 3 4 8 0 3 4 2 5 1 4 4 0 9 2 0 9 2 0 9 4 5 6 6 6 8 3 2 0 3 7 4 2 9 2 2 9 8 75 33
2 0 , 0 4 2 2 . 3 6 2 . 5 3 1 . 6 0 - 3 . 1 4 16 13 71 1 4 5 2 1 4 3 4 951 1 0 8 3 6 9 6 3 7 8 4 7 9 3 6 4 1 1 9 4 1 0 9 5 1 5 4 5 1 8 6 6 5 6 6 4 2 3 9 2 5 2 7 7 71 1 ,1 2 9 2 . 8 5 3 . 1 3 2 . 6 0 - 3 . 2 0 - - - - 6 7 3 1 9 6 1 5 78 1 3 7 1 1 9 6 9 3 3 9 8 1 0 6 1 1 3 5 9 2 6 3 4 1 3 9 2 5 2 7 77
4 , 7 3 5 1 .6 5 1 . 4 8 1 . 3 2 - 1 . 8 2 - - - 9 7 5 8 8 9 6 3 8 3 7 9 4 7 9 1 4 5 1 8 5 9 3 1 61 2 2 8 2 4 2 1 4 7 1 2 9 4 3 - -2 , 8 3 2 1 . 7 7 1 . 5 9 1 . 3 5 - 2 . 2 0 - - 61 4 6 6 4 0 1 2 5 0 2 5 1 1 6 0 1 1 9 1 3 6 1 1 0 1 7 2 2 2 3 2 0 2 1 8 7 3 8 5 7 _ _1 ,3 2 2 2 . 0 7 2 . 1 4 1 . 5 6 - 2 . 4 7 16 13 10 11 76 4 7 2 5 2 4 2 3 6 21 4 2 16 3 2 4 6 39 1 7 2 1 3 6 - -
1 2 ,2 2 6 2 . 6 5 2 . 9 3 2 . 1 9 - 3 . 1 5 _ _ _ 1 6 7 2 7 2 1 2 1 31 1 4 7 1 4 4 5 3 7 6 1 4 0 7 9 4 6 3 0 8 4 4 8 7 8 1 2 2 9 4 0 1 5 1 4 7 3 6 31 ,6 7 0 2 . 1 4 2 . 0 8 1 . 7 0 - 2 . 5 5 - - - 27 5 9 6 3 9 8 1 7 5 1 5 5 1 1 2 9 0 1 3 2 2 6 1 1 2 4 1 5 5 53 1 1 6 4 9 3
1 0 ,5 5 6 2 . 7 3 3 . 0 2 2 . 4 2 - 3 . 1 6 - - - 140 2 1 2 5 8 2 1 3 2 9 6 2 9 0 2 6 4 5 0 6 6 3 3 7 0 7 2 0 72 3 1 1 7 6 3 8 9 9 1 4 2 4 6 06 , 1 0 7 2 .9 7 3 . 1 4 2 . 9 9 - 3 . 2 0 - - - 34 - - - 1 0 1 1 8 6 4 - 3 1 6 1 3 0 1 9 8 1 6 6 5 6 9 3 0 8 9 1 4 1 5 -2 ,8 7 0 2 . 3 6 2 . 5 0 1 . 7 2 - 2 .9 1 - - - 1 0 6 1 9 1 4 0 1 1 0 2 4 6 1 1 4 1 3 7 2 7 85 1 8 5 3 5 2 3 8 9 3 71 4 5 0 5 6 01 , 5 6 7 2 . 4 5 2 . 5 5 2 . 0 9 - 2 . 9 0
” " ~2 1 18 1 0 3 4 0 5 8 6 3 2 3 2 6 2 56 1 6 9 1 6 0 2 3 2 3 6 1 4
5 , 9 8 5 2 . 3 1 2 . 3 9 1 . 8 6 - 2 . 7 4 _ _ _ 38 1 0 0 1 7 1 5 0 3 5 4 2 1 2 7 2 1 1 3 6 5 1 6 5 6 0 2 3 3 1 8 7 4 2 1 9 5 4 0 1 1 0 _4 , 2 9 6 2 . 2 3 2 . 2 5 1 . 8 5 - 2 . 7 1 - - - 20 58 1 5 2 4 4 0 53 2 0 6 7 9 9 8 4 1 4 4 4 4 1 8 2 1 5 3 3 1 3 1 4 7 2 6 -1 , 6 9 0 2 . 5 3 2 . 6 5 2 . 0 1 - 3 . 1 2 - - - 18 4 2 19 6 3 1 1 9 1 4 2 3 8 1 0 2 1 1 7 52 3 4 2 88 4 9 3 84 _1 ,1 4 9 2 . 7 4 2 . 8 9 2 . 6 1 - 3 . 1 5 ~ ” ~ “ 5 1 3 1 2 7 3 4 18 35 6 3 0 1 50 4 5 9 84
1 6 ,7 9 4 2 . 1 9 2 . 2 0 1 . 7 1 - 2 . 6 7 - - 4 6 3 6 8 1 C 6 4 1 0 6 8 6 3 1 9 6 0 1 0 5 6 7 6 7 8 3 2 1 5 6 8 2 2 7 4 1 331 1 4 7 9 2 1 4 8 7 5 4 3 7 7 7 21 1 , 9 9 9 2 . 2 5 2 . 3 t 1 . 7 8 - 2 . 7 6 - - 4 3 1 8 3 5 4 6 7 3 5 3 7 0 5 3 5 7 4 1 3 7 0 6 4 9 1 0 6 3 1 9 7 3 9 2 1 1 0 7 5 1 9 4 4 4 9 1 2 9 0 72
4 , 7 9 4 2 .0 1 1 . 8 9 1 . 5 6 - 2 . 4 8 - - 3 1 8 5 5 1 8 3 3 3 2 6 2 4 2 5 3 1 5 3 9 7 1 8 3 5 0 6 3 0 0 4 1 0 4 0 4 2 0 4 2 6 3 87 -1 , 5 9 0 2 . 1 6 2 . 1 0 1 . 6 4 - 2 . 6 9 - - - 13 2 5 7 34 5 9 9 5 1 5 3 1 0 7 7 0 7 0 9 1 1 5 5 1 6 0 8 2 4 0 7 9 -1 , 9 9 7 1 .7 8 1 . 6 7 1 . 4 7 - 1 . 9 3 - - - 86 2 1 3 2 7 7 2 0 1 3 0 3 1 4 4 2 6 1 4 7 97 59 1 5 4 1 2 8 23 4 - -1 , 1 8 6 2 . 2 0 2 . 1 7 2 . 0 0 - 2 . 6 1 3 e6 4 8 2 2 3 1 8 1 8 2 9 6 5 3 3 8 1 5 1 1 0 1 1 1 3 1 7 3 1 9
S ee foo tn otes at end o f table,
Digitized for FRASER http://fraser.stlouisfed.org/ Federal Reserve Bank of St. Louis

5 3
Table A-14. Custodial and Material Movement Occupations—South— Continued
(A v e ra g e s tra ig h t-t im e h ou r ly ea rn in gs fo r s e le c te d o ccu p a tion s by in du stry d iv is io n in the South, 1 F e b ru a ry 1 9652 )
Hourly earnings4 N um ber o f w o rk e r s re ce iv in g stra ight -t im e h o u r ly earn ing s o f—
VI $ $ $ $ $ $ $ $ $ $ $ $ t $ $ $ $ *
O ccu p a t io n 3 and in du stry d iv is io nNumber
of Under 1 . 0 0 1 . 1 0 1 . 2 0 1 . 3 0 1 . 4 0 1 . 5 0 1 . 6 0 1 . 7 0 1 . 8 0 1 . 9 0 2 . 0 0 2 . 2 0 2 . 4 0 2 . 6 0 2 . 8 0 3 . 0 0 3 . 2 0 3 . 4 0wodcers Mean5 6 7 8 Median5 Middle range 5 ( and
1 . 0 0 under ' “ “ “ ~ and
1 . 1 0 1 . 2 0 1 . 3 0 1 . 4 0 1 . 5 0 1 . 6 0 1 . 7 0 1 . 8 0 1 . 9 0 2 . 0 0 2 . 2 0 2 . 4 0 2 . 6 0 2 . 8 0 3 . 0 0 3 .2 0 3 . 4 0 o v e r
TRUCKERS* POWER C OTHER THAN $ $ $ $FORKLIFTI ----------------------------------------------------------- 3 ,1 0 3 2 . 3 6 2 . 3 8 1 . 7 9 - 2 . 7 2 - - 7 3 87 1 4 7 2 4 8 1 7 2 1 2 1 16 1 0 9 1 32 6 0 C 5 6 0 1 9 8 1 5 3 2 9 3 1 9 8 6 0
MANUFACTURING-------------------------------------------- 2 ,4 8 1 2 . 3 8 2 . 3 6 1 . 7 8 - 2 . 8 9 - - - - 61 1 4 7 1 9 7 1 2 1 1 1 5 14 1 0 7 1C1 557 2 1 6 1 4 9 1 4 8 2 9 2 198 60NONMANUFACTURING-------------------------------- 6 2 2 2 . 2 6 2 . 4 8 2 . 1 2 - 2 . 5 6 7 3 2 7 51 51 6 2 2 31 4 3 3 4 4 49 5 1
1 F o r de fin ition o f r e g io n s , se e footn ote 3 to the table in appendix A .2 A v e ra g e m onth o f r e fe r e n c e . D ata w e re c o lle c te d du ring the p e r io d July 1964 through June 1965.3 Data lim ited to m en w o rk e r s e x cep t w h ere o th e rw ise in d ica ted .4 E x clu d es p rem iu m pay fo r o v e r t im e and fo r w ork on w eek en d s, h o lid a y s , and late sh ifts .5 F o r de fin ition o f te r m s , se e foo tn ote 3, tab le A - l .6 F in a n ce , in su ra n ce , and re a l esta te .7 T ra n sp orta tion , co m m u n ica tio n , and oth er pu blic u t il it ie s .8 Includes a ll d r iv e r s r e g a rd le s s o f s iz e and type o f tru ck o p erated .
Digitized for FRASER http://fraser.stlouisfed.org/ Federal Reserve Bank of St. Louis

5 4
Table A-15. Custodial and Material Movement Occupations—North Central
(A v e ra g e s tra ig h t -t im e h ou rly earn ings fo r s e le c te d occu p a tion s by in dustry d iv is io nin the N orth C en tra l re g io n , 1 F e b ru a ry 1965 2)
O ccu p a tio n 3 and in du stry d iv is io n I
ELEVATOR OPERATORS. PASSENGER ----------NONMANUFACTURING --------------------------------
FINANCE6 -----------------------------------------------S E R V IC E S ---------------------------------------------
ELEVATOR OPERATORS, PASSENGERI WOMEN I --------------------------------------------------------
NUNMANUFACTUR IN G --------------------------------RETAIL TRAD E-------------------------------------FINANCE6-----------------------------------------------S E R V IC E S---------------------------------------------
GUAR DS ANO WATCHMFN--------------------------------MANUFACTURING---------------------------------------NONMANUFACTURING--------------------------------
GUARDS'-MANUFACTURING ---------------------------------------
WATCHMEN:MANUFACTURING ---------------------------------------
JANITORS, PORTERS, AND CLEANERS ------MANUFACTURING---------------------------------------NONMANUFACTURING --------------------------------
PUBLIC U T IL IT IE S 7----------------------------WHOLESALE TRAD E------------------------------RETAIL TRAD E-------------------------------------FINANCE6-----------------------------------------------SERVICES ---------------------------------------------
JANITORS, PORTERS, AND CLEANERS( WOMEN) --------------------------------------------------------
MANUFACTURING---------------------------------------NONMANUFACTURING--------------------------------
PUBLIC U T IL IT IE S 7----------------------------WHOLESALE TRADE ------------------------------RETAIL TRADE ------------------------------------FINANCE6-----------------------------------------------S E R V IC E S---------------------------------------------
LABORERS, MATERIAL HANDLING---------------MANUFACTURING---------------------------------------NUNMANUFACTURING--------------------------------
PUBLIC U T IL IT IE S7----------------------------WHOLESALE TRADE ------------------------------RETAIL TRAD E------------------------------------
ORDER F IL L E R S -------------------------------------------MANUFACTURING---------------------------------------NQNMANUF ACTUR I N G --------------------------------
WHOLESALE TRADE ------------------------------RETAIL TRAD E-------------------------------------
PACKERS, S H IP P IN G -------------------------------------MANUFACTURING---------------------------------------NONMANUFACTURING--------------------------------
WHOLESALE TRADE ------------------------------RETAIL TR A D E -------------------------------------
N u m ber o f w o rk e r s re ce iv in g s tr a ig h t -t im e h ou rly ea rn in gs o f—
$ $ S $ $ $ $ $ $ 1 $ $ $ $ $ $ $ $Number 1 .0 0 1 .1 0 1 .2 C 1 .3 0 1 .4 0 1 .5 0 1 .6 0 1 .7 0 1 .8 0 2 .0 0 2 .2 0 2 .4 0 2 .6 0 2 .8 0 3 .0 0 3 .2 0 3 .4 0 3 .6 0of U nderworiters Mean 5 Median 5 Middle range5 % and _ _ _ _ _ _ _ _ _ _ _ _ and1 .0 0 under1 .1 0 1 .2 0 1 .3 C 1 .4 0 1 .5 0 1 .6 0 1 .7 0 1 .8 0 2 .0 0 2 .2 0 2 .4 0 2 .6 0 2 .8 0 3 .0 0 3 .2 0 3 .4 0 3 .6 0 o v e r
1 ,5 7 6 f .9 1 f . 8 8 f . 3 9 - 1 .4 5 54 71 40 83 162 84 29 155 62 94 6 6 7 591 72 6 _ _ _ _1 ,4 6 3 1 .9 0 1 .8 5 1 .3 8 - 2 .4 5 54 71 40 64 161 81 24 155 62 64 41 5 577 64 - - - - -
931 2 .1 1 2 .4 2 1 .6 4 - 2 .4 7 - _ _ 57 133 1 1 109 2 25 17 - 564 22 - - - - -353 1 .3 4 1 .4 4 1 .0 5 - 1 .6 5 54 71 - 5 16 77 22 38 60 4 6 ” ~ ~ -
2 ,4 5 9 1 .3 1 1 .2 9 1 .1 5 - 1 .5 4 265 131 415 492 174 198 427 150 99 67 13 8 17 3 _ _ _ _ _2 ,4 2 3 1 .3 1 1 .2 8 1 .1 5 - 1 .5 4 265 131 415 492 • 1 6 8 190 4 18 150 99 66 6 6 17 - - - - - -
986 1 .2 9 1 .2 3 1 .1 6 - 1 .4 0 - - 4 06 264 68 93 4 0 73 36 6 1 - - - - - - — -393 1 .4 7 1 .5 2 1 . 3 6 - 1 .5 7 - - - 62 62 26 204 10 17 8 4 - - - - - - - -950 1 .2 0 1 .2 4 . 9 5 - 1 .5 2 265 131 9 166 35 66 168 50 32 28 ” ~
2 5 ,7 4 9 2 .2 1 2 .2 9 1 .5 6 - 2 .7 9 29 14 32 2149 1369 1375 2 3 6 9 632 646 1666 1847 1670 2181 3 559 3597 2 559 51 1 _1 4 ,8 1 2 2 .5 7 2 .7 1 2 .3 0 - 2 .9 4 20 _ _ 130 119 116 149 147 2 79 932 1249 1242 1742 3 011 3131 2506 39 1 -1 0 , 936 1 .7 1 1 .5 4 1 .3 5 - 1 .9 3 9 14 32 2C19 1250 1260 2 22 0 485 367 735 599 4 28 439 548 466 53 12 ~
1 0 ,8 8 8 2 .7 2 2 .8 0 2 . 5 6 - 2 .9 9 20 - - 17 - 29 10 14 66 342 600 621 1301 2397 297 7 2478 14 1 -
3 ,9 2 5 2 .1 6 2 .1 7 1 .8 5 - 2 .5 4 - - - 113 119 87 1 39 133 213 590 648 621 4 40 6 14 154 28 25 —A -
6 6 ,6 6 0 2 .1 5 2 .2 4 1 .8 0 - 2 .5 6 449 507 902 1912 2248 1593 2836 2 646 3 510 6 77 9 8155 8951 12157 1 2104 1637 207 48 18 44 0 ,6 8 2 2 .3 5 2 .4 3 2 . 1 3 - 2 .6 4 - - - 165 327 293 510 631 1166 3 57 7 5382 7112 8 598 11238 1461 151 48 18 42 5 ,9 7 9 1 .8 2 1 .7 8 1 .4 7 - 2 .2 0 449 507 902 1747 1921 1301 2325 2 016 2343 3202 2772 1 840 3559 866 175 56 - - -
4 ,0 3 0 2 .2 8 2 .3 4 2 . 1 2 - 2 .5 2 - - - 40 17 26 152 74 176 223 709 798 1166 563 71 15 - - -1 ,8 7 1 2 .0 3 2 .0 7 1 . 6 6 - 2 .3 9 - - - 39 47 117 143 196 147 178 234 309 250 176 24 10 - — _7 ,8 5 6 1 .6 2 1 .5 9 1 .3 6 - 1 .8 5 134 157 579 724 620 487 1322 864 698 1080 621 291 141 66 63 10 - - -5 ,3 4 5 1 .9 8 1 .9 8 1 .6 3 - 2 .4 4 - 11 13 336 282 226 319 5 85 270 670 698 140 1769 22 3 3 - - -6 ,8 7 7 1 .6 0 1 .6 3 1 .3 2 - 1 .8 5 315 339 309 608 954 4 46 389 298 1053 1052 510 301 234 39 14 18 “ -
1 9 ,4 6 7 1 .7 0 1 .6 8 1 .4 4 - 1 .8 7 50 126 436 248 0 1423 964 2244 2651 1313 5 077 721 744 733 445 54 8 _3 ,6 7 9 2 .0 9 2 .1 1 1 .7 8 - 2 .4 7 - - 8 66 154 64 2 08 218 258 533 591 531 575 435 29 8 - - -
1 5 ,7 8 8 1 .6 1 1 .6 3 1 .3 7 - 1 .8 3 50 126 428 2414 1269 900 2 035 2433 1056 4 5 4 4 130 212 158 9 25 - - - _1 ,4 6 4 1 .8 8 1 .7 7 1 .7 0 - 2 .0 1 - - - 17 27 37 105 165 523 224 34 189 138 6 - - - - _
365 1 .6 8 1 .6 8 1 .4 1 - 1 .8 8 - - 11 52 27 9 64 24 44 74 30 10 16 3 - - _ - -1 ,2 3 2 1 .4 0 1 .3 5 1 .2 2 - 1 .5 8 14 29 201 259 244 91 103 125 95 59 8 2 2 - - - - - -7 ,1 7 8 1 .6 7 1 .6 8 1 .5 2 - 1 .8 5 - 20 4 723 416 4 66 1036 1132 1 10 3235 35 - 2 - - - _ _ . -5 ,5 5 1 1 .5 1 1 .5 3 1 .2 8 - 1 .6 9 36 77 212 1264 556 297 728 987 284 952 23 11 - - 25 -
9 5 ,0 5 3 2 .5 3 2 .6 0 2 . 2 6 - 2 .8 2 _ 6 175 730 403 539 1613 105 0 1880 4 91 6 7992 14166 14294 2 1857 10434 10357 4112 265 2675 5 ,7 0 6 2 .4 7 2 .5 2 2 .2 4 - 2 .7 3 - - - 187 96 178 750 552 839 3 45 9 5948 9982 9115 16318 5763 1321 675 258 2673 9 ,3 4 7 2 .6 1 2 .6 9 2 .3 3 - 3 .C S - 6 175 543 307 361 86 3 4 98 1041 1456 2045 4185 5179 5 539 4671 9036 3 43 7 7 -1 9 ,0 7 5 2 .9 0 3 .0 4 2 . 6 3 - 3 .1 7 - - - - - 6 13 3 41 41 23 1 260 2692 2 924 186 7 7206 299 4 7 -1 1 ,4 4 2 2 .4 1 2 .4 2 2 . 1 4 - 2 .8 1 - - - 124 50 75 4 57 97 530 737 1399 2121 1400 1386 2 002 1023 43 - -
8 ,4 6 8 2 .2 9 2 .4 1 1 .7 8 - 2 .7 8 - 3 172 366 237 246 376 387 433 601 576 790 1077 1202 802 799 400 -
3 1 ,6 1 1 2 .5 3 2 .6 2 2 .2 9 - 2 .8 3 - _ _ 33 228 184 4 94 497 9 24 1473 2429 3756 5235 7 070 6 222 1847 846 306 651 1 ,2 0 2 2 .5 3 2 .5 6 2 .3 1 - 2 .7 9 - - - 11 51 72 123 133 94 724 760 1921 1996 2730 1827 2 28 168 3 00 652 C .4 1 0 2 .5 4 2 .6 4 2 .2 8 - 2 .8 5 - - - 22 177 112 372 364 830 750 1669 1835 3241 4 34 0 4 39 5 1620 678 6 _1 5 ,3 6 8 2 .5 5 2 .6 3 2 . 3 2 - 2 .8 3 - - - 20 125 62 122 159 514 474 1295 1602 2840 3504 3301 1135 216 - -
4 ,4 4 8 2 .5 0 2 .6 9 2 .0 2 - 2 .9 2 - - 1 49 41 240 158 310 261 359 224 313 659 1004 378 447 5 -
2 1 ,5 0 7 2 .4 6 2 .5 2 2 . 1 9 - 2 .7 7 _ _ 5 5C 179 236 429 537 487 1377 2181 3126 3392 4820 3541 612 294 81 1621 5 ,0 9 6 2 .4 9 2 .5 5 2 . 2 4 - 2 .7 7 - - - 10 123 108 22 7 3 57 234 8 75 1436 24 C 7 2262 3 88 3 2 284 456 194 80 161
6 ,4 1 1 2 .3 8 2 .4 6 2 .0 8 - 2 .7 9 - - 5 40 56 128 202 180 253 502 745 719 1130 936 1258 157 100 1 15 ,3 6 4 2 .4 3 2 .4 9 2 .1 5 - 2 .8 0 - - - 23 37 67 135 101 211 3 40 629 594 1028 887 1148 67 96 1 1
922 2 .1 7 2 .1 5 1 .7 0 - 2 .6 8 ~ 5 17 19 61 62 68 42 113 92 110 85 49 110 90 “ ” " .
S ee foo tn otes at end o f ta b le .
Digitized for FRASER http://fraser.stlouisfed.org/ Federal Reserve Bank of St. Louis

5 5
Table A-15. Custodial and Material Movement Occupations—North Central— Continued
(A v e ra g e s tra ig h t -t im e h ou r ly earn in gs fo r s e le c te d o ccu p a tion s by in dustry d iv is io nin the N orth C en tra l re g io n , 1 F e b ru a ry 1965 2)
Hourly earnings N um ber o f w o r k e r s re ce iv in g s tra ig h t -t im e h ou rly earn in gs o f—
N umber * $ $ $ $ $ $ $ $ i $ % $ $ $ $ $ $Under 1 . 0 0 1 . 1 0 1 .2 0 1.30 1 .40 1 .50 1 .6 0 1 .7 0 1 .8 0 2 . 0 0 2 .2 0 2 .4 0 2 .60 2 .80 3.00 3.20 3 .4 0 3 .60
Occupation 3 and industry division o fM ean5workers M edian5 M iddle range5 $ and and1 .0 0 under
1 .1 0 1 . 2 0 1.3C 1 .40 1 .50 1 .6 0 1 .7 0 1 .8 0 2 . 0 0 2 .2 0 2 .4 0 2 .60 2 .80 3 .0 0 3.20 3 .40 3 .6 0 over
PACKERS, SHIPPING I WOMEN)----------------- 9 ,017$2 .0 22 .1 2
i.„ $ $ 1 .7 2 - 2 .31 1 .7 7 - 2 .4 0
_ 50 129 283 3851 Q"T
459*>ni 724 1318
9 1 OI1420Ol T
1320I l ia
1228 313 11601146
113107
63 2323
18 1010109 lor C\J3 33** 11 ol VI r 1113
NONMANUFACTURING ----------------------------- 2,305 1.741 .80
1.701.80
1 .5 2 - 1 .97 1 .6 1 - 1 .97
- 50 99 174 195 256 390 137 503 20777
2591 0 1
8 14 6 5 - -W nUL i. <j AL L 1 l> AUL.RETAIL TRADE --------------------------------- 1 ,247 1.65 1 .64 1 .4 1 - 1 .92 50 83 165 1 1 2 146 169 1 0 0 252 130 27 3 - 5 - - -
RECEIVING CLERKS ----------------------------------- 6 ,2404 ,618
2.592.65
2 . 6 62.70
2 .3 5 - 2 .89 2 .4 5 - 2 .92
- - - 22 8 15 812 0
8218
11829
328119
697 993 46 2
1285 18211107
18951259
589 26774
198
1513
22 8 19 390 453 2193,6212.52 2 .59 2 .2 2 - 2 .84 61 64 90 209 532 715 636 193 11 cPUBLIC UTILITIES7------------------------- 469 2.81 2 .79 2 .7 3 - 2 .8 9 - - - - - - - - - - 1 1 44 215 180 12 14 2 -WHOLESALE TRADE -------------------------------------- 1,529
1,5312.522.45
2 .59 2 .2 0 - 2 .8 4 2 .1 4 - 2 .78
-16
4*
11 1 235
- 1771
113 226158
204 188 277 325 131 18 522.41 60 83 321 208 2 1 0 117 76 159 *
SHIPPING CLERKS ---------------------------------------------------- 5,780 2 . 6 8 2.7 2 2 .4 4 - 2 .95 - - _ 1 2 1 15 2 0 34 189 378 623 1 0 0 0 1086 1430 595 334 51 23MANUFACTURING------------------------------------------------- 4,126 2.72 2 .76 2 .5 0 - 2 .9 7 - - - - - - 11 11 9 1 2 2 215 335 720 825 1114 447 256 43 21NONMANUFACTURING----------------------------------------- 1,655 2.58 2 .59 2 .3 2 - 2 .8 7 - - - 1 2 1 4 9 25 67 163 283 280 261 316 148 78 8 2
WHOLESALE TRADE --------------------------- 1 ,227 2.60 2 .63 2 .3 4 - 2 .8 8 - - - - - - 3 5 19 36 133 174 204 226 264 1 2 0 34 8 -nrT*Ti m ine 1 1 0 24Kb 1 AIL 1 KAUt ——— ———————— — ^•■31- C . O H 0 31 10 C O HH c 0 c
SHIPPING AND RECEIVING CLERKS --------- 6 ,146 2.71 2 .77 2 .4 7 - 2 .9 4 - - - 7 3 1 0 54 3 33 152 391 682 694 1350 1498 741 297 1 1 1 123MANUFACTURING----------------------------------- 3 ,870 2 .7 2 2.78 2 .5 3 - 2 .88 - - - - - 1 0 2 0 - 17 82 232 348 3 86 1005 1 2 1 1 330 108 40 82NONMANUFACTURING ----------------------------- 2,276 2.7C 2.73 2 .3 7 - 3 .06 - - - 7 3 - 34 3 15 70 158 334 308 345 287 411 189 71 41
PUBLIC UTILITIES7 -------------------------ti uni r r »i r rn i r\r 3331,214
2 .8 62.80
2 .912.79
2 .6 3 - 3.03 2 .4 1 - 3 .15
5 1250
71148
47171
1 1 2107
55 27140
1549 37MnULtoALt 1KAUt —— — —
DTT A TI TOUnC 2.47 2 .52 2 .1 3 - 2 .88 76 79 59 84 19KclAlL I KAUt — — — ——— — — ouo 30 1UO O H 6 3mi i i / rvr> t \j rn r* 8 .. 66,170 3.01 3 .15 2 .8 8 - 3 .2 9 15 16 38 1 0 1 183 234 305 365 827 1460 2 0 2 0 3380 4905 7616 18483 2 2 0 2 1 3664 537V KULIn UK 1 V tK b — —u ah i ic nr ti in tm/' 1 1 1436 329n Ain Ur AL i UK Ilib ———— —————————— 1 j X X
NONMANUFACTURING----------------------------- 49 , 869 3.05 3 .18 2 .9 8 - 3.31 - - 16 38 75 172 192 269 291 578 952 1133 1943 2862 4482 14447 19573 2640 208PUBLIC UTILITIES7 ------------------------- 29,653 3.17 3 .23 3 .1 3 - 3 .34 - - - - - - - - 3 196 175 2 2 1 469 683 1472 9817 15487 1099 33WHOLESALE TRADE---------------------------n f- T a ti Tnnnc 12,652 2 .8 8 3 .03 2 .6 0 - 3 .25
2 .7 9 - 3 .1 9-
16 3824 92
778272
2 1 045
18159
158179
415261
6 8 8140
1299135
1347573
15031300
24611970
28591219
1208288
12640KtI A XL 1 KAUt
2 .77 2 .2 9 - 3 .00 1 36 11 46 36 92 53 38 245 207 2 0 0 45r VIC ES 8 9
TRUCKORIVERS, LIGHT (UNDERi i /o Tnnct 2 .74 2 .3 9 - 3 .20 16 19 79 153 104 2 0 0 356 324 421 550 606 637 1760 1651 901 L/C lUNbl — — ————— — ——u nmnrnr Tiin u,r 2 ,219 2.89
92.80 2 .4 8 - 3 .25 19 1 2 22 41 95 89 215 217 283 199 154 805 64rl AIMUrAb IUK l!N« — — — ——— —— ——— — —
ii iiM iinkiiicnf'Tiio ivir 11 n4 , 871 206 333 323 438 1606 846 26N'JiNn AINU rAU 1 UK liNb • ————— —— — n im i t r i i t t i i t t c c ? t 1 1 3 .0 8 - 3 .24 _ _ _ 110 1 _ _ 157
3 15 169
20 33 22 1117 681 10r UdL 1U U 1 XL X 1 i to ^ — —— — — uuni rrnn r T n n n c i *
3 11 2^52 y * 18 37 31 47 69 -7K
82 .0 1 - 3 .0 4 128 78 68 245 1 2 2 262 165H HUL COAX, t 1 KAUt ------- — — 4
RETAIL TRADE--------------------------------- 901 2 .2 8 2.31 1 .6 2 - 2 .9 8 - - 16 19 43 71 72 27 39 81 50 78 46 24 132 190 _ 12 1SERVICES ----------------------------------------- 552 2 .47 2 .69 2 .0 3 - 2 .94 - - - - - 36 6 46 27 83 15 6 134 162 37 - ~ -
TRUCKORIVERS, MEDIUM (1 -1 /2 TOmin f nr* i i m n i r /. t d a ic i 2.94 2 .7 7 - 3.21 20 68 774 1495 2169 2798 7159 5018 594 328ANU INLLUulNb lUINb) —— —unn.ncnr r u n t a*/* 5,776 2 .89 2 .97 2 .6 9 - 3 .1 7 15 30 19 126 218 29 1 493 757 1139 1343 693 341 303nAf\ UrAU lUKiriu ———— ——— ——— — — — —NUNMANUFACTURING ----------------------------------------- 15,934 2.96 3 .13 2 .8 2 - 3 .22 - - - 2 0 14 62 51 136 108 129 444 483 1 0 0 1 1412 1659 5815 4325 2 53 25
PUBLIC UTILITIES7 ----------------------------------- 9,007 3.10 3 .16 3 .1 0 - 3 .23 - - - - - - - - - - 24 51 302 496 543 4679 2888 12 14WHOLESALE TRADE -------------------------------------- 5,258 2.80 2 .8 7 2 .4 9 - 3 .24 - - - - 6 55 51 118 8 8 30 285 347 659 62 8 692 658 1410 23 2 -n CT A TI TD A n c 1,504 2.73 2 .93 2 .6 1 - 3 .09 2 0 3 18 2 0 90 129 59 2 0 246 40 8 456 19K Cl A iL 1 KAUC c 9 c
TRUCKDRIVERS, HEAVY (OVFR 4 TONS,r n n ti cd T v n r \ 23,681 3.16 3.25 3 .1 0 - 3 .35 45 29 23 176 426 582 1297 1730 5698 11597 2 0 2 0 591 KA lLcK I Tr c 1 — —— — — — — —MANUFACTUR ING-----------------------------------i t n n u A n n ie a t t iio i k i r
- - - - - - -3 ,56620,115
2.953.19
3 .043.28
2 .6 9 - 3 .18 3 .1 4 - 3 .36 45
524
158
8393
150276
297285
587710
5051226
11514547
52411073
2291791
2237nlUINnANUrAt 1 UK Inib — — — ———————
PUBLIC UTILITIES7---------------------------- 12,856 3.26 3 .32 3 .2 1 - 3 .3 7 - - - - - - - - - - - 143 3 42 360 2496 8951 861 -WHOLESALE TRAOE----------------------------- 4 ,5 2 3 3.05 3 .13 2 .9 2 - 3 .28 - - - - - - - 45 24 - 24 126 277 392 550 1451 998 636 _O CTA f l T n ADC 2,662 3.12 273 301 600 1124 249 37K 11 A IL 1 KAUt 3 .^ 1 3 .u i - i . e o 8 0 a 1 5
S ee foo tn otes at end o f table.
Digitized for FRASER http://fraser.stlouisfed.org/ Federal Reserve Bank of St. Louis

5 6
Table A*15. Custodial and Material Movement Occupations—North Central-----Continued
(A v e ra g e s tra ig h t-t im e h ou rly earn ings fo r s e le c te d occu p a tion s by in dustry d iv is io n in the N orth C en tra l r e g io n , 1 F e b ru a ry 1965 2)
O ccu p a tio n 3 and in du stry d iv is io n
TRUCKCRIVERS8 - CONTINUED
TRUCK OR l VERS * HEAVY (OVER 4 TONSiOTHER THAN TRAILER TYPE)-------------MANUFACTURING-----------------------------------NONMANUFACTURING -----------------------------
PUBLIC UTILITIES7-------------------------WHOLESALE TRADE---------------------------
TRUCKERS, POWER (FORKLIFT) ---------------MANUFACTURING -----------------------------------NONMANUFACTURING -----------------------------
PUBLIC UTILITIES7-------------------------WHOLESALE TRADE---------------------------RETAIL TRADE---------------------------------
TRUCKERS, POWER (OTHER THANFORKLIFT) -----------------------------------------------
M AN UF ACT UR ING-----------------------------------NONMANUFACTUR ING-----------------------------
PUBLIC UTILITIES7-------------------------
Hourly earnings4 N um ber o f w o rk e r s re ce iv in g stra ight -t im e hou rly earn ings o f—
Number * $ $ $ $ $ $ $ $ % $ * $ S $ » $ S1 .0 0 1 .1 0 1.2C 1.30 1 .40 1 .50 1 .6 0 1 .7 0 1 .80 2 .0 0 2 . 2 0 2 .40 2 .60 2 .8 0 3 . GO 3.20 3.40 3 .60
workers Mean5 6 Median5 Middle range5 $ and and1 .0 0 under
1 .1 0 1 .2 0 1.3C 1.40 1 .50 1 .60 1 .7 0 1 .8 0 2 . 0 0 2 .2 0 2 .40 2 .6 0 2 .80 3 .00 3.20 3.40 3 .60 o v e r
5,271$3.05 $3 .16 $ $
2 .9 4 - 3 .30 11 6 14 147 234 318 291 685 1436 1289 839 21,967 2.93 3 .07 2 .7 1 - 3.25 _ _ - - - - - 6 6 14 111 129 177 2 0 0 207 475 368 272 23,304 3.11 3.18 2 .9 9 - 3 .34 _ _ _ - - - - 5 - - 36 105 141 91 478 961 921 567 -1 , 6 35 3.18 3.21 3 .1 2 - 3 .35 _ _ - - - - - - - - - - 53 3* 2 1 0 489 636 213 -
919 3.06 3 .25 2 .7 8 - 3.43 - - " - - - - - 18 90 86 43 62 72 2 1 2 336 -
36,268 2.70 2 .75 2 .5 1 - 2 .87 _ _ _ 11 _ 44 47 34 90 477 1146 4244 55 10 9399 11286 2480 703 362 43532,045 2.69 2.75 2 .5 0 - 2 .86 _ - - - - 44 1 0 3 78 435 1109 3 875 4917 8835 10241 1390 349 324 435
4,223 2.80 2 .8 6 2 .5 8 - 3 .06 - - - 11 - - 37 31 1 2 42 37 368 593 564 1045 1090 355 38 -603 2.9? 3 .05 2 .6 0 - 3 .18 - - - - - - - - - - - 3 7 167 106 40 281 153 19 -
2,476 2.74 2 .84 2 .5 5 - 3.01 _ _ _ 9 - - 32 30 1 0 6 10 307 354 279 788 5 72 79 - -887 2 .8 8 2 .93 2 .6 8 - 3 .08 - - - “ “ 5 1 2 11 1 2 22 64 177 217 237 119 19
8,822 2.67 2 .72 2 .5 3 - 2 .82 1 . _ _ 1 2 376 337 802 1345 3351 1906 308 216 78 927,145 2 .6 8 2.75 2 .5 5 - 2 .84 - - - - - - - - 1 1 372 321 711 515 2743 1826 262 216 78 921,677 2.60 2.58 2 .5 1 - 2 .66 - - - - 1 - - - 1 4 16 92 830 608 80 46 - - -1,456 2.59 2 .58 2 .5 2 - 2 .65 86 735 597 39
1 F o r de fin ition o f r e g io n s , se e foo tn ote 3 to the table in appendix A .2 A v e ra g e m onth o f r e fe r e n c e . Data w e re c o l le c te d during the p e r io d July 1964 through June 1965.3 Data lim ite d to m en w o rk e r s e x cep t w h ere o th e rw ise in d icated .4 E xclu des p re m iu m pay fo r o v e rt im e and fo r w o rk on w eek en d s, h o lid a y s , and late sh ifts .5 F o r de fin ition o f t e rm s , s e e foo tn ote 3, ta b le A - l .6 F in a n ce , in su ra n ce , and r e a l esta te .7 T ra n sp o r ta tio n , com m u n ica tion , and oth er p u b lic u t il it ie s .8 Includes a ll d r iv e r s r e g a rd le s s o f s iz e and type o f tru ck op erated .
Digitized for FRASER http://fraser.stlouisfed.org/ Federal Reserve Bank of St. Louis
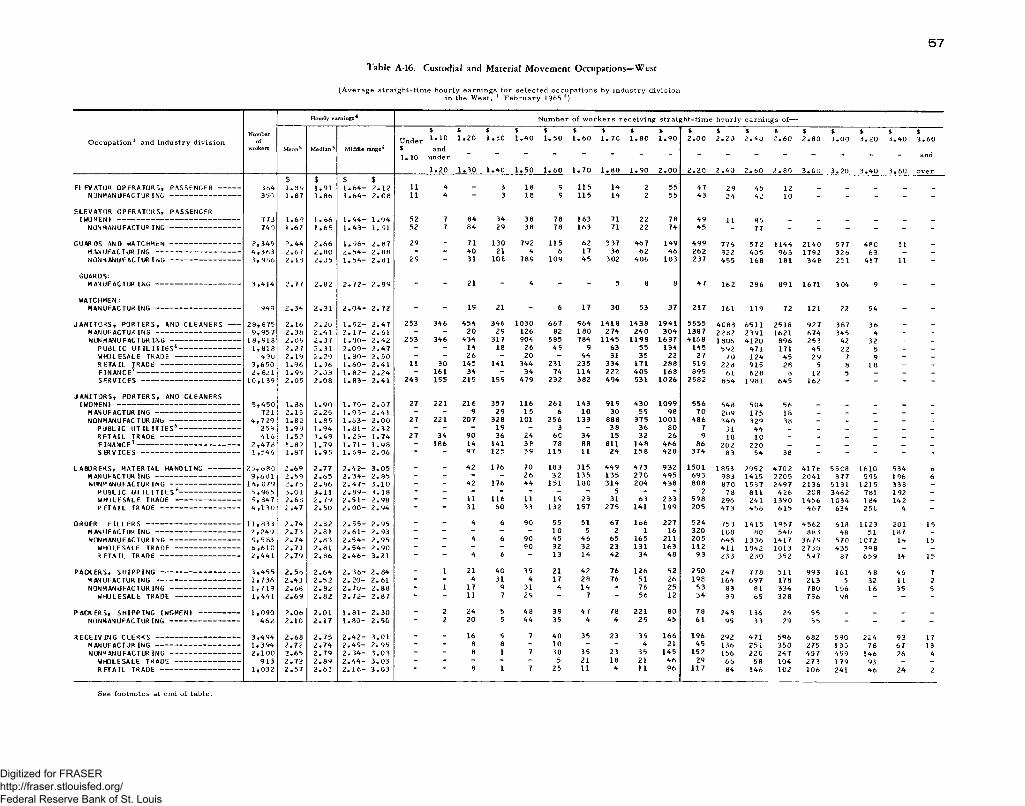
5 7
Table A-16. Custodial and Material Movement Occupations—West
(A v era g e s tra ig h t- t im e h o u rly earn in g s fo r s e le c ted occupations by in d u s try d iv is io nin the W est, 1 F e b ru a ry 1965 2)
Hourly earnings4 N um ber o f w o rk e r s r e ce iv in g s tra ig h t-t im e h ou rly earn ings o f—
U L $ $ $ $ $ $ $ $ $ % t $ $ $ $ $ $ $of Under 1 .1 0 1 .2 0 1 .3 0 1 .4 0 1 .5 0 1 .6 0 1 . 7 C 1 .8 0 1 .9 0 2 .0 0 2 .2 D 2 .4 0 2 .6 0 2 .8 0 3 .0 0 3 .2 0 3 .4 0 3 .6 0
workers Mean5 Median5 Middle range5 $ and1 .1 0 under ~ ~ ~ and
1 .2 0 1 .3 0 1 .4 0 1 .5 0 1 .6 0 1 .7 0 1 .8 0 1 .9 0 2 .0 0 2 .2 0 2 .4 0 2 .6 0 2 .8 0 3 .0 0 3 .2 0 3 .4 0 3 .6 0 o v e r$ $ $ $
364 1 .3 9 1 .9 1 1 .6 4 - 2 .1 2 11 4 - 3 18 9 115 14 2 55 47 29 45 12 - - _ - -350 1 .8 7 1 .8 b 1 .6 4 - 2 .0 8 11 4
"3 18 9 115 14 2 55 43 24 42 10 - “ “ -
773 1 .6 9 1 .6 6 1 .4 4 - 1 .9 4 52 7 84 34 38 78 163 71 22 78 49 11 8674 0 1 .6 7 1 .6 5 1 .4 3 - 1 .9 1 52 7 84 29 38 78 163 71 22 74 45 77 - - - - - -
8 ,3 4 9 2 .4 4 2 .6 6 1 .9 6 - 2 .8 7 29 - 71 130 792 115 62 337 46 7 149 4 99 776 572 1144 2140 577 48C 11 _4 ,3 6 3 2 .6 7 2 .8 0 2 . 5 4 - 2 .8 8 - - 40 21 4 6 17 36 62 46 262 322 405 963 1792 326 63 - -3 ,9 8 6 2 .1 8 2 .0 5 1 .5 4 - 2 .8 1 29
"31 io e 789 109 45 302 4 06 103 237 455 168 181 348 251 417 11
3 ,4 1 4 2 .7 7 2 .8 2 2 .7 2 - 2 .8 9 - - 21 - 4 - - 5 8 8 47 162 236 891 1671 3 04 9 -
949 2 .3 4 2 .3 1 2 . 0 4 - 2 .7 2 - - 19 21 - 6 17 30 53 37 217 161 119 72 121 22 54 - -
2 8 ,8 7 5 2 .1 6 2 .2 0 1 .9 2 - 2 .4 7 253 346 454 346 1030 667 964 1418 1438 1941 5555 4C88 6511 2518 927 387 36 _ _9 ,9 5 7 2 .3 8 2 .4 1 2 . 1 7 - 2 .6 1 - - 20 29 126 82 180 2 74 240 304 1387 2282 2391 1621 674 345 4 _ _
1 8 ,9 1 8 2 .0 5 2 .0 7 1 .8 0 - 2 .4 2 253 346 434 317 904 585 784 1145 1 198 1637 4168 1806 4120 896 253 42 32 _ _1 ,8 1 8 2 .2 7 2 .3 1 2 . 0 9 - 2 .4 7 - - 14 18 26 49 9 63 55 134 145 592 471 171 45 22 5 - -
4 9 U 2 .1 9 2 .2 9 1 .8 0 - 2 .5 0 - - 26 - 20 - 44 31 35 22 27 70 124 45 29 7 9 - -3 ,6 5 0 1 .9 6 1 .9 6 1 .6 0 - 2 .4 1 11 30 145 141 344 231 235 334 171 288 519 223 915 28 5 3 18 - -2 ,8 2 1 1 .9 9 2 .0 3 1 .8 2 - 2 .2 4 - 161 34 - 34 74 114 222 405 168 895 61 628 8 12 5 _ -
1 0 ,1 3 9 2 .0 5 2 .0 8 1 .8 3 - 2 .4 1 243 155 215 159 479 232 382 494 531 1026 2582 854 1981 645 162 - -
5 ,4 5 0 1 .8 6 1 .9 0 1 .7 0 - 2 .0 7 27 221 216 357 116 261 143 919 4 30 1099 556 548 504 56721 2 .1 5 2 .2 5 1 .9 3 - 2 .4 1 - - 9 29 15 6 10 30 55 98 70 209 175 18 _ _ _ - _
4 ,7 2 9 1 .8 2 1 .8 5 1 .6 3 - 2 .0 0 27 221 207 328 101 256 133 888 375 1001 486 340 329 38 - _ _ _ _258 1 .9 9 1 .9 4 1 .8 1 - 2 .3 2 - - - 19 - 3 - 38 36 80 7 31 44 _ _ _ _ _ _416 1 .5 2 1 .4 9 1 .2 5 - 1 .7 4 27 34 90 36 24 6C 34 15 32 26 9 18 10 _ _ _ _ _ _
2 ,4 7 8 1 .8 2 1 .7 9 1 .7 1 - 1 .9 8 - 186 14 141 38 78 88 811 148 466 86 202 220 _ _ _ _ _ _1 ,5 4 6 1 .8 7 1 .9 5 1 .6 9 - 2 .0 6 ~ 97 125 39 115 11 24 158 428 374 83 54 38 - - - - -
2 5 ,6 3 0 2 .6 9 2 .7 7 2 .4 2 - 3 .0 5 - - 42 176 70 183 315 4 49 473 932 1501 1853 2952 470 2 4176 ' 5 5C8 1810 534 69 ,6 0 1 2 .5 9 2 .6 5 2 .3 4 - 2 .8 5 - - - - 26 32 135 135 270 495 693 983 1415 2205 2041 377 595 196 6
1 6 , 079 2 .7 5 2 .3 6 2 .4 7 - 3 .1 0 - - 42 176 44 151 180 314 204 438 808 870 1537 2497 2136 5131 1215 338 -5 ,9 6 5 3 .0 1 3 .1 1 2 . 8 9 - 3 .1 8 - - - - - - - 5 - - 2 78 811 426 208 3462 781 192 -5 ,8 4 7 2 .6 8 2 .7 9 2 .5 1 - 2 .9 8 - - 11 116 11 19 23 31 63 233 598 296 241 1390 1456 1034 184 142 -4 ,1 3 0 2 .4 7 2 .5 0 2 . 0 0 - 2 .9 4 ~ ” 31 60 33 132 157 275 141 199 205 47 3 456 615 467 634 250 4 -
1 1 ,8 3 3 2 .7 4 2 .8 2 2 .5 5 - 2 .9 5 - - 4 6 90 55 51 67 166 227 524 75 3 1415 1957 4562 618 1123 201 152 ,2 4 9 2 .7 3 2 .8 1 2 .6 1 - 2 .9 3 - - - - - 10 5 2 1 16 320 1U8 80 540 883 48 51 187 -9 ,5 83 2 .7 4 2 .8 3 2 .5 4 - 2 .9 5 - - 4 6 90 45 46 65 165 211 205 645 1336 1417 3679 570 1C72 14 156 ,6 1 0 2 .7 1 2 .8 1 2 . 5 4 - 2 .9 0 - - - - 90 32 32 23 131 163 112 411 1042 1013 2730 435 398 - _2 ,4 4 1 2 .7 9 2 .8 6 2 . 4 6 - 3 .2 1 “ 4 6 ~ 13 14 42 34 48 93 233 230 352 597 87 659 14 15
3 ,4 5 5 2 .5 6 2 .6 4 2 . 3 6 - 2 .8 4 - 1 21 4C 35 21 42 76 126 52 250 247 778 511 993 161 48 46 71 ,7 3 6 2 .4 3 2 .5 2 2 .2 0 - 2 .6 1 - - 4 31 4 17 28 76 51 26 198 164 697 178 213 5 32 11 21 ,7 1 9 2 .6 8 2 .8 2 2 .7 0 - 2 .8 8 - 1 17 9 31 4 14 - 76 25 53 83 81 334 780 156 16 35 51 ,4 4 1 2 .6 9 2 .8 2 2 . 7 2 - 2 .8 7 “ ~ 11 7 29 7 ~ 56 12 34 39 65 328 756 98 - - -
1 ,0 9 0 2 .0 6 2 .0 1 1 . 8 1 - 2 .3 0 - 2 24 5 48 39 47 78 221 80 78 243 136 29 55 _ _ _ _
462 2 .1 0 2 .1 7 1 .8 0 - 2 .5 0 “ 2 20 5 44 35 4 4 29 45 61 95 33 29 55 - - - -
3 ,4 9 4 2 .6 8 2 .7 5 2 . 4 2 - 3 .0 1 - - 16 9 7 40 35 23 39 166 196 292 471 596 682 590 224 93 171 ,3 9 4 2 .7 2 2 .7 4 2 .4 9 - 2 .9 5 - - 8 8 - 10 - - 4 21 45 136 251 350 275 130 78 67 132 ,1 0 0 2 .6 5 2 .7 9 2 .3 4 - 3 .0 3 - - 8 1 7 30 35 23 35 145 152 156 220 247 40 7 459 146 26 4
913 2 .7 2 2 .8 9 2 . 4 4 - 3 .0 3 - - - - - 5 21 18 21 46 29 6b 58 104 273 179 93 - -1 ,0 3 2 2 .5 7 2 .6 1 2 . 1 6 - 3 .0 3 8 1 7 25 11 4 11 96 117 84 146 102 106 2 4 i 46 24 2
O ccu p a tio n 3 and in du stry d iv is io n
ELEVATOR OPERATORS, PASSENGER - NUNMANUFACTUR ING ----------------------
ELEVATOR OPERATORS, PASSENGER(WOMEN) --------------------------------------------
NONMANUFACTURING----------------------
GUARDS AND WATCHMEN----------------------MANUFACTURING----------------------------NONM ANUFACTUR ING----------------------
GUARDS:MANUFACTUR ING----------------------------
WATCHMEN:MANUFACTURING----------------------------
JANITORS, PORTERS, AND CLEANERSMANUFACTURING----------------------------NONMANUFACTURING----------------------
PUBLIC UTILITIES6 ------------------WHOLESALE TRADE--------------------RETAIL TRADE--------------------------FINANCE7 ------------------------------------SERVICES ----------------------------------
JANITORS, PORTERS, AND CLEANERS(WOMEN) --------------------------------------------
MAN UFACTUR ING----------------------------NONMANUFACTURING----------------------
PUBLIC UTILITIES6 ------------------RETAIL TRADE --------------------------FINANCE7 ------------------------------------S ERV ICES----------------------------------
LABORERS, MATERIAL HANDLING------MANUFACTURING----------------------------NONMANUFACTURING----------------------
PUBLIC UTILITIES6------------------WHOLESALE TRADE--------------------RETAIL TRADE--------------------------
ORDER FILLERS--------------------------------MANUFACTURING----------------------------NONMANUFACTURING----------------------
WHOLESALE TRADE--------------------RETAIL TRADE--------------------------
PACKERS, SHIPPING--------------------------MANUFACTURING----------------------------NONMANUFACTURING----------------------
WHOLESALE TRADE--------------------
PACKERS, SHIPPING (WOMEN)----------NONMANUFACTURING----------------------
RECEIVING CLERKS----------------------------MANUFACTURING----------------------------NONM ANUFACTUR ING----------------------
WHOLESALE TRADE--------------------RETAIL TRADE--------------------------
See footnotes at end o f tab le .
Digitized for FRASER http://fraser.stlouisfed.org/ Federal Reserve Bank of St. Louis

5 8
Table A-16. Custodial and Material Movement Occupations—West----Continued
(A v e ra g e s tra ig h t-t im e h ou rly ea rn in gs fo r se le c te d o ccu p a tio n s by in du stry d iv is io nin the W est, 1 F e b ru a ry 1965 2)
Hourly earnings Number of workers receiving straight-time hourly earnings of—
O ccu p a t io n 3 and in du stry d iv is io n
SHIPPING CLERKS------------------------------------MANUFACTURING----------------------------------NONMANUFACTUR ING----------------------------
WHOLESALE TRADE --------------------------
SHIPPING AND RECEIVING CLERKS --------M ANUFACTUR ING----------------------------------NONMANUFACTUR ING----------------------------
WHOLESALF TRADE --------------------------RETAIL TRADE--------------------------------
TRUCK DR IVERS8 ----------------------------------------MANUFACTUR ING----------------------------------NONMANUFACTURING----------------------------
PUBLIC UTILITIES6------------------------WHOLESALE TRADE --------------------------RETAIL TRADE--------------------------------SERVICES----------------------------------------
TRUCKDR IVERS. LIGHT (UNDER1 -1 /2 TUNS) --------------------------------------MANUFACTURING----------------------------------NONMANUFACTUR ING----------------------------
PUBLIC UTILITIES6------------------------WHOLESALE TRADE --------------------------RETAIL TRADE --------------------------------
TRUCKOR IVERS. MEDIUM ( 1 -1 /2 TOAND INCLUDING 4 TONS)------------------MANUFACTURING----------------------------------NONMANUFACTURING----------------------------
PUBLIC UTILITIES6------------------------WHOLESALE TRADE --------------------------RETAIL TRADE--------------------------------
TRUCKDRIVERS. HEAVY (CVER 4 TONSTRAILER TYPE)----------------------------------MANUFACTURING----------------------------------NONMANUFACTURING----------------------------
PUBLIC UTILITIES6------------------------WHOLESALE TRADE--------------------------RETAIL TRADE--------------------------------
TRUCKDRIVERS, HEAVY (CVER 4 TONSOTHER THAN TRAILER TYPE) ------------MANUFACTURING----------------------------------NONMANUFACTURING----------------------------
WHOLESALE TRADE------------- -------------
Number $ $ $ S $ $ $ $ $ $ S $ $ 1 * $ $ %1 .1 0 1 . 2 0 1.3C 1.40 1 .50 1 .6 0 1 .7 0 1 .80 1 .90 2 .0 0 2 . 2 0 2 .4 0 2 .6 0 2 .80 3 .00 3 .20 3 .40 3 .60
workers Mean5 Median5 Middle range 5 $ and and1 . 10 under
1 .2 0 1.30 l.MC 1.50 1 .60 1 .7 0 1 . 80 1 .90 2 . 0 0 2 . 2 0 2.40 2 .6 0 2 .80 3 .00 3 .20 3 .40 3 .60 over
$ $ $ $2 ,038 2.74 2.81 2 .4 2 - 3.C9 - - - - - 11 - 5 5 76 192 19 1 277 236 349 400 194 61 401,096 2.71 2 .6 8 2 .4 0 - 3.GS - - - - - - - 5 3 2 140 124 2 2 0 117 167 147 1 0 2 46 24
942 2.78 2.91 2 .5 0 - 3 .10 - - - - - 11 - - 3 74 53 67 57 119 182 254 92 15 16711 2.72 2 .8 6 2 .3 9 - 3 .05 - - - - - 11 - 74 40 58 26 90 175 169 60 8 -
2 ,480 2 .84 2 .83 2 .6 1 - 3.10 _ _ _ _ 2 4 14 2 5 32 74 153 3C3 569 434 375 294 150 651,190 2.71 2 .70 2 .5 4 - 2 .87 - - - - - 4 - - 4. 7 17 92 261 384 251 74 45 52 -1,290 2.95 3 .03 2 .7 5 - 3 .27 - - - - 2 - 14 2 1 25 57 65 42 185 183 3C1 249 98 65
591 3.19 3 .27 3 .0 4 - 3.42 - - - - - - - - - - 12 19 5 25 50 134 189 94 63415 2.84 2 .97 2 .7 4 - 3 .03 - - - 2 6 2 “ 1 19 33 32 17 1 1 2 135 52 4 -
37,662 3.05 3 .18 2 .8 8 - 3.35 _ _ 32 AO 1 0 0 290 146 358 138 196 1226 1197 1623 2912 2 7U4 9757 9472 6326 11459,715 3.01 3 . 12 2 .7 3 - 3 .33 - - - - 4 27 2 0 155 48 76 301 5 84 555 991 1053 2237 1482 1531 653
27,947 3.07 3 .19 2 .9 8 - 3 .34 - - 32 40 96 263 126 203 90 1 2 1 926 613 1 0 o8 1921 1650 7519 7990 4796 49214,449 3.18 3 .21 3 .1 3 - 3.31 - - - - - - - - 15 2 78 21 157 1035 287 5412 5046 2348 47
8,035 2.92 3.12 2 .6 3 - 3 .30 - - 22 4 79 144 73 62 47 109 511 381 405 782 701 1253 2331 1064 6 63,948 2.9o 3.14 2 .5 6 - 3 .46 - - 10 37 17 116 37 107 28 9 237 180 305 55 579 425 565 879 3641,479 3.02 3.16 2 .6 0 - 3 .44 ~ ~ ~ 3 16 33 ~ ~ 99 31 190 28 83 429 48 505 15
4,638 2.70 2 .72 2 .2 3 - 3 .23 _ _ 32 35 1 2 84 52 130 65 86 622 481 390 506 227 680 537 700 _1 ,281 2.78 2 .74 2 .4 4 - 3.31 - - - - 4 27 - 36 19 6 1 11 90 197 2 0 1 141 83 230 132 -3,357 2.69 2 .72 2 .1 4 - 3.21 - - 32 35 8 57 52 94 46 80 511 390 193 306 8 8 591 307 568 -
725 3.28 3.51 3 .2 1 - 3 .56 - - - - - - - - - - 7 4 49 38 2 0 53 146 407 -1,447 2.39 2 .36 2 .0 5 - 2 .71 - - 2 2 4 - 26 44 54 24 77 279 2 90 126 242 3 103 142 12 -
362 2.05 2 .06 1 .8 0 - 2 .25 ~ 10 31 8 28 6 6 2 2 3 125 65 14 1 7 16 19
14,348 3.01 3 .14 2 .8 3 - 3 .26 _ _ _ _ 9 135 67 2 2 0 53 67 262 377 706 1519 974 5241 3193 1291 2363,105 2.93 3 .06 2 .6 4 - 3 .34 - - - - - - 2 0 119 19 37 127 180 178 349 291 842 399 340 203
11,242 3.03 3 .15 2 .9 1 - 3 .25 - - - - 9 135 47 101 34 30 135 1 96 528 1170 683 4398 2794 951 337,147 3.13 3.17 3 .1 2 - 3.25 - - - - - - - - 9 - 64 14 51 663 223 3617 1969 538 -2,661 2.97 3 .07 2 .6 7 - 3.28 - - - - - 47 29 - 23 30 14 86 169 465 2 2 2 562 669 345 -1,118 2.67 2 .8 4 2 .2 5 - 3 .13 “ ~ “ “ 9 87 4 101 2 “ 56 97 1 11 19 223 219 108 50 33
11,892 3.24 3.28 3 .1 5 - 3 .44 _ _ _ _ _ _ 27 _ _ 28 240 27 155 508 552 2511 4073 3117 6542,268 3.23 3 .30 3 .1 2 - 3 .46 - - - - - - - - - 22 2 2 21 24 142 155 553 373 739 2149,625 3.24 3 .27 3 .1 6 - 3 .43 - - - - - - 27 - - 6 219 6 130 367 398 1953 3701 2378 4405,086 3.24 3 .25 3 .1 6 - 3.37 - - - - - - - - - - 3 - 5 267 29 1505 2268 963 472,706 3.15 3 .25 3 .0 0 - 3 .3 9 - - - - - - - - - - 216 6 105 65 283 265 1109 590 6 61,812 3.39 3 .46 3 .3 3 - 3 .57 ~ ~ ~ ~ “ ~ 27 “ 6 “ 21 35 75 172 323 825 327
4,371 3.09 3 .21 2 .8 5 - 3 .37 _ _ _ _ _ _ _ _ 11 13 99 306 2 2 2 234 514 702 1324 708 2402 ,029 3.03 3 .11 2 .7 3 - 3.42 - - - - - - - - 11 11 42 283 98 174 239 430 207 295 2362,342 3.14 3 .25 3 .0 9 - 3 .35 - - - - - - - - - 2 57 18 124 60 275 272 1117 413 4
871 3.21 3 .26 3 .1 3 - 3 .36 2 2 5 103 247 395 117
See foo tn otes at end o f ta b le .
Digitized for FRASER http://fraser.stlouisfed.org/ Federal Reserve Bank of St. Louis

5 9
Table A-16. Custodial and Material Movement Occupations—West----Continued
(A v e ra g e s tra ig h t-t im e h ou rly ea rn in gs fo r s e le c te d o ccu p a tion s by in du stry d iv is io n in the W est, 1 F e b ru a ry 1965 2)
H o u rly e a rn in g s Number of workers receiving straight-time hourly earnings of—s i i $ S 1 S t * % i f i $ i *>1.10 1.20 1.30 1 . 4 0 1 . 5 0 1 . 6 0 1.70 1.80 1 . 9 0 2 . 0 0 2 . 2 0 2 . 4 0 2 . 6 0 2 . 8 0 3 . 0 0 3 . 2 0 3 . 4 0 3 . 6 0
Occupation3 4 and industry division of Underworke rs M e a n 5 M e d i a n 5 M id d l e r a n g e5 $ and and
1.10 under
1 . 2 0 1.30 1.40 1 . 5 0 1.60 1 . 7 C 1.80 1 . 9 0 2 . 0 0 2 . 2 0 2 . 4 3 2 . 6 0 ? . 8 0 3.00 3 . 2 0 3 . V 3 . 6 0 over
$ $ $ $TRUCKERS, POWER (FORKLIFT) --------- 11,601 2.87 2.91 2.66- 3.07 - - - - - 19 19 3 84 2 30 213 615 1227 1776 3741 1587 1156 874 6 0
MA NUFACTURING--------------------- 7,535 2.77 2.83 2.59- 2.96 - - - - - 8 19 3 79 43 213 545 1061 1404 3000 6 5 7 167 2 6 2 36NONMANUFACTURING----------------- 4 , C66 3.06 3.10 2.89- 3.35 - - - - - 11 - - 5 187 - 70 165 373 741 890 989 612 24
PUBLIC UTILITIES6 7 8--------------- 1,354 2.96 3.14 2.67- 3.34 - - - - - - - - - 173 - 4 113 114 189 232 305 224 -WHOLESALE TRAOE ---------------- 1,712 3.09 3.08 2.92- 3.38 - - - - - 11 - - 5 14 - 37 47 166 358 444 266 347 18RETAIL T R A O E -------------------- 879 3.15 3.29 3.01- 3.35 ~ ~ ~ - ~ - 2 9 4 49 124 214 418 41
TRUCKERS, POWER (OTHER THANF O RK LI FT )---------------------------- 2,204 2.85 2.79 2.63- 3.21 - - - - - - - - - 5 19 142 266 69 3 418 58 533 54 16
MANUFACTURING --------------------- 1,558 2.78 2.76 2.63- 2.94 - - - - - - - - - 5 14 1 1 0 170 612 413 48 143 27 1 6
NONMANUFACTURING ----------------- 646 3.03 3.24 2.64- 3.30 " ~ “ ~ - “ “ 5 3 2 9 6 8 1 5 1 0 390 27 -
1 F o r defin ition o f re g io n s , see footn ote 3 to the table in appendix A .2 A v e ra g e m onth o f r e fe r e n c e . Data w e re c o l le c te d during the p e r io d July 1964 through June 1965.3 Data lim ite d to m en w o rk e r s e x cep t w here o th e rw ise in d ica ted .4 E x clu des p rem iu m pay fo r o v e rt im e and fo r w ork on w eeken d s, h o lid a y s , and la te sh ifts .5 F o r de fin ition o f te rm s , see footn ote 3, tab le A - l .6 T ra n sp orta tion , co m m u n ica tion , and oth er pu blic u t ilit ie s .7 F in a n ce , in su ra n ce , and re a l esta te .8 Includes a ll d r iv e r s r e g a rd le s s o f s iz e and type o f tru ck o p era ted .
Digitized for FRASER http://fraser.stlouisfed.org/ Federal Reserve Bank of St. Louis

Digitized for FRASER http://fraser.stlouisfed.org/ Federal Reserve Bank of St. Louis

W age Differences Among Metropolitan Areas
C om parison o f occupational averages fo r two areas o r m ore w ill gen era lly show that the magnitude o f wage d iffe re n ce s , whether m easu red in absolute or in re la tive te rm s , v a r ie s am ong occu pation s. Any o f sev era l fa c to rs m ay account fo r the v aria tion . Perhaps f o r e m ost, establishm ents d iffer in their general pay lev e ls and o ccu p a tional staffing and, thus, in their contribution to the pay averages re co rd e d fo r the jo b s studied. Interestablishm ent d iffe ren ces m ay o c cu r in the position ing o f particu lar jo b s in the wage or sa lary stru ctu re becau se o f d iffe ren ces in evaluation, c o lle c t iv e bargaining, o r the la bor supply situation.
Inter area d ifferen ces in pay le v e ls are exam ined h ere in te rm s o f average wage rates fo r three occupational g rou ps— o ffic e c le r ic a l , sk illed m aintenance, and unskilled plant w ork ers . Pay le v e ls in the areas studied are ex p ressed as percen tages o f national le v e ls and are p resen ted in table 1 fo r a ll in du stries com bined and separately fo r m anufacturing and nonm anufacturing.
Pay relationsh ips based on occupations included in the m e tro politan area wage surveys w ill not n e ce s sa r ily co rresp on d c lo s e ly to those obtained by com paring averages fo r b roa d er grou ps, such as all production w ork ers in m anufacturing, o r fo r sp e cific in du stries . W hereas in terarea d iffe ren ces in pay fo r production w ork ers m ay, in som e situations, la rg e ly re f le c t d iffe ren ces in occupational and sk ill com p os ition o f the production labor fo r c e o r in the in ciden ce and nature o f incentive pay plans, such in fluence is a lm ost com p lete ly e lim inated in the in terarea com p a rison s by basing the pay re la tives on a constant lis t o f jo b s .
D etailed rep orts issu ed on the B u reau 's su rveys in individual m etropolitan areas indicate that individual em p loyee pay rates within the sam e occupation and industry d iv is ion w ere d istributed ov er a wide range; quite com m on ly , the h ighest individual rates exceeded the low est rates in the sam e com m unity by 100 percen t or m o re . Inevitably , th ere fore , substantial overla p m ay be found in the em ployee distributions in areas with sign ifican tly d ifferent average rates fo r the sam e occupation .
The use o f averages fo r the sam e jo b s in each area , to gether with the assum ption o f a constant em ploym ent relationsh ip betw een jo b s in all a rea s , elim in ates in terarea d iffe ren ces in o c c u pational com p osition as a fa c to r in exam ining pay le v e ls . Although
adjustm ents w ere m ade fo r d iffe ren ces in the tim ing o f su rveys in individual a rea s , the m u ltip lic ity o f wage actions within m etropolitan areas p reclu des obtaining exact com parab ility through the procedu re outlined under "M ethod o f Com puting A rea Pay R elatives . "
M ethod o f Com puting A rea Pay R elatives
The fo llow in g m ethod was used in com puting the data used in the wage com p a rison s . A ggregates fo r all in du stries com bined and fo r m anufacturing and nonm anufacturing separately fo r each area w ere com puted by m ultiplying the average w eekly sa lary fo r each o f 19 o ffice jo b s and the average stra ight-tim e hourly earnings fo r each o f 8 sk illed m aintenance job s and 2 unskilled plant jo b s by the a ll-in d u stry em ploym ent in the jo b in all Standard M etropolitan A reas com bined . 13
F or pu rposes o f this com pa rison , aggregates fo r each jo b and industry group are e x p ressed as percen tages o f like groups in the 212 m etropolitan areas com bined, adjusted fo r d iffe ren ces in survey tim ing. The nationwide estim ates relate to F ebru ary 1964 and F ebru ary 1965. 14
The adjustm ent fo r tim ing d iffe ren ces assum ed that the nationwide wage le v e l in cre a se d u n iform ly over the 12 months betw een annual studies and that an interm ediate lev e l fo r any intervening month, in w hich individual areas w ere studied, cou ld be obtained by adding the estim ated wage in crem en t to F ebru ary 1964 pay le v e ls .
Interarea C om parisons
Wage le v e ls d iffe red w idely am ong the 80 m etropolitan areas surveyed, with average rates fo r unskilled plant w ork ers in the highest pay area being a lm ost double those in the low est. The m axim um in ter area wage spread fo r o ff ic e c le r ic a l w ork ers and sk illed m aintenance w ork ers am ounted to 40 and 64 percent, resp ectiv e ly .
N early a ll o f the areas with above average pay le v e ls had la rge num bers o f w ork ers in industries with com parative ly high w ages, such as tran sportation equipm ent (autom obiles o r a ircra ft), petroleu m refin ing, ch e m ica ls , steel, o r rubber. On the other hand, areas with
The jobs are listed on p. 70.Average month o f reference. Data were co llected during the period July o f one year through
June o f the next year.
61
220-617 0 - 66 -5
Digitized for FRASER http://fraser.stlouisfed.org/ Federal Reserve Bank of St. Louis

62
la rge concentration s o f w ork ers in tex tiles , apparel, footw ear, o r the low er wage food in du stries tended to r e co r d below average pay le v e ls . R eg ard less o f industria l com position ; w ages w ere usually h ighest in the la rge m etropolitan areas and low est in the sm all on es.
A ll Industries C om bin ed . Am ong 79 areas included in the o ffic e c le r ic a l pay com p a rison s , D etroit was h igh est, at 115 p ercen t o f the nationwide urban le v e l. Beaumont—P o rt Arthur, the only oneo f the top five a reas with a population o f le s s than 1 m illion , had the secon d h ighest pay re lative (112). L os A ngeles—Long B each , San F ra n cis co —Oakland, and San D iego w ere 111, 110, and 107 percen t,re sp e ctiv e ly , o f the national le v e l. A llentow n^B ethlehem -E aston and C harleston (W . V a .) , at 106 percen t tied fo r sixth p osition in the ranking. T h ree areas— C h icago, Dayton, and Seattle— had re la tives o f 105 each , w hile New Y ork , with on e-seven th o f the o ffic e c le r ic a l w ork ers in m etropolitan a re a s , ranked 11th as did five other areas (A kron , C leveland , P ittsburgh, San B ernardino—R iversid e—O ntario, and W aterloo) at 104 p ercen t. 15 Six additional areas had pay re la tives above the national average , and two others— M ilwaukee and P ortland (O re g .)— had re la tives equal to the national figu re (100). Of the 55 rem aining areas fo r w hich data m et publication c r ite r ia , 41 had re la tives betw een 90 and 99, and 14 between 80 and 89. Ten o f the la tter group w ere lo ca ted in the South.
Skilled m aintenance rates w ere h ighest in San F ra n cis co — Oakland, w here a re la tive o f 113 was re co rd e d . D etroit ranked secon d at 109 percen t o f national pay, w hile C hicago was in th ird position (107 percen t). The pay re la tive fo r M ilwaukee and San D iego was 106, com pa red with 105 fo r C harleston (W . V a .), Davenport—R ock Island—M oline, L os A n geles—Long Beach, and St. L ou is . E leven area s , w idely separated geograp h ica lly and v a r ied in population s ize , had re la tives o f 102 each. Am ong the other areas fo r w hich data are presen ted , the low est pay re la tive , 69 in G reen ville , was 17 percen t below the next low est, 81, found in L ittle Rock—N orth L ittle R ock and Portland (M aine).
Pay re la tives fo r unsk illed plant w ork ers ranged fro m 126 in Akron and 125 in San F ra n cis co —Oakland to 65 in three areas (G reen v ille , Jackson, M is s ., and R aleigh ). As shown in the fo llow ing tabulation, u nskilled pay re la tives w ere below 80 in 18 o f 26 southern areas , w hereas on ly 1 southern area had a re la tive o f le s s than 80 fo r sk illed m aintenance and none fo r o ff ic e c le r ic a l w ork ers .
If comparisons were based on average hourly earnings instead o f average weekly earnings, New York would rank near the top for o ffice c lerica l workers. More than half o f such workers in New York were scheduled to work 35 hours a w eek, and 86 percent, less than 40 hours. In thetwo highest ranking areas, Detroit and Beaumont—Port Arthur, 16 and 2 percent, respectively, o f the o ffice c lerica l workers had work schedules o f less than 40 hours.
D istr ib u tion o f area re la tiv es
Number80
and90and
100and 110
o f Under under under under andJob group and region areas 80 90 100 110 over
O ffice clerica l:Northeast--------------------------- 19 3 10 6 -S ou th -------------------------------- 26 10 13 2 1North C en tra l------------------- 23 1 13 8 1W est......................................... 11 - 5 4 2
Skilled maintenance:Northeast--------------------------- 18 5 9 4 -S ou th -------------------------------- 20 1 4 10 5 _
North C en tra l------------------ 23 - 8 15 -W est---------------------------------- 10 - - 9 1
Unskilled plant:Northeast--------------------------- 19 3 9 5 2S ou th -------------------------------- 26 1 18 4 2 2 _
North C en tra l------------------ 24 - 4 12 8W est............................. ........... 11 - 3 3 5
1 Includes 6 areas under 70.
The im pact o f unskilled labor rates in the South on the a ll-a r e a average is re fle cte d in com p a ra tive ly h igher pay re la tives in other reg ion s fo r this jo b group than fo r o ffic e c le r ic a l and sk illed m aintenance w o r k e r s .16 In the North C entral reg ion , fo r exam ple, eight areas had re la tives o f 110 and ov er fo r unskilled plant w ork ers , w hile only one area (D etroit) had a com parable pay le v e l fo r o ffic e c le r ic a l and none fo r the sk illed m aintenance occupational group.
The fa c to r s that distinguish one a r e a 's pay le v e l fro m another are gen era lly in terre la ted , and the in fluence o f a single fa ctor can seldom be iso la ted . T h ere fore , the co rre la t io n o f re la tive pay lev e ls with a particu lar ch a ra cte r is t ic does not n e ce s sa r ily im ply a causal relationsh ip . The exam ination that fo llow s should be v iew ed with these lim itations in m ind.
Nationwide pay le v e ls fo r each o f the three jo b groups w ere , fo r the m ost part, h ighest in la rg e m etropolitan areas and low est in sm all a rea s . As shown in the fo llow in g tabulation, a d istinct m a jor ity o f the areas with I960 populations o f 1 m illion or m ore had pay re la tives o f 100 o r m o re . Am ong areas with le s s than 250, 000 population, the la rg e st proportion o f areas with pay re la tives o f 100 o r m ore w as 22 percen t fo r unskilled plant w ork ers ; the highest p roportion am ong areas o f in term ed ia te -s ize was 47 percen t fo r sk illed m aintenance.
A fifth o f the woricers in Ike unskilled in die South.
jobs (janitors and laborers, material handling) were
Digitized for FRASER http://fraser.stlouisfed.org/ Federal Reserve Bank of St. Louis

Percent of areas with pay relatives __________ of 100 or more__________
Office Skilled UnskilledArea population clerical maintenance plant
■j nor) 000 or tnoi^- 58 67 71250,000 but less than 1,000,000-------- 24 47 42Less than 250,000 ----------------------------- 6 15 22
Wage su periority am ong large m etropolitan areas was le ss sign ificant when the exam ination was d irected to com pa rison s within broad reg ion s . Using m ed ian -area pay re la tives to point out average d iffe ren ces am ong various a r e a -s iz e groups within reg ion s, pay lev e ls in the la rge areas w ere not consistently above those in areas of other s iz e s . M edian -area pay re la tives , as shown in the follow ing tabulation, w ere highest in the la rge areas in 8 o f 12 jo b g rou p -reg ion com p a rison s .
Median-■area pay relatives among areas with population of—
1 ,000,000 250, 000 but less Less than AllJob group and region or more than 1,000,000 250,000 areas
Office clerical:Northeast------------------------- 101 98 91 97South------------------------------ 97 93 84 93North Central------------------ 99 99 98 98West-------------------------------- 109 99 - 100
Skilled maintenance:Northe ast------------------------- 100 92 89 94South------------------------- *---- 95 95 81 95North Central------------------ 105 102 94 102West--------------------------------- 106 102 - 103
Unskilled plant:Northeast-------------------------- 106 97 91 97South------------------------------- 78 78 66 77North Central------------------- 108 105 109 107West--------------------------------- 116 100 - 109
F or each o f the job groups, in terreg ion a l com pa rison s o f re la tives revea led that pay le v e ls w ere h ighest in the W est and low est in the South in large areas . In the m ed iu m -s ize area group, the North C entral reg ion had the highest pay m edian fo r unskilled plant w ork ers, and shared the highest position with the West fo r o ffice c le r ic a l and sk illed m aintenance; in contrast, the South had the low est pay lev e ls except fo r sk illed m aintenance w ork ers , w here the low est level was in the N ortheast. M edian re la tives , by region , o f areas with populations o f le s s than on e-qu arter m illion w ere all below the
63
national average with the exception of unskilled plant w ork ers in the North Central region . (None o f the w estern areas studied w ere in this popu la tion -size group, so the West was not included in this com parison . )
M anufacturing. Pay re la tives fo r m anufacturing and nonm anufacturing, based on 212-a re a pay leve ls for each of these d iv isions, are shown separately in table 1. The om ission o f estim ates fo r sk illed m aintenance occupations in nonm anufacturing re fle cts the concentration o f this em ploym ent group in m anufacturing activ ities . Pay relative values and rank o f individual areas in m anufacturing d iffered from the a ll-in d u stry re la tives . The range of the in du stry 's pay re la tives is indicated in the follow ing tabulation:
Area pay relatives in manufacturing industries
Job group Highest Lowest
Office clerical----------- Detroit------------------------------------------- 120 Scranton--------------------------------- ------82San D ie g o -------------------------------------- 113 Prov idence - P awtucke t------------ ------84Los Angeles—Long Beach and Chattanooga and
San Francisco-Oakland----------------- 111 Oklahoma City--------------------- ------88
Skilled maintenance--■ San Francisco-Oakland------------------ 113 Little Rock—North LittleDetroit------------------------------------------- 110 R o ck ----------------------------------- ----- 78Davenport—Rock Island—Moline Portland (Maine)--------------------- ------81
and San Diego------------------------------- 106 Providence-Pawtucket andYorit------------------------------------- ----- 83
Unskilled plant---------- San Diego and San Francisco-Oakland---------------------------------------- 122 Greenville------------------------------ ----- 61
Akron--------------------------------------------- 120 Lubbock and Raleigh-------------- ----- 62Detroit------------------------------------------- 118 Charlotte--------------------------------■ — 63
The four areas with the highest pay re la tives fo r o ffice c le r ica l w ork ers had populations o f over 1 m illion ; three w ere located in the W est. T ransportation equipm ent was the m ost im portant m anufacturing industry in D etroit and L os A ngeles—Long Beach. Ordnance was the m a jor group within m anufacturing in San D iego, and food in San F ra n cisco —Oakland.
The four areas with the low est pay re la tives for o ffice c le r ic a l w ork ers had populations o f le s s than 1 m illion ; two of them had le s s than 300, 000 population. Half o f these low er paying areas w ere located in the N ortheast, and the other two areas w ere in the South. The m ost im portant m anufacturing industries in Scranton and Chattanooga w ere apparel and tex tiles , resp ectiv e ly . Oklahoma City, with only on e-th ird o f its w ork ers em ployed in m anufacturing in du stries , had a v ariety of m anufacturing activ ities that included about a fourth of
Digitized for FRASER http://fraser.stlouisfed.org/ Federal Reserve Bank of St. Louis

64
the m anufacturing em ploym ent in the food in du stries . The industrial com p os ition in P rov id en ce—Pawtucket had high concentration s of m anufacturing em ploym ent in tex tiles and variou s m isce lla n eou s m anufacturing in du stries .
Pay re la tives fo r sk illed m aintenance w ork ers in m anufacturing w ere iden tica l to the corresp on d in g re la tives fo r all industries in nearly half o f the 61 areas fo r w hich com p a rison s w ere obtainable. 17 S im ilarity of re la tives is expected , as m ore than 80 percen t o f the sk illed m aintenance w ork ers w ere em ployed in m anufacturing estab lish m en ts. Only two areas— L ittle R ock—North L ittle R ock and Y ork— had pay re la tives which d iffered 3 points from the correspon d in g a ll-in d u stry re la tives , while all other areas had d iffe ren ces of 2 points or le s s . The prim e cause fo r d iffe ren ces betw een the a ll-in d u stry and m anufacturing re la tives was traceab le to auto m ech an ics ; le s s than three-ten th s o f these w ork ers w ere em ployed in m anufacturing estab lish m en ts. C on verse ly , m ore than nine-tenths o f the aggregate e m ploym ent in the other seven sk illed m aintenance job s se lected fo r this study was in m anufacturing. The e ffe ct o f auto m ech an ics ' rates on re la tives can best be illu strated in L ittle Rock—North Little R ock, w here auto m ech an ics averaged $ 2 . 7 7 on an a ll-in d u stry basis and $ 2. 14 in m anufacturing, and in Y ork, w here the a ll-in d u stry average o f $ 2 . 7 8 was 58 cents grea ter than the m anufacturing average.
The areas with highest pay re la tives fo r unskilled plant w ork ers w ere loca ted in the sam e reg ion s as the highest paying areas fo r o ffic e c le r ic a l and sk illed m aintenance w ork ers— North C entral and W est. D etroit, San D iego, and San F ra n cis co —Oakland, w hich ranked am ong the top four areas fo r o ffic e c le r ic a l and sk illed m aintenance w ork ers in m anufacturing, w ere jo in ed by Akron in the unskilled plant com p a rison . The latter area was heavily dom inated by the rubber industry, which accounted fo r over 50 percen t o f the a re a 's m anufacturing a ctiv ities . The eight low est area pay re la tives w ere found in the South; food or textiles w ere im portant m anufacturing indu stries in each o f these eight low er paying a reas .
N onm anufacturing. A rev iew o f pay re la tives in nonm anufacturing in du stries in d icates that the values and rank position o f in d ividual areas d iffered , substantially in som e areas , from those in m anufacturing or in all in du stries com bined . The highest and low est pay re la tives in nonm anufacturing are shown in the follow ing tabulation:
^ Comparisons were not made for 19 areas where data did not meet publication criteria for either all industries or manufacturing.
A rea p a y re la tiv es in nonm anufacturing industries
Job group Highest Lowest
Office clerical Los Angeles-Long Beach--------------------------------- --------112
Little Rock-North Little Rock and San Antonio---------- --------84
San Francisco-Oakland-------- --------I l l Chattanooga andChicago------------------------------- --------107 Portland (M aine)----------------- --------85Detroit and New
York----------------------------------- --------106
Unskilled plant------------San Francisco-OaklandSeattle------------------------Los Angeles-Long
Beach------------------------Akron and Portland
(O re g .)--------------------
130120 Jackson and San
Antonio--------------116 Fort Worth and
Little R ock - 115 North Little Rock-
66
68
C om parison s o f the high and low areas in nonm anufacturing with those in m anufacturing show that areas are not n e ce ssa r ily c o m m on to both lis tin g s . The m ost notable exception was San F ra n cis co — Oakland, which ranked among the fou r h ighest paying areas fo r each job group com p a rison in both m anufacturing and nonm anufacturing in du stries .
D etroit, Los A ngeles—Long Beach, and San F ra n cis co —Oakland w ere am ong the highest paying areas fo r o ffice c le r ic a l w ork ers in both m anufacturing and nonm anufacturing in du stries ; h ow ever, Chicago and New Y ork , w hich w ere lis ted among the areas with highest pay re la tives in the nonm anufacturing d iv ision , had a re lative o f 103 in m anufacturing and w ere tied with C leveland and Indianapolis fo r 11th position am ong the 56 areas fo r w hich data w ere shown. The areas with com pa ra tive ly low o ffic e pay re la tives in nonm anufacturing in du stries had populations o f le s s than th ree -q u a rter m illion and, except in Chattanooga w hich a lso ranked am ong the four low est paying areas in m anufacturing, did not have enough w ork ers to perm it publication o f re la tives fo r m anufacturing.
A verage pay rates fo r unskilled plant w ork ers in nonmanufacturing w ere highest in w estern areas and low est in southern areas . F our of the five h ighest paying areas w ere located in the W est and had pay re la tives that ex ceeded the correspon d in g re la tives fo r m anufacturing by 6 percentage points or m ore ; these areas , excepting San F ra n cis co —Oakland, had m uch higher position s in the nonm anufacturing sca le than in m anufacturing. The low est pay relative fo r a nonsouthern area— 82 in Portland (M aine)— ranked above 20 o f the 25 southern areas included in the nonm anufacturing com p a rison . The South was the only reg ion w here all areas reported unskilled plant rates below the national average .
Digitized for FRASER http://fraser.stlouisfed.org/ Federal Reserve Bank of St. Louis

Movement of Area Pay Relatives, 1961 to 1965
A com p a rison of occupational pay re la tives in 79 m etropolitan areas 18 studied in both 1961 and 1965 revea led that re la tive pay values fo r the unskilled plant occupations d iffered substantially in m ore areas than those fo r o ffice and sk illed m aintenance. 19 As shown in the fo llow in g tabulation, pay re la tives fo r unskilled plant w ork ers in m anufacturing w ere higher in 10 areas and low er in 5 areas by 5 points or m o re ; 11 area pay re la tives fo r the sam e jo b group in nonm anufacturing w ere 5 to 10 points low er than com parab le estim ates reported in the e a r lie r study.
Change in area pay relatives, 1961 to 1965
Industry and job group
Manufacturing
Office c le r ic a l-------- M em p h is-----
N ew Orleans -
Higher by 5 points or more
Skilled maintenance — N ew O rlean s------------------------- 5
Unskilled plant-
N onmanuf acturing
Unskilled plant-------
Lower by 5 points or more
C an ton -------------------------------- 5
Pittsburgh----------------------------- 6
---------------------- 5
------------------- 6
- Cincinnati, D enver, Manchester,
Seattle, and Washington------------ 5
Albuquerque, N ew Orleans,
and R ich m on d -----------------------6
Sioux Falls and W orcester------------ 8
D a y to n --------------------------
Pittsburgh-----------------------
Canton, Charleston (W. V a .),
and S p ok an e------------------
Fort Worth and Savannah------------ 6
Charlotte, G reenville,
Salt Lake C ity, and
South Bend--------------------------- 5Davenport—Rock Island—
M oline and Oklahoma City-------- 6
M ilwaukee and New H a v en ---------- 7
Rockford------------------------------ 8Portland (M a in e)--------------------- 9
T o le d o ---------------------------------10
Excludes W ilm ington which is no longer surveyed and San D iego which was not surveyed
in 1961.
For area pay relatives for 1961 , see Wages and R elated Benefits: Metropolitan A re a s ,
U nited States and R egional Summaries, 1 9 6 0 —61 (ELS Bulletin 1 2 8 5 - 8 4 , 1962 ), pp. 2 3 —30.
6 5
Rates fo r ja n itors and la b o re rs , m ateria l handling w ere m ore w idely d isp ersed than those fo r o ffice c le r ica l job s and sk illed m ain tenance. The rates fo r these job s are often a ffected by shifts in em ploym ent. F or exam ple, a lo s s o f w ork ers in a high wage plant or an in cre a se in em ploym ent in a low paying firm would cause a d ecrea se in ra tes .
T here w ere only seven changes o f 5 points or m ore fro m 1961 to 1965 involving the o ffice c le r ica l and sk illed m aintenance groups and these w ere all in m anufacturing. Pay re la tives fo r the o ffice c le r ic a l and sk illed m aintenance job groups in P ittsburgh d e cre a se d 6 points ov er the 4 y ea rs . These d e cre a se s w ere substantiated by com parin g wage changes in m anufacturing fo r these jo b groups in P ittsburgh with the wage changes in all m etropolitan areas over the sam e p eriod . O ffice c le r ic a l sa laries in P ittsburgh rose only 5. 1 percen t and sk illed m aintenance rates 4. 1 percen t fro m 1961 to 1965. Sa laries o f o ffice c le r ic a l w ork ers in all m etropolitan areas ro se 11 .6 percen t and rates fo r sk illed maintenance 10 .5 percen t. The com parative ly sm all in cre a se s in Pittsburgh are explained la rg e ly by the fact that the 1962 labor-m an agem en t agreem ent in steel, the dominant industry in the area , did not provide a general wage in cre a se .
New O rleans was the only area that had substantial changes in pay relative values fo r m anufacturing in each o f the occupational groups studied. E ach o f these changes in the relative w ere in cre a s e s , o f which the 7 -poin t in crea se fo r o ffice c le r ic a l w ork ers was highest. The upward m ovem ent o f the re la tives was also re fle cted in the wage trends fo r the three jo b groups from 1961 to 1965. The sa la ries o f o ffice c le r ic a l w ork ers in New O rleans in creased 17.1 percen t ov er this period , sk illed m aintenance 13, 1 percent, and unskilled plant w ork ers 12 .8 percen t. Wage rates in New Orleans have been a ffected by t h e entrance o f la rg e , h igh-paying m anufacturing plants into the area.
M ost o f the 29 areas with unusually high or low changes in their pay re la tives w ere sm aller m etropolitan areas with a population o f le s s than 500,000. Pay re la tives as w ell as wage trends fo r sm all areas are m ore lik e ly to be a ffected by unusual changes in a single in dustry or com pany. It should be noted that unusual changes in values and rank position o f individual area pay relatives can be supported by com p a rison o f the area wage trends with those in all m etropolitan areas .
Digitized for FRASER http://fraser.stlouisfed.org/ Federal Reserve Bank of St. Louis

66Table 1. Interarea Pay Comparisons
(Relative pay levels by industry division, March 1964 through February 1965)
O ffice c le r ic a l S killed m aintenance U nskilled plantA rea A ll
industriesM anufacturing
industriesN onm anufacturing
industriesA ll
industriesM anufacturing
industriesA ll
industriesM anufacturing
industriesN onmanuf ac tur ing
industries
A ll m etropolitan a r e a s _______ _____________ 100 100 100 100 100 100 100 100
N ortheast
A reas with 1 ,000 , 000 population o r m ore :B oston ------------------------------------------- ---------- — _ 93 92 95 94 94 95 93 98B u ffa lo ------ ----------------------- --------------------- 101 101 97 101 101 111 110 104N ewark and J e rse y C i t y ---------------------------------- 101 98 102 102 103 111 112 109New Y ork --------------- --------------------------------------- 104 103 106 101 103 106 103 110P ater son—C lifton—P a s s a ic ----- ----- ---------- — 101 99 98 98 98 103 96 104Philadelphia — -------------------------- --------------- 96 96 95 99 100 103 102 101P itts b u rg h ____________________________________ 104 105 101 100 100 107 108 106
A rea s w ith 250, 000 but le s s than 1, 000, 000 population:
A lban y-S ch enectady—T r o y ------------------------------- 99 96 98 96 95 96 91 102Allentow n—B ethlehem —Easton-------------------------- 106 104 97 93 93 105 102 104New H aven- ------------------------- -------------------------- 99 95 100 90 90 93 95 93P r o v idenc e—Pawtuck et-------------------------------------- 86 84 87 85 83 86 78 97T re n to n ----------------------------------------------------------- - 97 96 - 96 96 97 97 98W o rce ste r -------------- ------- ----------------------- — 91 90 87 89 89 97 93 98
A rea s with le ss than 250, 000 population:L aw rence—H a v e r h ill -------------------------------------- 91 - - 89 90 91 87 96M a n ch ester --------------------------------------------------------- 82 - - - - 81 73 87P o rtla n d -------------------------------------------------------------- 83 - 85 81 81 87 89 82S cran ton --------------------------------- -------------------------- 92 82 - 90 - 95 84 99W aterbury----------------------------------------------------------- 99 96 - 90 90 98 98 92Y o r k --------------------------------------------------------------------- 91 89 “ 86 83 91 85 101
South
A rea s with 1 ,000 , 000 population o r m ore :Atlanta _ ------- — ----------------------------------- 97 98 99 93 92 76 78 76Ba1timr‘T' <a - ... - - - . .. . . ..... 97 100 94 98 99 95 102 87D a lla s ------------------------------------------------------------------ 93 94 95 91 91 78 80 78H ou ston --------------------------------------------------------------- 99 99 100 100 101 77 86 73W ashington----------------------------------- ------------------- 102 - 105 95 - 87 89 87
A reas with 250, 000 but le ss than 1,0 0 0 , 000 population:
Beaum ont—P ort A r th u r ------------------------------------- 112 - - 103 105 95 101 -B irm in gh a m ------------------------------------------------------- 93 - 93 102 102 80 91 71C h arleston , W. V a --------------------- --------------- 106 - 99 105 105 106 114 97C h a rlo tte________________________________________ 88 - 90 - - 74 63 77Chattanooga________________________________ 87 88 85 86 86 81 83 69Forth W orth --------------------------------- ----- --------- 93 96 89 94 96 78 86 68J a ck so n v ille ------------------------------------------------------- 89 - 92 86 - 72 73 73L o u is v i lle _______________________________________ 96 96 96 103 104 100 105 93M em phis-------------------------------------------------------------- 88 90 88 92 91 74 76 74Miarni .............. . ___ 91 - 94 85 - 74 71 79New O rlea n s------------------------------------------------------- 93 99 91 97 98 73 85 70N orfolk—P ortsm ou th and
N ew port N ew s—Hampton--------------------------------- 94 - - 95 - 79 90 71Oklahom a C ity - ----------------------------------------------- 90 88 92 - - 81 79 83R ichm ond------------------------------------------------------------- 94 95 94 94 94 77 82 73San A n ton io_________________________________ __ 82 - 84 - - 66 67 66
A reas with le ss than 250, 000 population:G reen v ille— ----------------------- -------------------------- 82 - - 69 - 65 61 71J a ck so n --------------------------------------------------------------- 84 - 86 - - 65 65 66Little R ock—N orth L ittle R ock ------------------------- 83 - 84 81 78 68 68 68Lubbock--------------------------------------------------------------- 85 - 87 - - 67 62 73R aleigh----------------------------------- -------------------------- 84 - 87 - - 65 62 69Savannah-------------------------------------------------------------- 98 _ “ 97 1 97 76 76 78
See footnotes at end of table,
Digitized for FRASER http://fraser.stlouisfed.org/ Federal Reserve Bank of St. Louis

6 7
Table 1. Interarea Pay Comparisons----Continued
(R elative pay lev e ls by industry d iv ision , M arch 1964 through F eb ru a ry 1965)
(2 1 2 -a rea pay lev e ls fo r each industry and occupational groups 100)O ffice c le r ic a l Skilled m aintenance U nskilled plant
A rea A llindustries
Manuf ac tur ing industries
N onm anufacturingindustries
A llindustries
M anufactur ing industries
A llindustries
Manuf ac tur ing industries
N onm anufacturingindustries
N orth C entral
A rea s w ith 1 ,000 , 000 population o r m ore :C h ica g o _________________________________________ 105 103 107 107 105 106 100 111C in cin n ati--------- ----------------------------------------------- 98 95 97 98 99 104 104 100C levelan d------------------------------------------------------------ 104 103 103 102 102 110 111 105D e tr o it ------------------------------------------- --------------- 115 120 106 109 110 116 118 104K ansas C ity -------------------------------------------------------- 96 95 98 102 102 99 102 96M ilw aukee— ----- -------------------------- --------------- 100 100 •98 106 105 111 110 104M in neapolis—St. Paul -------------- ----------------- 93 89 96 104 104 112 107 113St. L o u is _________________ ________ __________ 98 96 99 105 105 102 104 101
A reas with 250, 000 but le ss than 1,000 , 000 population:
A k ron ------------------------------ --------------- --------------- 104 105 95 103 104 126 120 115Canton------------------------------------------------------------------ 96 94 - 96 97 107 106 99C olum bus-------------------------- ------------------------------- 94 97 93 99 99 94 96 89D avenport—R ock Is la n d -
Mo line --------------- ---------- -------------------------- 102 105 94 105 106 111 111 101Dayton—_______ -_____ _________________________ 105 104 102 102 102 106 109 96D es M o in e s -------------------------------------------------------- 88 92 88 102 101 104 108 94Indianapolis --------------------------------------------------- 99 103 95 103 103 100 103 93Omaha— --------------------- — ----------------------- - 95 93 97 99 100 102 101 103T o led o ----------- ----------- ---------- ---------------------------- 102 100 99 102 102 107 106 105W ich ita---------------------------------------------------------------- 98 98 - 95 94 101 99 96
A reas with less than 250, 000 population:G reen B a y --------------------- ----- -------------------------- 93 - - 90 89 108 103 112M uskegon—M uskegon H eigh ts-------------------------- 99 96 - 94 94 109 107 -R ock ford -------------------------------------------------------------- 93 89 - 90 90 97 92 105Sioux F a lls____________ ____________ ________ - - - - - 99 101 -South B en d ---------------------------------------------------------- 98 99 - 102 103 116 115 108W aterloo -------------------------------------------------------------- 104 ■ ■ 102 " 113 112 96
W est
A rea s with 1 ,000 , 000 population or m ore ;L os A n geles—Long B e a ch _____________________ 111 111 112 105 105 113 108 116San D iego------------------------------------------------------------- 107 113 101 106 106 114 122 112San F ra n cis co —Oakland------------------------------------- 110 111 111 113 113 125 122 130Seattle. — _ _ ------------------- — 105 107 103 103 “ 118 114 120
A reas with 250, 000 but le ss than 1,0 0 0 , 000 population:
A lbu q u erqu e----------------------------------------------------- 96 - 99 - - 97 90 103D e n v e r ------------------------------ ------------------------------- 99 97 101 100 99 105 106 104P h o e n ix --------------------------------------------------------------- 95 98 95 102 - 91 96 90P o rtla n d - -------------------------------------------------- — 100 95 103 103 103 110 107 115Salt Lake C i t y ----------------- -------------- -------------- 95 96 95 100 99 95 99 95San B ern ard in o—R iv ers id e—O ntario 1-------------- 104 - 105 102 103 100 102 94Spokane-------------------------------------------- --------------- 99 - 97 104 - 109 113 108
1 E stim ates fo r a ll industries and m anufacturing include paym ents under a "p ro g re ss sh arin g" plan in 1 m anufacturing establishm ent. E stim ates exclu sive o f such paym ents would have been identica l fo r o ffice c le r ic a l and unsk illed plant w o rk e rs . R elatives fo r sk illed m aintenance w ork ers in both a ll industries and m anufacturing would have been 100.
NOTE: D ashes indicate data that do not m eet publication c r ite r ia .
Digitized for FRASER http://fraser.stlouisfed.org/ Federal Reserve Bank of St. Louis

Digitized for FRASER http://fraser.stlouisfed.org/ Federal Reserve Bank of St. Louis

Trends in Occupational Earnings
A vera ge annual w age in crea ses o f o ffic e and plant w ork ers have shown a slow but steady declin e since I960. (See chart 1. ) O ffice c le r ic a l sa la ries in creased 2. 8 p ercen t from F ebru ary 1964 to F ebru ary 1965 as com pared to in creases o f 3. 3 percen t fro m F ebruary I960 to F ebru ary 1961 and F ebruary 1961 to F ebru ary 1962 (table 2). D eclining rates o f in crease are even m ore apparent for sk illed m ain tenance w ork ers w hose earnings showed a 1964—65 in crease o f 2. 4 p ercen t, com pared to a 1960—61 in crease o f 3 .6 percen t. Each y e a r 's in crea se fo r unskilled plant w ork ers has been slightly sm aller than that o f the p revious y ear , with the exception o f the year ending F ebru ary 1963. The latest average in crea se fo r unskilled plant w o rk ers was 2. 9 percen t.
The declin e in rates o f in crea se began even be fore I960, the earliest date fo r w hich national w age lev e ls w ere com puted. The Bureau o f Labor Statistics conducted wage su rveys in 20 m etropolitan areas 20 in both 1953 and 1965. M edian annual average in crea ses by industry and occupational group fo r these areas over the 12-year p eriod are provided in the follow ing tabulation:
1953-65
Occupational groupAll
industries M anufa cturing
Office clerical----------------------------- 3 .8 3 .8Industrial nurses--------------------------- 4 .3 4 .3Skilled maintenance-------------------- 4 .1 3 .9Unskilled plant----------------------------- 4 .1 4 .0
P ay rates fo r a ll groups studied ro se le s s between F ebru ary 1964 and F ebru ary 1965 in m anufacturing industries than in a ll industr ies com bined , and the in crea ses in m anufacturing w ere sm aller than those a y ea r e a r lie r .
An analysis o f the d ivergen ce between estim ates for m anufacturing and a ll industries com bined p rov id es som e insight into wage m ovem ents in the nonm anufacturing in du stries . Nonmanufacturing firm s accounted for about th ree -fifth s o f the o ffic e c le r ica l, nearly half o f the unskilled plant, and about a fifth o f the sk illed m aintenance w ork ers included in this m easu rem ent o f wage trends.
Atlanta, Baltimore, Boston, Buffalo, Chicago, Cleveland, Dallas, Denver, Kansas City, Los Angeles-Long Beach, Memphis, Milwaukee, Minneapolis-St. Paul, Newark and Jersey City, New York, Philadelphia, Portland (Oreg.), Providence—Pawtucket, St. Louis, and San Francisco—Oakland.
In creases w ere gen era lly sm aller fo r w ork ers in m anufacturing than in a ll industries com bined fo r the 4 -y e a r period from 1961 to 1965 (chart 2). Even in the W est, w here o ffice c le r ic a l rates ro se m ore in m anufacturing over this p eriod , the m anufacturing rates of in crease w ere sm aller in 3 o f the 4 y e a rs , but sign ificantly la rger for the year ending in F ebru ary 1964.
The 4 -y e a r a ll-in d u stry rates o f in crease for sk illed m a in tenance w ork ers by regions w ere : N ortheast, 11 .4 percen t; South, 11.4 percen t; North C entral, 11 percen t; and W est, 12.6 percen t. Although these p ercen tages w ere sm aller than those for unskilled plant w o rk e rs , the dollar value percen ts o f in crea se relate to co n siderably h igher base rates.
Com paring the N ation 's 10 la rgest m etropolitan area s , percen t in crea ses (over the 4 -y e a r period) w ere highest in the city o f New Y ork for sk illed m aintenance and unskilled plant w ork ers and highest in W ashington for o ffic e c le r ic a l w ork ers . The rates w ere higher than the national average for a ll three o f these occupational groups in Los A n geles—Long B each , New Y ork , and San F ra n cis co —Oakland, and low er in D etroit and Pittsburgh.
F ollow ing is a listing o f those o f the 80 m etropolitan areas studied in w hich w ork ers averaged the highest and low est rates o f in crease between the I960—61 and 1964—65 surveys.
Rate of wage increase
5 areas with highest 5 areas with lowestJob group increase increase
Office clerical------------------------------------- ----------16.8 Toledo--------------------■7.6Providence—
Pawtucket------ --------- 16.6 Pittsburgh-------------- 7 .7Manchester------ --------- 16.3 Canton------------------ 8 .2Fort Worth-------- --------- 16.0 Wichita---------------- 8 .6Raleigh ---------- --------- 15.9 Rockford-------------- 8 .7
Skilled maintenance trades---------------- --------- 19.1 Pittsburgh------------- 5.1Manchester------ --------- 18.9 Canton---------------- 7.1Salt Lake City ---------- 16.6 South Bend----------- 7 .7Greenville-------- --------- 16.5 Dayton------------------ 7 .8Atlanta------------ --------- 16.2 Charleston
(W .V a .) ------------- 8 .1
Unskilled plant------------------------------------- ---------21.8 Portland (Maine)-- 6 .3Jackson (Miss.)---------- 19.4 Canton------------------ 6 .6Manchester------- ---------19.0 Toledo------------------ 6 .9Richmond-------- ---------18.4 South Bend----------- 7 .2Seattle------------ -------- 18.4 Dayton------------------- 8 .0
69
Digitized for FRASER http://fraser.stlouisfed.org/ Federal Reserve Bank of St. Louis

70
M ost o f the areas with unusually high or low in crea ses w ere sm aller m etropolitan areas with populations o f le ss than half a m illion people. Wage trends o f sm all areas are m ore likely to be a ffected by unusual changes in a single industry or com pany. The com parative ly low in crea ses in P ittsburgh , a m a jor industrial cen ter, are explained la rge ly by the fact that the 1962 labor-m anagem ent agreem ent in stee l, the dominant industry in the area , did not provide a general wage in crease .
C overage and M ethod o f Computing Wage T rends
In com puting w age or sa lary tren ds, average w eekly sa la ries or hourly earnings fo r each o f the se lected occupations o f an o c c u pational group w ere m ultip lied by the 1961 em ploym ent in that job within the area . T hese w eighted earnings w ere totaled for each o c c u pational group and com pared with the correspon d in g aggregate o f the p revious year to a rr iv e at the percen tage change in earn ings. T hese w eighted earnings w ere a lso m ultip lied by the area weight (the ratio to total n onagricu ltural em ploym ent in the stratum to that in the area) and totaled fo r each econ om ic reg ion , and for a ll areas to perm it com pa rison on a reg ion a l and a ll-m etrop o lita n area b a sis . The indexes (table 3) w ere com puted by m ultiplying the ratios for each group aggregate fo r each period after the base year (1961).
The trend se r ie s is based on 1961 em ploym ent in the follow ing occupations:
Office clerical (men and women) Skilled maintenance (men)
Bookkeeping-machine operators, class BClerks, accounting, classes A and BClerics, file, classes A , B, and CClerics, orderClerics, payrollComptometer operatorsKeypunch operators, classes A and BOffice boys and girlsSecretariesStenographers, general Stenographers, senior Switchboard operators Tabulating-machine operators, class B Typists, classes A and B
CarpentersElectriciansMachinistsMechanicsMechanics (automotive)PaintersPipefittersTool and die makers
Unskilled plant (men)
Janitors, porters, and cleaners Laborers, material handling
In the analysis o f wage m ovem ents from 1953 to 1965, data fo r 1953 to 1961 w ere based on an average o f 1953 and 1954 em p loy m ent, w ere re s tr ic te d to w om en in the o ffice c le r ic a l and industria l nurse grou ps, and d iffe red som ewhat in occupations used.
About a th ird o f the o ffic e em ployees within scope o f the surveys w ere em ployed in occupations used in constructing the index for o ffic e w o rk e rs . About 7 p ercen t o f a ll plant w o rk e rs , the m a jority of whom w ere u nskilled , w ere em ployed in the se lected job s used in com puting the indexes for sk illed and unskilled w o rk e rs . A large m a jority o f the sk illed m aintenance w ork ers covered by the index w ere em ployed in m anufacturing establishm ents, w hereas the num ber o f unskilled w ork ers w as only slightly la rger in m anufacturing than in nonm anufacturing. About th ree -fifth s o f the o ffic e w ork ers w ere em ployed in nonm anufacturing industries .
L im itations o f the Data
The p ercen tages o f change m ea su re , p rin cip a lly , the effects o f (1) gen era l sa lary and wage changes, (2) m erit or other in crea ses in pay re ce iv e d by individual w ork ers w hile in the sam e job , and (3) changes in average w ages due to changes in the labor fo r c e resulting from labor tu rnover, fo r c e expansions and reductions, as w ell as changes in the p roportion o f w ork ers em ployed by establishm ents with d ifferent pay lev e ls . Changes in the labor fo r ce can cause in crea ses o r d e cre a se s in the occupational averages without actual wage changes. F or exam ple, a fo r ce expansion m ight in crea se the p roportion of low er paid w ork ers in a sp ecific occupation and thereby low er the average. S im ilarly , the m ovem ent o f a high-paying establishm ent out o f an area could cause average earnings in the area to drop , even though no change in rates o ccu rre d in other area establishm ents.
The use o f constant occupational em ploym ent and area w eights elim inates the e ffects o f changes in the p roportion o f w ork ers r e p r e sented in each job or area included in the data. The percen tages o f change are based on pay for stra igh t-tim e hours and th ere fore are not influenced by changes in the standard w ork schedules of sa la ried w ork ers or by prem iu m pay for overtim e .
Digitized for FRASER http://fraser.stlouisfed.org/ Federal Reserve Bank of St. Louis

71
Chart 1. Annual Wage Increases, 1960-65, 3 Occupational GroupsPercent5 ----------------------------------------------------------------------------------------------------------------------------------------------------
OFFICE CLERICAL WORKERS SKILLED PLANT WORKERS UNSKILLED PLANT WORKERS
4 -
in February
Digitized for FRASER http://fraser.stlouisfed.org/ Federal Reserve Bank of St. Louis

72
Chart 2. Wage Increases for Office Clerical and Unskilled Plant Workers— All Industries and Manufacturing, February 1 9 6 1 to February 1965
Percent Percent0 2 4 6 8 10 12 14 16 0 2 4 6 8 10 12 14 16
REGION
Northeast
South
NorthCentral
West
REGION
Northeast
South
NorthCentral
West
All industries Manufacturing
Digitized for FRASER http://fraser.stlouisfed.org/ Federal Reserve Bank of St. Louis

7 3
Table 2. Percentage Increases, Office and Plant--- All Metropolitan Areas
( P e r c e n t a g e i n c r e a s e s in a v e r a g e e a r n i n g s 1 f o r s e l e c t e d o c c u p a t io n a l g r o u p s in a l l m e t r o p o l i t a n a r e a s , 2 U n ite d S t a t e s , r e g i o n s , 3 a n d s e l e c t e d p e r io d s )
P e r i o d a n d a r e a
A l l i n d u s t r i e s M a n u f a c t u r in g
O ff ic e c l e r i c a l ( m e n a n d w o m e n )
I n d u s t r i a ln u r s e s
(m e n a n d w o m e n )
S k i l l e dm a in t e n a n c e
t r a d e s(m e n )
U n s k i l l e d p la n t w o r k e r s
(m e n )
O ff ic e c l e r i c a l (m e n a n d w o m e n )
I n d u s t r i a ln u r s e s
(m e n a n d w o m e n )
S k i l l e dm a in t e n a n c e
t r a d e s(m e n )
U n s k i l l e d p la n t w o r k e r s
(m e n )
F e b r u a r y 1 9 6 4 to F e b r u a r y 1 9 6 5 4
U n it e d S t a t e s ------------------------------------------------------------- 2 .8 2 . 5 2 .4 2 .9 2 . 5 2 . 3 2 .2 2 .6N o r t h e a s t ------------------------------ -------- --------------- 2 .7 2 .8 2 . 7 3 . 5 2 . 3 2 . 7 2 . 5 2 .8S o u th ------------------------------ ----- — — 3 . 2 1 .7 2 .6 3 .2 3 . 1 1 . 3 2 .4 3 . 5N o r th C e n t r a l ------ --------------- -------- — — 2 .4 2 . 1 2 . 1 2 .2 2 . 1 2 . 1 2 . 0 2 .0W e s t ----------------------------------------------------------------------- 3 . 1 3 .7 2 .4 3 .6 2 .9 3 . 3 1 .9 3 . 5
F e b r u a r y 1 96 3 to F e b r u a r y 1 9 6 4 4
U n ite d S t a t e s ______________________________________ 2 .8 2 .8 2 .7 3 . 1 2 .7 2 .8 2 .6 2 .9N o r t h e a s t ------------------------------------------------------------ 3 . 0 2 . 5 2 . 4 3 . 1 2 .7 2 . 3 2 . 3 2 .9S o u th ----------------------------------------------------------------------- 2 . 9 2 .4 2 . 3 3 .4 2 . 0 2 .4 2 . 2 3 . 2N o r th C e n t r a l - -------- ---------------- ------------------- 2 . 5 3 . 2 2 .8 3 . 0 2 .6 3 .0 2 .7 2 . 7W e s t ..................................................................................................... 3 . 0 3 . 3 3 . 7 3 . 2 3 . 6 3 .8 3 .8 3 .7
F e b r u a r y 1 96 2 to F e b r u a r y 1 9 6 3 4
U n ite d S t a t e s ------ ---------------- — ------------- ------ 2 .9 3 . 3 2 .7 3 . 3 2 .8 3 . 3 2 . 5 2 . 8a t . ________ ___ 2 .8 3 .6 2 .6 3 .6 2 .8 3 .6 2 . 3 2 .7
S o u th ----------------------------------------------------------------------- 3 . 2 3 . 2 2 .6 2 . 3 2 .9 3 . 0 2 .4 2 . 1N o r th C e n t r a l - ------------------------- ---------------- 2 . 5 2 .8 2 . 7 3 . 2 2 . 5 2 .8 2 .6 2 . 9W e s t ................................................................................................ 3 .4 4 . 4 2 . 7 4 . 1 3 . 3 4 . 5 2 . 7 3 . 3
F e b r u a r y 1961 to F e b r u a r y 1 9 6 2 4
U n ite d S t a t e s — ------------------- -------- ------------------ 3 . 3 3 .6 3 . 1 3 . 2 3 . 2 3 .4 2 . 9 3 . 2N o r t h e a s t ----------------------------------------------------------— 3 .4 4 . 0 3 .2 3 . 1 3 . 3 3 .8 3 . 1 3 . 2S o u th ----------------------------------------- ------------- --------- 3 . 4 3 . 3 3 .4 4 . 5 3 . 2 3 . 2 3 . 1 4 . 2N o r th C e n t r a l ------------ --------------------------------------- 3 . 1 3 . 3 2 .9 2 .8 3 . 1 3 . 2 2 .8 3 . 0W e s t .............................................................................................. 3 . 3 3 . 6 3 . 3 3 . 3 3 . 2 3 . 3 2 . 8 2 .6
F e b r u a r y I9 6 0 to ' F e b r u a r y 1 9 6 1 4
U n ite d S t a t e s ----------------------- — -------------------------- 3 . 3 3 . 7 3 .6 3 .6 3 . 5 3 . 7 3 .6 3 . 7N o r t h e a s t --------------------------- ----------- -------- 3 . 6 3 .6 3 .7 3 .6 3 . 7 3 .4 3 .6 3 .7S o u th — —— —— —__— —— ————— —— ___ 3 . 2 3 .8 3 .6 2 .6 3 . 5 3 .9 3 . 3 3 . 0N o r th C e n t r a l ------------------------- -------- -------- 2 .8 3 .9 3 . 6 4 . 1 3 . 2 4 . 0 3 .6 3 .9W e s t ..................................................................................................... 3 .7 3 . 4 3 .6 3 .7 3 .4 3 . 3 3 .8 3 .4
1 E a r n in g s o f o f f ic e c l e r i c a l w o r k e r s a n d i n d u s t r i a l n u r s e s r e l a t e to r e g u l a r s t r a i g h t - t i m e s a l a r i e s th a t a r e p a id f o r s t a n d a r d w o r k w e e k s . E a r n in g s o f s k i l l e d m a in t e n a n c e a n d u n s k i l l e d p la n t w o r k e r s r e l a t e to h o u r ly e a r n i n g s e x c lu d in g p r e m iu m p a y f o r o v e r t im e a n d w o r k o n w e e k e n d s , h o l i d a y s , a n d l a t e s h i f t s .
2 D a ta f o r th e F e b r u a r y 196 3 to F e b r u a r y 1 96 4 a n d F e b r u a r y 1 96 4 to F e b r u a r y 1 96 5 i n c r e a s e s r e l a t e to a l l 2 1 2 S t a n d a r d M e t r o p o l i t a n S t a t i s t i c a l A r e a s in th e U n ite d S t a t e s a s e s t a b l i s h e d b y th e B u r e a u o f th e B u d g e t t h r o u g h 1 9 6 1 . D a t a f o r e a r l i e r c o m p a r i s o n s r e l a t e to 188 a r e a s a s e s t a b l i s h e d t h r o u g h 1 9 5 9 .
3 F o r d e f in i t io n o f r e g io n s , s e e fo o tn o te 3 to th e t a b le in a p p e n d ix A . D a ta f o r th e 188 a r e a s e x c lu d e d A l a s k a a n d H a w a i i .4 A v e r a g e 'm o n t h s o f r e f e r e n c e . I n d iv id u a l a r e a s u r v e y s w e r e c o n d u c te d d u r in g th e p e r io d J u l y o f o n e y e a r t h r o u g h J u n e o f th e n e x t y e a r .
Digitized for FRASER http://fraser.stlouisfed.org/ Federal Reserve Bank of St. Louis

7 4
Table 3. W a g e Indexes, Office an d Plant--- All Metropolitan Areas
(Indexes of average earnings1 for selected occupational groups in all metropolitan a re a s ,2 United States, and regions, 3 4 February I960 to February 1965)
(February 1961 = 100)
O c c u p a t io n a l g r o u p an d p e r io d 4
U n ite d S t a t e s N o r t h e a s t S o u th N o r th C e n t r a l W e s t
A l lin d u s t r i e s
M a n u f a c t u r in g
A l li n d u s t r i e s
M a n u f a c t u r in g
A l li n d u s t r i e s
M a n u f a c t u r in g
A l lin d u s t r i e s
M a n u f a c t u r in g
A l li n d u s t r i e s
M a n u f a c t u r in g
O ff ic e c l e r i c a l (m e n an d w o m e n ) :
F e b r u a r y o f—1965 ------ -------------------------------------------------------- 1 1 2 .3 111.6 1 1 2 .4 111.6 1 1 3 .4 111.8 111.0 110.8 1 1 3 .3 1 1 3 .71Q64- , ... . 1 0 9 .2 1 0 9 .0 1 0 9 .4 109.0 1 0 9 .8 1 0 8 .3 1 0 8 .3 1 0 8 .5 110.0 1 1 0 .51 9 6 3 __________________________________________ 1 0 6 .2 1 0 6 .0 1 0 6 .3 1 06 .1 1 0 6 .7 1 0 6 .2 1 0 5 .7 1 0 5 .7 1 0 6 .8 1 0 6 .61962__________________________________________ 1 0 3 .3 1 0 3 .2 1 0 3 .4 1 0 3 .3 1 0 3 .4 1 0 3 .2 1 0 3 .1 1 0 3 .1 1 0 3 .3 1 0 3 .21 9 6 1 ................................................................................................. 100.0 100.0 100.0 100.0 100.0 100.0 100.0 100.0 100.0 100.0I 9 6 0 ............................................................................................. 9 6 .8 9 6 .7 9 6 .5 9 6 .4 9 6 .9 9 6 .6 9 7 .3 9 6 .9 9 6 .4 9 6 .7
I n d u s t r i a l n u r s e s (m e n a n d w o m e n ) :
F e b r u a r y o f—1965 _____________________________________ ___ 112.8 1 1 2 .3 1 1 3 .5 1 1 3 .0 111.0 110.2 112.0 1 1 1 .5 1 1 5 .9 1 1 5 .81 9 6 4 __________________________________________ 110.1 1 0 9 .8 1 1 0 .3 110.0 1 0 9 .1 1 0 8 .8 1 0 9 .7 1 0 9 .2 1 1 1 .7 112.11 9 6 3 __________________________________________ 1 0 7 .0 106.8 1 0 7 .7 1 0 7 .5 1 0 6 .6 1 0 6 .2 1 0 6 .3 1 0 6 .1 1 08 .1 1 0 8 .01962................................................................................................. 1 0 3 .6 1 0 3 .4 1 0 4 .0 1 0 3 .8 1 0 3 .3 1 0 3 .2 1 0 3 .3 1 0 3 .2 1 0 3 .6 1 0 3 .31 9 6 1 _____ ___ ______________________________ 100.0 100.0 100.0 100.0 100.0 100.0 100.0 100.0 100.0 100.01960__________________________________________ 9 6 .4 9 6 .4 9 6 .5 9 6 .7 9 6 .4 9 6 .3 9 6 .3 96.1 9 6 .7 9 6 .8
S k i l l e d m a in t e n a n c e (m e n ) :
F e b r u a r y o f—1 9 6 5 .................................................................................................. 111.4 1 1 0 .5 1 1 1 .4 1 1 0 .5 1 1 1 .4 1 1 0 .4 111.0 1 1 0 .4 112.6 111.61 9 6 4 __________________________________________ 1 0 8 .8 1 0 8 .2 1 0 8 .5 1 0 7 .9 1 0 8 .6 1 0 7 .9 1 0 8 .7 1 0 8 .2 110.0 1 0 9 .61 9 6 3 ................................................................................................. 1 0 5 .9 1 0 5 .5 1 0 5 .9 1 0 5 .5 1 0 6 .2 1 0 5 .6 1 0 5 .7 1 0 5 .4 1 0 6 .1 1 0 5 .61962_____ __________________________________ 1 0 3 .1 1 0 2 .9 1 0 3 .2 1 0 3 .1 1 0 3 .4 1 0 3 .1 1 0 2 .9 102.8 1 0 3 .3 102.81 9 6 1 ................................................................................................. 100.0 100.0 100.0 100.0 100.0 100.0 100.0 100.0 100.0 100.01960 ............................................................................................. 9 6 .5 9 6 .5 9 6 .4 9 6 .5 9 6 .6 9 6 .8 9 6 .5 9 6 .5 9 6 .6 9 6 .3
U n s k i l le d p la n t (m e n ) :
F e b r u a r y o f—1 9 6 5 _________________ ___________ ____________ _ 1 1 3 .2 112.0 1 1 3 .9 112.1 1 1 4 .2 1 1 3 .7 1 1 1 .7 111.0 1 1 5 .0 1 1 3 .8196 4 ________________________________________ 110.0 1 0 9 .1 110.1 1 0 9 .1 110.6 1 0 9 .8 1 0 9 .3 1 0 8 .8 111.0 1 0 9 .91 9 6 3 __________________________________________ 106.6 1 0 6 .0 106.8 1 0 6 .0 1 0 6 .9 1 0 6 .4 1 0 6 .1 1 0 6 .0 1 0 7 .5 1 0 6 .01 9 6 2 ................................................................................................. 1 0 3 .2 1 0 3 .2 1 0 3 .1 1 0 3 .2 1 0 4 .5 1 0 4 .2 102.8 1 0 3 .0 1 0 3 .3 102.61961__________________________________________ 100.0 100.0 100.0 100.0 100.0 100.0 100.0 100.0 100.0 100.01960__________________________________________ 9 6 .5 9 6 .5 9 6 .6 9 6 .4 9 7 .4 9 7 .1 9 6 .1 9 6 .2 9 6 .5 9 6 .7
1 Earnings of office clerica l workers and industrial nurses relate to regular straight-time salaries that are paid for standard workweeks. Earnings of skilled maintenance and unskilled plant workers relate to hourly earnings excluding premium pay for overtime and work on weekends, holidays, and late shifts.
2 Indexes for February of 1964 and 1965 relate to all 212 Standard Metropolitan Statistical Areas in the United States as established by the Bureau of the Budget through 1961. Earlier indexes relate to 188 areas as established through 1959. Data were adjusted to eliminate the effect of the conversion from 188 to 212 areas.
3 For definition of regions, see footnote 3 to the table in appendix A. Data for the 188 areas excluded Alaska and Hawaii.4 Average months of reference. Individual area surveys were conducted during the period July of one year through June of the next year.
Digitized for FRASER http://fraser.stlouisfed.org/ Federal Reserve Bank of St. Louis

W age Dispersion
Substantial d isp ers ion is to be noted in the rate d istributions fo r each occupation and area studied. 21 The pay rate fo r the highest paid em ployee com m on ly exceeds* by 100 p ercen t or m o re , that of the low est paid counterpart in the sam e occupation , industry d iv ision , and m etropolitan area . The general le v e l o f pay v a r ie s am ong industr ie s and am ong establishm ents within in du stries . Rate d iffe ren ces are a lso recorded within establishm ents fo r occupational c la ss ifica tio n s studied. A m a jo r ity o f o ffic e w ork ers and la rg e num bers of plant w ork ers are em ployed under rate-range plans that provide fo r advancem ent in the range* based on m erit (p erform a n ce ) rev iew s , length of s e r v ice , or a com bination o f these con cep ts . 22
Establishm ents with single rates sp ecified fo r individual jo b s m ay have rate exception s applying to certa in conditions. In the absence of a fo rm a l w age structure specify ing either a single rate or a range of rates fo r each jo b or labor grade* 23 pay rates tend to vary , since they are determ ined p r im a rily with re fe re n ce to the qualifications of the individual w ork er . R egard less of the type of pay plan in u se , rate variation m ay be re fle cted in the su rvey data w here m ore than one job c la ss ifica tio n in an establishm ent m atches the jo b defin ition applied by the B u reau 's fie ld econom ist.
Wage d isp ersion m ea su res are presen ted in the accom panying tables fo r se lected o ffice c le r ic a l and manual jo b s . The data are shown separately fo r m anufacturing and nonm anufacturing in each of 80 m etropolitan areas* in table 4, and fo r a ll m etropolitan areas by reg ion in table 5. C om parable jo b data fro m su rveys conducted in 1954 and 1961 w ere drawn upon in an exam ination o f trends in wage d isp ersion rates .
The indexes of d isp ersion in the accom panying tables w ere com puted by dividing the in terquartile range by the m edian pay rate and m ultiplying by 100. A m easu re of re la tive d isp ersion rather than o f absolute d isp ersion was se lected fo r presentation* since w idely d ifferin g pay le v e ls , as m easu red by a v era g es , w ere found am ong the occupations, industry groupings* and areas studied in late 1964 and ea r ly 1965. In addition, wage and sa la ry le v e ls had in crea sed substantially during the p er iod under review .
21 The reports for each area listed at the back o f this bulletin provide distributions o f em ployee rates for each occupation , by sex and, wherever possible, for m ajor industry divisions.
22 See "W age Payment Plans," Wages and Related Benefits, Part II: M etropolitan Area, United States and Regional Summaries, 1962-63 (BLS Bulletin 1345-83, 1964), pp. 61-64.
23 One o f a series o f rate steps (single rate or rate range) in the wage structure in which o ccu pations o f approximately equal value are grouped.
The sam e o ffic e and u nskilled jo b s w ere se lected fo r analysis in m anufacturing and nonm anufacturing; the sk illed m aintenance jo b se lection d iffe red by division* re flectin g the concentration of m a in tenance em ploym ent in m anufacturing in all except the autom otive m echan ic ca teg ory .
A re a Indexes
Am ong the occupations fo r w hich area indexes of wage d is p ers ion are presen ted in table 4, the d isp ersion values ranged fro m le s s than 5 fo r one or m ore of the sk illed trades in a few areas to m ore than 70 fo r m ateria l-handlin g la b o re rs in nonm anufacturing in 2 of the 80 area s . A s shown in the fo llow ing tabulation, d isp ersion indexes o f le s s than 15 w ere re co rd e d fo r each of the sk illed trades in at lea st half the areas .
Percent distribution o f area indexes
Under 15 and 30 andIndustry division and job 15 under 30 over
Manufacturing:Stenographers, general------------------------------- 15 81 4Electricians, m aintenance-------------------------- 69 31 0Machinists, m aintenance--------------------------- 60 39 1M echanics, m aintenance-------------------------- 50 41 9T ool and die makers------------------------------------ 76 24 0Janitors, porters, and
cleaners --------------— — - — ---------- 54 23Laborers, material h an d lin g---------- ------------ 26 51 23
Nonmanufacturing:Stenographers, general------------------------------- 0 68 32M echanics, autom otive — ------------------------- 50 38 12Janitors, porters, and
c lea n ers---------------------------------------- 9 35 56Laborers, m aterial h an d lin g---------- ----------- 9 29 62
D isp ersion values fo r stenographers, jan itors , and laborersexceeded those fo r the sk illed trades and, fo r each of the three jobs.they w ere higher in nonm anufacturing than in m anufacturing a ctiv ities . Although the area values fo r m ost of these se lected occupations (and industry groupings) v aried quite w idely within each region , on ba lance,
7 5
Digitized for FRASER http://fraser.stlouisfed.org/ Federal Reserve Bank of St. Louis

7 6
w estern and southern areas had the low est and the highest indexes, resp ectiv e ly . The prop ortion of area indexes of le s s than 15 fo r the five sk illed trades w ere as fo llow s : W est— seven -e igh th s; NorthCentral— n early th ree -fou rth s ; N ortheast— n early th re e -fifth s ; and South— slightly m ore than on e-th ird .
Exam ination was a lso m ade of the three low est and three highest area indexes fo r each of the job s in table 4. A total of 37 areas accounted fo r the three low est in dexes; of the 71 position s (and ties ) noted fo r the 18 jo b s , Salt Lake City accounted fo r 6 and Portland, Or eg .; San F ra n c is co —Oakland; Seattle; San D iego; and Spokane a c counted fo r from 3 to 5 each. D etroit ranked am ong the three low est values in the too l and die m aker, ja n itor , la b o re r , and fo rk lift operator job s in m anufacturing. T h irty -th ree areas accounted fo r the 60 "h ig h -3" indexes and m ore than on e-h a lf w ere in the South. Except fo r D etroit and San F ra n c is co —Oakland, the large industria l areas appeared only in frequently at the ex trem es in the arrays of wage d is persion indexes.
It m ay be assum ed that sm aller d isp ersion values fo r m anufacturing would be found in areas in w hich such em ploym ent is la rg e ly concentrated within a pa rticu la r industry. The evidence supports this in part. R elatively low indexes w ere found in D etroit, San D iego, and Seattle (transportation equipm ent), in A kron (rubber), in P ittsburgh (s tee l), and in G reen v ille , S.C . (tex tiles ). Some other "o n e -in d u stry " cen ters , such as F ort W orth, B irm ingham , N orfolk—P ortsm outh and N ew port News—Hampton did not have p a rticu la rly low values. A r e l a t iv e ly high prop ortion of em ploym ent w orking under term s of la b o r - m anagem ent agreem en ts was often a ssocia ted with low index values.
A s indicated on pages 3—5, general pay lev e ls varied substantially am ong industry d iv is ion s in the nonm anufacturing se c to r . P ublic u tilities (transportation , com m unication , and other public u tilities) had pay lev e ls fo r o ffice c le r ic a l and unskilled w ork ers that exceeded those fo r m anufacturing as w ell as counterpart pay lev e ls in the other nonm anufacturing d iv is ion s . It w ill be noted that the m axim um wage spread am ong d iv is ion s was 21 percen t fo r o ffice c le r ica l jo b s and 37 percen t fo r unskilled plant jo b s . D espite the magnitude of in terd iv ision d iffe re n ce s in average pay le v e ls , indexes of wage d isp ersion fo r som e industry d iv isions exceeded the values fo r a ll nonm anufacturing in du stries com bined in the sam e area. As shown in the fo llow in g tabulation, total nonm anufacturing indexes fo r typ ists , c la ss B (wom en) fo r exam ple, w ere exceeded by public u tilities indexes in 4 of the 5 a reas .
Substantial v aria tion in pay rates thus ex ists am ong industries and establishm ents c la s s ifie d in each of the industry d iv is ion s .
Indexes of wage dispersion
Job and industry Phila-
division Boston Chicago D etroit N ew York delphia
Stenographers, general (wom en)---- 19 23 3 0 21 26Public u t ilit ie s -------------------- 18 14 28 22 38W holesale trad e------------------ 17 18 15 16 23R etail tr a d e ---------------------- 14 20 2 0 17 18F in an ce--------------------------- 17 15 18 17 22Services--------------------------- 11 15 28 17 -
Typists, class B (w o m en )------------ 18 20 2 0 17 2 0Public u tilit ie s -------------------- 37 37 21 15 34W holesale trad e------------------ 11 16 23 13 16R etail tr a d e ---------------------- 27 20 26 16 22
F in a n ce--------------------------- 14 19 14 15 18Services--------------------------- 13 17 19 16 22
Janitors, porters, and
cleaners ( m e n ) --------------------- 29 32 25 20 21Public u t ilit ie s -------------------- 15 5 18 15 13W holesale trad e----------------- - 24 34 4 2 30 30
R etail tr a d e ---------------------- 26 23 3 7 27 2 7F in an ce---------------------------- 21 3 16 15 10
Services--------------------------- 29 14 16 10
Range of R egional Indexes
R egional indexes of d isp ersion are presen ted fo r the N ation 's m etropolitan areas com bined and fo r four broad region s in table 5. Nationwide indexes w ere c lo se ly grouped fo r the five sk illed trades (14—18) and fo r o ffice c le r ic a l job s (23—29); fo r custod ia l and m a te r ia lhandling jo b s , h ow ever, a l l-a r e a indexes ranged fro m 19 fo r fo rk lift opera tors in m anufacturing to 46 fo r jan itors in nonm anufacturing. R egionally , the low est indexes fo r m ost job s w ere re cord ed in the W est and the h ighest indexes w ere usually in the South. Wage d is p ers ion values in the South w ere m ore than double those in the W est and North C entral region s in the case of ja n itors , la b o re rs , and fo rk lift opera tors in m anufacturing, and fo r la b o re rs in nonm anufacturing. This ch a ra cte r is tic of unskilled w ages in southern m anufacturing undoubtedly r e fle cts the location in this reg ion of re la tive ly high w age, genera lly unionized, industries such as transportation equipm ent, ch em ica ls , and petroleum refin ing that have pay le v e ls that d iffer quite substantially from those preva ilin g in other lo ca l indu stries . The degree of d isp ersion in o ffice c le r ica l sa la ries and in the sk illed trades (other than m ech an ics) was not ap preciab ly grea ter in the South.
D isp ersion trends
An e a r lie r study, based on data fo r 17 of the la rg er m arkets, indicated that, except fo r the sk illed trades in nonm anufacturing, in c re a se s in wage d isp ersion during the p er iod studied (1954 to 1961)
Digitized for FRASER http://fraser.stlouisfed.org/ Federal Reserve Bank of St. Louis

outnum bered d e cre a se s fo r o ffice c le r ica l, sk illed trad es, and unsk illed jo b s . 24 In all except the manual job s in nonm anufacturing, how ever, the index changes w ere con s id ered to be m in or, since m ore than on e-h a lf w ere within a band of plus or minus 4 points.
C om parison of indexes fo r 1954 and 1965 fo r the sam e areas and m ost of the sam e job s indicated that in cre a se s of 5 points or m ore outnum bered d e cre a se s of this amount in a m a jor ity of the cases in m anufacturing, but w ere about equal in num ber in nonmanufacturing. The grea test changes w ere noted in the follow ing ca teg or ies :
J anitors— manuf acturing------J anitors— nonmanufacturing- Laborers— nonmanuf acturing
Increases of 5 points or more
92
14
Decreases of 5 points or more
1121
220-617 0 - 66 - 6
7 7
Interindustry and in terestablishm ent variation in the p r o portion of w ork ers in the jo b s included in the survey and in the general lev e l of pay la rg e ly explains the inter occupational d ifferen ces in the lev e ls and trends of wage d ispersion indexes. Em ploym ent in the m ain tenance trades tends to be concentrated in the la rg er establishm ents, w hereas em ploym ent of ja n itors and la b orers is m ore w idely d is tributed within an area. 25 Som e occupations, although found in a substantial p roportion of the establishm ents v isited , tend to be c lu s tered , i .e . , la rge groups of w ork ers in the occupation are em ployed in certa in in du stries . The m aterial-handling la borer job is distributed in this m anner. The in crea se in wage d isp ersion associa ted with this job is tra cea b le , in part, to the above-average r ise in pay rates in som e of the unionized nonm anufacturing industries that are m a jor em p loyers of la b o re rs .
Wages and Related Benefits, Metropolitan Areas, United States and Regional Summaries, 1960-61 (BLS Bulletin 1285-84, 1962).
25 See Occupational Employment data in appendix B.
Digitized for FRASER http://fraser.stlouisfed.org/ Federal Reserve Bank of St. Louis

7 8
(In d exes of d is p e r s io n 1 for s e le c te d occup ation s in m anufacturing and nonm anufacturing, 80 m etrop olitan a r e a s, la te 196 4 and e a r ly 1965)
Table 4. Dispersion o f Rates W ithin Occupations
M e t r o p o l i t a n a r e a
O ff ic e jo b s (w o m e n ) P la n t jo b s (m e n )
M a n u f a c t u r in g N o n m a n u fa c tu r in g M a n u f a c t u r in g N o n m a n u fa c tu r in g
A c c o u n t in gc l e r k s S t e n o g -
r a p h e r s ,g e n e r a l
T y p i s t s ,c l a s s
B
A c c o u n t in gc l e r k s S t e n o g -
r a p h e r s ,g e n e r a l
T y p i s t s ,c l a s s
BE l e c t r i c i a n s M a c h i n i s t s M e c h a n ic s
T o o la n dd ie
m a k e r s
J a n i t o r s ,p o r t e r s ,
a n dc l e a n e r s
L a b o r e r s ,m a t e r i a lh a n d l in g
T r u c k e r s ,
p o w e r( f o r k
l i f t )
M e c h a n ic s ,a u to m o t iv e
J a n i t o r s ,p o r t e r s ,
a n dc l e a n e r s
L a b o r e r s ,m a t e r i a lh a n d l in gC l a s s
AC l a s s
BC l a s s
AC la s s
B
N o r t h e a s t
A lb a n y - S c h e n e c t a d y —T r o y , N. Y____ 12 14 20 21 19 22 25 18 15 11 21 - 33 33 9 8 4 5 9A l le n to w n —B e t h le h e m ^ E a s t o n ,
P a .—N. J _____________________________ 23 39 4 0 28 _ 61 67 26 13 11 11 13 13 25 15 21 29 55B o s to n , M a s s ________________________ 18 19 17 20 16 26 19 18 10 13 27 16 22 27 19 17 29 27B u f f a lo , N .Y _________________________ 17 35 24 25 29 26 4 2 15 12 14 11 10 18 17 12 20 63 15L a w r e n c e —H a v e r h i l l ,
M a s s .—N .H ................................................. 14 23 14 23 34 27 18 - 15 18 17 - 24 14 15 21 33 27M a n c h e s t e r , N .H ____________________ _ 23 - 13 17 20 20 15 29 20 36 - 23 24 - 5 17 55N e w a r k a n d J e r s e y C i t y , N .J ______ 16 18 19 16 24 26 23 19 11 13 8 15 21 25 17 13 39 13N ew H a v e n , C o n n ___________________ 20 28 21 22 22 24 29 17 17 18 17 9 30 28 14 10 30 39N ew Y o r k , N .Y ______________________ 20 20 19 20 22 22 21 17 18 18 13 9 30 29 20 12 20 10P a t e r s o n —C lif to n —P a s s a i c , N .J_»___ 25 17 20 12 29 16 15 20 13 16 20 11 29 24 19 6 30 17P h i l a d e lp h i a , P a .—N . J _____________ 22 24 27 20 24 26 26 20 14 16 14 11 21 21 22 8 21 25P i t t s b u r g h , P a _____ ________ __ 16 24 26 27 16 31 25 22 8 16 11 18 6 13 12 12 30 39P o r t l a n d , M a i n e . . __ __ _ 20 18 25 - 17 53 30 14 6 23 9 13 6 29 14 34 35 68P r o v id e n c e —P a w t u c k e t ,
R .I .—M a s s ________ . _ 16 22 19 15 21 28 30 12 23 19 22 13 30 27 25 29 33 66S c r a n t o n , P a ______________ _____ 16 26 13 10 7 32 51 17 19 8 28 7 21 19 10 3 6 2 23T r e n to n , N .J __ ___ __ ________ 13 22 20 25 _ _ 33 18 27 13 12 21 14 17 17 11 4 7 4 2W a t e r b u r y , C o n n _____ __ __ 16 26 21 16 - 27 - 17 6 10 7 11 25 28 16 18 16 47W o r c e s t e r , M a s s ____________________ 38 21 21 14 23 14 17 13 14 17 14 7 26 36 12 22 37 34Y o r k , P a ............................................................. - 34 21 20 - 4 2 16 - 7 9 15 10 27 27 15 4 25 26
S o u th
A t la n t a , G a __ _____ __ __ 41 26 25 20 19 30 26 17 12 20 33 13 59 28 39 22 18 6 4B a l t im o r e , M d ____ __ ___ __ 29 31 20 32 21 31 32 23 16 16 14 7 33 25 14 7 14 43B e a u m o n t—P o r t A r t h u r , T e x ______ 49 63 14 27 14 27 27 - 2 2 2 - 11 35 11 52 51 50B ir m in g h a m , A l a ________ __ ___ 31 29 29 39 29 33 35 22 23 24 19 8 26 27 43 25 4 6 39C h a r l e s t o n , W . V a __________________ 35 39 20 17 47 33 28 27 6 6 3 - 13 9 16 7 43 35C h a r lo t t e , N .C __ __ __ __ _ 13 30 18 13 36 26 16 28 - 30 - 17 18 14 19 22 52C h a t t a n o o g a , T e n n .—Ga______________ 23 21 13 19 23 20 28 10 18 17 16 3 36 21 26 22 15 25D a l l a s , T e x __ __ ________ __ 27 22 15 16 25 31 22 16 27 23 13 19 25 32 26 23 14 67F o r t W o r th , T e x __ _____ _____ 21 38 - 26 28 36 26 18 9 17 4 2 9 4 5 55 33 25 32 41G r e e n v i l l e , S .C ______________________ 16 14 15 _ - 16 27 - 11 11 18 - 9 9 16 30 26 55H o u s to n , T e x ________________________ 15 18 18 23 25 27 20 17 11 8 20 3 34 4 0 32 32 20 51J a c k s o n , M is s __ _______________ ____ 17 - 17 - 29 36 28 15 13 15 29 - 24 18 16 37 13 53J a c k s o n v i l l e , F l a _ _________________ __ - 23 16 19 27 30 33 14 29 31 36 - 37 19 39 26 13 73L i t t l e R o c k —N o rth L i t t l e
R o c k , A r k ________________________ 8 20 13 11 23 26 20 13 16 23 24 14 22 26 4 5 33 29 12L o u i s v i l l e , K y .—I n d __ ______________ 23 30 19 22 19 33 31 24 10 5 14 3 21 18 17 22 31 43L u b b o c k , T e x __ __ _____ ___ _ _ _ _ 28 18 34 13 - - 3 - 12 28 22 _ 34 38M e m p h is , T e n n _____________________ 20 28 23 13 23 26 35 13 11 17 29 23 4 0 37 66 4 20 69M ia m i , F l a _ _ __ 10 17 15 23 20 27 22 25 23 - 29 8 28 36 27 26 35 52N ew O r le a n s , L a ____________________ 36 23 19 23 23 28 27 25 16 15 21 - 37 4 2 3 0 29 19 49N o rfp lk —P o r t s m o u t h a n d N e w p o r t
N e w 8—H a m p to n , V a _______________ 35 21 17 - 13 29 28 17 11 23 30 - 24 38 5 4 23 17 23O k la h o m a C i t y , O k l a _______________ _ 21 15 12 30 31 22 14 20 - 29 - 34 41 - 24 25 4 2R a l e i g h , N .C __ __ __ _ - 25 - - 17 15 21 12 - - 20 - 17 10 4 5 20 19 4 3R ic h m o n d , V a __ __ _ 22 28 11 17 9 2 4 39 13 9 8 18 - 28 34 30 33 33 4 6S a n A n to n io , T e x __ _ 27 24 _ 20 24 19 14 19 - 68 - 25 30 33 60 15 26S a v a n n a h , G a ____ ___ _ ___ 17 20 22 23 66 55 41 - 4 6 21 - 37 53 8 _ 52 50W a s h in g to n , D. C .—M d .—V a __ ____ 16 11 16 21 17 28 15 23 17 3 4 19 16 36 4 6
S ee footn otes at end of table,
Digitized for FRASER http://fraser.stlouisfed.org/ Federal Reserve Bank of St. Louis

( I n d e x e s o f d i s p e r s i o n 1 f o r s e l e c t e d o c c u p a t io n s in m a n u f a c t u r in g a n d n o n m a n u f a c t u r in g , 8 0 m e t r o p o l i t a n a r e a s , l a t e 1 9 6 4 a n d e a r l y 1 96 5 )
Table 4. Dispersion o f Rates W ithin Occupations-----Continued
7 9
M e t r o p o l i t a n a r e a
O ff ic e jo b s (w o m e n ) P la n t jo b s (m e n )
M a n u f a c t u r in g N o n m a n u fa c tu r in g M a n u f a c t u r in g N o n m a n u fa c tu r in g
A c c o u n t in g c l e r k s S t e n o g -
r a p h e r s , g e n e r a l
T y p i s t s ,c l a s s
B
A c c o u n t in gc l e r k s S t e n o g -
r a p h e r s ,g e n e r a l
T y p i s t s , c l a s s .
BE l e c t r i c i a n s M a c h i n i s t s M e c h a n ic s
T o o la n dd ie
m a k e r s
J a n i t o r s ,p o r t e r s ,
a n dc l e a n e r s
L a b o r e r s ,m a t e r i a lh a n d l in g
T r u c k e r s ,
p o w e r( f o r k
l i f t )
M e c h a n ic s ,a u to m o t iv e
J a n i t o r s ,p o r t e r s ,
a n dc l e a n e r s
L a b o r e r s ,m a t e r i a lh a n d l in gC l a s s
AC l a s s
BC l a s s
AC la s s
B
N o r th C e n t r a l
A k r o n , O h io___ __ _ 15 23 26 23 22 28 30 25 6 6 5 12 12 11 20 4 39 3C a n to n , O h io _________________________ 19 48 29 24 32 16 28 12 5 6 13 15 10 14 15 24 30 31C h ic a g o , 111 . . 20 19 19 17 20 22 23 20 12 12 16 10 25 22 19 4 32 23C in c in n a t i , O h io—K y ________________ 28 19 16 18 16 29 23 21 18 15 14 16 19 23 20 19 27 16C le v e la n d , O h io 22 26 21 18 21 27 27 18 13 12 18 10 18 17 11 6 17 30C o lu m b u s , O h io _____ __ ___ 27 20 33 21 26 24 24 15 14 17 14 13 19 24 16 8 4 2 38D a v e n p o r t—R o c k I s l a n d - M o l i n e ,
Iowar-H.1 __ — ___ 24 32 18 20 15 20 24 14 6 5 9 9 16 5 5 5 55 28D a y to n , O h io _________________________ 25 15 27 3 0 11 30 22 19 9 4 18 6 16 15 9 31 41 41D e s M o in e s , Io w a 12 21 20 20 25 26 22 14 15 15 11 20 23 12 20 5 33 57D e t r o i t , M i c h _______________________ 20 33 16 23 24 31 30 20 4 7 7 3 3 4 5 10 25 33G r e e n B a y , W is __ _ 21 19 20 - - 20 19 8 6 13 - 10 9 5 17 31 16I n d ia n a p o l i s , In d _ __ __ 28 25 25 20 17 23 46 20 11 8 17 10 28 19 13 12 38 4 8K a n s a s C i t y , M o .—K a n s____ ________ 26 20 28 18 26 23 21 18 6 9 12 11 29 31 7 17 33 20M ilw a u k e e , W i« ----------- ------ _ 17 29 21 17 22 29 21 14 12 14 19 8 17 17 20 11 30 49M in n e a p o l is —S t . P a u l , M in n _______ 10 19 18 19 24 23 27 17 10 4 11 15 16 12 13 9 21 17M u s k e g o n —M u s k e g o n
H e ig h t s , M ic h 18 23 19 19 21 4 7 25 - 11 11 8 9 12 15 7 7 45 -O m a h a , N e b r .—Io w a _ 35 19 19 11 20 29 20 20 7 11 18 14 31 32 26 13 53 30R o c k f o r d , 111 - 18 25 15 15 31 25 18 19 16 18 11 14 19 22 18 27 38 52S t . L o u i s , M o .—I l l ___________________ 21 26 19 18 32 30 36 22 12 12 20 2 24 27 17 2 30 26S io u x F a l l s , S . D a k _________________ _ - - - - 30 22 27 - - - - 41 24 - 6 47 -S o u th B e n d , In d _ __ __ 12 29 28 15 15 - 21 13 12 8 8 11 20 8 9 17 36 33T o le d o , O h io __ __ 22 25 14 23 18 17 33 32 10 11 14 10 20 11 11 15 34 32W a t e r lo o , I o w a ___ __ - 28 20 25 - 27 58 - 17 - 14 23 5 3 12 - 41 74W ic h i t a , K a n s _ 23 29 16 18 17 47 4 4 - 14 22 21 17 15 14 21 2 45 41
W e s t
A lb u q u e r q u e , N . M e x _ 23 _ _ 33 25 30 12 _ _ 15 _ 31 25 20 3 4 0 24D e n v e r , C o lo __ __ 25 21 19 22 27 28 32 15 8 9 10 15 20 35 13 5 20 26L o s A n g e le s —L o n g B e a c h , C a l i f ___ 14 21 11 29 25 17 19 18 9 15 13 9 19 20 14 5 17 17P h o e n ix , A r i z _ 20 17 15 15 18 20 21 16 6 - 11 13 18 22 18 19 34 41P o r t l a n d , O r e g .—W a s h _____________ 24 2 4 18 22 23 23 39 19 3 4 11 20 20 10 12 2 12 10S a l t L a k e C i t y , U t a h _______________ 25 18 11 6 8 23 29 19 3 3 7 8 4 6 10 22 2 18 4 7S a n B e r n a r d in o —R i v e r s i d e —
O n ta r io , C a l i f _ __ 18 36 21 19 13 24 36 16 6 4 9 14 13 25 16 14 56 56S a n D ie g o , C a l i f 8 20 7 28 24 24 16 24 4 6 4 4 12 2 5 12 21 23S a n F r a n c i s c o —O a k la n d , C a l i f _____ 16 19 15 15 17 20 16 18 8 9 13 5 13 4 5 6 6 15S e a t t l e , W a s h „ __ __________ 18 27 11 24 16 15 19 18 - 11 15 9 16 12 6 2 12 15S p o k a n e , W a s h __ __ ______ 13 20 25 20 21 2 2 1 3 25 7 19 12
1 C o m p u te d b y d iv id in g th e i n t e r q u a r t i l e r a n g e b y th e m e d ia n a n d m u l t ip ly in g b y 1 0 0 .
N O T E : D a s h e s in d i c a t e d a t a t h a t do n o t m e e t p u b l i c a t io n c r i t e r i a .
Digitized for FRASER http://fraser.stlouisfed.org/ Federal Reserve Bank of St. Louis

8 0T a b le 5 . D i s p e r s i o n o f R a t e s W i t h i n O c c u p a t i o n s b y R e g i o n
(Indexes o f d is p e r s io n 1 for se le cted occupations 2 a ll m etrop olitan areas 3
in m anufacturing and nonm anufacturing industries in by reg ion , F eb ru ary 1965)
Industry d iv ision and occupationA ll
m etrop olitanareas
N ortheast South N orthC en tral W est
M anufacturing
A ccounting c le r k s , c la ss A ---------------------------------- 23 21 27 25 17A ccounting c le r k s , c la ss B ---------------------------------- 26 23 24 28 24S ten ograp h ers, g e n e r a l---------------------------------------- 26 22 26 25 17T y p is ts , c la ss B ------- — ------------- — 23 21 23 22 33E le c tr ic ia n s ---- ---------------------- --------------- 14 14 16 13 8M a ch in is ts --------------------------------------------------------------- 14 15 15 12 9M ech an ics— — ---------- ~ ------- --------- - 18 15 28 18 9T o o l and die m a k e r s ----------------- — ---------- ----- 15 17 16 12 10Ja n itors , p o r te r s , and c le a n e rs -------------------------- 28 23 47 21 18L a b o re rs , m a ter ia l handling - ------------------ - 30 28 45 19 19T ru ck e rs , pow er (fork lift) — ------------- 19 21 42 13 13
N onm anufacturing
A ccounting c le r k s , c la ss A — — ------ — 23 24 25 23 22A ccounting c le r k s , c la ss B ---------------------------------- 29 27 30 28 23S ten ograp h ers, g e n e r a l---------------------------------------- 27 24 29 28 23T y p is ts , c la ss B — ----- — ------ ---------- — 23 22 21 23 20M ech an ics, autom otive ------- ------- 15 13 24 11 9Jan itors , p o r te r s , and c le a n e rs -------------------------- 46 35 24 41 30L a b o re rs , m a ter ia l han d ling . _ . . . . 35 21 60 28 22
Com puted b y dividing the in terquartile range by the m edian and m ultiplying b y 100.E stim ates re la te to w om en in o ffic e occupations and to m en in plant occu pation s.212 Standard M etropolitan Statistica l A rea s in the United States, as estab lish ed b y the B ureau o f the Budget through 1961.
Digitized for FRASER http://fraser.stlouisfed.org/ Federal Reserve Bank of St. Louis

Establishment Practices and Supplementary W age Provisions
N early all o ffic e and plant w ork ers within the scope o f the su rvey in the 212 m etropolitan areas re ce iv e d paid holidays and v a ca tions and w ere co v e re d by som e type o f health, in su ran ce, o r pension plan. In form ation is provided on the extent and nature o f benefits in m edium and la rge establishm ents in the in du stries within scope o f the study in 1964—65, and on benefit trends o v er the p eriod I9 6 0 26 to 1965.
In analyzing the B -s e r ie s ta b les , it should be kept in m ind that the m anufacturing d iv is ion strongly in fluences the a ll-in d u stry fig u res fo r plant w ork ers , w h ereas , fo r o ffic e w ork ers , the nonmanufactu ring in du stries exert the g rea ter in flu ence. About 61 percen t o f the plant w ork ers and 37 p ercen t o f the o ffic e w ork ers within scope o f the 1965 study w ere em ployed in m anufacturing fir m s .
The availab ility o f supplem ental wage benefits varied am ong reg ion s and industry d iv is ion s . A lm ost all w ork ers in each reg ion re ce iv e d paid vacations, but the length o f se rv ice requ ired fo r a sp e c ific paid vacation period d iffe red . F or exam ple, 61 percen t o f the o ffic e w ork ers in the N ortheast, com p a red with 39 percen t in the South, w ere e lig ib le fo r 4 w eeks' vacation after 25 yea rs o f s e r v ice . S even ty-th ree percen t o f the plant w ork ers in public u tilities and 6 p e r cent in se r v ice s w ere e lig ib le fo r 4 w eeks after 25 y e a rs .
The fastest grow th ov er the period fro m I960 to 1965 was in the p reva len ce o f catastrophe (m a jor m ed ica l) in su ran ce. This in su ran ce , available to only 42 percen t o f o ffic e and 20 percen t o f plant em p loyees in I960, was provided by establishm ents em ploying 69 and 35 p ercen t o f the o ffic e and plant w ork ers , re sp e ctiv e ly , in 1965.
By 1959~60, n early a ll w ork ers w ere provided paid holidays and paid vacations, so changes ov er this 5 -y e a r p eriod usually took the fo rm o f m ore lib e ra l benefits rather than the establishm ent o f plans. Changes in paid holidays o v er the 5 -y e a r p eriod , 1959—60 to 1964—65, usually in volved the establishm ent o f additional holidays— in many ca se s , ones w hich provide long w eekends rather than add tra d itional holidays. In keeping with the trend tow ard lon ger w eekends, many la bor-m an agem en t agreem ents signed during this period sp e c ified G ood F riday or the day after Thanksgiving as an additional paid holiday. The m ost frequent im provem en t in vacation p rov is ion s was reduction in the se rv ice requ ired fo r 3 and 4 w eeks o f vacation and addition o f a fourth w eek o f vacation . A lso , ov er this p eriod , extended vacations w ere p rovided in m a jor bargaining situations, such as in the steel and alum inum in du stries . H ow ever, this type o f vacation plan is not included in the covera g e o f the survey; extended vacations are usually p rovided only at certa in in terva ls (e v e ry 5 y e a rs , e t c . ) . The vacation coverag e in the su rvey was lim ited to ba sic plans and a lso excluded v acation -sav in gs plans.
For data applying to 1960, see "Supplementary Wage Benefits in Metropolitan Areas, 1959—60," Monthly Labor Review, April 1961, pp. 379—387.
Late-Sh ift Pay P rov is ion s and P ra c tice s in M anufacturing
While 87 o f ev ery 100 m anufacturing plant w ork ers w ere in firm s with p rov is ion s fo r shift operations, only 24 w ere actually w orking on a late shift at the tim e o f survey. The percen t actually w orking late shifts ranged fro m 2 1 .5 percen t in the N ortheast to 26. 7 percen t in the North C entral reg ion . W orkers actually em ployed on second shift ranged from 15 .5 percen t in the N ortheast to 20 percen t in the N orth C entral region ; and, on third shift, fr o m 5. 3 percen t in the W est to 7 .9 percen t in the South. N early a ll w ork ers re ce iv e d prem ium rates when w orking on late shifts.
The m ost com m on fo rm o f prem ium pay fo r w ork ers on late shifts was a u n iform ce n ts -p e r -h o u r addition to f ir s t -s h ift ra tes . O ver tw o-th irds o f the w ork ers on a second shift and rece iv in g a pay d ifferen tia l w ere co v e re d with a u n iform ce n ts -p e r -h o u r p rov is ion . About th ree -fifth s o f the plant w ork ers with p rov ision s fo r a th ird -sh ift d ifferen tia l re ce iv e d the u n iform ce n ts -p e r -h o u r prem ium . The average ce n ts -p e r -h o u r d ifferen tia l, com puted to sim plify com p a rison s , shows that plant em p loyees actually w orking second shift averaged 9. 5 cents; fo r w ork ers actually w orking on the third shift, the average was 12 cents. R egion ally , w ork ers in the W est had the highest average cents d ifferen tia l when w orking on second or th ird shift, and w ork ers in the South the low est.
In the 5 -y e a r period ending in 1965, sh ift-pay d ifferen tia ls com puted on a ce n ts -p e r -h o u r b a sis have not in crea sed in value as fast as the in cre a se in stra igh t-tim e pay. During this period , the average ce n ts -p e r -h o u r d ifferen tia l fo r all plant w ork ers in crea sed by 6. 8 and 8 .8 percen t fo r second and third sh ifts, resp ectiv e ly . S tra ight-tim e earnings o f sk illed m aintenance w ork ers , h ow ever, in c re a se d 14. 5 percen t and those o f unskilled plant w ork ers by 16. 1 p e r cent. W orkers who re ce iv e d a percentage o f stra ight-tim e pay as a d ifferentia l re ce iv e d proportionate in cre a se s in the dollar value o f their d ifferen tia ls as their stra igh t-tim e earnings in creased .
The percen t o f m anufacturing plant w ork ers with no p rov is ion fo r a se con d -sh ift pay d ifferentia l was not significant, except in the South w here a lm ost 15 percen t o f the w ork ers rece iv ed no d ifferen tia l fo r secon d -sh ift w ork . H ow ever, th ere w ere only about 4 percen t o f the w ork ers in the South actually w orking second shift at the tim e o f the survey and re ce iv in g no shift d ifferentia l.
The addition o f a u n iform percentage d ifferentia l to f ir s t -s h ift rates was next in im portan ce to the uniform ce n ts -p e r -h o u r d if fe r ential. In the W est, h ow ever, a fu ll day 's pay fo r reduced hours, or such com bination plans as a fu ll day 's pay fo r reduced hours plus a ce n ts -p e r -h o u r d ifferen tia l, was m ore im portant than a percentage addition. F or ready an alysis, average percentage d ifferen tia ls w ere
81
Digitized for FRASER http://fraser.stlouisfed.org/ Federal Reserve Bank of St. Louis
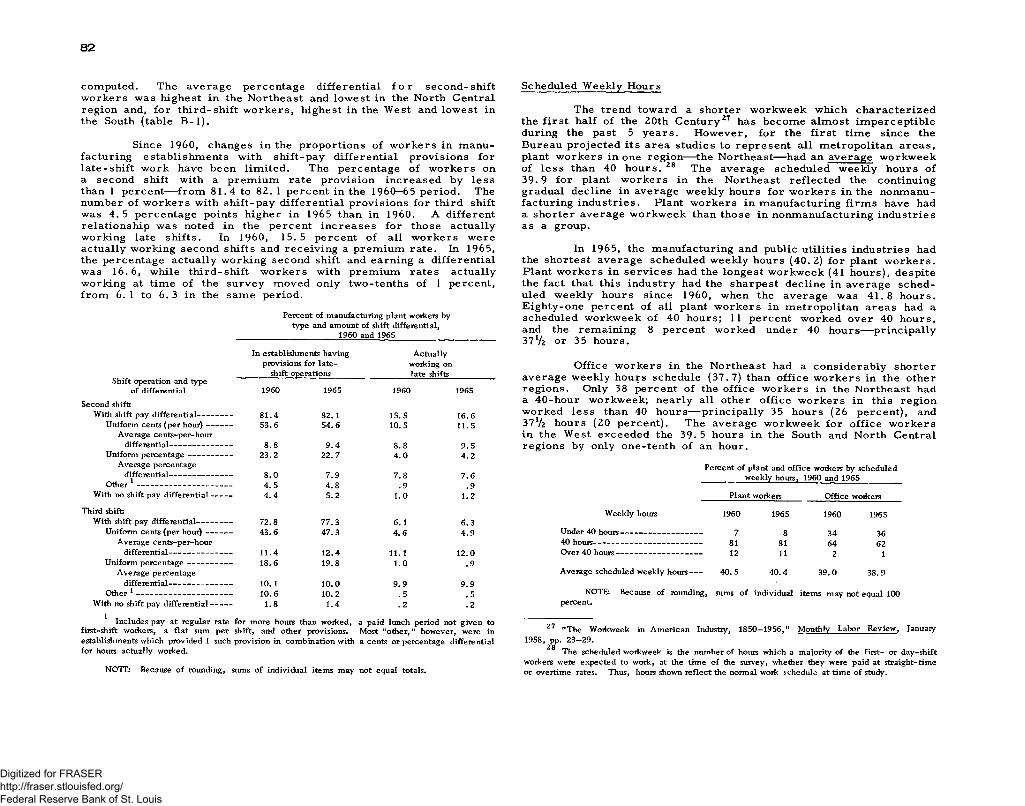
8 2
com puted. The average percentage d ifferen tia l f o r secon d -sh ift w ork ers was highest in the N ortheast and low est in the North Central reg ion and, fo r th ird -sh ift w ork ers , highest in the W est and low est in the South (table B - l ) .
Since I960, changes in the proportion s o f w ork ers in m anufacturing establishm ents with sh ift-pay d ifferentia l p rov ision s fo r la te -sh ift w ork have been lim ited . The percentage o f w ork ers on a second shift with a prem ium rate p rov is ion in crea sed by le s s than 1 percent— fro m 8 1 .4 to 82. 1 percen t in the 1960—65 p eriod . The num ber o f w ork ers with sh ift-pay d ifferentia l p rov ision s fo r th ird shift was 4. 5 percentage points h igher in 1965 than in I960. A different relationsh ip was noted in the percen t in cre a se s fo r those actually w orking late sh ifts. In I960, 15 .5 percen t o f all w ork ers w ereactually w orking second shifts and rece iv in g a prem ium rate. In 1965, the percentage actually w orking second shift and earning a d ifferentia l was 16 .6 , while th ird -sh ift w ork ers with prem ium rates actually w orking at tim e o f the su rvey m oved only tw o-tenths of 1 percent, fro m 6. 1 to 6 .3 in the sam e p eriod .
Percent of manufacturing plant workers by type and amount of shift differential,
_______________________ 1960 and 1965_______________________
In establishments having Actuallyprovisions for late- working on
shift operations_______ _________ late shiftsShift operation and type
of differential 1960 1965 1960 1965Second shift:
With shift pay differential------------ 8 1 .4 82 .1 15 .5 16 .6Uniform cents (per hour)-------- 53 .6 54 .6 10 .5 11 .5
Average cents-per-hourdifferential--------------------- 8 .8 9 .4 8 .8 9 .5
Uniform percentage--------------- 23 .2 22 .7 4 .0 4 .2Average percentage
differential--------------------- 8 .0 7 .9 7 .8 7 .6Other 1 --------------------------------- 4 .5 4 .8 .9 .9
With no shift pay differential------- 4 .4 5 .2 1 .0 1 .2
Third shift:With shift pay differential------------ 72.8 77 .3 6. 1 6 .3
Uniform cents (per hour)--------- 43 .6 47 .3 4 .6 4 .9Average cents-per-hour
differential---------------------- 1 1 .4 12 .4 1 1 .1 12 .0Uniform percentage--------------- 18 .6 19 .8 1 .0 .9
Average percentagedifferential---------------------- 10 .1 10 .0 9 .9 9 .9
Other 1 --------------------------------- 10 .6 10 .2 .5 .5With no shift pay differential------- 1 .8 1 .4 .2 .2
1 Includes pay at regular rate for more hours than worked, a paid lunch period not given tofirst-shift workers, a flat sum per shift, and other provisions. Most "other,1" however, were inestablishments which provided 1 such provision in combination with a cents or percentage differentialfor hours actually worked.
NOTE: Because of rounding, sums of individual items may not equal totals.
Scheduled W eekly H ours
The trend tow ard a sh orter w orkw eek w hich ch a ra cter ized the fir s t half o f the 20th C en tu ry27 has becom e alm ost im p ercep tib le during the past 5 y e a rs . H ow ever, fo r the f ir s t tim e since the Bureau p ro jected its area studies to rep resen t a ll m etropolitan area s , plant w ork ers in one reg ion — the Northeast— had an average w orkw eek o f le s s than 40 h ours. 28 The average scheduled w eekly hours o f 39-9 fo r plant w ork ers in the N ortheast re fle cte d the continuing gradual declin e in average w eekly hours fo r w ork ers in the nonmanufacturing in d u stries . Plant w ork ers in m anufacturing firm s have had a sh orter average w orkw eek than those in nonm anufacturing industries as a group.
In 1965, the m anufacturing and public u tilities industries had the sh ortest average scheduled w eekly hours (40 .2 ) fo r plant w ork ers . Plant w ork ers in se rv ice s had the lon gest w orkw eek (41 h ours), despite the fa ct that this industry had the sharpest decline in average sch ed uled w eekly hours since I960, when the average was 4 1 .8 hours. E ighty-one percen t o f all plant w ork ers in m etropolitan areas had a scheduled w orkw eek o f 40 hours; 11 percen t w orked over 40 h ours, and the rem aining 8 percen t w orked under 40 hours— p rin cip a lly 37V2 or 35 hours.
O ffice w ork ers in the N ortheast had a con s id erab ly sh orter average w eekly hours schedule (37 .7 ) than o ffice w ork ers in the other reg ion s . Only 38 percen t o f the o ffice w ork ers in the N ortheast had a 40-hour w orkw eek; n early all other o ffice w ork ers in this reg ion w orked le s s than 40 hours— prin cip a lly 35 hours (26 p ercen t), and 3 7 V2 hours (20 percen t). The average w orkw eek fo r o ffic e w ork ers in the W est ex ceeded the 39. 5 hours in the South and N orth Central reg ion s by only one-tenth o f an hour.
Percent of plant and office workers by scheduled _________ weekly hours, 1960 and 1965_________
______Plant workers____ Office workers
Weekly hours 1960 1965 1960 1965
Under 40 hours---------------------------- 7 8 34 3640 hours-------------------------------------- 81 81 64 62Over 40 hours------------------------------ 12 11 2 1
Average scheduled weekly hours---- 40 .5 40 .4 39 .0 38.9
NOTE: Because of rounding, sums of individual items may not equal 100percent.
27 it'pjjg Workweek in American Industry, 1850—1956," Monthly Labor Review, January 1958, pp. 23-29 .
28 The scheduled woikweek is the number of hours which a majority of the first- or day-shift workers were expected to work, at the time of the survey, whether they were paid at straight-time or overtime rates. Thus, hours shown reflect the normal work schedule at time of study.
Digitized for FRASER http://fraser.stlouisfed.org/ Federal Reserve Bank of St. Louis

Paid Holidays
In 1965, nearly all o ff ic e w ork ers and 95 percen t o f plant w ork ers in m etropolitan areas w ere em ployed in establishm ents p r o viding paid h olidays. With this degree o f co v era g e , m ost o f the im provem ents connected with paid holidays w ere in the fo rm o f additional holidays. Continuing the trend tow ard the addition o f paid holidays which provide w ork ers with lon ger w eekends, and away from the addition o f traditional holidays, 29 sev era l recen t union settlem ents sp ecified the day after Thanksgiving as an additional paid holiday. M ajor settlem ents in the auto industry in 1964 added Good F riday as a paid holiday. F u rth erm ore , som e em p loyees , who in the past r e ce ived no com pensation when a regu lar paid holiday fe ll on Saturday or Sunday now get the preceding F riday or follow ing Monday as a paid holiday when the holiday fa lls during the weekend.
A num ber o f sign ificant changes resu lted fro m the additional paid holidays granted em ployees in the past y ear . In som e in stan ces, the in cre a se s e ffective in the p eriod 1964—65 w ere grea ter than those in the 4 -y e a r period 1960—64. G eograph ica lly , the North Central reg ion had the m ost im portant in cre a s e s . Only 1 percen t o f the plant w ork ers in the North Central reg ion had 9 days or m ore of total holiday tim e in I960. By 1964, the percentage ro se to 3 percent, and in 1965 the percentage reached 13 percen t. In the sam e region , the percen t o f plant w ork ers rece iv in g 8 days or m ore o f paid tim e in cre a se d fro m 9 to 18 percent in the period 1960—64, and from 18 to 32 percent in the period 1964—65. The average num ber of paid holidays fo r plant w ork ers in the North C entral reg ion was 6 .7 in I960, 6. 9 in 1964, and 7 .1 in 1965. M anufacturing and public utility industries w ere p rim a rily respon sib le fo r the la rge in cre a s e s . In spite o f these sign ificant advances, the North Central reg ion tra iled the Northeast and the West in the average num ber o f paid holidays granted to both o ffice and plant w ork ers.
The slight d ecrea se in the average num ber o f paid holidays fo r o ffice w ork ers in the finance d iv is ion m ay have been a ffected by a change in the w orkw eek in banks during the period 1960—65. Some banks discontinued their p o licy o f opening fo r business on Saturdays and, at the sam e tim e, reduced the num ber o f paid holidays.
In each industry d iv is ion and in each o f the reg ion s, o ffice w ork ers continued to r e ce iv e m ore paid holidays than plant w ork ers , even though there was m ore o f an in crea se in the average num ber of paid holidays fo r plant than fo r o ffice w ork ers during the period .
2DFor an analysis of major paid holidays provided, see Wages and Related Benefits,
Part lit Metropolitan Areas, United States and Regional Summaries. 1963-64 (BLS Bulletin 1385-82 , 1965), p. 77.
8 3
While plant w ork ers in the Northeast re ce iv e d a higher average number o f paid holidays (7 .9 ) than plant or o ffice w ork ers in the three other reg ion s, o ffic e w ork ers in the Northeast had an average of 9 .3 paid holidays in 1965, or 1 .4 paid holidays m ore than the plant w ork ers in this reg ion . The national average num ber o f paid holidays was 7 .9 fo r o ffice and 7 .2 for plant w ork ers in 1965. The o ffice w ork ers ' average was in fluenced by the average num ber o f paid holidays (8. 8) re ce iv e d by w ork ers in the finance d iv ision . The a ll-in du stry average o f 7 .9 paid holidays with finance included drops to 7 .6 when an a ll-in d u stry average without the finance d iv is ion is com puted. 30
Average number of paid holidays provided plant and office workers, 1960 and 1965
Plant workers Office workers
1960 1965 1960 1965
A ll areas------------------------------------ 6 .9 7.2 7.8 7 .9
Industry division
Manufacturing----------------------------Public utilities 1--------------------------
7 .1 7 .4 7 .4 7 .87 .5 7.8 7 .8 8 .0
Wholesale trade-------------------------- 7 .1 7 .4 7 .4 7 .6Retail tra d e ------------------------------- 6 .0 6 .3 6 .6 6 .7Finance 2------------------------------------ - - - 8 .9 8 .8Services-------------------------------------- 5 .9 6 .4 7 .4 7 .4
Region 3
Northeast------------------------------------ 7 .6 7 .9 9 .0 9 .3South----------------------------------------- 6 .0 6 .2 6 .7 6. 7North Central------------------------------ 6 .7 7 .1 7 .0 7 .3W es t------------------------------ ------- 6 .9 7.2 7 .5 7 .7
1 Transportation, communication, and other public utilities.2 Finance, insurance, and real estate.3 For definition of regions, see footnote 3 to the table in appendix A.
Paid V acations
V irtua lly a ll em p loyees in m etropolitan areas w ere e lig ib le fo r paid vacations in I960. Thus, in the 5 years since I960, changes in paid vacations w ere generally in the fo rm of a sh orter len g th -o f- se rv ice requ irem ent fo r a sp ecified vacation p eriod or lon ger vacation after a qualifying length o f se rv ice . The follow ing tabulation typ ifies the trend ob serv ed in paid vacation provision s during this period :
30 In comparing national and regional averages for plant and office workers, it should be kept in mind that the liberal provisions for workers in banks and insurance are not included in the plant workers' averages. (See footnote 7 to the table in appendix A .)
Digitized for FRASER http://fraser.stlouisfed.org/ Federal Reserve Bank of St. Louis

8 4
Percent of plant and office workers in establishments with selected formal paid
______ vacation provisions, 1960 and 1965
(Cumulative percent)
_____ Plant workers Office workersAmount of vacation pay
and length of service 1960 1965 1960 1965
3 weeks or more after:10 years---------------------------------- 27 47 38 6115 years---------------------------------- 74 77 82 8820 years---------------------------------- 75 78 84 8825 ye ars---------------------------------- 76 78 85 89
4 weeks or more after:15 years---------------------------------- 2 4 3 720 years---------------------------------- 9 24 13 2925 years---------------------------------- 22 43 33 56
The relationsh ip betw een vacations provided sh o r t -se r v ice plant and o ffic e w ork ers did not change ap preciab ly during 1960—65. S h o r t-se rv ice o ffice w ork ers continued to re ce iv e m ore lib e ra l paid vacations than sim ilar plant w ork ers ; fo r exam ple, 76 percen t o f the o ffic e w ork ers in 1965 w ere provided 2 w eeks after 1 y e a r 's se rv ice com p a red with only 19 percen t o f the plant w ork ers . As in e a r lie r y e a rs , d iffe ren ces betw een vacations provided plant and o ffic e w ere not as great fo r the lo n g -s e rv ic e w o rk e rs . M ost o f the changes w hich took p lace during the 5 -y ear p eriod a ffected the lo n g -s e rv ic e em p loy e es , but prov ision s w ere lib e ra liz e d fo r both o ffice and plant w ork ers .
M ost of the plant w ork ers in the se rv ice s industry reached their m axim um vacation after 15 y ears o f s e rv ice , while in all other industries studied there w ere con s id erab le and varied changes which provided fo r lon ger paid vacations after the 15 -year m ark . In public u tilities , only 4 percent o f the plant w ork ers re ce iv e d 4 w eeks' v a ca tion after 15 y e a rs ; but, a fter 20 and 25 y e a rs , those rece iv in g 4 w eeks jum ped to 43 and 73 percen t, re sp e ctiv e ly . A higher percen t of sh o r t -se rv ice o ffic e w ork ers in the finance industry d iv ision w ere p r o vided re la tive ly long vacations when com pared to s im ilar w ork ers in other industry d iv is ion s . H ow ever, this d ifferen ce la rg e ly d isappears after lon ger p eriods o f s e rv ice .
R egionally , the highest percen t o f sh o r t -s e r v ice plant w ork ers with re la tive ly long paid vacations was in the W est. P rov is ion s fo r plant w ork ers in the North Central reg ion ranged fro m the lea st to the m ost lib e ra l, depending on length o f se rv ice ; plant w ork ers with short se rv ice re ce iv e d sh orter paid vacations than com parable w ork ers in the other reg ion s , while lo n g -s e r v ic e 'em p lo y e e s w ere p rovided longer paid vacations than w ork ers in the other reg ion s. Am ong reg ion s, o ffice w ork ers in the N ortheast had the longest vacations and in the South the sh ortest.
Health, Insurance, and P ension Plans
In co lle ctin g data on health, insurance, and pension plans, fie ld represen tatives o f the Bureau sought in form ation relating only to the preva len ce o f these plans, and no attempt was made to evaluate either their m onetary co s t or the benefits provided by any plan (except paid s ick lea ve). 31 A ll plans (except those lega lly required) w ere included w henever at lea st a part o f the co st was borne by the em p loyer. Plans included those underw ritten by a co m m e rc ia l in su rance com pany and those provided through a union fund, or paid d irectly by the em p loyer out o f curren t operating funds, or fro m a fund e a r m arked fo r this pu rpose.
L ife insurance co v era g e , available to 96 percen t o f the o ffice w ork ers and to 92 percen t o f the plant w ork ers , was the m ost com m on benefit fo r o ffice w ork ers . Nine out o f ten o ffic e and plant w ork ers w ere co v e re d by hospita lization and su rg ica l insurance plans.
Am ong the plans studied, catastrophe (extended m edica l) insurance has been slow est in gaining general acceptan ce . This type o f insurance is designed to p rotect em p loyees when sick n ess or in jury in volves expenses beyond the norm al covera g e o f hospitalization , m ed ica l, and su rg ica l plans. By I960, it was the only plan studied w here le s s than half o f the plant o r o ffic e w ork ers had been brought under co v era g e . S p ecifica lly , in that year , 20 and 42 percen t o f the plant and o ffic e w ork ers , resp ectiv e ly , had catastrophe insurance available to them . The potential fo r expanded covera g e was grea ter fo r this insurance and, in the period 1960—65, coverag e fo r plant and o ffice w ork ers reached 35 and 69 percen t, resp ectiv e ly .
The 59 percen t o f the plant and 61 percen t o f o ffice w ork ers with m ed ica l insurance covera g e in I960 advanced to 71 and 78 p e r cent, re sp ectiv e ly , by 1965. V iewing potential expansion in term s o f c los in g the gap tow ard ultim ate coverag e under a plan, 2 9 p ercen t o f plant w ork ers lacking m ed ica l insurance covera g e in I960 had it available to them by 1965* In like m anner, o ffice w ork ers advanced tow ard ultim ate m ed ica l covera g e by 44 percent.
A ll o f the industry d iv is ion s studied re g is te re d la rge in cre a se s in catastrophe and m ed ica l insurance coverag e over the 5 y e a rs . The public u tilities industry d iv is ion extended catastrophe insurance covera g e of o ffic e w ork ers fro m 42 to 83 percen t, and of plant w ork ers fro m 36 to 71 percen t. M edical insurance coverag e in creased from 55 to 87 percen t fo r o ffice and 55 to 84 percen t fo r plant w o rk e rs . In I960, the percen t o f plant and o ffice w ork ers in public u tilities having hospitalization and su rg ica l insurance plans was
31 Additional detail (number of days, full pay or partial pay, accumulation, etc.) was collected on paid sick leave. See separate presentation in table B-6.
Digitized for FRASER http://fraser.stlouisfed.org/ Federal Reserve Bank of St. Louis

sm aller than in any other industry d iv is ion . H ow ever, by 1965, only one industry d iv is ion (m anufacturing) had a h igher percen t o f w ork ers co v e re d , and the d ifferen ce was only 1 percen tage point. R egionally , the South has generally tra iled the other geograph ic areas in providing insurance plans to w ork ers . H ow ever, since I960 in terreg ion a l d iffe re n ce s have been reduced by above average in cre a se s in covera g e in the South.
Paym ent fo r absence fro m w ork becau se o f illn ess o r o ff-th e - jo b in jury was guaranteed to 4 o f e v ery 5 plant and o ffic e w ork ers in scope o f this study. Of the two m a jor m ethods o f sa lary continuation during d isab ility , sick n ess and acciden t in surance plans w ere m ost prevalent fo r plant w ork ers , while paid s ick leave was m ost im portant fo r o ffic e w ork ers . A m ore detailed analysis o f paid s ick leave p r o v is ion s and the relationsh ip o f paid s ick leave to sick n ess and accident insurance is presented in the separate covera g e o f paid s ick leave .
P rivate retirem en t pension plans designed to provide paym ents fo r the rem ainder o f the w o rk e r 's life w ere availab le to 71 p e r cent o f the plant w ork ers and 80 percen t o f the o ffic e w ork ers in 1965. In I960, the resp ectiv e percen ts w ere 66 and 76.
Percent of plant and office workers in establishments wilh formal health,
insurance, and pension plans,____________ 1960 and 1965 ___________
Plant workers Office workers
Type of plan 1960 1965 1960 1965
Insurance plans:Life------------------------------------------------ 89 92 92 96Accidental death and
dismemberment----------------------------- 55 59 53 58Hospitalization-------------------------------- 86 92 83 92Surgical------------------------------------------ 84 91 82 91M edical----------------------------------------- 59 71 61 78Catastrophe------------------------------------- 20 35 42 69
Sickness and accident insurance and/or sick leave 1 ----------------------------- 80 80 81 79
Sickness and accident insurance--------- 65 63 43 40Sick leave:
Full pay and no waiting period------ 14 16 59 55Partial pay or waiting period---------- 10 12 8 9
Retirement pension plans---------------------- 66 71 76 80No health, insurance, or
pension plans------------------------------------- 4 3 1 1
1 The apparent decline in prevalence of sickness and accident insurance and sick leave can be attributed to sampling variability and, in the case of sick leave for office workers, to a reevaluation of policies in some establishments regarding the formality of the plans.
85
L arge segm ents o f the w ork fo r c e , pa rticu la rly am ong plant w ork ers , w ere em ployed in establishm ents which paid all o f the financing co s ts o f insurance plans a n d retirem en t pension plans (table B -5 ). Of w ork ers e lig ib le fo r these plans, a higher percentage w ere co v e re d on a noncontributory basis fo r retirem en t pension plans than any other plan. F or exam ple, 71 percen t o f the plant w ork ers w ere co v e re d by som e fo rm o f retirem en t pension plan, and 59 p e r cent w ere in firm s paying the entire co st of the plan; th ere fore , 83 percen t o f those e lig ib le had the entire cost borne by the em p loyer . R egionally , m ost o f the plans provided w ork ers in the N ortheast w ere p rim a rily em p loyer financed; the South showed a g rea ter tendency than any other reg ion to have em ployees share the co st o f financing m ost o f the plans studied.
F orm al P rov is ion s fo r Paid Sick LeavePaym ent fo r absence fro m w ork becau se o f illn ess or o ff-th e -
jo b in jury was guaranteed to 4 o f ev ery 5 plant and o ffice w ork ers in m etropolitan areas o f the United States. This protection was usually in the fo rm o f sick n ess and accident insurance fo r plant w ork ers , w hereas o ffic e w ork ers w ere cov ered p r im a rily by paid s ick leave. S ixty-three percen t of the o ffice w ork ers within scope o f the survey w ere em ployed in firm s with form al s ick leave plans and 40 percen t w ere in firm s with sick n ess and accident insurance fo r o ffic e w ork ers , On the other hand, 63 percen t o f the plant w ork ers w ere co v e re d by sick n ess and accident insurance and only 27 percen t by form a l s ick leave plans.
Plant and o ffic e w ork ers em ployed in the public u tilities in dustry d iv is ion had the grea test likelih ood of being em ployed by an establishm ent with a fo rm a l s ick leave plan, as over half o f the plant w ork ers and a lm ost th ree -fou rth s o f the o ffice w ork ers in this industry w ere provided co v e ra g e . M anufacturing ranked second to public u tilities in providing cov era g e fo r o ffice w ork ers , but provided the least covera g e fo r plant w ork ers . Only 17. 3 percen t o f the plant w ork ers in m anufacturing firm s w ere e lig ib le fo r paid sick leave, com pared with 42. 5 percen t in the nonm anufacturing in du stries . Sixty percen t o f the plant w ork ers w ere em ployed in m anufacturing establishm ents and the lim ited s ick -le a v e coverag e in these establishm ents had a great im pact on the a ll-in d u str ies estim ates.
Paid s ick leave coverag e fo r plant w ork ers was highest in the W est, w here 50 percent w ere covered , fo llow ed by the South with 30 percen t co v e re d . Each m a jor industry d iv ision in the W est provided w ider covera g e than the national average. M anufacturing how ever, was the m ost im portant contributor to the W est's broad er covera g e . F o r ty -fiv e percen t o f the m anufacturing plant w ork ers in the W est w ere elig ib le fo r s ick leave in com parison to the national average fo r m anufacturing o f 17 percen t. About 40 percent of the w ork ers in the a ircra ft and a ircra ft-p a rts industries within scope of the survey are located in the W est. These industries generally p r o vided sick leave fo r plant w ork ers and accounted fo r over a fourth of
Digitized for FRASER http://fraser.stlouisfed.org/ Federal Reserve Bank of St. Louis

86
the W est's m anufacturing plant w ork ers with s ick leave plans. Howev er, with the a irc ra ft and parts in du stries excluded, 38 percen t o f the plant w ork ers in the W est w ere e lig ib le fo r paid s ick lea ve , a con siderab ly higher percentage than the coverag e in the other regions (from 10 to 20 percen t).
C overage fo r o ffic e w ork ers was a lso highest in the W est and next h ighest in the N ortheast. The m ost populous State in each o f these region s (C a liforn ia and New Y ork) has a State tem pora ry disab ility la w 32 and s ick leave plans in these States w ere often designed to p ro vide the d iffe ren ce betw een the d isab ility allow ance and fu ll pay. 33 In many ca se s , plans in these States a lso provided fu ll pay fo r the p eriod between the tim e o f d isab ility and the e ffectiv e date o f co v era g e . (State tem pora ry d isab ility plans usually requ ire a 7 -d ay waiting p e r io d .)
A m a jority o f the plant w ork ers e lig ib le fo r paid s ick leave w ere cov e re d by plans w hich provided constant benefits r e g a rd le ss o f le n g th -o f-s e rv ic e (uniform plans). 34 This was the ca se fo r each industry d iv is ion studied except public u tilities . U niform plans w ere provided to slightly le s s than half o f the o ffic e w ork ers rece iv in g paid sick leave, with proportion s varying by industry d iv is ion fro m about a third in public u tilities to a lm ost fo u r-fifth s in s e r v ice s .
Of those plant and o ffic e w ork ers e lig ib le fo r u niform plans, a m a jor ity w ere provided with 5, 6, 10, or 12 days a yea r . Theprov ision s fo r 5 or 10 days w ere often ex p ressed as 1 or 2 weeks a year; the p rov is ion s fo r 6 or 12 days w ere usually ex p ressed as a half o r fu ll day per month.
P rov is ion s fo r partial pay after the exhaustion o f full pay benefits w ere not as w idespread fo r u n iform plans as fo r graduated plans or fo r plant w ork ers as fo r o ffice w ork ers . One exam ple of a u niform plan with p rov is ion s fo r fu ll pay plus partial pay was the plan fo r o ffic e w ork ers o f a tran sportation -equ ipm en t m anufacturing c o m pany. The plan provided 21 days o f s ick leave at fu ll pay and i f an em ployee was absent fo r m ore than 21 days, he had available to him an additional 42 days at half pay.
Few o f the o ffic e w ork ers co v e re d by u niform plans w ere subject to a waiting p eriod or re ce iv e d le s s than fu ll pay, while a lm ost 1 o f e v ery 3 plant w ork ers co v e re d by uniform plans w ere so lim ited . T hese lim itations w ere m ost prevalent in the W estern reg ion and in w holesale and re ta il trade fo r both plant and o ffice w ork ers and
New Jersey and Rhode Island have similar plans. The New York and New Jersey plans require e m p ire r contributions; the California and Rhode Island plans are financed by the employees.
Plans which provided the difference between fu ll pay and the benefits of an insurance plan were considered as providing full pay.
34 Plans which provide constant benefits after a year of service were considered to be uniform.Changes in benefits during probationary periods of less than a year were disregarded.
in se r v ice s fo r o ff ic e w ork ers . The num ber o f days provided at le s s than full pay or after a waiting period w ere not included in table B -6 becau se the plans w hich provided an equal num ber o f days varied con siderab ly in the proportion o f pay provided and the length of the waiting period .
Graduated plans w ere designed to rew ard w ork ers with g rea ter se rv ice by providing additional leave tim e. 35 U niform plans often accom plish ed the sam e by providing fo r the accum ulation o f unused sick leave; graduated plans seldom allow ed fo r accum ulation o f unused lea ve . Under the graduated plans, in crea ses in c o v e r age after .10 y ea rs ' se rv ice v aried fro m 50 -percen t coverag e fo r o ffice w ork ers and 37 -percen t covera g e fo r plant w ork ers in public u tilities , to 12 percen t fo r o ffice w ork ers and 5 percent fo r plant w ork ers in se r v ice s . Much o f the telephone com m unications industry, which e m ploys about 25 percen t o f the plant w ork ers and about 30 percen t o f the o ffice w ork ers in public u tilities , has a plan fo r lo n g -te rm illn e sse s , with graduations up to a year o f s ick leave for em ployees with 25 y ears o f s e rv ice .
Of those plant w ork ers em ployed in establishm ents with graduated s ick leave plans, th ree -fifth s re ce iv e d only partial pay or w ere subject to a waiting p eriod fo r the f ir s t year; le s s than tw o-fifth s o f those with 10 years o f se rv ice had sim ilar re s tr ic t io n s . About a tenth o f those e lig ib le fo r s ick leave after 10 y ea rs ' se rv ice w ere in elig ib le fo r s ick leave after only a year of s e rv ice , but had acqu ired e lig ib ility with g rea ter tenure.
Som e o ffic e w ork ers a lso rece iv ed m ore lib e ra l benefits as se rv ice tim e in cre a se d . T h ree -fou rth s o f the o ffice w ork ers cov ered by graduated plans w ere e lig ib le fo r fu ll pay, or fu ll pay plus partial pay, after a year o f s e r v ice . The proportion elig ib le fo r sim ilar benefits after 10 years o f se rv ice in crea sed to a lm ost 90 percent. Som e graduated plans w hich requ ired a waiting p eriod fo r o ffice w ork ers with a y ea r o f se rv ice did not requ ire the waiting period after 10 years o f s e rv ice .
The study o f cred it fo r unused benefits was lim ited to p r o v is ion s fo r accum ulation o f s ick leave fo r use in future y ea rs . Other m ethods used to rew ard w ork ers fo r not exhausting available benefits included cash paym ent fo r all or part o f the unused leave; unused leave tim e added to the next y e a r 's vacation ; and in crea sed s ick leave benefits to those w ork ers who have not exhausted past benefits.
Slightly m ore than a fifth o f the plant and o ffic e w ork ers co v e re d by s ick leave plans w ere em ployed in establishm ents w hich allow ed the accum ulation o f unused s ick leave . F ourteen percen t of the plant w ork ers and 37 percen t o f the o ffice w ork ers with p rov is ion s
35 The study of provisions of graduated plans (those which had changing benefits after a year of service) was limited to those provisions applicable after 1 year and 10 years of service.
Digitized for FRASER http://fraser.stlouisfed.org/ Federal Reserve Bank of St. Louis

fo r accum ulation w ere not r e s tr ic te d in the num ber o f days they could accum ulate. Plans w hich provided fo r accum ulation o f unused leave usually cred ited w ork ers with le s s leave per year than plans which had no p rov ision s fo r accum ulation .
P rov is ion s fo r accum ulation o f unused paid s ick leave w ere found m ore often in u niform plans than in graduated plans. Graduated plans w hich did provide fo r accum ulation usually had few graduations and provided a month or le s s o f s ick leave as the m axim um amount earned each year.
F or both o ffice and plant w ork ers , prov ision s fo r accum ulation w ere m ore than tw ice as prevalent in the W est as in any other region , since uniform plans, w hich are m ore lik e ly to have prov ision s fo r accum ulation , w ere w idespread in that reg ion . Of the industry div isions studied, the la rg est p roportion o f o ffic e w ork ers allow ed to accum ulate sick leave was found in finance. This was the only d iv ision which adopted plans fo r unlim ited accum ulation m ore often than plans fo r lim ited accum ulation .
D isability benefits do not always end with the exhaustion of paid s ick leave; 38 percent o f the plant w ork ers and 41 percent of the o ffice w ork ers with s ick leave coverag e w ere a lso e lig ib le fo r s ick ness and accident insurance. L ess than 30 percen t o f the plant and o ffice w ork ers in the W est re ce iv e d both s ick leave and sickn ess and accident insurance; this m ay r e fle c t the absence o f a need fo r volun tary sick n ess and accident insurance plans in C a liforn ia because of the State1 s tem porary disab ility law. 36 The d isab ility laws o f New J ersey , New Y ork , and Rhode Island apparently did not have the sam e e ffect on sick n ess and accident insurance coverag e in the Northeast.
O ffice w ork ers in m anufacturing rece iv in g paid s ick leave w ere m ore lik e ly to r e ce iv e supplem ental sick n ess and accident in su rance benefits than w ere w ork ers in the nonm anufacturing in du stries , and o f the o ffice w ork ers in m anufacturing e lig ib le fo r paid sick leave over 60 percent w ere co v e re d by a supplem entary insurance plan, while le s s than 30 percen t o f those em ployed in nonm anufacturing and elig ib le fo r s ick leave w ere co v e re d by in su ran ce. C overage did not exceed 40 percen t o f the w ork ers in any o f the nonm anufacturing in dustry d iv is ion s . The d ifferen ce in covera g e betw een m anufacturing
As defined, sickness and accident insurance excluded legally required plans such as State temporary disability and railroad unemployment insurance except where the employer contributed more than was legally required or provided the employee with benefits which exceeded the requirements of the law.
87
and nonm anufacturing was not as la rge fo r plant w ork ers as for o ffice w ork ers ; plant w ork ers in m anufacturing rece iv in g sick leave rece iv ed the m ost sick n ess and accident insurance proportionately, but coverage in the se rv ice s industry group fo llow ed c lo se ly . The d iv isions p r o viding the sm allest proportionate sickn ess and accident coverag e to those elig ib le fo r sick leave w ere public u tilities and reta il trade. W orkers in public u tilities w ere le s s lik e ly to need sickn ess and accident insurance becau se o f the lon g -term s ick leave plan provided to telephone com m unication w ork ers and the coverage o f ra ilroad em ployees under the R a ilroad Unemploym ent Insurance Act.
Percent of plant and office workers provided disability benefits, by type of benefit
Plant workers_________________Office workers
All Manu Nonmanu All Manu NonmanuType of disability benefits industries facturing facturing industries facturing facturing
Sickness and accident insurance only---------------------- 53 67 29 14 20 11
Sick leave only, full pay, no waiting period------------------ 8 4 14 32 23 37
Other paid sick leave only--------- 9 5 15 6 2 8Sickness and accident
insurance plus:Full pay, no waiting
period, sick leave------------- 7 6 10 23 37 15Other paid sick leave------------ 3 3 4 3 4 3
No sickness and accident insurance or paid sick leave---------------------------- 20 15 28 22 14 26
As illu strated in the previous tabulation, tw o-th irds o f the plant w ork ers em ployed in m anufacturing w ere covered by sickn ess and accident insurance alone. Plant w ork ers em ployed in nonmanufacturing industries w ere co v e re d le s s often by any plan, but w ere m ore often cov e re d by a s ick leave plan than w ere those in m anufacturing. The sm aller proportion o f o ffice w orkers rece iv in g only s ick ness and accident insurance was partia lly o ffset by the num ber o f w ork ers rece iv in g both sick leave and sick n ess and accident in su ran ce. As fo r plant w ork ers , sickness and accident insurance was m ore prevalent in m anufacturing than nonm anufacturing and paid s ick leave m ore com m on in nonm anufacturing than in m anufacturing.
Digitized for FRASER http://fraser.stlouisfed.org/ Federal Reserve Bank of St. Louis

8 8B. Establishment Practices and Supplementary Wage Provisions
Table B-l. Shift Differentials
(Shift differentials for manufacturing plant workers by type and ampunt of differential in all metropolitan areas by region, 1 1964—65 2)
Percent of manufacturing plant workers—Shift operation and shift
pay differential In establishments having provisions for late-shift operation3 Actually working on late shift
A ll ^reas Northeast Sopth North Central West A ll areas Northeast South North Central West
A ll shift operations------------------------------- 100.0 100.0 100.0 100.0 100.0 100.0 100.0 100.0 100. 0 100.0Second shift----------------------------------------------- 87. 2 80.2 82.4 94.6 91.4 17.8 15. 5 17.0 20.0 18. 1
With shift pay differential------------------------ 82. 1 75.0 67.8 92.9 90. 1 16.6 14.6 13.2 19.6 17.8Uniform cents (per hour)4------------------- 54.6 45.9 54.0 59.2 66.2 11.5 9.7 10.7 12.7 13.8
Under 5 cents _ _ 1.0 1. 1 1.8 . 5 1. 1 . 2 . 3 . 3 . 1 .25 cents _ _ — 6.8 6.9 8.9 5.9 6. 1 1.3 1.4 1.5 1.2 1.06 cents __ — __ ------------ — 3.4 2. 3 5.0 4. 1 1.4 .8 .6 1. 1 .9 . 37 cents. ----- __ „ — __ 2.6 2.7 4 .3 2. 1 1.0 . 5 . 5 1.0 . 5 . 17V2 cents _ ________ .8 1. 1 .6 .7 .3 . 1 . 2 . 1 .2 (5)8 cents __ 11.6 10.9 14.4 11.3 9.8 2.6 2.7 2.9 2.6 2. 39 cents 1.4 2.0 .8 .8 2.6 .3 .4 .2 .2 .610 cents. _ _ 12.5 10.2 8.5 15.7 15.0 2.3 1.6 1.6 3. 2 2. 311 cents . 5 .7 . 2 .7 . 1 . 1 .2 (5) .2 (5)12 cents.. 6. 1 1.6 4 .2 6.9 19.3 1.3 . 3 .9 1. 5 4.714 cents. 1.4 .4 1.7 2.3 .9 .3 . 1 .2 .4 . 2143/5 cents .8 - - 2. 1 - . 2 - - .6 -15 cents- 2.2 2.0 1.2 2 .1 4 .2 .4 .4 . 3 .4 .9Over 15 cents 2. 1 2.7 .4 2.2 2. 5 . 5 .7 . 1 . 5 .6
Average cents-per-hour differential----- 9.4 9. 1 8 .3 9.8 10. 3 9.5 9. 1 8. 5 9.8 10. 6Uniform percentage4--------------------------- 22.7 26.0 11 .2 29.0 10.4 4. 2 4. 3 2.0 5.8 1.8
5 percent.--------- ----------------------- — 8.3 5. 2 2.6 15.3 3.4 1.7 .9 . 3 3. 5 .67 percent_________________________ 1.2 .9 2.4 1. 3 - . 2 . 2 .4 .3 -7V2 percent----------------------------------- . 5 . 5 (5) .8 - . 1 . 1 (5) . 1 -8 percent_________________________ .7 .4 1.0 1. 1 - . 1 . 1 .2 . 1 -10 percent _ . . . . 10.8 17. 1 4 .6 9.7 6.2 1.8 2.6 .9 1.7 1.015 percent. _ _ — - - .4 .8 (5) . 3 - . 1 . 1 - (5) -
Average percentage differential----------- 7.9 8.9 7.8 7. 1 8 .0 7. 6 8.8 8.3 6.8 7. 8Otherh ..................................................... 4 .8 3. 1 2. 5 4.7 13.5 .9 .6 .6 1.0 2. 2
With no shift pay differential------------------- 5.2 5. 2 14.6 1.7 1.3 1.2 .9 3.8 .4 . 3Third shift------------------------------------------------- 78.7 71. 2 70.9 88. 1 82. 5 6. 5 6.0 7.9 6.7 5.3
With shift-pay differential— ---- — 77.3 69.9 66.4 87.7 82. 2 6. 3 5.8 7. 2 6.7 5. 3Uniform cents (per hour)4 ------------------ 47.3 41. 5 50.0 53.9 38.0 4 .9 4. 5 6.2 4 .9 3.7
5 cents___________________________ 2. 5 .8 9.3 1.2 1. 1 .4 . 1 1.7 . 1 (5)6 cents _ __ _ ------- 1.7 .9 1.0 2.8 1. 1 .2 . 1 . 1 . 3 . 27 cents 1.2 1. 5 2. 1 .8 . 2 .2 .3 . 2 . 1 (5)8 cents . _ __ — .8 . 5 1.6 .8 .4 . 1 . 1 . 1 . 1 (5)9 cents _ _ __ __ 1.3 1.0 3.2 .9 . 3 . 2 . 1 .6 (5) (5)10 rents _ — ------------- 9.3 10.7 5.0 10.7 7.0 .6 .8 . 3 .7 .211 rents — — _ - — .7 1.0 .9 .4 . 1 . 1 . 1 . 1 . 1 (5)12 cents__________________________ 12.0 11. 5 10.2 14. 1 9.4 1.7 1.8 1.3 1.7 1.6I2V2 cent8 __ — - - - .7 1.0 . 5 .6 .8 . 1 . 1 . 1 (5) (5)13 cents__________________________ .7 .7 .7 1.0 .2 . 1 (5) . 1 . 114 cents__________________________ 1.4 1. 3 .9 2.0 .6 . 1 . 1 . 1 . 1 (*)15 cents _ _ 5.8 4.6 3.4 7.2 8.6 .4 . 3 . 3 .4 .716 cents__ — 2.3 1. 1 4. 5 2.2 2.5 .3 . 1 .6 . 3 .418 cents__________________________ .8 .4 .5 1.3 1.2 . 1 (5) . 1 . 1 . 120 cents 1. 5 .7 3.0 1.6 .7 . 1 (5) .4 . 1 (5)Over 20 cents __ _ . . . . 2.5 1.4 1.6 3.9 2.7 .2 . 1 . 1 . 3 . 2
Average cents-per-hour differential---- 12.4 12. 1 11 .4 12.9 13. 5 12.0 11.8 10.7 12. 5 13.6Uniform percentage4-------------------- 19.8 23.2 10.9 25.4 6. 1 .9 .9 .7 1. 3 . 1
7 pei-rwnT --- ■ ------- -------- .9 1.0 2.3 . 3 - (5) (5) . 1 (5) -10 percent____ ______ _________________ 15.4 17.0 7.0 21.4 5.0 .7 .7 . 5 1.0 . 115 percent____________________________ 1.3 2.3 . 1 1. 1 1. 1 . 1 . 1 - . 1 (5)
Average percentage differential-------- 10.0 10. 1 8 .9 10. 1 10.9 9.9 9.8 9.0 10.2 10. 3Other ®----------------------------------- 10.2 5.2 5 .5 8.4 38. 1 . 5 .4 . 3 . 5 1. 5
With no shift pay differential--------------- 1.4 1.3 4 .5 .4 . 3 . 2 .2 .7 . 1 (5)
1 For definition of regions, see footnote 3 to the table in appendix A.2 Information on establishment practices is obtained annually in 6 of the largest areas and biennially on a rotating cycle in the remaining areas. Data for a majority of the workers relate
to late 1964 and early 1965; for the remainder, to late 1963 and early 1964.3 Includes establishments currently operating late shifts, , and establishments with formal provisions covering late shifts, even though they were not currently operating late shifts.4 Includes differentials in addition to those presented separately.5 Less than 0.05 percent.6 Includes pay at regular rate for more hours than worked; a paid lunch period not given to first-shift workers; a flat sum per shift; and other provisions. Most "other, " however, were
in establishments which provided 1 such provision in combination with a cents or percentage differential for hours actually worked.NOTE: Because of rounding, sums of individual items may not equal totals.
Digitized for FRASER http://fraser.stlouisfed.org/ Federal Reserve Bank of St. Louis

Table B-2. Scheduled W eekly Hours8 9
(Percent distribution of plant and office workers by scheduled weekly hours 1 of first-shift workers in all metropolitan areas,by industry division and region, 2 1964—65 3)
Weekly hours AllIndustry, division Region 2
Manufacturing Public utilities 4
Wholesaletrade
Retailtrade Finance 5 Services Northeast South North
Central West
All weekly work schedules _
Plant workers
100 100 100 100 100 100 100 100 100 100
Under 40 hours 6 ___________________________ 8 8 1 3 14 13 14 5 6 5Under 35 hours_________________________ n (7) - (7) (7) 3 (7) 0 (7) (7)35 hours _ __ __ __ - __ __ 3 3 (7) 1 1 5 6 C) 1 237V2 hours __ __ ______ __ __ _ _ 3 3 (7) 2 7 4 6 3 2 2
40 hours_____________ ____________________ 81 85 95 81 66 61 79 74 84 88Over 40 hours 6 — _ _ __ __ ___ 11 8 5 15 20 26 7 21 10 6
42 h o u r s _ ___ 1 1 (I) (7) 2 1 1 2 1 144 hours ------------------ ------ ---- -------- _ 2 1 (7) 3 5 4 1 4 2 145 hours _________ _____ __________ ____ 2 2 1 3 2 3 1 3 3 148 hour s _______________________________________________ 3 2 1 2 6 14 2 7 3 2Over 48 hours____ ________ _____ ___ 1 1 1 3 2 2 1 3 2 (7)
Average scheduled weekly hours____________ 40.4 40.2 40.2 40.8 40.8 41.0 39.9 41.2 40.4 40.2
Office workers
All weekly work schedules______________ 100 100 100 100 100 100 100 100 100 100 100
Under 40 hours6- ----- ----------- --------- — 36 21 26 31 25 63 47 8 62 25 23 1835 hours________________________________ 10 6 9 10 7 15 19 26 2 2 136V4 hours _____ ________ ________________ 3 1 1 2 1 8 2 6 2 1 137V2 hours. -------- --------- -------------------- 14 9 14 13 13 21 20 20 13 12 9383/4 hours__ ___________________ _______ 4 4 1 4 1 8 4 3 5 6 3
40 hours___________ ___________ ____ — 62 78 74 65 70 37 48 38 70 75 81Over 40 hours--------------------------------------------- 1 1 (7) 4 5 (7) 5 (7) 4 1 1
Average scheduled weekly hours------------------- 38.9 39.4 39.1 39.1 39.4 38.0 38.6 37.7 39.5 39.5 39.6
1 The scheduled workweek is the number of hours which a majority of the full-time workers on the first or day shift were expected to work at the time of the survey, regardless of whether some hours were paid for at overtime rates.
2 For definition of regions, see footnote 3 to the table in appendix A.3 See footnote 2, table B -l.4 Transportation, communication, and other public utilities.5 Finance, insurance, and real estate. Data are not shown separately for plant workers in this industry group. Plant workers in real estate, however, are included in "all" and
regional data.6 Includes weekly schedules other than those presented separately.7 Less than 0. 5 percent.8 Data published in error last year as 36 percent should have been 62 percent.
NOTE: Because of rounding, sums of individual items may not equal totals.
Digitized for FRASER http://fraser.stlouisfed.org/ Federal Reserve Bank of St. Louis

9 0
Table B-3. Paid Holidays
(Percent distribution of plant and office workers by number of paid holidays provided annually in all metropolitan areas, by industry division and region, 1 1964—65 2)
Item AllIndustry division Region1
Manufacturing Public utilities 3
Wholesaletrade
Retailtrade Finance 4 Services Northeast South North
Central West
Plant Workers
All workers ___ ____ __ __ ________ 100 100 100 100 100 100 100 100 100 100Workers in establishments providing
paid holidays _j,______ __ __ __________ 95 97 98 97 92 80 98 87 98 95Workers in establishments providing
no paid holidays _ ___________ _ _ _ ____ 5 3 2 3 8 20 2 13 2 5Average number of holidays_________________ 7. 2 7.4 7. 8 7.4 6. 3 6.4 7.9 6. 2 7. 1 7. 2
Number of daysLess than 1 d ay______ ____________ ____ _ (5) (?) (?) (?) (5) (5) (?) (5) (!) .1 day. ---------- -------- -------- ------------------- 1 (?) (5) (5) 3 2 (5) 3 (!) 11 day plus 1 half day or m ore_______________ (?) ( ) - (5) (5) (5) (?) -2 days _ ........ (5) (?) (?) (?) 1 2 (?") 1 (!) 13 days___________ __ ________ __ ________ 1 (?) (?) (5) 1 2 (5) 2 (5) 13 days plus 1 half day or m ore.. ___ __ ____ (5) (5) (?) - - - - (5) - (!*)4 days _ ______ __ _________________ _ 1 1 (5) (?) 1 2 (5) 2 (5) (5)4 days plus 1 half day or more_______________ (5) (5) (5) - (5) (5) (5) -5 days_ ____ ________ __ — ------------------- 4 3 1 9 10 7 1 17 1 15 days plus 1 half day or more__ _______ __ (5) (5) (5) 1 1 (5) (5) 1 (5) (5)6 days_____ __ ______ _________ ______ ___ _ 18 10 12 24 39 33 10 18 25 186 days plus 1 half day. ___ _____ ___ __ _ 1 2 (?) 2 (5) 1 2 1 2 16 days plus 2 half days _ __ _______ 5 7 (?) 6 1 (*) 2 1 12 16 days plus 3 half days or m ore_____________ (5) (5) (5) 1 - (5) (5) (5) (5) (5)7 day 8 __ __________ _ ______ _. _______ 26 29 36 13 18 13 28 24 24 297 days plus 1 half day. . . _. ______ ______ 1 1 1 1 (5) (5) 1 (?) 1 27 days plus 2 half days______ _______________ 2 3 (5) 2 2 1 3 (!) 3 27 days plus 3 half days or m ore_____________ (5) (5) (5) (5) (5) (5) (5) - -8 days _ __ ____ _ ___ __ ____ __ 20 23 26 17 12 5 22 14 17 338 days plus 1 half day. ___ _ ________ __ _ 1 1 (?) 1 (*) 2 1 (“) (5) 18 days plus 2 half days _ _ ____________ _____ 1 2 (5) (?) (5) (5) 2 (5) 2 (5)8 day8 plus 3 half days _ --------- ----------------- (5) - - (5) - (5) - - -9 days_______ ________________ _________ 7 10 6 8 2 4 10 2 10 49 days plus 1 half day or more_______________ 1 1 1 1 (5) 1 2 (5) (5) (5)10 days_________________________________ __ 2 2 3 3 1 2 5 1 1 110 day8 plus 1 half day or m ore________ __ _ (5) (5) (5) (5) (?) (5) 1 (?) - -11 days_______ _____________________________ 2 1 7 4 (?) 2 5 (?) (5) -11 days plus 1 half day or m ore_____________ (!) (*) (5) 1 (5) (?) (5) (5) - -12 days.. _____ __ __ _________ ____ _ (?) (?) 2 1 (?) 2 (5) (5)Over 12 days_______________ _ __ ._ __ _ (5) (5) 1 2 - (5) 1 - - -
Total holiday time 613 days or more__ ___ _ _____________ __ . (*) (*) 1 2 - (*) (5) - - -I2V2 days or m ore__________________________ (5) (5) 1 2 - 0 1 - - -12 days or more____________________________ 1 (?) 3 3 (?) (?) 2 - (!) (!)HV2 days or m ore.. ____ __ ____ _ ____ 1 (5) 3 4 (5) (5) 2 (?) (!) (!)11 days or more____________________________ 3 1 10 7 1 2 8 (!) (!) (?)10V2 days or m ore.. ---- ------ ------------ --- 3 2 10 7 1 2 8 (5) (5) (5)10 days or more ______ __ __ 5 4 14 11 2 5 14 1 1 19V2 days or more__ __ __ __ ____ ____ _ 5 4 14 12 2 5 15 1 1 19 days or m ore____________________________ 14 16 21 20 4 9 27 3 13 58V2 days or more _ __ __ __ _ 15 17 21 20 4 10 29 3 13 68 days or m ore_______________ __ ________ 37 43 47 39 17 16 53 18 32 417V2 days or more___________________________ 38 4 4 48 41 18 17 55 18 33 437 days or m ore____________________________ 69 80 84 60 37 30 84 43 69 736V2 days or more. ______ __________ ____ 70 82 84 62 37 31 85 4 4 71 746 days or m ore_____________________ ____ 88 93 96 87 76 64 95 62 96 925V2 days or more______ ______ _ ------ ._ _ 88 93 96 87 76 64 95 63 96 925 days or more . 92 95 97 96 86 71 97 79 97 924V2 days or more___________________________ 92 95 97 96 86 71 97 79 97 924 days or m ore____________________________ 93 96 98 97 87 74 97 82 97 92
See footnotes at end of table.
Digitized for FRASER http://fraser.stlouisfed.org/ Federal Reserve Bank of St. Louis

Table B-3. Paid Holidays-----Continued
(Percent distribution of plant and office workers by number of paid holidays provided annually in all metropolitan areas, by industry division and region, 1 1964—65 2)
91
Industry division Region 1 2It^m All
Manufacturing Public utilities 3
Wholesaletrade
Retailtrade Finance 4 Services Northeast South North
Central West
Office workers
All workers___________________________ 100 100 100 100 100 100 100 100 100 100 100Workers in establishments providing
paid holidays _ ________ _______________ _Workers in establishments providing
99 99 99 99 99 99 98 99 99 99 99
no paid holidays ____ __ __ __ __ _ (5) (5) (5) (5) 1 (5) 2 (5) 1 (5) (5)Average number of holidays________________ 7.9 7. 8 8. 0 7. 6 6. 7 8. 8 7.4 9. 3 6. 7 7. 3 7. 7
Number of daysLess than 5 days ___ __ _____ ____ __ (5) (5) (5) (5) 1 _ 1 (*) 2 (?) (?)5 days _ __ __ __ _ ________ . 4 1 1 6 10 5 5 ( ) 19 (?) (?)5 days plus 1 half day or more_______________ (5) (5) (5) 1 1 1 (5) (5) 2 (5) (5)6 days .. - _ _ _ . ______________________ 16 10 8 20 38 16 28 4 24 26 126 days plus 1 half day_ __ __ ________ ____ 2 2 1 3 1 2 2 (5) 2 4 16 days plus 2 half days __ ____ __ _ __ 3 6 1
(5)6 1 1 1 1
(5)2 9 1
6 days plus 3 half days or m ore. __ __ __ _ (5) (5) 1 (5) (5) 1 (5) 1 (5)7 days ___________ _______ ______________ ___ 20 23 34 13 30 8 17 14 22 22 247 days plus 1 half day_______________________ 2 2 1 3 2 2 3 2 1 2 27 days plus 2 half days ___ __ ___ __ _ 2 3 (?) 3 (?) 1 3 2 1 3 27 days plus 3 half days or more ___ __ (5) (5) (5) (5) (5) (5) (5) (5) (5) (5) -8 days , ____ ... ,__ ___ _,,________________ 20 27 29 20 7 10 13 14 16 15 438 days plus 1 half day __ _ _____ __ __ _ 2 2 (5) 1 (5) 4 4 2 1 1 58 days plus 2 half days__ ______ 2 3 1
(5) (*)1
(*)2 2 1
(5)3 1
8 days plus 3 half days or m ore_____________ (5) (5) (5) (5) 1 - -9 days _ __ _ _ _ ____ 8 11 8 7 2 8 5 13 3 10 49 days plus 1 half day _ __ _ ___ __ 1 1 1 1
(*)2 (?) 3
(*)(?) 1
9 days plus 2 half days __ _ — — _ 1 1 (?) 1 1 ?)n
(!) 19 days plus 3 half days or m ore_____________ (5) (5) (5) (5) - (5) (5) - (5) -10 days __ _ __ __ ___ __ __ __ _ 4 3 4 4 2 6 3 8 3 1
(5J1
10 days plus 1 half day_ _____ __ ______ 1 1 1 1 (?) 1 (5) 2 (?) (?)10 days plus 2 half days or more __ __ __ __ (5) (5) (5) 1 (5) 1 1 1 ?) (5) (5)11 days.. _____ __ __ — — — 7 2 8 2 1 16 4 17 (?) 2 111 days plus 1 half day_____________________ 1 0 - 1 - 2
(*)3 (5) (5.) -
11 days plus 2 half days or more __ ____ (5) (?) 1 1 (?) 1 1 - - (5)12 days ____ _ _ _ _ _ __ _ _ — _ _ 3 0 2 1 (5) 8 (5) 7 (5) (5) 112 days plus 1 half day or m ore_____________ 1 0 0 - - 2 1 2 - - -13 days or more __ _ __________ (5) (5) (5) 1 (5) 1 (5) 1 (5) - -
Total holiday time 613 days or more___________________________ 1 0 (5) 1 (?) 1 (5) 1 (?) -I2V2 days or m ore.. _ _ _ __ __ 1 (5) 1 1 (?) 2 1 3 (?) - -12 days or m ore.. __ ________ __ ____ 4 1 2 2 11 1 11 0 (*) 111V2 days or m ore. __ __ __ __ _ _ _ _ 5 1 2 3 (5) 14 2 14 (5) (5) 111 days or more _ __ ______ ___ __ 12 3 11 6 2 31 8 32 1 2 2IOV2 days or more ___ __ _ ____ ___ 13 4 11 7 2 32 8 34 1 2 210 days or more __ _ _ __ __ ----- 17 7 15 12 4 39 11 43 4 4 49V2 days or more __ __ _____ _ _ 19 8 17 14 5 41 12 46 5 4 59 days or more _____ __ _ ----- ----- __ 29 22 25 22 8 50 19 60 8 17 108V2 days or more. __ ____ ___ _ __ __ 31 24 26 23 8 54 23 62 9 18 158 days or more ____ ____ __ 53 55 55 46 16 65 39 78 26 36 607V2 days or more___________________________ 55 57 56 50 18 67 43 80 27 39 627 days or more _ _ _ _ _ _ _ _ _ __ _ 78 86 90 70 48 76 61 95 51 69 876V2 days or more. *___ _ __ ____ __ 80 87 91 72 49 79 63 95 53 73 886 days or more __ _ __ _____ 95 98 99 93 88 95 92 99 77 99 995V2 days or more___________________________ 96 98 99 93 88 95 92 99 79 99 995 days or more ___ ______ ____ ___ __ ____ __ 99 99 99 99 98 99 97 99 97 99 99
1 For definition of regions, see footnote 3 to the table in appendix A.2 See footnote 2, table B-l.3 Transportation, communication, and other public utilities.4 See footnote 5, table B-2.5 Less than 0. 5 percent.6 All combinations of full and half days that add to the s a m e amount are combined; for example, the proportion of workers receiving a total of 7 days included those with 7 full days and
no half days, 6 full days and 2 half days, 5 full days and 4 half days, and so on. Proportions we re then cumulated.
NOTE: Because of rounding, sums of individual items may not equal totals.
Digitized for FRASER http://fraser.stlouisfed.org/ Federal Reserve Bank of St. Louis

9 2Table B-4. Paid Vacations
(Percent distribution of plant and office workers by vacation pay provisions in all metropolitan areas, by industry division and region. 1964t-652)
Industry division Region1Vacation policy A ll
Manufacturing Public utilities 3
Wholesaletrade
Retailtrade Finance4 Services Northeast South North
Central West
Plant workers
A ll workers __________ __ __ _ __ 100 100 100 100 100 100 100 100 100 100
Method of payment
Workers in establishments providingpaid vacations___________ ________ _ __ - 99 99 99 98 99 94 99 97 99 99
Length-of-time payment _____________ ____ 86 80 97 97 96 90 84 87 85 91Percentage payment_________ ________ __ 12 18 3 2 1 3 13 9 14 8Flat-sum payment _______________________ (5) (5) (!) - 1 (5) 1 1 (!) (!)Othfir ...... ... ... . __ ....... 1 1 (5) - (5) 1 1 (5) (5) (5)
Workers in establishments providing(5) (5)no paid vacations____________________ ___ __ 1 1 2 1 6 1 3 1
Amount of vacation pay6
After 6 months of service
Under 1 week__ ______________ _____ ______ 16 22 2 7 9 8 25 9 16 61 weft1t..,r.. , - - ... _____________ 14 9 31 20 22 12 19 14 10 15Over 1 and under 2 weeks___________________ 2 2 3 3 2 2 4 1 2 12 weeks________ _____ ________ _ 1 (*) 3 1 (!) (5) 2 (5) (•) (5)Over 2 weeks __ __ _ _____ ______ __ (5) (5) (5) - (5) 1 (5) (5) 1
After 1 year of service
Under 1 week__ ___________ __________ ______ (5) (5) _ (5) 1 (5) (5) 1 (5) (5)1 week __ __ __ __ __ _ __ ___ 72 76 65 60 68 70 67 71 81 69Over 1 and under 2 weeks___ __ ___ __ 4 6 1 1 2 3 4 2 6 32 weeks __ _ __ ____ _ _ __ __ _ 19 14 31 34 28 18 25 22 11 22Over 2 weeks _________________ ______ __ 2 3 3 2 (5) 2 3 1 2 5
After 2 years of service
Under 1 week____ _____________ ____________ (5) (5) _ _ 1 (5) (5) 1 (5) (5)1 week 44 55 32 31 22 37 40 47 54 28Over 1 and under 2 weeks _ ___ __ __ _ 10 13 6 2 2 7 14 6 10 42 weeks__ __ ________ _ _ 42 27 59 63 74 47 41 42 33 61Over 2 weeks----------------------------------------------- 3 4 3 3 2 3 4 2 2 6
After 3 years of service
Under 1 week __ ____________ _ __ _ _ _ (5) (5) _ _ (5) (5) (5) 1 (5) (5)1 week 14 17 2 12 7 19 14 23 11 6Over 1 and under 2 weeks___________________ 14 23 1 3 1 3 14 6 24 42 weeks ______________ ____ . „ .... _ 66 54 93 79 88 69 65 65 60 83Over 2 and under 3 weeks___________________ 2 3 (5) 1 2 1 2 2 2 43 weeks ...... ... 2 2 3 2 1 1 3 1 2 2Over 3 weeks __ ____ _________________ (5) (5) (5) 1 (5) 1 (5) (5) (5) 1
After 4 years of service
Under 1 week.. _ _ ____ __ _______ (5) (5) _ _ (5) (5) (5) 1 (5) (5)1 week.. __ ____ _ __ ______ _ ___ __ 13 16 2 11 7 16 13 22 10 5Over 1 and under 2 weeks _______ 14 22 1 3 1 2 14 6 24 32 weeks__ ____ ______ ____ __ ____ 67 55 93 80 88 70 66 66 62 83Over 2 and under 3 weeks___________________ 3 3 1 1 2 3 3 2 2 53 weeks ________ __ _____ _____ __ __ 2 2 3 2 1 1 3 1 2 2Over 3 weeks _____ _ __ _ __ __ ___ (5) (5) (5) 1 (5) 1 (5) (5) (S) 1
See footnotes at end of table.
Digitized for FRASER http://fraser.stlouisfed.org/ Federal Reserve Bank of St. Louis

9 3Table B-4. Paid Vacations-----Continued
■(Percent distribution of plant and office workers by vacation pay provisions in all metropolitan areas, by industry division and region, 1964-652)
Vacatiod policy A llIndustry division Region 1
Manufac tur ing Public utilities 3
Wholesaletrade
Retailtrade Finance 4 Services Northeast South North
Central West
Plant workers— Continued
Amount of vacation pay 6—Continued
After 5 years of service
Under 1 week______________________________ (5) (5) _ _ (5) (5) (5) (5) (5)1 week.. _ __ ___ __ 3 3 (5) 4 4 10 3 9 1 2Over 1 and under 2 weeks___ _ _ _ 1 1 (5) 1 1 1 2 1 1 (5)2 weeks _ _ _ 81 82 92 81 74 73 79 80 86 76Over 2 and under 3 weeks___________________ 5 7 1 1 2 5 5 2 6 63 weeks _ _ _ _ _ _ ___ _ __ __ _ 7 5 5 11 17 4 9 4 5 15Over 3 weeks _ __ _ __ __ __ _ 1 1 (5) 1 (5) 2 1 (5) 1 1
After 10 years of service
Under 1 week______________________________ (5) (5) _ _ (5) (5) (5) (5) _ (5)1 week______ __ _ _ __ _ _ ____ ___ _ 3 3 (5) 4 4 10 2 8 1 2Over 1 and under 2 weeks _ __ __ (5) 1 (5) (5) (5) (5) 1 1 (5) (5)2 weeks _ 36 33 43 41 33 55 35 47 30 34Over 2 and under 3 weeks 12 19 1 4 1 3 9 5 23 53 weeks _ _ r „ .... ... _ ... .. 45 42 53 46 58 24 49 35 43 54Over 3 weeks _ ___ _ _ __ _ _ _ _ _ _ 3 3 2 4 3 2 3 1 3 3
After 12 years of service
Under 1 week______________________________ (5) (5) _ _ (5) (5) (5) (5) _ (5)1 week.. _ ___ __ _ _ ________ _ _ 3 3 (5) 4 4 10 2 8 1 2Over 1 and under 2 weeks __ _ ____ __ _ (5) 1 (5) (5) (5) (5) 1 1 (5) (5)2 weeks_ _ __ ______ 29 25 30 34 31 48 29 42 22 22Over 2 and under 3 weeks___________________ 13 20 1 5 (5) 3 10 4 24 63 weeks _ ____ __ __ __ ____ 50 47 65 51 60 29 52 40 49 65Over 3 weeks---------------------------------------------- 3 4 3 5 3 3 4 2 4 4
After 15 years of service
Under 2 weeks __ __ _ _ _ __ 4 3 (5) 4 5 10 3 9 1 22 weeks__ __ __ 17 14 3 24 24 36 16 31 9 12Over 2 and under 3 weeks _ 2 3 (5) 1 (5) 1 2 1 2 33 weeks ...___ ____ r_____________ . 70 72 90 64 64 41 69 52 80 76Over 3 and under 4 weeks----------------------------- 3 4 1 (5) 1 1 3 2 4 14 weeks . _______ .,____ ____ „ _____ 4 3 4 6 5 3 5 1 3 4Over 4 weeks---------------------------------------------- (5) (5) 1 (5) " 1 1 (5) (5) 1
After 20 years of serviceUnder 2 weeks __ _ __ __ __ __ _ __ 4 3 (5) 4 5 10 3 9 1 22 weeks . . . . . . . __. 16 13 3 23 23 35 16 29 9 12Over 2 and under 3 weeks __ _ __ __ 2 2 (5) 1 (5) 1 1 1 2 33 wepkfi ___ 52 57 51 45 41 40 50 38 59 61Over 3 and under 4 weeks_____________ _____ 3 4 (5) (5) (5) 1 3 2 4 14 weeks __ __ _ ________ _ __ _ __ 22 18 43 22 30 5 25 17 24 20Over 4 weeks----------------------------------------------- 2 2 2 3 (5) 2 2 1 2 2
After 25 years of serviceUnder 2 weeks _ _ _ _ _ 4 3 (5) 4 5 10 3 9 1 22 weeks __ _ _ 15 13 3 23 22 34 15 29 9 12Over 2 and under 3 weeks ___ _____ _ 2 2 (5) 1 (5) 1 1 1 2 33 weeks _ ____ __ _ _ __ ___ 33 35 21 35 27 40 30 24 36 46Over 3 and under 4 weeks ______ _ __ 2 4 (5) 1 (5) 1 2 2 4 14 weeks _ _ _ _ ___ ____ 41 39 73 31 44 6 45 31 45 34Over 4 w e e k s_ _________ __ ______ 2 3 3 3 (5) 2 2 1 3 2
See footnotes at end of table.
220-617 0 - 6 6 - 7
Digitized for FRASER http://fraser.stlouisfed.org/ Federal Reserve Bank of St. Louis

9 4
Table B-4. Paid Vacations— Continued
(P e r c e n t d is t r ib u t io n o f p la n t and o f f i c e w o r k e r s b y v a c a t io n p a y p r o v is i o n s in a l l m e t r o p o li t a n a r e a s , b y in d u s tr y d iv is io n a n d r e g io n , L 9 6 4 -6 5 2)
V a c a t io n p o l i c y A l l
I n d u s t r y d iv i s io n R e g io n 1
M a n u f a c t u r in gP u b l ic
u t i l i t i e s 3W h o le s a l e
t r a d eR e t a i lt r a d e F i n a n c e 4 S e r v i c e s N o r t h e a s t S o u th N o r th
C e n t r a l W e s t
P la n t w o r k e r s — C o n t in u e d
A m o u n t o f v a c a t io n p a y 6— C o n t in u e d
A f t e r 30 y e a r s o f s e r v i c e
U n d e r 2 w e e k s __ ___________ ______ — __ _ 4 3 (5 ) 4 5 10 3 9 1 22 w e e k s _____ ______ _______ __ ___ __ _____ _ 15 13 3 23 22 34 15 29 9 12O v e r 2 a n d u n d e r 3 w e e k s _______________ _ ____ 2 2 (5 ) 1 (5 ) 1 1 1 2 33 w e e k s _______ _______ ______________ 33 35 20 35 27 4 0 30 24 36 4 6O v e r 3 a n d u n d e r 4 w e e k s ____ ______ __ _ 2 4 (5 ) 1 (5 ) 1 2 2 4 14 w e e k s ______________ _ __ __ _____ ____ — _ 4 0 38 7 3 31 4 4 6 4 5 31 4 5 33O v e r 4 w e e k s --------------------------------------------------------------- 3 4 3 3 1 2 3 2 4 2
M a x im u m v a c a t io n a v a i l a b l e
U n d e r 2 w e e k s _____________________________ __ _ 4 3 (5 ) 4 5 10 3 9 1 22 w e e k s ____ _____ _ __ ______ ___ __ — _ 15 13 3 23 22 34 15 29 9 12O v e r 2 a n d u n d e r 3 w e e k s ____ _______ _____ 2 2 (5 ) 1 (5 ) 1 1 1 2 33 w e e k s ________ ___________ ___________ _ 33 35 20 35 27 4 0 30 23 36 4 6O v e r 3 a n d u n d e r 4 w e e k s __ ___ ___ _________ 2 4 (5 ) 1 ( 5 ) 1 2 2 4 14 w e e k s ______________ _ _____________ - __ _ 4 0 38 73 31 4 4 6 45 31 45 33O v e r 4 w e e k s --------------------------------------------------------------- 3 4 3 3 1 2 3 2 4 2
O ff ic e w o r k e r s
A l l w o r k e r s __ ________ _ ______ __ __ _ 100 100 100 100 100 100 100 100 100 100 100
M e th o d o f p a y m e n t
W o r k e r s in e s t a b l i s h m e n t s p r o v id in gp a id v a c a t i o n s . . _ ________ __ ___ ____ 99 99 9 9 100 99 99 99 99 99 99 99
L e n g t h - o f - t im e p a y m e n t™ _________ __ 99 9 8 99 99 99 9 9 99 99 9 9 99 9 7P e r c e n t a g e p a y m e n t™ ____________________ ____ 1 2 1 (5 ) 1 (5 ) (5 ) 1 (5 ) 1 3F l a t - s u m p a y m e n t _ __ ____________________ _ - - - - - - - - - - -O th e r _ __ ______ ____________ __ _ _____ (5 ) (5 ) (5 ) - (5 ) - 1 (5 ) (5 ) (5 ) (5 )
W o r k e r s in e s t a b l i s h m e n t s p r o v id in gno p a id v a c a t io n s _______________________ (5 ) (5 ) (5 ) - ( 5 ) (5 ) (5 ) (5 ) (5 ) (5 ) (5 )
A m o u n t o f v a c a t io n p a y 6
A f t e r 6 m o n th s o f s e r v i c e
U n d e r 1 w e e k _____________________________ _________ 5 5 2 4 9 5 6 7 6 4 21 w e e k __ ________ _____ _____ ____ __ 47 49 4 0 37 28 56 4 3 53 4 2 4 5 4 2O v e r 1 a n d u n d e r 2 w e e k s ________________________ 9 10 4 6 6 12 9 11 7 11 22 w e e k s __ __ __ __ ________ ____ __ __ 5 2 4 1 (5 ) 13 4 12 2 2 2O v e r 2 w e e k s _. _____________ ______ __ _ (5 ) (5 ) - - (5 ) - 3 (5 ) - (5 ) 1
A f t e r 1 y e a r o f s e r v i c e
U n d e r 1 w e e k _______ ______ _ ____ ___ __ __ _ (5 ) (5 ) _ (5 ) _ _ (5 ) _ (5 ) (5 ) (5 )1 w p p lr 22 16 56 29 56 2 24 12 31 26 25O v e r 1 a n d u n d e r 2 w e e k s ______ _______ 1 1 (5 ) (5 ) 1 1 1 1 1 1 12 w e e k s ___ __ ______ ___________ ___ _ _ 76 81 4 4 70 4 3 9 6 68 86 65 7 3 71
2 2 (5 ) 1 (5 ) 1 6 1 3 1 3
S ee fo o t n o t e s at end o f ta b le ,
Digitized for FRASER http://fraser.stlouisfed.org/ Federal Reserve Bank of St. Louis

9 5Table B-4. Paid Vacations— Continued
(P e r c e n t d is t r ib u t io n o f p la n t and o f f i c e w o r k e r s b y v a c a t io n p a y p r o v is i o n s in a l l m e t r o p o li t a n a r e a s , b y in d u s tr y d iv is i o n and r e g io n , 1 9 6 4 -6 5 2 )
V a c a t io n p o l i c y A l l
I n d u s t r y d iv i s io n R e g io n 1
M a n u f a c t u r in g P u b l ic u t i l i t i e s 3
W h o le s a l et r a d e
R e t a i lt r a d e F i n a n c e 4 S e r v i c e s N o r t h e a s t S o u th N o r th
C e n t r a l W e s t
O ff ic e w o r k e r s — C o n t in u e d
A m o u n t o f v a c a t io n p a y 6— C o n t in u e d
A f t e r 2 y e a r s o f s e r v i c e
U n d e r 1 w e e k . . — ___________________ ___ ___________ (5 ) (5 ) _ _ _ _ _ _ (5 ) (5 ) (5 )1 w e e k . , 5 6 7 10 9 (5 ) 8 3 9 5 3O v e r 1 a n d u n d e r 2 w e e k s ________________________ 3 1 19 (5 ) (5 ) 1 2 4 3 32 w e e k s . __ __ _____ , _ __ __ 89 89 7 4 89 89 9 8 81 91 8 3 9 0 9 0O v e r 2 w e e k s --------------------------------------------------------------- 3 4 (5 ) 1 1 2 10 3 4 2 3
A f t e r 3 y e a r s o f s e r v i c e
U n d e r 1 w e e k ______________________________________ (5 ) (5 ) _ . _ _ _ _ (5 ) (5 ) (5 )1 w e e k ___ _____ 2 3 1 3 3 (5 ) 4 2 5 1 1O v e r 1 a n d u n d e r 2 w e e k s _ _ _ _ _ _ _ _ (5 ) 1 (5 ) (5 ) (5 ) (5 ) 1 1 (5 ) (5 )2 w e e k s ___ __ _ _ _ _ ... . 91 85 98 9 3 9 4 9 6 81 9 2 90 9 0 9 3O v e r 2 a n d u n d e r 3 w e e k s ______ — __________ ____ 3 6 (5 ) 1 1 1 6 2 3 5 23 w e e k s _ _ _ _ _ _ _ _ __ 3 5 1 2 1 2 5 4 1 3 2O v e r 3 w e e k s -------------------------------------------------------------- (5 ) (5 ) (5 ) - (5 ) (5 ) 4 (5 ) (5 ) (5 ) 2
A f t e r 4 y e a r s o f s e r v i c e
U n d e r 1 w e e k __ __ __ _ ___ (5 ) (5 ) _ _ _ _ _ . (5 ) (5 ) (5 )1 w e e k _ _ __ _ 2 3 1 3 3 (5 ) 3 2 4 1 1O v e r 1 a n d u n d e r 2 w e e k s ___ . __ ______ (5 ) 1 (5 ) (5 ) (5 ) (5 ) (5 ) 1 (5 ) (5 )2 w e e k s ___________ _ . — _________ ______ 91 85 98 9 3 9 4 96 81 9 2 90 9 0 9 3O v e r 2 a n d u n d e r 3 w e e k s __ 3 6
(V1 1 2 6 2 3 5 2
3 w e e k s _ _______ _ _ ____ _____ 3 5 2 1 2 5 4 1 3 2O v e r 3 w e e k s . . . . . . . . _ __ _ _ _ _ (5 ) (5 ) (■) (5 ) (5 ) (5 ) 4 (5 ) (5 ) (5 ) 2
A f t e r 5 y e a r s o f s e r v i c e
U n d e r 2 w e e k s _____________________________________ 1 1 (5 ) 1 2 (5 ) 2 (5 ) 2 (5 ) ( 5 )2 w e e k s ___ . _ . . . . . . 82 81 9 4 85 82 82 67 77 87 85 8 3O v e r 2 a n d u n d e r 3 w e e k s __ __ 5 3 (5 ) 3 2 10 6 6 5 3 43 w e e k s _________________________ 12 15 5 11 14 9 20 16 5 13 10O v e r 3 w e e k s ________ ___ __ _. _. _ 1 1 ( 5 ) (5 ) (5 ) (5 ) 5 1 (5 ) (5 ) 2
A f t e r 10 y e a r s o f s e r v i c e -
U n d e r 2 w e e k s _____________________________________ (5 ) (5 ) (5 ) 1 2 (5 ) 2 (5 ) 2 (5 ) (5 )2 w e e k s _____ _ _ _. ------ - — 35 29 39 41 31 38 4 0 26 51 32 4 0O v e r 2 a n d u n d e r 3 w e e k s ________________________ 4 7 2 2 1 4 2 4 5 5 33 w e e k s . . . . . . ...... 56 55 58 50 64 57 47 65 4 0 55 5 4O v e r 3 a n d u n d e r 4 w e e k s ________________________ 2 4 (5 ) 1 (5 ) (5 ) 2 1 1 4 14 w e e k s ________ __ ______ _____ _. 3 5 1 4 3 (5 ) 4 4 1 3 2O v e r 4 w e e k s ___ _____ _ ____________ (5 ) (5 ) - " - (5 ) 3 (5 ) (5 ) (5 ) 1
A f t e r 12 y e a r s o f s e r v i c e
U n d e r 2 w e e k s _____________________________________ (5 ) (B) (5 ) 1 2 (5 ) 2 (5 ) 2 (5 ) (5 )2 w e e k s __ __ __ _ __ _ . ______ 29 20 32 36 29 36 37 23 45 26 30O v e r 2 a n d u n d e r 3 w e e k s __ . __ _ __ 5 7 1 3 1 5 2 4 5 5 33 w e e k s . ______ __ _ _____ ________ 60 62 66 54 66 57 50 67 4 4 60 6 3O v e r 3 a n d u n d e r 4 w e e k s _ __ ____ 2 5 (5) 1 (5 ) 1 2 1 2 5 14 weeks -- --- 3 5 1 5 3 (5) 4 4 1 3 2O v e r 4 w e e k s _ __ __ ____ _ _ ____ (5) (5 ) (5) (5) 3 (5) (5) (5) 1
S ee fo o tn o te s at en d o f ta b le ,
Digitized for FRASER http://fraser.stlouisfed.org/ Federal Reserve Bank of St. Louis

9 6
Table B-4. Paid Vacations— Continued
(P e r c e n t d is t r ib u t io n o f p la n t and o f f i c e w o r k e r s b y v a c a t io n p a y p r o v is i o n s in a l l m e t r o p o li t a n a r e a s , b y in d u s tr y d iv is io n and r e g i o n , 1 1 9 6 4 -6 5 2 )
I n d u s t r y d iv i s io n R e g io n 1
V a c a t io n p o l i c y A l lM a n u f a c t u r in g P u b l ic
u t i l i t i e s 3W h o le s a l e
t r a d eR e t a i lt r a d e F in a n c e 4 S e r v i c e s N o r t h e a s t S o u th N o r th
C e n t r a l W e s t
O f f ic e w o r k e r s — C o n t in u e d
A m o u n t o f v a c a t io n p a y 6— C o n t in u e d
A f t e r 15 y e a r s o f s e r v i c e
U n d e r 2 w e e k s . _ __ __ (5 ) (5 ) (5 ) 1 2 (5 ) 2 (5 ) 2 (5 ) (5 )2 w e e k s ______ _ _ 12 9 3 23 22 8 26 7 24 8 12O v e r 2 a n d u n d e r 3 w e e k s ...____________________ _ (5 ) (5 ) ( 5 ) ( 5 ) (5 ) 1 1 (5 ) 1 (5 ) (5 )3 weeks _ _ _ 78 76 9 2 68 71 85 57 82 66 80 80O v e r 3 a n d u n d e r 4 w e e k s _ ___ _ . 2 2 1 1 1 4 1 3 3 2 14 w e e k s _____________________________________________ 7 11 3 7 4 2 10 7 3 9 5O v e r 4 w e e k s __ _________ ______ _ __ (5 ) (5 ) (5 ) (5 ) - (5 ) 4 (5 ) (5 ) (5 ) 1
A f t e r 20 y e a r s o f s e r v i c e
U n d e r 2 w e e k s _____________________________________ (5 ) (5 ) (5 ) 1 2 (5 ) 2 (5 ) 2 (5 ) (5 )2 w e e k s , , ,, _ „, _ 11 9 3 23 21 7 25 7 23 8 11O v e r 2 a n d u n d e r 3 w e e k s ________________________ (5 ) (5 ) (5 ) (5 ) (5 ) (5 ) (5 ) (5 ) (5 ) (5 ) (5 )3 w e e k s _ _ __ ___ __ __ ___ __ ______ — 58 53 60 4 5 51 71 51 59 51 58 62O v e r 3 a n d u n d e r 4 w e e k s ________________________ 1 2 1 (5 ) (5 ) 1 1 1 2 1 14 w e e k s . . . _ _ __ . ___ __ _ _ 28 33 35 26 26 20 17 31 20 31 23O v e r 4 w e e k s --------------------------------------------------------------- 2 2 1 5 (5 ) 1 5 1 1 2 2
A f t e r 25 y e a r s o f s e r v i c e
U n d e r 2 w e e k s __ _ ___ (5 ) (5 ) (5 ) 1 2 (5 ) 2 (5 ) 2 (5 ) (5 )2 weeks _ . .. 10 9 3 22 20 6 24 7 23 7 11Over 2 and under 3 weeks __ _ (5 ) (5 ) (5 ) (5 ) (5 ) (5 ) (5 ) (5 ) (5 ) (5 ) (5 )3 w e e k s ____________ ____________________________ _ 32 33 23 35 22 36 41 28 32 33 41O v e r 3 a n d u n d e r 4 w e e k s ________________________ 1 2 (5 ) 1 (5 ) 1 1 1 2 1 14 weeks . 52 52 71 35 56 53 27 61 39 54 4 3Over 4 weeks ___ __ _ 4 4 2 5 (5 ) 5 5 3 3 4 4
A f t e r 30 y e a r s o f s e r v i c e
U n d e r 2 w e e k s _ __ __ __ - __ _____ _ (5 ) (5 ) (5 ) 1 2 (5 ) 2 (5 ) 2 (5 ) (5 )2 w e e k s __ ___ _____ _ ____ _ _ _____ 10 9 3 22 20 6 2 4 7 22 7 11O v e r 2 a n d u n d e r 3 w e e k s _______ _____ (5 ) (5 ) (5 ) (5 ) (5 ) (5 ) (5 ) (5 ) (5 ) (5 ) (5 )3 w e e k s . _________ __ ___ __ , — ..... 31 33 23 35 22 32 41 27 31 33 36O v e r 3 a n d u n d e r 4 w e e k s _ 1 2 (5 ) 1 (5 ) 1 1 1 2 1 14 w e e k s _________________... ............ - 53 51 71 36 56 56 27 61 39 54 4 8Over 4 weeks ___ 4 5 2 5 (5 ) 5 5 4 4 5 4
M a x im u m v a c a t io n a v a i l a b l e
U n d e r 2 w e e k s ___ __ — _____ (5 ) (5 ) (5 ) 1 2 (5 ) 2 (5 ) 2 (5 ) (5 )2 w e e k s ... , .. - . - 10 9 3 22 20 6 2 4 7 22 7 11O v e r 2 a n d u n d e r 3 w e e k s _ _____ __ _ __ (5 ) (5 ) (5 ) (5 ) (5 ) ( 5 ) ( 5 ) (5 ) (5 ) (5 ) (5 )3 weeks 31 33 23 35 22 31 41 27 31 33 36O v e r 3 a n d u n d e r 4 w e e k s ______ ___ — __ 1 2 (5 ) 1 (5 ) 1 1 1 2 1 14 w e e k s ___ __ __ _ ________ _ ____ 53 51 71 36 56 57 27 61 39 5 4 4 8
4 5 2 5 1 5 5 4 4 5 4
1 F o r d e f in i t io n o f r e g i o n s , s e e fo o tn o te 3 to th e t a b le in a p p e n d ix A .2 S e e fo o tn o te 2 , t a b l e B - l .3 T r a n s p o r t a t io n , c o m m u n ic a t io n , a n d o t h e r p u b l i c u t i l i t i e s .4 S e e fo o tn o te 5 , t a b l e B - 2 .5 L e s s th a n 0 . 5 p e r c e n t .6 I n c lu d e s p a y m e n t s o t h e r th a n " le n g t h o f t i m e , " s u c h a s p e r c e n t a g e o f a n n u a l e a r n i n g s o r f l a t - s u m p a y m e n t s , c o n v e r t e d to a n e q u iv a le n t t im e b a s i s ; f o r e x a m p le , a p a y m e n t o f 2 p e r c e n t
o f a n n u a l e a r n i n g s w a s c o n s id e r e d a s 1 w e e k 's p a y . P e r i o d s o f s e r v i c e w e r e a r b i t r a r i l y c h o s e n a n d do n o t n e c e s s a r i l y r e f l e c t th e in d iv id u a l p r o v i s io n s f o r p r o g r e s s i o n s . F o r e x a m p le , th e c h a n g e s in p r o p o r t io n s in d i c a t e d a t 10 y e a r s o f s e r v i c e in c lu d e c h a n g e s in p r o v i s io n s o c c u r r in g b e tw e e n 5 a n d 10 y e a r s . E s t i m a t e s a r e c u m u l a t i v e . T h u s , th e p r o p o r t io n r e c e iv in g 3 w e e k s ' p a y o r m o r e a f t e r 5 y e a r s in c lu d e s th o s e w h o r e c e i v e 3 w e e k s ' p a y o r m o r e a f t e r f e w e r y e a r s o f s e r v i c e .
N O T E : I n c lu d e s b a s i c p la n s o n ly . E x c lu d e s p la n s s u c h a s v a c a t io n - s a v in g s a n d th o s e p la n s w h ic h o f f e r " e x t e n d e d " o r " s a b b a t i c a l " b e n e f i t s b e y o n d b a s i c p la n s to w o r k e r s w i th q u a l i f y in g le n g t h s o f s e r v i c e . T y p i c a l o f s u c h e x c lu s io n s a r e p la n s in th e s t e e l , a lu m in u m , a n d c a n in d u s t r i e s . B e c a u s e o f r o u n d in g , s u m s o f in d iv id u a l i t e m s m a y n o t e q u a l t o t a l s .
Digitized for FRASER http://fraser.stlouisfed.org/ Federal Reserve Bank of St. Louis

9 7Table B-5. Health, Insurance, and Pension Plans
(P e r c e n t d is t r ib u t io n o f p la n t and o f f i c e w o r k e r s e m p lo y e d in e s ta b l is h m e n ts w ith fo r m a l p r o v is i o n s , 1 b y ty p e o f p la n and ty p e o f fin a n c in gin a l l m e t r o p o l i t a n a r e a s , b y in d u s tr y d iv is io n and r e g io n , 2 1964—65 3 )
I n d u s t r y d iv i s io n a n d r e g io n
I n s u r a n c e p la n s S i c k n e s s a n d a c c id e n t in s u r a n c e a n d / o r s i c k l e a v e R e t i r e m e n t
p e n s io np la n No h e a l t h ,
i n s u r a n c e , o r p e n s io n
p la n
L if e
A c c id e n t a l d e a t h a n d d i s m e m b e r m e n t
H o s p i t a l i z a t io n S u r g i c a l M e d ic a l C a t a s t r o p h e
T o t a l 4
S i c k n e s s a n d a c c id e n t
in s u r a n c e S ic k l e a v e ( f u l l p a y a n d
S ic k l e a v e ( p a r t i a l p a y
o r w a i t in g p e r io d )A l l
p la n s
N o n -c o n t r ib
u t o r yp la n s
A l lp la n s
N o n -c o n t r ib -
u t o r yp la n s
A l lp la n s
N o n -c o n t r ib
u t o r yp la n s
A l lp la n s
N o n c o n t r ib
u t o r yp la n s
A l lp la n s
N o n -c o n t r ib
u t o r yp la n s
A l lp la n s
N o n c o n t r ib
u t o r yp la n s
A l lp la n s
N o n -c o n t r ib
u t o r yp la n s
no w a i t in g p e r io d ) A l l
p la n s
N o n -c o n t r ib
u t o r yp la n s
P l a n t w o r k e r s
A l l i n d u s t r i e s a n d r e g i o n s 5 _____ 9 2 62 59 37 9 2 61 91 60 71 47 35 19 80 63 4 3 16 12 71 59 3
I n d u s t r y d iv i s io n :M a n u f a c t u r in g ______________________ 95 66 62 41 9 6 68 95 67 75 52 31 16 85 76 5 3 10 7 77 67 2T r a n s p o r t a t io n , c o m m u n ic a t io n ,
a n d o th e r p u b l i c u t i l i t i e s ________ 97 69 58 22 95 50 9 4 50 84 4 2 71 54 75 34 22 28 28 75 61 1W h o le s a l e t r a d e ___ _____ 91 55 65 39 9 2 56 89 53 71 41 45 22 78 51 33 33 13 69 53 2R e t a i l t r a d e _________________________ 84 4 8 49 28 8 3 4 4 81 4 3 58 33 34 11 75 4 4 26 22 20 60 4 3 4S e r v i c e s . ______ _ _ _ _______ 76 60 52 4 0 7 8 58 76 57 61 47 20 10 56 4 4 36 18 6 36 28 14
R e g io n :N o r t h e a s t . . . . _____ . . . 9 3 70 55 38 9 2 69 91 68 70 51 27 17 81 68 52 16 8 75 65 2S o u th _ __ _ ______ ___________ 87 4 4 4 8 22 86 4 0 85 39 55 24 4 0 17 68 49 26 17 13 58 4 3 7N o r th C e n t r a l — __ _ _ 9 4 64 6 3 41 9 4 6 4 9 4 6 3 76 52 32 15 9 0 78 53 9 11 75 66 2W e s t ----------------------------------------------------- 91 65 7 2 49 95 66 95 66 89 63 55 34 72 36 24 29 22 71 56 2
.O ffic e w o r k e r s
A l l i n d u s t r i e s a n d r e g io n s — ___ 9 6 55 58 29 9 2 4 6 91 45 78 38 69 30 79 4 0 23 55 9 80 58 1
I n d u s t r y d iv i s io n :M a n u f a c t u r in g ______________________ 97 59 66 38 96 60 95 60 82 52 61 29 86 61 37 60 6 85 66 1T r a n s p o r t a t io n , c o m m u n ic a t io n ,
a n d o t h e r p u b l i c u t i l i t i e s ________ 9 8 67 57 15 95 41 9 4 41 87 36 8 3 61 80 25 12 54 21 74 59 (6 )W h o le s a l e t r a d e ___________________ 9 4 49 6 2 30 9 0 4 4 88 4 2 75 34 60 24 78 4 2 23 53 6 72 4 4 2R e t a i l t r a d e _____________ _________ 89 35 49 19 86 29 84 27 55 21 51 8 84 38 16 32 28 67 35 2F in a n c e , i n s u r a n c e , a n d
r e a l e s t a t e ________________________ 9 8 54 51 25 9 0 38 89 36 78 28 82 29 69 23 11 57 3 88 62 (6 )S e r v i c e s __________ ________________ 85 45 50 23 79 37 78 36 65 27 58 21 68 31 19 49 6 61 39 4
R e g io n :N o r t h e a s t ___________________________ 9 6 61 53 30 89 51 87 49 74 39 64 32 79 4 3 27 59 6 84 62 1S o u th ------------------------------ ------- --------- 9 5 4 5 54 21 91 35 9 0 35 70 27 70 29 71 33 14 47 11 76 52 1N cJrth C e n t r a l ------------------------------------ 9 6 56 59 31 9 3 4 8 9 2 4 7 81 4 2 65 26 81 49 28 51 11 80 58 1
9 6 50 71 31 96 4 4 96 4 4 89 4 0 81 37 81 27 13 66 9 80 57 ( 6 )
1 " A l l p l a n s " in c lu d e th o s e p la n s f o r w h ic h a t l e a s t a p a r t o f th e c o s t i s b o r n e b y th e e m p lo y e r . " N o n c o n t r ib u to r y p la n s " in c lu d e o n ly t h o s e p la n s f in a n c e d e n t i r e l y b y th e e m p lo y e r . E x c lu d e d a r e l e g a l l y r e q u i r e d p l a n s , s u c h a s w o r k m e n 's c o m p e n s a t io n , s o c i a l s e c u r i t y , r a i l r o a d r e t i r e m e n t , a n d c o m p u ls o r y t e m p o r a r y d i s a b i l i t y in s u r a n c e r e q u i r e d in N ew Y o r k a n d N ew J e r s e y .
2 F o r d e f in i t io n o f r e g i o n s , s e e fo o tn o te 3 to th e t a b le in a p p e n d ix A .3 S e e fo o tn o te 2 , t a b le B - l .4 U n d u p lic a t e d t o t a l o f w o r k e r s - r e c e i v i n g s i c k l e a v e o r s i c k n e s s a n d a c c i d e n t i n s u r a n c e sh o w n s e p a r a t e l y . S ic k l e a v e p la n s a r e l im i t e d to th o s e w h ic h d e f i n i t e l y e s t a b l i s h a t l e a s t th e
m in im u m n u m b e r o f d a y s ' p a y th a t c a n b e e x p e c t e d b y e a c h e m p lo y e e . I n f o r m a l s i c k l e a v e a l lo w a n c e s d e t e r m in e d on a n in d iv id u a l b a s i s a r e e x c lu d e d .5 I n c lu d e s d a t a f o r r e a l e s t a t e in a d d i t io n to th o s e in d u s t r y d iv i s io n s sh o w n s e p a r a t e l y .6 L e s s th a n 0 .5 p e r c e n t .
Digitized for FRASER http://fraser.stlouisfed.org/ Federal Reserve Bank of St. Louis

9 8
Table B-6. Paid Sick Leave
(P e r c e n t d is t r ib u t io n o f p la n t and o f f i c e w o r k e r s b y fo r m a l s i c k le a v e p r o v is i o n s in a l l m e t r o p o li t a n a r e a s , b y in d u s tr y d iv is io n and r e g i o n , 1 1964—6 5 2 )
I n d u s t r y d iv i s io n R e g io n 1
S ic k l e a v e p r o v i s io n A l lM a n u f a c tu r in g P u b l ic
u t i l i t i e s 3W h o le s a l e
t r a d eR e t a i lt r a d e F i n a n c e 4 S e r v i c e s N o r t h e a s t S o u th N o r th
C e n t r a l W e s t
P l a n t w o r k e r s
A l l w o r k e r s ________ _ __ _ __ __ _ _ 1 0 0 . 0 1 0 0 .0 1 0 0 . 0 1 0 0 .0 1 0 0 . 0 1 0 0 . 0 1 00 . 0 1 0 0 . 0 1 00 . 0 1 00 . 0
W o r k e r s in e s t a b l i s h m e n t s p r o v id in gf o r m a l p a id s i c k l e a v e . . __ _ _ _ . 2 7 . 1 17 . 3 5 5 . 3 4 6 . 7 4 2 . 5 2 0 . 1 2 3 . 7 2 9 .9 19 . 0 4 9 . 8
W o r k e r s in e s t a b l i s h m e n t s p r o v id in gno f o r m a l p a id s i c k l e a v e ___________ _______ __ 7 2 .9 8 2 .7 4 4 . 7 5 3 . 3 5 7 . 5 7 9 .9 7 6 . 3 7 0 . 1 8 1 . 0 5 0 . 2
T y p e a n d a m o u n t o f p a id s i c k l e a v e p r o v id e d a n n u a l l y
U n if o r m p l a n :5No w a i t in g p e r i o d __ ______ __ ____ __ 11 . 3 8 . 4 1 4 . 8 2 6 .4 1 4 . 7 12 . 3 1 0 . 6 1 2 .9 5 . 7 2 3 .9
F u l l p a y 6 ____________________________________ 10. 5 8 . 0 1 4 . 0 2 5 . 1 1 2 .9 11 . 3 10 . 1 11 . 7 5 . 1 2 2 . 73 d a y s ____________________________________ . 5 . 6 . 1 . 2 . 8 . 5 . 7 . 7 . 3 . 45 d a y s ____________________________________ 4 . 2 4 . 6 2 . 3 8 .9 2 .9 3. 7 4 . 1 3. 8 1. 7 11 . 46 d a y s _ . . . . __ __ . . . 2 . 3 1. 1 1. 8 4 . 6 5 . 5 2 . 6 1. 6 2. 3 1. 2 6 . 27 d a y s __ __ __ _ __ __ ______ _ . 2 . 1 . 3 1. 1 . 4 . 7 . 4 . 3 . 2 . 110 d a y s ___________________________________ 1. 1 . 4 2 .9 3. 1 1. 6 1. 7 1. 1 1. 2 . 5 1 .912 d a y s __ __ _ — _ . 7 . 1 4 . 7 1. 0 . 5 . 8 . 6 1. 2 . 4 1. 015 d a y s ___ __ ___ _ . 2 ( 7 ) . 9 . 7 . 1 . 2 . 1 . 1 ( 7 ) . 6130 d a y s ______ . ______ _ _ _ . 2 . 2 - 2 . 1 - . 2 . 1 . 4 . 2 . 2
F u l l p a y p lu s p a r t i a l p a y _ _____ . . . . . 2 . 1 . 7 . 8 . 1 . 1 . 2 . 2 . 2 . 3P a r t i a l p a y o n l y ____________________________ . 6 . 3 . 1 . 5 1. 7 . 9 . 3 . 9 . 5 . 9
W a it in g p e r i o d . _ ___ _ ___ __ 4 . 1 2 .9 3 . 6 7 .9 8 . 0 3. 0 2 . 3 4 . 2 2 . 1 13 . 3F u l l p a y . _ _ . . . . . . . ----- --------- 2 . 5 1. 3 2 . 7 6 . 2 5 . 6 2 . 4 1. 2 2 . 1 . 7 10 . 4F u l l p a y p lu s p a r t i a l p a y ___________________ . 3 . 4 . 1 . 8 . 1 . 5 . 2 . 1 . 1 1. 8P a r t i a l p a y o n l y ____________________________ 1. 3 1. 2 . 8 . 8 2 . 3 . 1 . 9 1 .9 1. 3 1. 1
G r a d u a te d p l a n 5— A f t e r 1 y e a r o f s e r v i c e :No w a i t in g p e r i o d ________ ---- ---------
F u l l p a y 6 _ _ ___ __ __ _ .4 . 7 2 . 1 12 . 2 8 . 0 9 .7 3. 4 5 . 1 5 . 0 3 . 5 6 . 72 .4 1. 2 6 . 3 3 .9 4 . 2 2 . 2 2 . 6 2 . 5 2 . 1 2 .9
1 d a y __ __ ___ _ _ _ _ _ _ . 4 . 4 ( 7 ) . 1 . 6 ( 7 ) . 4 . 2 . 5 . 45 d a y s ____ ___________ _______________ _ . 8 . 1 1. 5 1. 7 2 .4 1. 4 . 7 1. 1 . 7 . 910 d a y s . ___ _____ . 4 . 3 1. 3 1. 0 . 4 . 1 . 6 . 3 . 3 . 42 2 d a y s _________________ __________________ . 1 ( 7 ) 1. 1 . 1 - . 2 . 4 ( 7 ) ( 7 ) -
F u l l p a y p lu s p a r t i a l p a y 6 _________________ 1. 7 . 7 3 . 0 3. 7 4 . 6 . 7 2 . 2 2 . 1 . 9 1 .95 d a y s _______________________ _____________ . 3 . 1 . 9 . 3 . 5 . 1 . 4 . 3 . 1 . 310 d a y s . _ _______ __ _ _____ . 6 . 2 . 7 1. 0 2 . 2 . 2 1. 1 . 7 . 1 . 820 d a y 8____________________ ______________ . 3 . 3 . 3 1. 8 ( 7 ) - . 4 . 6 . 1 . 222 d a y s . ____ __ _ _ ________ . 3 - . 2 ( 7 ) 1. 8 . 1 . 1 . 4 . 4 . 7
P a r t i a l p a y o n ly ____ __ ___ . 6 . 2 2 .9 . 4 . 8 . 6 . 3 . 4 . 5 1 .9W a it in g p e r io d __ _ _ ________ _ _ 5 . 7 3 .7 1 5 . 5 4 . 0 9 . 8 . 3 3. 7 7 . 5 6 .4 5 . 7
F u l l p a y - __________ ____ __________ ______ 1. 5 . 2 1. 6 . 7 6 . 6 . 1 . 6 2 . 1 2 . 0 1. 1F u l l p a y p lu s p a r t i a l p a y _ __ ______ 1. 0 . 8 2 . 6 . 3 1. 5 - . 7 1. 3 1. 0 1. 2P a r t i a l p a y o n l y _____ _ „ _ ____ __ _ 3. 2 2 . 7 1 1 . 3 3 . 0 1. 7 . 2 2 . 4 4 . 1 3 .4 3 .4
G r a d u a te d p l a n 5— A f t e r 10 y e a r s o f s e r v i c e :No w a i t in g p e r i o d __________________________ ____ 8 . 0 3. 1 2 7 .4 8 . 2 15 . 7 4 . 6 7 .9 8 . 8 7 . 4 8 . 6
F u l l p a y 6 _ __ ____ ______ — __ 2 . 8 1 .4 6 . 7 4 . 0 5 . 1 3 . 6 2 . 8 2 . 7 2 . 7 3. 05 d a y s ___ _____ __ _ __ _ . 4 . 5 - . 2 . 1 . 9 . 3 - . 6 . 87 d a y s ____ ___ — _ __ --------- _ . 2 . 1 . 6 - . 4 ( 7 ) . 2 . 3 . 1 (7 )10 d a y s . ____________________________ . ____ . 6 . 1 . 6 1. 2 2 . 0 1. 1 . 5 . 7 . 6 . 720 d a y s ---------------- ----- ----- -------- ------ . 2 . 1 . 3 . 3 . 2 . 4 . 2 . 2 . 1 . 4
d a y s . ... ...... . . 1 ( 7 ) 1. 0 ( 7 ) ( 7 ) . 2 . 3 ( 7 ) . 2 -F u l l p a y p lu s p a r t i a l p a y 6 _________________ 4 . 5 . 8 2 0 .4 4 . 0 9 . 8 1. 0 4 . 9 5 . 8 2 .9 5 . 0
35 d a y s _ _____ __ _______ __ . 4 - ( 7 ) - 2 . 1 - . 8 . 4 . 1 -50 d a y s _____ . . . . . __ __ _ _ 1. 0 . 1 . 7 ( 7 ) 5 . 0 ( 7 ) . 7 1. 3 1. 0 1. 06 0 d a y s __________ ______________________ . 3 . 2 . 2 1 .9 ( 7 ) . . 3 . 3 . 6 . 2 . 265 d a y s —r_.___._ .TT_____ _̂_________________ 1. 5 . 1 1 1 .4 . 2 1. 8 . 3 2 . 1 1. 0 . 8 2 .970 d a y s . ____, ___________________________ . 5 - 5 . 3 - - - . 1 1. 7 . 3 . 3
P a r t i a l p a y o n ly __ _____ __ _ __ _______ . 8 1. 0 . 3 . 2 . 9 . 2 . 3 1. 7 . 6
S ee fo o t n o t e s a t end o f ta b le .
Digitized for FRASER http://fraser.stlouisfed.org/ Federal Reserve Bank of St. Louis

9 9
Table B-6. Paid Sick Leave— Continued
(P e r c e n t d is t r ib u t io n o f p la n t and o f f i c e w o r k e r s b y f o r m a l s i c k le a v e p r o v is i o n s in a l l m e t r o p o li t a n a r e a s , b y in d u s tr y d iv is io n and r e g i o n , 1 1964—65 2
S ic k l e a v e p r o v i s io n A l l
I n d u s t r y d iv i s io n R e g io n 1
M a n u f a c t u r in g P u b l ic u t i l i t i e s 3
W h o le s a l et r a d e
R e t a i lt r a d e F in a n c e 4 S e r v i c e s N o r t h e a s t S o u th N o r th
C e n t r a l W e s t
P la n t w o r k e r s — C o n t in u e d
T y p e a n d a m o u n t o f p a id s i c k l e a v ep r o v id e d a n n u a l l y — C o n t in u e d
G r a d u a te d p l a n 5— A f t e r 10 y e a r s o f s e r v i c e —C o n t in u e d
W a it in g p e r i o d . ___________________________ __ 3. 6 2 . 8 9 . 6 4 . 2 4 . 0 0 . 2 2 .9 4 . 1 3 . 7 3 .9F u l l p a y . . . _______ ____ ________ _ . 4 . 3 1. 3 . 8 . 5 . 1 . 3 . 7 . 5 . 3F u l l p a y p lu s p a r t i a l p a y . . _________________ 2 . 4 1. 8 8 . 3 3. 1 2 . 1 . 1 2 . 4 2 . 3 2 . 6 2 . 5P a r t i a l p a y o n l y ____________________________ . 7 . 7 " . 3 1 .4 " . 3 1. 1 . 7 i . 1
P r o v i s io n s f o r a c c u m u la t io n
W o r k e r s in e s t a b l i s h m e n t s h a v in g p r o v i s io n sfo r a c c u m u la t io n o f u n u s e d s i c k l e a v e ________ 5 .9 3 .9 15 . 3 11 . 8 6 . 4 3. 8 2 . 5 6 . 8 3 . 3 1 8 . 5
O ff ic e w o r k e r s
A l l w o r k e r s ______ __ ___ ______ __ __ _ 1 00 . 0 1 00 . 0 1 00 . 0 1 0 0 . 0 1 00 . 0 1 0 0 . 0 1 00 . 0 1 0 0 . 0 1 00 . 0 1 00 . 0 1 0 0 . 0
W o r k e r s in e s t a b l i s h m e n t s p r o v id in gf o r m a l p a id s i c k l e a v e __________________________ 6 3 . 3 6 5 . 8 7 4 . 0 5 8 .9 6 0 . 5 5 9 .6 5 1 . 8 6 3 . 8 5 8 . 0 6 1 . 3 7 1 . 5
W o r k e r s in e s t a b l i s h m e n t s p r o v id in gno f o r m a l p a id s i c k l e a v e __________ ._ _______ 3 6 . 7 3 4 . 2 2 6 . 0 4 1 . 1 3 9 . 5 4 0 . 4 4 8 . 2 3 6 . 2 4 2 . 0 3 8 . 7 2 8 . 5
T y p e a n d a m o u n t o f p a id s i c k l e a v ep r o v id e d a n n u a l l y
U n if o r m p la n : 5No w a i t in g p e r io d __ _____ _ ________ _ 2 9 .4 3 3 . 3 2 2 . 2 3 3 . 3 1 9 .5 2 7 . 8 3 6 . 1 2 7 . 7 2 5 .4 2 6 . 5 4 3 . 1
F u l l p a y 6 ____________________________________ 2 7 .9 3 1 . 1 2 1 . 1 3 1 . 5 18 . 0 2 6 .9 3 5 . 2 2 6 . 6 2 4 . 5 2 3 . 8 4 2 . 15 d a y s _______________________________ ___ 7 . 1 1 0 .4 4 . 7 10 . 0 4 . 9 3. 1 8 .9 6 .6 5 . 5 5 . 0 13 . 86 d a y s . . . . 3 . 6 3. 1 2 .4 4 . 6 6 .5 3 .4 4 . 3 2 . 8 3 .6 3. 6 5 . 17 days . . . . . . . . . 1. 0 . 7 . 6 2. 2 1. 2 1. 2 1 . 5 1. 5 . 8 . 7 . 910 d a y s _______________________ ___________ 6 . 8 9 . 3 5 . 5 6 .6 2 . 2 5 . 1 8 .9 7 . 4 6 . 0 5 . 7 8 . 712 d a y s ______________________________ 3 .4 1. 6 5 . 1 1. 2 . 7 5 . 8 7 . 1 2 .9 3. 8 3 . 3 4 . 515 days ......... . _ 1. 1 . 3 1. 5 . 7 . 4 2 . 1 1. 3 1. 2 . 7 . 9 1. 320 d a y s _______ __ _ ______ __ __ . 7 1. 1 ( 7 ) 1. 6 . 2 . 3 . 1 . 8 . 4 . 8 . 522 d a y s ________ _______________________ . 5 . 1 ( 7 ) . 2 . 1 1. 5 ( 7 ) . 2 . 4 ( 7 ) 2 . 1130 d a y s _________________________________ . 4 . 5 - 1 .4 - . 3 . 2 . 6 . 4 . 3 . 2
F u l l p a y p lu s p a r t i a l p a y 6 _________________ 1. 2 2 . 0 1. 0 1 .4 (7) . 7 . 5 1. 0 . 7 2 . 2 . 621 d a y s _ __ ______ __ _ ___ . 5 1. 3 - . 3 - - . 2 . 1 . 1 1 .4 . 1
P a r t i a l p a y o n l y ____________________________ . 3 . 2 . 2 . 4 1. 5 . 2 . 3 . 1 . 2 . 5 . 4W a it in g p e r i o d _______________________________ 1. 6 1. 2 1. 6 3 . 2 4 . 5 . 1 4 . 2 . 4 2 . 7 1. 2 3 .6
F u l l p a y _____________ ______ ___ _______ 1. 1 . 7 1 .4 1 .9 2 . 1 . 1 4 . 1 . 2 1. 3 . 7 3. 2F u l l p a y p lu s p a r t i a l p a y _____ __ __ . . _ . 1 (7) - . 4 . 2 - (7) (7) . 1 . 1 . 1P a r t i a l p a y o n l y ___________________________ _ . 5 . 5 . 2 . 9 2 . 3 - . 1 . 2 1 .4 . 4 . 3
G r a d u a te d p l a n 5— A f t e r 1 y e a r o f s e r v i c e :No w a i t in g p e r i o d __ ________________ _______ 2 5 . 3 2 6 . 8 2 6 .9 2 0 . 1 14 . 8 3 0 . 6 1 0 .4 3 0 .4 2 1 . 3 2 4 . 3 2 0 . 7
F u l l pay®_____________________________________ 17 . 1 2 1 . 8 14 . 8 9 .5 6 .9 18 . 7 9 . 0 2 0 . 0 13 . 5 1 8 . 6 12 . 15 d a y s _______ ___ 3 .4 2 .9 7 . 3 2 . 5 3 . 5 2 .9 1. 5 3 . 8 3 .4 3 . 6 1 .96 d a y s __ . 7 . 5 . 4 ( 7 ) . 4 1. 4 . 2 . 3 . 5 1. 0 1. 110 d a y s _____________________________ ______ 5 . 8 9 . 4 2 . 2 2 . 2 . 9 6 . 0 1 .4 7 . 3 3 .0 6 .6 4 . 312 days. _ _ _ _ _ _ . 8 . 2 . 7 . 1 . 1 1. 6 1. 7 . 8 1. 1 . 6 . 415 d a y s ____________ ____ ____ _ 1. 2 1. 2 . 5 . 3 ( 7 ) 2 . 1 1. 7 1. 6 . 6 1. 6 . 52 0 d a y s _.. ___ ___ ____ ______ _____,___v . 6 . 6 . 4 . 3 . 3 1. 1 . 1 . 8 . 7 . 7 (7 )
. 5 . 7 1. 2 . 6 . 2 . 2 . 8 . 3 . 5 . 3
S ee fo o t n o t e s at end o f t a b le .
Digitized for FRASER http://fraser.stlouisfed.org/ Federal Reserve Bank of St. Louis

10 0
Table B-6. Paid Sick Leave-----Continued
(P e r c e n t d is t r ib u t io n o f p la n t and o f f i c e w o r k e r s b y f o r m a l s i c k le a v e p r o v is i o n s in a l l m e t r o p o li t a n a r e a s , b y in d u s tr y d iv is io n and r e g i o n ,1 1 9 6 4 - 6 5 2 )
Industry division Reg ion 1 2Sick leave provision A ll
Manufacturing Public utilities 3
Wholesaletrade
Retailtrade F inane e 4 Services Northeast South North
Central West
O ffice workers— Continued
Type and amount of paid sick leave provided annually— Continued
Graduated plan5— After 1 year of service— Continued
No waiting period— ContinuedFull pay plus partial pay 6_______________ 6. 8 4. 8 6.9 9. 7 7. 1 9.7 1.4 8. 3 7. 1 5. 2 6. 3
5 days___________________ _____ _______ 1. 5 .9 2. 3 . 8 . 8 2. 6 . 3 1. 7 .9 1. 2 2. 210 days ______________ ____________.___ 2. 2 1. 3 1. 3 3. 7 2. 0 3.9 . 5 2. 2 3.4 1. 3 2. 815 days__ _ ___ ________ __ __ _ . 5 . 4 . 8 . 3 - . 6 . 3 . 5 . 6 . 5 . 220 days ____________ ___ ____ ___ _ .9 .9 .4 3. 0 . 2 1. 0 - 1. 5 1. 4 . 5 . 122 days __ ___________ _ __ _ . 6 . 2 . 3 . 3 3.9 . 6 . 2 . 8 . 5 .6 . 6
Partial pay only ________ _ __ _______ 1. 4 . 1 5. 2 .9 .9 2. 1 (7) 2. 1 . 7 . 6 2.4Waiting period ____ _______ __ __ ____ 6. 0 4. 1 18. 3 2. 1 20. 8 .9 1. 0 4. 2 8. 0 7.9 4. 0
Full pay.,-- , _______ ________ ______ ______- 2. 5 1.9 3. 3 . 4 14. 7 .4 .6 2. 0 2. 8 3. 7 1. 1Full pay plus partial pay __ _______ _ 1. 1 . 3 3. 8 .4 4. 0 . 4 (7) .6 . 4 2.4 . 4Partial pay on ly____________________ ____ _ 2.4 1. 8 11. 3 1. 3 2. 1 - . 5 1. 7 4. 8 1. 7 2. 5
Graduated plan5— After 10 years o f service:No waiting period __ ______________ __ -------- 28. 7 27. 6 41. 2 20. 2 29. 3 31. 0 10. 5 32.9 27. 5 27. 8 22.9
Full pay 6_________________________________ 17. 1 22. 0 14. 6 9. 0 8. 0 18. 5 9. 0 20. 6 13. 8 18. 0 11. 85 days _ ______ _______ _____ ____ . 7 . 3 - . 7 . 1 1. 8 (7) 1.4 . 2 . 1 . 610 days „_____________________________ 1. 8 1. 3 4. 5 1. 3 2.9 1. 3 1. 2 1. 6 1.9 2. 3 1. 312 days__ _ ____ ___________ __ _ .4 . 1 . 8 - . 2 1. 0 - . 1 . 7 . 1 1. 315 days. __ _ ______________ ____ .9 .9 .9 . 4 .9 1. 1 . 4 .9 1. 0 .9 . 820 days.. ____ ___ ____ __________ 2. 7 5. 3 . 4 1. 0 . 8 1. 7 1. 4 2. 2 1. 0 5. 0 1. 722 days __ ___ ___________ . . 5 1. 0 - . 1 - . 4 (7) .4 . 2 1. 0 . 130 days___ ___________ __________ ... - __ _ . 6 . 8 . 2 . 4 . 6 . 8 . 4 .6 . 4 . 7 . 740 days __ __ __ _ _ . 5 . 7 . 1 . 7 . 3 . 4 . 7 1. 2 . 3 . 1 (7)
. 150 days _ _ 1. 2 1. 2 . 7 . 6 . 5 1.9 .4 2. 0 . 5 1. 155 days ___ ___ __ __ _____ ___ . 6 . 6 . 6 (7) (7) . 8 1. 0 1. 5 . 2 . 1 . 160 days __ __ . 5 . 7 . 8 (7) . 4 . 3 . 7 . 2 . 4 . 665 days_,_____ ,,___________ ___________ . 7 1. 2 .9 . 8 . 2 . 2 . 2 1. 1 . 4 . 7 . 2130 days ------ ---- . 6 . 6 1. 6 . 5 . 2 . 5 _ . 7 1. 1 . 5 . 1
Full pay plus partial pay6. _____________ 11. 4 5.4 26. 0 11. 1 20. 5 12. 5 1. 5 12. 2 13. 5 9. 5 10. 95 days________________________________ .6 . 1 . 2 - (7) 2. 0 . 1 . 8 .6 . 3 1. 020 days - — ______„_.__ .... . 7 . 1 . 1 . 2 - 2. 3 . 1 .9 1. 2 . 2 . 650 days _____ _ ___ _______ ___ 1. 7 . 7 . 6 . 2 13. 2 1. 2 . 1 1. 5 2. 3 1. 8 1. 760 days. ___ _ — __ _ _____ __ __ . 9 . 8 . 8 3. 2 . 1 . 7 . 3 . 7 1. 0 . 8 1. o65 days____ ________________ _________ 2. 5 .9 12. 5 1. 8 2.9 .9 . 1 2. 7 1.9 2. 0 3.97 0 days __________________________ .9 (7) 7. 3 . 1 - - - . 5 2. 8 . 5 . 5130 days . 7 .6 . 1 2. 0 (7) 1. 0 . 1 . 8 . 6 . 5 . 7
Partial pay on ly______ ______ __ __ . 2 . 1 . 6 . 1 .9 . 1 - . 1 . 2 . 3 . 2Waiting period __ ____ ___ _ _ __ _ 3. 5 3. 7 9.0 2 . 2 7. 1 . 6 1. o 2. 7 2. 4 5. 8 1.9
Full pay_ __ _ __ __ ___ __ __ _ .9 1. 7 . 3 . 5 .9 . 1 .6 . 2 . 7 2. 1 . 2Full pay plus partial pay__ ________ ___ 2.4 1. 8 8. 8 1.4 4 . 4 . 4 . 5 2. 5 1. 2 3.4 1. 7Partial pay only __ ___ __ _______ _ _ . 2 . 2 (7) . 3 1. 8 - - (7) . 6 . 4 . 1
Provisions for accumulation Workers in establishments having provisions
for accumulation of unused sick leave________ 13. 0 9. 3 17.5 8.4 5. 2 18. 5 18. 0 8. 2 12.9 11.4 26. 4
1 F o r d e f in i t io n o f r e g i o n s , s e e fo o tn o te 3 to th e t a b le in a p p e n d ix A .2 S e e fo o tn o te 2 , t a b l e B - l .3 T r a n s p o r t a t io n , c o m m u n ic a t io n , a n d o t h e r p u b l i c u t i l i t i e s .4 S e e fo o tn o te 5 , t a b le B - 2 .5 " U n ifo r m p la n s " a r e d e f in e d a s t h o s e f o r m a l p la n s u n d e r w h ic h a n e m p lo y e e , a f t e r 1 y e a r o f s e r v i c e , i s e n t i t l e d to th e s a m e n u m b e r o f d a y s ' p a id s i c k l e a v e e a c h y e a r . " G r a d u a te d p la n s "
a r e d e f in e d a s t h o s e f o r m a l p la n s u n d e r w h ic h a n e m p lo y e e 's l e a v e v a r i e s a c c o r d in g to le n g t h o f s e r v i c e . P e r i o d s o f s e r v i c e w e r e a r b i t r a r i l y c h o s e n . E s t i m a t e s r e f l e c t p r o v i s io n s a p p l i c a b le a t th e s t a t e d le n g t h o f s e r v i c e b u t do n o t r e f l e c t p r o v i s io n s f o r p r o g r e s s i o n . T h u s , th e p r o p o r t io n r e c e iv in g 10 d a y s ' s i c k l e a v e a f t e r 10 y e a r s o f s e r v i c e m a y a l s o r e c e i v e t h i s a m o u n t a f t e r g r e a t e r o r l e s s e r le n g t h s o f s e r v i c e .
6 I n c lu d e s p r o v i s io n s o t h e r th a n t h o s e p r e s e n t e d s e p a r a t e l y . N u m b e r s o f d a y s sh o w n u n d e r " F u l l p a y p lu s p a r t i a l p a y " a r e d a y s f o r w h ic h w o r k e r s r e c e i v e s i c k l e a v e a t f u l l p a y ; w o r k e r s ' a r e e n t i t l e d to a d d i t io n a l d a y s o f s i c k l e a v e a t p a r t i a l p a y .
7 L e s s th a n 0 . 05 p e r c e n t .
N O T E : B e c a u s e o f r o u n d in g , s u m s o f in d iv id u a l i t e m s m a y n o t e q u a l t o t a l s .
Digitized for FRASER http://fraser.stlouisfed.org/ Federal Reserve Bank of St. Louis

Labor-Management Agreement Coverage
Only 15 percent of the 3.4 million office workers within scope of the survey were in establishments with labor-management agreement coverage, whereas 69 percent of the 11.3 million plant workers were in establishments with comparable coverage. These estimates of agreement coverage are representative only of medium and large establishments in the industries within scope of the survey in m etropolitan areas. 37 The following table presents estimates of agreement coverage for plant and office workers, for all metropolitan areas combined, and by industry division and region:
Percentage of .plant and office workers employed in establishments in which a contract or contracts covered a majority of workers
______________ in the respective categories, 1964-65
Region
All Manu- Nonmanu-indus- fac- fa c- Public Wholesale Retailtries turing turing utilities trade trade Finance Services
Plant workers
All metropolitanareas------------------------ 69 77 57 94 57 36 54
Northeast--------------- 74 79 66 97 66 45 66South-------------------- 47 60 33 84 24 13 21North Central-------- 79 86 63 98 68 39 67West---------------------- 71 74 69 97 72 55 61
Office workers
A ll m etropolitanareas------------------------ 15 12 17 62 7 14 2 12
Northeast--------------- 16 15 17 67 6 18 2 16South-------------------- 14 16 14 57 (2 ) 3 C2) 2North Central-------- 14 8 19 68 8 14 3 2West---------------------- 18 13 20 55 17 25 2 25
1 For definition of regions,2 Less than 0. 5 percent.
see footnote 3 to the table in appendix A.
Establishments with 50 workers or more were included in these studies, except in 12 of the largest areas in which the minimum was 100 in manufacturing, public utilities, and retail trade, and 50 in the other industry divisions.
If a majority of plant or office workers within an establishment were covered by a labor-management agreement, all plant or office workers in that establishment were considered to be covered. Thus, these data do not provide a measure of union membership, but rather a statistical measure of union coverage.
The transportation, communication, and other public utilities division was the most extensively unionized. Ninety-four percent of the plant workers and 62 percent of the office workers were in establishments in which a majority were covered by one or more agreements. Coverage in public utilities was so much higher than in other nonmanufacturing industries that removing the utilities data from nonmanufacturing totals would reduce the extent of unionization of office workers in nonmanufacturing from 17 to 6 percent, and that of plant workers from 57 to 44 percent. Manufacturing industries had the next highest incidence of coverage for plant workers with 77 percent, while the retail trade group had the lowest with 36 percent. However, retail trade's office workers, with 14 percent coverage, exceeded all other industry divisions except public utilities in union contract coverage. The smallest percentage of unionized office workers was found in finance (2 percent).
In all geographical regions except the South, at least 7 out of 10 plant workers were in establishments operating under terms of collective bargaining agreements. Approximately half of the plant workers in the southern region were covered. Among office workers, those in the western region had the highest proportion under union coverage— 18 percent, and those in the South and North Central the lowest— 14 percent.
A more detailed analysis of labor-management agreement coverage was included in Wages and Related Benefits: MetropolitanAreas, United States and Regional Summaries, 1960—61 (BLS Bulletin 1285 -84, 1962). Agreement coverage by size of establishment andcommunity were included in the examination.
101
Digitized for FRASER http://fraser.stlouisfed.org/ Federal Reserve Bank of St. Louis

Digitized for FRASER http://fraser.stlouisfed.org/ Federal Reserve Bank of St. Louis

Appendix A. Scope and Method o f Survey
Data in this report relate to all 212 Standard Metropolitan Statistical Areas in the United States as established by the Bureau of the Budget through 1961. Data were collected in only 80 of the 212 areas, but these were selected as a sample designed to represent all 212 areas.
Occupational pay data are collected annually in each of the 80 areas, but establishment practices and supplementary wage provisions are collected annually only in Boston, Chicago, Los A ngeles- Long Beach, New York, Philadelphia, and San Francisco—Oakland; in the other 74 areas, these data are collected biennially. Tables B - l through B -6 include data from the previous year in the areas in which the supplementary data were not collected between July 1964 and June 1965. Current information was available for about two-thirds of the employment within scope of the survey. 38 *
Industry and Establishment Coverage
Area survey data were obtained from .representative establishments within six broad industry divisions: (1) Manufacturing;(2) transportation, communication, and other public utilities; (3) wholesale trade; (4) retail trade; (5) finance, insurance, and real estate; and (6) selected services. Excluded from the scope of the studies were the construction and extractive industries and government institutions. The latter exclusion has a significant effect on the public utilities industry division. Municipally operated utilities were excluded, but utilities were included in areas where they are privately operated.
The scope of the studies was further limited within each of the six major industry groupings to establishments which employed 50 workers or more. In 12 of the largest areas, the minimum size was 100 employees in manufacturing, public utilities, and retail trade. These areas are Baltimore, Boston, Chicago, Cleveland, Detroit, Los Angeles—Long Beach, Newark and Jersey City, New York, Philadelphia, Pittsburgh, St. Louis, and San Francisco—Oakland. Smaller establishments were omitted because employment in the occupations studied tended to be insufficient to warrant inclusion.
Sampling and Estimating Procedures
The sampling plan can be described as a two-stage design consisting of an area sample and an establishment sample. The area sample is designed to allow presentation of data for all metropolitan
38 For more detailed description of scope and method of survey in individual areas, see Wages and Related Benefits: Part I. 80 Metropolitan Areas, 1964—65 (BLS Bulletin 1430-83, 1965).
areas combined, and the establishment sample is designed to allow presentation of data for each particular area. As was indicated earlier, this bulletin is concerned with the data for all metropolitan areas combined.
The area sample of 80 areas in 1964 and 1965 was based on the selection of one area from a stratum of similar areas. The criteria of stratification were size of area, region, and type of industrial activity. Insofar as possible, probability sampling was used and each area had a chance of selection roughly proportionate to its total nonagricultural employment. Thirty-seven of the areas were certain of inclusion in the sample, either because of their size, as measured by the I960 Census of Population, or because of the unusual nature of their industry composition. Each of these 37 areas represented only itself, but each of the 43 other areas represented itself and one or more similar areas, with the data from each area weighted by the ratio of total nonagricultural employment in the stratum to that in the sample area when preparing estimates for all areas combined.
The establishment sample is stratified as precisely as available information permits. Each geographic industry unit for which a separate analysis is to be presented is sampled independently. Within these broad groupings, a finer stratification by product and size of establishment is made. Each sampled stratum will be represented in the sample by a number of establishments proportionate to its share of the total employment. The size of the sample in a particular survey depends on the size of the universe, the diversity of occupations and their distribution, the relative dispersion of earnings among establishments, the distribution of the establishment by size, and the degree of accuracy required.
Approximately 12,200 establishments e m p l o y i n g about 8, 377,900 workers were included in the Bureau*s sample from an es timated universe of 66,300 establishments employing about 18, 118,000 workers within scope of the studies in all metropolitan areas. The estimates as presented relate to all establishments and workers within scope of the studies in all metropolitan areas.
Occupational EarningsWorkers were classified by occupation on the basis of uniform
job descriptions designed to take account of minor interestablishment variation in duties within the same job; these job descriptions are listed in appendix C.
Average earnings are presented (in the A tables), beginning on page 6. Data are shown for full-time workers, i. e. , those hired to work a full-tim e schedule in the given occupational classification.
103
Digitized for FRASER http://fraser.stlouisfed.org/ Federal Reserve Bank of St. Louis

1 0 4
Earnings data exclude prem ium pay for overtim e and nightw ork, and w ork on w eekends and holidays. Nonproduction bonuses are excluded a lso , but c o s t -o f- l iv in g bonuses and incentive earnings are included. A verage w eek ly earnings for o ffic e c le r ic a l , p ro fe ss io n a l, and te ch n ica l occupations relate to the standard sa la ries that w ere paid for standard w ork schedules; i. e. , to the stra igh t-tim e sa lary c o r r e sponding to the w o rk e rs ' n orm al w eekly w ork schedule excluding all overtim e hours. W eekly earnings w ere rounded to the n earest half d o lla r .
Establishm ent P r a c t ic e s and Supplem entary Wage P rov is ion s
Inform ation is presen ted (in the B -s e r ie s tables) on se lected establishm ent p ra ctice s and supplem entary wage p rov is ion s as they relate to plant and o ffic e w o rk e rs . A dm in istra tive , execu tive, and p ro fe ss io n a l em p loyees , and fo r ce -a c co u n t construction w ork ers who are u tilized as a separate w ork fo r ce are excluded . "P lant w o rk e rs " include w orking forem en and all n on su perv isory w ork ers (including leadm en and tra inees) engaged in n onoffice functions. "O ffice w o rk e rs " include w orking su p erv isors and n on su perv isory w ork ers perform ing c le r ic a l o r related functions. C afeteria w ork ers and routem en are ex cluded in m anufacturing in du str ies , but included in nonm anufacturing in d u stries .
Shift d ifferen tia l data (table B - l ) are lim ited to plant w ork ers in m anufacturing in du stries . This in form ation is p resen ted both in term s o f (1) establishm ent p o l i c y ,39 in term s o f total plant w ork er em ploym ent, and (2) e ffective p ra c tice , in term s o f w ork ers actually em ployed on the sp ecified shift at the tim e o f the survey. In estab lishm ents having v aried d iffe ren tia ls , the amount applying to a m a jo r ity was used o r , if no amount applied to a m a jor ity , the c la s s i f i c a tion "o th e r" was used. In establishm ents in w hich som e la te -sh ift hours are paid at n orm al ra tes , a d ifferen tia l was re co rd e d only if it applied to a m a jor ity o f the shifts hours.
The scheduled w eekly hours (table B -2 ) of a m a jor ity o f the f ir s t -s h ift w ork ers in an establishm ent are tabulated as applying to a ll o f the plant or o ffic e w ork ers o f that establishm ent. P aid holidays; paid vacations; and health, in su ran ce, and pension plans (tables B -3 through B -6 ) are treated s ta tistica lly on the basis that these are applicable to a ll plant or o ffic e w ork ers if a m a jor ity o f such w ork ers are e lig ib le or m ay eventually qualify for the p ra ctice s listed .
39 An establishment was considered as having a policy if it met either of the following conditions: (1) Operated late shifts at the time of the survey, or (2) had formal provisions covering late shifts. An establishment was considered as having formal provisions if it (1) had operated late shifts during the 12 months prior to the survey, or (2) had provisions in written form for operating late shifts.
Data on paid holidays (table B -3 ) are lim ited to data on holidays granted annually on a fo rm a l ba sis ; i. e. , (1) are provided for in w ritten fo rm , o r (2) have been established by custom . H olidays ord in arily granted annually are included even though they m ay fa ll on a nonworkday and the w ork er is not granted another day off. The fir s t part o f the paid holidays table p resen ts the num ber o f whole and half holidays actually granted. The second part com bines w hole and half holidays to show total holiday tim e.
The sum m ary o f vacation plans (table B -4) is lim ited to form a l p o lic ie s , excluding in form al arrangem ents w hereby tim e o ff with pay is granted at the d iscre tion o f the em p loyer. Separate e s tim ates are provided accord in g to em ployer p ra ctice in com puting vacation paym ents, such as tim e paym ents, percen t o f annual earn ings, or fla t-su m am ounts. H ow ever, in the tabulations o f vacation pay, paym ents not on a tim e basis w ere converted to a tim e ba sis ; for exam ple, a paym ent o f 2 percen t o f annual earnings was con s id ered as the equivalent o f 1 w eek 's pay.
Data are presented for a ll health, in su ran ce, and pension plans (table B -5 ) for w hich at least a part o f the cost is borne by the em p loyer , excepting only legal requ irem ents such as w ork m en 's com pensation , so c ia l secu rity , and ra ilroa d retirem en t. Such plans include those underw ritten by a co m m e rc ia l insurance com pany and those p rovided through a union fund or paid d ire c t ly by the em ployer out o f curren t operating funds or from a fund set aside for this p u rpose . Death benefits are included as a fo rm o f life insurance.
S ickness and accident insurance is lim ited to that type o f insurance under w hich predeterm in ed cash paym ents are m ade d ire c tly to the insured on a w eekly or m onthly basis during illn ess or accident d isab ility . Inform ation is p resen ted for a ll such plans to w hich the em ployer contributes. H ow ever, in New Y ork and New J e rse y , w hich have enacted tem pora ry d isab ility insurance laws w hich requ ire e m p loyer co n tr ib u tio n s ,40 plans are included only if the em ployer (1) contributes m ore than is lega lly requ ired , or (2) p rov id es the em ployee with benefits w hich exceed the requ irem ents o f the law. Tabulations o f paid sick leave plans are lim ited to fo rm a l p la n s41 w hich provide fu ll pay or a p roportion o f the w o rk e r 's pay during absence from w ork becau se o f illn ess . T able B -5 distinguishes between sick leave plans w hich (1) p rovided fu ll pay and no waiting p er iod , and (2) p rovided either partia l pay or a waiting p eriod . T ab le B -6 , the resu lt o f a sp ecia l study o f paid sick leave, p rov ides in form ation on the re la tio n ship o f benefits to length o f s e r v ice , type o f pay, waiting p er iod requ irem en ts, num ber o f days availab le , and p rov is ion s fo r a ccu m u la tion o f unused leave.
4® The temporary disability laws in California and Rhode Island do not require employer contributions.
41 An establishment was considered as having a formal plan if it established at least the minimum number of days of sick leave available to each employee. Such a plan need not be written, but informal sick leave allowances, determined on an individual basis, were excluded.
Digitized for FRASER http://fraser.stlouisfed.org/ Federal Reserve Bank of St. Louis

P aid sick leave and sick n ess and acciden t insurance have a basic s im ilarity o f purpose but include a w ide varie ty o f p rov is ion s . Follow ing are the c r ite r ia used in the study to distinguish between the two types o f plans:
M ethod o f F inancing. Paid sick leave is (usually) a pa yroll item , w hile sickn ess and accident in surance is financed through pu rchase o f insurance o r is se lf-in su re d through a sp ecia l fund.
Amount o f B en efit. Paid sick leave usually p rov ides full pay o r a com bination o f fu ll pay plus partial pay, but occa sion a lly p rovides only partial pay. The rate o f pay m ay graduate with length o f s e r v ice . S ickness and accident insurance usually provides fla t- sum paym ents or a percentage o f earnings le s s than fu ll pay. The rate o f pay is not graduated by length o f s e r v ice .
Benefit P e r io d . Sick leave benefits range from a day to a fu ll yea r , w hile sick n ess and accident benefits usually are fo r 26 w eeks and occa s ion a lly fo r 13 w eeks.
Waiting P e r io d . Sick leave plans m ay have no waiting period or a waiting p er iod o f no lon ger than a w eek. The waiting period m ay dim inish with length o f s e rv ice . S ickness and accident insurance usually has a 1-w eek waiting period . The length o f the waiting p eriod m ay be less fo r an accident or h ospitalization , but does not vary with length o f s e rv ice .
1 0 5
C redit fo r Unused B en efit. Sick leave plans m ay provide cash fo r unused lea ve , accum ulation to the next year, or other co m pensation . Sickness and accident insurance does not provide cred it fo r unused ben efits .
C atastrophe insurance, som etim es re fe rre d to as extended m ed ica l insurance, includes those plans w hich are designed to p r o tect em ployees in ca se o f sickn ess and injury involving expenses b e yond the n orm al coverag e o f hospitalization , m ed ica l, and su rg ica l plans. M ed ica l insurance re fe rs to plans providing for com plete or partia l paym ent o f d o c to rs ' fees . Such plans m ay be underw ritten by co m m e rc ia l insurance com panies or nonprofit organ izations, or they m ay be se lf-in su re d .
Tabulations o f retirem en t pension plans are lim ited to those plans that provide m onthly paym ents for the rem ainder o f the w o rk e r s ' l ife .
E stim ates o f labor-m anagem ent agreem ent coverag e (page 101) relate to a ll w ork ers (plant or o ffice ) em ployed in an establishm ent having e ffective con tracts coverin g a m a jority o f the w ork ers in their resp ectiv e ca te g o r ie s .
Digitized for FRASER http://fraser.stlouisfed.org/ Federal Reserve Bank of St. Louis
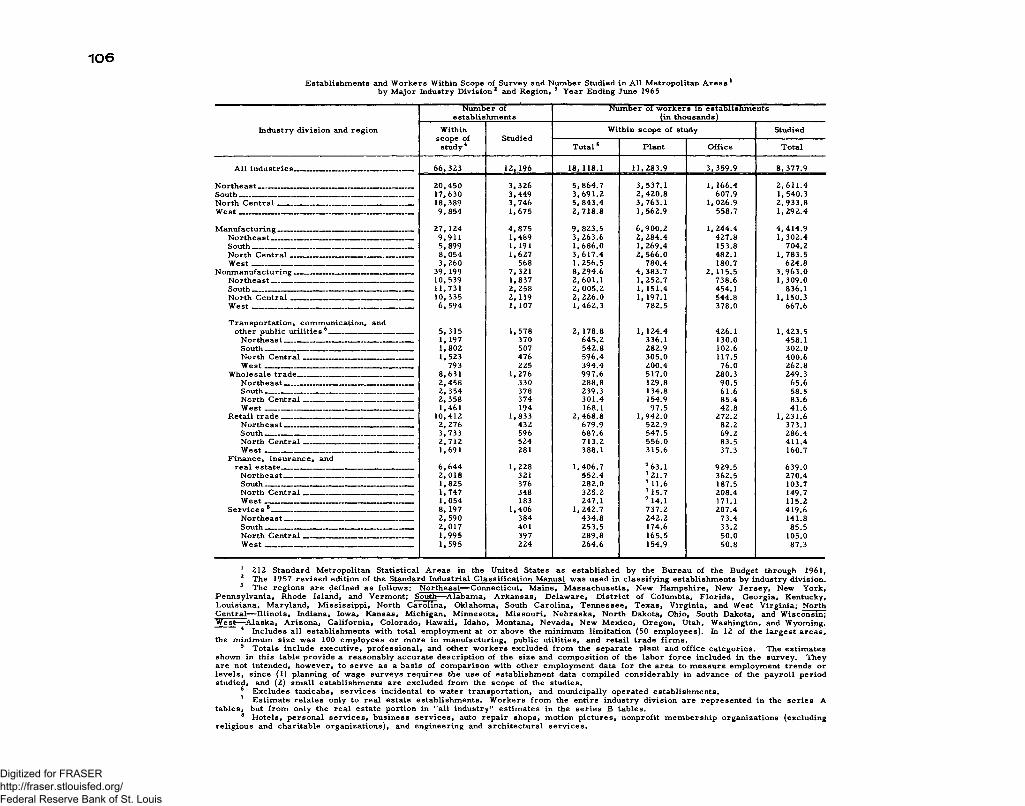
1 0 6
Establishments and Workers Within Scope of Survey and N u m b e r Studied in All Metropolitan Areas 1 by Major Industry Division2 and Region, 3 Year Ending June 1965
N u m b e r of N u m b e r of1 workers in establishmentsestablishments___________________________________ (in thousands)_________ ____
I n d u s t r y d iv i s io n a n d r e g io n W ith in s c o p e of
s t u d y 4S tu d ie d
W ith in s c o p e o f s tu d y S tu d ie d
T o t a l 5 P la n t O ff ic e T o t a l
A l l i n d u s t r i e s ________________________________ 6 6 ,3 2 3 1 2 , 196 1 8 ,1 1 8 .1 1 1 , 2 8 3 .9 3 ,3 5 9 .9 8 ,3 7 7 .9
N o r t h e a s t ______ __ _ ______ _ _ _____ — — 2 0 ,4 5 0 3 ,3 2 6 5 ,8 6 4 .7 3 , 5 3 7 .1 1 , 1 6 6 .4 2 ,6 1 1 .4S o u th _ _ 1 7 ,6 3 0 3 ,4 4 9 3 ,6 9 1 .2 2 ,4 2 0 .8 6 0 7 .9 1, 5 4 0 .3N o r th C e n t r a l _____________________________________ 1 8 ,3 8 9 3 ,7 4 6 5 ,8 4 3 .4 3 ,7 6 3 .1 1 ,0 2 6 .9 2 ,9 3 3 .8W e s t ......................... ........................................................... 9 ,8 5 4 1 ,6 7 5 2 ,7 1 8 .8 1 ,5 6 2 .9 5 5 8 .7 1 ,2 9 2 .4
M a n u f a c t u r in g _______ __ _ ___ 2 7 ,1 2 4 4 ,8 7 5 9 ,8 2 3 .5 6 ,9 0 0 .2 1 ,2 4 4 .4 4 ,4 1 4 .9N o r t h e a s t _______________________________________ 9 ,9 1 1 1 ,4 8 9 3 ,2 6 3 .6 2 , 2 8 4 .4 4 2 7 .8 1, 3 0 2 .4S o u th ________ _______ ___ __________ ___ 5 ,8 9 9 1 , 191 1 ,6 8 6 .0 1 , 2 6 9 .4 1 5 3 .8 7 0 4 .2N o r th C e n t r a l 8 ,0 5 4 1 ,6 2 7 3 , 6 1 7 .4 2 , 5 6 6 .0 4 8 2 .1 1 ,7 8 3 .5W e s t ______ 3 , 2 60 5 68 1 , 2 5 6 .5 7 8 0 .4 1 8 0 .7 6 2 4 .8
N o n m a n u f a c t u r in g . _____ __ 3 9 , 199 7 ,3 2 1 8 ,2 9 4 .6 4 ,3 8 3 .7 2 , 1 1 5 .5 3 ,9 6 3 .0N o r t h e a s t __ ___ __ ________ __ _» __ 1 0 ,5 3 9 1 ,8 3 7 2 ,6 0 1 .1 1 ,2 5 2 .7 7 3 8 .6 1 ,3 0 9 .0S o u th ____________________________________________ 1 1 ,7 3 1 2 ,2 5 8 2 , 0 0 5 .2 1 , 1 5 1 .4 4 5 4 .1 8 3 6 .1N o r th C e n t r a l _________________________________ 1 0 ,3 3 5 2 , 119 2 ,2 2 6 .0 1 ,1 9 7 .1 5 4 4 .8 1 , 1 5 0 .3W e s t ----------------------------------------------------------------------- 6 , 5 9 4 1 , 107 1 ,4 6 2 .3 7 8 2 .5 3 7 8 .0 6 6 7 .6
T r a n s p o r t a t io n , c o m m u n ic a t io n , a n do t h e r p u b l i c u t i l i t i e s 6 7_______________________ 5 ,3 1 5 1 ,5 7 8 2 , 1 7 8 .8 1 , 1 2 4 .4 4 2 6 .1 1 ,4 2 3 .5
N o r t h e a s t ___ __ __ _ __ __ __ __ 1 , 197 3 70 6 4 5 .2 3 3 6 .1 1 3 0 .0 4 5 8 .1S o u th __ __ _ ___ 1 ,8 0 2 507 5 4 2 .8 2 8 2 .9 1 0 2 .6 3 0 2 .0N o r th C e n t r a l __ ___ __ 1 ,5 2 3 4 7 6 5 9 6 .4 3 0 5 .0 1 1 7 .5 4 0 0 .6W e s t _____ . . 7 93 2 25 3 9 4 .4 2 0 0 .4 7 6 .0 2 6 2 .8
W h o le s a l e t r a d e _ ________ __ 8 ,6 3 1 1 ,2 7 6 9 9 7 .6 5 1 7 .0 2 8 0 .3 2 4 9 .3N o r t h e a s t ____ __ _ 2 ,4 5 8 3 3 0 2 8 8 .8 1 2 9 .8 9 0 .5 6 5 .6S o u th __ __ 2 ,3 5 4 3 78 2 3 9 .3 1 3 4 .8 6 1 .6 5 8 .5N o r th C e n t r a l ____ ___ ______ _____ 2 ,3 5 8 3 74 3 0 1 .4 1 5 4 .9 8 5 .4 8 3 .6W e s t ________________________________________ 1 ,4 6 1 194 1 6 8 .1 9 7 .5 4 2 .8 4 1 .6
R e t a i l t r a d e ___ _____ _______ __ _ 1 0 ,4 1 2 1 ,8 3 3 2 ,4 6 8 .8 1 ,9 4 2 .0 2 7 2 .2 1, 2 3 1 .6N o r t h e a s t 2 , 2 76 4 3 2 6 7 9 .9 5 2 2 .9 8 2 .2 3 7 3 .1S o u th __ __ ______ ______ _____ 3 ,7 3 3 5 96 6 8 7 .6 5 4 7 .5 6 9 .2 2 8 6 .4N o r th C e n t r a l ______ . _ 2 ,7 1 2 5 24 7 1 3 .2 5 5 6 .0 8 3 .5 4 1 1 .4W e s t ......................................................................................... 1 ,6 9 1 281 3 8 8 .1 3 1 5 .6 3 7 .3 1 6 0 .7
F in a n c e , i n s u r a n c e , a n dr e a l e s t a t e _________ _ ___,L___ _ 6 ,6 4 4 1 ,2 2 8 1 ,4 0 6 .7 7 6 3 .1 9 2 9 .5 6 3 9 .0
N o r t h e a s t _ .... - _ - 2 ,0 1 8 321 5 5 2 .4 7 2 1 .7 3 6 2 .5 2 7 0 .4S o u t h ____ __ __ ___ _ _ ___ 1 ,8 2 5 3 76 2 8 2 .0 7 1 1 .6 1 8 7 .5 1 0 3 .7N o r th C e n t r a l ........................................ 1 ,7 4 7 3 48 3 2 5 .2 7 1 5 .7 2 0 8 .4 1 4 9 .7W e s t _________ __________________________ 1 ,0 5 4 183 2 4 7 .1 7 1 4 .1 1 7 1 .1 1 1 5 .2
S e r v i c e s 8 ---- 8 , 197 1 ,4 0 6 1 , 2 4 2 .7 7 3 7 .2 2 0 7 .4 4 1 9 .6N o r t h e a s t ______ __ ____ _____ 2 , 5 90 3 8 4 4 3 4 .8 2 4 2 .2 7 3 .4 1 4 1 .8S o u t h ____ _ _ ____ __ __________ 2 ,0 1 7 4 01 2 5 3 .5 1 7 4 .6 3 3 .2 8 5 .5N o r th C e n t r a l ______________________________ 1 ,9 9 5 3 97 2 8 9 .8 1 6 5 .5 5 0 .0 1 0 5 .0W e s t ________________________ 1 ,5 9 5 2 2 4 2 6 4 .6 1 5 4 .9 5 0 .8 8 7 .3
1 212 Standard M etropolitan Statistica l A rea s in the United States as estab lish ed by the Bureau o f the Budget through 1961,2 The 1957 re v ise d edition of the Standard Industrial C la ss ifica tion Manual w as used in c la ss ify in g establishm ents by industry d iv ision .3 The reg ion s are defined as fo llow s : N ortheast— C onnecticut, M aine, M assach u setts , New H am pshire, New J e rse y , New Y ork ,
P en nsylvan ia , Rhode Island, and V erm ont; South— A labam a, A rk a n sas , D elaw are, D is tr ic t of C olum bia, F lo r id a , G eorg ia , Kentucky, L ou isiana , M aryland, M iss is s ip p i, N orth C arolina , O klahom a, South C arolin a , T en n essee , T exa s , V irg in ia , and W est V irg in ia ; N orth C en tra l— Illin o is , Indiana, Iowa, K ansas, M ichigan , M innesota, M issou r i, N ebraska, N orth Dakota, O hio, South Dakota, and W iscon sin ; W est— A lask a , A rizon a , C a liforn ia , C olorad o , H awaii, Idaho, M ontana, N evada, New M e x ico , O regon , Utah, W ashington, and W yom ing.
4 Includes a ll estab lishm ents with total em ploym ent at or above the m inim um lim itation (50 em p loyees). In 12 o f the la rg est a rea s , the m inim um s ize w as 100 em ployees o r m ore in m anufacturing, public u tilit ies , and re ta il trade f irm s .
5 T ota ls include execu tive , p ro fe ss io n a l, and other w ork ers excluded fro m the separate plant and o ffice ca te g o r ie s . The estim atesshown in this table p rov id e a reason ab ly accu rate descr ip tion o f the s ize and com p osition o f the labor fo r c e included in the survey. They are not intended, h ow ever, to serve as a b a sis of com p a rison with other em ploym ent data fo r the a rea to m easu re em ploym ent trends or le v e ls , s in ce (1) planning o f w age su rveys req u ires the use o f establishm ent data com p iled con sid era b ly in advance o f the p a y ro ll p er iodstudied, and (2) sm all establishm ents are excluded fro m the scop e o f the studies.
6 Excludes taxicabs, services incidental to water transportation, and municipally operated establishments.7 E stim ate re la tes only to rea l estate estab lishm ents. W ork ers fro m the entire industry d iv ision a re rep resen ted in the s e r ie s A
ta b les , but fro m only the rea l estate portion in "a ll industry" estim ates in the s e r ie s B tab les.8 H otels , p erson a l s e r v ic e s , b u sin ess s e r v ic e s , auto rep a ir shops, m otion p ic tu res , nonprofit m em bersh ip organ ization s (excluding
re lig io u s and ch arita b le organ iza tion s), and engineering and arch itectu ra l s e r v ic e s .
Digitized for FRASER http://fraser.stlouisfed.org/ Federal Reserve Bank of St. Louis

Appendix B. Occupational Employment107
Appendix Table 1. P ercen t of W orkers in Selected O ccupations by Industry D ivision in A ll M etropolitan A rea s , F eb ru ary 1964 1
Sex, occupation , and gradeP ercen t o f total
M anufacturing Pu blic utilities 2
W holesaletrade
R eta iltrade Fina.nc e 3 S erv ices
O ffice c le r ic a l
Men
B ille r s , m achine (b illin g m achine)— ________ — 11 75 5 1 6 1B ook keeping-m ach ine o p era tors , c la ss A ______ 21 5 14 15 42 4B ook keeping-m ach ine op era tors , c la ss B --------- 16 4 17 6 48 9C le rk s , accounting, c la ss A ------- — ------ — 48 17 15 4 12 5C le rk s , accounting, c la ss B --------------------------------- 36 22 18 4 16 4C le rk s , f i le , c la ss A _____________________________ 33 36 3 1 17 10C le rk s , f i le , c la ss B _____________________________ 27 26 5 2 27 14C le rk s , f i le , c la ss C _ __ ___________ — — - 17 15 6 2 58 3C lerk s , o rd er - — __ ____ ________ ________ 37 1 58 4 (4) (4)C lerk s , p a y ro ll- ------- --------------- ---------------------- 65 20 4 3 3 5C om ptom eter o p e ra to rs__________________________ 48 25 24 3 - -D uplicating-m ach ine op erators
(M im eograph or D itto )---------------------------------------- 40 21 7 4 13 14Keypunch o p era tors , c la ss A ------------------------------- 49 36 9 4 3 1Keypunch o p era tors , c la ss B ____________________ 25 46 10 2 10 7O ffice b oys _ - ----------- ------------------------------- 34 12 9 3 30 11S e c r e ta r ie s — ------------------------ ----------------------------- 29 52 7 2 4 7Stenographers, g e n e r a l— ---------------------------------- 16 64 18 1
(4)(4) 1
Stenographers, sen io r____________________________ 39 47 7 6 1T abulating-m achine op era tors , c la ss A ------------- 51 10 8 3 25 3Tabulating-m achine o p era tors , c la ss B ------------- 40 11 12 5 29 4T abulating-m achine o p era tors , c la ss C ------------- 32 9 12 6 39 3T yp ists , c la ss A __ _______ ___________________ 33 39 7 2 6 14T yp ists , c la ss B ------ ------ ------------------------------
W om en
20 49 18 3 6 4
B ille r s , m achine (b illing m achine) _ __ — ------ 38 16 20 17 5 5B ille r s , m achine (bookkeeping m ach ine)----------- 24 8 8 46 3 13B ookkeeping-m ach ine o p era tors , c la s s A ------ 37 4 20 10 24 5B ook keeping-m ach ine o p era tors , c la ss B --------- 21 3 16 11 46 3C le rk s , accounting, c la ss A _______ —------------------ 38 13 9 13 18 9C le rk s , accounting, c la ss B -------------------------------- 29 18 11 16 20 6C lerk s , f i le , c la ss A _____________________________ 33 7 8 3 41 8C le rk s , f ile , c la ss B ----------------------- — — 23 7 10 9 45 7C lerk s , f ile , c la ss C ___________________ ______ 16 6 7 10 54 8C lerk s , o r d e r ______________________________________ 45 2 30 21 1 3C lerk s , p a y ro ll- --------------------------------------------------- 57 10 7 12 7 7C om ptom eter o p e ra to rs ---------------------------------------- 34 8 18 30 5 4D uplicating m achine op erators
(M im eograph or D itto )----------------------------------------- 45 11 11 6 18 9Keypunch op e ra to rs , c la ss A ____________________ 44 13 9 5 25 4Keypunch op era tors , c la ss B ----------------- --------- 35 16 11 7 28 4O ffice g i r l s -------------------------------------------------------------- 26 13 9 8 39 5S e c r e ta r ie s ________________________________________ 44 9 10 5 21 11Stenographers, g e n e r a l----------------------------------------- 44 14 9 4 23 6Stenographers, s e n io r . --------- ----- ------------------- 53 10 7 3 20 7Sw itchboard o p e ra to rs_____ — __________________ 23 12 7 14 20 23Sw itchboard o p e ra to r -re ce p t io n is ts — — ------- 48 7 20 9 9 7T abulating-m achine op e ra to rs , c la ss A ________ 53 8 6 2 30 2T abulating-m achine op e ra to rs , c la ss B------------- 29 35 9 4 21 3T abulating-m achine op e ra to rs , c la ss C ------------- 17 43 9 6 23 3T ra n scr ib in g -m a ch in e op era tors , g e n e r a l_____ 33 3 16 3 38 8T yp ists , c la ss A ______ — — __________________ 42 9 6 3 30 10T yp ists , c la ss B ------------------ ---------------------- ------ 30 6 9 6 42 8
P ro fe ss io n a l and tech n ica l
W om en
N u rses, industria l (reg iste red ) _____ __ ____ 82 51
4 5 2
S ee fo o t n o t e s at end o f ta b le .
Digitized for FRASER http://fraser.stlouisfed.org/ Federal Reserve Bank of St. Louis

108
A p p e n d ix T a b le 1. P e r c e n t o f W o r k e r s in S e le c t e d O c c u p a t io n s b y In d u s try D iv is io nin A l l M e tr o p o l ita n A r e a s , F e b r u a r y 1964 1— C on tin u ed
S e x , o c c u p a t io n , an d g r a d eP e r c e n t o f t o t a l
M a n u f a c t u r in g P u b l ic u t i l i t i e s 2
W h o le s a l et r a d e
R e t a i lt r a d e F in a n c e 3 S e r v i c e s
M a in t e n a n c e a n d p o w e r p la n t 5
C a r p e n t e r s , m a i n t e n a n c e _________________________ 72 10 1 8 4 5E l e c t r i c i a n s , m a in t e n a n c e ----------------------------------- 87 8 1 1 1 2E n g in e e r s , s t a t i o n a r y . . ------------------------------------------- 63 8 2 7 9 12F i r e m e n , s t a t i o n a r y b o i l e r ______________________ 81 5 2 2 3 7H e l p e r s , m a in t e n a n c e t r a d e s ____________________ 79 16 1 1 1 2M a c h in e - t o o l o p e r a t o r s , to o l r o o m ______________ 99 (4 ) n D ( 4 ) ( 4 )M a c h i n i s t s , m a i n t e n a n c e ---------------------------------------- 9 4 5 (4 ) ( 4 ) 0
1M e c h a n ic s , a u to m o t iv e ( m a in t e n a n c e ) ------------- 28 60 6 3 (4 ) 3M e c h a n ic s , m a i n t e n a n c e ______ __ ______________ 92 4 2 1
( 4)4 1
M i l lw r i g h t s _ ________________________________ - — 99 1 (4 ) ( ) ( 4 )O i l e r s __ ________________________________ ________ 97 2 (4 ) ( 4 ) ( 4 ) 1P a i n t e r s , m a in t e n a n c e ------------------------------------------ 68 7 1 4 11 10P i p e f i t t e r s , m a in t e n a n c e ------------ ---------------------- 95 3 1 (4 ) ( 4 ) 1P lu m b e r s , m a i n t e n a n c e ----- ----------------------------------- 64 15 ( 4 ) 3 8 10S h e e t - m e t a l w o r k e r s , m a in t e n a n c e _____________ 95 3
0 ( 4 ) (4 ) 1T o o l a n d d ie m a k e r s ____________________ ______ - 99 (4 ) ( 4 ) ( 4 ) (4 ) 1
C u s t o d ia l a n d m a t e r i a l m o v e m e n t 5
E le v a t o r o p e r a t o r s , p a s s e n g e r ----------------------------- 7 3 3 10 49 28E le v a t o r o p e r a t o r s , p a s s e n g e r ( w o m e n ) ------------ 2 4 1 3 7 21 35G u a r d s an d w a t c h m e n ----------------------------------------------- 52 5 2 3 10 27J a n i t o r s , p o r t e r s , a n d c l e a n e r s _________________ 47 7 3 13 10 20J a n i t o r s , p o r t e r s , a n d c l e a n e r s (w o m e n )______ 16 7 2 8 35 32L a b o r e r s , m a t e r i a l h a n d l in g ____________________ 53 22 15 10 (4 ) ( 4 )O r d e r f i l l e r s ____ _____________________________ — 32 2 46 20 (4 ) ( 4 )P a c k e r s , s h ip p in g ----------------------------------------------------- 69
024 6 0 1
P a c k e r s , s h ip p in g ( w o m e n ) _______ ______ 75 (4 ) 10 15 (4 ) ( 4 )R e c e iv in g c l e r k s ______ ____ ______ _______ __ 49 4 21 24
0S h ip p in g c l e r k s _____ ___ __________ ___________ 66 1 2 4 9 (4 ) 1S h ip p in g a n d r e c e iv in g c l e r k s _________ _______ 58 5 21 13 (4 ) 3T r u c k d r i v e r s 6_____ __ ___ __ _____ __ __ 27 40 20 10 (4 )
13
T r u c k d r i v e r s , l i g h t ( u n d e r 1 V2 t o n s ) ________ 32 14 25 16 13T r u c k d r i v e r s , m e d iu m (IV 2 to an d
in c lu d in g 4 t o n s ) ______________________________ 26 4 2 21 8 (4 ) 3T r u c k d r i v e r s , h e a v y ( o v e r 4 t o n s ,
t r a i l e r t y p e ) _____-_________________ ___ ____ 16 51 19 13 (4 ) (4 )T r u c k d r i v e r s , h e a v y ( o v e r 4 t o n s ,
o t h e r th a n t r a i l e r t y p e ) _____________ ______ 45 25 23 7 (4 ) ( 4 )T r u c k e r s , p o w e r ( f o r k l i f t ) _______________________ 79 7 9 5 (4 ) ( 4 )T r u c k e r s , p o w e r ( o t h e r th a n f o r k l i f t ) ___________ 79 16 4 2 (4 ) (4 )
1 A v era ge m onth o f r e fe re n ce . Data w ere c o lle c te d during the p eriod July 1963 through June 1964.2 T ran sp orta tion , com m u nication , and other public u tilit ies .3 F in an ce , in su ran ce , and rea l estate.4 L e ss than 0.5 percen t.5 Data lim ited to m en w ork ers except w here o th erw ise indicated .6 Includes a ll d r iv e rs re g a rd le ss o f s ize and type o f tru ck operated .
N OTE: B ecau se o f rounding, sum s o f individual item s m ay not equal 100 p ercen t.
Digitized for FRASER http://fraser.stlouisfed.org/ Federal Reserve Bank of St. Louis
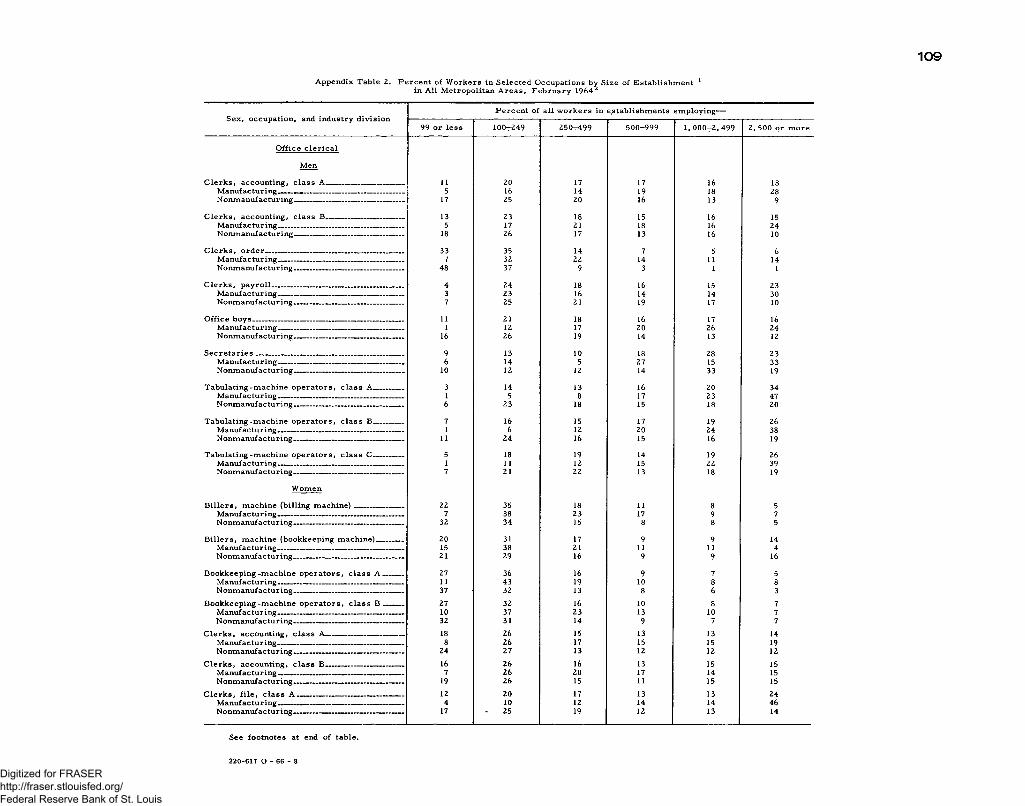
1 0 9
A p p e n d ix T a b le 2. P e r c e n t o f W o r k e r s in S e le c t e d O cc u p a t io n s b y S iz e o f E s ta b lis h m e n t 1in A l l M e tr o p o l ita n A r e a s , F e b r u a r y 1964^
S e x , o c c u p a t io n , an d in d u s t r y d iv i s io nP e r c e n t of a l l w o r k e r s in e s t a b l i s h m e n t s e m p lo y in g —
99 o r l e s s 1 0 0 -2 4 9 250 -r49 9 5 0 0 -9 9 9 1, 0 0 0 —2 , 4 99 2 , 5 0 0 o r m o r e
O ff ic e c l e r i c a l
M e n
C l e r k s , a c c o u n t in g , c l a s s A ___ __________ 11 20 17 17 16 18M a n u f a c t u r in g __ ___________________________ 5 16 14 19 18 28N o n m a n u f a c tu r in g __ ------------------------------------------- 17 25 20 16 13 9
C l e r k s , a c c o u n t in g , c l a s s B_ ___________________ 13 23 18 15 16 15M a n u f a c t u r in g __________________________________ 5 17 21 18 16 24N o n m a n u fa c tu r in g ____________________________ 18 26 17 13 16 10
C l e r k s , o r d e r ______________________________________ 33 35 14 7 5 6M a n u f a c t u r in g __________________________________ 7 32 22 14 11 14N o n m a n u fa c tu r in g ______________________________ 48 37 9 3 1 1
C l e r k s , p a y r o l l __________________ ________________ 4 24 18 16 15 23M a n u f a c t u r in g __________________________________ 3 23 16 14 14 30N o n m a n u fa c tu r in g ______________________________ 7 25 21 19 17 10
O ff ic e b o y s ____________ __________________________ 11 21 18 16 17 16M a n u f a c t u r in g __________________________________ 1 12 17 20 26 24N o n m a n u fa c tu r in g ------------------------------------------------- 16 26 19 14 13 12
S e c r e t a r i e s ________________ _______________ _____ 9 13 10 18 28 23M a n u f a c t u r in g __________________________________ 6 14 5 27 15 33N o n m a n u fa c tu r in g _ .____________________________ 10 12 12 14 33 19
T a b u l a t in g - m a c h in e o p e r a t o r s , c l a s s A ________ 3 14 13 16 20 34M a n u f a c t u r in g ______ ___________________________ 1 5 8 17 23 47N o n m a n u f a c tu r in g ______________________________ 6 23 18 15 18 20
T a b u l a t in g - m a c h in e o p e r a t o r s , c l a s s B ________ 7 16 15 17 19 26M a n u f a c t u r in g __________________________________ 1 6 12 20 24 38N o n m a n u f a c tu r in g ------------------------------------------------- 11 2 4 16 15 16 19
T a b u l a t in g - m a c h in e o p e r a t o r s , c l a s s C ________ 5 18 19 14 19 26M a n u f a c t u r in g __________________________________ 1 11 12 15 22 39N o n m a n u fa c tu r in g __ __ _____________________ 7 21 22 13 18 19
W o m e n
B i l l e r s , m a c h in e ( b i l l i n g m a c h i n e ) _____________ 22 35 18 11 8 5M a n u f a c t u r in g __________________________________ 7 38 23 17 9 7N o n m a n u f a c tu r in g --------- --------- ----------------------- 32 34 15 8 8 5
B i l l e r s , m a c h in e (b o o k k e e p in g m a c h in e ) _____ 20 31 17 9 9 14M a n u f a c t u r in g __________________________________ 15 38 21 11 11 4N o n m a n u f a c tu r in g ______________________________ 21 29 16 9 9 16
B o o k k e e p in g - m a c h in e o p e r a t o r s , c l a s s A ____ 27 36 16 9 7 5M a n u f a c t u r in g __________________________________ 11 43 19 10 8 8N o n m a n u f a c tu r in g ______________________________ 37 32 13 8 6 3
B o o k k e e p in g - m a c h in e o p e r a t o r s , c l a s s B _____ 27 32 16 10 8 7M a n u f a c t u r in g __________________________________ 10 37 23 13 10 7N o n m a n u f a c tu r in g --------- ------------------------------------ 32 31 14 9 7 7
C l e r k s , a c c o u n t in g , c l a s s A _ --------------- — 18 26 15 13 13 14M a n u f a c t u r in g ___________________ s----------------------- 8 26 17 15 15 19N o n m a n u f a c tu r in g __ __ _______ ________ — 24 27 13 12 12 12
C l e r k s , a c c o u n t in g , c l a s s B ___________________ 16 26 16 13 15 15M a n u f a c t u r in g ----------------------------- — -------------- 7 26 20 17 14 15N o n m a n u f a c tu r in g _____ _____ _____________ _ 19 26 15 11 15 15
C l e r k s , f i l e , c l a s s A ________ _ --------- — — 12 20 17 13 13 24M a n u f a c t u r in g ---- --------- _ — -------------------- 4 10 12 14 14 46N o n m a n u f a c tu r in g ------------------------------------------------- 17 25 19 12 13 14
S e e f o o tn o te s a t e n d o f t a b le .
2 2 0 - 6 1 7 0 - 6 6 - 8
Digitized for FRASER http://fraser.stlouisfed.org/ Federal Reserve Bank of St. Louis

110
A p p e n d ix T a b le 2. P e r c e n t o f W o r k e r s in S e le c t e d O cc u p a t io n s b y S iz e o f E s ta b lis h m e n t 1in A l l M e tr o p o l ita n A r e a s , F e b r u a r y 1964 2— C on tin u e d
S e x , o c c u p a t io n , a n d in d u s t r y d iv i s io nP e r c e n t o f a l l w o r k e r s in e s t a b l i s h m e n t s e m p lo y in g —
9 9 o r l e s s 1 0 0 -2 4 9 250^-499 5 0 0 t-999 1 ,0 0 0 —2 ,4 9 9 2 , 5 00 o r m o r e
O ff ic e c l e r i c a l — C o n t in u e d
W o m e n — C o n t in u e d
C l e r k s , f i l e , c l a s s B _ __________________________ 14 26 17 12 14 17M a n u f a c t u r in g __________________________________ 2 17 17 16 15 33N o n m a n u f a c tu r i n g ------------------------------------------------- 17 28 17 11 14 12
C l e r k s , f i l e , c l a s s C _____________________________ 15 22 20 13 15 16M a n u f a c t u r in g ____________________ ____________ 2 18 16 18 21 26N o n m a n u f a c t u r in g ------------------------------------------------- 18 23 20 12 14 14
C l e r k s , o r d e r ---- -------------- ------------- ----- ------------ 20 31 15 9 13 12M a n u f a c t u r in g __________________________________ 8 34 22 15 12 10N o n m a n u f a c t u r in g ----- ---------------------------------------- 29 30 10 5 14 13
C l e r k s , p a y r o l l - ________________ _____________ _ 11 30 20 16 12 11M a n u f a c t u r in g __________________________________ 8 30 22 17 10 12N o n m a n u f a c t u r in g ______________________________ 15 30 18 13 14 10
C o m p to m e te r o p e r a t o r s __ —______________________ 9 21 16 15 18 22M a n u f a c t u r in g -------------------------------- --------------------- 4 21 19 16 15 26N o n m a n u f a c t u r in g — ---------------------- ------- ;--------- 12 21 15 14 19 20
D u p l ic a t in g - m a c h in e o p e r a t o r s( M im e o g r a p h o r D it to )_______________________ __ 9 22 12 14 21 22
M a n u f a c t u r in g . ______ _________________________ 1 13 14 18 22 31N o n m a n u f a c t u r in g ----- ----------------------------------- __ 16 30 10 10 19 14
K e y p u n c h o p e r a t o r s , c l a s s A ____________________ 5 13 14 16 20 32M a n u f a c t u r in g __________________________________ ( 3 ) 6 10 16 25 4 3N o n m a n u f a c tu r in g ______________________________ 9 19 17 15 16 24
K e y p u n c h o p e r a t o r s , c l a s s B ____________________ 7 19 17 15 17 24M a n u f a c t u r in g __________________________________ 1 16 13 18 19 34N o n m a n u f a c t u r in g ______________________________ 11 22 19 13 17 19
O ff ic e g i r l s _________________________________________ 7 16 15 14 20 28M a n u f a c t u r in g . ________________________________ 1 17 17 22 18 26N o n m a n u f a c t u r in g ______________________________ 10 16 14 11 20 29
S e c r e t a r i e s ------------------------------------ -------------------------- 11 21 17 14 16 21M a n u f a c t u r in g - — ------------------------------------------- 3 15 16 16 18 31N o n m a n u f a c t u r in g ------------------------------------------------- 18 26 17 12 14 13
S t e n o g r a p h e r s , g e n e r a l — — ---------------------------- 11 19 14 14 16 26M a n u f a c t u r in g __________________________________ 3 14 13 15 18 36N o n m a n u f a c t u r in g ----- ----------- --------------------- — 17 23 14 12 15 18
S t e n o g r a p h e r s , s e n i o r ____________________________ 7 14 14 12 18 35M a n u f a c t u r in g __________________________________ 2 7 12 12 18 49N o n m a n u f a c t u r in g ______________________________ 13 22 16 13 18 19
S w it c h b o a r d o p e r a t o r s ----------- -------------------------- — 14 23 16 13 15 18M a n u f a c t u r in g _________________________________— 2 8 12 16 24 39N o n m a n u f a c t u r in g — -------- --------- ------------ — 18 28 17 12 13 12
S w it c h b o a r d o p e r a t o r - r e c e p t i o n i s t s __ _ ____ 30 42 16 7 3 1M a n u f a c t u r in g __________________________________ 11 48 2 4 12 5 1N o n m a n u f a c tu r in g ______________________________ 49 36 9 3 2 1
T a b u l a t in g - m a c h in e o p e r a t o r s , c l a s s A -------------- 4 11 12 13 20 40M a n u f a c t u r in g ____ ____________________________ ( 3 ) 4 10 13 18 55N o n m a n u f a c tu r in g ______ — ------------------------------- 8 19 14 13 22 24
T a b u l a t in g - m a c h in e o p e r a t o r s , c l a s s B — -------- 9 15 12 11 13 41M a n u f a c t u r in g __________________________________ 2 17 20 19 16 27N o n m a n u f a c t u r in g ______________________________ 11 14 9 8 12 4 6
S e e fo o t n o t e s at end o f ta b le .
Digitized for FRASER http://fraser.stlouisfed.org/ Federal Reserve Bank of St. Louis

111
A p p e n d ix T a b le 2. P e r c e n t o f W o r k e r s in S e le c t e d O cc u p a t io n s b y S iz e o f E s ta b lis h m e n t 1in A l l M e tr o p o l ita n A r e a s , F e b r u a r y 1964 2— C on tin u ed
S e x , o c c u p a t io n , an d in d u s t r y d iv i s io nP e r c e n t o f a l l w o r k e r s in e s t a b l i s h m e n t s <e m p lo y in g —
9 9 o r l e s s 100t-2 4 9 2 5 0 v 4 9 9 5 0 0 -9 9 9 1, 0 0 0 - 2 ,4 9 9 2 , 5 00 o r m o r e
O ff ic e c l e r i c a l — C o n t in u e d
W o m e n — C o n t in u e d
T a b u l a t in g - m a c h in e o p e r a t o r s , c l a s s C . 7 17 9 13 23 31M a n u f a c t u r i n g __— __ _ _________________ 1 18 13 19 19 30N o n m a n u f a c tu r in g ______________________________ 8 17 8 12 24 31
T r a n s c r ib in g - m a c h i n e o p e r a t o r s , g e n e r a l -------- 19 30 18 15 11 7M a n u f a c t u r in g __ ______ ______ ____ ___ 4 33 22 21 14 7N o n m a n u f a c tu r in g ______________________________ 27 28 17 11 9 7
T y p i s t s , c l a s s A - — ------------- — — - - — — 11 16 14 14 15 30M a n u f a c t u r in g __________________________________ 2 8 12 15 19 4 4N o n m a n u fa c tu r in g ------------------------------ ----------------- 18 22 15 13 12 20
T y p i s t s , c l a s s B -------------------------------------------------------- 15 26 16 12 14 17M a n u f a c t u r in g __________________________________ 4 17 16 16 18 29N o n m a n u fa c tu r in g __________ __________________ 20 30 16 11 12 12
P r o f e s s io n a l a n d t e c h n i c a l
W o m e n
N u r s e s , i n d u s t r i a l ( r e g i s t e r e d ) - ------ --------------- ( ? ) 5 13 21 24 37M a n u f a c t u r in g __________________________________ (? ) 5 15 22 23 36N o n m a n u fa c tu r in g ______________________________ ( 3 ) 4 7 18 27 4 3
M a in t e n a n c e an d p o w e r p la n t 4
C a r p e n t e r s , m a in t e n a n c e - — _ -------------------------- 3 10 10 16 21 4 0M a n u f a c t u r in g - --------------------------------------------------- 1 9 11 17 19 4 4N o n m a n u fa c tu r in g —---------------------------------------------- 9 13 8 14 24 31
E l e c t r i c i a n s , m a i n t e n a n c e --------- ------------------------- 2 7 10 16 21 4 4M a n u f a c t u r in g — - ----- ----- ----------------------------- 1 7 10 16 21 45N o n m a n u fa c tu r in g -- -------- ----------- --------------- 5 8 7 17 25 38
E n g in e e r s , s t a t i o n a r y ---------------------------------------------- 9 20 15 14 17 25M a n u f a c t u r in g __________________________________ 3 17 16 17 18 30N o n m a n u fa c tu r in g ------------------------------------------------- 18 25 14 11 16 16
F i r e m e n , s t a t io n a r y b o i l e r ------------------------------------ 8 22 17 18 16 19M a n u f a c t u r in g ------------------------------------------------------- 6 22 16 20 17 20N o n m a n u fa c tu r in g ----- ---------------- --------------------- 17 22 18 12 13 19
H e l p e r s , m a in t e n a n c e t r a d e s — ------ ------------ 4 12 12 15 18 4 0M a n u f a c t u r in g - _____________ — -------------------- 3 10 11 15 17 4 4N o n m a n u fa c tu r in g ----- ------ ------------------------------ 8 17 14 13 21 27
M a c h in e - t o o l o p e r a t o r s , to o l r o o m — ------ — 2 10 9 10 17 51M a n u f a c t u r in g ----------------- ----------- --------------------- 2 10 9 10 17 51
M a c h i n i s t s , m a i n t e n a n c e . — ------------------------------ 2 9 14 16 21 37M a n u f a c t u r in g - ------------------- — ----- ------------ 2 9 14 16 21 37N o n m a n u fa c tu r in g ------------------------------------------------- 2 7 8 16 21 47
M e c h a n ic s , a u to m o t iv e ( m a in t e n a n c e ) ------------ - 14 29 19 14 10 14M a n u f a c t u r in g __ _____ _______________________ 7 23 18 14 12 26N o n m a n u fa c tu r in g ------------------------------------------------- 16 31 20 14 9 10
M e c h a n ic s , m a in t e n a n c e ---- ------------------------- — - 4 15 15 18 19 29M a n u f a c t u r in g . _ ---------------- — ------------------- 3 15 16 18 20 29N o n m a n u fa c tu r in g ----- ------------------------------ — - 11 13 10 18 18 30
M i l lw r i g h t s _ ------------ ------------ ---- --------------------- (?) 3 7 12 18 59M a n u f a c t u r in g . — ----------------------- — -------- ( 3 ) 3 6 12 18 59
O i l e r s . __ _ __ __ _____________________________ 2 10 15 17 19 37M a n u f a c t u r in g __________________________________ 2 9 15 17 19 38
S e e fo o t n o t e s at en d o f t a b le .
Digitized for FRASER http://fraser.stlouisfed.org/ Federal Reserve Bank of St. Louis

112
A p p e n d ix T a b le 2. P e r c e n t o f W o r k e r s in S e le c t e d O cc u p a t io n s b y S iz e o f E s ta b lis h m e n t 1in A l l M e t r o p o l it a n A r e a s , F e b r u a r y 1964 2— C on tin u e d
S e x , o c c u p a t io n , an d in d u s t r y d iv i s io nP e r c e n t o f a l l w o r k e r s in e s t a b l i s h m e n t s e m p lo y in g —
99 o r l e s s 1 00 —2 49 2 5 0 -4 9 9 5 0 0 -9 9 9 1, 0 0 0 - 2 ,4 9 9 2 , 5 00 d r m o r e
M a in t e n a n c e a n d p o w e r p la n t 4 — C o n t in u e d
P a in t e r s , m a in t e n a n c e -------------------------------------------- 8 10 9 15 22 37M a n u f a c t u r in g --------------------- -------------------------------- ( 3) 5 8 16 23 47N o n m a n u f a c t u r in g ______________________________ 23 19 11 11 13 23
P i p e f i t t e r s , m a i n t e n a n c e ----- -------------------------------- ( 3 ) 4 6 15 25 50M a n u f a c t u r in g __________________________________ (? ) 4 6 15 26 50N o n m a n u f a c tu r in g ______________________________ ( 3 ) 8 9 15 18 49
P lu m b e r s , m a in t e n a n c e ____________ ____________ 5 7 9 15 20 43M a n u f a c t u r in g ------ ---------------------------------------------- ( 3 ) 7 12 14 18 50N o n m a n u f a c tu r in g ______________________________ 14 9 6 19 23 30
S h e e t - m e t a l w o r k e r s , m a in t e n a n c e ---------------------- 1 2 4 12 21 60M a n u f a c t u r in g — ---------------- _ -------------------------- 1 2 4 12 21 6 0
T o o l a n d d ie m a k e r s ------------------------------------------------- 2 14 12 14 15 4 3M a n u f a c t u r in g - _______ ______________________ 2 14 12 14 15 4 3
C u s t o d ia l a n d m a t e r i a l m o v e m e n t 4
E le v a t o r o p e r a t o r s , p a s s e n g e r __________________ 37 20 10 9 12 12M a n u f a c t u r in g __________________________________ 2 7 8 18 36 29N o n m a n u f a c t u r in g ______________________________ 39 22 10 8 10 11
E le v a t o r o p e r a t o r s , p a s s e n g e r ( w o m e n ) _______ 22 31 15 12 9 11N o n m a n u f a c tu r in g ______________________________ 22 32 15 12 9 11
G u a r d s a n d w a t c h m e n ____________ ______________ 9 17 18 14 14 28M a n u f a c t u r in g ---- ------------------- ------------------- — 3 12 12 14 16 41N o n m a n u f a c t u r in g ______________________________ 15 21 2 4 13 12 14
G u a r d s :M a n u f a c t u r in g - ----- -------- _ ---------------------- 1 4 7 13 19 56
W a tc h m e n :M a n u f a c t u r in g - __ ---------------- ------------------ 9 30 24 17 11 9
J a n i t o r s , p o r t e r s , a n d c l e a n e r s _________________ 12 22 17 14 13 22M a n u f a c t u r in g ___ _____________________ ______ 5 18 16 15 17 29N o n m a n u f a c tu r in g ----- ---------------------------------------- 18 26 18 13 10 16
J a n i t o r s , p o r t e r s , a n d c l e a n e r s (w o m e n )______ 21 27 16 9 9 19M a n u f a c t u r in g __________________________________ 5 15 12 18 20 30N o n m a n u fa c tu r in g - ------ — — — — ------- 24 30 16 7 7 16
L a b o r e r s , m a t e r i a l h a n d l in g ------ --------------------- 15 26 16 13 12 18M a n u f a c t u r in g __________________________________ 8 23 16 16 15 22N o n m a n u fa c tu r in g -------------------------------------------- _ 22 30 16 10 8 14
O r d e r f i l l e r s _______________________________________ 21 29 16 10 13 12M a n u f a c t u r in g __________________________________ 6 26 19 17 14 18N o n m a n u f a c tu r in g ___________________________ _ 28 31 14 7 12 9
P a c k e r s , s h ip p in g ________________________________ 13 29 20 13 11 14M a n u f a c t u r in g ___________________________ _____ 5 28 19 16 14 17N o n m a n u f a c tu r in g ______________________________ 31 29 22 5 6 6
P a c k e r s , s h ip p in g ( w o m e n ) ------------------------------------ 12 30 18 13 12 14M a n u f a c t u r in g __________________________________ 11 31 20 15 12 11N o n m a n u f a c t u r in g ______________________________ 13 25 15 9 15 24
R e c e iv in g c l e r k s _________ __ ___________________ 16 27 16 10 14 18M a n u f a c t u r in g __________________________________ 4 27 19 13 13 23N o n m a n u f a c t u r in g ______________________________ 27 27 12 7 14 13
S h ip p in g c l e r k s ____________________________________ 20 31 16 10 10 14M a n u f a c t u r in g __________________________________ 9 32 17 14 10 18N o n m a n u f a c t u r in g ______________________________ 40 28 14 3 9 6
S ee fo o t n o t e s at end o f ta b le .
Digitized for FRASER http://fraser.stlouisfed.org/ Federal Reserve Bank of St. Louis
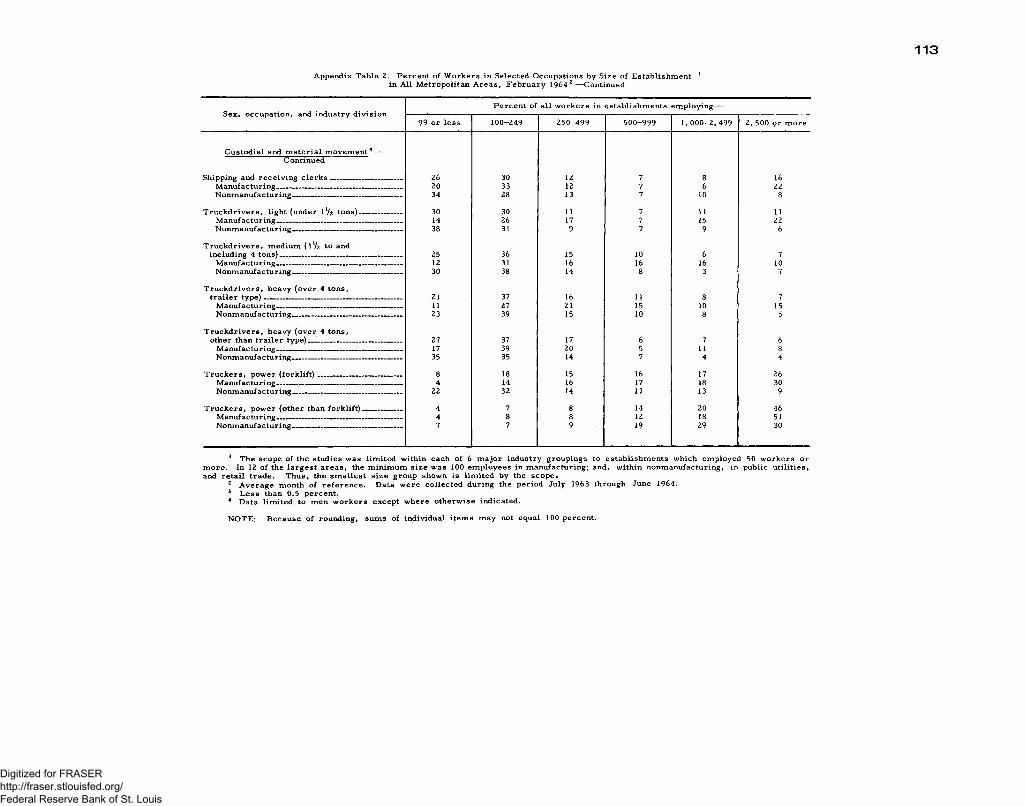
1 1 3
A p p e n d ix T a b le 2. P e r c e n t o f W o r k e r s in S e le c te d O cc u p a t io n s b y S iz e o f E s ta b lis h m e n t 1in A l l M e tr o p o l ita n A r e a s , F e b r u a r y 1 9 6 4 2— C o n tin u ed
S e x , o c c u p a t io n , an d in d u s t r y d iv i s io nP e r c e n t o f a l l w o r k e r s in e s t a b l i s h m e n t s e m p lo y in g ----
9 9 o r l e s s 1 0 0 -2 4 9 2 5 0 -4 9 9 5 0 0 -9 9 9 1 ,0 0 0 - 2 ,4 9 9 2 , 5 00 o r m o r e
C u s t o d ia l a n d m a t e r i a l m o v e m e n t 4 — C o n t in u e d
S h ip p in g a n d r e c e iv in g c l e r k s ----------------------------- 26 30 12 7 8 16M a n u f a c t u r in g __________________________________ 20 33 12 7 6 22N o n m a n u fa c tu r in g ------------------------------------------------ 34 28 13 7 10 8
T r u c k d r i v e r s , l i g h t (u n d e r 1 V2 t o n s ) ____________ 30 30 11 7 11 11M a n u f a c t u r in g __________________________________ 14 26 17 7 15 22N o n m a n u fa c tu r in g ------------------------------------------------- 38 31 9 7 9 6
T r u c k d r i v e r s , m e d iu m ( 1 V2 to an din c lu d in g 4 t o n s ) _______________ ____________ ___ 25 36 15 10 6 7
M a n u f a c t u r in g __________________________________ 12 31 16 16 16 10N o n m a n u fa c tu r in g ___________ _________________ 30 38 14 8 3 7
T r u c k d r i v e r s , h e a v y ( o v e r 4 t o n s ,t r a i l e r t y p e ) ___ ________ ___ ____________________ 21 37 16 11 8 7
M a n u f a c t u r in g . ------------------------- __ ----------- — 11 27 21 15 10 15N o n m a n u fa c tu r in g ___ _ ---- ----------------------------- 23 39 15 10 8 5
T r u c k d r i v e r s , h e a v y ( o v e r 4 to n s ,o th e r th a n t r a i l e r t y p e ) _________________________ 27 37 17 6 7 6
M a n u f a c t u r in g __________________________________ 17 39 20 5 11 8N o n m a n u fa c tu r in g ------------------------------------------------ 35 35 14 7 4 4
T r u c k e r s , p o w e r ( f o r k l i f t ) ______ — _______ 8 18 15 16 17 26M a n u f a c t u r in g ____ ~ ------------------------------------- 4 14 16 17 18 30N o n m a n u fa c tu r in g ___ _ ----------- ---------------------- 22 32 14 11 13 9
T r u c k e r s , p o w e r (o t h e r th a n f o r k l i f t ) ___________ 4 7 8 14 20 46M a n u f a c t u r in g __________________________________ 4 8 8 12 18 51N o n m a n u fa c tu r in g ______________________________ 7 7 9 19 29 30
1 T h e s c o p e o f th e s t u d ie s w a s l im i t e d w i t h in e a c h o f 6 m a j o r in d u s t r y g r o u p in g s to e s t a b l i s h m e n t s w h ic h e m p lo y e d 50 w o r k e r s o r m o r e . In 12 o f th e l a r g e s t a r e a s , th e m in im u m s i z e w a s 100 e m p lo y e e s in m a n u f a c t u r in g ; a n d , w i t h in n o n m a n u f a c t u r in g , in p u b l ic u t i l i t i e s , a n d r e t a i l t r a d e . T h u s , th e s m a l l e s t s i z e g r o u p s h o w n i s l im i t e d b y th e s c o p e .
2 A v e r a g e m o n th o f r e f e r e n c e . D a t a w e r e c o l l e c t e d d u r in g th e p e r io d J u l y 1963 th r o u g h J u n e 1 9 6 4 .3 L e s s th a n 0 .5 p e r c e n t .4 D a t a l im i t e d to m e n w o r k e r s e x c e p t w h e r e o t h e r w is e in d i c a t e d .
N O T E : B e c a u s e o f r o u n d in g , s u m s o f in d iv id u a l i t e m s m a y n o t e q u a l 100 p e r c e n t .
Digitized for FRASER http://fraser.stlouisfed.org/ Federal Reserve Bank of St. Louis

Digitized for FRASER http://fraser.stlouisfed.org/ Federal Reserve Bank of St. Louis
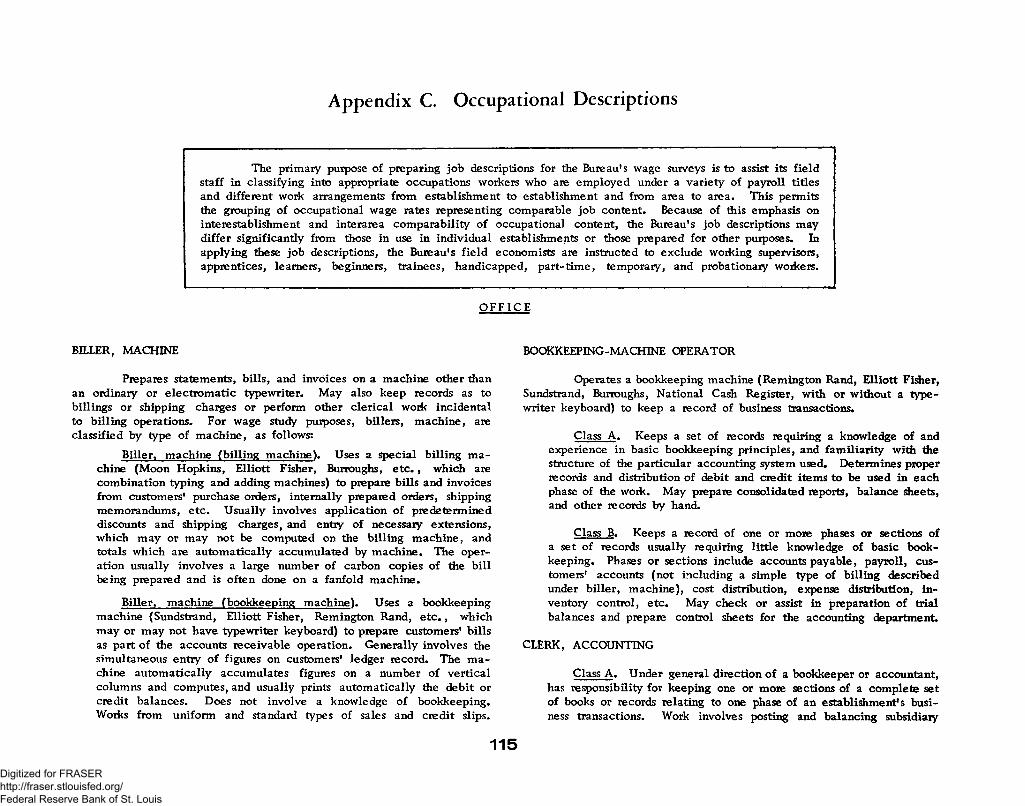
A p p en d ix C. O ccupational D escrip tions
The primary purpose of preparing job descriptions for the Bureau’ s wage surveys is to assist its field staff in classifying into appropriate occupations workers who are employed under a variety of payroll titles and different work arrangements from establishment to establishment and from area to area. This permits the grouping of occupational wage rates representing comparable job content. Because of this emphasis on interestablishment and interarea comparability of occupational content, the Bureau’ s job descriptions may differ significantly from those in use in individual establishments or those prepared for other purposes. In applying these job descriptions, the Bureau's field economists are instructed to exclude working supervisors, apprentices, learners, beginners, trainees, handicapped, part-time, temporary, and probationary workers.
OFFICE
BILLER, MACHINE
Prepares statements, bills, and invoices on a machine other than an ordinary or electromatic typewriter. May also keep records as to billings or shipping charges or perform other clerical work incidental to billing operations. For wage study purposes, billers, machine, are classified by type of machine, as follows:
Biller, machine (billing machine). Uses a special billing machine (Moon Hopkins, Elliott Fisher, Burroughs, e t c . , which are combination typing and adding machines) to prepare bills and invoices from customers' purchase orders, internally prepared orders, shipping memorandums, etc. Usually involves application of predetermined discounts and shipping charges, and entry of necessary extensions, which may or may not be computed on the billing machine, and totals which are automatically accumulated by machine. The operation usually involves a large number of carbon copies of the bill being prepared and is often done on a fanfold machine.
Biller, machine (bookkeeping machine). Uses a bookkeeping machine (Sundstrand, Elliott Fisher, Remington Rand, e t c ., which may or may not have typewriter keyboard) to prepare customers' bills as part of the accounts receivable operation. Generally involves the simultaneous entry of figures on customers' ledger record. The machine automatically accumulates figures on a number of vertical columns and computes, and usually prints automatically the debit or credit balances. Does not involve a knowledge of bookkeeping. Works from uniform and standard types of sales and credit slips.
BOOKKEEPING-MACHINE OPERATOR
Operates a bookkeeping machine (Remington Rand, Elliott Fisher, Sundstrand, Burroughs, National Cash Register, with or without a typewriter keyboard) to keep a record of business transactions.
Class A . Keeps a set of records requiring a knowledge of and experience in basic bookkeeping principles, and familiarity with the structure of the particular accounting system used. Determines proper records and distribution of debit and credit items to be used in each phase of the work. May prepare consolidated reports, balance sheets, and other records by hand.
Class B. Keeps a record of one or more phases or sections of a set of records usually requiring little knowledge of basic bookkeeping. Phases or sections include accounts payable, payroll, customers' accounts (not including a simple type of billing described under biller, machine), cost distribution, expense distribution, inventory control, etc. May check or assist in preparation of trial balances and prepare control sheets for the accounting department.
CLERK, ACCOUNTING
Class A. Under general direction of a bookkeeper or accountant, has responsibility for keeping one or more sections of a complete set of books or records relating to one phase of an establishment's business transactions. Work involves posting and balancing subsidiary
1 1 5
Digitized for FRASER http://fraser.stlouisfed.org/ Federal Reserve Bank of St. Louis

1 1 6
CLERK, ACCOUNTING— Continued
ledger or ledgers such as accounts receivable or accounts payable; examining and coding invoices or vouchers with proper accounting distribution; and requires judgment and experience in making proper assignations and allocations. May assist in preparing, adjusting, and closing journal entries; and may direct class B accounting clerks.
Class B. Under supervision, performs one or more routine accounting operations such as posting simple journal vouchers or accounts payable vouchers, entering vouchers in voucher registers; reconciling bank accounts; and posting subsidiary ledgers controlled by general ledgers, or posting simple cost accounting data. This job does not require a knowledge of accounting and bookkeeping principles but is found in offices in which the more routine accounting work is subdivided on a functional basis among several woikers.
CLERK, FILE
Class A . In an established filing system containing a number of varied subject matter files, classifies and indexes file material such as correspondence, reports, technical documents, etc. May also file this material. May keep records of various types in conjunction with the files. May lead a small group of lower level file cleiks.
Class B. Sorts, codes, and files unclassified material by simple (subject matter) headings or partly classified material by finer subheadings. Prepares simple related index and cross-reference aids. As requested, locates clearly identified material in files and forwards material. May perform related clerical tasks required to maintain and service files.
Class C. Performs routine filing of material that has already been classified or which is easily classified in a simple serial classification system ( e .g . , alphabetical, chronological, or numerical). As requested, locates readily available material in files and forwards material; and may fill out withdrawal charge. Performs simple clerical and manual tasks required to maintain and service files.
CLERK, ORDERReceives customers' orders for material or merchandise by mail,
phone, or personally. Duties involve any combination of the followings Quoting prices to customers; making out an order sheet listing the items
CLERK, ORDER— Continuedto make up the order; checking prices and quantities of items on order sheet; and distributing order sheets to respective departments to be filled. May check with credit department to determine credit rating of customer, acknowledge receipt of orders from customers, followup orders to see that they have been filled, keep file of orders received, and check shipping invoices with original orders.
CLERK, PAYROLLComputes wages of company employees and enters the necessary
data on the payroll sheets. Duties involve: Calculating workers' earningsbased on time or production records; and posting calculated data on payroll sheet, showing information such as worker's name, working days, time, rate, deductions for insurance, and total wages due. May make out pay- checks and assist paymaster in making up and distributing pay envelopes. May use a calculating machine.
COMPTOMETER OPERATORPrimary duty is to operate a Comptometer to perform mathe
matical computations. This job is not to be confused with that of statistical or other type of clerk, which may involve frequent use of a Comptometer but, in which, use of this machine is incidental to performance of other duties.DUPLICATING-MACHINE OPERATOR (MIMEOGRAPH OR DITTO)
Under general supervision and with no supervisory responsibilities, reproduces multiple copies of typewritten or handwritten matter, using a Mimeograph or Ditto machine. Makes necessary adjustment such as for ink and paper feed counter and cylinder speed. Is not required to prepare stencil or Ditto master. May keep file of used stencils or Ditto masters. May sort, collate, and staple completed material.
KEYPUNCH OPERATORClass A . Operates a numerical and/or alphabetical or combina
tion keypunch machine to transcribe data from various source documents to keypunch tabulating cards. Performs same tasks as lower level keypunch operator but, in addition, work requires application of coding skills and the making of some determinations, for example, locates on the source document the items to be punched; extracts information from several documents; and searches for and interprets information on the document to determine information to be punched. May train inexperienced operators.
Digitized for FRASER http://fraser.stlouisfed.org/ Federal Reserve Bank of St. Louis

KEYPUNCH OPERATOR— Continued
Class B. Under close supervision or following specific procedures or instructions, transcribes data from source documents to punched cards. Operates a numerical and/or alphabetical or combination keypunch machine to keypunch tabulating cards. May verify cards. Working from various standardized source documents, follows specified sequences which have been coded or prescribed in detail and require little or no selecting, coding, or interpreting of data to be punched. Problems arising from erroneous items or codes, missing information, etc. , are referred to supervisor.
OFFICE BOY OR GIRLPerforms various routine duties such as running errands, operating
minor'office machines such as sealers or mailers, opening and distributing mail, and other minor clerical woric.
SECRETARYPerforms secretarial and clerical duties for a superior in an ad
ministrative or executive position. Duties include making appointments for superior; receiving people coming into office; answering and making phone calls; handling personal and important or confidential mail, and writing routine correspondence on own initiative; and taking dictation (where transcribing machine is not used) either in shorthand or by Steno- type or similar machine, and transcribing dictation or the recorded information reproduced on a transcribing machine. May prepare special reports or memorandums for information of superior.STENOGRAPHER, GENERAL
Primary duty is to take dictation involving a normal routine vocabulary from one or more persons either in shorthand or by Stenotype or similar machine; and transcribe dictation. May also type from written copy. May maintain files, keep simple records, or perform other relatively routine clerical tasks. May operate from a stenographic pool. Does not include transcribing-machine work. (See transcribing-machine operator.)STENOGRAPHER, SENIOR
Primary duty is to take dictation involving, a varied technical or specialized vocabulary such as in legal briefs or reports on scientific research from one or more persons either in shorthand or by Stenotype or similar machine; and transcribe dictation. May also type from written copy. May also setup and maintain files, keep records, etc.
OR
1 1 7
STENOGRAPHER, SENIOR— Continued
Performs stenographic duties requiring significantly greater independence and responsibility than stenographers, general as evidenced by the following: Woric requires high degree of stenographic speed and accuracy; and a thorough working knowledge of general business and office procedures and of the specific business operations, organization, policies, procedures, files, workflow, etc. Uses this knowledge in performing stenographic duties and responsible clerical tasks such as, maintaining followup files; assembling material for reports, memorandums, letters, e tc .; composing simple letters from general instructions, reading and routing incoming mail; and answering routine questions, etc. Does not include transcribing-machine work.
SWITCHBOARD OPERATOROperates a single- or multiple-position telephone switchboard.
Duties involve handling incoming, outgoing, and intraplant or office calls. May record toll calls and take messages. May give information to persons who call in, or occasionally take telephone orders. For workers who also act as receptionists see switchboard operator-receptionist.
SWITCHBOARD OPERA TOR-RECEPTIONISTIn addition to performing duties of operator on a single position
or monitor-type switchboard, acts as receptionist and may also type or perform routine clerical work as part of regular duties. This typing or clerical work may take the major part of this worker’ s time while at switchboard.
TABULA TING-MACHINE OPERATOR
Class A. Operates a variety of tabulating or electrical accounting machines, typically including such machines as the tabulator, calculator, interpreter, collator, and others. Performs complete reporting assignments without close supervision, and performs difficult wiring as required. The complete reporting and tabulating assignments typically involve a variety of long and complex reports which often are of irregular or nonrecurring type requiring some planning and sequencing of steps to be taken. As a more experienced operator, is typically involved in training new operators in machine operations, or partially trained operators in wiring from diagrams and operating sequences of long and complex reports. Does not include working supervisors performing tabulating-machine operations and day-to-day supervision of the work and production of a group of tabulating-machine operators.
Digitized for FRASER http://fraser.stlouisfed.org/ Federal Reserve Bank of St. Louis

1 1 8
TABULA TING-MACHINE OPERATOR—ContinuedClass B. Operates more difficult tabulating or electrical account
ing machines such as the tabulator and calculator, in addition to the sorter, reproducer, and collator. This work is performed under specific instructions and may include the performance of some wiring from diagrams. The woik typically involves, for example, tabulations involving a repetitive accounting exercise, a complete but small tabulating study, or parts of a longer and more complex report. Such reports and studies are usually of a recurring nature where the procedures are well established. May also include the training of new employees in the basic operation of the machine.
Class C. Operates simple tabulating or electrical accounting machines such as the sorter, reproducing punch, collator, e tc ., with specific instructions. May include simple wiring from diagrams and some filing work. The woik typically involves portions of a work unit, for example, individual sorting or collating runs or repetitive operations.
TRANSCRIBING-MACHINE OPERATOR, GENERAL
Primary duty is to transcribe dictation involving a normal routine vocabulary from transcribing-machine records. May also type from written copy and do simple clerical work. Woikers transcribing dictation involving
PROFESSIONALNURSE, INDUSTRIAL (REGISTERED)
A registered nurse who gives nursing service under general medical direction to ill or injured employees or other persons who become ill or suffer an accident on the premises of a factory or other establishment. Duties involve a combination of the following; Giving first aid to the ill or injured; attending to subsequent dressing of employees1 injuries; keeping records of patients treated; preparing accident reports for compensation or
MAI NTENANCE
TRANSCRIBING-MACHINE OPERATOR, GENERAL---- Continueda varied technical or specialized vocabulary such as legal briefs or reports on scientific research are not included. A wolker who takes dictation in shorthand or by Stenotype or similar machine is classified as a stenographer, general.TYPIST
Uses a typewriter to make copies of various material or to make out bills after calculations have been made by another person. May include typing of stencils, mats, or similar materials for use in duplicating processes. May do clerical woik involving little special training, such as keeping simple records, filing records and reports, or sorting and distributing incoming mail.
Class A . Performs one or more of the following: Typing material in final form when it involves combining material from several sources or responsibility for correct spelling, syllabication, punctuation, e t c ., of technical or unusual words or foreign language material; and planning layout and typing of complicated statistical tables to maintain uniformity and balance in spacing. May type routine form letters varying details to suit circumstances.
Class B. Performs one or more of the following; Copy typing from rough or clear drafts; routine typing of forms, insurance policies, e tc .; and setting up simple standard tabulations, or copying more complex tables already set up and spaced properly.
AND TECHNICALNURSE, INDUSTRIAL (REGISTERED)— Continued
other purposes; assisting in physical examinations and health evaluations of applicants and employees; and planning and carrying out programs involving health education, accident prevention, evaluation of plant environment, or other activities affecting the health, welfare, and safety of all personnel.
AND POWERPLANT
CARPENTER, MAINTENANCEPerforms the carpentry duties necessary to construct and maintain
in good repair building woodwoik and equipment such as bins, cribs, counters, benches, partitions, doors, floors, stairs, casings, and trim made of wood in an establishment. Work involves most of the following: Planning and laying out of work from blueprints, drawings, models, or verbal instructions; using a variety of carpenter's handtools, portable power tools,
CARPENTER, MAINTENANCE— Continued
and standard measuring instruments; making standard shop computations relating to dimensions of work; and selecting materials necessary for the work. In general, the work of the maintenance carpenter requires rounded training and experience usually acquired through a formal apprenticeship or equivalent training and experience.
Digitized for FRASER http://fraser.stlouisfed.org/ Federal Reserve Bank of St. Louis

ELECTRICIAN, MAINTENANCE
Performs a variety of electrical trade functions such as the installation, maintenance, or repair of equipment for the generation, distribution, or utilization of electric energy in an establishment. Work involves most of the followings Installing or repairing any of a variety of electrical equipment such as generators, transformers, switchboards, controllers, circuit breakers, motors, heating units, conduit systems, or other transmission equipment; working from blueprints, drawings, layouts, or other specifications; locating and diagnosing trouble in the electrical system or equipment; working standard computations relating to load requirements of wiring or electrical equipment; and using a variety of electrician’ s handtools and measuring and testing instruments. In general, the work of the maintenance electrician requires rounded training and experience usually acquired through a formal apprenticeship or equivalent training and experience.
ENGINEER, STATIONARY
Operates and maintains and may also supervise the operation of stationary engines and equipment (mechanical or electrical) to supply the establishment in which employed with power, heat, refrigeration, or air-conditioning. Work involves: Operating and maintaining equipmentsuch as steam engines, air compressors, generators, motors, turbines, ventilating and refrigerating equipment, steam boilers and boiler-fed water pumps;, making equipment repairs; and keeping a record of operation of machinery, temperature, and fuel consumption. May also supervise these operations. Head or chief engineers in establishments employing more than one engineer are excluded.
FIREMAN, STATIONARY BOILER
Fires stationary boilers to furnish the establishment in which employed with heat, power, or steam. Feeds fuels to fire by hand or operates a mechanical stoker, or gas or oil burner; and checks water and safety valves. May clean, oil, or assist in repairing boilerroom equipment.
HELPER, MAINTENANCE TRADES
Assists one or more workers in the skilled maintenance trades, by performing specific or general duties of lesser skill, such as keeping
1 1 9
HELPER, MAINTENANCE TRADES— Continued
a worker supplied with materials and tools; cleaning working area, machine, and equipment; assisting journeyman by holding materials or tools; and performing other unskilled tasks as directed by journeyman. The kind of work the helper is permitted to perform varies from trade to trade: In some trades the helper is confined to supplying, lifting, and holding materials and tools and cleaning working areas; and in others he is permitted to perform specialized machine operations, or parts of a trade that are also performed by workers on a full-time basis.
MACHINE-TOOL OPERATOR, TOOLROOM
Specializes in the operation of one or more types of machine tools, such as jig borers, cylindrical or surface grinders, engine lathes, or milling machines, in the construction of machine-shop tools, gages, jigs, fixtures, or dies. Work involves most of the following: Planning and performing difficult machining operations; processing items requiring complicated setups or a high degree of accuracy; using a variety of precision measuring instruments; selecting feeds, speeds, tooling, and operation sequence; and making necessary adjustments during operation to achieve requisite tolerances or dimensions. May be required to recognize when tools need dressing, to dress tools, and to select proper coolants and cutting and lubricating oils. For cross-industry wage study purposes, machine-tool operators, toolroom, in tool and die jobbing shops are excluded from this classification.
MACHINIST, MAINTENANCE
Produces replacement parts and new parts in making repairs of metal parts of mechanical equipment operated in an establishment. Work involves most of the following: Interpreting written instructions and specifications; planning and laying out of work; using a variety of machinist's handtools and precision measuring instruments; setting up and operating standard machine tools; shaping of metal parts to close tolerances; making standard shop computations relating to dimensions of work, tooling, feeds, and speeds of machining; knowledge of the working properties of the common metals; selecting standard materials, parts, and equipment required for his work; and fitting and assembling parts into mechanical equipment. In general, the machinist’ s work normally requires a rounded training in machine-shop practice usually acquired through a formal apprenticeship or equivalent training and experience.
Digitized for FRASER http://fraser.stlouisfed.org/ Federal Reserve Bank of St. Louis

1 2 0
MECHANIC, AUTOMOTIVE (MAINTENANCE)
Repairs automobiles, buses, motortrucks, and tractors of an establishment. Work involves most of the followings Examining automotive equipment to diagnose source of trouble; disassembling equipment and performing repairs that involve the use of such handtools as wrenches, gages, drills, or specialized equipment in disassembling or fitting parts; replacing broken or defective parts from stock; grinding and adjusting valves; reassembling and installing the various assemblies in the vehicle and making necessary adjustments; and alining wheels, adjusting brakes and lights, or tightening body bolts. In general, the work of the automotive mechanic requires rounded training and experience usually acquired through a formal apprenticeship or equivalent training and experience.
MECHANIC, MAINTENANCE
Repairs machinery or mechanical equipment of an establishment. Work involves most of the following: Examining machines and mechanical equipment to diagnose source of trouble; dismantling or partly dismantling machines and performing repairs that mainly involve the use of handtools #in scraping and fitting parts; replacing broken or defective parts with items obtained from stock; ordering the production of a replacement part by a machine shop or sending of the machine to a machine shop for major repairs; preparing written specifications for major repairs or for the production of parts ordered from machine shop; reassembling machines; and making all necessary adjustments for operation. In general, the work of a maintenance mechanic requires rounded training and experience usually acquired through a formal apprenticeship or equivalent training and experience. Excluded from this classification are workers whose primary duties involve setting up or adjusting machines.
MILLWRIGHT
Installs new machines or heavy equipment, and dismantles and installs machines or heavy equipment when changes in the plant layout are required. Work involves most of the following Planning and laying out of the work; interpreting blueprints or other specifications; using a variety of handtools and rigging; making standard shop computations relating to stresses, strength of materials, and centers of gravity; alining and balancing of equipment; selecting standard tools, equipment, and parts to be used; and installing and maintaining in good order power transmission equipment such as drives and speed reducers. In general, the millwright's work normally requires a rounded training and experience in the trade acquired through a formal apprenticeship or equivalent training and experience.
OILER
Lubricates, with oil or grease, the moving parts or wearing surfaces of mechanical equipment of an establishment.
PAINTER, MAINTENANCE
Paints and redecorates walls, woodwork, and fixtures of an establishment. Work involves the following: Knowledge of surface peculiarities and types of paint required for different applications; preparing surface for painting by removing old finish or by placing putty or filler in nail holes and interstices; and applying paint with spray gun or brush. May mix colors, oils, white lead, and other paint ingredients to obtain proper color or consistency. In general, the work of the maintenance painter requires rounded training and experience usually acquired through a formal apprenticeship or equivalent -training and experience.
PIPEFITTER, MAINTENANCE
Installs or repairs water, steam, gas, or other types of pipe and pipefittings in an establishment. Work involves most of the followings Laying out of work and measuring to locate position of pipe from drawings or other written specifications; cutting various sizes of pipe to correct lengths with chisel and hammer or oxyacetylene torch or pipe-cutting machine; threading pipe with stocks and dies; bending pipe by hand-driven or power-driven machines; assembling pipe with couplings and fastening pipe to hangers; making standard shop computations relating to pressures, flow, and size of pipe required; and making standard tests to determine whether finished pipes meet specifications. In general, the work of the maintenance pipefitter requires rounded training and experience usually acquired through a formal apprenticeship or equivalent training and experience. Workers primarily engaged in installing and repairing building sanitation or heating systems are excluded.
PLUMBER, MAINTENANCE
Keeps the plumbing system of an establishment in good order. Work involves: Knowledge of sanitary codes regarding installation of vents and traps in plumbing system; installing or repairing pipes and fixtures; and opening clogged drains with a plunger or plumber*s snake. In general, the work of the maintenance plumber requires rounded training and experience usually acquired through a formal apprenticeship or equivalent training and experience.
Digitized for FRASER http://fraser.stlouisfed.org/ Federal Reserve Bank of St. Louis
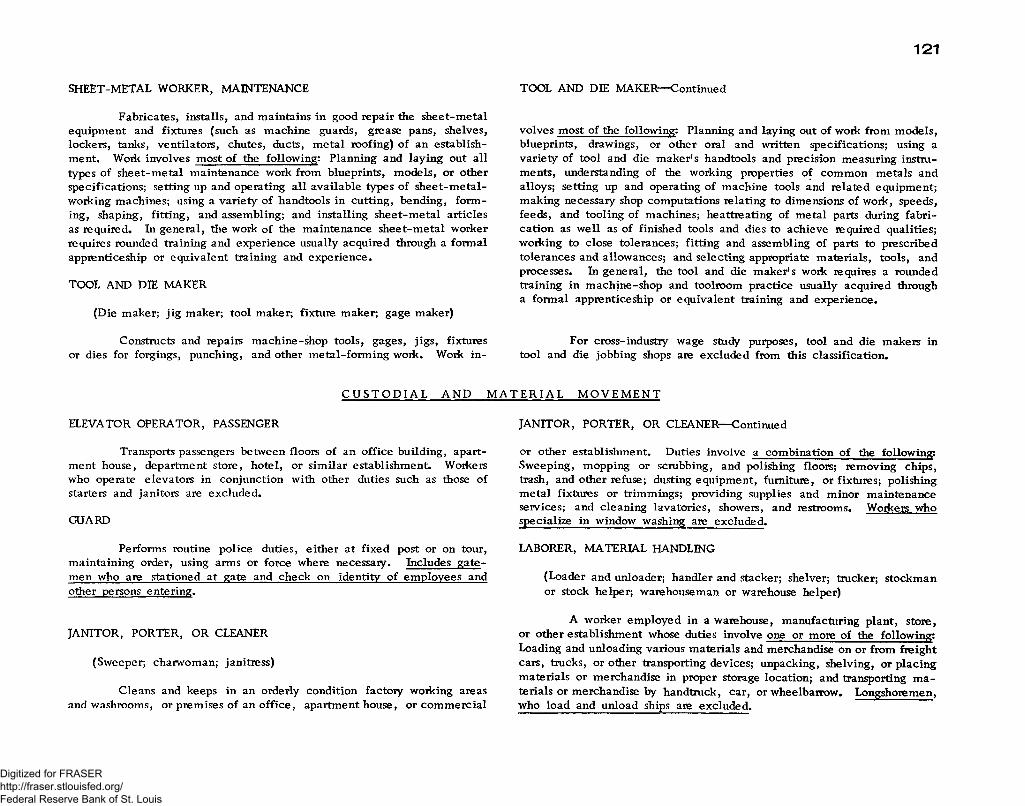
1 2 1
SHEET-METAL WORKER, MAINTENANCE
Fabricates, installs, and maintains in good repair the sheet-metal equipment and fixtures (such as machine guards, grease pans, shelves, lockers, tanks, ventilators, chutes, ducts, metal roofing) of an establishment. Work involves most of the following: Planning and laying out all types of sheet-metal maintenance work from blueprints, models, or other specifications; setting up and operating all available types of sheet-metalworking machines; using a variety of handtools in cutting, bending, forming, shaping, fitting, and assembling; and installing sheet-metal articles as required. In general, the work of the maintenance sheet-metal worker requires rounded training and experience usually acquired through a formal apprenticeship or equivalent training and experience.
TOOL AND DIE MAKER
(Die maker; jig maker; tool maker; fixture maker; gage maker)
Constructs and repairs machine-shop tools, gages, jigs, fixtures or dies for forgings, punching, and other metal-forming work. Work in-
TOOL AND DIE MAKER—Continued
volves most of the following: Planning and laying out of work from models, blueprints, drawings, or other oral and written specifications; using a variety of tool and die maker’ s handtools and precision measuring instruments, understanding of the working properties of common metals and alloys; setting up and operating of machine tools and related equipment; making necessary shop computations relating to dimensions of work, speeds, feeds, and tooling of machines; heattreating of metal parts during fabrication as well as of finished tools and dies to achieve required qualities; working to close tolerances; fitting and assembling of parts to prescribed tolerances and allowances; and selecting appropriate materials, tools, and processes. In general, the tool and die maker's work requires a rounded training in machine-shop and toolroom practice usually acquired through a formal apprenticeship or equivalent training and experience.
For cross-industry wage study purposes, tool and die makers in tool and die jobbing shops are excluded from this classification.
C U S T O D I A L AND M A T E R I A L MOVEMENT
ELEVATOR OPERATOR, PASSENGER
Transports passengers between floors of an office building, apartment house, department store, hotel, or similar establishment. Woikers who operate elevators in conjunction with other duties such as those of starters and janitors are excluded.
GUARD
Performs routine police duties, either at fixed post or on tour, maintaining order, using arms or force where necessary. Includes gate- men who are stationed at gate and check on identity of employees and other persons entering.
JANITOR, PORTER, OR CLEANER
(Sweeper; charwoman; janitress)
Cleans and keeps in an orderly condition factory woiking areas and washrooms, or premises of an office, apartment house, or commercial
JANITOR, PORTER, OR CLEANER— Continued
or other establishment. Duties involve a combination of the following: Sweeping, mopping or scrubbing, and polishing floors; removing chips, trash, and other refuse; dusting equipment, furniture, or fixtures; polishing metal fixtures or trimmings; providing supplies and minor maintenance services; and cleaning lavatories, showers, and restrooms. Workers who specialize in window washing are excluded.
LABORER, MATERIAL HANDLING
(Loader and unloader; handler and stacker; shelver; trucker; stockman or stock helper; warehouseman or warehouse helper)
A worker employed in a warehouse, manufacturing plant, store, or other establishment whose duties involve one or more of the following: Loading and unloading various materials and merchandise on or from freight cars, trucks, or other transporting devices; unpacking, shelving, or placing materials or merchandise in proper storage location; and transporting materials or merchandise by handtruck, car, or wheelbarrow. Longshoremen, who load and unload ships are excluded.
Digitized for FRASER http://fraser.stlouisfed.org/ Federal Reserve Bank of St. Louis

1 2 2
ORDER FILLER
(Order picker; stock selector; warehouse stockman)
Fills shipping or transfer orders for finished goods from stored merchandise in accordance with specifications on sales slips, customers’ orders, or other instructions. May, in addition to filling orders and indicating items filled or omitted, keep records of outgoing orders, requisition additional stock or report short supplies to supervisor, and perform other related duties.
PACKER, SHIPPING
Prepares finished products for shipment or storage by placing them in shipping containers, the specific operations performed being dependent upon the type, size, and number of units to be packed, the type of container employed, and method of shipment. Work requires the placing of items in shipping containers and may involve one or more of the following: Knowledge of various items of stock in order to verify content; selection of appropriate type and size of container; inserting enclosures in container; using excelsior or other material to prevent breakage or damage; closing and sealing container; and applying labels or entering identifying data on container. Packers who also make wooden boxes or crates are excluded.
SHIPPING AND RECEIVING CLERK
Prepares merchandise for shipment, or receives and is responsible for incoming shipments of merchandise or other materials. Shipping work involves: A knowledge of shipping procedures, practices, routes, available means of transportation, and rates; and preparing records of the goods shipped, making up bills of lading, posting weight and shipping charges, and keeping a file of shipping records. May direct or assist in preparing the merchandise for shipment. Receiving work involves: Verifying or directing others in verifying the correctness of shipments against bills of lading, invoices, or other records; checking for shortages and rejecting damaged goods; routing merchandise or materials to proper departments; and maintaining necessary records and files.
For wage study purposes, woikers are classified as follows:
Receiving clerkShipping clerkShipping and receiving cleric
TRUCKDRIVER
Drives a truck within a city or industrial area to transport materials, merchandise, equipment, or men between various types of establishments such as: Manufacturing plants, freight depots, warehouses, wholesale and retail establishments, or between retail establishments and customers' houses or places of business. May also load or unload truck with or without helpers, make minor mechanical repairs, and keep truck in good working order. Driver-salesmen and over-the-road drivers are excluded.
For wage study purposes, truckdrivers are classified by size and type of equipment, as follows: (Tractor-trailer should be rated on the basis of trailer capacity.)
Truckdriver (combination of sizes listed separately) Truckdriver, light (under 1V2 tons)Truckdriver, medium (IV2 to and including 4 tons) Truckdriver, heavy (over 4 tons, trailer type) Truckdriver, heavy (over 4 tons, other than trailer type)
TRUCKER, POWER
Operates a manually controlled gasoline- or electric-powered truck or tractor to transport goods and materials of all kinds about a warehouse, manufacturing plant, or other establishment.
For wage study purposes, woikers are classified by type of truck, as follows:
Trucker, power (forklift)Trucker, power (other than foridift)
WATCHMAN
Makes rounds of premises periodically in protecting property against fire, theft, and illegal entry.
U. S. GOVERNMENT PRINTING OFFICE : 1966 O - 220-617
Digitized for FRASER http://fraser.stlouisfed.org/ Federal Reserve Bank of St. Louis

Order FormTO:
Superintendent of Documents U.S. Government Printing Office Washington, D .C. 20402
Bureau of Labor Statistics—18 Oliver Street, Boston, Mass. 02110341 Ninth Avenue, New York, N. Y. 100011371 Peachtree Street, NE., Atlanta, Ga. 303091365 Ontario Street, Cleveland, Ohio 44114219 South Dearborn Street, Chicago, 111. 60604450 Golden Gate Avenue, San Francisco, Calif. 94102
Enclosed find $ _____ in [ | checkpayable to the Superintendent of Documents, copies or m ore.)
** L 1 i^oney order. Make checks or money orders (Twenty-five percent discount for bundle order of 100
Please send me copies of bulletins a/ indicated.
Data on occupational earnings, and establishment practices and supplementary wage provisions are presented in the following bulletins:
Numberof copies Area and payroll period_____ _ Allentown—Bethlehem—Easton (Feb. 1966)__________ Birmingham (Apr. 1966)_________________Boston (Oct. 1965)_____________________ Chicago (Apr. 1965)___________ —...______ Dayton (Jan. 1966)____________ -______ Denver (Dec. 1965)_______________________ Des Moines (Feb. 1966)_______________ ”______ Indianapolis (Dec. 1965)_______ IIIIHIIHIIIIII______ Jackson (Feb. 1966)__________________ ~~______ Kansas City (Nov. 1965)_________IIIIIIIIIIIII______ Los Angeles—Long Beach (Mar. 1965)_____ II______ Memphis (Jan. 1966)_________________ ”______ Miami (Dec. 1965)____________________ Milwaukee (Apr. 1965)________________ Newark and Jersey City (Feb. 1Q66)~~"______ New Haven (Jan. 1966)________________H______ New York (Apr. 1965)______________ ~--------- Norfolk—Portsmouth and Newport News—
Hampton (June 1965)______________________ _ Omaha (Oct. 1965)_______________~~_____ _ Philadelphia (Nov. 1965)______________ ™______ Portland (Maine), (Nov. 1965)_______IIIIIIIIIII_____ _ Providence-Pawtucket (May 1965)__IIIIII—IIIIII!______ Raleigh (Sept. 1965)____________________ 1- Richmond (Nov. 1965)_______________________ _ San Antonio (June 1965)_____________III—II]------- - San Bernardino—Riverside—Ontario (Sept. 1965)-------- - San Francisco—Oakland (Jan. 1966)_____________ _ San Jose (Sept. 1965)_________________ ~______Scranton (Aug. 1965)_______________________ Seattle—Everett (Oct. 1965~)____ - —._____ _ Sioux Falls (Oct. 1965)_________________ I______ Spokane (June 1965)__________________ H______ Water bury (Mar. 1966)______________ IIIIII______ York (Feb. 1966)____________________ Youngstown-Warren (Nov. 1965) IIIIIIIIIIIIIIIIIIII
Bulletinnumber
1465-531465-561465-121430-721465-391465-331465-481465-311465-441465-271430-571465-421465-301430-581465-501465-371430-80
1430-771465-131465-351465-231430-671465-101465-281430-811465-201465-431465-191465-31465-91465-171430-791465-521465-401465-25
Price
25 cents 20 cents 30 cents 30 cents 25 cents 30 cents 25 cents 30 cents 25 cents 30 cents 30 cents 30 cents 25 cents 25 cents 30 cents 25 cents 40 cents
25 cents 25 cents 35 cents 25 cents 30 cents 25 cents 30 cents 25 cents 30 cents 30 cents 25 cents 25 cents 30 cents 25 cents 25 cents 25 cents 25 cents 25 cents
Digitized for FRASER http://fraser.stlouisfed.org/ Federal Reserve Bank of St. Louis

Data on occupational earnings are presented in the following bulletins:
Num bero f c o p ie s A rea and pa yroll period__________ A kron (June 1965)_________________________ _______________________ A lbany—Schenectady—T roy (A pr. 1965)------------------ ------__________ A lbuquerque (A pr. 1965)------------------------------------------------__________ Atlanta (M ay 1965)-----------------------------------------------------------__________ B a ltim ore (N ov. 1965)-----------------—-------------------------- ------__________ Beaum ont—P ort Arthur (M ay 1965)____________________
B oise C ity (July 1965)----------------------------------------------------__________ B uffalo (D e c . 1965)----------------------------------------------------------__________ B urlington (M ar. 1966)---------------------------------------------------__________ Canton (A p r. 1965)----------------------------------------------------------__________ C h arleston (W. V a .), (A pr. 1965)----------------------------------__________ C harlotte (A p r. 1965)-----------------------------------------------------__________ Chattanooga (Sept. 1965)------------------------------------------------__________ Cincinnati (M ar. 1965)---------------------------------------------------__________ C leveland (Sept. 1965)----------------------------------------------------__________ C olum bus (O ct. 1965)--------------------------------------- ------------__________ D allas (N ov. 1965)------- -------- --------------------------—------------__________ D avenport—R ock Island—M oline (O ct. 1965)________—__________ D etroit (Jan. 1966)________________________________________________ F o rt W orth (N ov. 1965)______-_______________ -— _ —__________ G reen Bay (Aug. 1965)---------------------------------------------------__________ G reen v ille (M ay 1965)----------------------------------------------------__________ Houston (June 1965)----------------------------------- --------------------__________ Ja ck son v ille (Jan. 1966)------------------------------------------------__________ L aw rence—H averhill (June 1965)____________________ —__________ L ittle R ock—North L ittle R ock (Aug. 1965)-----------------__________ L o u isv ille (F eb . 1966)------------------------------- ------— — __________ L ubbock (June 1965)--------------------------------------------------------__________ M an ch ester (Aug. 1965)--------------------------------------------------__________ M inneapolis—St. Paul (Jan. 1966)---------------------------------__________ M uskegon—M uskegon Heights (M ay 1965)---------------------__________ New O rlean s (F eb . 1966)-----------------------------------------------__________ Oklahom a C ity (Aug. 1965)________________________- __________ P atersonr-C liftonr-Passaic (M ay 1965)--------------------------__________ P hoenix (M ar. 1965)-------------------------------------------------------__________ P ittsburgh (Jan. 1966)----------------------------------------------------__________ P ortland (O reg .),(M ay 1965)-------------------------------------------__________ R ock ford (M ay 1965)______________________________________________ St. L ou is (O ct. 1965)------------------------------------------------------__________ Salt Lake C ity (D ec. 1965)_______________________________________ San D iego (N ov. 1965)----------------------------------------------------__________ Savannah (M ay 1965) -___________________________ - __________ South Bend (M ar. 1966)--------------------------------------------------__________ T oledo (F e b . 1966)_______________________________________________ T renton (D e c . 1965)___ -__________________________________________ W ash ington (D .C .), (O ct. 1965)--------------------------------------__________ W aterloo (N ov. 1965)_____________________________________________ W ichita (O ct. 1965)______ _________________________________________ W o rce s te r (June 1965)-..________________________________
O CCU PATIO N AL SUMM ARY BULLETINS:
Bulletinnumber1430-781430-521430-621430-741465-291430-661465-11465-361465-541430-591430-651430-611465-71430-551465-81465-151465-241465-161465-451465-261465-41430-691430-821465-411430-751465-61465-511430-731465-21465-381430-681465-471465-51430-711430-561465-461430-701430-631465-221465-321465-211430-641465-551465-491465-341465-141465-181465-111430-76
25 cents 25 cents 20 cents 25 cents 25 cents 20 cents 20 cents 25 cents 20 cents 20 cents 20 cents 25 cents 20 cents 25 cents 25 cents 25 cents 25 cents 20 cents 25 cents 20 cents 20 cents 20 cents 25 cents 20 cents 20 cents 20 cents 20 cents 20 cents 20 cents 25 cents 20 cents 20 cents 20 cents 25 cents 20 cents 25 cents 25 cents 20 cents 25 cents 20 cents 20 cents 20 cents 25 cents 20 cents 20 cents 25 cents 20 cents 20 cents 25 cents
Price
Number of copies
Bulletin 1430-83. Wages and Related Benefits, Part I: 80 Metropolitan Areas,1964-65 .Presents information on occupational earnings, employer practices, and supplem entary wage benefits for 80 metropolitan areas by industry division and region. Also provides information on labor-management agreement coverage. P rice 60 cents.
________ Bulletin 1469. National Survey of Professional, Administrative, Technical, andC lerica l Pay, February—March 1965.Sixth annual report provides information on nationwide salary levels and distributions in private industry for accountants, auditors, attorneys, chemists, engineers, engineering technicians, draftsmen, tracers , job analysts, directors of personnel, managers of office services, and clerica l employees. Price 45 cents.
Name __AddressCity State Zip Code
Digitized for FRASER http://fraser.stlouisfed.org/ Federal Reserve Bank of St. Louis

Digitized for FRASER http://fraser.stlouisfed.org/ Federal Reserve Bank of St. Louis
Related Documents


