Bloomington Prairie Thunder Consumer Research Report July 8, 2009

Bloomington Prairie Thunder Consumer Research Report July 8, 2009.
Dec 13, 2015
Welcome message from author
This document is posted to help you gain knowledge. Please leave a comment to let me know what you think about it! Share it to your friends and learn new things together.
Transcript

Bloomington Prairie Thunder Consumer Research Report
July 8, 2009

Study Overview
Research Goals: • Measure consumer behavior and attitudes towards the team,
facility and league• Provide Prairie Thunder with a better understanding of their
current fan base• Research can be complex – more questions now
The Research Process:• Surveys handed out at home game in April 2009• 347 usable surveys were collected out of 416 handed out
– 83.4% response rate• Data was tabulated and analyzed using SPSS statistical software

Research Topics• Demographics• Consumers’ level of fan involvement• Top reasons consumers attend games• Factors that influence the consumer’s decision to attend next season• Media outlets used to get information about the team• Whether or not consumers are Season Ticket and/or Thunder Pass holders• Where and when consumers obtained tickets for the game
Key Survey Findings

Key Survey FindingsDemographics
Age%
Indicating18-29 21.9%
30-39 21.2%
40-49 33.9%50-59 15.4%60+ 7.1%
Annual Household Income
%Indicating
Less than $20,000 9.8%
$20,000 - $39,999 15.0%
$40,000 - $59,999 16.0%
$60,000 - $79,999 13.7%
$80,000 - $99,999 14.7%
$100,000 or greater 30.7%
Miles Traveled%
Indicating0-10 68.6%
11-24 15.5%
25-49 9.4%
50-74 2.1%
75-100 1.5%
101+ 2.6%

Key Survey FindingsConsumers’ Level of Fan Involvement
% Indicating (1=weak, 5=strong)
1 13.3%
2 9.2%
3 18.8%
4 23.7%
5 32.7%
% of Respondents Indicating
0 5 10 15 20 25 30 35
1
2
3
4
5
Only 48% were season ticket
holders
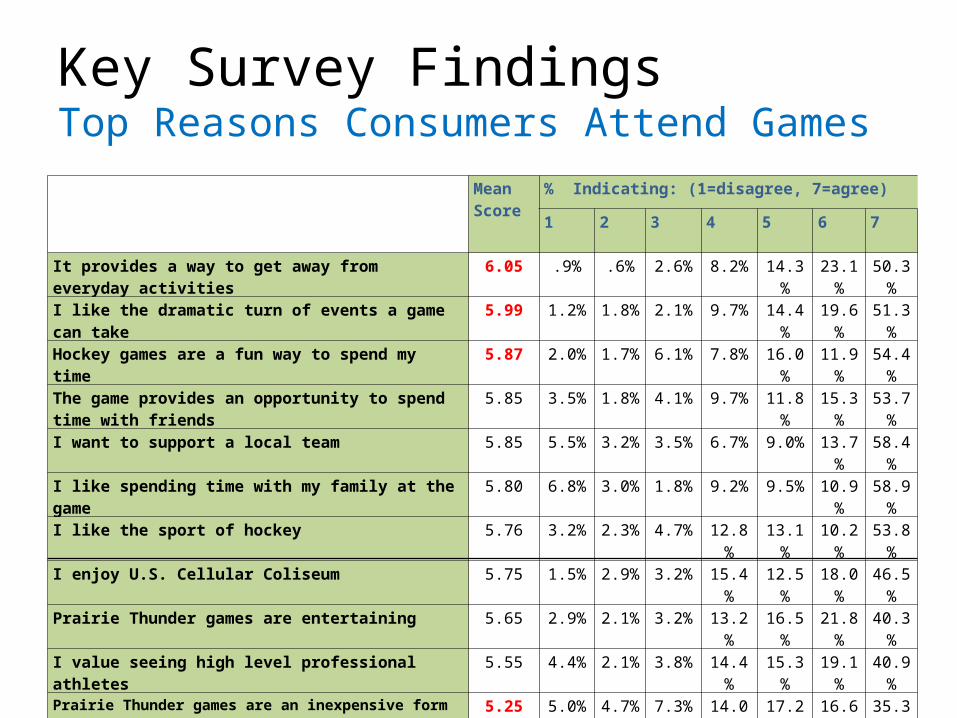
Key Survey FindingsTop Reasons Consumers Attend Games
Mean Score
% Indicating: (1=disagree, 7=agree)
1 2 3 4 5 6 7
It provides a way to get away from everyday activities 6.05 .9% .6% 2.6% 8.2% 14.3% 23.1% 50.3%
I like the dramatic turn of events a game can take 5.99 1.2% 1.8% 2.1% 9.7% 14.4% 19.6% 51.3%
Hockey games are a fun way to spend my time 5.87 2.0% 1.7% 6.1% 7.8% 16.0% 11.9% 54.4%
The game provides an opportunity to spend time with friends 5.85 3.5% 1.8% 4.1% 9.7% 11.8% 15.3% 53.7%
I want to support a local team 5.85 5.5% 3.2% 3.5% 6.7% 9.0% 13.7% 58.4%
I like spending time with my family at the game 5.80 6.8% 3.0% 1.8% 9.2% 9.5% 10.9% 58.9%
I like the sport of hockey 5.76 3.2% 2.3% 4.7% 12.8% 13.1% 10.2% 53.8%
I enjoy U.S. Cellular Coliseum 5.75 1.5% 2.9% 3.2% 15.4% 12.5% 18.0% 46.5%
Prairie Thunder games are entertaining 5.65 2.9% 2.1% 3.2% 13.2% 16.5% 21.8% 40.3%
I value seeing high level professional athletes 5.55 4.4% 2.1% 3.8% 14.4% 15.3% 19.1% 40.9%
Prairie Thunder games are an inexpensive form of entertainment 5.25 5.0% 4.7% 7.3% 14.0% 17.2% 16.6% 35.3%
I’m a fan of one of the teams playing 5.20 14.8% 4.5% 2.7% 10.7% 6.8% 12.5% 48.1%
I’m attending with a group 3.59 47.5% 4.3% 1.6% 4.0% 5.0% 5.9% 31.7%

Key Survey FindingsTop Factors in Influencing Consumer’s Decision to Attend Games Next Season
Mean Score
% Indicating: (1=most important, 10=least important)
1 2 3 4 5 6 7 8 9 10
The team is more competitive 3.30 38.4% 16.5% 8.5% 6.1% 10.4% 7.3% .6% 4.9% 3.0% 4.3%
More affordable concessions 3.62 22.6% 20.1% 17.7% 6.7% 10.4% 5.5% 9.8% 1.2% 4.3% 1.8%
The team offering discounted ticket packages for attending multiple games
4.11 14.6% 20.1% 16.5% 11.0% 10.4% 8.5% 6.1% 3.0% 4.9% 4.9%
The team offering more give-away items at games
4.99 5.5% 11.6% 17.1% 17.7% 11.0% 6.1% 7.3% 12.8% 6.7% 4.3%
Personal contact with players, coaches and team personnel
5.84 6.1% 9.8% 10.4% 9.1% 6.1% 12.2% 10.4% 17.1% 11.0% 7.9%
Better in-game entertainment options 6.05 3.0% 7.3% 8.5% 14.0% 9.8% 14.0% 10.4% 11.0% 7.3% 14.6%
The team becoming more involved in the community
6.30 3.7% 5.5% 5.5% 9.8% 14.6% 12.2% 11.6% 12.8% 14.0% 10.4%
Greater access to info about the team and players
6.63 2.4% 3.0% 8.5% 10.4% 9.8% 6.1% 13.4% 18.3% 18.9% 9.1%
The team hosting more pre-game celebrity appearances
6.64 4.9% 4.3% 3.7% 6.1% 11.6% 15.2% 14.0% 11.0% 12.8% 16.5%
Better parking options 6.74 2.4% 6.7% 6.1% 9.8% 7.9% 8.5% 13.4% 12.2% 11.0% 22.0%

Key Survey FindingsMedia Outlets Used to Get Information About the Team
Mean Score
% Indicating: (1=not at all, 7=quite frequently)
1 2 3 4 5 6 7
Newspaper 4.50 22.7% 4.2% 6.6% 9.6% 11.0% 16.4% 29.6%
Internet/Team website 4.39 26.4% 4.8% 5.8% 8.8% 10.0% 9.1% 35.2%
Word of Mouth 4.25 20.2% 6.6% 7.9% 14.2% 17.5% 10.9% 22.7%
Radio 3.98 26.9% 5.4% 9.4% 14.8% 12.1% 7.9% 23.6%
Pocket schedules and team posters 3.61 33.7% 7.4% 7.7% 13.2% 10.1% 8.9% 19.0%
E-mail 2.48 61.2% 7.1% 4.0% 6.5% 4.6% 4.3% 12.3%
Television 2.43 51.1% 11.1% 10.5% 12.7% 6.2% 2.5% 5.9%
Mail from the Prairie Thunder 1.71 76.6% 8.1% 3.1% 3.1% 3.1% .9% 5.0%
Telephone calls from the Prairie Thunder 1.38 85.8% 4.7% 1.9% 3.8% 2.2% .3% 1.3%
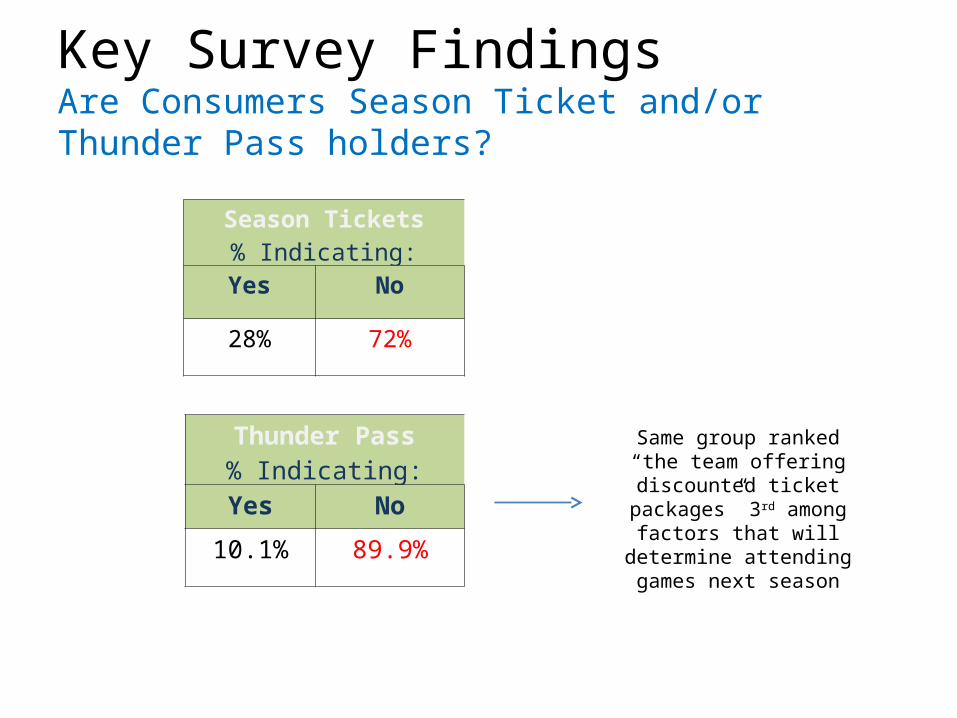
Key Survey FindingsAre Consumers Season Ticket and/or Thunder Pass holders?
Season Tickets% Indicating:
Yes No
28% 72%
Thunder Pass% Indicating:
Yes No
10.1% 89.9%
Same group ranked “the team offering discounted
ticket packages” 3rd among factors that will determine
attending games next season

Key Survey FindingsWhere and When Consumers Obtained Tickets for the Game
Where Consumers Obtained Tickets for the Game
%Indicating
Box office/TicketMaster 28.3%Part of a season ticket 28.9%Bought on-line 2.1%Thunder Pass 2.1%Given a free ticket 28.3%Bought as part of a group outing
8.9%
When Consumers Obtained Tickets for the Game
%Indicating
Tonight 36.0%
Earlier this week 16.7%
Over a week ago 17.0%
Part of a season ticket 30.1%

Conclusions and Recommendations
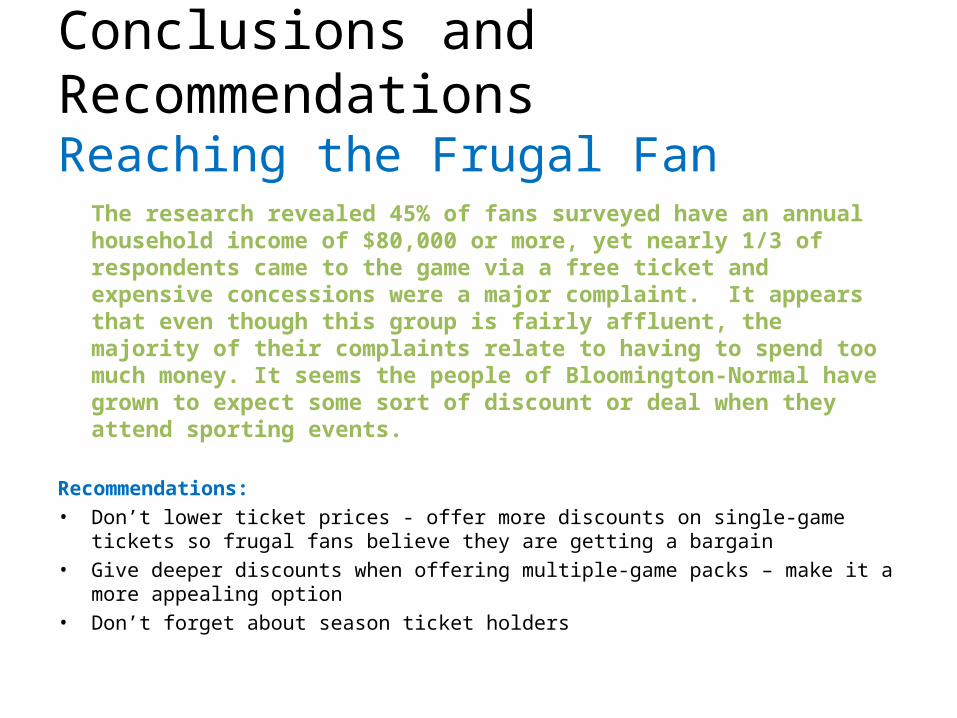
Conclusions and RecommendationsReaching the Frugal Fan
The research revealed 45% of fans surveyed have an annual household income of $80,000 or more, yet nearly 1/3 of respondents came to the game via a free ticket and expensive concessions were a major complaint. It appears that even though this group is fairly affluent, the majority of their complaints relate to having to spend too much money. It seems the people of Bloomington-Normal have grown to expect some sort of discount or deal when they attend sporting events.
Recommendations:• Don’t lower ticket prices - offer more discounts on single-game tickets so frugal fans believe
they are getting a bargain• Give deeper discounts when offering multiple-game packs – make it a more appealing option• Don’t forget about season ticket holders
Conclusions and RecommendationsImproving Customer Database & Communication
The research revealed a high number of consumers utilizing the team website and the Internet as a way to get information about the Prairie Thunder, yet a significantly lower number of consumers were utilizing E-mail. Even fewer respondents said phone calls were how they got their information. The lack of E-mail and phone communication with fans could explain why fans aren’t taking the next step and purchasing season tickets or multiple game packs.
Recommendations:• Team has to capture contact information from fans as they enter and leave• If fans are already online, why not utilize E-mail? • Reconsider how advertising dollars are spent• Once you obtain fan info, maintain contact and build relationships

Conclusions and RecommendationsIncreasing Online Ticket Sales
The research revealed only 2.1% of fans purchased their ticket online. This is extremely low in today’s Internet-savvy society, especially when compared to other sports organizations. The research also revealed a high number of fans waiting to purchase tickets until the night of the game. If the team can increase ticket sales online, more tickets are likely to sell ahead of time.
Recommendations:• Focus advertising efforts on quickness and ease of purchasing online• Utilize E-mail addresses to send out reminders to purchase online
– Create a sense of urgency so fan feels compelled to buy early
Conclusions and RecommendationsPotential Target Market: Young Professionals and Families 25-39
The research revealed over 56% of fans in attendance were age 40 or over and a significantly lower % were 18-39, a large portion of the Bloomington-Normal population. The research also revealed a low number of children per household as well. A 2005 census revealed 32,317 adults residing in Bloomington-Normal are 25-39. It appears the team is missing out on a large portion of the population that could turn into valuable, long term fans.
Recommendations:• Target the 25-39 age group that includes young professionals and families• This group has an expendable income, are settled in the community and many have children • Don’t put too much energy into marketing to the 18-24 college student
– Not willing to spend $$ on season tickets, concessions, beer– Other entertainment options– Temporary Bloomington-Normal residents

Conclusions and RecommendationsMoving Fans up the Frequency Escalator and Attracting the Non-Hockey Fan
The research revealed the team currently has a large number of fans that consider themselves “strong” hockey fans, however a small percentage of them have actually purchased season tickets or multiple game packs. Having a large number of fans that are “strong” hockey fans is great, yet it reveals the absence of the non-hockey fan.
Recommendations:• In order to get the “strong” hockey fans to purchase season tickets or multiple game packs,
the team needs to approach them directly. More sales calls should be made to this group once customer data is gathered at games.
• The team needs to look beyond the “strong” hockey fan and also attract the non-hockey fan. This will expand the overall fan base and increase overall ticket sales.

Conclusions and RecommendationsMaking Concessions Prices More Appealing
The research revealed an overwhelmingly high percentage of respondents who had complaints about concessions prices being too high. Although the team doesn’t control the pricing, there is a poor reflection onto the team due to this issue. If a change isn’t made, this could eventually have a negative impact on ticket sales.
Recommendations:• If lowering prices isn’t an option, offer an option for vouchers or coupons for concessions
with season ticket packages/multiple game packs• This allows fans to get concession vouchers at a discounted price up front and keeps them
from handing over cash during the season

Questions or Comments?
Related Documents


