April 2016 Market Commentary 02 Commodity Performance BCOM 08 Roll Select 09 Historical 10 Contribution to Return & Weights 11 Commodity Volatility Realized 12 Implied 13 Historical Realized 14 Commodity Correlation Composites 15 Singles 16 US CPI Indices 17 Country CPI 18 Country GDP 19 Commitment of Traders Report Monthly Notional Change & Correlation 20 Historical Net Positions 21 Commodity Inventories & Sales Monthly Change & Correlation 23 Historical Levels 24 Commodity ETP Flows 26 Term Structures 27 Research Dashboards (BI) 29 Bloomberg Cheat Sheet 30 Contact us: <Help> <Help> on the Bloomberg Professional service 1-212-617-5020 [email protected] TABLES & CHARTS (BCOM) BLOOMBERG COMMODITY INDEX

Welcome message from author
This document is posted to help you gain knowledge. Please leave a comment to let me know what you think about it! Share it to your friends and learn new things together.
Transcript
April 2016Market Commentary 02Commodity Performance BCOM 08 Roll Select 09 Historical 10Contribution to Return & Weights 11Commodity Volatility Realized 12 Implied 13 Historical Realized 14Commodity Correlation Composites 15 Singles 16 US CPI Indices 17 Country CPI 18 Country GDP 19Commitment of Traders Report Monthly Notional Change & Correlation 20 Historical Net Positions 21Commodity Inventories & Sales Monthly Change & Correlation 23 Historical Levels 24Commodity ETP Flows 26Term Structures 27Research Dashboards (BI) 29Bloomberg Cheat Sheet 30
Contact us:<Help> <Help> on the Bloomberg Professional [email protected]
TABLES & CHARTS(BCOM)BLOOMBERG COMMODITY INDEX
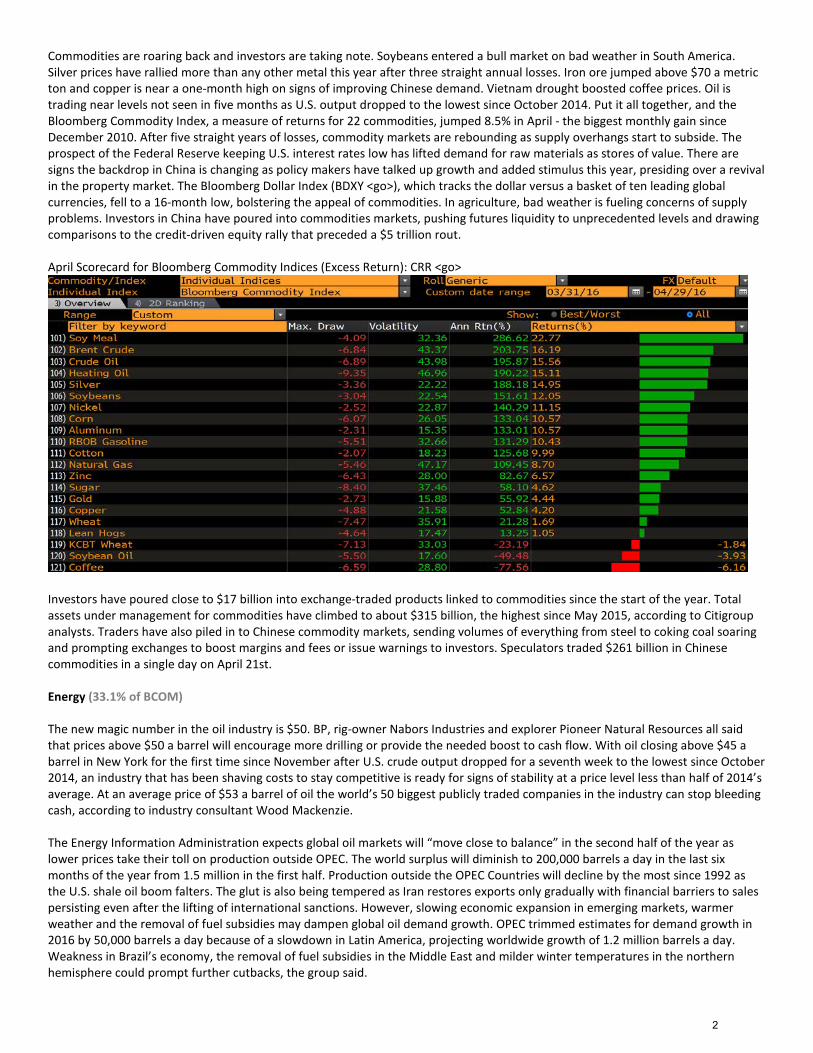
Commodities are roaring back and investors are taking note. Soybeans entered a bull market on bad weather in South America. Silver prices have rallied more than any other metal this year after three straight annual losses. Iron ore jumped above $70 a metric ton and copper is near a one-month high on signs of improving Chinese demand. Vietnam drought boosted coffee prices. Oil is trading near levels not seen in five months as U.S. output dropped to the lowest since October 2014. Put it all together, and the Bloomberg Commodity Index, a measure of returns for 22 commodities, jumped 8.5% in April - the biggest monthly gain since December 2010. After five straight years of losses, commodity markets are rebounding as supply overhangs start to subside. The prospect of the Federal Reserve keeping U.S. interest rates low has lifted demand for raw materials as stores of value. There are signs the backdrop in China is changing as policy makers have talked up growth and added stimulus this year, presiding over a revival in the property market. The Bloomberg Dollar Index (BDXY <go>), which tracks the dollar versus a basket of ten leading global currencies, fell to a 16-month low, bolstering the appeal of commodities. In agriculture, bad weather is fueling concerns of supply problems. Investors in China have poured into commodities markets, pushing futures liquidity to unprecedented levels and drawing comparisons to the credit-driven equity rally that preceded a $5 trillion rout.
April Scorecard for Bloomberg Commodity Indices (Excess Return): CRR <go>
Investors have poured close to $17 billion into exchange-traded products linked to commodities since the start of the year. Total assets under management for commodities have climbed to about $315 billion, the highest since May 2015, according to Citigroup analysts. Traders have also piled in to Chinese commodity markets, sending volumes of everything from steel to coking coal soaring and prompting exchanges to boost margins and fees or issue warnings to investors. Speculators traded $261 billion in Chinese commodities in a single day on April 21st.
Energy (33.1% of BCOM)
The new magic number in the oil industry is $50. BP, rig-owner Nabors Industries and explorer Pioneer Natural Resources all said that prices above $50 a barrel will encourage more drilling or provide the needed boost to cash flow. With oil closing above $45 a barrel in New York for the first time since November after U.S. crude output dropped for a seventh week to the lowest since October 2014, an industry that has been shaving costs to stay competitive is ready for signs of stability at a price level less than half of 2014’s average. At an average price of $53 a barrel of oil the world’s 50 biggest publicly traded companies in the industry can stop bleeding cash, according to industry consultant Wood Mackenzie.
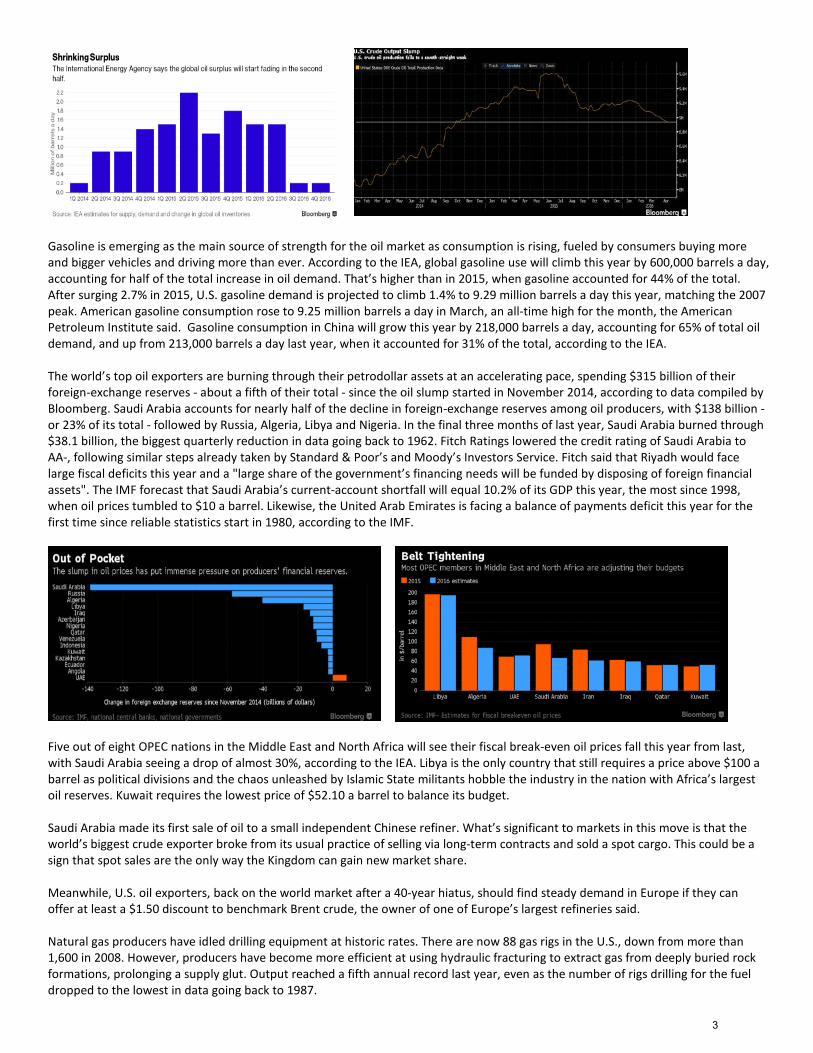
The Energy Information Administration expects global oil markets will “move close to balance” in the second half of the year as lower prices take their toll on production outside OPEC. The world surplus will diminish to 200,000 barrels a day in the last six months of the year from 1.5 million in the first half. Production outside the OPEC Countries will decline by the most since 1992 as the U.S. shale oil boom falters. The glut is also being tempered as Iran restores exports only gradually with financial barriers to sales persisting even after the lifting of international sanctions. However, slowing economic expansion in emerging markets, warmer weather and the removal of fuel subsidies may dampen global oil demand growth. OPEC trimmed estimates for demand growth in 2016 by 50,000 barrels a day because of a slowdown in Latin America, projecting worldwide growth of 1.2 million barrels a day. Weakness in Brazil’s economy, the removal of fuel subsidies in the Middle East and milder winter temperatures in the northern hemisphere could prompt further cutbacks, the group said.
2
Gasoline is emerging as the main source of strength for the oil market as consumption is rising, fueled by consumers buying more and bigger vehicles and driving more than ever. According to the IEA, global gasoline use will climb this year by 600,000 barrels a day, accounting for half of the total increase in oil demand. That’s higher than in 2015, when gasoline accounted for 44% of the total. After surging 2.7% in 2015, U.S. gasoline demand is projected to climb 1.4% to 9.29 million barrels a day this year, matching the 2007 peak. American gasoline consumption rose to 9.25 million barrels a day in March, an all-time high for the month, the American Petroleum Institute said. Gasoline consumption in China will grow this year by 218,000 barrels a day, accounting for 65% of total oil demand, and up from 213,000 barrels a day last year, when it accounted for 31% of the total, according to the IEA.
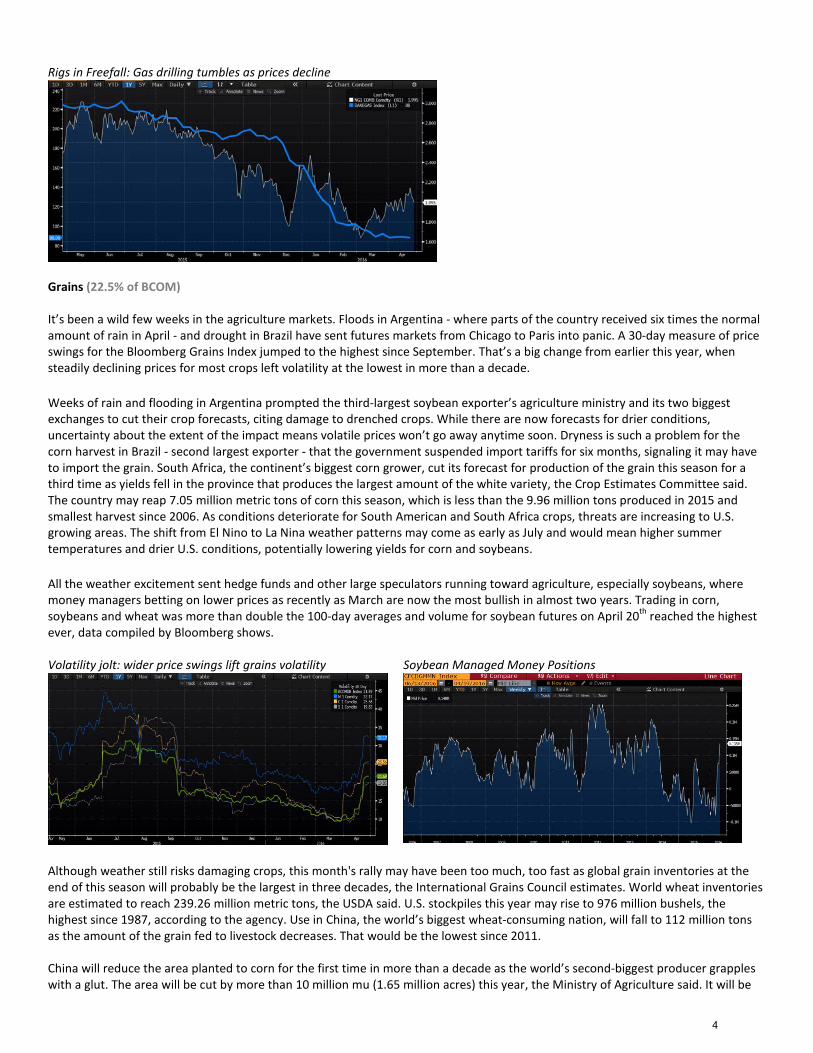
The world’s top oil exporters are burning through their petrodollar assets at an accelerating pace, spending $315 billion of their foreign-exchange reserves - about a fifth of their total - since the oil slump started in November 2014, according to data compiled by Bloomberg. Saudi Arabia accounts for nearly half of the decline in foreign-exchange reserves among oil producers, with $138 billion - or 23% of its total - followed by Russia, Algeria, Libya and Nigeria. In the final three months of last year, Saudi Arabia burned through $38.1 billion, the biggest quarterly reduction in data going back to 1962. Fitch Ratings lowered the credit rating of Saudi Arabia to AA-, following similar steps already taken by Standard & Poor’s and Moody’s Investors Service. Fitch said that Riyadh would face large fiscal deficits this year and a "large share of the government’s financing needs will be funded by disposing of foreign financial assets". The IMF forecast that Saudi Arabia’s current-account shortfall will equal 10.2% of its GDP this year, the most since 1998, when oil prices tumbled to $10 a barrel. Likewise, the United Arab Emirates is facing a balance of payments deficit this year for the first time since reliable statistics start in 1980, according to the IMF.
Five out of eight OPEC nations in the Middle East and North Africa will see their fiscal break-even oil prices fall this year from last, with Saudi Arabia seeing a drop of almost 30%, according to the IEA. Libya is the only country that still requires a price above $100 a barrel as political divisions and the chaos unleashed by Islamic State militants hobble the industry in the nation with Africa’s largest oil reserves. Kuwait requires the lowest price of $52.10 a barrel to balance its budget.
Saudi Arabia made its first sale of oil to a small independent Chinese refiner. What’s significant to markets in this move is that the world’s biggest crude exporter broke from its usual practice of selling via long-term contracts and sold a spot cargo. This could be a sign that spot sales are the only way the Kingdom can gain new market share.
Meanwhile, U.S. oil exporters, back on the world market after a 40-year hiatus, should find steady demand in Europe if they can offer at least a $1.50 discount to benchmark Brent crude, the owner of one of Europe’s largest refineries said.
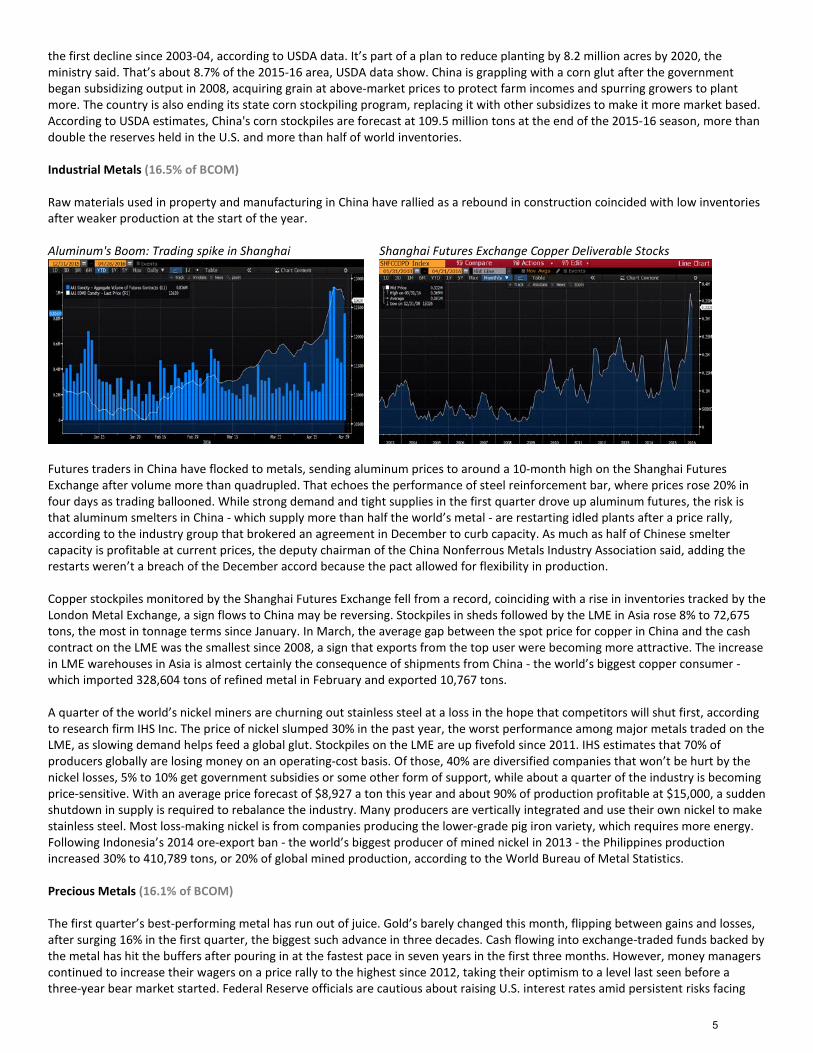
Natural gas producers have idled drilling equipment at historic rates. There are now 88 gas rigs in the U.S., down from more than 1,600 in 2008. However, producers have become more efficient at using hydraulic fracturing to extract gas from deeply buried rock formations, prolonging a supply glut. Output reached a fifth annual record last year, even as the number of rigs drilling for the fuel dropped to the lowest in data going back to 1987.
3
Rigs in Freefall: Gas drilling tumbles as prices decline
Grains (22.5% of BCOM)
It’s been a wild few weeks in the agriculture markets. Floods in Argentina - where parts of the country received six times the normal amount of rain in April - and drought in Brazil have sent futures markets from Chicago to Paris into panic. A 30-day measure of price swings for the Bloomberg Grains Index jumped to the highest since September. That’s a big change from earlier this year, when steadily declining prices for most crops left volatility at the lowest in more than a decade.
Weeks of rain and flooding in Argentina prompted the third-largest soybean exporter’s agriculture ministry and its two biggest exchanges to cut their crop forecasts, citing damage to drenched crops. While there are now forecasts for drier conditions, uncertainty about the extent of the impact means volatile prices won’t go away anytime soon. Dryness is such a problem for the corn harvest in Brazil - second largest exporter - that the government suspended import tariffs for six months, signaling it may have to import the grain. South Africa, the continent’s biggest corn grower, cut its forecast for production of the grain this season for a third time as yields fell in the province that produces the largest amount of the white variety, the Crop Estimates Committee said. The country may reap 7.05 million metric tons of corn this season, which is less than the 9.96 million tons produced in 2015 and smallest harvest since 2006. As conditions deteriorate for South American and South Africa crops, threats are increasing to U.S. growing areas. The shift from El Nino to La Nina weather patterns may come as early as July and would mean higher summer temperatures and drier U.S. conditions, potentially lowering yields for corn and soybeans.
All the weather excitement sent hedge funds and other large speculators running toward agriculture, especially soybeans, where money managers betting on lower prices as recently as March are now the most bullish in almost two years. Trading in corn, soybeans and wheat was more than double the 100-day averages and volume for soybean futures on April 20th reached the highest ever, data compiled by Bloomberg shows.
Volatility jolt: wider price swings lift grains volatility Soybean Managed Money Positions
Although weather still risks damaging crops, this month's rally may have been too much, too fast as global grain inventories at the end of this season will probably be the largest in three decades, the International Grains Council estimates. World wheat inventories are estimated to reach 239.26 million metric tons, the USDA said. U.S. stockpiles this year may rise to 976 million bushels, the highest since 1987, according to the agency. Use in China, the world’s biggest wheat-consuming nation, will fall to 112 million tons as the amount of the grain fed to livestock decreases. That would be the lowest since 2011.
China will reduce the area planted to corn for the first time in more than a decade as the world’s second-biggest producer grapples with a glut. The area will be cut by more than 10 million mu (1.65 million acres) this year, the Ministry of Agriculture said. It will be
4
the first decline since 2003-04, according to USDA data. It’s part of a plan to reduce planting by 8.2 million acres by 2020, the ministry said. That’s about 8.7% of the 2015-16 area, USDA data show. China is grappling with a corn glut after the government began subsidizing output in 2008, acquiring grain at above-market prices to protect farm incomes and spurring growers to plant more. The country is also ending its state corn stockpiling program, replacing it with other subsidizes to make it more market based. According to USDA estimates, China's corn stockpiles are forecast at 109.5 million tons at the end of the 2015-16 season, more than double the reserves held in the U.S. and more than half of world inventories.
Industrial Metals (16.5% of BCOM)
Raw materials used in property and manufacturing in China have rallied as a rebound in construction coincided with low inventories after weaker production at the start of the year.
Aluminum's Boom: Trading spike in Shanghai Shanghai Futures Exchange Copper Deliverable Stocks
Futures traders in China have flocked to metals, sending aluminum prices to around a 10-month high on the Shanghai Futures Exchange after volume more than quadrupled. That echoes the performance of steel reinforcement bar, where prices rose 20% in four days as trading ballooned. While strong demand and tight supplies in the first quarter drove up aluminum futures, the risk is that aluminum smelters in China - which supply more than half the world’s metal - are restarting idled plants after a price rally, according to the industry group that brokered an agreement in December to curb capacity. As much as half of Chinese smelter capacity is profitable at current prices, the deputy chairman of the China Nonferrous Metals Industry Association said, adding the restarts weren’t a breach of the December accord because the pact allowed for flexibility in production.
Copper stockpiles monitored by the Shanghai Futures Exchange fell from a record, coinciding with a rise in inventories tracked by the London Metal Exchange, a sign flows to China may be reversing. Stockpiles in sheds followed by the LME in Asia rose 8% to 72,675 tons, the most in tonnage terms since January. In March, the average gap between the spot price for copper in China and the cash contract on the LME was the smallest since 2008, a sign that exports from the top user were becoming more attractive. The increase in LME warehouses in Asia is almost certainly the consequence of shipments from China - the world’s biggest copper consumer - which imported 328,604 tons of refined metal in February and exported 10,767 tons.
A quarter of the world’s nickel miners are churning out stainless steel at a loss in the hope that competitors will shut first, according to research firm IHS Inc. The price of nickel slumped 30% in the past year, the worst performance among major metals traded on the LME, as slowing demand helps feed a global glut. Stockpiles on the LME are up fivefold since 2011. IHS estimates that 70% of producers globally are losing money on an operating-cost basis. Of those, 40% are diversified companies that won’t be hurt by the nickel losses, 5% to 10% get government subsidies or some other form of support, while about a quarter of the industry is becoming price-sensitive. With an average price forecast of $8,927 a ton this year and about 90% of production profitable at $15,000, a sudden shutdown in supply is required to rebalance the industry. Many producers are vertically integrated and use their own nickel to make stainless steel. Most loss-making nickel is from companies producing the lower-grade pig iron variety, which requires more energy. Following Indonesia’s 2014 ore-export ban - the world’s biggest producer of mined nickel in 2013 - the Philippines production increased 30% to 410,789 tons, or 20% of global mined production, according to the World Bureau of Metal Statistics.
Precious Metals (16.1% of BCOM)
The first quarter’s best-performing metal has run out of juice. Gold’s barely changed this month, flipping between gains and losses, after surging 16% in the first quarter, the biggest such advance in three decades. Cash flowing into exchange-traded funds backed by the metal has hit the buffers after pouring in at the fastest pace in seven years in the first three months. However, money managers continued to increase their wagers on a price rally to the highest since 2012, taking their optimism to a level last seen before a three-year bear market started. Federal Reserve officials are cautious about raising U.S. interest rates amid persistent risks facing
5
the global outlook. Traders have cut the chance of a U.S. interest-rate increase by December down to about 50% compared with 92% at the start of the year. Investors are snapping up bullion as the shaky economy picture spurs haven demand, while low borrowing costs keep the metal competitive against interest-bearing assets. Gold holdings have almost doubled from two months ago, even as the rally stalled since mid-March.
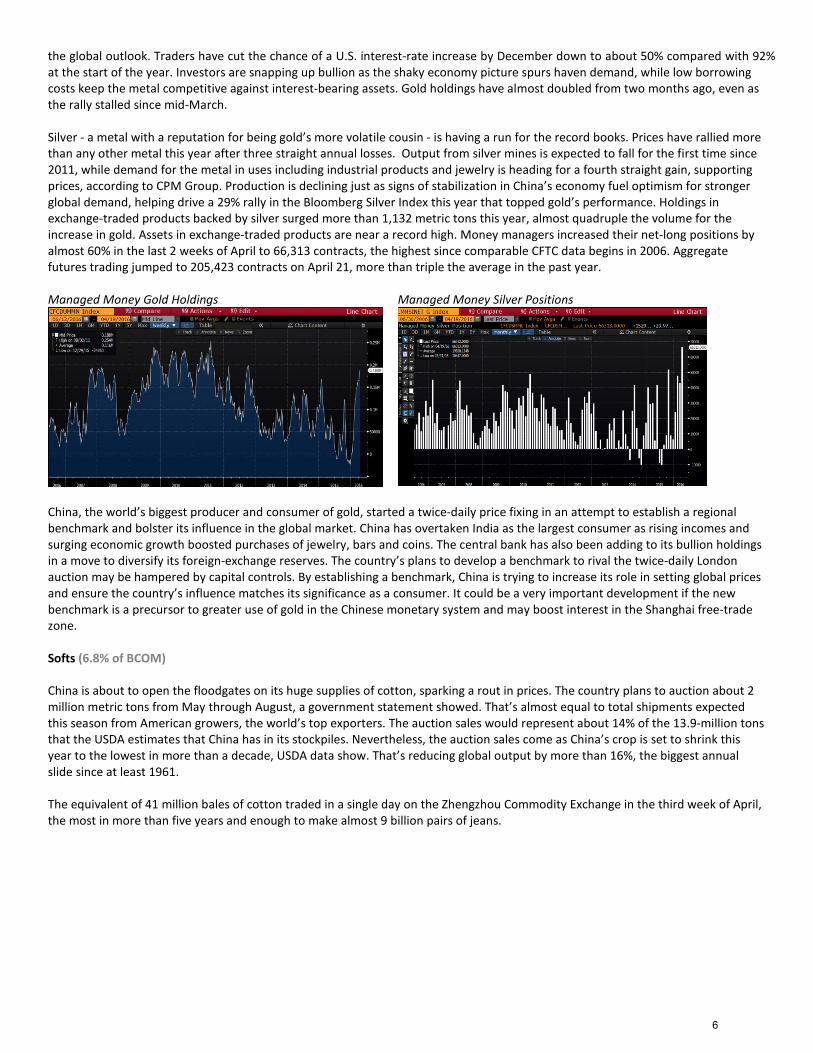
Silver - a metal with a reputation for being gold’s more volatile cousin - is having a run for the record books. Prices have rallied more than any other metal this year after three straight annual losses. Output from silver mines is expected to fall for the first time since 2011, while demand for the metal in uses including industrial products and jewelry is heading for a fourth straight gain, supporting prices, according to CPM Group. Production is declining just as signs of stabilization in China’s economy fuel optimism for stronger global demand, helping drive a 29% rally in the Bloomberg Silver Index this year that topped gold’s performance. Holdings in exchange-traded products backed by silver surged more than 1,132 metric tons this year, almost quadruple the volume for the increase in gold. Assets in exchange-traded products are near a record high. Money managers increased their net-long positions by almost 60% in the last 2 weeks of April to 66,313 contracts, the highest since comparable CFTC data begins in 2006. Aggregate futures trading jumped to 205,423 contracts on April 21, more than triple the average in the past year.
Managed Money Gold Holdings Managed Money Silver Positions
China, the world’s biggest producer and consumer of gold, started a twice-daily price fixing in an attempt to establish a regional benchmark and bolster its influence in the global market. China has overtaken India as the largest consumer as rising incomes and surging economic growth boosted purchases of jewelry, bars and coins. The central bank has also been adding to its bullion holdings in a move to diversify its foreign-exchange reserves. The country’s plans to develop a benchmark to rival the twice-daily London auction may be hampered by capital controls. By establishing a benchmark, China is trying to increase its role in setting global prices and ensure the country’s influence matches its significance as a consumer. It could be a very important development if the new benchmark is a precursor to greater use of gold in the Chinese monetary system and may boost interest in the Shanghai free-trade zone.
Softs (6.8% of BCOM)
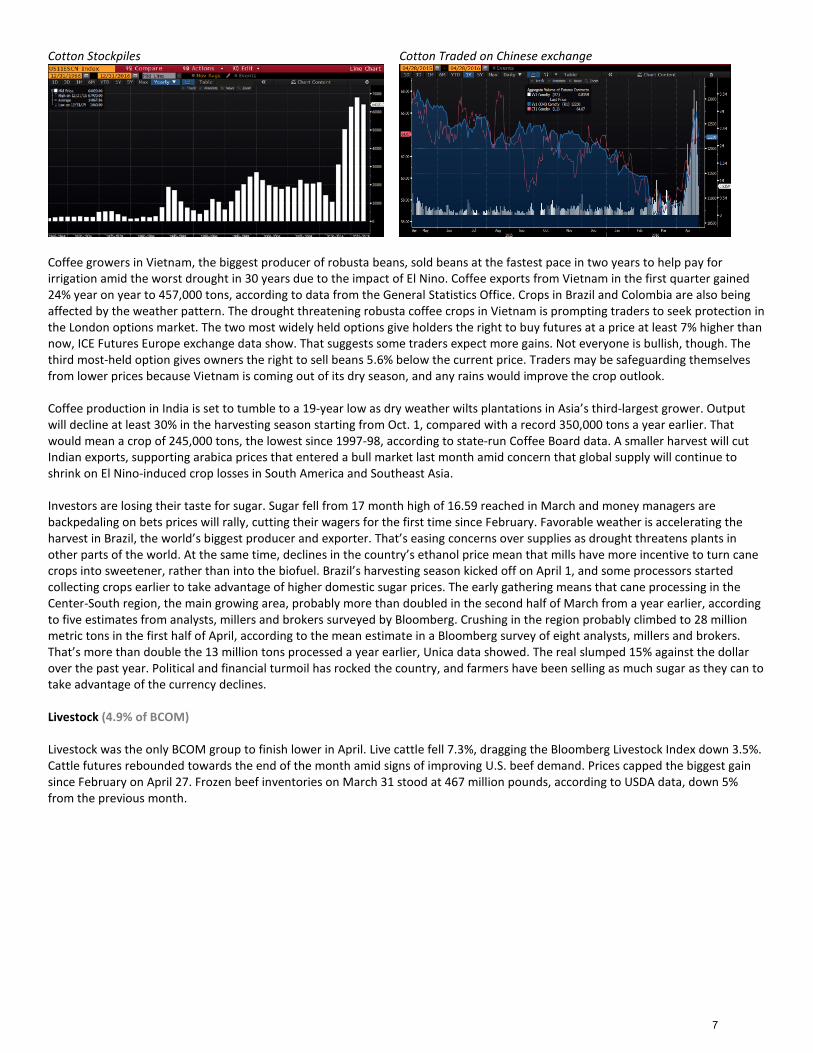
China is about to open the floodgates on its huge supplies of cotton, sparking a rout in prices. The country plans to auction about 2 million metric tons from May through August, a government statement showed. That’s almost equal to total shipments expected this season from American growers, the world’s top exporters. The auction sales would represent about 14% of the 13.9-million tons that the USDA estimates that China has in its stockpiles. Nevertheless, the auction sales come as China’s crop is set to shrink this year to the lowest in more than a decade, USDA data show. That’s reducing global output by more than 16%, the biggest annual slide since at least 1961.
The equivalent of 41 million bales of cotton traded in a single day on the Zhengzhou Commodity Exchange in the third week of April, the most in more than five years and enough to make almost 9 billion pairs of jeans.
6
Cotton Stockpiles Cotton Traded on Chinese exchange
Coffee growers in Vietnam, the biggest producer of robusta beans, sold beans at the fastest pace in two years to help pay for irrigation amid the worst drought in 30 years due to the impact of El Nino. Coffee exports from Vietnam in the first quarter gained 24% year on year to 457,000 tons, according to data from the General Statistics Office. Crops in Brazil and Colombia are also being affected by the weather pattern. The drought threatening robusta coffee crops in Vietnam is prompting traders to seek protection in the London options market. The two most widely held options give holders the right to buy futures at a price at least 7% higher than now, ICE Futures Europe exchange data show. That suggests some traders expect more gains. Not everyone is bullish, though. The third most-held option gives owners the right to sell beans 5.6% below the current price. Traders may be safeguarding themselves from lower prices because Vietnam is coming out of its dry season, and any rains would improve the crop outlook.
Coffee production in India is set to tumble to a 19-year low as dry weather wilts plantations in Asia’s third-largest grower. Output will decline at least 30% in the harvesting season starting from Oct. 1, compared with a record 350,000 tons a year earlier. That would mean a crop of 245,000 tons, the lowest since 1997-98, according to state-run Coffee Board data. A smaller harvest will cut Indian exports, supporting arabica prices that entered a bull market last month amid concern that global supply will continue to shrink on El Nino-induced crop losses in South America and Southeast Asia.
Investors are losing their taste for sugar. Sugar fell from 17 month high of 16.59 reached in March and money managers are backpedaling on bets prices will rally, cutting their wagers for the first time since February. Favorable weather is accelerating the harvest in Brazil, the world’s biggest producer and exporter. That’s easing concerns over supplies as drought threatens plants in other parts of the world. At the same time, declines in the country’s ethanol price mean that mills have more incentive to turn cane crops into sweetener, rather than into the biofuel. Brazil’s harvesting season kicked off on April 1, and some processors started collecting crops earlier to take advantage of higher domestic sugar prices. The early gathering means that cane processing in the Center-South region, the main growing area, probably more than doubled in the second half of March from a year earlier, according to five estimates from analysts, millers and brokers surveyed by Bloomberg. Crushing in the region probably climbed to 28 million metric tons in the first half of April, according to the mean estimate in a Bloomberg survey of eight analysts, millers and brokers. That’s more than double the 13 million tons processed a year earlier, Unica data showed. The real slumped 15% against the dollar over the past year. Political and financial turmoil has rocked the country, and farmers have been selling as much sugar as they can to take advantage of the currency declines.
Livestock (4.9% of BCOM)
Livestock was the only BCOM group to finish lower in April. Live cattle fell 7.3%, dragging the Bloomberg Livestock Index down 3.5%. Cattle futures rebounded towards the end of the month amid signs of improving U.S. beef demand. Prices capped the biggest gain since February on April 27. Frozen beef inventories on March 31 stood at 467 million pounds, according to USDA data, down 5% from the previous month.
7
Composite Indices* Click hyperlinks to open in Bloomberg
2015Apr Mar Q1 Q4 YTD 1-Year 3-Year 5-Year 10-Year 20-Year
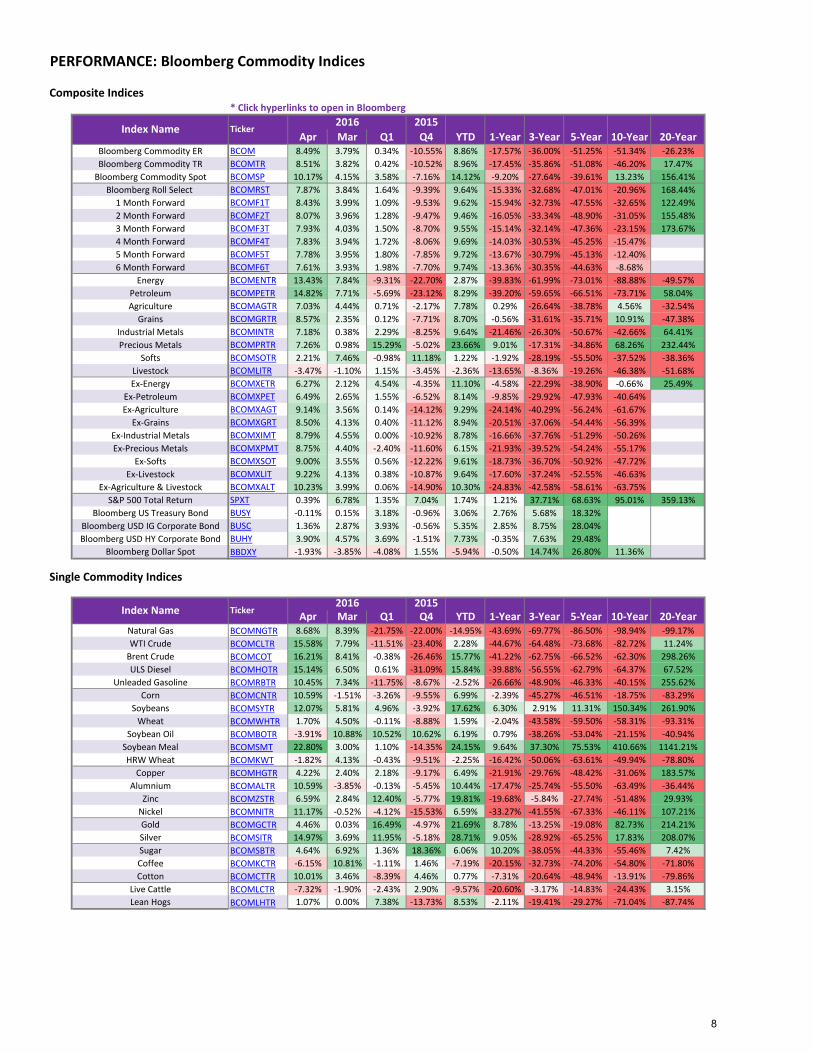
Bloomberg Commodity ER BCOM 8.49% 3.79% 0.34% -10.55% 8.86% -17.57% -36.00% -51.25% -51.34% -26.23%Bloomberg Commodity TR BCOMTR 8.51% 3.82% 0.42% -10.52% 8.96% -17.45% -35.86% -51.08% -46.20% 17.47%
Bloomberg Commodity Spot BCOMSP 10.17% 4.15% 3.58% -7.16% 14.12% -9.20% -27.64% -39.61% 13.23% 156.41%Bloomberg Roll Select BCOMRST 7.87% 3.84% 1.64% -9.39% 9.64% -15.33% -32.68% -47.01% -20.96% 168.44%
1 Month Forward BCOMF1T 8.43% 3.99% 1.09% -9.53% 9.62% -15.94% -32.73% -47.55% -32.65% 122.49% 2 Month Forward BCOMF2T 8.07% 3.96% 1.28% -9.47% 9.46% -16.05% -33.34% -48.90% -31.05% 155.48% 3 Month Forward BCOMF3T 7.93% 4.03% 1.50% -8.70% 9.55% -15.14% -32.14% -47.36% -23.15% 173.67% 4 Month Forward BCOMF4T 7.83% 3.94% 1.72% -8.06% 9.69% -14.03% -30.53% -45.25% -15.47% 5 Month Forward BCOMF5T 7.78% 3.95% 1.80% -7.85% 9.72% -13.67% -30.79% -45.13% -12.40% 6 Month Forward BCOMF6T 7.61% 3.93% 1.98% -7.70% 9.74% -13.36% -30.35% -44.63% -8.68%
Energy BCOMENTR 13.43% 7.84% -9.31% -22.70% 2.87% -39.83% -61.99% -73.01% -88.88% -49.57%Petroleum BCOMPETR 14.82% 7.71% -5.69% -23.12% 8.29% -39.20% -59.65% -66.51% -73.71% 58.04%Agriculture BCOMAGTR 7.03% 4.44% 0.71% -2.17% 7.78% 0.29% -26.64% -38.78% 4.56% -32.54%
Grains BCOMGRTR 8.57% 2.35% 0.12% -7.71% 8.70% -0.56% -31.61% -35.71% 10.91% -47.38%Industrial Metals BCOMINTR 7.18% 0.38% 2.29% -8.25% 9.64% -21.46% -26.30% -50.67% -42.66% 64.41%Precious Metals BCOMPRTR 7.26% 0.98% 15.29% -5.02% 23.66% 9.01% -17.31% -34.86% 68.26% 232.44%
Softs BCOMSOTR 2.21% 7.46% -0.98% 11.18% 1.22% -1.92% -28.19% -55.50% -37.52% -38.36%Livestock BCOMLITR -3.47% -1.10% 1.15% -3.45% -2.36% -13.65% -8.36% -19.26% -46.38% -51.68%Ex-Energy BCOMXETR 6.27% 2.12% 4.54% -4.35% 11.10% -4.58% -22.29% -38.90% -0.66% 25.49%
Ex-Petroleum BCOMXPET 6.49% 2.65% 1.55% -6.52% 8.14% -9.85% -29.92% -47.93% -40.64%Ex-Agriculture BCOMXAGT 9.14% 3.56% 0.14% -14.12% 9.29% -24.14% -40.29% -56.24% -61.67%
Ex-Grains BCOMXGRT 8.50% 4.13% 0.40% -11.12% 8.94% -20.51% -37.06% -54.44% -56.39%Ex-Industrial Metals BCOMXIMT 8.79% 4.55% 0.00% -10.92% 8.78% -16.66% -37.76% -51.29% -50.26%Ex-Precious Metals BCOMXPMT 8.75% 4.40% -2.40% -11.60% 6.15% -21.93% -39.52% -54.24% -55.17%
Ex-Softs BCOMXSOT 9.00% 3.55% 0.56% -12.22% 9.61% -18.73% -36.70% -50.92% -47.72%Ex-Livestock BCOMXLIT 9.22% 4.13% 0.38% -10.87% 9.64% -17.60% -37.24% -52.55% -46.63%
Ex-Agriculture & Livestock BCOMXALT 10.23% 3.99% 0.06% -14.90% 10.30% -24.83% -42.58% -58.61% -63.75%S&P 500 Total Return SPXT 0.39% 6.78% 1.35% 7.04% 1.74% 1.21% 37.71% 68.63% 95.01% 359.13%
Bloomberg US Treasury Bond BUSY -0.11% 0.15% 3.18% -0.96% 3.06% 2.76% 5.68% 18.32%Bloomberg USD IG Corporate Bond BUSC 1.36% 2.87% 3.93% -0.56% 5.35% 2.85% 8.75% 28.04%Bloomberg USD HY Corporate Bond BUHY 3.90% 4.57% 3.69% -1.51% 7.73% -0.35% 7.63% 29.48%
Bloomberg Dollar Spot BBDXY -1.93% -3.85% -4.08% 1.55% -5.94% -0.50% 14.74% 26.80% 11.36%
Single Commodity Indices
2015Apr Mar Q1 Q4 YTD 1-Year 3-Year 5-Year 10-Year 20-Year
Natural Gas BCOMNGTR 8.68% 8.39% -21.75% -22.00% -14.95% -43.69% -69.77% -86.50% -98.94% -99.17%WTI Crude BCOMCLTR 15.58% 7.79% -11.51% -23.40% 2.28% -44.67% -64.48% -73.68% -82.72% 11.24%
Brent Crude BCOMCOT 16.21% 8.41% -0.38% -26.46% 15.77% -41.22% -62.75% -66.52% -62.30% 298.26%ULS Diesel BCOMHOTR 15.14% 6.50% 0.61% -31.09% 15.84% -39.88% -56.55% -62.79% -64.37% 67.52%
Unleaded Gasoline BCOMRBTR 10.45% 7.34% -11.75% -8.67% -2.52% -26.66% -48.90% -46.33% -40.15% 255.62%Corn BCOMCNTR 10.59% -1.51% -3.26% -9.55% 6.99% -2.39% -45.27% -46.51% -18.75% -83.29%
Soybeans BCOMSYTR 12.07% 5.81% 4.96% -3.92% 17.62% 6.30% 2.91% 11.31% 150.34% 261.90%Wheat BCOMWHTR 1.70% 4.50% -0.11% -8.88% 1.59% -2.04% -43.58% -59.50% -58.31% -93.31%
Soybean Oil BCOMBOTR -3.91% 10.88% 10.52% 10.62% 6.19% 0.79% -38.26% -53.04% -21.15% -40.94%Soybean Meal BCOMSMT 22.80% 3.00% 1.10% -14.35% 24.15% 9.64% 37.30% 75.53% 410.66% 1141.21%HRW Wheat BCOMKWT -1.82% 4.13% -0.43% -9.51% -2.25% -16.42% -50.06% -63.61% -49.94% -78.80%
Copper BCOMHGTR 4.22% 2.40% 2.18% -9.17% 6.49% -21.91% -29.76% -48.42% -31.06% 183.57%Alumnium BCOMALTR 10.59% -3.85% -0.13% -5.45% 10.44% -17.47% -25.74% -55.50% -63.49% -36.44%
Zinc BCOMZSTR 6.59% 2.84% 12.40% -5.77% 19.81% -19.68% -5.84% -27.74% -51.48% 29.93%Nickel BCOMNITR 11.17% -0.52% -4.12% -15.53% 6.59% -33.27% -41.55% -67.33% -46.11% 107.21%Gold BCOMGCTR 4.46% 0.03% 16.49% -4.97% 21.69% 8.78% -13.25% -19.08% 82.73% 214.21%Silver BCOMSITR 14.97% 3.69% 11.95% -5.18% 28.71% 9.05% -28.92% -65.25% 17.83% 208.07%Sugar BCOMSBTR 4.64% 6.92% 1.36% 18.36% 6.06% 10.20% -38.05% -44.33% -55.46% 7.42%Coffee BCOMKCTR -6.15% 10.81% -1.11% 1.46% -7.19% -20.15% -32.73% -74.20% -54.80% -71.80%Cotton BCOMCTTR 10.01% 3.46% -8.39% 4.46% 0.77% -7.31% -20.64% -48.94% -13.91% -79.86%
Live Cattle BCOMLCTR -7.32% -1.90% -2.43% 2.90% -9.57% -20.60% -3.17% -14.83% -24.43% 3.15%Lean Hogs BCOMLHTR 1.07% 0.00% 7.38% -13.73% 8.53% -2.11% -19.41% -29.27% -71.04% -87.74%
Index Name Ticker
Index Name Ticker
PERFORMANCE: Bloomberg Commodity Indices
2016
2016
8
Composite Roll Select Indices * Click hyperlinks to open in Bloomberg
2015Apr Mar Q1 Q4 YTD 1-Year 3-Year 5-Year 10-Year 20-Year
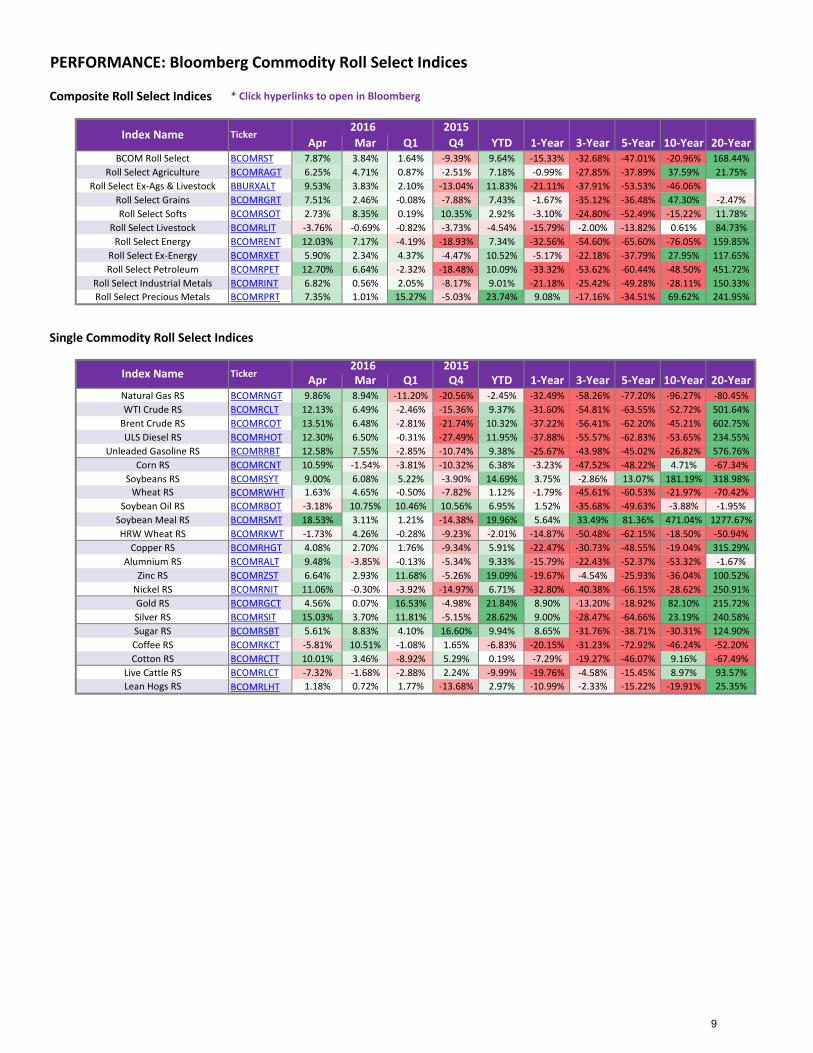
BCOM Roll Select BCOMRST 7.87% 3.84% 1.64% -9.39% 9.64% -15.33% -32.68% -47.01% -20.96% 168.44%Roll Select Agriculture BCOMRAGT 6.25% 4.71% 0.87% -2.51% 7.18% -0.99% -27.85% -37.89% 37.59% 21.75%
Roll Select Ex-Ags & Livestock BBURXALT 9.53% 3.83% 2.10% -13.04% 11.83% -21.11% -37.91% -53.53% -46.06%Roll Select Grains BCOMRGRT 7.51% 2.46% -0.08% -7.88% 7.43% -1.67% -35.12% -36.48% 47.30% -2.47%Roll Select Softs BCOMRSOT 2.73% 8.35% 0.19% 10.35% 2.92% -3.10% -24.80% -52.49% -15.22% 11.78%
Roll Select Livestock BCOMRLIT -3.76% -0.69% -0.82% -3.73% -4.54% -15.79% -2.00% -13.82% 0.61% 84.73%Roll Select Energy BCOMRENT 12.03% 7.17% -4.19% -18.93% 7.34% -32.56% -54.60% -65.60% -76.05% 159.85%
Roll Select Ex-Energy BCOMRXET 5.90% 2.34% 4.37% -4.47% 10.52% -5.17% -22.18% -37.79% 27.95% 117.65%Roll Select Petroleum BCOMRPET 12.70% 6.64% -2.32% -18.48% 10.09% -33.32% -53.62% -60.44% -48.50% 451.72%
Roll Select Industrial Metals BCOMRINT 6.82% 0.56% 2.05% -8.17% 9.01% -21.18% -25.42% -49.28% -28.11% 150.33%Roll Select Precious Metals BCOMRPRT 7.35% 1.01% 15.27% -5.03% 23.74% 9.08% -17.16% -34.51% 69.62% 241.95%
Single Commodity Roll Select Indices
2015Apr Mar Q1 Q4 YTD 1-Year 3-Year 5-Year 10-Year 20-Year
Natural Gas RS BCOMRNGT 9.86% 8.94% -11.20% -20.56% -2.45% -32.49% -58.26% -77.20% -96.27% -80.45%WTI Crude RS BCOMRCLT 12.13% 6.49% -2.46% -15.36% 9.37% -31.60% -54.81% -63.55% -52.72% 501.64%
Brent Crude RS BCOMRCOT 13.51% 6.48% -2.81% -21.74% 10.32% -37.22% -56.41% -62.20% -45.21% 602.75%ULS Diesel RS BCOMRHOT 12.30% 6.50% -0.31% -27.49% 11.95% -37.88% -55.57% -62.83% -53.65% 234.55%
Unleaded Gasoline RS BCOMRRBT 12.58% 7.55% -2.85% -10.74% 9.38% -25.67% -43.98% -45.02% -26.82% 576.76%Corn RS BCOMRCNT 10.59% -1.54% -3.81% -10.32% 6.38% -3.23% -47.52% -48.22% 4.71% -67.34%
Soybeans RS BCOMRSYT 9.00% 6.08% 5.22% -3.90% 14.69% 3.75% -2.86% 13.07% 181.19% 318.98%Wheat RS BCOMRWHT 1.63% 4.65% -0.50% -7.82% 1.12% -1.79% -45.61% -60.53% -21.97% -70.42%
Soybean Oil RS BCOMRBOT -3.18% 10.75% 10.46% 10.56% 6.95% 1.52% -35.68% -49.63% -3.88% -1.95%Soybean Meal RS BCOMRSMT 18.53% 3.11% 1.21% -14.38% 19.96% 5.64% 33.49% 81.36% 471.04% 1277.67%HRW Wheat RS BCOMRKWT -1.73% 4.26% -0.28% -9.23% -2.01% -14.87% -50.48% -62.15% -18.50% -50.94%
Copper RS BCOMRHGT 4.08% 2.70% 1.76% -9.34% 5.91% -22.47% -30.73% -48.55% -19.04% 315.29%Alumnium RS BCOMRALT 9.48% -3.85% -0.13% -5.34% 9.33% -15.79% -22.43% -52.37% -53.32% -1.67%
Zinc RS BCOMRZST 6.64% 2.93% 11.68% -5.26% 19.09% -19.67% -4.54% -25.93% -36.04% 100.52%Nickel RS BCOMRNIT 11.06% -0.30% -3.92% -14.97% 6.71% -32.80% -40.38% -66.15% -28.62% 250.91%Gold RS BCOMRGCT 4.56% 0.07% 16.53% -4.98% 21.84% 8.90% -13.20% -18.92% 82.10% 215.72%Silver RS BCOMRSIT 15.03% 3.70% 11.81% -5.15% 28.62% 9.00% -28.47% -64.66% 23.19% 240.58%Sugar RS BCOMRSBT 5.61% 8.83% 4.10% 16.60% 9.94% 8.65% -31.76% -38.71% -30.31% 124.90%Coffee RS BCOMRKCT -5.81% 10.51% -1.08% 1.65% -6.83% -20.15% -31.23% -72.92% -46.24% -52.20%Cotton RS BCOMRCTT 10.01% 3.46% -8.92% 5.29% 0.19% -7.29% -19.27% -46.07% 9.16% -67.49%
Live Cattle RS BCOMRLCT -7.32% -1.68% -2.88% 2.24% -9.99% -19.76% -4.58% -15.45% 8.97% 93.57%Lean Hogs RS BCOMRLHT 1.18% 0.72% 1.77% -13.68% 2.97% -10.99% -2.33% -15.22% -19.91% 25.35%
PERFORMANCE: Bloomberg Commodity Roll Select Indices
Index Name Ticker
Index Name Ticker
2016
2016
9
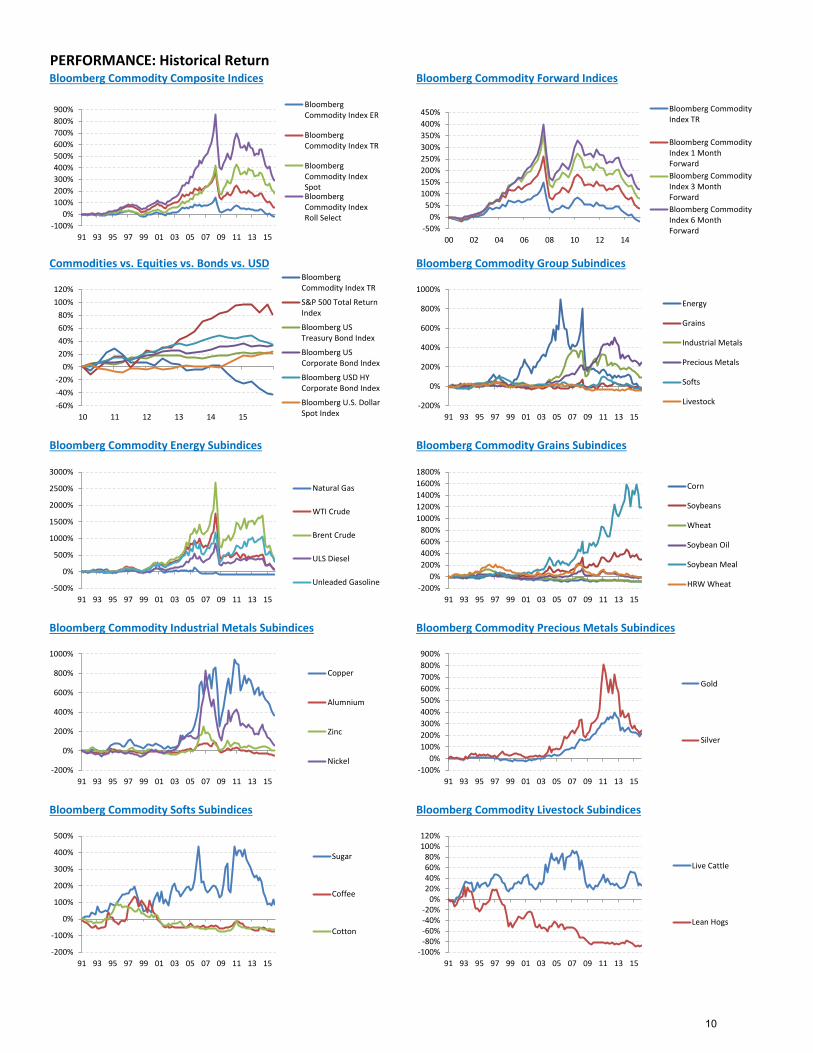
PERFORMANCE: Historical ReturnBloomberg Commodity Composite Indices
Commodities vs. Equities vs. Bonds vs. USD
Bloomberg Commodity Energy Subindices
Bloomberg Commodity Forward Indices
Bloomberg Commodity Group Subindices
Bloomberg Commodity Grains Subindices
Bloomberg Commodity Industrial Metals Subindices Bloomberg Commodity Precious Metals Subindices
Bloomberg Commodity Softs Subindices Bloomberg Commodity Livestock Subindices
-100%0%
100%200%300%400%500%600%700%800%900%
91 93 95 97 99 01 03 05 07 09 11 13 15
BloombergCommodity Index ER
BloombergCommodity Index TR
BloombergCommodity IndexSpotBloombergCommodity IndexRoll Select
-50%0%
50%100%150%200%250%300%350%400%450%
00 02 04 06 08 10 12 14
Bloomberg CommodityIndex TR
Bloomberg CommodityIndex 1 MonthForwardBloomberg CommodityIndex 3 MonthForwardBloomberg CommodityIndex 6 MonthForward
-60%-40%-20%
0%20%40%60%80%
100%120%
10 11 12 13 14 15
BloombergCommodity Index TR
S&P 500 Total ReturnIndex
Bloomberg USTreasury Bond Index
Bloomberg USCorporate Bond Index
Bloomberg USD HYCorporate Bond Index
Bloomberg U.S. DollarSpot Index
-200%
0%
200%
400%
600%
800%
1000%
91 93 95 97 99 01 03 05 07 09 11 13 15
Energy
Grains
Industrial Metals
Precious Metals
Softs
Livestock
-500%
0%
500%
1000%
1500%
2000%
2500%
3000%
91 93 95 97 99 01 03 05 07 09 11 13 15
Natural Gas
WTI Crude
Brent Crude
ULS Diesel
Unleaded Gasoline-200%
0%200%400%600%800%
1000%1200%1400%1600%1800%
91 93 95 97 99 01 03 05 07 09 11 13 15
Corn
Soybeans
Wheat
Soybean Oil
Soybean Meal
HRW Wheat
-200%
0%
200%
400%
600%
800%
1000%
91 93 95 97 99 01 03 05 07 09 11 13 15
Copper
Alumnium
Zinc
Nickel-100%
0%100%200%300%400%500%600%700%800%900%
91 93 95 97 99 01 03 05 07 09 11 13 15
Gold
Silver
-200%
-100%
0%
100%
200%
300%
400%
500%
91 93 95 97 99 01 03 05 07 09 11 13 15
Sugar
Coffee
Cotton
-100%-80%-60%-40%-20%
0%20%40%60%80%
100%120%
91 93 95 97 99 01 03 05 07 09 11 13 15
Live Cattle
Lean Hogs
10
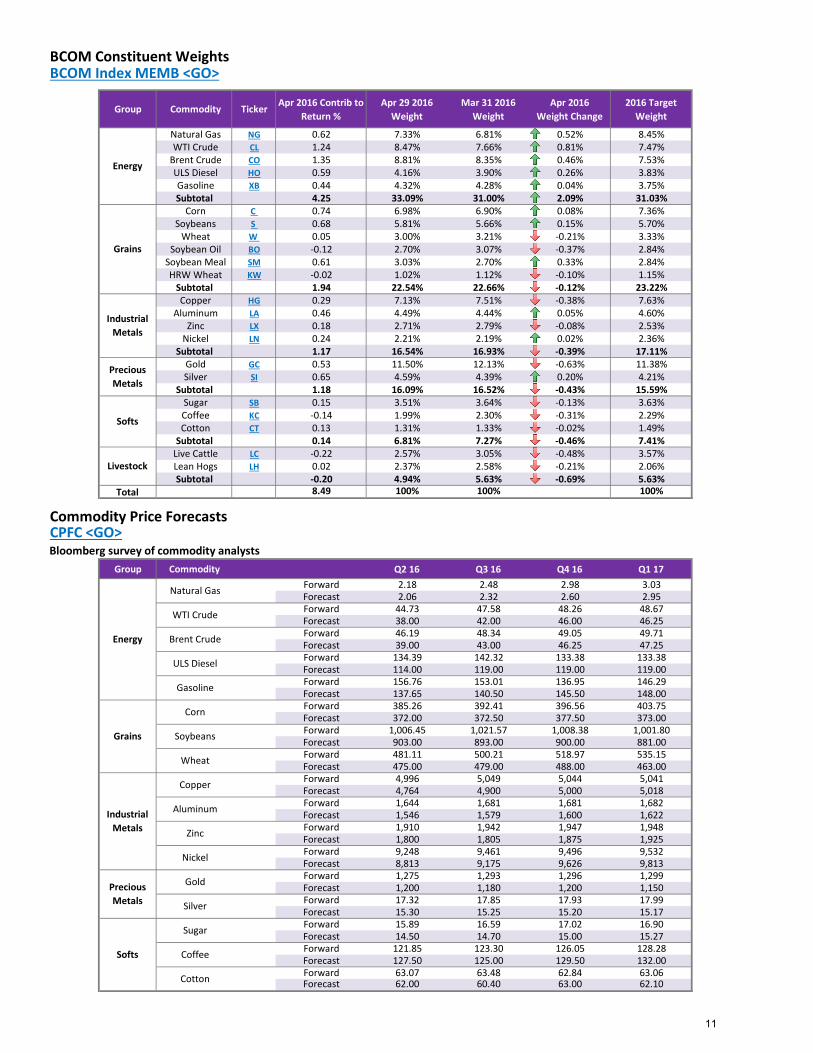
BCOM Constituent Weights BCOM Index MEMB <GO>
Group Commodity Ticker Apr 2016 Contrib to Return %
Apr 29 2016 Weight
Mar 31 2016 Weight
Apr 2016 Weight Change
2016 Target Weight
Natural Gas NG 0.62 7.33% 6.81% 0.52% 8.45% WTI Crude CL 1.24 8.47% 7.66% 0.81% 7.47%
Brent Crude CO 1.35 8.81% 8.35% 0.46% 7.53% ULS Diesel HO 0.59 4.16% 3.90% 0.26% 3.83% Gasoline XB 0.44 4.32% 4.28% 0.04% 3.75%Subtotal 4.25 33.09% 31.00% 2.09% 31.03%
Corn C 0.74 6.98% 6.90% 0.08% 7.36% Soybeans S 0.68 5.81% 5.66% 0.15% 5.70%
Wheat W 0.05 3.00% 3.21% -0.21% 3.33% Soybean Oil BO -0.12 2.70% 3.07% -0.37% 2.84%
Soybean Meal SM 0.61 3.03% 2.70% 0.33% 2.84% HRW Wheat KW -0.02 1.02% 1.12% -0.10% 1.15%
Subtotal 1.94 22.54% 22.66% -0.12% 23.22% Copper HG 0.29 7.13% 7.51% -0.38% 7.63%
Aluminum LA 0.46 4.49% 4.44% 0.05% 4.60% Zinc LX 0.18 2.71% 2.79% -0.08% 2.53%
Nickel LN 0.24 2.21% 2.19% 0.02% 2.36%Subtotal 1.17 16.54% 16.93% -0.39% 17.11%
Gold GC 0.53 11.50% 12.13% -0.63% 11.38% Silver SI 0.65 4.59% 4.39% 0.20% 4.21%
Subtotal 1.18 16.09% 16.52% -0.43% 15.59% Sugar SB 0.15 3.51% 3.64% -0.13% 3.63% Coffee KC -0.14 1.99% 2.30% -0.31% 2.29% Cotton CT 0.13 1.31% 1.33% -0.02% 1.49%
Subtotal 0.14 6.81% 7.27% -0.46% 7.41% Live Cattle LC -0.22 2.57% 3.05% -0.48% 3.57% Lean Hogs LH 0.02 2.37% 2.58% -0.21% 2.06%
Subtotal -0.20 4.94% 5.63% -0.69% 5.63%Total 8.49 100% 100% 100%
Commodity Price ForecastsCPFC <GO>
Group Commodity Q2 16 Q3 16 Q4 16 Q1 17Forward 2.18 2.48 2.98 3.03Forecast 2.06 2.32 2.60 2.95Forward 44.73 47.58 48.26 48.67Forecast 38.00 42.00 46.00 46.25Forward 46.19 48.34 49.05 49.71Forecast 39.00 43.00 46.25 47.25Forward 134.39 142.32 133.38 133.38Forecast 114.00 119.00 119.00 119.00Forward 156.76 153.01 136.95 146.29Forecast 137.65 140.50 145.50 148.00Forward 385.26 392.41 396.56 403.75Forecast 372.00 372.50 377.50 373.00Forward 1,006.45 1,021.57 1,008.38 1,001.80Forecast 903.00 893.00 900.00 881.00Forward 481.11 500.21 518.97 535.15Forecast 475.00 479.00 488.00 463.00Forward 4,996 5,049 5,044 5,041Forecast 4,764 4,900 5,000 5,018Forward 1,644 1,681 1,681 1,682Forecast 1,546 1,579 1,600 1,622Forward 1,910 1,942 1,947 1,948Forecast 1,800 1,805 1,875 1,925Forward 9,248 9,461 9,496 9,532Forecast 8,813 9,175 9,626 9,813Forward 1,275 1,293 1,296 1,299Forecast 1,200 1,180 1,200 1,150Forward 17.32 17.85 17.93 17.99Forecast 15.30 15.25 15.20 15.17Forward 15.89 16.59 17.02 16.90Forecast 14.50 14.70 15.00 15.27Forward 121.85 123.30 126.05 128.28Forecast 127.50 125.00 129.50 132.00Forward 63.07 63.48 62.84 63.06Forecast 62.00 60.40 63.00 62.10
Energy
Livestock
Softs
Precious Metals
Industrial Metals
Grains
Coffee
Cotton
Zinc
Nickel
Gold
Silver
Sugar
Softs
Bloomberg survey of commodity analysts
Energy
Grains
Industrial Metals
Precious Metals
Natural Gas
WTI Crude
Brent Crude
ULS Diesel
Gasoline
Corn
Soybeans
Wheat
Copper
Aluminum
11
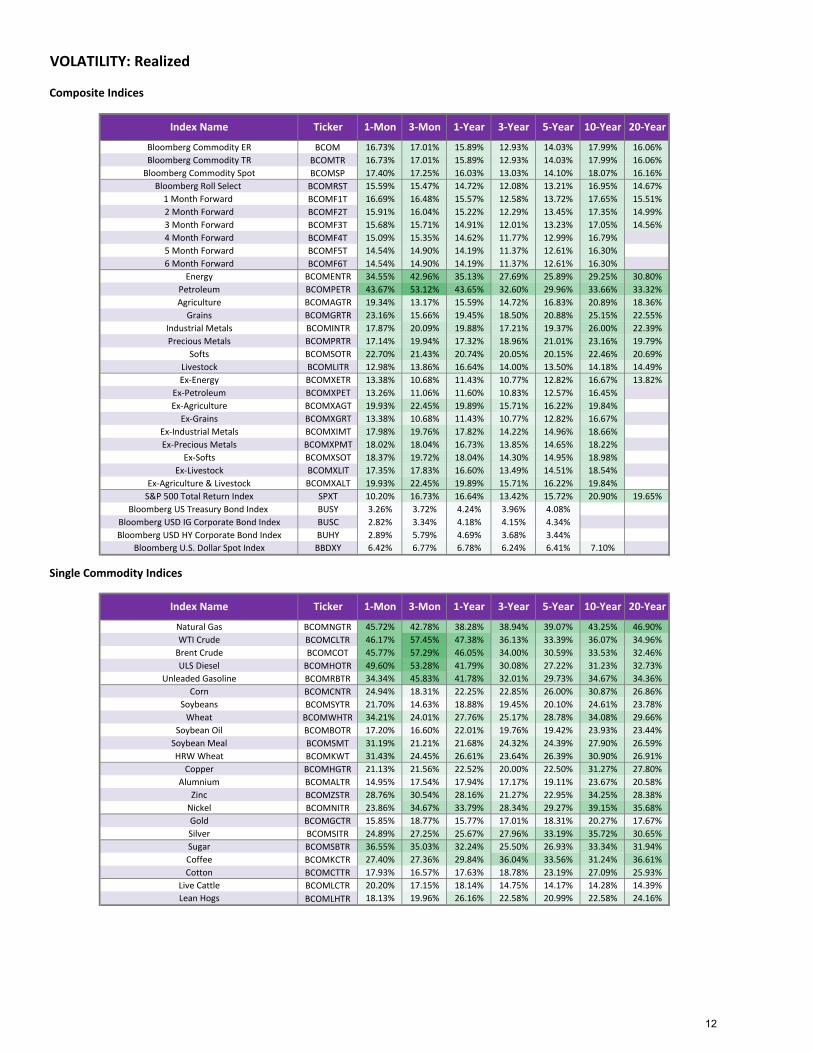
Composite Indices
Bloomberg Commodity ER BCOM 16.73% 17.01% 15.89% 12.93% 14.03% 17.99% 16.06%Bloomberg Commodity TR BCOMTR 16.73% 17.01% 15.89% 12.93% 14.03% 17.99% 16.06%
Bloomberg Commodity Spot BCOMSP 17.40% 17.25% 16.03% 13.03% 14.10% 18.07% 16.16%Bloomberg Roll Select BCOMRST 15.59% 15.47% 14.72% 12.08% 13.21% 16.95% 14.67%
1 Month Forward BCOMF1T 16.69% 16.48% 15.57% 12.58% 13.72% 17.65% 15.51% 2 Month Forward BCOMF2T 15.91% 16.04% 15.22% 12.29% 13.45% 17.35% 14.99% 3 Month Forward BCOMF3T 15.68% 15.71% 14.91% 12.01% 13.23% 17.05% 14.56% 4 Month Forward BCOMF4T 15.09% 15.35% 14.62% 11.77% 12.99% 16.79% 5 Month Forward BCOMF5T 14.54% 14.90% 14.19% 11.37% 12.61% 16.30% 6 Month Forward BCOMF6T 14.54% 14.90% 14.19% 11.37% 12.61% 16.30%
Energy BCOMENTR 34.55% 42.96% 35.13% 27.69% 25.89% 29.25% 30.80%Petroleum BCOMPETR 43.67% 53.12% 43.65% 32.60% 29.96% 33.66% 33.32%Agriculture BCOMAGTR 19.34% 13.17% 15.59% 14.72% 16.83% 20.89% 18.36%
Grains BCOMGRTR 23.16% 15.66% 19.45% 18.50% 20.88% 25.15% 22.55%Industrial Metals BCOMINTR 17.87% 20.09% 19.88% 17.21% 19.37% 26.00% 22.39%Precious Metals BCOMPRTR 17.14% 19.94% 17.32% 18.96% 21.01% 23.16% 19.79%
Softs BCOMSOTR 22.70% 21.43% 20.74% 20.05% 20.15% 22.46% 20.69%Livestock BCOMLITR 12.98% 13.86% 16.64% 14.00% 13.50% 14.18% 14.49%Ex-Energy BCOMXETR 13.38% 10.68% 11.43% 10.77% 12.82% 16.67% 13.82%
Ex-Petroleum BCOMXPET 13.26% 11.06% 11.60% 10.83% 12.57% 16.45%Ex-Agriculture BCOMXAGT 19.93% 22.45% 19.89% 15.71% 16.22% 19.84%
Ex-Grains BCOMXGRT 13.38% 10.68% 11.43% 10.77% 12.82% 16.67%Ex-Industrial Metals BCOMXIMT 17.98% 19.76% 17.82% 14.22% 14.96% 18.66%Ex-Precious Metals BCOMXPMT 18.02% 18.04% 16.73% 13.85% 14.65% 18.22%
Ex-Softs BCOMXSOT 18.37% 19.72% 18.04% 14.30% 14.95% 18.98%Ex-Livestock BCOMXLIT 17.35% 17.83% 16.60% 13.49% 14.51% 18.54%
Ex-Agriculture & Livestock BCOMXALT 19.93% 22.45% 19.89% 15.71% 16.22% 19.84%S&P 500 Total Return Index SPXT 10.20% 16.73% 16.64% 13.42% 15.72% 20.90% 19.65%
Bloomberg US Treasury Bond Index BUSY 3.26% 3.72% 4.24% 3.96% 4.08%Bloomberg USD IG Corporate Bond Index BUSC 2.82% 3.34% 4.18% 4.15% 4.34%Bloomberg USD HY Corporate Bond Index BUHY 2.89% 5.79% 4.69% 3.68% 3.44%
Bloomberg U.S. Dollar Spot Index BBDXY 6.42% 6.77% 6.78% 6.24% 6.41% 7.10%
Single Commodity Indices
Natural Gas BCOMNGTR 45.72% 42.78% 38.28% 38.94% 39.07% 43.25% 46.90%WTI Crude BCOMCLTR 46.17% 57.45% 47.38% 36.13% 33.39% 36.07% 34.96%
Brent Crude BCOMCOT 45.77% 57.29% 46.05% 34.00% 30.59% 33.53% 32.46%ULS Diesel BCOMHOTR 49.60% 53.28% 41.79% 30.08% 27.22% 31.23% 32.73%
Unleaded Gasoline BCOMRBTR 34.34% 45.83% 41.78% 32.01% 29.73% 34.67% 34.36%Corn BCOMCNTR 24.94% 18.31% 22.25% 22.85% 26.00% 30.87% 26.86%
Soybeans BCOMSYTR 21.70% 14.63% 18.88% 19.45% 20.10% 24.61% 23.78%Wheat BCOMWHTR 34.21% 24.01% 27.76% 25.17% 28.78% 34.08% 29.66%
Soybean Oil BCOMBOTR 17.20% 16.60% 22.01% 19.76% 19.42% 23.93% 23.44%Soybean Meal BCOMSMT 31.19% 21.21% 21.68% 24.32% 24.39% 27.90% 26.59%HRW Wheat BCOMKWT 31.43% 24.45% 26.61% 23.64% 26.39% 30.90% 26.91%
Copper BCOMHGTR 21.13% 21.56% 22.52% 20.00% 22.50% 31.27% 27.80%Alumnium BCOMALTR 14.95% 17.54% 17.94% 17.17% 19.11% 23.67% 20.58%
Zinc BCOMZSTR 28.76% 30.54% 28.16% 21.27% 22.95% 34.25% 28.38%Nickel BCOMNITR 23.86% 34.67% 33.79% 28.34% 29.27% 39.15% 35.68%Gold BCOMGCTR 15.85% 18.77% 15.77% 17.01% 18.31% 20.27% 17.67%Silver BCOMSITR 24.89% 27.25% 25.67% 27.96% 33.19% 35.72% 30.65%Sugar BCOMSBTR 36.55% 35.03% 32.24% 25.50% 26.93% 33.34% 31.94%Coffee BCOMKCTR 27.40% 27.36% 29.84% 36.04% 33.56% 31.24% 36.61%Cotton BCOMCTTR 17.93% 16.57% 17.63% 18.78% 23.19% 27.09% 25.93%
Live Cattle BCOMLCTR 20.20% 17.15% 18.14% 14.75% 14.17% 14.28% 14.39%Lean Hogs BCOMLHTR 18.13% 19.96% 26.16% 22.58% 20.99% 22.58% 24.16%
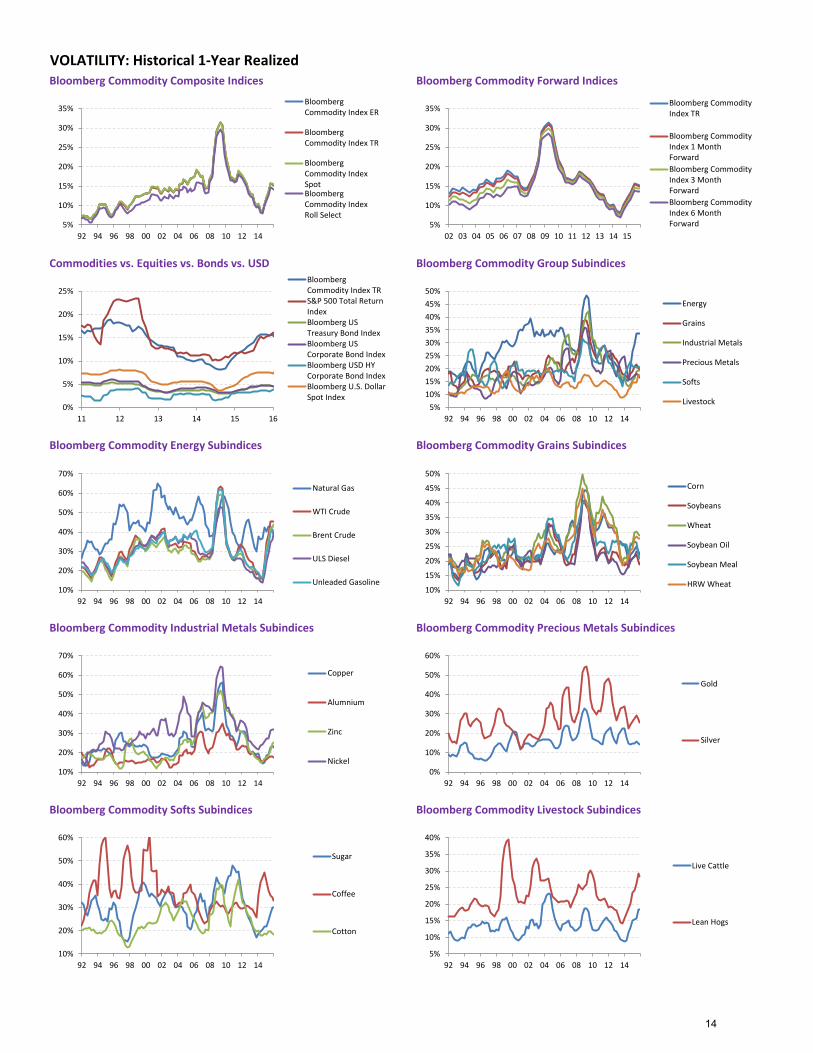
VOLATILITY: Realized
Index Name Ticker
Index Name Ticker
3-Mon 1-Year 3-Year1-Mon
1-Mon 3-Mon 1-Year 3-Year 5-Year 10-Year
5-Year 10-Year 20-Year
20-Year
12
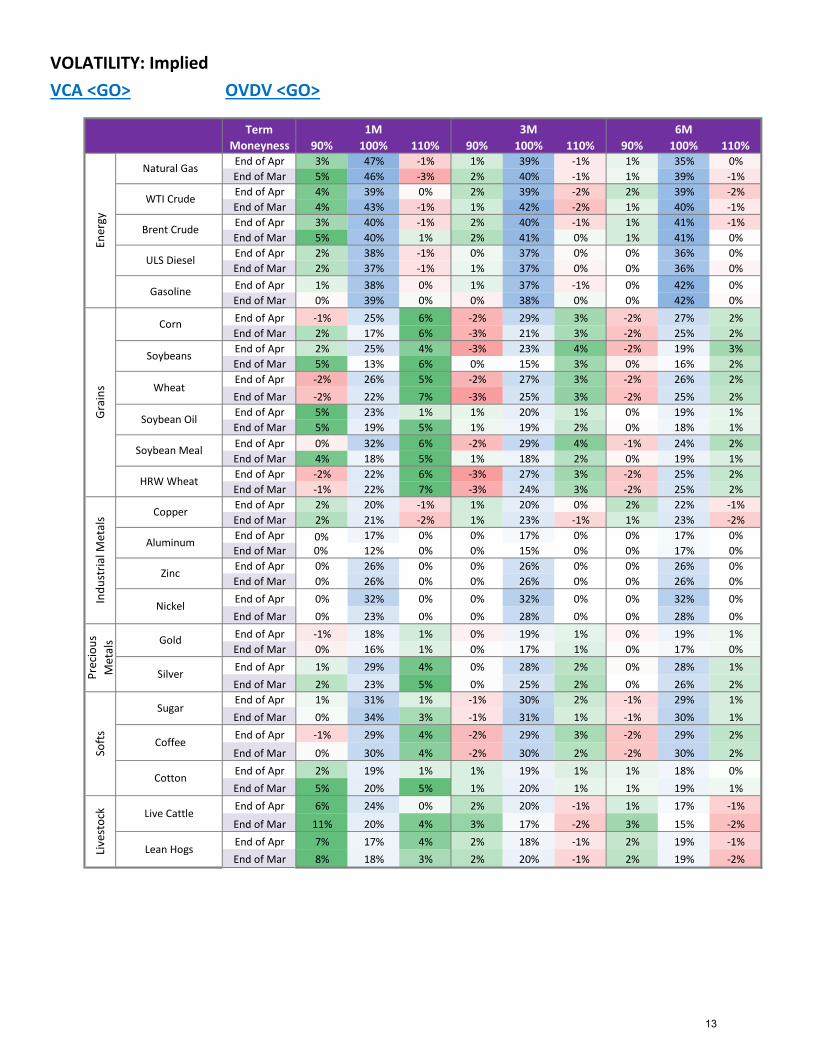
VOLATILITY: ImpliedVCA <GO> OVDV <GO>
TermMoneyness 90% 100% 110% 90% 100% 110% 90% 100% 110%End of Apr 3% 47% -1% 1% 39% -1% 1% 35% 0%End of Mar 5% 46% -3% 2% 40% -1% 1% 39% -1%End of Apr 4% 39% 0% 2% 39% -2% 2% 39% -2%End of Mar 4% 43% -1% 1% 42% -2% 1% 40% -1%End of Apr 3% 40% -1% 2% 40% -1% 1% 41% -1%End of Mar 5% 40% 1% 2% 41% 0% 1% 41% 0%End of Apr 2% 38% -1% 0% 37% 0% 0% 36% 0%End of Mar 2% 37% -1% 1% 37% 0% 0% 36% 0%End of Apr 1% 38% 0% 1% 37% -1% 0% 42% 0%End of Mar 0% 39% 0% 0% 38% 0% 0% 42% 0%End of Apr -1% 25% 6% -2% 29% 3% -2% 27% 2%End of Mar 2% 17% 6% -3% 21% 3% -2% 25% 2%End of Apr 2% 25% 4% -3% 23% 4% -2% 19% 3%End of Mar 5% 13% 6% 0% 15% 3% 0% 16% 2%End of Apr -2% 26% 5% -2% 27% 3% -2% 26% 2%End of Mar -2% 22% 7% -3% 25% 3% -2% 25% 2%End of Apr 5% 23% 1% 1% 20% 1% 0% 19% 1%End of Mar 5% 19% 5% 1% 19% 2% 0% 18% 1%End of Apr 0% 32% 6% -2% 29% 4% -1% 24% 2%End of Mar 4% 18% 5% 1% 18% 2% 0% 19% 1%End of Apr -2% 22% 6% -3% 27% 3% -2% 25% 2%End of Mar -1% 22% 7% -3% 24% 3% -2% 25% 2%End of Apr 2% 20% -1% 1% 20% 0% 2% 22% -1%End of Mar 2% 21% -2% 1% 23% -1% 1% 23% -2%End of Apr 0% 17% 0% 0% 17% 0% 0% 17% 0%End of Mar 0% 12% 0% 0% 15% 0% 0% 17% 0%End of Apr 0% 26% 0% 0% 26% 0% 0% 26% 0%End of Mar 0% 26% 0% 0% 26% 0% 0% 26% 0%End of Apr 0% 32% 0% 0% 32% 0% 0% 32% 0%End of Mar 0% 23% 0% 0% 28% 0% 0% 28% 0%End of Apr -1% 18% 1% 0% 19% 1% 0% 19% 1%End of Mar 0% 16% 1% 0% 17% 1% 0% 17% 0%End of Apr 1% 29% 4% 0% 28% 2% 0% 28% 1%End of Mar 2% 23% 5% 0% 25% 2% 0% 26% 2%End of Apr 1% 31% 1% -1% 30% 2% -1% 29% 1%End of Mar 0% 34% 3% -1% 31% 1% -1% 30% 1%End of Apr -1% 29% 4% -2% 29% 3% -2% 29% 2%End of Mar 0% 30% 4% -2% 30% 2% -2% 30% 2%End of Apr 2% 19% 1% 1% 19% 1% 1% 18% 0%End of Mar 5% 20% 5% 1% 20% 1% 1% 19% 1%End of Apr 6% 24% 0% 2% 20% -1% 1% 17% -1%End of Mar 11% 20% 4% 3% 17% -2% 3% 15% -2%End of Apr 7% 17% 4% 2% 18% -1% 2% 19% -1%End of Mar 8% 18% 3% 2% 20% -1% 2% 19% -2%
3M 6M
Corn
Soybeans
Wheat
1M
Live
stoc
k Live Cattle
Lean Hogs
Gra
ins
Prec
ious
M
etal
s Gold
Silver
Soft
s
Sugar
Coffee
Cotton
Soybean Oil
Soybean Meal
HRW Wheat
Indu
stria
l Met
als Copper
Aluminum
Zinc
Nickel
Ener
gy
Natural Gas
WTI Crude
Brent Crude
ULS Diesel
Gasoline
13
Bloomberg Commodity Energy Subindices Bloomberg Commodity Grains Subindices
VOLATILITY: Historical 1-Year RealizedBloomberg Commodity Composite Indices Bloomberg Commodity Forward Indices
Commodities vs. Equities vs. Bonds vs. USD Bloomberg Commodity Group Subindices
Bloomberg Commodity Industrial Metals Subindices Bloomberg Commodity Precious Metals Subindices
Bloomberg Commodity Softs Subindices Bloomberg Commodity Livestock Subindices
5%
10%
15%
20%
25%
30%
35%
92 94 96 98 00 02 04 06 08 10 12 14
BloombergCommodity Index ER
BloombergCommodity Index TR
BloombergCommodity IndexSpotBloombergCommodity IndexRoll Select
5%
10%
15%
20%
25%
30%
35%
02 03 04 05 06 07 08 09 10 11 12 13 14 15
Bloomberg CommodityIndex TR
Bloomberg CommodityIndex 1 MonthForwardBloomberg CommodityIndex 3 MonthForwardBloomberg CommodityIndex 6 MonthForward
0%
5%
10%
15%
20%
25%
11 12 13 14 15 16
BloombergCommodity Index TRS&P 500 Total ReturnIndexBloomberg USTreasury Bond IndexBloomberg USCorporate Bond IndexBloomberg USD HYCorporate Bond IndexBloomberg U.S. DollarSpot Index
5%10%15%20%25%30%35%40%45%50%
92 94 96 98 00 02 04 06 08 10 12 14
Energy
Grains
Industrial Metals
Precious Metals
Softs
Livestock
10%
20%
30%
40%
50%
60%
70%
92 94 96 98 00 02 04 06 08 10 12 14
Natural Gas
WTI Crude
Brent Crude
ULS Diesel
Unleaded Gasoline10%
15%
20%
25%
30%
35%
40%
45%
50%
92 94 96 98 00 02 04 06 08 10 12 14
Corn
Soybeans
Wheat
Soybean Oil
Soybean Meal
HRW Wheat
10%
20%
30%
40%
50%
60%
70%
92 94 96 98 00 02 04 06 08 10 12 14
Copper
Alumnium
Zinc
Nickel0%
10%
20%
30%
40%
50%
60%
92 94 96 98 00 02 04 06 08 10 12 14
Gold
Silver
10%
20%
30%
40%
50%
60%
92 94 96 98 00 02 04 06 08 10 12 14
Sugar
Coffee
Cotton
5%
10%
15%
20%
25%
30%
35%
40%
92 94 96 98 00 02 04 06 08 10 12 14
Live Cattle
Lean Hogs
14
Bloo
mbe
rg
Com
mod
ity
Roll
Sele
ct
1 M
onth
Fo
rwar
d
3 M
onth
Fo
rwar
d
6 M
onth
Fo
rwar
d
Ener
gy
Petr
oleu
m
Agric
ultu
re
Gra
ins
Indu
stria
l M
etal
s
Prec
ious
M
etal
s
Soft
s
Live
stoc
k
Ex-E
nerg
y
Ex-A
gs &
Li
vest
ock
Bloomberg Commodity 99% 100% 100% 99% 89% 86% 55% 44% 64% 36% 37% 29% 77% 96%Roll Select 99% 100% 100% 100% 87% 85% 56% 45% 65% 37% 37% 28% 78% 95%
1 Month Forward 100% 100% 100% 99% 88% 85% 55% 44% 65% 37% 37% 29% 77% 95%3 Month Forward 100% 100% 100% 100% 88% 85% 55% 45% 65% 37% 37% 28% 78% 95%6 Month Forward 99% 100% 99% 100% 87% 85% 55% 44% 65% 37% 37% 28% 78% 95%
Energy 89% 87% 88% 88% 87% 96% 23% 16% 43% 14% 20% 21% 40% 94%Petroleum 86% 85% 85% 85% 85% 96% 24% 15% 42% 11% 22% 21% 39% 90%Agriculture 55% 56% 55% 55% 55% 23% 24% 93% 30% 10% 53% 18% 79% 28%
Grains 44% 45% 44% 45% 44% 16% 15% 93% 19% 5% 22% 14% 68% 18%Industrial Metals 64% 65% 65% 65% 65% 43% 42% 30% 19% 23% 26% 19% 70% 63%Precious Metals 36% 37% 37% 37% 37% 14% 11% 10% 5% 23% 8% 3% 53% 38%
Softs 37% 37% 37% 37% 37% 20% 22% 53% 22% 26% 8% 13% 47% 24%Livestock 29% 28% 29% 28% 28% 21% 21% 18% 14% 19% 3% 13% 31% 22%Ex-Energy 77% 78% 77% 78% 78% 40% 39% 79% 68% 70% 53% 47% 31% 60%
Ex-Agriculture & Livestock 96% 95% 95% 95% 95% 94% 90% 28% 18% 63% 38% 24% 22% 60%S&P 500 Total Return Index 38% 39% 38% 39% 40% 39% 42% 17% 10% 32% -5% 20% 20% 24% 38%
S&P Energy 65% 64% 64% 64% 65% 71% 72% 18% 9% 39% 8% 25% 19% 33% 68%S&P Financial 36% 37% 36% 36% 37% 37% 41% 18% 11% 31% -11% 20% 19% 22% 35%
S&P Health Care 19% 20% 19% 20% 21% 19% 22% 9% 5% 23% -9% 8% 11% 12% 19%S&P Consumer Discretionary 29% 31% 30% 30% 31% 29% 33% 18% 11% 26% -10% 22% 20% 20% 27%
S&P IT 30% 31% 30% 31% 32% 30% 33% 16% 12% 26% -6% 12% 18% 20% 29%S&P Utilities 13% 13% 12% 13% 13% 13% 14% 0% -7% 7% 10% 20% 10% 8% 14%
S&P Consumers Staples 25% 26% 25% 26% 26% 25% 27% 9% 3% 19% 1% 18% 20% 16% 25%S&P Industrials 39% 40% 39% 40% 41% 38% 41% 18% 10% 36% -3% 23% 22% 27% 39%
S&P Telecommunication 32% 33% 32% 33% 33% 32% 34% 12% 7% 23% 6% 15% 19% 21% 33%S&P Materials 53% 54% 53% 54% 54% 52% 54% 23% 14% 42% 6% 25% 22% 36% 53%
Bloomberg US Treasury -30% -30% -30% -30% -31% -32% -35% -19% -17% -25% 20% -9% -7% -16% -28%Bloomberg USD IG Corporate -22% -22% -22% -22% -23% -25% -28% -14% -14% -18% 18% -3% -4% -10% -21%Bloomberg USD HY Corporate 35% 36% 35% 35% 36% 33% 34% 20% 12% 31% -4% 21% 16% 25% 33%
Bloomberg U.S. Dollar Spot -35% -34% -35% -34% -33% -25% -22% -14% -9% -21% -45% -20% -9% -35% -35%EURUSD 11% 11% 11% 10% 10% 0% -4% 3% 2% 5% 45% 8% -5% 21% 11%JPYUSD -10% -10% -10% -11% -11% -18% -20% -8% -4% -13% 42% -7% -7% 4% -8%CADUSD 60% 59% 60% 60% 59% 56% 55% 17% 7% 43% 34% 27% 18% 43% 63%MXNUSD 53% 54% 53% 54% 54% 50% 50% 23% 11% 40% 17% 35% 18% 40% 53%GBPUSD 30% 31% 31% 30% 30% 21% 19% 12% 7% 22% 40% 15% 10% 33% 31%AUDUSD 49% 50% 49% 50% 50% 36% 37% 25% 15% 45% 35% 28% 17% 49% 47%CHFUSD 3% 3% 3% 3% 2% -5% -8% -4% -5% -1% 44% 4% -8% 12% 6%KRWUSD 42% 42% 42% 42% 42% 27% 26% 24% 13% 36% 40% 32% 13% 46% 39%CNYUSD 22% 22% 22% 22% 22% 12% 13% 26% 24% 21% 7% 8% 8% 28% 16%
Bloo
mbe
rg
Com
mod
ity
Roll
Sele
ct
1 M
onth
Fo
rwar
d
3 M
onth
Fo
rwar
d
6 M
onth
Fo
rwar
d
Ener
gy
Petr
oleu
m
Agric
ultu
re
Gra
ins
Indu
stria
l M
etal
s
Prec
ious
M
etal
s
Soft
s
Live
stoc
k
Ex-E
nerg
y
Ex-A
gs &
Li
vest
ock
Bloomberg Commodity 99% 100% 99% 99% 82% 77% 66% 57% 64% 53% 44% 24% 84% 94%Roll Select 99% 99% 100% 99% 80% 76% 66% 57% 66% 55% 45% 23% 85% 93%
1 Month Forward 100% 99% 100% 99% 80% 77% 66% 57% 65% 54% 45% 23% 84% 93%3 Month Forward 99% 100% 100% 100% 79% 77% 66% 57% 66% 55% 45% 23% 85% 93%6 Month Forward 99% 99% 99% 100% 78% 77% 65% 56% 67% 56% 45% 22% 85% 92%
Energy 82% 80% 80% 79% 78% 89% 27% 22% 35% 20% 21% 16% 37% 89%Petroleum 77% 76% 77% 77% 77% 89% 28% 20% 41% 23% 25% 16% 41% 83%Agriculture 66% 66% 66% 66% 65% 27% 28% 94% 30% 24% 54% 14% 80% 36%
Grains 57% 57% 57% 57% 56% 22% 20% 94% 21% 19% 26% 11% 71% 28%Industrial Metals 64% 66% 65% 66% 67% 35% 41% 30% 21% 43% 31% 13% 71% 66%Precious Metals 53% 55% 54% 55% 56% 20% 23% 24% 19% 43% 20% 6% 67% 55%
Softs 44% 45% 45% 45% 45% 21% 25% 54% 26% 31% 20% 13% 51% 30%Livestock 24% 23% 23% 23% 22% 16% 16% 14% 11% 13% 6% 13% 24% 17%Ex-Energy 84% 85% 84% 85% 85% 37% 41% 80% 71% 71% 67% 51% 24% 67%
Ex-Agriculture & Livestock 94% 93% 93% 93% 92% 89% 83% 36% 28% 66% 55% 30% 17% 67%S&P 500 Total Return Index 36% 37% 37% 38% 38% 32% 39% 20% 14% 39% 6% 20% 12% 29% 36%
S&P Energy 56% 56% 56% 56% 57% 57% 64% 25% 18% 43% 16% 26% 12% 37% 58%S&P Financial 31% 32% 32% 33% 33% 27% 34% 18% 12% 38% 1% 20% 8% 25% 31%
S&P Health Care 23% 24% 24% 24% 25% 20% 25% 13% 10% 28% 0% 14% 9% 19% 22%S&P Consumer Discretionary 28% 29% 29% 30% 30% 25% 31% 17% 13% 34% -1% 16% 11% 23% 27%
S&P IT 31% 32% 32% 33% 33% 26% 33% 18% 13% 36% 5% 16% 12% 26% 30%S&P Utilities 17% 17% 17% 18% 18% 16% 18% 9% 6% 16% 4% 13% 3% 13% 17%
S&P Consumers Staples 24% 24% 24% 25% 25% 20% 25% 12% 9% 26% 4% 14% 10% 19% 23%S&P Industrials 35% 35% 35% 36% 37% 29% 36% 19% 14% 40% 6% 20% 11% 28% 34%
S&P Telecommunication 23% 23% 23% 24% 24% 22% 26% 11% 7% 23% 4% 13% 8% 17% 23%S&P Materials 47% 47% 47% 48% 49% 39% 47% 25% 18% 47% 18% 24% 12% 39% 47%
Bloomberg US Treasury -22% -22% -23% -23% -23% -25% -28% -13% -11% -25% 12% -9% -6% -13% -22%Bloomberg USD IG Corporate -15% -14% -15% -15% -15% -19% -22% -8% -7% -16% 15% -4% -4% -5% -14%Bloomberg USD HY Corporate 26% 27% 26% 27% 28% 22% 26% 16% 11% 28% 6% 15% 9% 22% 25%
Bloomberg U.S. Dollar Spot -42% -42% -42% -43% -43% -28% -31% -25% -17% -33% -37% -29% -8% -40% -40%EURUSD 35% 35% 35% 36% 36% 19% 20% 20% 14% 34% 37% 23% 3% 38% 34%JPYUSD 3% 3% 3% 3% 3% -6% -6% 5% 4% -5% 28% 5% -3% 11% 2%CADUSD 54% 54% 54% 55% 55% 43% 49% 25% 17% 46% 36% 28% 14% 46% 55%MXNUSD 48% 49% 48% 49% 50% 35% 41% 26% 17% 46% 30% 31% 11% 44% 47%GBPUSD 33% 34% 34% 34% 35% 20% 23% 17% 12% 32% 35% 19% 9% 35% 33%AUDUSD 49% 50% 50% 51% 51% 31% 37% 28% 20% 47% 40% 31% 13% 50% 48%CHFUSD 21% 21% 21% 21% 22% 7% 6% 12% 8% 23% 33% 15% -2% 27% 21%KRWUSD 34% 35% 35% 35% 36% 20% 24% 21% 15% 34% 28% 23% 8% 36% 33%CNYUSD 11% 11% 11% 11% 11% 7% 6% 10% 9% 9% 5% 4% 2% 11% 9%
Bond
Curr
ency
Bond
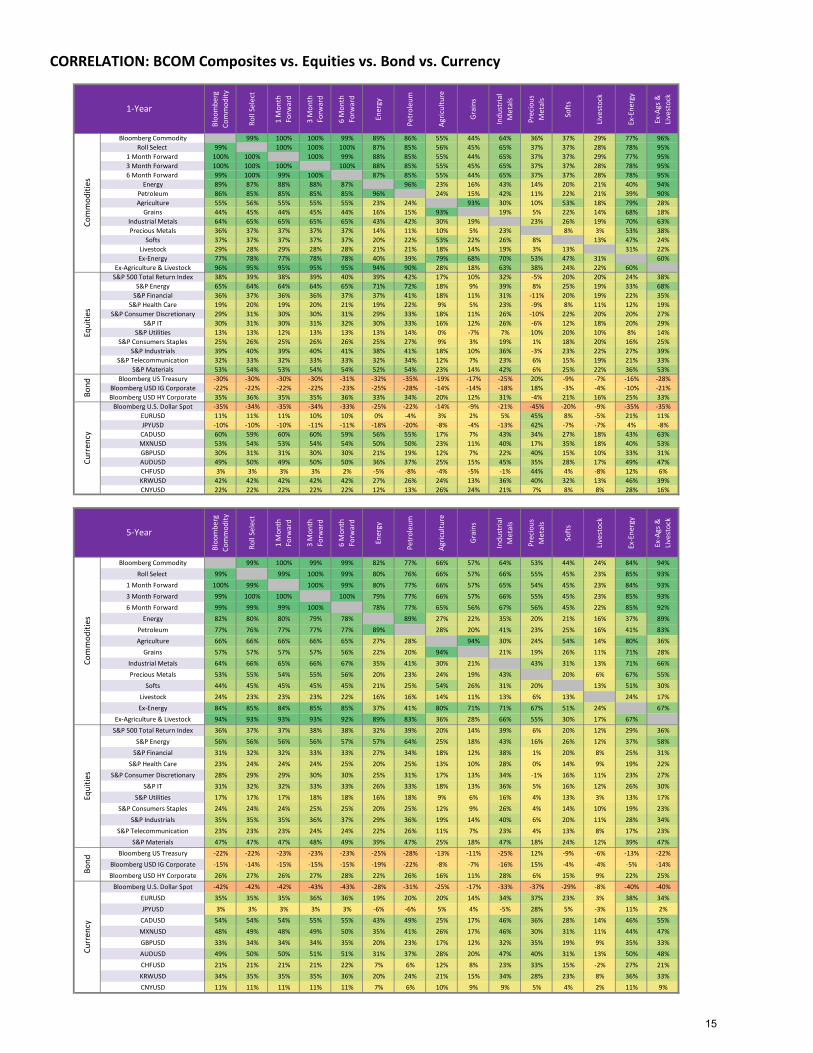
CORRELATION: BCOM Composites vs. Equities vs. Bond vs. Currency Cu
rren
cyCo
mm
oditi
esEq
uitie
s
5-Year
1-Year
Com
mod
ities
Equi
ties
15
Nat
ural
Gas
WTI
Cru
de
Bren
t Cru
de
ULS
Die
sel
Unl
eade
d G
asol
ine
Corn
Soyb
eans
Whe
at
Soyb
ean
Oil
Soyb
ean
Mea
l
HRW
Whe
at
Copp
er
Alum
nium
Zinc
Nic
kel
Gol
d
Silv
er
Suga
r
Coffe
e
Cott
on
Live
Cat
tle
Lean
Hog
s
Natural Gas 17% 17% 16% 11% 5% 4% 7% 12% 0% 5% 16% 15% 11% 12% 13% 13% -2% 0% 1% 5% 7%WTI Crude 17% 97% 93% 83% 14% 21% 4% 36% 8% 7% 43% 31% 24% 37% 2% 23% 13% 29% 15% 19% 15%
Brent Crude 17% 97% 96% 86% 15% 20% 4% 35% 8% 8% 42% 30% 24% 36% 1% 22% 9% 29% 16% 17% 13%ULS Diesel 16% 93% 96% 82% 16% 22% 6% 33% 10% 9% 40% 30% 23% 32% 5% 24% 9% 27% 15% 16% 16%
Unleaded Gasoline 11% 83% 86% 82% 11% 16% 2% 32% 5% 6% 39% 28% 20% 28% 2% 20% 4% 20% 18% 11% 11%Corn 5% 14% 15% 16% 11% 67% 68% 34% 60% 65% 15% 9% 6% 14% -3% 5% 12% 18% 15% 8% 12%
Soybeans 4% 21% 20% 22% 16% 67% 45% 56% 87% 43% 31% 25% 22% 29% 3% 24% 8% 32% 25% 16% 12%Wheat 7% 4% 4% 6% 2% 68% 45% 21% 41% 95% 9% 0% 0% 2% 5% 7% 7% 22% 17% 5% 5%
Soybean Oil 12% 36% 35% 33% 32% 34% 56% 21% 18% 19% 37% 33% 28% 31% 10% 33% 3% 35% 28% 23% 12%Soybean Meal 0% 8% 8% 10% 5% 60% 87% 41% 18% 38% 22% 16% 16% 17% 1% 14% 6% 20% 16% 6% 7%HRW Wheat 5% 7% 8% 9% 6% 65% 43% 95% 19% 38% 10% 0% -1% 4% 3% 5% 6% 18% 14% 6% 7%
Copper 16% 43% 42% 40% 39% 15% 31% 9% 37% 22% 10% 60% 65% 67% 12% 36% 16% 26% 23% 16% 16%Alumnium 15% 31% 30% 30% 28% 9% 25% 0% 33% 16% 0% 60% 62% 55% 8% 26% 6% 16% 22% 13% 13%
Zinc 11% 24% 24% 23% 20% 6% 22% 0% 28% 16% -1% 65% 62% 53% 21% 32% 10% 19% 15% 7% 11%Nickel 12% 37% 36% 32% 28% 14% 29% 2% 31% 17% 4% 67% 55% 53% 5% 26% 10% 20% 23% 5% 5%Gold 13% 2% 1% 5% 2% -3% 3% 5% 10% 1% 3% 12% 8% 21% 5% 77% 1% 2% 2% -3% 3%Silver 13% 23% 22% 24% 20% 5% 24% 7% 33% 14% 5% 36% 26% 32% 26% 77% 10% 19% 15% 7% 4%Sugar -2% 13% 9% 9% 4% 12% 8% 7% 3% 6% 6% 16% 6% 10% 10% 1% 10% 23% 6% 5% 10%Coffee 0% 29% 29% 27% 20% 18% 32% 22% 35% 20% 18% 26% 16% 19% 20% 2% 19% 23% 18% 10% 8%Cotton 1% 15% 16% 15% 18% 15% 25% 17% 28% 16% 14% 23% 22% 15% 23% 2% 15% 6% 18% 6% 4%
Live Cattle 5% 19% 17% 16% 11% 8% 16% 5% 23% 6% 6% 16% 13% 7% 5% -3% 7% 5% 10% 6% 26%Lean Hogs 7% 15% 13% 16% 11% 12% 12% 5% 12% 7% 7% 16% 13% 11% 5% 3% 4% 10% 8% 4% 26%
S&P 500 Total Return Index 3% 42% 43% 40% 36% 10% 15% 1% 21% 5% 4% 31% 22% 21% 33% -13% 9% 7% 27% 18% 24% 6%S&P Energy 18% 73% 71% 70% 61% 9% 14% 1% 28% 0% 7% 39% 29% 23% 36% -1% 22% 13% 28% 17% 20% 9%
S&P Financial 3% 41% 41% 39% 34% 11% 17% 1% 19% 7% 4% 29% 22% 20% 34% -20% 6% 7% 28% 18% 24% 3%S&P Health Care -2% 22% 23% 22% 18% 5% 11% -2% 13% 4% -1% 20% 19% 16% 24% -14% 2% 0% 14% 12% 14% 1%
S&P Consumer Discretionary -3% 33% 34% 32% 28% 11% 14% 3% 16% 6% 5% 25% 18% 16% 27% -16% 3% 10% 27% 17% 22% 9%S&P IT 0% 33% 34% 31% 30% 11% 15% 4% 21% 6% 7% 25% 16% 20% 28% -12% 5% 0% 24% 13% 23% 4%
S&P Utilities 2% 14% 15% 15% 10% -6% -4% -6% 1% -9% -7% 10% -3% 6% 7% 8% 14% 10% 22% 16% 14% 1%S&P Consumers Staples 6% 26% 28% 26% 21% 4% 7% -3% 12% -1% -1% 20% 10% 13% 21% -4% 10% 8% 20% 19% 25% 5%
S&P Industrials 5% 41% 41% 38% 35% 10% 14% 2% 18% 5% 5% 37% 21% 24% 34% -12% 13% 11% 28% 14% 25% 8%S&P Telecommunication 5% 33% 36% 34% 27% 8% 9% 1% 14% -1% 3% 24% 14% 15% 22% 0% 15% 2% 25% 21% 24% 4%
S&P Materials 11% 54% 54% 51% 45% 13% 20% 3% 27% 8% 6% 43% 29% 28% 37% -4% 22% 11% 32% 18% 24% 9%Bloomberg US Treasury 1% -37% -35% -33% -28% -16% -20% -8% -16% -17% -9% -28% -20% -8% -24% 26% 7% 0% -21% -9% -9% -1%
Bloomberg USD IG Corporate 3% -30% -28% -26% -21% -14% -13% -8% -11% -12% -7% -21% -15% -2% -18% 21% 10% 4% -14% -4% -4% -3%Bloomberg USD HY Corporate 7% 34% 36% 34% 25% 9% 19% 5% 14% 17% 7% 29% 25% 24% 24% -12% 11% 11% 24% 15% 23% -1%
Bloomberg U.S. Dollar Spot -16% -24% -20% -22% -16% -6% -5% -14% -7% -3% -10% -24% -11% -17% -9% -45% -39% -10% -21% -15% -1% -13%EURUSD 12% -2% -5% -2% -6% -1% -4% 10% 1% -5% 7% 9% -1% 5% -3% 48% 33% 3% 6% 13% -10% 3%JPYUSD 0% -20% -21% -18% -16% -3% -13% 6% -21% -3% 4% -11% -9% -6% -19% 51% 19% -1% -10% -10% -15% 6%CADUSD 20% 56% 54% 53% 43% 3% 11% 5% 24% 2% 5% 40% 33% 35% 34% 27% 42% 15% 30% 15% 15% 11%MXNUSD 13% 52% 50% 48% 41% 7% 18% 5% 22% 11% 5% 39% 27% 31% 35% 9% 30% 23% 34% 11% 18% 10%GBPUSD 12% 22% 16% 16% 14% 4% 8% 8% 10% 5% 3% 25% 13% 18% 10% 38% 39% 6% 17% 14% 10% 6%AUDUSD 8% 37% 36% 36% 32% 10% 21% 9% 28% 13% 7% 44% 30% 41% 30% 28% 42% 14% 36% 13% 17% 9%CHFUSD 6% -5% -9% -7% -10% -6% -12% 6% 0% -13% 4% 1% -4% 3% -8% 48% 30% 4% -1% 8% -14% 2%KRWUSD 11% 28% 25% 25% 21% 10% 16% 9% 20% 12% 6% 35% 22% 34% 26% 33% 47% 23% 29% 10% 11% 9%CNYUSD 2% 16% 13% 13% 3% 22% 26% 15% 19% 25% 13% 20% 13% 19% 18% 3% 11% 2% 16% 3% 7% 4%
Nat
ural
Gas
WTI
Cru
de
Bren
t Cru
de
ULS
Die
sel
Unl
eade
d G
asol
ine
Corn
Soyb
eans
Whe
at
Soyb
ean
Oil
Soyb
ean
Mea
l
HRW
Whe
at
Copp
er
Alum
nium
Zinc
Nic
kel
Gol
d
Silv
er
Suga
r
Coffe
e
Cott
on
Live
Cat
tle
Lean
Hog
s
Natural Gas 15% 14% 14% 12% 12% 5% 9% 8% 4% 10% 2% 6% 1% 2% 1% 4% 3% 3% 0% 4% 5%WTI Crude 15% 93% 88% 82% 17% 22% 13% 36% 13% 14% 42% 34% 30% 31% 18% 30% 19% 19% 21% 16% 12%
Brent Crude 14% 93% 96% 89% 16% 21% 12% 34% 12% 14% 38% 29% 27% 28% 15% 28% 16% 17% 20% 14% 10%ULS Diesel 14% 88% 96% 85% 16% 22% 12% 34% 14% 14% 36% 28% 26% 27% 16% 28% 16% 17% 20% 13% 11%
Unleaded Gasoline 12% 82% 89% 85% 14% 19% 11% 33% 10% 13% 34% 28% 24% 25% 16% 28% 12% 13% 19% 12% 8%Corn 12% 17% 16% 16% 14% 61% 70% 41% 54% 65% 15% 13% 10% 15% 12% 18% 18% 13% 17% 11% 6%
Soybeans 5% 22% 21% 22% 19% 61% 47% 65% 91% 45% 25% 21% 20% 19% 16% 24% 18% 14% 19% 10% 5%Wheat 9% 13% 12% 12% 11% 70% 47% 34% 41% 94% 14% 11% 10% 13% 13% 16% 18% 16% 19% 9% 2%
Soybean Oil 8% 36% 34% 34% 33% 41% 65% 34% 37% 32% 31% 28% 29% 25% 21% 31% 15% 19% 24% 15% 7%Soybean Meal 4% 13% 12% 14% 10% 54% 91% 41% 37% 39% 17% 14% 13% 11% 11% 17% 15% 8% 12% 5% 2%HRW Wheat 10% 14% 14% 14% 13% 65% 45% 94% 32% 39% 14% 10% 9% 13% 11% 15% 16% 14% 18% 9% 3%
Copper 2% 42% 38% 36% 34% 15% 25% 14% 31% 17% 14% 66% 71% 60% 36% 50% 21% 20% 23% 12% 10%Alumnium 6% 34% 29% 28% 28% 13% 21% 11% 28% 14% 10% 66% 69% 56% 30% 40% 18% 15% 19% 9% 8%
Zinc 1% 30% 27% 26% 24% 10% 20% 10% 29% 13% 9% 71% 69% 57% 30% 40% 20% 17% 16% 8% 8%Nickel 2% 31% 28% 27% 25% 15% 19% 13% 25% 11% 13% 60% 56% 57% 21% 31% 21% 15% 23% 7% 6%Gold 1% 18% 15% 16% 16% 12% 16% 13% 21% 11% 11% 36% 30% 30% 21% 82% 10% 14% 10% 4% 2%Silver 4% 30% 28% 28% 28% 18% 24% 16% 31% 17% 15% 50% 40% 40% 31% 82% 16% 20% 16% 8% 4%Sugar 3% 19% 16% 16% 12% 18% 18% 18% 15% 15% 16% 21% 18% 20% 21% 10% 16% 24% 15% 9% 9%Coffee 3% 19% 17% 17% 13% 13% 14% 16% 19% 8% 14% 20% 15% 17% 15% 14% 20% 24% 11% 6% 7%Cotton 0% 21% 20% 20% 19% 17% 19% 19% 24% 12% 18% 23% 19% 16% 23% 10% 16% 15% 11% 8% 4%
Live Cattle 4% 16% 14% 13% 12% 11% 10% 9% 15% 5% 9% 12% 9% 8% 7% 4% 8% 9% 6% 8% 31%Lean Hogs 5% 12% 10% 11% 8% 6% 5% 2% 7% 2% 3% 10% 8% 8% 6% 2% 4% 9% 7% 4% 31%
S&P 500 Total Return Index 1% 39% 37% 35% 33% 11% 17% 10% 22% 10% 12% 40% 30% 30% 29% 1% 14% 15% 12% 21% 13% 5%S&P Energy 13% 64% 61% 59% 54% 15% 19% 13% 28% 10% 16% 43% 33% 32% 31% 10% 24% 20% 16% 22% 13% 7%
S&P Financial 0% 34% 32% 30% 28% 8% 15% 9% 20% 9% 11% 38% 28% 28% 28% -4% 11% 15% 12% 20% 10% 3%S&P Health Care -1% 25% 24% 22% 20% 7% 12% 6% 15% 8% 7% 28% 23% 22% 21% -3% 7% 9% 8% 16% 11% 4%
S&P Consumer Discretionary -2% 31% 30% 28% 27% 10% 14% 10% 18% 9% 11% 35% 26% 25% 27% -5% 7% 12% 9% 18% 13% 4%S&P IT -2% 33% 32% 30% 29% 10% 16% 8% 21% 9% 10% 35% 28% 28% 27% 1% 12% 11% 10% 19% 14% 5%
S&P Utilities 3% 19% 17% 15% 14% 4% 5% 6% 8% 2% 8% 18% 10% 12% 10% 3% 6% 12% 5% 15% 6% 0%S&P Consumers Staples 1% 25% 24% 23% 20% 7% 10% 6% 14% 5% 8% 27% 19% 19% 20% 1% 9% 11% 6% 17% 11% 5%
S&P Industrials 0% 37% 34% 31% 31% 10% 17% 9% 21% 11% 12% 41% 30% 31% 29% 1% 14% 15% 11% 19% 11% 5%S&P Telecommunication 1% 25% 25% 24% 22% 6% 8% 6% 11% 4% 7% 24% 18% 18% 16% 1% 8% 10% 7% 15% 10% 3%
S&P Materials 3% 47% 44% 42% 40% 15% 19% 13% 26% 12% 15% 47% 36% 36% 33% 12% 25% 18% 15% 22% 14% 6%Bloomberg US Treasury -4% -29% -27% -25% -24% -7% -13% -7% -16% -8% -9% -27% -20% -16% -17% 17% 1% -5% -7% -10% -5% -5%
Bloomberg USD IG Corporate -3% -23% -21% -19% -18% -4% -8% -5% -11% -4% -6% -18% -13% -10% -10% 19% 6% -2% -3% -5% -3% -4%Bloomberg USD HY Corporate 1% 25% 27% 26% 20% 9% 15% 5% 17% 12% 6% 27% 22% 23% 21% 1% 12% 10% 10% 14% 11% 3%
Bloomberg U.S. Dollar Spot -7% -32% -29% -28% -25% -13% -17% -16% -18% -13% -16% -34% -27% -25% -20% -36% -34% -19% -21% -22% -5% -8%EURUSD 6% 22% 17% 18% 16% 9% 13% 15% 16% 9% 15% 34% 29% 25% 21% 36% 35% 14% 16% 20% -1% 6%JPYUSD -2% -6% -7% -6% -4% 5% 1% 5% -7% 5% 4% -5% -3% -4% -7% 32% 18% 3% 6% 0% -4% -1%CADUSD 6% 49% 47% 45% 40% 11% 21% 12% 29% 14% 13% 45% 36% 37% 33% 32% 38% 17% 23% 22% 11% 11%MXNUSD 4% 42% 39% 37% 35% 12% 21% 12% 25% 14% 13% 45% 37% 36% 34% 26% 33% 22% 21% 24% 10% 7%GBPUSD 3% 25% 21% 20% 18% 7% 14% 11% 16% 10% 11% 32% 26% 24% 20% 33% 33% 11% 15% 16% 8% 6%AUDUSD 2% 37% 35% 34% 31% 13% 24% 15% 28% 18% 16% 46% 35% 40% 33% 37% 41% 21% 24% 24% 11% 10%CHFUSD 3% 8% 5% 5% 5% 6% 4% 10% 10% 2% 10% 23% 21% 16% 14% 35% 28% 13% 8% 11% -6% 3%KRWUSD 2% 25% 22% 22% 20% 10% 17% 12% 21% 14% 11% 33% 26% 30% 26% 26% 29% 14% 18% 18% 6% 7%CNYUSD 3% 7% 7% 7% 3% 8% 8% 7% 9% 5% 8% 8% 7% 7% 11% 4% 5% -1% 8% 4% 3% 1%
Curr
ency
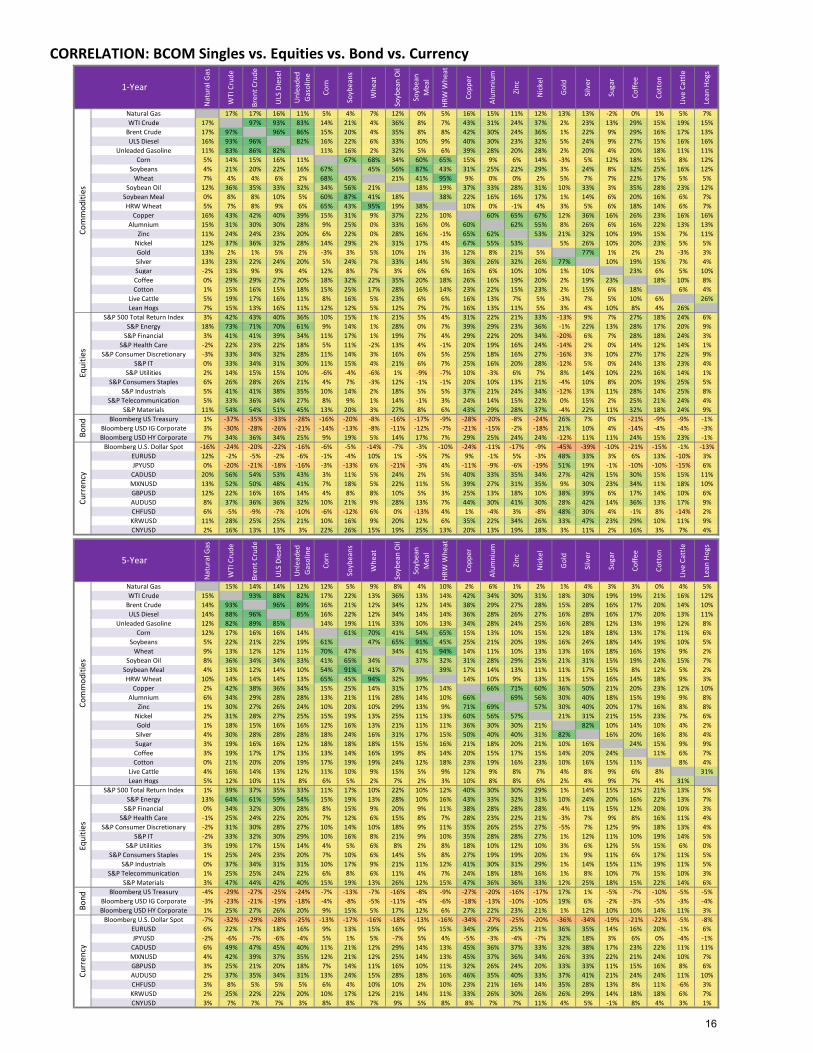
CORRELATION: BCOM Singles vs. Equities vs. Bond vs. Currency
5-Year
Com
mod
ities
Equi
ties
Bond
1-YearCo
mm
oditi
esEq
uitie
sBo
ndCu
rren
cy
16
All i
tem
s
Core
Food
Food
at h
ome
Food
aw
ay fr
om
hom
e
Ener
gy
Ener
gy
Com
mod
ities
Fuel
Oil
Mot
or F
uel
Ener
gy se
rvic
es
Elec
tric
ity
Util
ity g
as se
rvic
e
Com
mod
ities
less
fo
od a
nd e
nerg
y
Serv
ices
less
en
ergy
serv
ices
Shel
ter
Med
ical
car
e
Tran
spor
tatio
n
Bloomberg Commodity 60% -14% 18% 18% 4% 63% 60% 65% 60% 23% 3% 35% -10% -8% -21% 5% 14%Energy 64% -22% 12% 14% -4% 74% 74% 75% 73% 20% 4% 29% -3% -25% -28% -6% -4%
Petroleum 71% -12% 8% 9% -4% 78% 78% 80% 78% 5% 3% 5% 1% -14% -30% -1% 5%Agriculture 18% -10% 9% 9% 5% 19% 16% 11% 17% 13% -11% 34% -25% 8% -5% 9% 25%
Grains 10% -8% 7% 6% 6% 10% 8% 3% 9% 8% -15% 30% -20% 7% -7% 14% 18%Industrial Metals 40% 6% -1% 0% -5% 39% 37% 44% 37% -3% 4% -7% -1% 11% 2% 8% 15%Precious Metals 30% 13% 32% 30% 21% 20% 13% 28% 13% 17% 14% 14% 15% 6% -11% 17% 9%
Softs 21% -14% 18% 17% 9% 23% 20% 17% 21% 24% 6% 32% -28% 6% 2% -5% 30%Livestock 18% 2% 18% 17% 9% 18% 15% 13% 15% 20% 1% 34% -1% 6% -2% 17% 8%
Natural Gas 10% -26% 18% 20% -3% 17% 15% 12% 15% 38% 4% 59% -9% -28% -4% -13% -15%WTI Crude 65% -12% 8% 9% -1% 72% 73% 73% 72% 7% 5% 7% -2% -11% -28% 3% 5%
Brent Crude 72% -12% 12% 14% -4% 78% 78% 83% 78% 7% 5% 6% 7% -18% -34% -5% 5%ULS Diesel 69% -17% 15% 16% 1% 76% 75% 85% 74% 8% 6% 7% 3% -22% -32% -7% 3%
Unleaded Gasoline 80% -4% 9% 11% -5% 85% 86% 79% 86% -2% -2% 1% 7% -8% -26% -6% 13%Corn 12% -7% 15% 14% 10% 10% 7% 7% 8% 9% -15% 31% -12% 1% -13% 13% 18%
Soybeans 18% -4% -4% -3% -6% 19% 17% 11% 18% 5% -9% 19% -19% 12% -3% 13% 20%Wheat -4% -12% 0% -2% 8% -2% -3% -13% -2% 5% -20% 31% -30% 9% 0% 10% 11%
Soybean Oil 25% 9% -13% -13% -3% 23% 21% 12% 21% 1% -13% 15% -6% 19% -1% 0% 31%Soybean Meal 13% -9% 4% 5% -4% 16% 15% 11% 15% 4% -6% 14% -24% 8% 0% 11% 14%HRW Wheat 7% -12% 9% 7% 10% 8% 5% -1% 6% 18% -11% 42% -21% 3% -11% 9% 13%
Copper 39% 10% -11% -11% -5% 39% 39% 48% 39% -6% 5% -14% 3% 12% 2% 11% 11%Alumnium 37% -5% 10% 9% 6% 35% 33% 33% 33% -10% -7% -7% 1% -7% -3% 0% 5%
Zinc 27% 9% -11% -9% -15% 26% 24% 34% 24% 2% 11% -8% -3% 15% 8% 9% 16%Nickel 30% 3% 21% 24% -5% 28% 25% 32% 25% 14% 10% 14% -12% 17% 2% 6% 23%Gold 22% 18% 32% 29% 24% 11% 5% 21% 5% 16% 11% 16% 20% 8% -9% 18% 9%Silver 40% 4% 28% 27% 14% 32% 25% 37% 25% 17% 17% 10% 5% 2% -13% 13% 9%Sugar 2% 6% -5% -6% 4% 4% 5% 1% 5% 4% 2% 4% -8% 16% 4% 3% 29%Coffee 21% -15% 39% 38% 17% 20% 14% 12% 15% 39% 12% 50% -20% -4% 5% -9% 7%Cotton 21% -25% 0% 3% -10% 25% 23% 29% 23% 6% -3% 13% -32% -2% -5% -5% 21%
Live Cattle 24% -9% 11% 11% 5% 26% 26% 27% 25% 12% 11% 8% -6% -4% -2% 11% 3%Lean Hogs 8% 10% 19% 18% 8% 5% 2% -2% 2% 22% -6% 43% 5% 11% -2% 15% 8%
S&P 500 Total Return Index 25% -41% -30% -27% -24% 40% 40% 36% 40% 5% 9% -1% -31% -27% -13% -12% -17%Bloomberg US Treasury -34% 12% 31% 27% 31% -42% -44% -35% -44% 11% 8% 8% 27% -10% -12% 8% -8%
Bloomberg USD IG Corporate -4% -10% 17% 14% 22% -4% -7% 6% -7% 17% 11% 16% 17% -28% -21% -9% -16%Bloomberg USD HY Corporate 38% -25% -12% -11% -7% 49% 50% 58% 50% 8% 3% 10% -1% -29% -30% -18% -11%
Bloomberg U.S. Dollar Spot -52% -2% -16% -16% -6% -50% -46% -46% -46% -15% -7% -19% -10% 6% 20% 9% -12%
All i
tem
s
Core
Food
Food
at h
ome
Food
aw
ay fr
om
hom
e
Ener
gy
Ener
gy
Com
mod
ities
Fuel
Oil
Mot
or F
uel
Ener
gy se
rvic
es
Elec
tric
ity
Util
ity g
as se
rvic
e
Com
mod
ities
less
fo
od a
nd e
nerg
y
Serv
ices
less
en
ergy
serv
ices
Shel
ter
Med
ical
car
e
Tran
spor
tatio
n
Bloomberg Commodity 68% 5% 5% 8% -12% 69% 67% 66% 66% 31% -1% 41% 1% 8% 0% 8% 19%Energy 68% 0% 11% 14% -9% 72% 70% 69% 68% 38% 0% 48% -1% 4% -2% 2% 14%
Petroleum 72% 4% 10% 12% -7% 75% 76% 72% 75% 23% 2% 29% 2% 6% -2% 4% 17%Agriculture 29% 7% -1% 0% -7% 27% 26% 24% 26% 5% -3% 10% 1% 9% 6% 8% 15%
Grains 23% 7% 2% 2% -2% 20% 20% 19% 20% 2% -3% 6% -1% 10% 9% 8% 10%Industrial Metals 43% 6% -10% -7% -14% 44% 44% 43% 44% 11% 1% 14% 4% 5% -1% 8% 10%Precious Metals 30% 5% 0% 0% 0% 28% 26% 27% 25% 11% 7% 10% 4% 4% -6% 14% 15%
Softs 26% 3% -7% -4% -13% 28% 27% 21% 27% 11% -2% 15% 4% 0% -5% 4% 19%Livestock 15% -3% 17% 21% -9% 13% 10% 9% 10% 16% 8% 17% -12% 8% 5% 9% 3%
Natural Gas 36% -6% 9% 14% -12% 39% 33% 37% 32% 47% -5% 61% -3% -3% -3% -7% 3%WTI Crude 67% 5% 11% 13% -5% 70% 71% 68% 70% 22% 4% 27% 1% 8% 0% 7% 17%
Brent Crude 70% 5% 10% 13% -7% 72% 74% 70% 73% 19% 3% 23% 4% 6% -1% 4% 16%ULS Diesel 69% 1% 13% 15% -4% 72% 72% 77% 71% 27% 3% 33% 2% 2% -6% 1% 18%
Unleaded Gasoline 79% 3% 4% 8% -11% 82% 84% 67% 83% 21% -2% 28% 5% 2% -5% 0% 15%Corn 22% 5% 5% 6% -2% 19% 18% 19% 18% 4% -4% 10% 3% 4% 4% 1% 8%
Soybeans 22% 7% -2% -1% -8% 20% 20% 20% 20% 1% 1% 2% -1% 11% 8% 7% 15%Wheat 15% 6% 0% -2% 5% 13% 14% 9% 14% 1% -5% 5% -5% 11% 11% 14% 3%
Soybean Oil 30% 14% -3% -2% -6% 25% 24% 23% 24% 4% -3% 8% 4% 16% 11% 10% 16%Soybean Meal 17% 3% 1% 2% -6% 16% 17% 16% 17% 1% 6% -1% -2% 6% 4% 4% 13%HRW Wheat 22% 7% -1% -2% 3% 21% 21% 16% 21% 7% -1% 11% 0% 8% 8% 15% 2%
Copper 43% 9% -12% -11% -11% 43% 44% 41% 43% 9% 0% 10% 9% 5% -4% 9% 13%Alumnium 41% 4% 0% 3% -9% 41% 40% 44% 39% 19% 3% 23% 1% 5% 3% 3% 8%
Zinc 24% 6% -20% -18% -15% 26% 27% 22% 27% 1% 0% 1% 8% 2% 0% 2% 2%Nickel 32% -4% -4% 0% -18% 36% 37% 31% 37% 4% -2% 8% -10% 3% -3% 11% 8%Gold 27% 3% 5% 4% 5% 25% 23% 25% 23% 12% 10% 9% 3% 5% -6% 13% 15%Silver 29% 5% -7% -5% -7% 27% 25% 27% 25% 9% 2% 10% 6% 2% -5% 12% 12%Sugar 18% 7% -8% -7% -5% 18% 16% 12% 16% 11% 4% 13% 12% 0% -5% 4% 14%Coffee 13% 5% 0% 3% -8% 13% 13% 8% 13% 3% 1% 6% 3% -1% 1% -4% 4%Cotton 27% -8% -5% -2% -18% 30% 30% 32% 29% 8% -6% 12% 0% -8% -11% 1% 18%
Live Cattle 21% -6% 20% 23% -9% 19% 17% 12% 17% 15% 11% 13% -15% 8% 8% 9% 2%Lean Hogs 5% -3% 11% 13% -6% 3% 0% 3% 0% 12% 4% 14% -8% 3% -1% 7% 3%
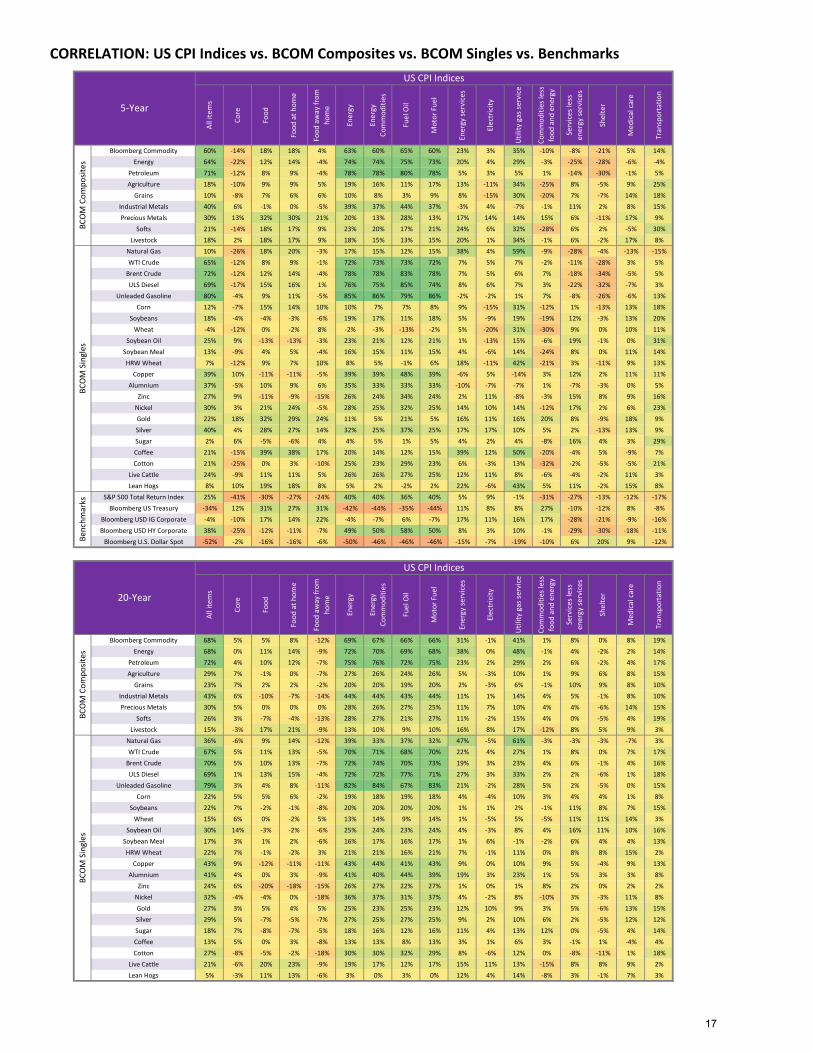
CORRELATION: US CPI Indices vs. BCOM Composites vs. BCOM Singles vs. Benchmarks
20-Year
US CPI Indices
BCO
M C
ompo
sites
BCO
M S
ingl
esUS CPI Indices
5-Year
BCO
M C
ompo
sites
BCO
M S
ingl
esBe
nchm
arks
17
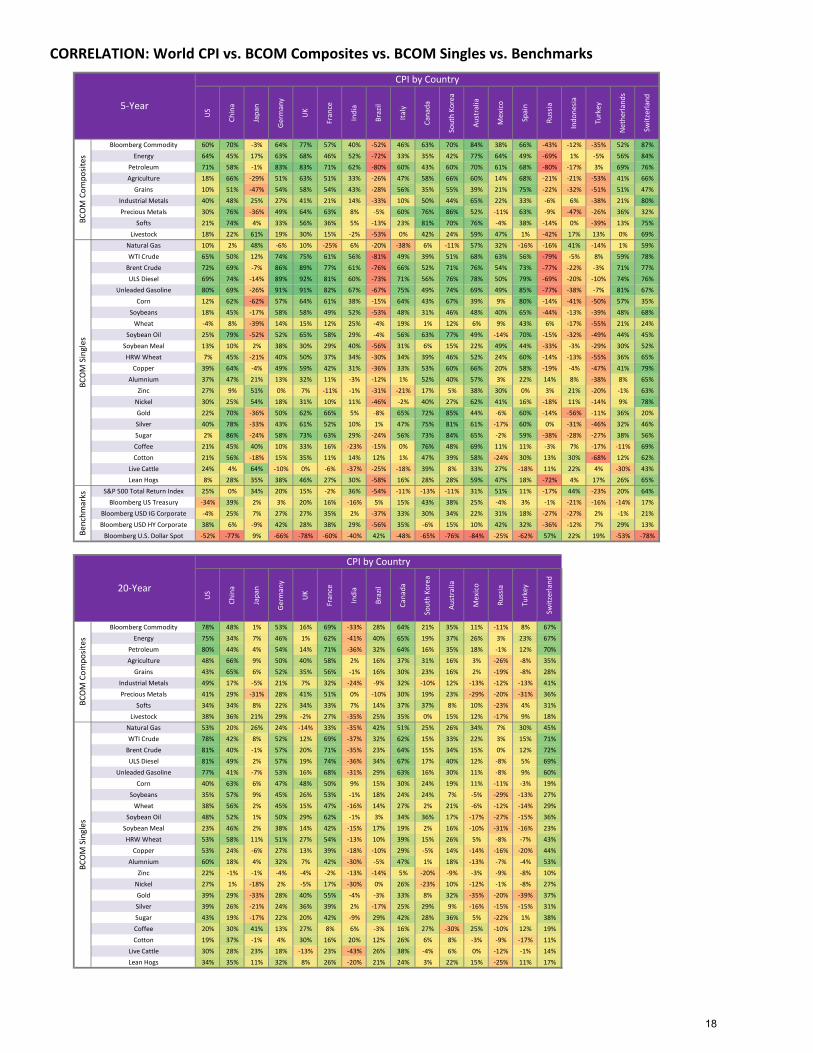
CORRELATION: World CPI vs. BCOM Composites vs. BCOM Singles vs. Benchmarks
US
Chin
a
Japa
n
Ger
man
y
UK
Fran
ce
Indi
a
Braz
il
Italy
Cana
da
Sout
h Ko
rea
Aust
ralia
Mex
ico
Spai
n
Russ
ia
Indo
nesi
a
Turk
ey
Net
herla
nds
Switz
erla
nd
Bloomberg Commodity 60% 70% -3% 64% 77% 57% 40% -52% 46% 63% 70% 84% 38% 66% -43% -12% -35% 52% 87%Energy 64% 45% 17% 63% 68% 46% 52% -72% 33% 35% 42% 77% 64% 49% -69% 1% -5% 56% 84%
Petroleum 71% 58% -1% 83% 83% 71% 62% -80% 60% 43% 60% 70% 61% 68% -80% -17% 3% 69% 76%Agriculture 18% 66% -29% 51% 63% 51% 33% -26% 47% 58% 66% 60% 14% 68% -21% -21% -53% 41% 66%
Grains 10% 51% -47% 54% 58% 54% 43% -28% 56% 35% 55% 39% 21% 75% -22% -32% -51% 51% 47%Industrial Metals 40% 48% 25% 27% 41% 21% 14% -33% 10% 50% 44% 65% 22% 33% -6% 6% -38% 21% 80%Precious Metals 30% 76% -36% 49% 64% 63% 8% -5% 60% 76% 86% 52% -11% 63% -9% -47% -26% 36% 32%
Softs 21% 74% 4% 33% 56% 36% 5% -13% 23% 81% 70% 76% -4% 38% -14% 0% -39% 13% 75%Livestock 18% 22% 61% 19% 30% 15% -2% -53% 0% 42% 24% 59% 47% 1% -42% 17% 13% 0% 69%
Natural Gas 10% 2% 48% -6% 10% -25% 6% -20% -38% 6% -11% 57% 32% -16% -16% 41% -14% 1% 59%WTI Crude 65% 50% 12% 74% 75% 61% 56% -81% 49% 39% 51% 68% 63% 56% -79% -5% 8% 59% 78%
Brent Crude 72% 69% -7% 86% 89% 77% 61% -76% 66% 52% 71% 76% 54% 73% -77% -22% -3% 71% 77%ULS Diesel 69% 74% -14% 89% 92% 81% 60% -73% 71% 56% 76% 78% 50% 79% -69% -20% -10% 74% 76%
Unleaded Gasoline 80% 69% -26% 91% 91% 82% 67% -67% 75% 49% 74% 69% 49% 85% -77% -38% -7% 81% 67%Corn 12% 62% -62% 57% 64% 61% 38% -15% 64% 43% 67% 39% 9% 80% -14% -41% -50% 57% 35%
Soybeans 18% 45% -17% 58% 58% 49% 52% -53% 48% 31% 46% 48% 40% 65% -44% -13% -39% 48% 68%Wheat -4% 8% -39% 14% 15% 12% 25% -4% 19% 1% 12% 6% 9% 43% 6% -17% -55% 21% 24%
Soybean Oil 25% 79% -52% 52% 65% 58% 29% -4% 56% 63% 77% 49% -14% 70% -15% -32% -49% 44% 45%Soybean Meal 13% 10% 2% 38% 30% 29% 40% -56% 31% 6% 15% 22% 49% 44% -33% -3% -29% 30% 52%HRW Wheat 7% 45% -21% 40% 50% 37% 34% -30% 34% 39% 46% 52% 24% 60% -14% -13% -55% 36% 65%
Copper 39% 64% -4% 49% 59% 42% 31% -36% 33% 53% 60% 66% 20% 58% -19% -4% -47% 41% 79%Alumnium 37% 47% 21% 13% 32% 11% -3% -12% 1% 52% 40% 57% 3% 22% 14% 8% -38% 8% 65%
Zinc 27% 9% 51% 0% 7% -11% -1% -31% -21% 17% 5% 38% 30% 0% 3% 21% -20% -1% 63%Nickel 30% 25% 54% 18% 31% 10% 11% -46% -2% 40% 27% 62% 41% 16% -18% 11% -14% 9% 78%Gold 22% 70% -36% 50% 62% 66% 5% -8% 65% 72% 85% 44% -6% 60% -14% -56% -11% 36% 20%Silver 40% 78% -33% 43% 61% 52% 10% 1% 47% 75% 81% 61% -17% 60% 0% -31% -46% 32% 46%Sugar 2% 86% -24% 58% 73% 63% 29% -24% 56% 73% 84% 65% -2% 59% -38% -28% -27% 38% 56%Coffee 21% 45% 40% 10% 33% 16% -23% -15% 0% 76% 48% 69% 11% 11% -3% 7% -17% -11% 69%Cotton 21% 56% -18% 15% 35% 11% 14% 12% 1% 47% 39% 58% -24% 30% 13% 30% -68% 12% 62%
Live Cattle 24% 4% 64% -10% 0% -6% -37% -25% -18% 39% 8% 33% 27% -18% 11% 22% 4% -30% 43%Lean Hogs 8% 28% 35% 38% 46% 27% 30% -58% 16% 28% 28% 59% 47% 18% -72% 4% 17% 26% 65%
S&P 500 Total Return Index 25% 0% 34% 20% 15% -2% 36% -54% -11% -13% -11% 31% 51% 11% -17% 44% -23% 20% 64%Bloomberg US Treasury -34% 39% 2% 3% 20% 16% -16% 5% 15% 43% 38% 25% -4% 3% -1% -21% -16% -14% 17%
Bloomberg USD IG Corporate -4% 25% 7% 27% 27% 35% 2% -37% 33% 30% 34% 22% 31% 18% -27% -27% 2% -1% 21%Bloomberg USD HY Corporate 38% 6% -9% 42% 28% 38% 29% -56% 35% -6% 15% 10% 42% 32% -36% -12% 7% 29% 13%
Bloomberg U.S. Dollar Spot -52% -77% 9% -66% -78% -60% -40% 42% -48% -65% -76% -84% -25% -62% 57% 22% 19% -53% -78%
US
Chin
a
Japa
n
Ger
man
y
UK
Fran
ce
Indi
a
Braz
il
Cana
da
Sout
h Ko
rea
Aust
ralia
Mex
ico
Russ
ia
Turk
ey
Switz
erla
nd
Bloomberg Commodity 78% 48% 1% 53% 16% 69% -33% 28% 64% 21% 35% 11% -11% 8% 67%Energy 75% 34% 7% 46% 1% 62% -41% 40% 65% 19% 37% 26% 3% 23% 67%
Petroleum 80% 44% 4% 54% 14% 71% -36% 32% 64% 16% 35% 18% -1% 12% 70%Agriculture 48% 66% 9% 50% 40% 58% 2% 16% 37% 31% 16% 3% -26% -8% 35%
Grains 43% 65% 6% 52% 35% 56% -1% 16% 30% 23% 16% 2% -19% -8% 28%Industrial Metals 49% 17% -5% 21% 7% 32% -24% -9% 32% -10% 12% -13% -12% -13% 41%Precious Metals 41% 29% -31% 28% 41% 51% 0% -10% 30% 19% 23% -29% -20% -31% 36%
Softs 34% 34% 8% 22% 34% 33% 7% 14% 37% 37% 8% 10% -23% 4% 31%Livestock 38% 36% 21% 29% -2% 27% -35% 25% 35% 0% 15% 12% -17% 9% 18%
Natural Gas 53% 20% 26% 24% -14% 33% -35% 42% 51% 25% 26% 34% 7% 30% 45%WTI Crude 78% 42% 8% 52% 12% 69% -37% 32% 62% 15% 33% 22% 3% 15% 71%
Brent Crude 81% 40% -1% 57% 20% 71% -35% 23% 64% 15% 34% 15% 0% 12% 72%ULS Diesel 81% 49% 2% 57% 19% 74% -36% 34% 67% 17% 40% 12% -8% 5% 69%
Unleaded Gasoline 77% 41% -7% 53% 16% 68% -31% 29% 63% 16% 30% 11% -8% 9% 60%Corn 40% 63% 6% 47% 48% 50% 9% 15% 30% 24% 19% 11% -11% -3% 19%
Soybeans 35% 57% 9% 45% 26% 53% -1% 18% 24% 24% 7% -5% -29% -13% 27%Wheat 38% 56% 2% 45% 15% 47% -16% 14% 27% 2% 21% -6% -12% -14% 29%
Soybean Oil 48% 52% 1% 50% 29% 62% -1% 3% 34% 36% 17% -17% -27% -15% 36%Soybean Meal 23% 46% 2% 38% 14% 42% -15% 17% 19% 2% 16% -10% -31% -16% 23%HRW Wheat 53% 58% 11% 51% 27% 54% -13% 10% 39% 15% 26% 5% -8% -7% 43%
Copper 53% 24% -6% 27% 13% 39% -18% -10% 29% -5% 14% -14% -16% -20% 44%Alumnium 60% 18% 4% 32% 7% 42% -30% -5% 47% 1% 18% -13% -7% -4% 53%
Zinc 22% -1% -1% -4% -4% -2% -13% -14% 5% -20% -9% -3% -9% -8% 10%Nickel 27% 1% -18% 2% -5% 17% -30% 0% 26% -23% 10% -12% -1% -8% 27%Gold 39% 29% -33% 28% 40% 55% -4% -3% 33% 8% 32% -35% -20% -39% 37%Silver 39% 26% -21% 24% 36% 39% 2% -17% 25% 29% 9% -16% -15% -15% 31%Sugar 43% 19% -17% 22% 20% 42% -9% 29% 42% 28% 36% 5% -22% 1% 38%Coffee 20% 30% 41% 13% 27% 8% 6% -3% 16% 27% -30% 25% -10% 12% 19%Cotton 19% 37% -1% 4% 30% 16% 20% 12% 26% 6% 8% -3% -9% -17% 11%
Live Cattle 30% 28% 23% 18% -13% 23% -43% 26% 38% -4% 6% 0% -12% -1% 14%Lean Hogs 34% 35% 11% 32% 8% 26% -20% 21% 24% 3% 22% 15% -25% 11% 17%
BCO
M C
ompo
sites
BCO
M S
ingl
es
5-Year
CPI by CountryBC
OM
Com
posit
esBC
OM
Sin
gles
Benc
hmar
ks
20-Year
CPI by Country
18
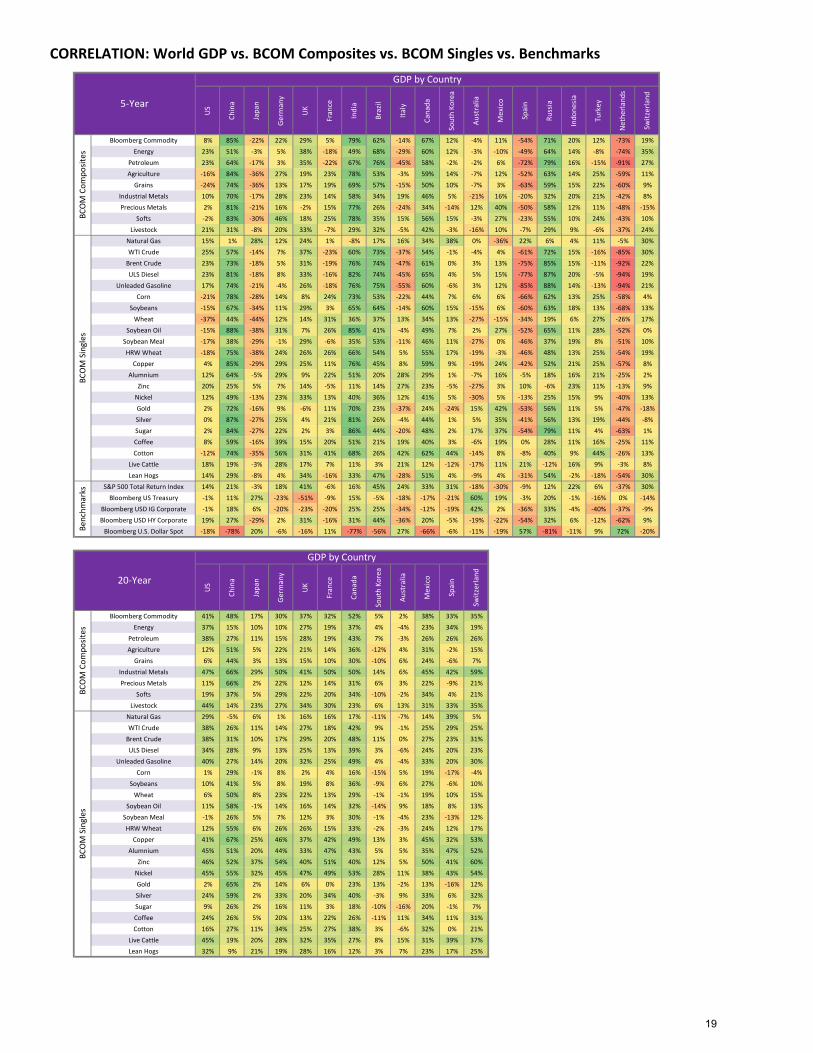
CORRELATION: World GDP vs. BCOM Composites vs. BCOM Singles vs. Benchmarks
US
Chin
a
Japa
n
Ger
man
y
UK
Fran
ce
Indi
a
Braz
il
Italy
Cana
da
Sout
h Ko
rea
Aust
ralia
Mex
ico
Spai
n
Russ
ia
Indo
nesi
a
Turk
ey
Net
herla
nds
Switz
erla
nd
Bloomberg Commodity 8% 85% -22% 22% 29% 5% 79% 62% -14% 67% 12% -4% 11% -54% 71% 20% 12% -73% 19%Energy 23% 51% -3% 5% 38% -18% 49% 68% -29% 60% 12% -3% -10% -49% 64% 14% -8% -74% 35%
Petroleum 23% 64% -17% 3% 35% -22% 67% 76% -45% 58% -2% -2% 6% -72% 79% 16% -15% -91% 27%Agriculture -16% 84% -36% 27% 19% 23% 78% 53% -3% 59% 14% -7% 12% -52% 63% 14% 25% -59% 11%
Grains -24% 74% -36% 13% 17% 19% 69% 57% -15% 50% 10% -7% 3% -63% 59% 15% 22% -60% 9%Industrial Metals 10% 70% -17% 28% 23% 14% 58% 34% 19% 46% 5% -21% 16% -20% 32% 20% 21% -42% 8%Precious Metals 2% 81% -21% 16% -2% 15% 77% 26% -24% 34% -14% 12% 40% -50% 58% 12% 11% -48% -15%
Softs -2% 83% -30% 46% 18% 25% 78% 35% 15% 56% 15% -3% 27% -23% 55% 10% 24% -43% 10%Livestock 21% 31% -8% 20% 33% -7% 29% 32% -5% 42% -3% -16% 10% -7% 29% 9% -6% -37% 24%
Natural Gas 15% 1% 28% 12% 24% 1% -8% 17% 16% 34% 38% 0% -36% 22% 6% 4% 11% -5% 30%WTI Crude 25% 57% -14% 7% 37% -23% 60% 73% -37% 54% -1% -4% 4% -61% 72% 15% -16% -85% 30%
Brent Crude 23% 73% -18% 5% 31% -19% 76% 74% -47% 61% 0% 3% 13% -75% 85% 15% -11% -92% 22%ULS Diesel 23% 81% -18% 8% 33% -16% 82% 74% -45% 65% 4% 5% 15% -77% 87% 20% -5% -94% 19%
Unleaded Gasoline 17% 74% -21% -4% 26% -18% 76% 75% -55% 60% -6% 3% 12% -85% 88% 14% -13% -94% 21%Corn -21% 78% -28% 14% 8% 24% 73% 53% -22% 44% 7% 6% 6% -66% 62% 13% 25% -58% 4%
Soybeans -15% 67% -34% 11% 29% 3% 65% 64% -14% 60% 15% -15% 6% -60% 63% 18% 13% -68% 13%Wheat -37% 44% -44% 12% 14% 31% 36% 37% 13% 34% 13% -27% -15% -34% 19% 6% 27% -26% 17%
Soybean Oil -15% 88% -38% 31% 7% 26% 85% 41% -4% 49% 7% 2% 27% -52% 65% 11% 28% -52% 0%Soybean Meal -17% 38% -29% -1% 29% -6% 35% 53% -11% 46% 11% -27% 0% -46% 37% 19% 8% -51% 10%HRW Wheat -18% 75% -38% 24% 26% 26% 66% 54% 5% 55% 17% -19% -3% -46% 48% 13% 25% -54% 19%
Copper 4% 85% -29% 29% 25% 11% 76% 45% 8% 59% 9% -19% 24% -42% 52% 21% 25% -57% 8%Alumnium 12% 64% -5% 29% 9% 22% 51% 20% 28% 29% 1% -7% 16% -5% 18% 16% 21% -25% 2%
Zinc 20% 25% 5% 7% 14% -5% 11% 14% 27% 23% -5% -27% 3% 10% -6% 23% 11% -13% 9%Nickel 12% 49% -13% 23% 33% 13% 40% 36% 12% 41% 5% -30% 5% -13% 25% 15% 9% -40% 13%Gold 2% 72% -16% 9% -6% 11% 70% 23% -37% 24% -24% 15% 42% -53% 56% 11% 5% -47% -18%Silver 0% 87% -27% 25% 4% 21% 81% 26% -4% 44% 1% 5% 35% -41% 56% 13% 19% -44% -8%Sugar 2% 84% -27% 22% 2% 3% 86% 44% -20% 48% 2% 17% 37% -54% 79% 11% 4% -63% 1%Coffee 8% 59% -16% 39% 15% 20% 51% 21% 19% 40% 3% -6% 19% 0% 28% 11% 16% -25% 11%Cotton -12% 74% -35% 56% 31% 41% 68% 26% 42% 62% 44% -14% 8% -8% 40% 9% 44% -26% 13%
Live Cattle 18% 19% -3% 28% 17% 7% 11% 3% 21% 12% -12% -17% 11% 21% -12% 16% 9% -3% 8%Lean Hogs 14% 29% -8% 4% 34% -16% 33% 47% -28% 51% 4% -9% 4% -31% 54% -2% -18% -54% 30%
S&P 500 Total Return Index 14% 21% -3% 18% 41% -6% 16% 45% 24% 33% 31% -18% -30% -9% 12% 22% 6% -37% 30%Bloomberg US Treasury -1% 11% 27% -23% -51% -9% 15% -5% -18% -17% -21% 60% 19% -3% 20% -1% -16% 0% -14%
Bloomberg USD IG Corporate -1% 18% 6% -20% -23% -20% 25% 25% -34% -12% -19% 42% 2% -36% 33% -4% -40% -37% -9%Bloomberg USD HY Corporate 19% 27% -29% 2% 31% -16% 31% 44% -36% 20% -5% -19% -22% -54% 32% 6% -12% -62% 9%
Bloomberg U.S. Dollar Spot -18% -78% 20% -6% -16% 11% -77% -56% 27% -66% -6% -11% -19% 57% -81% -11% 9% 72% -20%
US
Chin
a
Japa
n
Ger
man
y
UK
Fran
ce
Cana
da
Sout
h Ko
rea
Aust
ralia
Mex
ico
Spai
n
Switz
erla
nd
Bloomberg Commodity 41% 48% 17% 30% 37% 32% 52% 5% 2% 38% 33% 35%Energy 37% 15% 10% 10% 27% 19% 37% 4% -4% 23% 34% 19%
Petroleum 38% 27% 11% 15% 28% 19% 43% 7% -3% 26% 26% 26%Agriculture 12% 51% 5% 22% 21% 14% 36% -12% 4% 31% -2% 15%
Grains 6% 44% 3% 13% 15% 10% 30% -10% 6% 24% -6% 7%Industrial Metals 47% 66% 29% 50% 41% 50% 50% 14% 6% 45% 42% 59%Precious Metals 11% 66% 2% 22% 12% 14% 31% 6% 3% 22% -9% 21%
Softs 19% 37% 5% 29% 22% 20% 34% -10% -2% 34% 4% 21%Livestock 44% 14% 23% 27% 34% 30% 23% 6% 13% 31% 33% 35%
Natural Gas 29% -5% 6% 1% 16% 16% 17% -11% -7% 14% 39% 5%WTI Crude 38% 26% 11% 14% 27% 18% 42% 9% -1% 25% 29% 25%
Brent Crude 38% 31% 10% 17% 29% 20% 48% 11% 0% 27% 23% 31%ULS Diesel 34% 28% 9% 13% 25% 13% 39% 3% -6% 24% 20% 23%
Unleaded Gasoline 40% 27% 14% 20% 32% 25% 49% 4% -4% 33% 20% 30%Corn 1% 29% -1% 8% 2% 4% 16% -15% 5% 19% -17% -4%
Soybeans 10% 41% 5% 8% 19% 8% 36% -9% 6% 27% -6% 10%Wheat 6% 50% 8% 23% 22% 13% 29% -1% -1% 19% 10% 15%
Soybean Oil 11% 58% -1% 14% 16% 14% 32% -14% 9% 18% 8% 13%Soybean Meal -1% 26% 5% 7% 12% 3% 30% -1% -4% 23% -13% 12%HRW Wheat 12% 55% 6% 26% 26% 15% 33% -2% -3% 24% 12% 17%
Copper 41% 67% 25% 46% 37% 42% 49% 13% 3% 45% 32% 53%Alumnium 45% 51% 20% 44% 33% 47% 43% 5% 5% 35% 47% 52%
Zinc 46% 52% 37% 54% 40% 51% 40% 12% 5% 50% 41% 60%Nickel 45% 55% 32% 45% 47% 49% 53% 28% 11% 38% 43% 54%Gold 2% 65% 2% 14% 6% 0% 23% 13% -2% 13% -16% 12%Silver 24% 59% 2% 33% 20% 34% 40% -3% 9% 33% 6% 32%Sugar 9% 26% 2% 16% 11% 3% 18% -10% -16% 20% -1% 7%Coffee 24% 26% 5% 20% 13% 22% 26% -11% 11% 34% 11% 31%Cotton 16% 27% 11% 34% 25% 27% 38% 3% -6% 32% 0% 21%
Live Cattle 45% 19% 20% 28% 32% 35% 27% 8% 15% 31% 39% 37%Lean Hogs 32% 9% 21% 19% 28% 16% 12% 3% 7% 23% 17% 25%
20-Year
BCO
M C
ompo
sites
BCO
M S
ingl
es
GDP by Country
5-Year
GDP by CountryBC
OM
Com
posit
esBC
OM
Sin
gles
Benc
hmar
ks
19
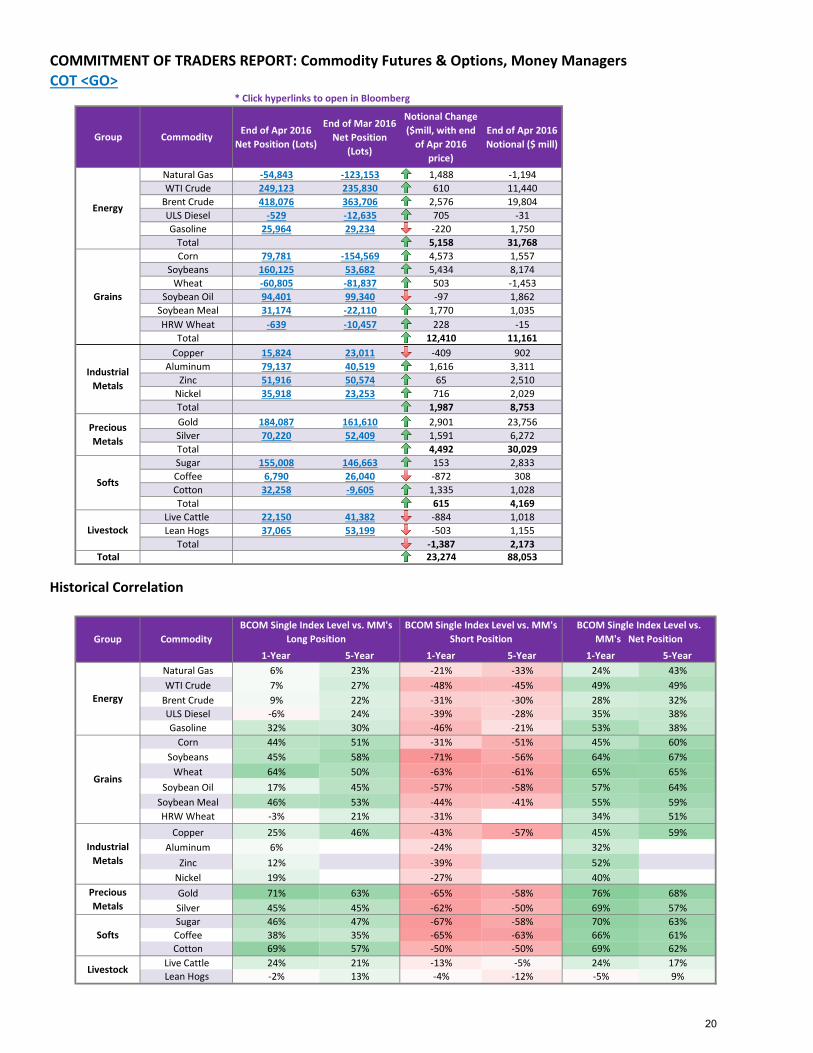
COMMITMENT OF TRADERS REPORT: Commodity Futures & Options, Money ManagersCOT <GO>
* Click hyperlinks to open in Bloomberg
Group Commodity End of Apr 2016 Net Position (Lots)
End of Mar 2016 Net Position
(Lots)
Notional Change ($mill, with end
of Apr 2016 price)
End of Apr 2016 Notional ($ mill)
Natural Gas -54,843 -123,153 1,488 -1,194 WTI Crude 249,123 235,830 610 11,440
Brent Crude 418,076 363,706 2,576 19,804 ULS Diesel -529 -12,635 705 -31 Gasoline 25,964 29,234 -220 1,750
Total 5,158 31,768 Corn 79,781 -154,569 4,573 1,557
Soybeans 160,125 53,682 5,434 8,174 Wheat -60,805 -81,837 503 -1,453
Soybean Oil 94,401 99,340 -97 1,862 Soybean Meal 31,174 -22,110 1,770 1,035 HRW Wheat -639 -10,457 228 -15
Total 12,410 11,161 Copper 15,824 23,011 -409 902
Aluminum 79,137 40,519 1,616 3,311 Zinc 51,916 50,574 65 2,510
Nickel 35,918 23,253 716 2,029 Total 1,987 8,753 Gold 184,087 161,610 2,901 23,756 Silver 70,220 52,409 1,591 6,272 Total 4,492 30,029 Sugar 155,008 146,663 153 2,833 Coffee 6,790 26,040 -872 308 Cotton 32,258 -9,605 1,335 1,028 Total 615 4,169
Live Cattle 22,150 41,382 -884 1,018Lean Hogs 37,065 53,199 -503 1,155
Total -1,387 2,173Total 23,274 88,053
Historical Correlation
1-Year 5-Year 1-Year 5-Year 1-Year 5-Year Natural Gas 6% 23% -21% -33% 24% 43% WTI Crude 7% 27% -48% -45% 49% 49%
Brent Crude 9% 22% -31% -30% 28% 32% ULS Diesel -6% 24% -39% -28% 35% 38% Gasoline 32% 30% -46% -21% 53% 38%
Corn 44% 51% -31% -51% 45% 60% Soybeans 45% 58% -71% -56% 64% 67%
Wheat 64% 50% -63% -61% 65% 65% Soybean Oil 17% 45% -57% -58% 57% 64%
Soybean Meal 46% 53% -44% -41% 55% 59% HRW Wheat -3% 21% -31% 34% 51%
Copper 25% 46% -43% -57% 45% 59% Aluminum 6% -24% 32%
Zinc 12% -39% 52% Nickel 19% -27% 40% Gold 71% 63% -65% -58% 76% 68% Silver 45% 45% -62% -50% 69% 57% Sugar 46% 47% -67% -58% 70% 63% Coffee 38% 35% -65% -63% 66% 61% Cotton 69% 57% -50% -50% 69% 62%
Live Cattle 24% 21% -13% -5% 24% 17%Lean Hogs -2% 13% -4% -12% -5% 9%
CommodityBCOM Single Index Level vs. MM's
Long PositionBCOM Single Index Level vs. MM's
Short PositionBCOM Single Index Level vs.
MM's Net Position
Energy
Group
Grains
Industrial Metals
Precious Metals
Softs
Livestock
Livestock
Energy
Grains
Industrial Metals
Precious Metals
Softs
20
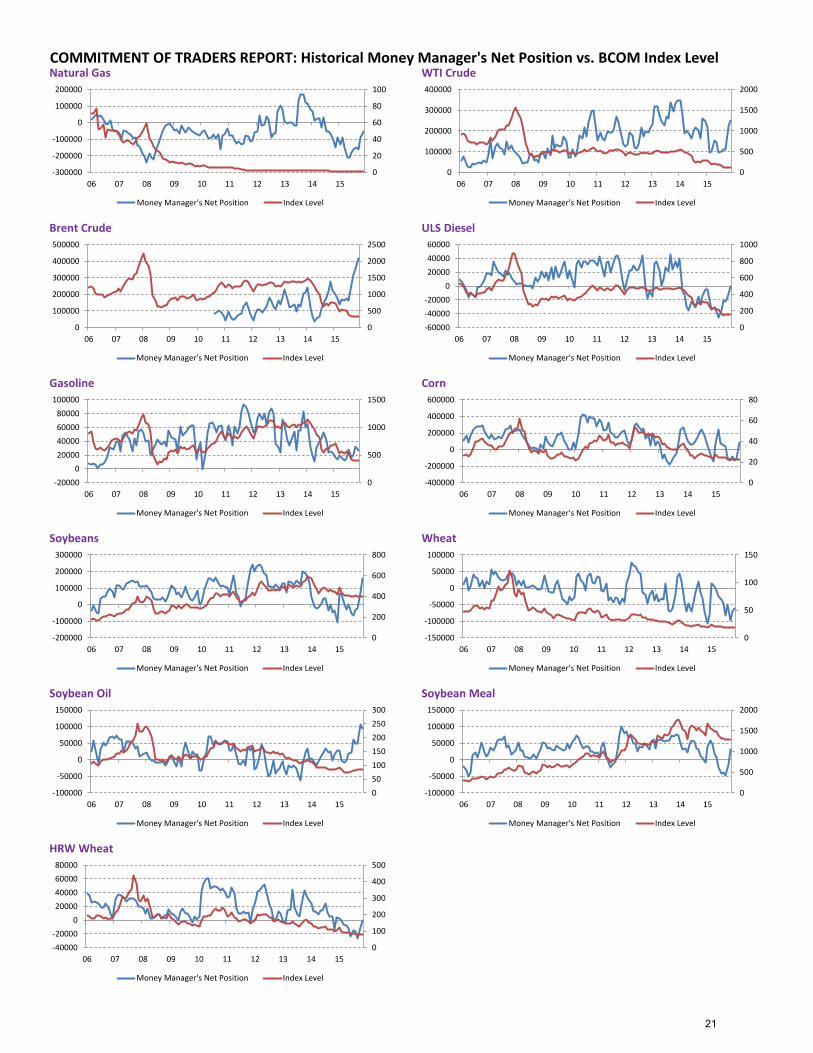
Gasoline Corn
COMMITMENT OF TRADERS REPORT: Historical Money Manager's Net Position vs. BCOM Index LevelNatural Gas WTI Crude
Brent Crude ULS Diesel
Soybeans Wheat
Soybean Oil Soybean Meal
HRW Wheat
0
20
40
60
80
100
-300000
-200000
-100000
0
100000
200000
06 07 08 09 10 11 12 13 14 15
Money Manager's Net Position Index Level
0
500
1000
1500
2000
2500
0
100000
200000
300000
400000
500000
06 07 08 09 10 11 12 13 14 15
Money Manager's Net Position Index Level
0
500
1000
1500
2000
0
100000
200000
300000
400000
06 07 08 09 10 11 12 13 14 15
Money Manager's Net Position Index Level
0
200
400
600
800
1000
-60000-40000-20000
0200004000060000
06 07 08 09 10 11 12 13 14 15
Money Manager's Net Position Index Level
0
500
1000
1500
-200000
20000400006000080000
100000
06 07 08 09 10 11 12 13 14 15
Money Manager's Net Position Index Level
0
20
40
60
80
-400000
-200000
0
200000
400000
600000
06 07 08 09 10 11 12 13 14 15
Money Manager's Net Position Index Level
0
200
400
600
800
-200000
-100000
0
100000
200000
300000
06 07 08 09 10 11 12 13 14 15
Money Manager's Net Position Index Level
0
50
100
150
-150000
-100000
-50000
0
50000
100000
06 07 08 09 10 11 12 13 14 15
Money Manager's Net Position Index Level
050100150200250300
-100000
-50000
0
50000
100000
150000
06 07 08 09 10 11 12 13 14 15
Money Manager's Net Position Index Level
0
500
1000
1500
2000
-100000
-50000
0
50000
100000
150000
06 07 08 09 10 11 12 13 14 15
Money Manager's Net Position Index Level
0
100
200
300
400
500
-40000-20000
020000400006000080000
06 07 08 09 10 11 12 13 14 15
Money Manager's Net Position Index Level
21
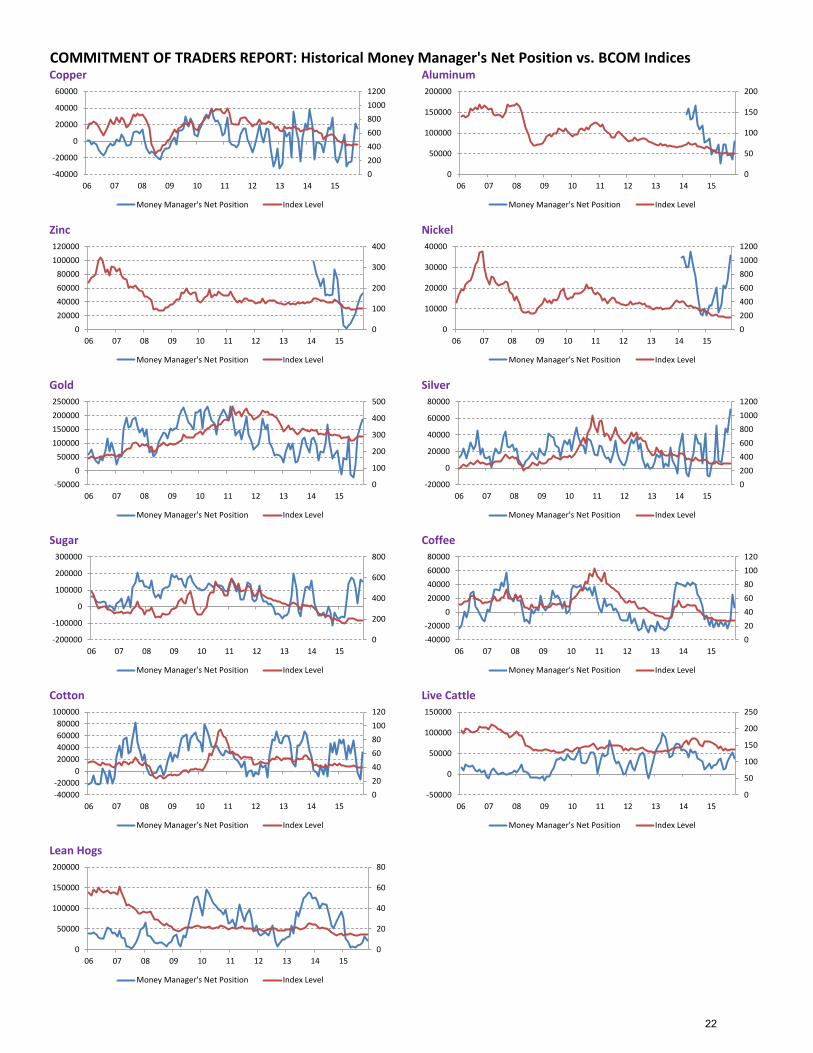
Sugar Coffee
Cotton Live Cattle
Lean Hogs
Copper Aluminum
Zinc Nickel
Gold Silver
COMMITMENT OF TRADERS REPORT: Historical Money Manager's Net Position vs. BCOM Indices
020040060080010001200
-40000
-20000
0
20000
40000
60000
06 07 08 09 10 11 12 13 14 15
Money Manager's Net Position Index Level
0
50
100
150
200
0
50000
100000
150000
200000
06 07 08 09 10 11 12 13 14 15
Money Manager's Net Position Index Level
0
100
200
300
400
020000400006000080000
100000120000
06 07 08 09 10 11 12 13 14 15
Money Manager's Net Position Index Level
020040060080010001200
0
10000
20000
30000
40000
06 07 08 09 10 11 12 13 14 15
Money Manager's Net Position Index Level
0
100
200
300
400
500
-500000
50000100000150000200000250000
06 07 08 09 10 11 12 13 14 15
Money Manager's Net Position Index Level
020040060080010001200
-20000
0
20000
40000
60000
80000
06 07 08 09 10 11 12 13 14 15
Money Manager's Net Position Index Level
0
200
400
600
800
-200000
-100000
0
100000
200000
300000
06 07 08 09 10 11 12 13 14 15
Money Manager's Net Position Index Level
020406080100120
-40000-20000
020000400006000080000
06 07 08 09 10 11 12 13 14 15
Money Manager's Net Position Index Level
020406080100120
-40000-20000
020000400006000080000
100000
06 07 08 09 10 11 12 13 14 15
Money Manager's Net Position Index Level
0
50
100
150
200
250
-50000
0
50000
100000
150000
06 07 08 09 10 11 12 13 14 15
Money Manager's Net Position Index Level
0
20
40
60
80
0
50000
100000
150000
200000
06 07 08 09 10 11 12 13 14 15
Money Manager's Net Position Index Level
22
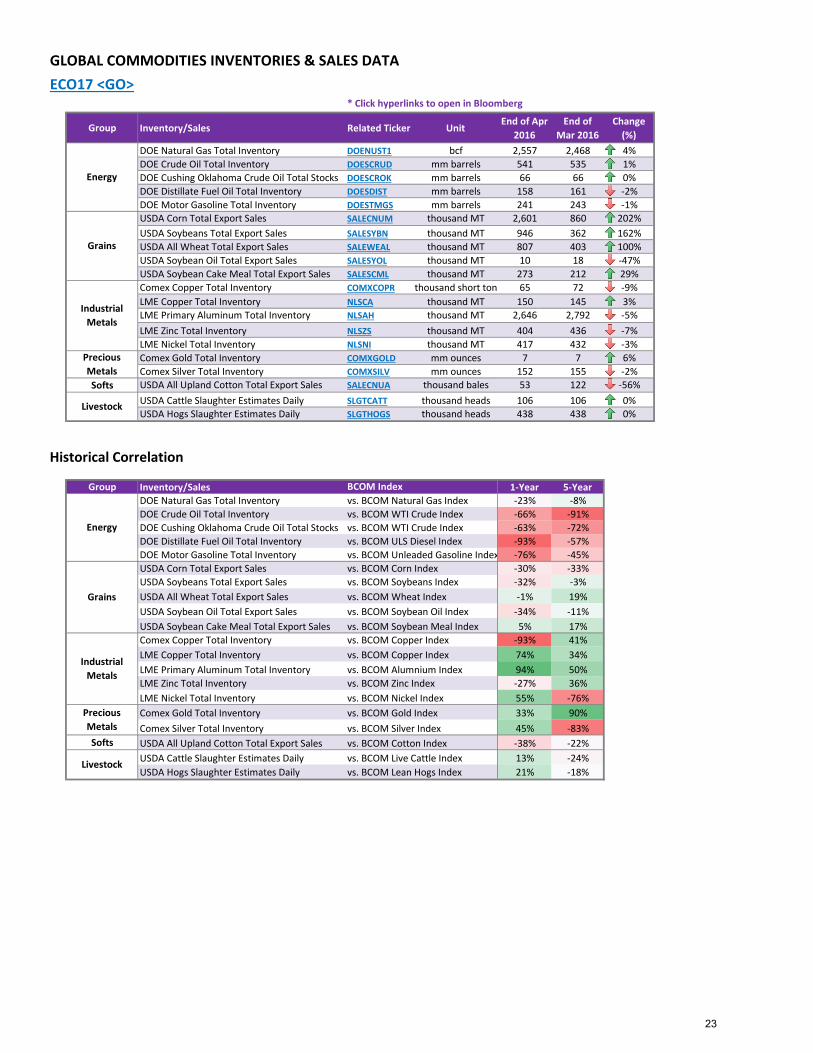
GLOBAL COMMODITIES INVENTORIES & SALES DATAECO17 <GO>
* Click hyperlinks to open in Bloomberg
Group Inventory/Sales Related Ticker UnitEnd of Apr
2016End of
Mar 2016Change
(%)DOE Natural Gas Total Inventory DOENUST1 bcf 2,557 2,468 4%DOE Crude Oil Total Inventory DOESCRUD mm barrels 541 535 1%DOE Cushing Oklahoma Crude Oil Total Stocks DOESCROK mm barrels 66 66 0%DOE Distillate Fuel Oil Total Inventory DOESDIST mm barrels 158 161 -2%DOE Motor Gasoline Total Inventory DOESTMGS mm barrels 241 243 -1%USDA Corn Total Export Sales SALECNUM thousand MT 2,601 860 202%USDA Soybeans Total Export Sales SALESYBN thousand MT 946 362 162%USDA All Wheat Total Export Sales SALEWEAL thousand MT 807 403 100%USDA Soybean Oil Total Export Sales SALESYOL thousand MT 10 18 -47%USDA Soybean Cake Meal Total Export Sales SALESCML thousand MT 273 212 29%Comex Copper Total Inventory COMXCOPR thousand short ton 65 72 -9%LME Copper Total Inventory NLSCA thousand MT 150 145 3%LME Primary Aluminum Total Inventory NLSAH thousand MT 2,646 2,792 -5%LME Zinc Total Inventory NLSZS thousand MT 404 436 -7%LME Nickel Total Inventory NLSNI thousand MT 417 432 -3%Comex Gold Total Inventory COMXGOLD mm ounces 7 7 6%Comex Silver Total Inventory COMXSILV mm ounces 152 155 -2%
Softs USDA All Upland Cotton Total Export Sales SALECNUA thousand bales 53 122 -56%USDA Cattle Slaughter Estimates Daily SLGTCATT thousand heads 106 106 0%USDA Hogs Slaughter Estimates Daily SLGTHOGS thousand heads 438 438 0%
Historical Correlation
Group Inventory/Sales 1-Year 5-YearDOE Natural Gas Total Inventory -23% -8%DOE Crude Oil Total Inventory -66% -91%DOE Cushing Oklahoma Crude Oil Total Stocks -63% -72%DOE Distillate Fuel Oil Total Inventory -93% -57%DOE Motor Gasoline Total Inventory -76% -45%USDA Corn Total Export Sales -30% -33%USDA Soybeans Total Export Sales -32% -3%USDA All Wheat Total Export Sales -1% 19%USDA Soybean Oil Total Export Sales -34% -11%USDA Soybean Cake Meal Total Export Sales 5% 17%Comex Copper Total Inventory -93% 41%LME Copper Total Inventory 74% 34%LME Primary Aluminum Total Inventory 94% 50%LME Zinc Total Inventory -27% 36%LME Nickel Total Inventory 55% -76%Comex Gold Total Inventory 33% 90%Comex Silver Total Inventory 45% -83%
Softs USDA All Upland Cotton Total Export Sales -38% -22%USDA Cattle Slaughter Estimates Daily 13% -24%USDA Hogs Slaughter Estimates Daily 21% -18%
Livestock
Livestock
Energy
Grains
Industrial Metals
Precious Metals
Energy
Grains
Industrial Metals
Precious Metals
vs. BCOM Cotton Indexvs. BCOM Live Cattle Indexvs. BCOM Lean Hogs Index
vs. BCOM Natural Gas Index
vs. BCOM Unleaded Gasoline Index
vs. BCOM Copper Indexvs. BCOM Copper Indexvs. BCOM Alumnium Indexvs. BCOM Zinc Indexvs. BCOM Nickel Index
vs. BCOM Corn Indexvs. BCOM Soybeans Indexvs. BCOM Wheat Indexvs. BCOM Soybean Oil Indexvs. BCOM Soybean Meal Index
BCOM Index
vs. BCOM WTI Crude Indexvs. BCOM WTI Crude Indexvs. BCOM ULS Diesel Index
vs. BCOM Silver Indexvs. BCOM Gold Index
23
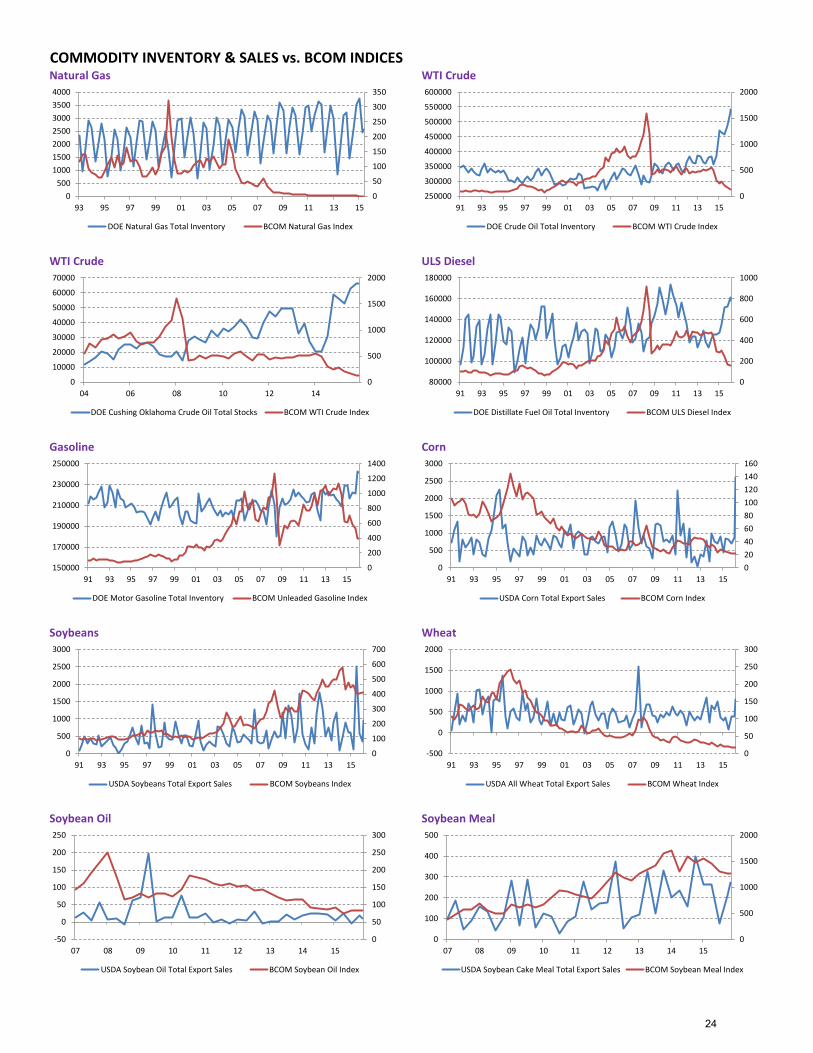
Soybeans Wheat
Soybean Oil Soybean Meal
COMMODITY INVENTORY & SALES vs. BCOM INDICESNatural Gas WTI Crude
WTI Crude ULS Diesel
Gasoline Corn
0
50
100
150
200
250
300
350
0500
1000150020002500300035004000
93 95 97 99 01 03 05 07 09 11 13 15
DOE Natural Gas Total Inventory BCOM Natural Gas Index
0
500
1000
1500
2000
250000
300000
350000
400000
450000
500000
550000
600000
91 93 95 97 99 01 03 05 07 09 11 13 15
DOE Crude Oil Total Inventory BCOM WTI Crude Index
0
500
1000
1500
2000
0
10000
20000
30000
40000
50000
60000
70000
04 06 08 10 12 14
DOE Cushing Oklahoma Crude Oil Total Stocks BCOM WTI Crude Index
0
200
400
600
800
1000
80000
100000
120000
140000
160000
180000
91 93 95 97 99 01 03 05 07 09 11 13 15
DOE Distillate Fuel Oil Total Inventory BCOM ULS Diesel Index
0
200
400
600
800
1000
1200
1400
150000
170000
190000
210000
230000
250000
91 93 95 97 99 01 03 05 07 09 11 13 15
DOE Motor Gasoline Total Inventory BCOM Unleaded Gasoline Index
020406080100120140160
0
500
1000
1500
2000
2500
3000
91 93 95 97 99 01 03 05 07 09 11 13 15
USDA Corn Total Export Sales BCOM Corn Index
0
100
200
300
400
500
600
700
0
500
1000
1500
2000
2500
3000
91 93 95 97 99 01 03 05 07 09 11 13 15
USDA Soybeans Total Export Sales BCOM Soybeans Index
0
50
100
150
200
250
300
-500
0
500
1000
1500
2000
91 93 95 97 99 01 03 05 07 09 11 13 15
USDA All Wheat Total Export Sales BCOM Wheat Index
0
50
100
150
200
250
300
-50
0
50
100
150
200
250
07 08 09 10 11 12 13 14 15
USDA Soybean Oil Total Export Sales BCOM Soybean Oil Index
0
500
1000
1500
2000
0
100
200
300
400
500
07 08 09 10 11 12 13 14 15
USDA Soybean Cake Meal Total Export Sales BCOM Soybean Meal Index
24
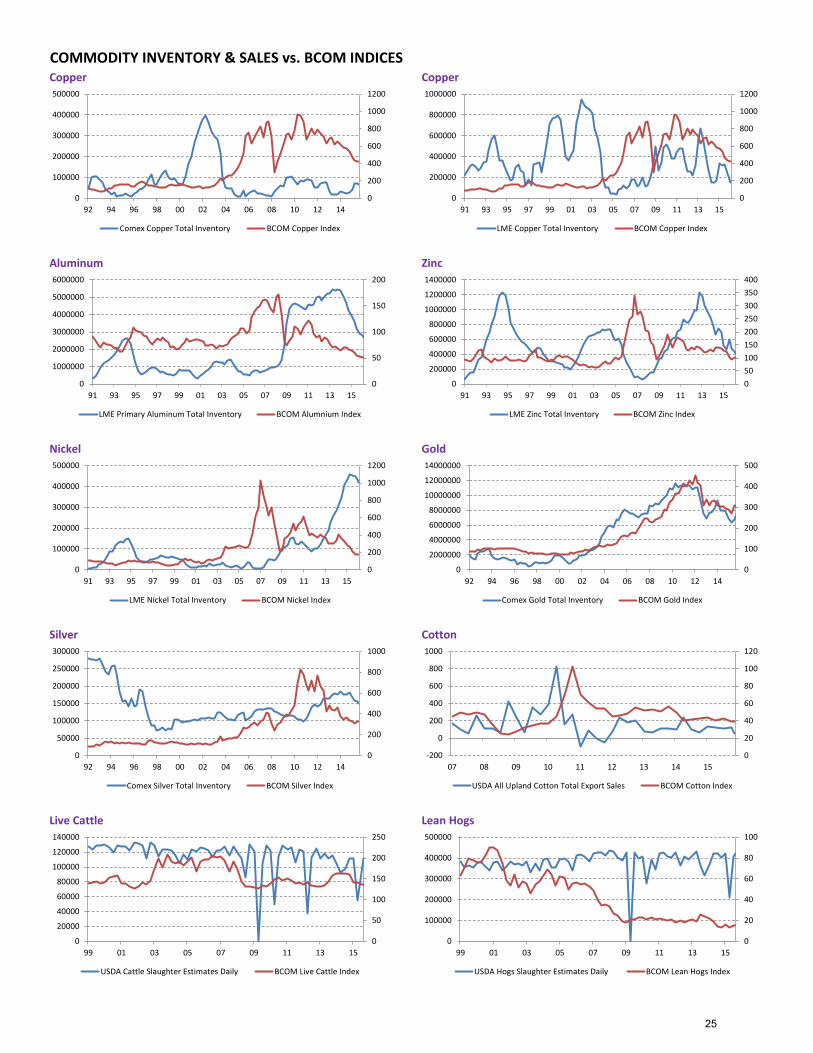
Silver Cotton
Live Cattle Lean Hogs
COMMODITY INVENTORY & SALES vs. BCOM INDICESCopper Copper
Aluminum Zinc
Nickel Gold
0
200
400
600
800
1000
1200
0
100000
200000
300000
400000
500000
92 94 96 98 00 02 04 06 08 10 12 14
Comex Copper Total Inventory BCOM Copper Index
0
200
400
600
800
1000
1200
0
200000
400000
600000
800000
1000000
91 93 95 97 99 01 03 05 07 09 11 13 15
LME Copper Total Inventory BCOM Copper Index
0
50
100
150
200
0
1000000
2000000
3000000
4000000
5000000
6000000
91 93 95 97 99 01 03 05 07 09 11 13 15
LME Primary Aluminum Total Inventory BCOM Alumnium Index
050100150200250300350400
0
200000
400000
600000
800000
1000000
1200000
1400000
91 93 95 97 99 01 03 05 07 09 11 13 15
LME Zinc Total Inventory BCOM Zinc Index
0
200
400
600
800
1000
1200
0
100000
200000
300000
400000
500000
91 93 95 97 99 01 03 05 07 09 11 13 15
LME Nickel Total Inventory BCOM Nickel Index
0
100
200
300
400
500
0
2000000
4000000
6000000
8000000
10000000
12000000
14000000
92 94 96 98 00 02 04 06 08 10 12 14
Comex Gold Total Inventory BCOM Gold Index
0
200
400
600
800
1000
0
50000
100000
150000
200000
250000
300000
92 94 96 98 00 02 04 06 08 10 12 14
Comex Silver Total Inventory BCOM Silver Index
0
20
40
60
80
100
120
-200
0
200
400
600
800
1000
07 08 09 10 11 12 13 14 15
USDA All Upland Cotton Total Export Sales BCOM Cotton Index
0
50
100
150
200
250
0
20000
40000
60000
80000
100000
120000
140000
99 01 03 05 07 09 11 13 15
USDA Cattle Slaughter Estimates Daily BCOM Live Cattle Index
0
20
40
60
80
100
0
100000
200000
300000
400000
500000
99 01 03 05 07 09 11 13 15
USDA Hogs Slaughter Estimates Daily BCOM Lean Hogs Index
25
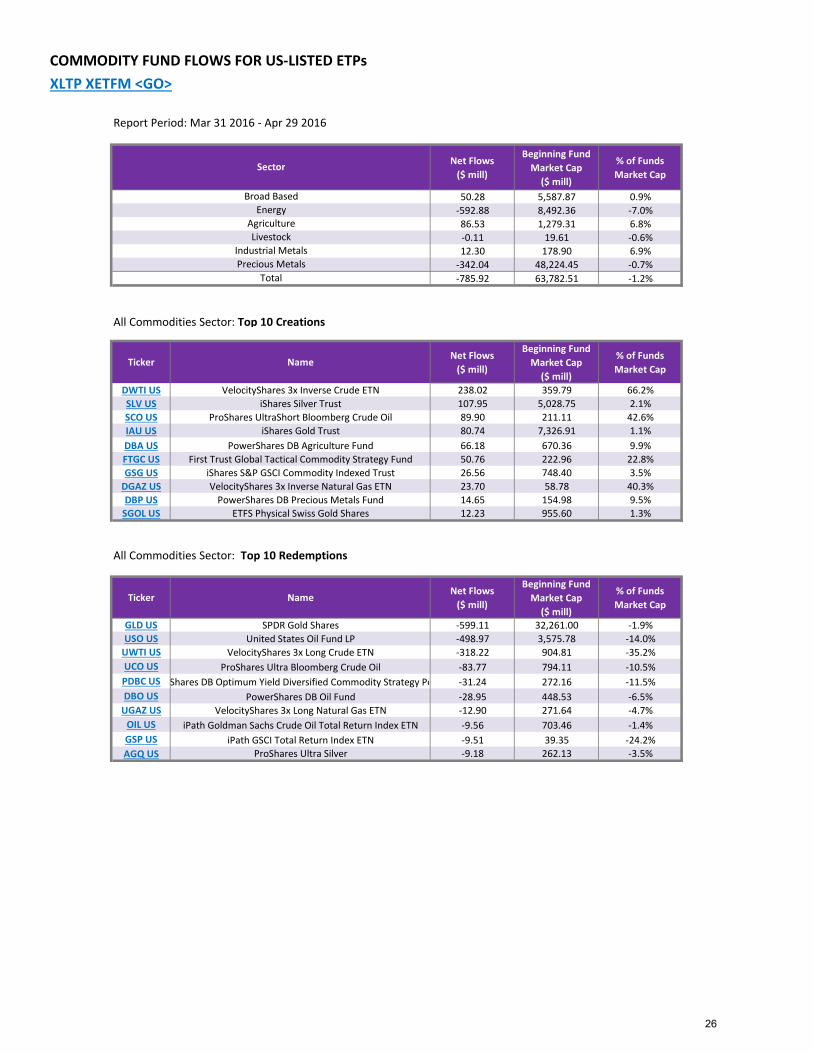
COMMODITY FUND FLOWS FOR US-LISTED ETPsXLTP XETFM <GO>
Report Period: Mar 31 2016 - Apr 29 2016
Net Flows ($ mill)
Beginning Fund Market Cap
($ mill)
% of Funds Market Cap
50.28 5,587.87 0.9%-592.88 8,492.36 -7.0%86.53 1,279.31 6.8%-0.11 19.61 -0.6%12.30 178.90 6.9%
-342.04 48,224.45 -0.7%-785.92 63,782.51 -1.2%
All Commodities Sector: Top 10 Creations
Ticker Name Net Flows ($ mill)
Beginning Fund Market Cap
($ mill)
% of Funds Market Cap
DWTI US VelocityShares 3x Inverse Crude ETN 238.02 359.79 66.2%SLV US iShares Silver Trust 107.95 5,028.75 2.1%SCO US ProShares UltraShort Bloomberg Crude Oil 89.90 211.11 42.6%IAU US iShares Gold Trust 80.74 7,326.91 1.1%DBA US PowerShares DB Agriculture Fund 66.18 670.36 9.9%FTGC US First Trust Global Tactical Commodity Strategy Fund 50.76 222.96 22.8%GSG US iShares S&P GSCI Commodity Indexed Trust 26.56 748.40 3.5%
DGAZ US VelocityShares 3x Inverse Natural Gas ETN 23.70 58.78 40.3%DBP US PowerShares DB Precious Metals Fund 14.65 154.98 9.5%
SGOL US ETFS Physical Swiss Gold Shares 12.23 955.60 1.3%
All Commodities Sector: Top 10 Redemptions
Ticker Name Net Flows ($ mill)
Beginning Fund Market Cap
($ mill)
% of Funds Market Cap
GLD US SPDR Gold Shares -599.11 32,261.00 -1.9%USO US United States Oil Fund LP -498.97 3,575.78 -14.0%
UWTI US VelocityShares 3x Long Crude ETN -318.22 904.81 -35.2%UCO US ProShares Ultra Bloomberg Crude Oil -83.77 794.11 -10.5%PDBC US Shares DB Optimum Yield Diversified Commodity Strategy Po -31.24 272.16 -11.5%DBO US PowerShares DB Oil Fund -28.95 448.53 -6.5%
UGAZ US VelocityShares 3x Long Natural Gas ETN -12.90 271.64 -4.7%OIL US iPath Goldman Sachs Crude Oil Total Return Index ETN -9.56 703.46 -1.4%GSP US iPath GSCI Total Return Index ETN -9.51 39.35 -24.2%AGQ US ProShares Ultra Silver -9.18 262.13 -3.5%
Sector
LivestockIndustrial MetalsPrecious Metals
Total
Broad BasedEnergy
Agriculture
26
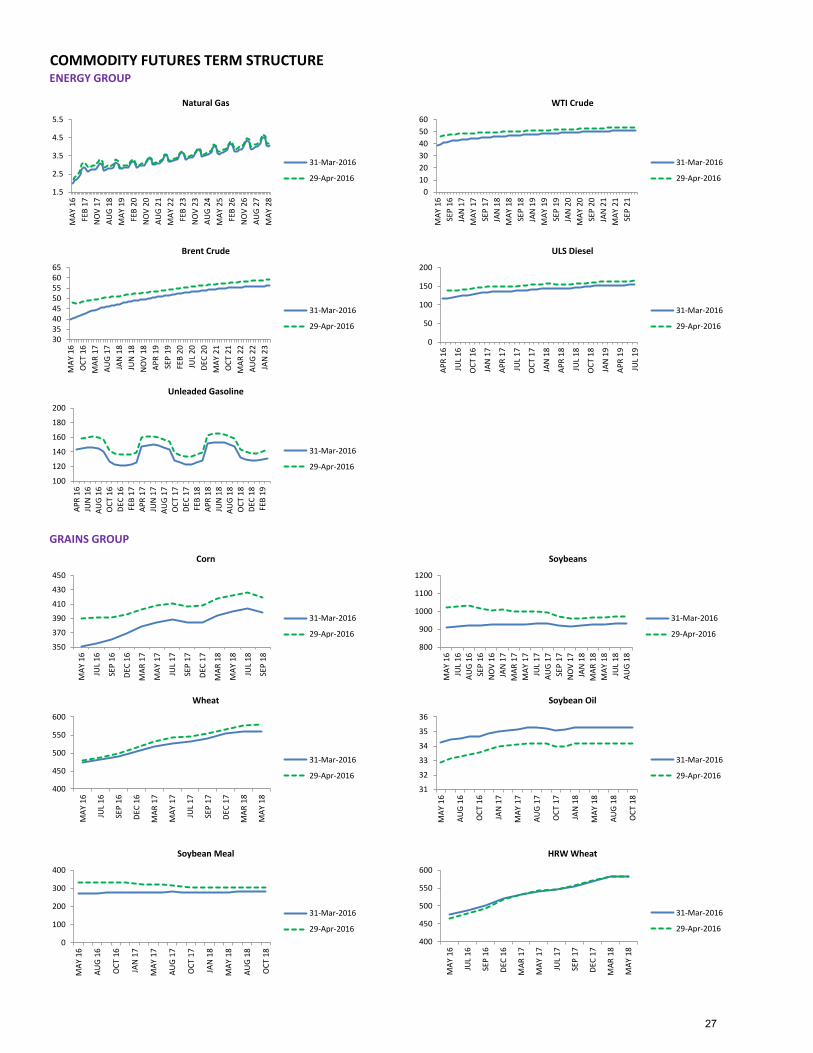
COMMODITY FUTURES TERM STRUCTUREENERGY GROUP
GRAINS GROUP
1.5
2.5
3.5
4.5
5.5
MAY
16
FEB
17N
OV
17AU
G 18
MAY
19
FEB
20N
OV
20AU
G 21
MAY
22
FEB
23N
OV
23AU
G 24
MAY
25
FEB
26N
OV
26AU
G 27
MAY
28
Natural Gas
31-Mar-2016
29-Apr-20160
102030405060
MAY
16
SEP
16JA
N 1
7M
AY 1
7SE
P 17
JAN
18
MAY
18
SEP
18JA
N 1
9M
AY 1
9SE
P 19
JAN
20
MAY
20
SEP
20JA
N 2
1M
AY 2
1SE
P 21
WTI Crude
31-Mar-2016
29-Apr-2016
3035404550556065
MAY
16
OCT
16
MAR
17
AUG
17JA
N 1
8JU
N 1
8N
OV
18AP
R 19
SEP
19FE
B 20
JUL
20DE
C 20
MAY
21
OCT
21
MAR
22
AUG
22JA
N 2
3Brent Crude
31-Mar-2016
29-Apr-2016
0
50
100
150
200
APR
16
JUL
16
OCT
16
JAN
17
APR
17
JUL
17
OCT
17
JAN
18
APR
18
JUL
18
OCT
18
JAN
19
APR
19
JUL
19
ULS Diesel
31-Mar-2016
29-Apr-2016
100
120
140
160
180
200
APR
16JU
N 1
6AU
G 16
OCT
16
DEC
16FE
B 17
APR
17JU
N 1
7AU
G 17
OCT
17
DEC
17FE
B 18
APR
18JU
N 1
8AU
G 18
OCT
18
DEC
18FE
B 19
Unleaded Gasoline
31-Mar-2016
29-Apr-2016
0
100
200
300
400
MAY
16
AUG
16
OCT
16
JAN
17
MAY
17
AUG
17
OCT
17
JAN
18
MAY
18
AUG
18
OCT
18
Soybean Meal
31-Mar-2016
29-Apr-2016400
450
500
550
600
MAY
16
JUL
16
SEP
16
DEC
16
MAR
17
MAY
17
JUL
17
SEP
17
DEC
17
MAR
18
MAY
18
HRW Wheat
31-Mar-2016
29-Apr-2016
350
370
390
410
430
450
MAY
16
JUL
16
SEP
16
DEC
16
MAR
17
MAY
17
JUL
17
SEP
17
DEC
17
MAR
18
MAY
18
JUL
18
SEP
18
Corn
31-Mar-2016
29-Apr-2016800
900
1000
1100
1200
MAY
16
JUL
16AU
G 16
SEP
16N
OV
16JA
N 1
7M
AR 1
7M
AY 1
7JU
L 17
AUG
17SE
P 17
NO
V 17
JAN
18
MAR
18
MAY
18
JUL
18AU
G 18
Soybeans
31-Mar-2016
29-Apr-2016
400
450
500
550
600
MAY
16
JUL
16
SEP
16
DEC
16
MAR
17
MAY
17
JUL
17
SEP
17
DEC
17
MAR
18
MAY
18
Wheat
31-Mar-2016
29-Apr-201631
32
33
34
35
36
MAY
16
AUG
16
OCT
16
JAN
17
MAY
17
AUG
17
OCT
17
JAN
18
MAY
18
AUG
18
OCT
18
Soybean Oil
31-Mar-2016
29-Apr-2016
27
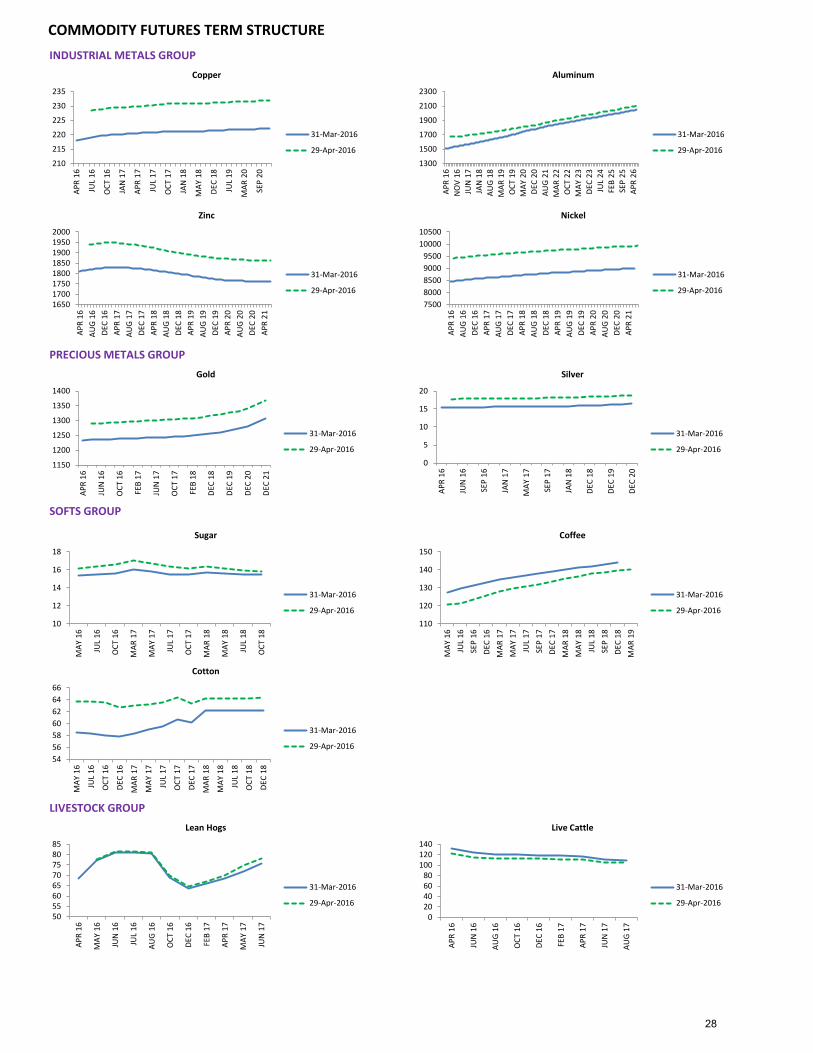
INDUSTRIAL METALS GROUP
PRECIOUS METALS GROUP
SOFTS GROUP
LIVESTOCK GROUP
210
215
220
225
230
235
APR
16
JUL
16
OCT
16
JAN
17
APR
17
JUL
17
OCT
17
JAN
18
MAY
18
DEC
18
JUL
19
MAR
20
SEP
20
Copper
31-Mar-2016
29-Apr-20161300
1500
1700
1900
2100
2300
APR
16N
OV
16JU
N 1
7JA
N 1
8AU
G 18
MAR
19
OCT
19
MAY
20
DEC
20AU
G 21
MAR
22
OCT
22
MAY
23
DEC
23JU
L 24
FEB
25SE
P 25
APR
26
Aluminum
31-Mar-2016
29-Apr-2016
1150
1200
1250
1300
1350
1400
APR
16
JUN
16
OCT
16
FEB
17
JUN
17
OCT
17
FEB
18
DEC
18
DEC
19
DEC
20
DEC
21
Gold
31-Mar-2016
29-Apr-20160
5
10
15
20
APR
16
JUN
16
SEP
16
JAN
17
MAY
17
SEP
17
JAN
18
DEC
18
DEC
19
DEC
20
Silver
31-Mar-2016
29-Apr-2016
10
12
14
16
18
MAY
16
JUL
16
OCT
16
MAR
17
MAY
17
JUL
17
OCT
17
MAR
18
MAY
18
JUL
18
OCT
18
Sugar
31-Mar-2016
29-Apr-2016110
120
130
140
150
MAY
16
JUL
16SE
P 16
DEC
16M
AR 1
7M
AY 1
7JU
L 17
SEP
17DE
C 17
MAR
18
MAY
18
JUL
18SE
P 18
DEC
18M
AR 1
9
Coffee
31-Mar-2016
29-Apr-2016
5055606570758085
APR
16
MAY
16
JUN
16
JUL
16
AUG
16
OCT
16
DEC
16
FEB
17
APR
17
MAY
17
JUN
17
Lean Hogs
31-Mar-2016
29-Apr-2016
020406080
100120140
APR
16
JUN
16
AUG
16
OCT
16
DEC
16
FEB
17
APR
17
JUN
17
AUG
17
Live Cattle
31-Mar-2016
29-Apr-2016
16501700175018001850190019502000
APR
16AU
G 16
DEC
16AP
R 17
AUG
17DE
C 17
APR
18AU
G 18
DEC
18AP
R 19
AUG
19DE
C 19
APR
20AU
G 20
DEC
20AP
R 21
Zinc
31-Mar-2016
29-Apr-2016
75008000850090009500
1000010500
APR
16AU
G 16
DEC
16AP
R 17
AUG
17DE
C 17
APR
18AU
G 18
DEC
18AP
R 19
AUG
19DE
C 19
APR
20AU
G 20
DEC
20AP
R 21
Nickel
31-Mar-2016
29-Apr-2016
54565860626466
MAY
16
JUL
16
OCT
16
DEC
16
MAR
17
MAY
17
JUL
17
OCT
17
DEC
17
MAR
18
MAY
18
JUL
18
OCT
18
DEC
18
Cotton
31-Mar-2016
29-Apr-2016
28
COMMODITY FUTURES TERM STRUCTURE
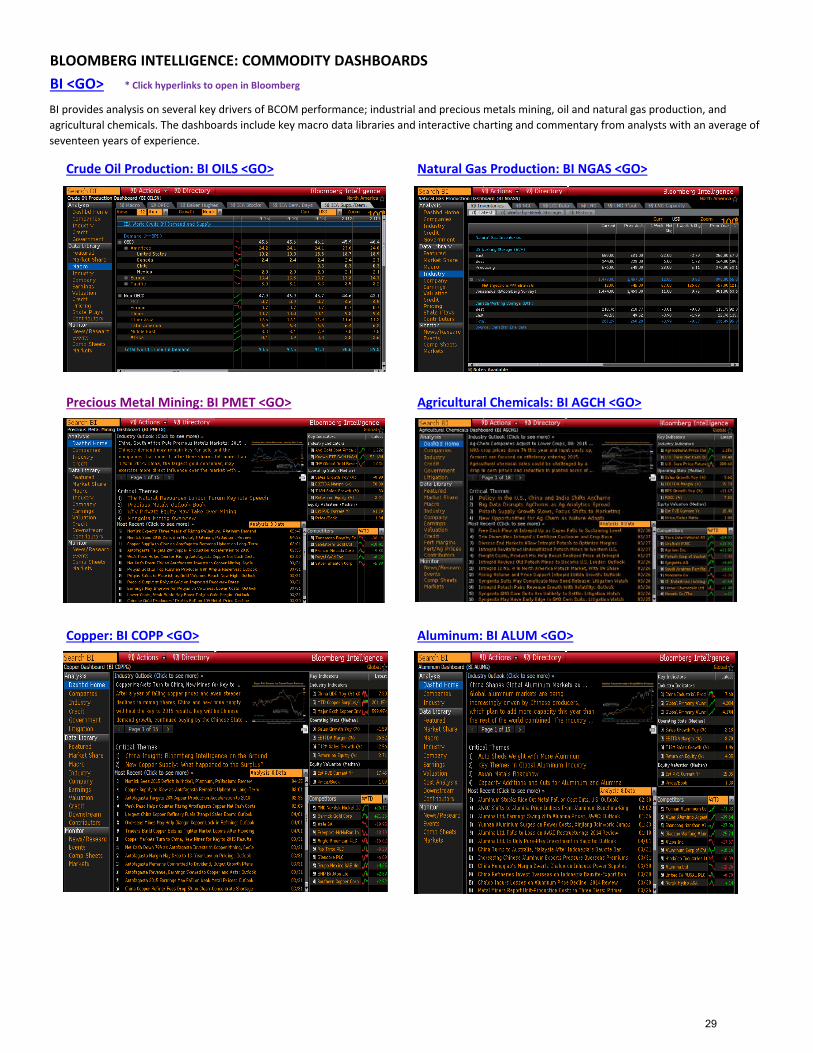
BLOOMBERG INTELLIGENCE: COMMODITY DASHBOARDS BI <GO> * Click hyperlinks to open in Bloomberg
Crude Oil Production: BI OILS <GO> Natural Gas Production: BI NGAS <GO>
Precious Metal Mining: BI PMET <GO> Agricultural Chemicals: BI AGCH <GO>
Copper: BI COPP <GO> Aluminum: BI ALUM <GO>
BI provides analysis on several key drivers of BCOM performance; industrial and precious metals mining, oil and natural gas production, and agricultural chemicals. The dashboards include key macro data libraries and interactive charting and commentary from analysts with an average of seventeen years of experience.
29
COMMODITY CHEAT SHEET FOR THE BLOOMBERG PROFESSIONAL® SERVICE
* Click hyperlinks to open in Bloomberg
Broad Commodities EnergyTop commodity news CTOP Top energy news ETOPGlobal commodity prices GLCO Top oil news OTOP Commodity playbook CPLY Crude Oil Production Dashboard BI OILSCommitments of traders report COT First Word oil NI BFWOIL Calendar of commodity events ECO17 News on oil inventories TNI OIL INV Commodity arbitrage calculator CARC Oil Buyer's Guide newsletter NI OBGBRIEFCommodity fundamental data explorer FDM Pipes & Wires newsletter NI PAWSBRIEFCommodity futures overview CMBQ Oil market analysis BOILSecurity finder SECF Nat gas spot prices BGASCommodity data contributors & broker CDAT Forward European utility markets EUMContract table menu CTM News on oil markets NI OILMARKET Seasonality chart SEAG News on OPEC NI OPEC Commodity curve analysis CCRV OPEC production and prices OPECCommodity fair values CFVL Oil markets menu OIL Commodity price forecasts CPFC Crude stored in tankers NOONCommitments of Traders Report COT Refinery outages REFOCommodity maps BMAP Oil’s decline EXT5 Commodity options monitor OMON Oil versus inflation expectations SWIFCommodities charts COSYCommodity Investors menu CMNV MetalsUS exchange traded product fund flows ETF Top metal news METT
Precious metal dashboard BI PMETGBase metals dashboard BI BMET
Commodity Indices Metals prices and data MINE Index description BCOM Index DES Precious metals prices and rates MTL Index constituent weights BCOM Index MEMB Metals Bulletin MB Listed index futures BCOM Index CT COMEX inventories COMX Option volatility surface BCOM Index OVDV LME monitor LME Seasonality chart BCOMNG Index SEAG LME implied volatilities LMIV Commodity index futures movers FMV LME warehouse inventories LMEI Commodity index ranked returns CRR
AgricultureWeather Top agriculture news YTOP Global weather database WETR Agriculture calendar AGRI US snow monitor SNOW Agriculture spot prices AGGPEU weather & utility models EUMM Agriculture supply & demand AGSD
Crop calendar CCAL
BCOM QUICK FACTS
Weighting Bias 2/3 market liquidity and 1/3 world production No. of Commodities 20 Re-balancing Frequency Annual Roll Schedule Monthly (5 day roll) Caps/Limits Single commodity: max 15%
Single commodity and its derivatives: max 25%Related commodity groups: max 33%
First Value Date 30 December 1990
The data provided in this report can be easily accessed on the Bloomberg Professional® service along with numerous news and analytical tools to help you stay on top of the commodity markets.
30
BLOOMBERG, BLOOMBERG INDICES and BCOM are trademarks or service marks of Bloomberg Finance L.P. Bloomberg Finance L.P. and its affiliates ("collectively, "Bloomberg") or Bloomberg's licensors own all proprietary right in the BLOOMBERG INDICES or BCOM. Bloomberg does not guarantee the timeliness, accuracy or completeness of any data or information relating to BLOOMBERG INDICES or BCOM. Bloomberg makes no warranty, express or implied, as to the BLOOMBERG INDICES or BCOM or any data or values relating thereto or results to be obtained therefrom, and expressly disclaims all warranties of merchantability and fitness for a particular purpose with respect thereto. It is not possible to invest directly in an index. Back-tested performance is not actual performance. Past performance is not an indication of future results. To the maximum extent allowed by law, Bloomberg, its licensors, and its and their respective employees, contractors, agents, suppliers and vendors shall have no liability or responsibility whatsoever for any injury or damages - whether direct, indirect, consequential, incidental, punitive or otherwise - arising in connection with BLOOMBERG INDICES or BCOM or any data or values relating thereto - whether arising from their negligence or otherwise. This document constitutes the provision of factual information, rather than financial product advice. Nothing in the BLOOMBERG INDICES or BCOM shall constitute or be construed as an offering of financial instruments or as investment advice or investment recommendations (i.e., recommendations as to whether or not to “buy”, “sell”, “hold”, or to enter or not to enter into any other transaction involving any specific interest or interests) by Bloomberg or its affiliates or a recommendation as to an investment or other strategy by Bloomberg or its affiliates. Data and other information available via the BLOOMBERG INDICES or BCOM should not be considered as information sufficient upon which to base an investment decision. All information provided by the BLOOMBERG INDICES or BCOM is impersonal and not tailored to the needs of any person, entity or group of persons. Bloomberg and its affiliates do not express an opinion on the future or expected value of any security or other interest and do not explicitly or implicitly recommend or suggest an investment strategy of any kind. Customers should consider obtaining independent advice before making any financial decisions. © 2016 Bloomberg Finance L.P. All rights reserved. This document and its contents may not be forwarded or redistributed without the prior consent of Bloomberg.
31
Related Documents