Blood pressure and hypertension in an American colony (Puerto Rico) and on the USA mainland compared, 1886–1930 Ricardo Godoy a, * , Elizabeth Goodman a , Clarence Gravlee b , Richard Levins c , Craig Seyfried a , Mariana Caram a , Naveen Jha a a Heller School, Brandeis University, Waltham, MA 02454-9110, USA b Department of Anthropology, University of Florida, Gainesville, FL 32611-7305, USA c Harvard School of Public Health, Harvard University, 665 Huntington Avenue, Boston, MA 02115, USA Received 5 March 2007; accepted 5 March 2007 Abstract We compare blood pressure and hypertension between adult men on the USA mainland and in Puerto Rico born during 1886–1930 to test hypotheses about the link between cardiovascular health and large socioeconomic and political changes in society: (a) 8853 men surveyed in Puerto Rico in 1965 and (b) 1449 non-Hispanic White men surveyed on the mainland during 1971–1975. Systolic and diastolic blood pressure and hypertension were regressed separately on demographic and socioeconomic variables and cardiovas- cular risk factors. Mainland men not taking anti-hypertensive medication showed statistically significant improvements in systolic blood pressure and hypertension at the beginning of the century and men in Puerto Rico showed improvements in diastolic blood pressure but only during the last two quinquenniums. An average man born on the mainland during the last birth quinquennium (1926–1930) had 7.4–8.7 mmHg lower systolic blood pressure and was 61% less likely to have systolic hypertension than one born before 1901. On average Puerto Rican men born during 1921–1925 had 1.7 mmHg lower diastolic blood pressure than men born before 1901. Analyses of secular trends in cardiovascular health complements analyses of secular trends in anthropometric indicators and together provide a fuller view of the changing health status of a population. # 2007 Elsevier B.V. All rights reserved. JEL classification : I12; I32; N33 Keywords: Blood pressure; Hypertension; Puerto Rico; Secular trends; USA; Stress; Male living standards; Anthropometric history http://www.elsevier.com/locate/ehb Economics and Human Biology 5 (2007) 255–279 * Corresponding author. Tel.: +1 781 736 2784/2770; fax: +1 781 736 2774. E-mail address: [email protected] (R. Godoy). 1570-677X/$ – see front matter # 2007 Elsevier B.V. All rights reserved. doi:10.1016/j.ehb.2007.03.002

Welcome message from author
This document is posted to help you gain knowledge. Please leave a comment to let me know what you think about it! Share it to your friends and learn new things together.
Transcript
Blood pressure and hypertension in an American
colony (Puerto Rico) and on the USA
mainland compared, 1886–1930
Ricardo Godoy a,*, Elizabeth Goodman a, Clarence Gravlee b,Richard Levins c, Craig Seyfried a, Mariana Caram a, Naveen Jha a
a Heller School, Brandeis University, Waltham, MA 02454-9110, USAb Department of Anthropology, University of Florida, Gainesville, FL 32611-7305, USA
c Harvard School of Public Health, Harvard University, 665 Huntington Avenue, Boston, MA 02115, USA
Received 5 March 2007; accepted 5 March 2007
Abstract
We compare blood pressure and hypertension between adult men on the USA mainland and in Puerto
Rico born during 1886–1930 to test hypotheses about the link between cardiovascular health and large
socioeconomic and political changes in society: (a) 8853 men surveyed in Puerto Rico in 1965 and (b) 1449
non-Hispanic White men surveyed on the mainland during 1971–1975. Systolic and diastolic blood pressure
and hypertension were regressed separately on demographic and socioeconomic variables and cardiovas-
cular risk factors. Mainland men not taking anti-hypertensive medication showed statistically significant
improvements in systolic blood pressure and hypertension at the beginning of the century and men in Puerto
Rico showed improvements in diastolic blood pressure but only during the last two quinquenniums. An
average man born on the mainland during the last birth quinquennium (1926–1930) had 7.4–8.7 mmHg
lower systolic blood pressure and was 61% less likely to have systolic hypertension than one born before
1901. On average Puerto Rican men born during 1921–1925 had�1.7 mmHg lower diastolic blood pressure
than men born before 1901. Analyses of secular trends in cardiovascular health complements analyses of
secular trends in anthropometric indicators and together provide a fuller view of the changing health status
of a population.
# 2007 Elsevier B.V. All rights reserved.
JEL classification : I12; I32; N33
Keywords: Blood pressure; Hypertension; Puerto Rico; Secular trends; USA; Stress; Male living standards;
Anthropometric history
http://www.elsevier.com/locate/ehb
Economics and Human Biology 5 (2007) 255–279
* Corresponding author. Tel.: +1 781 736 2784/2770; fax: +1 781 736 2774.
E-mail address: [email protected] (R. Godoy).
1570-677X/$ – see front matter # 2007 Elsevier B.V. All rights reserved.
doi:10.1016/j.ehb.2007.03.002
1. Introduction
Structural changes in an economy have been associated with a temporary decline in the
biological standard of living (Bogin and Keep, 1999; Komlos, 1998; Komlos and Baur, 2004;
Komlos and Lauderdale, 2007; Steckel and Rose, 2002). The record of industrial nations
during the 19th century suggests that the decline of agriculture and the growth of employment
in industries and services induced migration from the countryside to the city. Urbanization, in
turn, produced changes in health risk factors, such as diet, physical activity, social capital,
and pathogen exposure. The link between structural transformations in an economy and
the biological standard of living has been well documented through analyses of secular
changes in physical stature (Fogel et al., 1982). Economic historians have shown that onset
of industrialization during the 19th century in Europe and the USA was associated with a
short-term decline in adult physical stature (Arora, 2005; Fogel, 2005; Haines, 2004; Komlos,
1994).
We build on a growing body of research on the biological standard of living to explore the
association between large socioeconomic and political changes in society and secular changes in
a biological indicator of the standard of living that has received scant attention from economists
or historians but that has received much attention from social epidemiologists and human
biologists: adult blood pressure.
Blood pressure reflects the force of blood against artery walls (O’Rourke, 1990). Systolic
blood pressure (SBP) measures the maximum force created as the heart contracts and blood
expands in the arteries; diastolic blood pressure (DBP) measures the minimum force maintained
when the ventricles of the heart relax. Risk factors for high blood pressure restrict blood flow and
increase the pressure placed on artery walls. Different risk factors affect blood pressure in
different ways. For example, elevated salt intake increases blood volume, making it harder for
blood to flow through arteries. Obesity increases salt retention and promotes constriction of blood
vessels (Montani et al., 2002).
Blood pressure is a complex phenotype influenced by multiple genetic and environmental
factors over the life course. Growing evidence suggests that blood pressure reflects conditions
during a person’s early years and therefore provides a convenient biological barometer of past
socioeconomic conditions. Adverse socioeconomic conditions during childhood increase the risk
of coronary heart disease in adulthood (Blane et al., 1996). Huxley et al. (2000) reviewed over 80
studies and concluded that birth weight bore a negative association with adult systolic blood
pressure (see also Cruickshank et al., 2005). Impaired fetal development, maternal smoking
during pregnancy, absence of breast-feeding, and high salt consumption as an infant all bore a
positive association with blood pressure as an adult (Lawlor and Smith, 2005; Barker, 1995,
2001; Barker et al., 2002). Juonala et al. (2005) found that childhood obesity bore a positive
association with stiffness of arteries as an adult. Confounders, such as adult obesity and
psychosocial stress, mediate the association between events during early life and adult
cardiovascular health (Goya et al., 1996; Regidor et al., 2006; Hardy et al., 2003; Huxley et al.,
2002).
The earliest measures of blood pressure date back to the turn of the 20th century (Evans,
2003). However, economists and historians have not used blood pressure to assess the biological
costs of large socioeconomic and political changes in society. For example, a search for
‘‘hypertension/blood pressure’’ and ‘‘industrialization/modernization’’ in EconLit and in the
economics and history journals of JSTOR, two main literature databases for economic historians
and behavioral scientists, turned up just one article about industrialization’s impact on blood
R. Godoy et al. / Economics and Human Biology 5 (2007) 255–279256
pressure (Possas and Bobadilla, 1992). The article mentioned modernization’s adverse effect on
blood pressure in Brazil, Colombia, and Mexico, but did not discuss or measure it. Analyses of
secular trends in cardiovascular health complements analyses of secular trends in anthropometric
indicators and together provide a more comprehensive view of the changing health status of a
population.
To explore the association between large socioeconomic and political changes in society
and secular trends in adult blood pressure we turn to the modern history of the Caribbean
island of Puerto Rico. A colony of Spain from the late 15th century until the late 19th century,
Puerto Rico became a territory of the USA after the Spanish-American War of 1898.
The USA introduced many changes in Puerto Rico during the first three decades of the
20th century, including reforms of public health, schooling, taxes, trade, and land tenure,
and promoted the development of commercial agriculture (Dietz, 1987; Perloff, 1950;
Godoy et al., 2003, 2007). In 1917 Congress granted the people of Puerto Rico USA
citizenship. Together, the takeover and the subsequent socioeconomic and political changes
amounted to a significant structural transformation of Puerto Rican society and economy. In
contrast, the mainland had transitioned out of agriculture into an industrial economy during the
19th century, so during the early 20th century the mainland economy was well on its way to
industrialization.
For several reasons Puerto Rico provides a good case study to assess whether large
socioeconomic and political changes bear an association with secular trends in adult blood
pressure. First, because events early in the lifecycle affect adult blood pressure, one should be
able to detect and compare the strength of the association between adult blood pressure and date
of birth between people born during the late 19th and early 20th centuries in Puerto Rico and their
peers on the mainland. Since Puerto Rico belongs to the USA, people on the mainland provide an
appropriate contrast. Second, since Puerto Rico has been and remains much poorer than the
mainland (Lefort, 1997), the comparison allows one to highlight differences in cardiovascular
health between a developing and a developed area.
The literature yields three hypotheses that guide our analysis.
1. Economic history. As noted, economic historians have found evidence that physical stature in
the USA and Europe declined during the onset of industrialization in the first half of the 19th
century. If we assume that biological indicators of living standards are affected by large
socioeconomic and political changes, then we would hypothesize that blood pressure and
hypertension in Puerto Rico during the late 19th and early 20th centuries might increase
because of the socioeconomic and political changes in Puerto Rico. Several strands of
evidence support the hypothesis. Lipowicz (2007) describes a possible temporary increase in
hypertension in Poland during the 1980s that followed the collapse of communism and the
emergence of the market economy. Studies of contemporary populations in developing nations
also find a positive association between blood pressure and economic modernization (Dressler,
1999; Grossman and Rosenthal, 1993; James, 1987; McGarvey, 1999; Sobngwi et al., 2004;
Ulijaszek et al., 2005; Hajjar et al., 2006).
2. Social epidemiology. Research in social epidemiology of industrialized nations suggests that
secular improvements in health have been generalized, though more marked among some
groups than among others (McCarron et al., 2001; Sjøl et al., 1998). McCarron et al. (2002)
documented a secular decline in blood pressure during 1948–1998 among people between 5
and 34 years of age in six high-income nations. McCarron et al. (2001) and Sjøl et al. (1998)
used multiple cohorts and found a secular decline in systolic and diastolic blood pressure
R. Godoy et al. / Economics and Human Biology 5 (2007) 255–279 257
among both women and men in Scotland (1948–1968) and Denmark (1964–1991).1 Burt et al.
(1995) drew on repeated cross-sectional surveys done during 1960–1991 on the USA
mainland and found a decline in systolic blood pressure. The decline was most marked for
Black women, followed by Black men, White women, and White men in that order. If secular
improvements of health have been general in the USA, though more marked and more readily
visible among people of lower socioeconomic status, then we would hypothesize that people in
Puerto Rico would have experienced a higher rate of secular improvement in blood pressure
than their peers on the mainland.
3. Political economy. Structural transformations create socioeconomic forces working in
opposite directions that may produce ambiguous net effects on secular trends in blood
pressure. For instance, Guarnaccia et al. (1996) describe how the structural transformation of
the economy, society, and political system in Puerto Rico undermined the lives of the working
class and poor, and link the transformations to increasing signs of stress, such as nervous
breakdowns, anxiety, and hysteria. Nonetheless, the 20th century also witnessed increased
investments in public schools and public health in Puerto Rico (Clark et al., 1930; Rigau-
Perez, 2000), which would have improved awareness and prevention of disease. This line of
thinking would predict that the secular trend in blood pressure would be ambiguous owing to
forces working in opposite directions.
2. Data and methods
We compare secular trends in cardiovascular health between two groups of USA citizens:
(a) men born during 1886–1930 in Puerto Rico and surveyed as part of the Puerto Rico
Heart Health Program (PRHHP) in 1965 and (b) non-Hispanic White men (hereafter Whites)
born in the rest of the USA (hereafter mainland) during the same period and surveyed
during 1971–1975 as part of the first National Health and Nutrition Examination Survey
(NHANES-I).2
2.1. Study subjects: PRHHP and NHANES-I
Most of the large, representative databases on general health for the USA do not contain data
on people in Puerto Rico. NHANES surveys, the best source of general health data for the USA,
include few Hispanics, do not follow people over time, and exclude people in Puerto Rico.
NHANES-I (1971–1975) included only 156 Puerto Ricans on the mainland. The Hispanic Health
and Nutrition and Examination Survey (HHANES, 1984) increased the sample of Hispanics. It
included 2606 people living in New York City, Connecticut, and New Jersey who self-identified
as Puerto Ricans, but excluded people in Puerto Rico. The only representative sample of general
health data for adults in Puerto Rico we identified is the Puerto Rico Heart Health Program panel
study done during 1965–1980 in Puerto Rico by the National Heart, Lung, and Blood Institute of
the USA Public Health Services (Garcıa-Palmieri et al., 2002). Researchers have used PRHHP to
R. Godoy et al. / Economics and Human Biology 5 (2007) 255–279258
1 In Scotland, men experienced stronger improvements in diastolic blood pressure than women, but women and men
experienced the same rate of improvement in systolic blood pressure. In Denmark women experienced stronger
improvements in both systolic and diastolic blood pressure than men.2 As of February 2007, access to NHANES was available to the public at the following web address: http://www.cdc.gov/
nchs/nhanes.htm. For PRHHP data contact Sean Coady ([email protected]) or Paul Sorlie ([email protected]) at
NHLBI/DECA/EBP, 6701 Rockledge Center MSC 7934, Bethesda, MD 20892, USA, Tel.: +1 301 435 0456.
study the association between blood pressure and cardiovascular risk factors (Benson et al., 1966;
Costas et al., 1981; Garcıa-Palmieri et al., 1969, 1970, 1982, 1984; Gordon et al., 1974, 1981;
Sorlie et al., 1982; Sorlie and Garcıa-Palmieri, 1990), but not to study secular trends in
cardiovascular health.
PRHHP included only men born during 1886–1930 who were 35–79 years old at the time of
the baseline survey in 1965. PRHHP included three follow-up surveys of the same people, each
survey done 3–4 years apart. We use data only from the first survey.3 The sample for PRHHP
came from four rural areas of northeast Puerto Rico largely populated by farmers and from three
urban areas (Crespo et al., 2002). Because PRHHP excluded women, we limit the comparison to
men.
For comparative purposes we used NHANES-I because it took place during 1971–1975, at
about the same time as the PRHHP survey in Puerto Rico. NHANES-I included people 1–74
years old. Had we used later waves of NHANES we would have introduced a selectivity bias
because men on the mainland with low blood pressure live longer than men with high blood
pressure (Borhani et al., 1963; Kannel, 1975; Paffenbarger et al., 1966). Eighty percent of the
NHANES-I sample is White and 19% is Black. We do the main analysis with Whites because
minorities accounted for a small share of the sample, but in the sensitivity analysis we do add
Blacks to ensure that the main results of the analysis hold up.
Researchers doing analysis of blood pressure have followed two approaches when deciding
whether to include people taking medications against hypertension. Some researchers include
people taking medication in the analysis and add a dummy variable for whether the person took
medication (Gravlee and Dressler, 2005). Others exclude people taking medication against
hypertension (Lipowicz, 2007; McGrath et al., 2006). In the first set of regressions (Table 4A) we
follow the latter approach and exclude 873 people or 8.9% of the sample from Puerto Rico and
118 people or 7.5% of the sample from the mainland because they were taking medication
against hypertension at the time of the surveys. Since excluding such people would exclude
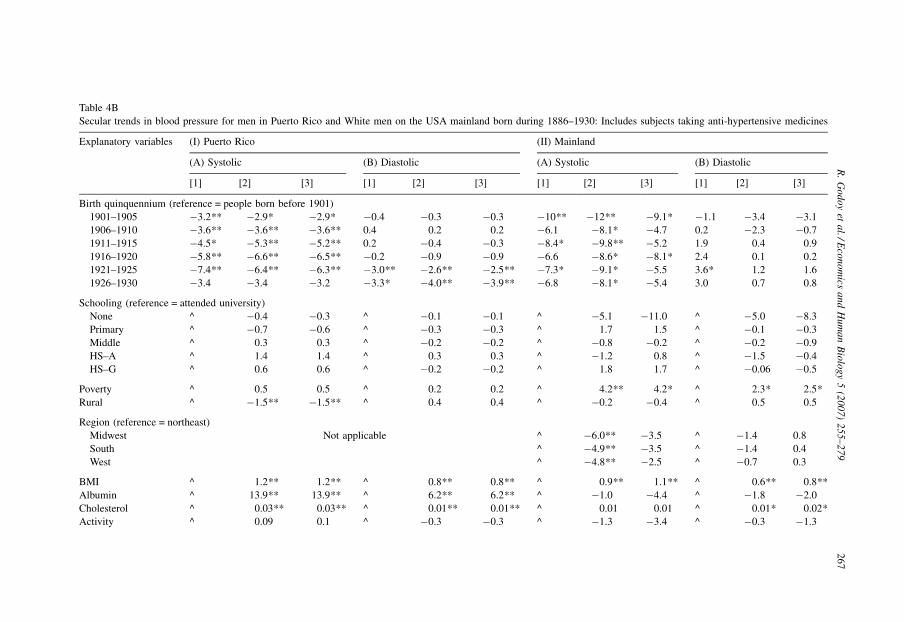
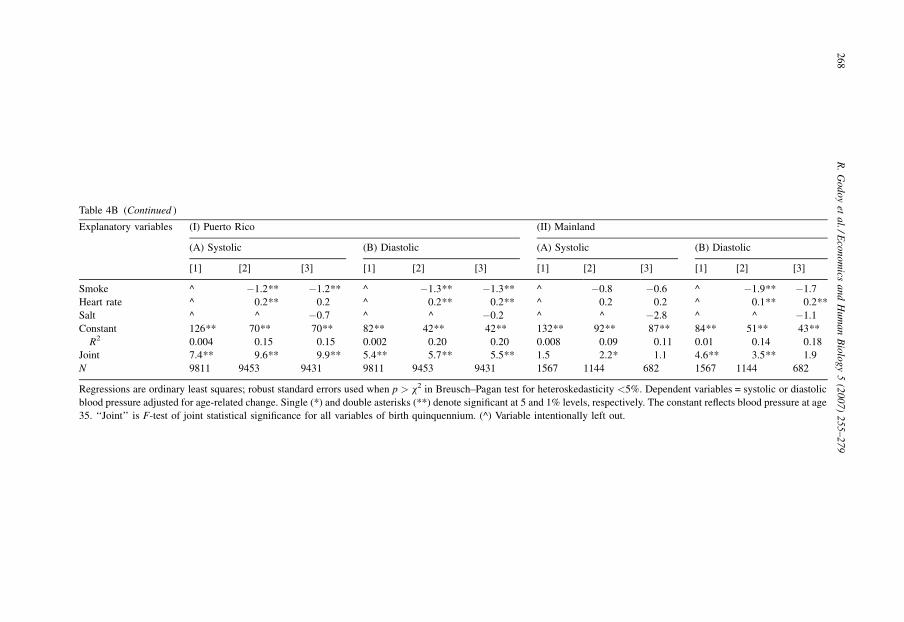
people with high blood pressure, our results could be biased. For this reason, in Table 4B we
present regression results with the sample that includes people taking medication against
hypertension.
The sample for the main analysis includes 8853 men in Puerto Rico (rural = 2712,
urban = 6141) and 1449 White men on the mainland (rural = 591, urban = 858) with data on
blood pressure who were not taking medications against hypertension.
2.2. Methods to create variables
2.2.1. Outcome variables: Blood pressure and hypertension
As outcome variables we use systolic and diastolic blood pressure and categorical variables
for two forms of hypertension. We use both systolic and diastolic blood pressure because they had
relativity low correlation coefficients (0.72 in Puerto Rico and 0.62 on the mainland) and because
they capture different dimensions of health. Systolic blood pressure predicts strokes and coronary
heart disease better than does diastolic blood pressure (Black, 2004), but diastolic blood pressure
R. Godoy et al. / Economics and Human Biology 5 (2007) 255–279 259
3 Since PRHHP is a panel study, the decision of which year to use is partly arbitrary. We opted to use the first survey to
ensure we had the largest sample size; the sample size of later surveys would be smaller from attrition. Also, since we
want to estimate the association between cardiovascular health and the socioeconomic changes in Puerto Rico during the
early 20th century, the earliest survey is more appropriate.
provides a better measure of overall, chronic physical stress or force on the arterial walls. We
created dummy variables for systolic and diastolic hypertension based on clinical cut-off points
of, respectively, 140 and 90 mmHg (NLBHI, 2006).
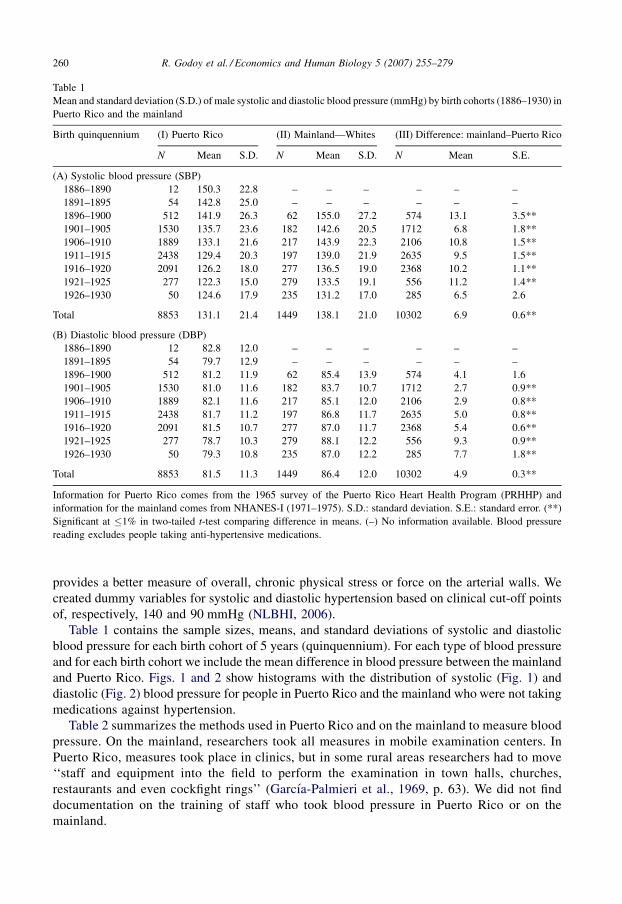
Table 1 contains the sample sizes, means, and standard deviations of systolic and diastolic
blood pressure for each birth cohort of 5 years (quinquennium). For each type of blood pressure
and for each birth cohort we include the mean difference in blood pressure between the mainland
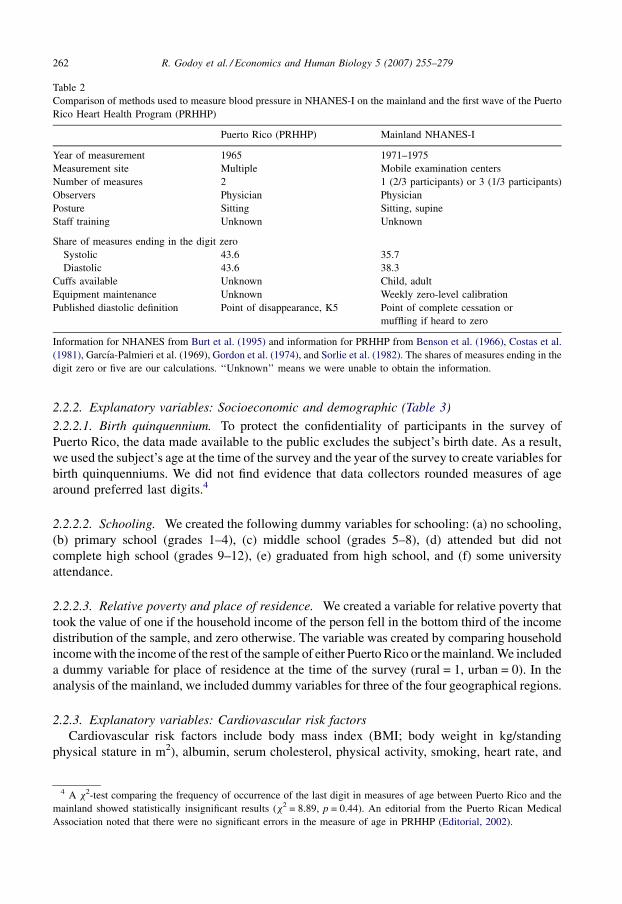
and Puerto Rico. Figs. 1 and 2 show histograms with the distribution of systolic (Fig. 1) and
diastolic (Fig. 2) blood pressure for people in Puerto Rico and the mainland who were not taking
medications against hypertension.
Table 2 summarizes the methods used in Puerto Rico and on the mainland to measure blood
pressure. On the mainland, researchers took all measures in mobile examination centers. In
Puerto Rico, measures took place in clinics, but in some rural areas researchers had to move
‘‘staff and equipment into the field to perform the examination in town halls, churches,
restaurants and even cockfight rings’’ (Garcıa-Palmieri et al., 1969, p. 63). We did not find
documentation on the training of staff who took blood pressure in Puerto Rico or on the
mainland.
R. Godoy et al. / Economics and Human Biology 5 (2007) 255–279260
Table 1
Mean and standard deviation (S.D.) of male systolic and diastolic blood pressure (mmHg) by birth cohorts (1886–1930) in
Puerto Rico and the mainland
Birth quinquennium (I) Puerto Rico (II) Mainland—Whites (III) Difference: mainland–Puerto Rico
N Mean S.D. N Mean S.D. N Mean S.E.
(A) Systolic blood pressure (SBP)
1886–1890 12 150.3 22.8 – – – – – –
1891–1895 54 142.8 25.0 – – – – – –
1896–1900 512 141.9 26.3 62 155.0 27.2 574 13.1 3.5**
1901–1905 1530 135.7 23.6 182 142.6 20.5 1712 6.8 1.8**
1906–1910 1889 133.1 21.6 217 143.9 22.3 2106 10.8 1.5**
1911–1915 2438 129.4 20.3 197 139.0 21.9 2635 9.5 1.5**
1916–1920 2091 126.2 18.0 277 136.5 19.0 2368 10.2 1.1**
1921–1925 277 122.3 15.0 279 133.5 19.1 556 11.2 1.4**
1926–1930 50 124.6 17.9 235 131.2 17.0 285 6.5 2.6
Total 8853 131.1 21.4 1449 138.1 21.0 10302 6.9 0.6**
(B) Diastolic blood pressure (DBP)
1886–1890 12 82.8 12.0 – – – – – –
1891–1895 54 79.7 12.9 – – – – – –
1896–1900 512 81.2 11.9 62 85.4 13.9 574 4.1 1.6
1901–1905 1530 81.0 11.6 182 83.7 10.7 1712 2.7 0.9**
1906–1910 1889 82.1 11.6 217 85.1 12.0 2106 2.9 0.8**
1911–1915 2438 81.7 11.2 197 86.8 11.7 2635 5.0 0.8**
1916–1920 2091 81.5 10.7 277 87.0 11.7 2368 5.4 0.6**
1921–1925 277 78.7 10.3 279 88.1 12.2 556 9.3 0.9**
1926–1930 50 79.3 10.8 235 87.0 12.2 285 7.7 1.8**
Total 8853 81.5 11.3 1449 86.4 12.0 10302 4.9 0.3**
Information for Puerto Rico comes from the 1965 survey of the Puerto Rico Heart Health Program (PRHHP) and
information for the mainland comes from NHANES-I (1971–1975). S.D.: standard deviation. S.E.: standard error. (**)
Significant at �1% in two-tailed t-test comparing difference in means. (–) No information available. Blood pressure
reading excludes people taking anti-hypertensive medications.
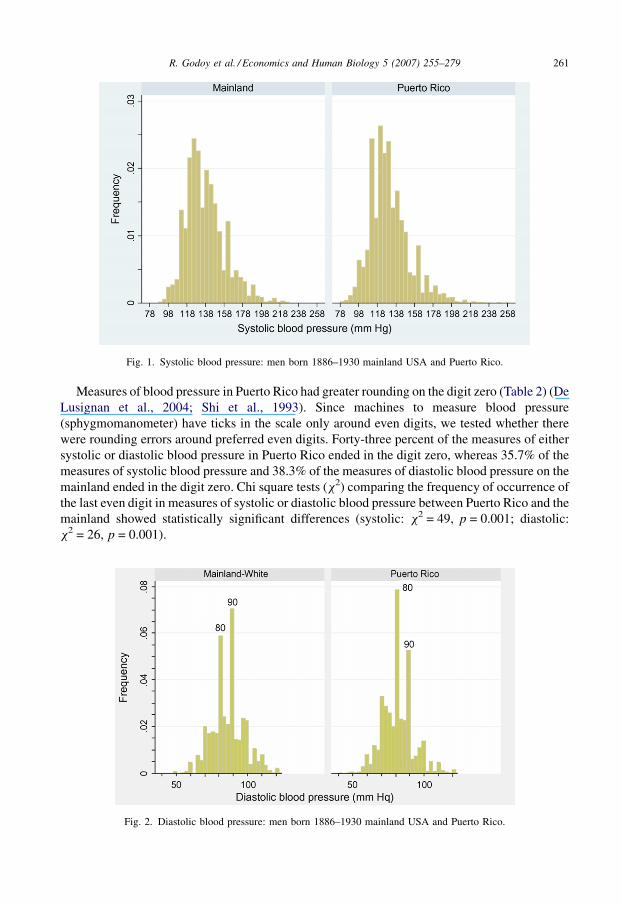
Measures of blood pressure in Puerto Rico had greater rounding on the digit zero (Table 2) (De
Lusignan et al., 2004; Shi et al., 1993). Since machines to measure blood pressure
(sphygmomanometer) have ticks in the scale only around even digits, we tested whether there
were rounding errors around preferred even digits. Forty-three percent of the measures of either
systolic or diastolic blood pressure in Puerto Rico ended in the digit zero, whereas 35.7% of the
measures of systolic blood pressure and 38.3% of the measures of diastolic blood pressure on the
mainland ended in the digit zero. Chi square tests (x2) comparing the frequency of occurrence of
the last even digit in measures of systolic or diastolic blood pressure between Puerto Rico and the
mainland showed statistically significant differences (systolic: x2 = 49, p = 0.001; diastolic:
x2 = 26, p = 0.001).
R. Godoy et al. / Economics and Human Biology 5 (2007) 255–279 261
Fig. 1. Systolic blood pressure: men born 1886–1930 mainland USA and Puerto Rico.
Fig. 2. Diastolic blood pressure: men born 1886–1930 mainland USA and Puerto Rico.
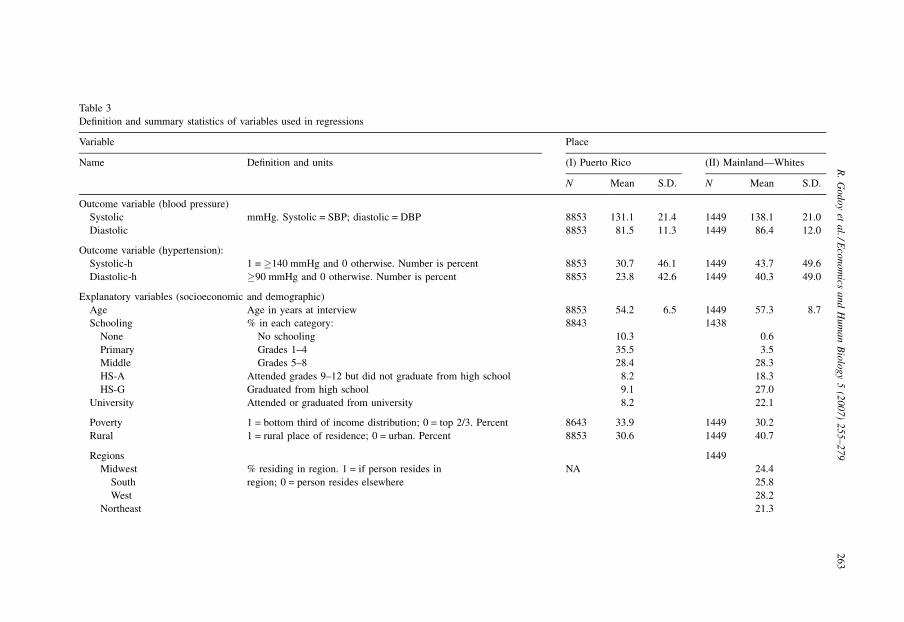
2.2.2. Explanatory variables: Socioeconomic and demographic (Table 3)
2.2.2.1. Birth quinquennium. To protect the confidentiality of participants in the survey of
Puerto Rico, the data made available to the public excludes the subject’s birth date. As a result,
we used the subject’s age at the time of the survey and the year of the survey to create variables for
birth quinquenniums. We did not find evidence that data collectors rounded measures of age
around preferred last digits.4
2.2.2.2. Schooling. We created the following dummy variables for schooling: (a) no schooling,
(b) primary school (grades 1–4), (c) middle school (grades 5–8), (d) attended but did not
complete high school (grades 9–12), (e) graduated from high school, and (f) some university
attendance.
2.2.2.3. Relative poverty and place of residence. We created a variable for relative poverty that
took the value of one if the household income of the person fell in the bottom third of the income
distribution of the sample, and zero otherwise. The variable was created by comparing household
income with the income of the rest of the sample of either Puerto Rico or the mainland. We included
a dummy variable for place of residence at the time of the survey (rural = 1, urban = 0). In the
analysis of the mainland, we included dummy variables for three of the four geographical regions.
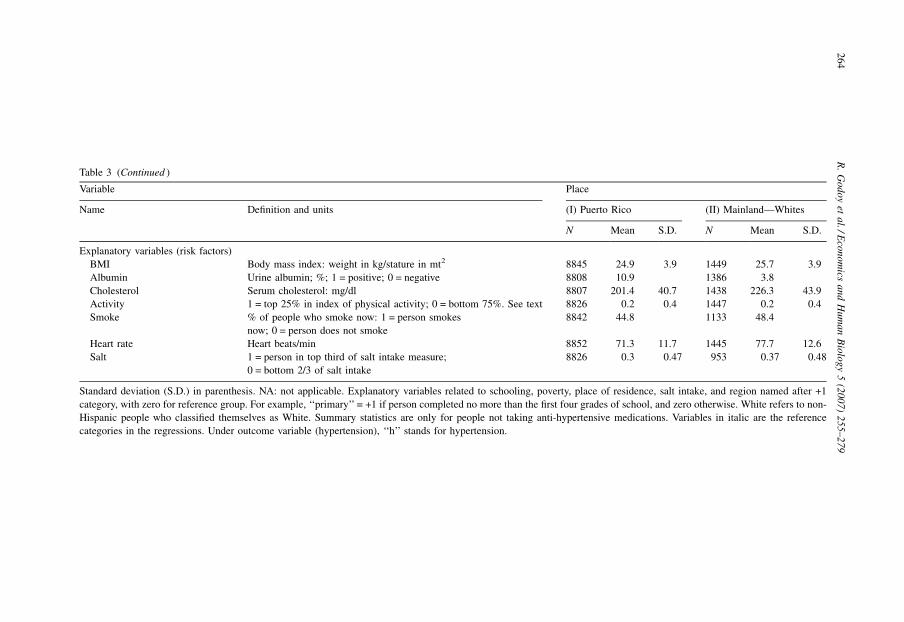
2.2.3. Explanatory variables: Cardiovascular risk factors
Cardiovascular risk factors include body mass index (BMI; body weight in kg/standing
physical stature in m2), albumin, serum cholesterol, physical activity, smoking, heart rate, and
R. Godoy et al. / Economics and Human Biology 5 (2007) 255–279262
Table 2
Comparison of methods used to measure blood pressure in NHANES-I on the mainland and the first wave of the Puerto
Rico Heart Health Program (PRHHP)
Puerto Rico (PRHHP) Mainland NHANES-I
Year of measurement 1965 1971–1975
Measurement site Multiple Mobile examination centers
Number of measures 2 1 (2/3 participants) or 3 (1/3 participants)
Observers Physician Physician
Posture Sitting Sitting, supine
Staff training Unknown Unknown
Share of measures ending in the digit zero
Systolic 43.6 35.7
Diastolic 43.6 38.3
Cuffs available Unknown Child, adult
Equipment maintenance Unknown Weekly zero-level calibration
Published diastolic definition Point of disappearance, K5 Point of complete cessation or
muffling if heard to zero
Information for NHANES from Burt et al. (1995) and information for PRHHP from Benson et al. (1966), Costas et al.
(1981), Garcıa-Palmieri et al. (1969), Gordon et al. (1974), and Sorlie et al. (1982). The shares of measures ending in the
digit zero or five are our calculations. ‘‘Unknown’’ means we were unable to obtain the information.
4 A x2-test comparing the frequency of occurrence of the last digit in measures of age between Puerto Rico and the
mainland showed statistically insignificant results (x2 = 8.89, p = 0.44). An editorial from the Puerto Rican Medical
Association noted that there were no significant errors in the measure of age in PRHHP (Editorial, 2002).
R.
Go
do
yet
al./E
con
om
icsa
nd
Hu
ma
nB
iolo
gy
5(2
00
7)
25
5–
27
92
63
Table 3
Definition and summary statistics of variables used in regressions
Variable Place
Name Definition and units (I) Puerto Rico (II) Mainland—Whites
N Mean S.D. N Mean S.D.
Outcome variable (blood pressure)
Systolic mmHg. Systolic = SBP; diastolic = DBP 8853 131.1 21.4 1449 138.1 21.0
Diastolic 8853 81.5 11.3 1449 86.4 12.0
Outcome variable (hypertension):
Systolic-h 1 = �140 mmHg and 0 otherwise. Number is percent 8853 30.7 46.1 1449 43.7 49.6
Diastolic-h �90 mmHg and 0 otherwise. Number is percent 8853 23.8 42.6 1449 40.3 49.0
Explanatory variables (socioeconomic and demographic)
Age Age in years at interview 8853 54.2 6.5 1449 57.3 8.7
Schooling % in each category: 8843 1438
None No schooling 10.3 0.6
Primary Grades 1–4 35.5 3.5
Middle Grades 5–8 28.4 28.3
HS-A Attended grades 9–12 but did not graduate from high school 8.2 18.3
HS-G Graduated from high school 9.1 27.0
University Attended or graduated from university 8.2 22.1
Poverty 1 = bottom third of income distribution; 0 = top 2/3. Percent 8643 33.9 1449 30.2
Rural 1 = rural place of residence; 0 = urban. Percent 8853 30.6 1449 40.7
Regions 1449
Midwest % residing in region. 1 = if person resides in
region; 0 = person resides elsewhere
NA 24.4
South 25.8
West 28.2
Northeast 21.3
R.
Go
do
yet
al./E
con
om
icsa
nd
Hu
ma
nB
iolo
gy
5(2
00
7)
25
5–
27
92
64
Table 3 (Continued )
Variable Place
Name Definition and units (I) Puerto Rico (II) Mainland—Whites
N Mean S.D. N Mean S.D.
Explanatory variables (risk factors)
BMI Body mass index: weight in kg/stature in mt2 8845 24.9 3.9 1449 25.7 3.9
Albumin Urine albumin; %; 1 = positive; 0 = negative 8808 10.9 1386 3.8
Cholesterol Serum cholesterol: mg/dl 8807 201.4 40.7 1438 226.3 43.9
Activity 1 = top 25% in index of physical activity; 0 = bottom 75%. See text 8826 0.2 0.4 1447 0.2 0.4
Smoke % of people who smoke now: 1 = person smokes
now; 0 = person does not smoke
8842 44.8 1133 48.4
Heart rate Heart beats/min 8852 71.3 11.7 1445 77.7 12.6
Salt 1 = person in top third of salt intake measure;
0 = bottom 2/3 of salt intake
8826 0.3 0.47 953 0.37 0.48
Standard deviation (S.D.) in parenthesis. NA: not applicable. Explanatory variables related to schooling, poverty, place of residence, salt intake, and region named after +1
category, with zero for reference group. For example, ‘‘primary’’ = +1 if person completed no more than the first four grades of school, and zero otherwise. White refers to non-
Hispanic people who classified themselves as White. Summary statistics are only for people not taking anti-hypertensive medications. Variables in italic are the reference
categories in the regressions. Under outcome variable (hypertension), ‘‘h’’ stands for hypertension.
salt intake. Albumin was measured from urine samples and took the value of one if the protein
could be detected in the urine, and zero otherwise. Serum cholesterol was measured in milligram
per deciliter. Since each of the two surveys had different measures of physical activity, we created
a variable called ‘‘activity’’ that took the value of one if the person scored at the top 25% of the
scale for physical activity in their site, and zero otherwise. The variable smoke took the value of
one if the person self-classified himself as a current smoker, and zero otherwise. We included a
measure of heart rate.
Last, we included salt intake. The variable was measured differently in Puerto Rico and on the
mainland. In Puerto Rico, researchers measured salt intake in ‘‘sodium units/week,’’ whereas on
the mainland researchers measured salt in at least three ways, none comparable to the way it was
measured in Puerto Rico. For the mainland, we opted to equate salt intake with milligrams of salt
consumed by a person as revealed through a 24-h dietary recall. Since the measure of salt intake
differed between Puerto Rico and the mainland, we created a dummy variable that took the value
of one if the person was in the top third of the salt intake distribution for their site, and zero
otherwise. Because 36% of the mainland sample lacked information on salt consumption
(irrespective of the way NHANES-I measured salt), we present separately the regression results
with salt intake.
2.3. Statistical analysis
We used ordinary least squares regressions (OLS) to estimate the association between
blood pressure and explanatory variables separately for Puerto Rico and for the mainland. We
used robust standard errors when the probability of exceeding the x2-value in the Breusch–
Pagan test for heteroskedasticity was <5%. To avoid producing unreasonable values for
constants, we transformed measures of blood pressure by subtracting 35 from age. This way the
constant refers to a 35-year-old man. In addition, we subtracted 0.6 and 0.02 from the values of
systolic and diastolic blood pressures for each year of age. The values 0.6 and 0.02 represent the
yearly change in blood pressure from an additional year of age. We prefer this approach because
we are unable to estimate age and birth of year effects otherwise. We used probit regressions
when using hypertension as an outcome. STATA 9 for Windows was used for the statistical
analysis.
Our analysis of secular trends relies on a one-time measure of blood pressure and
focuses on the coefficients of birth quinquennium while controlling for relevant covariates.
The approach would be more accurate if blood pressure did not change in adulthood. Ideally,
the coefficients for the variables for birth quinquennium pick up cohort effects common to a
group born during the same period (Borjas, 2005; Fienberg and Mason, 1979; Rodgers, 1982).
Since blood pressure increases generally with age, our identification strategy is not
ideal because it does not allow us to separate well the collinearity between age and cohorts.
This is why studies of secular trends of blood pressure rely on measures of blood pressure
taken from people of the same age bracket but at different times (Sjøl et al., 1998; McCarron
et al., 2001; Burt et al., 1995). We could not use the preferred identification strategy because
we did not find other representative surveys of blood pressure in Puerto Rico done after
PRHHP.
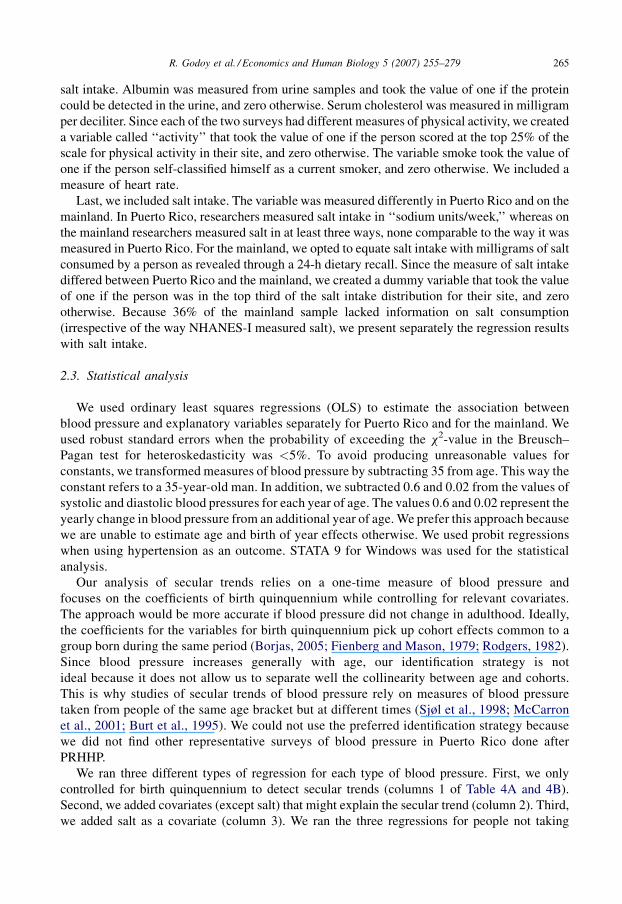
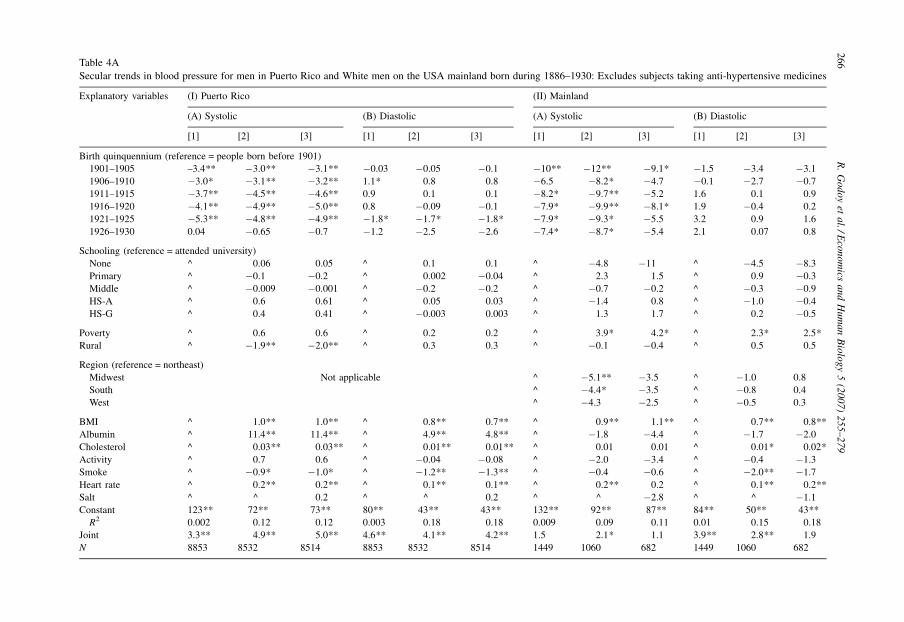
We ran three different types of regression for each type of blood pressure. First, we only
controlled for birth quinquennium to detect secular trends (columns 1 of Table 4A and 4B).
Second, we added covariates (except salt) that might explain the secular trend (column 2). Third,
we added salt as a covariate (column 3). We ran the three regressions for people not taking
R. Godoy et al. / Economics and Human Biology 5 (2007) 255–279 265
R.
Go
do
yet
al./E
con
om
icsa
nd
Hu
ma
nB
iolo
gy
5(2
00
7)
25
5–
27
92
66Table 4A
Secular trends in blood pressure for men in Puerto Rico and White men on the USA mainland born during 1886–1930: Excludes subjects taking anti-hypertensive medicines
Explanatory variables (I) Puerto Rico (II) Mainland
(A) Systolic (B) Diastolic (A) Systolic (B) Diastolic
[1] [2] [3] [1] [2] [3] [1] [2] [3] [1] [2] [3]
Birth quinquennium (reference = people born before 1901)
1901–1905 –3.4** �3.0** �3.1** �0.03 �0.05 �0.1 �10** �12** �9.1* �1.5 �3.4 �3.1
1906–1910 �3.0* �3.1** �3.2** 1.1* 0.8 0.8 �6.5 �8.2* �4.7 �0.1 �2.7 �0.7
1911–1915 �3.7** �4.5** �4.6** 0.9 0.1 0.1 �8.2* �9.7** �5.2 1.6 0.1 0.9
1916–1920 �4.1** �4.9** �5.0** 0.8 �0.09 �0.1 �7.9* �9.9** �8.1* 1.9 �0.4 0.2
1921–1925 �5.3** �4.8** �4.9** �1.8* �1.7* �1.8* �7.9* �9.3* �5.5 3.2 0.9 1.6
1926–1930 0.04 �0.65 �0.7 �1.2 �2.5 �2.6 �7.4* �8.7* �5.4 2.1 0.07 0.8
Schooling (reference = attended university)
None ^ 0.06 0.05 ^ 0.1 0.1 ^ �4.8 �11 ^ �4.5 �8.3
Primary ^ �0.1 �0.2 ^ 0.002 �0.04 ^ 2.3 1.5 ^ 0.9 �0.3
Middle ^ �0.009 �0.001 ^ �0.2 �0.2 ^ �0.7 �0.2 ^ �0.3 �0.9
HS-A ^ 0.6 0.61 ^ 0.05 0.03 ^ �1.4 0.8 ^ �1.0 �0.4
HS-G ^ 0.4 0.41 ^ �0.003 0.003 ^ 1.3 1.7 ^ 0.2 �0.5
Poverty ^ 0.6 0.6 ^ 0.2 0.2 ^ 3.9* 4.2* ^ 2.3* 2.5*
Rural ^ �1.9** �2.0** ^ 0.3 0.3 ^ �0.1 �0.4 ^ 0.5 0.5
Region (reference = northeast)
Midwest Not applicable ^ �5.1** �3.5 ^ �1.0 0.8
South ^ �4.4* �3.5 ^ �0.8 0.4
West ^ �4.3 �2.5 ^ �0.5 0.3
BMI ^ 1.0** 1.0** ^ 0.8** 0.7** ^ 0.9** 1.1** ^ 0.7** 0.8**
Albumin ^ 11.4** 11.4** ^ 4.9** 4.8** ^ �1.8 �4.4 ^ �1.7 �2.0
Cholesterol ^ 0.03** 0.03** ^ 0.01** 0.01** ^ 0.01 0.01 ^ 0.01* 0.02*
Activity ^ 0.7 0.6 ^ �0.04 �0.08 ^ �2.0 �3.4 ^ �0.4 �1.3
Smoke ^ �0.9* �1.0* ^ �1.2** �1.3** ^ �0.4 �0.6 ^ �2.0** �1.7
Heart rate ^ 0.2** 0.2** ^ 0.1** 0.1** ^ 0.2** 0.2 ^ 0.1** 0.2**
Salt ^ ^ 0.2 ^ ^ 0.2 ^ ^ �2.8 ^ ^ �1.1
Constant 123** 72** 73** 80** 43** 43** 132** 92** 87** 84** 50** 43**
R2 0.002 0.12 0.12 0.003 0.18 0.18 0.009 0.09 0.11 0.01 0.15 0.18
Joint 3.3** 4.9** 5.0** 4.6** 4.1** 4.2** 1.5 2.1* 1.1 3.9** 2.8** 1.9
N 8853 8532 8514 8853 8532 8514 1449 1060 682 1449 1060 682
R.
Go
do
yet
al./E
con
om
icsa
nd
Hu
ma
nB
iolo
gy
5(2
00
7)
25
5–
27
92
67
Table 4B
Secular trends in blood pressure for men in Puerto Rico and White men on the USA mainland born during 1886–1930: Includes subjects taking anti-hypertensive medicines
Explanatory variables (I) Puerto Rico (II) Mainland
(A) Systolic (B) Diastolic (A) Systolic (B) Diastolic
[1] [2] [3] [1] [2] [3] [1] [2] [3] [1] [2] [3]
Birth quinquennium (reference = people born before 1901)
1901–1905 �3.2** �2.9* �2.9* �0.4 �0.3 �0.3 �10** �12** �9.1* �1.1 �3.4 �3.1
1906–1910 �3.6** �3.6** �3.6** 0.4 0.2 0.2 �6.1 �8.1* �4.7 0.2 �2.3 �0.7
1911–1915 �4.5* �5.3** �5.2** 0.2 �0.4 �0.3 �8.4* �9.8** �5.2 1.9 0.4 0.9
1916–1920 �5.8** �6.6** �6.5** �0.2 �0.9 �0.9 �6.6 �8.6* �8.1* 2.4 0.1 0.2
1921–1925 �7.4** �6.4** �6.3** �3.0** �2.6** �2.5** �7.3* �9.1* �5.5 3.6* 1.2 1.6
1926–1930 �3.4 �3.4 �3.2 �3.3* �4.0** �3.9** �6.8 �8.1* �5.4 3.0 0.7 0.8
Schooling (reference = attended university)
None ^ �0.4 �0.3 ^ �0.1 �0.1 ^ �5.1 �11.0 ^ �5.0 �8.3
Primary ^ �0.7 �0.6 ^ �0.3 �0.3 ^ 1.7 1.5 ^ �0.1 �0.3
Middle ^ 0.3 0.3 ^ �0.2 �0.2 ^ �0.8 �0.2 ^ �0.2 �0.9
HS–A ^ 1.4 1.4 ^ 0.3 0.3 ^ �1.2 0.8 ^ �1.5 �0.4
HS–G ^ 0.6 0.6 ^ �0.2 �0.2 ^ 1.8 1.7 ^ �0.06 �0.5
Poverty ^ 0.5 0.5 ^ 0.2 0.2 ^ 4.2** 4.2* ^ 2.3* 2.5*
Rural ^ �1.5** �1.5** ^ 0.4 0.4 ^ �0.2 �0.4 ^ 0.5 0.5
Region (reference = northeast)
Midwest Not applicable ^ �6.0** �3.5 ^ �1.4 0.8
South ^ �4.9** �3.5 ^ �1.4 0.4
West ^ �4.8** �2.5 ^ �0.7 0.3
BMI ^ 1.2** 1.2** ^ 0.8** 0.8** ^ 0.9** 1.1** ^ 0.6** 0.8**
Albumin ^ 13.9** 13.9** ^ 6.2** 6.2** ^ �1.0 �4.4 ^ �1.8 �2.0
Cholesterol ^ 0.03** 0.03** ^ 0.01** 0.01** ^ 0.01 0.01 ^ 0.01* 0.02*
Activity ^ 0.09 0.1 ^ �0.3 �0.3 ^ �1.3 �3.4 ^ �0.3 �1.3
R.
Go
do
yet
al./E
con
om
icsa
nd
Hu
ma
nB
iolo
gy
5(2
00
7)
25
5–
27
92
68
Table 4B (Continued )
Explanatory variables (I) Puerto Rico (II) Mainland
(A) Systolic (B) Diastolic (A) Systolic (B) Diastolic
[1] [2] [3] [1] [2] [3] [1] [2] [3] [1] [2] [3]
Smoke ^ �1.2** �1.2** ^ �1.3** �1.3** ^ �0.8 �0.6 ^ �1.9** �1.7
Heart rate ^ 0.2** 0.2 ^ 0.2** 0.2** ^ 0.2 0.2 ^ 0.1** 0.2**
Salt ^ ^ �0.7 ^ ^ �0.2 ^ ^ �2.8 ^ ^ �1.1
Constant 126** 70** 70** 82** 42** 42** 132** 92** 87** 84** 51** 43**
R2 0.004 0.15 0.15 0.002 0.20 0.20 0.008 0.09 0.11 0.01 0.14 0.18
Joint 7.4** 9.6** 9.9** 5.4** 5.7** 5.5** 1.5 2.2* 1.1 4.6** 3.5** 1.9
N 9811 9453 9431 9811 9453 9431 1567 1144 682 1567 1144 682
Regressions are ordinary least squares; robust standard errors used when p > x2 in Breusch–Pagan test for heteroskedasticity <5%. Dependent variables = systolic or diastolic
blood pressure adjusted for age-related change. Single (*) and double asterisks (**) denote significant at 5 and 1% levels, respectively. The constant reflects blood pressure at age
35. ‘‘Joint’’ is F-test of joint statistical significance for all variables of birth quinquennium. (^) Variable intentionally left out.
anti-hypertensive medications (Table 4A) and then repeated the regressions including people
taking such medications (Table 4B).
3. Results
3.1. Description of socioeconomic and health status of the two samples
Table 3 suggests that the two samples had roughly similar mean body mass index (�25) and
share of smokers (45–48%), but the two samples also differed in socioeconomic and health
status. People on the mainland had much higher levels of school achievement. For example, 27.0
and 22.1% of the sample from the mainland had graduated from high school or university
respectively, whereas only 9.1 and 8.2% of the sample from Puerto Rico had done so. A larger
share of the sample came from the countryside on the mainland (40.7%) than in Puerto Rico
(30.6%). People on the mainland had higher levels of serum cholesterol (226.3 mg/dl) than in
Puerto Rico (201.4 mg/dl), but a higher share of people in Puerto Rico tested positive for urine
albumin (10.9%) than on the mainland (3.8%). Urine albumin is an indicator of renal disease,
which can reflect hypertension, though hypertension can also result from renal disease.
Microalbuminuria is associated with metabolic syndrome and increased risk for cardiovascular
disease. The higher share of people in Puerto Rico who tested positive for urine albumin would
suggest that renal damage may have been more common in Puerto Rico.
Table 3 suggests that both populations had roughly the same mean age (Puerto Rico = 54.2,
mainland = 57.3), but Table 1 suggests that there were fewer young men in the sample from
Puerto Rico (born after 1921).5
3.2. Descriptive, bivariate, and visual analysis
This section presents the raw data (without controlling for any of the covariates) to obtain a
preliminary impression of the data. Table 1 (Sections I and II) suggests that the average subject in
Puerto Rico born during 1886–1930 had 6.9 mmHg lower systolic blood pressure and 4.9 mmHg
lower diastolic blood pressure than the average subject born on the mainland during the same
period. Table 1 (Section III) suggests that the differences in both systolic and diastolic blood
pressure between people on the mainland and in Puerto Rico increased, the former from an
average of 8.5 mmHg among men born 1896–1905 to an average of 9.8 mmHg for those born
1921–1930. The mainland–Puerto Rico difference in diastolic blood pressure increased from an
average of 3.1 mmHg among people born during 1896–1905 to an average of 8.7 mmHg for
people born after 1921.
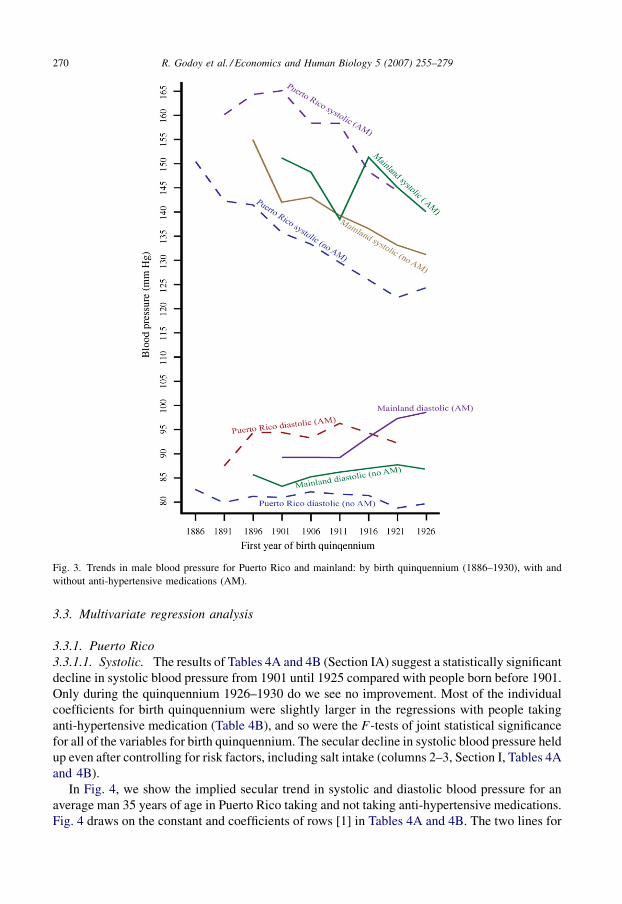
Among people who were not taking anti-hypertensive medication both systolic and diastolic
blood pressures were always higher on the mainland than in Puerto Rico (Fig. 3). There was a
secular parallel decline in systolic blood pressure in these groups while diastolic blood pressure
rose on the mainland, but rose and fell in Puerto Rico. However, if one includes in the sample
those who were taking anti-hypertensive medication the relationship is reversed and it is Puerto
Ricans who have the greater systolic and diastolic blood pressures at the outset. The USA catches
up and exceeds Puerto Rican levels at the end of the period.
R. Godoy et al. / Economics and Human Biology 5 (2007) 255–279 269
5 If the smaller sample of younger cohorts reflects a selectivity bias (e.g., migration to the mainland of younger adults),
then this could bias parameter estimates.
3.3. Multivariate regression analysis
3.3.1. Puerto Rico
3.3.1.1. Systolic. The results of Tables 4A and 4B (Section IA) suggest a statistically significant
decline in systolic blood pressure from 1901 until 1925 compared with people born before 1901.
Only during the quinquennium 1926–1930 do we see no improvement. Most of the individual
coefficients for birth quinquennium were slightly larger in the regressions with people taking
anti-hypertensive medication (Table 4B), and so were the F-tests of joint statistical significance
for all of the variables for birth quinquennium. The secular decline in systolic blood pressure held
up even after controlling for risk factors, including salt intake (columns 2–3, Section I, Tables 4A
and 4B).
In Fig. 4, we show the implied secular trend in systolic and diastolic blood pressure for an
average man 35 years of age in Puerto Rico taking and not taking anti-hypertensive medications.
Fig. 4 draws on the constant and coefficients of rows [1] in Tables 4A and 4B. The two lines for
R. Godoy et al. / Economics and Human Biology 5 (2007) 255–279270
Fig. 3. Trends in male blood pressure for Puerto Rico and mainland: by birth quinquennium (1886–1930), with and
without anti-hypertensive medications (AM).
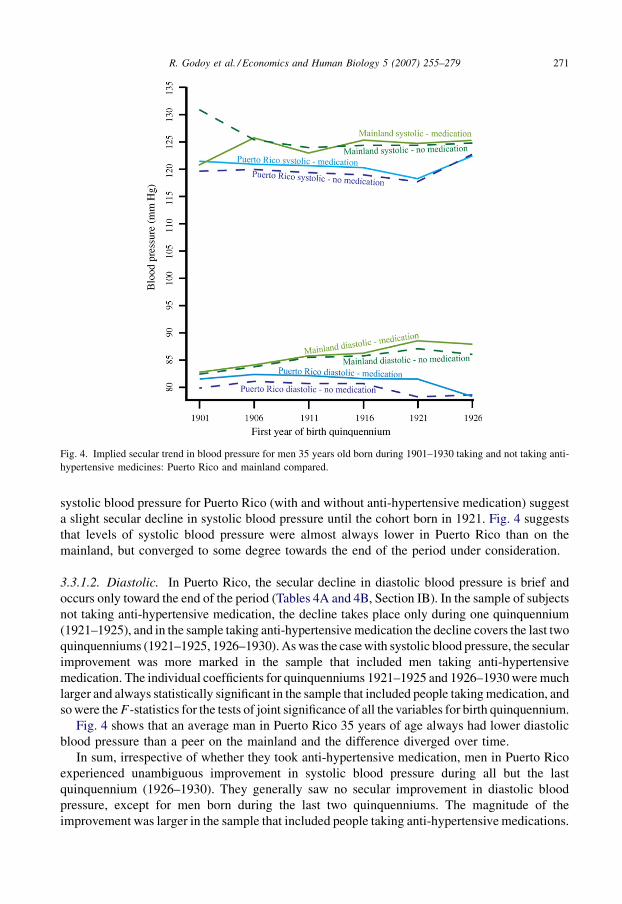
systolic blood pressure for Puerto Rico (with and without anti-hypertensive medication) suggest
a slight secular decline in systolic blood pressure until the cohort born in 1921. Fig. 4 suggests
that levels of systolic blood pressure were almost always lower in Puerto Rico than on the
mainland, but converged to some degree towards the end of the period under consideration.
3.3.1.2. Diastolic. In Puerto Rico, the secular decline in diastolic blood pressure is brief and
occurs only toward the end of the period (Tables 4A and 4B, Section IB). In the sample of subjects
not taking anti-hypertensive medication, the decline takes place only during one quinquennium
(1921–1925), and in the sample taking anti-hypertensive medication the decline covers the last two
quinquenniums (1921–1925, 1926–1930). As was the case with systolic blood pressure, the secular
improvement was more marked in the sample that included men taking anti-hypertensive
medication. The individual coefficients for quinquenniums 1921–1925 and 1926–1930 were much
larger and always statistically significant in the sample that included people taking medication, and
so were the F-statistics for the tests of joint significance of all the variables for birth quinquennium.
Fig. 4 shows that an average man in Puerto Rico 35 years of age always had lower diastolic
blood pressure than a peer on the mainland and the difference diverged over time.
In sum, irrespective of whether they took anti-hypertensive medication, men in Puerto Rico
experienced unambiguous improvement in systolic blood pressure during all but the last
quinquennium (1926–1930). They generally saw no secular improvement in diastolic blood
pressure, except for men born during the last two quinquenniums. The magnitude of the
improvement was larger in the sample that included people taking anti-hypertensive medications.
R. Godoy et al. / Economics and Human Biology 5 (2007) 255–279 271
Fig. 4. Implied secular trend in blood pressure for men 35 years old born during 1901–1930 taking and not taking anti-
hypertensive medicines: Puerto Rico and mainland compared.
3.3.2. Mainland
3.3.2.1. Systolic. The regression results for the mainland shown in Tables 4A and 4B (Section
IIA) suggest small secular improvements in systolic blood pressure. In the sample that excludes
people taking anti-hypertensive medications (Table 4A), the regression that includes only birth
quinquenniums (column 1) and the regression that controls for risk factors (but not salt intake)
(column 2) both suggest a secular decline in systolic blood pressure. If we compare the
coefficients for birth quinquennium in columns 1–2 for the mainland with Puerto Rico we see that
the magnitude of the improvement was larger on the mainland than in Puerto Rico but was
confined to the early period. For instance, columns 1 of systolic pressure in Table 4A suggests
that during 1916–1920, an average men born in Puerto Rico had 4.1 mmHg lower systolic blood
pressure than a peer born before 1901; the comparable coefficient for the mainland was 7.9. The
difference between the mainland and Puerto Rico widened by 1921, but then converged. By the
end of the period the difference was miniscule.
The secular decline on the mainland becomes weaker once we control for salt intake. Columns
3 of Sections IIA of Tables 4A and 4B show the regression results that control for salt intake on
the mainland. The coefficients retain their negative sign, but lose their statistical significance
owing to the reduction in the sample size. After controlling for salt intake, the F-test for the joint
significance of all variables related to birth quinquennium become statistically insignificant.
The results of the analysis of secular trends for systolic blood pressure on the mainland are
roughly the same with the sample of people taking and not taking anti-hypertensive medications.
If we compare the coefficients of Section IIA in Table 4Awith the coefficients of the same section
in Table 4B, we see that many of the coefficients become slightly smaller when we include the
sample of people taking anti-hypertensive medications. Nevertheless, the trends are quite similar
except at the beginning of the period.
3.3.2.2. Diastolic. The results of Sections IIB in Tables 4A and 4B suggest no evidence of a
secular change in diastolic blood pressure on the mainland. In fact, most of the coefficients for
birth quinquennium are positive (though statistically insignificant). The bottom of Fig. 4 shows
the implied secular change in diastolic blood pressure for a man on the mainland 35 years of age;
the secular trend for men taking and not taking anti-hypertensive medications are
indistinguishable, and slope slightly upward.
In sum, the mainland experienced a sharper decline in systolic blood pressure than Puerto Rico
if we consider those who were not taking medication, but experienced no secular change in
diastolic blood pressure even if there is a hint of slight increase. Among those who were taking
medication, systolic blood pressure remained constant throughout the period.
3.3.3. Robustness
To ensure the robustness of the main results, we introduced at the same time the following
changes to the regressions of columns 3 of Table 4B: (a) redefined the reference category
for birth quinquennium to include people born before 1906, (b) controlled for alcohol
consumption, (c) controlled for the use of anti-hypertensive medications by adding a dummy
variable for the use of such medication, and (d) we added Blacks to the mainland sample and
included a dummy variable for Blacks. The main results for Puerto Rico remained essentially
unchanged, though the coefficients became slightly smaller. The same was true for the secular
trend in systolic blood pressure on the mainland. However, the secular trend in diastolic blood
pressure for the mainland became positive; three of the five coefficients for birth quinquennium
(1926–1930, 1921–1925, 1911–1915) became statistically significant and so was the test of joint
R. Godoy et al. / Economics and Human Biology 5 (2007) 255–279272
statistical significance for all the variables related to birth quinquennium. These results are not
reported here.
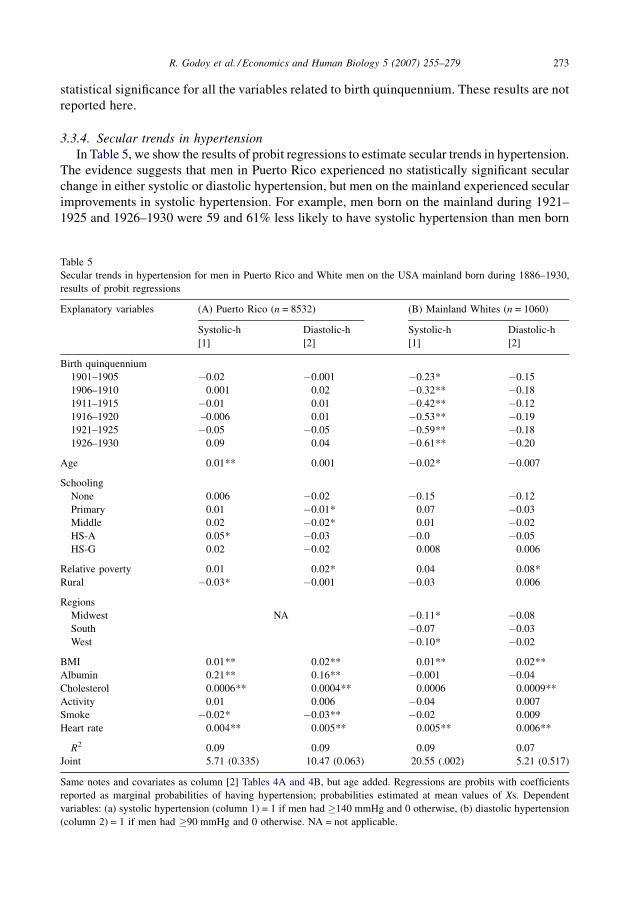
3.3.4. Secular trends in hypertension
In Table 5, we show the results of probit regressions to estimate secular trends in hypertension.
The evidence suggests that men in Puerto Rico experienced no statistically significant secular
change in either systolic or diastolic hypertension, but men on the mainland experienced secular
improvements in systolic hypertension. For example, men born on the mainland during 1921–
1925 and 1926–1930 were 59 and 61% less likely to have systolic hypertension than men born
R. Godoy et al. / Economics and Human Biology 5 (2007) 255–279 273
Table 5
Secular trends in hypertension for men in Puerto Rico and White men on the USA mainland born during 1886–1930,
results of probit regressions
Explanatory variables (A) Puerto Rico (n = 8532) (B) Mainland Whites (n = 1060)
Systolic-h Diastolic-h Systolic-h Diastolic-h
[1] [2] [1] [2]
Birth quinquennium
1901–1905 �0.02 �0.001 �0.23* �0.15
1906–1910 0.001 0.02 �0.32** �0.18
1911–1915 �0.01 0.01 �0.42** �0.12
1916–1920 –0.006 0.01 �0.53** �0.19
1921–1925 �0.05 �0.05 �0.59** �0.18
1926–1930 0.09 0.04 �0.61** �0.20
Age 0.01** 0.001 �0.02* �0.007
Schooling
None 0.006 �0.02 �0.15 �0.12
Primary 0.01 �0.01* 0.07 �0.03
Middle 0.02 �0.02* 0.01 �0.02
HS-A 0.05* �0.03 �0.0 �0.05
HS-G 0.02 �0.02 0.008 0.006
Relative poverty 0.01 0.02* 0.04 0.08*
Rural �0.03* �0.001 �0.03 0.006
Regions
Midwest NA �0.11* �0.08
South �0.07 �0.03
West �0.10* �0.02
BMI 0.01** 0.02** 0.01** 0.02**
Albumin 0.21** 0.16** �0.001 �0.04
Cholesterol 0.0006** 0.0004** 0.0006 0.0009**
Activity 0.01 0.006 �0.04 0.007
Smoke �0.02* �0.03** �0.02 0.009
Heart rate 0.004** 0.005** 0.005** 0.006**
R2 0.09 0.09 0.09 0.07
Joint 5.71 (0.335) 10.47 (0.063) 20.55 (.002) 5.21 (0.517)
Same notes and covariates as column [2] Tables 4A and 4B, but age added. Regressions are probits with coefficients
reported as marginal probabilities of having hypertension; probabilities estimated at mean values of Xs. Dependent
variables: (a) systolic hypertension (column 1) = 1 if men had �140 mmHg and 0 otherwise, (b) diastolic hypertension
(column 2) = 1 if men had �90 mmHg and 0 otherwise. NA = not applicable.
before 1901. On the mainland, the variables for birth quinquennium were jointly statistically
significantly associated with systolic hypertension at the 99% confidence level (x2 = 20.55,
p = 0.002).
3.3.5. Secular changes in cardiovascular risk factors and in the use of anti-hypertensive
medications
We next estimate secular trends in cardiovascular risk factors and in the use of anti-
hypertensive medications. We focus on risk factors that previous studies had identified as
predictors of cardiovascular health (Garcıa-Palmieri et al., 1980; Gordon et al., 1974, 1981). The
risk factors included (a) body mass index, (b) physical activity, (c) alcohol consumption, (d)
smoking, (e) heart rate, and (f) cholesterol level. When estimating secular trends in risk factors or
in the use of anti-hypertensive medications, we controlled for all the covariates of Table 4 and
added age. We found a strong secular decline in physical activity among people in Puerto Rico
(F-statistic for all birth quinquennium variables = 4.26, p = 0.001), but not among people on the
mainland. In neither sample did we find significant secular changes in alcohol consumption,
smoking, body mass index, heart rate, or cholesterol levels. These results are not reported here.
We used a probit regression with a dummy variable as an outcome for whether the person was
taking anti-hypertensive medications and found no evidence of a secular change in the use of
anti-hypertensive medication in Puerto Rico (F-statistics for test of all variables related to birth
quinquennium = 1.12, p = 0.89), but we found a secular increase in the use of anti-hypertensive
medication on the mainland (F = 52.81, p = 0.001). On the mainland subjects born starting with
the quinquennium 1906–1910 were 34% (1906–1910), 76% (1911–1915), 90% (1916–1920),
97% (1921–1925), and 99% (1926–1930) more likely to use anti-hypertensive medications than
people born before 1906.
The secular improvement in systolic blood pressure and in hypertension on the mainland and
the more modest improvement in Puerto Rico might therefore reflect improved access to health
care on the mainland, as shown by the increasing use of anti-hypertensive medication and by a
stronger tendency toward a sedentary lifestyle in Puerto Rico. The use of anti-hypertensive
medication is a proxy for greater access to health care, as discussed later.
We also analyzed secular trends in self-reported diabetes as a possible contributing factor to
secular trends in blood pressure. We found no secular trend in the incidence of diabetes in Puerto
Rico, but we found a small, but statistically significant secular decline on the mainland. On the
mainland, each birth quinquennium was associated with a 1–2% lower probability of reporting
diabetes, whereas in Puerto Rico each birth quinquennium was associated with about a 0.5%
lower probability of reporting diabetes. The pattern could reflect a healthy survivor effect—that
is, those with diabetes died at younger ages, so they are no longer in the sample. The frequency of
Type 2 diabetes has been increasing on the mainland, lending credence to the healthy survivor
interpretation.
4. Discussion and conclusions
4.1. Awareness and prevention
In this section, we discuss the role of awareness and prevention of cardiovascular health in
explaining the more marked decline in systolic (but not diastolic) blood pressure and
hypertension on the mainland. We lack data on awareness campaigns about cardiovascular health
before the 1970s, but data after the 1970s suggests that campaigns to increase awareness about
R. Godoy et al. / Economics and Human Biology 5 (2007) 255–279274
cardiovascular health may have started earlier and may have been more intense on the mainland
than in Puerto Rico. In 1972, the National Institutes of Health created the National High Blood
Pressure Education Program to mobilize, educate, and coordinate resources for groups interested
in the prevention and control of hypertension. During 1972–1976, clinics screened the blood
pressure of 1 million people on the mainland as part of the Community Hypertension Evaluation
Clinic Program (Stamler et al., 1976). Besides awareness and treatment programs, physicians on
the mainland started to prescribe anti-hypertensive medication to more people. Prescriptions rose
from 46 million in 1965 to 96 million in 1975, and the value of sales of anti-hypertensive
medication climbed from US$ 118 million in 1965 to US$ 383 million in 1975 (Stamler et al.,
1976). We too found evidence for a sharper secular increase in the use of hypertensive medication
on the mainland than in Puerto Rico.
Several authors have suggested that programs of awareness and prevention of hypertension in
Puerto Rico did not keep up with those of the mainland, that efforts started later (1980s) in Puerto
Rico than on the mainland (1970s), and that the programs may have treated only a small share of
the people in Puerto Rico with cardiovascular ailments (Cangiano, 1999; Crespo et al., 2002;
Ramırez, 1980, 1994; Rigau-Perez, 2000).
4.2. Evaluation of hypotheses
The comparative analysis of secular trends in blood pressure between Puerto Rico and the
mainland yields mixed support for the hypotheses. People in Puerto Rico generally had lower
blood pressure than people on the mainland, as seen in Figs. 3 and 4, and experienced a
statistically significant decline in diastolic blood pressure toward the end of the period
considered. However, people on the mainland experienced statistically significant secular
declines in both systolic blood pressure and in hypertension (but not in diastolic blood pressure,
particularly after we add Blacks). Mainland–Puerto Rico differences in both systolic and
diastolic blood pressure increased modestly for the period under study. Neither group enjoyed
unambiguous superiority in all dimensions of cardiovascular health.
Of the three hypotheses presented in Section 1, we find strongest—albeit partial—support for
the hypothesis from social epidemiology that in industrial nations all groups experienced secular
improvements in cardiovascular health, but that some groups did better than others. The
transformations of the Puerto Rican economy and society attenuated the rate of secular
improvement of two of the most important dimensions of cardiovascular health—systolic blood
pressure and hypertension—in Puerto Rico compared with the mainland. However, support for
the hypothesis is partial. Recall from Section 1 that among socioeconomic groups on the
mainland secular improvements in blood pressure were more marked for people of the lowest
socioeconomic status (Black women) and least marked for people of the highest socioeconomic
status (White men). Full support for the hypothesis would have seen people in Puerto Rico
experience larger secular improvements in cardiovascular health than people on the mainland
across all dimensions of cardiovascular health.
4.3. Implications
Since we found some improvement in systolic blood pressure and hypertension on the
mainland net of risk factors, the trend reflects variables we did not measure but that deserve
attention in future research. One such variable might be awareness about cardiovascular health
and access to health care. On the other hand, the absence of a secular increase in blood pressure in
R. Godoy et al. / Economics and Human Biology 5 (2007) 255–279 275
Puerto Rico suggests that men in Puerto Rico must have benefited from compensatory
mechanisms. It is possible that the socioeconomic and political changes in Puerto Rico during the
late 19th and early 20th centuries had adverse effects on cardiovascular health, but that protective
mechanisms in Puerto Rico—a strong sense of culture, community, language—protected people
from harm.
We noted in Section 1 that an analysis of secular trends in cardiovascular health could
complement analysis of secular trends of anthropometric indicators. In another study, we
documented how despite the economic stagnation and the poor quality of the diet in Puerto Rico
during the first half of the 20th century, the physical stature of adult men in Puerto Rico
experienced a more modest rate of secular increase than on the mainland (Godoy et al., 2007).
Seen this way, the results of the analysis of trends in cardiovascular health presented here carry
the same general message that we found when examining secular trends in physical stature. With
both outcomes—cardiovascular health and physical stature—we found that people in Puerto
Rico experienced secular stability or improvement, but that the magnitude of the improvement
(at least for some cardiovascular outcomes such as systolic blood pressure and hypertension) fell
short of improvements on the mainland. The results are promising and suggest that development
economists studying secular trends in the biological standard of living of people in modern
periods should examine multiple indicators, including blood pressure, to obtain a more
comprehensive picture of the changing health status of populations.
Acknowledgements
The Puerto Rico Heart Health Program (PRHHP) was conducted and supported by the
National Heart, Lung, and Blood Institute (NHLBI) in collaboration with the PRHHP Registry
Investigators. For PRHHP data contact Sean Coady ([email protected]) or Paul Sorlie
([email protected]) at NHLBI/DECA/EBP, 6701 Rockledge Center MSC 7934, Bethesda,
MD 20892, USA, Tel.: +1 301 435 0456. This Manuscript was prepared using a limited access
dataset obtained by the NHLBI (http://www.cdc.gov/nchs/nhanes.htm) and does not necessarily
reflect the opinions or views of the PRHHP Registry or the NHLBI. Thanks go to Ankur Patel for
help downloading data and its documentation, to Paul Sorlie for facilitating data and for
clarifying the meaning of some of the variables in PRHHP, to A. MacEwan, T. Hexner, S. Coady,
and three reviewers for comments on earlier versions, and to J. Komlos (an honorary co-author)
for many critical readings of earlier drafts.
References
Arora, S., 2005. On epidemiologic and economic transitions: a historical view. In: Lopez-Casanovas, G., Rivera, B.,
Currais, L. (Eds.), Health and Economic Growth. Findings and Policy Implications. MIT Press, Cambridge, pp. 199–
238.
Barker, D.J.P., 1995. Fetal origins of coronary heart disease. Br. Med. J. 311, 171–174.
Barker, D.J.P., 2001. Fetal origins of cardiovascular and lung disease. Marcel Dekker, New York.
Barker, D.J.P., Eriksson, J.G., Forsen, T., Osmond, C., 2002. Fetal origins of adult disease: strength of effects and
biological basis. Int. J. Epidemiol. 31, 1235–1239.
Benson, H., Costas Jr., R., Garcıa-Palmieri, M.R., Feliberti, M., Aixala, R., Blanton, J.H., Colon, A.A., 1966. Coronary
heart disease risk factors: a comparison of two Puerto Rican populations. Am. J. Public Health 56, 1058–1060.
Black, H.R., 2004. The paradigm has shifted to systolic blood pressure. J. Hum. Hypertens. 18S, S3–S7.
Blane, D., Hart, C.L., Smith, G.D., Gillis, C.R., Hole, D.J., Hawthorne, V.M., 1996. Association of cardiovascular disease
risk factors with socioeconomic position during childhood and during adulthood. Br. Med. J. 313, 1434–1438.
R. Godoy et al. / Economics and Human Biology 5 (2007) 255–279276
Bogin, B., Keep, R., 1999. Eight thousand years of economic and political history in Latin America revealed by
anthropometry. Ann. Hum. Biol. 26, 333–351.
Borhani, N.O., Hechter, H.H., Breslow, L., 1963. Report of a ten-year follow-up study of the San Francisco longshoremen.
J. Chronic Dis. 16, 1251–1266.
Borjas, G.J., 2005. Labor Economics, 3rd ed. McGraw Hill, New York.
Burt, V.L., Cutler, J.A., Higgins, M., Horan, M.J., Labarthe, D., Whelton, P., Brown, C., Roccella, E.J., 1995. Trends
in the prevalence, awareness, treatment, and control of hypertension in the adult US population. Hypertension 26,
60–69.
Cangiano, J.L., 1999. Hypertension and renal disease in Puerto Ricans. Am. J. Med. Sci. 318, 369–373.
Clark, V., Dearing, C., Dickey, J., Newell, F., Reber, H., Seidemann, H., Tannenbaum, F., Zimmerman, E., 1930. Porto
Rico and its Problems. The Brookings Institution, Washington, DC.
Costas Jr., R., Garcıa-Palmieri, M.R., Sorlie, P.D., Hertzmark, E., 1981. Coronary heart disease risk factors in men with
light and dark skin in Puerto Rico. Am. J. Public Health 71, 614–619.
Crespo, C.J., Garcıa-Palmieri, M.R., Perez Perdomo, R., McGee, D.L., Smit, E., Sempos, C.T., Min, I., Sorlie, P.D., 2002.
The relationship of physical activity and body weight with all-cause mortality. Ann. Epidemiol. 12, 543–552.
Cruickshank, J.K., Mzayek, F., Liu, L., Kieltyka, L., Sherwin, R., Webber, L.S., Srinavasan, S.R., Berenson, G.S., 2005.
Origins of the black/white difference in blood pressure: roles of birth weight, postnatal growth, early blood pressure
and adolescent body size. Circulation 111, 1932–1937.
De Lusignan, B.J., Hague, N., Dzregah, B., 2004. End digit preference in blood pressure recordings of patients with
ischaemic heart disease in primary care. J. Hum. Hypertens. 18, 261–265.
Dietz, J.L., 1987. Economic History of Puerto Rico: Institutional Change and Capitalist Development. Princeton
University Press, Princeton.
Dressler, W.W., 1999. Modernization, stress, and blood pressure: new directions in research. Hum. Biol. 71, 583–605.
Editorial, 2002. El programa de salud del corazon Puerto Rico: 1961–1970. Boletın de la Asociacion Medica de Puerto
Rico, vol. 94, pp. 59–60.
Evans, H., 2003. Losing touch: the controversy over the introduction of blood pressure instruments into medicine.
Technol. Cult. 34, 784–807.
Fienberg, S.E., Mason, W.M., 1979. Identification and estimation of age-period-cohort models in the analysis of discrete
archival data. Sociol. Methodol. 10, 1–67.
Fogel, R.W., 2005. The Escape from Hunger and a Premature Death, 1700–2100. Cambridge University Press, New York.
Fogel, R.W., Engerman, S.L., Trussel, J., 1982. Exploring the uses of data on height. Soc. Sci. Hist. 6, 401–421.
Garcıa-Palmieri, M.R., Feliberti, M., Costas Jr., R., Colon, A.A., Cruz-Vidal, M., Cortes-Alicea, M., Ayala, A., Sobrino,
R., Torres, R., 1969. An epidemiological study on coronary heart disease in Puerto Rico. Boletin Asociacion Medica
de Puerto Rico 94, 61–67.
Garcıa-Palmieri, M.R., Costas Jr., R., Cruz-Vidal, M., Cortes-Alicea, M., Colon, A.A., Feliberti, M., Ayala, A.M.,
Patterne, D., Sobrino, R., Torres, R., Nazario, E., 1970. Risk factors and prevalence of coronary heart disease in Puerto
Rico. Circulation 42, 541–549.
Garcıa-Palmieri, M.R., Sorlie, P.D., Tillotson, J., Costas Jr., R., Cordero, E., Rodrıguez, M., 1980. Relationship of dietary
intake to subsequent coronary heart disease incidence: The Puerto Rico Heart Health Program. Am. J. Clin. Nutr. 33,
1818–1827.
Garcıa-Palmieri, M.R., Costas Jr., R., Cruz-Vidal, M., Sorlie, P.D., Havlik, R., 1982. Increased physical activity: a
protective factor against heart attacks in Puerto Rico. Am. J. Cardiol. 50, 749–755.
Garcıa-Palmieri, M.R., Costas Jr., R., Cruz-Vidal, M., Sorlie, P.D., Tillotson, J., Havlik, R.J., 1984. Milk consumption,
calcium intake, and decreased hypertension in Puerto Rico: Puerto Rico Heart Health Program Study. Hypertension 6,
322–328.
Garcıa-Palmieri, M.R., Feliberti, M., Costas Jr., R., Colon, A.A., Cruz-Vidal, M., Cortes-Alicea, M., Ayala, A., Sobrino,
R., Torres, R., 2002. An epidemiological study on coronary heart disease in Puerto Rico, 1969. Boletın de la
Asociacion Medica de Puerto Rico 94, 61–67.
Godoy, R.A., Jenkins, G.P., Patel, K., 2003. Review of quantitative studies of Puerto Rican migration. Journal of the
Center for Puerto Rican Studies 15, 207–241.
Godoy, R.A., Goodman, E., Levins, R., Caram, M., Seyfried, C., 2007. A comparison of secular trends in height between
men in Puerto Rico and the USA mainland, 1886–1930. Econ. Hum. Biol. 5 (1), 82–99.
Gordon, T., Garcıa-Palmieri, M.R., Kagan, A., Kannel, W.B., Schiffman, J., 1974. Differences in coronary heart disease in
Framingham, Honolulu and Puerto Rico. J. Chronic Dis. 27, 329–344.
Gordon, T., Kagan, A., Garcıa-Palmieri, M.R., Kannel, W.B., Zukel, W.J., Tillotson, J., Sorlie, P.D., Hjortland, M., 1981.
Diet and its relation to coronary heart disease and death in three populations. Circulation 63, 500–515.
R. Godoy et al. / Economics and Human Biology 5 (2007) 255–279 277
Goya, W.S., Whincup, P.H., Shaper, G., Walker, M., 1996. Influence of father’s social class on cardiovascular disease in
middle-aged men. Lancet 348, 1259–1263.
Gravlee, C.C., Dressler, W.W., 2005. Skin pigmentation, self-perceived color, and arterial blood pressure in Puerto Rico.
Am. J. Hum. Biol. 17, 195–206.
Grossman, E., Rosenthal, T., 1993. Effect of urbanization on blood pressure in Ethiopian immigrants. J. Hum. Hypertens.
7, 559–561.
Guarnaccia, P., Rivera, M., Franco, F., Neighbors, C., 1996. The experiences of ataques de nervios: towards an
anthropology of emotions in Puerto Rico. Cult. Med. Psychiatry 20, 343–367.
Haines, M.R., 2004. Growing income, shrinking people—can economic development be hazardous to your health? Soc.
Sci. Hist. 28, 249–270.
Hajjar, I., Kotchen, J.M., Kotchen, T.A., 2006. Hypertension: trends in prevalence, incidence, and control. Annu. Rev.
Public Health 27, 465–490.
Hardy, R., Kuh, D., Langenberg, C., Wadsworth, M.E.J., 2003. Birth weight, childhood social class, and change in adult
blood pressure in the 1946 British birth cohort. Lancet 362, 1178–1183.
Huxley, R.R., Shiell, A.W., Law, C.M., 2000. The role of size at birth and postnatal catch-up growth in determining
systolic blood pressure: a systematic review of the literature. J. Hypertens. 18, 815–831.
Huxley, R.R., Neil, A., Collins, R., 2002. Unraveling the fetal origins hypothesis: is there really an inverse association
between birth weight and subsequent blood pressure? Lancet 360, 659–665.
James, S.A., 1987. Psychosocial precursors of hypertension: a review of the epidemiologic evidence. Circulation 76, 60–
66.
Juonala, M., Jarvisalo, M.J., Maki-Torkko, N., Kahonen, M., Viikari, J.S., Raitakari, O.T., 2005. Risk factors identified in
childhood and decreased carotid artery elasticity in adulthood: the Cardiovascular Risk in Young Finns Study.
Circulation 112, 1486–1493.
Kannel, W.B., 1975. Role of blood pressure in cardiovascular disease: the Framingham study. Angiology 26, 1–14.
Komlos, J. (Ed.), 1994. Stature, Living Standards, and Economic Development. University of Chicago Press, Chicago,
IL.
Komlos, J., 1998. Shrinking in a growing economy? The mystery of physical stature during the Industrial Revolution. J.
Econ. Hist. 58, 779–802.
Komlos, J., Baur, M., 2004. From the tallest to (one of) the fattest: the enigmatic fate of the size of the American
population in the twentieth century. Econ. Hum. Biol. 2, 57–74.
Komlos, J., Lauderdale, B.E., 2007. Spatial correlates of U.S. heights and BMIs, 2002. J. Biosoc. Sci. 39, 59–78.
Lawlor, D.A., Smith, G.D., 2005. Early life determinants of adult blood pressure. Nephrol. Hypertens. 14, 259–264.
Lefort, F., 1997. Is Puerto Rico Converging to the United States? International Tax Program, Harvard Law School, Report
number 1003, Cambridge, Massachusetts.
Lipowicz, A., 2007. Hypertension among Polish males during the economic transition. Econ. Hum. Biol. 5 (1), 61–73.
McCarron, P., Okasha, M., Mc Ewen, J., Smith, G.D., 2001. Changes in blood pressure among students attending Glasgow
University between 1948 and 1968: analyses of cross sectional surveys. Br. Med. J. 322, 885–889.
McCarron, P., Smith, G.D., Okasha, M., 2002. Secular changes in blood pressure in childhood adolescence and young
adulthood: systematic review of trends from 1948 to 1998. J. Hum. Hypertens. 16, 677–689.
McGarvey, S.T., 1999. Modernization, psychosocial factors, insulin, and cardiovascular health. In: Panter-Brick, C.,
Worthman, C. (Eds.), Hormones, Health and Behavior: A Socio-ecological and Lifespan Perspective. Cambridge
University Press, Cambridge, pp. 244–280.
McGrath, J.J., Matthews, K.A., Brady, S.S., 2006. Individual versus neighborhood socioeconomic status and race as
predictors of adolescent ambulatory blood pressure and heart rate. Soc. Sci. Med. 63, 1442–1453.
Montani, J., Antic, V., Yang, Z., Dulloo, A., 2002. Pathways from obesity to hypertension: from the perspective of a
vicious triangle. Int. J. Obes. Relat. Metab. Disord. 26 (Supp. 2), S28–S38.
NLBHI, National Lung, Blood and Health Institute, 2006. What is high blood pressure? [Online] Available at http://
www.nhlbi.nih.gov/health/dci/Diseases/Hbp/HBP_WhatIs.html. Accessed May 10, 2006.
O’Rourke, M.F., 1990. What is blood pressure? Am. J. Hypertens. 3, 803–810.
Paffenbarger, R.S., Notkin, J., Krueger, D.E., Wolf, P.A., Thorne, M.C., LeBauer, E.J., Williams, J.L., 1966. Chronic
disease in former college students. II. Methods of study and observations of mortality from coronary heart disease.
Am. J. Public Health 56, 962–971.
Perloff, H., 1950. Puerto Rico’s Economic Future: A Study in Planned Development. University of Chicago Press,
Chicago.
Possas, D.A., Bobadilla, J.L., 1992. How the epidemiological transition affects health policy issues in three Latin
American countries. World Bank, Policy Research Working Paper Series No. 987.
R. Godoy et al. / Economics and Human Biology 5 (2007) 255–279278
Ramırez, E.A., 1980. Operation by allied health professional personnel of a long-term hypertension detection and
treatment program. Boletın de la Asociacion Medica de Puerto Rico 72, 298–304.
Ramırez, E.A., 1994. Cardiovascular health in Puerto Ricans compared to other population groups in the United States.
Boletın de la Asociacion Medica de Puerto Rico 86, 28–36.
Regidor, E., Banegas, J.R., Gutierrez-Fisac, J.L., Domınguez, V., Rodrıguez-Artalejos, F., 2006. Influence of childhood
socioeconomic circumstances, height, and obesity on pulse pressure and systolic and diastolic blood pressure in older
people. J. Hum. Hypertens. 20, 73–82.
Rigau-Perez, J.G., 2000. Historia de la medicina. La salud en Puerto Rico en el siglo XX. P. R. Health Sci. J. 19, 357–368.
Rodgers, W.L., 1982. Estimable functions of age, period, and cohort effects. Am. Sociol. Rev. 47, 774–787.
Shi, W.W., Kramer, M.S., Hoey, J., Hanley, J.A., Usher, R.H., 1993. Terminal digit preference, random error, and bias in
routine clinical measurement of blood pressure. J. Clin. Epidemiol. 46, 1187–1193.
Sjøl, A., Korsgard, T., Schroll, M., 1998. Secular trends in blood pressure levels in Denmark 1964–1991. Int. J. Epidemiol.
27, 614–622.
Sobngwi, E., Mbanya, J.C., Unwin, N.C., Porcher, R., Kengne, A.P., Fezeu, L., Minkoulou, E.M., Tournoux, C., Gautier,
J.F., Aspray, T.J., Alberti, K., 2004. Exposure over the life course to an urban environment and its relation with obesity,
diabetes, and hypertension in rural and urban Cameroon. Int. J. Epidemiol. 33, 769–776.
Sorlie, P.D., Garcıa-Palmieri, M.R., 1990. Educational status and coronary heart disease in Puerto Rico: the Puerto Rico
Heart Health Program. Int. J. Epidemiol. 19, 59–65.
Sorlie, P.D., Garcıa-Palmieri, M.R., Costas Jr., R., Cruz-Vidal, M., Havlik, R., 1982. Cigarette smoking and coronary heart
disease in Puerto Rico. Prev. Med. 11, 304–316.
Stamler, J., Stamler, R., Riedlinger, W., Algera, G., Roberts, R.H., 1976. Hypertension screening of 1 million Americans:
community hypertension evaluation clinic (CHEC) program, 1973 through 1975. J. Am. M. Assoc. 235, 2299–2306.
Steckel, R.A., Rose, J.C. (Eds.), 2002. The Backbone of History: Health and Nutrition in the Western Hemisphere.
Cambridge University Press, New York.
Ulijaszek, S.J., Koziel, S., Hermanussen, M., 2005. Village distance from urban centre as the prime modernization
variable in differences in blood pressure and body-mass index of adults of the Purani delta of the Gulf Province, Papua
New Guinea. Ann. Hum. Biol. 32, 326–338.
R. Godoy et al. / Economics and Human Biology 5 (2007) 255–279 279
Related Documents