1 07S-32 Stapp Car Crash Journal, Vol. 51 (October 2007), pp. Copyright © 2007 The Stapp Association Blood Flow and Fluid-Structure Interactions in the Human Aorta during Traumatic Rupture Conditions Sang-Hyun Lee, Richard Kent Center for Applied Biomechanics, University of Virginia __________________________________ ABSTRACT – Traumatic aortic rupture (TAR) accounts for a significant mortality in automobile crashes. A numerical method by means of a mesh-based code coupling is employed to elucidate the injury mechanism of TAR. The aorta is modeled as a single-layered thick wall composed of two families of collagen fibers using an anisotropic strain energy function with consideration of viscoelasticity. A set of constitutive parameters is identified from experimental data of the human aorta, providing strict local convexity. An in vitro aorta model reconstructed from the Visible Human dataset is applied to the pulsatile blood flow to establish the references of mechanical quantities for physiological conditions. A series of simulations is performed using the parameterized impact pulses obtained from frontal sled tests. The result of parametric study reveals that the maximum level of 280 kPa pressure alone might cause TAR near the ascending aorta region, but that a characteristic deformation pattern, termed “dynamic self-pinch”, occurs in the presence of superimposed chest deceleration, chest compression, and blood pressure. Considering combined impact loading, the model indicates that an aortic rupture initiates from the inner wall (intima) at the classical site, the isthmus. In agreement with clinical findings, the tear predicted by the model is oriented transversely as a result of extremely high shear flow in the blood, coinciding with a stress concentration in the aortic wall near that region. The combined effect of chest deceleration, chest compression, and blood pressure appears to generate an aortic deformation and failure pattern that captures all the salient characteristics of clinically observed TAR. KEYWORDS – traumatic aortic rupture, injury mechanism, fluid-structure interaction, finite element method, constitutive modeling, anisotropic strain energy function, dynamic self-pinch __________________________________ INTRODUCTION Traumatic aortic rupture (TAR) has been reported as the second cause of death in blunt trauma, claiming 7500 to 8000 victims annually in North America (Jackson 1984, Mattox 1989, Schulman et al. 2007). The majority of cases is caused by motor vehicle crashes, and approximately 70% to 90% of drivers and front seat passengers die at the scene of the collision (Smith and Chang 1986, Sturm et al. 1988, Burkhart et al. 2001). The most common TAR, accounting for 50% to 60% of TAR deaths, has been identified as a transverse tear at the peri-isthmic region (Symbas et al. 1973, Burkhart et al. 2001). Despite the significantly high mortality of TAR, its injury mechanism is still unknown. Several hypotheses such as a rapid rise of blood pressure, a sudden stretch of the aortic wall and relative motion between the heart and the aorta have been proposed in the past few decades, but no mechanism has been firmly established (Lundewall 1964, Crass et al. 1990, Richens et al. 2002, Nikolic et al. 2006). Experimental efforts have been unsuccessful since aortic rupture conditions are difficult to reproduce in simulated collisions (Voigt and Wilfert 1969, Kroell and Schneider 1971, Yoganandan et al. 1991). As an example, Forman et al. assessed the potential for chest acceleration to generate TAR by inducing relative motion between the aortic arch and the heart (Forman et al. 2005). Two high-acceleration cadaver sled tests exceeding 100g were performed with a fixture isolating acceleration from chest deformation. No significant aortic or other injuries to the thorax resulted from these tests. This is consistent with an earlier study of Indy car drivers, which found peak acceleration levels well over 100g tolerated with no incidence of TAR (Melvin et al. 1998). Furthermore, it seems apparent from analysis of field crashes that TAR occurs in field exposures generating less than 100g of chest acceleration (Siegel et al. 2004). These findings suggest that acceleration alone, even at magnitudes in Address correspondence to Sang-Hyun Lee, 1011 Linden Avenue, Charlottesville, VA 22902. Electronic mail: [email protected]

Welcome message from author
This document is posted to help you gain knowledge. Please leave a comment to let me know what you think about it! Share it to your friends and learn new things together.
Transcript

1
07S-32
Stapp Car Crash Journal, Vol. 51 (October 2007), pp. Copyright © 2007 The Stapp Association
Blood Flow and Fluid-Structure Interactions in the Human Aorta during Traumatic Rupture Conditions
Sang-Hyun Lee, Richard Kent Center for Applied Biomechanics, University of Virginia
__________________________________
ABSTRACT – Traumatic aortic rupture (TAR) accounts for a significant mortality in automobile crashes. A numerical method by means of a mesh-based code coupling is employed to elucidate the injury mechanism of TAR. The aorta is modeled as a single-layered thick wall composed of two families of collagen fibers using an anisotropic strain energy function with consideration of viscoelasticity. A set of constitutive parameters is identified from experimental data of the human aorta, providing strict local convexity. An in vitro aorta model reconstructed from the Visible Human dataset is applied to the pulsatile blood flow to establish the references of mechanical quantities for physiological conditions. A series of simulations is performed using the parameterized impact pulses obtained from frontal sled tests. The result of parametric study reveals that the maximum level of 280 kPa pressure alone might cause TAR near the ascending aorta region, but that a characteristic deformation pattern, termed “dynamic self-pinch”, occurs in the presence of superimposed chest deceleration, chest compression, and blood pressure. Considering combined impact loading, the model indicates that an aortic rupture initiates from the inner wall (intima) at the classical site, the isthmus. In agreement with clinical findings, the tear predicted by the model is oriented transversely as a result of extremely high shear flow in the blood, coinciding with a stress concentration in the aortic wall near that region. The combined effect of chest deceleration, chest compression, and blood pressure appears to generate an aortic deformation and failure pattern that captures all the salient characteristics of clinically observed TAR.
KEYWORDS – traumatic aortic rupture, injury mechanism, fluid-structure interaction, finite element method, constitutive modeling, anisotropic strain energy function, dynamic self-pinch
__________________________________
INTRODUCTION
Traumatic aortic rupture (TAR) has been reported as the second cause of death in blunt trauma, claiming 7500 to 8000 victims annually in North America (Jackson 1984, Mattox 1989, Schulman et al. 2007). The majority of cases is caused by motor vehicle crashes, and approximately 70% to 90% of drivers and front seat passengers die at the scene of the collision (Smith and Chang 1986, Sturm et al. 1988, Burkhart et al. 2001). The most common TAR, accounting for 50% to 60% of TAR deaths, has been identified as a transverse tear at the peri-isthmic region (Symbas et al. 1973, Burkhart et al. 2001).
Despite the significantly high mortality of TAR, its injury mechanism is still unknown. Several hypotheses such as a rapid rise of blood pressure, a sudden stretch of the aortic wall and relative motion
between the heart and the aorta have been proposed in the past few decades, but no mechanism has been firmly established (Lundewall 1964, Crass et al. 1990, Richens et al. 2002, Nikolic et al. 2006). Experimental efforts have been unsuccessful since aortic rupture conditions are difficult to reproduce in simulated collisions (Voigt and Wilfert 1969, Kroell and Schneider 1971, Yoganandan et al. 1991). As an example, Forman et al. assessed the potential for chest acceleration to generate TAR by inducing relative motion between the aortic arch and the heart (Forman et al. 2005). Two high-acceleration cadaver sled tests exceeding 100g were performed with a fixture isolating acceleration from chest deformation. No significant aortic or other injuries to the thorax resulted from these tests. This is consistent with an earlier study of Indy car drivers, which found peak acceleration levels well over 100g tolerated with no incidence of TAR (Melvin et al. 1998). Furthermore, it seems apparent from analysis of field crashes that TAR occurs in field exposures generating less than 100g of chest acceleration (Siegel et al. 2004). These findings suggest that acceleration alone, even at magnitudes in
Address correspondence to Sang-Hyun Lee, 1011 Linden
Avenue, Charlottesville, VA 22902. Electronic mail: [email protected]
2 Lee and Kent / Stapp Car Crash Journal 51 (October 2007)
excess of 100g, is insufficient to generate aortic rupture, and that other mechanisms are responsible for the cases that occur in the field. Data from Cavanaugh et al. (2005), which indicate that differential motion of the upper and lower thorax may be important to TAR, and from Hardy et al. (2006), which describe the importance of thoracic deformation, also support the assertion that multiple factors contribute to the occurrence of TAR. It is not possible, however, to isolate precise injury mechanisms from these experimental and field studies, which are retrospective and lack sufficient instrumentation to describe the relative contributions of factors such as inertial loading, induced stresses due to thoracic deformation, and fluid mechanics.
As an alternative to experimental or field-based studies, numerical approaches have become prevalent as an effective tool in biomechanics and crashworthiness simulations. Some computer models based on the finite element method (FEM) have been developed specifically to investigate TAR mechanisms. Shah et al. improved the whole body FE model by Wang (1995) to allow for omni-directional impact simulations of the aorta under blunt loading (Shah et al. 2001). The blood was represented by the Lagrangian fluid material model available in LS-DYNA code (Hallquist 2006), and the aortic wall was modeled by single-layer isotropic membrane elements. As node sharing was used for the blood-aorta interface, actual blood flow and flow-induced shear due to blunt impact were not considered in the calculations. Aortic deformation was also simplified by neglecting out-of-plane bending in the model. Numerical simplifications of each domain in the aorta and their fluid-structure interaction (FSI) led to underestimation of hemodynamic factors during TAR. As a result, the blood pressure was concluded to be insignificant in causing high aortic wall stresses. Richen et al. developed a heart-aorta model for TAR using a similar approach (Richens et al. 2004). The Lagrangian fluid material for the blood and isotropic shell elements for the aorta were employed with the identical interface by Shah et al.
Although thoracic anatomical details were included to a certain extent, those models expose a number of fundamental challenges in numerical modeling of the aorta. In the Shah and Richens models, the material model used for the blood is not fully incompressible in order to ensure both numerical stability and the minimum time step in an explicit formulation such as the LS-DYNA code (Zienkiewicz and Taylor 2000). Consequently, outcomes from the fluid domain may vary depending on how the artificial compressibility
condition is represented (such as an artificially low speed of sound in the fluid). Furthermore, in an actual aorta the interaction between the flowing blood and the vascular wall creates changes in both the flow patterns and the wall morphology. A simple shared-node interface is incapable of reflecting such FSI precisely.
The objective of this study is to present a mesh-based code coupling technique of FSI for the development of a human aorta model that addresses some of the limitations of earlier models, and to perform a parametric study to investigate possible injury mechanisms of TAR under blunt impact loading conditions.
Anatomy of the Human Aorta
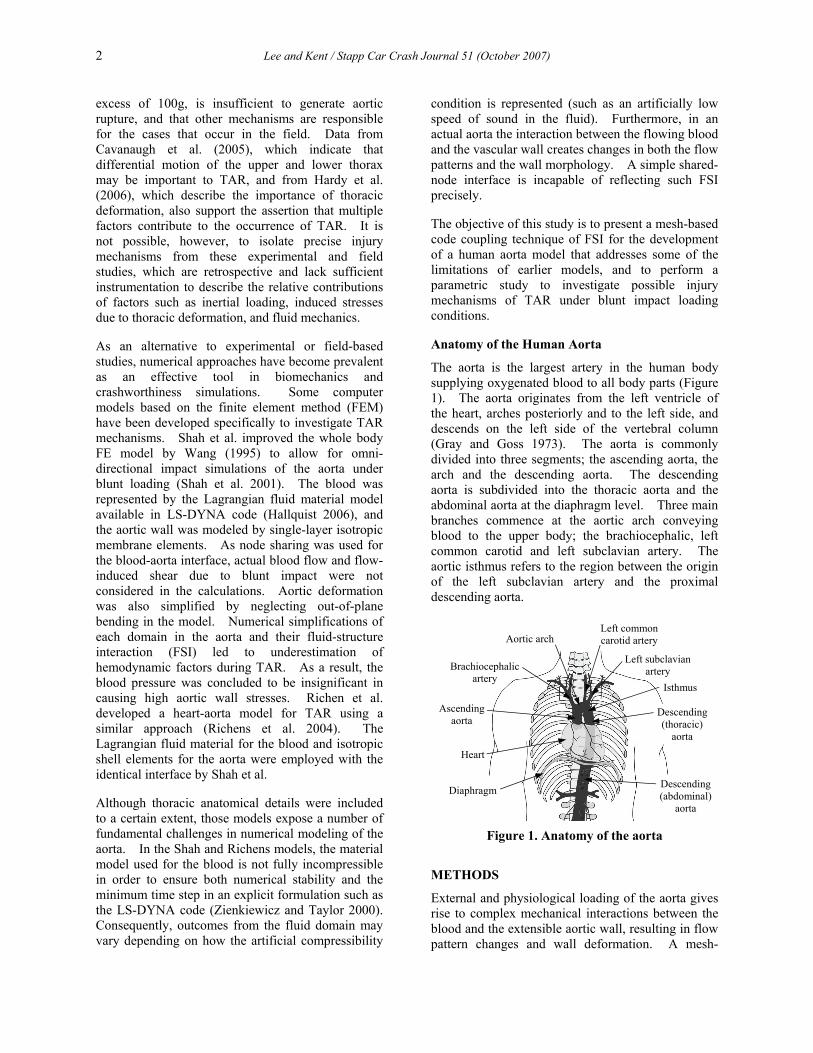
The aorta is the largest artery in the human body supplying oxygenated blood to all body parts (Figure 1). The aorta originates from the left ventricle of the heart, arches posteriorly and to the left side, and descends on the left side of the vertebral column (Gray and Goss 1973). The aorta is commonly divided into three segments; the ascending aorta, the arch and the descending aorta. The descending aorta is subdivided into the thoracic aorta and the abdominal aorta at the diaphragm level. Three main branches commence at the aortic arch conveying blood to the upper body; the brachiocephalic, left common carotid and left subclavian artery. The aortic isthmus refers to the region between the origin of the left subclavian artery and the proximal descending aorta.
Figure 1. Anatomy of the aorta
METHODS
External and physiological loading of the aorta gives rise to complex mechanical interactions between the blood and the extensible aortic wall, resulting in flow pattern changes and wall deformation. A mesh-
Ascending aorta
Aortic arch
Isthmus
Left common carotid artery
Descending (thoracic)
aorta
Descending(abdominal)
aorta
Brachiocephalic artery
Left subclavianartery
Diaphragm
Heart

Lee and Kent / Stapp Car Crash Journal 51 (October 2007) 3
based FE code coupling, commercially available in ANSYS (ANSYS, Inc., Release 11.0), is employed to solve such interactions during TAR numerically. In this approach, the physics of each domain is solved sequentially using two separate fluid and structure solvers, and mesh-based parameters are transferred across the fluid-structure interface iteratively to complete the coupling procedure (APPENDIX A). Case studies representing steady and pulsatile blood flows in linear elastic vessels have been examined for code evaluation. The FSI examples for the cardiovascular system demonstrate that the coupled FSI solver provides reliable numerical results verified by analytical solutions (APPENDIX B).
Blood exhibits non-Newtonian behavior at low shear rates and in small vessels. In most physiological circumstances, however, blood behaves in the Newtonian manner (Ku 1997, Nichols and O'Rourke 2005). In this study, blood is assumed to be a Newtonian fluid of density 1000 kg/m3 and viscosity 0.004 kg/m/s as representative properties in large arteries (Ku 1997).
Constitutive Modeling of the Aortic Wall
A complete description of the in vivo aortic wall requires a fundamental understanding of the biological function and histological structure. However, when passive and hyper-physiological responses due to impact loading is of primary concern, the macroscopic response of the aorta can be efficiently described by strain energy density functions (SEDF’s) of the finite elasticity theory.
Figure 2. Schematic of aortic wall structure
(Zulliger et al. 2004)
The human aortic behavior is considered to be nonlinear, anisotropic, viscoelastic and incompressible with a certain level of residual stresses in vivo (Holzapfel and Gasser 2000, Vito and Dixon 2003). The aortic wall is a layered structure with three distinct sections; the intima (innermost),
the media, and the adventitia (outermost). Structurally each layer is regarded as a cylindrical tube composed of an isotropic elastic matrix and two families of collagen fibers helically wound along the axial ( z ) direction (Figure 2). Assuming perfectly aligned collagen fibers in the original configuration, their anisotropic contribution is typically embedded in constitutive models as a pair of preferred directions. In the present study, a single-layered, thick-walled, anisotropic, viscoelastic, and incompressible aorta model was employed for finite nonlinear deformation.
Anisotropic strain energy density function. A polynomial form of SEDF is utilized in order to take fiber orientations and incompressibility (no volume change) into account for dynamic and finite deformation of the aorta. The SEDF is defined by the following set of invariants with the unit direction vectors 0a and 0b in Equation (1) (Spencer 1984, Holzapfel 2000, ANSYS 2007).
( ) ( )
( ) ( )
( ) ( )
( )
3 3
1 21 1
6 6
4 52 2
6 6
6 72 2
6
82
3 3
1 1
1 1
i ji j
i j
k lk l
k l
m nm n
m n
oo
o
W a I b I
c I d I
e I f I
g I ζ
= =
= =
= =
=
= − + −
+ − + −
+ − + −
+ −
∑ ∑
∑ ∑
∑ ∑
∑
(1)
where
( )( )
( )
20 0 0 0
2 21 2
24 0 0 5 0 0
26 0 0 7 0 0
8 0 0 0 0
1, 1, ,1tr , tr tr ,2
, ,, ,
I I
I II II
ζ= = = ⋅
= = −
= ⋅ = ⋅= ⋅ = ⋅= ⋅ ⋅
a b a b
C C C
a Ca a C ab Cb b C ba b a Cb
The constitutive relation for the second Piola-Kirchhoff stress, S is derived as follows (Holzapfel 2000).
( ) ( )
( ) ( )
( )( )
11 2 2
0 0 0 0 0 04 5
0 0 0 0 0 06 7
0 0 0 0 0 08
2
12
W W WII I I
W WI IW WI I
WI
⎡⎛ ⎞∂ ∂ ∂= + −⎢⎜ ⎟∂ ∂ ∂⎢⎝ ⎠⎣
∂ ∂+ ⊗ + ⊗ + ⊗
∂ ∂∂ ∂
+ ⊗ + ⊗ + ⊗∂ ∂
⎤∂+ ⋅ ⊗ + ⊗ ⎥∂ ⎦
S I C
a a a Ca a C a
b b b Cb b C b
a b a b b a
(2)
ϕ
ϕ−
ze
re
θeMatrix (elastin)
Collagen fiber
4 Lee and Kent / Stapp Car Crash Journal 51 (October 2007)
The collagen fibers are assumed to be arranged symmetrically in a two-dimensional plane formed by the circumferential ( θ ) and the longitudinal ( z ) axes (Zulliger et al. 2004, Holzapfel 2006). By introducing a mean fiber angle ϕ , the orientation with respect to the circumferential direction, the unit direction vectors can be written as follows.
0
0
cos sincos sin
z
z
θ
θ
ϕ ϕϕ ϕ
= +
= −
a e eb e e
(3)
Viscoelasticity. Experiments show that the human aorta exhibits different responses under dynamic and quasi-static loading rates (Mohan and Melvin 1982, Mohan and Melvin 1983, Shah et al. 2006). In general, smooth muscle cells in arteries are considered to be responsible for viscosity, and overall stiffness increases under dynamic loading conditions (Learoyd and Taylor 1966, Mohan and Melvin 1983). For the viscous effect in the model, the stress response is divided into the elastic and viscous parts given in a convolution integral form in Equation (4). The shear relaxation function, ( )G t and the bulk relaxation function, ( )K t are represented in terms of the Prony series.
( ) ( )0 0
( ) 2t td dt G t d K t d
d dτ τ τ τ
τ τ= − + −∫ ∫
ε Δσ I (4)
01
( ) expGn
G Gi G
i i
tG t G α ατ∞
=
⎡ ⎤⎛ ⎞= + −⎢ ⎥⎜ ⎟
⎢ ⎥⎝ ⎠⎣ ⎦∑ (5)
01
( ) expKn
K Ki K
i i
tK t K α ατ∞
=
⎡ ⎤⎛ ⎞= + −⎢ ⎥⎜ ⎟
⎢ ⎥⎝ ⎠⎣ ⎦∑ (6)
where σ is the Cauchy stress, ε the deviatoric part of the strain, Δ the volumetric part of the strain,
0G and 0K the instantaneous shear and bulk moduli, Gα∞ and Kα∞ the long-term relative moduli,
Giα and K
iα the relative moduli, and Giτ and K
iτ the relaxation times for each Prony component.
Residual stress. In vivo the aorta is pre-stretched under intravascular pressures, which accommodates lower stress gradients through the wall thickness. Although residual stresses are thought to be important for understanding of vascular growth and remodeling in large arteries (Holzapfel et al. 2007), the anisotropic constitutive model in the present study is developed without consideration of residual stresses in that those are negligible for hyper-physiological aortic behavior (APPENDIX C).
Constitutive coefficients identification. The material constants were determined from three separate stages for anisotropy, viscoelasticity and the global response, since the proposed constitutive model was composed of different groups of mathematical expressions for fiber orientations and viscous properties.
The unit direction vectors 0a and 0b for collagen fibers were identified by analyzing the mean fiber angle ϕ analytically from equi-biaxial test data, which provided relatively consistent anisotropic biaxial responses of the human aorta (Okamoto et al. 2002). The Cauchy stresses in the circumferential and longitudinal directions were derived by Equation (2) and biaxial kinematics with no shear coupling assumption. The stress responses were fitted to the experimental data by minimizing the following stress-based function as a function of ϕ .
( ) ( ) ( )2 2
1
nmod exp mod exp
zz zzi i i ii
f θθ θθϕ σ σ σ σ=
⎡ ⎤= − + −⎢ ⎥⎣ ⎦∑ (7)
where n is the number of data sampling points.
Few studies have reported viscoelastic properties for the aorta because the human arteries are relatively insensitive under various loading rates (Fung 1993). For the present work, aortic viscoelastic behavior was adopted from the analytical study of a human coronary artery by Holzapfel et al. (2002) over a wide range of frequencies. The use of five Maxwell elements from the dissipation energy analysis described arterial viscoelasticity sufficiently under physiological loading. The relative moduli in Equation (5) and (6) were defined as follows.
01
01
/ and 1
/ and 1
G Gi i i
i
K Ki i i
i
G G
K K
α α
α α
∞
=
∞
=
⎧= =⎪⎪
⎨⎪ = =⎪⎩
∑
∑ (8)
The global model response was characterized based on the dynamic failure inflation test by Mohan and Melvin (1983) in order to predict correct sub-failure finite deformation of the aorta. An optimization process was employed using the subproblem approximation algorithm available in ANSYS (ANSYS 2007). The polynomial coefficients of constitutive model in Equation (1) were parameterized as design variables and the circumferential and longitudinal stress responses were defined as state variables with equality constraints to match the dynamic aortic behavior from the experiment. The objective function was represented as a quadratic form in Equation (9) to

Lee and Kent / Stapp Car Crash Journal 51 (October 2007) 5
minimize the strain energy by evaluating the weighted least squares error norm given in Equation (10).
01 1 1
ˆm m m
i i ij i ji i j
A A y B y y= = =
Φ = + +∑ ∑∑ (9)
( )22 ( ) ( ) ( )
1
ˆdm
k k k
kE w
=
= Φ − Φ∑ (10)
where ^ is an approximated function, 0 , ,i ijA A A the polynomial coefficients for approximated function, y the design variables, m the number of design variables, w the weight associated with design set k , and dm current number of design sets.
Constitutive parameters determined by a limited number of experimental data may lead to ill-conditioned or non-unique solutions for different loading conditions. Convexity is a fundamental constraint that assures physically meaningful and mechanically reliable behavior in material characterization (Ogden 1997, Holzapfel and Gasser 2000). Accordingly, the identified set of material coefficients was evaluated by strict local convexity of the strain energy function on the Green-Lagrange strains, Eθθ and zzE plane.
Mechanical Behavior of Anisotropic Aorta Model – Comparison Relative to Experiments
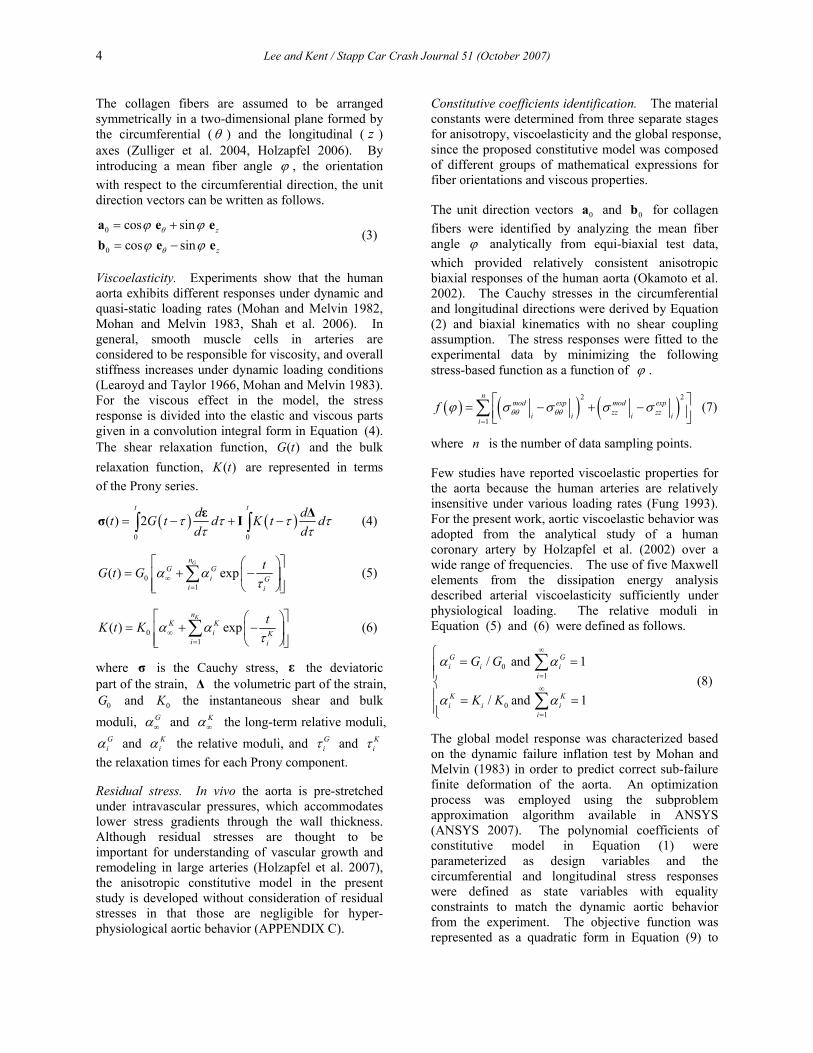
The constitutive parameters optimized from the experimental data of the human aorta are shown in Table 1. The mean fiber angle 42ϕ = ° obtained from the equi-biaxial data is located in between the layer-specific histological analysis of the media ( 37.8 20.6° ± ° ) and the adventitia ( 58.9 14.8° ± ° ) by Holzapfel (2006). Figure 3 illustrates that the model predicts anisotropic and nonlinear responses in the circumferential and longitudinal directions successfully under quasi-static biaxial loading (0.01 sec-1). The contour plot of the SEDF potential in Figure 4 shows that the identified set of material constants satisfies strict local convexity in the two-dimensional Green-Lagrange strain plane.
The finite sub-failure predictions of the model for various strain rates in uniaxial extension are examined and compared with those from the literature (Mohan and Melvin 1982). As shown in Figure 5, overall model responses for dynamic (100 sec-1) and quasi-static (0.01 sec-1) cases produce a good agreement with the averaged experimental results in the circumferential direction. The model predicts consistently less stiff behavior for the
longitudinal direction, which reflects the material anisotropy and corresponds well with the experiment for the dynamic case. The quasi-static experimental data, however, exhibit discrepant anisotropic uniaxial responses, with the longitudinal direction actually being slightly stiffer when all the experiments are averaged. This inconsistency between the quasi-static and dynamic data in the literature is an issue for further study, and may be a result of averaging an insufficient number of quasi-static data traces.
Table 1. Constitutive parameters for the human aorta
Parameter Subscript
1 2 3 4 5
Fiber angle (deg) φ 42
Polynomial coefficient
a 1668.6 9345.4
b 1885.9 95361
c 12300 118.2 118.0 81.6 10.2
d 12300 118.2 118.0 81.6 10.2
e 12300 118.2 118.0 81.6 10.2
f 12300 118.2 118.0 81.6 10.2
g 12300 118.2 118.0 81.6 10.2
Relative moduli α 0.2248 0.1822 0.1898 0.1852
Relaxation time (sec) τ 0.001 0.01 0.1 1.0
0.0 0.1 0.2 0.3 0.40
50
100
150
200
250 Exp. Circ. (Avg) Exp. Long. (Avg) Model Circ. Model Long.
Cau
chy
Stre
ss, σ
(kPa
)
Green-Lagrange Strain, E
Figure 3. Comparison of the experimental data (Okamoto et al. 2002) and the model responses in
equi-biaxial extension
6 Lee and Kent / Stapp Car Crash Journal 51 (October 2007)
Figure 4. Strain energy contour plot with the
optimized set of material constants
Figure 5. Comparison of the experimental data
(Mohan and Melvin 1982) and the model responses in uniaxial extension
Aortic Wall Failure Criterion
Considering a straight cylindrical vessel under internal pressure loading, the stress state is effectively represented by two-dimensional components which are the circumferential
(transverse) stress and the longitudinal (axial) stress. The maximum principal stress coincides with the circumferential direction in this case, and determines possible failure directions. Similarly, the aortic wall can be assumed to experience a two-dimensional stress state. Aortic failure in the in vitro aorta model can be assessed by a maximum principal stress-based failure criterion, and possible failure directions can be calculated from wall deformation, which are orthogonal to the maximum principal vectors.
The failure stress level was obtained from equi-biaxial testing. A dynamic (100 sec-1) biaxial test was performed using the anisotropic material model identified in this study, and the maximum principal stress at failure was measured based on the stress-strain threshold of the human aorta proposed by Shah et al. (2006). Compared to the averaged stress and strain measurements of the experiment, the model response was less stiff in the longitudinal direction, although overall behavior was within the standard deviation of the experimental data. Since the failure threshold in the circumferential direction was not provided in this biaxial test, the circumferential failure stress was obtained from the aorta material model by applying the experimental stress-strain threshold to the longitudinal model response. The material model predicted the circumferential stress of 1.43 MPa at failure, which is equivalent to the maximum principal stress by anisotropic biaxial deformation. Table 2 shows the comparison of aortic failure thresholds between the experiment and numerical calculation.
Table 2. Aortic failure thresholds in biaxial extension
Threshold Experiment by Shah et al. ( ± S.D.)
Anisotropic material model
Longitudinal Cauchy stress
2.01 MPa ( ± 0.99) 1.31 MPa
Longitudinal Lagrangian strain
0.254 ( ± 0.112) 0.339
Circumferential failure stress N/A 1.43 MPa
In Vitro Human Aorta Model
The surface geometry of the aorta was reconstructed from the cryosection images of the Visible Human Project (National Library of Medicine, Male). The boundaries of the aortic inner and outer walls were
(a) Dynamic uniaxial extension
(b) Quasi-static uniaxial extension
0.0 0.2 0.4 0.6 0.8 1.0 1.2 1.40.0
1.0
2.0
3.0
4.0
5.0
6.0
7.0 Exp. Circ. Exp. Long. Exp. Circ. (Avg) Exp. Long. (Avg) Model Circ. Model Long.
Cau
chy
Stre
ss, σ
(MPa
)
Green-Lagrange Strain, E
0.0 0.2 0.4 0.6 0.8 1.0 1.2 1.40.0
0.5
1.0
1.5
2.0
2.5
3.0
3.5 Exp. Circ. Exp. Long. Exp. Circ. (Avg) Exp. Long. (Avg) Model Circ. Model Long.
Cau
chy
Stre
ss, σ
(MPa
)
Green-Lagrange Strain, E
Lee and Kent / Stapp Car Crash Journal 51 (October 2007) 7
semi-automatically outlined on each transverse plane image from the aortic branches at the thoracic vertebra, T2 level to the descending aorta at the T10 level. The 3D polygon surfaces were created from the set of 2D outlines by the image processing software, 3D-Doctor (Able Software Corp.). Then, the polygon surfaces were smoothened with the feature lines and the NURBS (non-uniform rational B-spline) surfaces were defined by using the 3D modeling tool, Rhinoceros (Robert McNeel & Associates).
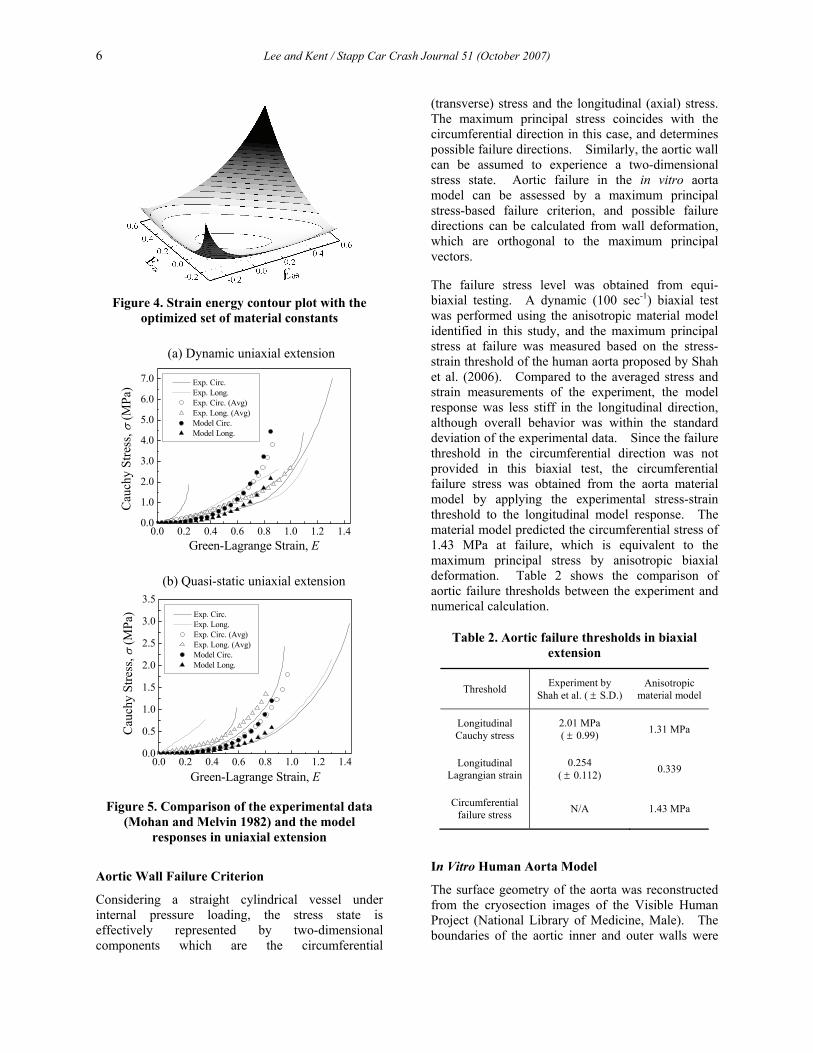
The aorta and blood domains were discretized by hexahedral elements generated by the multi-block structure algorithm in the finite element mesh generator, ICEM-CFD (ANSYS, Inc.). In this procedure, the model topology associating sub-blocks with the model geometry was mapped onto the NURBS surfaces. The model consisted of 1,352 8-noded structural elements (SOLID185) for the aorta and 5,592 8-noded FLOTRAN CFD elements (FLUID142) for the blood. The solid elements in the aorta domain were oriented to maintain anisotropy in the circumferential and longitudinal directions following the material definition by the cylindrical local coordinate systems. The two-way coupling between the aorta and the blood was defined at the fluid-structure interface shown in Figure 6.
Figure 6. In vitro human aorta FE model
Physiological Boundary Conditions of the Aorta
The aorta model is a precise representation of the anatomical and histological details of the human aorta, but the in vitro model environment lacks peripheral structures in the thorax such as the heart, lungs and spine. The inclusion of these structures per se would increase both the complexity and the uncertainty in the accuracy of the boundary
conditions on the aorta model. Thus, the physiological boundary conditions on the aorta (e.g., flow at the inlet and outlet, structural degrees of freedom) were defined explicitly based on experimental data contained primarily in the literature describing physiological cardiovascular mechanics, as outlined in detail in the following paragraph.
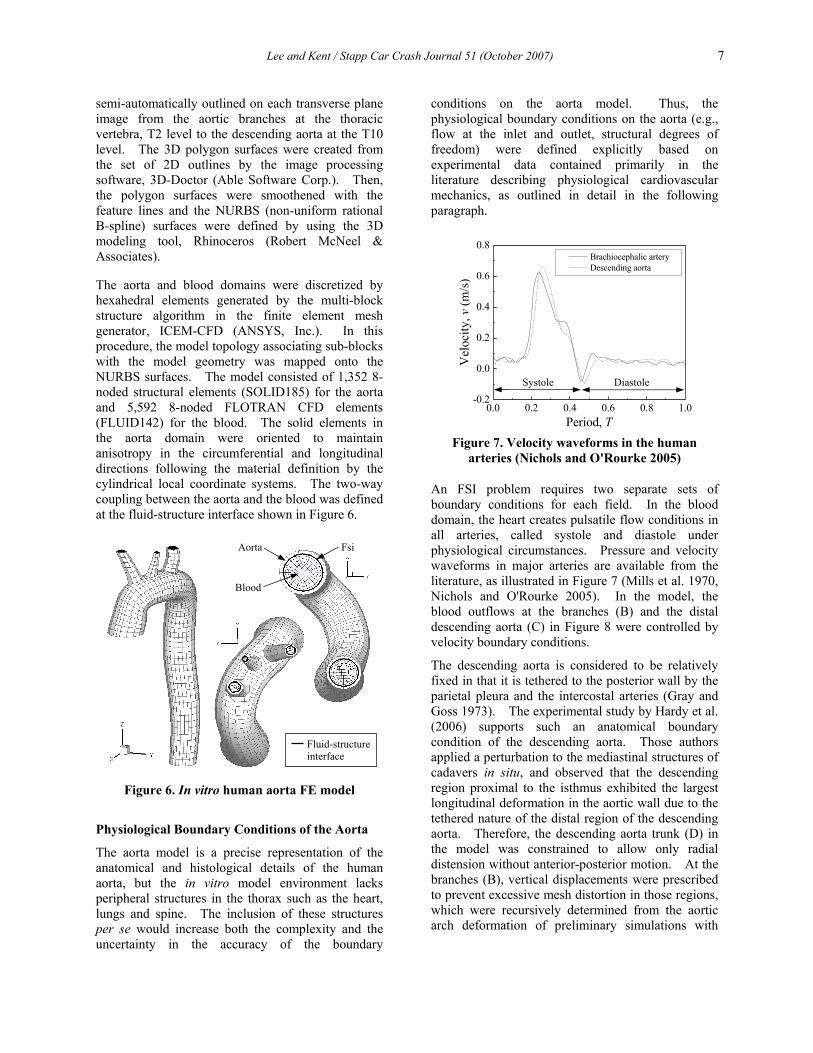
Figure 7. Velocity waveforms in the human
arteries (Nichols and O'Rourke 2005)
An FSI problem requires two separate sets of boundary conditions for each field. In the blood domain, the heart creates pulsatile flow conditions in all arteries, called systole and diastole under physiological circumstances. Pressure and velocity waveforms in major arteries are available from the literature, as illustrated in Figure 7 (Mills et al. 1970, Nichols and O'Rourke 2005). In the model, the blood outflows at the branches (B) and the distal descending aorta (C) in Figure 8 were controlled by velocity boundary conditions.
The descending aorta is considered to be relatively fixed in that it is tethered to the posterior wall by the parietal pleura and the intercostal arteries (Gray and Goss 1973). The experimental study by Hardy et al. (2006) supports such an anatomical boundary condition of the descending aorta. Those authors applied a perturbation to the mediastinal structures of cadavers in situ, and observed that the descending region proximal to the isthmus exhibited the largest longitudinal deformation in the aortic wall due to the tethered nature of the distal region of the descending aorta. Therefore, the descending aorta trunk (D) in the model was constrained to allow only radial distension without anterior-posterior motion. At the branches (B), vertical displacements were prescribed to prevent excessive mesh distortion in those regions, which were recursively determined from the aortic arch deformation of preliminary simulations with
0.0 0.2 0.4 0.6 0.8 1.0-0.2
0.0
0.2
0.4
0.6
0.8 Brachiocephalic artery Descending aorta
Vel
ocity
, v (m
/s)
Period, T
Systole Diastole
FsiAorta
Blood
Fluid-structure interface

8 Lee and Kent / Stapp Car Crash Journal 51 (October 2007)
fixed boundary conditions at (B). The distal end (C) was fixed for all analyses.
Figure 8. In vitro aorta model boundary
conditions
Parametric Study
Frontal impact loading conditions. The human body undergoes severe mechanical loads during car crashes as a result of an abrupt change in vehicle speed (King and Yang 1995). The vehicle experiences sudden deceleration and consequently the occupant’s chest is both accelerated and compressed due to the relative motion that builds between the thorax and the steering wheel or restraint systems. Global or local chest deformation induces rapid incompressible blood flow in the aorta resulting in a dramatic rise of the intravascular pressure. In addition, the blood may be occluded at remote locations from the heart where the opposition to the rapid blood flow exists, generally referred to as resistance or impedance (Lundewall 1964, Nichols and O'Rourke 2005). Accordingly, a high pressure pulse is observed in the blood near the aortic arch under automotive crash situations.
In the present study, aortic pressure, chest deceleration and chest compression are considered as the primary factors of TAR mechanism, which are typically measurable in experiments (Richens et al. 2002, Nikolic et al. 2006). Two complete sets of data were taken from frontal sled tests (University of Virginia Center for Applied Biomechanics 2007). All tests were performed with the impact velocity of 48 km/hr and the occupant was restrained by a standard three-point belt in the rear seat. For more detail on the protocols used for cadaver sled tests at the University of Virginia, see Kent et al. (2001) and Forman et al. (2005).
Figure 9. Time history data from frontal sled tests
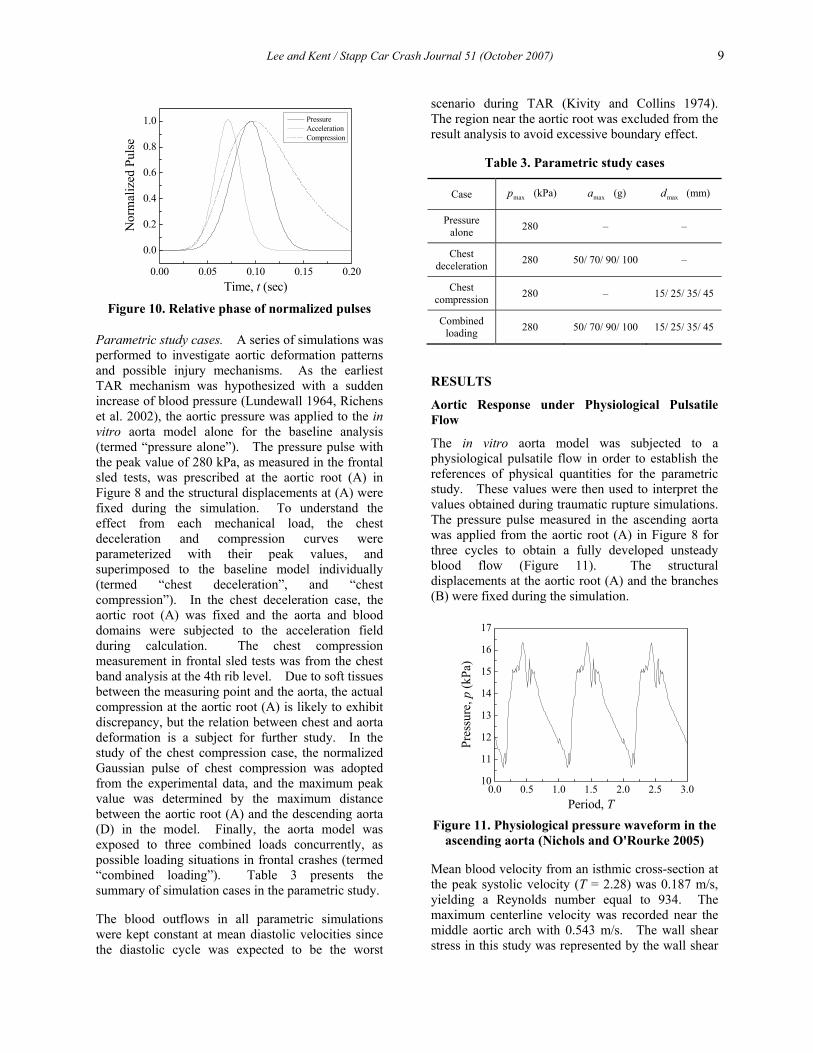
The purpose of the aorta model was to perform a series of analyses by imposing parameterized mechanical loads on the basis of actual frontal crash data. Hence, each of the time history data traces was fitted to a Gaussian form and averaged in order to control the peak value for the parametric study (Figure 9). Figure 10 illustrates the relative phase of three normalized pulses during the frontal impact. The acceleration pulse precedes the pressure peak by approximately 25 ms and the chest compression is nearly in phase with the pressure measurement.
T6
x
z
T10
(A)
(B)
(C)
(D) 0.00 0.05 0.10 0.15 0.20
0
50
100
150
200
250
300
350 Sled tests Gaussian fit
Aor
tic P
ress
ure,
p (k
Pa)
Time, t (sec)
0.00 0.05 0.10 0.15 0.20
0
10
20
30
40
50
60 Sled tests Gaussian fit
Che
st D
ecel
erat
ion,
a (g
)
Time, t (sec)
0.00 0.05 0.10 0.15 0.20
0
20
40
60
80 Sled tests Gaussian fit
Che
st C
ompr
essi
on, d
(mm
)
Time, t (sec)
Lee and Kent / Stapp Car Crash Journal 51 (October 2007) 9
0.00 0.05 0.10 0.15 0.20
0.0
0.2
0.4
0.6
0.8
1.0
Nor
mal
ized
Pul
se
Time, t (sec)
Pressure Acceleration Compression
Figure 10. Relative phase of normalized pulses
Parametric study cases. A series of simulations was performed to investigate aortic deformation patterns and possible injury mechanisms. As the earliest TAR mechanism was hypothesized with a sudden increase of blood pressure (Lundewall 1964, Richens et al. 2002), the aortic pressure was applied to the in vitro aorta model alone for the baseline analysis (termed “pressure alone”). The pressure pulse with the peak value of 280 kPa, as measured in the frontal sled tests, was prescribed at the aortic root (A) in Figure 8 and the structural displacements at (A) were fixed during the simulation. To understand the effect from each mechanical load, the chest deceleration and compression curves were parameterized with their peak values, and superimposed to the baseline model individually (termed “chest deceleration”, and “chest compression”). In the chest deceleration case, the aortic root (A) was fixed and the aorta and blood domains were subjected to the acceleration field during calculation. The chest compression measurement in frontal sled tests was from the chest band analysis at the 4th rib level. Due to soft tissues between the measuring point and the aorta, the actual compression at the aortic root (A) is likely to exhibit discrepancy, but the relation between chest and aorta deformation is a subject for further study. In the study of the chest compression case, the normalized Gaussian pulse of chest compression was adopted from the experimental data, and the maximum peak value was determined by the maximum distance between the aortic root (A) and the descending aorta (D) in the model. Finally, the aorta model was exposed to three combined loads concurrently, as possible loading situations in frontal crashes (termed “combined loading”). Table 3 presents the summary of simulation cases in the parametric study.
The blood outflows in all parametric simulations were kept constant at mean diastolic velocities since the diastolic cycle was expected to be the worst
scenario during TAR (Kivity and Collins 1974). The region near the aortic root was excluded from the result analysis to avoid excessive boundary effect.
Table 3. Parametric study cases
Case maxp (kPa) maxa (g) maxd (mm)
Pressure alone 280 – –
Chest deceleration 280 50/ 70/ 90/ 100 –
Chest compression 280 – 15/ 25/ 35/ 45
Combined loading 280 50/ 70/ 90/ 100 15/ 25/ 35/ 45
RESULTS
Aortic Response under Physiological Pulsatile Flow
The in vitro aorta model was subjected to a physiological pulsatile flow in order to establish the references of physical quantities for the parametric study. These values were then used to interpret the values obtained during traumatic rupture simulations. The pressure pulse measured in the ascending aorta was applied from the aortic root (A) in Figure 8 for three cycles to obtain a fully developed unsteady blood flow (Figure 11). The structural displacements at the aortic root (A) and the branches (B) were fixed during the simulation.
0.0 0.5 1.0 1.5 2.0 2.5 3.010
11
12
13
14
15
16
17
Pres
sure
, p (k
Pa)
Period, T
Figure 11. Physiological pressure waveform in the ascending aorta (Nichols and O'Rourke 2005)
Mean blood velocity from an isthmic cross-section at the peak systolic velocity (T = 2.28) was 0.187 m/s, yielding a Reynolds number equal to 934. The maximum centerline velocity was recorded near the middle aortic arch with 0.543 m/s. The wall shear stress in this study was represented by the wall shear
10 Lee and Kent / Stapp Car Crash Journal 51 (October 2007)
rate (WSR) γ , the velocity gradient, defined by the following relation.
/wγ τ μ= (11)
where wτ is the wall shear stress and μ the dynamic viscosity. The maximum WSR was observed near the region of the ascending aorta proximal to the arch with a magnitude of 1297 sec-1. The pressure at T = 2.44 was distributed with a monotonously decreasing gradient through the aorta with the maximum of 16.3 kPa. On the structural side, the maximum principal stress and strain were concentrated near the aortic arch at T = 2.88 with the maximum values of 199.9 kPa and 0.343, respectively. Table 4 presents the summary of maximum values for the physiological pulsatile flow in the aorta.
Table 4. Numerical calculation of the maximum reference values under physiological pulsatile flow
in the aorta
v (m/s)
p (kPa)
γ (sec-1)
1σ (kPa)
1E
0.543 16.3 1297 199.9 0.343
Aortic Response under Frontal Impact Conditions
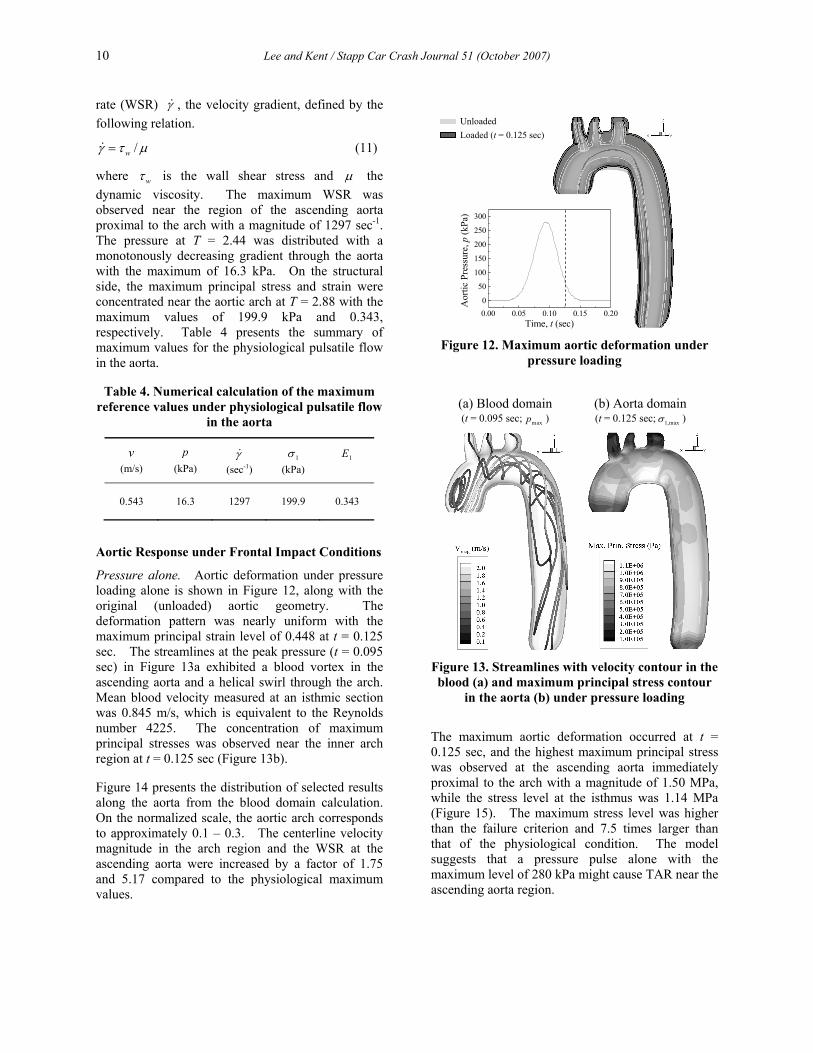
Pressure alone. Aortic deformation under pressure loading alone is shown in Figure 12, along with the original (unloaded) aortic geometry. The deformation pattern was nearly uniform with the maximum principal strain level of 0.448 at t = 0.125 sec. The streamlines at the peak pressure (t = 0.095 sec) in Figure 13a exhibited a blood vortex in the ascending aorta and a helical swirl through the arch. Mean blood velocity measured at an isthmic section was 0.845 m/s, which is equivalent to the Reynolds number 4225. The concentration of maximum principal stresses was observed near the inner arch region at t = 0.125 sec (Figure 13b).
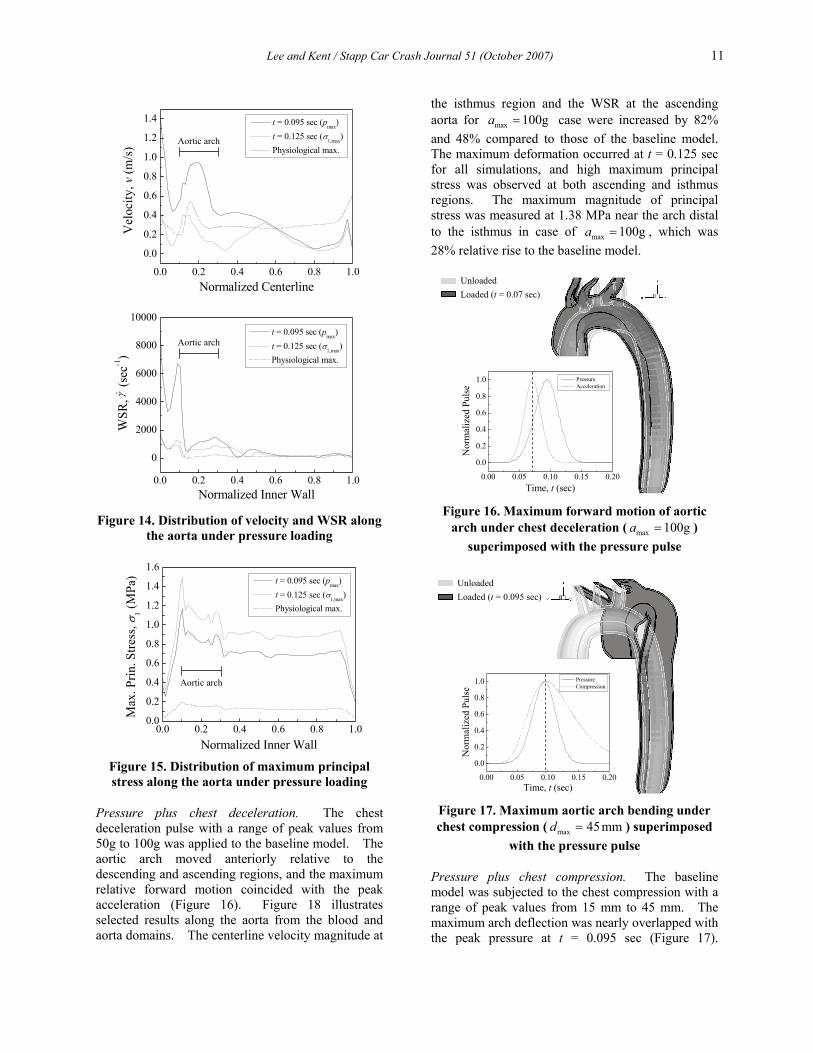
Figure 14 presents the distribution of selected results along the aorta from the blood domain calculation. On the normalized scale, the aortic arch corresponds to approximately 0.1 – 0.3. The centerline velocity magnitude in the arch region and the WSR at the ascending aorta were increased by a factor of 1.75 and 5.17 compared to the physiological maximum values.
Figure 12. Maximum aortic deformation under
pressure loading
Figure 13. Streamlines with velocity contour in the blood (a) and maximum principal stress contour
in the aorta (b) under pressure loading
The maximum aortic deformation occurred at t = 0.125 sec, and the highest maximum principal stress was observed at the ascending aorta immediately proximal to the arch with a magnitude of 1.50 MPa, while the stress level at the isthmus was 1.14 MPa (Figure 15). The maximum stress level was higher than the failure criterion and 7.5 times larger than that of the physiological condition. The model suggests that a pressure pulse alone with the maximum level of 280 kPa might cause TAR near the ascending aorta region.
(a) Blood domain (t = 0.095 sec; maxp )
(b) Aorta domain (t = 0.125 sec; 1,maxσ )
0.00 0.05 0.10 0.15 0.200
50
100
150
200
250
300
Aor
tic P
ress
ure,
p (k
Pa)
Time, t (sec)
Unloaded Loaded (t = 0.125 sec)
Lee and Kent / Stapp Car Crash Journal 51 (October 2007) 11
Figure 14. Distribution of velocity and WSR along
the aorta under pressure loading
Figure 15. Distribution of maximum principal stress along the aorta under pressure loading
Pressure plus chest deceleration. The chest deceleration pulse with a range of peak values from 50g to 100g was applied to the baseline model. The aortic arch moved anteriorly relative to the descending and ascending regions, and the maximum relative forward motion coincided with the peak acceleration (Figure 16). Figure 18 illustrates selected results along the aorta from the blood and aorta domains. The centerline velocity magnitude at
the isthmus region and the WSR at the ascending aorta for max 100ga = case were increased by 82% and 48% compared to those of the baseline model. The maximum deformation occurred at t = 0.125 sec for all simulations, and high maximum principal stress was observed at both ascending and isthmus regions. The maximum magnitude of principal stress was measured at 1.38 MPa near the arch distal to the isthmus in case of max 100ga = , which was 28% relative rise to the baseline model.
Figure 16. Maximum forward motion of aortic
arch under chest deceleration ( max 100ga = ) superimposed with the pressure pulse
Figure 17. Maximum aortic arch bending under chest compression ( max 45mmd = ) superimposed
with the pressure pulse
Pressure plus chest compression. The baseline model was subjected to the chest compression with a range of peak values from 15 mm to 45 mm. The maximum arch deflection was nearly overlapped with the peak pressure at t = 0.095 sec (Figure 17).
0.00 0.05 0.10 0.15 0.20
0.0
0.2
0.4
0.6
0.8
1.0 Pressure Compression
Nor
mal
ized
Pul
se
Time, t (sec)
Unloaded Loaded (t = 0.095 sec)
0.00 0.05 0.10 0.15 0.20
0.0
0.2
0.4
0.6
0.8
1.0 Pressure Acceleration
Nor
mal
ized
Pul
se
Time, t (sec)
Unloaded Loaded (t = 0.07 sec)
0.0 0.2 0.4 0.6 0.8 1.00.0
0.2
0.4
0.6
0.8
1.0
1.2
1.4
1.6 t = 0.095 sec (pmax) t = 0.125 sec (σ1,max) Physiological max.
Max
. Prin
. Stre
ss, σ
1 (MPa
)
Normalized Inner Wall
Aortic arch
0.0 0.2 0.4 0.6 0.8 1.0
0.0
0.2
0.4
0.6
0.8
1.0
1.2
1.4 t = 0.095 sec (pmax) t = 0.125 sec (σ1,max) Physiological max.
Vel
ocity
, v (m
/s)
Normalized Centerline
Aortic arch
0.0 0.2 0.4 0.6 0.8 1.0
0
2000
4000
6000
8000
10000 t = 0.095 sec (pmax) t = 0.125 sec (σ1,max) Physiological max.
WSR
, (
sec-1
)
Normalized Inner Wall
Aortic arch
γ
12 Lee and Kent / Stapp Car Crash Journal 51 (October 2007)
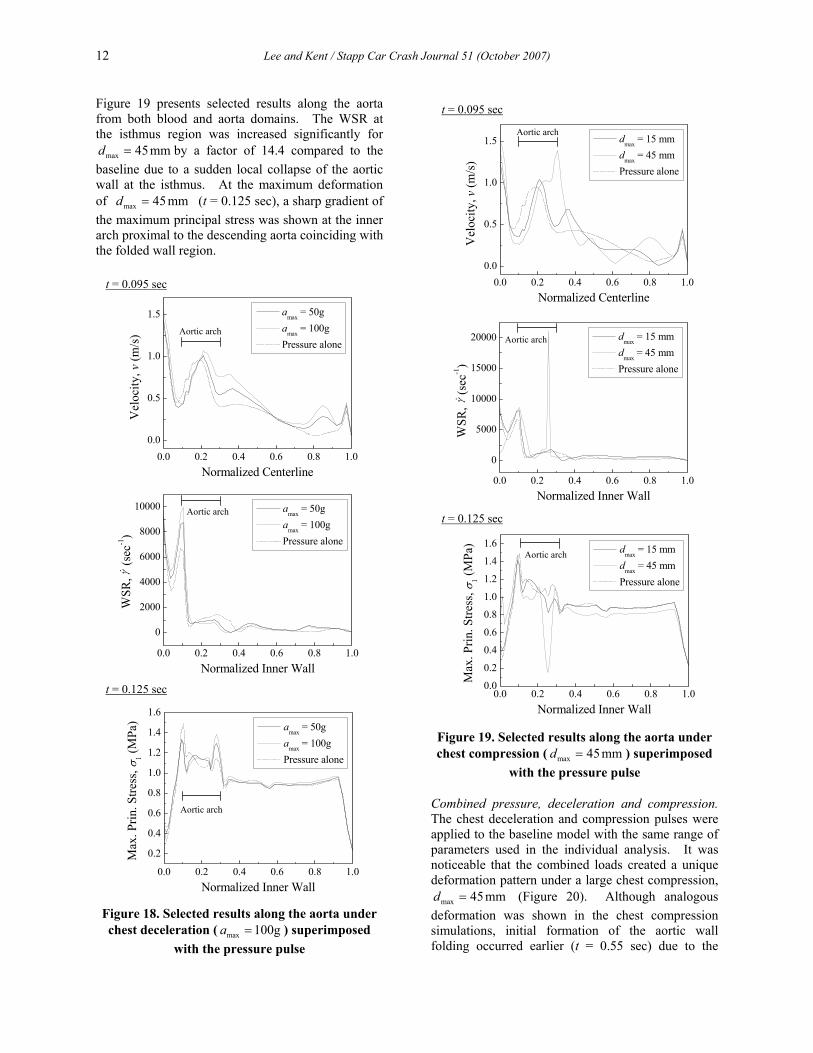
Figure 19 presents selected results along the aorta from both blood and aorta domains. The WSR at the isthmus region was increased significantly for
max 45mmd = by a factor of 14.4 compared to the baseline due to a sudden local collapse of the aortic wall at the isthmus. At the maximum deformation of max 45mmd = (t = 0.125 sec), a sharp gradient of the maximum principal stress was shown at the inner arch proximal to the descending aorta coinciding with the folded wall region.
Figure 18. Selected results along the aorta under chest deceleration ( max 100ga = ) superimposed
with the pressure pulse
Figure 19. Selected results along the aorta under chest compression ( max 45mmd = ) superimposed
with the pressure pulse
Combined pressure, deceleration and compression. The chest deceleration and compression pulses were applied to the baseline model with the same range of parameters used in the individual analysis. It was noticeable that the combined loads created a unique deformation pattern under a large chest compression,
max 45mmd = (Figure 20). Although analogous deformation was shown in the chest compression simulations, initial formation of the aortic wall folding occurred earlier (t = 0.55 sec) due to the
0.0 0.2 0.4 0.6 0.8 1.00.0
0.5
1.0
1.5 dmax = 15 mm d
max = 45 mm
Pressure alone
Vel
ocity
, v (m
/s)
Normalized Centerline
Aortic arch
0.0 0.2 0.4 0.6 0.8 1.00.0
0.2
0.4
0.6
0.8
1.0
1.2
1.4
1.6 dmax = 15 mm dmax = 45 mm Pressure alone
Max
. Prin
. Stre
ss, σ
1 (MPa
)
Normalized Inner Wall
Aortic arch
t = 0.095 sec
t = 0.125 sec
0.0 0.2 0.4 0.6 0.8 1.0
0
5000
10000
15000
20000 dmax = 15 mm d
max = 45 mm
Pressure alone
WSR
, (
sec-1
)
Normalized Inner Wall
Aortic arch
γ
t = 0.095 sec
0.0 0.2 0.4 0.6 0.8 1.0
0.2
0.4
0.6
0.8
1.0
1.2
1.4
1.6 amax = 50g amax = 100g Pressure alone
Max
. Prin
. Stre
ss, σ
1 (MPa
)
Normalized Inner Wall
Aortic arch
0.0 0.2 0.4 0.6 0.8 1.00.0
0.5
1.0
1.5 amax = 50g amax = 100g Pressure alone
Vel
ocity
, v (m
/s)
Normalized Centerline
Aortic arch
t = 0.125 sec
0.0 0.2 0.4 0.6 0.8 1.0
0
2000
4000
6000
8000
10000 amax = 50g amax = 100g Pressure alone
WSR
, (
sec-1
)
Normalized Inner Wall
Aortic arch
γ

Lee and Kent / Stapp Car Crash Journal 51 (October 2007) 13
acceleration causing forward aortic motion in those simulations. As a result, the maximum deformation (t = 0.11 sec) was observed close to the peak pressure (t = 0.095 sec), unlike other cases.
Figure 20. Maximum aortic deformation under combined loading ( max max100g, 45mma d= = )
As shown in Figure 21a, the streamlines at t = 0.11 sec demonstrates helical swirls in the arch and descending regions. Mean velocity of the blood from an isthmic cross-section was 0.674 m/s, which was a Reynolds number of 3370. High maximum principal stresses were shown in the ascending and vicinity of the folded wall regions in Figure 21b.
Figure 21. Streamlines with velocity contour in the blood (a) and maximum principal stress contour
in the aorta (b) under combined loading ( max max100g, 45mma d= = )
Figure 22 illustrates the surface plots of selected measurements from the blood domain. Overall
centerline velocity was similar to the baseline case and the chest compression contributed dominantly in velocity changes. High WSR was observed near the isthmus region at max 45mmd = and the chest deceleration multiplied its magnitude exponentially to 51.07 10× sec-1 at max 100ga = .
In the aorta (Figure 23), the magnitudes of the maximum principal stresses at the ascending aorta were mostly affected by the chest compression, and sufficiently large to cause ruptures over
max 35mmd = . In addition, the stress level at the isthmus was comparable to the ascending aorta region for a large chest compression, max 45mmd = .
Figure 22. Surface plots of maximum velocity and
WSR in the blood under combined loading (Maximum physiological velocity was 0.543 m/s
and WSR was 1297 sec-1)
(a) Blood domain (t = 0.11 sec; 1,maxσ )
(b) Aorta domain (t = 0.11 sec; 1,maxσ )
0.00 0.05 0.10 0.15 0.20
0.0
0.2
0.4
0.6
0.8
1.0
Nor
mal
ized
Pul
se
Time, t (sec)
Pressure Acceleration Compression
Unloaded Loaded (t = 0.11 sec)

14 Lee and Kent / Stapp Car Crash Journal 51 (October 2007)
Figure 23. Surface plots of maximum principal
stress in the aorta under combined loading (Maximum physiological principal stress in
ascending aorta was 199.9 kPa and in the isthmus was 162.4 kPa)
DISCUSSION
Possible Failure Directions in TAR
As described earlier, possible failure directions can be found using the maximum principal vectors. Figure 24 shows those directions on the aortic wall for the pressure alone and combined loading cases. The failure directions in the pressure alone case are uniformly oriented toward the longitudinal direction along the aorta. However, those directions are skewed rather transversely when the aorta is subjected to traumatic rupture conditions in Figure 24b, which indicates that the maximum principal stresses are aligned longitudinally near the isthmus region.
Figure 24. Possible failure directions in the aorta
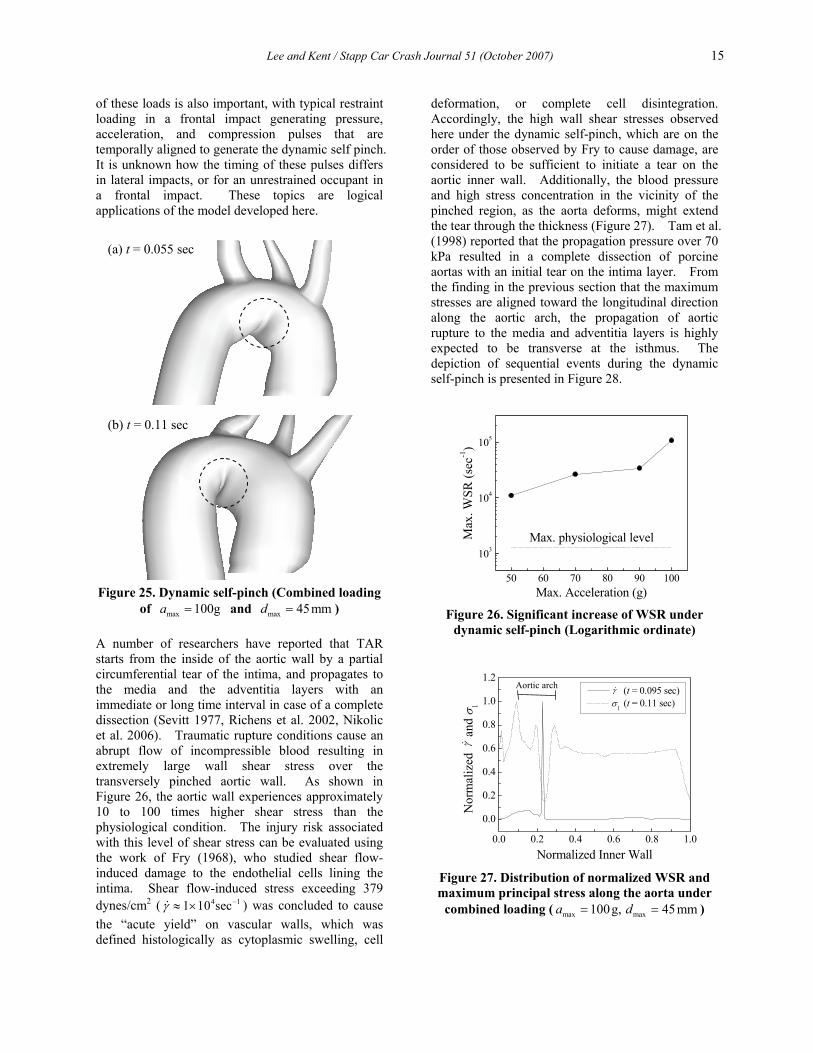
Dynamic Self-Pinch: A New TAR Mechanism
The aorta is anatomically a curved structure with various radii. The aortic curvature is structurally vulnerable to local bending along the inner wall from the ascending aorta to the isthmus, and locations may vary depending on blunt impact loading conditions and directions. As far as frontal car crashes are concerned, the in vitro aorta model predicts that a distinctive wall folding occurs at the isthmus when a large chest compression is applied to the aorta combined with typical frontal impact loading. This deformation pattern does not occur in the presence of chest acceleration without chest compression, but is exacerbated by the presence of acceleration when chest compression occurs.
Dynamic self-pinch, the specific local deformation pattern at the aortic inner arch, is proposed as a new injury mechanism for TAR (Figure 25). This wall pinching cannot be induced by pressure loading alone of any magnitude because the forward momentum from acceleration and the backward motion of the heart that occurs with chest compression contribute to this aortic deformation pattern. The relative timing
(a) Pressure alone
(b) Combined loading
max 280 kPap =
max 280 kPap =
max 100a g=
max 45mmd =
Lee and Kent / Stapp Car Crash Journal 51 (October 2007) 15
of these loads is also important, with typical restraint loading in a frontal impact generating pressure, acceleration, and compression pulses that are temporally aligned to generate the dynamic self pinch. It is unknown how the timing of these pulses differs in lateral impacts, or for an unrestrained occupant in a frontal impact. These topics are logical applications of the model developed here.
Figure 25. Dynamic self-pinch (Combined loading
of max 100ga = and max 45mmd = )
A number of researchers have reported that TAR starts from the inside of the aortic wall by a partial circumferential tear of the intima, and propagates to the media and the adventitia layers with an immediate or long time interval in case of a complete dissection (Sevitt 1977, Richens et al. 2002, Nikolic et al. 2006). Traumatic rupture conditions cause an abrupt flow of incompressible blood resulting in extremely large wall shear stress over the transversely pinched aortic wall. As shown in Figure 26, the aortic wall experiences approximately 10 to 100 times higher shear stress than the physiological condition. The injury risk associated with this level of shear stress can be evaluated using the work of Fry (1968), who studied shear flow-induced damage to the endothelial cells lining the intima. Shear flow-induced stress exceeding 379 dynes/cm2 ( 4 11 10 secγ −≈ × ) was concluded to cause the “acute yield” on vascular walls, which was defined histologically as cytoplasmic swelling, cell
deformation, or complete cell disintegration. Accordingly, the high wall shear stresses observed here under the dynamic self-pinch, which are on the order of those observed by Fry to cause damage, are considered to be sufficient to initiate a tear on the aortic inner wall. Additionally, the blood pressure and high stress concentration in the vicinity of the pinched region, as the aorta deforms, might extend the tear through the thickness (Figure 27). Tam et al. (1998) reported that the propagation pressure over 70 kPa resulted in a complete dissection of porcine aortas with an initial tear on the intima layer. From the finding in the previous section that the maximum stresses are aligned toward the longitudinal direction along the aortic arch, the propagation of aortic rupture to the media and adventitia layers is highly expected to be transverse at the isthmus. The depiction of sequential events during the dynamic self-pinch is presented in Figure 28.
50 60 70 80 90 100
103
104
105
Max
. WSR
(sec
-1)
Max. Acceleration (g)
Max. physiological level
Figure 26. Significant increase of WSR under
dynamic self-pinch (Logarithmic ordinate)
Figure 27. Distribution of normalized WSR and maximum principal stress along the aorta under
combined loading ( max max100g, 45mma d= = )
0.0 0.2 0.4 0.6 0.8 1.0
0.0
0.2
0.4
0.6
0.8
1.0
1.2 (t = 0.095 sec) σ1 (t = 0.11 sec)
Nor
mal
ized
a
nd σ
1
Normalized Inner Wall
Aortic arch
γ
γ
(a) t = 0.055 sec
(b) t = 0.11 sec

16 Lee and Kent / Stapp Car Crash Journal 51 (October 2007)
Figure 28. Schematic depiction of the injury
mechanism in dynamic self-pinch
From the numerical results in the present parametric study, traumatic rupture conditions are determined by high acceleration over 50g and large chest compressions over 45 mm (at the aortic root) in combination with high intravascular pressure at a level of 280 kPa. Such frontal impact circumstances lead to a transverse tear of the aortic wall eventually.
Based on the maximum stress level from all parametric study results, the ascending aorta is another susceptible site of TAR. The clinical finding that the ascending part is the second most
common rupture site supports this numerical result (Symbas et al. 1973, Burkhart et al. 2001, Nikolic et al. 2006). The rupture direction at this region tends to be longitudinal due to traditional failure mechanism of a cylindrical pressure vessel.
Intravascular Pressure during TAR
The parametric study described above considered a single value of pressure magnitude ( max 280kPap = ), but the blood pressure level in TAR found experimentally varies widely, from approximately 100 kPa to 400 kPa (Lundewall 1964, Bass et al. 2001, Richens et al. 2002). As a preliminary assessment of the model’s sensitivity to pressure magnitude, a lower peak pressure max 100kPap = in the pressure alone case was compared to the baseline result. As shown in Figure 29, the overall stress distribution along the aorta with max 100kPap = exhibits a similar profile to max 280kPap = pressure pulse, but the highest maximum principal stress is much lower, 398 kPa, which is 72% lower than the failure stress of 1.43 MPa.
Figure 29. Comparison of maximum principal stress level under different pressure loading
In Vitro Model Limitation
In numerical analysis, there are many factors that affect model responses. Characteristics of the mesh are some of these factors. The numerical technique adopted in this study, i.e. implicit formulation of two-way code coupling, has its own set of sensitivities. In the fluid solver, for instance, advection schemes, stability control or velocity/pressure convergence parameters influence the result, and in some situations this sensitivity is greater than that due to mesh density or other mesh characteristics. On the structural side, element formulations or force/ displacement convergence tolerance also affect the model response. Finally, this algorithm ties two sets
0.0 0.2 0.4 0.6 0.8 1.00.0
0.2
0.4
0.6
0.8
1.0
1.2
1.4
1.6 pmax = 280 kPa pmax = 100 kPa Physiological max.
M
ax. P
rin. S
tress
, σ1 (M
Pa)
Normalized Inner Wall
Aortic arch
(a) Pinch formation (t = 0.055 sec)
γ
Endothelial cell damage
Transverse local pinch
p1σ
1σPropagation of initial tear through thickness
(b) Intimal tear (t = 0.095 sec)
(c) Tear propagation (t = 0.11 sec)

Lee and Kent / Stapp Car Crash Journal 51 (October 2007) 17
of field equations together by transferring load vectors, and therefore special relaxation parameters are introduced to complete their fluid-structure interactions (ANSYS 2007). Although the effects from such parameters were carefully observed through the model development process, the sensitivity of the in vitro aorta model was evaluated by a limited number of numerical factors in the present study. An in-depth discussion of the model dependency is beyond the scope of the current work. As a result, additional experimental validations would be needed before the results from this study could be generalized and used as predictive.
The occurrence of TAR might be related to peripheral structures of the aorta such as the ligamentum arteriosum or the pulmonary artery, which can induce a sudden localized high stress in the aortic wall by dynamic interactions during traumatic loading conditions. In addition, aortic deformation and blood flow patterns might be affected by vertical or lateral motion of the aortic root and possible compression of the descending aorta due to the heart deformation under traumatic rupture conditions. Although providing TAR characteristics at a level of detail, the in vitro aorta model lacks such consideration fundamentally. The proposed FSI technique and aorta model can be extended to analysis for complex anatomical boundary conditions in future study.
CONCLUSION
A comprehensive understanding of TAR has been considered to be challenging experimentally and numerically due to the physical complexity. In this study, the in vitro aorta model developed from human aortic morphology was successfully used to study traumatic rupture conditions and identify a possible injury mechanism in frontal impacts. The use of a FSI approach in the aortic rupture is a necessary condition to describe changes in blood flow patterns, which induce significant shear stresses on the aortic wall, and wall deformation.
Dynamic self-pinch, a numerically identified injury mechanism for TAR, is proposed as a result of the parametric study. The model predicts that traumatic rupture conditions induce a unique local bending of the aortic wall transversely near the isthmus region. Extremely high shear flow over the pinched wall initiates the intimal tear, and high stress components skewed toward the longitudinal direction extend the tear through the wall thickness in case of a complete aortic dissection.
ACKNOWLEDGMENTS
The authors are grateful to J.A.C. Humphrey for valuable support and advice on fluid mechanics area. This project is supported by the U.S. Department of Transportation, National Highway Traffic Safety Administration under Cooperative Award No. DTNH22-01-H-07292.
REFERENCES
ANSYS. (2007) ANSYS theory reference. ANSYS, Inc.
Bass, C. R., Darvish, K., Bush, B., Crandall, J. R., Srinivasan, S. C., Tribble, C., Fiser, S., Tourret, L., Evans, J. C., Patrie, J., and Wang, C. (2001) Material properties for modeling traumatic aortic rupture. Stapp Car Crash Journal 45: 143-160.
Burkhart, H. M., Gomez, G. A., Jacobson, L. E., Pless, J. E., and Broadie, T. A. (2001) Fatal blunt aortic injuries: a review of 242 autopsy cases. J. Trauma 50(1): 113-5.
Cavanaugh, J. M., Koh, S.-W., Kaledhonkar, S. L., and Hardy, W. N. (2005) An analysis of traumatic rupture of the aorta in side impact sled tests. SAE No.2005-01-0304.
Crass, J. R., Cohen, A. M., Motta, A. O., Tomashefski, J. F., and Wiesen, E. J. (1990) A proposed new mechanism of traumatic aortic rupture: the osseous pinch. Radiology 176: 645-649.
Forman, J., Kent, R., Bolton, J., and Evans, J. (2005) A method for the experimental investigation of acceleration as a mechanism of aortic injury. SAE transactions 114: 98-110.
Fry, D. L. (1968) Acute vascular endothelial changes associated with increased blood velocity gradients. Circ. Res. 22(2): 165-197.
Fung, Y. C. (1993) Biomechanics : mechanical properties of living tissues. Springer-Verlag, New York.
Gray, H., and Goss, C. M. (1973) Anatomy of the human body. Lea & Febiger, Philadelphia.
Hallquist, J. O. (2006) LS-DYNA theory manual. Livermore Software Technology Corporation.
Hardy, W. N., Shah, C. S., Kopacz, J. M., Yang, K. H., Van Ee, C. A., Morgan, R., and Digges, K. (2006) Study of potential mechanisms of traumatic

18 Lee and Kent / Stapp Car Crash Journal 51 (October 2007)
rupture of the aorta using insitu experiments. Stapp Car Crash Journal 50: 247-266.
Holzapfel, G. A. (2000) Nonlinear solid mechanics : a continuum approach for engineering. Wiley, Chichester; New York.
Holzapfel, G. A., and Gasser, T. C. (2000) A new constitutive framework for arterial wall mechanics and a comparative study of material models. J. Elasticity 61: 1-48.
Holzapfel, G. A., Gasser, T. C., and Stadler, M. (2002) A structural model for the viscoelastic behavior of arterial walls: Continuum formulation and finite element analysis. Eur. J. Mech. A/Solids 21: 441-463.
Holzapfel, G. A. (2006) Determination of material models for arterial walls from uniaxial extension tests and histological structure. J. Theor. Biol. 238(2): 290-302.
Holzapfel, G. A., Sommer, G., Auer, M., Regitnig, P., and Ogden, R. W. (2007) Layer-Specific 3D Residual Deformations of Human Aortas with Non-Atherosclerotic Intimal Thickening. Ann. Biomed. Eng.
Jackson, D. H. (1984) Of TRAs and ROCs. Chest 85(5): 585-587.
Kent, R. W., Crandall, J. R., Bolton, J., Prasad, P., Nusholtz, G., and Mertz, H. (2001) The influence of superficial soft tissues and restraint condition on thoracic skeletal injury prediction. Stapp Car Crash Journal 45: 183-204.
King, A. I., and Yang, K. H. (1995) Research in biomechanics of occupant protection. J. Trauma 38(4): 570-576.
Kivity, Y., and Collins, R. (1974) Nonlinear wave propagation in viscoelastic tubes: Application to aortic rupture. J. Biomech. 7(1): 67-76.
Kroell, C. K., and Schneider, D. C. (1971) Impact tolerance and response of the human thorax. Stapp Car Crash Journal 15: 84-134.
Ku, D. (1997) Blood flow in arteries. Annu. Rev. Fluid Mech. 29: 399-434.
Learoyd, B. M., and Taylor, M. G. (1966) Alterations with age in the viscoelastic properties of human arterial walls. Circ. Res. 18(3): 278-92.
Love, A. E. H. (1927) A treatise on the mathematical theory of elasticity. Cambridge University Press.
Lundewall, J. (1964) The mechanics of traumatic rupture of the aorta. Acta. Pathol. Microbiol. Scand. 62: 34-36.
Mattox, K. L. (1989) Fact and fiction about management of aortic transection. Ann. Thorac. Surg. 48(1): 1-2.
Melvin, J. W., Baron, K. J., Little, W. C., Gideon, T. W., and Pierce, J. (1998) Biomechanical analysis of Indy race car crashes. Stapp Car Crash Journal 42: P-337.
Mills, C. J., Gabe, I. T., Gault, J. H., Mason, D. T., Ross, J., Jr., Braunwald, E., and Shillingford, J. P. (1970) Pressure-flow relationships and vascular impedance in man. Cardiovasc. Res. 4(4): 405-417.
Mohan, D., and Melvin, J. W. (1982) Failure properties of passive human aortic tissue. I - uniaxial tension tests. J. Biomech. 15(11): 887-902.
Mohan, D., and Melvin, J. W. (1983) Failure properties of passive human aortic tissue. II - Biaxial tension tests. J. Biomech. 16(1): 31-44.
Nichols, W., and O'Rourke, M. (2005) McDonald's blood flow in arteries. Hodder Arnold, London.
Nikolic, S., Atanasijevic, T., Mihailovic, Z., Babic, D., and Popovic-Loncar, T. (2006) Mechanisms of aortic blunt rupture in fatally injured front-seat passengers in frontal car collisions: an autopsy study. Am. J. Forensic Med. Pathol. 27(4): 292-295.
Ogden, R. W. (1997) Non-linear elastic deformation. Dover, New York.
Okamoto, R. J., Wagenseil, J. E., DeLong, W. R., Peterson, S. J., Kouchoukos, N. T., and Sundt, T. M., 3rd. (2002) Mechanical properties of dilated human ascending aorta. Ann. Biomed. Eng. 30(5): 624-35.
Richens, D., Field, M., K., Neale, M., and Oakley, C. (2002) The mechanism of injury in blunt traumatic rupture of the aorta. Eur. J. Cardiothorac. Surg. 21: 288-293.
Richens, D., Field, M., Hashim, S., Neale, M., and Oakley, C. (2004) A finite element model of blunt traumatic aortic rupture. Eur. J. Cardiothorac. Surg. 25(6): 1039-1047.
Lee and Kent / Stapp Car Crash Journal 51 (October 2007) 19
Schulman, C. I., Carvajal, D., Lopez, P. P., Soffer, D., Habib, F., and Augenstein, J. (2007) Incidence and crash mechanisms of aortic injury during the past decade. J. Trauma 62(3): 664-667.
Sevitt, S. (1977) Traumatic ruptures of the aorta: a clinico-pathological study. Injury 8(3): 159-173.
Shah, C. S., Yang, K. H., Hardy, W., Wang, H. K., and King, A. (2001) Development of a computer model to predict aortic rupture due to impact loading. Stapp Car Crash Journal 45: No.2001-22-0007.
Shah, C. S., Hardy, W., Mason, M., Yang, K. H., Van Ee, C. A., Morgan, R., and Digges, K. (2006) Dynamic biaxial tissue properties of the human cadaver aorta. Stapp Car Crash Journal 50: 217-246.
Siegel, J. H., Smith, J. A., and Siddiqi, S. Q. (2004) Change in velocity and energy dissipation on impact in motor vehicle crashes as a function of the direction of crash: key factors in the production of thoracic aortic injuries, their pattern of associated injuries and patient survival. A Crash Injury Research Engineering Network (CIREN) study. J. Trauma 57(4): 760-777.
Smith, R. S., and Chang, F. C. (1986) Traumatic rupture of the aorta: still a lethal injury. Am. J. Surg. 152(6): 660-663.
Spencer, A. J. M. (1984) Continuum theory of the mechanics of fibre-reinforced composites. Springer-Verlag, Wien; New York.
Sturm, J. T., McGee, M. B., and Luxenberg, M. G. (1988) An analysis of risk factors for death at the scene following traumatic aortic rupture. J. Trauma 28(11): 1578-1580.
Symbas, P. N., Tyras, D. H., Ware, R. E., and Diorio, D. A. (1973) Traumatic rupture of the aorta. Ann. Surg. 178(1): 6-12.
Tam, A. S., Sapp, M. C., and Roach, M. R. (1998) The effect of tear depth on the propagation of aortic dissections in isolated porcine thoracic aorta. J. Biomech. 31(7): 673-676.
Vaishnav, R. N., and Vossoughi, J. (1987) Residual stress and strain in aortic segments. J. Biomech. 20(3): 235-9.
Vito, R. P., and Dixon, S. A. (2003) Blood vessel constitutive models 1995-2002. Annu. Rev. Biomed. Eng. 5: 413-439.
Voigt, G. E., and Wilfert, K. (1969) Mechanisms of injuries to unrestrained drivers in head-on collisions. Stapp Car Crash Journal 13: 295-313.
Wang, H. C. (1995) Development of a side impact finite element human thoracic model. PhD Dissertation, Wayne State University, Detroit.
Womersley, J. R. (1955) Method for the calculation of velocity, rate of flow and viscous drag in arteries when their pressure gradient is known. J. Physiol. 127: 553-563.
Womersley, J. R. (1957) Oscillatory flow in arteries: the constrained elastic tube as a model of arterial flow and pulse transmission. Physics in Medicine and Biology 2: 178-187.
Yoganandan, N., Skrade, D., Pintar, F., Reinartz, J., and Sances, A. (1991) Thoracic deformation contours in a frontal impact. Stapp Car Crash Journal 35: 47-63.
Zhou, J. (1992) Theoretical analysis of bending experiments on aorta and determination of constitutive equations of materials in different layers of arterial walls. PhD Dissertation, University of California, San Diego.
Zienkiewicz, O. C., and Taylor, R. L. (2000) The finite element method. Butterworth-Heinemann, Oxford; Boston.
Zulliger, M. A., Fridez, P., Hayashi, K., and Stegiopulos, N. (2004) A strain energy function for arteries accounting for wall composition and structure. J. Biomech. 37: 989-1000.

20 Lee and Kent / Stapp Car Crash Journal 51 (October 2007)
APPENDIX
A. Numerical Modeling of Fluid-Structure Interaction
Mathematical modeling of the cardiovascular system. A unique mathematical description of FSI in the cardiovascular system is difficult to achieve due to physical complexity of the problem. The motion of blood is described by its associated velocity and pressure fields as determined by the conservation of momentum. The vector form of the momentum conservation equation, or Navier-Stokes equation, in the fluid domain FΩ is written by
( ) in Ftρ ρ ρ∂
+ ⋅∇ = ∇ ⋅ + Ω∂v v v σ f (A1)
where ρ denotes the density, v the velocity vector, σ the Cauchy stress tensor and f the body force per unit mass. In most physiological circumstances, blood behaves in the Newtonian manner and the constitutive relation becomes
( )Tp p μ= − + = − + ∇ + ∇σ I τ I v v (A2)
where p is the hydrostatic pressure, I the Kronecker tensor, τ the deviatoric stress tensor, and μ the dynamic viscosity.
The equations describing a deformable structure are represented by Cauchy’s theorem and the equilibrium equation.
on S= ⋅ ΓT σ n (A3)
in Sρ ρ∇ ⋅ + = Ωσ f a (A4)
where T is the surface traction vector, σ the Cauchy stress tensor, n the outward normal vector on the surface SΓ , and a the acceleration vector. Several functional forms of constitutive models for cardiovascular tissues have been proposed in order to describe their typically nonlinear, anisotropic mechanical behavior (Vito and Dixon 2003). Strain energy as a function of the deformation gradient tensor, F or the right Cauchy-Green tensor, C is a common way to define a finite elastic constitutive relation:
0 ( ) ( )W e W Wρ= = =F C (A5)
where 0ρ denotes the density in the original state and e the strain energy per unit mass. The second Piola-Kirchhoff stress, S and the Cauchy stress, σ are related to the Green strain, E and the
determinant of the deformation gradient tensor, J as follows.
( )T12
= ⋅ −E F F I (A6)
2W W∂ ∂= =
∂ ∂S
E C (A7)
1 T 1 T2W WJ J− −∂ ∂= ⋅ ⋅ = ⋅ ⋅
∂ ∂σ F F F F
E C (A8)
Fluid-structure coupling boundary conditions. A coupled fluid-structure model constitutes a domain Ω with boundary conditions given by the velocity and stress vectors (Figure A1). At each time, the stress tensor, Fσ in the fluid domain is provided to the structure as a boundary load and the displacement vector, Su from the structural domain is provided as the fluid constraint.
Figure A1. Schematic of fluid domain FΩ and structure domain SΩ with load-vector transfer
through boundaries ( ,F SΓ Γ )
The set of coupled equations becomes complete with the appropriate boundary conditions
( )( )
andon
andn n
Ft t
v Tv T
⎧ ⋅ = ⋅ ⋅ =⎪ Γ⎨ ⋅ = ⋅ ⋅ =⎪⎩
v n σ n nv t σ n t
(A9)
( )( )
andon
andn n
St t
x Tx T
⎧ ⋅ = ⋅ ⋅ =⎪ Γ⎨ ⋅ = ⋅ ⋅ =⎪⎩
x n σ n nx t σ n t
(A10)
where v is the velocity vector in the fluid domain, n is the unit normal and t the unit tangential vector on the boundary surface, T is the surface traction vector, and x is the position vector in the structural domain.
Numerical implementation of FSI. A finite element-based commercial package, ANSYS (ANSYS, Inc., Release 11.0) was employed to solve the set of coupled governing equations. In this package, the physics of each domain is solved separately using the FLOTRAN fluid solver for the fluid domain and the Structure solver for the structural domain. The
FΓ
Fσ
Fu
Sσ
Su
SΓ
F SΩ = Ω + Ω
Fluid domain
SΩFΩ
Structuredomain

Lee and Kent / Stapp Car Crash Journal 51 (October 2007) 21
coupling procedure is provided by the Multi-field solver, which performs automated iterations across the two different fields. Mesh-based parameters are transferred by the load-vector coupling approach at the fluid-structure interface. The force vector passed from the fluid domain becomes a part of the structure boundary loads and the structure returns the displacement vector as a fluid boundary condition. This stagger loop is repeated at a given time-step until predefined convergence criteria are satisfied. The solution procedure continues to loop through the analysis until the global time condition is attained.
The fluid domain described by the Eulerian-based Navier-Stokes equation must be reconsidered at each iteration within the staggered time loop since structural deformation causes a boundary change in the fluid. The Arbitrary Lagrangian-Eulerian technique is a widely used and robust mesh morphing algorithm (ANSYS 2007) in which the governing equation (A1) in the fluid domain is modified to allow mesh motion by introducing an arbitrary velocity w in Equation (A11). This vector follows the motion of the boundary domain Γ and is typically chosen to minimize the mesh distortion.
( ) in Ftρ ρ ρ∂
+ − ⋅∇ = ∇ ⋅ + Ω⎡ ⎤⎣ ⎦∂v v w v σ f (A11)
B. FSI Solver Verification using Characteristic Blood Flows
Hagen-Poiseuille flow in an elastic vessel. The Hagen-Poiseuille flow solution represents fully developed laminar flow through a cylindrical rigid tube of radius R. The solution of the Navier-Stokes equation (A1) presents a parabolic velocity profile in terms of the pressure gradient.
( ) ( )2 214
dpu r R rdxμ
= − − (B1)
where u is the axial velocity, μ the dynamic viscosity and p the pressure. For an elastic vessel interacting with this laminar steady flow, the pressure-flow relationship yields radial displacements of the vessel and its analytical solution can be obtained by Love's pressure tube solution (Love 1927). In addition, the circumferential stress can be found analytically from hoop stress theory. The solutions provided will have higher accuracy under the thin-walled tube assumption, i.e. R >> t.
( )2 2(1 )p RdR xE t
ν−= (B2)
( )hp Rxt
σ = (B3)
where dR denotes the radial displacement, ν the poisson’s ratio, E the elastic modulus, t the vessel thickness, and hσ the circumferential stress.
Figure B1. FE model of Hagen-Poiseuille flow
Figure B2. Normalized numerical results of
Hagen-Poiseuille flow compared to analytical solutions
A quarter FE model was designed for the Hagen-Poiseuille flow simulation (Figure B1). Constant pressures are defined at the inlet and outlet, and symmetric boundary conditions specified for the open fluid surfaces. The Reynolds number in this example was set to 500.
0.0 0.2 0.4 0.6 0.8 1.0
0.0
0.5
1.0
1.5
2.0
u/u av
g
r/R
Analytic Rigid vessel Elastic vessel
0.0 0.2 0.4 0.6 0.8 1.0
0.94
0.96
0.98
1.00
1.02
1.04
1.06
p/p av
g, dR/
dRav
g and
σh/σ
h,av
g
x/L
Analytic Pressure Displacement Stress
Elastic vessel (SHELL181)
Newtonian fluid (FLUID142)
Fluid-structure interface

22 Lee and Kent / Stapp Car Crash Journal 51 (October 2007)
The non-dimensional velocity profiles in the elastic and rigid vessels are found to be in good agreement with the analytical solutions (Figure B2). As the structural solutions (pressure, displacement, and stress) are all linear functions of pressure along the x-direction, they are expected to be identical lines when normalized by their average values along the length. The calculated results clearly show that these normalized parameters are well represented by a linear curve, with less than 1% error for any parameter.
Womersley flow in an elastic vessel. Oscillatory flow in a straight, cylindrical, rigid tube is generally referred to as Womersley flow (Womersley 1955). This unsteady flow is considered to be a fully developed periodic with pressure gradient changing with time. The governing equation is written from the Navier-Stokes equation (A1) using a complex form of the pressure gradient.
2 *
2
1 1 i tu u u p A er r t xr
ωρμ μ μ
∂ ∂ ∂ ∂+ − = = −
∂ ∂ ∂∂ (B4)
where u denotes the axial velocity, ρ the density, μ the dynamic viscosity, p the pressure, *A the complex conjugate of pressure amplitude and ω the flow frequency. The velocity profile can be found in terms of the Womersley number,
( )1/ 2/Rα ωρ μ= , a characteristic of the flow, and is given by
( )( )( )
3/ 2*0
3/ 20
1 i tJ yiAu y e
i J iω
α
ωρ α
⎧ ⎫⎪ ⎪= −⎨ ⎬⎪ ⎪⎩ ⎭
(B5)
where 0J is the Bessel function of the first kind of order zero and y is the fractional radius, /y r R= .
For an elastic vessel, Womersley showed that the same form of the solution from the rigid vessel can be used for a longitudinally constrained vessel (Womersley 1957). It is recommended that the vessel have a high natural frequency compared with the pulse frequency. The radial displacement and the circumferential stress in the previous section can also be applied here to obtain the structural deformation.
For the simulation, the half length of the radius was taken as the axial vessel dimension to allow for the assumption of a constant longitudinal pressure gradient. Sinusoidal pressures with an appropriate phase lag were prescribed at the inlet and outlet, and five cycles were imposed in order to attain fully
developed flow. The pressure amplitude was chosen to remain in the domain of laminar flow and, therefore, the Reynolds numbers for the simulation was below 1000. The velocity profile calculated numerically describes the characteristic behavior of Womersley flow remarkably well (Figure B3). The radial displacement is in good agreement with Love’s analytical solution, with an error of 0.32%. The circumferential stress is overestimated slightly by 2.2% mean error.
Figure B3. Normalized numerical results of
Womersley flow compared to analytical solutions
C. Effect of Residual Stress on Aortic Wall Behavior under Traumatic Rupture Conditions
The existence of residual stresses in the aorta is generally explained by the opening angle when an aortic strip is cut in the radial direction. The stress state in the in vivo aorta is compressive on the inner part and tensile on the outer part (Holzapfel et al. 2007).
A simple aorta strip model was utilized to examine the importance of residual stresses under traumatic loading conditions. The residual stress was determined at 15 kPa from the literature (Vaishnav and Vossoughi 1987, Zhou 1992). A series of simulations was performed with two different levels of internal pressures representing the physiological
0 60 120 180 240 300 360
-1.0
-0.5
0.0
0.5
1.0
dR/d
R max
and
σh/σ
h,m
ax
Phase (deg)
Analytic Displacement Stress
0.0 0.2 0.4 0.6 0.8 1.0
-1.0
-0.5
0.0
0.5
1.0
Analytic Rigid vessel Elastic vessel
u/u m
ax
r/R
α =1.25
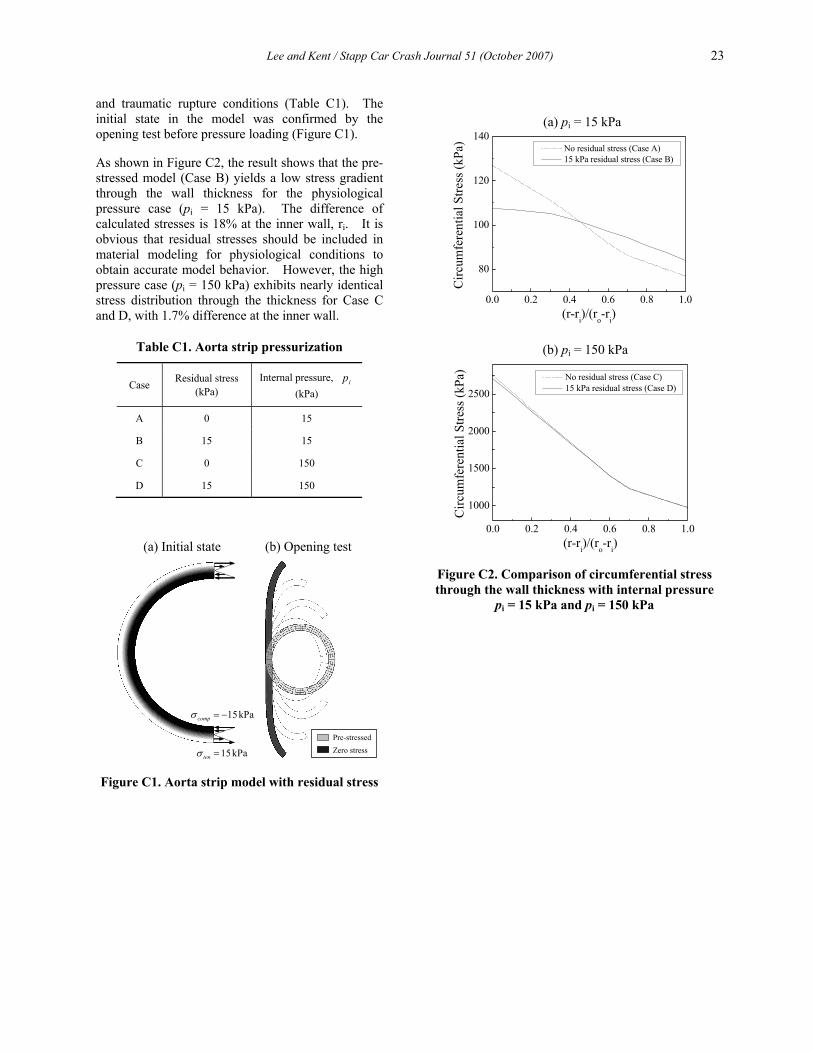
Lee and Kent / Stapp Car Crash Journal 51 (October 2007) 23
and traumatic rupture conditions (Table C1). The initial state in the model was confirmed by the opening test before pressure loading (Figure C1).
As shown in Figure C2, the result shows that the pre-stressed model (Case B) yields a low stress gradient through the wall thickness for the physiological pressure case (pi = 15 kPa). The difference of calculated stresses is 18% at the inner wall, ri. It is obvious that residual stresses should be included in material modeling for physiological conditions to obtain accurate model behavior. However, the high pressure case (pi = 150 kPa) exhibits nearly identical stress distribution through the thickness for Case C and D, with 1.7% difference at the inner wall.
Table C1. Aorta strip pressurization
Case Residual stress (kPa)
Internal pressure, ip (kPa)
A 0 15
B 15 15
C 0 150
D 15 150
Figure C1. Aorta strip model with residual stress
Figure C2. Comparison of circumferential stress through the wall thickness with internal pressure
pi = 15 kPa and pi = 150 kPa
15kPacompσ = −
15kPatenσ =
(a) Initial state (b) Opening test
Pre-stressedZero stress
0.0 0.2 0.4 0.6 0.8 1.0
80
100
120
140
Circ
umfe
rent
ial S
tress
(kPa
)
(r-ri)/(ro-ri)
No residual stress (Case A) 15 kPa residual stress (Case B)
0.0 0.2 0.4 0.6 0.8 1.0
1000
1500
2000
2500
Circ
umfe
rent
ial S
tress
(kPa
)
(r-ri)/(ro-ri)
No residual stress (Case C) 15 kPa residual stress (Case D)
(a) pi = 15 kPa
(b) pi = 150 kPa
Related Documents