PREF PREF PREF PREF PREFACE CE CE CE CE The present issue of the District Statistical Handbook seeks to provide statistical information on various socio-economic aspects of the district on a compact form. Attempts have been made to incorporate latest available information in this publication maintaining continuity of the time series of the data published in earlier issues. Data at the Block level have also been incorporated as far as available. I express my gratitude to the different offices situated in the district for their co-operation in obtaining data related to their activities. I like to put in my appreciation to the officials of the Handbook, Co-ordination & Nucleus (Compilation) units of the Head Office, District office and Electronic Data Processing Unit of the Bureau of Applied Economics & Statistics for their sincere and sustained work in bringing out the publication. Suggestions for any improvement of the publication will be appreciated. S.K.MUKHERJEE Director Dated, Kolkata, Bureau of Applied Economics & Statistics The 11 th November,2005 Government of West Bengal (i) (ii) SL. Table DESCRIPTION PAGE No. No. No. III. PUBLIC HEALTH 19 3.1 Medical facilities. 41 20 3.2 Family welfare centres. 43 21 3.2(a) Achievement of Universal Immunization Programme. 47 22 3.3 Patient treated in hospitals , dispensaries etc. 49 IV. EDUCATION AND CULTURE 23 4.1,(a) General Educational Institutions (by type) 51 24 4.1,(b) Professional & Technical Educational Institutions 55 (by type) 25 4.1,(c) Special & Non-formal Educational Institutions 59 (by type) 26 4.2,(a) Students by sex in different types of 61 General Educational Institutions 27 4.2,(b) Students by sex in different types of 65 Professional & Technical Educational Institutions 28 4.2,(c) Students by sex in different types of 69 Special & Non-formal Educational Institutions 29 4.3,(a) Teachers in different types of General 71 Educational Institutions. 30 4.3,(b) Teachers in different types of Professional 75 & Technical Educational Institutions 31 4.3,(c) Teachers in different types of Special 79 & Non-formal Educational Institutions 32 4.4 Number of Institutions, Students & Teachers by 81 Block & Municipality. CONTENTS SL. Table DESCRIPTION PAGE No. No. No. I. RAINFALL AND CLIMATE 1 1.1 Geographical Location. 1 2 1.2 Monthly Rainfall. 2 3 1.3 Maximum and Minimum temperature by month. 3 4 1.4 Mean maximum and Mean minimum temperature 4 by month. II. AREA AND POPULATION 5 2.1 Administrative units. 5 6 2.1(a) Assembly and Parliamentary Constituency 13 7 2.2 Area, Population and density. 14 8 2.3 Growth of population by sex. 16 9 2.4(a) Distribution of rural & urban population by sex,1991. 17 10 2.4(b) Distribution of rural & urban population by sex,2001. 21 11 2.5 Distribution of population by sex & by age group. 25 12 2.6 Distribution of population by sex in the towns. 27 13 2.7 Percentage of population according to different 28 categories of workers and non-workers. 14 2.8 Distribution of population according to different 34 categories of workers and non-workers by sex. 15 2.9 Scheduled Castes and Scheduled Tribes 36 population by sex. 16 2.10 Population by religion. 38 17 2.10(a) Population by religion & by sex. 39 18 2.11 Disabled persons by disability & by sex. 40

Welcome message from author
This document is posted to help you gain knowledge. Please leave a comment to let me know what you think about it! Share it to your friends and learn new things together.
Transcript
�����������������������������������
The present issue of the District Statistical Handbook seeks toprovide statistical information on various socio-economic aspects of thedistrict on a compact form. Attempts have been made to incorporatelatest available information in this publication maintaining continuity ofthe time series of the data published in earlier issues. Data at the Blocklevel have also been incorporated as far as available.
I express my gratitude to the different offices situated in thedistrict for their co-operation in obtaining data related to theiractivities. I like to put in my appreciation to the officials of the Handbook,Co-ordination & Nucleus (Compilation) units of the Head Office, Districtoffice and Electronic Data Processing Unit of the Bureau of AppliedEconomics & Statistics for their sincere and sustained work in bringingout the publication.
Suggestions for any improvement of the publication will beappreciated.
S.K.MUKHERJEE DirectorDated, Kolkata, Bureau of Applied Economics & StatisticsThe 11th November,2005 Government of West Bengal
(i) (ii)
SL. Table DESCRIPTION PAGENo. No. No.
III. PUBLIC HEALTH19 3.1 Medical facilities. 4120 3.2 Family welfare centres. 4321 3.2(a) Achievement of Universal Immunization Programme. 4722 3.3 Patient treated in hospitals , dispensaries etc. 49
IV. EDUCATION AND CULTURE23 4.1,(a) General Educational Institutions (by type) 5124 4.1,(b) Professional & Technical Educational Institutions 55
(by type)25 4.1,(c) Special & Non-formal Educational Institutions 59
(by type)26 4.2,(a) Students by sex in different types of 61
General Educational Institutions27 4.2,(b) Students by sex in different types of 65
Professional & Technical Educational Institutions28 4.2,(c) Students by sex in different types of 69
Special & Non-formal Educational Institutions29 4.3,(a) Teachers in different types of General 71
Educational Institutions.30 4.3,(b) Teachers in different types of Professional 75
& Technical Educational Institutions31 4.3,(c) Teachers in different types of Special 79
& Non-formal Educational Institutions32 4.4 Number of Institutions, Students & Teachers by 81
Block & Municipality.
CONTENTS
SL. Table DESCRIPTION PAGENo. No. No.
I. RAINFALL AND CLIMATE1 1.1 Geographical Location. 12 1.2 Monthly Rainfall. 23 1.3 Maximum and Minimum temperature by month. 34 1.4 Mean maximum and Mean minimum temperature 4
by month.II. AREA AND POPULATION
5 2.1 Administrative units. 56 2.1(a) Assembly and Parliamentary Constituency 137 2.2 Area, Population and density. 148 2.3 Growth of population by sex. 169 2.4(a) Distribution of rural & urban population by sex,1991. 17
10 2.4(b) Distribution of rural & urban population by sex,2001. 2111 2.5 Distribution of population by sex & by age group. 2512 2.6 Distribution of population by sex in the towns. 2713 2.7 Percentage of population according to different 28
categories of workers and non-workers.14 2.8 Distribution of population according to different 34
categories of workers and non-workers by sex.15 2.9 Scheduled Castes and Scheduled Tribes 36
population by sex.16 2.10 Population by religion. 3817 2.10(a) Population by religion & by sex. 3918 2.11 Disabled persons by disability & by sex. 40
(iii) (iv)
SL. Table DESCRIPTION PAGENo. No. No.
33 4.5 Percentage of literacy in rural and urban areas. 8534 4.6 Libraries, Reading Rooms and Mass Literacy 87
centres.35 4.7 Cinema Houses. 8936 4.8 Newspapers and Periodicals published. 91
V. AGRICULTURE & ALLIED37 5.1 Classification of land utilization statistics. 9238 5.1(a) Distribution of operational holdings. 9339 5.1(b) Area of vested agricultural land. 9440 5.2 Area under principal crops. 9541 5.3 Production of principal crops. 9742 5.3(a) Yield rate of principal crops. 9943 5.3(b) Yield rate of some selected crops. 10144 5.3(c) Index number of agricultural area, production 102
and productivity (base 81-82 = 100).45 5.3(d) Area and Production of Fruits and Vegetables. 10346 5.3(e) Area & production of Flowers. 10547 5.3(f) Area, production & employment in Tea Industries. 10648 5.4 Classification of forest area & forest produce. 10749 5.5 Area irrigated by different sources. 10950 5.5(a) Sources of minor irrigation. 11151 5.6 Fertilizer consumed. 11252 5.7 Warehousing and cold storage facilities. 11253 5.8 Estimated production of Milk and Egg. 113
SL. Table DESCRIPTION PAGENo. No. No.
VI. LIVE-STOCK54 6.1 Live-Stock and Poultry. 11455 6.2 Veterinary hospitals, dispensaries etc. 115
VII. CO-OPERATIVE, BANKING & INSURANCE56 7.1 Progress of Co-operative movements. 11757 7.2 Progress of Commercial Banking. 11958 7.3 Progress of LIC. 121
VIII. INDUSTRY59 8.1 Small Industrial establishments. 12260 8.2 Mouzas electrified. 12361 8.2(a) Consumption of Electricity. 12462 8.3 Selected Characteristics of factories by industry groups. 12563 8.4 Production in Sericulture 128
IX. EMPLOYMENT AND LABOUR64 9.1 Employment in registered factories 12965 9.2 Number of enterprises in rural and urban areas. 13066 9.2(a) Number of persons usually working in rural and 131
urban enterprises.67 9.2(b) Percentage distribution of hired workers & females 132
employed.X. EMPLOYMENT EXCHANGE
68 10.1 Applicants on the live-register of employment 133exchanges.
69 10.2 Registration and placement effected. 13470 10.3 Unemployment assistance recipients. 134
(v) (vi)
SL. Table DESCRIPTION PAGENo. No. No.
XI. PRICE71 11.1 Wholesale price of agriculture and Live-stock & 135
Live-stock products.72 11.1(a) Regulated market by category. 13773 11.2 Consumer price index number for families with 138
monthly expenditure level.74 11.3 Consumer price index number for industrial workers. 13975 11.4 Statutory and modified ration shops. 140
XII. TRANSPORT AND COMMUNICATION76 12.1 Roads maintained by P.W.D., Zilla Parishad. 141
& Panchayat77 12.2 Length of different classes of roads maintained by 142
P.W.D.78 12.3 Roads maintained by Municipalities. 14379 12.4 Statement of registered Motor Vehicles. 14480 12.5 Accident on roads. 14581 12.6 Post and Telegraph Offices. 14682 12.7 Progress in Tourism 148
XIII. JUDICIAL AND POLICE83 13.1 Offences reported, cases tried, persons convicted 149
and acquitted.84 13.2 Police Stations and Out-posts. 15385 13.3 Strength of police force. 154
SL. Table DESCRIPTION PAGENo. No. No.
XIV. LOCAL-BODIES86 14.1 Receipt and Expenditure of Municipalities 15587 14.2 Receipt and Expenditure of Zilla Parishad. 156
XV. FINANCE88 15.1 Revenue Collected from different sources. 15789 15.2 Net collection from small savings 158
BLOCK LEVEL STATISTICS90 16.1 Some basic Statistics about the Blocks. 15991 17.1 Population by religion in the Blocks. 16192 17.2 Population features of farmers in the Blocks. 16993 18.1 Use and distribution of land in the Blocks. 17094 18.2 Area,Production and Yield rate of Major crops in the 173
Blocks.95 18.3 Source of Irrigation and area Irrigated by different 180
Sources in the Blocks.96 18.4 Fisheries in the Blocks. 18397 19.1 Estimated number of Live-stock and Poultry in the 185
Blocks.98 20.1 Commercial and Gramin Banks in the Blocks. 18699 20.2 Co-operative Societies in the Blocks. 187
100 21.1 Roads in the Blocks. 188101 21.2 Transport in the Blocks 191
JALPAIGURI������� �� �������� �� �������� �� �������� �� �������� �� ������
Description Year Unit Particulars(1) (2) (3) (4)
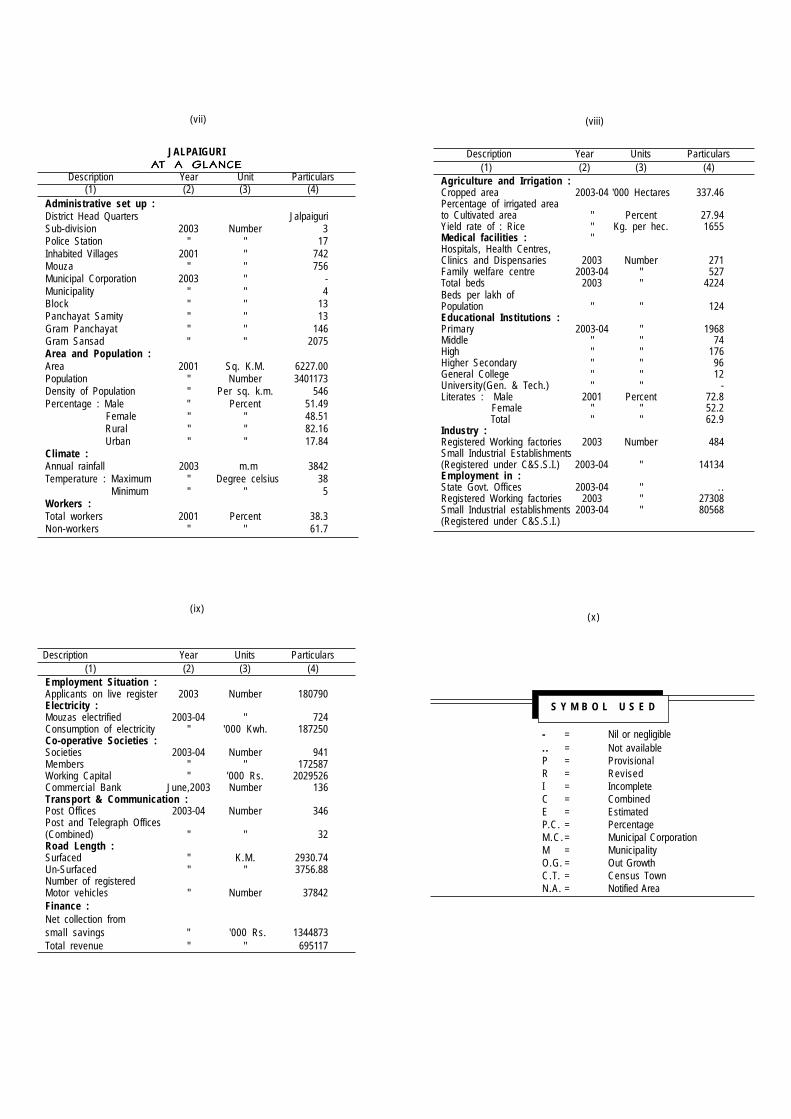
Administrative set up :District Head Quarters JalpaiguriSub-division 2003 Number 3Police Station " " 17Inhabited Villages 2001 " 742Mouza " " 756Municipal Corporation 2003 " -Municipality " " 4Block " " 13Panchayat Samity " " 13Gram Panchayat " " 146Gram Sansad " " 2075Area and Population :Area 2001 Sq. K.M. 6227.00Population " Number 3401173Density of Population " Per sq. k.m. 546Percentage : Male " Percent 51.49 Female " " 48.51 Rural " " 82.16 Urban " " 17.84Climate :Annual rainfall 2003 m.m 3842Temperature : Maximum " Degree celsius 38 Minimum " " 5Workers :Total workers 2001 Percent 38.3Non-workers " " 61.7
(vii) (viii)
Description Year Units Particulars(1) (2) (3) (4)
Employment Situation :Applicants on live register 2003 Number 180790Electricity :Mouzas electrified 2003-04 " 724Consumption of electricity " '000 Kwh. 187250Co-operative Societies :Societies 2003-04 Number 941Members " " 172587Working Capital " '000 Rs. 2029526Commercial Bank June,2003 Number 136Transport & Communication :Post Offices 2003-04 Number 346Post and Telegraph Offices(Combined) " " 32Road Length :Surfaced " K.M. 2930.74Un-Surfaced " " 3756.88Number of registeredMotor vehicles " Number 37842Finance :Net collection fromsmall savings " '000 Rs. 1344873Total revenue " " 695117
(ix)
Description Year Units Particulars(1) (2) (3) (4)
Agriculture and Irrigation :Cropped area 2003-04 '000 Hectares 337.46Percentage of irrigated areato Cultivated area " Percent 27.94Yield rate of : Rice " Kg. per hec. 1655Medical facilities : "Hospitals, Health Centres,Clinics and Dispensaries 2003 Number 271Family welfare centre 2003-04 " 527Total beds 2003 " 4224Beds per lakh ofPopulation " " 124Educational Institutions :Primary 2003-04 " 1968Middle " " 74High " " 176Higher Secondary " " 96General College " " 12University(Gen. & Tech.) " " -Literates : Male 2001 Percent 72.8 Female " " 52.2 Total " " 62.9Industry :Registered Working factories 2003 Number 484Small Industrial Establishments(Registered under C&S.S.I.) 2003-04 " 14134Employment in :State Govt. Offices 2003-04 " . .Registered Working factories 2003 " 27308Small Industrial establishments 2003-04 " 80568(Registered under C&S.S.I.)
S Y M B O L U S E D
- = Nil or negligible. . = Not availableP = ProvisionalR = RevisedI = IncompleteC = CombinedE = EstimatedP.C. = PercentageM.C. = Municipal CorporationM = MunicipalityO.G. = Out GrowthC.T. = Census TownN.A. = Notified Area
(x)
DISTRICT STATISTICALHANDBOOK
2004
Bureau of Applied Economics & StatisticsGovt. of West Bengal
����������
1 2
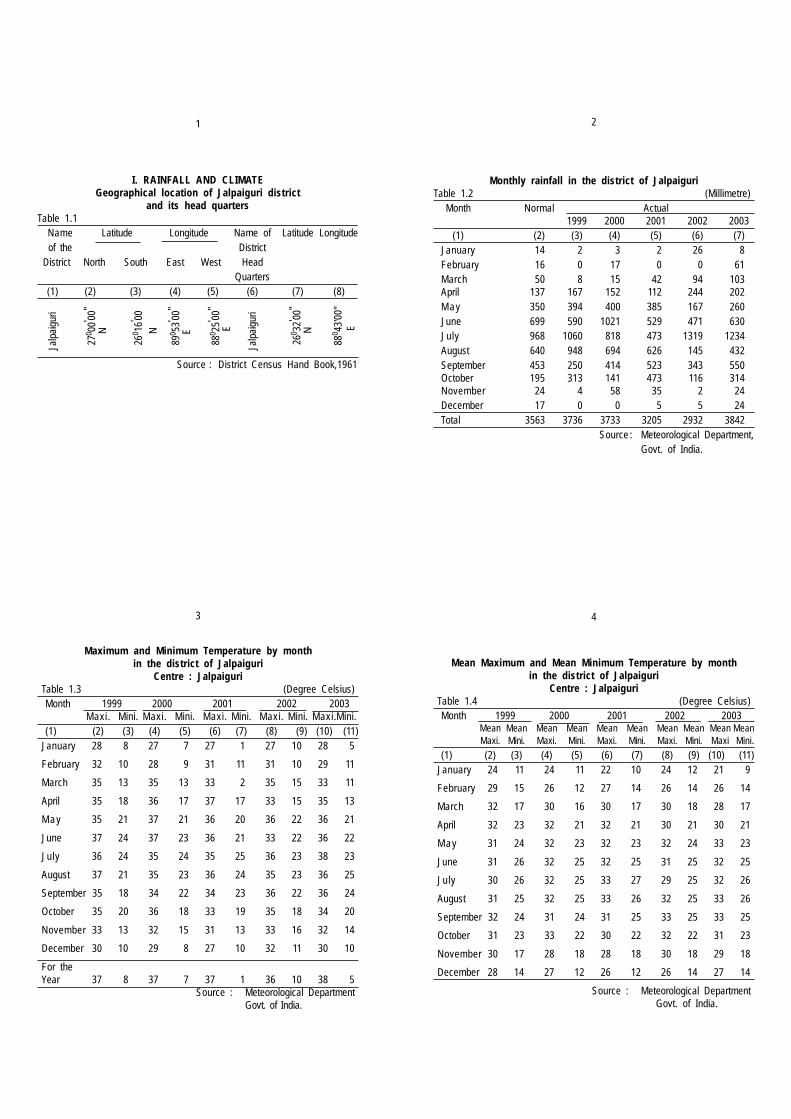
I. RAINFALL AND CLIMATEGeographical location of Jalpaiguri district
and its head quartersTable 1.1
Name Latitude Longitude Name of Latitude Longitudeof the District
District North South East West HeadQuarters
(1) (2) (3) (4) (5) (6) (7) (8)
Source : District Census Hand Book,1961
Monthly rainfall in the district of JalpaiguriTable 1.2 (Millimetre)
Month Normal Actual1999 2000 2001 2002 2003
(1) (2) (3) (4) (5) (6) (7)January 14 2 3 2 26 8February 16 0 17 0 0 61March 50 8 15 42 94 103April 137 167 152 112 244 202M a y 350 394 400 385 167 260June 699 590 1021 529 471 630July 968 1060 818 473 1319 1234August 640 948 694 626 145 432September 453 250 414 523 343 550October 195 313 141 473 116 314November 24 4 58 35 2 24December 17 0 0 5 5 24Total 3563 3736 3733 3205 2932 3842
Source : Meteorological Department,Govt. of India.
27
0 00' 00
"
N
Jal
paig
uri
26
0 16' 00
N
89
0 53' 00
"
E
88
0 25' 00
"
E
Jal
paig
uri
26
0 32' 00
"
N
880 43
'00'
'E
3 4
Maximum and Minimum Temperature by monthin the district of Jalpaiguri
Centre : JalpaiguriTable 1.3 (Degree Celsius)Month 1999 2000 2001 2002 2003
Maxi. Mini. Maxi. Mini. Maxi. Mini. Maxi. Mini. Maxi.Mini.(1) (2) (3) (4) (5) (6) (7) (8) (9) (10) (11)
January 28 8 27 7 27 1 27 10 28 5
February 32 10 28 9 31 11 31 10 29 11
March 35 13 35 13 33 2 35 15 33 11
April 35 18 36 17 37 17 33 15 35 13
M a y 35 21 37 21 36 20 36 22 36 21
June 37 24 37 23 36 21 33 22 36 22
July 36 24 35 24 35 25 36 23 38 23
August 37 21 35 23 36 24 35 23 36 25
September 35 18 34 22 34 23 36 22 36 24
October 35 20 36 18 33 19 35 18 34 20
November 33 13 32 15 31 13 33 16 32 14
December 30 10 29 8 27 10 32 11 30 10
For theYear 37 8 37 7 37 1 36 10 38 5
Source : Meteorological DepartmentGovt. of India.
Mean Maximum and Mean Minimum Temperature by monthin the district of Jalpaiguri
Centre : JalpaiguriTable 1.4 (Degree Celsius)Month 1999 2000 2001 2002 2003
Mean Mean Mean Mean Mean Mean Mean Mean Mean MeanMaxi. Mini. Maxi. Mini. Maxi. Mini. Maxi. Mini. Maxi Mini.
(1) (2) (3) (4) (5) (6) (7) (8) (9) (10) (11)January 24 11 24 11 22 10 24 12 21 9
February 29 15 26 12 27 14 26 14 26 14
March 32 17 30 16 30 17 30 18 28 17
April 32 23 32 21 32 21 30 21 30 21
M a y 31 24 32 23 32 23 32 24 33 23
June 31 26 32 25 32 25 31 25 32 25
July 30 26 32 25 33 27 29 25 32 26
August 31 25 32 25 33 26 32 25 33 26
September 32 24 31 24 31 25 33 25 33 25
October 31 23 33 22 30 22 32 22 31 23
November 30 17 28 18 28 18 30 18 29 18
December 28 14 27 12 26 12 26 14 27 14
Source : Meteorological Department Govt. of India.
5 6
Tabl
e : 2
.1 (C
ontd
.)
(Num
ber)
Sub-
Polic
eC
.D.B
lock
./ M
Inha
bite
dH
ouse
-To
wn
Div
isio
nSt
atio
nVi
llage
sho
lds
Mun
icip
al C
orp.
(200
1)
(
2001
)
N
o.W
ard
(1)
(2)
(3)
(8)
(9)
(1
0)(1
1)Sa
dar
Sub-
Div
. 6
4/2
236
3187
20-
-R
ajga
nj/B
hakt
inag
arR
ajga
nj29
5707
0-
-Ja
lpai
guri
Jalp
aigu
ri29
5758
7-
-Ja
lpai
guri(
M)
-22
063
--
May
nagu
riM
ayna
guri
7958
804
--
Dhu
pgur
iD
hupg
uri
9983
120
--
Bana
rhat
Dhu
pgur
i(M)
--
--
Silig
uri(M
.C.P
art)
-40
076
--
Mal
Sub
-Div
.
33/
116
810
2229
--
Mal
Mal
105
5244
9-
-M
al(M
)-
5002
--
Met
iali
Met
iali
3021
987
--
Nag
raka
taN
agra
kata
3322
791
--
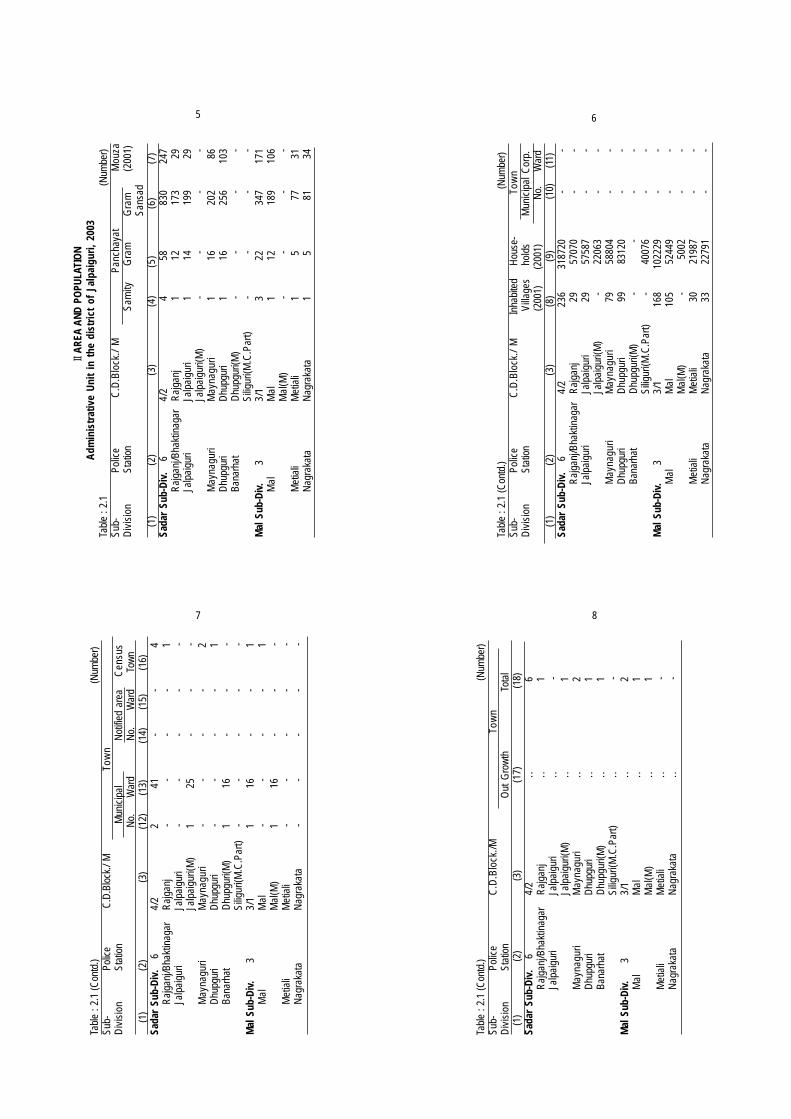
II
AREA
AND
PO
PULA
TIO
NA
dmin
istr
ativ
e U
nit
in t
he d
istr
ict
of J
alpa
igur
i, 20
03Ta
ble
: 2.1
(Num
ber)
Sub-
Polic
eC
.D.B
lock
./ M
Pan
chay
atM
ouza
Div
isio
nSt
atio
nS
amity
Gra
mG
ram
(200
1)Sa
nsad
(1)
(2)
(3)
(4)
(5)
(6)
(7)
Sada
r Su
b-D
iv.
64/
24
5883
024
7R
ajga
nj/B
hakt
inag
arR
ajga
nj1
1217
329
Jalp
aigu
riJa
lpai
guri
114
199
29Ja
lpai
guri(
M)
--
--
May
nagu
riM
ayna
guri
116
202
86D
hupg
uri
Dhu
pgur
i1
1625
610
3Ba
narh
atD
hupg
uri(M
)-
--
-Si
ligur
i(M.C
.Par
t)-
--
-M
al S
ub-D
iv.
3
3/1
322
347
171
Mal
Mal
112
189
106
Mal
(M)
--
--
Met
iali
Met
iali
15
7731
Nag
raka
taN
agra
kata
15
8134
7 8
Tabl
e : 2
.1 (C
ontd
.)
(N
umbe
r)Su
b-Po
lice
C
.D.B
lock
./ M
Tow
nD
ivis
ion
Stat
ion
Mun
icip
alN
otifi
ed a
rea
Cen
sus
No.
War
dN
o.
W
ard
Tow
n
(1)
(2)
(3
)
(1
2)
(1
3)
(1
4)
(1
5)
(16)
Sada
r Su
b-D
iv.
64/
22
41-
-4
Raj
ganj
/Bha
ktin
agar
Raj
ganj
--
--
1Ja
lpai
guri
Jalp
aigu
ri-
--
--
Jalp
aigu
ri(M
)1
25-
--
May
nagu
riM
ayna
guri
--
--
2D
hupg
uri
Dhu
pgur
i-
--
-1
Bana
rhat
Dhu
pgur
i(M)
116
--
-Si
ligur
i(M.C
.Par
t)-
--
--
Mal
Sub
-Div
.
33/
11
16-
-1
Mal
Mal
--
--
1M
al(M
)1
16-
--
Met
iali
Met
iali
--
--
-N
agra
kata
Nag
raka
ta-
--
--
Tabl
e : 2
.1 (C
ontd
.)
(N
umbe
r)Su
b-Po
lice
C.D
.Blo
ck./M
Tow
nD
ivis
ion
Stat
ion
Out
Gro
wth
Tot
al
(1)
(2
) (
3)(1
7)
(18)
Sada
r Su
b-D
iv.
64/
2..
6R
ajga
nj/B
hakt
inag
arR
ajga
nj..
1Ja
lpai
guri
Jalp
aigu
ri..
-Ja
lpai
guri(
M)
..1
May
nagu
riM
ayna
guri
..2
Dhu
pgur
iD
hupg
uri
..1
Bana
rhat
Dhu
pgur
i(M)
..1
Silig
uri(M
.C.P
art)
..-
Mal
Sub
-Div
.
33/
1..
2M
alM
al..
1M
al(M
)..
1M
etia
liM
etia
li..
-N
agra
kata
Nag
raka
ta..
-
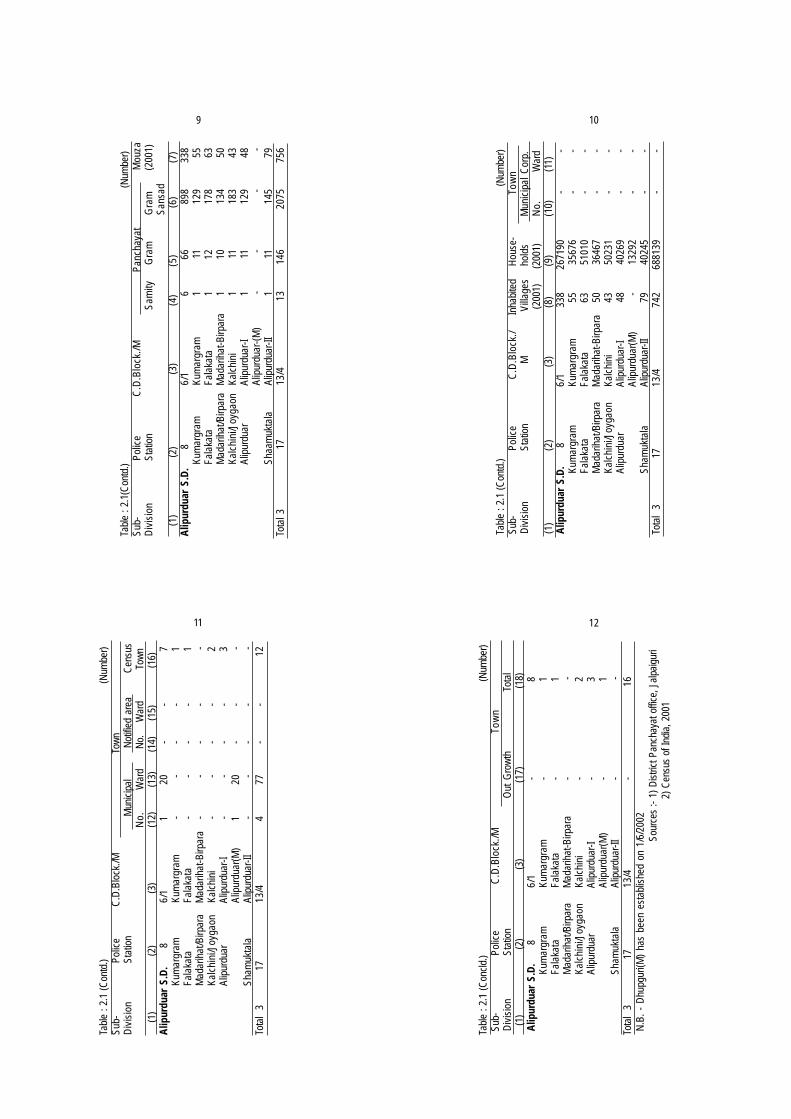
109Ta
ble
: 2.1
(Con
td.)
(
Num
ber)
Sub-
Polic
eC
.D.B
lock
./MP
anch
ayat
Mou
zaD
ivis
ion
Stat
ion
Sam
ityG
ram
Gra
m(2
001)
Sans
ad(1
) (
2)(3
)(4
)(5
)(6
)(7
)A
lipur
duar
S.D
.
8
6/1
666
898
338
Kum
argr
amKu
mar
gram
111
129
55Fa
laka
taFa
laka
ta1
1217
863
Mad
arih
at/B
irpar
aM
adar
ihat
-Birp
ara
110
134
50Ka
lchi
ni/J
oyga
onKa
lchi
ni1
1118
343
Alip
urdu
arAl
ipur
duar
-I1
1112
948
Alip
urdu
ar-(M
)-
--
-Sh
aam
ukta
laAl
ipur
duar
-II1
1114
579
Tota
l 3
17
13/4
1314
620
7575
6
Tab
le :
2.1
(Con
td.)
(N
umbe
r) S
ub-
Polic
eC
.D.B
lock
./In
habi
ted
Hou
se-
Tow
n D
ivis
ion
Stat
ion
MVi
llage
sho
lds
Mun
icip
al C
orp.
(
2001
)
(200
1)N
o.W
ard
(1)
(2)
(3)
(8)
(9)
(10)
(11)
Alip
urdu
ar S
.D.
86/
133
826
7190
--
Kum
argr
amKu
mar
gram
5535
676
--
Fala
kata
Fala
kata
6351
010
--
Mad
arih
at/B
irpar
aM
adar
ihat
-Birp
ara
5036
467
--
Kalc
hini
/Joy
gaon
Kalc
hini
4350
231
--
Alip
urdu
arAl
ipur
duar
-I48
4026
9-
-Al
ipur
duar
(M)
-13
292
--
Sham
ukta
laAl
ipur
duar
-II79
4024
5-
- T
otal
3
1
713
/474
268
8139
--
1211
Tabl
e : 2
.1 (C
ontd
.)
(N
umbe
r)Su
b-Po
lice
C
.D.B
lock
./M
T
own
Div
isio
nSt
atio
n
Mun
icip
alN
otifi
ed a
rea
C
ensu
sN
o.W
ard
No.
War
d
Tow
n
(1
) (
2)
(3)
(12)
(13)
(14)
(15)
(16)
Alip
urdu
ar S
.D.
86/
11
20-
-7
Kum
argr
amKu
mar
gram
--
--
1Fa
laka
taFa
laka
ta-
--
-1
Mad
arih
at/B
irpar
aM
adar
ihat
-Birp
ara
--
--
-Ka
lchi
ni/J
oyga
onKa
lchi
ni-
--
-2
Alip
urdu
arAl
ipur
duar
-I-
--
-3
Alip
urdu
ar(M
)1
20-
--
Sham
ukta
laAl
ipur
duar
-II-
--
--
Tota
l 3
1
713
/44
77-
-12
Tabl
e : 2
.1 (C
oncl
d.)
(N
umbe
r) S
ub-
Polic
eC
.D.B
lock
./MTo
wn
Div
isio
nSt
atio
nO
ut G
row
th
T
otal
(1
)
(2)
(3)
(17)
(1
8) A
lipur
duar
S.D
.
8
6/1
-8
Kum
argr
amKu
mar
gram
-1
Fala
kata
Fala
kata
-1
Mad
arih
at/B
irpar
aM
adar
ihat
-Birp
ara
--
Kalc
hini
/Joy
gaon
Kalc
hini
-2
Alip
urdu
arAl
ipur
duar
-I-
3Al
ipur
duar
(M)
-1
Sham
ukta
laAl
ipur
duar
-II-
-To
tal
3
17
13/4
-16
N.B
. -
Dhu
pgur
i(M)
has
been
est
ablis
hed
on 1
/6/2
002
So
urce
s :-
1) D
istri
ct P
anch
ayat
offi
ce, J
alpa
igur
i
2) C
ensu
s of
Indi
a, 2
001
14
1615
13
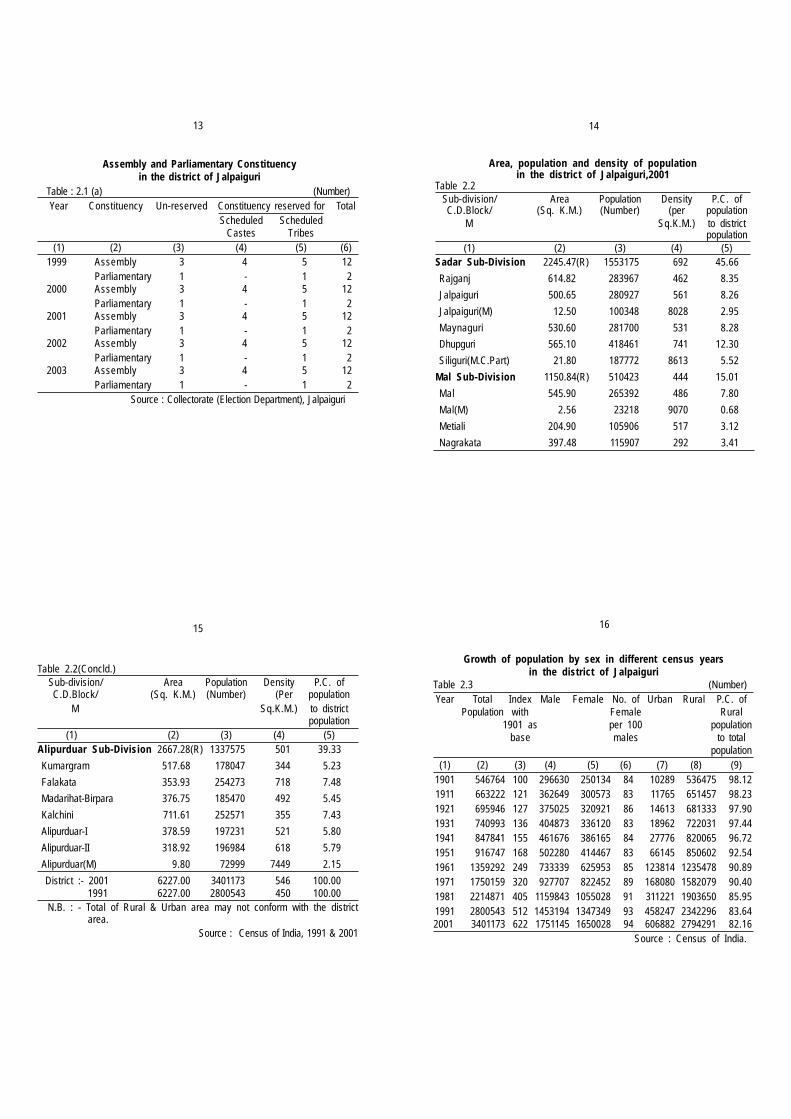
Assembly and Parliamentary Constituencyin the district of Jalpaiguri
Table : 2.1 (a) (Number)Year Constituency Un-reserved Constituency reserved for Total
Scheduled ScheduledCastes Tribes
(1) (2) (3) (4) (5) (6)1999 Assembly 3 4 5 12
Parliamentary 1 - 1 22000 Assembly 3 4 5 12
Parliamentary 1 - 1 22001 Assembly 3 4 5 12
Parliamentary 1 - 1 22002 Assembly 3 4 5 12
Parliamentary 1 - 1 22003 Assembly 3 4 5 12
Parliamentary 1 - 1 2 Source : Collectorate (Election Department), Jalpaiguri
Area, population and density of populationin the district of Jalpaiguri,2001
Table 2.2Sub-division/ Area Population Density P.C. ofC.D.Block/ (Sq. K.M.) (Number) (per population
M Sq.K.M.) to districtpopulation
(1) (2) (3) (4) (5)Sadar Sub-Division 2245.47(R) 1553175 692 45.66
Rajganj 614.82 283967 462 8.35
Jalpaiguri 500.65 280927 561 8.26
Jalpaiguri(M) 12.50 100348 8028 2.95
Maynaguri 530.60 281700 531 8.28
Dhupguri 565.10 418461 741 12.30
Siliguri(M.C.Part) 21.80 187772 8613 5.52
Mal Sub-Division 1150.84(R) 510423 444 15.01
Mal 545.90 265392 486 7.80
Mal(M) 2.56 23218 9070 0.68
Metiali 204.90 105906 517 3.12
Nagrakata 397.48 115907 292 3.41
Table 2.2(Concld.)Sub-division/ Area Population Density P.C. ofC.D.Block/ (Sq. K.M.) (Number) (Per population
M Sq.K.M.) to districtpopulation
(1) (2) (3) (4) (5)Alipurduar Sub-Division 2667.28(R) 1337575 501 39.33
Kumargram 517.68 178047 344 5.23
Falakata 353.93 254273 718 7.48
Madarihat-Birpara 376.75 185470 492 5.45
Kalchini 711.61 252571 355 7.43
Alipurduar-I 378.59 197231 521 5.80
Alipurduar-II 318.92 196984 618 5.79
Alipurduar(M) 9.80 72999 7449 2.15
District :- 2001 6227.00 3401173 546 100.00 1991 6227.00 2800543 450 100.00
N.B. : - Total of Rural & Urban area may not conform with the district area.
Source : Census of India, 1991 & 2001
Growth of population by sex in different census yearsin the district of Jalpaiguri
Table 2.3 (Number)Year Total Index Male Female No. of Urban Rural P.C. of
Population with Female Rural1901 as per 100 population
base males to totalpopulation
(1) (2) (3) (4) (5) (6) (7) (8) (9)1901 546764 100 296630 250134 84 10289 536475 98.121911 663222 121 362649 300573 83 11765 651457 98.231921 695946 127 375025 320921 86 14613 681333 97.901931 740993 136 404873 336120 83 18962 722031 97.441941 847841 155 461676 386165 84 27776 820065 96.721951 916747 168 502280 414467 83 66145 850602 92.541961 1359292 249 733339 625953 85 123814 1235478 90.891971 1750159 320 927707 822452 89 168080 1582079 90.401981 2214871 405 1159843 1055028 91 311221 1903650 85.951991 2800543 512 1453194 1347349 93 458247 2342296 83.642001 3401173 622 1751145 1650028 94 606882 2794291 82.16
Source : Census of India.
17
19 20
18
D
istr
ibut
ion
of R
ural
and
Urb
an P
opul
atio
n by
sex
in
the
dis
tric
t of
Jal
paig
uri
,199
1 T
able
: 2.
4(a)
(
Num
ber)
Sub-
Div
isio
n/R
ural
U
rban
C.D
.Blo
ck/M
Mal
eFe
mal
eTo
tal
Mal
eFe
mal
eTo
tal
(1)
(2)
(3)
(4)
(5)
(6)
(7)
Sad
ar S
ub-D
ivis
ion
7022
5665
2270
1354
526
1669
1815
1716
3186
34R
ajga
nj87
437
7945
116
6888
7791
069
307
1472
17Ja
lpai
guri
1359
6412
5415
2613
79-
--
Jalp
aigu
ri(M
)-
--
3502
033
712
6873
2M
al11
3301
1067
9222
0093
5251
4656
9907
Mal
(M)
--
-10
984
9411
2039
5M
etia
li47
702
4555
193
253
--
-M
ayna
guri
1066
9397
179
2038
7217
864
1641
934
283
Nag
raka
ta52
482
4930
010
1782
--
-D
hupg
uri
1586
7714
8582
3072
5919
889
1821
138
100
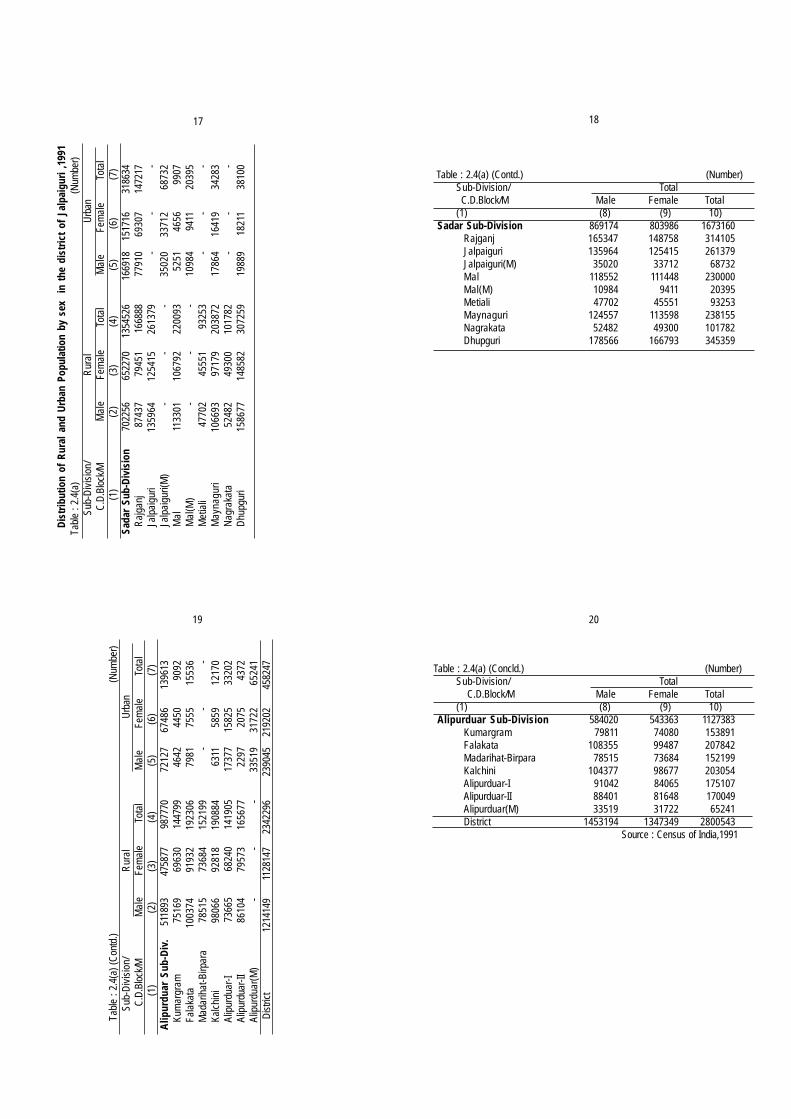
Table : 2.4(a) (Contd.) (Number)Sub-Division/ Total
C.D.Block/M Male Female Total(1) (8) (9) 10)
Sadar Sub-Division 869174 803986 1673160Rajganj 165347 148758 314105Jalpaiguri 135964 125415 261379Jalpaiguri(M) 35020 33712 68732Mal 118552 111448 230000Mal(M) 10984 9411 20395Metiali 47702 45551 93253Maynaguri 124557 113598 238155Nagrakata 52482 49300 101782Dhupguri 178566 166793 345359
Tab
le :
2.4(
a) (C
ontd
.)
(Num
ber)
Sub-
Div
isio
n/R
ural
U
rban
C.D
.Blo
ck/M
Mal
eFe
mal
eTo
tal
Mal
eFe
mal
eTo
tal
(1)
(2)
(3)
(4)
(5)
(6)
(7)
Alip
urdu
ar S
ub-D
iv.
5118
9347
5877
9877
7072
127
6748
613
9613
Kum
argr
am75
169
6963
014
4799
4642
4450
9092
Fala
kata
1003
7491
932
1923
0679
8175
5515
536
Mad
arih
at-B
irpar
a78
515
7368
415
2199
--
-Ka
lchi
ni98
066
9281
819
0884
6311
5859
1217
0Al
ipur
duar
-I73
665
6824
014
1905
1737
715
825
3320
2Al
ipur
duar
-II86
104
7957
316
5677
2297
2075
4372
Alip
urdu
ar(M
)-
--
3351
931
722
6524
1 D
istri
ct12
1414
911
2814
723
4229
623
9045
2192
0245
8247 Table : 2.4(a) (Concld.) (Number)
Sub-Division/ Total C.D.Block/M Male Female Total
(1) (8) (9) 10) Alipurduar Sub-Division 584020 543363 1127383
Kumargram 79811 74080 153891Falakata 108355 99487 207842Madarihat-Birpara 78515 73684 152199Kalchini 104377 98677 203054Alipurduar-I 91042 84065 175107Alipurduar-II 88401 81648 170049Alipurduar(M) 33519 31722 65241District 1453194 1347349 2800543 Source : Census of India,1991
21 22
23 24
Dis
trib
utio
n of
Rur
al a
nd U
rban
Pop
ulat
ion
by s
exin
the
dis
tric
t of
Jal
paig
uri
,200
1 T
able
: 2.
4(b)
(
Num
ber)
Sub-
Div
isio
n/R
ural
U
rban
C
.D.B
lock
/MM
ale
Fem
ale
Tota
lM
ale
Fem
ale
Tota
l(1
)(2
)(3
)(4
)(5
)(6
)(7
) S
adar
Sub
-Div
isio
n61
0388
5662
3411
7662
219
5118
1814
3537
6553
Raj
ganj
1474
6713
6500
2839
67-
--
Jalp
aigu
ri14
5272
1356
5528
0927
--
-Ja
lpai
guri(
M)
--
-50
629
4971
910
0348
May
nagu
ri13
1720
1228
7425
4594
1388
313
223
2710
6D
hupg
uri
1859
2917
1205
3571
3431
856
2947
161
327
Silig
uri(M
.C.P
art)
--
-98
750
8902
218
7772
Mal
Sub
Div
isio
n24
7606
2395
9948
7205
1215
111
067
2321
8M
al13
5344
1300
4826
5392
--
-M
al(M
)-
--
1215
111
067
2321
8M
etia
li53
472
5243
410
5906
--
-N
agra
kata
5879
057
117
1159
07-
--
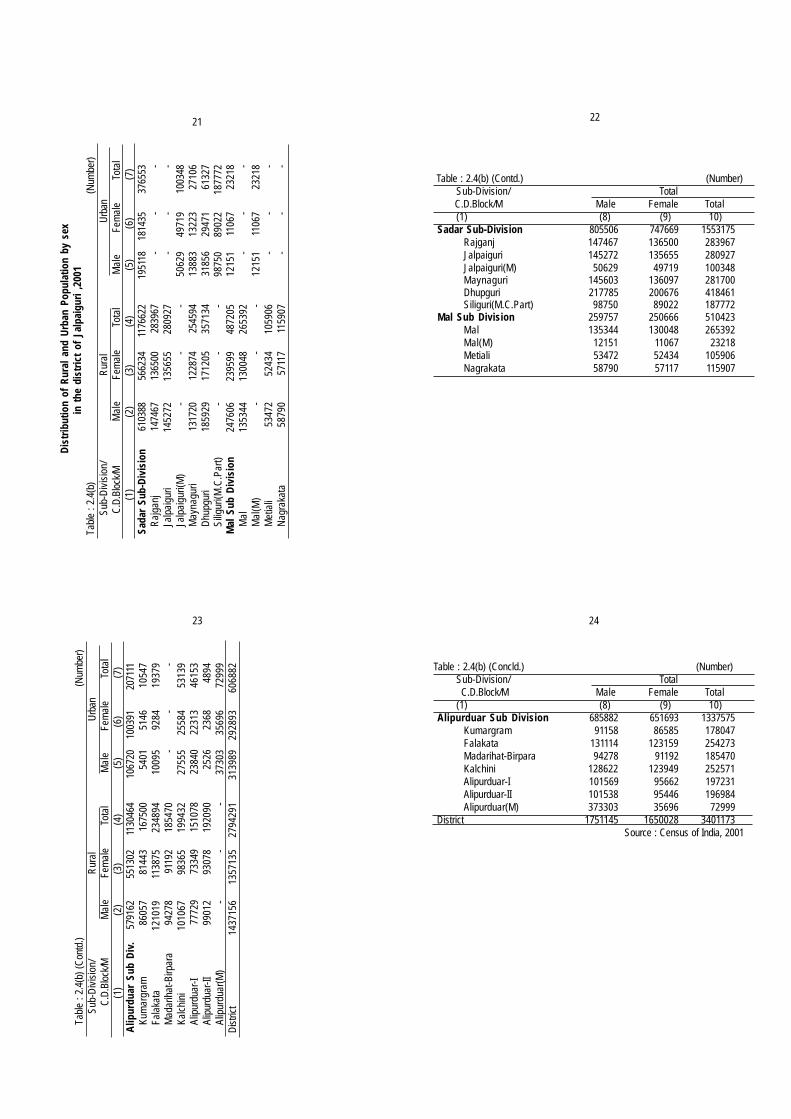
Table : 2.4(b) (Contd.) (Number)Sub-Division/ Total
C.D.Block/M Male Female Total(1) (8) (9) 10)
Sadar Sub-Division 805506 747669 1553175Rajganj 147467 136500 283967Jalpaiguri 145272 135655 280927Jalpaiguri(M) 50629 49719 100348Maynaguri 145603 136097 281700Dhupguri 217785 200676 418461Siliguri(M.C.Part) 98750 89022 187772
Mal Sub Division 259757 250666 510423Mal 135344 130048 265392Mal(M) 12151 11067 23218Metiali 53472 52434 105906Nagrakata 58790 57117 115907
Tab
le :
2.4(
b) (C
ontd
.)
(Num
ber)
Sub-
Div
isio
n/R
ural
U
rban
C.D
.Blo
ck/M
Mal
eFe
mal
eTo
tal
Mal
eFe
mal
eTo
tal
(1)
(2)
(3)
(4)
(5)
(6)
(7)
Alip
urdu
ar S
ub D
iv.
5791
6255
1302
1130
464
1067
2010
0391
2071
11Ku
mar
gram
8605
781
443
1675
0054
0151
4610
547
Fala
kata
1210
1911
3875
2348
9410
095
9284
1937
9M
adar
ihat
-Birp
ara
9427
891
192
1854
70-
--
Kalc
hini
1010
6798
365
1994
3227
555
2558
453
139
Alip
urdu
ar-I
7772
973
349
1510
7823
840
2231
346
153
Alip
urdu
ar-II
9901
293
078
1920
9025
2623
6848
94Al
ipur
duar
(M)
--
-37
303
3569
672
999
Dis
trict
1437
156
1357
135
2794
291
3139
8929
2893
6068
82 Table : 2.4(b) (Concld.) (Number)Sub-Division/ Total
C.D.Block/M Male Female Total(1) (8) (9) 10)
Alipurduar Sub Division 685882 651693 1337575Kumargram 91158 86585 178047Falakata 131114 123159 254273Madarihat-Birpara 94278 91192 185470Kalchini 128622 123949 252571Alipurduar-I 101569 95662 197231Alipurduar-II 101538 95446 196984Alipurduar(M) 373303 35696 72999
District 1751145 1650028 3401173 Source : Census of India, 2001
26
27
25
28
Dis
trib
utio
n of
pop
ulat
ion
by s
ex i
n th
e di
stri
ct o
f Ja
lpai
guri
by
age
grou
p,19
91Ta
ble
2.5
(Num
ber
in t
hous
and)
Age
Rur
al
Urb
angr
oup
Mal
e
Fe
mal
e
Tota
l
Mal
e
Fem
ale
To
tal
(Yea
rs)
No.
P.C
.N
o.P.
C.
No.
P.C
.N
o.P.
C.
No.
P.C
.N
o.P.
C.
(1)
(2)
(3)
(4)
(5)
(6)
(7)
(8)
(9)
(10)
(11)
(12)
(13)
)0
- 4
152.
812
.59
150.
613
.35
303.
412
.95
21.9
9.16
21.5
9.81
43.4
9.47
5 -
9 1
76.7
14.5
616
7.4
14.8
434
4.1
14.6
926
.811
.21
25.9
11.8
252
.711
.50
10-1
4 1
47.4
12.1
414
0.0
12.4
128
7.4
12.2
727
.111
.34
25.5
11.6
352
.611
.48
15-1
9 1
09.3
9.00
98.5
8.73
207.
88.
8723
.09.
6221
.49.
7644
.49.
6920
-24
101.
98.
3910
4.0
9.22
205.
98.
7923
.19.
6723
.410
.68
46.5
10.1
525
-29
103
.98.
5611
3.5
10.0
621
7.4
9.28
22.7
9.50
24.3
11.0
947
.010
.26
30-3
9 1
74.2
14.3
515
0.3
13.3
232
4.5
13.8
638
.516
.11
32.2
14.6
970
.715
.43
40-4
9 1
07.2
8.83
87.2
7.73
194.
48.
3025
.110
.50
18.9
8.62
44.0
9.60
50-5
9 6
8.4
5.63
58.2
5.16
126.
65.
4114
.96.
2411
.85.
3826
.75.
8360
&ab
ove
65.
65.
4053
.34.
7311
8.9
5.08
14.2
5.94
13.0
5.93
27.2
5.94
Age
not
stat
ed 6
.70.
555.
10.
4511
.80.
501.
70.
711.
30.
593.
00.
65Al
lag
es 1
214.
110
0.00
1128
.110
0.00
2342
.210
0.00
239.
010
0.00
219.
210
0.00
458.
210
0.00
Table 2.5 (Concld.) (Number in thousand) Age group Total
(Years) Male Female TotalNo. P.C. No. P.C. No. P.C.
(1) (14) (15) (16) (17) (18) (19)0 - 4 174.7 12.02 172.1 12.77 346.8 12.38
5 - 9 203.5 14.00 193.3 14.35 396.8 14.17
10-14 174.5 12.01 165.5 12.28 340.0 12.14
15-19 132.3 9.11 119.9 8.90 252.2 9.01
20-24 125.0 8.60 127.4 9.46 252.4 9.01
25-29 126.6 8.71 137.8 10.23 264.4 9.44
30-39 212.7 14.64 182.5 13.55 395.2 14.11
40-49 132.3 9.11 106.1 7.87 238.4 8.51
50-59 83.3 5.73 70.0 5.20 153.3 5.48
60 & above 79.8 5.49 66.3 4.92 146.1 5.22
Age not stated 8.4 0.58 6.4 0.47 14.9 0.53
All ages 1453.1 100.00 1347.3 100.00 2800.5 100.00
Source : Census of India, 1991
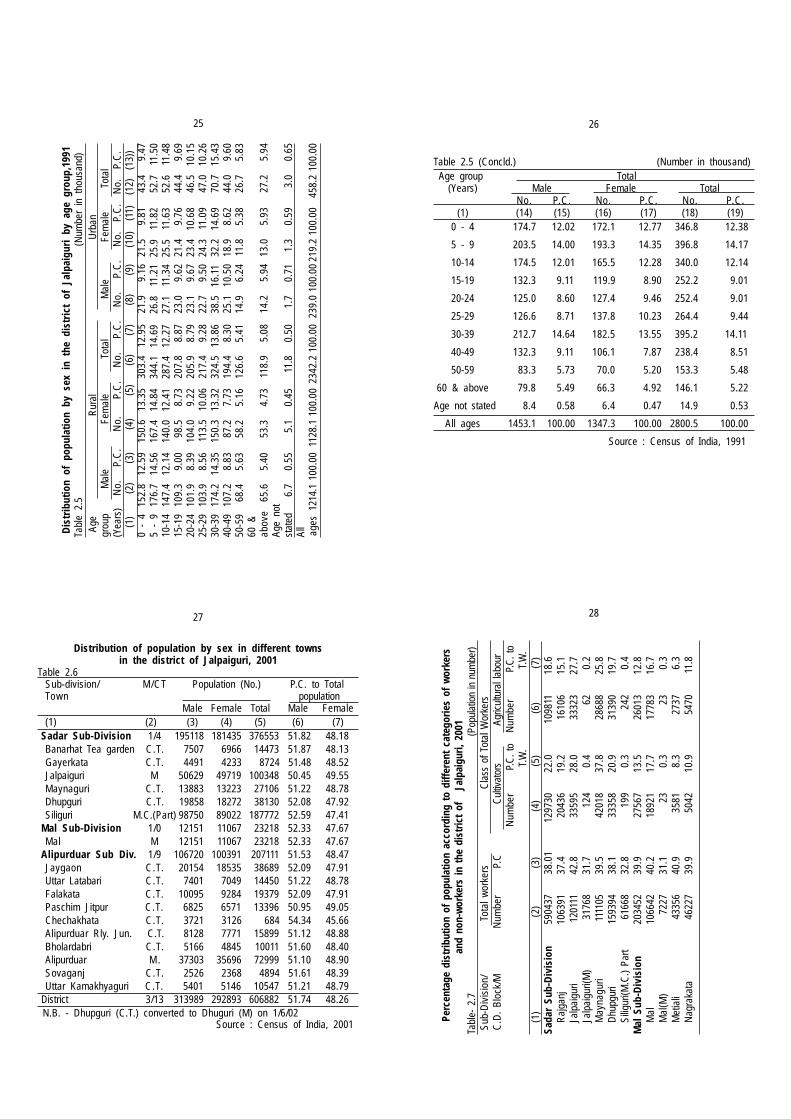
Distribution of population by sex in different townsin the district of Jalpaiguri, 2001
Table 2.6Sub-division/ M/CT Population (No.) P.C. to TotalTown population
Male Female Total Male Female(1) (2) (3) (4) (5) (6) (7)
Sadar Sub-Division 1/4 195118 181435 376553 51.82 48.18Banarhat Tea garden C.T. 7507 6966 14473 51.87 48.13Gayerkata C.T. 4491 4233 8724 51.48 48.52Jalpaiguri M 50629 49719 100348 50.45 49.55Maynaguri C.T. 13883 13223 27106 51.22 48.78Dhupguri C.T. 19858 18272 38130 52.08 47.92Siliguri M.C.(Part) 98750 89022 187772 52.59 47.41
Mal Sub-Division 1/0 12151 11067 23218 52.33 47.67Mal M 12151 11067 23218 52.33 47.67
Alipurduar Sub Div. 1/9 106720 100391 207111 51.53 48.47Jaygaon C.T. 20154 18535 38689 52.09 47.91Uttar Latabari C.T. 7401 7049 14450 51.22 48.78Falakata C.T. 10095 9284 19379 52.09 47.91Paschim Jitpur C.T. 6825 6571 13396 50.95 49.05Chechakhata C.T. 3721 3126 684 54.34 45.66Alipurduar Rly. Jun. C.T. 8128 7771 15899 51.12 48.88Bholardabri C.T. 5166 4845 10011 51.60 48.40Alipurduar M . 37303 35696 72999 51.10 48.90Sovaganj C.T. 2526 2368 4894 51.61 48.39Uttar Kamakhyaguri C.T. 5401 5146 10547 51.21 48.79
District 3/13 313989 292893 606882 51.74 48.26 N.B. - Dhupguri (C.T.) converted to Dhuguri (M) on 1/6/02 Source : Census of India, 2001 P
erce
ntag
e di
stri
butio
n of
pop
ulat
ion
acco
rdin
g to
diff
eren
t ca
tego
ries
of
wor
kers
and
non-
wor
kers
in
the
dist
rict
of
Jal
paig
uri,
2001
Tabl
e- 2
.7
(Pop
ulat
ion
in n
umbe
r)Su
b-D
ivis
ion/
Tota
l wor
kers
Cla
ss o
f To
tal W
orke
rsC
.D.
Blo
ck/M
Num
ber
P.C
Cul
tivat
ors
Ag
ricul
tura
l lab
our
Num
ber
P.
C. t
oN
umbe
r
P.C
. to
T
.W.
T
.W.
(1)
(2)
(3)
(4)
(5)
(6)
(7)
Sada
r Su
b-D
ivis
ion
5904
3738
.01
1297
3022
.010
9811
18.6
Raj
ganj
1063
9137
.420
436
19.2
1610
615
.1Ja
lpai
guri
1201
1142
.833
595
28.0
3332
327
.7Ja
lpai
guri(
M)
3176
831
.712
40.
462
0.2
May
nagu
ri11
1105
39.5
4201
837
.828
688
25.8
Dhu
pgur
i15
9394
38.1
3335
820
.931
390
19.7
Silig
uri(M
.C.)
Part
6166
832
.819
90.
324
20.
4M
al S
ub-D
ivis
ion
2034
5239
.927
567
13.5
2601
312
.8M
al10
6642
40.2
1892
117
.717
783
16.7
Mal
(M)
7227
31.1
230.
323
0.3
Met
iali
4335
640
.935
818.
327
376.
3N
agra
kata
4622
739
.950
4210
.954
7011
.8

31
3029
32
Tabl
e- 2
.7 (
Con
td.)
(Pop
ulat
ion
in n
umbe
r)Su
b-D
ivis
ion/
Cla
ss o
f Tot
al W
orke
rsM
ain
wor
kers
C.D
. Blo
ck/M
H
ouse
hold
Indu
stry
O
ther
wor
kers
Num
ber
P.C
wor
kers
Num
ber
P.
C. t
o N
umbe
rP.
C.
to T
.W.
T.W
.(1
)(8
)(9
)(1
0)(1
1)(1
2)(1
3)Sa
dar
Sub-
Div
isio
n13
829
2.3
3370
6757
.147
1798
30.4
Raj
ganj
2545
2.4
6730
463
.385
815
30.2
Jalp
aigu
ri31
452.
650
048
41.7
8536
430
.4Ja
lpai
guri(
M)
562
1.8
3102
097
.630
211
30.1
May
nagu
ri30
782.
837
321
33.6
8440
730
.0D
hupg
uri
2986
1.9
9166
057
.512
8741
30.8
Silig
uri(M
.C.)
Part
1513
2.5
5971
496
.857
260
30.5
Mal
Sub
-Div
isio
n23
881.
214
7484
72.5
1548
3230
.3M
al13
211.
268
617
64.3
8056
130
.4M
al(M
)20
52.
869
7696
.566
4128
.6M
etia
li48
01.
136
558
84.3
3346
031
.6N
agra
kata
382
0.8
3533
376
.434
170
29.5
Tabl
e- 2
.7 (C
ontd
.)
(P
opul
atio
n in
num
ber)
Sub-
Div
isio
n/
Mar
gina
l Wor
kers
Non
-Wor
kers
Tota
l Pop
ulat
ion
C.D
. B
lock
/MN
umbe
rP.
C.
Num
ber
P.C
..
(1)
(14)
(15)
(16)
(17)
(18)
Sada
r Su
b-D
ivis
ion
1186
397.
696
2738
62.0
1553
175
Raj
ganj
2057
67.
217
7576
62.6
2839
67Ja
lpai
guri
3474
712
.416
0816
57.2
2809
27Ja
lpai
guri(
M)
1557
1.6
6858
068
.310
0348
May
nagu
ri26
698
9.5
1705
9560
.528
1700
Dhu
pgur
i30
653
7.3
2590
6761
.941
8461
Silig
uri(M
.C.)
Part
4408
2.3
1261
0467
.218
7772
Mal
Sub
-Div
isio
n48
620
9.5
3069
7160
.151
0423
Mal
2608
19.
815
8750
59.8
2653
92M
al(M
)58
62.
515
991
68.9
2321
8M
etia
li98
969.
362
550
59.1
1059
06N
agra
kata
1205
710
.469
680
60.1
1159
07
Tabl
e- 2
.7(C
ontd
.)
(P
opul
atio
n in
num
ber)
Sub-
Div
isio
n/To
tal w
orke
rs
C
lass
of T
otal
Wor
kers
C.D
. Bl
ock/
MN
umbe
r P
.CC
ultiv
ator
sAg
ricul
tura
l lab
our
Num
ber
P.C
. to
Num
ber
P.C
. to
T.
W.
T.
W.
(1)
(2)
(3)
(4)
(5)
(6)
(7)
Alip
urdu
ar S
ub-D
iv.
5092
4738
.111
2647
22.1
9433
918
.5Ku
mar
gram
7571
042
.521
758
28.7
1531
520
.2Fa
laka
ta95
801
37.6
2847
529
.725
014
26.1
Mad
arih
at-B
irpar
a70
506
38.0
8840
12.5
5944
8.4
Kalc
hini
8956
335
.483
069.
366
177.
4Al
ipur
duar
-I78
784
39.9
2282
429
.018
711
23.7
Alip
urdu
ar-II
7485
438
.022
407
29.9
2261
930
.2Al
ipur
duar
(M)
2402
932
.937
0.2
119
0.5
Dis
trict
1130
3136
38.3
2699
4420
.723
0163
17.7
Tabl
e- 2
.7 (
Con
td.)
(Pop
ulat
ion
in n
umbe
r)
Sub-
Div
isio
n/ C
lass
of
Tota
l Wor
kers
Mai
n w
orke
rsC
.D. B
lock
/M
Hou
seho
ld In
dust
ryO
ther
wor
kers
N
umbe
rP.
C
wor
kers
Num
ber
P.C
. to
Num
ber
P.C
. to
T
.W.
T.
W.
(1)
(8)
(9)
(10)
(11)
(12)
(13)
Alip
urdu
ar S
ub-D
iv.
1062
22.
129
1639
57.3
3988
0329
.8Ku
mar
gram
1850
2.4
3678
748
.654
813
30.8
Fala
kata
2058
2.1
4025
442
.077
425
30.4
Mad
arih
at/B
irpar
a79
01.
154
932
77.9
5533
629
.8Ka
lchi
ni11
111.
273
529
82.1
7050
527
.9Al
ipur
duar
-I11
951.
536
054
45.8
6220
931
.5Al
ipur
duar
-II27
773.
727
051
36.1
5575
828
.3Al
ipur
duar
(M)
841
3.5
2303
295
.922
757
31.2
Dis
trict
2683
92.
177
6190
59.5
1025
433
30.1
34
3635
33
Tabl
e- 2
.7 (C
oncl
d.)
(Pop
ulat
ion
in n
umbe
r)Su
b-D
ivis
ion/
M
argi
nal W
orke
rsN
on-W
orke
rsTo
tal P
opul
atio
nC
.D.
Blo
ck/M
Num
ber
P.C
.N
umbe
rP.
C.
(
1)(1
4)(1
5)(1
6)(1
7)
(1
8)A
lipur
duar
Sub
-Div
.11
0444
8.3
8283
2861
.913
3757
5Ku
mar
gram
2089
711
.710
2337
57.5
1780
47Fa
laka
ta18
376
7.2
1584
7262
.425
4273
Mad
arih
at/B
irpar
a15
170
8.2
1149
6462
.018
5470
Kalc
hini
1905
87.
516
3008
64.6
2525
71Al
ipur
duar
-I16
575
8.4
1184
4760
.119
7231
Alip
urdu
ar-II
1909
69.
712
2130
62.0
1969
84Al
ipur
duar
(M)
1278
1.7
4897
067
.172
999
Dis
trict
2777
038.
220
9803
761
.734
0117
3
Not
e : T
otal
Wor
ker
= M
ain
Wor
ker
+ M
argi
nal W
orke
r
P.C
. = P
erce
ntag
e to
res
pect
ive
tota
l pop
ulat
ion
P.
C. t
o T.
W. =
Per
cent
age
to r
espe
ctiv
e to
tal w
orke
rs
Sou
rce
: Cen
sus
of In
dia
2001
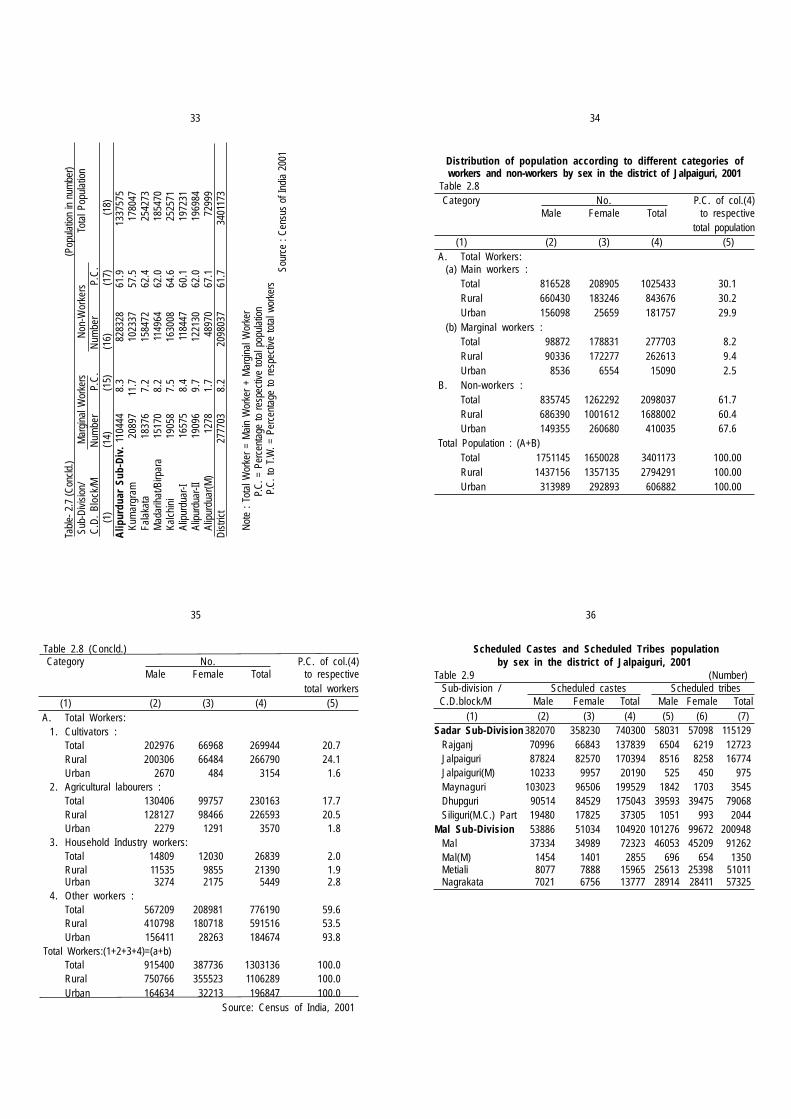
Table 2.8 (Concld.)Category No. P.C. of col.(4)
Male Female Total to respectivetotal workers
(1) (2) (3) (4) (5)A. Total Workers:
1. Cultivators :Total 202976 66968 269944 20.7Rural 200306 66484 266790 24.1Urban 2670 484 3154 1.6
2. Agricultural labourers :Total 130406 99757 230163 17.7Rural 128127 98466 226593 20.5Urban 2279 1291 3570 1.8
3. Household Industry workers:Total 14809 12030 26839 2.0Rural 11535 9855 21390 1.9Urban 3274 2175 5449 2.8
4. Other workers :Total 567209 208981 776190 59.6Rural 410798 180718 591516 53.5Urban 156411 28263 184674 93.8
Total Workers:(1+2+3+4)=(a+b)Total 915400 387736 1303136 100.0Rural 750766 355523 1106289 100.0Urban 164634 32213 196847 100.0
Source: Census of India, 2001
Scheduled Castes and Scheduled Tribes populationby sex in the district of Jalpaiguri, 2001
Table 2.9 (Number)Sub-division / Scheduled castes Scheduled tribes
C.D.block/M Male Female Total Male Female Total(1) (2) (3) (4) (5) (6) (7)
Sadar Sub-Division 382070 358230 740300 58031 57098 115129Rajganj 70996 66843 137839 6504 6219 12723Jalpaiguri 87824 82570 170394 8516 8258 16774Jalpaiguri(M) 10233 9957 20190 525 450 975Maynaguri 103023 96506 199529 1842 1703 3545Dhupguri 90514 84529 175043 39593 39475 79068Siliguri(M.C.) Part 19480 17825 37305 1051 993 2044
Mal Sub-Division 53886 51034 104920 101276 99672 200948Mal 37334 34989 72323 46053 45209 91262Mal(M) 1454 1401 2855 696 654 1350Metiali 8077 7888 15965 25613 25398 51011Nagrakata 7021 6756 13777 28914 28411 57325
Distribution of population according to different categories ofworkers and non-workers by sex in the district of Jalpaiguri, 2001
Table 2.8Category No. P.C. of col.(4)
Male Female Total to respectivetotal population
(1) (2) (3) (4) (5)A. Total Workers:
(a) Main workers :Total 816528 208905 1025433 30.1Rural 660430 183246 843676 30.2Urban 156098 25659 181757 29.9
(b) Marginal workers :Total 98872 178831 277703 8.2Rural 90336 172277 262613 9.4Urban 8536 6554 15090 2.5
B. Non-workers :Total 835745 1262292 2098037 61.7Rural 686390 1001612 1688002 60.4Urban 149355 260680 410035 67.6
Total Population : (A+B)Total 1751145 1650028 3401173 100.00Rural 1437156 1357135 2794291 100.00Urban 313989 292893 606882 100.00
38
39 40
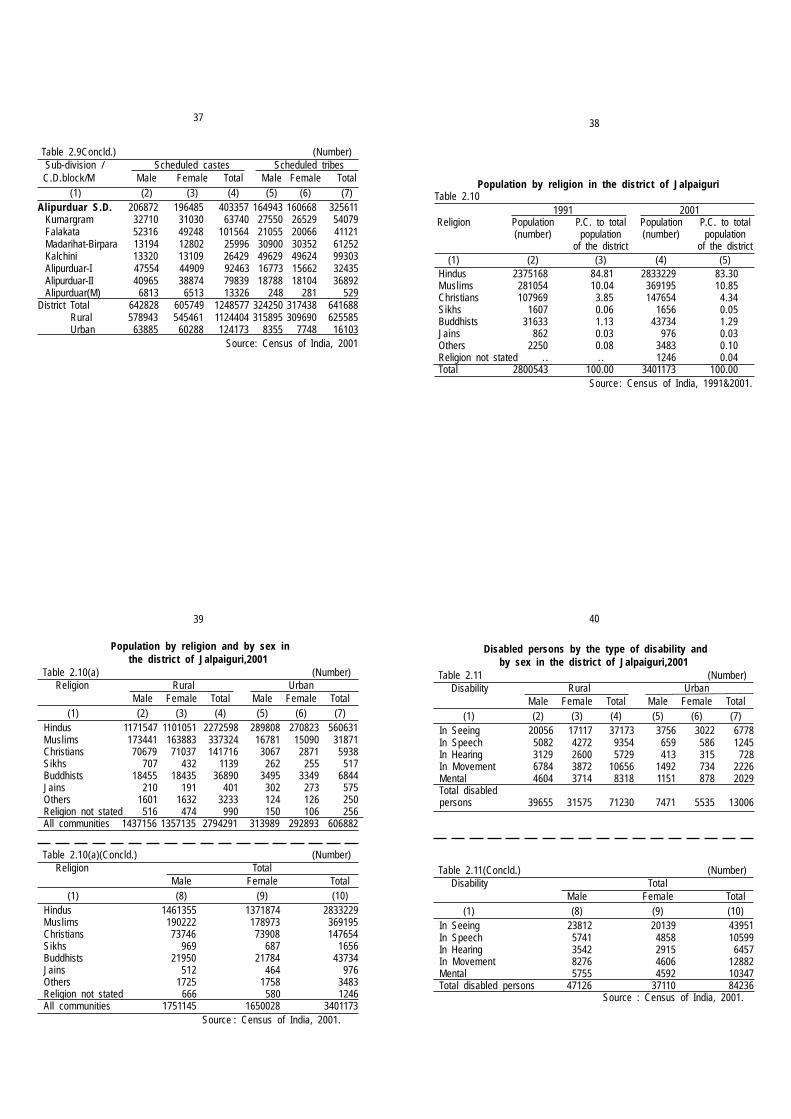
Table 2.9Concld.) (Number)Sub-division / Scheduled castes Scheduled tribes
C.D.block/M Male Female Total Male Female Total(1) (2) (3) (4) (5) (6) (7)
Alipurduar S.D. 206872 196485 403357 164943 160668 325611Kumargram 32710 31030 63740 27550 26529 54079Falakata 52316 49248 101564 21055 20066 41121Madarihat-Birpara 13194 12802 25996 30900 30352 61252Kalchini 13320 13109 26429 49629 49624 99303Alipurduar-I 47554 44909 92463 16773 15662 32435Alipurduar-II 40965 38874 79839 18788 18104 36892Alipurduar(M) 6813 6513 13326 248 281 529
District Total 642828 605749 1248577 324250 317438 641688 Rural 578943 545461 1124404 315895 309690 625585 Urban 63885 60288 124173 8355 7748 16103
Source: Census of India, 2001
Population by religion in the district of JalpaiguriTable 2.10
1991 2001Religion Population P.C. to total Population P.C. to total
(number) population (number) populationof the district of the district
(1) (2) (3) (4) (5)Hindus 2375168 84.81 2833229 83.30Muslims 281054 10.04 369195 10.85Christians 107969 3.85 147654 4.34Sikhs 1607 0.06 1656 0.05Buddhists 31633 1.13 43734 1.29Jains 862 0.03 976 0.03Others 2250 0.08 3483 0.10Religion not stated . . . . 1246 0.04Total 2800543 100.00 3401173 100.00
Source : Census of India, 1991&2001.
37
Population by religion and by sex inthe district of Jalpaiguri,2001
Table 2.10(a) (Number)Religion Rural Urban
Male Female Total Male Female Total(1) (2) (3) (4) (5) (6) (7)
Hindus 1171547 1101051 2272598 289808 270823 560631Muslims 173441 163883 337324 16781 15090 31871Christians 70679 71037 141716 3067 2871 5938Sikhs 707 432 1139 262 255 517Buddhists 18455 18435 36890 3495 3349 6844Jains 210 191 401 302 273 575Others 1601 1632 3233 124 126 250Religion not stated 516 474 990 150 106 256All communities 1437156 1357135 2794291 313989 292893 606882
Table 2.10(a)(Concld.) (Number)Religion Total
Male Female Total(1) (8) (9) (10)
Hindus 1461355 1371874 2833229Muslims 190222 178973 369195Christians 73746 73908 147654Sikhs 969 687 1656Buddhists 21950 21784 43734Jains 512 464 976Others 1725 1758 3483Religion not stated 666 580 1246All communities 1751145 1650028 3401173
Source : Census of India, 2001.
Disabled persons by the type of disability andby sex in the district of Jalpaiguri,2001
Table 2.11 (Number)Disability Rural Urban
Male Female Total Male Female Total(1) (2) (3) (4) (5) (6) (7)
In Seeing 20056 17117 37173 3756 3022 6778In Speech 5082 4272 9354 659 586 1245In Hearing 3129 2600 5729 413 315 728In Movement 6784 3872 10656 1492 734 2226Mental 4604 3714 8318 1151 878 2029Total disabledpersons 39655 31575 71230 7471 5535 13006
Table 2.11(Concld.) (Number)Disability Total
Male Female Total(1) (8) (9) (10)
In Seeing 23812 20139 43951In Speech 5741 4858 10599In Hearing 3542 2915 6457In Movement 8276 4606 12882Mental 5755 4592 10347Total disabled persons 47126 37110 84236
Source : Census of India, 2001.

41 42
III- PUBLIC HEALTHMedical facilities available in the district of Jalpaiguri
Table 3.1 (Number)Year/ Medical Institutions Total DoctorsSub-division/ Hospitals Health Clinics Dispen- Total bedsC.D.Block/M centres saries (1) (2) (3) (4) (5) (6) (7) (8)
1999 10* 46 56 56 168 1335 1642000 10* 46 56 56 168 1335 1622001 112 46 56 56 270 4188 3342002 113 46 56 56 271 4224 3542003 113 46 56 56 271 4224 361
Year : 2003Sadar Sub-division 27 19 24 24 94 1297 162
Rajganj 4 3 4 4 15 170 43Jalpaiguri 3 6 7 7 23 115 12Jalpaiguri(M) 1 - 1 1 3 610 57Maynaguri 1 6 7 7 21 60 15Dhupguri 17 4 4 4 29 312 20Dhupguri(M) 1 - 1 1 3 30 15
Mal Sub-Division 45 10 11 11 77 1391 75Mal 20 4 4 4 32 792 20Mal(M) 1 - 1 1 3 100 18Metiali 12 3 3 3 21 248 18Nagrakata 12 3 3 3 21 251 19
Table 3.1(Concld.) (Number)Year/ Medical Institutions Total Doctors
Sub-division/ Hospitals Health Clinics Dispen- Total bedsC.D.Block/M centres saries
(1) (2) (3) (4) (5) (6) (7) (8)AlipurduarSub-division 41 17 21 21 100 1536 124
Kumargram 7 3 3 3 16 215 14Falakata 5 2 3 3 13 130 12Madarihat-Birpara 12 4 5 5 26 415 29Kalchini 10 2 2 2 16 315 21Alipurduar-I 5 3 3 3 14 206 20Alipurduar-II 1 3 4 4 12 30 4Alipurduar(M) 1 - 1 1 3 225 25
Tea Garden Hospital - 100, * Govt. Hospital - 10 ( Rural - 6, Urban - 4 ) Rly. Hospital - 2, Private Eye Hospital - 1
Sources: 1) Dy. Chief Medical Officer of Health, Jalpaiguri.2) I.T.P.A. , Jalpaiguri.3) Supdt. of Rly. Hospital N.J.P & Alipurduar.4) Deputy Labour Commissioner, Jal5) Asst. Labour Commissioner Apd & Birpara6) Super/Director of the respective
(L.S.G. / Private) Hospitals, Jalpaiguri
43 44
Family welfare centres in the district of Jalpaiguri Table 3.2 (Number)
Year/ Sub-division/ Family welfare centresC.D. Block/M Public Private Total
(1) (2) (3) (4)1999-00 527 - 5272000-01 527 - 5272001-02 527 - 5272002-03 527 - 5272003-04 527 - 527
Year 2003-04 : -Sadar Sub-division 221 - 221
Rajganj 49 - 49Jalpaiguri 59 - 59Jalpaiguri(M) 1 1Maynaguri 53 - 53Dhupguri 58 - 58Dhupguri(M) 1 - 1
Mal Sub-division 92 - 92Mal 55 - 55Mal(M) 1 - 1Metiali 11 - 11Nagrakata 25 - 25
Table 3.2(Concld.) (Number)Year/ Sub-division/ Family welfare centres
C.D. Block/M Public Private Total(1) (2) (3) (4)
Alipurduar Sub-division 214 - 214Kumargram 32 - 32Falakata 40 - 40Madarihat-Birpara 31 - 31Kalchini 36 - 36Alipurduar-I 37 - 37Alipurduar (M) 1 - 1Alipurduar-II 37 - 37
45 46
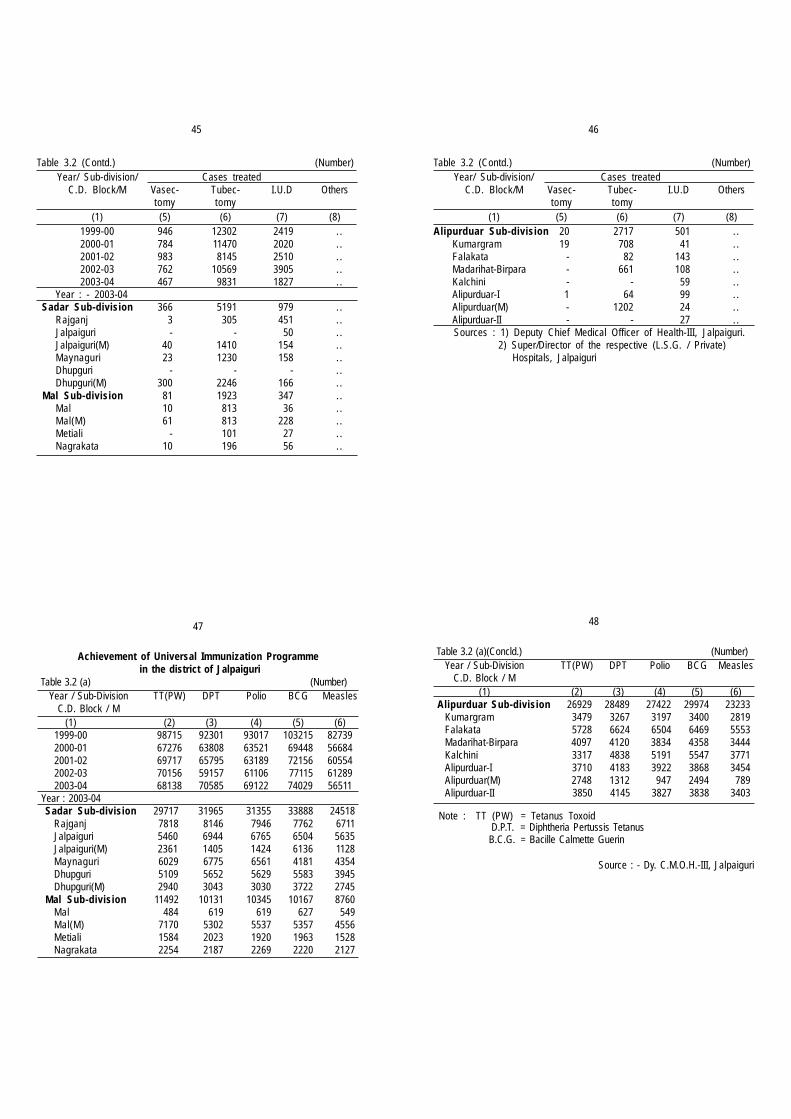
Table 3.2 (Contd.) (Number)Year/ Sub-division/ Cases treated
C.D. Block/M Vasec- Tubec- I.U.D Otherstomy tomy
(1) (5) (6) (7) (8)1999-00 946 12302 2419 . .2000-01 784 11470 2020 . .2001-02 983 8145 2510 . .2002-03 762 10569 3905 . .2003-04 467 9831 1827 . .
Year : - 2003-04 Sadar Sub-division 366 5191 979 . .
Rajganj 3 305 451 . .Jalpaiguri - - 50 . .Jalpaiguri(M) 40 1410 154 . .Maynaguri 23 1230 158 . .Dhupguri - - - . .Dhupguri(M) 300 2246 166 . .
Mal Sub-division 81 1923 347 . .Mal 10 813 36 . .Mal(M) 61 813 228 . .Metiali - 101 27 . .Nagrakata 10 196 56 . .
Table 3.2 (Contd.) (Number)Year/ Sub-division/ Cases treated
C.D. Block/M Vasec- Tubec- I.U.D Otherstomy tomy
(1) (5) (6) (7) (8)Alipurduar Sub-division 20 2717 501 . .
Kumargram 19 708 41 . .Falakata - 82 143 . .Madarihat-Birpara - 661 108 . .Kalchini - - 59 . .Alipurduar-I 1 64 99 . .Alipurduar(M) - 1202 24 . .Alipurduar-II - - 27 . .
Sources : 1) Deputy Chief Medical Officer of Health-III, Jalpaiguri. 2) Super/Director of the respective (L.S.G. / Private) Hospitals, Jalpaiguri
47
Achievement of Universal Immunization Programme in the district of Jalpaiguri
Table 3.2 (a) (Number)Year / Sub-Division TT(PW) DPT Polio BCG Measles
C.D. Block / M(1) (2) (3) (4) (5) (6)
1999-00 98715 92301 93017 103215 827392000-01 67276 63808 63521 69448 566842001-02 69717 65795 63189 72156 605542002-03 70156 59157 61106 77115 612892003-04 68138 70585 69122 74029 56511
Year : 2003-04Sadar Sub-division 29717 31965 31355 33888 24518
Rajganj 7818 8146 7946 7762 6711Jalpaiguri 5460 6944 6765 6504 5635Jalpaiguri(M) 2361 1405 1424 6136 1128Maynaguri 6029 6775 6561 4181 4354Dhupguri 5109 5652 5629 5583 3945Dhupguri(M) 2940 3043 3030 3722 2745
Mal Sub-division 11492 10131 10345 10167 8760Mal 484 619 619 627 549Mal(M) 7170 5302 5537 5357 4556Metiali 1584 2023 1920 1963 1528Nagrakata 2254 2187 2269 2220 2127
48
Table 3.2 (a)(Concld.) (Number)Year / Sub-Division TT(PW) DPT Polio BCG Measles
C.D. Block / M(1) (2) (3) (4) (5) (6)
Alipurduar Sub-division 26929 28489 27422 29974 23233Kumargram 3479 3267 3197 3400 2819Falakata 5728 6624 6504 6469 5553Madarihat-Birpara 4097 4120 3834 4358 3444Kalchini 3317 4838 5191 5547 3771Alipurduar-I 3710 4183 3922 3868 3454Alipurduar(M) 2748 1312 947 2494 789Alipurduar-II 3850 4145 3827 3838 3403
Note : TT (PW) = Tetanus Toxoid D.P.T. = Diphtheria Pertussis Tetanus B.C.G. = Bacille Calmette Guerin
Source : - Dy. C.M.O.H.-III, Jalpaiguri
49
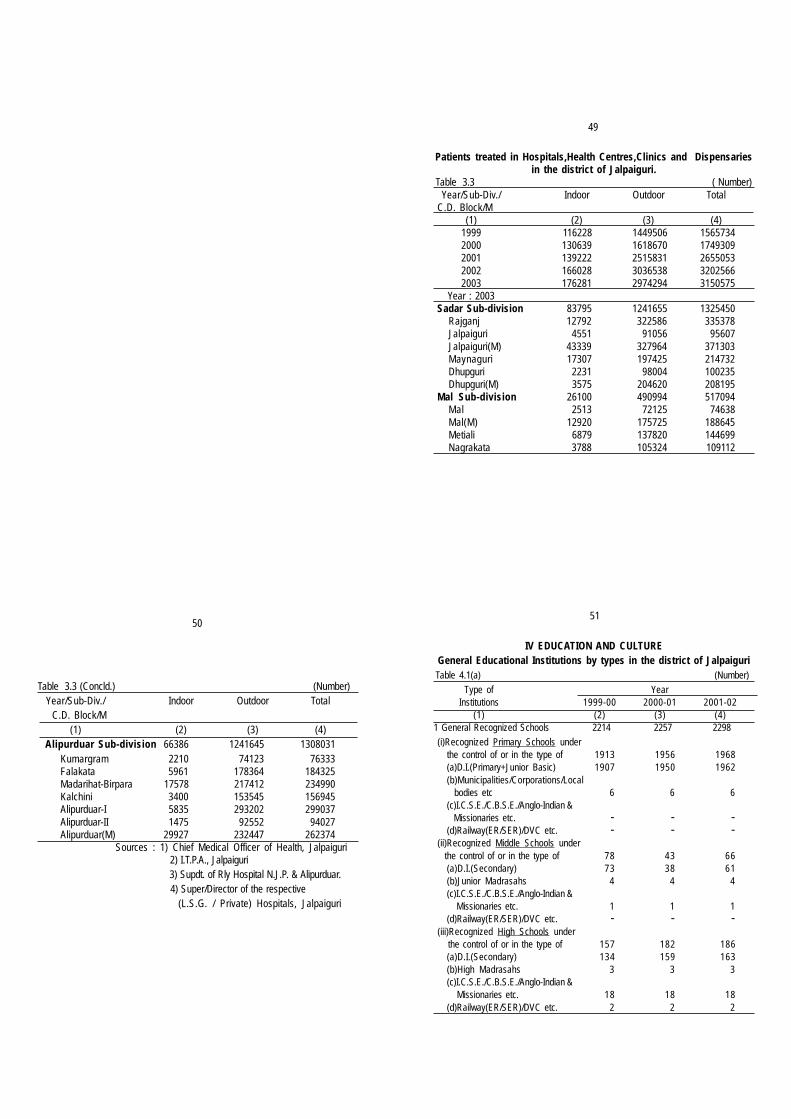
Patients treated in Hospitals,Health Centres,Clinics and Dispensariesin the district of Jalpaiguri.
Table 3.3 ( Number)Year/Sub-Div./ Indoor Outdoor Total
C.D. Block/M(1) (2) (3) (4)
1999 116228 1449506 15657342000 130639 1618670 17493092001 139222 2515831 26550532002 166028 3036538 32025662003 176281 2974294 3150575
Year : 2003Sadar Sub-division 83795 1241655 1325450
Rajganj 12792 322586 335378Jalpaiguri 4551 91056 95607Jalpaiguri(M) 43339 327964 371303Maynaguri 17307 197425 214732Dhupguri 2231 98004 100235Dhupguri(M) 3575 204620 208195
Mal Sub-division 26100 490994 517094Mal 2513 72125 74638Mal(M) 12920 175725 188645Metiali 6879 137820 144699Nagrakata 3788 105324 109112
50
Table 3.3 (Concld.) (Number)Year/Sub-Div./ Indoor Outdoor Total C.D. Block/M
(1) (2) (3) (4)Alipurduar Sub-division 66386 1241645 1308031
Kumargram 2210 74123 76333Falakata 5961 178364 184325Madarihat-Birpara 17578 217412 234990Kalchini 3400 153545 156945Alipurduar-I 5835 293202 299037Alipurduar-II 1475 92552 94027Alipurduar(M) 29927 232447 262374
Sources : 1) Chief Medical Officer of Health, Jalpaiguri 2) I.T.P.A., Jalpaiguri 3) Supdt. of Rly Hospital N.J.P. & Alipurduar.
4) Super/Director of the respective (L.S.G. / Private) Hospitals, Jalpaiguri
IV EDUCATION AND CULTUREGeneral Educational Institutions by types in the district of Jalpaiguri
Table 4.1(a) (Number)
Type of YearInstitutions 1999-00 2000-01 2001-02
(1) (2) (3) (4)1 General Recognized Schools 2214 2257 2298
(i)Recognized Primary Schools underthe control of or in the type of 1913 1956 1968(a)D.I.(Primary+Junior Basic) 1907 1950 1962(b)Municipalities/Corporations/Local bodies etc 6 6 6(c)I.C.S.E./C.B.S.E./Anglo-Indian & Missionaries etc. - - -(d)Railway(ER/SER)/DVC etc. - - -
(ii)Recognized Middle Schools under the control of or in the type of 78 43 66
(a)D.I.(Secondary) 73 38 61(b)Junior Madrasahs 4 4 4(c)I.C.S.E./C.B.S.E./Anglo-Indian &
Missionaries etc. 1 1 1(d)Railway(ER/SER)/DVC etc. - - -
(iii)Recognized High Schools under the control of or in the type of 157 182 186
(a)D.I.(Secondary) 134 159 163(b)High Madrasahs 3 3 3(c)I.C.S.E./C.B.S.E./Anglo-Indian & Missionaries etc. 18 18 18(d)Railway(ER/SER)/DVC etc. 2 2 2
51
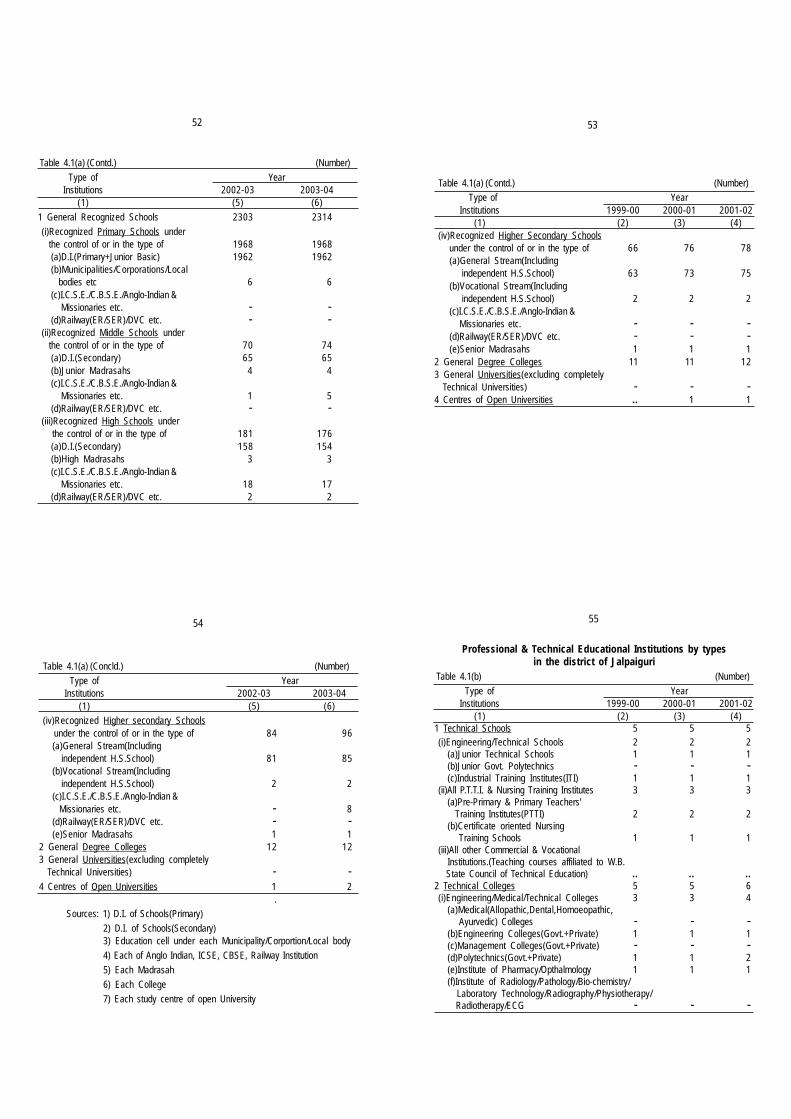
Table 4.1(a) (Contd.) (Number)
Type of YearInstitutions 2002-03 2003-04
(1) (5) (6)
1 General Recognized Schools 2303 2314
(i)Recognized Primary Schools under the control of or in the type of 1968 1968
(a)D.I.(Primary+Junior Basic) 1962 1962(b)Municipalities/Corporations/Local bodies etc 6 6(c)I.C.S.E./C.B.S.E./Anglo-Indian & Missionaries etc. - -(d)Railway(ER/SER)/DVC etc. - -
(ii)Recognized Middle Schools under the control of or in the type of 70 74
(a)D.I.(Secondary) 65 65(b)Junior Madrasahs 4 4(c)I.C.S.E./C.B.S.E./Anglo-Indian & Missionaries etc. 1 5(d)Railway(ER/SER)/DVC etc. - -
(iii)Recognized High Schools under the control of or in the type of 181 176
(a)D.I.(Secondary) 158 154(b)High Madrasahs 3 3(c)I.C.S.E./C.B.S.E./Anglo-Indian & Missionaries etc. 18 17(d)Railway(ER/SER)/DVC etc. 2 2
52 53
Table 4.1(a) (Contd.) (Number) Type of Year
Institutions 1999-00 2000-01 2001-02(1) (2) (3) (4)
(iv)Recognized Higher Secondary Schools under the control of or in the type of 66 76 78
(a)General Stream(Including independent H.S.School) 63 73 75(b)Vocational Stream(Including independent H.S.School) 2 2 2(c)I.C.S.E./C.B.S.E./Anglo-Indian & Missionaries etc. - - -(d)Railway(ER/SER)/DVC etc. - - -(e)Senior Madrasahs 1 1 1
2 General Degree Colleges 11 11 123 General Universities(excluding completely Technical Universities) - - -
4 Centres of Open Universities .. 1 1
54 55
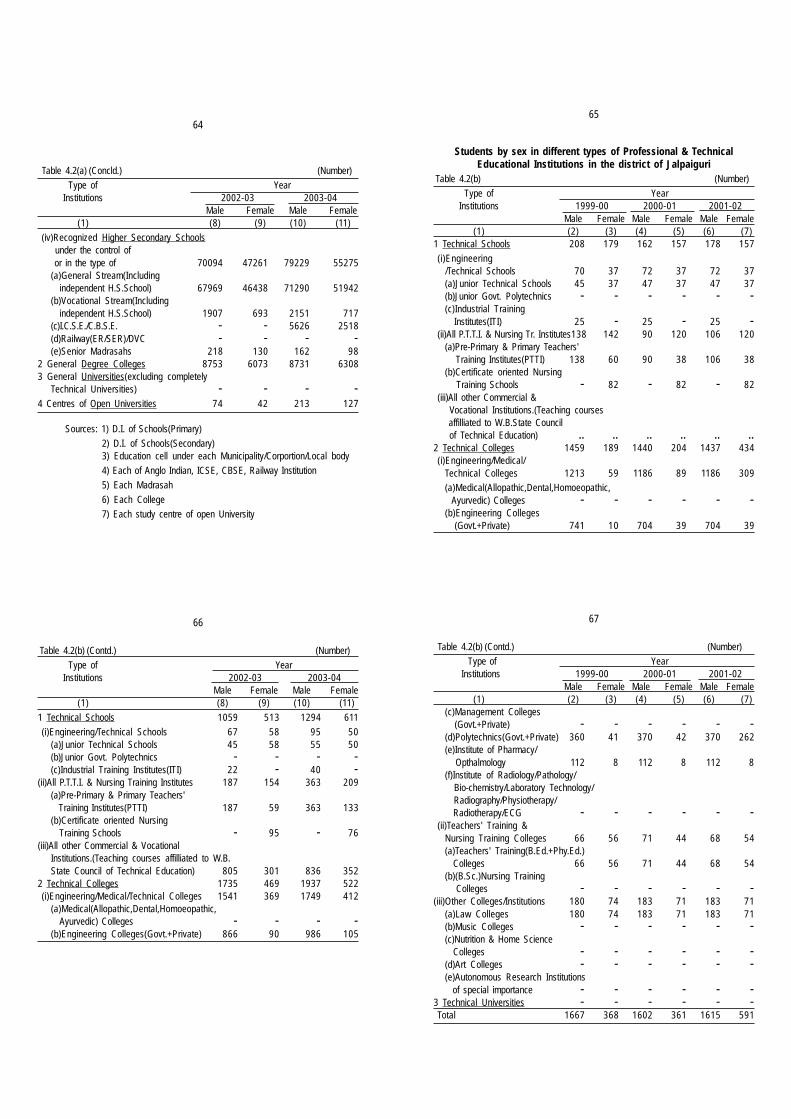
Professional & Technical Educational Institutions by typesin the district of Jalpaiguri
Table 4.1(b) (Number)
Type of YearInstitutions 1999-00 2000-01 2001-02
(1) (2) (3) (4)1 Technical Schools 5 5 5(i)Engineering/Technical Schools 2 2 2
(a)Junior Technical Schools 1 1 1(b)Junior Govt. Polytechnics - - -(c)Industrial Training Institutes(ITI) 1 1 1
(ii)All P.T.T.I. & Nursing Training Institutes 3 3 3(a)Pre-Primary & Primary Teachers' Training Institutes(PTTI) 2 2 2(b)Certificate oriented Nursing Training Schools 1 1 1
(iii)All other Commercial & VocationalInstitutions.(Teaching courses affiliated to W.B.
State Council of Technical Education) .. .. ..2 Technical Colleges 5 5 6(i)Engineering/Medical/Technical Colleges 3 3 4
(a)Medical(Allopathic,Dental,Homoeopathic, Ayurvedic) Colleges - - -(b)Engineering Colleges(Govt.+Private) 1 1 1(c)Management Colleges(Govt.+Private) - - -(d)Polytechnics(Govt.+Private) 1 1 2(e)Institute of Pharmacy/Opthalmology 1 1 1(f)Institute of Radiology/Pathology/Bio-chemistry/ Laboratory Technology/Radiography/Physiotherapy/ Radiotherapy/ECG - - -
Table 4.1(a) (Concld.) (Number)
Type of YearInstitutions 2002-03 2003-04
(1) (5) (6)(iv)Recognized Higher secondary Schools under the control of or in the type of 84 96
(a)General Stream(Including independent H.S.School) 81 85(b)Vocational Stream(Including independent H.S.School) 2 2(c)I.C.S.E./C.B.S.E./Anglo-Indian & Missionaries etc. - 8(d)Railway(ER/SER)/DVC etc. - -(e)Senior Madrasahs 1 1
2 General Degree Colleges 12 123 General Universities(excluding completely Technical Universities) - -
4 Centres of Open Universities 1 2 .
Sources: 1) D.I. of Schools(Primary)
2) D.I. of Schools(Secondary)3) Education cell under each Municipality/Corportion/Local body
4) Each of Anglo Indian, ICSE, CBSE, Railway Institution
5) Each Madrasah
6) Each College
7) Each study centre of open University

56
Table No. 4.1(b) (Contd.) (Number)
Type of YearInstitutions 2002-03 2003-04
(1) (5) (6)
1 Technical Schools 18 20
(i)Engineering/Technical Schools 2 2(a)Junior Technical Schools 1 1(b)Junior Govt. Polytechnics - -(c)Industrial Training Institutes(ITI) 1 1
(ii)All P.T.T.I. & Nursing Training Institutes 3 5(a)Pre-Primary & Primary Teachers' Training Institutes(PTTI) 2 4(b)Certificate oriented Nursing Training Schools 1 1
(iii)All other Commercial & VocationalInstitutions.(Teaching courses affilliated to W.B.
State Council of Technical Education) 13 132 Technical Colleges 6 6(i)Engineering/Medical/Technical Colleges 4 4
(a)Medical(Allopathic,Dental,Homoeopathic, Ayurvedic) Colleges - -(b)Engineering Colleges(Govt.+Private) 1 1(c)Management Colleges(Govt.+Private) - -(d)Polytechnics(Govt.+Private) 2 2(e)Institute of Pharmacy/Opthalmology 1 1(f)Institute of Radiology/Pathology/Bio-chemistry/ Laboratory Technology/Radiography/Physiotherapy/ Radiotherapy/ECG - -
57
Table 4.1(b) (Contd.) (Number)
Type of YearInstitutions 1999-00 2000.01 2001-02
(1) (2) (3) (4)(ii)Teachers' Training & Nursing Training Colleges 1 1 1
(a)Teachers' Training(B.Ed.+Phy.Ed.) Colleges 1 1 1(b)(B.Sc.)Nursing Training Colleges - - -
(iii)Other Colleges/Institutions 1 1 1(a)Law Colleges 1 1 1(b)Music Colleges - - -(c)Nutrition & Home Science Colleges - - --(d)Art Colleges - - -(e)Autonomous Research Institutions of special importance - - -3 Technical Universities - - -
Total 10 10 11
58
Table 4.1(b) (Concld.) (Number)
Type of YearInstitutions 2002-03 2003-04
(1) (5) (6)
(ii)Teachers' Training & Nursing Training Colleges 1 1
(a)Teachers' Training(B.Ed.+Phy.Ed.) Colleges 1 1
(b)(B.Sc.)Nursing Training Colleges independent H.S.School) - -
(iii)Other Colleges/Institutions 1 1(a)Law Colleges 1 1(b)Music Colleges - -(c)Nutrition & Home Science Colleges - -(d)Art Colleges - -(e)Autonomous Research Institutions of special importance - -
3 Technical Universities - -Total 24 26
Source: Head of all technical & professional Institutions, Jalpaiguri
Special and Non-formal Educational Institutions by typesin the district of Jalpaiguri
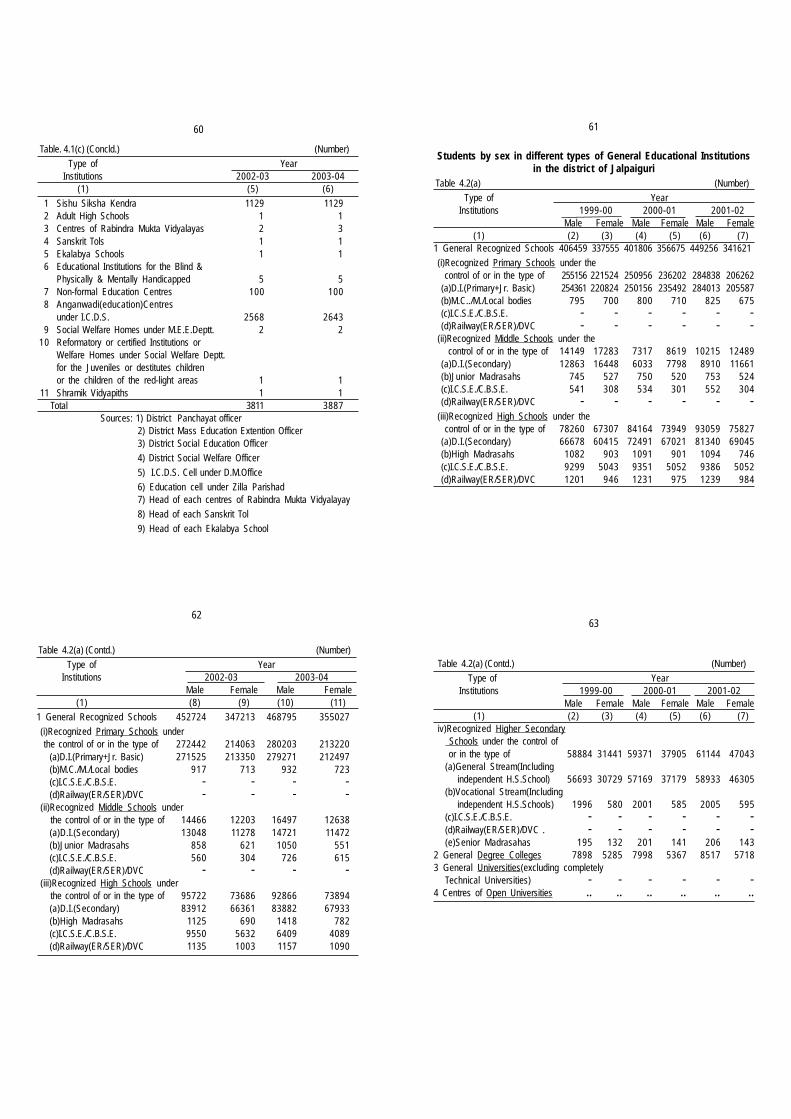
Table 4.1(c) (Number)
Type of YearInstitutions 1999-00 2000-01 2001-02
(1) (2) (3) (4)1 Sishu Siksha Kendra .. 931 9312 Adult High Schools 1 1 13 Centres of Rabindra Mukta Vidyalayas .. 2 24 Sanskrit Tols 1 1 15 Ekalabya Schools .. .. ..6 Educational Institutions for the Blind &
Physically & Mentally Handicapped 4 4 57 Non-formal Education Centres 50 100 1008 Anganwadi(education)Centres
under I.C.D.S. 2468 2564 25649 Social Welfare Homes under M.E.E.Deptt. 2 2 2
10 Reformatory or certified Institutions orWelfare Homes under Social Welfare Deptt.for the Juveniles or destitutes childrenor the children of the red-light areas 1 1 1
11 Shramik Vidyapiths 1 1 1Total 2528 3607 3608
59
60 61
62
Table 4.2(a) (Contd.) (Number)
Type of YearInstitutions 2002-03 2003-04
Male Female Male Female(1) (8) (9) (10) (11)
1 General Recognized Schools 452724 347213 468795 355027
(i)Recognized Primary Schools under the control of or in the type of 272442 214063 280203 213220
(a)D.I.(Primary+Jr. Basic) 271525 213350 279271 212497(b)M.C./M./Local bodies 917 713 932 723(c)I.C.S.E./C.B.S.E. - - - -(d)Railway(ER/SER)/DVC - - - -
(ii)Recognized Middle Schools under the control of or in the type of 14466 12203 16497 12638
(a)D.I.(Secondary) 13048 11278 14721 11472(b)Junior Madrasahs 858 621 1050 551(c)I.C.S.E./C.B.S.E. 560 304 726 615(d)Railway(ER/SER)/DVC - - - -
(iii)Recognized High Schools under the control of or in the type of 95722 73686 92866 73894
(a)D.I.(Secondary) 83912 66361 83882 67933(b)High Madrasahs 1125 690 1418 782(c)I.C.S.E./C.B.S.E. 9550 5632 6409 4089(d)Railway(ER/SER)/DVC 1135 1003 1157 1090
63
Table 4.2(a) (Contd.) (Number)
Type of YearInstitutions 1999-00 2000-01 2001-02
Male Female Male Female Male Female(1) (2) (3) (4) (5) (6) (7)
iv)Recognized Higher Secondary Schools under the control of or in the type of 58884 31441 59371 37905 61144 47043(a)General Stream(Including independent H.S.School) 56693 30729 57169 37179 58933 46305(b)Vocational Stream(Including independent H.S.Schools) 1996 580 2001 585 2005 595(c)I.C.S.E./C.B.S.E. - - - - - -(d)Railway(ER/SER)/DVC . - - - - - -(e)Senior Madrasahas 195 132 201 141 206 143
2 General Degree Colleges 7898 5285 7998 5367 8517 57183 General Universities(excluding completely
Technical Universities) - - - - - -4 Centres of Open Universities .. .. .. .. .. ..
Table. 4.1(c) (Concld.) (Number)
Type of YearInstitutions 2002-03 2003-04
(1) (5) (6)
1 Sishu Siksha Kendra 1129 11292 Adult High Schools 1 13 Centres of Rabindra Mukta Vidyalayas 2 34 Sanskrit Tols 1 15 Ekalabya Schools 1 16 Educational Institutions for the Blind &
Physically & Mentally Handicapped 5 57 Non-formal Education Centres 100 1008 Anganwadi(education)Centres
under I.C.D.S. 2568 26439 Social Welfare Homes under M.E.E.Deptt. 2 2
10 Reformatory or certified Institutions orWelfare Homes under Social Welfare Deptt.for the Juveniles or destitutes childrenor the children of the red-light areas 1 1
11 Shramik Vidyapiths 1 1 Total 3811 3887 Sources: 1) District Panchayat officer
2) District Mass Education Extention Officer3) District Social Education Officer
4) District Social Welfare Officer
5) I.C.D.S. Cell under D.M.Office
6) Education cell under Zilla Parishad7) Head of each centres of Rabindra Mukta Vidyalayay
8) Head of each Sanskrit Tol
9) Head of each Ekalabya School
Students by sex in different types of General Educational Institutionsin the district of Jalpaiguri
Table 4.2(a) (Number)
Type of YearInstitutions 1999-00 2000-01 2001-02
Male Female Male Female Male Female(1) (2) (3) (4) (5) (6) (7)
1 General Recognized Schools 406459 337555 401806 356675 449256 341621
(i)Recognized Primary Schools under the control of or in the type of 255156 221524 250956 236202 284838 206262(a)D.I.(Primary+Jr. Basic) 254361 220824 250156 235492 284013 205587(b)M.C../M./Local bodies 795 700 800 710 825 675(c)I.C.S.E./C.B.S.E. - - - - - -(d)Railway(ER/SER)/DVC - - - - - -
(ii)Recognized Middle Schools under the control of or in the type of 14149 17283 7317 8619 10215 12489(a)D.I.(Secondary) 12863 16448 6033 7798 8910 11661(b)Junior Madrasahs 745 527 750 520 753 524(c)I.C.S.E./C.B.S.E. 541 308 534 301 552 304(d)Railway(ER/SER)/DVC - - - - - -
(iii)Recognized High Schools under the control of or in the type of 78260 67307 84164 73949 93059 75827(a)D.I.(Secondary) 66678 60415 72491 67021 81340 69045(b)High Madrasahs 1082 903 1091 901 1094 746(c)I.C.S.E./C.B.S.E. 9299 5043 9351 5052 9386 5052(d)Railway(ER/SER)/DVC 1201 946 1231 975 1239 984
64
Table 4.2(a) (Concld.) (Number)
Type of YearInstitutions 2002-03 2003-04
Male Female Male Female(1) (8) (9) (10) (11)
(iv)Recognized Higher Secondary Schools under the control of or in the type of 70094 47261 79229 55275(a)General Stream(Including
independent H.S.School) 67969 46438 71290 51942(b)Vocational Stream(Including
independent H.S.School) 1907 693 2151 717(c)I.C.S.E./C.B.S.E. - - 5626 2518(d)Railway(ER/SER)/DVC - - - -(e)Senior Madrasahs 218 130 162 98
2 General Degree Colleges 8753 6073 8731 63083 General Universities(excluding completely
Technical Universities) - - - -4 Centres of Open Universities 74 42 213 127
Sources: 1) D.I. of Schools(Primary)
2) D.I. of Schools(Secondary)3) Education cell under each Municipality/Corportion/Local body
4) Each of Anglo Indian, ICSE, CBSE, Railway Institution
5) Each Madrasah
6) Each College
7) Each study centre of open University
65
Students by sex in different types of Professional & TechnicalEducational Institutions in the district of Jalpaiguri
Table 4.2(b) (Number)
Type of YearInstitutions 1999-00 2000-01 2001-02
Male Female Male Female Male Female(1) (2) (3) (4) (5) (6) (7)
1 Technical Schools 208 179 162 157 178 157
(i)Engineering/Technical Schools 70 37 72 37 72 37(a)Junior Technical Schools 45 37 47 37 47 37(b)Junior Govt. Polytechnics - - - - - -(c)Industrial Training Institutes(ITI) 25 - 25 - 25 -
(ii)All P.T.T.I. & Nursing Tr. Institutes138 142 90 120 106 120(a)Pre-Primary & Primary Teachers' Training Institutes(PTTI) 138 60 90 38 106 38(b)Certificate oriented Nursing Training Schools - 82 - 82 - 82
(iii)All other Commercial & Vocational Institutions.(Teaching courses affilliated to W.B.State Council of Technical Education) .. .. .. .. .. ..
2 Technical Colleges 1459 189 1440 204 1437 434(i)Engineering/Medical/
Technical Colleges 1213 59 1186 89 1186 309(a)Medical(Allopathic,Dental,Homoeopathic,
Ayurvedic) Colleges - - - - - -(b)Engineering Colleges (Govt.+Private) 741 10 704 39 704 39
66
Table 4.2(b) (Contd.) (Number)
Type of YearInstitutions 2002-03 2003-04
Male Female Male Female(1) (8) (9) (10) (11)
1 Technical Schools 1059 513 1294 611
(i)Engineering/Technical Schools 67 58 95 50(a)Junior Technical Schools 45 58 55 50(b)Junior Govt. Polytechnics - - - -(c)Industrial Training Institutes(ITI) 22 - 40 -
(ii)All P.T.T.I. & Nursing Training Institutes 187 154 363 209(a)Pre-Primary & Primary Teachers'
Training Institutes(PTTI) 187 59 363 133(b)Certificate oriented Nursing
Training Schools - 95 - 76(iii)All other Commercial & Vocational
Institutions.(Teaching courses affilliated to W.B.State Council of Technical Education) 805 301 836 352
2 Technical Colleges 1735 469 1937 522(i)Engineering/Medical/Technical Colleges 1541 369 1749 412
(a)Medical(Allopathic,Dental,Homoeopathic, Ayurvedic) Colleges - - - -
(b)Engineering Colleges(Govt.+Private) 866 90 986 105
67
Table 4.2(b) (Contd.) (Number)
Type of Year Institutions 1999-00 2000-01 2001-02
Male Female Male Female Male Female(1) (2) (3) (4) (5) (6) (7)
(c)Management Colleges (Govt.+Private) - - - - - -(d)Polytechnics(Govt.+Private) 360 41 370 42 370 262(e)Institute of Pharmacy/ Opthalmology 112 8 112 8 112 8(f)Institute of Radiology/Pathology/ Bio-chemistry/Laboratory Technology/
Radiography/Physiotherapy/ Radiotherapy/ECG - - - - - -
(ii)Teachers' Training &Nursing Training Colleges 66 56 71 44 68 54(a)Teachers' Training(B.Ed.+Phy.Ed.) Colleges 66 56 71 44 68 54(b)(B.Sc.)Nursing Training Colleges - - - - - -
(iii)Other Colleges/Institutions 180 74 183 71 183 71(a)Law Colleges 180 74 183 71 183 71(b)Music Colleges - - - - - -(c)Nutrition & Home Science Colleges - - - - - -(d)Art Colleges - - - - - -(e)Autonomous Research Institutions of special importance - - - - - -
3 Technical Universities - - - - - -Total 1667 368 1602 361 1615 591
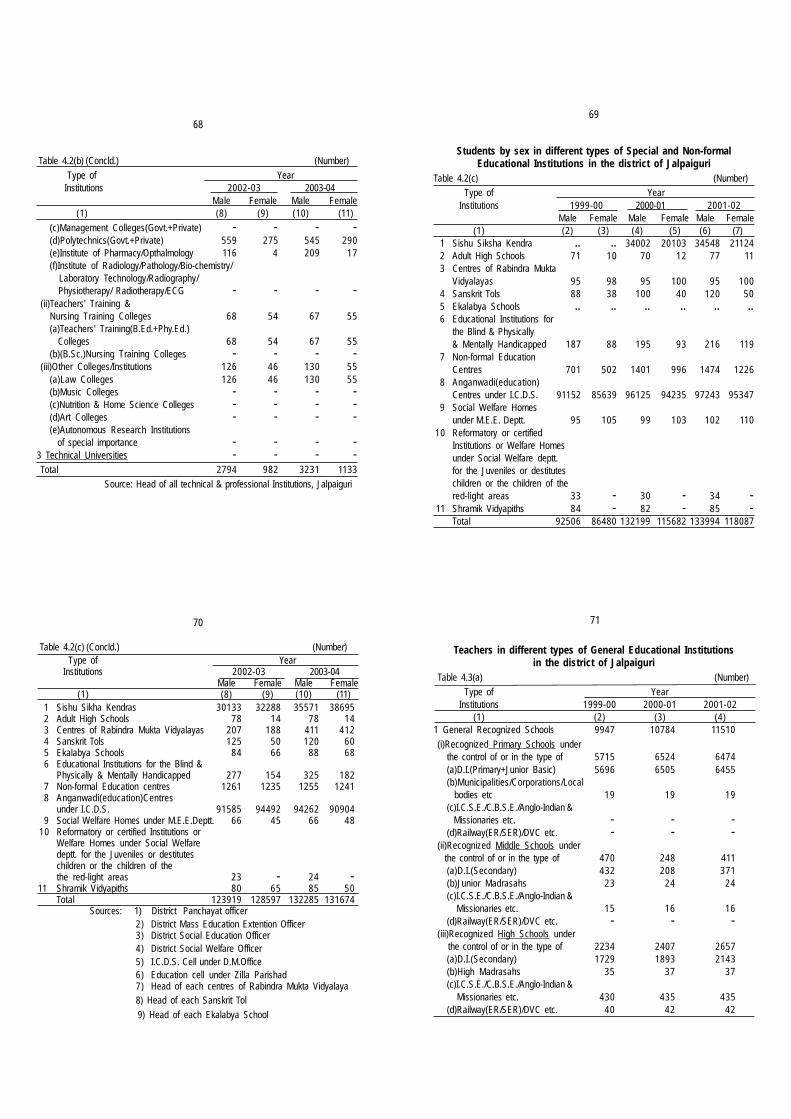
68
Table 4.2(b) (Concld.) (Number)
Type of Year Institutions 2002-03 2003-04
Male Female Male Female(1) (8) (9) (10) (11)
(c)Management Colleges(Govt.+Private) - - - -(d)Polytechnics(Govt.+Private) 559 275 545 290(e)Institute of Pharmacy/Opthalmology 116 4 209 17(f)Institute of Radiology/Pathology/Bio-chemistry/ Laboratory Technology/Radiography/
Physiotherapy/ Radiotherapy/ECG - - - -(ii)Teachers' Training &
Nursing Training Colleges 68 54 67 55(a)Teachers' Training(B.Ed.+Phy.Ed.) Colleges 68 54 67 55(b)(B.Sc.)Nursing Training Colleges - - - -
(iii)Other Colleges/Institutions 126 46 130 55(a)Law Colleges 126 46 130 55(b)Music Colleges - - - -(c)Nutrition & Home Science Colleges - - - -(d)Art Colleges - - - -(e)Autonomous Research Institutions of special importance - - - -
3 Technical Universities - - - -Total 2794 982 3231 1133
Source: Head of all technical & professional Institutions, Jalpaiguri
69
Students by sex in different types of Special and Non-formalEducational Institutions in the district of Jalpaiguri
Table 4.2(c) (Number)Type of Year
Institutions 1999-00 2000-01 2001-02Male Female Male Female Male Female
(1) (2) (3) (4) (5) (6) (7)1 Sishu Siksha Kendra .. .. 34002 20103 34548 211242 Adult High Schools 71 10 70 12 77 113 Centres of Rabindra Mukta
Vidyalayas 95 98 95 100 95 1004 Sanskrit Tols 88 38 100 40 120 505 Ekalabya Schools .. .. .. .. .. ..6 Educational Institutions for
the Blind & Physically& Mentally Handicapped 187 88 195 93 216 119
7 Non-formal EducationCentres 701 502 1401 996 1474 1226
8 Anganwadi(education)Centres under I.C.D.S. 91152 85639 96125 94235 97243 95347
9 Social Welfare Homesunder M.E.E. Deptt. 95 105 99 103 102 110
10 Reformatory or certifiedInstitutions or Welfare Homesunder Social Welfare deptt.for the Juveniles or destituteschildren or the children of thered-light areas 33 - 30 - 34 -
11 Shramik Vidyapiths 84 - 82 - 85 -Total 92506 86480 132199 115682 133994 118087
70 71
Teachers in different types of General Educational Institutionsin the district of Jalpaiguri
Table 4.3(a) (Number)
Type of YearInstitutions 1999-00 2000-01 2001-02
(1) (2) (3) (4)1 General Recognized Schools 9947 10784 11510
(i)Recognized Primary Schools underthe control of or in the type of 5715 6524 6474(a)D.I.(Primary+Junior Basic) 5696 6505 6455(b)Municipalities/Corporations/Local bodies etc 19 19 19(c)I.C.S.E./C.B.S.E./Anglo-Indian & Missionaries etc. - - -(d)Railway(ER/SER)/DVC etc. - - -
(ii)Recognized Middle Schools under the control of or in the type of 470 248 411
(a)D.I.(Secondary) 432 208 371(b)Junior Madrasahs 23 24 24(c)I.C.S.E./C.B.S.E./Anglo-Indian &
Missionaries etc. 15 16 16(d)Railway(ER/SER)/DVC etc. - - -
(iii)Recognized High Schools under the control of or in the type of 2234 2407 2657
(a)D.I.(Secondary) 1729 1893 2143(b)High Madrasahs 35 37 37(c)I.C.S.E./C.B.S.E./Anglo-Indian & Missionaries etc. 430 435 435(d)Railway(ER/SER)/DVC etc. 40 42 42
Table 4.2(c) (Concld.) (Number)Type of Year
Institutions 2002-03 2003-04Male Female Male Female
(1) (8) (9) (10) (11)1 Sishu Sikha Kendras 30133 32288 35571 386952 Adult High Schools 78 14 78 143 Centres of Rabindra Mukta Vidyalayas 207 188 411 4124 Sanskrit Tols 125 50 120 605 Ekalabya Schools 84 66 88 686 Educational Institutions for the Blind &
Physically & Mentally Handicapped 277 154 325 1827 Non-formal Education centres 1261 1235 1255 12418 Anganwadi(education)Centres
under I.C.D.S. 91585 94492 94262 909049 Social Welfare Homes under M.E.E.Deptt. 66 45 66 48
10 Reformatory or certified Institutions orWelfare Homes under Social Welfaredeptt. for the Juveniles or destituteschildren or the children of thethe red-light areas 23 - 24 -
11 Shramik Vidyapiths 80 65 85 50Total 123919 128597 132285 131674
Sources: 1) District Panchayat officer2) District Mass Education Extention Officer3) District Social Education Officer4) District Social Welfare Officer5) I.C.D.S. Cell under D.M.Office6) Education cell under Zilla Parishad7) Head of each centres of Rabindra Mukta Vidyalaya8) Head of each Sanskrit Tol
9) Head of each Ekalabya School

72
Table 4.3(a) (Contd.) (Number)Type of Year
Institutions 2002-03 2003-04(1) (5) (6)
1 General Recognized Schools 11096 11758(i)Recognized Primary Schools under the control of or in the type of 6241 6855
(a)D.I.(Primary+Junior Basic) 6222 6835(b)Municipalities/Corporations/Local bodies etc 19 20(c)I.C.S.E./C.B.S.E./Anglo-Indian & Missionaries etc. - -(d)Railway(ER/SER)/DVC etc. - -
(ii)Recognized Middle Schools under the control of or in the type of 349 402
(a)D.I.(Secondary) 309 332(b)Junior Madrasahs 24 24(c)I.C.S.E./C.B.S.E./Anglo-Indian & Missionaries etc. 16 46(d)Railway(ER/SER)/DVC etc. - -
(iii)Recognized High Schools under the control of or in the type of 2596 2336
(a)D.I.(Secondary) 2029 1817(b)High Madrasahs 38 36(c)I.C.S.E./C.B.S.E./Anglo-Indian & Missionaries etc. 477 431(d)Railway(ER/SER)/DVC etc. 52 52
73
Table 4.3(a) (Contd.) (Number)
Type of YearInstitutions 1999-00 2000-01 2001-02
(1) (2) (3) (4)(iv)Recognized Higher Secondary Schools under the control of or in the type of 1528 1605 1968
(a)General Stream(Including independent H.S.School) 1468 1541 1904(b)Vocational Stream(Including independent H.S.School) 47 50 50(c)I.C.S.E./C.B.S.E./Anglo-Indian & Missionaries etc. - - -(d)Railway(ER/SER)/DVC etc. - - -(e)Senior Madrashas 13 14 14
2 General Degree Colleges 207 194 1843 General Universities(excluding Technical Universities) - - -
4 Centres of Open Universities .. 19 19
74
Table 4.3(a) (Concld.) (Number)
Type of YearInstitutions 2002-03 2003-04
(1) (5) (6)
(iv)Recognized Higher Secondary Schools under the control of or in the type of 1910 2165
(a)General Stream(Including independent H.S.School) 1840 1843(b)Vocational Stream(Including independent H.S.School) 55 49(c)I.C.S.E./C.B.S.E./Anglo-Indian & Missionaries etc. - 259(d)Railway(ER/SER)/DVC etc. - -(e)Senior Madrasahs 15 14
2 General Degree Colleges 186 1663 General Universities(excluding Technical Universities) - -
4 Centres of Open Universities 19 37Sources: 1) D.I. of Schools(Primary)
2) D.I. of Schools(Secondary)3) Education cell under each Municipality/Corportion/Local body
4) Each of Anglo Indian, ICSE, CBSE, Railway Institution
5) Each Madrasah
6) Each College7) Each study centre of open University
75
Teachers in different types of Professional & Technical EducationalInstitutions in the district of Jalpaiguri
Table 4.3(b) (Number)
Type of YearInstitutions 1999-00 2000-01 2001-02
(1) (2) (3) (4)1 Technical Schools 38 45 51(i)Engineering/Technical Schools 13 14 14
(a)Junior Technical Schools 11 12 12(b)Junior Govt. Polytechnics - - -(c)Industrial Training Institutes(ITI) 2 2 2
(ii)All P.T.T.I. & Nursing Training Institutes 25 31 37(a)Pre-Primary & Primary Teachers' Training Institutes(PTTI) 14 20 26(b)Certificate oriented Nursing Training Schools 11 11 11
(iii)All other Commercial & VocationalInstitutions.(Teaching courses affilliated to W.B.
State Council of Technical Education) .. .. ..2 Technical Colleges 123 130 163(i)Engineering/Medical/Technical Colleges 100 108 135
(a)Medical(Allopathic,Dental,Homoeopathic, Ayurvedic) Colleges - - -(b)Engineering Colleges(Govt.+Private) 50 58 58(c)Management Colleges(Govt.+Private) - - -(d)Polytechnics(Govt.+Private) 42 42 69(e)Institute of Pharmacy/Opthalmology 8 8 8(f)Institute of Radiology/Pathology/Bio-chemistry/ Laboratory Technology/Radiography/Physiotherapy/ Radiotherapy/ECG - - -
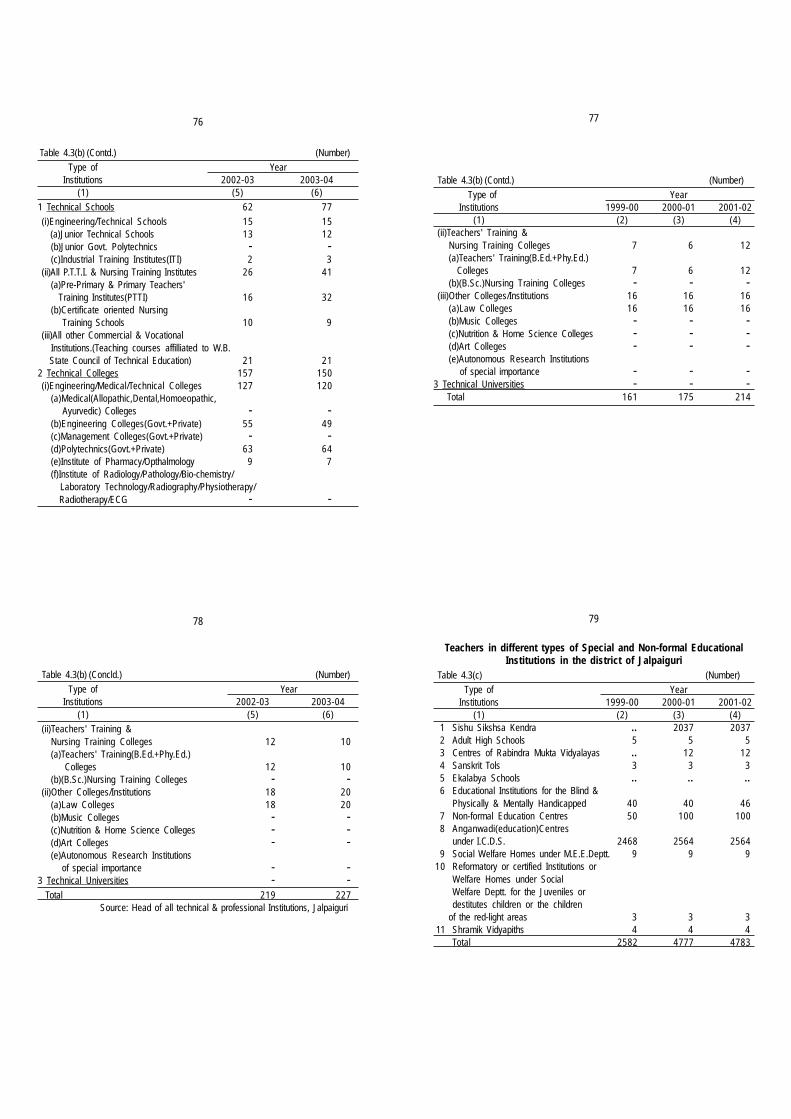
76
Table 4.3(b) (Contd.) (Number)
Type of YearInstitutions 2002-03 2003-04
(1) (5) (6)
1 Technical Schools 62 77
(i)Engineering/Technical Schools 15 15 (a)Junior Technical Schools 13 12
(b)Junior Govt. Polytechnics - -(c)Industrial Training Institutes(ITI) 2 3
(ii)All P.T.T.I. & Nursing Training Institutes 26 41(a)Pre-Primary & Primary Teachers' Training Institutes(PTTI) 16 32(b)Certificate oriented Nursing Training Schools 10 9
(iii)All other Commercial & VocationalInstitutions.(Teaching courses affilliated to W.B.
State Council of Technical Education) 21 212 Technical Colleges 157 150(i)Engineering/Medical/Technical Colleges 127 120
(a)Medical(Allopathic,Dental,Homoeopathic, Ayurvedic) Colleges - -(b)Engineering Colleges(Govt.+Private) 55 49(c)Management Colleges(Govt.+Private) - -(d)Polytechnics(Govt.+Private) 63 64(e)Institute of Pharmacy/Opthalmology 9 7(f)Institute of Radiology/Pathology/Bio-chemistry/ Laboratory Technology/Radiography/Physiotherapy/ Radiotherapy/ECG - -
77
Table 4.3(b) (Contd.) (Number)
Type of YearInstitutions 1999-00 2000-01 2001-02
(1) (2) (3) (4)(ii)Teachers' Training &
Nursing Training Colleges 7 6 12(a)Teachers' Training(B.Ed.+Phy.Ed.) Colleges 7 6 12(b)(B.Sc.)Nursing Training Colleges - - -
(iii)Other Colleges/Institutions 16 16 16(a)Law Colleges 16 16 16(b)Music Colleges - - -(c)Nutrition & Home Science Colleges - - -(d)Art Colleges - - -(e)Autonomous Research Institutions of special importance - - -
3 Technical Universities - - - Total 161 175 214
78
Table 4.3(b) (Concld.) (Number)
Type of YearInstitutions 2002-03 2003-04
(1) (5) (6)(ii)Teachers' Training &
Nursing Training Colleges 12 10(a)Teachers' Training(B.Ed.+Phy.Ed.)
Colleges 12 10(b)(B.Sc.)Nursing Training Colleges - -
(ii)Other Colleges/Institutions 18 20(a)Law Colleges 18 20(b)Music Colleges - -(c)Nutrition & Home Science Colleges - -(d)Art Colleges - -(e)Autonomous Research Institutions of special importance - -
3 Technical Universities - - Total 219 227 Source: Head of all technical & professional Institutions, Jalpaiguri
79
Teachers in different types of Special and Non-formal EducationalInstitutions in the district of Jalpaiguri
Table 4.3(c) (Number)
Type of YearInstitutions 1999-00 2000-01 2001-02
(1) (2) (3) (4)1 Sishu Sikshsa Kendra .. 2037 20372 Adult High Schools 5 5 53 Centres of Rabindra Mukta Vidyalayas .. 12 124 Sanskrit Tols 3 3 35 Ekalabya Schools .. .. ..6 Educational Institutions for the Blind &
Physically & Mentally Handicapped 40 40 467 Non-formal Education Centres 50 100 1008 Anganwadi(education)Centres
under I.C.D.S. 2468 2564 25649 Social Welfare Homes under M.E.E.Deptt. 9 9 9
10 Reformatory or certified Institutions orWelfare Homes under SocialWelfare Deptt. for the Juveniles ordestitutes children or the children
of the red-light areas 3 3 311 Shramik Vidyapiths 4 4 4
Total 2582 4777 4783
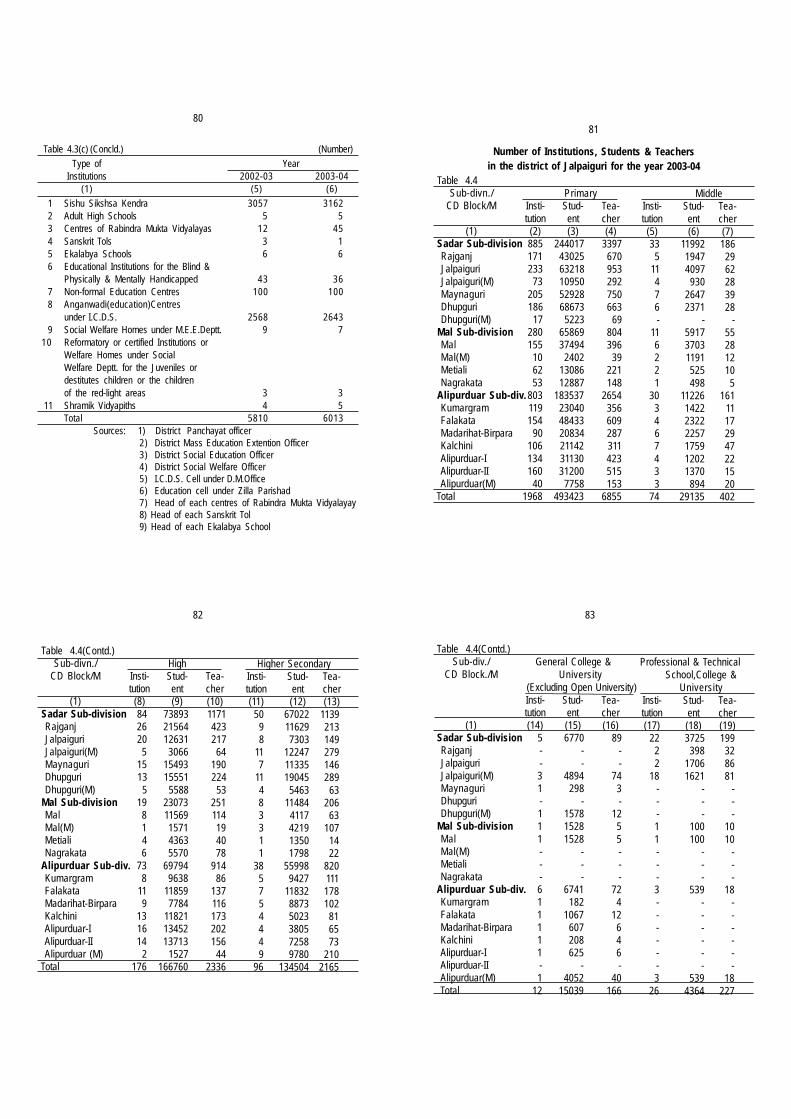
8081
Number of Institutions, Students & Teachersin the district of Jalpaiguri for the year 2003-04
Table 4.4Sub-divn./ Primary Middle
CD Block/M Insti- Stud- Tea- Insti- Stud- Tea-tution ent cher tution ent cher
(1) (2) (3) (4) (5) (6) (7) Sadar Sub-division 885 244017 3397 33 11992 186
Rajganj 171 43025 670 5 1947 29Jalpaiguri 233 63218 953 11 4097 62Jalpaiguri(M) 73 10950 292 4 930 28Maynaguri 205 52928 750 7 2647 39Dhupguri 186 68673 663 6 2371 28Dhupguri(M) 17 5223 69 - - -
Mal Sub-division 280 65869 804 11 5917 55Mal 155 37494 396 6 3703 28Mal(M) 10 2402 39 2 1191 12Metiali 62 13086 221 2 525 10Nagrakata 53 12887 148 1 498 5
Alipurduar Sub-div. 803 183537 2654 30 11226 161Kumargram 119 23040 356 3 1422 11Falakata 154 48433 609 4 2322 17Madarihat-Birpara 90 20834 287 6 2257 29Kalchini 106 21142 311 7 1759 47Alipurduar-I 134 31130 423 4 1202 22Alipurduar-II 160 31200 515 3 1370 15Alipurduar(M) 40 7758 153 3 894 20
Total 1968 493423 6855 74 29135 402
82
Table 4.4(Contd.)Sub-divn./ High Higher Secondary
CD Block/M Insti- Stud- Tea- Insti- Stud- Tea-tution ent cher tution ent cher
(1) (8) (9) (10) (11) (12) (13) Sadar Sub-division 84 73893 1171 50 67022 1139
Rajganj 26 21564 423 9 11629 213Jalpaiguri 20 12631 217 8 7303 149Jalpaiguri(M) 5 3066 64 11 12247 279Maynaguri 15 15493 190 7 11335 146Dhupguri 13 15551 224 11 19045 289Dhupguri(M) 5 5588 53 4 5463 63
Mal Sub-division 19 23073 251 8 11484 206Mal 8 11569 114 3 4117 63Mal(M) 1 1571 19 3 4219 107Metiali 4 4363 40 1 1350 14Nagrakata 6 5570 78 1 1798 22
Alipurduar Sub-div. 73 69794 914 38 55998 820Kumargram 8 9638 86 5 9427 111Falakata 11 11859 137 7 11832 178Madarihat-Birpara 9 7784 116 5 8873 102Kalchini 13 11821 173 4 5023 81Alipurduar-I 16 13452 202 4 3805 65Alipurduar-II 14 13713 156 4 7258 73Alipurduar (M) 2 1527 44 9 9780 210
Total 176 166760 2336 96 134504 2165
83
Table 4.4(Contd.)Sub-div./ General College & Professional & Technical
CD Block./M University School,College & (Excluding Open University) University
Insti- Stud- Tea- Insti- Stud- Tea-tution ent cher tution ent cher
(1) (14) (15) (16) (17) (18) (19) Sadar Sub-division 5 6770 89 22 3725 199
Rajganj - - - 2 398 32Jalpaiguri - - - 2 1706 86Jalpaiguri(M) 3 4894 74 18 1621 81Maynaguri 1 298 3 - - -Dhupguri - - - - - -Dhupguri(M) 1 1578 12 - - -
Mal Sub-division 1 1528 5 1 100 10Mal 1 1528 5 1 100 10Mal(M) - - - - - -Metiali - - - - - -Nagrakata - - - - - -
Alipurduar Sub-div. 6 6741 72 3 539 18Kumargram 1 182 4 - - -Falakata 1 1067 12 - - -Madarihat-Birpara 1 607 6 - - -Kalchini 1 208 4 - - -Alipurduar-I 1 625 6 - - -Alipurduar-II - - - - - -Alipurduar(M) 1 4052 40 3 539 18Total 12 15039 166 26 4364 227
Table 4.3(c) (Concld.) (Number)
Type of YearInstitutions 2002-03 2003-04
(1) (5) (6)
1 Sishu Sikshsa Kendra 3057 31622 Adult High Schools 5 53 Centres of Rabindra Mukta Vidyalayas 12 454 Sanskrit Tols 3 15 Ekalabya Schools 6 66 Educational Institutions for the Blind &
Physically & Mentally Handicapped 43 367 Non-formal Education Centres 100 1008 Anganwadi(education)Centres
under I.C.D.S. 2568 26439 Social Welfare Homes under M.E.E.Deptt. 9 7
10 Reformatory or certified Institutions orWelfare Homes under SocialWelfare Deptt. for the Juveniles ordestitutes children or the childrenof the red-light areas 3 3
11 Shramik Vidyapiths 4 5Total 5810 6013
Sources: 1) District Panchayat officer2) District Mass Education Extention Officer3) District Social Education Officer4) District Social Welfare Officer5) I.C.D.S. Cell under D.M.Office6) Education cell under Zilla Parishad7) Head of each centres of Rabindra Mukta Vidyalayay8) Head of each Sanskrit Tol9) Head of each Ekalabya School
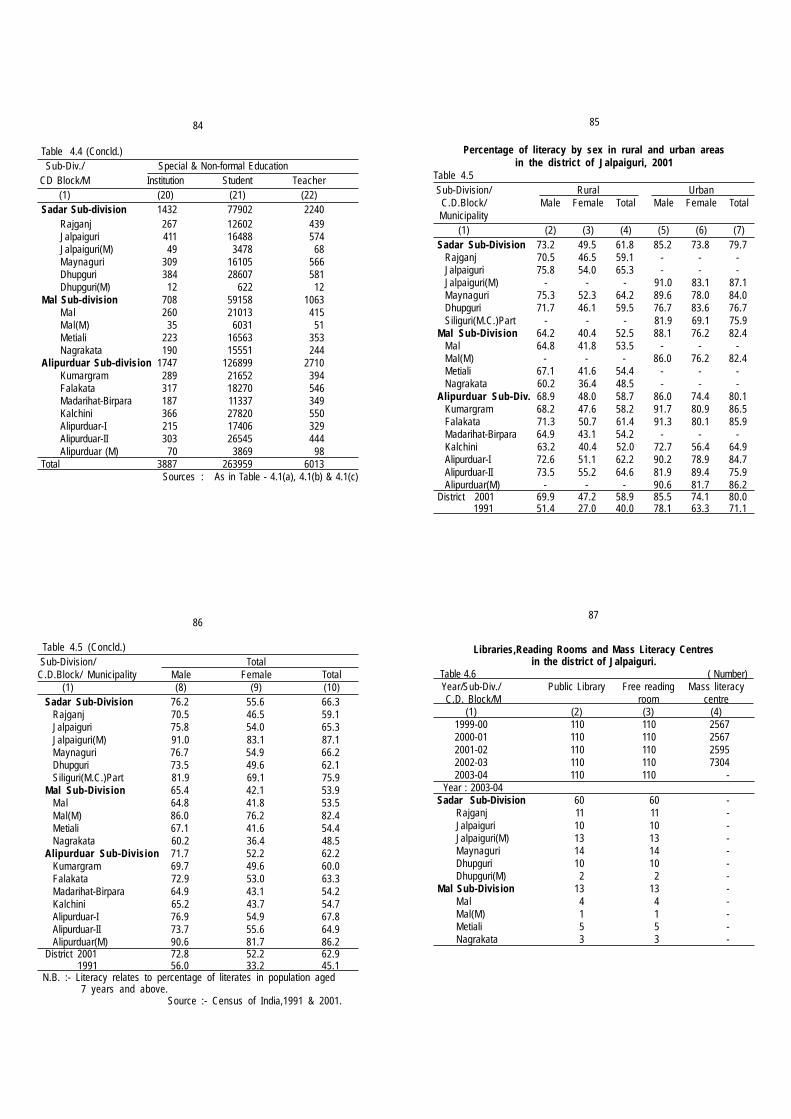
84
Table 4.4 (Concld.)Sub-Div./ Special & Non-formal Education
CD Block/M Institution Student Teacher(1) (20) (21) (22)
Sadar Sub-division 1432 77902 2240Rajganj 267 12602 439Jalpaiguri 411 16488 574Jalpaiguri(M) 49 3478 68Maynaguri 309 16105 566Dhupguri 384 28607 581Dhupguri(M) 12 622 12
Mal Sub-division 708 59158 1063Mal 260 21013 415Mal(M) 35 6031 51Metiali 223 16563 353Nagrakata 190 15551 244
Alipurduar Sub-division 1747 126899 2710Kumargram 289 21652 394Falakata 317 18270 546Madarihat-Birpara 187 11337 349Kalchini 366 27820 550Alipurduar-I 215 17406 329Alipurduar-II 303 26545 444Alipurduar (M) 70 3869 98
Total 3887 263959 6013 Sources : As in Table - 4.1(a), 4.1(b) & 4.1(c)
85
Percentage of literacy by sex in rural and urban areasin the district of Jalpaiguri, 2001
Table 4.5Sub-Division/ Rural Urban
C.D.Block/ Male Female Total Male Female TotalMunicipality
(1) (2) (3) (4) (5) (6) (7)Sadar Sub-Division 73.2 49.5 61.8 85.2 73.8 79.7
Rajganj 70.5 46.5 59.1 - - -Jalpaiguri 75.8 54.0 65.3 - - -Jalpaiguri(M) - - - 91.0 83.1 87.1Maynaguri 75.3 52.3 64.2 89.6 78.0 84.0Dhupguri 71.7 46.1 59.5 76.7 83.6 76.7Siliguri(M.C.)Part - - - 81.9 69.1 75.9
Mal Sub-Division 64.2 40.4 52.5 88.1 76.2 82.4Mal 64.8 41.8 53.5 - - -Mal(M) - - - 86.0 76.2 82.4Metiali 67.1 41.6 54.4 - - -Nagrakata 60.2 36.4 48.5 - - -
Alipurduar Sub-Div. 68.9 48.0 58.7 86.0 74.4 80.1Kumargram 68.2 47.6 58.2 91.7 80.9 86.5Falakata 71.3 50.7 61.4 91.3 80.1 85.9Madarihat-Birpara 64.9 43.1 54.2 - - -Kalchini 63.2 40.4 52.0 72.7 56.4 64.9Alipurduar-I 72.6 51.1 62.2 90.2 78.9 84.7Alipurduar-II 73.5 55.2 64.6 81.9 89.4 75.9Alipurduar(M) - - - 90.6 81.7 86.2
District 2001 69.9 47.2 58.9 85.5 74.1 80.0 1991 51.4 27.0 40.0 78.1 63.3 71.1
86
Table 4.5 (Concld.)Sub-Division/ Total
C.D.Block/ Municipality Male Female Total(1) (8) (9) (10)
Sadar Sub-Division 76.2 55.6 66.3Rajganj 70.5 46.5 59.1Jalpaiguri 75.8 54.0 65.3Jalpaiguri(M) 91.0 83.1 87.1Maynaguri 76.7 54.9 66.2Dhupguri 73.5 49.6 62.1Siliguri(M.C.)Part 81.9 69.1 75.9
Mal Sub-Division 65.4 42.1 53.9Mal 64.8 41.8 53.5Mal(M) 86.0 76.2 82.4Metiali 67.1 41.6 54.4Nagrakata 60.2 36.4 48.5
Alipurduar Sub-Division 71.7 52.2 62.2Kumargram 69.7 49.6 60.0Falakata 72.9 53.0 63.3Madarihat-Birpara 64.9 43.1 54.2Kalchini 65.2 43.7 54.7Alipurduar-I 76.9 54.9 67.8Alipurduar-II 73.7 55.6 64.9Alipurduar(M) 90.6 81.7 86.2
District 2001 72.8 52.2 62.9 1991 56.0 33.2 45.1 N.B. :- Literacy relates to percentage of literates in population aged
7 years and above. Source :- Census of India,1991 & 2001.
87
Libraries,Reading Rooms and Mass Literacy Centresin the district of Jalpaiguri.
Table 4.6 ( Number)Year/Sub-Div./ Public Library Free reading Mass literacy C.D. Block/M room centre
(1) (2) (3) (4)1999-00 110 110 25672000-01 110 110 25672001-02 110 110 25952002-03 110 110 73042003-04 110 110 -
Year : 2003-04 Sadar Sub-Division 60 60 -
Rajganj 11 11 -Jalpaiguri 10 10 -Jalpaiguri(M) 13 13 -Maynaguri 14 14 -Dhupguri 10 10 -Dhupguri(M) 2 2 -
Mal Sub-Division 13 13 -Mal 4 4 -Mal(M) 1 1 -Metiali 5 5 -Nagrakata 3 3 -
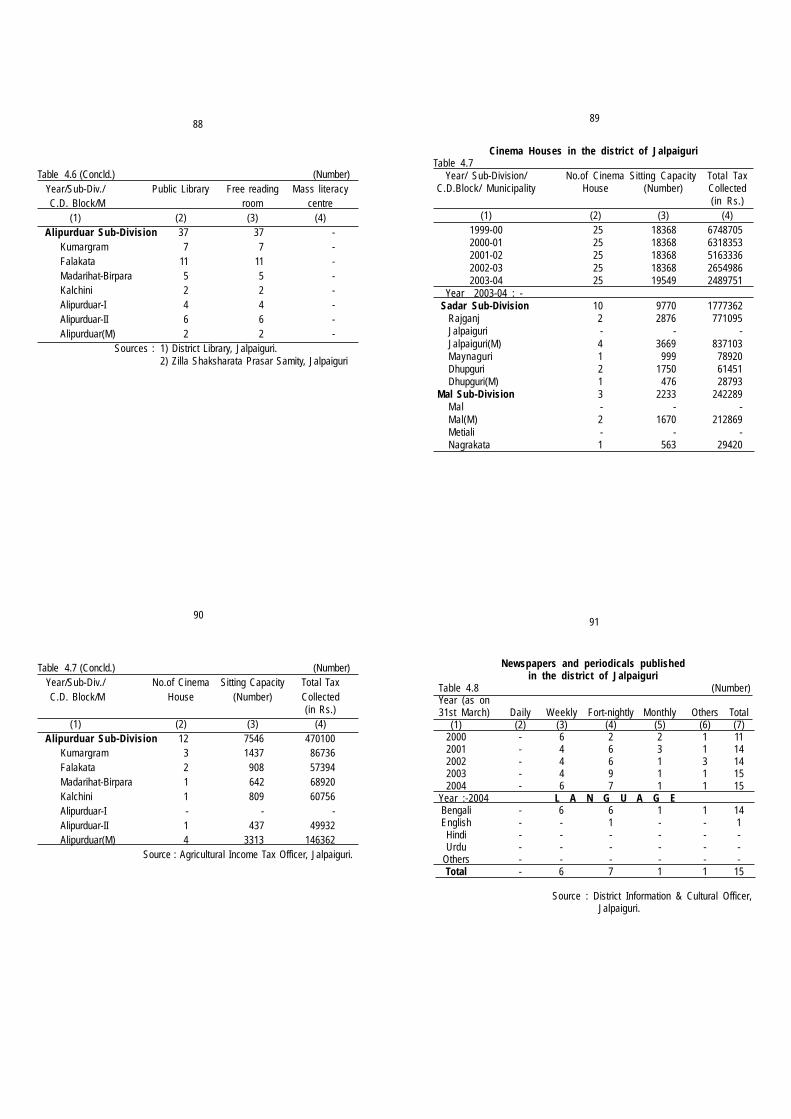
88
Table 4.6 (Concld.) (Number)Year/Sub-Div./ Public Library Free reading Mass literacy C.D. Block/M room centre
(1) (2) (3) (4)Alipurduar Sub-Division 37 37 -
Kumargram 7 7 -Falakata 11 11 -Madarihat-Birpara 5 5 -Kalchini 2 2 -Alipurduar-I 4 4 -Alipurduar-II 6 6 -Alipurduar(M) 2 2 -
Sources : 1) District Library, Jalpaiguri.2) Zilla Shaksharata Prasar Samity, Jalpaiguri
89
Cinema Houses in the district of JalpaiguriTable 4.7
Year/ Sub-Division/ No.of Cinema Sitting Capacity Total TaxC.D.Block/ Municipality House (Number) Collected
(in Rs.)(1) (2) (3) (4)
1999-00 25 18368 67487052000-01 25 18368 63183532001-02 25 18368 51633362002-03 25 18368 26549862003-04 25 19549 2489751
Year 2003-04 : -Sadar Sub-Division 10 9770 1777362
Rajganj 2 2876 771095Jalpaiguri - - -Jalpaiguri(M) 4 3669 837103Maynaguri 1 999 78920Dhupguri 2 1750 61451Dhupguri(M) 1 476 28793
Mal Sub-Division 3 2233 242289Mal - - -Mal(M) 2 1670 212869Metiali - - -Nagrakata 1 563 29420
90
Table 4.7 (Concld.) (Number)Year/Sub-Div./ No.of Cinema Sitting Capacity Total Tax C.D. Block/M House (Number) Collected
(in Rs.)(1) (2) (3) (4)
Alipurduar Sub-Division 12 7546 470100Kumargram 3 1437 86736Falakata 2 908 57394Madarihat-Birpara 1 642 68920Kalchini 1 809 60756Alipurduar-I - - -Alipurduar-II 1 437 49932Alipurduar(M) 4 3313 146362 Source : Agricultural Income Tax Officer, Jalpaiguri.
91
Newspapers and periodicals publishedin the district of Jalpaiguri
Table 4.8 (Number) Year (as on 31st March) Daily Weekly Fort-nightly Monthly Others Total
(1) (2) (3) (4) (5) (6) (7)2000 - 6 2 2 1 112001 - 4 6 3 1 142002 - 4 6 1 3 142003 - 4 9 1 1 152004 - 6 7 1 1 15
Year :-2004 L A N G U A G EBengali - 6 6 1 1 14English - - 1 - - 1
Hindi - - - - - -Urdu - - - - - -
Others - - - - - -Total - 6 7 1 1 15
Source : District Information & Cultural Officer, Jalpaiguri.
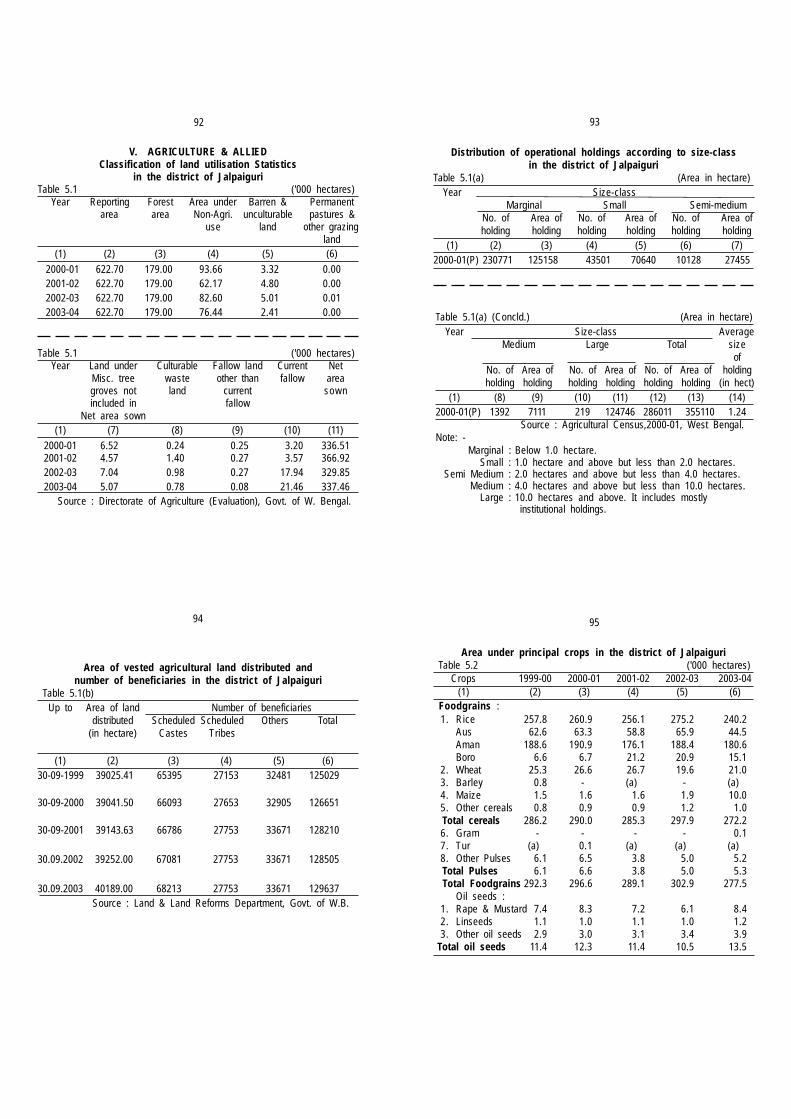
92 93
Table 5.1(a) (Concld.) (Area in hectare)Year Size-class Average
Medium Large Total sizeof
No. of Area of No. of Area of No. of Area of holdingholding holding holding holding holding holding (in hect)
(1) (8) (9) (10) (11) (12) (13) (14)2000-01(P) 1392 7111 219 124746 286011 355110 1.24 Source : Agricultural Census,2000-01, West Bengal.Note: -
Marginal : Below 1.0 hectare.Small : 1.0 hectare and above but less than 2.0 hectares.
Semi Medium : 2.0 hectares and above but less than 4.0 hectares.Medium : 4.0 hectares and above but less than 10.0 hectares.
Large : 10.0 hectares and above. It includes mostly institutional holdings.
Distribution of operational holdings according to size-classin the district of Jalpaiguri
Table 5.1(a) (Area in hectare)Year Size-class
Marginal Small Semi-mediumNo. of Area of No. of Area of No. of Area ofholding holding holding holding holding holding
(1) (2) (3) (4) (5) (6) (7)2000-01(P) 230771 125158 43501 70640 10128 27455
94 95
Area under principal crops in the district of Jalpaiguri Table 5.2 ('000 hectares)
Crops 1999-00 2000-01 2001-02 2002-03 2003-04(1) (2) (3) (4) (5) (6)
Foodgrains :1. Rice 257.8 260.9 256.1 275.2 240.2
Aus 62.6 63.3 58.8 65.9 44.5Aman 188.6 190.9 176.1 188.4 180.6Boro 6.6 6.7 21.2 20.9 15.1
2. Wheat 25.3 26.6 26.7 19.6 21.03. Barley 0.8 - (a) - (a)4. Maize 1.5 1.6 1.6 1.9 10.05. Other cereals 0.8 0.9 0.9 1.2 1.0
Total cereals 286.2 290.0 285.3 297.9 272.26. Gram - - - - 0.17. Tur (a) 0.1 (a) (a) (a)8. Other Pulses 6.1 6.5 3.8 5.0 5.2
Total Pulses 6.1 6.6 3.8 5.0 5.3 Total Foodgrains 292.3 296.6 289.1 302.9 277.5
Oil seeds :1. Rape & Mustard 7.4 8.3 7.2 6.1 8.42. Linseeds 1.1 1.0 1.1 1.0 1.23. Other oil seeds 2.9 3.0 3.1 3.4 3.9
Total oil seeds 11.4 12.3 11.4 10.5 13.5
Area of vested agricultural land distributed andnumber of beneficiaries in the district of Jalpaiguri
Table 5.1(b)Up to Area of land Number of beneficiaries
distributed Scheduled Scheduled Others Total(in hectare) Castes Tribes
(1) (2) (3) (4) (5) (6)30-09-1999 39025.41 65395 27153 32481 125029
30-09-2000 39041.50 66093 27653 32905 126651
30-09-2001 39143.63 66786 27753 33671 128210
30.09.2002 39252.00 67081 27753 33671 128505
30.09.2003 40189.00 68213 27753 33671 129637 Source : Land & Land Reforms Department, Govt. of W.B.
Table 5.1 ('000 hectares)Year Land under Culturable Fallow land Current Net
Misc. tree waste other than fallow areagroves not land current sownincluded in fallow
Net area sown(1) (7) (8) (9) (10) (11)
2000-01 6.52 0.24 0.25 3.20 336.512001-02 4.57 1.40 0.27 3.57 366.922002-03 7.04 0.98 0.27 17.94 329.852003-04 5.07 0.78 0.08 21.46 337.46
Source : Directorate of Agriculture (Evaluation), Govt. of W. Bengal.
V. AGRICULTURE & ALLIEDClassification of land utilisation Statistics
in the district of JalpaiguriTable 5.1 ('000 hectares)
Year Reporting Forest Area under Barren & Permanentarea area Non-Agri. unculturable pastures &
use land other grazingland
(1) (2) (3) (4) (5) (6)
2000-01 622.70 179.00 93.66 3.32 0.002001-02 622.70 179.00 62.17 4.80 0.002002-03 622.70 179.00 82.60 5.01 0.012003-04 622.70 179.00 76.44 2.41 0.00
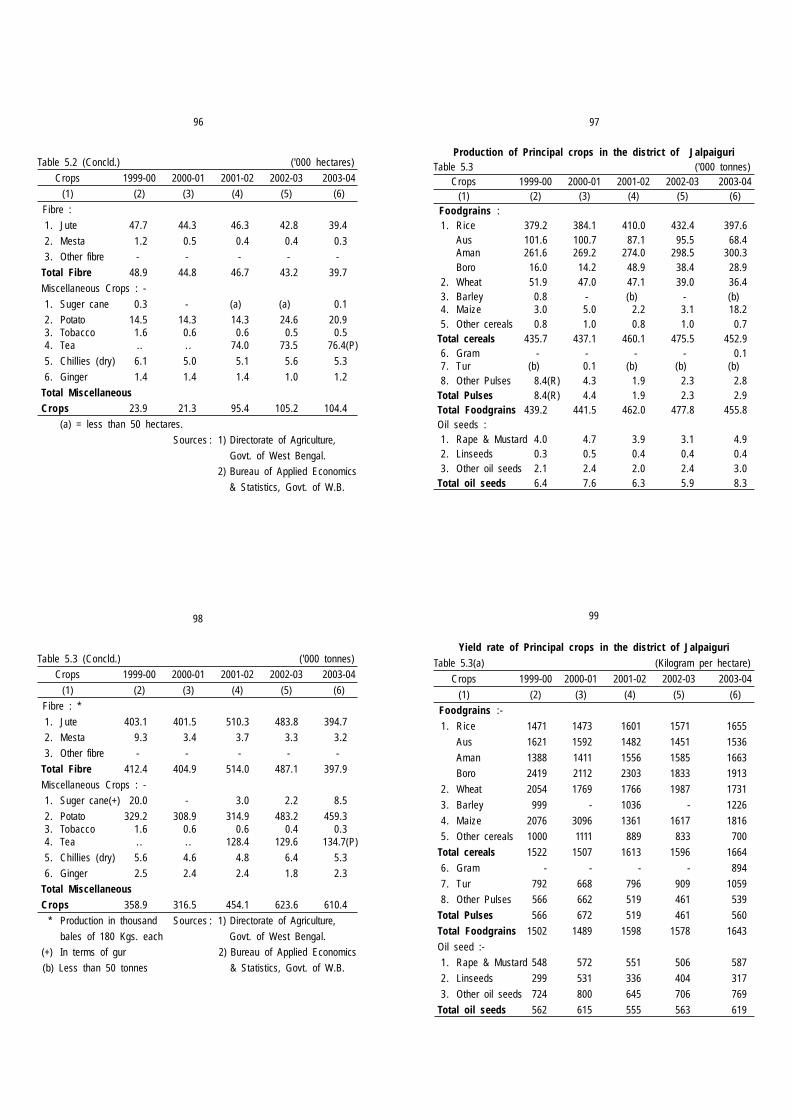
96
Table 5.2 (Concld.) ('000 hectares)
Crops 1999-00 2000-01 2001-02 2002-03 2003-04
(1) (2) (3) (4) (5) (6)
Fibre :
1. Jute 47.7 44.3 46.3 42.8 39.4
2. Mesta 1.2 0.5 0.4 0.4 0.3
3. Other fibre - - - - -
Total Fibre 48.9 44.8 46.7 43.2 39.7
Miscellaneous Crops : -
1. Suger cane 0.3 - (a) (a) 0.1
2. Potato 14.5 14.3 14.3 24.6 20.93. Tobacco 1.6 0.6 0.6 0.5 0.54. Tea .. . . 74.0 73.5 76.4(P)
5. Chillies (dry) 6.1 5.0 5.1 5.6 5.3
6. Ginger 1.4 1.4 1.4 1.0 1.2
Total MiscellaneousCrops 23.9 21.3 95.4 105.2 104.4
(a) = less than 50 hectares.
Sources : 1) Directorate of Agriculture,
Govt. of West Bengal.
2) Bureau of Applied Economics
& Statistics, Govt. of W.B.
97
Production of Principal crops in the district of JalpaiguriTable 5.3 ('000 tonnes)
Crops 1999-00 2000-01 2001-02 2002-03 2003-04(1) (2) (3) (4) (5) (6)
Foodgrains :1. Rice 379.2 384.1 410.0 432.4 397.6
Aus 101.6 100.7 87.1 95.5 68.4Aman 261.6 269.2 274.0 298.5 300.3Boro 16.0 14.2 48.9 38.4 28.9
2. Wheat 51.9 47.0 47.1 39.0 36.43. Barley 0.8 - (b) - (b)4. Maize 3.0 5.0 2.2 3.1 18.25. Other cereals 0.8 1.0 0.8 1.0 0.7
Total cereals 435.7 437.1 460.1 475.5 452.96. Gram - - - - 0.17. Tur (b) 0.1 (b) (b) (b)8. Other Pulses 8.4(R) 4.3 1.9 2.3 2.8
Total Pulses 8.4(R) 4.4 1.9 2.3 2.9Total Foodgrains 439.2 441.5 462.0 477.8 455.8Oil seeds :1. Rape & Mustard 4.0 4.7 3.9 3.1 4.92. Linseeds 0.3 0.5 0.4 0.4 0.43. Other oil seeds 2.1 2.4 2.0 2.4 3.0
Total oil seeds 6.4 7.6 6.3 5.9 8.3
98
Table 5.3 (Concld.) ('000 tonnes)
Crops 1999-00 2000-01 2001-02 2002-03 2003-04
(1) (2) (3) (4) (5) (6)
Fibre : *
1. Jute 403.1 401.5 510.3 483.8 394.7
2. Mesta 9.3 3.4 3.7 3.3 3.2
3. Other fibre - - - - -
Total Fibre 412.4 404.9 514.0 487.1 397.9
Miscellaneous Crops : -
1. Suger cane(+) 20.0 - 3.0 2.2 8.5
2. Potato 329.2 308.9 314.9 483.2 459.33. Tobacco 1.6 0.6 0.6 0.4 0.34. Tea . . . . 128.4 129.6 134.7(P)
5. Chillies (dry) 5.6 4.6 4.8 6.4 5.3
6. Ginger 2.5 2.4 2.4 1.8 2.3
Total MiscellaneousCrops 358.9 316.5 454.1 623.6 610.4
* Production in thousand Sources : 1) Directorate of Agriculture,
bales of 180 Kgs. each Govt. of West Bengal.
(+) In terms of gur 2) Bureau of Applied Economics
(b) Less than 50 tonnes & Statistics, Govt. of W.B.
99
Yield rate of Principal crops in the district of JalpaiguriTable 5.3(a) (Kilogram per hectare)
Crops 1999-00 2000-01 2001-02 2002-03 2003-04
(1) (2) (3) (4) (5) (6)
Foodgrains :-
1. Rice 1471 1473 1601 1571 1655
Aus 1621 1592 1482 1451 1536
Aman 1388 1411 1556 1585 1663
Boro 2419 2112 2303 1833 1913
2. Wheat 2054 1769 1766 1987 1731
3. Barley 999 - 1036 - 1226
4. Maize 2076 3096 1361 1617 1816
5. Other cereals 1000 1111 889 833 700
Total cereals 1522 1507 1613 1596 1664
6. Gram - - - - 894
7. Tur 792 668 796 909 1059
8. Other Pulses 566 662 519 461 539
Total Pulses 566 672 519 461 560
Total Foodgrains 1502 1489 1598 1578 1643
Oil seed :-
1. Rape & Mustard 548 572 551 506 587
2. Linseeds 299 531 336 404 317
3. Other oil seeds 724 800 645 706 769
Total oil seeds 562 615 555 563 619

100
Table 5.3(a)(Concld.) (Kilogram per hectare)
Crop 1999-00 2000-01 2001-02 2002-03 2003-04
(1) (2) (3) (4) (5) (6)
Fibre : * -
1. Jute 8.5 9.1 11.0 11.3 10.0
2. Mesta 7.6 7.4 8.8 8.7 9.9
3. Other fibre - - - - -
Total Fibres 8.4 9.0 11.0 11.3 10.0
Miscellaneous Crops : -
1. Sugercane 77529 - 83820 65748 74194
2. Potato 22718 21638 22040 19646 21946
3. Tobacco 999 994 993 820 679
4. Tea . . . . 1735 1763 1763
5. Chillies (dry) 916 921 934 1153 1000
6. Ginger 1730 1680 1680 1800 1885Total MiscellaneousCrops 15017 14859 4760 5928 5847
* In bales / hectare Sources: 1) Directorate of Agriculture,
Govt. of West Bengal.
2) Bureau of Applied Economics
& Statistics, Govt. of W.B.
101
Yield rate of some selected crops in the district of Jalpaiguri and West Bengal
Table 5.3(b) (Kilogram per hectare)Crops 1999-00 2000-01 2001-02 2002-03(P) 2003-04
Dist- West Dist- West Dist- West Dist- West Dist- West rict Bengal rict Bengal rict Bengal rict Bengal rict Bengal
(1) (2) (3) (4) (5) (6) (7) (8) (9) (10) (11)Rice 1471 2237 1473 2287 1601 2514 1571 2463 1655 2504Wheat 2054 2336 1769 2485 1766 2215 1987 2189 1731 2315Gram - 825 - 917 - 851 - 780 894 1026Jute 1530 2226 1638 2182 1980 2440 2034 2407 1800 2428Rape Seed &Mustard 548 805 572 956 551 766 506 805 587 928Potato 22718 23689 21638 26000 22040 26090 19646 19761 21946 24711Tea . . 1746 . . 1689 1735 1718 1763 1735 1763 1763
(E) (E) (P) (E)
Sources: 1) Bureau of Applied Economics & Statistics,
Government of West Bengal
2) Directorate of Agriculture,
Govt. of West Bengal.
3) Tea Board
Index number of Agricultural Area, Production & Productivityin the district of Jalpaiguri
Base : Triennium ending crop year 1981-82 = 100Table 5.3(c)
Year Area Production ProductivityCereals All Combined Cereals All Combined Cereals All Combined
(1) (2) (3) (4) (5) (6) (7)1999-00 98.90 104.79 237.39 184.87 240.03 176.42
2000-01 100.20 104.57 229.19 182.24 228.73 174.28
2001-02 98.58 103.15 413.81 257.68 419.77 249.81
2002-03 102.94 107.44(P) 367.11 251.16(P) 356.63 233.77(P)
2003-04 94.05 101.30(P) 309.67 228.31(P) 329.26 225.38(P) Source : Bureau of Applied Economics & Statistics Government of West Bengal.
102 103
Area and Production of Fruits and Vegetablesin the district of Jalpaiguri
Table 5.3(d)Name of Fruits/ Area
Vegetables ('000 hectares)1999-00 2000-01 2001-02 2002-03 2003-04
(1) (2) (3) (4) (5) (6)A. Fruits :
Mango . . 1.43 1.47 1.51 1.55Banana . . 1.96 2.05 2.11 2.19Pineapple . . 2.60 2.97 2.99 1.65Papaya . . 0.46 0.49 0.55 0.56Guava . . 0.27 0.29 0.52 0.53Jackfruit . . 1.48 1.49 1.50 1.52Litchi . . 0.28 0.33 0.35 0.26Mandarin Orange . . 0.04 0.05 0.05 0.05Other Citrus . . 0.64 0.66 0.69 0.68Sapota . . 0.07 0.15 0.17 0.18Others . . 0.10 0.17 0.14 0.15Total . . 9.33 10.12 10.58 9.32
B. Vegetables :Tomato . . 2.96 3.06 3.10 3.55Cabbage . . 2.80 2.89 3.40 4.40Cauliflower . . 2.12 2.20 4.31 4.31Peas . . 3.59 3.61 3.63 3.51Brinjal . . 7.73 7.74 8.57 9.61Onion . . 0.25 0.25 0.26 0.51Cucurbits . . 7.89 8.88 9.24 6.37Ladies Finger . . 2.45 2.65 2.93 4.30Radish . . 3.68 3.70 3.89 2.94Others . . 11.59 12.00 13.75 9.94Total . . 45.06 46.98 53.08 49.44
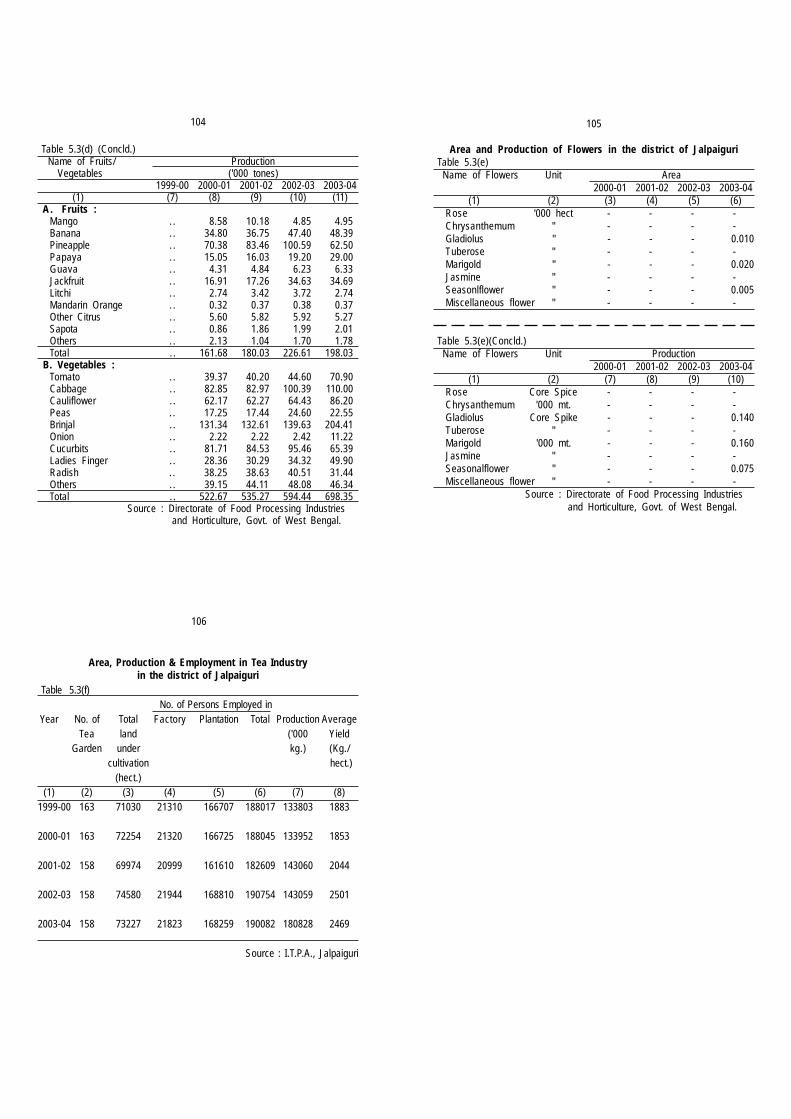
104
Table 5.3(d) (Concld.) Name of Fruits/ Production Vegetables ('000 tones)
1999-00 2000-01 2001-02 2002-03 2003-04 (1) (7) (8) (9) (10) (11)
A. Fruits :Mango . . 8.58 10.18 4.85 4.95Banana . . 34.80 36.75 47.40 48.39Pineapple . . 70.38 83.46 100.59 62.50Papaya . . 15.05 16.03 19.20 29.00Guava . . 4.31 4.84 6.23 6.33Jackfruit . . 16.91 17.26 34.63 34.69Litchi . . 2.74 3.42 3.72 2.74Mandarin Orange . . 0.32 0.37 0.38 0.37Other Citrus . . 5.60 5.82 5.92 5.27Sapota . . 0.86 1.86 1.99 2.01Others . . 2.13 1.04 1.70 1.78Total . . 161.68 180.03 226.61 198.03
B. Vegetables :Tomato . . 39.37 40.20 44.60 70.90Cabbage . . 82.85 82.97 100.39 110.00Cauliflower . . 62.17 62.27 64.43 86.20Peas . . 17.25 17.44 24.60 22.55Brinjal . . 131.34 132.61 139.63 204.41Onion . . 2.22 2.22 2.42 11.22Cucurbits . . 81.71 84.53 95.46 65.39Ladies Finger . . 28.36 30.29 34.32 49.90Radish . . 38.25 38.63 40.51 31.44Others . . 39.15 44.11 48.08 46.34Total . . 522.67 535.27 594.44 698.35
Source : Directorate of Food Processing Industries and Horticulture, Govt. of West Bengal.
106
Area, Production & Employment in Tea Industryin the district of Jalpaiguri
Table 5.3(f) No. of Persons Employed in
Year No. of Total Factory Plantation Total Production AverageTea land ('000 Yield
Garden under kg.) (Kg./cultivation hect.)
(hect.)(1) (2) (3) (4) (5) (6) (7) (8)
1999-00 163 71030 21310 166707 188017 133803 1883
2000-01 163 72254 21320 166725 188045 133952 1853
2001-02 158 69974 20999 161610 182609 143060 2044
2002-03 158 74580 21944 168810 190754 143059 2501
2003-04 158 73227 21823 168259 190082 180828 2469
Source : I.T.P.A., Jalpaiguri
105
Area and Production of Flowers in the district of JalpaiguriTable 5.3(e)
Name of Flowers Unit Area2000-01 2001-02 2002-03 2003-04
(1) (2) (3) (4) (5) (6)Rose '000 hect - - - -Chrysanthemum " - - - -Gladiolus " - - - 0.010Tuberose " - - - -Marigold " - - - 0.020Jasmine " - - - -Seasonlflower " - - - 0.005Miscellaneous flower " - - - -
Table 5.3(e)(Concld.)Name of Flowers Unit Production
2000-01 2001-02 2002-03 2003-04 (1) (2) (7) (8) (9) (10)
Rose Core Spice - - - -Chrysanthemum '000 mt. - - - -Gladiolus Core Spike - - - 0.140Tuberose " - - - -Marigold '000 mt. - - - 0.160Jasmine " - - - -Seasonalflower " - - - 0.075Miscellaneous flower " - - - - Source : Directorate of Food Processing Industries
and Horticulture, Govt. of West Bengal.
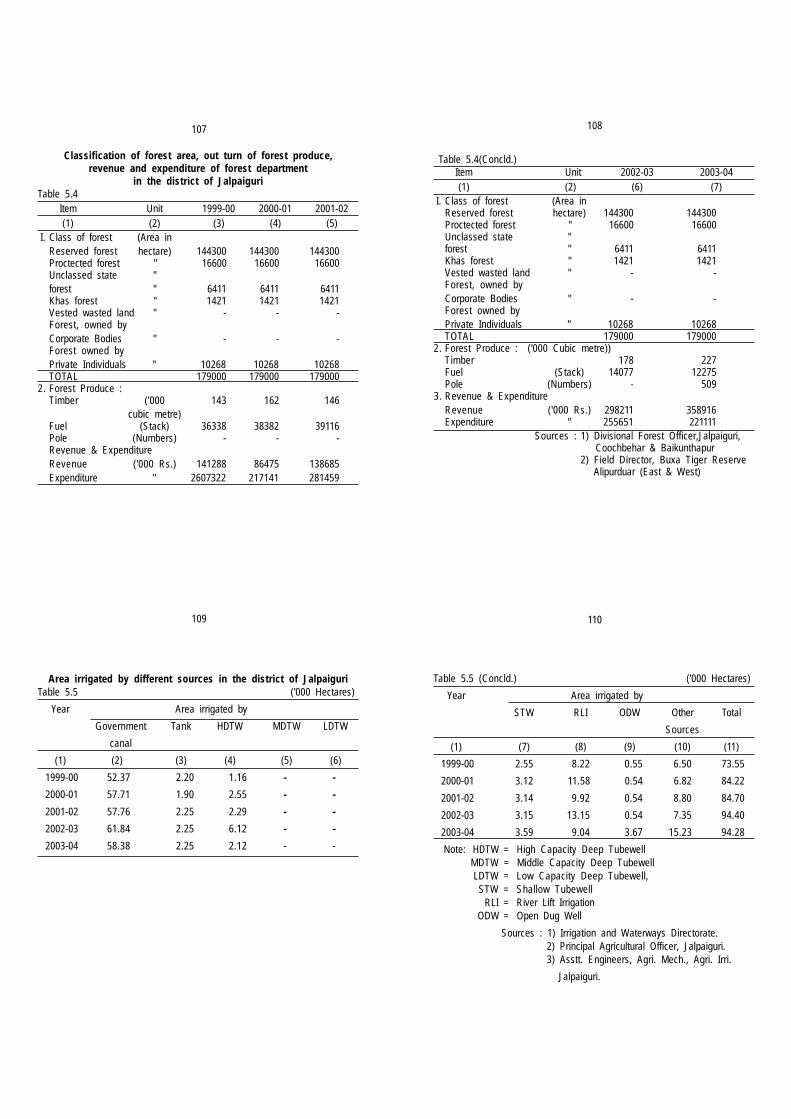
107 108
Table 5.4(Concld.)Item Unit 2002-03 2003-04(1) (2) (6) (7)
I. Class of forest (Area inReserved forest hectare) 144300 144300Proctected forest " 16600 16600Unclassed state "forest " 6411 6411Khas forest " 1421 1421Vested wasted land " - -Forest, owned byCorporate Bodies " - -Forest owned byPrivate Individuals " 10268 10268TOTAL 179000 179000
2. Forest Produce : ('000 Cubic metre))Timber 178 227Fuel (Stack) 14077 12275Pole (Numbers) - 509
3. Revenue & ExpenditureRevenue ('000 Rs.) 298211 358916Expenditure " 255651 221111
Sources : 1) Divisional Forest Officer,Jalpaiguri, Coochbehar & Baikunthapur2) Field Director, Buxa Tiger Reserve
Alipurduar (East & West)
Classification of forest area, out turn of forest produce,revenue and expenditure of forest department
in the district of JalpaiguriTable 5.4
Item Unit 1999-00 2000-01 2001-02(1) (2) (3) (4) (5)
I. Class of forest (Area inReserved forest hectare) 144300 144300 144300Proctected forest " 16600 16600 16600Unclassed state "forest " 6411 6411 6411Khas forest " 1421 1421 1421Vested wasted land " - - -Forest, owned byCorporate Bodies " - - -Forest owned byPrivate Individuals " 10268 10268 10268TOTAL 179000 179000 179000
2. Forest Produce :Timber ('000 143 162 146
cubic metre)Fuel (Stack) 36338 38382 39116Pole (Numbers) - - -Revenue & ExpenditureRevenue ('000 Rs.) 141288 86475 138685Expenditure " 2607322 217141 281459
109
Area irrigated by different sources in the district of JalpaiguriTable 5.5 ('000 Hectares)
Year Area irrigated by
Government Tank HDTW MDTW LDTW
canal
(1) (2) (3) (4) (5) (6)
1999-00 52.37 2.20 1.16 - -
2000-01 57.71 1.90 2.55 - -
2001-02 57.76 2.25 2.29 - -
2002-03 61.84 2.25 6.12 - -
2003-04 58.38 2.25 2.12 - -
Table 5.5 (Concld.) ('000 Hectares)
Year Area irrigated by
STW RLI ODW Other Total
Sources
(1) (7) (8) (9) (10) (11)
1999-00 2.55 8.22 0.55 6.50 73.55
2000-01 3.12 11.58 0.54 6.82 84.22
2001-02 3.14 9.92 0.54 8.80 84.70
2002-03 3.15 13.15 0.54 7.35 94.40
2003-04 3.59 9.04 3.67 15.23 94.28
Note: HDTW = High Capacity Deep Tubewell MDTW = Middle Capacity Deep Tubewell
LDTW = Low Capacity Deep Tubewell, STW = Shallow Tubewell
RLI = River Lift IrrigationODW = Open Dug Well
Sources : 1) Irrigation and Waterways Directorate.2) Principal Agricultural Officer, Jalpaiguri.3) Asstt. Engineers, Agri. Mech., Agri. Irri.
Jalpaiguri.
110
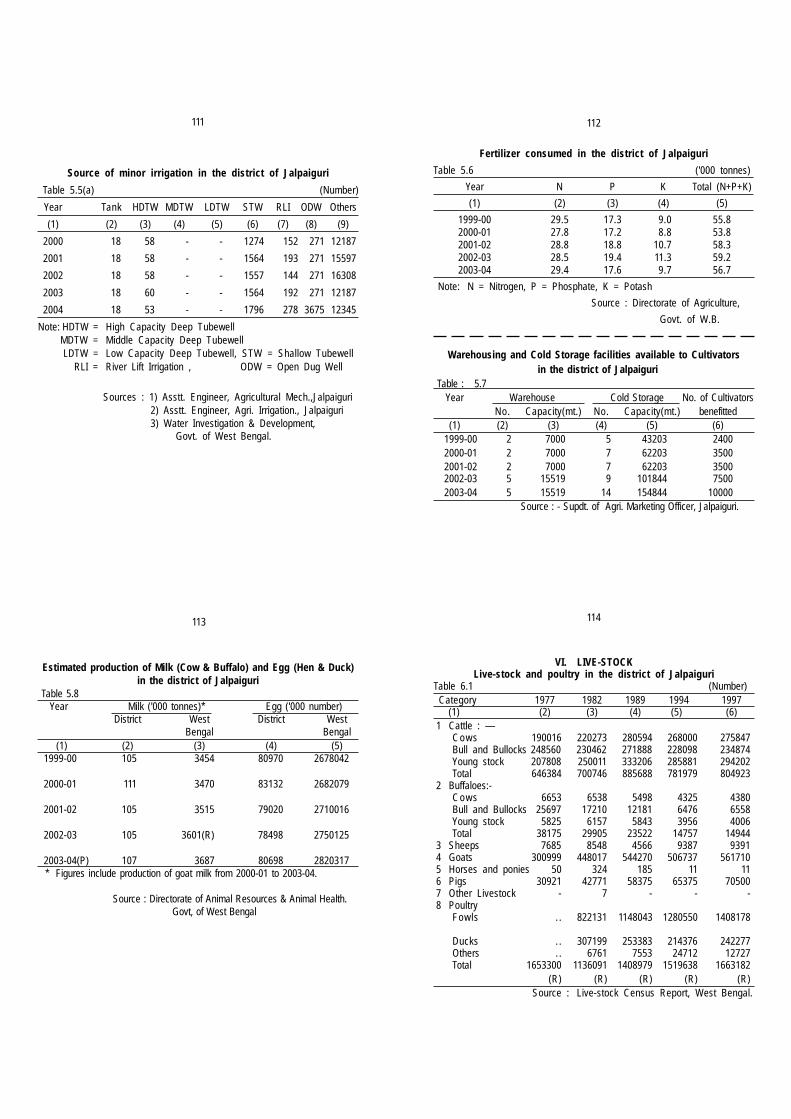
111
Source of minor irrigation in the district of Jalpaiguri
Table 5.5(a) (Number)
Year Tank HDTW MDTW LDTW STW RLI ODW Others
(1) (2) (3) (4) (5) (6) (7) (8) (9)
2000 18 58 - - 1274 152 271 12187
2001 18 58 - - 1564 193 271 15597
2002 18 58 - - 1557 144 271 16308
2003 18 60 - - 1564 192 271 12187
2004 18 53 - - 1796 278 3675 12345
Note: HDTW = High Capacity Deep TubewellMDTW = Middle Capacity Deep TubewellLDTW = Low Capacity Deep Tubewell, STW = Shallow Tubewell
RLI = River Lift Irrigation , ODW = Open Dug Well
Sources : 1) Asstt. Engineer, Agricultural Mech.,Jalpaiguri 2) Asstt. Engineer, Agri. Irrigation., Jalpaiguri 3) Water Investigation & Development, Govt. of West Bengal.
112
Fertilizer consumed in the district of Jalpaiguri
Table 5.6 ('000 tonnes)
Year N P K Total (N+P+K)
(1) (2) (3) (4) (5)
1999-00 29.5 17.3 9.0 55.82000-01 27.8 17.2 8.8 53.82001-02 28.8 18.8 10.7 58.32002-03 28.5 19.4 11.3 59.22003-04 29.4 17.6 9.7 56.7
Note: N = Nitrogen, P = Phosphate, K = Potash
Source : Directorate of Agriculture,
Govt. of W.B.
Warehousing and Cold Storage facilities available to Cultivators in the district of Jalpaiguri
Table : 5.7Year Warehouse Cold Storage No. of Cultivators
No. Capacity(mt.) No. Capacity(mt.) benefitted(1) (2) (3) (4) (5) (6)
1999-00 2 7000 5 43203 24002000-01 2 7000 7 62203 35002001-02 2 7000 7 62203 35002002-03 5 15519 9 101844 75002003-04 5 15519 14 154844 10000
Source : - Supdt. of Agri. Marketing Officer, Jalpaiguri.
113
Estimated production of Milk (Cow & Buffalo) and Egg (Hen & Duck)in the district of Jalpaiguri
Table 5.8Year Milk ('000 tonnes)* Egg ('000 number)
District West District WestBengal Bengal
(1) (2) (3) (4) (5)1999-00 105 3454 80970 2678042
2000-01 111 3470 83132 2682079
2001-02 105 3515 79020 2710016
2002-03 105 3601(R) 78498 2750125
2003-04(P) 107 3687 80698 2820317 * Figures include production of goat milk from 2000-01 to 2003-04.
Source : Directorate of Animal Resources & Animal Health. Govt, of West Bengal
114
VI. LIVE-STOCKLive-stock and poultry in the district of Jalpaiguri
Table 6.1 (Number) Category 1977 1982 1989 1994 1997 (1) (2) (3) (4) (5) (6)1 Cattle : —
Cows 190016 220273 280594 268000 275847Bull and Bullocks 248560 230462 271888 228098 234874Young stock 207808 250011 333206 285881 294202Total 646384 700746 885688 781979 804923
2 Buffaloes:-Cows 6653 6538 5498 4325 4380Bull and Bullocks 25697 17210 12181 6476 6558Young stock 5825 6157 5843 3956 4006Total 38175 29905 23522 14757 14944
3 Sheeps 7685 8548 4566 9387 93914 Goats 300999 448017 544270 506737 5617105 Horses and ponies 50 324 185 11 116 Pigs 30921 42771 58375 65375 705007 Other Livestock - 7 - - -8 Poultry
Fowls . . 822131 1148043 1280550 1408178
Ducks . . 307199 253383 214376 242277Others . . 6761 7553 24712 12727Total 1653300 1136091 1408979 1519638 1663182
(R) (R) (R) (R) (R)Source : Live-stock Census Report, West Bengal.
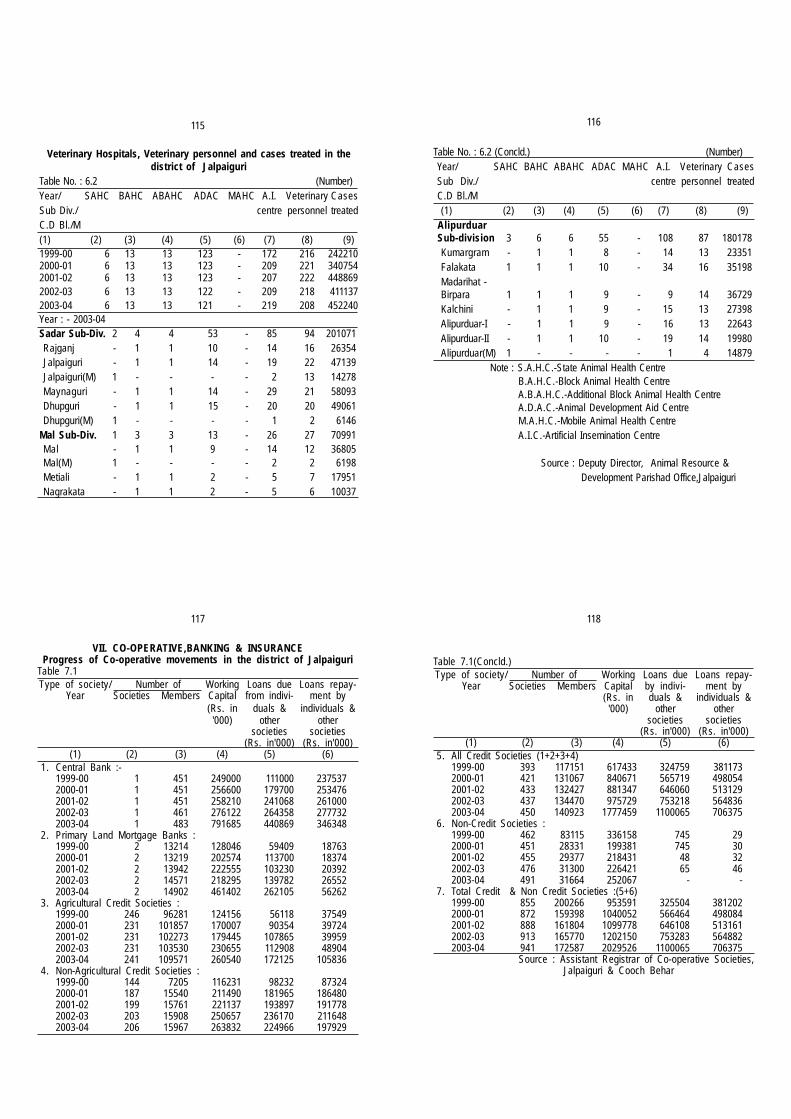
115
Veterinary Hospitals, Veterinary personnel and cases treated in thedistrict of Jalpaiguri
Table No. : 6.2 (Number)Year/ SAHC BAHC ABAHC ADAC MAHC A.I. Veterinary CasesSub Div./ centre personnel treatedC.D Bl./M(1) (2) (3) (4) (5) (6) (7) (8) (9)1999-00 6 13 13 123 - 172 216 2422102000-01 6 13 13 123 - 209 221 3407542001-02 6 13 13 123 - 207 222 4488692002-03 6 13 13 122 - 209 218 4111372003-04 6 13 13 121 - 219 208 452240Year : - 2003-04Sadar Sub-Div. 2 4 4 53 - 85 94 201071Rajganj - 1 1 10 - 14 16 26354Jalpaiguri - 1 1 14 - 19 22 47139Jalpaiguri(M) 1 - - - - 2 13 14278Maynaguri - 1 1 14 - 29 21 58093Dhupguri - 1 1 15 - 20 20 49061Dhupguri(M) 1 - - - - 1 2 6146
Mal Sub-Div. 1 3 3 13 - 26 27 70991Mal - 1 1 9 - 14 12 36805Mal(M) 1 - - - - 2 2 6198Metiali - 1 1 2 - 5 7 17951Nagrakata - 1 1 2 - 5 6 10037
116
Table No. : 6.2 (Concld.) (Number) Year/ SAHC BAHC ABAHC ADAC MAHC A.I. Veterinary Cases Sub Div./ centre personnel treated C.D Bl./M
(1) (2) (3) (4) (5) (6) (7) (8) (9) Alipurduar Sub-division 3 6 6 55 - 108 87 180178
Kumargram - 1 1 8 - 14 13 23351Falakata 1 1 1 10 - 34 16 35198Madarihat -Birpara 1 1 1 9 - 9 14 36729Kalchini - 1 1 9 - 15 13 27398Alipurduar-I - 1 1 9 - 16 13 22643Alipurduar-II - 1 1 10 - 19 14 19980Alipurduar(M) 1 - - - - 1 4 14879 Note : S.A.H.C.-State Animal Health Centre
B.A.H.C.-Block Animal Health CentreA.B.A.H.C.-Additional Block Animal Health CentreA.D.A.C.-Animal Development Aid CentreM.A.H.C.-Mobile Animal Health CentreA.I.C.-Artificial Insemination Centre
Source : Deputy Director, Animal Resource & Development Parishad Office,Jalpaiguri
117 118
Table 7.1(Concld.)Type of society/ Number of Working Loans due Loans repay-
Year Societies Members Capital by indivi- ment by(Rs. in duals & individuals &
'000) other othersocieties societies
(Rs. in'000) (Rs. in'000)(1) (2) (3) (4) (5) (6)
5. All Credit Societies (1+2+3+4)1999-00 393 117151 617433 324759 3811732000-01 421 131067 840671 565719 4980542001-02 433 132427 881347 646060 5131292002-03 437 134470 975729 753218 5648362003-04 450 140923 1777459 1100065 706375
6. Non-Credit Societies :1999-00 462 83115 336158 745 292000-01 451 28331 199381 745 302001-02 455 29377 218431 48 322002-03 476 31300 226421 65 462003-04 491 31664 252067 - -
7. Total Credit & Non Credit Societies :(5+6)1999-00 855 200266 953591 325504 3812022000-01 872 159398 1040052 566464 4980842001-02 888 161804 1099778 646108 5131612002-03 913 165770 1202150 753283 5648822003-04 941 172587 2029526 1100065 706375
Source : Assistant Registrar of Co-operative Societies, Jalpaiguri & Cooch Behar
VII. CO-OPERATIVE,BANKING & INSURANCEProgress of Co-operative movements in the district of Jalpaiguri
Table 7.1Type of society/ Number of Working Loans due Loans repay-
Year Societies Members Capital from indivi- ment by(Rs. in duals & individuals &
'000) other othersocieties societies
(Rs. in'000) (Rs. in'000)(1) (2) (3) (4) (5) (6)
1. Central Bank :-1999-00 1 451 249000 111000 2375372000-01 1 451 256600 179700 2534762001-02 1 451 258210 241068 2610002002-03 1 461 276122 264358 2777322003-04 1 483 791685 440869 346348
2. Primary Land Mortgage Banks :1999-00 2 13214 128046 59409 187632000-01 2 13219 202574 113700 183742001-02 2 13942 222555 103230 203922002-03 2 14571 218295 139782 265522003-04 2 14902 461402 262105 56262
3. Agricultural Credit Societies :1999-00 246 96281 124156 56118 375492000-01 231 101857 170007 90354 397242001-02 231 102273 179445 107865 399592002-03 231 103530 230655 112908 489042003-04 241 109571 260540 172125 105836
4. Non-Agricultural Credit Societies :1999-00 144 7205 116231 98232 873242000-01 187 15540 211490 181965 1864802001-02 199 15761 221137 193897 1917782002-03 203 15908 250657 236170 2116482003-04 206 15967 263832 224966 197929
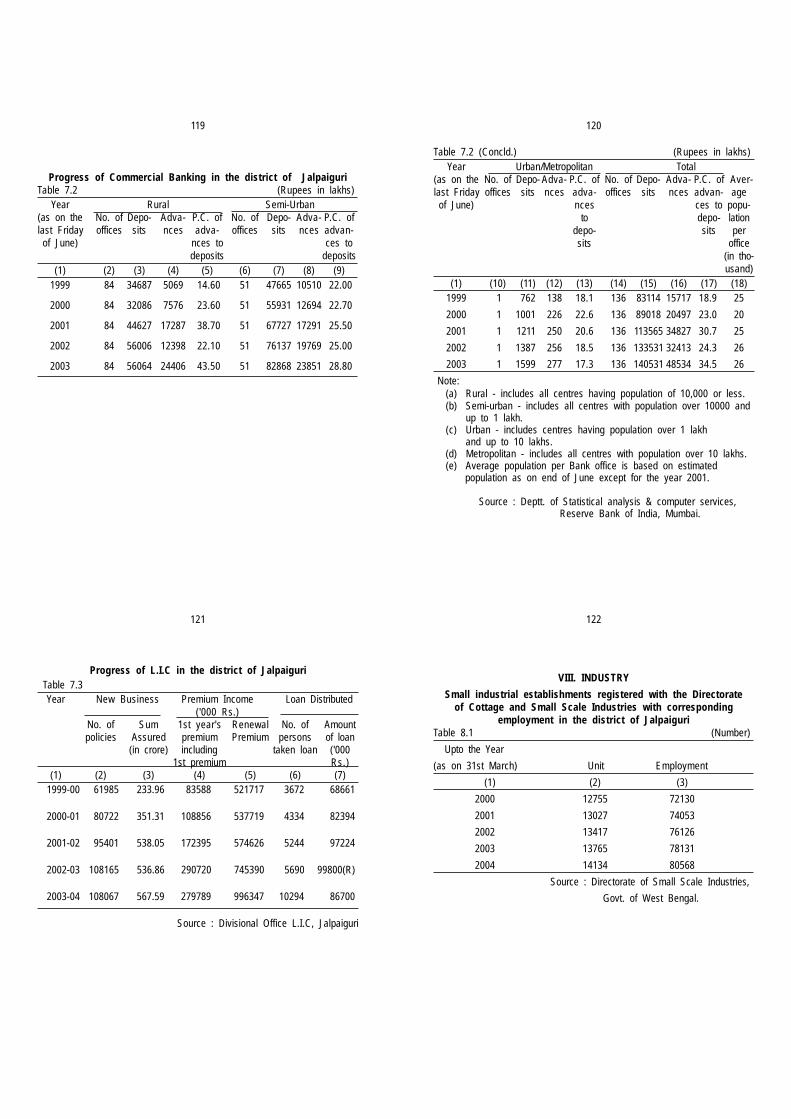
119 120
Progress of Commercial Banking in the district of JalpaiguriTable 7.2 (Rupees in lakhs)
Year Rural Semi-Urban(as on the No. of Depo- Adva- P.C. of No. of Depo- Adva- P.C. oflast Friday offices sits nces adva- offices sits nces advan-
of June) nces to ces todeposits deposits
(1) (2) (3) (4) (5) (6) (7) (8) (9)1999 84 34687 5069 14.60 51 47665 10510 22.00
2000 84 32086 7576 23.60 51 55931 12694 22.70
2001 84 44627 17287 38.70 51 67727 17291 25.50
2002 84 56006 12398 22.10 51 76137 19769 25.00
2003 84 56064 24406 43.50 51 82868 23851 28.80
Table 7.2 (Concld.) (Rupees in lakhs)Year Urban/Metropolitan Total
(as on the No. of Depo- Adva- P.C. of No. of Depo- Adva- P.C. of Aver-last Friday offices sits nces adva- offices sits nces advan- age
of June) nces ces to popu-to depo- lation
depo- sits persits office
(in tho-usand)
(1) (10) (11) (12) (13) (14) (15) (16) (17) (18)1999 1 762 138 18.1 136 83114 15717 18.9 25
2000 1 1001 226 22.6 136 89018 20497 23.0 20
2001 1 1211 250 20.6 136 113565 34827 30.7 25
2002 1 1387 256 18.5 136 133531 32413 24.3 26
2003 1 1599 277 17.3 136 140531 48534 34.5 26
Note:(a) Rural - includes all centres having population of 10,000 or less.(b) Semi-urban - includes all centres with population over 10000 and
up to 1 lakh. (c) Urban - includes centres having population over 1 lakh
and up to 10 lakhs. (d) Metropolitan - includes all centres with population over 10 lakhs.
(e) Average population per Bank office is based on estimated population as on end of June except for the year 2001.
Source : Deptt. of Statistical analysis & computer services, Reserve Bank of India, Mumbai.
121 122
VIII. INDUSTRY
Small industrial establishments registered with the Directorateof Cottage and Small Scale Industries with corresponding
employment in the district of JalpaiguriTable 8.1 (Number)
Upto the Year
(as on 31st March) Unit Employment
(1) (2) (3)
2000 12755 72130
2001 13027 74053
2002 13417 76126
2003 13765 78131
2004 14134 80568
Source : Directorate of Small Scale Industries,
Govt. of West Bengal.
Progress of L.I.C in the district of Jalpaiguri Table 7.3
Year New Business Premium Income Loan Distributed('000 Rs.)
No. of Sum 1st year's Renewal No. of Amountpolicies Assured premium Premium persons of loan
(in crore) including taken loan ('0001st premium Rs.)
(1) (2) (3) (4) (5) (6) (7)1999-00 61985 233.96 83588 521717 3672 68661
2000-01 80722 351.31 108856 537719 4334 82394
2001-02 95401 538.05 172395 574626 5244 97224
2002-03 108165 536.86 290720 745390 5690 99800(R)
2003-04 108067 567.59 279789 996347 10294 86700
Source : Divisional Office L.I.C, Jalpaiguri
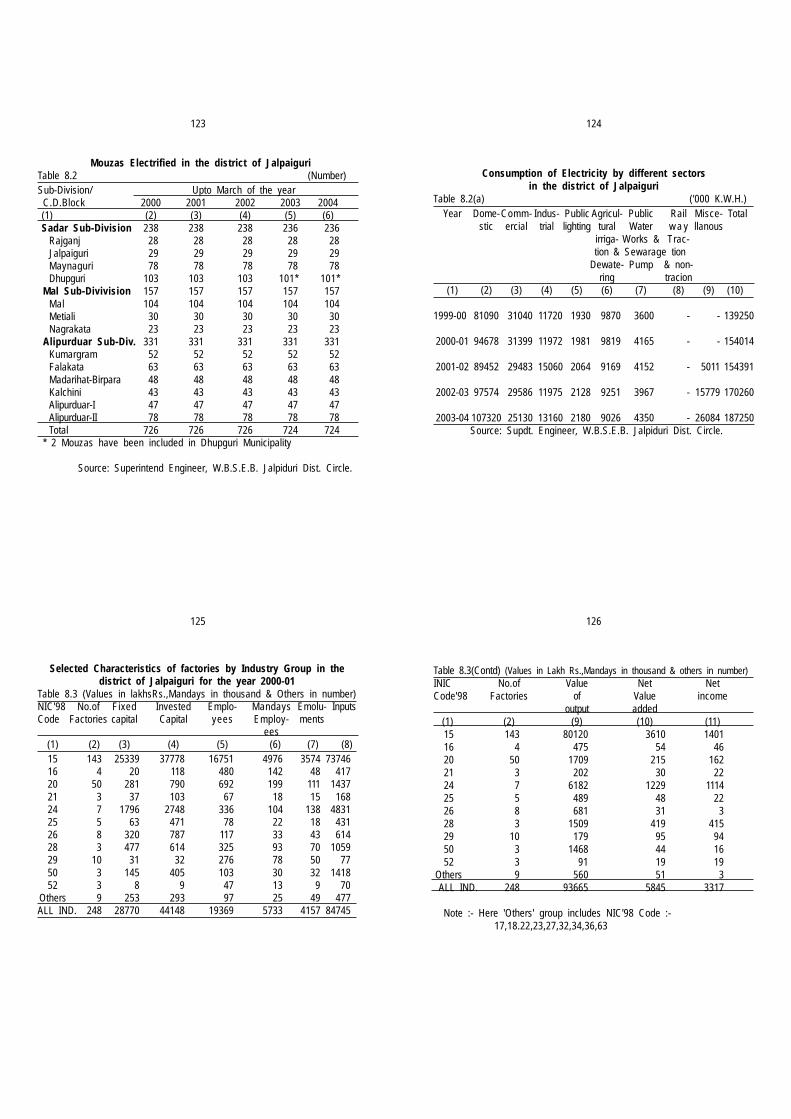
124123
Mouzas Electrified in the district of JalpaiguriTable 8.2 (Number)Sub-Division/ Upto March of the year C.D.Block 2000 2001 2002 2003 2004(1) (2) (3) (4) (5) (6)Sadar Sub-Division 238 238 238 236 236
Rajganj 28 28 28 28 28Jalpaiguri 29 29 29 29 29Maynaguri 78 78 78 78 78Dhupguri 103 103 103 101* 101*
Mal Sub-Divivision 157 157 157 157 157Mal 104 104 104 104 104Metiali 30 30 30 30 30Nagrakata 23 23 23 23 23
Alipurduar Sub-Div. 331 331 331 331 331Kumargram 52 52 52 52 52Falakata 63 63 63 63 63Madarihat-Birpara 48 48 48 48 48Kalchini 43 43 43 43 43Alipurduar-I 47 47 47 47 47Alipurduar-II 78 78 78 78 78Total 726 726 726 724 724
* 2 Mouzas have been included in Dhupguri Municipality
Source: Superintend Engineer, W.B.S.E.B. Jalpiduri Dist. Circle.
Consumption of Electricity by different sectorsin the district of Jalpaiguri
Table 8.2(a) ('000 K.W.H.)Year Dome-Comm- Indus- Public Agricul- Public Rail Misce- Total
stic ercial trial lighting tural Water w a y llanousirriga- Works & Trac-tion & Sewarage tion
Dewate- Pump & non-ring tracion
(1) (2) (3) (4) (5) (6) (7) (8) (9) (10)
1999-00 81090 31040 11720 1930 9870 3600 - - 139250
2000-01 94678 31399 11972 1981 9819 4165 - - 154014
2001-02 89452 29483 15060 2064 9169 4152 - 5011 154391
2002-03 97574 29586 11975 2128 9251 3967 - 15779 170260
2003-04 107320 25130 13160 2180 9026 4350 - 26084 187250Source: Supdt. Engineer, W.B.S.E.B. Jalpiduri Dist. Circle.
125 126
Selected Characteristics of factories by Industry Group in thedistrict of Jalpaiguri for the year 2000-01
Table 8.3 (Values in lakhsRs.,Mandays in thousand & Others in number)NIC'98 No.of Fixed Invested Emplo- Mandays Emolu- InputsCode Factories capital Capital yees Employ- ments
ees(1) (2) (3) (4) (5) (6) (7) (8)15 143 25339 37778 16751 4976 3574 7374616 4 20 118 480 142 48 41720 50 281 790 692 199 111 143721 3 37 103 67 18 15 16824 7 1796 2748 336 104 138 483125 5 63 471 78 22 18 43126 8 320 787 117 33 43 61428 3 477 614 325 93 70 105929 10 31 32 276 78 50 7750 3 145 405 103 30 32 141852 3 8 9 47 13 9 70
Others 9 253 293 97 25 49 477ALL IND. 248 28770 44148 19369 5733 4157 84745
Table 8.3(Contd) (Values in Lakh Rs.,Mandays in thousand & others in number)INIC No.of Value Net NetCode'98 Factories of Value income
output added(1) (2) (9) (10) (11)15 143 80120 3610 140116 4 475 54 4620 50 1709 215 16221 3 202 30 2224 7 6182 1229 111425 5 489 48 2226 8 681 31 328 3 1509 419 41529 10 179 95 9450 3 1468 44 1652 3 91 19 19
Others 9 560 51 3 ALL IND. 248 93665 5845 3317
Note :- Here 'Others' group includes NIC'98 Code :- 17,18.22,23,27,32,34,36,63
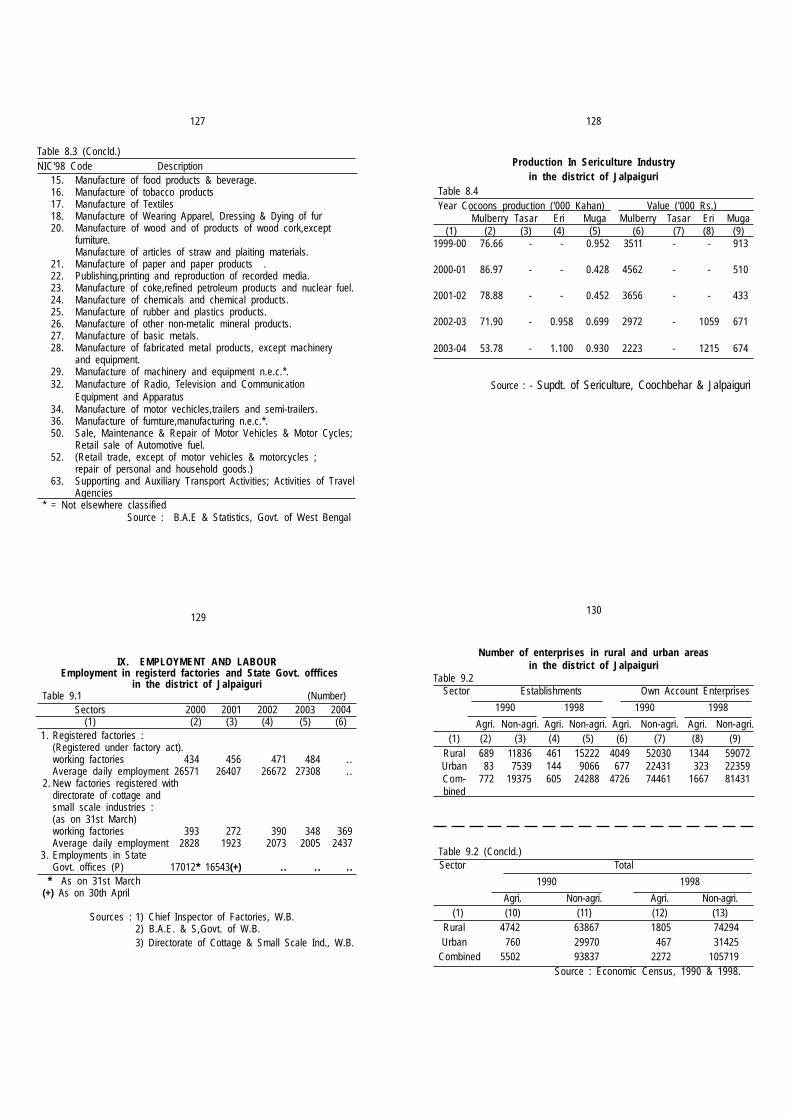
127 128
Production In Sericulture Industryin the district of Jalpaiguri
Table 8.4 Year Cocoons production ('000 Kahan) Value ('000 Rs.)
Mulberry Tasar Eri Muga Mulberry Tasar Eri Muga(1) (2) (3) (4) (5) (6) (7) (8) (9)
1999-00 76.66 - - 0.952 3511 - - 913
2000-01 86.97 - - 0.428 4562 - - 510
2001-02 78.88 - - 0.452 3656 - - 433
2002-03 71.90 - 0.958 0.699 2972 - 1059 671
2003-04 53.78 - 1.100 0.930 2223 - 1215 674
Source : - Supdt. of Sericulture, Coochbehar & Jalpaiguri
Table 8.3 (Concld.)NIC'98 Code Description
15. Manufacture of food products & beverage.16. Manufacture of tobacco products17. Manufacture of Textiles18. Manufacture of Wearing Apparel, Dressing & Dying of fur20. Manufacture of wood and of products of wood cork,except
furniture.Manufacture of articles of straw and plaiting materials.
21. Manufacture of paper and paper products .22. Publishing,printing and reproduction of recorded media.23. Manufacture of coke,refined petroleum products and nuclear fuel.24. Manufacture of chemicals and chemical products.25. Manufacture of rubber and plastics products.
26. Manufacture of other non-metalic mineral products.27. Manufacture of basic metals.28. Manufacture of fabricated metal products, except machinery
and equipment.29. Manufacture of machinery and equipment n.e.c.*.32. Manufacture of Radio, Television and Communication
Equipment and Apparatus34. Manufacture of motor vechicles,trailers and semi-trailers.36. Manufacture of furnture,manufacturing n.e.c.*.50. Sale, Maintenance & Repair of Motor Vehicles & Motor Cycles;
Retail sale of Automotive fuel.52. (Retail trade, except of motor vehicles & motorcycles ;
repair of personal and household goods.)63. Supporting and Auxiliary Transport Activities; Activities of Travel
Agencies * = Not elsewhere classified Source : B.A.E & Statistics, Govt. of West Bengal
129130
IX. EMPLOYMENT AND LABOUR Employment in registerd factories and State Govt. offfices
in the district of Jalpaiguri Table 9.1 (Number)
Sectors 2000 2001 2002 2003 2004(1) (2) (3) (4) (5) (6)
1. Registered factories :(Registered under factory act).working factories 434 456 471 484 . .Average daily employment 26571 26407 26672 27308 . .
2. New factories registered withdirectorate of cottage andsmall scale industries :(as on 31st March)working factories 393 272 390 348 369Average daily employment 2828 1923 2073 2005 2437
3. Employments in StateGovt. offices (P) 17012* 16543(+) . . . . . .
* As on 31st March (+) As on 30th April
Sources : 1) Chief Inspector of Factories, W.B.2) B.A.E. & S,Govt. of W.B.3) Directorate of Cottage & Small Scale Ind., W.B.
Number of enterprises in rural and urban areasin the district of Jalpaiguri
Table 9.2Sector Establishments Own Account Enterprises
1990 1998 1990 1998
Agri. Non-agri. Agri. Non-agri. Agri. Non-agri. Agri. Non-agri.(1) (2) (3) (4) (5) (6) (7) (8) (9)
Rural 689 11836 461 15222 4049 52030 1344 59072Urban 83 7539 144 9066 677 22431 323 22359Com- 772 19375 605 24288 4726 74461 1667 81431bined
Table 9.2 (Concld.)Sector Total
1990 1998
Agri. Non-agri. Agri. Non-agri. (1) (10) (11) (12) (13)Rural 4742 63867 1805 74294Urban 760 29970 467 31425
Combined 5502 93837 2272 105719 Source : Economic Census, 1990 & 1998.
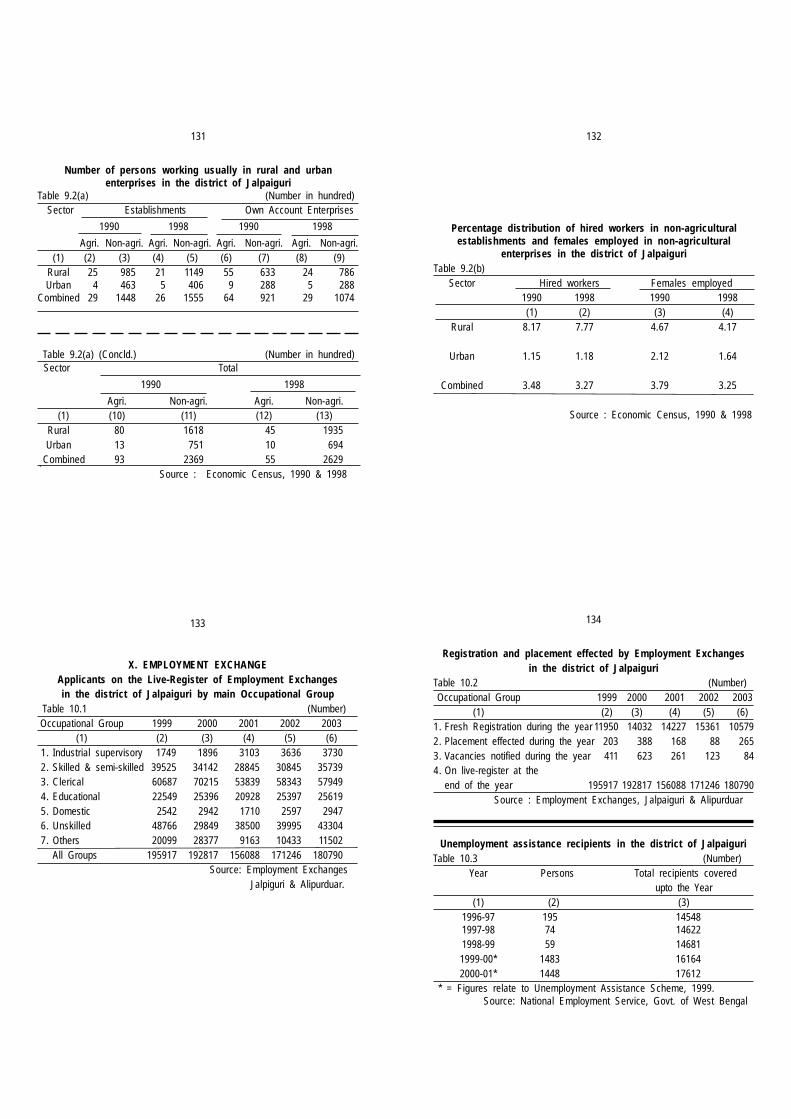
131 132
Number of persons working usually in rural and urbanenterprises in the district of Jalpaiguri
Table 9.2(a) (Number in hundred)Sector Establishments Own Account Enterprises
1990 1998 1990 1998
Agri. Non-agri. Agri. Non-agri. Agri. Non-agri. Agri. Non-agri.(1) (2) (3) (4) (5) (6) (7) (8) (9)
Rural 25 985 21 1149 55 633 24 786Urban 4 463 5 406 9 288 5 288
Combined 29 1448 26 1555 64 921 29 1074
Percentage distribution of hired workers in non-agriculturalestablishments and females employed in non-agricultural
enterprises in the district of JalpaiguriTable 9.2(b)
Sector Hired workers Females employed1990 1998 1990 1998(1) (2) (3) (4)
Rural 8.17 7.77 4.67 4.17
Urban 1.15 1.18 2.12 1.64
Combined 3.48 3.27 3.79 3.25
Source : Economic Census, 1990 & 1998
Table 9.2(a) (Concld.) (Number in hundred)Sector Total
1990 1998
Agri. Non-agri. Agri. Non-agri. (1) (10) (11) (12) (13)Rural 80 1618 45 1935Urban 13 751 10 694
Combined 93 2369 55 2629 Source : Economic Census, 1990 & 1998
133 134
X. EMPLOYMENT EXCHANGEApplicants on the Live-Register of Employment Exchangesin the district of Jalpaiguri by main Occupational Group
Table 10.1 (Number)Occupational Group 1999 2000 2001 2002 2003
(1) (2) (3) (4) (5) (6)1. Industrial supervisory 1749 1896 3103 3636 37302. Skilled & semi-skilled 39525 34142 28845 30845 357393. Clerical 60687 70215 53839 58343 579494. Educational 22549 25396 20928 25397 256195. Domestic 2542 2942 1710 2597 29476. Unskilled 48766 29849 38500 39995 433047. Others 20099 28377 9163 10433 11502
All Groups 195917 192817 156088 171246 180790 Source: Employment Exchanges
Jalpiguri & Alipurduar.
Registration and placement effected by Employment Exchangesin the district of Jalpaiguri
Table 10.2 (Number)Occupational Group 1999 2000 2001 2002 2003
(1) (2) (3) (4) (5) (6)1. Fresh Registration during the year 11950 14032 14227 15361 105792. Placement effected during the year 203 388 168 88 2653. Vacancies notified during the year 411 623 261 123 844. On live-register at the
end of the year 195917 192817 156088 171246 180790 Source : Employment Exchanges, Jalpaiguri & Alipurduar
Unemployment assistance recipients in the district of JalpaiguriTable 10.3 (Number)
Year Persons Total recipients coveredupto the Year
(1) (2) (3)1996-97 195 145481997-98 74 146221998-99 59 146811999-00* 1483 161642000-01* 1448 17612
* = Figures relate to Unemployment Assistance Scheme, 1999. Source: National Employment Service, Govt. of West Bengal

135
XI. PRICEWholesale Price of Agriculture, Live-Stock & Live-Stock products
(average quality) in the different markets of JalpaiguriTable 11.1
Commodity Market Unit Price as on February(Rs.)2002 2003 2004
(1) (2) (3) (4) (5) (6)Paddy(Aman Fine) Dhupguri Qtl. 525.00 520.00 530.00Paddy(Common) " " 505.00 500.00 480.00Rice(Aman Fine) " " 1200.00 1620.00 1200.00Rice(Aman Common) " " 930.00 900.00 878.00Wheat " " 550.00 575.00 590.00Barley " " . . . . . .Musur(Deshi) Jalpaiguri " 2415.00 2600.00 2700.00Musur(Small) " " 2650.00 2850.00 2925.00Matar " " 1900.00 2225.00 2025.00Arhar " " 2843.00 2875.00 2713.00Khesari " " . . . . . .Urid(Deshi) " " 2570.00 2560.00 2550.00Potato(Nainital) " " 235.00 250.00 303.00Bringal " " 325.00 450.00 368.00Cabbage " " 75.00 160.00 110.00Cauliflower " " 170.00 375.00 333.00
136
Table 11.1(Concld.)Commodity Market Unit Price as on February(Rs.)
2002 2003 2004(1) (2) (3) (4) (5) (6)
Egg(Hen) Jalpaiguri 100 Nos. 164.00 170.00 180.00Cow(Milk) " 100 Ltr. 1200.00 1250.00 1250.00Cow(Skin) " Each . . . . . .Sheep(Alive)(10 Kg.) " " . . . . . .Goat Alive (10 Kg.) Alipurduar " 1150.00 1200.00 1400.00Onion(Deshi) " Qtl. 650.00 550.00 980.00Tamarid(Deshi) " " 3000.00 3000.00 3000.00Mustard " " 2400.00 3000.00 3000.00Jute (T.D.S.) " " 1100.00 1200.00 1300.00Linseed " " . . . . . .Gur (Achi-chaki) " " 1200.00 1150.00 1180.00 Source : Superintendent of Agriculture Marketing Officer, Jalpaiguri
137
Regulated market by category in the district of JalpaiguriTable 11.1(a) (Number)
Year Principal Market Sub-market(as on 31st Oct.) Yard Yard
(1) (2) (3)1999 3 58
2000 3 58
2001 3 57
2002 3 57
2003 3 57 Source : Directorate of Agricultural Marketing Branch, Govt. of W. B.
138
Consumer Price index number for families with monthlyexpenditure level in the district of Jalpaiguri
Centre : Jalpaiguri Base : 1960 = 100Table 11.2
Year/ Average monthly expenditure level (Rupees) Month 1-100 101-200 201-350 351-700 701-above
(1) (2) (3) (4) (5) (6)1999 1856.80 1833.29 1772.60 1729.49 1689.362000 1906.90 1885.60 1844.70 1792.70 1743.602001 1936.70 1919.30 1876.60 1833.90 1810.202002 1955.50 1946.40 1924.20 1880.80 1874.702003 1997.80 1985.20 1957.90 1914.10 1908.602003 :January 1987.30 1976.10 1950.60 1906.00 1902.70February 1986.00 1973.10 1944.50 1898.30 1893.80March 1983.10 1974.00 1945.50 1899.70 1897.60April 1988.70 1977.10 1947.80 1903.30 1901.20M a y 1993.30 1979.80 1952.70 1909.70 1905.00June 1991.00 1977.40 1948.90 1903.00 1897.00July 1992.60 1982.00 1956.00 1912.00 1905.30August 1996.60 1984.40 1960.40 1918.40 1912.20September 2005.60 1992.20 1965.20 1921.90 1916.70October 2019.90 2006.40 1979.40 1939.50 1925.40November 2017.80 2003.30 1975.70 1932.90 1926.60December 2011.60 1996.80 1968.30 1925.00 1919.20 Source:-Bureau of Applied Economics & Statistics, Govt. of W. B.
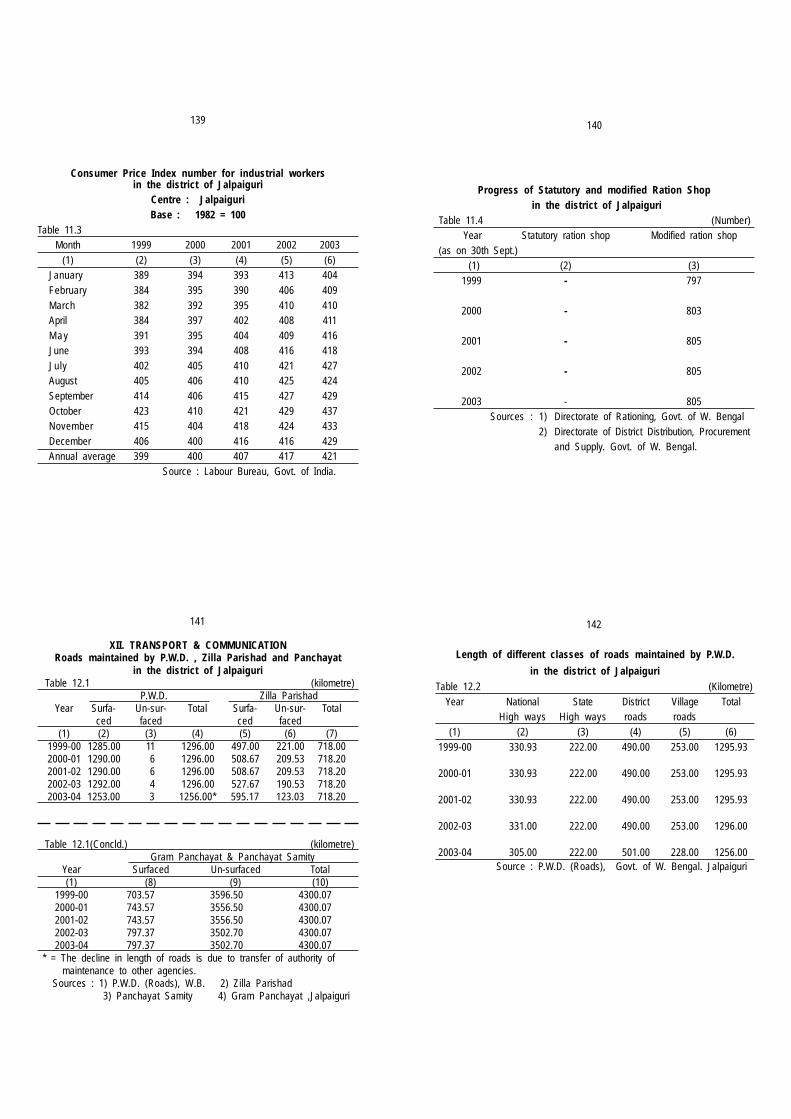
139
Consumer Price Index number for industrial workersin the district of Jalpaiguri
Centre : JalpaiguriBase : 1982 = 100
Table 11.3Month 1999 2000 2001 2002 2003
(1) (2) (3) (4) (5) (6)January 389 394 393 413 404February 384 395 390 406 409March 382 392 395 410 410April 384 397 402 408 411M a y 391 395 404 409 416June 393 394 408 416 418July 402 405 410 421 427August 405 406 410 425 424September 414 406 415 427 429October 423 410 421 429 437November 415 404 418 424 433December 406 400 416 416 429Annual average 399 400 407 417 421
Source : Labour Bureau, Govt. of India.
140
Progress of Statutory and modified Ration Shop in the district of Jalpaiguri
Table 11.4 (Number) Year Statutory ration shop Modified ration shop (as on 30th Sept.) (1) (2) (3)
1999 - 797
2000 - 803
2001 - 805
2002 - 805
2003 - 805Sources : 1) Directorate of Rationing, Govt. of W. Bengal
2) Directorate of District Distribution, Procurementand Supply. Govt. of W. Bengal.
141
Table 12.1(Concld.) (kilometre) Gram Panchayat & Panchayat Samity
Year Surfaced Un-surfaced Total(1) (8) (9) (10)
1999-00 703.57 3596.50 4300.072000-01 743.57 3556.50 4300.072001-02 743.57 3556.50 4300.072002-03 797.37 3502.70 4300.072003-04 797.37 3502.70 4300.07
* = The decline in length of roads is due to transfer of authority of maintenance to other agencies. Sources : 1) P.W.D. (Roads), W.B. 2) Zilla Parishad 3) Panchayat Samity 4) Gram Panchayat ,Jalpaiguri
142
Length of different classes of roads maintained by P.W.D.
in the district of JalpaiguriTable 12.2 (Kilometre)
Year National State District Village TotalHigh ways High ways roads roads
(1) (2) (3) (4) (5) (6)1999-00 330.93 222.00 490.00 253.00 1295.93
2000-01 330.93 222.00 490.00 253.00 1295.93
2001-02 330.93 222.00 490.00 253.00 1295.93
2002-03 331.00 222.00 490.00 253.00 1296.00
2003-04 305.00 222.00 501.00 228.00 1256.00 Source : P.W.D. (Roads), Govt. of W. Bengal. Jalpaiguri
XII. TRANSPORT & COMMUNICATIONRoads maintained by P.W.D. , Zilla Parishad and Panchayat
in the district of JalpaiguriTable 12.1 (kilometre) P.W.D. Zilla Parishad
Year Surfa- Un-sur- Total Surfa- Un-sur- Totalced faced ced faced
(1) (2) (3) (4) (5) (6) (7)1999-00 1285.00 11 1296.00 497.00 221.00 718.002000-01 1290.00 6 1296.00 508.67 209.53 718.202001-02 1290.00 6 1296.00 508.67 209.53 718.202002-03 1292.00 4 1296.00 527.67 190.53 718.202003-04 1253.00 3 1256.00* 595.17 123.03 718.20

143 144
145
Number of Registered Motor Vehicles in the district of JalpaiguriTable 12.4
Year Goods Motor car Motor Taxi & Auto(as on Vehicle & Jeep cycle Contract Rickshaw
31st March)(R) & Scooter Carriage(1) (2) (3) (4) (5) (6)
2000 3578 2799 19248 500 1332001 3695 2872 20765 585 1412002 3631 2807 20814 675 2052003 4202 2958 23281 740 2112004 4227 3153 26185 825 269
Table 12.4(Concld.)Year Mini State Tractor Others Total
(as on 31st March)(R) Bus Carriage & Trailor(1) (7) (8) (9) (10) (11)
2000 98 335 2241 37 289692001 98 335 2306 190 309872002 98 335 2506 86 311572003 99 372 2556 109 345282004 105 395 2567 116 37842
Source : R.T.A., Jalpaiguri
Accident on Roads in the district of JalpaiguriTable. : 12.5
Year No. of accident No. of person No. of personoccurred injured killed
(1) (2) (3) (4)1999 500 729 223
2000 531 736 235
2001 499 659 238
2002 500 585 235
2003 629 717 296
Source : - Superintendent of Police, Jalpaiguri
146
Post & Telegraph offices in the district of JalpaiguriTable - 12.6 ( Number)
Year Post office Telegraph office Combined office(as on 31st March)Sub-Div./ C.D. Block/M
(1) (2) (3) (4)2000 297 1 242001 297 1 242002 297(R) 1 302003 346(R) 1(R) 32(R)2004* 346 1 32
Year : 2004Sadar Sub-division 158 1 13
Rajganj 31 - 1Jalpaiguri 43 - 2Jalpaiguri(M) 16 1 2Maynaguri 28 - 3Dhupguri 35 - 4Dhupguri(M) 5 - 1
Mal Sub-division 41 - 9Mal 26 - 4Mal(M) 3 - 1Metiali 6 - 2Nagrakata 6 - 2
Roads maintained by Municipalities in the district of Jalpaiguri
Table 12.3 (Kilometre)
Year/ M. Surfaced Un-surfaced Total(1) (2) (3) (4)
1999-00 250.20 79.80 330.002000-01 250.20 79.80 330.002001-02 261.20 68.80 330.002002-03 279.50 95.80 375.302003-04 285.20 128.15 413.35
Year 2003-04 : -Jalpaiguri (M) 132.00 6.00 138.00Mal (M) 38.00 20.00 58.00Alipurduar (M) 97.20 26.85 124.05Dhupguri (M) 18.00 75.30 93.30 Source : All Municipalities of Jalpaiguri.
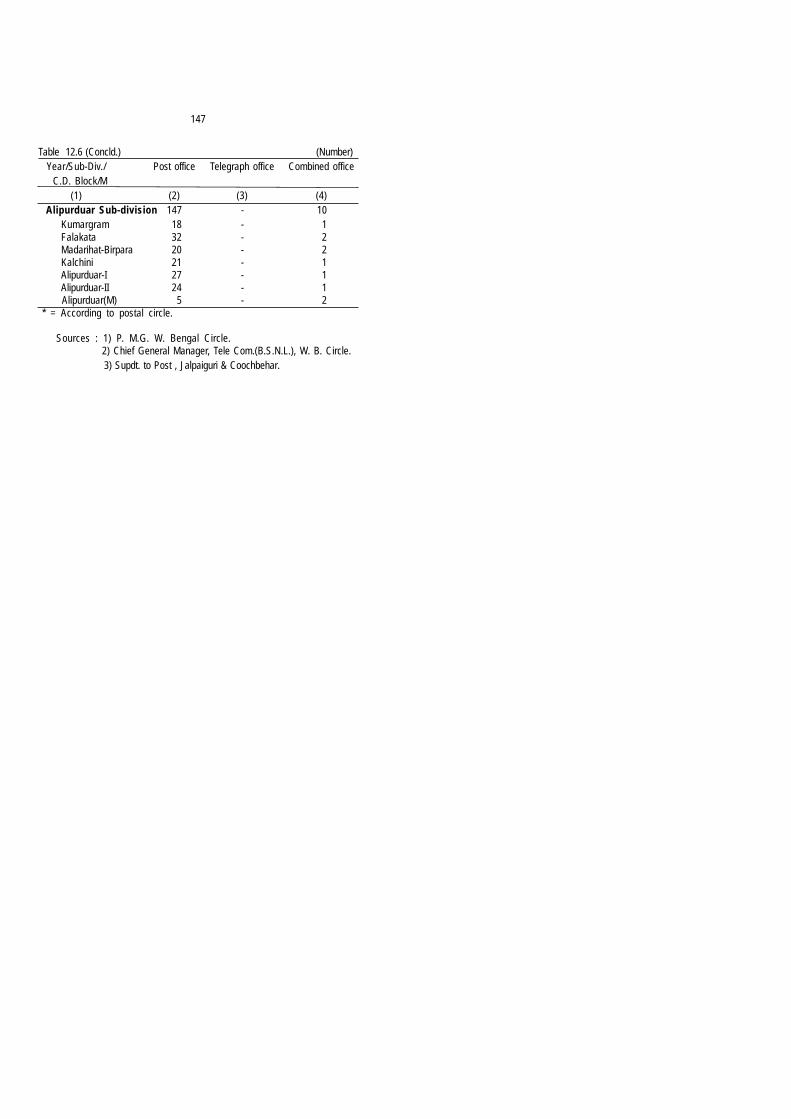
147
Table 12.6 (Concld.) (Number)Year/Sub-Div./ Post office Telegraph office Combined office C.D. Block/M
(1) (2) (3) (4)Alipurduar Sub-division 147 - 10
Kumargram 18 - 1Falakata 32 - 2Madarihat-Birpara 20 - 2Kalchini 21 - 1Alipurduar-I 27 - 1Alipurduar-II 24 - 1
Alipurduar(M) 5 - 2* = According to postal circle.
Sources : 1) P. M.G. W. Bengal Circle. 2) Chief General Manager, Tele Com.(B.S.N.L.), W. B. Circle.
3) Supdt. to Post , Jalpaiguri & Coochbehar.
151
Table 13.1(Contd.) (Number)Class of Offence Persons Convicted
1999 2000 2001 2002 2003(1) (12) (13) (14) (15) (16)
Murder . . 5 15 3 7
Dacoity .. . . . . . . . .
Robbery 4 . . . . . . 3
Burglary .. . . . . . . . .
Rioting . . . . 1 2 . .
Theft 6 7 . . . . . .
Minor Offences . . . . . . . . 17
Offences against
Women . . 12 27 6 74
Others 92 135 183 112 101
Total 102 159 226 123 202
150
Table 13.1(Contd.) (Number)Class of Offence Cases tried
1999 2000 2001 2002 2003(1) (7) (8) (9) (10) (11)
Murder 22 35 48 157 66
Dacoity 2 . . . . 18 6
Robbery 6 13 4 17 3
Burglary 3 . . 1 1 5
Rioting 69 . . 40 63 54
Theft 63 67 36 51 20
Minor Offences . . . . . . . . . .
Offences against
Women . . 228 153 400 140
Others 727 925 564 1145 391
Total 892 1268 846 1852 685
XIII. JUDICIAL AND POLICEOffences reported, cases tried,persons convicted and
acquitted for different classes of the offencein the district of Jalpaiguri
Table 13.1 (Number)Class of Offence Offences Reported
1999 2000 2001 2002 2003(1) (2) (3) (4) (5) (6)
Murder 150 158 152 92 108
Dacoity 27 41 36 13 7
Robbery 48 42 59 27 22
Burglary 33 27 28 9 7
Rioting 113 . . 110 47 59
Theft 572 510 461 400 474
Minor Offences . . 185 180 . . . .
Offences against
Women . . 301 321 319 376
Others 1219 1291 1138 1181 1405
Total 2162 2555 2485 2088 2458
149148
Progress in Tourism in the district of Jalpaiguri Table 12.7
Year No. of No. of No. of No. of No. of TotalVehicle Trips Tourist Tourist Tourist earning
conducted Carried Staying in Lodge ('000Tourist Lodge (Govt.) Rs.)
(1) (2) (3) (4) (5) (6) (7)1999-00 . . 75 375 14627 7 5915
2000-01 . . 50 300 13117 7 5656
2001-02 . . 52 350 13825 7 6163
2002-03 . . 55 415 14940 7 6603
2003-04 . . 806 8712 18619 10 10692 Sources: - 1) Malbazar, WBTDC 2) Madarihat, WBTDC 3) Holong, WBTDC 4) Buxaduar, Forest Deptt. W.B.
5) Testa Paryatak Abas, Jalpaiguri6) Murti Forest Bunglow 7) Chalsa Tourist Lodge8) Eco. Tourism (Lataguri) 9)Gurumara Soth Bunglow
10) Chapramari Forest Bunglow.
155
XIV. LOCAL BODIESPopulation, Receipt and Expenditure of Municipalities
in the district of JalpaiguriTable 14.1 ('000 Rs.)Name of Date of Popu- 1999-00 2000-01 2001-02Municipality establish- lation Rec- Expe- Rec- Expe- Rec- Expe-
ment (2001) eipt nditure eipt nditure eipt nditure(1) (2) (3) (4) (5) (6) (7) (8) (9)
Jalpaiguri 01-04-1885 100348 68180 68157 71464 64721 63885 62031
Mal 18-08-1989(R) 23218 9504 10901 16619 15145 36282 36282
Alipurduar 07-02-1957 72999 39246 21883 37874 29163 42416 35736
Dhupguri 01-06-2002 38099 - - - - - -
Table 14.1(Concld.) ('000 Rs.)Name of Date of Popu- 2002-03 2003-04Municipality establish- lation Rec- Expe- Rec- Expe-
ment (2001) eipt nditure eipt nditure (1) (2) (3) (10) (11) (12) (13) Jalpaiguri 01-04-1885 100348 100631 73948 89780 82577
Mal 18-08-1989(R) 23218 38682 21792 32181 17612
Alipurduar 07-02-1957 72999 66821 30622 62752 34470
Dhupguri 01-06-2002 38099 11455 8178 12320 7456
Sources : All Municipalities, Jalpaiguri.
154
Strength of Police Force by category in the district of JalpaiguriTable 13.3 (Number)
Category of Year police force 1999 2000 2001 2002 2003 (1) (2) (3) (4) (5) (6)
1. Superintendent 1 1 1 1 12. Addl. Superintendent 2 2 2 2 23. Dy. Superintendent 4 4 4 4 44. S.D.P.O 1 1 1 2 25. Inspector 19 18 19 18 206. Sub-Inspector 125 131 136 150 1507. Sergeant (Armed S.I.) - - - - -8. J.C.O. - - - - -9. Asstt.Sergeant(A.S.I.) 139 123 121 160 160
10. Head Constable 89 87 85 94 9411. Naik 29 29 29 29 2912. Constable 1122 1095 1148 1169 1169
Total 1531 1491 1546 1629 1631 Source: Superintendent of Police,
Jalpaiguri.
153
Police Stations and Out-posts in different Sub-divisions
in the district of Jalpaiguri
Table 13.2 (Number)
Name of Police Station Out-post
Sub-division 1999 2000 2001 2002 2003 1999 2000 2001 2002 2003
(1) (2) (3) (4) (5) (6) (7) (8) (9) (10) (11)
Sadar 9 9 6 6 6 3 3 3 3 3
Mal - - 3 3 3 - - - 1 1
Alipurduar 7 7 8 8 8 5 5 2 4 4
Total 16 16 17 17 17 8 8 5 8 8
Source: Supdt. of Police,
Jalpaiguri
Table 13.1(Concld.) (Number)Class of Offence Persons Acquitted
1999 2000 2001 2002 2003(1) (17) (18) (19) (20) (21)
Murder . . 22 60 28 127
Dacoity . . . . . . 3 17
Robbery 2 12 6 3 5
Burglary 3 . . 2 3 9
Rioting 194 . . 182 45 371
Theft 94 85 82 22 56
Minor Offences . . . . . . . . . .
Offences against
Women . . 195 343 99 277
Others 516 817 938 458 823
Total 809 1131 1613 661 1685
Source : Superintendent of Police,
Jalpaiguri
152

������������ ������ ��� ������ ��� ������ ��� ������ ��� ������ �������� ��� �� ��� �� ��� �� ��� �� ���
158
Net
Col
lect
ion
from
Sm
all S
avin
gs in
the
dis
tric
t of
Jal
paig
uri
Tabl
e :1
5.2
('
000
Rs.
)Ye
ar/S
ub-D
iv./
Achi
evem
ent
Year
/Sub
-Div
./Ac
hiev
emen
tC
.D.B
lock
/MC
.D.B
lock
/M(1
)(2
)(1
)(2
)19
99-0
083
4367
2002
-03
1155
300
2000
-01
9935
1920
03-0
413
4487
320
01-0
210
4126
6Ye
ar 2
003-
04Sa
dar
Sub-
Div.
6428
28M
etia
li24
306
Raj
ganj
2016
5N
agra
kata
1073
5Ja
lpai
guri
4924
3Al
ipur
duar
Sub
-Div.
5236
00Ja
lpai
guri(
M)
4705
96Ku
mar
gram
3976
8M
ayna
guri
4232
4Fa
laka
ta64
353
Dhu
pgur
i23
834
Mad
arih
at &
Birp
ara
6932
2D
hupg
uri(M
)36
666
Kalc
hini
6270
8M
al S
ub-D
iv.17
8445
Alip
urdu
ar-I
7080
0M
al69
467
Alip
urdu
ar-II
9224
9M
al(M
)73
937
Alip
urdu
ar(M
)12
4400
So
urce
: D
y. D
irect
or o
f Sm
all S
avin
gs, J
alpa
igur
i.
157
Table 15.1(Concld.) ('000 Rs.)Year Entertain- Electri- Agri. Professional Other Total
ment Tax city Duty Income Tax Tax Taxes(1) (7) (8) (9) (10) (11) (12)
1999-00 8633 1116 10370 30028 32895 5688662000-01 8855 1099 3090 30470 36465 5163062001-02 6740 2582 3968 37086 38066 5806142002-03 5659 1471 6242 40000 2108 5762982003-04 5739 1486 2845 21061 2516 695117
Source: District Magistrate, Jalpaiguri.
XV. FINANCERevenue collected from different sources
in the district of JalpaiguriTable 15.1 ('000 Rs.)
Year Land Stamp Revenue & Excise Sales Taxes onRevenue Registration fees Revenue Tax Vehicles
(1) (2) (3) (4) (5) (6)1999-00 31163 94508 259133 68125 328952000-01 22503 92204 217693 67462 364652001-02 49465 107228 222261 75152 380662002-03 49151 132590 235161 52200 517162003-04 95775 162618 263573 87616 51888
156
Table 14.2 (Concld.) ('000 Rs.)
Name of Date of 2002-03 2003-04 Zilla establi- Receipt Expendi- Receipt Expendi-Parishad shment ture ture
(1) (2) (9) (10) (11) (12) Jalpaiguri 20-10-1964 820488 1146005 800170 963300
Source: Zilla Parishad, Jalpaiguri.
Receipt & Expenditure of Jalpaiguri Zilla Parishad
Table 14.2 ('000 Rs.)
Name of Date of 1999-00 2000-01 2001-02Zilla establi- Receipt Expendi- Receipt Expendi- Receipt Expen-
Parishad shment ture ture diture(1) (2) (3) (4) (5) (6) (7) (8)
Jalpaiguri 20-10-1964 799024 553760 487478 338400 1261951 1163421
JALPAIGURI
Related Documents