BLINN COLLEGE ANNUAL FINANCIAL REPORT For the Fiscal Year Ended August 31, 2018 D I STRICT

Welcome message from author
This document is posted to help you gain knowledge. Please leave a comment to let me know what you think about it! Share it to your friends and learn new things together.
Transcript

BLINN COLLEGE
ANNUAL FINANCIAL REPORT
For the Fiscal Year Ended August 31, 2018
D I STRICT

Blinn College District Annual Financial Report
For the Fiscal Year Ended August 3 I, 2018

BLINN COLLEGE DISTRICT Table of Contents
INTRODUCTORY SECTION Letters of Transmittal .... ..... .............. ........ ... .. .. ....... ....... .... .. ... .. .............. ... ..... .. .. ....... . Organizational Data ...................................................... ... .... .................. ..... .... .......... .
FINANCIAL SECTION Independent Auditors' Report on the Financial Statements
and Supplemental I,~f'ormation ... ..... .... .... ..... ..... ... .. .... ................. ..... .................. . Management's Discussion and Analysis ............... .. .............. .... ....... ........... .... ... .... . .
Basic Financial Statements Statements of Net Position (Exhibit 1 ) .... .................. ... .......... ......... .. .... ... ... ..... ... .. Statements of Financial Position (Exhibit 1-A) .................................................. .. Statements of Revenues, Expenses, and Changes in Net Position (Exhibit 2) .... . Statements of Activities (Exhibit 2-A) .... ........................................ .. ....... ............ . Statements of Cash Flows (Exhibit 3) .. ............ ................ .................. .......... ........ . Notes to Financial Statements ..... ... ............ ....................... ... ..... ... ......... ..... .......... .
Required Supplementary !,~formation (RSI) Schedules Schedule of District's Proportionate Share of Net Pension Liability . . .......... .. Schedule of District' s Pension Contributions .................................... .. ..... . Schedule of District's Proportionate Share of Net OPEB Liability ............ .... .... .. Schedule of District's OPEB Contributions .. ........ ... .... .. ..... ............................ ..... . Notes to Required Supplementary Information .... ... . .... ..... ...................... .
Supplementary Schedules Schedules A Schedule of Operating Revenues ............................................................. . B Schedule of Operating Expenses by Object ...... .. .. .... .......... .................... .. C Schedule of Non-Operating Revenues and Expenses ............ ......... ........ .. D Schedule of Net Position by Source and Availability ............... .......... .... .. E Schedule of Expenditures of Federal Awards .. ..... ........... ................ .... ... .. F Schedule of Expenditures of State Awards .... .. .... ... ........... .......... ..... ..... .. .
Notes to Schedules of Expenditures of Federal and State Awards .......... .
AUDITOR'S REPORTS ON CONTROLS AND COMPLIANCE AND SCHEDULE OF FINDINGS AND QUESTIONED COSTS Independent Auditor's Report on Internal Control over Financial Repo1iing and on
Compliance and Other Matters Based on an Audit of Financial Statements Perfonned in Accordance with Governmental Auditing Standards .... .... .. .... .... .. ..
Independent Auditor' s Report on Compliance for Each Major Program and on Internal Control over Compliance Required by The Unifonn Guidance and The State of Texas Single Audit Circular ...................... .. ...... .... .................. ..
Schedule of Findings and Questioned Costs .............. ...... ................... ... .. ......... ....... ..
Page
7
8 11
20 21 22 23 25 26
55 56 57 58 59
62 63 64 65 66 67 68
69
71 74
INTRODUCTORY SECTION
Chancellor of the Blinn College District
M;iry H,cn-:, iCV. EfJ.D
BOARD OF TRUSTEES
Chair Ct1mtcs Mo,-c r
Secretary 1:iavitl S011m10 r
Members
T111,odo,a · Tccld'( V. Boeh, 11
1)011glc1s R. Go, r: 11 ,rnlt
Dc111 G,rcwnocJ
! 1n11 l l0rt0, ,
/\1v1c1c1cl C. 1,1: n111rc1
December 3, 2018
~~ ..... . 11nn. "1a1·
BLINN COLLEGE DISTRICT.
To the Board of Trustees and Citizens of Blinn College,
This Comprehensive Annual Financial Report for the fiscal year ended August 31, 2018, has been developed to provide the public a complete financial picture of the Blinn College District. This document plays an important role in meeting the College's strategic objective to promote inclusive and transparent financial and budgeting processes. By sharing clear financial information and data, we provide stakeholders a clear vision of the College's priorities and its vision for the future.
As thi~ report demonstrates, Blinn has utilized a variety of funding strategies to minimize debt while developing the first-class facilities necessary to meet the growing and changing needs of the communities it serves. With the development of the Walter C. Schwartz Building at the RELLIS Campus in partnership with The Texas A&M University System; the construction of Mill Creek Hall , a privately funded 464-bed student housing facility at the Brenham Campus; the opening of the Kruse Center and the Doyle Coatney Center on the Brenham Campus; and the expansion of the A.W. Hodde, Jr. Technical Education Center, Blinn is positioned to carry out its mission in an efficient and effective manner, and to continue to meet the needs of citizens throughout its service area.
Office of tl1e Cl1ancellor, Blinn College District
9 ) Colle)!.<' /1vrnt 1t' • Brenlw m. Tex,1<; 7 7833 • 979-830-41 ·12 • f .. nx 979-830-4 '.l .1.6 • cl 1,.1ncello1@,l) l1nr1.edu

November 28, 2018
ABLINN • COLLEGE. D S T R C T
To the Board of Trustees, Chancellor, and Citizens of the Blinn College District,
The following Comprehensive Annual Financial Report of the Blinn College District for the fiscal year ended August 31, 2018, is hereby submitted. Responsibility for the preparation and integrity of the financial information, and the completeness and fairness of the presentation, rests with the College District. The financial statements are prepared in accordance with Generally Accepted Accounting Principles (GAAP) as established by the Governmental Accounting Standards Board (GASB) and comply with Annual Financial Reporting Requirements for Texas Public Community and Junior Colleges as set forth by the Texas Higher Education Coordinating Board (THECB). The Notes to the Basic Financial Statements are provided in the financial section and are considered essential to fair presentation and adequate disclosure for this financial report. The notes include the Summary of Significant Accounting Policies for the College District and other necessary disclosures of important matters relating to the financial position of the College District. The notes are treated as an integral part of the financial statements and should be read in conjunction with those statements. The Management's Discussion and Analysis (MD&A) is provided to supplement the basic financial statements, related notes, and this transmittal letter. The purpose of the MD&A is to provide an objective and readable analysis of the College's financial activities.
To the best of our knowledge, the enclosed data is accurate in all material respects and is reported in a manner designed to present fairly the financial position and results of operations of the College District. All disclosures necessary to enable the reader to gain an understanding of the College's financial activities have been included.
The College District is required to undergo an annual federal single audit in conformity with the provisions of the Federal Single Audit Act, Title 2 U.S. Code of Federal Regulations Part 200, Un(form Administrative Requirements, Cost Principles, and Audit Requirements of Federal Awards, and an annual state single audit in conformity with the Texas Governor's Office of Budget and Planning Uniform Grant Management Standards Single Audit Circular. Information related to these Single Audits, including the schedule of expenditures of federal awards, schedule of expenditures of state awards, and auditor's reports on compliance and on internal controls, is included in the federal and state single audit sections of this report.
BUSINESS AND FINANCE DIVISION
902 College Avenue • Brenham, Texas 77833 • 979-830-4459
2
Historical Statement Blinn College, the Junior College District of Washington County, is located in Brenham, Texas, and serves a 13-county service area with campuses in Bryan, Sealy and Schu.lenbmg. 'J'he Col lege was founded in 1883 by the Southern German Conforence of the Methodist denomination under the narne of Mission Institution. ln 1889, the name ,vas changed to Blinn Memorial College in honor of the Reverend Christian Blinn of New York, who had donated a considernble sum of money to make the school possible. The institution was originally founded for the purpose or training young men for the ministry, but to meet the demands of the public, academic courses were added. After operating for five years as an institution for men only, Blinn ColJege was made coeducational in 1888. In 1927, the Board of Trustees, under the leadership of President Phil ip Deschner, organized a junior college, and in 1930 the school was merged with Southwestern University (Georgetown, Texas). In 1934, a new charter was procured by the citizens of Brenham, and a private nonsectarian junior college, under the name of Blinn College, was organized with nine regents as the board of control. In February 1937, all connection with Southwestern University and the Methodist denominations were severed. An election held in Washington County on June 8, 1937, for the purposes of creating a public junior college district and for levying a smal l tax, was successful. Blinn thus became the first county-owned junior college district in Texas. The College continues to operate as one of the largest of the state's 50 publicjunior/comn1unity college districts.
Service Area The service area of the Blinn College District includes the territory within Brazos, Burleson, Grimes, Madison, Waller, and Washington counties; the Mumford, Hearne, and Franklin Independent School Districts located in Robertson County; Austin County, other than the territory within the Wallis-Orchard Independent School District; the Milano and Gause Independent School Districts located in Milam County; the area of the Richards Independent School District located in Walker and Montgomery counties~ the area of the Bryan Independent School District located in Robertson County; Fayette County, other than the territory within the Smithville Independent School District; Lee County, other than the territory within the Elgin Independent School District; and the area of the Lexington Independent School District located in Bastrop, Milam, and Williamson counties.
Mission, Vision, and Values Mission Statement: Blinn College is building stronger communities by providing quality, comprehensive education, and empowering students to achieve excellence in their educational careers and personal goals.
Vision Statement: Shaping future academic, workforce, cultural, and economic leaders by providing excel lent instruction, resources, services, and innovative partnerships, fo r students and the community.
Core Values:
• Access
• Col labornt ion
• Diversity
• Excellence BUSINESS AND FINAN CE DIVISION
902 College Avenue • Brenham, Texas 77833 • 979-830-4459
3

• 1 nnovation • Respect • Service
Ecouomic Coudition and Outlook The Blinn College District continues to build on its financial strength with strong operating performance coupled with an increase in cash reserves. In February 2018, Moody's Investor Service upgraded the creditor analysis outlook from negative to stable. Moody's outlook was based on Blinn's steady growth in financial reserves and continued strong cash flow to support debt service.
The outlook for the College District continues to remain positive, with increases in enrollment expected with the completion of the RELLIS Campus and the established alliance wi th Texas A&M. In addition, the grand opening of Mill Creek Hall in Brenham has allowed the College to better satisfy the growing demand for student housing and increase enrollment at the Brenham Campus. Auxiliary revenue from both housing and food service will continue to increase.
As Blinn's grant infrastructure continues to develop, it is likely to create more funding opportunities for the institution. Workforce Development needs are also being addressed to satisfy the demand for specific skills among local employers and bring revenue growth to the College District.
Blinn 's adm inistration continues to maintain its fiscal responsibility to the community and its students by researching and implementing best practices that decrease costs, increase efficiency, and maximize the use of it resources.
Financial Planning and B11dgeli11g The Division of Business and Finance oversees the development and preparation of the College District's budget. The Division is responsible for coordinating all efforts relating to the compilation of information used to develop the college's fiscal year budget. The Budget Office collaborates with each member of the Executive Council to ensure that all budget requests are properly evaluated.
AH necessary budget fotms and information are made available to budget managers beginning in early spring. Budget managers review their unit's objectives for the current year and develop their unit objectives for the coming year, including any budget needed to accomplish the objective. Unit managers then review their proposed objectives with their next-level manager. The goal of the review is to prioritize objectives and to produce an integrated planning model that strengthens the connection between the strategic plan, related action plans and the budget, which is approved annually by the Board of Trustees. The budget is developed with broad-based staff involvement and is guided by budgetary, debt, and financial policies approved by the Board.
The budget is the major component of the College District' s financial plan: it includes an assessment of enrollment and a forecast of state appropriations and property tax revenues. The
BUSINESS AND FINANCE DIVISION
902 College Avenue • Brenham, Texas 77833 • 979-830-4459
4
budget also incorporates proposed increases for operational and strategic needs, short and longterm capital projects, preventive maintenance, debt management, and a reserve for contingency.
Major Initiatives The Blinn College District has devoted significant time and resources to expand its community partnerships and plan for the future. At The Texas A&M University System's RELLIS Campus, Blinn celebrated the grand opening of a new 83 ,000-square-foot faci lity that will allow students to learn cutting-edge, high-demand skills in an environment that encourages collaboration between public institutions and private companies. This new location establishes a new educational community combining a major university system and a community co llege at a single physical location, and will allow Blinn students to complete their freshman and sophomore-level coursework prior to their seamless transfer to Texas A&M System universities located at the RELLJS Campus. The RELLIS Campus also serves as the home of career and technical education programs offered in partnership with the Texas A&M Engineering Extension Service (TEEX). These programs are designed with community input to meet the local worldorce's job-training needs, particularly in skilled construction trades.
Blinn also is positioning itself for growth at Blinn College-Brenham with the grand opening of a new student housing facility that accommodate 462 additional students and addresses the need for additional student housing in the Brenham area. This project is funded by National Campus and Community Development-Blinn CoJlege Properties, LLC, a 50 I ( c)J nonprofit organization established to provide tax-exempt financing specifically for this project. The Col lege and NCCDBlinn College Properties have entered into a 35-year ground lease, and upon loan repayment by NCCD, the facility will revert to Blinn.
Other projects completed this year include the development of the Kruse Center, a student recreation and activities center at Blinn-Brenham, made possible through a generous private donation. In addition, the College District participated in the construction of the Technical Education Annex at the A.W. Hodde, Jr. Technical Education Center, a project funded primarily through a grant obtained through the U.S. Economic Development Administration's Economic Development Ass.istance Program. The College District also renovated its food service space to support the anticipated increase demand in student meal plans generated from additional student housing.
Independent Audit State statutes require an annual audit by independent certified public accountants. The College District' s Board of Trustees selected the accounting firm of Lott, Vernon & Company, P.C. In addit ion to meeting the requirements set forth in state statutes, their aud it was designed to meet the requi rements of the Federal Single Audit Act, Title 2 U.S. Code of Federal Regulations Part 200, Uniform Administrative Requiremenrs, Cost Principles and Audir Requirements t>f Federal 11"wards and the State of Texas Single Audit Circular.
A ck110 111/edgeme11ts The 131 inn College District would like to extend its appreciation to the Board of Trustees and Administration for their continuous commitment to the responsible financial management and planning of the Blinn College District. We especially would like to acknowledge the District's
BUSINESS AND FINANCE DIVISION
902 College Avenue • Brenham, Texas 77833 • 979-830-4459
5
Financial Services personnel as well as those throughout the District whose efforts helped compile this report. Thanks also are extended to Lott, Vernon & Company, P.C. , for completing a timely and productive audit.
Sincerely,
Richard Cervantes Vice Chancellor, Business and Finance/CFO Blinn College District
BUSINESS AND FINANCE DIVISION
902 College Avenue • Brenham, Texas 77833 • 979-830-4459
6
Members
Charles Moser Richard Powell David Sommer Stacy Aschenbeck
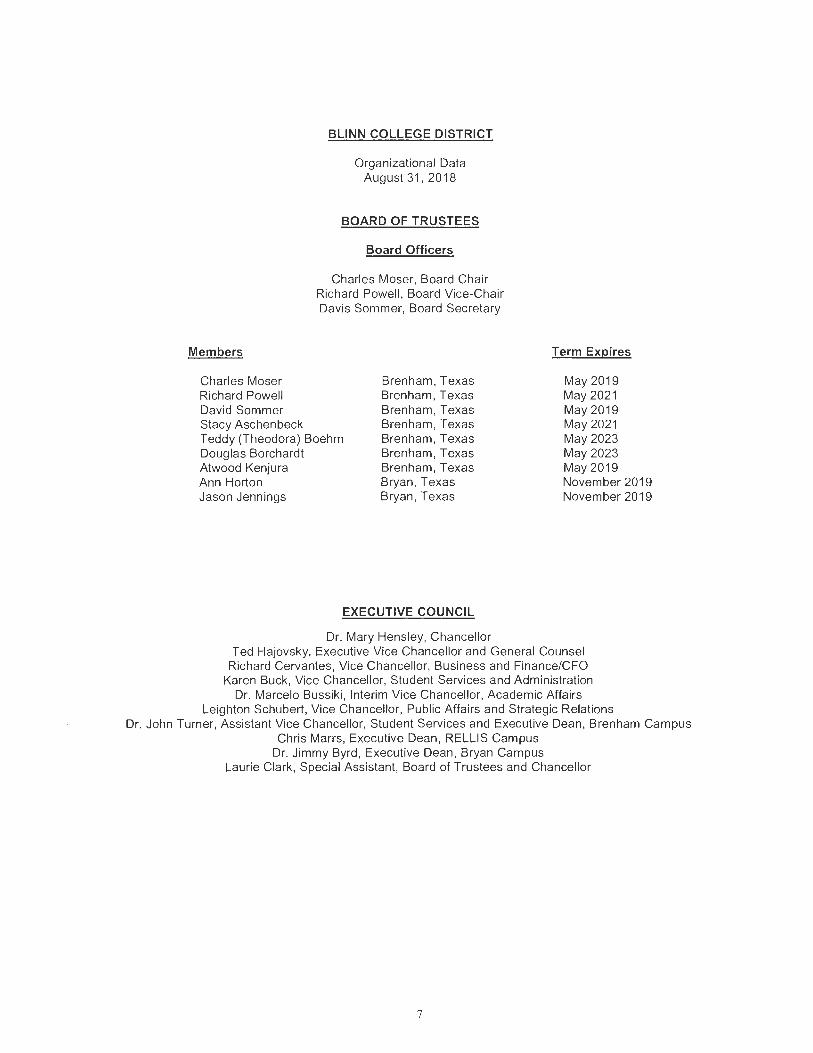
BLINN COLLEGE DISTRICT
Organizational Data August 31, 2018
BOARD OF TRUSTEES
Board Officers
Charles Moser, Board Chair Richard Powell , Board Vice-Chair Davis Sommer, Board Secretary
Teddy (Theodora) Boehm Douglas Borchardt Atwood Kenjura
Brenham, Texas Brenham, Texas Brenham, Texas Brenham, Texas Brenham, Texas Brenham, Texas Brenham, Texas Bryan, Texas Bryan, Texas
Ann Horton Jason Jennings
EXECUTIVE COUNCIL
Dr. Mary Hensley, Chancellor
Term Expires
May 2019 May 2021 May2019 May 2021 May 2023 May 2023 May2019 November 201 9 November 2019
Ted Hajovsky, Executive Vice Chancellor and General Counsel Richard Cervantes, Vice Chancellor, Business and Finance/CFO
Karen Buck, Vice Chancellor, Student Services and Administration Dr. Marcelo Bussiki, Interim Vice Chancellor, Academic Affairs
Leighton Schubert, Vice Chancellor, Public Affairs and Strategic Relations Dr. John Turner, Assistant Vice Chancellor, Student Services and Executive Dean, Brenham Campus
Chris Marrs, Executive Dean, RELLIS Campus Dr. Jimmy Byrd, Executive Dean, Bryan Campus
Laurie Clark, Special Assistant, Board of Trustees and Chancellor
7

FINANCIAL SECTION

~ LOTT, VERNON & COMPANY, P.C.
CERTIFIED PUBLIC ACCOUNTANTS
KILLEEN • COPPERAS COVE • TEMPLE
20 SOUTH FOURTH STREET POST OFFICE BOX 160 TEMPLE, TEXAS 76503
Member of
254 / 778 / 4783 800 I 460 I 4783 FAX 254/778/ 4792
American Institute & Texas Society of Certified Public Accountants
INDEPENDENT AUDITORS' REPORT ON THE FINANCIAL STATEMENTS AND SUPPLEMENTAL INFORMATION
Board of Trustees Blinn College District Brenham, Texas
Report on the Financial Statements
We have audited the accompanying financial statements of Blinn College District, (the District) as of and for the years ended August 31, 2018 and 2017, and the related notes to the financial statements, which collectively comprise the District's basic financial statements as listed in the table of contents.
Management's Responsibility for the Financial Statements
Management is responsible for the preparation and fair presentation of these financial statements in accordance with accounting principles generally accepted in the United States of America; this includes the design, implementation, and maintenance of internal control relevant to the preparation and fair presentation of financial statements that are free from material misstatement, whether due to fraud or error.
Auditor's Responsibility
Our responsibility is to express opinions on these financial statements based on our audits. We conducted our audits in accordance with auditing standards generally accepted in the United States of America, and the standards applicable to financial audits contained in Government Auditing Standards, issued by the Comptroller General of the United States. Those standards require that we plan and perfo1m the audit to obtain reasonable assurance about whether the financial statements are free of material misstatement.
8
INDEPENDENT AUDITORS' REPORT ON THE FINANCIAL STATEMENTS AND SUPPLEMENTAL INFORMATION (CONTINUED)
An audit involves performing procedures to obtain audit evidence about the amounts and disclosures in the financial statements. The procedures selected depend on the auditor' s judgment, including the assessment of the risks of material misstatement of the financial statements, whether due to fraud or error. In making those risk assessments, the auditor considers internal control relevant to the entity' s preparation and fair presentation of the financial statements in order to design audit procedures that are appropriate in the circumstances, but not for the purpose of expressing an opinion on the effectiveness of the entity's internal control. Accordingly, we express no such opinion.
An audit also includes evaluating the appropriateness of accounting policies used and the reasonableness of significant accounting estimates made by management, as well as evaluating the overall presentation of the financial statements. We believe that the audi t evidence we have obtained is sufficient and appropriate to provide a basis for our audit opinions.
Opinions
In our opinion, the financial statements referred to above present fairly, in all material respects, the respective financial position of Blinn College District as of August 31, 2018 and 201 7, and the respective changes in financial position, and cash flows for the years then ended 111
accordance with accounting principles generally accepted in the United States of America.
Other Matters
Required Supplementary Information
Accounting principles generally accepted in the United States of America require that the management 's discussion and analysis, the Schedule of District 's Proportionate Share of Net Pension Liability, the Schedule of District ' s Pensions Contributions, the Schedule of District ' s Proportionate Share of Net OPEB Liability, and the Schedule of District's OPEB Contributions as listed in the table of contents be presented to supplement the basic fi nancial statements. Such information, although not a part of the basic financi al statements, is required by the Governmental Accounting Standards Board, who considers it to be an essential part of financial reporting for placing the financial statements in an appropriate operational, economic, or historical context. We have applied certain limited procedures to the required supplementary information in accordance with auditing standards generally accepted in the United States of America, which consisted of inquiries of management about the methods of preparing the information and comparing the information for consistency with management' s responses to our inquiries, the basic financial statements, and other knowledge we obtained during our audit of the basic financial statements. We do not express an opinion or provide any assurance on the information because the limited procedures do not provide us with suffici ent evidence to express an opinion or provide any assurance.
9

INDEPENDENT AUDITORS' REPORT ON THE FINANCIAL ST A TEMENTS AND SUPPLEMENT AL INFORMATION (CONTINUED)
Other Jnfonnation
Our audit was conducted for the purpose of forming opinions on the financial statements that coll ectively comprise the District 's basic financial statements. The introductory section, supplementary schedules (Schedules A through D) as described in lhe lable of contents, are presented for purposes of additional analysis and are not a required part of the basic financial statements. The accompanying schedule of expenditures of federal awards (Schedule E) and schedule of expenditures of state awards (Schedule F) are presented for purposes of additional analysis as required by Title 2 U.S. Code of Federal Regulations (CFR) Part 200, Uniform Administrative Requirements, Cost Principles, and Audit Requirements.for Federal Awards, and the State of Texas Single Audit Circular, and are also not a required part of the basic financial statements.
The supplemental schedules, the schedule of expenditures of federa l awards and the schedule of expenditures of state awards are the responsibility of management and were derived from and relate directly to the underlying accounting and other records used to prepare the financial statements. Such information has been subjected to the auditing procedures applied in the audit of the financial statements and certain additional procedures, including comparing and reconciling such information directly to the underlying accounting and other records used to prepare the financial statements or to the financial statements themselves, and other additional procedures in accordance with auditing standards generally accepted in the United States of America. In our opinion, the information is fairly stated in all material respects in relation to the financial statements as a whole.
The introductory section has not been subjected to the auditing procedures applied in the audit of the basic financial statements and, accordingly, we do not express an opinion or provide any assurance on it.
Other Reporting Required by Government Auditing Standards
In accordance with Government Auditing Standards , we have also issued our repo1i dated November 27, 2018, on our consideration of the District ' s internal control over financial reporting and on our tests of its compliance with certain provisions of laws, regulations, contracts, and grant agreements and other matters. The purpose of that report is to describe the scope of our testing of internal control over financial reporting and compliance and the results of that testing, and not to provide an opinion on internal control over financial reporting or on compliance. That report is an integral part of an audit performed in accordance with Government Auditing Standards in considering the District's internal contro l over financial reporting and compliance.
~ e::~ ~ ~I/)( November 27, 2018
JO
MANAGEMENT'S DISCUSSION AND ANALYSIS
The following discussion and analysis of Blinn College's (the District) annual financial statements provides an overview of the District's financial performance for the fiscal years ended August 31 , 2018 and August 31, 2017. Management's discussion and analysis based on management's knowledge of current activities, resultant changes and known facts; therefore, it should be read in conjunction with the accompanying basic financial statements and associated notes. The basic financial statements, notes and this discussion are the responsibility of management.
Financial Highlights and Significant Activities for 2018
The District's net position decreased approximately $35.0 million, or 28%. This decrease is the resu lt of a prior period adjustment of $(50.6) million from the implementation of GASB Statement No. 75, Accounting and Reporting for Post-Employment Benefits Other Than Pensions (OPEB), pertaining to retiree health insurance liability.
Total operating expenses increased $7.3 million, or 7%. This increase is primarily attributable to an increase in operation and maintenance of plant of $4.8 million, scholarships and fellowships of $1 .8 million, instructional and general of $0.4 million , institutional support of $0.2 million, and auxiliary enterprises of $0.1 million.
Financial Highlights and Significant Activities for 2017
The District's net position increased approximately $16.9 million, or 15%.
Total operating expenses decreased $0.9 million, or 0.8%. This decrease is primarily attributable to a decrease in operation and maintenance of plant of $2.9 million, and a decrease in depreciation expense of $0.4 million offset by increases in scholarships and fellowships of $1.2 million, auxiliary enterprises of $0.4 million, instruction of $0.4 million and academic support of $0.4 million.
11
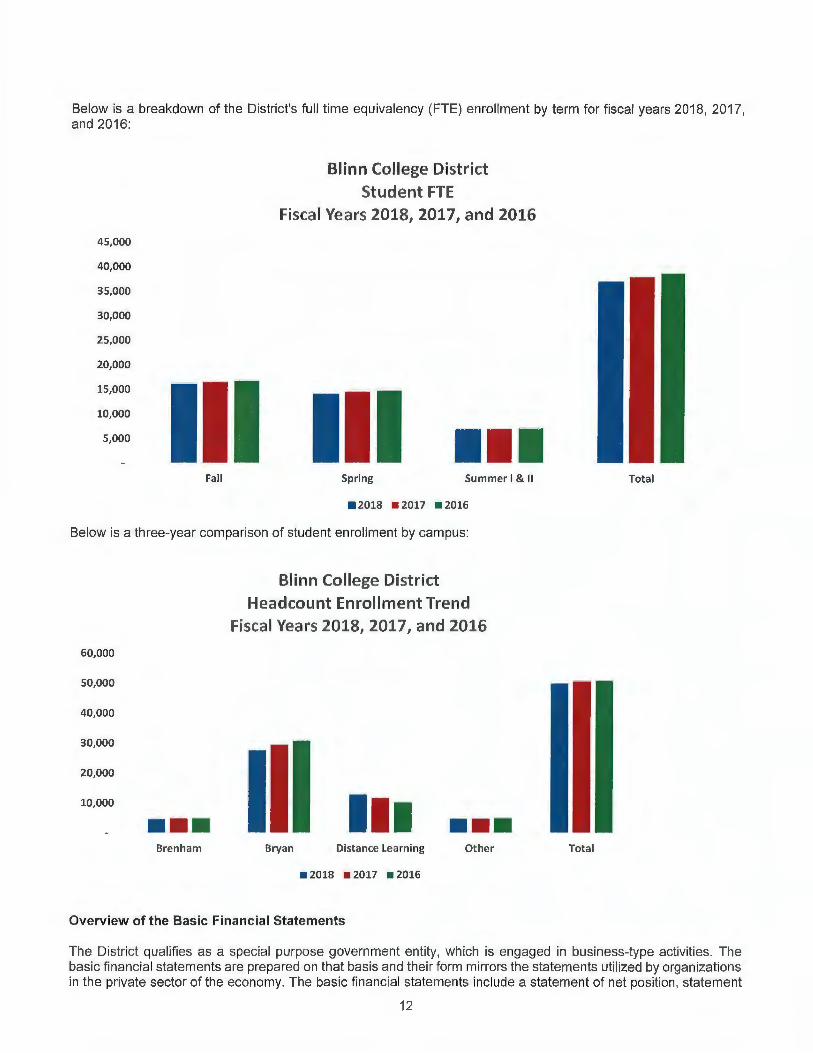
Below is a breakdown of the District's fu ll time equivalency (FTE) enrollment by term for fisca l years 2018, 2017, and 2016:
45,000
40,000
35,000
30,000
25,000
20,000
15,000
II 10,000
5,000
Fall
Blinn College District Student FTE
Fiscal Years 2018, 2017, and 2016
Ill I l l Spring Su mmer I & II
• 2018 • 2017 • 2016
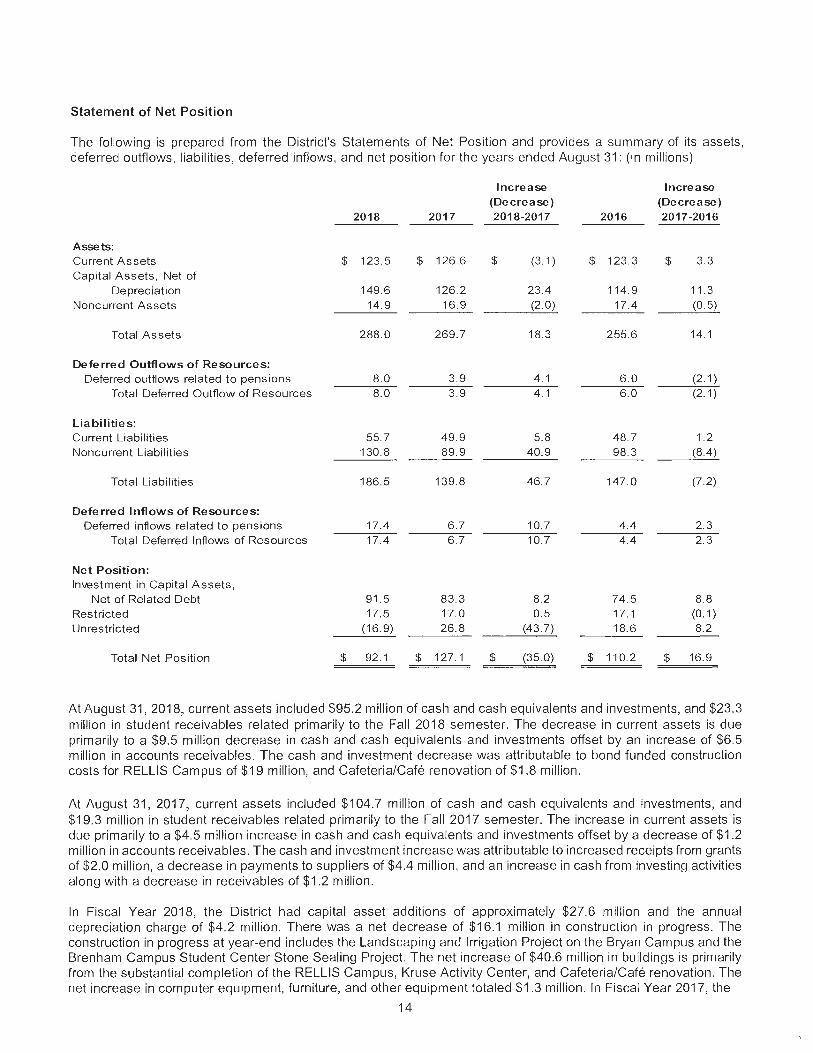
Below is a three-year comparison of student enro llment by campus:
60,000
50,000
40,000
30,000
20,000
10,000
••• Brenham
Blinn College District
Headcount Enrollment Trend Fiscal Years 2018, 2017, and 2016
I l l • •• Bryan Distance Learning Other
• 2018 • 2017 • 2016
Overview of the Basic Financial Statements
Tota l
Total
The District qualifies as a special purpose government entity, which is engaged in business-type activities. The basic financial statements are prepared on that basis and the ir form mirrors the statements utilized by organizations in the private sector of the economy. The bas ic fi nancial statements include a statement of net position, statement
12

of revenues , expenses and changes in net position, statement of cash flows, and notes to the basic financial statements.
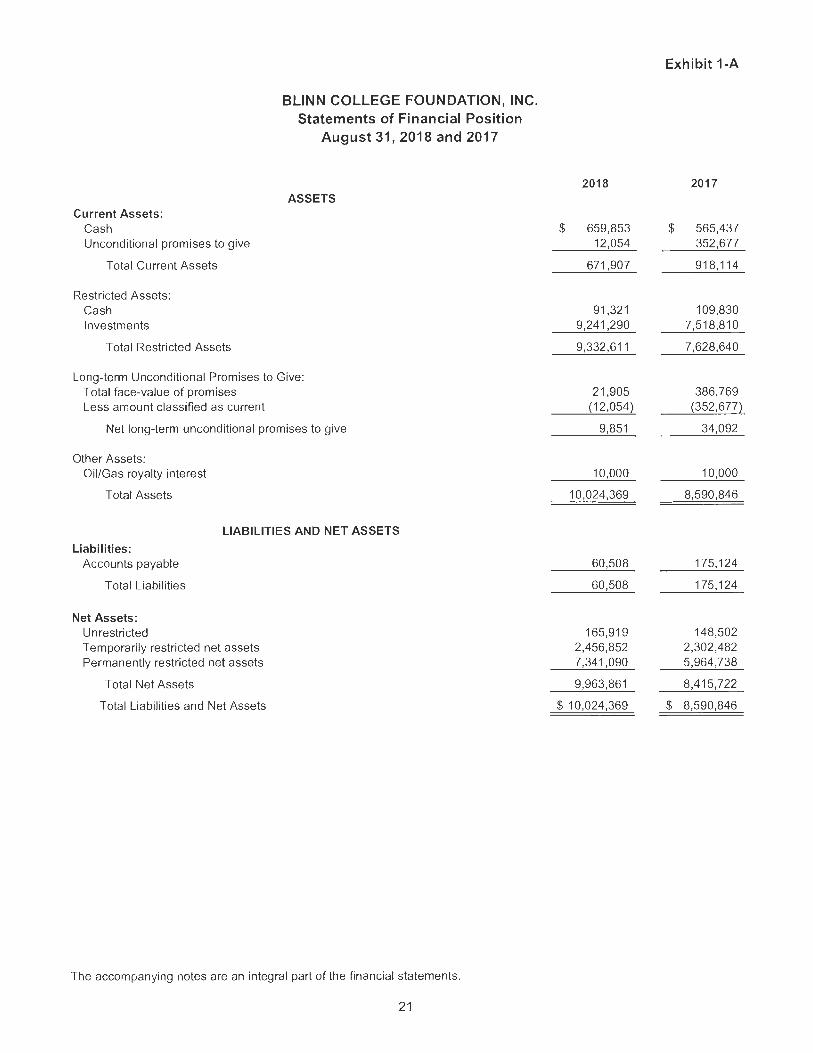
Financial statements for the District's component unit, Blinn College Foundation, Inc. (the Foundation) are issued independent to those of the District but are presented with the District's basic financial statements.
The statement of net position's focus is to report the total net resources available to f inance future services. The statement presents all assets and liabilities of the District, and the change in net position as of the end of the fiscal year. The statement is prepared under the accrual basis of accounting, in which revenues ;:ind assets are recognized when earned, and expenses and liabilities are recognized when incurred regardless of when cash is received or paid . The difference between assets, deferred outflows of resources, liabilities, and deferred inflows of resources is net position, which is one indicator of the financial cond ition of the District when considered with other factors such as changes in enrollment, contact hours, student retention, and other non-financial information. The statement of net position is useful in determining the assets available to continue operations, as well as how much the District owes vendors, bondholders, and other entities at the end of the year.
The statement of revenues, expenses, and changes in net position denotes the results of business activities as revenues earned and expenses incurred over the course of the f iscal year. The statement also provides information regarding how the net position of the District changed during the year. The statement is divided into the operating results of the District as well as the non-operating revenues and expenses. Operating revenues are primarily those that result from instruction (tuition and fees), the operation of the District's auxiliary services (student housing, cafeteria, athletics, etc.) and Federal and State grants. State appropriations, property tax receipts, Federal revenues (Title IV funds), and interest income, while budgeted for operations, are considered to be non-operating revenues. Depreciation is shown as an operating expense in accordance with generally accepted accounting principles .
The statement of cash flows presents the information related to cash inflows and cash outflows summarized by operating, financing, and investing activities . This statement presents cash receipt and cash disbursement information without consideration of the earning event. This information is crucial to determining the District's fiscal viability and its ability to meet f inancial obligations as they mature, and helps users assess the District's ability to generate net cash flows, its abil ity to meet its obligations as they come due, and its need for external financing.
The notes to the basic financial statements provide required disclosures and other information that are essential to a full understanding of material data provided in the statements. The notes also present information about the District's accounting policies, significant account balances and activities, and contingencies.
13
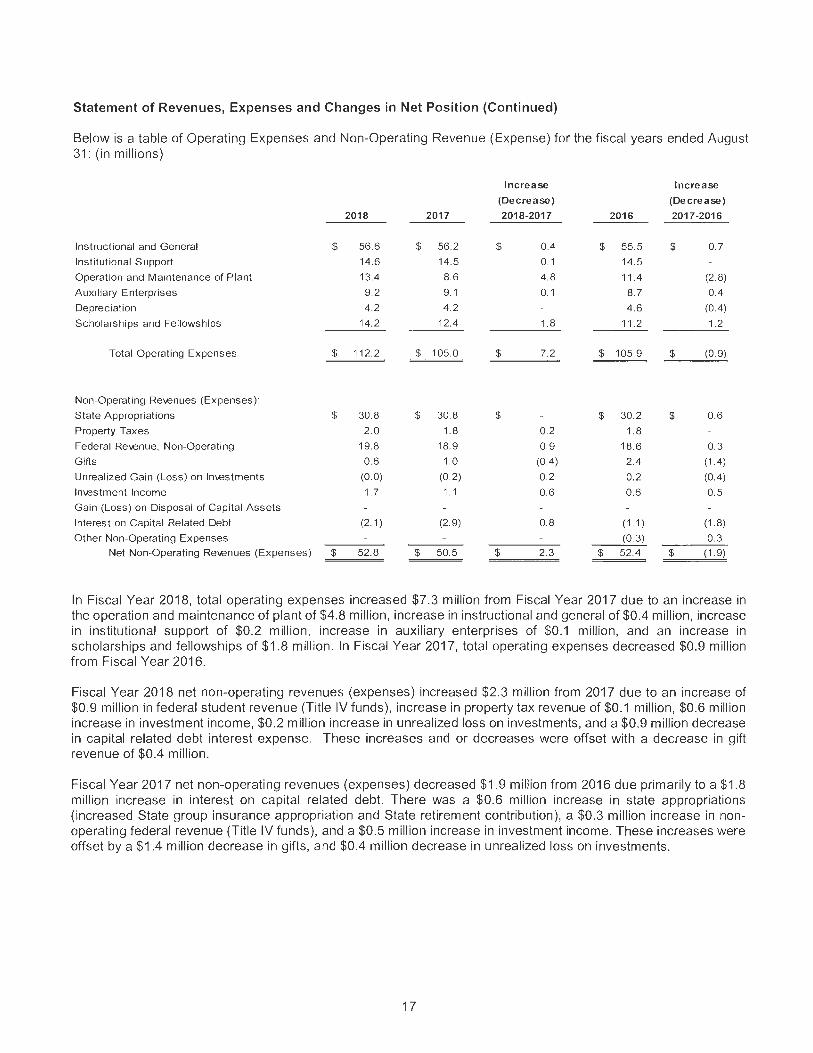
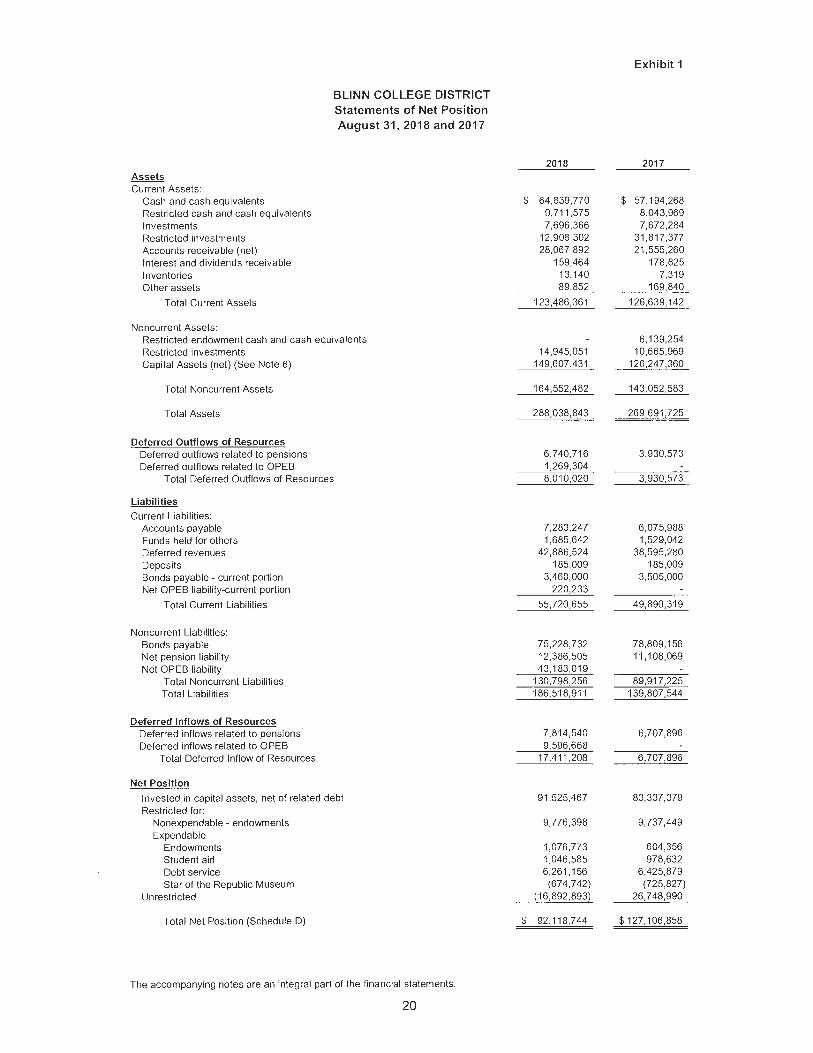
Statement of Net Position
The following is prepared from the District's Statements of Net Pos ition and provides a summary of its assets, deferred outflows, liabilities, deferred inflows, and net position for the years ended August 31: (in millions)
Increase Increase (Decrease ) (Decrease )
2018 2017 2018-2017 2016 2017-2016
Assets: Current Assets $ 123.5 $ 126.6 $ (3. 1) $ 123.3 $ 3.3 Capita l Assets, Net of
Depreciation 149.6 126.2 23.4 114. 9 11.3 Noncurrent Assets 14.9 16.9 (2 .0) 17.4 (0.5)
Tota l Assets 288.0 269.7 18.3 255.6 14.1
Deferred Outflows of Resources: Deferred outflows re lated to pensions 8.0 3.9 4.1 6 .0 (2.1)
Total Deferred Outflow of Resources 8.0 3 .9 4.1 6.0 (2 . 1)
Liabilities: Current Liabilities 55.7 49.9 5.8 48.7 1.2 Noncurrent Liabilities 130.8 89.9 40.9 98.3 (8.4)
Total Liabilities 186.5 139.8 46.7 147.0 (7.2)
Deferred Inflows of Resources: Deferred inflows related to pensions 17.4 6.7 10.7 4.4 2 .3
Total Deferred Inflows of Resources 17.4 6.7 10.7 4.4 2.3
Net Position: Investment in Capital Assets,
Net of Related Debt 91.5 83.3 8.2 74.5 8.8 Restricted 17.5 17.0 0.5 17.1 (0.1) Unrestricted (16. 9) 26.8 (43. 7) 18.6 8.2
Total Net Position $ 92 .1 $ 127.1 $ (35.0) $ 110.2 $ 16.9
At August 31, 2018, current assets included $95.2 million of cash and cash equ ivalents and investments, and $23.3 million in student receivables related primarily to the Fall 2018 semester. The decrease in current assets is due primarily to a $9.5 million decrease in cash and cash equ ivalents and investments offset by an increase of $6.5 million in accounts receivables . The cash and investment decrease was attributable to bond funded construction costs for RELLIS Campus of $19 million, and Cafeteria/Cafe renovation of $1.8 million.
At August 31, 201 7, current assets included $104.7 million of cash and cash equivalents and investments, and $19.3 million in student receivables related primarily to the Fall 2017 semester. The increase in current assets is due primarily to a $4 .5 million increase in cash and cash equ ivalents and investments offset by a decrease of $1.2 million in accounts receivables. The cash and investment increase was attributable to increased receipts from grants of $2.0 million, a decrease in payments to suppliers of $4.4 million, and an increase in cash from investing activities along with a decrease in receivables of $1.2 million.
In Fiscal Year 2018, the District had capital asset additions of approximately $27.6 million and the annual depreciation charge of $4.2 million. There was a net decrease of $16.1 million in construction in progress. The construction in progress at year-end includes the Landscaping and Irrigation Project on the Bryan Campus and the Brenham Campus Student Center Stone Sealing Project. The net increase of $40.6 million in buildings is primarily from the substantial completion of the RELLIS Campus, Kruse Activ ity Center, and Cafeteria/Cafe renovation . The net increase in computer equipment, furniture, and other equ ipment totaled $1.3 million. In Fisca l Year 2017, the
14

Statement of Net Position (Continued)
District had capital asset additions of approximately $15.5 million offset by the annual depreciation charge of $4.2 million.
The District's noncurrent assets include funds restricted for endowments, debt service, and other investments. Noncurrent assets decreased $1.9 million in Fiscal Year 2018 due primarily to the decrease in bond funds. In Fiscal Year 2017, noncurrent assets decreased $0.5 million due primarily to a decrease in required debt service investments.
Current liabilities increased $5.8 million in Fiscal Year 2018. Payables on close out of construction projects at August 31, 2018, increased accounts payable by $1.2 million. Funds held for others also increased $0.2 million. Deferred revenues increased $4.3 million related to the Fall 2018 semester enrollment. Implementation of GASB Statement No. 75, Accounting and Financial Reporting for Post-Employment Benefits Other than Pensions, increased current liabilities by $0.2 million. Current liabilities increased $1.2 million in Fiscal Year 2017 compared to Fiscal Year 2016.
Noncurrent liabilities increased $40.9 million in Fiscal Year 2018. The bonds payable decrease of $3.6 million is a result of scheduled principal payment of existing bonds. The adjustment for the net pension liability during Fiscal Year 2018 was an increase of $1 .3 million. In Fiscal Year 2018, the District implemented the provisions of GASB Statement No. 75, Accounting and Financial Reporting for Post-Employment Benefits Other Than Pensions. The District reported a liability for OPEB of $43.2 million at August 31 , 2018 for its proportionate share of Employee Retirement System of Texas (ERS) net retiree health insurance liability.
Fiscal Year 2017 had a decrease of $8.4 million in noncurrent liabilities because of a $3.5 million decrease in bonds payable and a $4.8 million decrease in net pension liability. The bonds payable decrease is due to the full amortization of the 2003 Bond Series.
In Fiscal Year 2015, the District implemented the provisions of GASB Statement No. 68, Accounting and Financial Reporting for Pensions, as amended by GASB Statement No. 71, Pension Transition for Contributions Made Subsequent to the Measurement Date. The District has reported a liability of $12 million and $11 million at August 31, 2018, and 2017, respectively, for its proportionate share of the Teacher Retirement System of Texas (TRS) net pension liability.
15

Statement of Revenues, Expenses and Changes in Net Position
The following summary is prepared from the District's Statements of Revenues, Expenses, and Changes in Net Position for the fiscal years ended August 31: (in millions)
Operating Revenues:
Student Tuition and Fees, Net
Federal Grants and Contracts
State Grants and Contracts
Auxiliary Enterprises, Net
Other
Total Operating Revenues
Less Operating Expenses
Operating Loss
Nonoperating Revenues(Expenses)
State Appropriations
Property Taxes
Federal Revenue, Nonoperating
Gifts
Investment Income
Unrealized Gain(Loss) Investments
Interest on Capital Related Debt
Other
Total Nonoperating Revenues
Income Before Other Revenue
Additions (Deductions) to Endowments
Total Increase in Net Position
Net Position, Beginning of Year
Cumulative Effect of Change in Accounting Principle
Net Position, Beginning of Year, as restated
Net Position, End of Year
2018
$ 57.0
0.8
2.6
13.5
1.2
75.1
112.2
(37.1)
30.8
2.0
19.8
0.6
1. 7
0.0
(2.1)
52.8
15.7
0.0
15.7
127.1
(50.7)
76.4
$ 92.1
2017
$ 55.7
0.7
2.0
11.9
1.0
71.3
105.0
(33.7)
30.8
1.8
18.9
1.0
1.1
(0.2)
(2.9)
50.5
16.8
0.1
16.9
110.2
110.2
$ 127.1
Increase
(Decrease)
2018-2017
$ 1.3
0.1
0.6
1.6
0.2
3.8
7.2
(3.4)
0.2
0.9
(0.4)
0.6
0.2
0.8
2.3
(1.1)
(0.1)
(1.1)
16.9
(50.7)
(33.8)
$ (34.9)
2016
$ 55.1
0.6
2.0
11.9
1.3
70.9
105.9
(35.0)
30.2
1.8
18.6
2.4
0.6
0.2
(1.1)
(0.3)
52.4
17.4
17.4
92.8
92.8
$ 110.2
Increase
(Decrease)
2017-2016
$ 0.6
0.1
(0.3)
0.4
(0.9)
1.3
0.6
0.3
(1.4)
0.5
(0.4)
(1.8)
0.3
(1.9)
(0.6)
0.1
(0.5)
17.4
17.4
$ 16.9
Total operating revenues increased $3.8 million from 2017. Auxiliary enterprises revenues increased $1.6 million, net student tuition and fees increased $1.3 million. Federal and State Grants increased $0.7 million in total from 2017.
During Fiscal Year 2017, the total operating revenues increased $0.4 million from 2016. This slight increase was primarily due from $0.6 million increase in tuition and fees. Enrollment for the 2016-2017 academic year was down 1.8% when compared to 2015-2016 academic year; however, tuition and fee rates were changed in 2017, which allowed a slight increase in revenue .
16
Statement of Revenues, Expenses and Changes in Net Position (Continued)
Below is a table of Operating Expenses and Non-Operating Revenue (Expense) for the fiscal years ended August 31: (in mi ll ions)
2018 2017
Instruc tional and General $ 56.6 $ 56.2
Institutional S upport 14.6 14.5
Operation and Maintenance of Plant 13.4 8.6
A ux iliary Ente rprises 9.2 9. 1
Depreciation 4 .2 4.2
Scholarships and Fe llowships 14.2 12.4
Total Operating Expenses $ 11 2.2 $ 105.0
Non-Operat ing Re1.enues (Expenses):
S tate Appropriations $ 30.8 $ 30.8
Property Taxes 2.0 1.8
Federal Re1.enue, Non-Operating 19.8 18.9
G ifts 0.6 1.0
Unrealized Gain (Loss) on ln1.estments (0.0) (0.2)
ln1.estment Income 1.7 1.1
Gain (Loss) on Disposal of Capital A ssets
lnteres t on Capital Related Debt (2. 1) (2.9)
Other Non-Operating Expenses
Net Non-Operating Re1.enues (Expenses) $ 52.8 $ 50.5
Increase
(Decrease)
2018-2017
$
$
$
$
0.4
0.1
4 .8
0. 1
1.8
7.2
0.2
0.9
(0.4)
0. 2
0.6
0.8
2 .3
$
$
$
$
2016
55.5
14.5
11 .4
8.7
4.6
11 .2
105.9
30.2
1.8
18.6
2.4
0. 2
0.6
(1.1)
(0.3)
52.4
Incre ase
(Decrease)
2017-2016
$
$
$
$
0.7
(2.8)
0.4
(0. 4)
1.2
(0.9)
0.6
0.3
(1.4)
(0.4)
0.5
(1.8)
0.3
(1.9)
In Fiscal Year 2018, total operating expenses increased $7.3 million from Fiscal Year 2017 due to an increase in the operation and maintenance of plant of $4.8 million, increase in instructional and general of $0.4 million, increase in institutional support of $0.2 million, increase in auxiliary enterprises of $0.1 million, and an increase in scholarships and fellowships of $1.8 million. In Fiscal Year 2017, total operating expenses decreased $0.9 mill ion from Fiscal Year 2016.
Fiscal Year 2018 net non-operating revenues (expenses) increased $2.3 mill ion from 2017 due to an increase of $0.9 mill ion in federal student revenue (Title IV funds), increase in property tax revenue of $0.1 million, $0.6 million increase in investment income, $0.2 million increase in unrealized loss on investments, and a $0.9 million decrease in capital related debt interest expense. These increases and or decreases were offset with a decrease in gift revenue of $0.4 million.
Fiscal Year 2017 net non-operating revenues (expenses) decreased $1 .9 mill ion from 2016 due primarily to a $1.8 mil lion increase in interest on capital related debt. There was a $0.6 mil lion increase in state appropriations (increased State group insurance appropriation and State reti rement contribution), a $0.3 mill ion increase in nonoperating federal revenue (Title IV funds), and a $0.5 million increase in investment income. These increases were offset by a $1.4 mill ion decrease in gifts, and $0.4 million decrease in unrealized loss on investments.
17
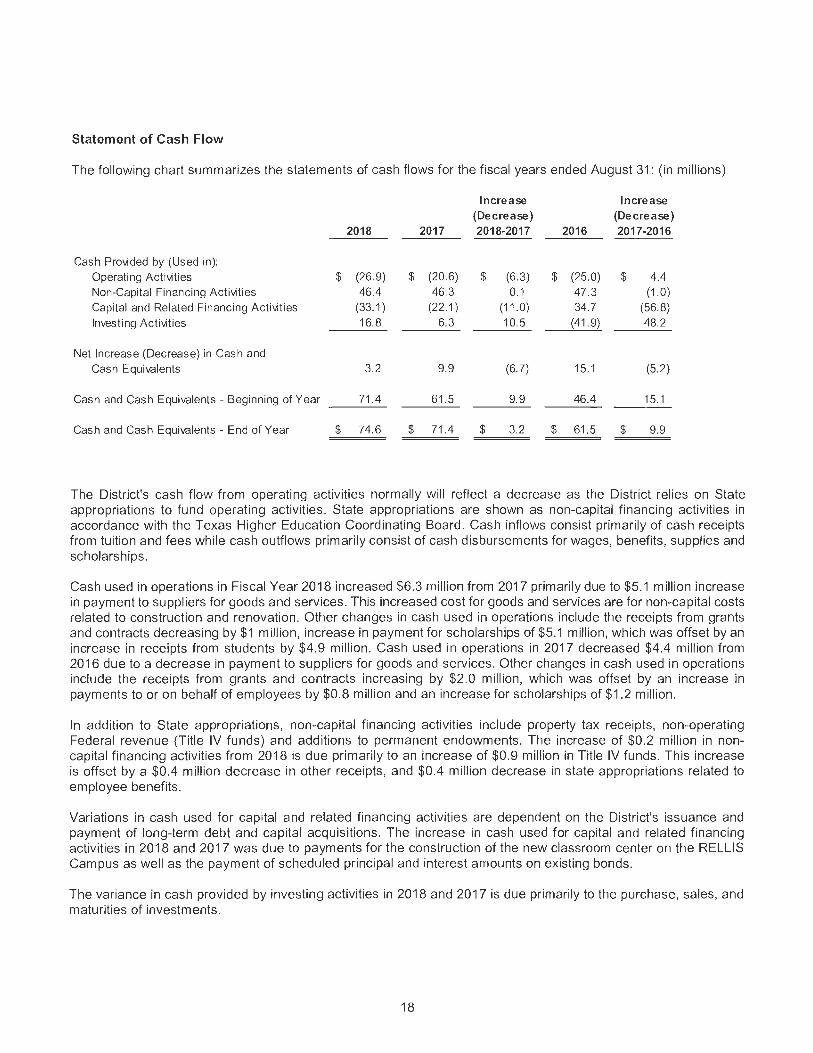
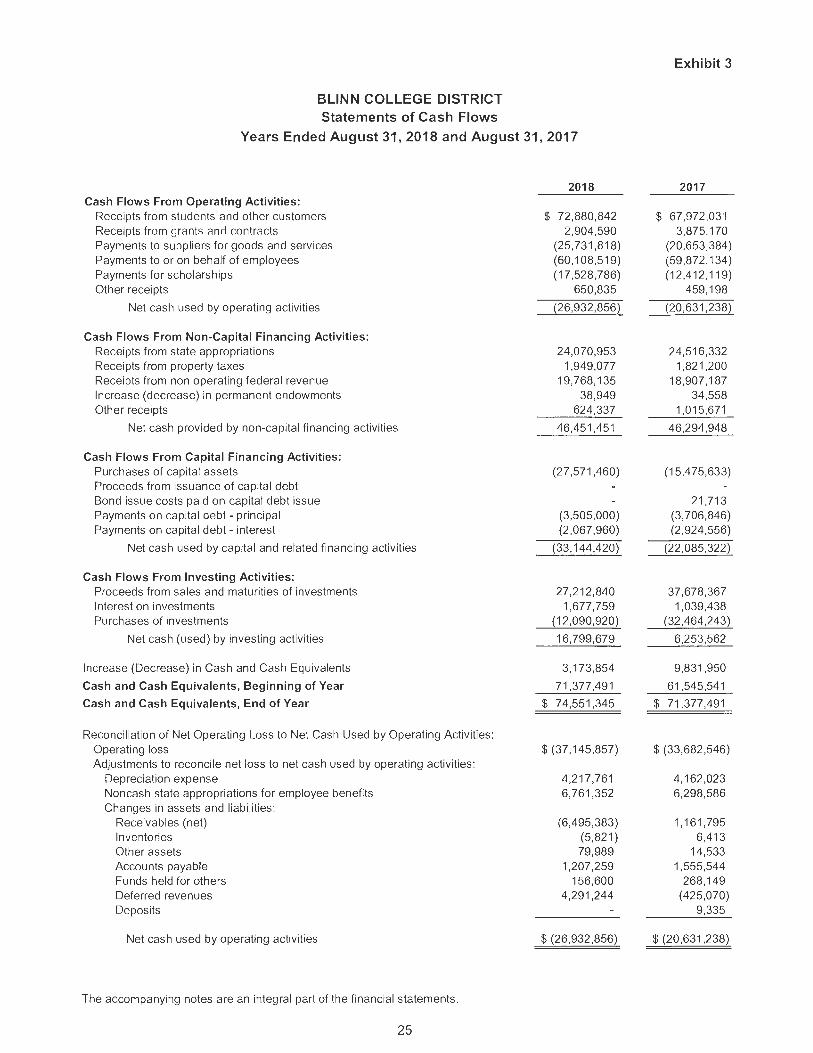
Statement of Cash Flow
The following chart summarizes the statements of cash flows for the fiscal years ended August 31: (in millions)
Increase Increase (Decrease) (Decrease)
2018 2017 2018-2017 2016 2017-2016
Cash Provided by (Used in):
Operating Activities $ (26.9) $ (20.6) $ (6.3) $ (25.0) $ 4.4 Non-Capital Financing Activities 46.4 46.3 0.1 47.3 (1 .0) Capital and Related Financing Activities (33.1) (22.1) (11.0) 34.7 (56.8)
Investing Activities 16.8 6.3 10.5 (41.9) 48.2
Net Increase (Decrease) in Cash and
Cash Equivalents 3.2 9.9 (6.7) 15.1 (5.2)
Cash and Cash Equivalents - Beginn ing of Year 71.4 61.5 9.9 46.4 15.1
Cash and Cash Equivalents - End of Year $ 74.6 $ 71.4 $ 3.2 $ 61 .5 $ 9.9
The District's cash flow from operating activities normally will reflect a decrease as the District relies on State appropriations to fund operating activities. State appropriations are shown as non-capital financing activities in accordance with the Texas Higher Education Coordinating Board. Cash inflows consist primari ly of cash receipts from tuition and fees while cash outflows primarily consist of cash disbursements for wages, benefits, supplies and scholarships.
Cash used in operations in Fiscal Year 2018 increased $6.3 million from 2017 primarily due to $5.1 million increase in payment to suppliers for goods and services. This increased cost for goods and services are for non-capital costs related to construction and renovation. Other changes in cash used in operations include the receipts from grants and contracts decreasing by $1 million, increase in payment for scholarships of $5.1 mill ion, which was offset by an increase in receipts from students by $4.9 mil lion. Cash used in operations in 2017 decreased $4.4 million from 2016 due to a decrease in payment to suppliers for goods and services. Other changes in cash used in operations include the receipts from grants and contracts increasing by $2.0 mill ion, which was offset by an increase in payments to or on behalf of employees by $0.8 million and an increase for scholarships of $1 .2 million.
In addition to State appropriations, non-capital financing activities include property tax receipts, non-operating Federal revenue (Title IV funds) and additions to permanent endowments. The increase of $0.2 million in noncapital financing activities from 2018 is due primarily to an increase of $0.9 million in Title IV funds. This increase is offset by a $0.4 million decrease in other receipts, and $0.4 million decrease in state appropriations related to employee benefits.
Variations in cash used for capital and related financing activities are dependent on the District's issuance and payment of long-term debt and capital acquisitions. The increase in cash used for capital and related financing activities in 2018 and 2017 was due to payments for the construction of the new classroom center on the RELLIS Campus as well as the payment of scheduled principal and interest amounts on existing bonds.
The variance in cash provided by investing activities in 201 8 and 2017 is due primarily to the purchase, sales, and maturities of investments.
18

Capital Assets and Debt Administration
In Fiscal Year 2018, the District had capital additions of approximately $27.6 million. Capital additions comprised of $19.6 million for the Bryan RELLIS Campus, $2.4 million for the Brenham Kruse Activity Center, $1 .8 mill ion for the renovation of the Brenham Cafeteria/Cafe, $1.4 million for Brenham Mill Creek Dorm parking lot, $1 million of furniture and equipment and $1.4 million in other col lege wide capital asset additions.
In Fiscal Year 2017, the District had capita l additions of approximately $15.5 million, including $5.4 million for the Kruse Center on the Brenham Campus, $1.1 million for a new indoor batting and classroom facility on the Brenham Campus, $5.9 million for the Bryan RELLIS Campus, $1.5 mil lion for landscaping, irrigation, and access improvement on the Bryan Villa Maria Campus, $0.8 million for technology equipment college wide and $0.8 million in other college wide capita l asset additions.
Future Considerations
With an academic transfer rate that ranks second among Texas community colleges and close partnerships with Texas A&M, Baylor, Sam Houston State and Texas State universities, and the universities of Texas and Houston, Blinn is an established destination for Texas students seeking an affordable pathway to a bachelor's degree. Unique co-enrollment partnerships such as the TEAM (Transfer Enrollment at A&M) and Texas A&M Engineering Academies at Blinn provide seamless transfer opportunities for students seeking degrees at Texas A&M University.
Blinn continues to invest in strategic capital projects to encourage and accommodate enrol lment growth. The District recently completed a $27 million building on the new Texas A&M's RELLIS Campus. This new campus establishes a new educational community combining a major university system and a community col lege at a single physical location. Blinn will begin hosting courses at its new RELLIS academic facility beginning in the Fall 2018 semester. This unique educational environment al lows seamless pathways for students seeking degrees from institutions across The Texas A&M System.
On the Brenham Campus, the District will be constructing a new 6,000 square foot Agriculture Building. This new building will include livestock demonstration space, tack room, farrowing house, livestock pens, and a livestock chute. This facility will allow hands-on-learning opportunities within offered credit courses. Adding this new facility to the Agriculture complex allows increased programming options to attract more students to the Brenham campus in the form of leadership events, departmental preview days, and youth campus. Agriculture is an immensely diverse field, so having a complex that reflects that diversity is paramount for future recruitment efforts .
Management expects Blinn College's market position to remain strong, operating performance to remain positive, and pledged revenues to remain strong to support debt service.
Contacting the District's Financial Management
This financial report is designed to provide the District's citizens, taxpayers, students, investors, and creditors a general overview of the District's finances and to demonstrate the District's accountability for the money it receives. If you have any questions about this report or need additional information, contact the Finance and Administrative Services Office at 902 Col lege Avenue, Brenham, Texas 77833.
19
BLINN COLLEGE DISTRICT Statements of Net Position August 31, 2018 and 2017
Current Assets: Cash and cash equivalents Restricted cash and cash equivalents Investments Restricted inveslrnenl;; Accounts receivable (net) Interest and dividends receivable Inventories Other assets
Total Current Assets
Noncurrent Assets: Restricted endowment cash and cash equivalents Restricted investments Capital Assets (net) (See Note 6)
Total Noncurrent Assets
Total Assets
Deferred Outflows of Resources Deferred outflows related to pensions Deferred outflows related to OPEB
Total Deferred Outflows of Resources
Liabilities Current Liabilities:
Accounts payable Funds held for others Deferred revenues Deposits Bonds payable - current portion Net OPEB liabi lity-current portion
Total Current Liabilities
Noncurrent Liabilities: Bonds payable Net pension liability Net OPEB liability
Total Noncurrent Liabilities Total Liabilities
Deferred Inflows of Resources Deferred inflows related to pensions Deferred inflows related to OPEB
Total Deferred Inflow of Resources
Net Position
Invested in capital assets, net of related debt Restricted for:
Nonexpendable - endowments Expendable
Endowments Student aid Debt service Star of the Republic Museum
Unrestricted
Total Net Position (Schedule D)
The accompanying notes are an integral part of the financial statements.
20
$
$
Exhibit 1
2018 2017
64 ,839,770 $ 57,194,268 0,711,575 8,043,060 7,696 ,366 7,672,284
12,908 ,302 31,817,377 28,067,892 21,555,260
159,464 178,825 13,140 7,319 89,852 169,840
123,486,361 126,639,142
6,139,254 14,945,051 10,665,969
149,607,431 126,247,360
164,552,482 143,052,583
288,038,843 269,691,725
6,740,716 3,930,573 1,269,304 8,010,020 3,930,573
7,283,247 6,075,988 1,685,642 1,529,042
42,886,524 38,595,280 185,009 185,009
3,460,000 3,505,000 220,233
55,720,655 49,890,319
75,228,732 78,809,156 12,386,505 11,108,069 43,183,019
130,798,256 89,917,225 186,518,911 139,807,544
7,814,540 6,707,896 9,596 ,668
17,411,208 6,707,896
91,525,467 83,337,379
9,776,398 9,737,449
1,076,773 604,356 1,046,585 978,632 6,261 ,156 6,425,879 (674,742) (725,827)
(16 ,892 ,893) 26,748,990
92 ,118,744 $127,106,858
Current Assets: Cash Unconditional promises to give
Total Current Assets
Restricted Assets: Cash Investments
Total Restricted Assets
BLINN COLLEGE FOUNDATION, INC. Statements of Financial Position
August 31, 2018 and 2017
ASSETS
Long-term Unconditional Promises to Give: Total face-value of promises Less amount classified as current
Net long-term unconditional promises to give
Other Assets: Oil/Gas roya lty interest
Tota l Assets
LIABILITIES AND NET ASSETS
Liabilities: Accounts payable
Total Liabilities
Net Assets: Un restricted Temporari ly restricted net assets Permanently restricted net assets
Total Net Assets
Total Liabilities and Net Assets
The accompanying notes are an integral part of the financial statements.
21
Exhibit 1-A
2018 2017
$ 659,853 $ 565,437 12,054 352,677
671,907 918,11 4
91,32 1 109,830 9,241,290 7,518,810
9,332 ,611 7,628,640
21,905 386,769 (12,054) (352,677)
9,851 34,092
10,000 10,000
10,024,369 8,590,846
60,508 175,1 24
60,508 175,124
165,919 148,502 2,456,852 2,302,482 7,341,090 5,964,738
9,963,861 8,415,722
$ 10,024,369 $ 8,590,846

BLINN COLLEGE DISTRICT Statements of Revenues, Expenses and Changes in Net Position
Years Ended August 31, 2018 and August 31, 2017
Operating Revenues Tuition and Fees (net of discounts of
$13,667,651 and $14,016,370, respectively} Federal Grants and Contracts State Grants and Contracts Sales and Services of Educational Activities Auxiliary Enterprises (net of discounts of $909,408
and $955,480, respectively) Other Operating Revenues
Total Operating Revenues (Schedule A)
Operating Expenses Instruction Public Service Academic Support Student Services Institutional Support Operation and Maintenance of Plant Scholarships and Fellowships Auxiliary Enterprises Depreciation
Total Operating Expenses (Schedule B) Operating Loss
Non-Operating Revenues (Expenses) State Appropriations Property Taxes Federal Revenue, Non Operating Gifts Unrealized Gain (Loss) on Investments Investment Income Loss on Disposal of Capital Assets Interest on Capital Related Debt Other Non-Operating Expenses
Net Non-Operating Revenues (Schedule C)
Income Before Other Revenue
Other Revenue - Additions to Permanent Endowments
Increase in Net Position
Net Position Net Position, Beginning of Year
Adjustments to Net Position, Beginning of Year - Note 21 Adjusted Net Position, Beginning of Year
Net Position, End of Year
The accompanying notes are an integral part of the financial statements.
22
$
$
2018
56,999,952 801,002
2,633,900 512,769
13,526,11 3 650,835
75,124,571
39,706,221 1,883,304 8,589,810 6,427,925
14,633, 130 13,395,313 14,169,550
9,247,414 4,217,761
112,270,428 (37,145,857)
30,832,306 1,966,326
19,768, 135 624,337
3,899 1,654,499
1,550 (2,067,960)
52,783,092
15,637,235
38,949
15,676, 184
127,106,858 (50,664,298) 76,442,560
92,118,744
Exhibit 2
2017
$ 55,653, 177 654,945
2,034,738 565, 153
11 ,924,979 459,198
71,292,1 90
41,674,914 1,701,692 6,500,249 6,368,01 3
14,472,581 8,552,614
12,412, 11 9 9,130,531 4,162,023
104,974,736 (33,682,546)
30,814,918 1,831,612
18,907,187 1,015,671 (172,845)
1,052,057 (15,201)
(2,924,556) 21,713
50,530,556
16,848,010
34,558
16,882,568
110,224,290
110,224,290
$ 127,106,858

Exhibit 2-A
BLINN COLLEGE FOUNDATION, INC. Statement of Activities
For the Year Ended August 31, 2018
Temporari ly Permanently Unrestricted Restricted Restricted Total
Public Support and Revenues
Donations $ 2,009 $ 317,325 $ 1,298,987 $ 1,618,321 Fundraising 25,625 25,625 Investment income 25,566 685,595 711,161 Oil/Gas royalty 309 309 Endowment of temporarily restricted net assets (77,365) 77,365 Net assets released from purpose restrictions 796,810 (796,810)
Total Public Support and Revenues 824,694 154,370 1,376,352 2,355,416
Expenses
Program sevices: Expenditures for the benefit of Blinn College 397,705 397,705 Scholarships 376,814 376,814
Support sevices: Administrative expenses 28,000 28,000 Fundraising 4,758 4,758
Total Expenses 807,277 807,277
Change in Net Assets 17,417 154,370 1,376,352 1,548,139
Net Assets - Beginning of Year 148,502 2,302,482 5,964,738 8,415,722
Net Assets - End of Year $ 165,919 $ 2,456,852 $ 7,341,090 $9,963,861
The accompanying notes are an integral part of the financial statements.
23

BLINN COLLEGE FOUNDATION, INC. Statement of Activities
For the Year Ended August 31, 2017
Unrestricted
Public Support and Revenues
Donations $ 39,754 Fundraising Investment income 19,612 Oi l/Gas royalty 575 Endowment of temporarily restricted net assets Net assets released from purpose restrictions 1,210,41 5
Total Public Support and Revenues 1,270,356
Expenses
Program sevices: Expenditures for the benefit of Blinn College 913,916 Scholarships 306,868
Support sevices: Administrative expenses 25,646 Fundraising 1,883
Total Expenses 1,248,313
Change in Net Assets 22,043
Net Assets - Beginning of Year 126,459
Net Assets - End of Year $ 148,502
The accompanying notes are an integral part of the financia l statements.
24
Temporari ly Restricted
$ 306,192 2,960
616,690
(34,087) (1,210,415)
(318,660)
(318,660)
2,621,142
$ 2,302,482
Exhibit 2-A
Permanently Restricted Total
$ 249,185 $ 595,131 2,960
636,302 575
34,087
283,272 1,234,968
913,916 306,868
25,646 1,883
1,248,313
283,272 (1 3,345)
5,681,466 8,429,067
$ 5,964,738 $ 8,415,722
BLINN COLLEGE DISTRICT Statements of Cash Flows
Years Ended August 31, 2018 and August 31, 2017
2018 Cash Flows From Operating Activities:
Receipts from students and other customers $ 72,880,842 Receipts from orants .=incl r.ontrnr.ts 2.904.590 Payments to suppliers for goods and services (25,731,818) Payments to or on behalf of employees (60,108,519) Payments for scholarships (17,528,786) Other receipts 650,835
Net cash used by operating activities (26,932,856)
Cash Flows From Non-Capital Financing Activities: Receipts from state appropriations 24,070,953 Receipts from property taxes 1,949,077 Receipts from non operating federal revenue 19,768,135 Increase (decrease) in permanent endowments 38,949 Other receipts 624,337
Net cash provided by non-capital financing activities 46,451,451
Cash Flows From Capital Financing Activities: Purchases of capital assets (27,571,460) Proceeds from issuance of capital debt Bond issue costs paid on capital debt issue Payments on capital debt - principal (3,505,000) Payments on capital debt - interest (2,067,960)
Net cash used by capital and related financing activities (33,144,420)
Cash Flows From Investing Activities: Proceeds from sales and maturities of investments 27,212,840 Interest on investments 1,677,759 Purchases of investments (12,090,920)
Net cash (used) by investing activities 16,799,679
Increase (Decrease) in Cash and Cash Equivalents 3,173,854
Cash and Cash Equivalents, Beginning of Year 71,377,491
Cash and Cash Equivalents, End of Year $ 74,551,345
Reconciliation of Net Operating Loss to Net Cash Used by Operating Activities: Operating Joss $ (37,145,857) Adjustments to reconcile net loss to net cash used by operating activities:
Depreciation expense 4,217,761 Noncash state appropriations for employee benefits 6,761,352 Changes in assets and liabilities:
Receivables (net) (6,495,383) Inventories (5,821) Other assets 79,989 Accounts payable 1,207,259 Funds held for others 156,600 Deferred revenues 4,291,244 Deposits
Net cash used by operating activities $ (26,932,856)
The accompanying notes are an integral part of the financial statements.
25
Exhibit 3
2017
$ 67,972 ,03"1 3,875,170
(20,653,384) (59,872. 134) (12,41 2,11 9)
459,198
(20,631,238)
24,516,332 1,821 ,200
18,907, 187 34,558
1,015,671
46,294,948
(1 5,475,633)
21 ,713 (3,706,846) (2,924,556)
(22,085,322)
37,678,367 1,039,438
(32,464,243)
6,253,562
9,831,950
61,545,541
$ 71 ,377,491
$ (33,682,546)
4,162,023 6,298,586
1,161 ,795 6,413
14,533 1,555,544
268, 149 (425,070)
9,335
$ (20,631,238)
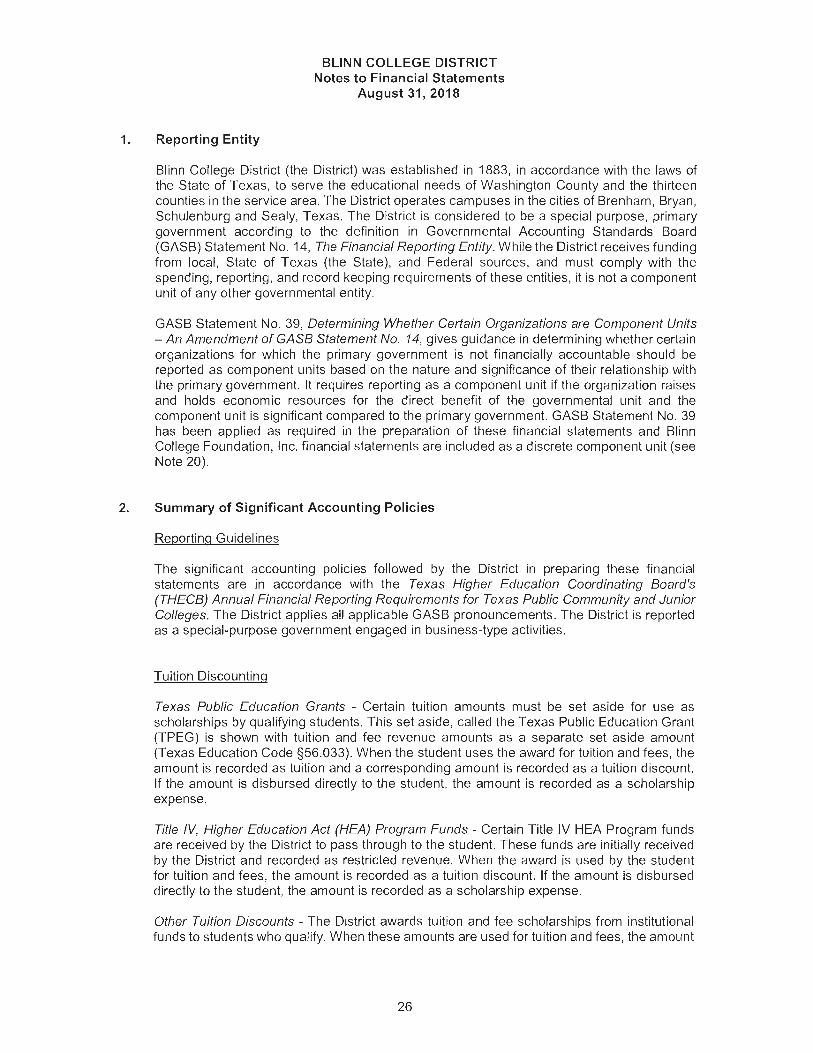
1. Reporting Entity
BLINN COLLEGE DISTRICT Notes to Financial Statements
August 31, 2018
Blinn College District (the District) was established in 1883, in accordance with the laws of the State of Texas, to serve the educational needs of Washington County and the thirteen counties in the service area. The District operates campuses in the cities of Brenham, Bryan, Schulenburg and Sealy, Texas. The District is considered to be a special purpose, primary government according to the definition in Governmental Accounting Standards Board (GASB) Statement No. 14, The Financial Reporting Entity While the District receives funding from local, State of Texas (the State) , and Federal sources, and must comply with the spending, reporting, and record keeping requirements of these entities, it is not a component unit of any other governmental entity.
GASB Statement No . 39, Determining Whether Certain Organizations are Component Units -An Amendment of GASB Statement No. 14, gives guidance in determining whether certain organizations for which the primary government is not financially accountable should be reported as component units based on the nature and significance of their relationship with the primary government. It requires reporting as a component unit if the organization raises and holds economic resources for the direct benefit of the governmental unit and the component unit is significant compared to the primary government. GASS Statement No. 39 has been applied as required in the preparation of these financial statements and Blinn College Foundation, Inc. financial statements are included as a discrete component unit (see Note 20) .
2. Summary of Significant Accounting Policies
Reporting Guidelines
The significant accounting policies followed by the District in preparing these financial statements are in accordance with the Texas Higher Education Coordinating Board's (THECB) Annual Financial Reporting Requirements for Texas Public Community and Junior Colleges. The District applies all applicable GASB pronouncements. The District is reported as a special-purpose government engaged in business-type activities .
Tuition Discounting
Texas Public Education Grants - Certain tuition amounts must be set aside for use as scholarships by qualifying students . This set aside, called the Texas Public Education Grant (TPEG) is shown with tuition and fee revenue amounts as a separate set aside amount (Texas Education Code §56.033). When the student uses the award for tuition and fees, the amount is recorded as tuition and a corresponding amount is recorded as a tuition discount. If the amount is disbursed directly to the student, the amount is recorded as a scholarship expense.
Title IV, Higher Education Act (HEA) Program Funds - Certain Title IV HEA Program funds are received by the District to pass through to the student. These funds are initially received by the District and recorded as restricted revenue. When the award is used by the student for tuition and fees , the amount is recorded as a tuition discount. If the amount is disbursed directly to the student , the amount is recorded as a scholarship expense.
Other Tuition Discounts - The District awards tuition and fee scholarships from institutional funds to students who qualify. When these amounts are used for tuition and fees , the amount
26

BLINN COLLEGE DISTRICT Notes to Financial Statements
August 31, 2018
is recorded as a tuition discount. If the amount is disbursed directly to the student, the amount is recorded as a scholarship expense.
Basis of Accounting
The financial statements of the District have been prepared on the accrual basis whereby all revenues are recorded when earned and all expenses are recorded when they have been reduced to a legal or contractual obligation to pay.
Budgetary Data
Each community college in Texas is required by law to prepare an annual operating budget of anticipated revenues and expenditures for the fiscal year beginning September 1. The District's Board of Trustees adopts the budget, which is prepared on the accrual basis of accounting. A copy of the approved budget and subsequent amendments must be filed with the Texas Higher Education Coordinating Board, Legislative Budget Board , Legislative Reference Library, and Governor's Office of Budget and Planning by December 1.
Cash and Cash Equivalents
The District's cash and cash equivalents are considered to be cash on hand, demand deposits and short-term investments with original maturities of three months or less from the date of acquisition . The Board of Trustees has designated public funds investment pools to be cash equivalents as the investments are redeemable on demand.
Deferred Inflows
In addition to liabilities, the statement of net position will sometimes report a separate section for deferred inflows of resources. This separate financial statement element, deferred inflows of resources, represents an acquisition of net position that applies to a future period(s) and so will not be recognized as an inflow of resources (revenue) until that time. Governments are only permitted to report deferred inflows in circumstances specifical ly authorized by the GASB.
Deferred Outflows
In addition to assets, the statement of net position will sometimes report a separate section for deferred outflows of resources. This separate financial statement element, deferred outflows of resources, represents a consumption of net position that applies to a future period(s) and so wil l not be recognized as an outflow of resources (expense) until that time. Governments are only permitted to report deferred outflows in circumstances specifically authorized by the GASB.
Estimates
The preparation of the financial statements in conformity with generally accepted accounting principles requires management to make estimates and assumptions that affect certain reported amounts and disclosures. Accordingly, actual results could differ from those estimates.
Operating and Non-Operating Revenue and Expense Pol icy
The District distinguishes operating revenues and expenses from non-operating items. The District reports as a BTA and as a single, proprietary fund. Operating revenues and expenses
27

BLINN COLLEGE DISTRICT Notes to Financial Statements
August 31, 2018
general ly result from providing services in connection with the District's principal ongoing operations. The principal operating revenues are tuition and related fees. The major nonoperating revenues are state appropriations and property tax collections. Operating expenses include the cost of sales and services, administrative expenses and depreciation on capita l assets. The operation of the bookstore is not performed by the District.
Investments
In accordance with GASB Statement No. 31, Accounting and Financial Reporting for Certain Investments and External Investment Pools, investments are reported at fair value. Fair values are based on published market rates. Short-term investments have an original maturity greater than three months but less than one year at time of purchase. Long-term investments have an original maturity of greater than one year at the time of purchase.
Inventories
Inventories consist of consumable office and physical plant supplies. Inventories are valued at cost under the first-in first-out method and are charged to expense as consumed.
Capital Assets
Capital assets are recorded at cost at the date of acquisition, or fair value at the date of donation. The District's capitalization policies include real or business personal property with a value equal to or greater than $5,000 and an estimated useful life in excess of one year. Renovations of $100,000 to buildings and land improvements that significantly increase the value or extend the useful life of the structure are capitalized . The cost of normal maintenance and repairs that do not add to the value of the asset or materially extend assets' lives are charged to operating expense in the year in which the expense is incurred. The District reports depreciation under a single-line item as a business-type unit. Depreciation is computed using the straight-line method over the following estimated useful lives of the assets:
Buildings Land improvements Library books Furniture, equipment and vehicles Computer systems
Museum Collections
50 years 20 years 15 years
5-10 years 5 years
In accordance with guidance issued by the Texas Comptroller of Public Accounts, collections located at the Star of the Republic Museum held for public exhibition are capitalized but not depreciated. Collections are valued at their historical cost or estimated fair value at date of donation.
Deferred Revenue
Tuition, fees, housing and meal charges of $42,230,595 and $37,719,243 and federal, state and local grants of $655,929 and $848,439 have been reported as deferred revenue at August 31, 2018 and 2017, respectively.
28

Pensions
BLINN COLLEGE DISTRICT Notes to Financial Statements
August 31, 2018
The District participates in the Teacher Retirement System of Texas (TRS) pension plan, a multiple-employer cost sharing defined benefit pension plan with a special funding situation. The fiduciary net position of TRS has been determined on the flow of economic resources measurement focus and full accrual basis of accounting. This includes for purposes of measuring the net pension liability, deferred outflows of resources and deferred inflows of resources related to pensions, pension expense, and information about assets, liabilities and additions to/deductions from TRS's fiduciary net position. Benefit payments (including refunds of employee contributions) are recognized when due and payable in accordance with the benefit terms . Investments are reported at fair value.
Income Taxes
The District is exempt from income taxes under Internal Revenue Code Section 115, Income of States, Municipalities, Etc., although unrelated business income may be subject to income taxes under Internal Revenue Code Section 511 (a)(2)(B), Imposition of Tax on Unrelated Business Income of Charitable, Etc., Organizations. The District had no unrelated business income tax liability for the year ended August 31, 2018 and 2017.
3. Authorized Investments
The Board of Trustees of the District has adopted a written investment policy regarding the investments of its funds as defined in the Public Funds Investment Act (Chapter 2256.001 Texas Government Code) . The investments of the District are in compliance with the Board of Trustees' investment policy and the Public Funds Investment Act. The District is authorized to invest in obligations and instruments as follows: (1) obligations of the United States and its agencies, (2) direct obligations of the State of Texas or its agencies, (3) obligations of political subdivisions rated not less than A by a national investment rating firm, (4) certificates of deposits and (5) other instruments and obligations authorized by statute.
4. Deposits and Investments
Deposits
Custodial credit risk for deposits with financial institutions is the risk that in the event of a bank failure, the District's deposits may not be returned . The District's investment policy requires pledging of collateral for all bank balances in excess of Federal Depository Insurance Corporation (FDIC) limits at a minimum of 102% of market value. As of August 31, 2018 and 2017, the District's entire bank balances of $6,043,685 and $5,071,455 respectively, were insured , collateralized and not exposed to custodial credit risk.
29
BLINN COLLEGE DISTRICT Notes to Financial Statements
August 31, 2018
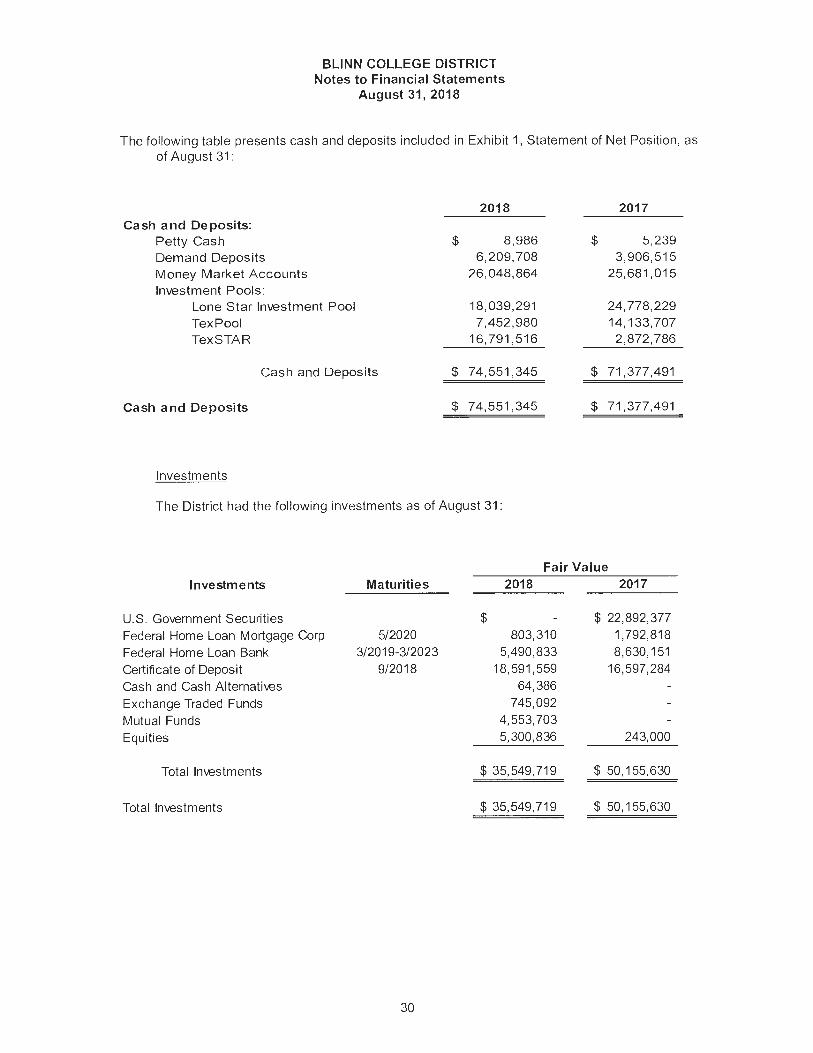
The following table presents cash and deposits included in Exhibit 1, Statement of Net Position, as of August 31:
2018 2017 Cash and Deposits:
Petty Cash $ 8,986 $ 5,239 Demand Deposits 6,209,708 3,906,515 Money Market Accounts 26,048,864 25,681,015 Investment Pools:
Lone Star Investment Pool 18,039,291 24,778,229 TexPool 7,452,980 14,133,707 TexSTAR 16,791,516 2,872,786
Cash and Deposits $ 74,551,345 $ 71,377,491
Cash and Deposits $ 74,551,345 $ 71,377,491
Investments
The District had the following investments as of August 31:
Investments
U.S. Government Securities Federal Home Loan Mortgage Corp Federal Home Loan Bank Certificate of Deposit Cash and Cash Alternatives Exchange Traded Funds Mutual Funds Equities
Total Investments
Total Investments
Maturities
5/2020 3/2019-3/2023
9/2018
30
Fair Value 2018 2017
$ $ 22,892,377 803,310 1,792,818
5,490,833 8,630,151 18,591,559 16,597,284
64,386 745,092
4,553,703 5,300,836 243,000
$ 35,549,719 $ 50,155,630
$ 35,549,719 $ 50,155,630

BLINN COLLEGE DISTRICT Notes to Financial Statements
August 31, 2018
Reconci liation of Cash, Deposits, and Investments to the Statement of Net Position (Exhibit 1)
Market Value Market Va lue August 31, 2018 August 31, 2017
Total Investments (footnote 4) $ 35,549,719 $ 50,155,630 Total Cash and Deposits (footnote 4) 74,551,345 71,377,491
Total Deposits and Investments 110,101,064 12 1,533,121
Statement of Net Position
Cash and Cash Equivalents $ 64,839,770 $ 57,194,268 Restricted Cash and Cash Equivalents 9 ,711 ,575 8,043,969 Restricted Endowment Cash and Cash Equivalents 6,139,254 Total Cash and Deposits (Exhibit 1) $ 74,551,345 $ 7 1,377,491
Investments $ 7,696,366 $ 7,672,284 Restricted Investments 12,908,302 31,817,377 Restricted Investments Noncurrent 14,945,051 10,665,969 Total Investments (Exhibit 1) $ 35,549,719 $ 50,155,630
Total Deposits and Investments (Exhibit 1) $ 110,101 ,064 $ 12 1,533,121
Interest risk is the risk that changes in interest rates will adversely affect the fair value of an investment. Investments held for longer periods can be subjected to increased risk of adverse interest rate changes. In accordance with its investment policy, the District limits its exposure to interest rate risk by structuring its portfolio to provide liquidity for operating funds and maximizing yields for funds not immediately needed. The investment policy limits the maximum maturity on any security to seven years. To the extent possible, the District shall attempt to match its investments with anticipated future cash flow. Unless matched to a specific cash flow, the District shall not directly invest in securities maturing more than three years from the date of purchase.
Credit risks are the risk that the insurer of the debt security will not pay its par value upon maturity. The District's investment policy limits credit risk based on meeting requirements of State law. Investments in mutual funds and investment pools must be rated at least AAA; commercial paper must be rated at least A-1 or P-1 ; and investments in obligations from other states, municipalities, counties, etc., must be rated at least A as well. U.S. Government obligations are not considered to have credit risk.
Concentration of credit risk is the risk of loss attributed to the magnitude of investment in a single issuer. The District places no limit on the amount the District may invest in any one issuer. At August 31, 2018 and 2017, the District had approximately $6.3 and $33.3 of its investment portfolio in U.S. Government and Federal Agency securities, which mature through March 2023.
During fiscal year 2006, a donor remitted shares in a Company to the District to establish an endowment scholarship. The shares had a fair market value of $280,500 at August 31, 201 8. Securities donated to an investing entity for a particular purpose or under terms of use specified by the donor, are not subject to the requirements of the Public Funds Investment Act. The College amended its investment policy to allow, at the Board of Trustees discretion, the District to hold donated equities for endowed scholarships.
31

BLINN COLLEGE DISTRICT Notes to Financial Statements
August 31, 2018
5. Disaggregation of Receivables and Payables Balances
Receivables consist of the following at August 31:
Student Tuition and Fees Ad Valorem Taxes Federal Grants State Grants Other Receil.rables
Allowance for Doubtful Accounts Total Receivables
Payables consist of the following at August 31:
Vendor Payables Other Payables
Total Payables
2018 $ 28,202,920
134,272 475,785
97,731 4,029,106
$32,939,814 (4,871 ,922)
$28,067,892
2018 $ 6,050,942
1,232,305 $ 7,283,247
32
2017 $25,330,671
117,023 124,631 43,020
545,424 $ 26, 160,769
(4,605,509) $21,555,260
2017 $ 4,086,497
1,989,491 $ 6,075,988
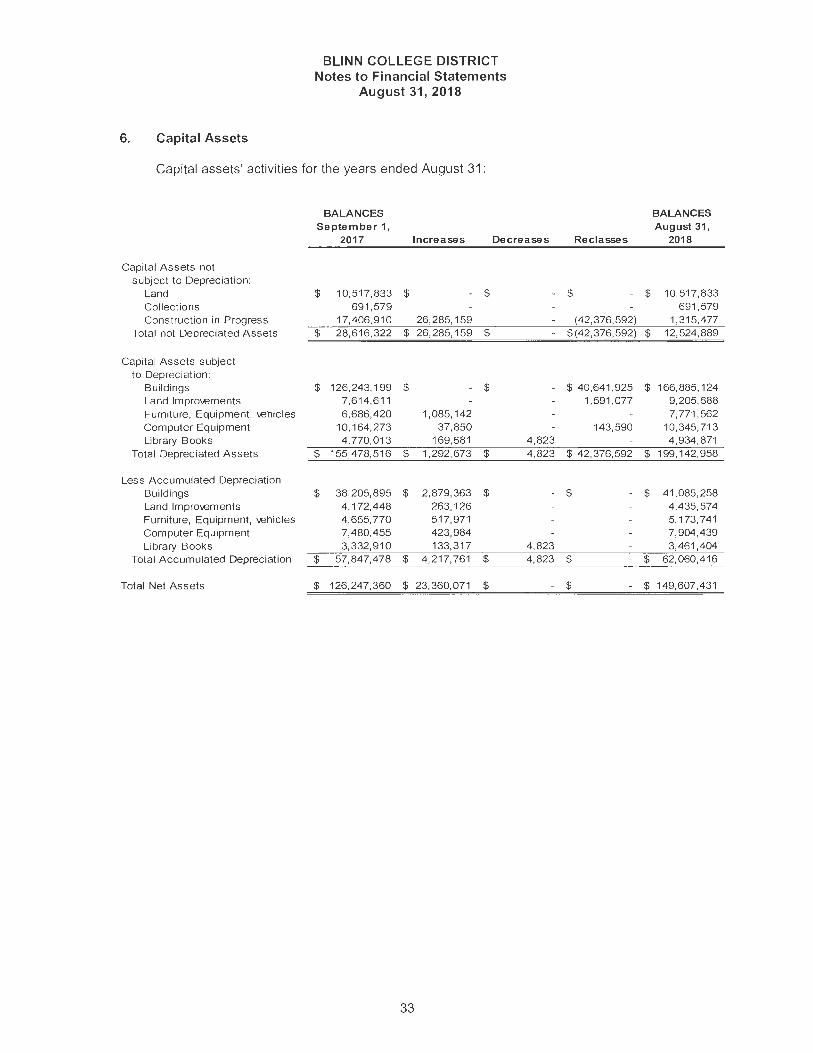
6. Capital Assets
BLINN COLLEGE DISTRICT Notes to Financial Statements
August 31, 2018
Capital assets' activities for the years ended August 31:
Capital A ssets not s ubject to Depreciation:
Land Collections Construct ion in Progress
Total not Depreciated A ssets
Capital Assets subject to Deprec iation:
Buildings Land lmprol.€ments Furniture, Equipment, 1.€hicles Computer Equipment Library Books
Total Depreciated A ssets
Less Accumulated Depreciation Buildings Land lmprol.€ments Furniture, Equipment, 1.€hic les Computer Equipment Library Books
Total Accumulated Depreciation
Tota l Net Assets
BALANCES September 1,
2017
$ 10,517,833 691,579
17,406,910 $ 28,616,322
$ 126,243, 199 7,614,611 6 ,686,420
10,164,273 4,770,013
$ 155,478,516
$ 38,205,895 4,172,448 4,655,770 7,480,455 3,332,910
$ 57,847, 478
$ 126,247,360
Increases Decreases
$ - $ -
26,285,159 $ 26,285,159 $ -
$ - $ -
1,085,142 37,850
169,681 4,823 $ 1,292,673 $ 4,823
$ 2,879,363 $ 263,126 517,971 423,984 133,317 4,823
$ 4,217,761 $ 4, 823
$ 23,360,071 $ -
33
Re classes
$ - $
(42,376,592) $(42,376,592) $
$ 40,641 ,925 $ 1,591,077
143,590
$ 42,376,592 $
$ - $
$ - $
$ - $
BALANCES August 31,
2018
10,517,833 691 ,579
1,315,477 12,524,889
166,885, 124 9,205,688 7,771 ,562
10,345,713 4,934 ,871
199,142,958
41 ,085,258 4,435,574 5,173,741 7,904,439 3,461,404
62,060 ,416
149,607,431

BLINN COLLEGE DISTRICT Notes to Financial Statements
August 31, 2018
BALANCES BALANCES September 1, August 31,
2016 Increases Decreases Reclasses 2017
Capital Assets not subject to Depreciation:
Land $ 10,610,094 $ 9,240 $ - $ (101 ,501) $ 10,517,833 Collections oSl1,b /SI 69'1,579 Construction in Progress 6,427,906 12,603,264 (1 ,624,260) 17,406,910
Total not Depreciated Assets $ 17,729,579 $ 12,612,504 $ (1 ,624,260) $ (101,501) $ 28,616,322
Capital Assets subject to Depreciation:
Buildings $ 125,625,238 $ 1,082,268 $ - $ (464,307) $ 126,243,199 Land Improvements 6,690,057 823,053 101 ,501 7,614,611 Furniture, Equipment, vehicles 7,105,512 221,564 (159,557) (481,099) 6,686,420 Computer Equipment 7,028,982 2,219,401 (29,516) 945,406 10,164, 273 Library Books 4,632,845 166,21 2 (29,044) 4 ,770,013
Total Depreciated Assets $ 151 ,082,634 $ 4 ,512,498 $ (218,11 7) $ 101,501 $ 155,478,516
Less Accumulated Depreciation Buildings $ 35,342,706 $ 2,874,759 $ - $ (11 ,570) $ 38,205,895 Land Improvements 4 ,048,056 194,581 (70,189) 4 ,172,448 Furniture, Equipment , vehic les 5 ,346,915 540,122 (119,246) (1,112,02 1) 4,655,770 Computer Equipment 5,894,392 421,798 (29,515) 1,193,780 7 ,480,455 Library Books 3 ,231,192 130,763 (29,045) 3,332,910
Total Accumulated Depreciation $ 53,863,261 $ 4,162,023 $ (177,806) $ - $ 57,847,478
Total Net Assets $ 114,948,952 $ 12,962,979 $ (1,664,571) $ - $ 126,247,360
34

BLINN COLLEGE DISTRICT Notes to Financial Statements
August 31, 2018
7. Long-Term Liabilities
Long-term liabi lity activity for the years ended August 31:
2018 Balance
September 1, 2017 Additions Reductions
Bonds Payable $ 80,140,000 $ - $ (3,505,000) Unamortized Bond Premium 2,174,156 (120,424)
Total Bond Liability $ 82,314,156 $ - $ (3,625,424)
Net Pension Liability $ 11,108,069 $ 1,278,436 $ -Net OPEB Liability 43,403,252
Total Other Liability $ 11,108,069 $ 44,681,688 $ -
Total Long-term Liabilit ies $ 93,422,225 $ 44,681,688 $ (3,625, 424)
2017 Balance
September 1, 2016 Additions Reductions
Bonds Payable $ 83,805,000 $ - $ (3,665,000) Unamortized Bond Premium 2,216,002 (41,846)
Total Bond Liability $ 86,021,002 $ - $ (3,706,846)
Net Pension Liability $ 15,979,437 $ - $ (4,871,368) Net OPEB Liability
Total Other Liability $ 15,979,437 $ - $ (4,871,368)
Total Long-term Liabilities $102,000,439 $ - $ (8,578,214)
8. Bonds Payable
Balance August 31, Current
2018 Portion
$ 76,635,000 $ 3,460,000 2,053,732
$ 78,688,732 $3,460,000
$ 12,386,505 $ 43,403,252 220,233
$ 55,789,757 $ 220,233
$1 34,478,489 $3,680,233
Balance August 31, Current
2017 Portion
$ 80,140,000 $3,505,000 2, 174,156
$ 82,314,156 $3,505,000
$ 11,108,069
$ 11,108,069 $
$ 93,422,225 $3,505,000
Bonds payable consist of Combined Fee Revenue and Refunding Bonds. General information related to bonds payable is summarized below:
Combined Fee Revenue Bonds, Series 2016
• Washington County Junior College District Combined Fee Revenue Bonds, Series 2016 • Proceeds will be used to (i) acquire, purchase, construct, improve, enlarge, equip,
operate, and/or maintain any property, buildings, structures, activities, operations, or facilities, of any nature, to wit: academic facilities, including classrooms, laboratories, related facilities and administration facilities; (ii) fund a Reserve Fund; and (iii) pay the costs of issuance of the Bonds
• Issued March 23, 201 6 • $36,975,000, all authorized bonds have been issued • Interest rates range from 2.125% to 5.00%
35
BLINN COLLEGE DISTRICT Notes to Financial Statements
August 31, 2018
• Source of revenue for debt service - designated portion of tu ition and fees and designated auxiliary revenues
• Outstanding bonds payable at August 31 , 2018 and 2017 of $36,575,000 and $36,975,000, respectively.
• A premium of $1,905,100 is being amortized over the life of the bonds
Combined Fee Revenue Bonds, Series 2015
• Washington County Junior College District Combined Fee Revenue Bonds, Series 2015 • Proceeds will be used to (i) acquire, purchase, construct, improve, enlarge, equip,
operate, and/or maintain any property, buildings, structures, activities, operations, or facilities, of any nature, to wit : academic facilities, including classrooms, laboratories, related facilities and administration faciliti es; (ii) fund a Reserve Fund ; and (iii) pay the costs of issuance of the Bonds
• Issued December 15, 201 5 • $9,625,000, all authorized bonds have been issued • Interest rates range from 3.00% to 4.00% • Source of revenue for debt service - designated portion of tuition and fees and
designated auxiliary revenues • Outstanding bonds payable at August 31, 2018 and 2017 of $9,360,000 and $9,625,000,
respectively. • A premium of $94,033 is being amortized over the life of the bonds
Combined Fee Revenue Bonds, Series 2014
• Washington County Junior College District Combined Fee Revenue Bonds, Series 2014 • Proceeds will be used to (i) acquire, purchase, construct, improve, enlarge, equip,
operate, and/or maintain any property, buildings, structures, activities, operations, or facilities, of any nature, to wit: academic facilities, including classrooms, laboratories and related faci lities, administration facilities and the acquisition of sites therefor and (ii) pay the costs of issuance of the Bonds
• Issued December 18, 2014 • $9,820,000, all authorized bonds have been issued • Interest rates range from 2.00% to 4.00% • Source of revenue for debt service - designated portion of tuition and fees and
designated auxiliary revenues • Outstanding bonds payable at August 31, 2018 and 2017 of $9,515,000 and $9,820,000,
respectively. • A premium of $25,897 is being amortized over the life of the bonds
Combined Fee Revenue Refunding Bonds, Series 2011
• Washington County Junior College District Combined Fee Revenue Refunding Bonds, Series 2011
• To refund a portion of the District's Combination Fee Revenue Bonds, Series 2002 for a debt service savings and pay the costs of issuance of the Bonds
• Issued May 17, 2011 • $6,925,000, all authorized bonds have been issued • Interest rates range from 2.00% to 4.00% • Source of revenue for debt service - designated portion of tuition and fees and
designated auxiliary revenues • Outstanding bonds payable at August 31, 2018 and 2017 of $3,630,000 and $4,285,000,
respectively • A premium of $181,438 is being amortized over the life of the bonds
36

BLINN COLLEGE DISTRICT Notes to Financial Statements
August 31, 2018
Combined Fee Revenue Bonds, Series 2010
• Washington County Junior College District Combined Fee Revenue Bonds, Series 2010 • To pay for (i) various campus renovation projects (ii) a dormitory (iii) teaching equipment
for the Allied Health Center and (iv) the costs of issuance of the Bonds • Issued March 15, 2010 • $20,155,000, all authorized bonds have been issued • Interest rates range from 3.000% to 4.375% • Source of revenue for debt service - designated portion of tuition and fees and
designated auxiliary revenues • Outstanding bonds payable at August 31, 2018 and 2017 of $15,720,000 and
$16,550,000 respectively
Combined Fee Revenue Refunding Bonds, Series 2009
• Washington County Junior College District Combined Fee Revenue Refund ing Bonds, Series 2009
• To refund a portion of the District's Combination Fee Revenue Bonds, Series 1998, Com bi nation Fee Revenue Bonds, Series 1999 and pay the costs of issuance of the Bonds
• Issued April 15, 2009 • $8,925,000, all authorized bonds have been issued • Interest rates range from 1.10% to 4.00% • Source of revenue for debt service - designated portion of tuition and fees and
designated auxiliary revenues • Outstanding bonds payable at August 31, 2018 and 2017 of $1,835,000 and $2,715,000,
respectively • A premium of $244,401 is being amortized over the life of the bonds
Combined Fee Revenue Refunding Bonds, Series 2003
• Washington County Junior College District Combined Fee Revenue Refunding Bonds, Series 2003
• To refund $4,300,000 of Combined Fee and Revenue Bonds, Series 1993 • Issued January 1, 2003 • $4,475,000, all authorized bonds have been issued • Interest rates range from 3% to 4.3% • Source of revenue for debt service - designated portion of tuition and registration
charges, other fee charges and designated revenues • Outstanding bonds payable at August 31, 2018 and 2017 of $0 and $170,000,
respectively • Net proceeds from refunding bonds $4,406,739; after payment of $94,344 in underwriting
fees, insurance, and other issuance costs • The 1993 Series bond are considered fu lly defeased and the liability for those bonds has
been removed from the financial statements • Advanced refunding of the 1993 Series bonds reduced the Districts debt service
payments over the next 15 years by approximately $230,000 • Economic gain of approximately $170,000 is difference between the net present value of
the old and new debt service payments
37
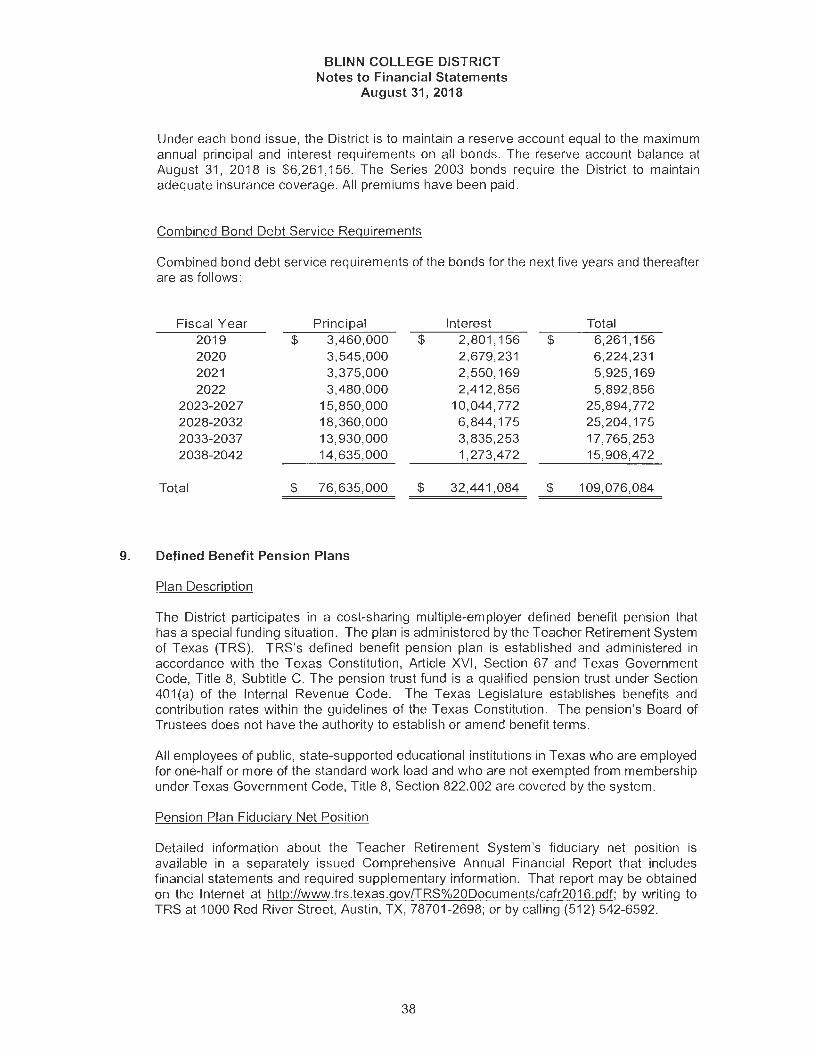
BLINN COLLEGE DISTRICT Notes to Financial Statements
August 31, 2018
Under each bond issue, the District is to maintain a reserve account equal to the maximum annual principal and interest requirements on all bonds. The reserve account balance at August 31, 2018 is $6,261,156. The Series 2003 bonds require the District to maintain adequate insurance coverage. All premiums have been paid.
Combined Bond Debt Service Requirements
Combined bond debt service requirements of the bonds for the next five years and thereafter are as follows:
Fiscal Year Principal 2019 $ 3,460,000 2020 3,545,000 2021 3,375,000 2022 3,480,000
2023-2027 15,850,000 2028-2032 18,360,000 2033-2037 13,930,000 2038-2042 14,635,000
Total $ 76,635,000
9. Defined Benefit Pension Plans
Plan Description
Interest Total $ 2,801,156 $ 6,261,156
2,679,231 6,224,231 2,550,169 5,925, 169 2,412,856 5,892,856
10,044,772 25,894,772 6,844, 175 25,204,175 3,835,253 17,765,253 1,273,472 15,908,472
$ 32,441,084 $ 109,076,084
The District participates in a cost-sharing multiple-employer defined benefit pension that has a special funding situation. The plan is administered by the Teacher Retirement System of Texas (TRS). TRS's defined benefit pension plan is established and administered in accordance with the Texas Constitution, Article XVI, Section 67 and Texas Government Code, Title 8, Subtitle C. The pension trust fund is a qualified pension trust under Section 401 (a) of the Internal Revenue Code. The Texas Legislature establishes benefits and contribution rates within the guidelines of the Texas Constitution. The pension's Board of Trustees does not have the authority to establish or amend benefit terms.
All employees of public, state-supported educational institutions in Texas who are employed for one-half or more of the standard work load and who are not exempted from membership under Texas Government Code, Title 8, Section 822.002 are covered by the system.
Pension Plan Fiduciary Net Position
Detailed information about the Teacher Retirement System's fiduciary net position is available in a separately issued Comprehensive Annual Financial Report that includes financia l statements and required supplementary information. That report may be obtained on the Internet at http://www.trs. texas.gov/TRS%20Documents/cafr2016.pdf; by writing to TRS at 1000 Red River Street, Austin, TX, 78701-2698; or by calling (512) 542-6592.
38
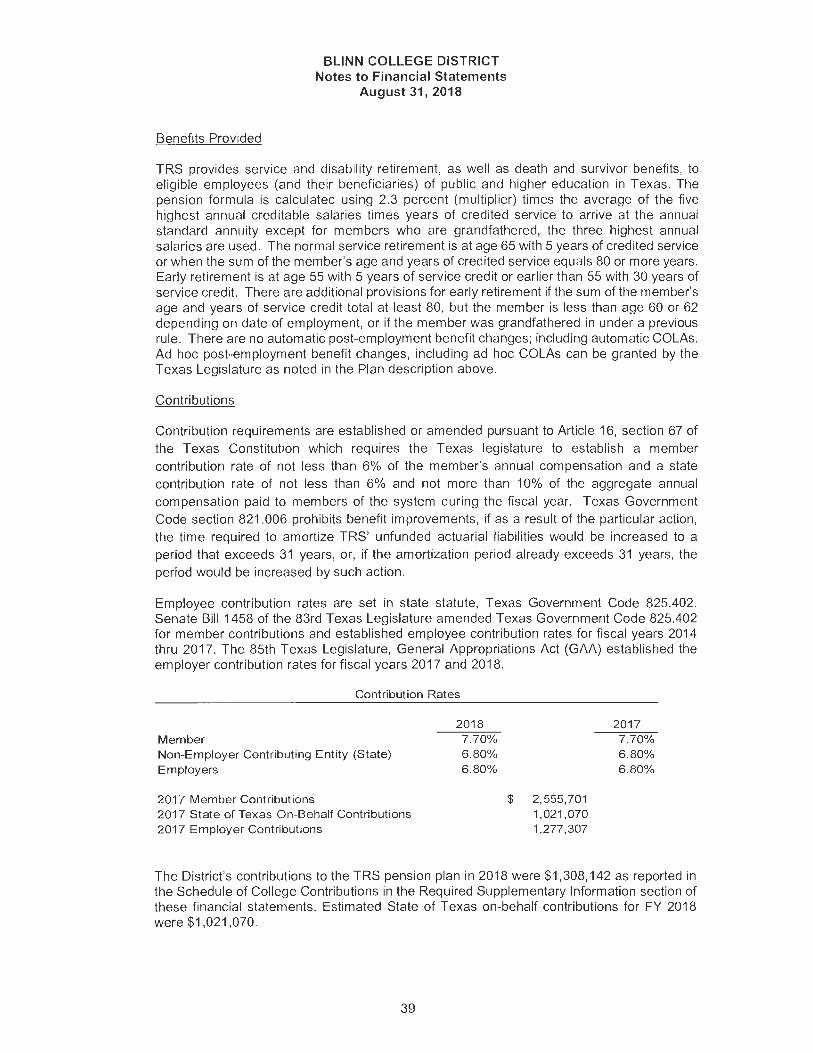
Benefits Provided
BLINN COLLEGE DISTRICT Notes to Financial Statements
August 31, 2018
TRS provides service and disability retirement, as wel l as death and survivor benefits, to eligible employees (and their beneficiaries) of public and higher education in Texas. The pension formula is calculated using 2.3 percent (multiplier) times the average of the five highest annual cred itable salaries times years of credited service to arrive at the annual standard annuity except for members who are grandfathered, the three highest annual salaries are used. The normal service retirement is at age 65 with 5 years of credited service or when the sum of the member's age and years of credited service equals 80 or more years. Early retirement is at age 55 with 5 years of service credit or earlier than 55 with 30 years of service credit. There are additional provisions for early retirement if the sum of the member's age and years of service credit total at least 80, but the member is less than age 60 or 62 depending on date of employment, or if the member was grandfathered in under a previous rule. There are no automatic post-employment benefit changes; including automatic COLAs. Ad hoc post-employment benefit changes, including ad hoc COLAs can be granted by the Texas Legislature as noted in the Plan description above.
Contributions
Contribution requirements are established or amended pursuant to Article 16, section 67 of the Texas Constitution which requires the Texas legislature to establish a member contribution rate of not less than 6% of the member's annual compensation and a state contribution rate of not less than 6% and not more than 10% of the aggregate annual compensation paid to members of the system during the fiscal year. Texas Government Code section 821.006 prohibits benefit improvements, if as a result of the particular action, the time required to amortize TRS' unfunded actuarial liabilities would be increased to a period that exceeds 31 years, or, if the amortization period already exceeds 31 years, the period would be increased by such action.
Employee contribution rates are set in state statute, Texas Government Code 825.402. Senate Bill 1458 of the 83rd Texas Legislature amended Texas Government Code 825.402 for member contributions and established employee contribution rates for f iscal years 2014 thru 2017. The 85th Texas Legislature, General Appropriations Act (GAA) established the employer contribution rates for fiscal years 2017 and 2018.
Contribution Rates
Member Non-E mploy er Contributing E ntity (State) E mployers
201 7 Member Contributions 201 7 State of Texas On-Behalf Contributions 2017 Employer Contributions
2018 2017 7.70% 7.70% 6 .80% 6 .80% 6.80% 6 .80%
$ 2 ,555,701 1,021,070 1,277,307
The District's contributions to the TRS pension plan in 2018 were $1,308,142 as reported in the Schedule of Col lege Contributions in the Required Supplementary Information section of these financial statements. Estimated State of Texas on-behalf contributions for FY 2018 were $1,021,070.
39

BLINN COLLEGE DISTRICT Notes to Financial Statements
August 31, 2018
• As the non-employer contributing entity for public education and junior colleges, the State of Texas contributes to the retirement system an amount equal to the current employer contribution rate times the aggregate annual compensation of all participating members of the pension trust fund during that fiscal year reduced by the amounts described below which are paid by the employers .
Public junior colleges or junior college districts are required to pay the employer contribution rate in the following instances:
• On the portion of the member's salary that exceeds the statutory minimum for members entitled to the statutory minimum under Section 21.402 of the Texas Education Code.
• During a new member's first 90 days of employment.
• When any part or all of an employee's salary is paid by federal funding sources, a privately sponsored source, from non-educational and general, or local funds .
• When the employing district is a public junior college or junior college district, the employer shall contribute to the retirement system an amount equal to 50% of the state contribution rate for certain instructional or administrative employees; and 100% of the state contribution rate for all other employees.
• In addition to the employer contributions listed above, when employing a retiree of the Teacher Retirement System the employer shall pay both the member contribution and the state contribution as an employment after retirement surcharge.
40

BLINN COLLEGE DISTRICT Notes to Financial Statements
August 31, 2018
Actuarial Assumptions
The total pension liability in the August 31, 2017 actuarial valuation was determined using the following actuarial assumptions:
Valuation Date Actuarial Cost Method Asset Valuation Method Single Discount Rate Long-term expected investment Rate of Return* Municipal Bond Rate* Last year ending August 31 in 2017 to 2116
Projection period (100 years) Inflation Salary increases including inflation Payroll Growth Rate Benefit changes during the year Ad hoc post-employment benefit changes.
August 31, 2017 Individual Entry Age Normal Market Value 8.00% 8.00% N/A
2116 2.50% 3.5% to 9.5% 2.5% None None
*If a municipal bond rate was to be used, the rate would be 3.42 percent as of August 2017 (i.e., the rate closest to but not later than the measurement Date). The source for the rate is the Fixed Income Market Data/Yield Curve/Data Municipal Bonds with 20 years to maturity that include only federally tax-exempt bonds as reported in Fidelity Index's "20-Year Municipal GO AA Index. "
Actuarial methods and assumptions were updated based on a study of actual experience for the four-year period ending August 31, 2014, and adopted on September 24, 2015, by the TRS Board of Trustees, who have sole authority to determine the actuarial assumptions used for the plan. There were no changes to the actuarial assumptions or other inputs that affected the measurement of the total pension liability since the prior measurement period.
There were no changes of benefit terms that affected measurement of the total pension liability during the measurement period.
Discount Rate
The discount rate used to measure the total pension liability was 8.0%. There was no change in the discount rate since the previous year. The projection of cash flows used to determine the discount rate assumed that contributions from plan members and those of the contributing employers and the non-employer contributing entity are made at the statutorily required rates . Based on those assumptions, the pension plan's fiduciary net position was projected to be available to make all future benefit payments of current plan members. Therefore, the longterm expected rate of return on pension plan investments was applied to all periods of projected benefit payments to determine the total pension liability. The long-term rate of return on pension plan investments is 8 percent. The long-term expected rate of return on pension plan
41
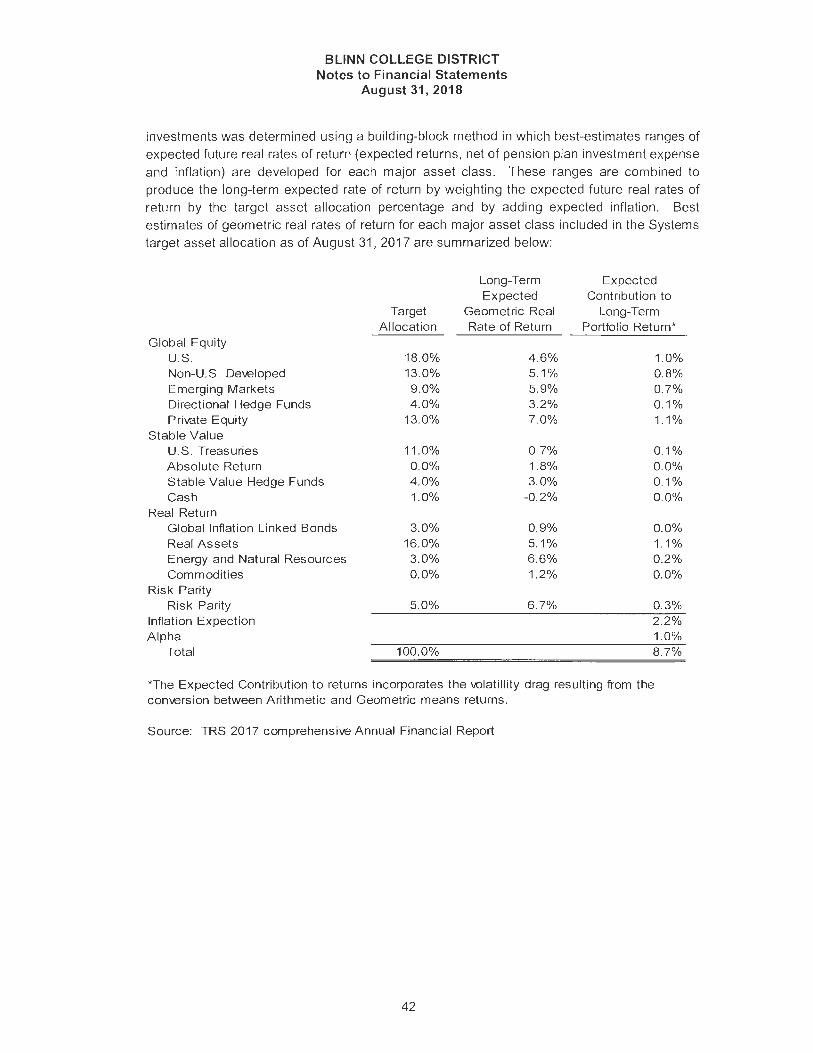
BLINN COLLEGE DISTRICT Notes to Financial Statements
August 31, 2018
investments was determined using a building-block method in wh ich best-estimates ranges of
expected future real rates of return (expected returns, net of pension plan investment expense
and inflation) are developed for each major asset class. These ranges are combined to
produce the long-term expected rate of return by weighting the expected future real rates of
return hy the target asset a llocation percentage and by adding expected inflation. Best
estimates of geometric real rates of return for each major asset class included in the Systems
target asset al location as of August 31 , 2017 are summarized below:
Long-Term Expected Expected Contribution to
Target Geometric Real Long-Term Allocation Rate of Return Portfolio Return*
Global Equity U.S. 18.0% 4.6% 1.0% Non-U.S. Developed 13.0% 5. 1% 0.8% Emerging Markets 9.0% 5.9% 0.7% Directional Hedge Funds 4.0% 3.2% 0.1 % Private Equity 13.0% 7.0% 1.1%
Stable Value U.S. Treasuries 11.0% 0.7% 0.1% Absolute Return 0.0% 1.8% 0.0% Stable Value Hedge Funds 4.0% 3.0% 0.1% Cash 1.0% -0.2% 0.0%
Real Return Global Inflation Linked Bonds 3.0% 0.9% 0.0% Real Assets 16.0% 5.1 % 1.1% Energy and Natural Resources 3. 0% 6 .6% 0.2% Commodit ies 0.0% 1.2% 0.0%
Risk Parity Risk Parity 5.0% 6.7% 0.3%
Inflation Expection 2.2% A lpha 1.0%
Total 100.0% 8.7%
*The Expected Contribution to returns incorporates the volati ll ity drag resulting from the conversion between Arithmetic and Geometric means returns.
Source: TRS 2017 comprehensive Annual Financial Report
42
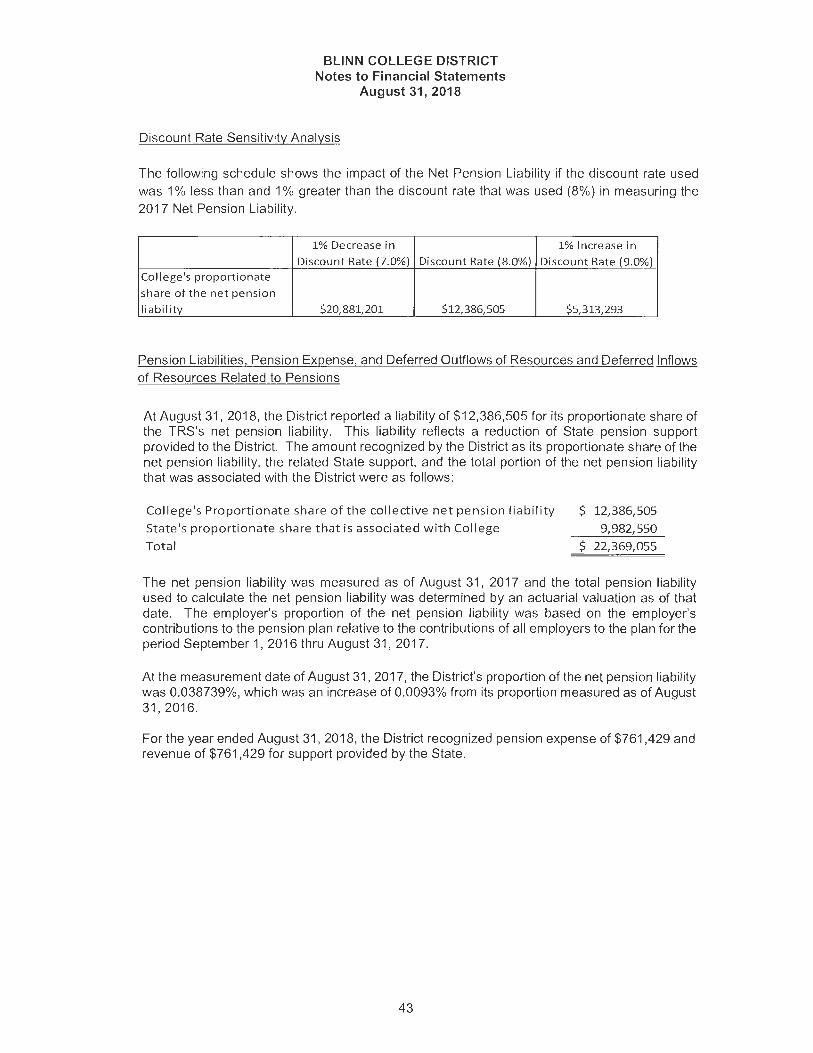
BLINN COLLEGE DISTRICT Notes to Financial Statements
August 31, 2018
Discount Rate Sensitivity Analysis
The following schedule shows the impact of the Net Pension Liabi lity if the discount rate used was 1 % less than and 1 % greater than the discount rate that was used (8%) in measuring the 2017 Net Pension Liability.
1% Decrease in 1% Increase in
Discount Rate (7.0%} Discount Rate (8.0%} Discount Rate (9.0%}
College's proportionate
share of the net pension
li ability $20,881,201 $12,386,505 $5,313,293
Pension Liabilities, Pension Expense, and Deferred Outflows of Resources and Deferred Inflows of Resources Related to Pensions
At August 31, 2018, the District reported a liability of $12,386,505 for its proportionate share of the TRS's net pension liability. This liability reflects a reduction of State pension support provided to the District. The amount recognized by the District as its proportionate share of the net pension liability, the related State support, and the total portion of the net pension liability that was associated with the District were as follows:
College's Proportionate share of the co llective net pension li ab ility
State's proportionate share that is associated with College
Tota l
$ 12,386,505
9,982,550
$ 22,369,055
The net pension liability was measured as of August 31, 2017 and the total pension liability used to calculate the net pension liability was determined by an actuarial valuation as of that date. The employer's proportion of the net pension liability was based on the employer's contributions to the pension plan relative to the contributions of all employers to the plan for the period September 1, 2016 thru August 31, 2017.
At the measurement date of August 31, 2017, the District's proportion of the net pension liability was 0.038739%, which was an increase of 0.0093% from its proportion measured as of August 31,2016.
For the year ended August 31, 2018, the District recognized pension expense of $761,429 and revenue of $761,429 for support provided by the State.
43
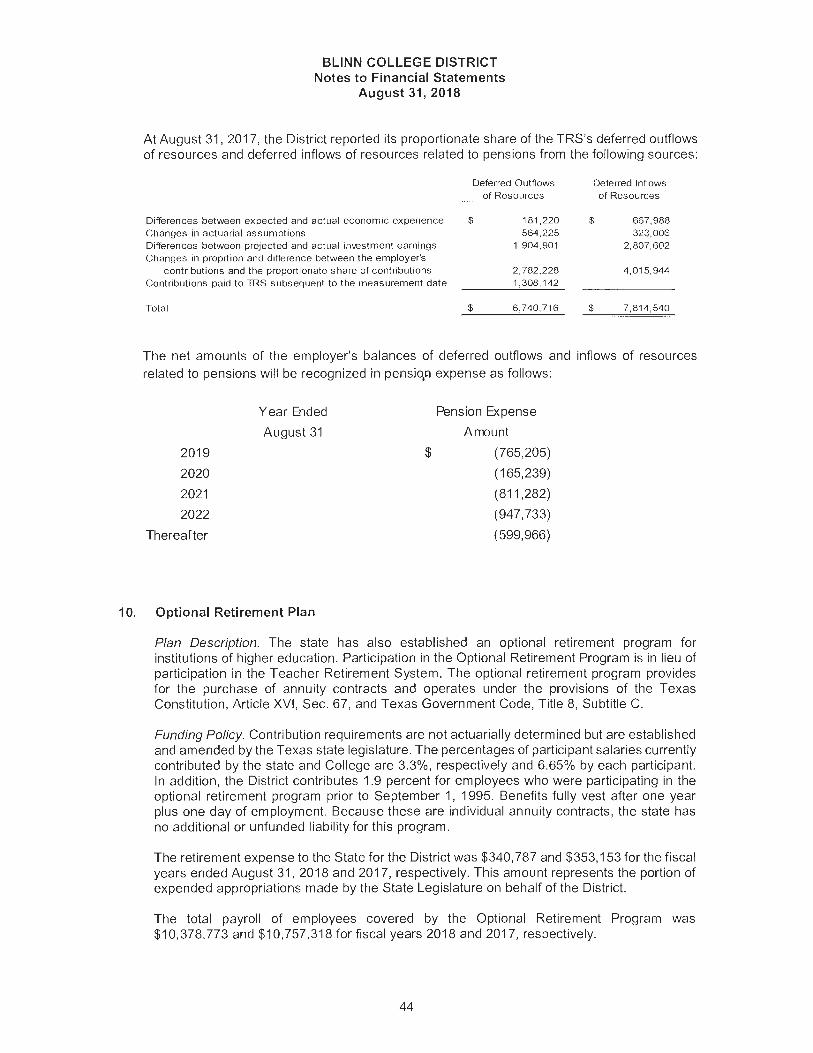
BLINN COLLEGE DISTRICT Notes to Financial Statements
August31,2018
At August 31, 2017, the District reported its proportionate share of the TRS's deferred outflows of resources and deferred inflows of resources related to pensions from the following sources:
Diffe rences between ex pected and actua l economic ex perience Changes in actuaria l assumptions Diffe rences between projected and actual im,estment earnings Changes in proprtion and diffe rence between the employer's
contributions and the proportionate s hare of contributions Contributions paid to TRS s ubsequent to the meas urement date
Total
Deferred Outfiows of Resources
$ 181 ,220 564, 225
1,904,901
2,782 ,228 1,308 ,142
$ 6 ,740,716
Deferred lnfiows of Resources
$ 667,988 323, 00G
2,807,602
4 ,01 5,944
$ 7,814,540
The net amounts of the employer's balances of deferred outflows and inflows of resources related to pensions will be recognized in pensiop expense as follows:
2019
2020
2021
2022
Thereafter
Year Ended
August 31
10. Optional Retirement Plan
$
Pension Expense
Amount
(765,205)
(165,239)
(811,282)
(947,733)
(599,966)
Plan Description. The state has also established an optional retirement program for institutions of higher education. Participation in the Optional Retirement Program is in lieu of participation in the Teacher Retirement System . The optional retirement program provides for the purchase of annuity contracts and operates under the provisions of the Texas Constitution, Article XVI, Sec. 67, and Texas Government Code, Title 8, Subtitle C.
Funding Policy. Contribution requirements are not actuarially determined but are established and amended by the Texas state legislature. The percentages of participant salaries currently contributed by the state and College are 3.3%, respectively and 6.65% by each participant. In addition, the District contribu tes 1.9 percent for employees who were participating in the optional retirement program prior to September 1, 1995. Benefits fully vest after one year plus one day of employment. Because these are individual annuity contracts , the state has no additional or unfunded liabi lity for this program.
The retirement expense to the State for the District was $340,787 and $353,153 for the fiscal years ended August 31, 2018 and 2017, respectively. This amount represents the portion of expended appropriations made by the State Legislature on behalf of the District.
The total payroll of employees covered by the Optional Ret irement Program was $10,378,773 and $10,757,318 for fiscal years 2018 and 2017, respectively.
44
BLINN COLLEGE DISTRICT Notes to Financial Statements
August 31, 2018
11. Deferred Compensation Program
The District's employees may elect to defer a portion of their earnings for income tax and investment purposes pursuant to authority granted in Government Code 609.001. This plan is essentially an unfunded promise to pay by the employer to each of the plan participants. At August 31, 2018 and 2017, the District had no employees electing lo defer cornµensalion.
12. Health Care and Life Insurance Benefits
In addition to providing pension benefits, the State provides certain health care and life insurance benefits for retired employees. Almost all of the employees may become eligible for those benefits if they reach normal retirement age while working for the State. Those and similar benefits for active employees are provided through an insurance company whose premiums are based on benefits paid during previous year. The State recognizes the cost of providing these benefits by expending the annual insurance premiums. The State's contribution per full-time employee was $610 to $1,217 and $610 to $1,208 per month for the years ended August 31, 2018 and 2017, depending on the coverage elected. The State's contribution totaled $4,096,796 and $3,676,323, for the years ended August 31, 2018 and 2017, respectively. The cost of providing those benefits for retirees is not separable from the cost of providing benefits for active em ployees.
13. Compensated Absences
Non-faculty employees are entitled to compensation vacation days. The amount of days is determined annually, based on their length of employment, as stipulated with official policy adopted by the District. The current policy allows a maximum of six accrued unused vacation days to be carried over; however, the carry over days are not payable upon termination. Any accrued unused days in excess of the carry over days expire at the end of each year. In accordance with the provisions of Statement of Financial Accounting Standards No. 43, Accounting for Compensated Absences, no liability is recorded for these non-vesting rights.
Sick leave can be accumulated subject to certain limitations. It is paid to an employee who misses work because of illness. The District does not allow conversion of unpaid sick leave for terminated employees. The District's policy is to recognize the cost of sick leave when paid. The liability is not shown in the financial statements since experience indicates the expenditure for sick leave to be minimal.
14. Contract and Grant Awards
Contract and grant awards are accounted for in accordance with the requirements of the AICPA Industry Audit Guide, Audits of Colleges and Universities. Revenues are recognized on Exhibit 2 and Schedule A. Contract and grant awards for which funds are expended, but not collected, are reported as accounts receivable on Exhibit 1. Contract and grant awards that are not yet funded and for which the District has not yet performed services are not included in the financial statements. State contract and grant award funds already committed, e.g., multi-year awards or funds awarded for which monies have not been received nor funds expended for 201 8 and 201 7 totaled $655,928 and $759,275, respectively.
45
15. Property Tax
BLINN COLLEGE DISTRICT Notes to Financial Statements
August 31, 2018
The District's ad valorem property tax is levied each October 1, on the assessed value listed as of the prior January 1, for all real, business/land personal property located in the tax area of the District. Property taxes are recorded on an accrual basis of accounting. At August 31 :
A ssessed valuation of the College $ Less exemptions
Net assessed valuation of the College $
2018 3,662,570,898
(754,631,771) 2,907,939, 127
=======
Tax rate per $100 valuation for authorized Tax rate per $100 valuation for assessed
Tax rate per $100 valuation for authorized Tax rate per $100 valuation for assessed
$
$
Current Operations
0.0601 0.0601
Current Operations
0.0601 0.0601
201 8 Debt
Service $
2017 Debt
Service $
?01 7 $ 3,231,516,568
(581,744,603) $ 2,649,771,965
Total $ 0.0601
0.0601
Total $ 0.0601
0.0601
Tax levied for the years ended August 31, 2018 and 2017 is $1 ,981 ,872 and $1 ,812,702 respectively (which includes any penalty and interest assessed if applicable). Taxes are due on receipt of the tax bill and are delinquent if not paid before February 1, of the year following the year in which imposed.
Under GASB Statement No. 33, Accounting and Financial Reporting for Non Exchange Transactions, ad valorem taxes are imposed non-exchange revenue. Asset from imposed non-exchange transactions are recorded when the entity has an enforceable legal claim to the assets or when the entity receives resources, whichever comes first. The enforceable legal claim date for ad valorem taxes is the assessment date. The District has recognized all assessed taxes in the current year and recorded a receivable for uncollected taxes.
Taxes Collected at August 31, 2018 2017
Current $ 1,894,260 $ 1,775,179 Delinquent 30,594 27,305 Penalties and Interest 23,684 20,487
Total Gross Collections $ 1,948,538 $ 1,822,971
Total Appraisal and Collection Fees $ {44,586} $ {42,372}
Total Net Collections $ 1,903,952 $ 1,780,599
Tax collections for the year ended August 31 , 2018 and 2017 were 96% and 98% of the respective tax levy, respectively. Allowances for uncollectible taxes are based upon historical experience in collecting property taxes. The use of tax proceeds is restricted to either maintenance and operations or general obligation debt service.
46
16. Operating Leases
BLINN COLLEGE DISTRICT Notes to Financial Statements
August 31, 2018
The District leases facilities related to the Bryan and Sealy Campuses under non-cancelable leases expiring through January 2020, with future minimum payments as of August 31, 2018 as follows :
Fiscal Year 2019 2020
2,267,209 2 ,206,819
Rental expense was approximately $2,410,375 and $2,559,147 for the years ended August 31, 2018 and 2017, respectively.
17. Contingent Liabilities
State and Federal Grants
The District participates in a number of state and federally assisted programs. These programs are subject to program compliance audits by the grantors or their representatives. Accordingly, the District's compliance with applicable grant requirements will be finally determined at some future date. The amount, if any, of expenditures which may be disallowed by the granter agencies cannot be determined at this time, although the District expects such amounts, if any, to be immaterial.
18. Settlnsurance
Effective September 1, 2003, the District began participating in a public entity risk pool for worker's compensation. The participants of the pool include several other public junior and community colleges. The plan provides coverage to each participant with the District's individual loss fund maximum of $375,000 and $400,487 at August 31, 2018 and 201 7, respectively, which is based on estimated payroll.
The liability for claims incurred but not reported under the self-insured plan is $50,244 and $59,553 as of August 31, 201 8 and 2017, respectively, and is included in the accompanying statement of net position. Future payments for the claims will be paid from the accrued liability.
Self-insurance activity for the years ended August 31, 201 8 and 2017 was as follows:
Accrued Liabi lity for the
Year Ended A ugust 31
2018 201 7
Balance of Liability at
Beginning of Fiscal Year Adjus tments Additions
Cumulative Balance of
Reduc tions for Liability at End Claims Paid of Fiscal Year
$ 400,487 $ (140,047) $ 218,493 $ (103,933) $ 375,000 400,487 433,813 72,468 (105,794)
47

BLINN COLLEGE DISTRICT Notes to Financial Statements
August 31, 2018
19. Postemployment Benefits Other than Pensions
Plan Description. The District participates in a cost-sharing, multiple-employer, other postemployment benefit (OPEB) plan with a special funding situation. The Texas Employees Group Benefits Program (GBP) is administered by the Employees Retirement System ofTexas (ERS). The GBP provides certain postemployment health care , life and dental insurance benefits to retired employees of pmticipating universities, community colleges, and State agencies in accordance with Chapter 1551 , Texas Insurance Code. Almost all employees may become eligible for those benefits if they reach normal retirement age while working for the State and retire with at least 10 years of service to eligible entities . Surviving spouses and dependents of these retirees are also covered. Benefit and contribution provisions of the GBP are authorized by State law and may be amended by the Texas Legislature.
OPEB Plan Fiduciary Net Position. Detailed information about the GBP's fiduciary net position is available in the separately issued ERS Comprehensive Annual Financial Report (CAFR) that includes financial statements , notes to the financial statements and required supplementary information. That report may be obtained on the Internet at https ://ers .texas.gov/AboutERS/Reports-and-Studies/Reports-on-Overall-ERS-Operations-and-Financial -Management; or by writing to ERS at: 200 East 181h Street, Austin, TX 78701 ; or by calling (877) 275-4377. The fiduciary net position of the plan has been determined using the same basis used by the OPEB plan.
Benefits Provided. Retiree health benefits offered through the GBP are available to most State of Texas retirees and their eligible dependents. Participants need at least ten years of service credit with an agency or institution that participates in the GBP to be eligible for GBP retiree insurance. The GBP provides self-funded group health (medical and prescription drug) benefits for eligible retirees under HealthSelect. The GBP also provides a fully insured medical benefit option for Medicare-primary participants under the HealthSelect Medicare Advantage Plan and life insurance benefits to eligible retirees via a minimum premium funding arrangement. The authority under which the obligations of the plan members and employers are established and/or may be amended is Chapter 1551, Texas Insurance Code.
Contributions. Section 1551 .055 of Chapter 1551, Texas Insurance Code, provides that contribution requirements of the plan members and the participating employers are established and may be amended by the ERS Board of Trustees . The employer and member contribution
rates are determined annually by the ERS Board of Trustees based on the recommendation of ERS staff and its consulting actuary. The contribution rates are determined based on (i) the benefit and administrative costs expected to be incurred, (ii) the funds appropriated and (iii) the funding policy established by the Texas Legislature in connection with benefits provided through the GBP. The Trustees revise benefits when necessary to match expected benefit and administrative cost with the revenue expected to be generated by the appropriated funds.
The following table summarized the maximum monthly employer contribution toward eligible retirees' health and basic life premium . Retirees pay any premium over and above the employer contribution. The employer does not contribute toward dental or optional life insurance. Surviving spouses and their dependents do not receive any employer contribution . As the non-employer contributing entity (NECE), the State of Texas pays part of the premiums for the junior and community colleges.
48

BLINN COLLEGE DISTRICT Notes to Financial Statements
August 31, 2018
Other Post-Employment Benefits (OPEB) (continued)
Maximum Monthly Employer Contribution Retiree Health and Basic Life Premium Fiscal Year 2017
Retiree only Retiree & Spouse Retiree & Children Retiree & Family
$ 617.30 970.98 854.10
1,207.78
Contributions of premiums to the GBP plan for the current and prior fiscal year by source is summarized in the following table.
Premium Contributions by Source Group Benefits Program Plan For the Years Ended August 31, 2018 and 2017
Employers Members (Employees) Non-employer Contributing Entity (State of Texas)
FY2017 $ 890,735,173
195,806,162 44,433,743
Source: ERS FY2017 Comprehensive Annual Financial Report
FY 2016 $ 663,986,538
183,284,339 N/A
Actuarial Assumptions. The total OPEB liability was determined by an actuarial valuation as of August 31 , 2017 using the following actuarial assumptions, applied to all period included in the measurement, unless otherwise specified:
49

BLINN COLLEGE DISTRICT Notes to Financial Statements
August 31, 2018
Other Post-Employment Benefits (OPEB) (continued)
Actuarial Assumptions ERS Group Benefits Program Plan
Valuation Date Actuarial Cost Method Amortization Method Remaining Amortization Period Asset Valuation Method Discount Rate Projected Annual Salary Increase (includes inflation) Annual Healthcare Trend rate
Inflation Assumption Rate Ad hoc Postemployment Benefit Changes Mortality assumptions
Service Retirees, Survivors and Other Inactive Members
Disability Retirees
Active members
August 31, 2017 Entry Age Level Percent of Pay, Open 30 Years Not applicable 3.51% 2.50% to 9.50% 8.50% for FY 2019, Decreasing 0.5% per year to 4.50% For FY 2027 and later years 2.50% None
Tables based on TRS experience with full generational projection using Scale BB from Base Year 2014 Tables based on TRS experience with full generation projection using Scale BB from Base Year 2014 using a 3-year set forward and minimum mortality rates of four per 100 male members and two per 100 female members Sex Distinct RP-2014 Employee Mortality multiplied by 90% with full generational projection using Scale BB
Source: 2017 ERS CAFR except for mortality assumptions obtained from ERS 2017 GASB 7 4 Actuarial Valuation
Many of the actuarial assumptions used in this valuation were based on the results of actuarial experience studies performed by the ERS and TRS retirement plan actuaries for the period (ex. September 1, 2010 to August 31, 2014) for higher education members.
Investment Policy. The State Retiree Health Plan is a pay-as-you-go plan and does not accumulate funds in advance of retirement. The System's Board of Trustees adopted the amendment to the investment policy in August 2017 to require that all funds in the plan be invested in short-term fixed income securities and specify that the expected rate of return on these investments is 2.4%.
Discount Rate. Because the GBP does not accumulate funds in advance of retirement, the discount rate that was used to measure the total OPEB liability is the municipal bonds rate. The discount rate used to determine the total OPEB liability as of the beginning of the measurement year was 2.84%. The discount rate used to measure the total OPEB liability as of the end of the measurement period was 3.51 %, which amounted to an increase of .67%.
50
BLINN COLLEGE DISTRICT Notes to Financial Statements
August 31, 2018
Other Post-Employment Benefits (OPEB) (continued)
The source of the municipal bond rate was the Bond Buyer Index of general obligation bonds with 20 years to maturity and mixed credit quality. The bonds average credit quality is roughly equivalent to Moody's Investors Service's Aa2 rating and Standard & Poor's Carp's AA rating . Projected cash flows into the plan are equal to projected benefit payments out of the plan. Because the plan operates on a pay-as-you-go (PAYGO) basis and is not
intended to accumulate assets, there is no long-term expected rate of return on plan assets and therefore the years of the projected benefit payments to which the long-term expected rate of return on plan assets and therefore the years of projected benefit payments to which the long-term expected rate of return is applicable is zero years.
Discount Rate Sensitivity Analysis. The following schedule shows the impact on the District's proportionate share of the collective OPEB Liability if the discount rate used was 1 percent less than and 1 percent greater than the discount rate that was used (3.51%) in measuring the net OPEB Liability.
1 % Decrease in 1 % Increase in Discount Rate (2.51%) Discount Rate (3.51%) Discount Rate (4.51 %)
College's proportionate share of the net OPE B liability $51,810,799 $43,403,252 $36,890,856
Healthcare Trend Rate Sensitivity Analysis. The initial healthcare trend rate is 8.5% and the ultimate rate is 4.5%. The following schedule shows the impact on the District's proportionate share of the collective net OPEB Liability if the healthcare cost trend rate used was 1 percent less than and 1 percent greater than the healthcare cost trend rate that was used (8.5%) in measuring the net OPEB Liability.
1 % Decrease in Current Healthcare 1% Increase in Healthcare Cost Cost Trend Rates Healthcare Cost
Trend Rates (7.5% (8.5% decreasing to Trend Rates (9.5% decreasing to 3.5%) 4.5%) decreasing to 5.5%)
College's proportionate share of the net OPEB liability $36,487,808 $43,403,252 $52,376,435
OPEB Liabilities, OPEB Expense, and Deferred Outflows of Resources and Deferred Inflows of Resources Related to OPEB. At August 31, 2018, the District reported a liabi lity of $43,403,253 for its proportionate share of the ERS's net OPEB liability. This liability reflects a reduction for State support provided to the District for OPEB. The amount recognized by the District as its proportionate share of the net OPEB liability, the related State support, and the total portion of the net OPEB liability that was associated with the District were as follows:
College's Proportionate share of the collective net OPEB liability State's proportionate share that is associated with College Total
51
$43,403,252 $32,917,587 $76,320,839
BLINN COLLEGE DISTRICT Notes to Financial Statements
August31,2018
Other Post-Employment Benefits (OPEB) (continued)
The net OPEB liability was measured as of August 31, 2017, and the total OPEB liability used to calculate the net OPEB liability was determined by an actuarial valuation as of that date. The employer's proportion of the net OPEB liability was based on the employer's contributions to the OPEB plan relative to the contributior1s of c:111 employers lo lhe plan for the period September 1, 2016 thru August 31, 2017.
At the measurement date of August 31, 2017, the employers proportion of the collective net OPEB liability was .012738308% which was the same proportion measured as of August 31, 2016.
For the year ended August 31, 2018, the District recognized OPEB expense of $905,458 and revenue of $905,458 for support provided by the State.
Changes Since the Prior Actuarial Valuation - Changes to the actuarial assumptions or other inputs that affected measurement of the total OPEB liability since the prior measurement period were as follows:
• Additional demographic assumptions (aggregate payroll increases and rate of general inflation) to reflect an experience study;
• The percentage of current and future retirees and retirees ' spouses not yet eligible to participate in the HealthSelect Medicare Advantage plan who will elect to participate at the earliest date at which coverage can commence has been updated to reflect recent plan experience and expected trends;
• Assumptions for administrative expenses, assumed per Capita Health Benefit Costs , Health Benefit Cost and Retiree Contribution trends to reflect recent health plan experience;
• Effects in short-term expectations and revised assumed rate of general inflation.
Changes of Benefit Terms Since Prior Measurement Date - The following benefit revisions have been adopted since the prior valuation :
• An increase in the out-of-pocket cost applicable to services obtained at a free-standing emergency facility;
• An elimination of the copayment for virtual visits; • A copay reduction for Airrosti; • And for out-of-state participants, an elimination of the deductible for in-network
services and application of a copayment rather than coinsurance to certain services like primary care and specialist visits.
These minor benefit changes have been reflected in the fiscal year 2018 Assumed Per Capita Health Benefit Costs.
At August 31, 2018, the District reported its proportionate share of the ERS plan's collective deferred outflows of resources and deferred inflow of resources related to OPEB from the following sources:
52
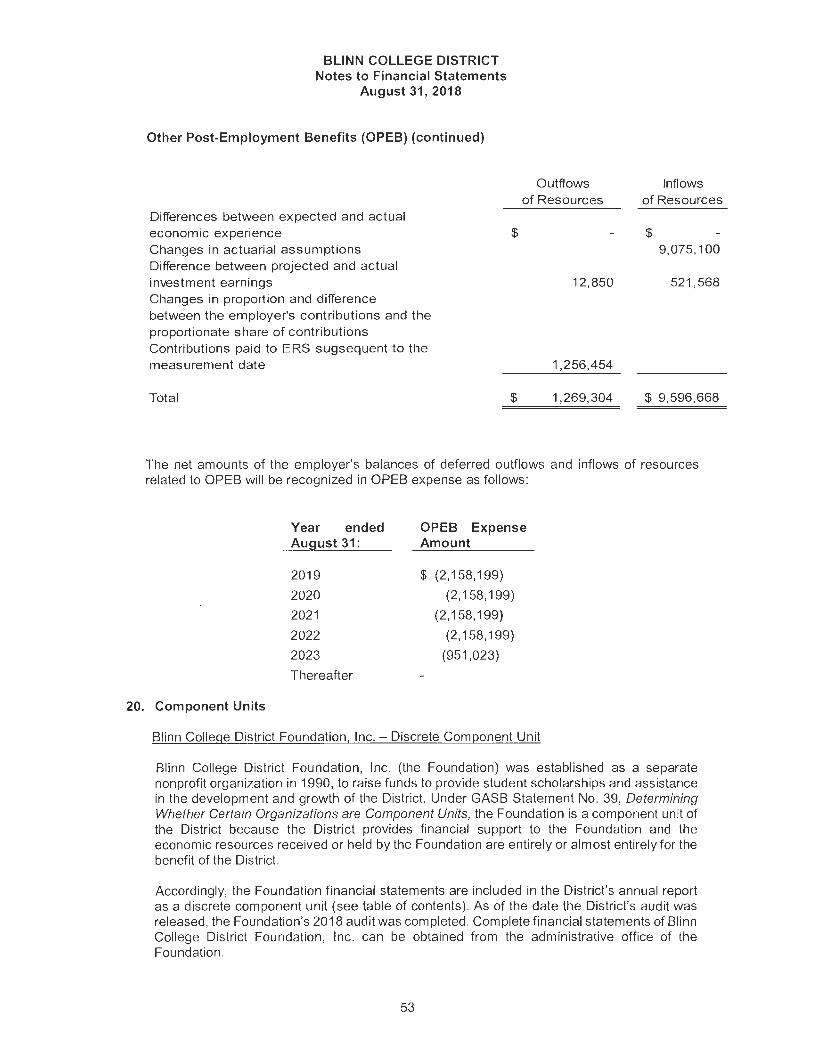
BLINN COLLEGE DISTRICT Notes to Financial Statements
August 31, 2018
Other Post-Employment Benefits (OPEB) (continued)
Differences between expected and actual economic experience Changes in actuarial assumptions Difference between projected and actual investment earnings Changes in proportion and difference between the employer's contributions and the proportionate share of contributions Contributions paid to ERS sugsequent to the measurement date
Total
$
$
Outflows of Resources
12,850
1,256,454
1,269,304
Inflows of Resources
$ 9,075, 100
521,568
$ 9,596,668
The net amounts of the employer's balances of deferred outflows and inflows of resources related to OPEB will be recognized in OPEB expense as follows:
Year ended OPEB Expense August 31 : Amount
2019 $ (2,158,199)
2020 (2,158,199)
2021 (2,158,199)
2022 (2,158,199)
2023 (951,023)
Thereafter
20. Component Units
Blinn College District Foundation, Inc. - Discrete Component Unit
Blinn College District Foundation , Inc. (the Foundation) was established as a separate nonprofit organization in 1990, to raise funds to provide student scholarships and assistance in the development and growth of the District. Under GASB Statement No. 39, Determining Whether Certain Organizations are Component Units, the Foundation is a component unit of the District because the District provides financial support to the Foundation and the economic resources received or held by the Foundation are entirely or almost entirely for the benefit of the District.
Accordingly, the Foundation financial statements are included in the District's annual report as a discrete component unit (see table of contents). As of the date the District's audit was released, the Foundation's 201 8 audit was completed. Complete financial statements of Blinn College District Foundation, Inc. can be obtained from the administrative office of the Foundation.
53
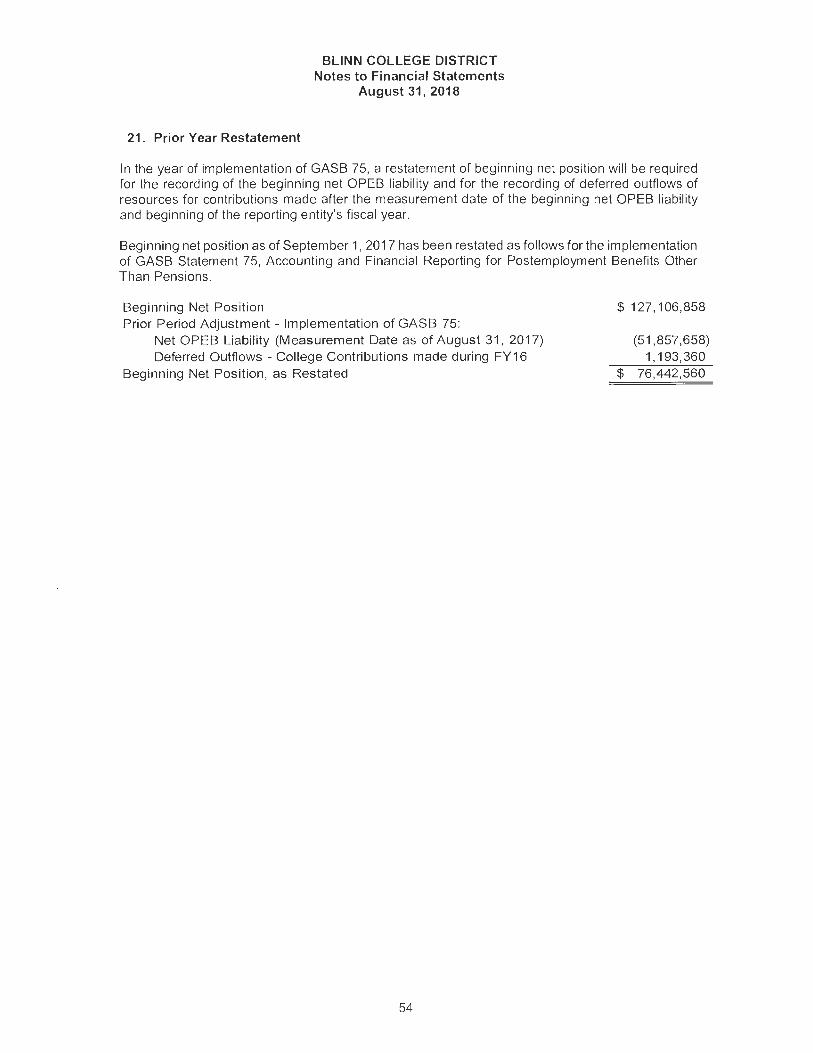
21. Prior Year Restatement
BLINN COLLEGE DISTRICT Notes to Financial Statements
August 31, 2018
In the year of implementation of GASS 75, a restatement of beginning net position will be required for the recording of the beginning net OPES liability and for the recording of deferred outflows of resources for contributions made after the measurement date of the beginning net OPES liability and beginning of the reporting entity's fiscal year.
Beginning net position as of September 1, 2017 has been restated as follows for the implementation of GASS Statement 75, Accounting and Financial Reporting for Postemployment Benefits Other Than Pensions.
Beginning Net Position Prior Period Adjustment - Implementation of GASB 75:
Net OPES Liability (Measurement Date as of August 31, 2017) Deferred Outflows - College Contributions made during FY 16
Beginning Net Position, as Restated
54
$ 127,106,858
(51,857,658) 1,193,360
$ 76,442,560
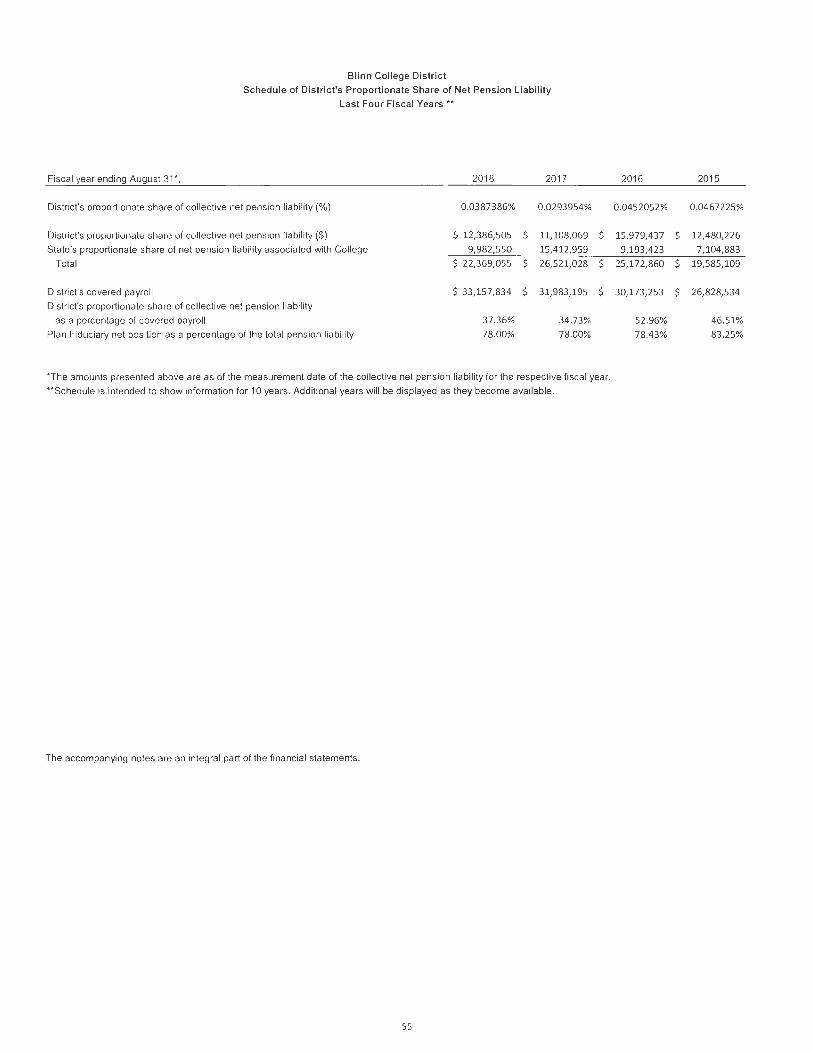
Blinn Col lege District
Schedule of District's Proportionate Share of Net Pension Liability
Last Four Fiscal Years **
Fiscal year ending August 31 *, 2018 2017
District's proportionate share of collective net pension liability(%) 0.0387386% 0.0293954%
District's proportionate share of collective net pension liability($) $ 12,386,505 $ 11,108,069
State's proportionate share of net pension liability associated with College 9,982,550 15,412,959
Total $ 22,369,055 $ 26,521,028
District's covered payroll $ 33,157,834 $ 31,983,195
District's proportionate share of collective net pension liability
as a percentage of covered payroll 37.36% 34.73%
Plan Fiduciary net position as a percentage of the total pension liabi lity 78.00% 78.00%
$
$
$
' The amounts presented above are as of the measurement date of the collective net pension liability for the respective fiscal year.
**Schedule is intended to show information for 10 years. Additional years will be displayed as they become available.
The accompanying notes are an integral part of the financial statements.
55
2016 2015
0.0452052% 0.0467225%
15,979,437 $ 12,480,226
9,193,423 7,104,883
25,172,860 $ 19,585,109
30,173,253 $ 26,828,534
52.96% 46.51%
78.43% 83.25%
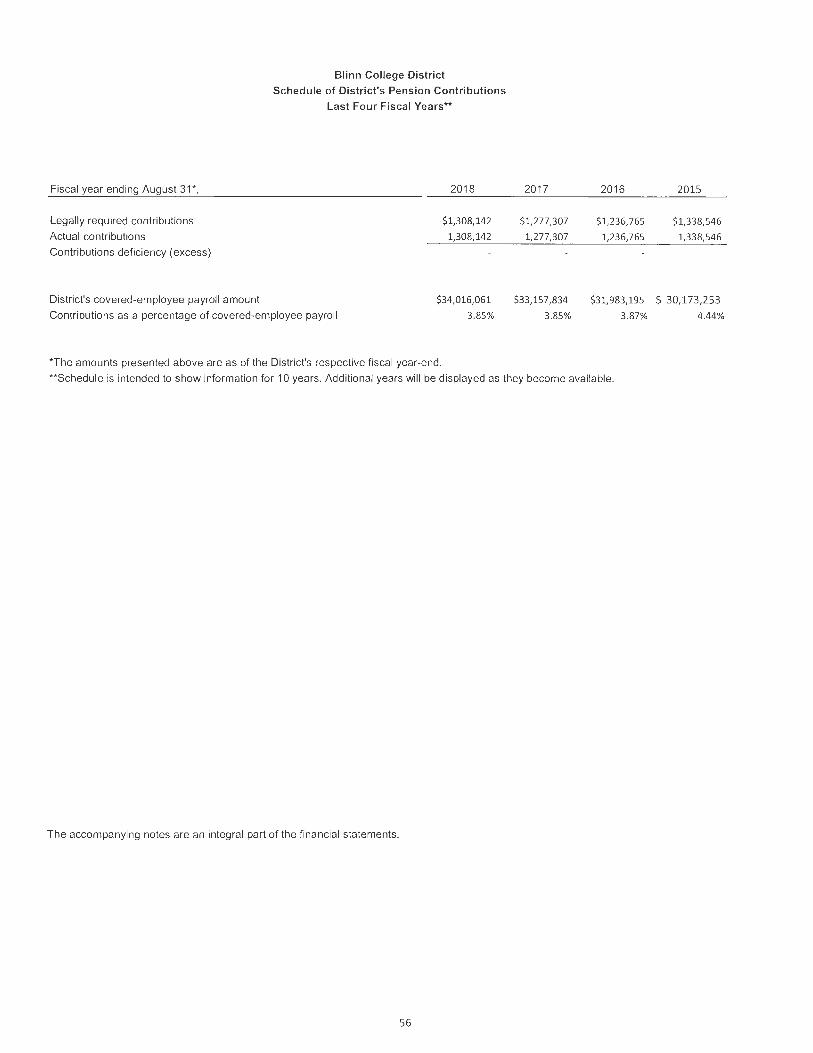
Fiscal year ending August 31 *,
Legally required contributions
Actual contributions
Contributions deficiency (excess)
District's covered-employee payrol l amount
Blinn College District
Schedule of District's Pension Contributions
Last Four Fiscal Years**
2018
$1,308,142
1,308,142
Contributions as a percentage of covered-employee payroll
$34,016,061
3.85%
*The amounts presented above are as of the District's respective fiscal year-end.
2017
$1,277,307
1,277,307
$33,157,834
3.85%
2016
$1,236,765
1,236,765
2015
$1,338,546
1,338,546
$31,983,195 $ 30, 173,253
3.87% 4.44%
**Schedule is intended to show information for 1 O years. Additional years will be displayed as they become available.
The accompanying notes are an integral part of the financia l statements.
56

Blinn College District
Schedule of District's Proportionate Share of Net OPEB Liabi lity
Implemented in Fiscal Year 2018*
Fiscal year ending August 31.,
District's proportionate share of collective net OPEB liability(%)
District's proportionate share of collective net OPEB liability($)
State's proportionate share of net OPEB liabil ity associated with Col lege
Total
District's covered payroll
District's proportionate share of collective net OPEB liability
as a percentage of covered payroll
Plan Fiduciary net position as a percentage of the total pension liability
$
$
$
*The amounts presented above are as of the measurement date of the collective net pension liability for the respective fiscal year.
**Schedule is intended to show information for 1 O years. Additional years will be displayed as they become available.
The accompanying notes are an integral part of the financial statements.
57
2018
0.1273831%
43,403,252
32,917,587
76,320,839
41,519,643
104.54%
78.00%
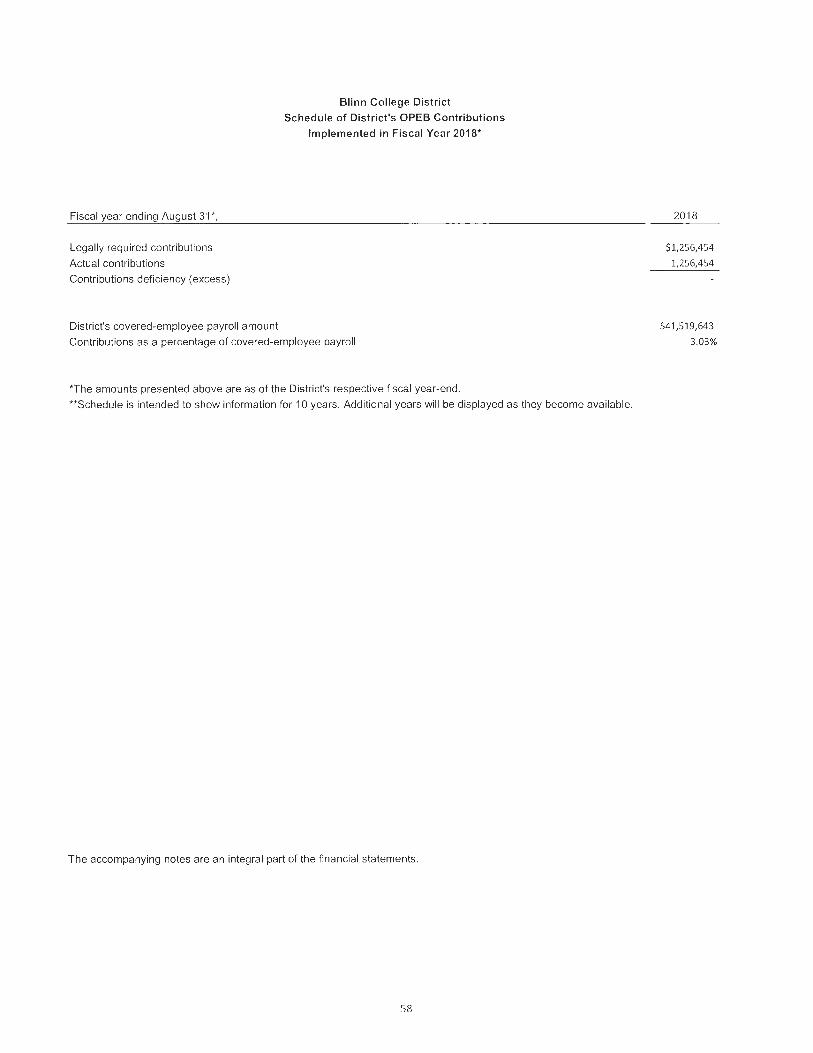
Fiscal year ending August 3'1',
Legally required contributions
Actual contributions
Contributions deficiency (excess)
District's covered-employee payroll amount
Blinn College District
Schedule of District's OPEB Contributions
Implemented in Fiscal Year 2018*
Contributions as a percentage of covered-employee payroll
*The amounts presented above are as of the District's respective fiscal year-end.
**Schedule is intended to show information for 10 years. Additional years will be displayed as they become available.
The accompanying notes are an integral part of the financial statements.
58
2018
$1,256,454
1,256,454
$41,519,643
3.03%
BLINN COLLEGE DISTRICT Notes to Required Supplementary Information (RSI)
For Pensions Year Ended August 31, 2018
1. Changes of Benefit Terms
The College implemented a 3.5 percent salary and wage increase effective September 1, 2017 for ful l time faculty/administrators and all staff.
2. Changes of Assumptions
There were no changes of assumptions for the year ended August 31 , 2018.
59
BLINN COLLEGE DISTRICT Notes to Required Supplementary Information (RSI)
For OPEB Year Ended August 31, 2018
1. Changes of Benefit Terms
Under Q/A #4.107 of GAS B's Implementation Guide No. 2017-2, Financial Reporting for PostEmployment Benefit Plans Other Than Pension Plans, any plan changes that have been adopted and communicated to plan members by the time the valuation is prepared must be included in the valuation. Accordingly, the latest valuation reflects the benefit changes that became effective September 1, 2017, since these changes were communicated to plan member in advance of the preparation of the latest valuation report. The benefit changes for HealthSelect retirees and dependents for whom Medicare is not primary include:
• An increase in the out-of-pocket cost applicable to services obtained at a free-standing emergency facility;
• Elimination of the copayment for virtual visits; • A reduction in the copayment Airrosti; and • For out-of-state participants, (i) elimination of the deductible for in-network services and (ii)
application of a copayment rather than coinsurance to certain services like primary care and specialist office visits.
These minor benefit changes are provided for in the FY 2018 Assumed Per Capita Health Benefit Costs. There are no benefit changes for HealthSelect retirees and dependents for whom Medicare is Primary.
2. Changes of Assumptions
Demographic Assumptions
Since the last valuation was prepared for this plan, demographic assumptions (including rates of retirement, disability, term ination, and mortality, assumed salary increases and assumed age difference for future retirees and their spouses for selected classes of State Agency employees), assumed aggregate payroll increases and the assumed rate of general inflation have been updated to reflect assumptions recently adopted by the ERS Trustees . These new assumptions were adopted to reflect an experience study on the ERS retirement plan performed by the ERS retirement plan actuary.
In addition, the following assumptions have been updated since the previous valuation to reflect recent plan experience and expected trends:
• Percentage of current retirees and retiree spouses not yet eligible to participate in the Health Select Medicare Advantage Plan and future retirees and retiree spouses who will elect to participate in the plan at the earliest date at which coverage can commence.
• Proportion of future retirees covering dependent children. • Percentage of future retirees assumed to be married and electing coverage for their spouse.
60
BLINN COLLEGE DISTRICT Notes to Required Supplementary Information (RSI)
For OPEB Year Ended August 31, 2018
Economic Assumptions
The assumed rate of general inflation has been updated since the previous valuation to remain consistent with ERS retirement plan assumption previously adopted by the ERS Trustees.
Assumptions for Expenses, Assumed Per Capita Health Benefit Costs and Health Benefit Cost, Retiree Contribution and Expense trends have been updated since the previous valuation to reflect recent health plan experience and its effects on our short-term expectations and the revised assumed rate of general inflation .
The discount rate was lowered as a result of requirement by GASB No. 74 to utilize the yield or index rate for 20-year, tax-Oexempt general obligation bonds rated AA/Aa (or equivalent) or higher.
Minor benefit changes have been reflected in the FY 2018 Assumed Per Capita Health Benefit Costs.
61

Schedule A
BLINN COLLEGE DISTRICT Schedule of Operating Revenues
Year Ended August 31, 2018 (With Memorandum Totals for the Year Ended August 31, 2017)
Total Educational Activities Educational Auxi liary 2018 2017
Unrestricted Restricted Activities Enterprises Total Total Tuition: State funded credit courses:
In-district resident tuition $ 481 ,625 $ $ 481 ,62!:> $ $ 481 ,62!:> $ 531,71 2 Out-of-district resident tuition 39,303,775 39,303,775 39,303,775 40,721,770 Non-resident tuition 3,251,260 3,251,260 3,251,260 3,491,1 29 TPEG - credit (set aside)* 1,255,989 1,255,989 1,255,989 1,280,156 State funded continuing education 765,158 765,158 765,158 676,046 Non-State funded continuing education 72,773 72,773 72,773 66,200
Tota l Tuition 45,130,580 45,130,580 45,130,580 46,767,013 Fees:
General fee 19,593,022 19,593,022 3,457,592 23,050,614 20,429,349 Laboratory and course fees 1,938,750 1,938,750 1,938,750 1,848,768 Incidental fees 271,547 271,547 271 ,547 278,697 Other fees 276, 11 2 276, 11 2 345,720
Total fees 21,803,319 21 ,803,319 3,733,704 25,537,023 22,902,534 Allowances and discounts:
Bad debt allowance (305,066) (305,066) (305,066) (502,853) Scholarship allowances (864,038) (864,038) (864,038) (747,764) Remissions and exemptions (3,315,340) (3,315,340) (3,315,340) (3,133,125) TPEG allowances (51 2,999) (512,999) (51 2,999) (460,967) Federal and State grants to students (8,519,057) (8,51 9,057) (8,519,057) (8,967,657) Other (1 51,151) (1 51,151) (151 ,151) (204,004)
Total allowances and discounts (13,667,651) (1 3,667,651) (1 3,667,651) (1 4,016,370) Total net tuition and fees 53,266,248 53,266,248 3,733,704 56,999,952 55,653,177
Additional operating revenues: Federal grants and contracts 801 ,002 801 ,002 801 ,002 654,945 State grants and contracts 2,633,900 2,633,900 2,633,900 2,034,738 Sales and services of educational activities 512,769 512,769 512,769 565,153 Other operating revenues 650,835 650,835 650,835 459,198
Total additional operating revenues 1,163,604 3,434,902 4,598,506 4,598,506 3,714,034 Auxi liary enterprises:
Residential life 5,233, 149 5,233,149 5,099,517 Scholarships allowances and discounts (505,390) (505,390) (533,813)
Net residential life 4,727,759 4,727,759 4,565,704 Cafeteria 4,01 2,497 4,012,497 3,758,889 Scholarship allowances and discounts (277,368) (277,368) (283,618)
Net cafeteria 3,735, 129 3,735,129 3,475,271 Bookstore 1,053,523 1,053,523 1,170,655 Scholarship allowances and discounts (1 26,650) (1 26,650) (138,049)
Net bookstore 926,873 926,873 1,032,606 Parking 3,091 ,872 3,091 ,872 2,356,344 Other auxiliary 1,044,480 1,044,480 495,054
Total net auxiliary enterprises 13,526,11 3 13,526,113 11 ,924,979 Total Operating Revenues $ 54,429,852 $ 3,434,902 $ 57,864,754 $ 17,259,817 $ 75,124,571 $ 71,292, 190
(Exhibil 2) (Exhibil 2)
* In accordance with Education Code §56.033, $1 ,255,989 and $1,280,156 for the years ended August 31, 201 8 and 2017, respectively, of tuition was set aside for Texas Public Education Grants (TPEG).
62

BLINN COLLEGE DISTRICT Schedule of Operating Expenses By Object
Year Ended August 31, 2018 (With Memorandum Totals for the Year Ended August 31, 2017)
Operating Expenses Sa laries Benefits Other
and Wages State Local Expenses
Unrestricted - Educational Activities: Instruction $ 28,473,345 $ $ 5,854,572 $ 2,516,201 Public Service 290,413 58,278 109,803 Academic Support 4,968,890 1,090,304 2,017,778 Student Services 3,958,101 929,540 1,029,575 Institutional Support 5,777,705 1,337,786 5,214,061 Operation and Maintenance of Plant 2,533,105 886 ,752 9,975,456 Scholarships and Fellowships 1,032,445
Total Unrestricted - Educational Activities 46,001,559 10,157,232 21,895,319
Restricted - Educational Activities: Instruction 132,793 2,559,121 37,324 132,865 Public Service 298,260 27,365 88,218 1,010,967 Academic Support 512,838 Student Services 510,709 Institutional Support 31 ,671 2,225 ,898 3,800 42,209 Scholarships and Fellowships 13,137,105
Total Restricted - Educational Activities 462 ,724 5,835,931 129,342 14,323,146
Total Educational Activities 46,464,283 5,835,931 10,286,574 36,218,465
Auxiliary Enterprises 2,884,476 1,398,608 4,964,330
Depreciation Expense - Buildings and other real estate improvements 3,142,489
Depreciation Expense - Equipment, furniture and library books 1,075,272
Total Operating Expenses $ 49,348,759 $5,835,931 $ 11,685,182 $ 45,400,556
63
Schedu le B
2018 2017 Total Total
$ 36,844,118 $ 38 ,815 ,035 458,494 584 ,732
8,076,972 6,080 ,958 5,917,216 5,843 ,422
12,329,552 12,060,437 13,395,313 8,552,614
1,032,445 893,509 78,054,110 72 ,830,707
2,862,103 2,859,878 1,424,810 1,116,961
512,838 419,291 510,709 524,591
2,303,578 2,412,143 13,137,105 11,518,610
20,751,143 18,851 ,475
98,805,253 91,682,182
9,247,414 9,130,531
3,142,489 3,069,340
1,075,272 1,092 ,683
$ 112,270,428 $ 104,974,736
(Exhibit 2) (Exhibit 2)
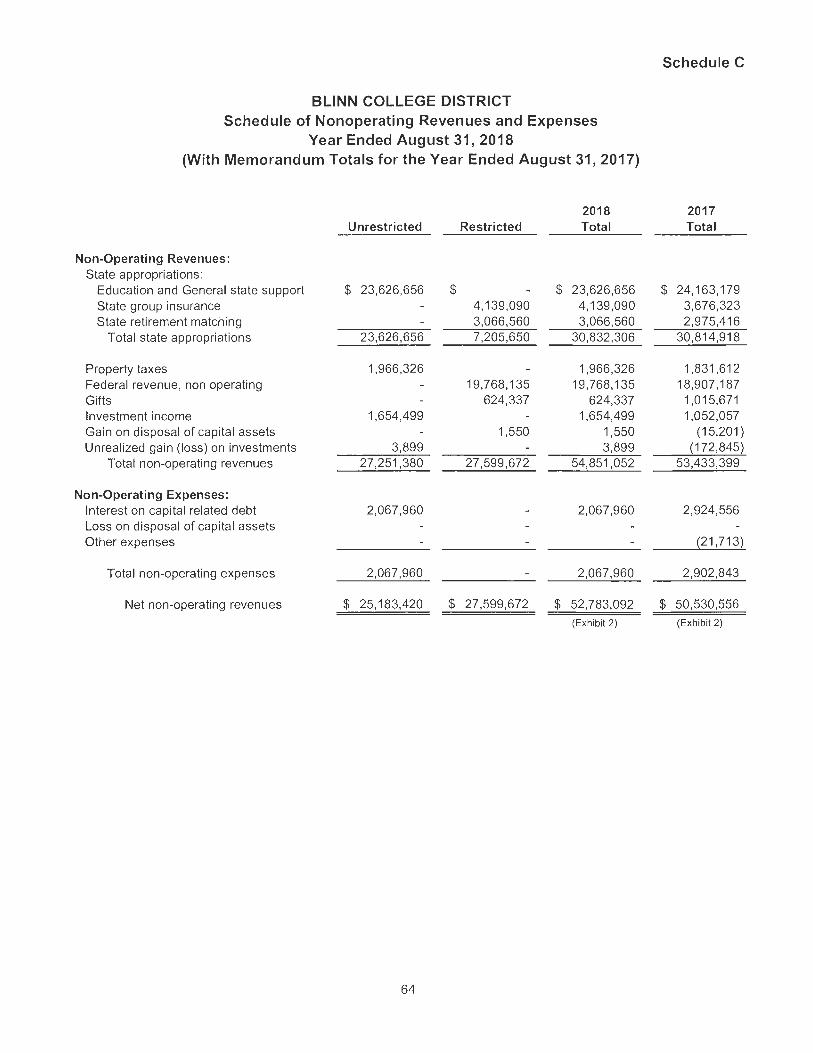
Schedule C
BLINN COLLEGE DISTRICT Schedule of Nonoperating Revenues and Expenses
Year Ended August 31, 2018 (With Memorandum Totals for the Year Ended August 31, 2017)
201 8 2017 Unrestricted Restricted Total Total
Non-Operating Revenues: State appropriations:
Education and General state support $ 23,626,656 $ $ 23,626,656 $ 24,163,179 State group insurance 4,139,090 4,139,090 3,676,323 State retirement matching 3,066,560 3,066,560 2,975,416
Tota l state appropriations 23,626,656 7,205,650 30,832,306 30,814,918
Property taxes 1,966,326 1,966,326 1,831,612 Federal revenue, non operating 19,768,135 19,768,135 18,907,187 Gifts 624,337 624,337 1,015,671 Investment income 1,654,499 1,654,499 1,052,057 Gain on disposal of capital assets 1,550 1,550 (15,201) Unrealized gain (loss) on investments 3,899 3,899 (172,845)
Total non-operating revenues 27,251,380 27,599,672 54,851,052 53,433,399
Non-Operating Expenses: Interest on capital related debt 2,067,960 2,067,960 2,924,556 Loss on disposal of capita l assets Other expenses (21,713)
Total non-operating expenses 2,067,960 2,067,960 2,902,843
Net non-operating revenues $ 25,183,420 $ 27,599,672 $ 52,783,092 $ 50,530,556
(Exhibit 2) (Exhibit 2)
64
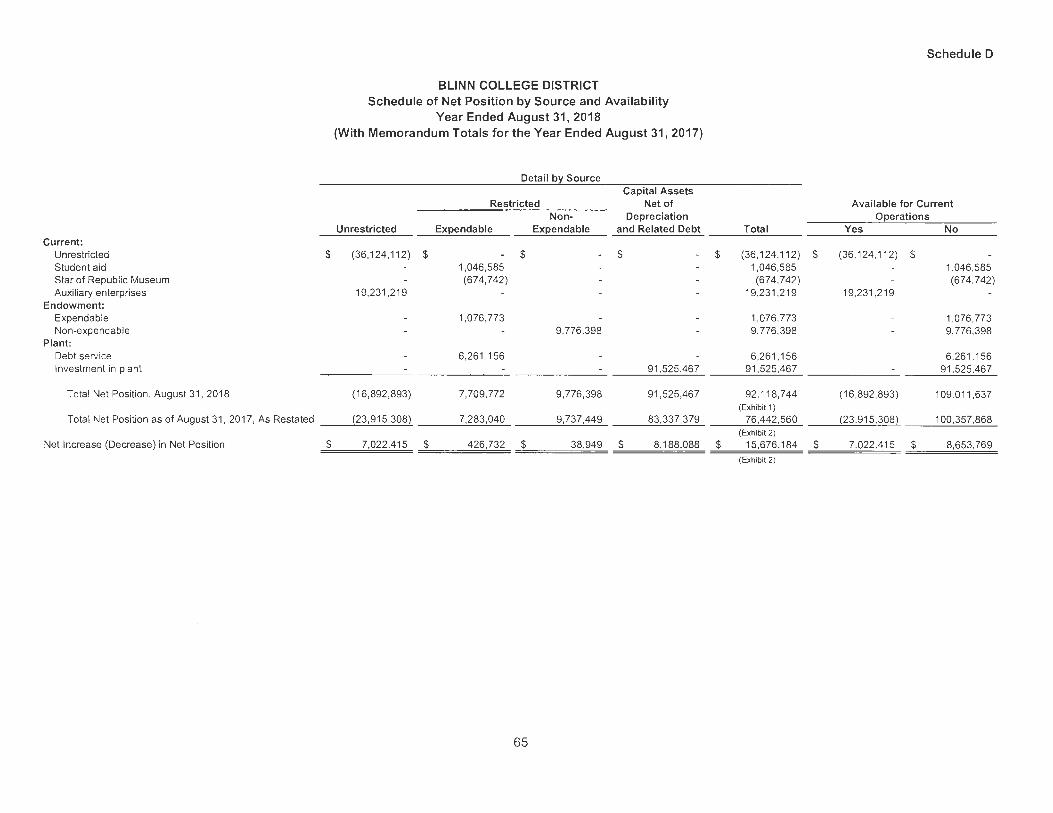
Current: Unrestricted $ Student aid Star of Republic Museum Auxiliary enterprises
Endowment: Expendable Non-expendable
Plant: Debt service Investment in plant
Total Net Position, August 31 , 2018
Total Net Position as of August 31, 2017, As Restated
Net Increase (Decrease) in Net Position $
BLINN COLLEGE DISTRICT Schedule of Net Position by Source and Availability
Year Ended August 31 , 2018 (With Memorandum Totals for the Year Ended August 31 , 2017)
Detail by Source Capital Assets
Restricted Net of Non- Depreciation
Unrestricted Expendable Expendable and Related Debt
(36,124,112) $ $ $ 1,046,585 (674,742)
19,231,219
1,076,773 9,776,398
6,261 ,156 91 ,525,467
(16,892,893) 7,709,772 9,776,398 91,525,467
(23,915,308) 7,283,040 9,737,449 83,337,379
7,022,415 $ 426,732 $ 38,949 $ 8,188,088
65
Schedule D
Available for Current Operations
Total Yes No
$ (36,124,112) $ (36,124,11 2) $ 1,046,585 1,046,585 (674,742) (674,742 )
19,231 ,219 19,231 ,219
1,076,773 1,076,773 9,776,398 9,776,398
6,261 ,1 56 6,261 ,1 56 91 ,525,467 91 ,525,467
92,118,744 (16,892,893) 109,011 ,637 (Exhibit 1)
76,442,560 (23,915,308) 100,357,868 (Exhibit 2)
$ 15,676,184 $ 7,022,415 $ 8,653,769
(Exhibit 2)

BLINN COLLEGE DISTRICT Schedule of Expenditures of Federal Awards For The Year Ended August 31, 2018
Federa l Granter/Pass Throug h Granter/ Program Title
U.S. Department of Education Direct Programs: Student Financia l Assistance Cluster
Federal Supplemental Education Opportunity Grant Federal Supplementa l Education Opportunity Grant
Federa l Work Study Program Federal Work Study Program
Federa l Pell Grant
Federal Direct Student Loan Program
Tota l Student Financial Assistance Cluster
Pass-Through From: Texas Higher Education Coordinating Board
Carl Perkins Vocational Education
Texas Workforce Commission Brazos Valley Council of Governments
Federa l Audit Education Literacy Federal Audit Education Literacy- TANF Federal Audit Education Literacy- EL Civics Federa l Audit Education Literacy- Professional Development Adult Education Literacy Transitional
Tota l Pass-Through From Department of Education
Tota l U.S. Department of Education
U.S. Department of Labor Pass-Through from:
Texas Workforce Commission: Building Construction Trades
National Science Foundation Direct Programs:
Education and Human Resources
U.S. Small Business Administration Pass-Through from:
University of Houston: Small Business Development Center Small Business Development Center
Tota l U.S. Small Business Administration
Total Expenditures of Federal Awards
Federal Direct Student Loan Program, CFDA 84.268, includes the following: Direct Subsidized Loans Direct Unsubsidized Loans Direct PLUS Loans
Federal CFDA
Number
84.007 84.007
84.033 84.033
84.063
84.268
84.048
84.002 84.002 84.002 84.002 84.002
Pass-Through Grantor's Number
P007A163969 P007 A 173969
P033A 163969 P033A173969
P063P172262
P268K182262
184209
1618ALAOOO 1618ALAOOO 1618ALAOOO 1618ALAOOO 1618ALAOOO
17.258 AA-28345-16-55-A-48
47.076
59.037 59.037
1614496
R-17-0027-53803 R-18-0046-53803
See accompanying notes to Schedules of Expenditures of Federal and State Awards.
66
Schedule E
Expenditures and
Pass Through Disbursements
$ 18.313 233. 149
$
$
$
24,500 221,018 245,518
19,516.673
30,517.602 30,517.602
50,531,255
342,729
11 .330 2.196 2.196
185 3,946
19,853
362.582
50,893,837
48,136
25.177
3.876 115,713
119,589
51,086.739
13,615,588 14,281.008 2,621.006
30,517.602
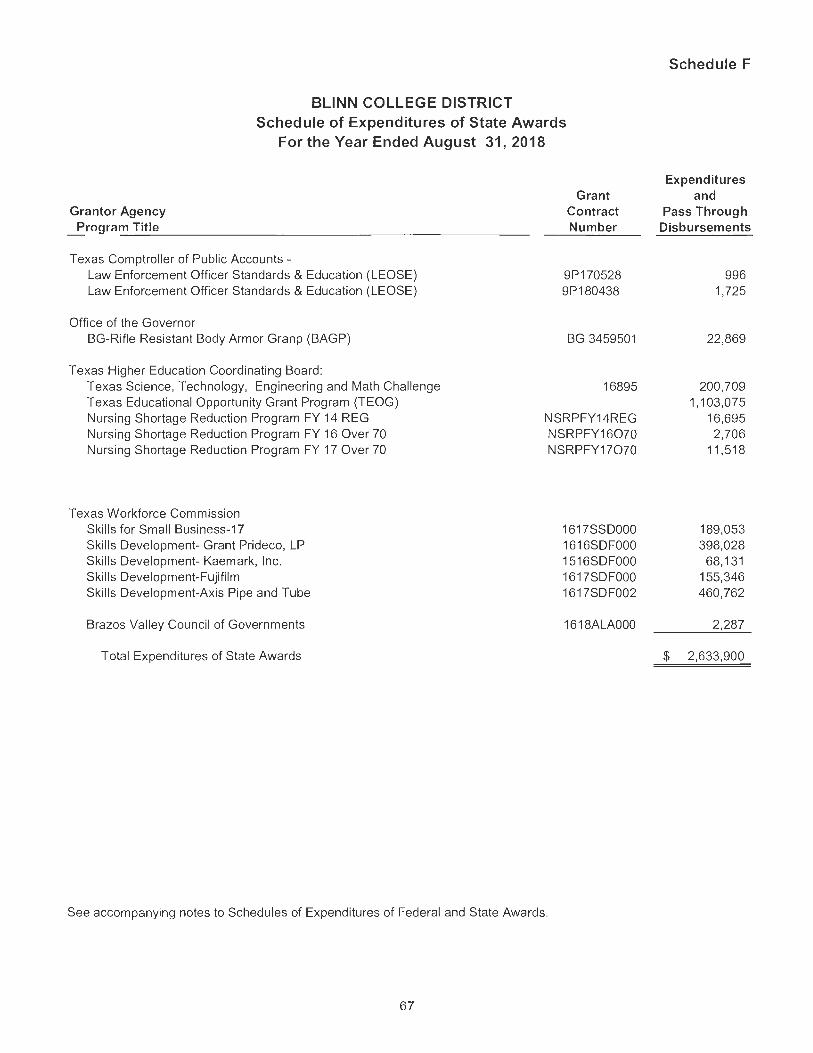
BLINN COLLEGE DISTRICT Schedule of Expenditures of State Awards
For the Year Ended August 31, 2018
Grantor Agency ~rogrnm_T_i_tl_e _____________________ _
Texas Comptroller of Public Accounts -Law Enforcement Officer Standards & Education (LEOSE) Law Enforcement Officer Standards & Education (LEOSE)
Office of the Governor BG-Rifle Resistant Body Armor Granp (BAGP)
Texas Higher Education Coordinating Board : Texas Science, Technology, Engineering and Math Challenge Texas Educational Opportunity Grant Program (TEOG) Nursing Shortage Reduction Program FY 14 REG Nursing Shortage Reduction Program FY 16 Over 70 Nursing Shortage Reduction Program FY 17 Over 70
Texas Workforce Commission Skills for Small Business-17 Skills Development- Grant Prideco, LP Skills Development- Kaemark, Inc. Skills Development-Fujifilm Ski lls Development-Axis Pipe and Tube
Brazos Valley Council of Governments
Total Expenditures of State Awards
Grant Contract Number
9P170528 9P180438
BG 3459501
16895
NSRPFY14REG NSRPFY16070 NSRPFY17070
1617SSDOOO 1616SDFOOO 1516SDFOOO 1617SDFOOO 1617SDF002
1618ALAOOO
See accompanying notes to Schedules of Expenditures of Federal and State Awards.
67
Schedule F
Expenditures and
Pass Through Disbursements
996 1,725
22,869
200,709
$
1,103,075 16,695 2,706
11,518
189,053 398,028
68,131 155,346 460,762
2,287
2,633,900
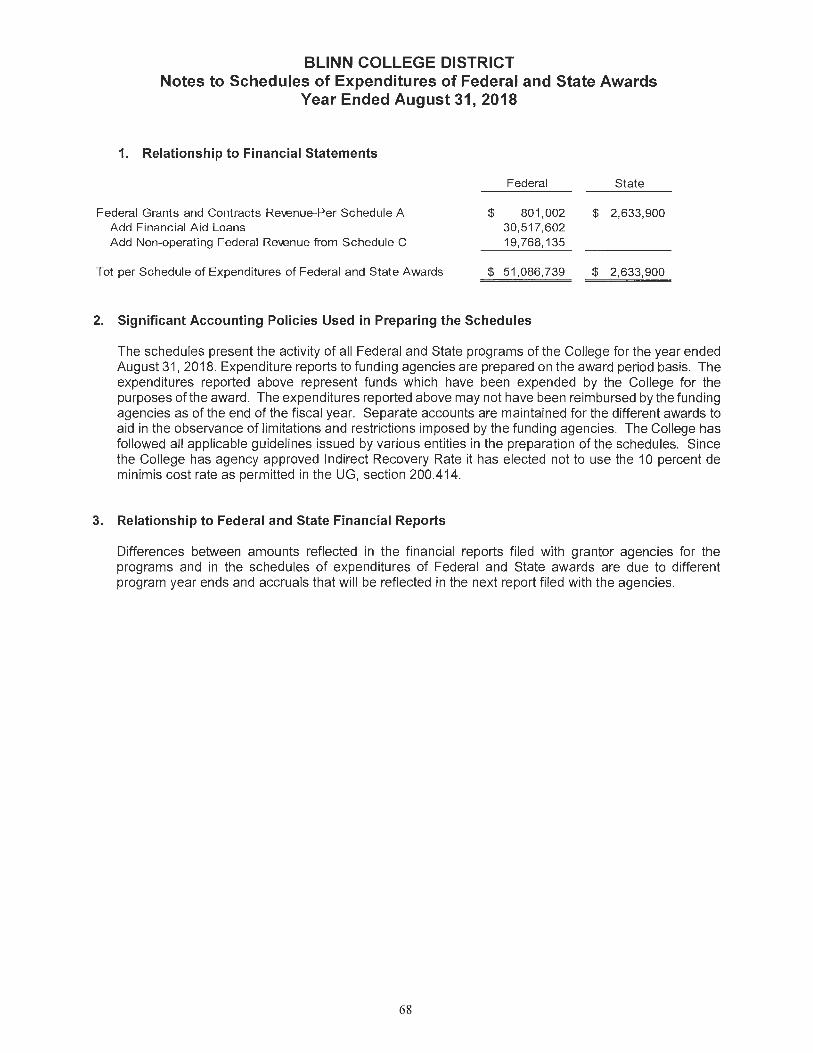
BLINN COLLEGE DISTRICT Notes to Schedules of Expenditures of Federal and State Awards
Year Ended August 31, 2018
1. Relationship to Financial Statements
Federal Grants and Contracts Revenue-Per Schedule A Arlrl Fin;:inr.i;:i l Airl Loans Add Non-operating Federal Revenue from Schedule C
Tot per Schedule of Expenditures of Federal and State Awards
$
$
Federal
801,002 30,517,602 19,768,135
51,086,739
2. Significant Accounting Policies Used in Preparing the Schedules
State
$ 2,633,900
$ 2,633,900
The schedules present the activity of all Federal and State programs of the College for the year ended August 31, 2018. Expenditure reports to funding agencies are prepared on the award period basis. The expenditures reported above represent funds which have been expended by the College for the purposes of the award. The expenditures reported above may not have been reimbursed by the funding agencies as of the end of the fiscal year. Separate accounts are maintained for the different awards to aid in the observance of limitations and restrictions imposed by the funding agencies. The College has followed al l applicable guidelines issued by various entities in the preparation of the schedules. Since the College has agency approved Indirect Recovery Rate it has elected not to use the 10 percent de minimis cost rate as permitted in the UG, section 200.414.
3. Relationship to Federal and State Financial Reports
Differences between amounts reflected in the financial reports fi led with granter agencies for the programs and in the schedules of expenditures of Federal and State awards are due to different program year ends and accruals that will be reflected in the next report filed with the agencies.
68

AUDITOR'S REPORTS ON CONTROLS AND COMPLIANCE AND
SCHEDULE OF FINDINGS AND QUESTIONED COSTS

~ LOTT, VERNON & COMPANY, P.C.
CERTIFIED PUBLIC ACCOUNTANTS
20 SOUTH FOURTH STREET POST OFFICE BOX 160 TEMPLE, TEXAS 76503
Member of
254/778 / 4783 800/460/4783 FAX 254/778/4792
KILLEEN • COPPERAS COVE • TEMPLE American Institute & Texas Society of
Certified Public Accountants
INDEPENDENT AUDITOR'S REPORT ON INTERNAL CONTROL OVER FINANCIAL REPORTING AND ON COMPLIANCE
AND OTHER MATTERS BASED ON AN AUDIT OF FINANCIAL STATEMENTS PERFORMED IN ACCORDANCE
WITH GOVERNMENT AUDITING STANDARDS
Board of Trustees Blinn College District Brenham, Texas
We have audited, in accordance with the auditing standards generally accepted in the United States of America and the standards applicable to financial audits contained in Government Auditing Standards issued by the Comptroller General of the United States, the financial statements of Blinn College District (the District), as of and for the years ended August 31, 2018 and 2017, and the related notes to the financial statements, which collectively comprise the District's basic financial statements, and have issued our repmi thereon dated November 27, 2018.
Internal Control Over Financial Reporting
In planning and perfonning our audit of the financial statements, we considered the Distiict's internal control over financial repmiing (internal control) to dete1mine the audit procedures that are appropriate in the circumstances for the purpose of expressing our opinions on the financial statements, but not for the purpose of expressing an opinion on the effectiveness of the District's internal control. Accordingly, we do not express an opinion on the effectiveness of the District's internal control.
A deficiency in internal control exists when the design or operation of a control does not allow management or employees, in the normal course of perfo1ming their assigned functions, to prevent, or detect and c01Tect misstatements on a timely basis. A material weakness is a deficiency, or a combination of deficiencies, in internal control, such that there is a reasonable possibility that a material misstatement of the District ' s financial statements will not be prevented, or detected and conected on a timely basis. A significant deficiency is a deficiency, or a combination of deficiencies, in internal control that is less severe than a material weakness, yet impo1iant enough to merit attention by those charged with governance.
69
INDEPENDENT AUDITOR'S REPORT ON INTERNAL CONTROL OVER FINANCIAL REPORTING AND ON COMPLIANCE
AND OTHER MATTERS BASED ON AN AUDIT OF FINANCIAL STATEMENTS PERFORMED IN ACCORDANCE
WITH GOVERNMENT AUDITING STANDARDS (CONTINUED)
Our consideration of internal control was for the limited purpose described in the first paragraph of this section and was nol designed Lo idelllify all deficiencies in internal control Lhal might be material weaknesses or, significant deficiencies. Given these limitations, during our audit we did not identify any deficiencies in internal control that we consider to be material weaknesses. However, material weaknesses may exist that have not been identified.
Compliance and Other Matters
As part of obtaining reasonable assurance about whether the District' s financial statements are free from material misstatement, we performed tests of its compliance with certain provisions of laws, regulations, contracts and grant agreements, including the Public Funds Investment Act (Chapter 2256, Texas Government Code), noncompliance with which could have a direct and material effect on the determination of financial statement amounts. However, providing an opinion on compliance with those provisions was not an objective of our audit, and accordingly, we do not express such an opinion. The results of our tests disclosed no instances of noncompliance or other matters that are required to be reported under Government Auditing Standards or the Public Funds Investment Act (Chapter 2256, Texas Government Code).
Purpose of this Report
The purpose of this report is solely to describe the scope of our testing of internal control and compliance and the results of that testing, and not to provide an opinion on the effectiveness of the District's internal control or on compliance. This report is an integral part of an audit performed in accordance with Government Auditing Standards in considering the District's internal control and compliance. Accordingly, this communication is not suitable for any other purpose.
emple, Texas November 27, 2018
70

~ LOTT, VERNON & COMPANY, P.C.
CERTIFIED PUBLIC ACCOUNTANTS
KILLEEN • COPPERAS COVE • TEMPLE
20 SOUTH FOURTH STREET POST OFFICE BOX 160 TEMPLE, TEXAS 76503
Member of
254/778/ 4783 800 I 460 I 4783 FAX 254/778/ 4792
American In stitute & Texas Society of Certified Public Accountants
INDEPENDENT AUDITOR'S REPORT ON COMPLIANCE FOR EACH MAJOR PROGRAM AND ON INTERNAL CONTROL
OVER COMPLIANCE REQUIRED BY THE UNIFORM GUIDANCE AND THE STATE OF TEXAS SINGLE AUDIT CIRCULAR
Board of Trustees Blinn College District Brenham, Texas
Repmi on Compliance for Each Major Federal and State Program
We have audited Blinn College District's compliance with the types of compliance requirements described in the 0MB Compliance Supplement and The State of Texas Single Audit Circular that could have a direct and material effect on each of its major federal and state programs for the year ended August 31, 2018. The District's major federal and state programs are identified in the summary of auditor's results section of the accompanying Schedule of Findings and Questioned Costs.
Management's Responsibility
Management is responsible for compliance with the requirements of laws, regulations, contracts, and grants applicable to its federal and state programs.
Audi_tor's Responsibility
Our responsibility is to express an opinion on compliance for each of the District's major federal and state programs based on our audit of the types of compliance requirements referred to above. We conducted our audit of compliance in accordance with auditing standards generally accepted in the United States of America; the standards applicable to financial audits contained in Goverrunent Auditing Standards, issued by the Comptroller General of the United States; the audit requirements of Title 2 U.S. Code of Federal Regulations Paii 200, Uniform Administrative Requirements, Cost Principles, and Audit Requirements for Federal Awards (Unifonn Guidance), and the State of Texas Single Audit Circular.
71

INDEPENDENT AUDITOR'S REPORT ON COMPLIANCE FOR EACH MAJOR PROGRAM AND ON INTERNAL CONTROL OVER COMPLIANCE REQUIRED BY THE UNIFORM GUIDANCE AND
THE STATE OF TEXAS SINGLE AUDIT CIRCULAR (CONTINUED)
Those standards, the Uniform Guidance and The State of Texas Single Audit Circular require that we plan and perform the audit to obtain reasonable assurance about whether noncompliance with the types of compliance requirements referred to above that could have a direct and material effect on a major federal or state program occurred. An audit includes examining, on a test basis, evidence about the District ' s compliance with those requirements and performing such other procedures as we considered necessary in the circumstances.
We believe that our audit provides a reasonable basis for our opinion on compliance for each major federal and state program. However, our audit does not provide a legal determination of the District's compliance.
Opinion on Each Major Federal and State Program
In our opinion, Blinn College District complied, in all material respects, with the types of compliance requirements referred to above that could have a direct and material effect on each of its major federal and state programs for the year ended August 31, 2018.
Report on Internal Control Over Compliance
Management of the District is responsible for establishing and maintaining effective internal control over compliance with the types of compliance requirements referred to above. In planning and performing our audit of compliance, we considered the District's internal control over compliance with the types of requirements that could have a direct and material effect on each major federal and state program to detennine the auditing procedures that are appropriate in the circumstances for the purpose of expressing an opinion on compliance for each major federal and state program and to test and report on internal control over compliance in accordance with The Uniform Guidance and The State of Texas Single Audit Circular, but not for the purpose of expressing an opinion on the effectiveness of the District ' s internal control over compliance. Accordingly, we do not express an opinion on the effectiveness of the District ' s internal control over compliance.
A deficiency in internal control over compliance exists when the design or operation of a control over compliance does not allow management or employees, in the normal course of performing their assigned functions, to prevent, or detect and correct, noncompliance with a type of compliance requirement of a federal or state program on a timely basis. A material weakness in internal control over compliance is a deficiency, or combination of deficiencies, in internal control over compliance, such that there is a reasonable possibility that material noncompliance with a type of compliance requirement of a federal or state program will not be prevented, or detected and corrected, on a timely basis. A significant deficiency in internal control over compliance is a deficiency, or a combination of deficiencies, in internal control over compliance with a type of compliance requirement of a federal or state program that is less severe than a material weakness in internal control over compliance, yet important enough to merit attention by those charged with governance.
72

INDEPENDENT AUDITOR'S REPORT ON COMPLIANCE FOR EACH MAJOR PROGRAM AND ON 1NTERNAL CONTROL OVER COMPLIANCE REQUIRED BY THE UNIFORM GUIDANCE AND
THE STATE OF TEXAS SINGLE AUD1T CIRCULAR (CONTINUED)
Our consideration of internal control over compliance was for the limited purpose described in the first paragraph of thi s section and was not designed to identify all deficiencies in internal control over cornpliance that might be material weaknesses or significant deficiencies. We did not identify any deficiencies in internal control over compliance that we consider to be material weaknesses. However, material weaknesses may exist that have not been identified.
The purpose of this report on internal control over compliance is solely to describe the scope of our testing of internal control over compliance and the results of that testing based on the requirements of the Uniform Guidance and The State of Texas Single Audit Circular. Accordingly, this report is not suitable for any other purpose.
emple, Texas November 27, 2018
73

BLINN COLLEGE DJSTRJCT Schedule of Findings and Questioned Costs August 31, 2018
I. Summary of Audit Results Financial Statements
1. Type of auditor's report issued:
?.. Tntern;::il contro l over financial reporting: Material weakness( es) identified? Significant deficiencies identified that are not considered to be material weakness( es)?
3. Noncompliance material to financial statements noted?
Federal and State Awards 4. Internal control over major programs:
Material weakness( es) identified? Significant deficiencies identified that are not considered to be material weakness( es)?
5. Type of auditor' s report issued on compliance for major programs:
6. Any audit findings disclosed that are required to be reported in accordance with section 200.516a of the Uniform Guidance or the State of Texas Single Audit Circular and Uniform Grant Management Standards?
7. Identification of major programs:
Name of Federal Programs Federal
CFDA Number
U.S. Department of Education Student Financial Aid Cluster
Supplemental Educational Opportunity Grant Federal Work Study Program Federal Pell Grant Program Federal Direct Student Loans
U.S. Small Business Administmtion Small Business Development Center
84.007 84.033 84.063 84.268
59.037
74
unmodified
__ yes_x_ no
__ yes _x_ none reported
__ yes_x_ no
_ _ yes X no
yes X none reported
unmodified
__ yes _x_ no
Name of State Program
Texas Workforce Commission Skills for Small Business Skills Development Brazos Valley Council of Governments

BLINN COLLEGE DISTRICT Schedule of Findings and Questioned Costs (Continued) August 31, 2018
8. Dollar threshold used to distinguish between type A and type B federal programs :
9. Dollar threshold used to distinguish between type A and type B state programs:
10. Auditee qualified as low-risk auditee for federal single audit?
II.
11. Auditee qualified as low-risk auditee for state single audit?
Financial Statement Findings None.
$750,000
$300,000
_x_ yes __ no
X yes __ no
III. Federal and State Awards Findings and Questioned Costs
None.
75
Related Documents


