MARKET RESEARCH PROJECT BLIND PRODUCT TEST Ankush Roy Krishna Bollojula Shubham Sharma Suddhasheel Bhattacharya

Blind Product Test - Data Analysis
Aug 15, 2015
Welcome message from author
This document is posted to help you gain knowledge. Please leave a comment to let me know what you think about it! Share it to your friends and learn new things together.
Transcript

MARKET RESEARCH PROJECTBLIND PRODUCT TEST
Ankush Roy
Krishna Bollojula
Shubham Sharma
Suddhasheel Bhattacharya

AGENDA
• Background
• Objective
• Research Design
• Data Description
• Data Analysis
• Insights from Data Analysis
• Recommendations
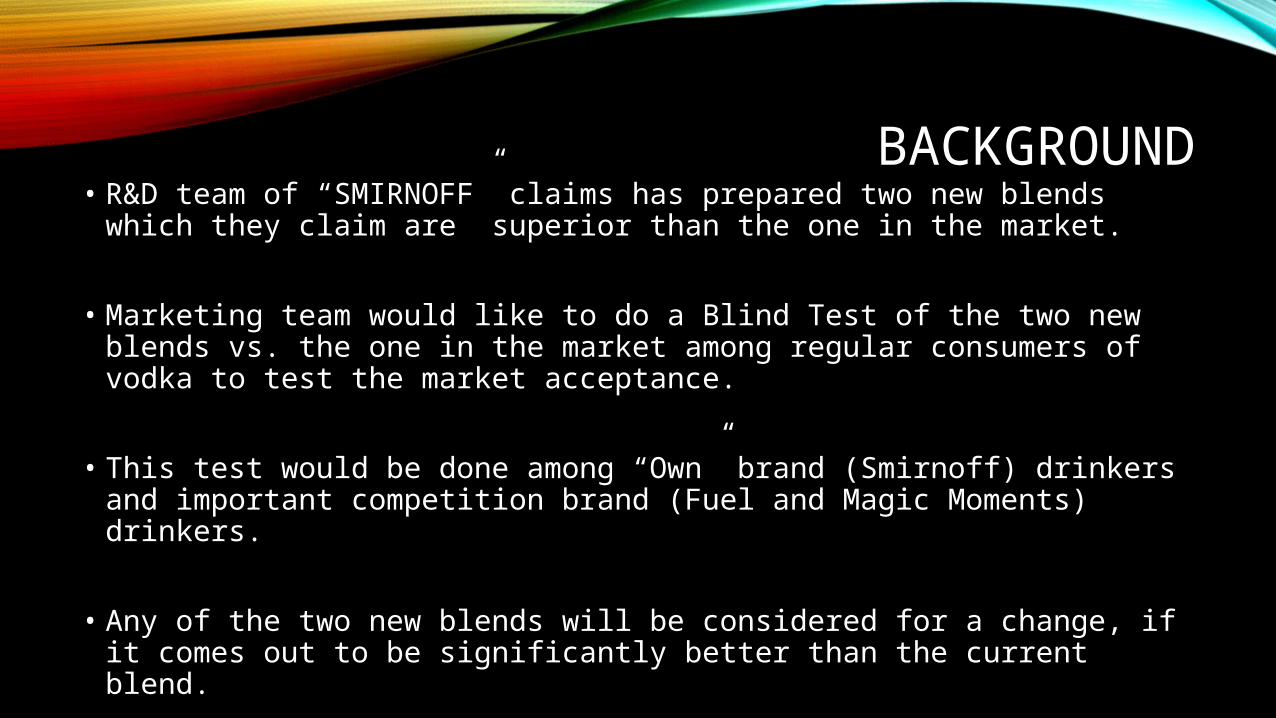
BACKGROUND• R&D team of “SMIRNOFF” claims has prepared two new blends which
they claim are superior than the one in the market.
• Marketing team would like to do a Blind Test of the two new blends vs. the one in the market among regular consumers of vodka to test the market acceptance.
• This test would be done among “Own” brand (Smirnoff) drinkers and important competition brand (Fuel and Magic Moments) drinkers.
• Any of the two new blends will be considered for a change, if it comes out to be significantly better than the current blend.

OBJECTIVEPrimary Objective :
• To replace the current product with any of the two test products if found significantly(statistically) superior.
Secondary Objective :
• To understand which parameters are the key drivers for overall vodka preference and to what extent.
• To predict the factors(by reducing attributes) which influence the preference of vodka.
• To predict the purchase intention by evaluating the attribute ratings.

RESEARCH DESIGN• Sequential monadic exposure method is used to collect responses.
• All the three blends are placed for consumption one after the other and feedback is taken after each consumption.
• Neutralizer is given after each consumption to ensure the unbiased responses.
• The current product in the market “SMIRNOFF” is the Control Blend and the other two blends are Test Blend1 and Test Blend2.
• Sample Size : Total 760 sample size which gives you 2280 data points as each respondent
has given feedback on all three products.
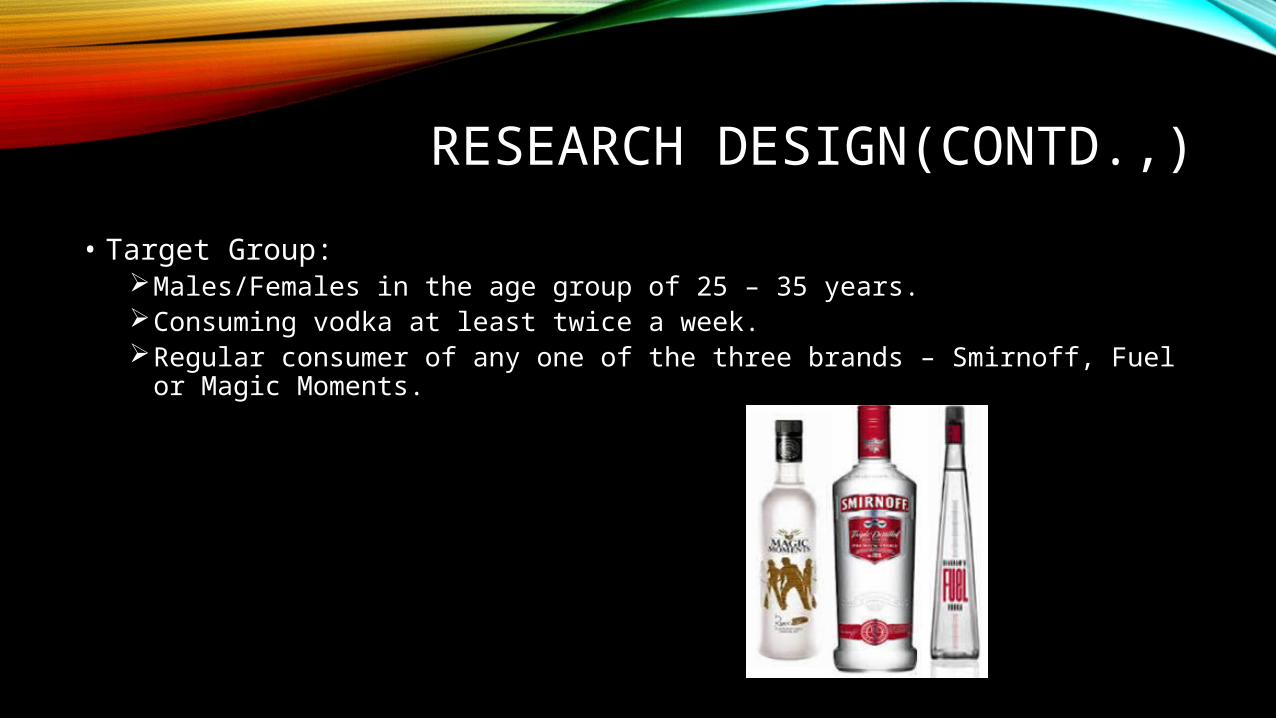
RESEARCH DESIGN(CONTD.,)
• Target Group:Males/Females in the age group of 25 – 35 years.Consuming vodka at least twice a week.Regular consumer of any one of the three brands – Smirnoff, Fuel or Magic
Moments.

DATA DESCRIPTION
• Centers : 1. Delhi 2. Mumbai 3. Kolkata 4. Bangalore 5.Chennai
• Main Brands : Magic Moments , Smirnoff , Fuel
• Age Category : 1. 25 - 30 2. 31-35
• Panel :1. Blend 1 has been placed first.
2. Blend 2 has been placed first.
3. Blend 3 has been placed first.
• Attributes rated on 10 point scale : Overall Likeability, Aroma, Taste, Smoothness, Flavor, Throat-Feel, After-taste and Mouth-feel.
• Attributes rated on 5 point scale : Strengths of Aroma, Taste, smoothness, Flavor and After-Taste.
• Intention to buy attribute(1-Yes, 2-No)

DATA ANALYSIS• Attributes that drive overall preference of vodka blends are found by doing a
regression analysis between overall likeability and all other attributes.OL= 0.391 + 0.07Aroma_Neat + 0.04Aroma_Mixer + 0.11Aroma + 0.29Taste +
0.11Smoothness +
0.07Flavor + 0.09ThroatFeel + 0.05AfterTaste + 0.19MouthFeel
• However, we noticed that few attributes are not contributing much to the model as their standardized beta coefficients are very less.
• We run the step-wise regression to eliminate less contributing attributes and arrive at the best fit model.
OL= 0.478 + 0.334Taste + 0.269MouthFeel + 0.152Aroma + 0.159Smoothness + 0.089Aroma_Neat
• We found that the Taste and MouthFeel are two important drivers for overall preference of vodka.
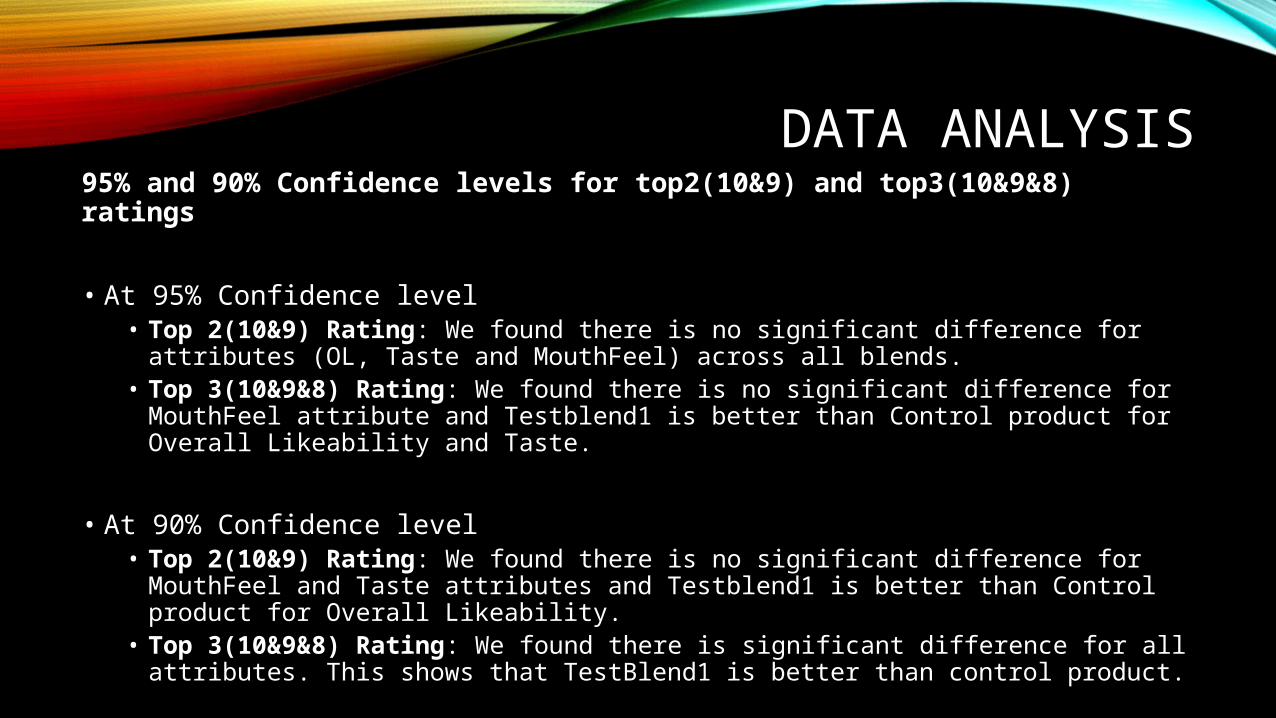
DATA ANALYSIS95% and 90% Confidence levels for top2(10&9) and top3(10&9&8) ratings
• At 95% Confidence level• Top 2(10&9) Rating: We found there is no significant difference for attributes
(OL, Taste and MouthFeel) across all blends.• Top 3(10&9&8) Rating: We found there is no significant difference for
MouthFeel attribute and Testblend1 is better than Control product for Overall Likeability and Taste.
• At 90% Confidence level• Top 2(10&9) Rating: We found there is no significant difference for MouthFeel
and Taste attributes and Testblend1 is better than Control product for Overall Likeability.
• Top 3(10&9&8) Rating: We found there is significant difference for all attributes. This shows that TestBlend1 is better than control product.

DATA ANALYSIS• We conduct a factor analysis to reduce dimensions and arrive at more
concrete factors.
• Using PCA, we find that the first factor itself explains more than 70% of overall variance
• Taking the first 3 factors we found that the model explains 85.3% of variance
• We recommend not to go for factor analysis as one factor itself explains more than 70% of overall variance.
Component
Initial Eigenvalues
Total% of
VarianceCumulative
%1 6.382 70.906 70.906
2 .947 10.520 81.427
3 .345 3.835 85.261
4 .277 3.077 88.338
5 .269 2.986 91.324
6 .228 2.529 93.853
7 .217 2.409 96.262
8 .178 1.972 98.235
9 .159 1.765 100.000

DATA ANALYSIS
• To predict the purchase intention of vodka blends based on the ratings on different attributes, we did discriminant analysis.
• But we found negative values and very less values for some attributes in standardized co-efficient values and in structure matrix.
• Now, we run the step-wise discriminant analysis to find classify better.
Standardized Canonical Discriminant Function Coefficients
Structure Matrix
Function
Function
1 1Q5A_att2 .337Q5A_att3 .893
Q5A_att3 .373Q5A_att8 .822
Q5A_att4 .139Q5A_att6 .816
Q5A_att5 .057Q5A_att4 .805
Q5A_att6 .212Q5A_att2 .803
Q5A_att7 -.072Q5A_att5 .791
Q5A_att8 .148Q5A_att7 .772
Classification Resultsa,c
Q6_Int_p (Y=1,N=2)
Predicted Group Membership
Total1 2Original Count 1 519 204 723
2 125 1432 1557% 1 71.8 28.2 100.0
2 8.0 92.0 100.0a. 85.6% of original grouped cases correctly
classified.

DATA ANALYSIS
• In step-wise discriminant analysis, flavor and after taste attributes are removed and we got 0.1% increase in predictability.
• If we add the Arom_Neat and Aroma_Mixer, the overall classified levels are getting down(0.2%) and their standardized canonical discriminant function co-efficients are also.
• Hence, we don’t include Aroma_Neat and Aroma_Mixer attributes.
Classification Resultsa,c
Q6_Int_p (Y=1,N=2)
Predicted Group Membership
Total1 2Original Count 1 515 208 723
2 119 1438 1557% 1 71.2 28.8 100.0
2 7.6 92.4 100.0a. 85.7% of original grouped cases correctly
classified.
Structure MatrixStandardized Canonical Discriminant Function
Coefficients
Function
Function
1 1Q5A_att3 .894Q5A_att2 .344
Q5A_att8 .823Q5A_att3 .374
Q5A_att6 .817Q5A_att4 .137
Q5A_att4 .806Q5A_att6 .205
Q5A_att2 .804Q5A_att8 .134
Q5A_att7a.793
Q5A_att5a.773

DATA ANALYSIS
• Additionally, we did cross tabulations and chi-square test of independence between purchase intention and strength attributes(3-Just right).
• We found the following insights,• Despite giving the just right rating on all strength attributes, majority of
respondents chose Not-to-Buy.Purchase Intention
Y=1 N=2
Aroma-Strength 195(25.7%)
182(23.9%)
Taste-Strength 194(25.5%)
190(25%)
Smoothness-Strength
189(24.9%)
169(22.2%)
Flavor-Strength 183(24.1%)
193(25.4%)
AfterTaste-Strength 184(24.2%)
193(25.4%)
Purchase Intention
Y=1 N=2
Aroma-Strength 162(21.3%)
178(23.4%)
Taste-Strength 151(19.9%)
164(21.6%)
Smoothness-Strength
149(19.6%)
180(23.7%)
Flavor-Strength 156(20.5%)
155(20.4%)
AfterTaste-Strength 146(19.2%)
183(24.1%)
Test Blend1 Test Blend2
DATA ANALYSIS
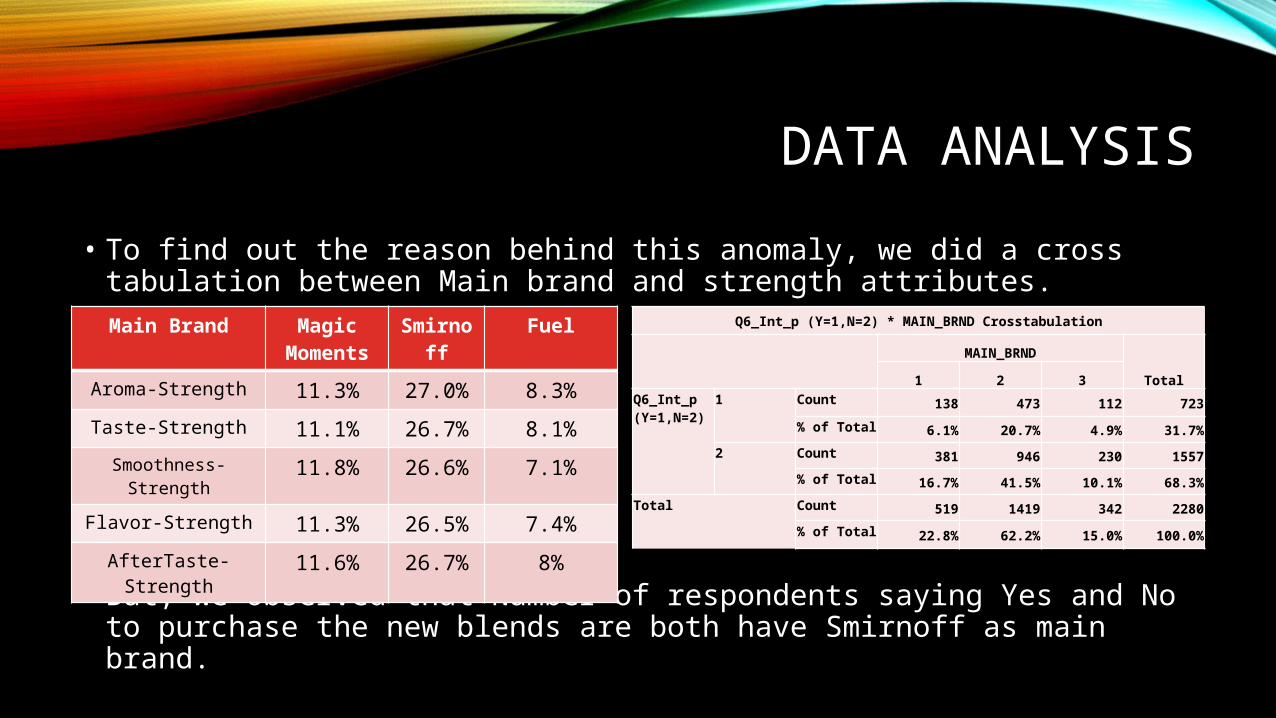
• To find out the reason behind this anomaly, we did a cross tabulation between Main brand and strength attributes.
• But, we observed that Number of respondents saying Yes and No to purchase the new blends are both have Smirnoff as main brand.
Main Brand MagicMoments
Smirnoff
Fuel
Aroma-Strength 11.3% 27.0% 8.3%
Taste-Strength 11.1% 26.7% 8.1%
Smoothness-Strength
11.8% 26.6% 7.1%
Flavor-Strength 11.3% 26.5% 7.4%
AfterTaste-Strength
11.6% 26.7% 8%
Q6_Int_p (Y=1,N=2) * MAIN_BRND Crosstabulation
MAIN_BRND
Total1 2 3Q6_Int_p (Y=1,N=2)
1 Count 138 473 112 723
% of Total 6.1% 20.7% 4.9% 31.7%
2 Count 381 946 230 1557
% of Total 16.7% 41.5% 10.1% 68.3%
Total Count 519 1419 342 2280
% of Total 22.8% 62.2% 15.0% 100.0%

DATA ANALYSIS
• Additionally, we split the whole dataset based on categories such as Centre's, Panel, Ages and main brand.
• If we split dataset based on Centre's, the sample size is getting very low and error levels are getting very high in the model.
• We found the overall likeability is driven by factors as follows.• Across Ages: Taste, Aroma, MouthFeel• Across Main brand:
• Main Brand1 & Main Brand2 – Taste, Aroma, Mouth Feel• Main Brand3 – Taste, ThroatFeel and MouthFeel
• Across Panels:• Panel1 and Panel2 – Taste, Aroma, MouthFeel• Panel 3 – Taste, Smoothness, MouthFeel

DATA ANALYSIS• We have done cross tabulation and chi-square test between Rating of an
attribute(available) to the strength of that attribute and found they are associated.
• We have done cross tab and chi-square for ages and purchase intention, panel and purchase intention, but we didn’t find any association.
• As proportion of Smirnoff drinkers in the population are high, we can normalize and find which factors are driving their likeability.
• We observed that even the total number of respondents are 760, we found that last respondent number in the dataset is 804.(Just an observation )

RECOMMENDATIONS
• The company should go ahead with the replacement of the current blend with the new blend, Test product 1 as it ranks consistently higher in all attributes at 90 % C.I.
• Further thrust areas for product development should be on:
Aroma
Taste
Mouth - feel
As they are the common attributes in overall likeability and purchase intention

ACTION AREAS
• The response anomaly(difference in no of response and respondent number) should be looked into- Could be due to Missing data-points.
• Robustness and validity of scales should be checked- we observed anomalies with respect to Smirnoff users and their purchase intentions.

THANK YOU
Related Documents
![A Large Eddy Simulation model for the study of wind ...for example Blind Test 1 [13] has been simulated in [24, 17], Blind Test 2 [14] in [17], Blind Test 4 [16] in [10]. Regarding](https://static.cupdf.com/doc/110x72/5f72199f56497d1d697bdb49/a-large-eddy-simulation-model-for-the-study-of-wind-for-example-blind-test-1.jpg)