Blends of hydroxypropyl methylcellulose and poly(1-vinylpyrrolidone-co-vinyl acetate): Miscibility and thermal stability Cla´udia M. Zaccaron, Ricardo V.B. Oliveira, Marcela Guiotoku, Alfredo T.N. Pires, Valdir Soldi * Grupo de Estudos em Materiais Polime ´ricos (POLIMAT), Departamento de Quı´mica, Universidade Federal de Santa Catarina, 88040-900 Floriano ´polis, SC, Brazil Received 13 January 2005; received in revised form 3 February 2005; accepted 6 February 2005 Available online 25 March 2005 Abstract The miscibility, kinetic parameters, and mechanism associated with the thermal degradation of hydroxypropyl methylcellulose/ poly(1-vinylpyrrolidone-co-vinyl acetate) (HPMC/P(VP-co-VAc)) blends, were analysed. The presence of only one glass transition temperature (T g ) in the blend, intermediate between those for the pure polymers, the shift of the bands in the region of 3430 cm ÿ1 and the disappearance of the band at 1647 cm ÿ1 from the infrared spectra, suggest miscibility between the components. The thermogravimetric curves associated with the temperature of maximum degradation rate (T max ) indicate a higher thermal stability for the blend with 30% HPMC and for the pure copolymer. This conclusion was supported by the activation energy (E ) values which increased to ca. 190 and 170 kJ mol ÿ1 for the blend with 30% HPMC and the pure copolymer, respectively. The E-values for the studied systems suggested a degradation mechanism associated with a random scission of the chain. The FTIR spectra of the solid residues from the thermal degradation reaction of both systems suggest the formation of alcohol and unsaturated hydrocarbons as reaction products. For the HPMC system, CO 2 , CO, aldehydes, alcohols and ethers were detected as volatile products. Volatile products such as, acetic acid, CO 2 , CO and NH 3 were detected for P(VP-co-VAc). Ó 2005 Elsevier Ltd. All rights reserved. Keywords: Hydroxypropyl methylcellulose; Poly(1-vinylpyrrolidone-co-vinyl acetate); Thermal degradation; Activation energy 1. Introduction Cellulose and their derivatives have been extensively used in recent decades, mainly due to their potential applications in different areas and properties such as biodegradability, solubility in water (derivatives), capa- city to form films, etc. [1e4]. Hydroxypropyl methylcel- lulose (HPMC) is a hydrophilic polymer extensively used as a matrix for drug delivery [5,6], in building materials, for dye and paint removal, in adhesives, cosmetics, coating processes and in the agricultural and textile areas [7]. The thermal stability and degradation kinetics of cellulose derivatives have been described in the literature by various authors [8e10]. Different processes, such as molecular characterization, stability, recovery during recycling, kinetic and chemical processes and macromo- lecular reactions, have been considered in the degrada- tion of polymers, in particular polysaccharides [11]. Zohuriaan and Shokrolahi [9] studied the thermal degradation of various cellulose derivatives observing that the decomposition started between 200 and 280 C. * Corresponding author. Tel.: C55 48 331 9219; fax: C55 48 331 9711. E-mail address: [email protected] (V. Soldi). 0141-3910/$ - see front matter Ó 2005 Elsevier Ltd. All rights reserved. doi:10.1016/j.polymdegradstab.2005.02.010 Polymer Degradation and Stability 90 (2005) 21e27 www.elsevier.com/locate/polydegstab

Welcome message from author
This document is posted to help you gain knowledge. Please leave a comment to let me know what you think about it! Share it to your friends and learn new things together.
Transcript

Polymer Degradation and Stability 90 (2005) 21e27
www.elsevier.com/locate/polydegstab
Blends of hydroxypropyl methylcelluloseand poly(1-vinylpyrrolidone-co-vinyl acetate): Miscibility
and thermal stability
Claudia M. Zaccaron, Ricardo V.B. Oliveira, Marcela Guiotoku,Alfredo T.N. Pires, Valdir Soldi*
Grupo de Estudos em Materiais Polimericos (POLIMAT), Departamento de Quımica, Universidade Federal de Santa Catarina,
88040-900 Florianopolis, SC, Brazil
Received 13 January 2005; received in revised form 3 February 2005; accepted 6 February 2005
Available online 25 March 2005
Abstract
The miscibility, kinetic parameters, and mechanism associated with the thermal degradation of hydroxypropyl methylcellulose/poly(1-vinylpyrrolidone-co-vinyl acetate) (HPMC/P(VP-co-VAc)) blends, were analysed. The presence of only one glass transitiontemperature (Tg) in the blend, intermediate between those for the pure polymers, the shift of the bands in the region of 3430 cm�1
and the disappearance of the band at 1647 cm�1 from the infrared spectra, suggest miscibility between the components. Thethermogravimetric curves associated with the temperature of maximum degradation rate (Tmax) indicate a higher thermal stabilityfor the blend with 30% HPMC and for the pure copolymer. This conclusion was supported by the activation energy (E ) valueswhich increased to ca. 190 and 170 kJ mol�1 for the blend with 30% HPMC and the pure copolymer, respectively. The E-values for
the studied systems suggested a degradation mechanism associated with a random scission of the chain. The FTIR spectra of thesolid residues from the thermal degradation reaction of both systems suggest the formation of alcohol and unsaturatedhydrocarbons as reaction products. For the HPMC system, CO2, CO, aldehydes, alcohols and ethers were detected as volatile
products. Volatile products such as, acetic acid, CO2, CO and NH3 were detected for P(VP-co-VAc).� 2005 Elsevier Ltd. All rights reserved.
Keywords: Hydroxypropyl methylcellulose; Poly(1-vinylpyrrolidone-co-vinyl acetate); Thermal degradation; Activation energy
1. Introduction
Cellulose and their derivatives have been extensivelyused in recent decades, mainly due to their potentialapplications in different areas and properties such asbiodegradability, solubility in water (derivatives), capa-city to form films, etc. [1e4]. Hydroxypropyl methylcel-lulose (HPMC) is a hydrophilic polymer extensively used
* Corresponding author. Tel.: C55 48 331 9219; fax: C55 48 331
9711.
E-mail address: [email protected] (V. Soldi).
0141-3910/$ - see front matter � 2005 Elsevier Ltd. All rights reserved.
doi:10.1016/j.polymdegradstab.2005.02.010
as a matrix for drug delivery [5,6], in building materials,for dyeandpaint removal, in adhesives, cosmetics, coatingprocesses and in the agricultural and textile areas [7].
The thermal stability and degradation kinetics ofcellulose derivatives have been described in the literatureby various authors [8e10]. Different processes, such asmolecular characterization, stability, recovery duringrecycling, kinetic and chemical processes and macromo-lecular reactions, have been considered in the degrada-tion of polymers, in particular polysaccharides [11].Zohuriaan and Shokrolahi [9] studied the thermaldegradation of various cellulose derivatives observingthat the decomposition started between 200 and 280 �C.

22 C.M. Zaccaron et al. / Polymer Degradation and Stability 90 (2005) 21e27
The exception was methylcellulose in which the thermaldegradation started at 325 �C suggesting a significantdependence on the structure and functional groupspresent in the chain. The structural dependence was alsoanalysed by Nada and Hassan [10] observing that thetemperatures of maximum degradation rate for celluloseand grafted cellulose were 315 �C and 260 �C, re-spectively. In general, for polysaccharides, processessuch as dehydration, depolymerisation and pyrolyticdecomposition occur at high temperatures (ca. 350 �C),forming H2O, CO2, CO, CH4 and unsaturated struc-tures as products of degradation [9,12,13].
Blends of poly(1-vinylpyrrolidone-co-vinyl acetate)[P(VP-co-VAc)] with cellulose acetate are used as mem-branes in the pervaporation processes [14]. Kwok et al. [15]evaluated the plasticizer effect of P(VP-co-VAc) onHPMC. Properties such as, water permeation, mechanicalbehaviour and glass transition temperature, were studied.In terms of thermal degradation only the homopolymersPVP and PVAc have been studied. The degradationreaction of PVP occurs via only one main stage of massloss, starting at ca. 400 �C, leading to the formation ofesters as a consequence of the scission of the NeCeObonds at 480 �C, confirmed by the evolved NH3 [16,17].For PVAc, on the other hand, the thermal degradationoccurs via two main stages, one associated with thedeacetylation reaction at ca. 325 �C leading to theformation of polyenes, which at 460 �C (second stage)degrade formingbenzene, toluene andnaphthalene [18,19].
In order to improve the thermal stability of HPMC itwas blended with P(VP-co-VAc), a more thermallystable copolymer. In this study, pure components andblends with 30, 50 and 70% HPMC were analysed andcompared in terms of their thermal stability, kineticparameters and products of degradation under nitrogen.
2. Experimental
2.1. Materials
Hydroxypropyl methylcellulose [HPMC] and poly(1-vinylpyrrolidone-co-vinyl acetate) [P(VP-co-VAc)]were obtained from Sigma-Aldrich (St. Louis, USA).The molecular weight of HPMC, determined in thisstudy by intrinsic viscosity, was 4.0! 106 g mol�1. Thecopolymer P(VP-co-VAc) with a molecular weightw5.0! 104 g mol�1 (determined by size exclusion chro-matography) had an average molar ratio of vinyl-pyrrolidone/vinyl acetate of 1.3/1. Deionised water wasused in all experiments.
2.2. Film preparation
Pure polymers and a mixture of 2% (w/w) HPMCand P(VP-co-VAc) in aqueous solution were stirred
overnight at room temperature. The resulting solutionswere spread over Teflon plates and the solvent (water)was slowly evaporated. After the solvent evaporationthe films were dried under vacuum and stored ina desiccator until analysis. Films were prepared withthe following compositions HPMC/P(VP-co-VAc):100/0, 70/30, 50/50, 30/70 and 0/100.
2.3. Infrared spectroscopy
Infrared spectroscopy (FTIR) was carried out onBomem equipment, model FTLA 2000 (Japan), witha resolution of 4 cm�1, in the range of 4000e400 cm�1.For miscibility studies, the FTIR analysis was per-formed using 0.25% (w/w) films of the polymers andblends at room temperature.
Solid residues and gas products evolved from thermaldegradation reactions were also analysed by FTIR. Forthis analysis, samples of ca. 200 mg were submitted tothermal degradation in a tubular oven (Lindberg/Blue)at the required temperature, under nitrogen atmosphere(50 cm3 min�1) at a heating rate of 10 �Cmin�1. Thesolid residues were cooled to room temperature and theFTIR measurements were carried out in KBr or on SiO2
supports. The spectra of the gas products were obtainedduring degradation at different temperatures in thetubular oven connected to the FTIR equipment.
2.4. Thermal analysis
DSC measurements were performed in a DSC 50(Shimadzu, Japan) under nitrogen (50 cm3 min�1). Thesamples were first heated to 150 �C (heating rate of20 �Cmin�1) to remove adsorbed water. They were thenrapidly cooled to room temperature with liquid nitrogenand a second scanning to 300 �C (heating rate of10 �Cmin�1) was obtained.
Thermogravimetric analysis was carried out on aTGA-50 (Shimadzu, Japan) under nitrogen atmosphere(50 cm3 min�1) using an average sample of 7 mg. Non-isothermal experiments were performed in the tempera-ture range of 25e600 �C at different heating rates (5, 10and 20 �Cmin�1) for each sample. The thermogravimet-ric data were analysed using the Ozawa method [20] andthe parameters determined using the associated TGA-50software. The activation energy was derived from theslope of the dependence of the reaction rate upon thereciprocal absolute temperature, at defined weight loss.
3. Results and discussion
3.1. Miscibility of the blend
In order to investigate the miscibility of the HPMC/copolymer mixtures, FTIR and DSC analyses wereperformed. The FTIR spectra for pure components and
23C.M. Zaccaron et al. / Polymer Degradation and Stability 90 (2005) 21e27
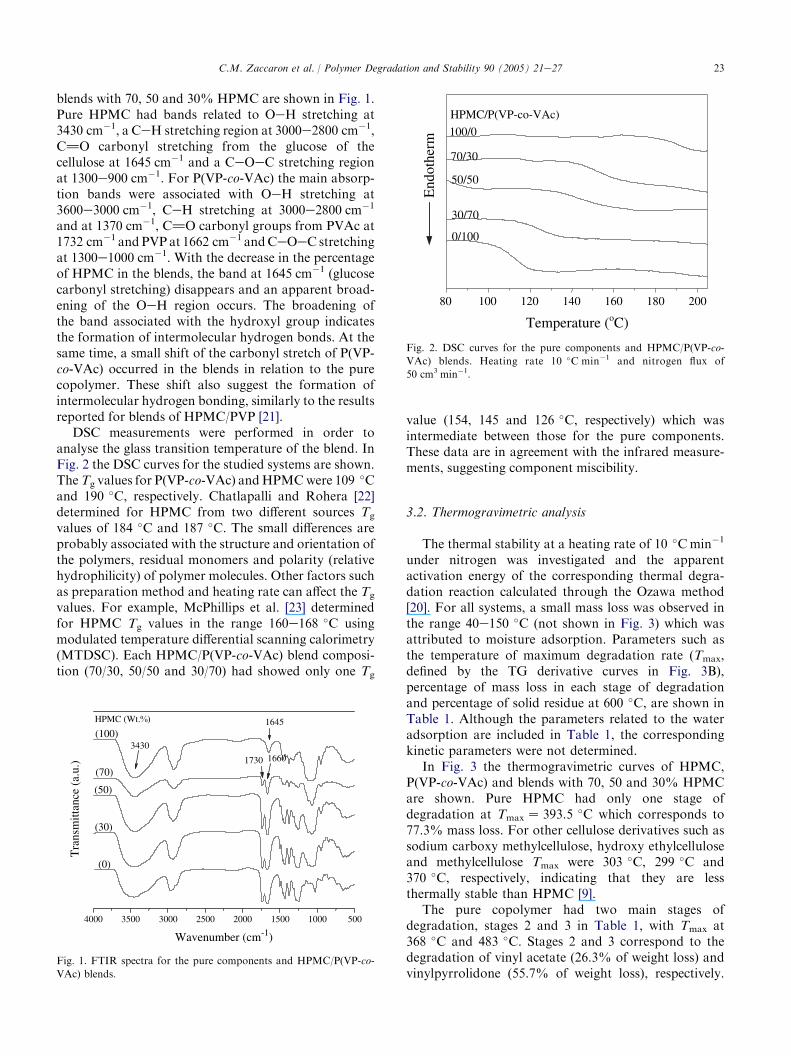
blends with 70, 50 and 30% HPMC are shown in Fig. 1.Pure HPMC had bands related to OeH stretching at3430 cm�1, a CeH stretching region at 3000e2800 cm�1,C]O carbonyl stretching from the glucose of thecellulose at 1645 cm�1 and a CeOeC stretching regionat 1300e900 cm�1. For P(VP-co-VAc) the main absorp-tion bands were associated with OeH stretching at3600e3000 cm�1, CeH stretching at 3000e2800 cm�1
and at 1370 cm�1, C]O carbonyl groups from PVAc at1732 cm�1 and PVPat 1662 cm�1 andCeOeC stretchingat 1300e1000 cm�1. With the decrease in the percentageof HPMC in the blends, the band at 1645 cm�1 (glucosecarbonyl stretching) disappears and an apparent broad-ening of the OeH region occurs. The broadening ofthe band associated with the hydroxyl group indicatesthe formation of intermolecular hydrogen bonds. At thesame time, a small shift of the carbonyl stretch of P(VP-co-VAc) occurred in the blends in relation to the purecopolymer. These shift also suggest the formation ofintermolecular hydrogen bonding, similarly to the resultsreported for blends of HPMC/PVP [21].
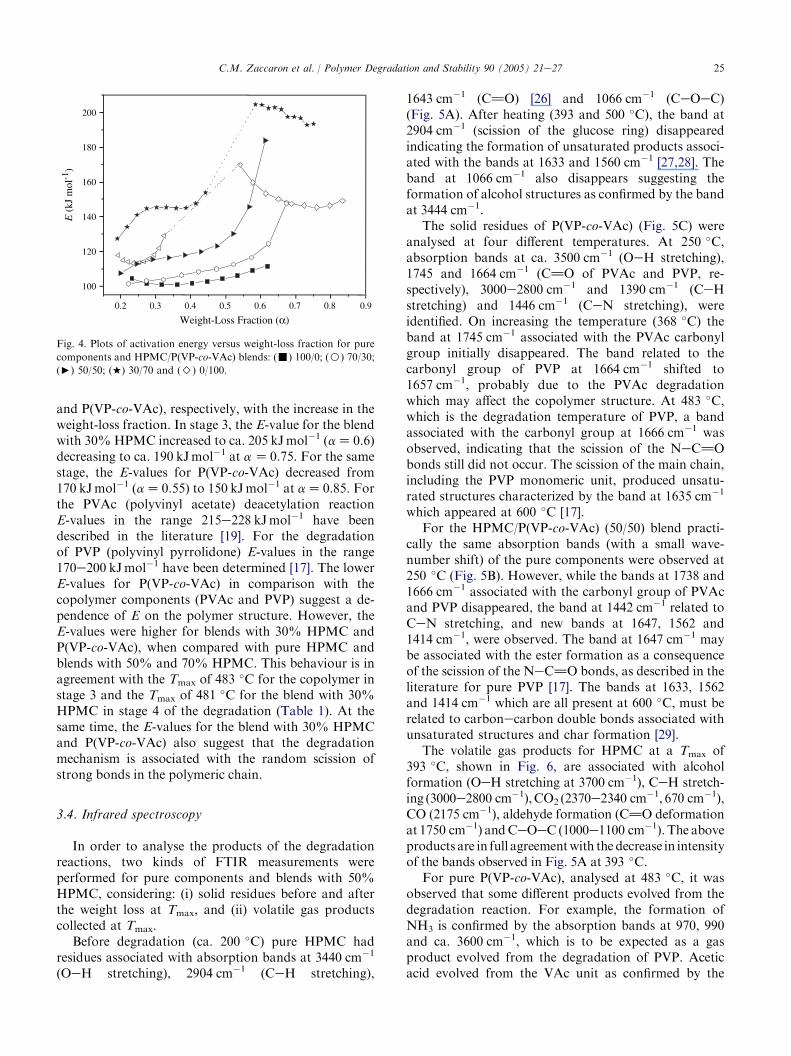
DSC measurements were performed in order toanalyse the glass transition temperature of the blend. InFig. 2 the DSC curves for the studied systems are shown.TheTg values for P(VP-co-VAc) andHPMCwere 109 �Cand 190 �C, respectively. Chatlapalli and Rohera [22]determined for HPMC from two different sources Tg
values of 184 �C and 187 �C. The small differences areprobably associated with the structure and orientation ofthe polymers, residual monomers and polarity (relativehydrophilicity) of polymer molecules. Other factors suchas preparation method and heating rate can affect the Tg
values. For example, McPhillips et al. [23] determinedfor HPMC Tg values in the range 160e168 �C usingmodulated temperature differential scanning calorimetry(MTDSC). Each HPMC/P(VP-co-VAc) blend composi-tion (70/30, 50/50 and 30/70) had showed only one Tg
4000 3500 3000 2500 2000 1500 1000 500
1730 1660
Tra
nsm
ittan
ce (
a.u.
)
HPMC (Wt. )
(100)
(70)
3430
(50)
(30)
(0)
1645
Wavenumber (cm-1)
Fig. 1. FTIR spectra for the pure components and HPMC/P(VP-co-
VAc) blends.
value (154, 145 and 126 �C, respectively) which wasintermediate between those for the pure components.These data are in agreement with the infrared measure-ments, suggesting component miscibility.
3.2. Thermogravimetric analysis
The thermal stability at a heating rate of 10 �Cmin�1
under nitrogen was investigated and the apparentactivation energy of the corresponding thermal degra-dation reaction calculated through the Ozawa method[20]. For all systems, a small mass loss was observed inthe range 40e150 �C (not shown in Fig. 3) which wasattributed to moisture adsorption. Parameters such asthe temperature of maximum degradation rate (Tmax,defined by the TG derivative curves in Fig. 3B),percentage of mass loss in each stage of degradationand percentage of solid residue at 600 �C, are shown inTable 1. Although the parameters related to the wateradsorption are included in Table 1, the correspondingkinetic parameters were not determined.
In Fig. 3 the thermogravimetric curves of HPMC,P(VP-co-VAc) and blends with 70, 50 and 30% HPMCare shown. Pure HPMC had only one stage ofdegradation at TmaxZ 393.5 �C which corresponds to77.3% mass loss. For other cellulose derivatives such assodium carboxy methylcellulose, hydroxy ethylcelluloseand methylcellulose Tmax were 303 �C, 299 �C and370 �C, respectively, indicating that they are lessthermally stable than HPMC [9].
The pure copolymer had two main stages ofdegradation, stages 2 and 3 in Table 1, with Tmax at368 �C and 483 �C. Stages 2 and 3 correspond to thedegradation of vinyl acetate (26.3% of weight loss) andvinylpyrrolidone (55.7% of weight loss), respectively.
80 100 120 140 160 180 200
0/100
End
othe
rm
50/50
30/70
HPMC/P(VP-co-VAc)
100/0
70/30
Temperature (oC)
Fig. 2. DSC curves for the pure components and HPMC/P(VP-co-
VAc) blends. Heating rate 10 �C min�1 and nitrogen flux of
50 cm3 min�1.

24 C.M. Zaccaron et al. / Polymer Degradation and Stability 90 (2005) 21e27
These results agree with the literature which describesthat PVAc suffers deacetylation in the temperaturerange 160e400 �C [24] and that degradation of PVPoccurs in the temperature range 400e530 �C [17].
For the blends with 70% and 50% of HPMC, thedegradation is higher in stage 2, with 71.1% and 61.6%of weight loss, respectively. However, blends with 30%HPMC showed four stages of degradation with the most
0
20
40
60
80
100
A
B
TG
(
)D
TG
(a.
u.)
200 250 300 350 400 450 500 550 600
Temperature (οC)
200 250 300 350 400 450 500 550 600
Temperature (οC)
P(VP-co-VAc)/HPMC
100/0 70/30 50/50 30/70 0/100
P(VP-co-VAc)/HPMC
100/0 70/30 50/50 30/70 0/100
Fig. 3. Thermogravimetric (A) and derivatives (B) curves for the
systems HPMC/P(VP-co-VAc) at a heating rate of 10 �C min�1.
significant weight loss (24.9%) being observed in stage 3,although 17% weight loss was observed in stage 4(Table 1).
Considering the second stage of degradation, thethermogravimetric analysis suggests that the blend with70% HPMC is more thermally stable than the purecomponents and the blends with 50% and 30% HPMC.This is confirmed by the Tmax of 407 �C. On the otherhand, the analysis of stages 3 (for P(VP-co-VAc)) and 4(for the blend with 30% HPMC), suggests a higherstability for these systems in comparison with the pureHPMC and other blends.
3.3. Kinetic parameters
The apparent activation energies of the pure compo-nents and the blends versus the weight-loss fractions(a) are shown in Fig. 4. In general, high E-values(O100 kJ mol�1) suggest a degradation mechanism asso-ciated with the random scission of strong bonds in thepolymeric chain, reflecting the existence of multiplecompeting steps in the degradation process [17,25]. Thisbehaviour was clearly observed for pure P(VP-co-VAc)andblendswith 30, 50 and 70%HPMC.However, in pureHPMC, E remains practically constant (z104 kJ mol�1)suggesting that the degradation occurred by scission ofweak bonds of the chain. The E-value of pure HPMC isin agreement with the value (112 kJ mol�1) determined byLi et al. [8] using the Friedmanmethod. It is interesting toobserve that the E-value for HPMC (which is a cellulosederivative) is considerably lower than the E-values 182,230 and 232 kJ mol�1 reported in the literature forcellulose, carboxy methylcellulose and methylcellulose,respectively [9,10]. This behaviour suggests a dependenceof Ewith the structure of the polymer. For the blend with70% HPMC, E increased from 100 to 150 kJ mol�1 withthe variation ofa from 0.22 to 0.65. In the blendwith 50%HPMC, E was practically constant (117 kJ mol�1) up toaZ 0.5, increasing to ca. 185 kJ mol�1 at aZ 0.6.
In blends with 30%HPMC and pure P(VP-co-VAc) Ewas determined considering stages 2 and 3 (Table 1). Instage 2, the E-values increased from 125 to 155 kJ mol�1
and 115 to 130 kJ mol�1 for the blend with 30% HPMC
Table 1
Thermogravimetric parameters for the HPMC/P(VP-co-VAc) system
HPMC/P(VP-co-VAc) (% wt) Stage 2 Stage 3 Stage 4 Residual weightc (%)
T2a M2
b T3a M3
b T4a M4
b
100/0 393 77.3 e e e e 11.3
70/30 408 71.1 475 6.0 e e 16.5
50/50 405 61.6 468 12.4 e e 17.5
30/70 365 19.8 411 24.9 481 17.0 14.3
0/100 367 26.3 483 55.7 e e 5.5
a Temperatures of maximum degradation rate ( �C).b Percentage weight loss in each stage of degradation.c Residual weight at 600 �C.
25C.M. Zaccaron et al. / Polymer Degradation and Stability 90 (2005) 21e27
and P(VP-co-VAc), respectively, with the increase in theweight-loss fraction. In stage 3, the E-value for the blendwith 30%HPMC increased to ca. 205 kJmol�1 (aZ 0.6)decreasing to ca. 190 kJmol�1 at a Z 0.75. For the samestage, the E-values for P(VP-co-VAc) decreased from170 kJmol�1 (aZ 0.55) to 150 kJmol�1 at aZ 0.85. Forthe PVAc (polyvinyl acetate) deacetylation reactionE-values in the range 215e228 kJmol�1 have beendescribed in the literature [19]. For the degradationof PVP (polyvinyl pyrrolidone) E-values in the range170e200 kJmol�1 have been determined [17]. The lowerE-values for P(VP-co-VAc) in comparison with thecopolymer components (PVAc and PVP) suggest a de-pendence of E on the polymer structure. However, theE-values were higher for blends with 30% HPMC andP(VP-co-VAc), when compared with pure HPMC andblends with 50% and 70% HPMC. This behaviour is inagreement with the Tmax of 483
�C for the copolymer instage 3 and the Tmax of 481
�C for the blend with 30%HPMC in stage 4 of the degradation (Table 1). At thesame time, the E-values for the blend with 30% HPMCand P(VP-co-VAc) also suggest that the degradationmechanism is associated with the random scission ofstrong bonds in the polymeric chain.
3.4. Infrared spectroscopy
In order to analyse the products of the degradationreactions, two kinds of FTIR measurements wereperformed for pure components and blends with 50%HPMC, considering: (i) solid residues before and afterthe weight loss at Tmax, and (ii) volatile gas productscollected at Tmax.
Before degradation (ca. 200 �C) pure HPMC hadresidues associated with absorption bands at 3440 cm�1
(OeH stretching), 2904 cm�1 (CeH stretching),
0.2 0.3 0.4 0.5 0.6 0.7 0.8 0.9
100
120
140
160
180
200
E (
kJ m
ol-1
)
Weight-Loss Fraction (α)
Fig. 4. Plots of activation energy versus weight-loss fraction for pure
components and HPMC/P(VP-co-VAc) blends: (-) 100/0; (B) 70/30;
(<) 50/50; (+) 30/70 and (>) 0/100.
1643 cm�1 (C]O) [26] and 1066 cm�1 (CeOeC)(Fig. 5A). After heating (393 and 500 �C), the band at2904 cm�1 (scission of the glucose ring) disappearedindicating the formation of unsaturated products associ-ated with the bands at 1633 and 1560 cm�1 [27,28]. Theband at 1066 cm�1 also disappears suggesting theformation of alcohol structures as confirmed by the bandat 3444 cm�1.
The solid residues of P(VP-co-VAc) (Fig. 5C) wereanalysed at four different temperatures. At 250 �C,absorption bands at ca. 3500 cm�1 (OeH stretching),1745 and 1664 cm�1 (C]O of PVAc and PVP, re-spectively), 3000e2800 cm�1 and 1390 cm�1 (CeHstretching) and 1446 cm�1 (CeN stretching), wereidentified. On increasing the temperature (368 �C) theband at 1745 cm�1 associated with the PVAc carbonylgroup initially disappeared. The band related to thecarbonyl group of PVP at 1664 cm�1 shifted to1657 cm�1, probably due to the PVAc degradationwhich may affect the copolymer structure. At 483 �C,which is the degradation temperature of PVP, a bandassociated with the carbonyl group at 1666 cm�1 wasobserved, indicating that the scission of the NeC]Obonds still did not occur. The scission of the main chain,including the PVP monomeric unit, produced unsatu-rated structures characterized by the band at 1635 cm�1
which appeared at 600 �C [17].For the HPMC/P(VP-co-VAc) (50/50) blend practi-
cally the same absorption bands (with a small wave-number shift) of the pure components were observed at250 �C (Fig. 5B). However, while the bands at 1738 and1666 cm�1 associated with the carbonyl group of PVAcand PVP disappeared, the band at 1442 cm�1 related toCeN stretching, and new bands at 1647, 1562 and1414 cm�1, were observed. The band at 1647 cm�1 maybe associated with the ester formation as a consequenceof the scission of the NeC]O bonds, as described in theliterature for pure PVP [17]. The bands at 1633, 1562and 1414 cm�1 which are all present at 600 �C, must berelated to carbonecarbon double bonds associated withunsaturated structures and char formation [29].
The volatile gas products for HPMC at a Tmax of393 �C, shown in Fig. 6, are associated with alcoholformation (OeH stretching at 3700 cm�1), CeH stretch-ing (3000e2800 cm�1),CO2 (2370e2340 cm
�1, 670 cm�1),CO (2175 cm�1), aldehyde formation (C]O deformationat 1750 cm�1) andCeOeC (1000e1100 cm�1). The aboveproducts are in full agreementwith the decrease in intensityof the bands observed in Fig. 5A at 393 �C.
For pure P(VP-co-VAc), analysed at 483 �C, it wasobserved that some different products evolved from thedegradation reaction. For example, the formation ofNH3 is confirmed by the absorption bands at 970, 990and ca. 3600 cm�1, which is to be expected as a gasproduct evolved from the degradation of PVP. Aceticacid evolved from the VAc unit as confirmed by the

26 C.M. Zaccaron et al. / Polymer Degradation and Stability 90 (2005) 21e27
characteristic band at ca. 3000 cm�1 and C]O de-formation at 1745 cm�1. The low intensity of the bandassociated with CO2 suggests that the gas evolution maybe suppressed in this system, in agreement with othersystems described in the literature [30]. Finally, evolved
4000 3500 3000 2500 2000 1500 1000 500
34401066
A
4000 3500 3000 2500 2000 1500 1000
Tra
nsm
ittan
ce (
a.u.
)
1745
1635C
4000 3500 3000 2500 2000 1500 1000
1562
1562
1415
B
Tra
nsm
ittan
ce (
a.u)
Tra
nsm
ittan
ce (
a.u.
.)
Wavenumber (cm-1)
Wavenumber (cm-1)
Wavenumber (cm-1)
200oC
393oC
500oC
250oC
250oC
368oC
483oC
600oC
405oC
468oC
600oC
3419
3444
2904
1643
1616
15601633
2929 17381666 1442
1647
16331414
1633 1414
500
2961
1664
1446
1657
1666
500
Fig. 5. FTIR spectra for the residues during thermal degradation at
different temperatures: (A) HPMC, (B) HPMC/P(VP-co-VAc) (50/50)
and (C) P(VP-co-VAc).
products related to amides is confirmed by the C]Odeformation at 1760 cm�1.
The HPMC/P(VP-co-VAc) (50/50) blend, analysed at405 �C, shows the same evolved products present in thedegradation of the pure components, similarly to thebehaviour observed above for the solid residues.
4. Conclusions
The HPMC and P(VP-co-VAc) miscibility was con-firmed by thermal analysis and infrared spectroscopy.The behaviour concerning the absorption bands in theFTIR spectra and the variation of Tg suggests inter-actions via hydrogen bonding between the components.
The profile of the thermogravimetric curves andnumber of degradation stages were dependent on thepercentage of copolymer present in the blend. Accordingto the Tmax, the blend with 30% HPMC and pure P(VP-co-VAc) was the most thermally stable systems. For thesame systems the activation energy values (E ) increasedto ca. 190 and 170 kJ mol�1, respectively, confirmingthe higher thermal stability. Considering the activationenergy values of the pure components and blends,a degradation mechanism associated with a randomscission of the chain occurred.
The FTIR spectra of the solid residues from thermaldegradation of HPMC indicated the formation ofalcohol structures and unsaturated hydrocarbons asreaction products. For the same system CO2, CO,aldehydes, alcohols and ethers were detected as volatileproducts. Unsaturated structures were also observed assolid products associated with the degradation reactionof P(VP-co-VAc). For this system volatile products suchas, acetic acid, CO2, CO and NH3 were detected. For the
4000 30003500 2500 2000 1500 1000 500
1750
1125
3000
Tra
nsm
ittan
ce (
a.u.
)
393oC
405oC
483oC
3700
2175
2370
1760
17451427
Wavenumber (cm-1)
Fig. 6. FTIR spectra for the volatile products evolved during thermal
degradation at Tmax of: (A) HPMC at 393 �C, (B) 50% HPMC at
405 �C and (C) P(VP-co-VAc) at 483 �C.

27C.M. Zaccaron et al. / Polymer Degradation and Stability 90 (2005) 21e27
blend HPMC/P(VP-co-VAC) (50/50) the formation ofthe same solid and volatile products detected for thepure components, was observed.
Acknowledgements
This research was supported by Conselho Nacionalde Desenvolvimento Cientıfico e Tecnologico (CNPq),Coordenacao de Aperfeicoamento de Pessoal de NıvelSuperior (CAPES) and Federal University of SantaCatarina (Universidade Federal de Santa Catarina eUFSC), Brazil.
References
[1] Qiu Z, Komura M, Ikehara T, Nishi T. Miscibility and
crystallization of biodegradable blends of two aliphatic polyesters.
Poly(3-hydroxybutyrate-co-hydroxyvalerate) and poly(butylenes
succinate) blends. Polymer 2003;44:8111e7.
[2] Van de Velde K, Kiekens P. Biopolymers: overview of several
properties and consequences on their applications. Polym Test
2002;21:433e42.[3] Sakellariou P, Hassan A, Rowe RC. Plasticization of aqueous
poly(vinyl alcohol) and hydroxypropyl methylcellulose with
polyethylene glycols and glycerol. Eur Polym J 1993;29:937e43.
[4] Coma V, Sebti I, Pardon P, Pichavant FH, Deschamps A. Film
properties from crosslinking of cellulosic derivatives with a poly-
functional carboxylic acid. Carbohydr Polym 2003;51:265e71.
[5] Fuller CS, MacRae RJ, Walther M, Cameron RE. Interactions in
poly(ethylene oxide)ehydroxypropyl methylcellulose blends.
Polymer 2001;42:9583e92.
[6] Ford JL. Thermal analysis of hydroxypropylmethylcellulose and
methylcellulose: powders, gels and matrix tablets. Int J Pharm
1999;179:209e28.
[7] Pekel N, Yoshii F, Kume T, Guven O. Radiation crosslinking of
biodegradable hydroxypropylmethylcellulose. Carbohydr Polym
2004;55:139e47.[8] Li X, Huang M, Bai H. Thermal decomposition of cellulose
ethers. J Appl Polym Sci 1999;73:2927e36.
[9] Zohuriaan MJ, Shokrolahi F. Thermal studies on natural and
modified gums. Polym Test 2004;23(5):575e9.[10] Nada AMA, Hassan ML. Thermal behavior of cellulose and
some cellulose derivatives. Polym Degrad Stab 2000;67:111e5.
[11] Sivalingam G, Madras G. Oxidative degradation of poly(vinyl
acetate) and poly(epsilon-caprolactone) and their mixtures in
solution. Chem Eng Sci 2004;59:1577e87.
[12] Villetti MA, Crespo JS, Soldi MS, Pires ATN, Borsali R, Soldi V.
Thermal degradation of natural polymers. J Therm Anal
2002;67:295e303.
[13] Soldi V. Stability and degradation of polysaccharides. In:
Dumitriu S, editor. Polysaccharides: structural diversity and
functional versatility. 2nd ed. p. 395e409.[14] Nguyen Q, Clement R, Noezar I, Lochon P. Performances of
poly(vinylpyrrolidone-co-vinyl acetate)-cellulose acetate blend
membranes in the pervaporation of ethanol-ethyl tert-butyl ether
mixtures. Simplified model for flux prediction. Sep Purif Technol
1998;13:237e45.
[15] Kwok TSH, Sunderland BV, Heng PWS. An investigation on the
influence of a vinyl pyrrolidone/vinyl acetate copolymer on the
moisture permeation, mechanical and adhesive properties of
aqueous-based hydroxypropyl methylcellulose film coatings.
Chem Pharm Bull 2004;52:790e6.[16] Rosiak J, Olejniczak J, Pekala W. Fast reaction of irradiated
polymers. 1. Cross-linking and degradation of polyvinylpyrroli-
done. Radiat Phys Chem 1990;36(6):747e55.
[17] Bianco G, Soldi MS, Pinheiro EA, Pires ATN, Gehlen MH,
Soldi V. Thermal stability of poly(N-vinyl-2-pyrrolidone-co-
methacrylic acid) copolymers in inert atmosphere. Polym Degrad
Stab 2003;80:567e74.
[18] Zulfiqar S, Ahmad S. Thermal degradation of blends of PVAC
with polysiloxane-II. Polym Degrad Stab 2001;71:299e304.
[19] Sivalingam G, Karthik R, Madras G. Blends of poly(epsilon-
caprolactone) and poly(vinyl acetate): mechanical properties and
thermal degradation. Polym Degrad Stab 2004;84:345e51.
[20] Ozawa T. A new method of analyzing thermogravimetric data.
Bull Chem Soc Jpn 1965;38:1881e6.
[21] Hiremath AC, Sherigara BS, Prashantha K, Rai KS, Kumar SP.
Studies on the miscibility of hydroxypropyl methylcellulose and
polyvinylpyrrolidone blends. Indian J Chem Technol 2002;9:
312e5.
[22] Chatlapalli R, Rohera BD. Study of effect of excipient source
variation on rheological behaviour of diltiazem HCl-HPMC wet
masses using a mixer torque rheometer. Int J Pharm
2002;238139e51.[23] McPhillips H, Craig DQM, Royall PG, Hill VL. Characteriza-
tion of the glass transition of HPMC using modulated
temperature differential scanning calorimetry. Int J Pharm 1999;
180:83e90.[24] McNeill IC, Ahmed S, Memetea L. Thermal-degradation of vinyl
acetate-methacrylic acid copolymer and the homopolymers. 2.
Thermal-analysis studies. Polym Degrad Stab 1995;48:89e97.
[25] Barreto PLM, Pires ATN, Soldi V. Thermal degradation of edible
films based on milk proteins and gelatin in inert atmosphere.
Polym Degrad Stab 2003;79:147e52.
[26] Yang G, Zhang L, Peng T, Zhong W. Effects of Ca2C bridge
cross-linking on structure and pervaporation of cellulose/alginate
blend membranes. J Membr Sci 2000;175:53e60.
[27] Boon JP, Pastorova I, Botto RE, Arisz PW. Structural studies on
cellulose pyrolysis and cellulose chars by PYMS, PYGCMS,
FTIR, NMR and by wet chemical techniques. Biomass Bioenergy
1994;7:25e32.
[28] Souza AC, Pires ATN, Soldi V. Thermal stability of ferrocene
derivatives and ferrocene-containing polyamides. J Therm Anal
2002;70:405e14.
[29] Soares S, Camino G, Levchik S. Effect of metal carboxylates on
the thermal decomposition of cellulose. Polym Degrad Stab
1998;62:25e31.[30] Vieira I, Severgnini VLS, Mazera DJ, Soldi MS, Pinheiro EA,
Pires ATN, et al. Effect of maleated propylene diene rubber
(EPDM) on the thermal stability of pure polyamides and
polyamide/EPDM and polyamide/poly(ethylene terephthalate)
blends: kinetic parameters and reaction mechanism. Polym
Degrad Stab 2001;74:151e7.
Related Documents