Evaluating Properties of Blended Cements for Concrete Pavements Sponsored by The Center for Portland Cement Concrete Pavement Technology Iowa State University Final Report December 2003 Department of Civil, Construction and Environmental Engineering

Blended Cements
Dec 27, 2015
Cements blended
Welcome message from author
This document is posted to help you gain knowledge. Please leave a comment to let me know what you think about it! Share it to your friends and learn new things together.
Transcript
Evaluating Properties of Blended Cementsfor Concrete Pavements
Sponsored byThe Center for Portland Cement Concrete Pavement Technology
Iowa State University
Final ReportDecember 2003
Department of Civil, Construction and Environmental Engineering
The opinions, findings, and conclusions expressed in this publication are those of the authors andnot necessarily those of the sponsor(s).
The Center for Portland Cement Concrete Pavement Technology (PCC Center) is housed and adminis-tered at the Center for Transportation Research and Education (CTRE), Iowa State University.
The mission of the PCC Center is to advance the state of the art of portland cement concrete pavementtechnology. The center focuses on improving design, materials science, construction, and maintenance inorder to produce a durable, cost-effective, sustainable pavement.

Technical Report Documentation Page
1. Report No. 2. Government Accession No. 3. Recipient’s Catalog No.
4. Title and Subtitle 5. Report Date December 2003 6. Performing Organization Code
Evaluating Properties of Blended Cements for Concrete Pavements
7. Author(s) 8. Performing Organization Report No. Kejin Wang and Zhi Ge 9. Performing Organization Name and Address 10. Work Unit No. (TRAIS)
11. Contract or Grant No.
Department of Civil, Construction and Environmental Engineering Iowa State University 394 Town Engineering Building Ames, IA 50011
12. Sponsoring Organization Name and Address 13. Type of Report and Period Covered Final Report 14. Sponsoring Agency Code
Center for Portland Cement Concrete Pavement Technology Iowa State University 2901 South Loop Drive, Suite 3100 Ames, IA 50010-8634
15. Supplementary Notes 16. Abstract The addition of supplementary cementitious materials (SCMs), such as fly ash (FA) and slag, generally improves concrete workability, durability, and long-term strength. New trends in sustainable development of concrete infrastructure and in environmental regulations on waste disposal are spurring use of SCMs in concrete. However, use of SCM concrete is sometimes limited due to a lack of understanding about material behaviors and lack of proper specifications for its construction practice. It is believed that SCM concrete performance varies significantly with the source and proportion of the cementitious materials. SCM concrete often displays slower hydration, accompanied by slower setting and lower early-age strength, especially under cold weather conditions. The present research was conducted to have a better understanding of SCM concrete behaviors under different weather conditions.
In addition to the study of the effect of SCM content on concrete set time using cementitious materials from different sources/manufacturers, further research may be needed to investigate the effects of SCM combinations on concrete flowability, air stability, cracking resistance, and durability.
17. Key Words 18. Distribution Statement blended cement—fly ash—portland cement concrete—slag—supplementary cementitious materials
No restrictions.
19. Security Classification (of this report)
20. Security Classification (of this page)
21. No. of Pages 22. Price
Unclassified. Unclassified. 47 plus appendices NA

EVALUATING PROPERTIES OF BLENDED CEMENTS FOR CONCRETE PAVEMENTS
Principal Investigator Kejin Wang
Assistant Professor Department of Civil, Construction and Environmental Engineering
Iowa State University
Research Assistant Zhi Ge
Center for Portland Cement Concrete Pavement Technology Iowa State University
2901 South Loop Drive, Suite 3100 Ames, IA 50010-8634 Phone: 515-294-8103 Fax: 515-294-0467
www.ctre.iastate.edu/pcc/
Final Report • December 2003


iii
TABLE OF CONTENTS
ACKNOWLEDGMENTS ................................................................................................ IX
EXECUTIVE SUMMARY .............................................................................................. XI
1. INTRODUCTION ...........................................................................................................1
1.1. Background............................................................................................................1 1.2. Objective and Approach ........................................................................................2
2. EXPERIMENTAL WORK............................................................................................3
2.1. Concrete Materials.................................................................................................3 2.2. Experimental Methods...........................................................................................3 2.3. Specimen Preparations ..........................................................................................5
3. RESULTS ......................................................................................................................6
3.1. Properties of the Raw Materials ............................................................................6 3.2. Set Time...............................................................................................................12 3.2.1. Set Time of Paste....................................................................................... 12
3.2.2. Set Time of Concrete ................................................................................. 14
3.3. Strength Development .........................................................................................19 3.4. Heat of Hydration ................................................................................................29 3.5. Datum Temperature and Activation Energy........................................................33 3.6. Concrete Maturity and Strength-Maturity Correlations ......................................36 3.7. HIPERPAVE Analysis ........................................................................................39
4. CONCLUSIONS AND RECOMMENDATIONS ......................................................43
4.1. Conclusions .........................................................................................................43 4.2. Recommendations ...............................................................................................44
REFERENCES ..................................................................................................................46
APPENDICES ………………..………………………………………………………….48

iv
v
LIST OF FIGURES
Figure 3.1. SEM image of fly ash ........................................................................................6 Figure 3.2. SEM image of Holcim slag ...............................................................................7 Figure 3.3. SEM of Lafarge slag..........................................................................................7 Figure 3.4. Size distributions of cementitious materials......................................................8 Figure 3.5. XRD pattern of fly ash used ..............................................................................9 Figure 3.6. XRD pattern of slags .......................................................................................10 Figure 3.7. XRD pattern of OPCs......................................................................................10 Figure 3.8. Sulfate compounds in Lafarge and Holcim cements.......................................12 Figure 3.9. Set time for Holcim cement.............................................................................13 Figure 3.10. Set time for Lafarge cement ..........................................................................14 Figure 3.11. Initial set time of Holcim concrete ................................................................15 Figure 3.12. Final set time of Holcim concrete .................................................................16 Figure 3.13. Initial set time of Lafarge concrete................................................................16 Figure 3.14. Final set time of Lafarge concrete .................................................................17 Figure 3.15. Effects of curing temperature on initial set time of concrete ........................19 Figure 3.16. Relationship between mortar and concrete strength (cured at 10°C)............20 Figure 3.17. Effect of SCMs on mortar strength (Holcim cements)..................................21 Figure 3.18. Effect of SCMs on mortar strength (Lafarge cements) .................................22 Figure 3.19. Effect of curing temperature on mortar strength ...........................................25 Figure 3.20. Effect of curing temperature on mortar strength at given ages .....................26 Figure 3.21. Concrete strength (Holcim cements at 50°F) ................................................28 Figure 3.22. Concrete strength (Lafarge cements at 50°F)................................................28 Figure 3.23. Effect of fly ash on binary cement concrete heat signature...........................30 Figure 3.24. Effect of slag on ternary cement concrete heat signature..............................32 Figure 3.25. Effect of slag replacements on datum temperature and activation energy...35 Figure 3.26. Effect of datum temperature on the strength-TTF-time correlation..............37 Figure 3.27. Effect of curing temperature on the strength-TTF-time correlation..............38 Figure 3.28. Typical air temperatures in the Des Moines, Iowa, area ...............................40 Figure 3.29. Concrete strength vs. critical stress for summer conditions ..........................41 Figure 3.30. Concrete strength vs. critical stress for spring conditions.............................42 Figure 3.31. Concrete strength vs. critical stress for fall conditions..................................42

vi
vii
LIST OF TABLES
Table 2.1. Concrete mix proportion.....................................................................................5 Table 3.1. Chemical composition and physical properties of the raw materials ...............11 Table 3.2. Datum temperature and activation energy of concrete .....................................34 Table 3.3. Cracking potential of concrete made with binary/ternary cements ..................40


ix
ACKNOWLEDGMENTS
This project was sponsored by the Center for Portland Cement Concrete Pavement Technology (PCC Center) and the Iowa cement and concrete industry, which was led in this project by the Iowa Concrete Pavement Association (ICPA). The investigators would like to express their gratitude to the PCC Center and ICPA for not only their financial support but also their technical inputs on the proposal, tests, and final report. Valuable comments on the final project report from Jim Grove and Dale Harrington, both of the PCC Center, are especially acknowledged.
Special thanks are extended to the Iowa Department of Transportation (Iowa DOT) Office of Materials, particularly to Todd Hanson, Kevin Jones, and Chengsheng Ouyang. The Iowa DOT provided most concrete materials and some test equipment for the project. Some concrete setting and strength tests at 50°F were also performed at the Iowa DOT.
All cement chemistry and microscopic studies were performed at the Materials Analysis and Research Laboratory (MARL) at Iowa State University. The authors would like to acknowledge Jerry Amenson and Scott Schlorholtz for their assistances at MARL. The support of cementitious materials from Holcim and Lafarge Cement Group in Iowa is also appreciated.
Finally, the authors would like to thank several students at Iowa State University who helped in this project. Mike Anthony helped in datum temperature tests at the critical time when the research assistant for this project was unable to work. Shihai Zhang and Jiong Hu helped the entire project in many different ways. The project might not have been completed on schedule without the support from all the above.

xi
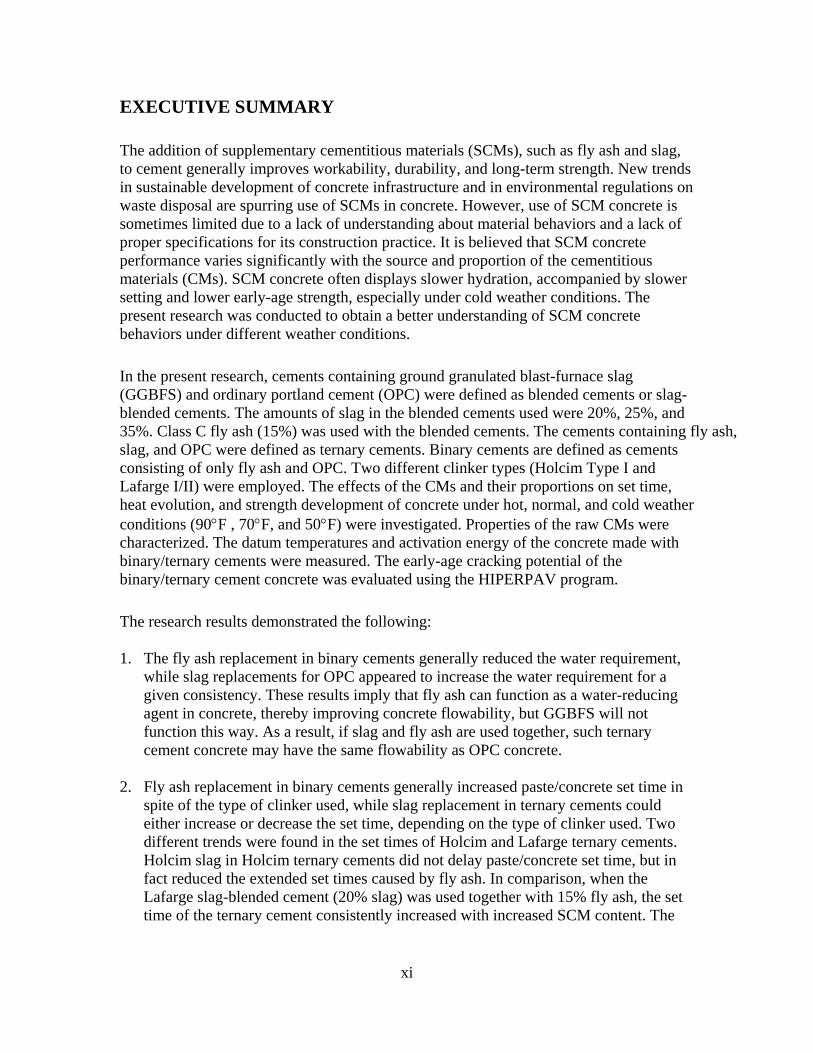
EXECUTIVE SUMMARY
The addition of supplementary cementitious materials (SCMs), such as fly ash and slag, to cement generally improves workability, durability, and long-term strength. New trends in sustainable development of concrete infrastructure and in environmental regulations on waste disposal are spurring use of SCMs in concrete. However, use of SCM concrete is sometimes limited due to a lack of understanding about material behaviors and a lack of proper specifications for its construction practice. It is believed that SCM concrete performance varies significantly with the source and proportion of the cementitious materials (CMs). SCM concrete often displays slower hydration, accompanied by slower setting and lower early-age strength, especially under cold weather conditions. The present research was conducted to obtain a better understanding of SCM concrete behaviors under different weather conditions.
In the present research, cements containing ground granulated blast-furnace slag (GGBFS) and ordinary portland cement (OPC) were defined as blended cements or slag-blended cements. The amounts of slag in the blended cements used were 20%, 25%, and 35%. Class C fly ash (15%) was used with the blended cements. The cements containing fly ash,slag, and OPC were defined as ternary cements. Binary cements are defined as cementsconsisting of only fly ash and OPC. Two different clinker types (Holcim Type I and Lafarge I/II) were employed. The effects of the CMs and their proportions on set time, heat evolution, and strength development of concrete under hot, normal, and cold weather conditions (90°F , 70°F, and 50°F) were investigated. Properties of the raw CMs were characterized. The datum temperatures and activation energy of the concrete made with binary/ternary cements were measured. The early-age cracking potential of the binary/ternary cement concrete was evaluated using the HIPERPAV program.
The research results demonstrated the following: 1. The fly ash replacement in binary cements generally reduced the water requirement,
while slag replacements for OPC appeared to increase the water requirement for a given consistency. These results imply that fly ash can function as a water-reducing agent in concrete, thereby improving concrete flowability, but GGBFS will not function this way. As a result, if slag and fly ash are used together, such ternary cement concrete may have the same flowability as OPC concrete.
2. Fly ash replacement in binary cements generally increased paste/concrete set time in
spite of the type of clinker used, while slag replacement in ternary cements could either increase or decrease the set time, depending on the type of clinker used. Two different trends were found in the set times of Holcim and Lafarge ternary cements. Holcim slag in Holcim ternary cements did not delay paste/concrete set time, but in fact reduced the extended set times caused by fly ash. In comparison, when the Lafarge slag-blended cement (20% slag) was used together with 15% fly ash, the set time of the ternary cement consistently increased with increased SCM content. The
xii
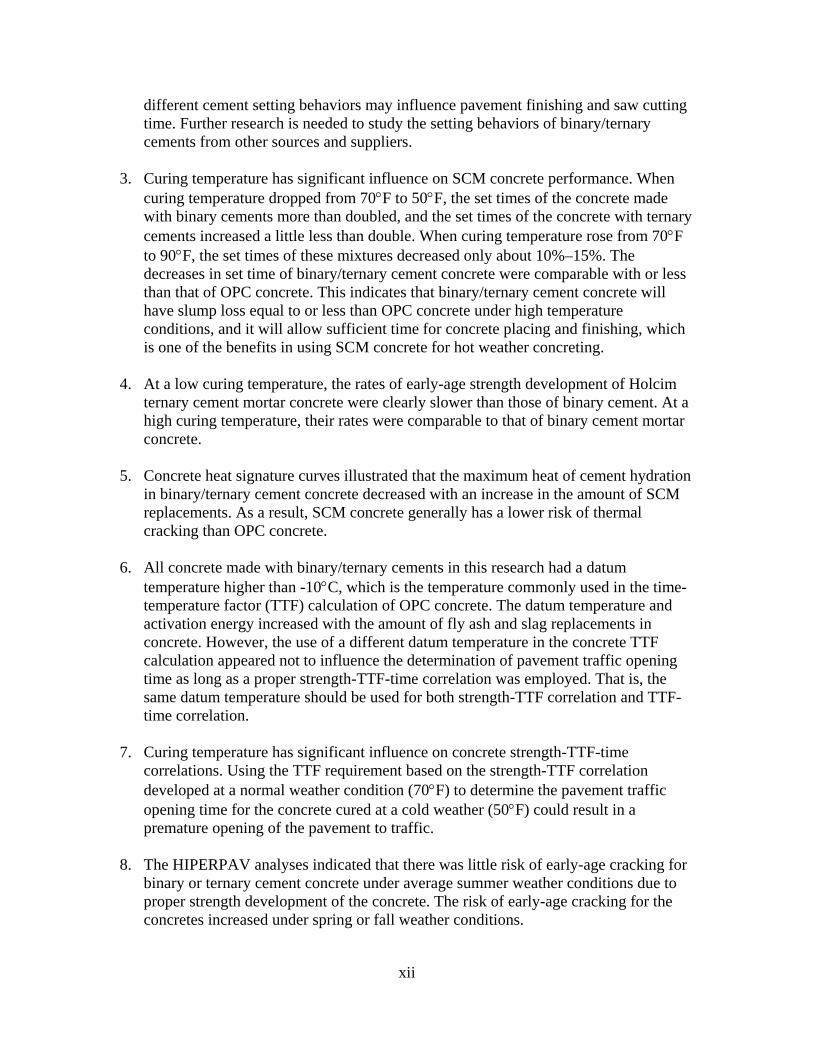
different cement setting behaviors may influence pavement finishing and saw cutting time. Further research is needed to study the setting behaviors of binary/ternary cements from other sources and suppliers.
3. Curing temperature has significant influence on SCM concrete performance. When
curing temperature dropped from 70°F to 50°F, the set times of the concrete made with binary cements more than doubled, and the set times of the concrete with ternary cements increased a little less than double. When curing temperature rose from 70°F to 90°F, the set times of these mixtures decreased only about 10%–15%. The decreases in set time of binary/ternary cement concrete were comparable with or less than that of OPC concrete. This indicates that binary/ternary cement concrete will have slump loss equal to or less than OPC concrete under high temperature conditions, and it will allow sufficient time for concrete placing and finishing, which is one of the benefits in using SCM concrete for hot weather concreting.
4. At a low curing temperature, the rates of early-age strength development of Holcim
ternary cement mortar concrete were clearly slower than those of binary cement. At a high curing temperature, their rates were comparable to that of binary cement mortar concrete.
5. Concrete heat signature curves illustrated that the maximum heat of cement hydration
in binary/ternary cement concrete decreased with an increase in the amount of SCM replacements. As a result, SCM concrete generally has a lower risk of thermal cracking than OPC concrete.
6. All concrete made with binary/ternary cements in this research had a datum
temperature higher than -10°C, which is the temperature commonly used in the time-temperature factor (TTF) calculation of OPC concrete. The datum temperature and activation energy increased with the amount of fly ash and slag replacements in concrete. However, the use of a different datum temperature in the concrete TTF calculation appeared not to influence the determination of pavement traffic opening time as long as a proper strength-TTF-time correlation was employed. That is, the same datum temperature should be used for both strength-TTF correlation and TTF-time correlation.
7. Curing temperature has significant influence on concrete strength-TTF-time
correlations. Using the TTF requirement based on the strength-TTF correlation developed at a normal weather condition (70°F) to determine the pavement traffic opening time for the concrete cured at a cold weather (50°F) could result in a premature opening of the pavement to traffic.
8. The HIPERPAV analyses indicated that there was little risk of early-age cracking for
binary or ternary cement concrete under average summer weather conditions due to proper strength development of the concrete. The risk of early-age cracking for the concretes increased under spring or fall weather conditions.

1
1. Introduction
1.1. Background
Blended cements are produced by intimately and uniformly intergrinding or blending ordinary portland cement (OPC) with one or more supplementary cementitious materials (SCMs). Most SCMs, such as ground granulated blast-furnace slag (GGBFS) or fly ash (FA), are industrial by-products. These materials are generally not used as cements by themselves, but when blended with OPC, they make a significant cementing contribution to the poperties of hardened concrete through hydraulic or pozzolanic activity [1].
SCMs are increasingly used in concrete because of following benefits [2]:
• Reduction of economic and environmental concerns by utilizing industrial wastes, reducing carbon dioxide emissions, and lowering energy requirements for OPC clinker production; and
• Improvements in concrete properties, such as workability, impermeability,
ultimate strength, and durability, including enhanced resistance to alkali-silica reactions, corrosion of steel, salt scaling, delayed ettringite formation, and sulfate attack.
However, experience also shows that concrete performance (such as workability, entrained air stability, and strength development) varies with the source and proportion of SCMs used. SCM concrete often displays slow hydration, accompanied by slow setting and low early-age strength. This effect is more pronounced as the proportion of SCMs in the blended cement is increased and when the concrete is cured at a low temperature. Therefore, more research is needed to have a better understanding of the effects of blended cement materials on concrete performance under different material, construction, and service conditions. Recently, the maturity concept has become widely used in Iowa for evaluating the in-situ concrete strength and for determining the appropriate time to open concrete pavement to traffic. In order to estimate concrete maturity, a datum temperature of the concrete, below which the concrete has no strength gain, is needed for calculation. The datum temperature of concrete is actually a function of concrete materials and mix proportions. However, due to lack of test data for SCM concrete, datum temperature of a typical OPC concrete, -10°C, is commonly used in the field regardless of concrete materials and mix proportions. Questions are raised on the accuracy of maturity estimation of SCM concrete based on the datum temperature of OPC concretes. In order to reduce the above problems, the present research was conducted to investigate the effects of clinker type, fly ash, and slag amount on set time, heat evolution, and strength development of SCM concrete. Datum temperatures of these concretes were also evaluated. It is expected that the research results would provide the Iowa concrete
2
industry with insight into improved specifications and construction practices for proper use of slag-blended cement and fly ash in concrete pavement under certain weather conditions. In Iowa, most blended cements used for pavement concrete contain 20%–35% GGBFS. In addition, 15% Class C fly ash is often employed together with the blended cements to improve concrete workability and further reduce cost. In this research, blended cements were considered to be the cements containing only GGBFS (slag) and OPC, that is, slag-blended cements. The amount of slag in the blended cements is 20%, 25%, and 35%. Thecementitious material (CM) containing fly ash, slag, and OPC was defined as ternary cement. If a CM consisted of only fly ash and OPC, it was defined as binary cement. 1.2. Objective and Approach
The objectives of this project included the following:
• Understand how the chemical and physical characteristics of slag-blended cements influence concrete performance (such as setting, hydration, and strength gain) at different curing temperature conditions (cold, normal, and hot).
• Investigate how the heat of hydration, strength, time-temperature factor
(TTF), datum temperature, activation energy, and strength-TTF correlation of concrete change with different cementitious materials.
• Provide a footing for establishing improved specifications for proper use of
binary or ternary cements in concrete and develop practical solutions for reducing the negative effects associated with the use of binary or ternary cements in concrete paving in low temperature conditions.
The specific research activities included investigating the following:
• Characteristics of cementitious materials (chemistry and fineness)
• Setting behavior of binary/ternary cement paste and concrete at extreme ambient temperature conditions
• Heat evolution of binary/ternary cement concrete
• Strength-TTF relationships of binary/ternary cement concrete at different
curing conditions
• Datum temperature and activation energy of binary/ternary cement concrete
3
2. Experimental Work
2.1. Concrete Materials
Two OPCs (Type I and Type I/II), a fly ash (Class C), and two types of GGBFS (Holcim slag and Lafarge slag, Grade 100), were used in this research project. The Type I cement (HI) was from the Holcim plant at Mason City, Iowa, and Type I/II (LI/II) was from the Lafarge Cement plant at Davenport, Iowa. A level of 15% fly ash replacement was used in the concrete for all tests conducted. In addition, 30% and 45% fly ash replacements were used in concrete for heat signature tests. The Class C fly ash was from Ottumwa, Iowa. Three levels of slag replacements (20%, 25%, and 35%) were selected. Holcim slagwas blended with Type I cement by the Holcim cement manufacturer, and Lafarge slag was blended with Type I/II at the concrete research lab. The limestone used as a concrete coarse aggregate was from Fort Dodge, Iowa. The aggregate was sieved and recombined to obtain a desired gradation. It was also saturated and then dried to the surface saturated dry (SSD) condition before the mixing. Two different sands were used. One, from Ames, Iowa, was used for mortar specimens, and the other, from Cordova, Illinois, was used for concrete specimens. 2.2. Experimental Methods
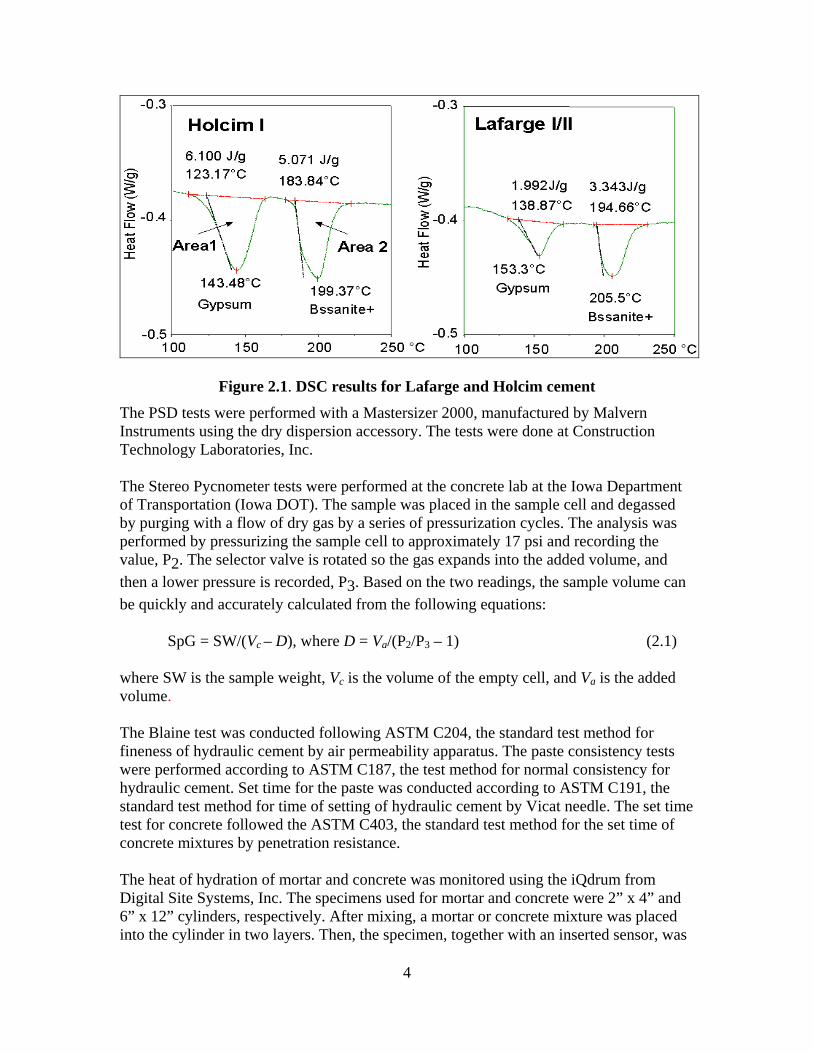
Various tests were performed to study the raw material characteristics, setting behavior, heat of hydration, strength development, and maturity of concrete containing different binary and ternary cements. The raw material tests include the x-ray fluorescence (XRF) test for chemical elements, x-ray diffraction (XRD) test for minerals, differential scanning calorimetric (DSC) test for gypsum content, particle size distribution (PSD) test, fineness (Blaine) test, and Stereo Pycnometer test for material specific gravity. The XRF, XRD, and DSC tests were done at the Materials Analysis and Research Laboratory (MARL) at Iowa State University (ISU). The gypsum and bassanite contents of OPC were estimated based on Areas 1 and 2 in the DSC curve of the cement (Figure 2.1), the values of which were then calibrated to gypsum and bassanite contents, respectively, based on a linear calibration curve [3, 4]. The anhydrite content of the material was then calculated from the difference between the total SO3 and the amount of SO3 in gypsum and bassanite.
4
Figure 2.1. DSC results for Lafarge and Holcim cement
The PSD tests were performed with a Mastersizer 2000, manufactured by Malvern Instruments using the dry dispersion accessory. The tests were done at Construction Technology Laboratories, Inc. The Stereo Pycnometer tests were performed at the concrete lab at the Iowa Department of Transportation (Iowa DOT). The sample was placed in the sample cell and degassed by purging with a flow of dry gas by a series of pressurization cycles. The analysis was performed by pressurizing the sample cell to approximately 17 psi and recording the value, P2. The selector valve is rotated so the gas expands into the added volume, and then a lower pressure is recorded, P3. Based on the two readings, the sample volume can be quickly and accurately calculated from the following equations: SpG = SW/(Vc – D), where D = Va/(P2/P3 – 1) (2.1) where SW is the sample weight, Vc is the volume of the empty cell, and Va is the added volume. The Blaine test was conducted following ASTM C204, the standard test method for fineness of hydraulic cement by air permeability apparatus. The paste consistency tests were performed according to ASTM C187, the test method for normal consistency for hydraulic cement. Set time for the paste was conducted according to ASTM C191, the standard test method for time of setting of hydraulic cement by Vicat needle. The set time test for concrete followed the ASTM C403, the standard test method for the set time of concrete mixtures by penetration resistance. The heat of hydration of mortar and concrete was monitored using the iQdrum from Digital Site Systems, Inc. The specimens used for mortar and concrete were 2” x 4” and 6” x 12” cylinders, respectively. After mixing, a mortar or concrete mixture was placed into the cylinder in two layers. Then, the specimen, together with an inserted sensor, was
5
put into the drum. The heat signature of the specimen was recorded by the sensor every 15 minutes. The test ran about 10 days for concrete and 3 days for mortar.
Concrete maturity, datum temperature, and activation energy tests were performed following ASTM C1074, the standard practice for estimating concrete strength by the maturity method. Three curing temperatures selected for datum temperature tests were 50°F, 70°F, and 90°F. The rate constant for strength development (k-value) was calculated based on ASTM C1074 Procedure A1.1.8.2. 2.3. Specimen Preparations
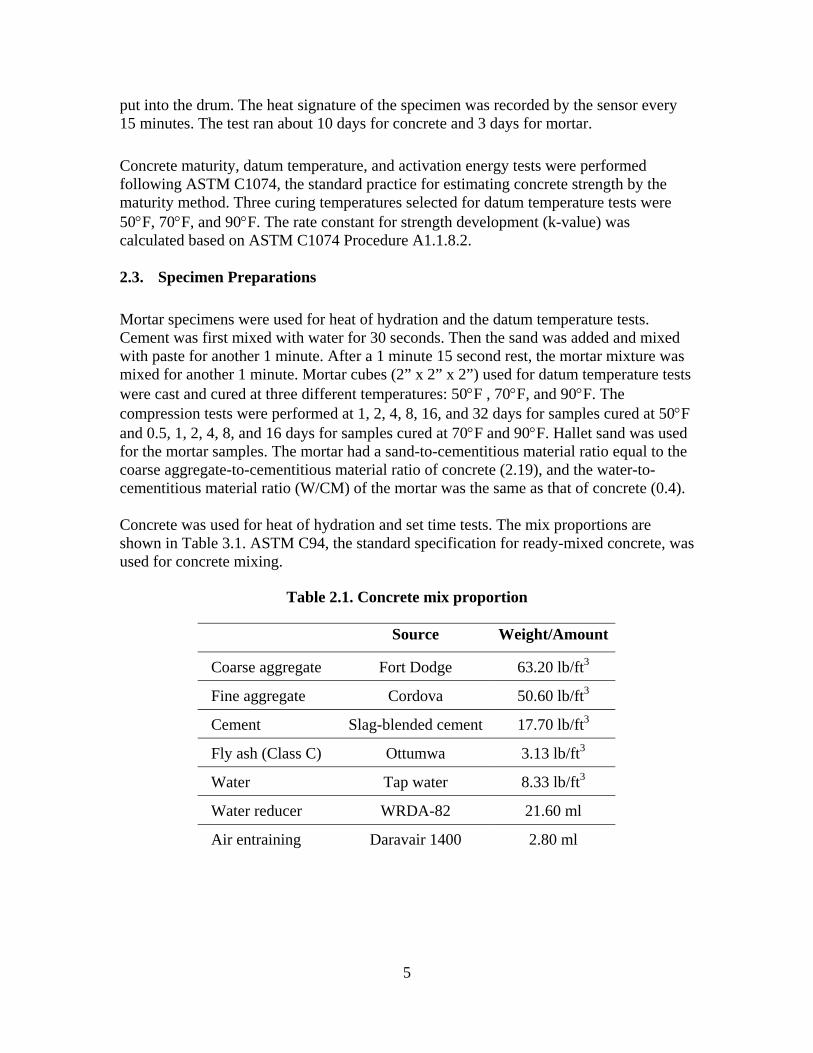
Mortar specimens were used for heat of hydration and the datum temperature tests. Cement was first mixed with water for 30 seconds. Then the sand was added and mixed with paste for another 1 minute. After a 1 minute 15 second rest, the mortar mixture was mixed for another 1 minute. Mortar cubes (2” x 2” x 2”) used for datum temperature tests were cast and cured at three different temperatures: 50°F , 70°F, and 90°F. The compression tests were performed at 1, 2, 4, 8, 16, and 32 days for samples cured at 50°F and 0.5, 1, 2, 4, 8, and 16 days for samples cured at 70°F and 90°F. Hallet sand was used for the mortar samples. The mortar had a sand-to-cementitious material ratio equal to the coarse aggregate-to-cementitious material ratio of concrete (2.19), and the water-to-cementitious material ratio (W/CM) of the mortar was the same as that of concrete (0.4). Concrete was used for heat of hydration and set time tests. The mix proportions are shown in Table 3.1. ASTM C94, the standard specification for ready-mixed concrete, was used for concrete mixing.
Table 2.1. Concrete mix proportion
Source Weight/Amount
Coarse aggregate Fort Dodge 63.20 lb/ft3
Fine aggregate Cordova 50.60 lb/ft3
Cement Slag-blended cement 17.70 lb/ft3
Fly ash (Class C) Ottumwa 3.13 lb/ft3
Water Tap water 8.33 lb/ft3
Water reducer WRDA-82 21.60 ml
Air entraining Daravair 1400 2.80 ml

6
3. RESULTS
3.1. Properties of the Raw Materials
A scanning electron microscope was employed to examine the supplementary materials (fly ash and slag) used, and their secondary images are shown in Figures 3.1–3.3. General observations indicate that fly ash has many fine spherical particles. These fine spherical particles can function as a lubricant and dispersion agent. Fly ash may help OPC particles to disperse in a water system and releases the water entrapped between OPC particles, thus improving concrete workability. However, due to increased “free” water available for concrete mixing and hydration, the concrete containing fly ash may experience increased set time [5-7].
In comparision, both Holcim and Lafarge slags have irregularly shaped particles, which may result from grinding (some slag particles are lighter in color than others due to a higher Fe content). The fine, irregular particles of the slags may absorb mixing water on their surface and increase the friction between solid particles, thus increasing the concrete water requirement. The results from paste consistency tests of the slag-blended cements are consistent with this explanation (see Section 3.2).
Figure 3.1. SEM image of fly ash

7
Figure 3.2. SEM image of Holcim slag
Figure 3.3. SEM of Lafarge slag
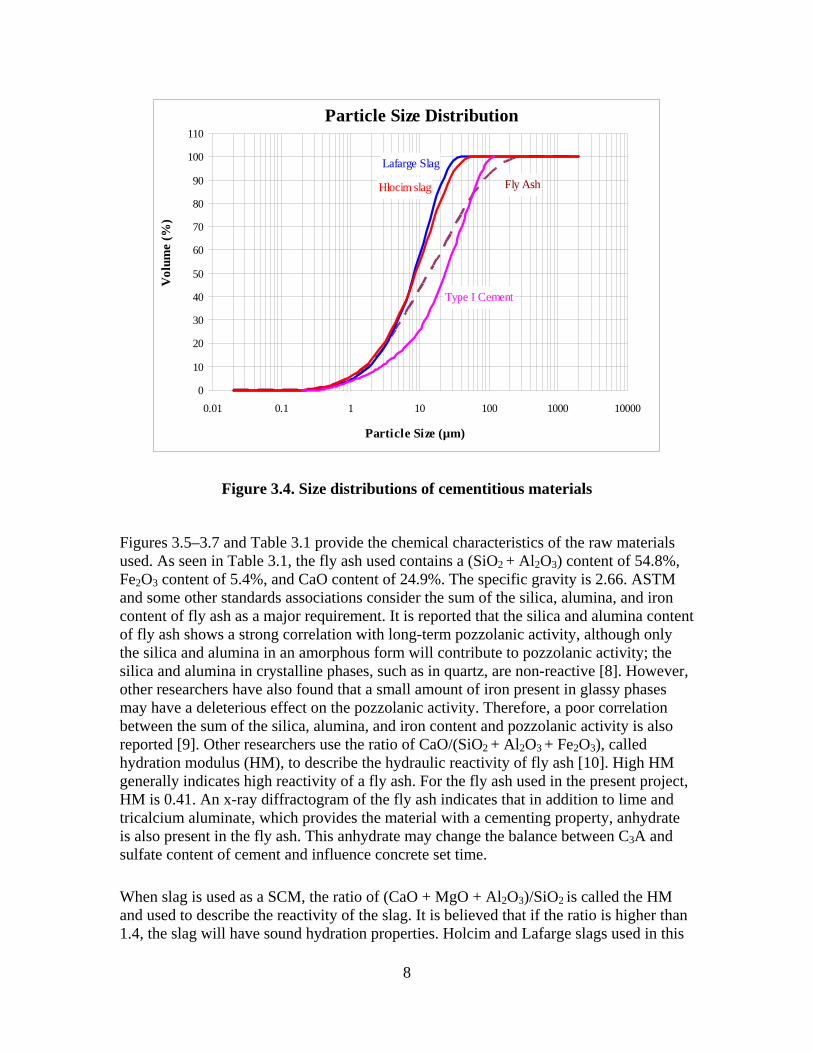
The size distributions of the fly ash and slags are illustrated in Figure 3.4. The size of fly ash particles ranges from 0.159 to 355.6 µm. The size of Holcim slag is from 0.159 to 63.2 µm. The Lafarge slag has the smallest particles, ranging from 0.159 to 39.9 µm. The mean particle sizes (for 50% volume) are 8.462, 8.859, and 13.6 µm for Lafarge slag, Holcim slag, and fly ash, respectively. The smaller the material particle size, the more water the material may absorb (due to the larger surface area), and the faster hydration and shorter set times the material will have.
8
Particle Size Distribution
Fly Ash
Lafarge Slag
Hlocim slag
Type I Cement
0
10
20
30
40
50
60
70
80
90
100
110
0.01 0.1 1 10 100 1000 10000
Particle Size (µm)
Vol
ume
(%)
Figure 3.4. Size distributions of cementitious materials
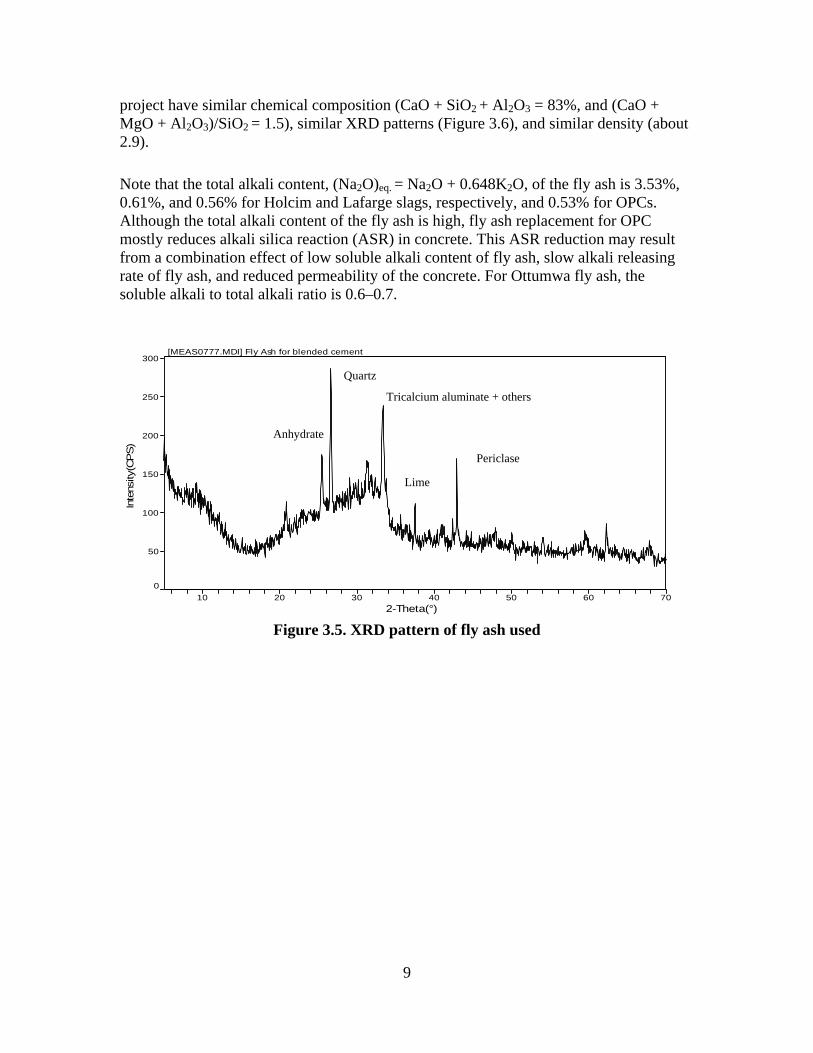
Figures 3.5–3.7 and Table 3.1 provide the chemical characteristics of the raw materials used. As seen in Table 3.1, the fly ash used contains a (SiO2 + Al2O3) content of 54.8%, Fe2O3 content of 5.4%, and CaO content of 24.9%. The specific gravity is 2.66. ASTM and some other standards associations consider the sum of the silica, alumina, and iron content of fly ash as a major requirement. It is reported that the silica and alumina content of fly ash shows a strong correlation with long-term pozzolanic activity, although only the silica and alumina in an amorphous form will contribute to pozzolanic activity; the silica and alumina in crystalline phases, such as in quartz, are non-reactive [8]. However, other researchers have also found that a small amount of iron present in glassy phases may have a deleterious effect on the pozzolanic activity. Therefore, a poor correlation between the sum of the silica, alumina, and iron content and pozzolanic activity is also reported [9]. Other researchers use the ratio of CaO/(SiO2 + Al2O3 + Fe2O3), called hydration modulus (HM), to describe the hydraulic reactivity of fly ash [10]. High HM generally indicates high reactivity of a fly ash. For the fly ash used in the present project, HM is 0.41. An x-ray diffractogram of the fly ash indicates that in addition to lime and tricalcium aluminate, which provides the material with a cementing property, anhydrate is also present in the fly ash. This anhydrate may change the balance between C3A and sulfate content of cement and influence concrete set time.
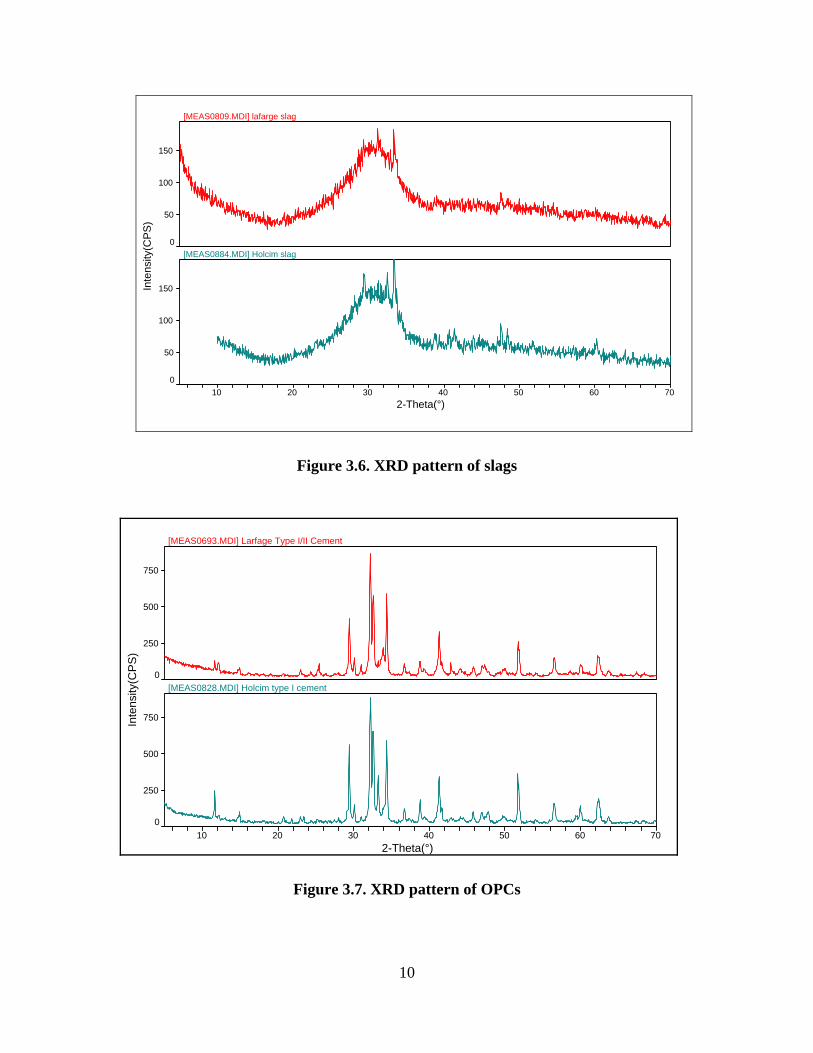
When slag is used as a SCM, the ratio of (CaO + MgO + Al2O3)/SiO2 is called the HM and used to describe the reactivity of the slag. It is believed that if the ratio is higher than 1.4, the slag will have sound hydration properties. Holcim and Lafarge slags used in this
9
project have similar chemical composition (CaO + SiO2 + Al2O3 = 83%, and (CaO + MgO + Al2O3)/SiO2 = 1.5), similar XRD patterns (Figure 3.6), and similar density (about 2.9).
Note that the total alkali content, (Na2O)eq. = Na2O + 0.648K2O, of the fly ash is 3.53%, 0.61%, and 0.56% for Holcim and Lafarge slags, respectively, and 0.53% for OPCs. Although the total alkali content of the fly ash is high, fly ash replacement for OPC mostly reduces alkali silica reaction (ASR) in concrete. This ASR reduction may result from a combination effect of low soluble alkali content of fly ash, slow alkali releasing rate of fly ash, and reduced permeability of the concrete. For Ottumwa fly ash, the soluble alkali to total alkali ratio is 0.6–0.7.
Figure 3.5. XRD pattern of fly ash used
10 20 30 40 50 60 702-Theta(°)
0
50
100
150
200
250
300
Inte
nsity
(CP
S)
[MEAS0777.MDI] Fly Ash for blended cement
Quartz
Anhydrate
Tricalcium aluminate + others
Lime
Periclase
10
0
50
100
150
[MEAS0809.MDI] lafarge slag
10 20 30 40 50 60 702-Theta(°)
0
50
100
150
[MEAS0884.MDI] Holcim slag
Inte
nsity
(CP
S)
Figure 3.6. XRD pattern of slags
0
250
500
750
[MEAS0693.MDI] Larfage Type I/II Cement
10 20 30 40 50 60 702-Theta(°)
0
250
500
750
[MEAS0828.MDI] Holcim type I cement
Inte
nsity
(CP
S)
Figure 3.7. XRD pattern of OPCs
11
Table 3.1. Chemical composition and physical properties of the raw materials
Holcim Type I cement Holcim slag Lafarge Type
I/II cement Lafarge slag Fly ash
CaO 64.24 37.09 62.32 36.99 24.88 SiO2 20.80 36.79 20.75 36.29 34.86 Al2O3 5.55 9.20 4.49 9.96 19.80 Fe2O3 2.25 0.76 3.45 0.75 5.38 MgO 1.91 9.50 2.88 10.35 5.33 K2O 0.50 0.41 0.67 0.34 0.52 Na2O 0.19 0.34 0.09 0.34 3.19 SO3 2.96 - 2.74 - 2.09 TiO2 0.26 0.44 0.34 0.53 1.43 P2O5 0.48 0.02 0.10 0.02 1.31 SrO 0.05 0.04 0.05 0.04 0.46 Mn2O3 0.05 0.55 0.53 0.46 0.02 BaO - - - - 0.78 S - 1.07 - 1.04 -
Che
mic
al C
ompo
sitio
n
LOI 0.82 0.10 0.29 C3S (%) 55.08 53.71 C2S (%) 18.56 19.58 C3A (%) 10.98 6.14 C4AF (%) 6.90 10.59 Density 3.14 2.93 3.20 2.94 2.66 Fineness (m2/Kg) 399 534 373 438
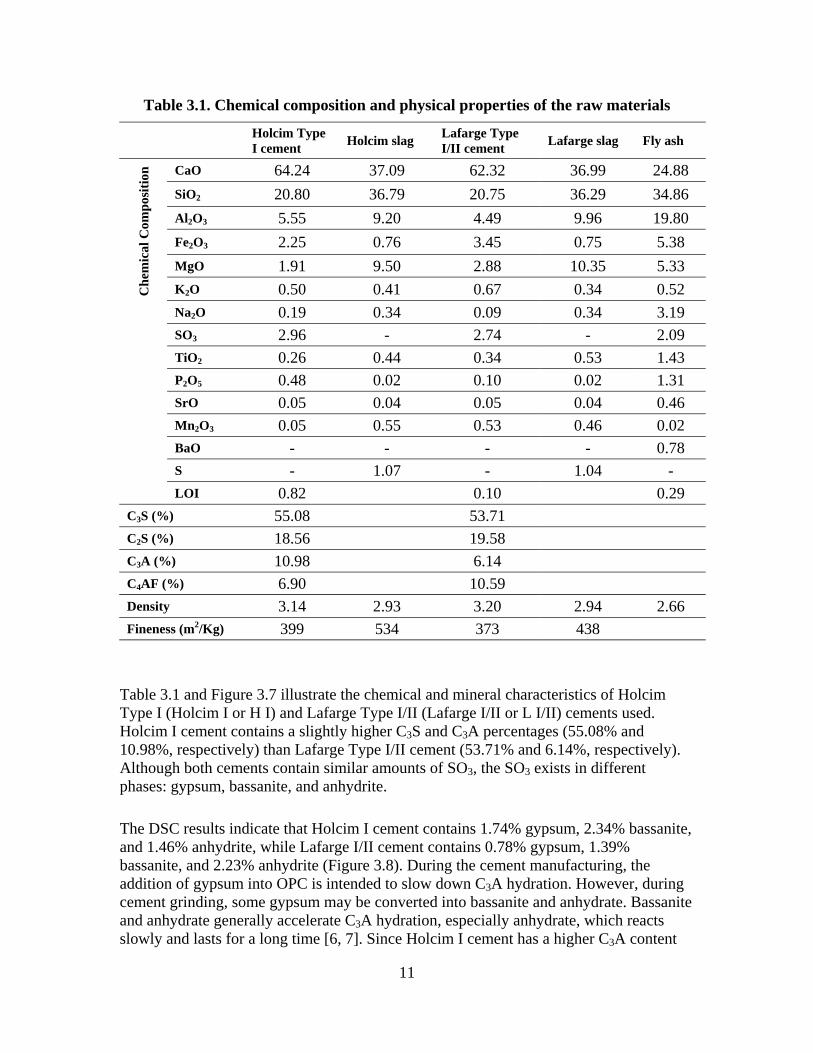
Table 3.1 and Figure 3.7 illustrate the chemical and mineral characteristics of Holcim Type I (Holcim I or H I) and Lafarge Type I/II (Lafarge I/II or L I/II) cements used. Holcim I cement contains a slightly higher C3S and C3A percentages (55.08% and 10.98%, respectively) than Lafarge Type I/II cement (53.71% and 6.14%, respectively). Although both cements contain similar amounts of SO3, the SO3 exists in different phases: gypsum, bassanite, and anhydrite.
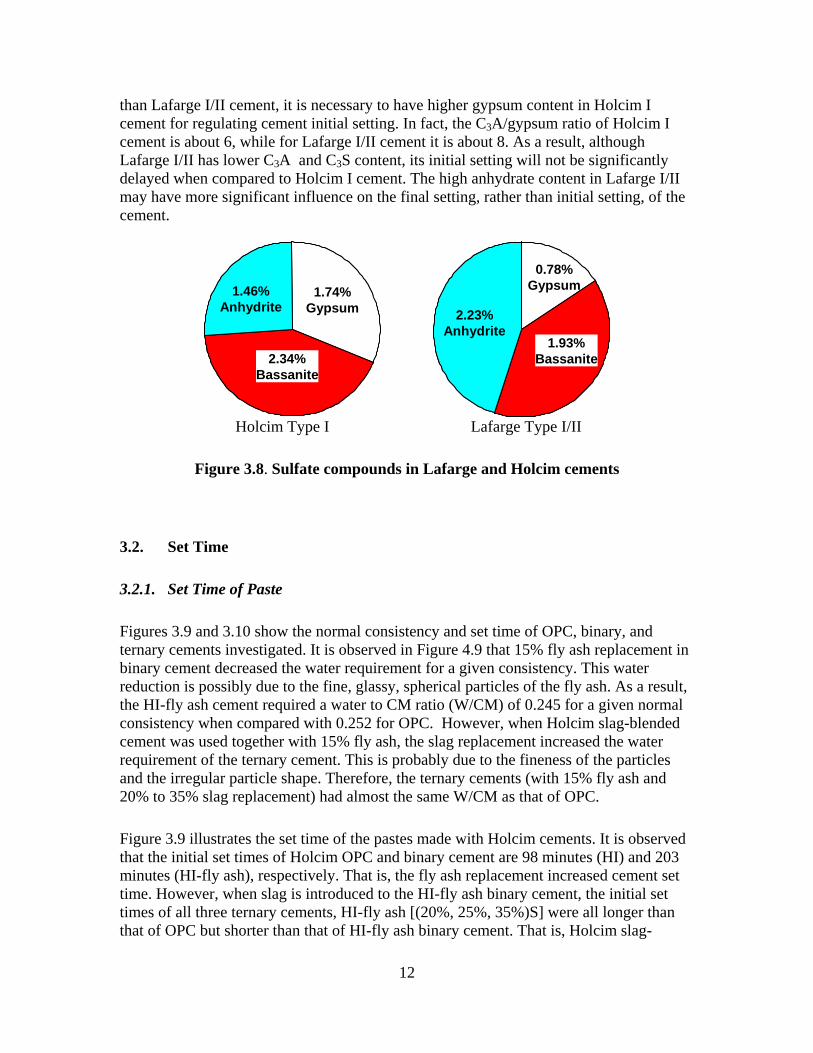
The DSC results indicate that Holcim I cement contains 1.74% gypsum, 2.34% bassanite, and 1.46% anhydrite, while Lafarge I/II cement contains 0.78% gypsum, 1.39% bassanite, and 2.23% anhydrite (Figure 3.8). During the cement manufacturing, the addition of gypsum into OPC is intended to slow down C3A hydration. However, during cement grinding, some gypsum may be converted into bassanite and anhydrate. Bassanite and anhydrate generally accelerate C3A hydration, especially anhydrate, which reacts slowly and lasts for a long time [6, 7]. Since Holcim I cement has a higher C3A content
12
than Lafarge I/II cement, it is necessary to have higher gypsum content in Holcim I cement for regulating cement initial setting. In fact, the C3A/gypsum ratio of Holcim I cement is about 6, while for Lafarge I/II cement it is about 8. As a result, although Lafarge I/II has lower C3A and C3S content, its initial setting will not be significantly delayed when compared to Holcim I cement. The high anhydrate content in Lafarge I/II may have more significant influence on the final setting, rather than initial setting, of the cement.
Holcim Type I Lafarge Type I/II
Figure 3.8. Sulfate compounds in Lafarge and Holcim cements
3.2. Set Time
3.2.1. Set Time of Paste
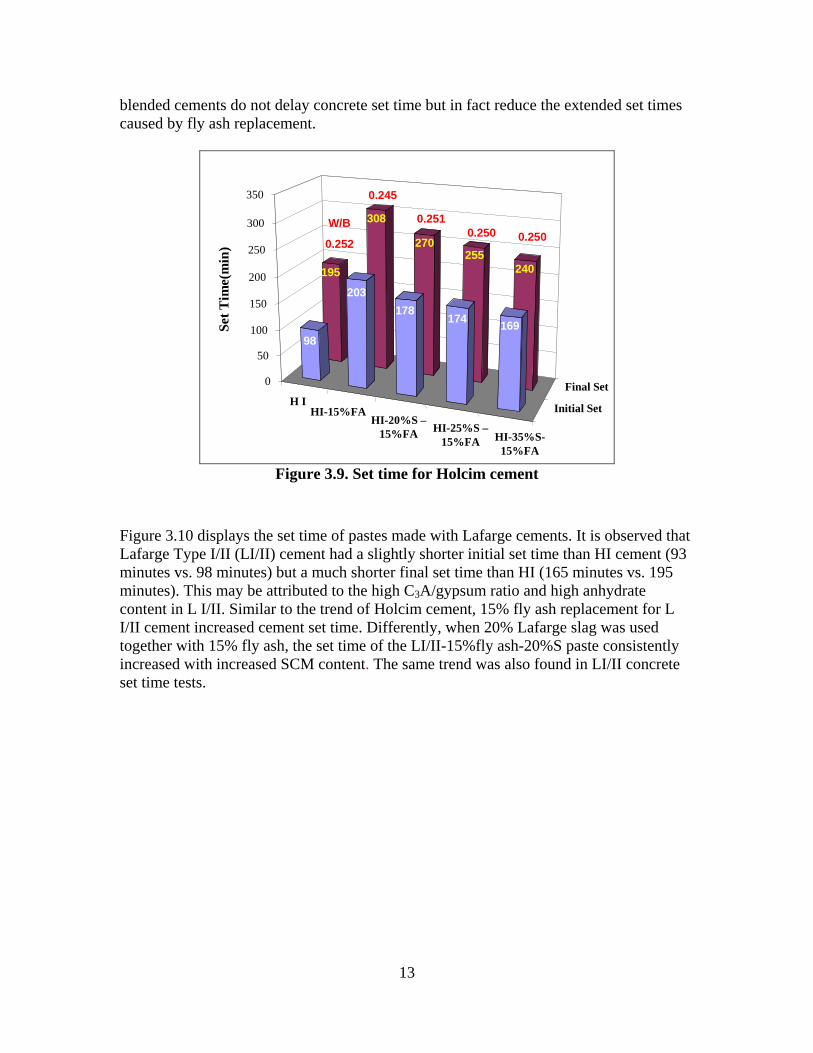
Figures 3.9 and 3.10 show the normal consistency and set time of OPC, binary, and ternary cements investigated. It is observed in Figure 4.9 that 15% fly ash replacement in binary cement decreased the water requirement for a given consistency. This water reduction is possibly due to the fine, glassy, spherical particles of the fly ash. As a result, the HI-fly ash cement required a water to CM ratio (W/CM) of 0.245 for a given normal consistency when compared with 0.252 for OPC. However, when Holcim slag-blended cement was used together with 15% fly ash, the slag replacement increased the water requirement of the ternary cement. This is probably due to the fineness of the particles and the irregular particle shape. Therefore, the ternary cements (with 15% fly ash and 20% to 35% slag replacement) had almost the same W/CM as that of OPC.
Figure 3.9 illustrates the set time of the pastes made with Holcim cements. It is observed that the initial set times of Holcim OPC and binary cement are 98 minutes (HI) and 203 minutes (HI-fly ash), respectively. That is, the fly ash replacement increased cement set time. However, when slag is introduced to the HI-fly ash binary cement, the initial set times of all three ternary cements, HI-fly ash [(20%, 25%, 35%)S] were all longer than that of OPC but shorter than that of HI-fly ash binary cement. That is, Holcim slag-
2.34%Bassanite
1.46%Anhydrite
1.74%Gypsum
0.78%Gypsum
2.23%Anhydrite
1.93%Bassanite2.34%
Bassanite
1.46%Anhydrite
1.74%Gypsum
0.78%Gypsum
2.23%Anhydrite
1.93%Bassanite
13
blended cements do not delay concrete set time but in fact reduce the extended set times caused by fly ash replacement.
H I HI-15%FA
HI-20%S –15%FA HI-25%S –
15%FA HI-35%S-15%FA
Initial Set
Final Set0
50
100
150
200
250
300
350
Set T
ime(
min
)W/B
0.252
0.251
0.245
0.250 0.250
98
203178
174 169
195
308
270255
240
Figure 3.9. Set time for Holcim cement
Figure 3.10 displays the set time of pastes made with Lafarge cements. It is observed that Lafarge Type I/II (LI/II) cement had a slightly shorter initial set time than HI cement (93 minutes vs. 98 minutes) but a much shorter final set time than HI (165 minutes vs. 195 minutes). This may be attributed to the high C3A/gypsum ratio and high anhydrate content in L I/II. Similar to the trend of Holcim cement, 15% fly ash replacement for L I/II cement increased cement set time. Differently, when 20% Lafarge slag was used together with 15% fly ash, the set time of the LI/II-15%fly ash-20%S paste consistently increased with increased SCM content. The same trend was also found in LI/II concrete set time tests.

14
L I/IIL I/II-15%FA
L I/II –20%S-15%FA
Initial Set
Final Set0
50
100
150
200
250
300
350
Set T
ime(
min
) 0.2420.236
0.243W/B
93 124 154
165210
240
Figure 3.10. Set time for Lafarge cement
It is important to note that the Lafarge slag-blended cement displayed a different setting behavior from Holcim slag-blended cements. This difference may be caused by various factors, such as the chemistry of the portland cement clinker, reactivity of the slags, and methods of blending. Since Lafarge Type I/II cement had a slightly lower C3S content than Holcim Type I cement, the calcium hydroxide content, resulting from OPC hydration, in LI/II blends might be lower that in HI blends. Therefore, the rate of silica and alumina dissolutions as well as the rate of early-age pozzolanic reaction of fly ash and slag might be reduced. Thus, set times of LI/II binary/ternary cements were delayed. In addition, the blended Holcim cements were blended by the Holcim manufacturer; while the Lafarge blended cement was blended with the slag in the research lab. It is believed that cement blended by manufacturer may have better uniformity. Further research is needed to study the causes of the trend change and to learn more about setting behaviors of binary/ternary cements from other sources and suppliers.
3.2.2. Set Time of Concrete
The set times of concrete made with various CMs were tested under different curing temperatures (50°F , 70°F , and 90°F), and the results are shown in Figures 3.11-3.14. The trend that illustrates effects of fly ash and slag replacement on set times of concrete is the same as that observed from the set time of cement pastes.
When the curing temperature decreased from 70°F to 50°F, the initial set times (Figure 3.11) of the concretes made with 100% HI cement and ternary cement (HI-15%FA-(20, 25, or 35)%S) increased 3.9–4.4 hours, while the initial set times of the concrete made

15
with binary cement (HI-15%FA) increased 6.7 hours. The differences in the initial set time between the OPC and blended cements doubled due to slower pozzolanic reaction in cold weather. For the same curing temperature change (from 70°F to 50°F), the initial set times (Figure 3.13) increased only 2.6 hours for the concretes made with L I/II cement, 4.1 hours for concrete made with L I/II-15%FA, but 5.7 hours for concrete made with L I/II-15%FA-20%S.
H I H I-1 5% F AH I- 2 0% S -1 5 % F A
9 0 F7 0 F
5 0 F0
2
4
6
8
1 0
1 2
1 4
7 .7
1 2 .1
9 .49 .3
9 .0
4 .35 .4
5 .0 5 .0 5 .13 .7
4 .74 .6 4 .3 4 .6
Initi
al S
et T
ime
(hrs
)
H I -2 5% S -1 5 % F A H I- 3 5% S
-1 5 % F A
Figure 3.11. Initial set time of Holcim concrete

16
Fina
l Set
Tim
e (h
rs)
H I H I-15%FA H I- 20%S
-15%FA H I-25%S-15%FA H I-35%S
-15%FA
90 F70 F
50 F0
5
10
15
20
25
13.0
20.5
14.414.0 14.7
5.97.5
6.9 7.0 7.25.0 6.4
5.95.7 6.0
Figure 3.12. Final set time of Holcim concrete
L I/II -15% FA
L I/II 90 F
70 F50 F
0
2
4
6
8
10
12
14
3.4
8.9
11.2
4.0 4.4
4.3 4.8 5.5
6.9
Initi
al S
et T
ime
(hr)
L I/II-15%FA L I/II-20%S-15%FA
L I/II -15% FA
L I/II 90 F
70 F50 F
0
2
4
6
8
10
12
14
3.4
8.9
11.2
4.0 4.4
4.3 4.8 5.5
6.9
Initi
al S
et T
ime
(hr)
L I/II-15%FA L I/II-20%S-15%FA
L I/II -15% FA
L I/II 90 F
70 F50 F
0
2
4
6
8
10
12
14
3.4
8.9
11.2
4.0 4.4
4.3 4.8 5.5
6.9
3.4
8.9
11.2
4.0 4.4
4.3 4.8 5.5
6.9
Initi
al S
et T
ime
(hr)
L I/II-15%FA L I/II-20%S-15%FA
Figure 3.13. Initial set time of Lafarge concrete

17
Figure 3.14. Final set time of Lafarge concrete
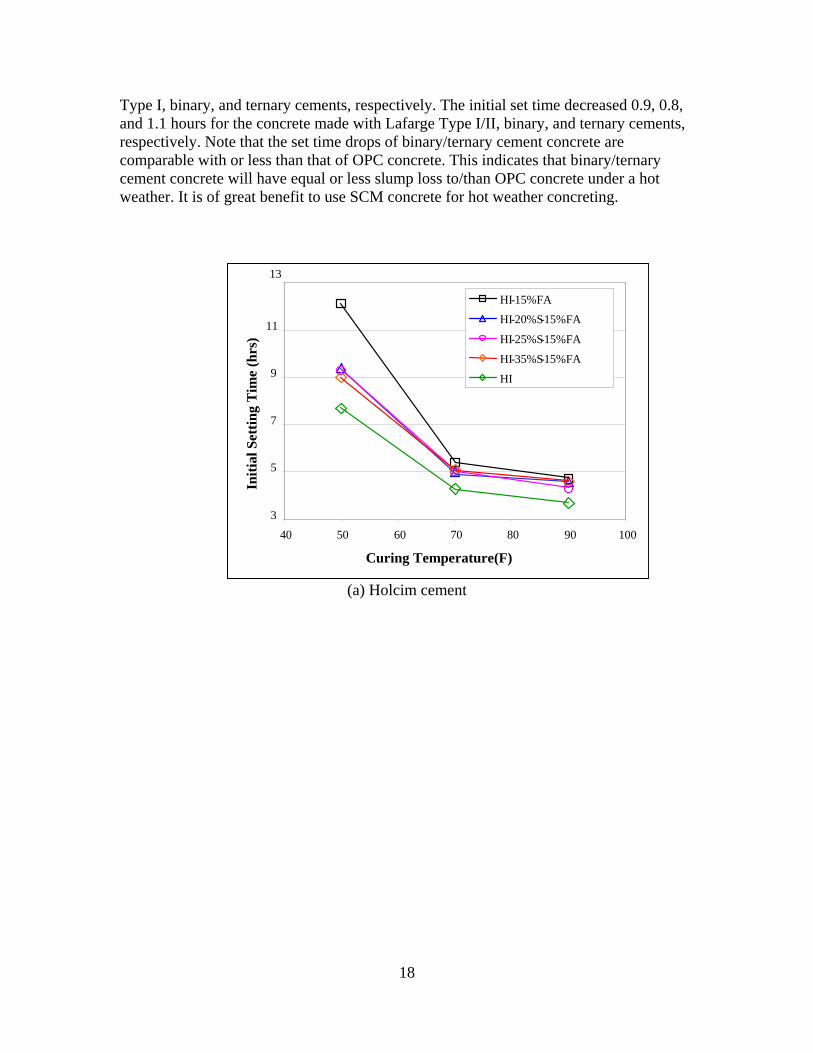
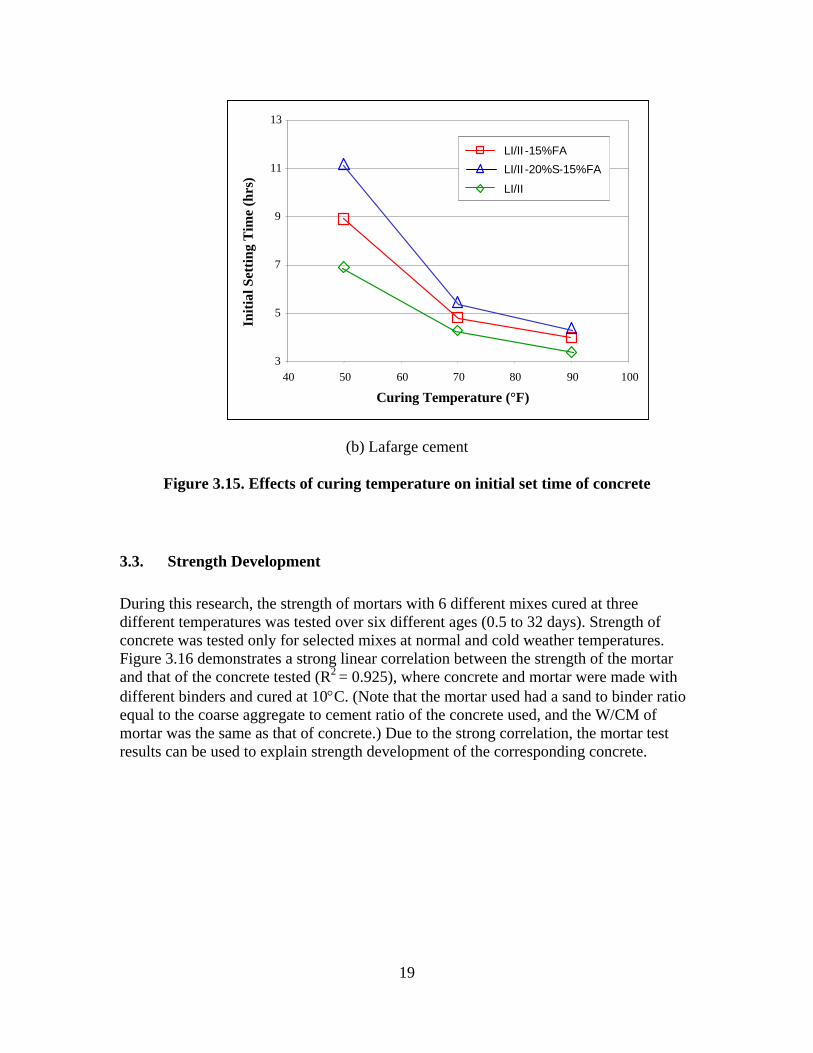
Figure 3.15 shows the effects of curing temperature on the initial set time of concrete. The figure can be used to predict setting behavior of concrete under a curing temperature ranging from 50°F to 90°F, and it may help engineers in controlling the time for pavement finishing and saw cutting.
Note from Figure 3.15 that when the curing temperature increased from 50°F to 70°F, the differences in the initial set time between the OPC, binary, and ternary cement mixtures become smaller with increased curing temperature. This indicates that the increased curing temperature accelerates ion dissolution of SCMs and pozzolanic reaction more effectively than it does for OPC hydration. The accelerated pozzolanic reaction consumes calcium hydroxide, and it in turn [wrong word?] expertise OPC hydration [11]. As a result, the set time of concrete containing SCMs is shortened.
Comparing the slopes of the lines in Figure 4.15 between curing temperatures of 50°F and 70°F, one may conclude that the set behavior of Holcim Type I and binary cements is more sensitive (having steeper slopes) to cold weather than Lafarge Type I/II and binary cements. However, the set behavior of the Lafarge ternary cement is more sensitive than the Holcim ternary cement.
When the curing temperature increased from 70°F to 90°F (Figures 3.11–3.15), the initial set time decreased only 0.6, 0.7, and 0.4-0.7 hours for the concrete made with Holcim
L I/II 90 F
70 F
50 F
0
5
10
15
20
25
4.5 5.5 6.0
6.4 6.9 8.1
10.813.7
17.6
Fina
l Set
Tim
e (h
rs)
L I/II-15%FA L I/II-20%S-15%FA
L I/II 90 F
70 F
50 F
0
5
10
15
20
25
4.5 5.5 6.0
6.4 6.9 8.1
10.813.7
17.6
Fina
l Set
Tim
e (h
rs)
L I/II-15%FA L I/II-20%S-15%FA
18
Type I, binary, and ternary cements, respectively. The initial set time decreased 0.9, 0.8, and 1.1 hours for the concrete made with Lafarge Type I/II, binary, and ternary cements, respectively. Note that the set time drops of binary/ternary cement concrete are comparable with or less than that of OPC concrete. This indicates that binary/ternary cement concrete will have equal or less slump loss to/than OPC concrete under a hot weather. It is of great benefit to use SCM concrete for hot weather concreting.
(a) Holcim cement
13
3
5
7
9
11
40 50 60 70 80 90 100
Curing Temperature(F)
Initi
al S
ettin
g T
ime
(hrs
)
HI-15%FA
HI-20%S-15%FA
HI-25%S-15%FA
HI-35%S-15%FA
HI
13
3
5
7
9
11
40 50 60 70 80 90 100
Curing Temperature(F)
Initi
al S
ettin
g T
ime
(hrs
)
HI-15%FA
HI-20%S-15%FA
HI-25%S-15%FA
HI-35%S-15%FA
HI
HI-15%FA
HI-20%S-15%FA
HI-25%S-15%FA
HI-35%S-15%FA
HI
19
(b) Lafarge cement
Figure 3.15. Effects of curing temperature on initial set time of concrete
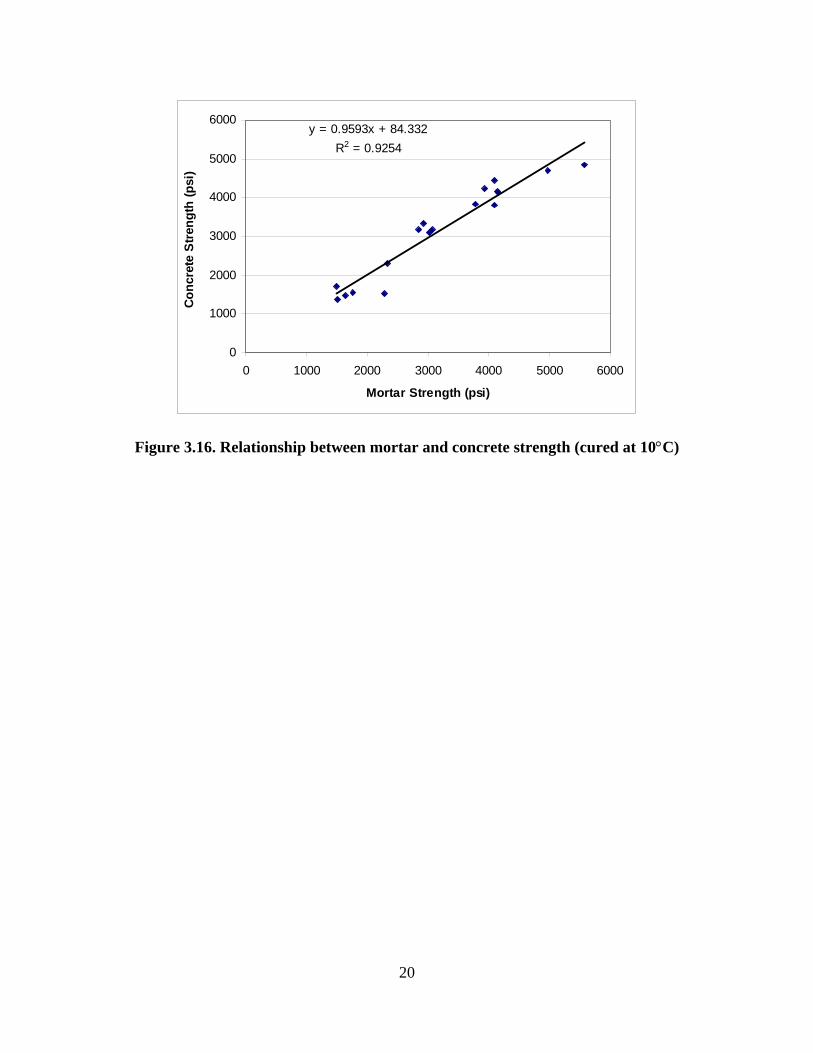
3.3. Strength Development
During this research, the strength of mortars with 6 different mixes cured at three different temperatures was tested over six different ages (0.5 to 32 days). Strength of concrete was tested only for selected mixes at normal and cold weather temperatures. Figure 3.16 demonstrates a strong linear correlation between the strength of the mortar and that of the concrete tested (R2 = 0.925), where concrete and mortar were made with different binders and cured at 10°C. (Note that the mortar used had a sand to binder ratio equal to the coarse aggregate to cement ratio of the concrete used, and the W/CM of mortar was the same as that of concrete.) Due to the strong correlation, the mortar test results can be used to explain strength development of the corresponding concrete.
3
5
7
9
11
13
40 50 60 70 80 90 100
Curing Temperature (°F)
Initi
al S
ettin
g T
ime
(hrs
)
LI/II -15%FALI/II -20%S-15%FA
LI/II
3
5
7
9
11
13
40 50 60 70 80 90 100
Curing Temperature (°F)
Initi
al S
ettin
g T
ime
(hrs
)
LI/II -15%FALI/II -20%S-15%FA
LI/II
LI/II -15%FALI/II -20%S-15%FA
LI/II
20
y = 0.9593x + 84.332R2 = 0.9254
0
1000
2000
3000
4000
5000
6000
0 1000 2000 3000 4000 5000 6000
Mortar Strength (psi)
Con
cret
e St
reng
th (p
si)
Figure 3.16. Relationship between mortar and concrete strength (cured at 10°C)
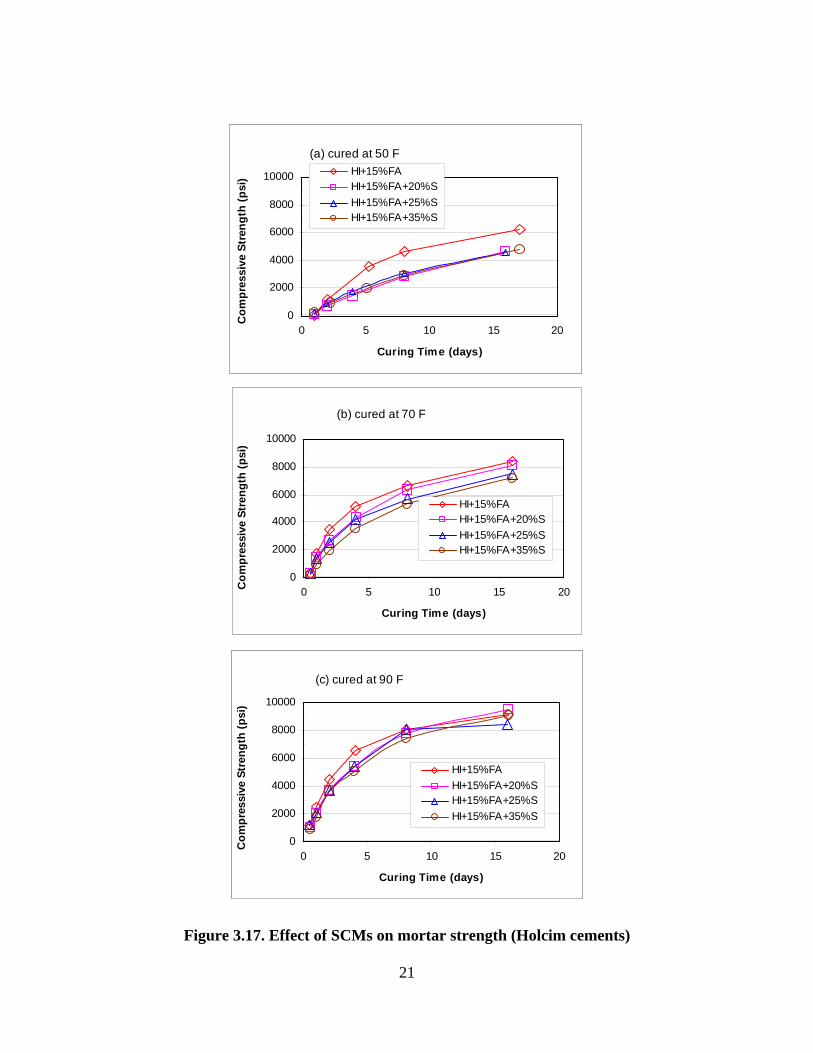
21
Figure 3.17. Effect of SCMs on mortar strength (Holcim cements)
(a) cured at 50 F
0
2000
4000
6000
8000
10000
0 5 10 15 20
Curing Time (days)
Com
pres
sive
Str
engt
h (p
si) HI+15%FA
HI+15%FA+20%SHI+15%FA+25%SHI+15%FA+35%S
(b) cured at 70 F
0
2000
4000
6000
8000
10000
0 5 10 15 20
Curing Time (days)
Com
pres
sive
Str
engt
h (p
si)
HI+15%FAHI+15%FA+20%SHI+15%FA+25%SHI+15%FA+35%S
(c) cured at 90 F
0
2000
4000
6000
8000
10000
0 5 10 15 20
Curing Time (days)
Com
pres
sive
Str
engt
h (p
si)
HI+15%FAHI+15%FA+20%SHI+15%FA+25%SHI+15%FA+35%S
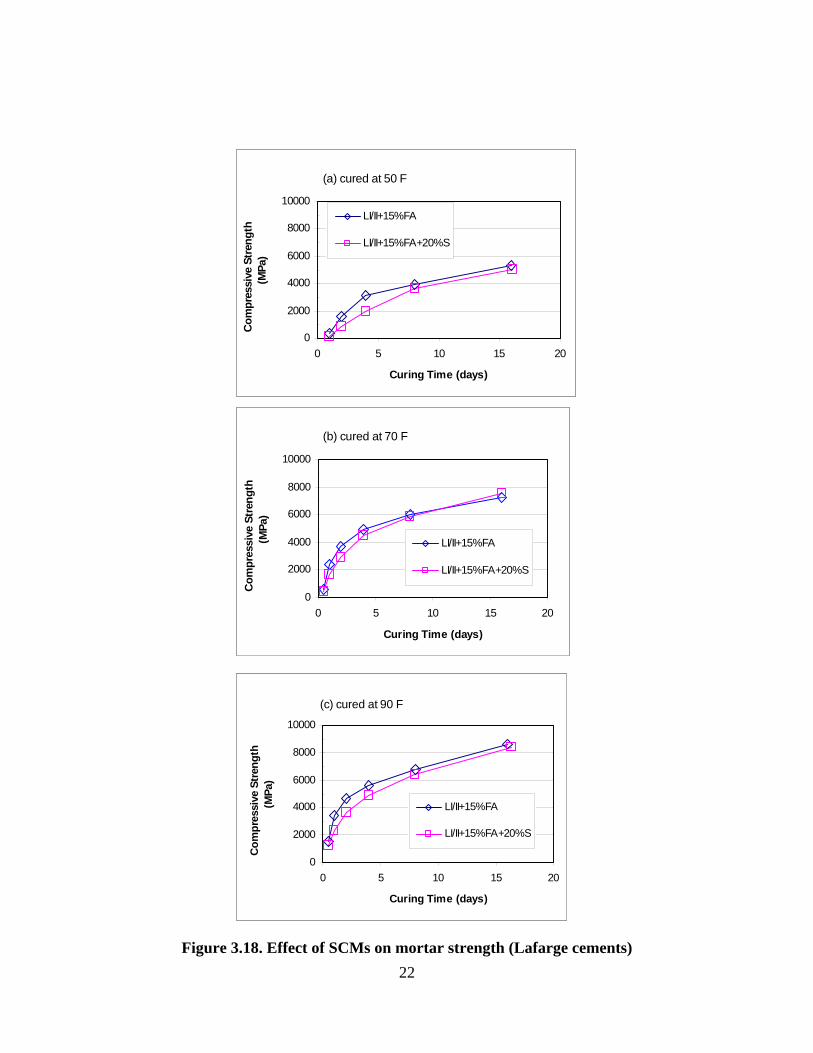
22
Figure 3.18. Effect of SCMs on mortar strength (Lafarge cements)
(b) cured at 70 F
0
2000
4000
6000
8000
10000
0 5 10 15 20
Curing Time (days)
Com
pres
sive
Str
engt
h (M
Pa)
LI/II+15%FA
LI/II+15%FA+20%S
(c) cured at 90 F
0
2000
4000
6000
8000
10000
0 5 10 15 20
Curing Time (days)
Com
pres
sive
Stre
ngth
(M
Pa)
LI/II+15%FA
LI/II+15%FA+20%S
(a) cured at 50 F
0
2000
4000
6000
8000
10000
0 5 10 15 20
Curing Time (days)
Com
pres
sive
Stre
ngth
(M
Pa)
LI/II+15%FA
LI/II+15%FA+20%S
23
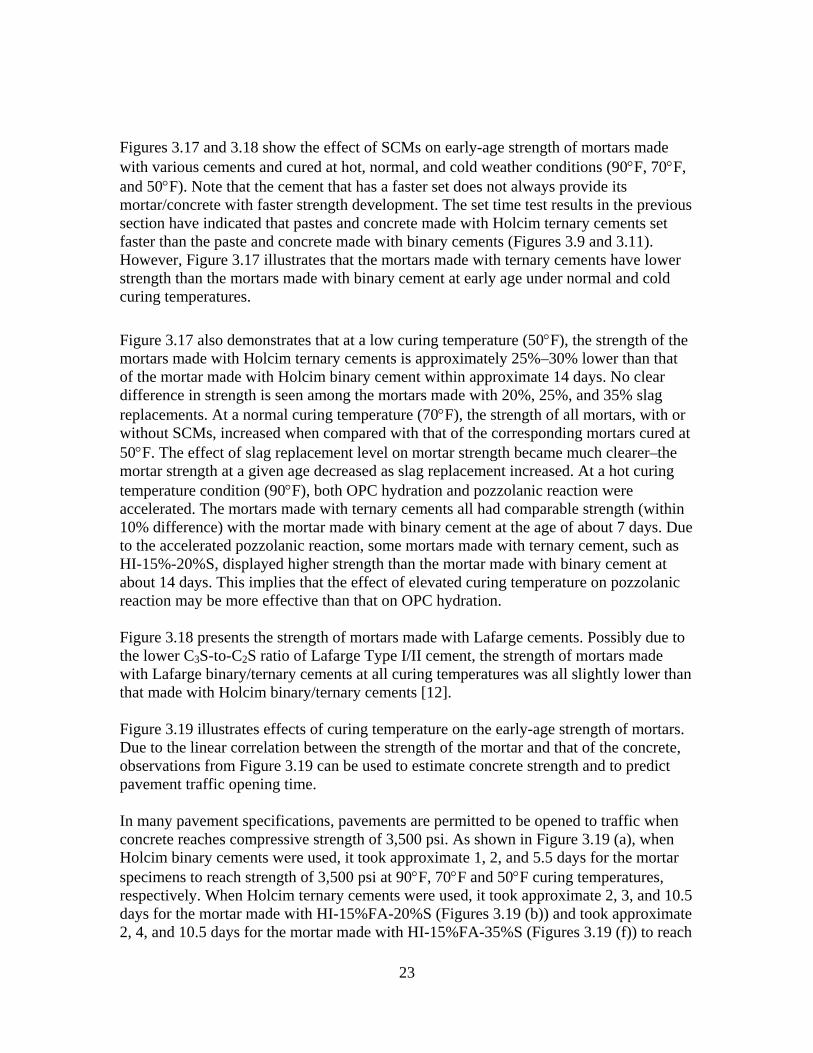
Figures 3.17 and 3.18 show the effect of SCMs on early-age strength of mortars made with various cements and cured at hot, normal, and cold weather conditions (90°F, 70°F, and 50°F). Note that the cement that has a faster set does not always provide its mortar/concrete with faster strength development. The set time test results in the previous section have indicated that pastes and concrete made with Holcim ternary cements set faster than the paste and concrete made with binary cements (Figures 3.9 and 3.11). However, Figure 3.17 illustrates that the mortars made with ternary cements have lower strength than the mortars made with binary cement at early age under normal and cold curing temperatures.
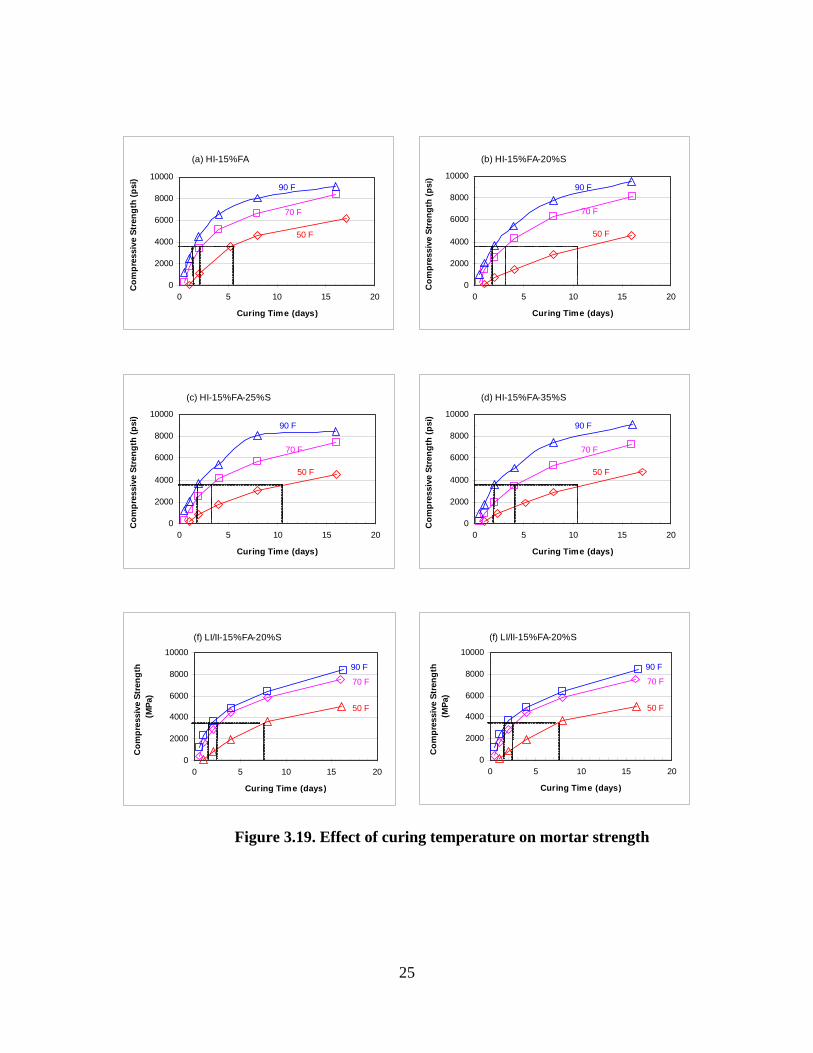
Figure 3.17 also demonstrates that at a low curing temperature (50°F), the strength of the mortars made with Holcim ternary cements is approximately 25%–30% lower than that of the mortar made with Holcim binary cement within approximate 14 days. No clear difference in strength is seen among the mortars made with 20%, 25%, and 35% slag replacements. At a normal curing temperature (70°F), the strength of all mortars, with or without SCMs, increased when compared with that of the corresponding mortars cured at 50°F. The effect of slag replacement level on mortar strength became much clearer–the mortar strength at a given age decreased as slag replacement increased. At a hot curing temperature condition (90°F), both OPC hydration and pozzolanic reaction were accelerated. The mortars made with ternary cements all had comparable strength (within 10% difference) with the mortar made with binary cement at the age of about 7 days. Due to the accelerated pozzolanic reaction, some mortars made with ternary cement, such as HI-15%-20%S, displayed higher strength than the mortar made with binary cement at about 14 days. This implies that the effect of elevated curing temperature on pozzolanic reaction may be more effective than that on OPC hydration. Figure 3.18 presents the strength of mortars made with Lafarge cements. Possibly due to the lower C3S-to-C2S ratio of Lafarge Type I/II cement, the strength of mortars made with Lafarge binary/ternary cements at all curing temperatures was all slightly lower than that made with Holcim binary/ternary cements [12]. Figure 3.19 illustrates effects of curing temperature on the early-age strength of mortars. Due to the linear correlation between the strength of the mortar and that of the concrete, observations from Figure 3.19 can be used to estimate concrete strength and to predict pavement traffic opening time. In many pavement specifications, pavements are permitted to be opened to traffic when concrete reaches compressive strength of 3,500 psi. As shown in Figure 3.19 (a), when Holcim binary cements were used, it took approximate 1, 2, and 5.5 days for the mortar specimens to reach strength of 3,500 psi at 90°F, 70°F and 50°F curing temperatures, respectively. When Holcim ternary cements were used, it took approximate 2, 3, and 10.5 days for the mortar made with HI-15%FA-20%S (Figures 3.19 (b)) and took approximate 2, 4, and 10.5 days for the mortar made with HI-15%FA-35%S (Figures 3.19 (f)) to reach

24
a strength of 3,500 psi at 90°F, 70°F and 50°F curing temperatures, respectively. That is, ternary cement concrete generally requires a longer curing time to reach a given early-age strength under a given curing temperature than binary cement concrete. As SCM content increases, a longer curing time is needed. Similar trends can be observed for mortars made Lafarge binary/ternary cements.
25
Figure 3.19. Effect of curing temperature on mortar strength
(a) HI-15%FA
0
2000
4000
6000
8000
10000
0 5 10 15 20
Curing Time (days)
Com
pres
sive
Str
engt
h (p
si)
50 F
70 F
90 F
(b) HI-15%FA-20%S
0
2000
4000
6000
8000
10000
0 5 10 15 20
Curing Time (days)
Com
pres
sive
Str
engt
h (p
si)
50 F
70 F
90 F
(c) HI-15%FA-25%S
0
2000
4000
6000
8000
10000
0 5 10 15 20
Curing Time (days)
Com
pres
sive
Str
engt
h (p
si)
50 F
70 F
90 F
(d) HI-15%FA-35%S
0
2000
4000
6000
8000
10000
0 5 10 15 20
Curing Time (days)
Com
pres
sive
Str
engt
h (p
si)
50 F
70 F
90 F
(f) LI/II-15%FA-20%S
0
2000
4000
6000
8000
10000
0 5 10 15 20
Curing Time (days)
Com
pres
sive
Str
engt
h (M
Pa)
50 F
70 F
90 F
(f) LI/II-15%FA-20%S
0
2000
4000
6000
8000
10000
0 5 10 15 20
Curing Time (days)
Com
pres
sive
Str
engt
h (M
Pa)
50 F
70 F
90 F
26
(a) Mortars made with Holcim cements at 3 days
(b) Mortars made with Lafarge cements at 3, 7, and 14 days
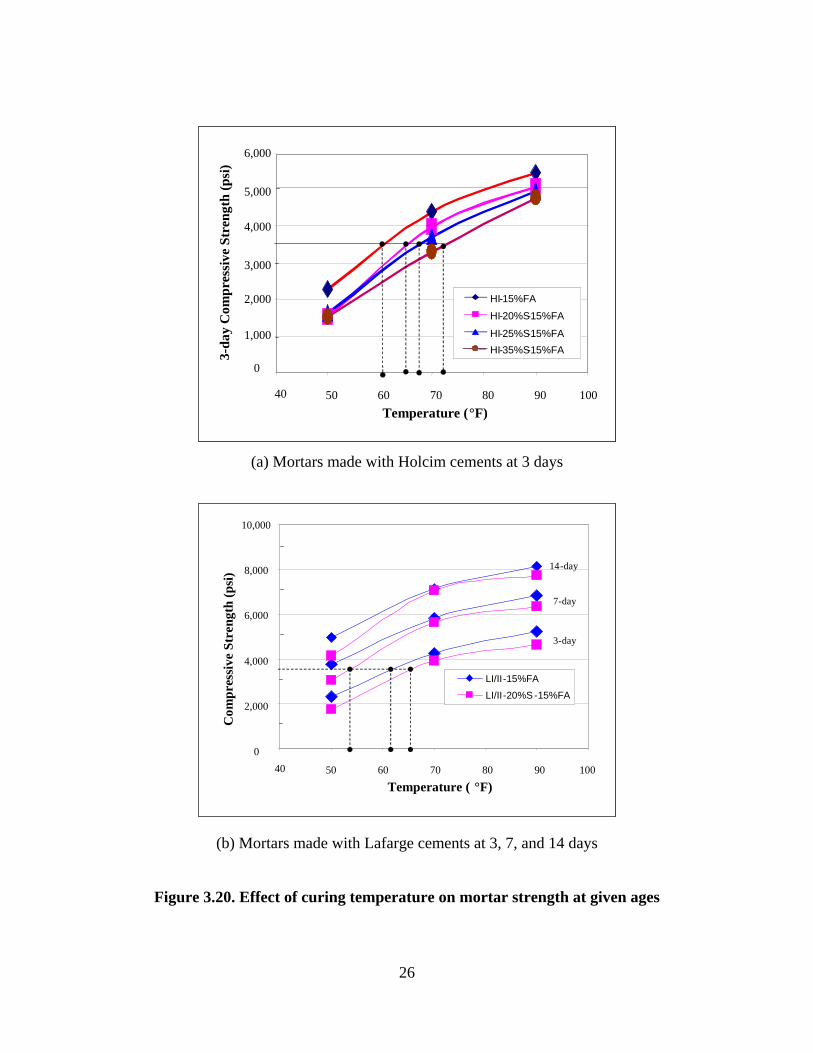
Figure 3.20. Effect of curing temperature on mortar strength at given ages
Temperature ( °F)
Com
pres
sive
Str
engt
h (p
si)
0
2,000
4,000
6,000
8,000
10,000
50 60 70 80 90 100
LI/II-15%FA
LI/II-20%S -15%FA
3-day
7-day
14-day
40
Temperature ( °F)
Com
pres
sive
Str
engt
h (p
si)
0
2,000
4,000
6,000
8,000
10,000
50 60 70 80 90 100
LI/II-15%FA
LI/II-20%S -15%FA
LI/II-15%FA
LI/II-20%S -15%FA
3-day
7-day
14-day
40
Temperature (°F)
3-da
y C
ompr
essi
ve S
tren
gth
(psi
)
50 60 70 80 90 10040
0
2,000
4,000
6,000
HI-15%FA
HI-20%S-15%FA
HI-25%S-15%FAHI-35%S-15%FA
3,000
5,000
1,000
Temperature (°F)
3-da
y C
ompr
essi
ve S
tren
gth
(psi
)
50 60 70 80 90 10040
0
2,000
4,000
6,000
HI-15%FA
HI-20%S-15%FA
HI-25%S-15%FAHI-35%S-15%FA
HI-15%FA
HI-20%S-15%FA
HI-25%S-15%FAHI-35%S-15%FA
3,000
5,000
1,000
27
In contrast to Figure 3.19, Figure 3.20 demonstrates the effects of curing temperature on mortar strength at given ages. As observed in Figure 4.20 (a), at a low curing temperature (50°F), the 3-day strength of Holcim ternary cement concrete was approximate 70% of that of binary cement concrete. In order to reach a 3-day strength of 3,500 psi, the mortar made with Holcim binary cement required a curing temperature of 60°F or higher. However, the mortars made with Holcim ternary cements, HI-15%FA-(20, 25, and 35)%S, required curing temperatures of equal or higher to 65°F, 67°F, and 72°F, respectively. This research result may help the pavement industry in establishing guidelines or specifications for curing temperature management of SCM concrete construction.
Figures 3.21 and 3.22 present the strength of concrete made with Holcim and Lafarge cements were cured at a cold weather condition (50°F). Different from mortar test results, Figure 3.21 shows the differences in strength between the concretes made with different levels of slag replacement in ternary cements at the cold curing temperature–the strength reduced as SCM content increased at 7, 10, and 14 days. It is observed that at 3 days, concrete made with Holcim binary cement (HI-15%fly ash) had lower strength than the concrete made with a ternary cement (HI-15%FA-20%S). This is not true for Holcim mortars or for the concrete made with Lafarge cements. Except for the 3-day strength, the trend of SCM effects on concrete strength was similar to that on the corresponding mortar strength, which is consistent with the linear correlation between concrete and mortar strength. Further research is needed to verify the effect of SCMs on early age (3-day) concrete strength.

28
0
1,000
2,000
3,000
4,000
5,000
6,000
0 2 4 6 8 10 12 14 16
Age (days)
Com
pres
sive
Str
engt
h (p
si)
Holcim IH I+15%FAH I+20%S+15%FAH I+25%S+15%FAH I+35%S+15%FA
Figure 3.21. Concrete strength (Holcim cements at 50°F)
0
1,000
2,000
3,000
4,000
5,000
6,000
0 2 4 6 8 10 12 14 16
Age (days)
Com
pres
sive
Str
engt
h (p
si)
L I/II
L I/II-15%F
L I/II-20%S-15%F
Figure 3.22. Concrete strength (Lafarge cements at 50°F)
29
3.4. Heat of Hydration
OPC hydration is an exothermal process that generates significant heat. The heat from cement hydration may benefit concrete strength development by providing concrete with a higher curing temperature, especially during construction in winter conditions. The rate and amount of heat liberated from cement hydration greatly depends on cement chemical compositions, finesse, concrete mix proportions, and curing temperature. It is believed that the heat signature, a temperature-time curve, is the “fingerprint” of the cement hydration process in concrete.
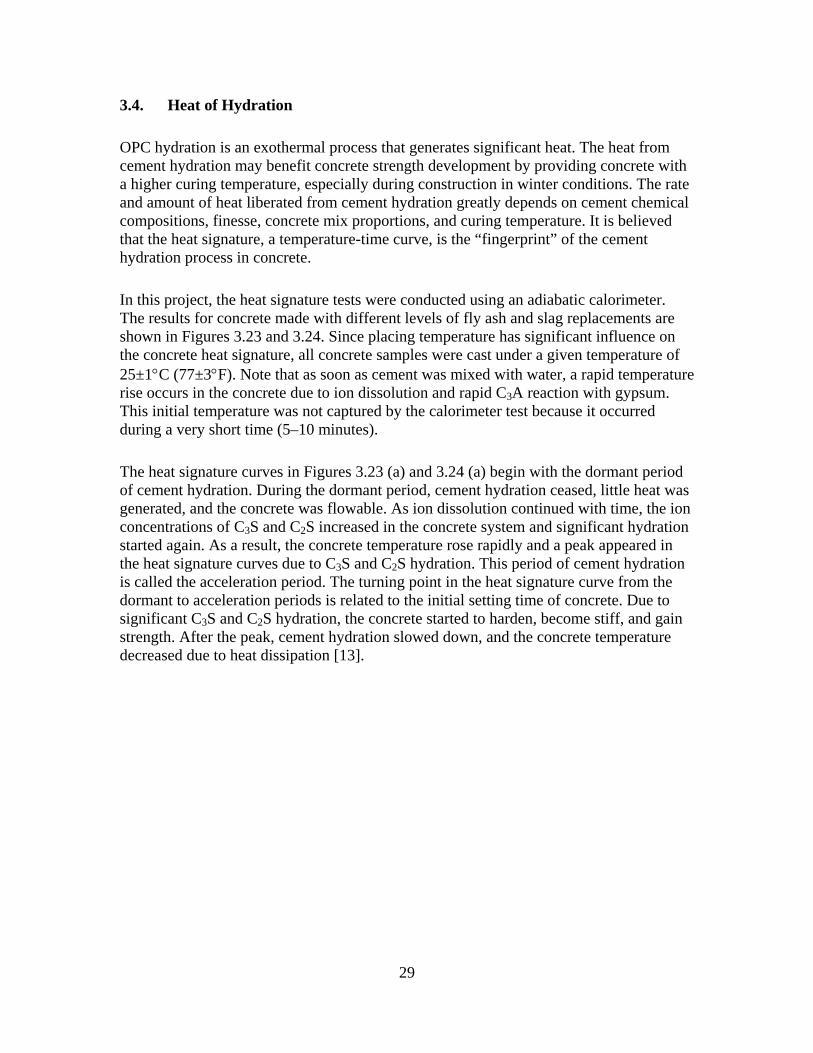
In this project, the heat signature tests were conducted using an adiabatic calorimeter. The results for concrete made with different levels of fly ash and slag replacements are shown in Figures 3.23 and 3.24. Since placing temperature has significant influence on the concrete heat signature, all concrete samples were cast under a given temperature of 25±1°C (77±3°F). Note that as soon as cement was mixed with water, a rapid temperature rise occurs in the concrete due to ion dissolution and rapid C3A reaction with gypsum. This initial temperature was not captured by the calorimeter test because it occurred during a very short time (5–10 minutes).
The heat signature curves in Figures 3.23 (a) and 3.24 (a) begin with the dormant period of cement hydration. During the dormant period, cement hydration ceased, little heat was generated, and the concrete was flowable. As ion dissolution continued with time, the ion concentrations of C3S and C2S increased in the concrete system and significant hydration started again. As a result, the concrete temperature rose rapidly and a peak appeared in the heat signature curves due to C3S and C2S hydration. This period of cement hydration is called the acceleration period. The turning point in the heat signature curve from the dormant to acceleration periods is related to the initial setting time of concrete. Due to significant C3S and C2S hydration, the concrete started to harden, become stiff, and gain strength. After the peak, cement hydration slowed down, and the concrete temperature decreased due to heat dissipation [13].
30
Time (hrs)
Tem
pera
ture
(C
)
20
25
30
35
40
45
50
0 1 10 100 1,000
HIHI-15%FAHI-30%FAHI-45%FA
(a) Concrete temperature
-
1
2
3
4
5
6
7
8
1 10 100Time (hrs)
Rat
e of
AR
T(
C/h
r)
HIHI-15%FAHI-30%FAHI-45%FA
(b) Rate of adiabatic temperature rise
Figure 3.23. Effect of fly ash on binary cement concrete heat signature
31
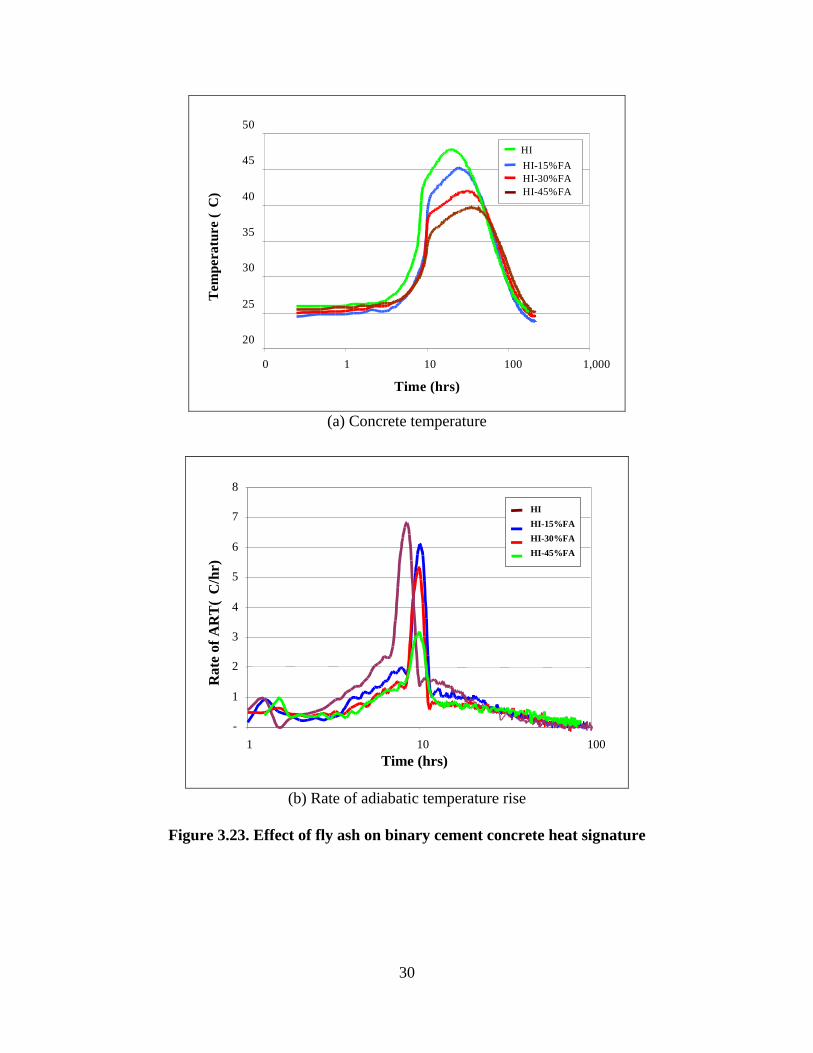
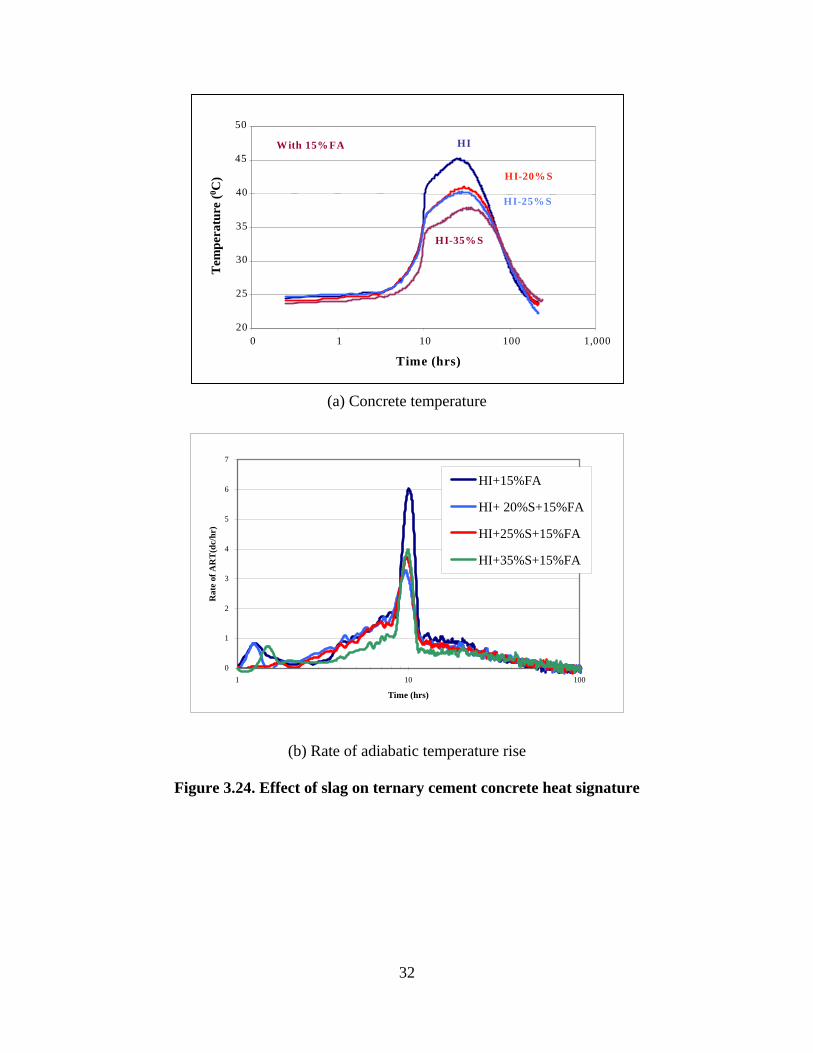
Figure 3.23 (a) shows the effect of fly ash on the temperature of concrete made with Holcim Type I cement. As observed in the figure, the maximum temperature of concrete decreases with the amount of fly ash replacement. The length of the dormant period of the concrete, related to the initial set time, increased due to the fly ash replacement. However, the amount of fly ash replacement seemed to have little effect on the initial set time possibly due to the combination effect of particle packing and reactivity of the CMs in the concrete. As shown in Figure 3.23 (b), the peak of the rate of adiabatic temperature rise (ATR) of concrete containing fly ash was delayed for about 1.5 hours compared with that of concrete without fly ash. It is believed that increased set time due to fly ash replacement is related to the reduced water demand of fly ash concrete [14]. Further research is needed to verify the effect of fly ash replacement level on concrete set time. Figures 3.24 (a) and (b) show the effect of the additional slag on the heat of hydration. Similar to fly ash replacement, slag replacement also decreased the maximum temperature of the concrete. In contrast, slag replacement did not postpone the dormant period during cement hydration. The time for slag concrete to reach the peak rate of ATR stayed unchanged or decreased slightly compared with that of the concrete without slag. These results suggest that slag replacement does not delay, but may slightly accelerate, initial concrete set time. This finding is consistent with cement/concrete set time test results.
32
(a) Concrete temperature
0
1
2
3
4
5
6
7
1 10 100
Time (hrs)
Rat
e of
AR
T(d
c/hr
)
HI+15%FA
HI+ 20%S+15%FA
HI+25%S+15%FA
HI+35%S+15%FA
(b) Rate of adiabatic temperature rise
Figure 3.24. Effect of slag on ternary cement concrete heat signature
20
25
30
35
40
45
50
0 1 10 100 1,000
Time (hrs)
Tem
pera
ture
(0 C)
HI
HI-20%S
HI-25% S
HI-35%S
With 15% FA
33
3.5. Datum Temperature and Activation Energy
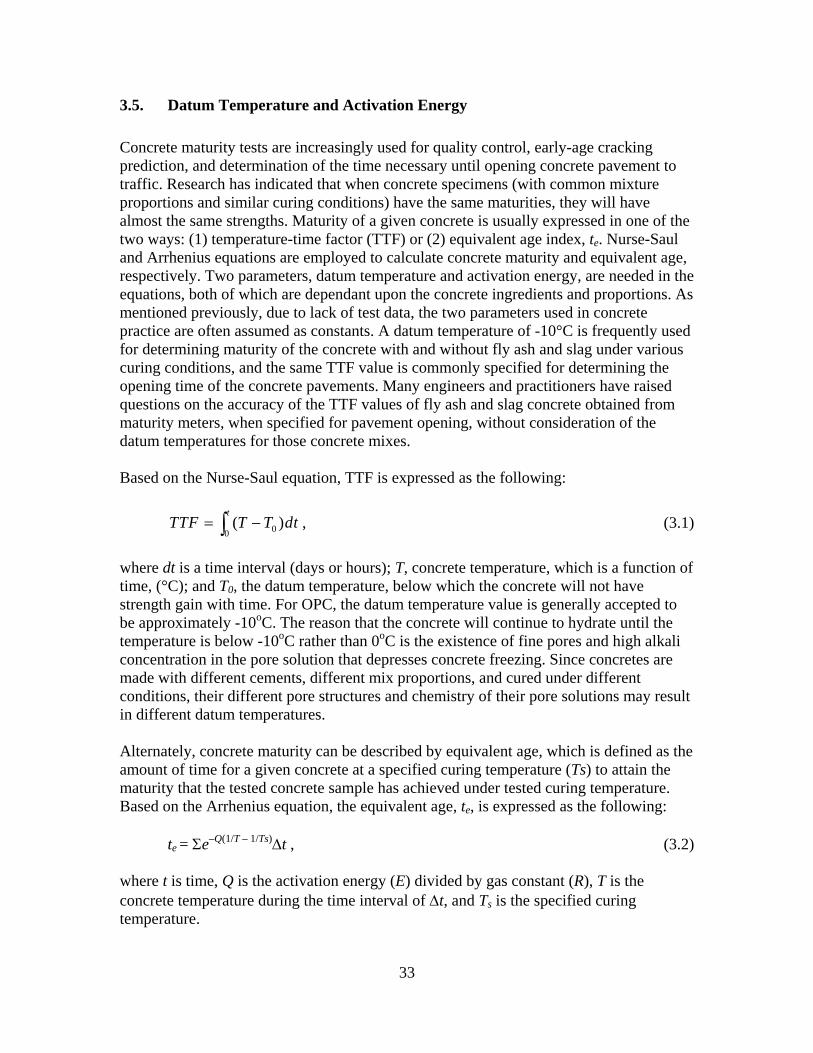
Concrete maturity tests are increasingly used for quality control, early-age cracking prediction, and determination of the time necessary until opening concrete pavement to traffic. Research has indicated that when concrete specimens (with common mixture proportions and similar curing conditions) have the same maturities, they will have almost the same strengths. Maturity of a given concrete is usually expressed in one of the two ways: (1) temperature-time factor (TTF) or (2) equivalent age index, te. Nurse-Saul and Arrhenius equations are employed to calculate concrete maturity and equivalent age, respectively. Two parameters, datum temperature and activation energy, are needed in the equations, both of which are dependant upon the concrete ingredients and proportions. As mentioned previously, due to lack of test data, the two parameters used in concrete practice are often assumed as constants. A datum temperature of -10°C is frequently used for determining maturity of the concrete with and without fly ash and slag under various curing conditions, and the same TTF value is commonly specified for determining the opening time of the concrete pavements. Many engineers and practitioners have raised questions on the accuracy of the TTF values of fly ash and slag concrete obtained from maturity meters, when specified for pavement opening, without consideration of the datum temperatures for those concrete mixes. Based on the Nurse-Saul equation, TTF is expressed as the following:
00( )
tTTF T T dt= −∫ , (3.1)
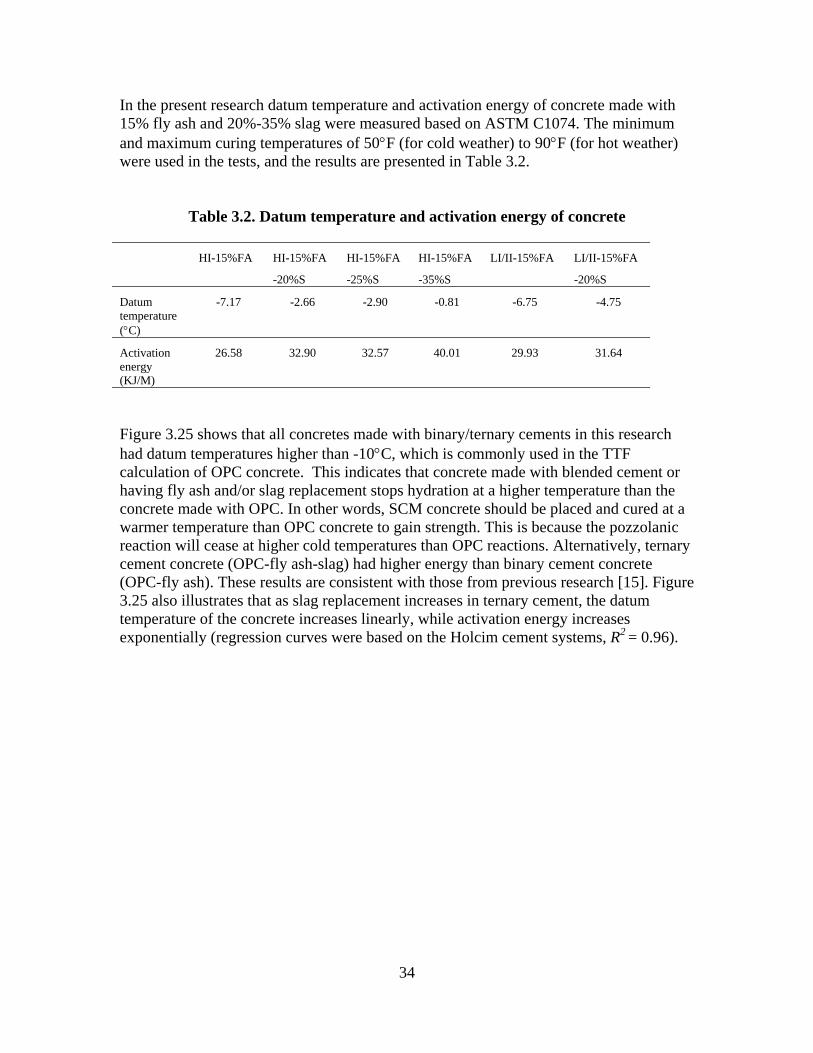
where dt is a time interval (days or hours); T, concrete temperature, which is a function of time, (°C); and T0, the datum temperature, below which the concrete will not have strength gain with time. For OPC, the datum temperature value is generally accepted to be approximately -10oC. The reason that the concrete will continue to hydrate until the temperature is below -10oC rather than 0oC is the existence of fine pores and high alkali concentration in the pore solution that depresses concrete freezing. Since concretes are made with different cements, different mix proportions, and cured under different conditions, their different pore structures and chemistry of their pore solutions may result in different datum temperatures. Alternately, concrete maturity can be described by equivalent age, which is defined as the amount of time for a given concrete at a specified curing temperature (Ts) to attain the maturity that the tested concrete sample has achieved under tested curing temperature. Based on the Arrhenius equation, the equivalent age, te, is expressed as the following:
te = Σe–Q(1/T – 1/Ts)∆t , (3.2)
where t is time, Q is the activation energy (E) divided by gas constant (R), T is the concrete temperature during the time interval of ∆t, and Ts is the specified curing temperature.
34
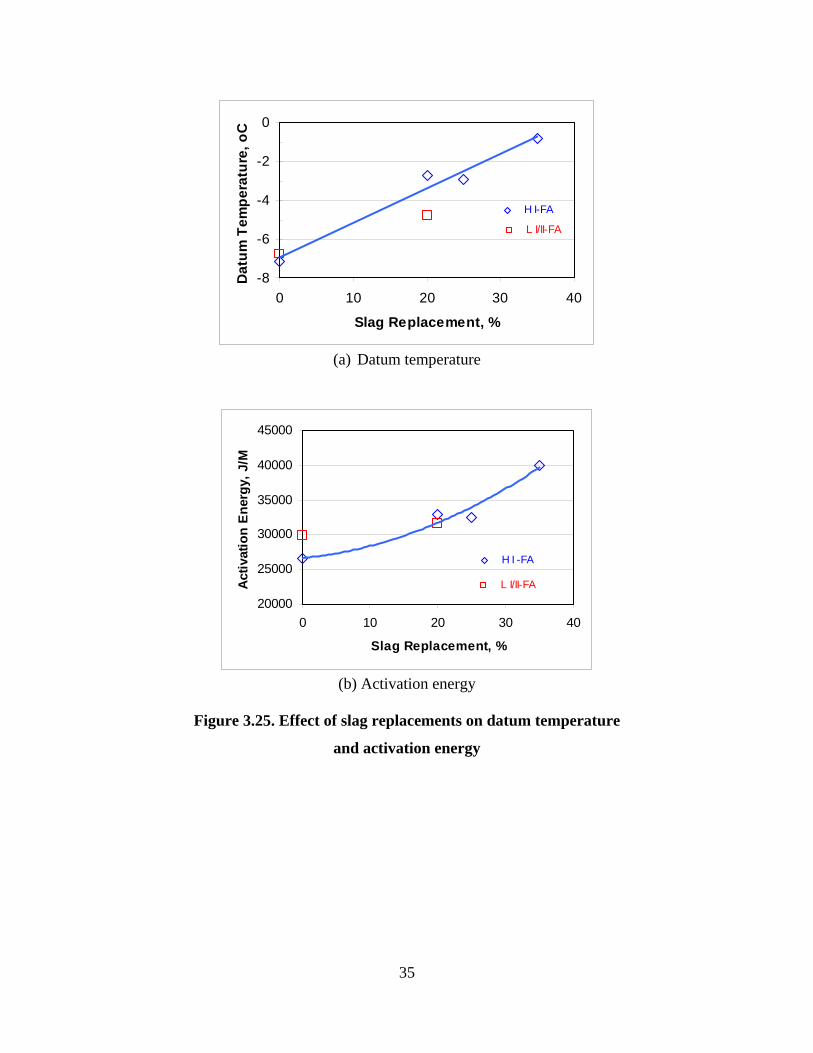
In the present research datum temperature and activation energy of concrete made with 15% fly ash and 20%-35% slag were measured based on ASTM C1074. The minimum and maximum curing temperatures of 50°F (for cold weather) to 90°F (for hot weather) were used in the tests, and the results are presented in Table 3.2.
Table 3.2. Datum temperature and activation energy of concrete
HI-15%FA HI-15%FA
-20%S
HI-15%FA
-25%S
HI-15%FA
-35%S
LI/II-15%FA LI/II-15%FA
-20%S
Datum temperature (°C)
-7.17 -2.66 -2.90 -0.81 -6.75 -4.75
Activation energy (KJ/M)
26.58 32.90 32.57 40.01 29.93 31.64
Figure 3.25 shows that all concretes made with binary/ternary cements in this research had datum temperatures higher than -10°C, which is commonly used in the TTF calculation of OPC concrete. This indicates that concrete made with blended cement or having fly ash and/or slag replacement stops hydration at a higher temperature than the concrete made with OPC. In other words, SCM concrete should be placed and cured at a warmer temperature than OPC concrete to gain strength. This is because the pozzolanic reaction will cease at higher cold temperatures than OPC reactions. Alternatively, ternary cement concrete (OPC-fly ash-slag) had higher energy than binary cement concrete (OPC-fly ash). These results are consistent with those from previous research [15]. Figure 3.25 also illustrates that as slag replacement increases in ternary cement, the datum temperature of the concrete increases linearly, while activation energy increases exponentially (regression curves were based on the Holcim cement systems, R2 = 0.96).
35
H I-FA
L I/II-FA
-8
-6
-4
-2
0
0 10 20 30 40
Slag Replacement, %
Dat
um T
empe
ratu
re, o
C
(a) Datum temperature
H I -FA
L I/II-FA
20000
25000
30000
35000
40000
45000
0 10 20 30 40
Slag Replacement, %
Act
ivat
ion
Ene
rgy,
J/M
(b) Activation energy
Figure 3.25. Effect of slag replacements on datum temperature
and activation energy
36
3.6. Concrete Maturity and Strength-Maturity Correlations
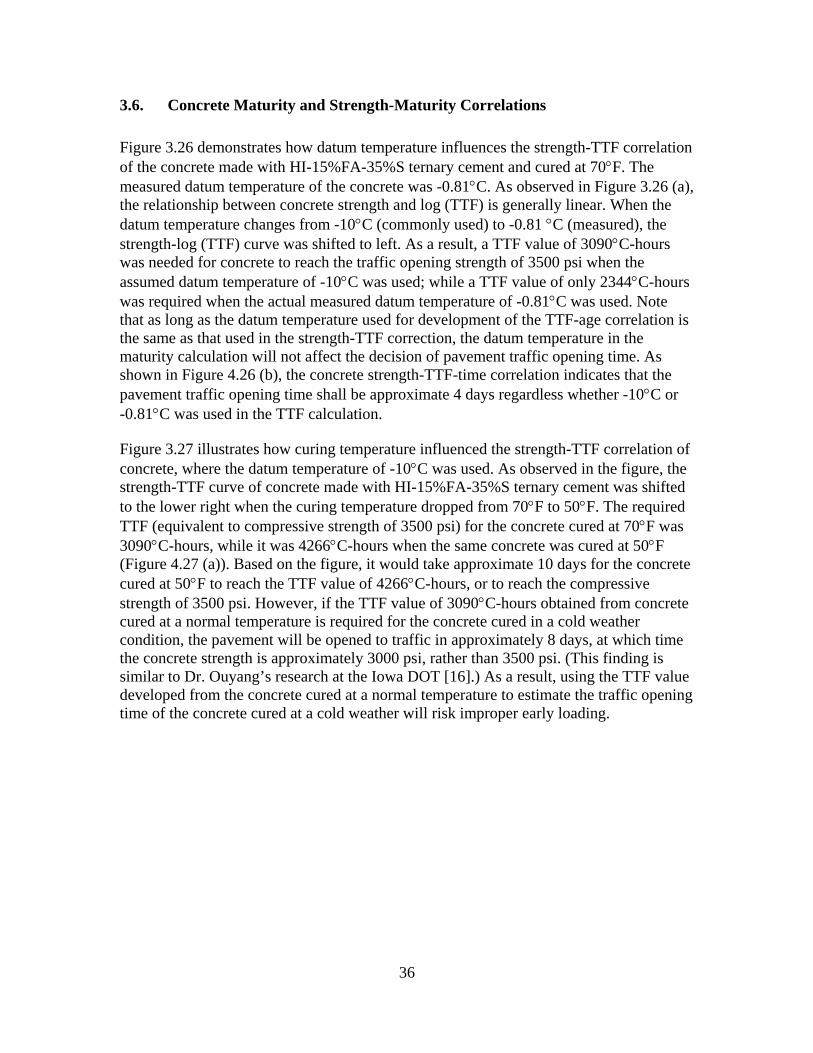
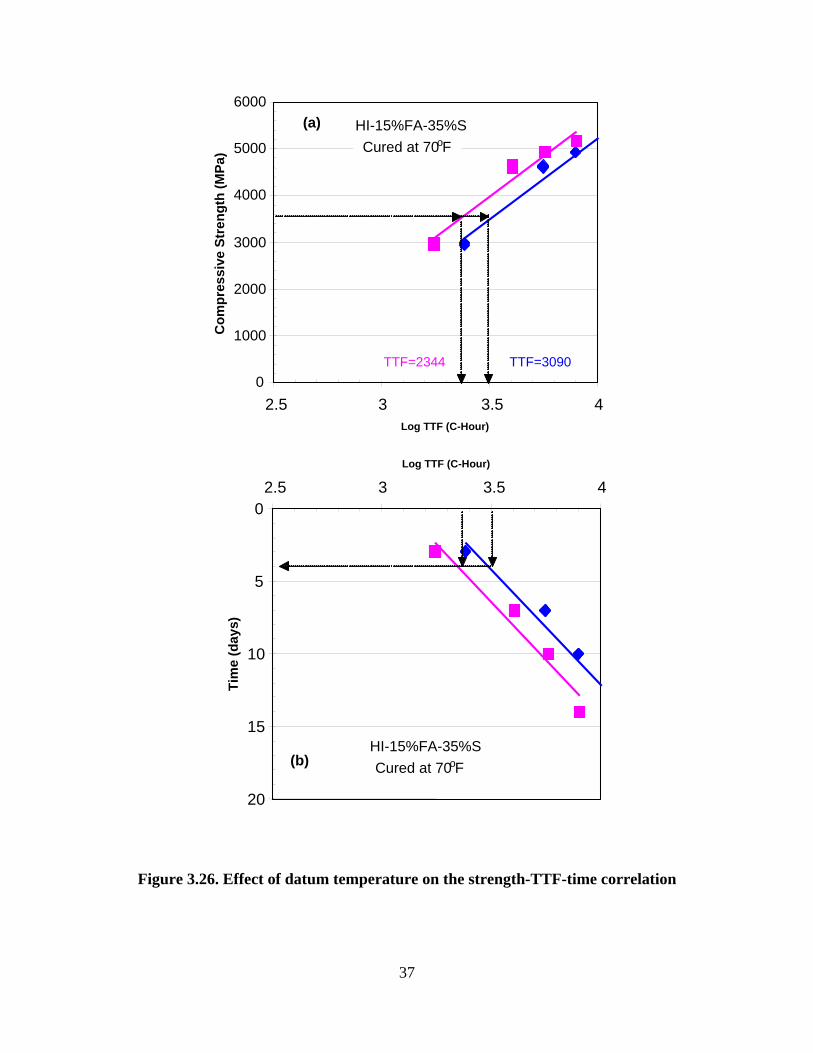
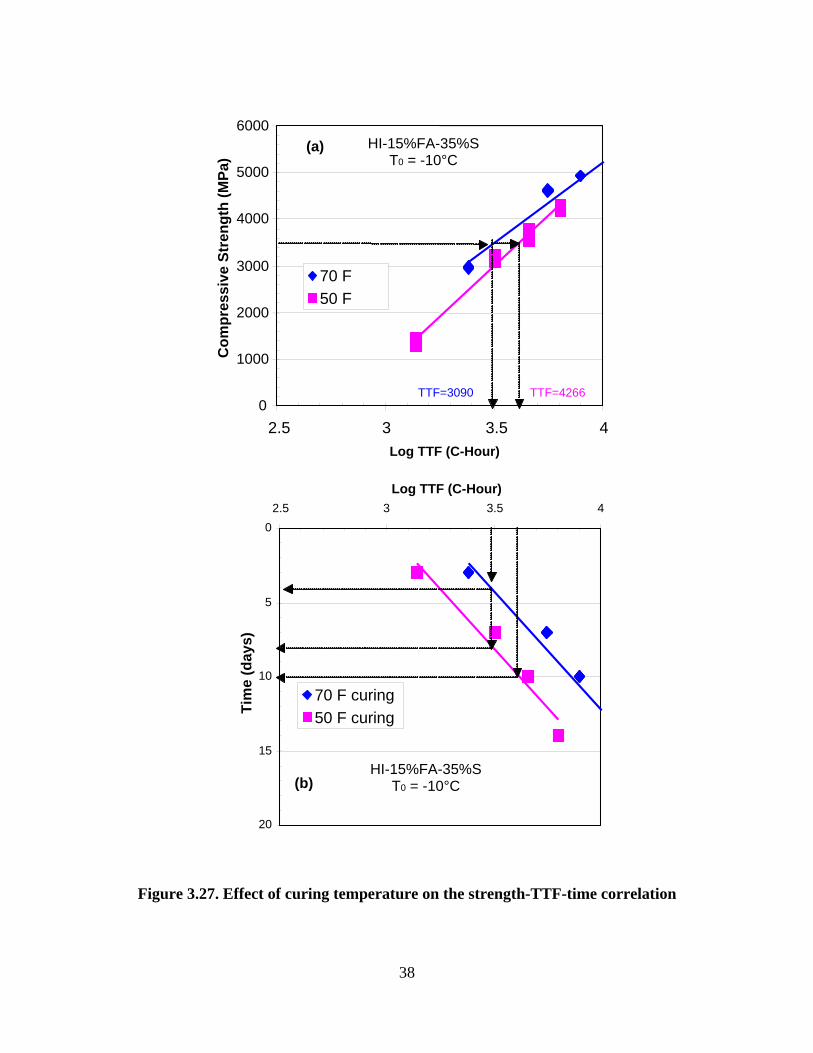
Figure 3.26 demonstrates how datum temperature influences the strength-TTF correlation of the concrete made with HI-15%FA-35%S ternary cement and cured at 70°F. The measured datum temperature of the concrete was -0.81°C. As observed in Figure 3.26 (a), the relationship between concrete strength and log (TTF) is generally linear. When the datum temperature changes from -10°C (commonly used) to -0.81 °C (measured), the strength-log (TTF) curve was shifted to left. As a result, a TTF value of 3090°C-hours was needed for concrete to reach the traffic opening strength of 3500 psi when the assumed datum temperature of -10°C was used; while a TTF value of only 2344°C-hours was required when the actual measured datum temperature of -0.81°C was used. Note that as long as the datum temperature used for development of the TTF-age correlation is the same as that used in the strength-TTF correction, the datum temperature in the maturity calculation will not affect the decision of pavement traffic opening time. As shown in Figure 4.26 (b), the concrete strength-TTF-time correlation indicates that the pavement traffic opening time shall be approximate 4 days regardless whether -10°C or -0.81°C was used in the TTF calculation. Figure 3.27 illustrates how curing temperature influenced the strength-TTF correlation of concrete, where the datum temperature of -10°C was used. As observed in the figure, the strength-TTF curve of concrete made with HI-15%FA-35%S ternary cement was shifted to the lower right when the curing temperature dropped from 70°F to 50°F. The required TTF (equivalent to compressive strength of 3500 psi) for the concrete cured at 70°F was 3090°C-hours, while it was 4266°C-hours when the same concrete was cured at 50°F (Figure 4.27 (a)). Based on the figure, it would take approximate 10 days for the concrete cured at 50°F to reach the TTF value of 4266°C-hours, or to reach the compressive strength of 3500 psi. However, if the TTF value of 3090°C-hours obtained from concrete cured at a normal temperature is required for the concrete cured in a cold weather condition, the pavement will be opened to traffic in approximately 8 days, at which time the concrete strength is approximately 3000 psi, rather than 3500 psi. (This finding is similar to Dr. Ouyang’s research at the Iowa DOT [16].) As a result, using the TTF value developed from the concrete cured at a normal temperature to estimate the traffic opening time of the concrete cured at a cold weather will risk improper early loading.
37
Figure 3.26. Effect of datum temperature on the strength-TTF-time correlation
HI-15%FA-35%SCured at 70 oF
0
1000
2000
3000
4000
5000
6000
2.5 3 3.5 4 Log TTF (C-Hour)
Com
pres
sive
Str
engt
h (M
Pa)
TTF=3090 TTF=4266
(a)
TTF=3090 TTF=2344
HI-15%FA-35%SCured at 70 oF
0
5
10
15
20
2.5 3 3.5 4 Log TTF (C-Hour)
Tim
e (d
ays)
(b)
38
HI-15%FA-35%ST0 = -10°C
0
1000
2000
3000
4000
5000
6000
2.5 3 3.5 4 Log TTF (C-Hour)
Com
pres
sive
Str
engt
h (M
Pa)
70 F 50 F
TTF=3090 TTF=4266
(a)
HI-15%FA-35%ST0 = -10°C
0
5
10
15
20
2.5 3 3.5 4 Log TTF (C-Hour)
Tim
e (d
ays)
70 F curing 50 F curing
(b)
Figure 3.27. Effect of curing temperature on the strength-TTF-time correlation
39
3.7. HIPERPAVE Analysis
The early-age behavior of concrete pavement is very important to the service life of the pavement. Concrete pavements are significantly affected by temperature and moisture changes during the first 72 hours after paving. Stresses due to temperature and moisture gradients in concrete slab often cause pavement curling and warping. Under restraint conditions, the stresses may cause concrete to crack. The HIPERPAV (High Performance Paving) computer program was developed by the Transtec Group, Inc. for the Federal Highway Administration. It was used in this project to assess the effect of the fly ash and slag on the early-age behavior of concrete pavements. The program considers the structural design, concrete materials, properties, and mix proportions as well as environmental and construction conditions in its inputs. The structural inputs include subbase type, slab-base friction, transverse joint spacing, and slab thickness. The material properties consist of concrete tensile strength, modulus of elasticity, and strength development. The material and mix proportion information contains OPC type, cement chemistry and content, type and content of supplementary cementitious materials, water content, coarse aggregate type, and content, fine aggregate content, and chemical admixture type and amount (water reducer, superplasticizer, retarder, and accelerator). Environmental inputs include air temperature, relative humidity distribution conditions, and wind speed. Construction inputs consider the curing method, time of curing application, times of construction and saw cutting, initial concrete mixture temperature, and subbase temperature.
The environmental conditions, typical 3-day air temperature curves of spring, summer, and fall in Des Moines, Iowa, were used as shown in Figure 3.28. The chemistry of Holcim Type I cement was input (see Table 3.1), and 15% fly ash and 0%, 20%, 25%, and 35% slag replacement was considered. A 12-inch thick, 12-foot wide concrete slab with transverse joint spacing of 15 feet on a 6-inch thick unbound aggregate subbase with a K-value of 200 psi/inch was selected. It was assumed that the single-layer liquid curing compound was applied at a half hour after the paving. The joints were cut at the optimum time.

40
Figure 3.28. Typical air temperatures in the Des Moines, Iowa, area
Table 3.3. Cracking potential of concrete made with binary/ternary cements
Minimum difference between strength and stress (psi)
Season HI-15%FA HI-20%S-15%FA HI-25%S-15%FA HI-35%S-15%FA
Spring 21.3 14.6 11.3 6.2
Summer 37.7 30.0 26.9 23
Fall 30.9 18.1 17.1 31
Figures 3.29–3.31 and Table 3.3 show the results from the HIPERPAV analyses. As observed from the figures, in summer (Figure 3.29), the rate of concrete strength development is desirable, and the stresses developed in the concrete due to thermal and moisture changes are relatively low partially because of the small difference in temperature between the surface and internal concrete. As a result, concrete strength is always higher than the stress within 3 days after paving, and the minimum difference between concrete strength and stress is relatively large (23~37.7 psi, depending on the amount of slag replacement in cement; see Table 3.3). Therefore, based on the HIPERPAV analysis, cracking is not would likely occur in these concrete pavements within 3 days after paving.
0
20
40
60
80
100
0 10 20 30 40 50 60 70 80
Time (hr)
Tem
pera
ture
(0 F)
Summer
Spring
Fall
(noon)
0
20
40
60
80
100
0 10 20 30 40 50 60 70 80
Time (hr)
Tem
pera
ture
(0 F)
Summer
Spring
Fall
(noon)
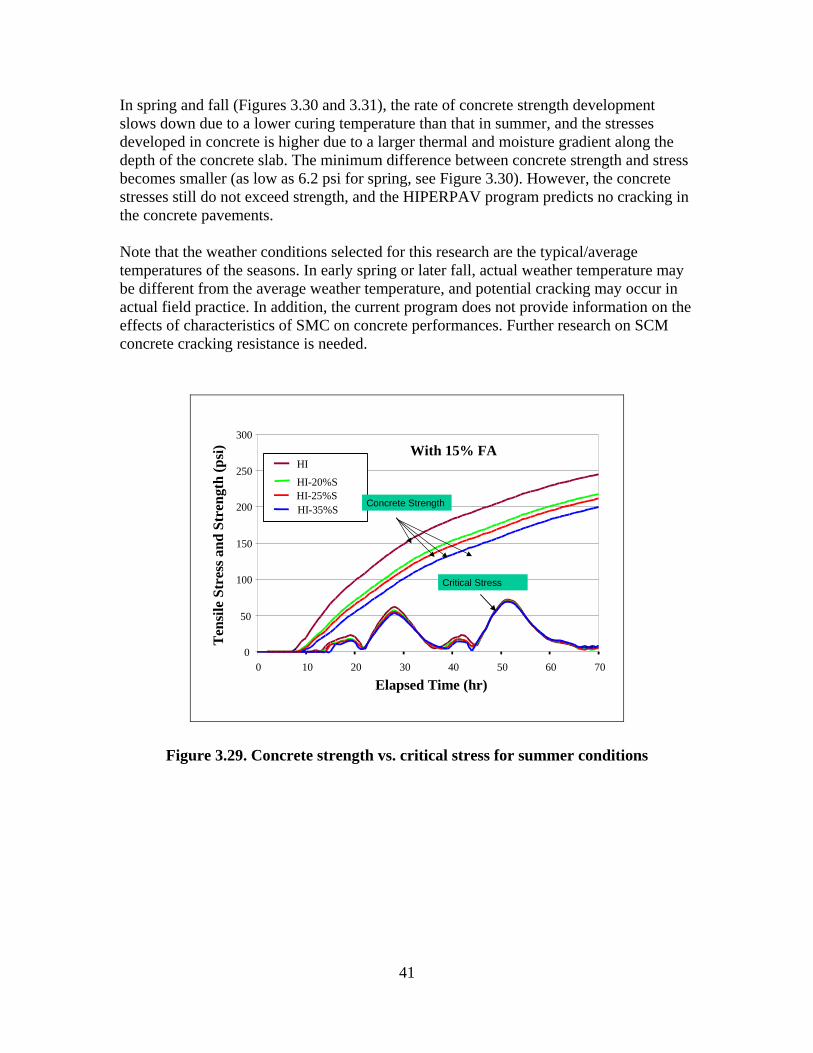
41
In spring and fall (Figures 3.30 and 3.31), the rate of concrete strength development slows down due to a lower curing temperature than that in summer, and the stresses developed in concrete is higher due to a larger thermal and moisture gradient along the depth of the concrete slab. The minimum difference between concrete strength and stress becomes smaller (as low as 6.2 psi for spring, see Figure 3.30). However, the concrete stresses still do not exceed strength, and the HIPERPAV program predicts no cracking in the concrete pavements. Note that the weather conditions selected for this research are the typical/average temperatures of the seasons. In early spring or later fall, actual weather temperature may be different from the average weather temperature, and potential cracking may occur in actual field practice. In addition, the current program does not provide information on the effects of characteristics of SMC on concrete performances. Further research on SCM concrete cracking resistance is needed.
Elapsed Time (hr)
With 15% FA
0
50
100
150
200
250
300
0 10 20 30 40 50 60 70
Ten
sile
Str
ess a
nd S
tren
gth
(psi
)
HI
HI-20%S
HI-35%SHI-25%S
Critical Stress
Concrete Strength
Figure 3.29. Concrete strength vs. critical stress for summer conditions

42
Elapsed Time (hr)
Ten
sile
Str
ess a
nd S
tren
gth
(psi
)
0
50
100
150
200
250
300
0 10 20 30 40 50 60 70
HI
HI-20%S
HI-35%SHI-25%S
With 15% FA
Figure 3.30. Concrete strength vs. critical stress for spring conditions
Elapsed Time (hr)
Ten
sile
Str
ess a
nd S
tren
gth
(psi
)
0
50
100
150
200
250
300
0 10 20 30 40 50 60 70
HI
HI-20%S
HI-35%S
HI-25%S
With 15% FA
Figure 3.31. Concrete strength vs. critical stress for fall conditions
43
4. CONCLUSIONS AND RECOMMENDATIONS
4.1. Conclusions
Set time, compressive strength, heat of hydration, datum temperature, activation energy, and maturity of mortar/concrete made with various slag-blended cements, together with 15% fly ash replacement, were investigated in this report. The following conclusions are drawn based on the test results:
1. Fly ash replacement in binary cements generally reduced the water requirement, while slag replacements for OPC appeared to increase the water requirement for a given consistency (see Figures 3.9 and 3.10). This implies that when used alone, fly ash can function as a water reducing agent, but GGBFS cannot. As a result, if slag and fly ash are used together, such ternary cement concrete may have the same flowability as OPC concrete.
2. Fly ash replacement in binary cements generally increased paste/concrete setting
time in spite of the type of clinker used, while slag replacement in ternary cements could either increase or decrease the set time depending on the type of clinker used. Two opposite trends were found in the present research that indicated the effects of different clinkers in slag-blended cement on concrete set time. Holcim slag in Holcim ternary cements did not delay paste/concrete set time, but in fact reduced the extended set times caused by fly ash. In comparison, when the Lafarge slag-blended cement (20% slag) was used together with 15% fly ash, the set time of the ternary cement consistently increased with increased SCM content, as shown in Figures 3.9 and 3.10.
3. The curing temperature has significant influence on SCM concrete performance.
When the curing temperature dropped from 70°F to 50°F, the set times of the concrete with binary cements more than doubled, as did the set times of the concrete with ternary cements. When curing temperature rose from 70°F to 90°F, the set times of these mixtures decreased only about 10%–15% (see Figures 3.11 and 3.12). The decreases in set times of binary/ternary cement concrete were comparable with or less than that of OPC concrete. This indicates that binary/ternary cement concrete will have equal or less slump loss to/than OPC concrete under a hot weather, which permits a sufficient time for concrete placing and finishing.
4. To reach a given early-age strength, ternary cement mortar/concrete generally
required either a longer curing time under a given curing temperature or a higher curing temperature for a given curing time than binary cement mortar/concrete. As SCM content increases, a longer curing time or higher curing temperature was needed (Figures 3.19 and 3.20). In this research, there is a good correlation between the strength of the mortars and concrete tested.
44
5. At a high curing temperature (90°F), mortars made with ternary cements all had comparable strength (within 10% difference) to those made with binary cements at the age of about 7 days. Due to the accelerated pozzolanic reaction, a mortar made with ternary cement, HI-15%FA-20%S, displayed higher strength than the mortar made with binary cement at about 14 days.
6. Concrete heat signature curves illustrated that the maximum heat of cement
hydration in binary/ternary cement concrete decreased with the amount of SCM replacements. As a result, SCM concrete generally has a lower risk of thermal cracking than OPC concrete (Figures 3.23 and 3.24).
7. The datum temperature and activation energy of concrete increased with the
amount of fly ash and slag replacements. However, the use of a different datum temperature in the concrete time-temperature factor (TTF) calculation appeared not to influence the determination of pavement traffic opening time as long as a proper strength-TTF-time correlation was employed (Figures 4.25 and 4.26).
8. Using the TTF requirement based on the strength-TTF correlation developed at
normal weather conditions (70°F) to determine the pavement traffic opening time for the concrete cured at a cold weather (50°F) could result in improper early opening of the pavement (Figure 3.27).
9. Based on the HIPERPAV program analysis, under typical spring, summer, or fall
weather conditions in the Des Moines area, concrete made with 15% fly ash and 20%–35% slag replacement would have no early-age cracking potential. However, in spring or fall, the stresses developed in the concrete become much closer to the strength developed in the concrete, indicating a higher risk of cracking than the concrete cast in summer (Table 4.3).
4.2. Recommendations
Based on the research findings above, the following recommendations are proposed for the proper use of blended cements in concrete pavement and future research:
1. This research has demonstrated two opposite trends in the set time of concrete made by the Holcim and Lafarge slag-blended cements. The different cement setting behavior may influence determination of pavement finishing and saw cutting time. Further research is needed to study the setting behaviors of binary/ternary cements from other sources/suppliers and to find out the dominant trends for commonly used slag-blended cements. Variations in chemical and physical characteristics of the CMs from different sources (such as Lehigh and other cement plants) or the CMs from the same source but manufactured at different times throughout a whole year will be evaluated in the future.
2. Flowability of SCM concrete was not studied in this research although
consistency tests were performed for SCM pastes. The research has indicated that
45
addition of GGBSF tends to reduce paste flowability. Further research may be needed to study the effects of slag type and replacement level on concrete flow property. Fly ash and/or a water reducing agent may be used together with slag replacement (≥20%) in concrete to obtain better flow. Compatibility of water replacement agents for various binary and ternary cements shall also be examined.
3. Due to the effect of curing temperature on pozzolanic reaction, covering slabs to
trap heat, extending curing time, and/or using accelerators is recommended for SCM concrete paving at a cold weather conditions. Guidelines/specifications for curing temperature management, rather than a cut-off date, may be established for the use of SCM concrete in pavement.
4. The required TTF value to open pavement to traffic should be specified based on
the strength-maturity correlation of the field concrete materials and mix proportions under the field curing conditions. A consistent datum temperature (regardless if it is commonly used or measured) should be used in development of the strength-TTF correlation and the TTF-time correlation to determine the traffic opening time of pavement.
5. Effects of SCMs and their compatibility with other chemical admixtures on
concrete air void systems and long-term durability are very important. To reduce the problems related to the use of SCM in concrete, more research is needed to further study the cracking resistance and durability of SCM concrete. In addition, the performance of concrete made with a high volume of fly ash and slag could also be explored for future concrete pavements.

46
REFERENCES
1. Detwiler, R. J., J. I. Bhatty, and S. Bhattacharja. Supplementary Cementing Materials for Use in Blended Cements. PCA Research and Development Bulletin RD112T. Portland Cement Association, 1996.
2. Strategic Development Council. Roadmap 2030: The U.S. Concrete Industry Technology Roadmap. Strategic Development Council, December 2002
3. QCL Group. The Role of Gypsum in Cement. QCL Group Technical Notes. QCL Group, March 1999.
4. Blaine, R. Determination of Calcium Sulfate Hydrates in Building Materials Using Thermal Analysis. American Laboratory, Vol. 27, No. 14, September 1995.
5. Malhotra, V. M., and A. A. Ramezanianpour. Fly Ash in Concrete, 2nd Edition. CANMET MSL 94-45 (IR). 1994, pp. 67-72.
6. Carette, G. G., and V. M. Malhotra. Characterization of Canadian Fly Ashes and Their Relative Performance in Concrete. Energy, Mines and Resources. CANMET Report 86-6E. Ottawa, Ontario, Canada, 1986.
7. Rosenberg, A. Using Fly Ash in Concrete. Magazine of National Precast Concrete Association, June 2000.
8. Watt, J. D., and D. J. Thorne. Composition and Pozzolanic Properties of Pulverized Fuel Ashes, I: Composition of Fly Ashes from British Power Stations and Properties of their Component Particles. Journal of Applied Chemistry, Vol. 15, 1965, pp. 585-594.
9. Philleo, R. E. Recent Developments in Pozzolan Specifications (Supplementary Paper 27). Proceedings, 2nd International Conference on the Use of Fly Ash, Silica Fume, Slag, and Natural Pozzolans in Concrete. Madrid, Spain, April 21-25, 1986.
10. Shih, P-H., J-E Chang, and L-C Chiang. Replacement of Raw Mix in Cement Production by Municipal Solid Waste Incineration Ash. Cement and Concrete Research, Vol. 33, No. 9, pp. 1831-1836, 2003.
11. Eren, O., J. J. Brooks, and T. Celik. Setting Times of Fly Ash and Slag-Cement Concrete as Affected by Curing Temperature. Cement, Concrete and Aggregates, CCAGDP, Vol. 17, No 1, June 1995, pp. 11-47.
12. Escalante-Farcia, J. I., and J. H. Sharp. Effect of Temperature on the Hydration of the Main Clinker Phases in Portland Cement: Part II, Blended Cements. Cement and Concrete Research, Vol. 28, 1998, pp. 1259-1274.
13. Hanson, T., K. Wang, and D. Harrington. Formation and Characteristics of Portland Cement Concrete Pavement: The Basics. Concrete Paving Notes, Materials No. 1. Center for Portland Cement Concrete Pavement Technology, Iowa State University, Ames, Iowa, June 2002.
14. M. I. Sánchez de Rojas, M. P. Luxán, M. Frías and N. García. The Influence of Different Additions on Portland Cement Hydration. Cement and Concrete Research, Vol. 23, 1993, pp. 46-54.
15. Ma, W., D. Sample, R. Martin, and P.W. Brown. Calorimetric Study of Cement Blends Containing Fly Ash, Silica Fume, and Slag at Elevated Temperatures, Cement Concrete and Aggregates, p. 93-99, 1994.
47
16. Ouyang, C. “Maturity and Set Times for Low Temperature Concrete,” presentation at the Blended Cement Project meeting, the Center for Portland Cement Concrete Pavement Technology, Iowa State University, Ames, Iowa, May 22, 2002.

49
APPENDIX A
Equipment Used for Concrete Material Tests
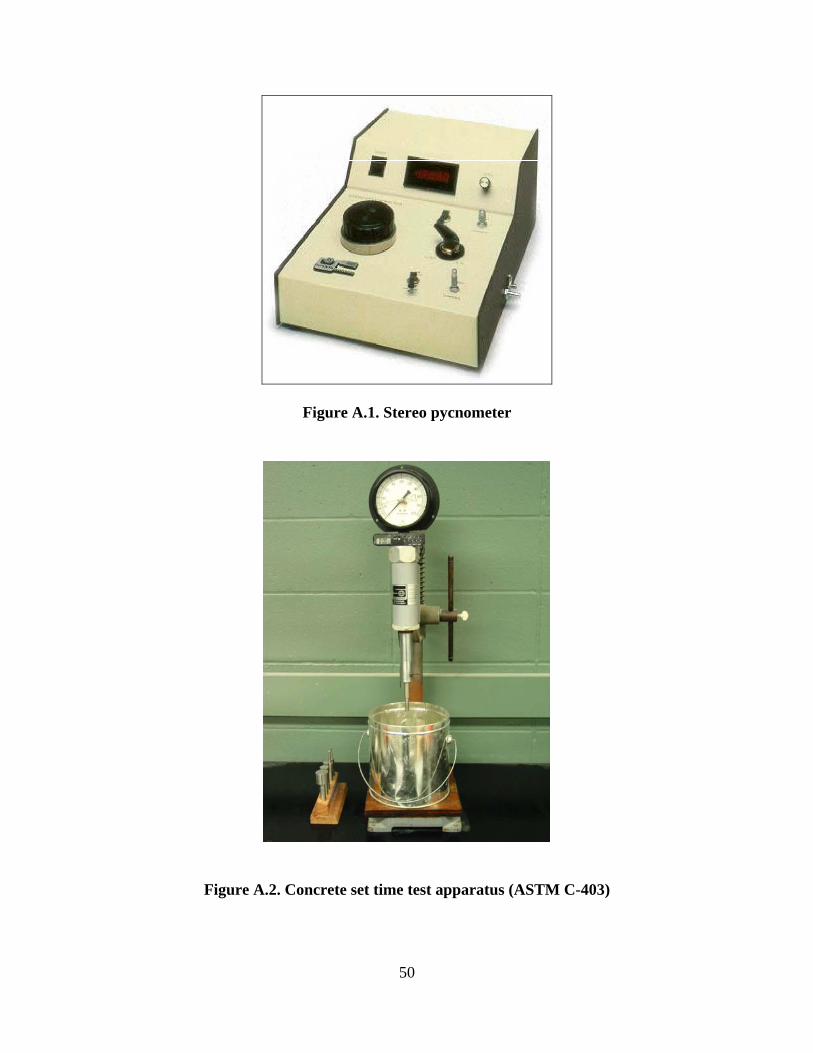
50
Figure A.1. Stereo pycnometer
Figure A.2. Concrete set time test apparatus (ASTM C-403)
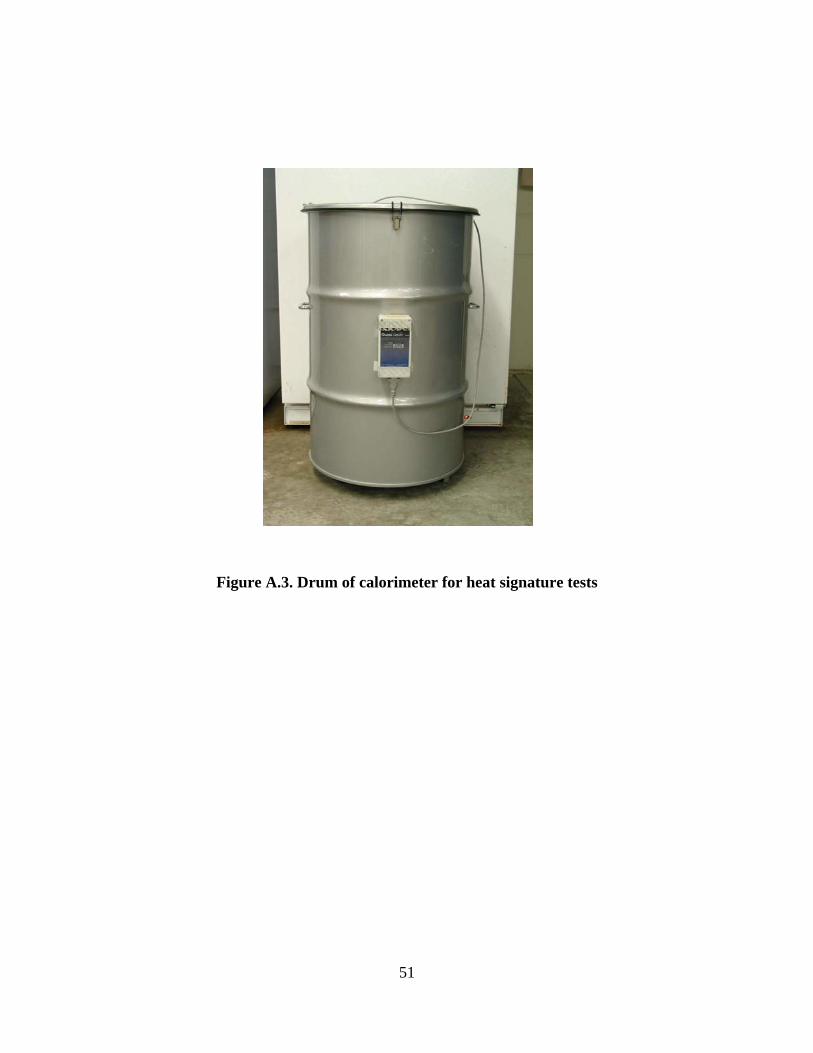
51
Figure A.3. Drum of calorimeter for heat signature tests

52
APPENDIX B
Effect of Curing Temperature on Mortar Strength Development

53
Temperature (°F)
14-d
ay C
ompr
essi
ve S
tren
gth
(psi
)
0
2,000
4,000
6,000
8,000
10,000
50 60 70 80 90 10040
HI-15%FAHI-20%S-15%FAHI-25%S-15%FAHI-35%S-15%FA
Figure B.1. Effect of curing temperature on 14-day strength of mortar made with Holcim cements
Age (day)
Com
pres
sive
Str
engt
h (p
si)
0
2,000
4,000
6,000
8,000
10,000
0 5 10 15 20 25 30 35
LI/II + FA
LI/II+20%S+FA
50 °F70 °F
90 °F
Figure B.2. Effect of curing temperature on strength of mortar made with Lafarge cements
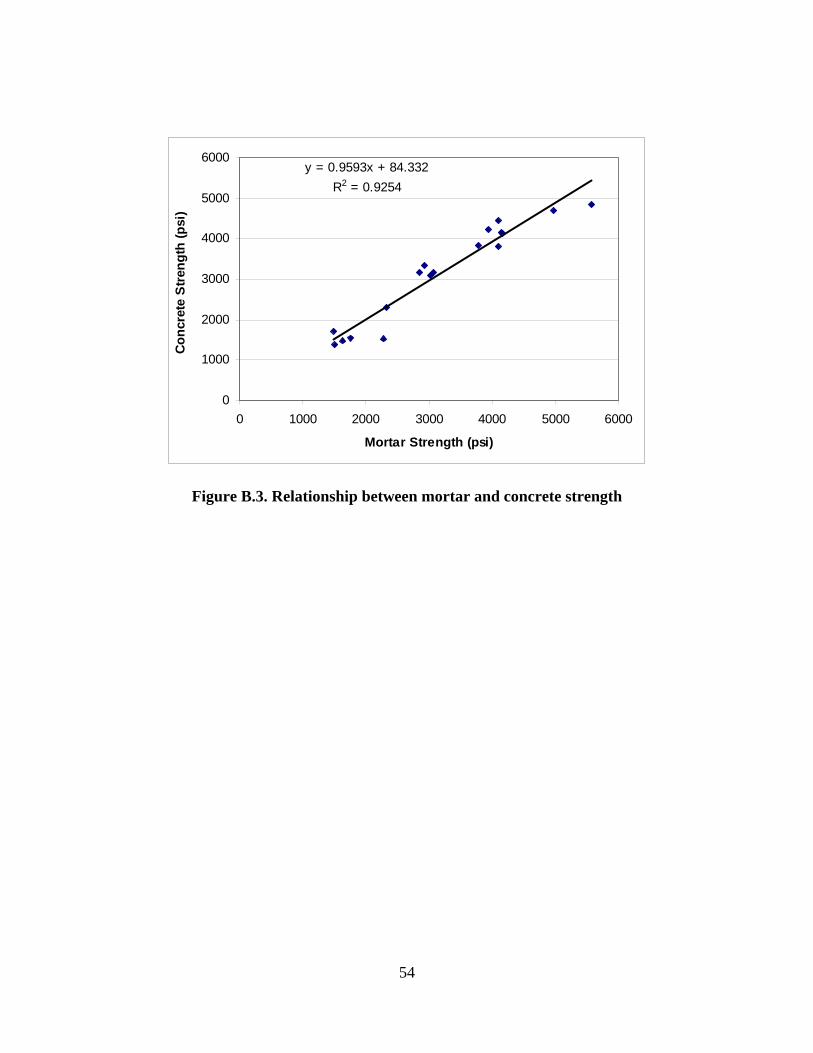
54
y = 0.9593x + 84.332R2 = 0.9254
0
1000
2000
3000
4000
5000
6000
0 1000 2000 3000 4000 5000 6000
Mortar Strength (psi)
Con
cret
e St
reng
th (p
si)
Figure B.3. Relationship between mortar and concrete strength

55
APPENDIX C
Heat Signature of Mortar Specimens
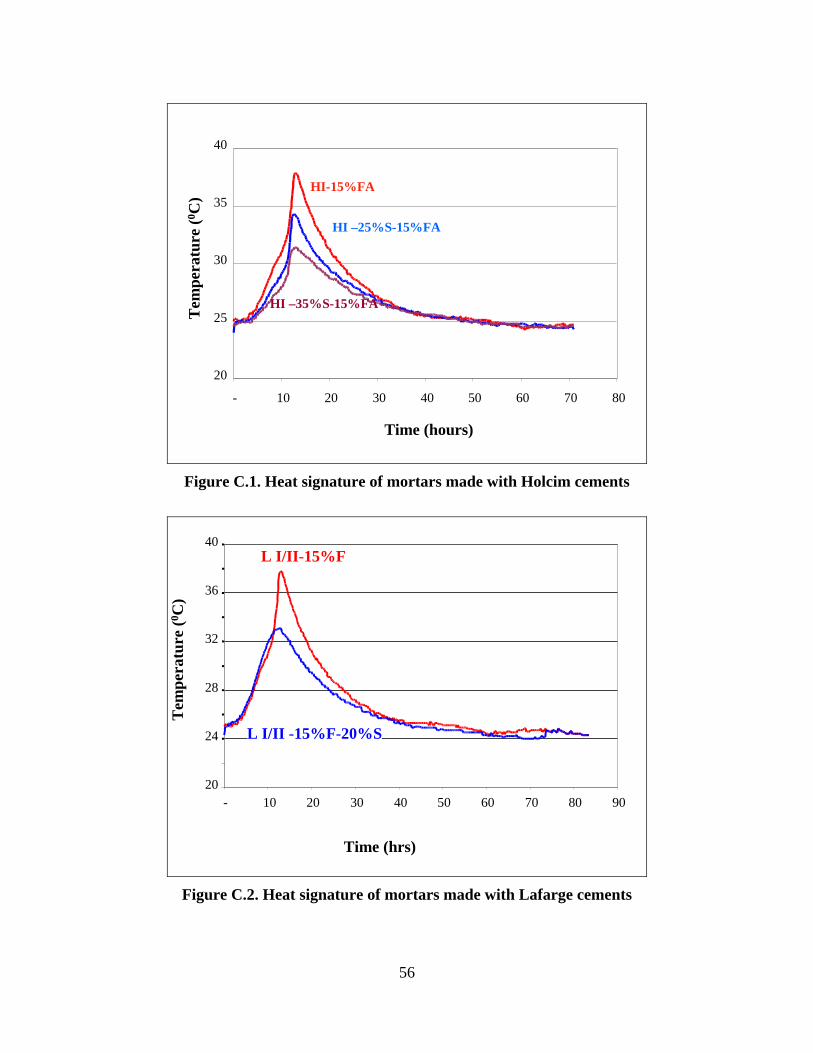
56
20
25
30
35
40
- 10 20 30 40 50 60 70 80
Time (hours)
Tem
pera
ture
(0 C)
HI-15%FA
HI –25%S-15%FA
HI –35%S-15%FA
Figure C.1. Heat signature of mortars made with Holcim cements
20
24
28
32
36
40
- 10 20 30 40 50 60 70 80 90
Time (hrs)
Tem
pera
ture
(0 C)
L I/II-15%F
L I/II -15%F-20%S
Figure C.2. Heat signature of mortars made with Lafarge cements

57
APPENDIX D
Procedures for Datum Temperature and Activation Energy Tests
(ASTM C1074)
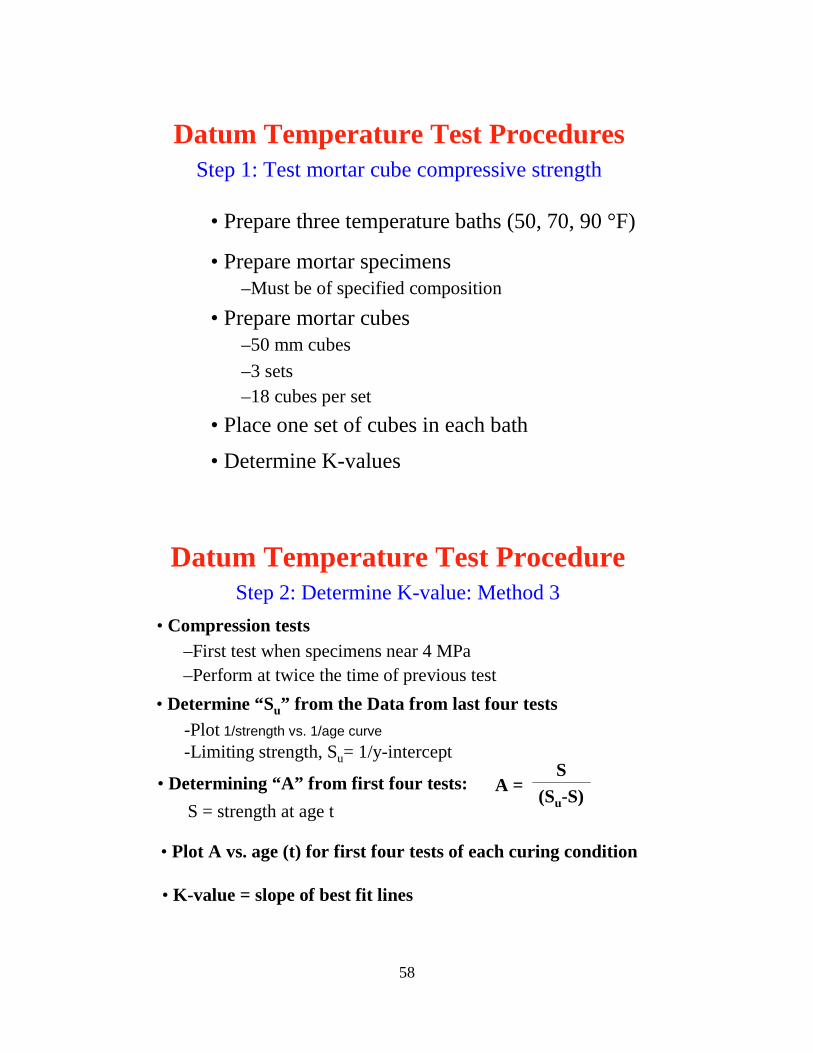
58
Datum Temperature Test Procedures Step 1: Test mortar cube compressive strength
• Prepare three temperature baths (50, 70, 90 °F)
• Prepare mortar specimens –Must be of specified composition
• Prepare mortar cubes –50 mm cubes –3 sets –18 cubes per set
• Place one set of cubes in each bath
• Determine K-values
S = strength at age t
• Plot A vs. age (t) for first four tests of each curing condition
• K-value = slope of best fit lines
• Determine “Su” from the Data from last four tests -Plot 1/strength vs. 1/age curve-Limiting strength, Su= 1/y-intercept
• Determining “A” from first four tests: S
(Su-S)A =
• Compression tests –First test when specimens near 4 MPa –Perform at twice the time of previous test
Datum Temperature Test ProcedureStep 2: Determine K-value: Method 3

59
Temperature - Controlled Bath (oC)
0
0.1
0.2
0.3
0.4
0.5
0.6
0 10 20 30 40
K-v
alue
( 1/
day
)
12
3
T0=40C
Datum Temperature Test ProcedureStep 3: Determine Datum Temperature
1/Temperature ( 1 / 0K )
Datum Temperature Test Procedure(Step 4: Determine Activation Energy)
-2.0
-1.6
-1.2
-0.8
-0.4
0
3.25 3.3 3.35 3.40 3.45 3.50 3.55
Nat
ural
Log
( K
-val
ue)
1
-Q
3
2
1
Activation Energy=Q*Gas Constant
Related Documents