2095 Limnol. Oceanogr., 49(6), 2004, 2095–2104 q 2004, by the American Society of Limnology and Oceanography, Inc. Availability of iron and major nutrients for phytoplankton in the northeast Atlantic Ocean Ste ´phane Blain Laboratoire d’Oce ´anographie et de Bioge ´ochimie, Parc Scientifique et Technologique de Luminy. Case 901, F-13288 Marseille Cedex 09, France Ce ´cile Guieu and Herve ´ Claustre LOV-CNRS FRE 2317, Observatoire Oce ´anologique de Villefranche-sur-Mer. B.P. 08, 06238 Villefranche-sur-mer, France Karine Leblanc, Thierry Moutin, and Bernard Que ´guiner Laboratoire d’Oce ´anographie et de Bioge ´ochimie, Parc Scientifique et Technologique de Luminy. Case 901, F-13288 Marseille Cedex 09, France Jose ´phine Ras LOV-CNRS FRE 2317, Observatoire Oce ´anologique de Villefranche-sur-Mer. B.P. 08, 06238 Villefranche-sur-mer, France Ge ´raldine Sarthou LEMAR UMR CNRS 6539, Place Nicolas Copernic. 29280 Plouzane ´, France Abstract Because of recent findings that Fe is a limiting factor for phytoplankton activity even at relatively high dissolved iron (DFe) concentrations, the potential importance of Fe limitation was revisited in the northeast Atlantic Ocean (39–458N, 17–218W). We report data gathered during deck incubation experiments performed at three stations in February–March 2001 with surface seawater containing DFe concentrations of ;0.40 nmol L 21 . At all stations, Fe addition enhanced phytoplankton growth. Fe limitation was moderate and occurred simultaneously with limitation by major nutrients. This was clearly demonstrated for diatoms that were colimited by orthosilicic acid. Micro-, nano-, and picoplankton benefited from Fe enrichment. Experiments performed with the trihydroxamate siderophore desferrioxamine mesylate B (DFOB) indicated that Fe reserves exist within the cells, especially within the larger cells. This reserve could result from luxurious storage of Fe by colimited cells during episodic atmospheric depo- sition of Saharan dust. Simulating concentrations of dust resulting from aerosol deposition in well-stratified surface waters, we determined that the solubility of Saharan dust was very low (,0.1% w/w) but the amount of DFe released in seawater was sufficient to relieve the Fe limitation of the ambient phytoplankton community. During the last decade, most biogeochemical studies ded- icated to Fe limitation of phytoplankton growth have been carried out in regions characterized by low dissolved iron (DFe) concentrations, such as the equatorial Pacific Ocean (Coale et al. 1996) or the Southern Ocean (de Baar et al. 1995; Boyd et al. 2000; Blain et al. 2001). Recent studies in the Californian coastal upwelling (Hutchins et al. 1998) and the Mediterranean Sea (Sarthou and Jeandel 2001) have shown that even in regions with DFe concentrations one or two orders of magnitude higher than in offshore high-nutri- ent–low-chlorophyll (HNLC) areas, Fe could be an impor- tant factor controlling phytoplankton growth, phytoplankton community structure, and nutrient drawdown. In light of these new findings, the case of the North Atlantic must be revisited. Acknowledgments We thank the captain and the crew of the RV Atalante for ex- cellent technical assistance. The final version benefited from the useful comments of one anonymous reviewer and M. O ¨ ztu ¨rk. This work was supported by the CNRS. This is contribution N8917 of the IUEM, European Institute for Marine Studies (Brest, France). Because of the assumption that North Atlantic waters con- tain high Fe concentrations, there have been few studies in- vestigating the importance of Fe on primary production in these waters. The large, shallow continental shelf could be a source of Fe for the North Atlantic at high latitude. How- ever, during the North Atlantic Bloom Experiment (NABE) Martin et al. (1993) observed low DFe concentrations (;0.1 nmol L 21 ) in surface waters at 478N, 208W. Higher DFe val- ues were reported at southerly stations (408N, 238W), rang- ing from 0.6 to 1.5 nmol L 21 (de Jong et al. 2000), but no bioassay experiments were associated with these measure- ments. At midlatitudes, large Saharan dust events are also a source of Fe for surface waters of the Atlantic Ocean, with possible implications on biological productivity. For exam- ple, a large Trichodesmium bloom following a Saharan dust event was monitored in offshore waters of the West Florida shelf (Lenes et al. 2001). DFe concentrations in surface wa- ters of the North Atlantic are thus expected to be highly variable in space and time, due to the interplay of episodic deposition of Saharan dust, hydrographic features, such as fronts or mesoscales eddies, and biological activities.

Welcome message from author
This document is posted to help you gain knowledge. Please leave a comment to let me know what you think about it! Share it to your friends and learn new things together.
Transcript
2095
Limnol. Oceanogr., 49(6), 2004, 2095–2104q 2004, by the American Society of Limnology and Oceanography, Inc.
Availability of iron and major nutrients for phytoplankton in the northeastAtlantic Ocean
Stephane BlainLaboratoire d’Oceanographie et de Biogeochimie, Parc Scientifique et Technologique de Luminy. Case 901, F-13288Marseille Cedex 09, France
Cecile Guieu and Herve ClaustreLOV-CNRS FRE 2317, Observatoire Oceanologique de Villefranche-sur-Mer. B.P. 08, 06238 Villefranche-sur-mer, France
Karine Leblanc, Thierry Moutin, and Bernard QueguinerLaboratoire d’Oceanographie et de Biogeochimie, Parc Scientifique et Technologique de Luminy. Case 901, F-13288Marseille Cedex 09, France
Josephine RasLOV-CNRS FRE 2317, Observatoire Oceanologique de Villefranche-sur-Mer. B.P. 08, 06238 Villefranche-sur-mer, France
Geraldine SarthouLEMAR UMR CNRS 6539, Place Nicolas Copernic. 29280 Plouzane, France
Abstract
Because of recent findings that Fe is a limiting factor for phytoplankton activity even at relatively high dissolvediron (DFe) concentrations, the potential importance of Fe limitation was revisited in the northeast Atlantic Ocean(39–458N, 17–218W). We report data gathered during deck incubation experiments performed at three stations inFebruary–March 2001 with surface seawater containing DFe concentrations of ;0.40 nmol L21. At all stations, Feaddition enhanced phytoplankton growth. Fe limitation was moderate and occurred simultaneously with limitationby major nutrients. This was clearly demonstrated for diatoms that were colimited by orthosilicic acid. Micro-,nano-, and picoplankton benefited from Fe enrichment. Experiments performed with the trihydroxamate siderophoredesferrioxamine mesylate B (DFOB) indicated that Fe reserves exist within the cells, especially within the largercells. This reserve could result from luxurious storage of Fe by colimited cells during episodic atmospheric depo-sition of Saharan dust. Simulating concentrations of dust resulting from aerosol deposition in well-stratified surfacewaters, we determined that the solubility of Saharan dust was very low (,0.1% w/w) but the amount of DFereleased in seawater was sufficient to relieve the Fe limitation of the ambient phytoplankton community.
During the last decade, most biogeochemical studies ded-icated to Fe limitation of phytoplankton growth have beencarried out in regions characterized by low dissolved iron(DFe) concentrations, such as the equatorial Pacific Ocean(Coale et al. 1996) or the Southern Ocean (de Baar et al.1995; Boyd et al. 2000; Blain et al. 2001). Recent studiesin the Californian coastal upwelling (Hutchins et al. 1998)and the Mediterranean Sea (Sarthou and Jeandel 2001) haveshown that even in regions with DFe concentrations one ortwo orders of magnitude higher than in offshore high-nutri-ent–low-chlorophyll (HNLC) areas, Fe could be an impor-tant factor controlling phytoplankton growth, phytoplanktoncommunity structure, and nutrient drawdown. In light ofthese new findings, the case of the North Atlantic must berevisited.
AcknowledgmentsWe thank the captain and the crew of the RV Atalante for ex-
cellent technical assistance. The final version benefited from theuseful comments of one anonymous reviewer and M. Ozturk. Thiswork was supported by the CNRS. This is contribution N8917 ofthe IUEM, European Institute for Marine Studies (Brest, France).
Because of the assumption that North Atlantic waters con-tain high Fe concentrations, there have been few studies in-vestigating the importance of Fe on primary production inthese waters. The large, shallow continental shelf could bea source of Fe for the North Atlantic at high latitude. How-ever, during the North Atlantic Bloom Experiment (NABE)Martin et al. (1993) observed low DFe concentrations (;0.1nmol L21) in surface waters at 478N, 208W. Higher DFe val-ues were reported at southerly stations (408N, 238W), rang-ing from 0.6 to 1.5 nmol L21 (de Jong et al. 2000), but nobioassay experiments were associated with these measure-ments. At midlatitudes, large Saharan dust events are also asource of Fe for surface waters of the Atlantic Ocean, withpossible implications on biological productivity. For exam-ple, a large Trichodesmium bloom following a Saharan dustevent was monitored in offshore waters of the West Floridashelf (Lenes et al. 2001). DFe concentrations in surface wa-ters of the North Atlantic are thus expected to be highlyvariable in space and time, due to the interplay of episodicdeposition of Saharan dust, hydrographic features, such asfronts or mesoscales eddies, and biological activities.

2096 Blain et al.
Fig. 1. Location of the area investigated during the cruise POM-ME1. Left panel shows the positions of Sta. 1 (S1), 2 (S2), and 3(S3). S1 is in the core of an anticyclonic eddy, S3 in the core of acyclonic eddy, and S2 at the front between both eddies. The eddiesare identified by gradients in geopotential anomalies (50 db/2,000db) (in gray).
Table 1. Location of study sites and respective hydrological fea-tures.
Type ofhydrological
structure
Station 1anticyclonic
eddyStation 2
front
Station 3cyclonic
eddy
LatitudeLongitude
40.058N18.458W
40.508N19.038W
41.818N19.368W
Table 2. Description of the different nutrient amendments during the incubation experiments. NPSi represents the simultaneous additionof the major nutrients, resulting in a final concentration in the incubation bottles of [NO ] 5 10 mmol L21, [Si(OH4)] 5 2 mmol L21,2
3
[PO ] 5 0.31 mmol L21. DFOB is desferrioxamine B.324
Station 1 Station 2 Station 3
Aim of the incubationexperiment
Identification of thelimiting factors
Ironavailability
Identificaion ofthe limiting factors
Additions
Control
1DFe 2.5 nmol L21
1DFOB 2.5 nmol L21
Control1 NPSi
1DFe 0.7 nmol L21
1 NPSi1DFe 2.5 nmol L21
1 NPSi
Control
1DFe 2.5 nmol L21
1DFOB 2.5 nmol L21
1DFe 2.5 nmol L21
1 NPSi1 NPSi
1DFOB 1 nmol L21
1NPSi1DFOB 10 nmol L21
1 NPSi
1DFe 2.5 nmol L21
1 NPSi1 NPSi
1 Saharan dust
We report here results from experiments carried out at theboundary between eutrophic and oligotrophic waters of thenortheast Atlantic Ocean investigating the importance of Feand other major nutrients for phytoplankton growth. Feavailability and the role of dust as a potential source of Fefor the northeast Atlantic Ocean are also discussed.
Material and methods
Location of the cruise—The cruise took place in Febru-ary–March 2001 as part of the French Programme Oceano-graphique Multi-disciplinaire Meso-echelle (POMME). Thestudy area was characterized by high mesoscale physical ac-tivity, as demonstrated by the geopotential anomalies mea-sured at 200 m (L. Prieur pers. comm.) (Fig. 1). Sta. 1 and3 were located in the core of an anticyclonic and a cycloniceddy, respectively. Sta. 2 was located at the front betweenboth eddies (Table 1).
Sampling and analysis—Water samples were collectedwith acid-cleaned polyethylene tubes using an Osmonics sol-id Teflon diaphragm pump. The tubing inlet was loweredusing a Kevlar line. Seawater was filtered under laminar flowhoods (class 100) in a clean laboratory van, through a Sar-trobran-P-capsule (Sartorius) containing a 0.45-mm prefilterand a 0.2-mm final filter. The samples were acidified withHCl supra pur (MERCK) at pH ,2 and stored for 3–5months in the dark at room temperature until analyzed. DFeconcentrations were measured on shore in a clean room us-ing flow-injection analysis with chemiluminescence detec-tion. The mean detection limit was 20 pmol L21 and themean blank was 30 pmol L21 (Laes et al. 2003).
In situ concentrations of NO and NO were analyzed2 23 2
aboard (Fernandez pers. comm.). Concentrations of Si(OH)4
were measured in the laboratory in 0.2-mm-filtered seawaterpoisoned with HgCl2 (Strickland and Parson 1972).
Incubation experiments—At Sta. 1 and 3, unfiltered cleanseawater from the mixed layer at 25-m depth was pumpedand transferred to 4-liter polycarbonate bottles inside theclean laboratory and immediately amended with nutrientsand desferrioxamine mesylate B (DFOB), as described inTable 2. The bottles were capped, sealed with polyvinylchloride tape, and incubated for up to 5 d in polyethylenetanks located on deck. The incubators shaded the bottles to50% of incident irradiance for photosynthetically active ra-diation. The dose received varied between 2 and 6 MJ m22
d21 during the cruise. A running seawater system suppliedcontinuous water from the sea surface. For each experimen-
2097Iron availability in the Atlantic Ocean
tal treatment, duplicate 4-liter bottles were sacrificed at se-lected (three) time points during the course of the experimentand subsamples for the following measurements were taken:concentrations of DFe, NO , and NO (NOx), Si(OH)4, chlo-2 2
3 2
rophyll a (Chl a), and carotenoids, particulate organic carbon(POC), and particulate organic nitrogen (PON), biogenic sil-ica (BSi), primary production, and rate of silicon uptake. Allchemical analyses were done on land. For NOx analyses, 0.2-mm–filtered seawater was kept frozen. Concentrations ofNOx were measured using a Technicon autoanalyzer. Silicicacid was analyzed in 0.2-mm–filtered seawater poisoned withHgCl2. Particulate organic carbon (POC) and particulate or-ganic nitrogen (PON) were measured using carbon, hydro-gen, nitrogen (CHN) analyses on GF/F-filtered samples. Bio-genic silica (BSi) was measured on 0.6-mm polycarbonatefilters. Concentrations of pigments were measured usinghigh-performance liquid chromatography, using a slightmodification of the method proposed by Vidussi et al.(1996). Pigment data were regrouped into pigment indicesroughly representing the phytoplankton size classes (pico-,nano-, microphytoplankton) according to the procedure ofVidussi et al. (2001). Carbon uptake rates were measuredusing radiolabeled NaH14CO3. Silicon uptake rates weremeasured using radiolabeled 32Si(OH)4 (Leblanc et al. 2002).Incubations for C and Si uptake rates were done on deck for24 h starting at sunrise.
At Sta. 3, Saharan dust was also added to incubation bot-tles to determine its potential as an Fe source for phytoplank-ton growth (Table 2). The dust we used was composed offine fractions of surface soils collected in the Hoggar region(southern Algeria) with grain-size distribution and chemicalcomposition typical for Saharan aerosols collected far fromthe source (Guieu et al. 2002a). The final concentration inthe incubation bottles was 1.34 6 0.08 mg L21. In the courseof this experiment, 60-ml subsamples were taken and filteredthrough 0.2-mm filters using a clean plastic syringe. The fil-trate was acidified, stored, and analyzed for DFe as describedabove.
At Sta. 2, various amounts of DFe and DFOB were addedto 20-liter polycarbonate bottles (Table 2) and incubated asdescribed above. Major nutrients were added to all bottlesat the same concentration as given in Table 2. Subsampleswere taken at different times during the incubation to deter-mine the chemical and biological parameters describedabove. All handling of the 20-liter bottles during subsam-pling was done inside the clean van.
Results
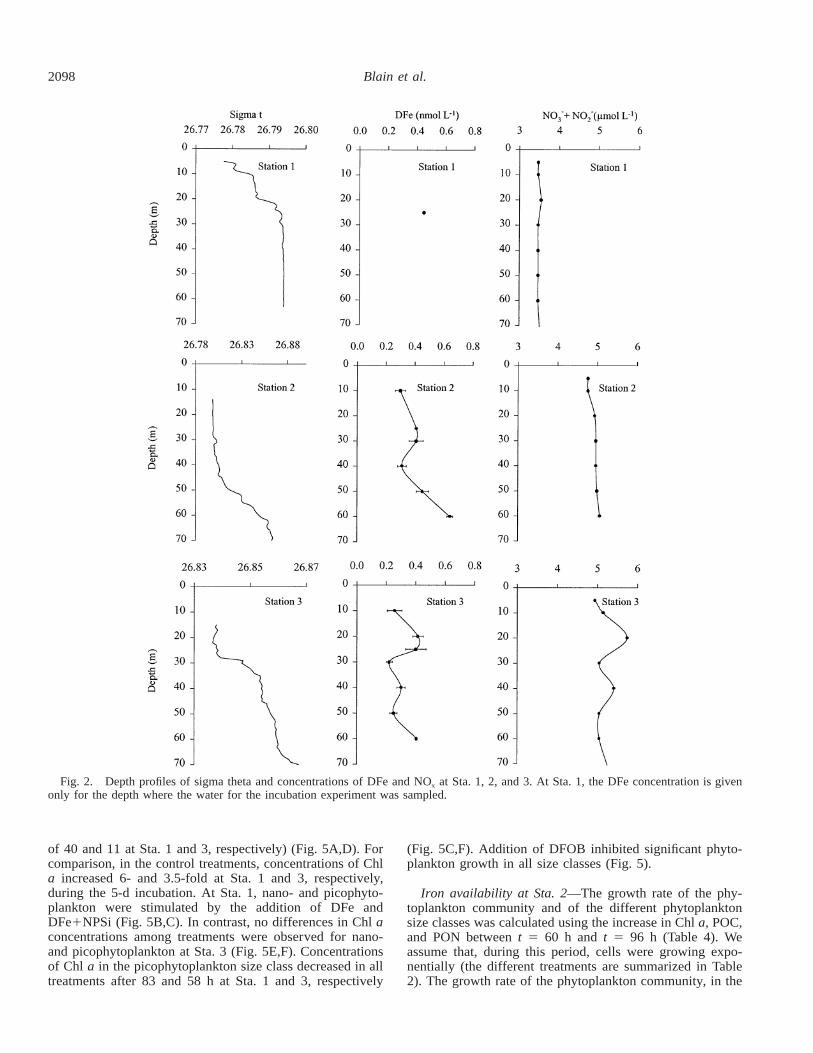
Characteristics of the surface waters—Vertical profiles ofsigma theta, DFe, and NOx at the three stations are shownin Figure 2. At Sta. 1, concentrations of NOx were homog-enous (3.47 mmol L21) in the upper 60 m of the water col-umn. DFe was not measured throughout the water columnat this station. The DFe concentration (0.45 nmol L21) isgiven for the depth where water for the incubation experi-ments was sampled. At Sta. 2, concentrations of DFe in-creased slightly with depth following the small increase insigma theta. Concentrations of NOx were nearly constant in
the first 60 m of the water column. At Sta. 3, concentrationsof DFe and NOx in the upper 60 m of water column variedbetween 0.22 and 0.45 nmol L21 and 5.51 and 5.86 nmolL21, respectively. Variations with depth were similar for bothchemical species, revealing a small increase of concentra-tions between 20 and 30 m, consistent with a small gradientin sigma theta at the same depth.
Initial concentrations of DFe at 25 m were similar at thethree study sites (0.45, 0.41, and 0.40 nmol L21 at Sta. 1, 2,and 3, respectively) (Table 3). Concentrations of NOx,Si(OH)4, Chl a, and BSi increased substantially along a southto north gradient (Table 3). At all sites, the phytoplanktoncommunity was dominated by nanophytoplankton (53–59%,Table 3) and picophytoplankton (31–34%, Table 3) and thecontribution of microphytoplankton to total phytoplanktonbiomass was relatively small (,15%, Table 3).
Identification of the limiting factors at Sta. 1 and 3—Addition of DFe alone or in combination with NPSi had apronounced effect on phytoplankton biomass productionduring the 5-d incubation at Sta. 1 and 3 (Fig. 3). At Sta. 1,the final Chl a concentration was 1.6- and 2-fold higher inthe DFe and DFe1NPSi treatments, respectively, as com-pared with the unamended control (Fig. 3A). At Sta. 3, ad-dition of DFe and DFe1NPSi resulted in a final Chl a con-centration of 1.4- and 1.5-fold higher, respectively, ascompared with the unamended control (Fig. 3B). In contrast,addition of NPSi alone did not stimulate phytoplankton bio-mass production as compared with the unamended controlat the two stations. A minor increase in phytoplankton bio-mass during the 5-d incubation was observed in the DFOB-amended treatments at Sta. 1 and 3.
Dissolved Fe and DFe1NPSi addition also affected allother biological parameters determined in the present study(Fig. 4). At Sta. 1, the stimulation by DFe and DFe1NPSiwas more pronounced for Chl a and POC integrated overthe 5-d incubation (Fig. 4A,B) than for PON and BSi (Fig.4D,E). Primary production and the silicon uptake rate inte-grated over the 5-d incubation were particularly enhancedupon addition of DFe1NPSi (both by a factor of four) (Fig.4C,F). At Sta. 3, DFe addition alone stimulated uptake ratesof silicon (Fig. 4F). However, the addition of DFe in com-bination with NPSi or the addition of dust resulted in ele-vated concentrations of Chl a, POC, PON, and BSi inte-grated over the 5-d incubation as compared with the controltreatment (Fig. 4A,B,D,E). Similar to Sta. 1, particularly theprimary production and the silicon uptake rate integratedover the 5-d incubation were stimulated by the addition ofDFe1NPSi (by factors of 1.9 and 3.6, respectively) (Fig.4C,F).
Pigment analysis was used to determine the contributionof different phytoplankton size classes responding to nutrientamendment at Sta. 1 and 3 (Fig. 5). Microphytoplankton(mainly diatoms) revealed the most pronounced response toDFe addition, resulting in a 17- and 10-fold increase in Chla in the course of the 5-d incubation at Sta. 1 and 3, re-spectively (Fig. 5A,D). Addition of dust resulted in a similarincrease in Chl a at Sta. 3 (Fig. 5D). However, Chl a con-centrations increased most in this size class in the course ofthe 5-d incubation when DFe1NPSi was added (by factors
2098 Blain et al.
Fig. 2. Depth profiles of sigma theta and concentrations of DFe and NOx at Sta. 1, 2, and 3. At Sta. 1, the DFe concentration is givenonly for the depth where the water for the incubation experiment was sampled.
of 40 and 11 at Sta. 1 and 3, respectively) (Fig. 5A,D). Forcomparison, in the control treatments, concentrations of Chla increased 6- and 3.5-fold at Sta. 1 and 3, respectively,during the 5-d incubation. At Sta. 1, nano- and picophyto-plankton were stimulated by the addition of DFe andDFe1NPSi (Fig. 5B,C). In contrast, no differences in Chl aconcentrations among treatments were observed for nano-and picophytoplankton at Sta. 3 (Fig. 5E,F). Concentrationsof Chl a in the picophytoplankton size class decreased in alltreatments after 83 and 58 h at Sta. 1 and 3, respectively
(Fig. 5C,F). Addition of DFOB inhibited significant phyto-plankton growth in all size classes (Fig. 5).
Iron availability at Sta. 2—The growth rate of the phy-toplankton community and of the different phytoplanktonsize classes was calculated using the increase in Chl a, POC,and PON between t 5 60 h and t 5 96 h (Table 4). Weassume that, during this period, cells were growing expo-nentially (the different treatments are summarized in Table2). The growth rate of the phytoplankton community, in the

2099Iron availability in the Atlantic Ocean
Table 3. Initial chemical and biological properties of the surfaceseawater used for the incubation experiments.
Station 1 Station 2 Station 3
Dissolved iron (nmol L21)Nitrate1nitrite (mmol L21)Phosphate (mmol L21)Silicic acid (mmol L21)Chlorophyll a (mg L21)
0.453.650.211.810.24
0.414.960.321.900.58
0.405.590.172.210.81
Biogenic silica (mmol L21)% Chl a microphytoplankton% Chl a nanophytoplankton% Chl a picophytoplankton
0.0468
5734
0.050105931
0.103155332
Fig. 3. Concentrations of Chl a in unamended and nutrient-amended treatments in the course of the incubations at (A) Sta. 1and (B) Sta. 3. The error bars represent the standard deviation fromduplicate incubations.
Fig. 4. Integrated value over the incubation period in nutrient-amended treatments relative to the control (R) for concentrations of(A) Chl a, (B) POC, (C) primary production (Prim. Prod.), (D)PON, (E) BSi, (F) biogenic silica production (BSi Prod.). Note dif-ferent scales on the y-axis.
control, based on the increase in Chl a (0.38 d21) was higherthan the estimates based on the increases of PON and POC,0.22 and 0.19 d21, respectively (Table 4). DFOB addition, 1or 10 nmol L21, reduced the growth rate by a factor of two.Iron addition at 0.7 or 2.5 nmol L21 resulted in the maximalgrowth rate of the whole phytoplankton community (0.57d21). In the control treatment, the growth rate of microphy-toplankton was 1.6- and 2.4-fold higher than the growth rateof nanophytoplankton and picophytoplankton, respectively.DFOB additions had a relatively low impact on the growthrate of microphytoplankton but precluded growth of pico-phytoplankton. An intermediary effect was observed on nan-ophytoplankton. DFe addition stimulated the growth rate ofthe three phytoplankton groups in the same manner by afactor of 1.5.
Discussion
Ambient iron concentrations—The concentrations of DFemeasured at the different stations were intermediate valuescompared with concentrations reported in the literature inthe northeast Atlantic. The lowest concentrations (0.07–0.2nmol L21) have been observed at 478N, 208W (Martin et al.1993). At 408N, 238W, an area closer to our study sites,concentrations of 0.8–1.5 nmol L21 have been reported (deJong et al. 2000). It is difficult to firmly interpret these dif-ferences, but variability on short spatial and temporal scalesis not surprising in this area. This region of the northeastAtlantic is characterized by permanent frontal structures thatare likely responsible for the variability in the chemical andbiological properties of surface seawater. The mesoscale fea-tures occurring in the studied area (Fig. 1) could also impactthe spatial and temporal distribution of Fe. Most anticycloniceddies are generated along the continental shelf of Portugaland then advected westward. Therefore, Fe could be trans-ported from the Fe-rich shelf zone offshore. Eddies have arelatively long life time (several months), but the water atthe periphery can rapidly mix with the surrounding water.This might provide a mechanism explaining the relativelyhigh DFe concentrations in this area. Atmospheric deposi-tion could be another source of Fe. Massive airborne plumesof desert dust from the Sahara are exported to the northAtlantic Ocean (Moulin et al. 1997). Under particular con-ditions, mineral aerosol deposition leads to a significant in-crease in the concentration of DFe in surface waters. This
has clearly been demonstrated in the well-stratified Mediter-ranean surface waters (Guieu et al. 2002a). Even if the strat-ification in the northeast Atlantic surface waters is weakerthan in the Mediterranean Sea, atmospheric dust depositionmay episodically and locally increase the Fe concentrationin surface waters (Lenes et al. 2001). Both factors, hydro-dynamic and atmospheric deposition, might explain the het-erogeneous distribution and the high concentrations of DFein surface waters of the northeast Atlantic. In any case, con-centrations of DFe in the northeast Atlantic are one order ofmagnitude higher than the lowest concentrations measuredin Fe-depleted waters of remote HNLC areas.
Iron versus major nutrient availability for phytoplanktongrowth—The experiments performed in the present studywere designed to investigate the chemical factors limitingphytoplankton growth with particular focus on Fe, which hasbeen poorly studied in this area. Nutrient addition experi-ments have proven to be very useful in identifying potentialchemical limitations or simultaneous chemical limitation ofphytoplankton. Container artifacts have been mentioned as

2100 Blain et al.
Fig. 5. Relative increase (Rinc.) in Chl a concentrations in the three different phytoplankton size classes, derived from pigment analysis,in nutrient-amended and unamended treatments in the course of the incubation at Sta. 1 (A–C) and 3 (D–F). All values are normalized tothe concentration of Chl a at the starting time of the incubations.
Table 4. Growth rate (d21) of different phytoplankton size classes and the whole phytoplankton community calculated from increasesin Chl a, POC, and PON between t 5 60 h and t 5 96 h, assuming an exponential growth phase. Data are from Sta. 2.
Parameters
Phytoplankton size classes
Micro Chl a Nano Chl a Pico Chl a
Whole phytoplankton community
Chl a PON POC
1DFOB 10 nmol L21
1DFOB 1 nmol L21
Control1DFe 0.7 nmol L21
1DFe 2.5 nmol L21
mcont/mmax (%)
0.560.520.651.030.98
67
0.230.200.410.620.70
68
000.270.330.39
69
0.190.140.380.570.56
67
0.150.150.220.320.29
72
0.060.140.19
(0.12)0.35
54
an important bias of this type of experiment, but a recentcomparison of data gathered from both shipboard Fe addi-tion experiments and mesoscale in situ enrichments suggestthat shipboard experiments provide a robust indication of thenutritional status of the native algal community (Gall et al.2001). The concept of the limiting factor according to Lie-big’s law implies the control of phytoplankton growth by asingle factor. However, it is now recognized that the conceptof multiple limitations is more realistic. Metabolisms of dif-ferent chemical elements are interconnected at the cell level,which implies that the growth of an individual cell can beconcurrently limited by several factors (Sciandra et al. 1997).As far as the whole phytoplankton community is concerned,simultaneous limitation can result from different limitingfactors acting on different contributors of the phytoplanktoncommunity.
In all experiments performed in the present study, phy-toplankton biomass increased significantly in the controltreatments. This observation implies that phytoplankton havethe potential to grow in an incubation bottle at a period ofthe year when no phytoplankton bloom is expected nor wasdetected. This suggests that light limitation as a consequenceof the deep mixed layer and low surface irradiance is thefirst in situ limiting factor of phytoplankton growth at thistime of the year. Incubating phytoplankton at surface irra-diance during wintertime has a somewhat similar effect onphytoplankton growth as the onset of stratification. Incubat-
ing has thus the advantage of removing the effect of lightlimitation so that the effect of nutrient limitation can beproperly assessed.
In our experiments, phytoplankton growth was alwaysstimulated by the addition of Fe, even though ambient con-centrations of DFe were relatively high (0.40–0.45 nmolL21). Fe limitation is not a step function with two extremestates: Fe limited versus Fe replete. There is evidence that acontinuum in the degree of Fe limitation exists. Along theCalifornian coast, a complex mosaic of different types ofwater masses was described using a four-level model. Thesystems were classified as Fe replete and slightly, moderate-ly, and highly limited, with different impacts on the Si(OH)4/NO drawdown and on the biological communities (Hutch-2
3
ins et al. 1998). A positive response to Fe addition inseawater with ambient concentrations of DFe of a few hun-dred picomoles has already been observed, for example, inthe sub-Antarctic region of the Southern Ocean (Sedwick etal. 2002). This is similar to the observations made in thepresent study.
Sta. 1 and 3: evidence of multiple chemical limitations—At Sta. 1, our results clearly show that the response of thephytoplankton community to the addition of limiting nutri-ents was more important (roughly twofold) for uptake pro-cesses than for biomass accumulation. The large response ofthe primary production was only obtained when both Fe and

2101Iron availability in the Atlantic Ocean
major nutrients were added. Pigment analysis indicated thatall three phytoplankton size classes were stimulated by theaddition of DFeNPSi, but the effect on microphytoplanktonwas most pronounced (Fig. 5). At the end of the incubations,the ratios R 5 Rinc.(1DFeNPSi)/Rinc.(DFe) were 2.4, 1.7, and1.5 for micro-, nano-, and picoplankton, respectively. Simi-larly, when nutrient-amended treatments (1DFeNPSi) arecompared with the unamended treatments, the ratio R 5Rinc.(1DFeNPSi)/Rinc.(control) was higher for microphyto-plankton (3.6) than for nano- and picophytoplankton (1.8and 2.5, respectively). This suggests that growth of the phy-toplankton community, in particular diatoms, is colimited byseveral nutrients. Comparing the ambient concentration ofSi(OH)4 at Sta. 1 (1.8 mmol L21) with the half-saturationconstant of Si uptake (KSi 5 3.5 mmol L21; Leblanc 2002),it is obvious that Si uptake is severely limited by Si(OH)4
availability (34% of Vmax). If Si was the unique limiting fac-tor for diatom growth, the addition of 2 mmol L21 Si(OH)4
would have relieved, at least partly, this limitation. However,this was not observed in the present study. Therefore, phy-toplankton growth is likely colimited by Si and Fe at thisstudy site. This confirms previous studies that report that Feavailability can affect KSi and Vmax of Si uptake by diatoms(De La Rocha et al. 2000). It was suggested that either Feis a cofactor of the transport system or that Fe limits otherprocesses within the cell, which subsequently impact the Siuptake due to a lack in energy availability. However, in theCalifornian upwelling region, Firme et al. (2003) observedonly small effects of Fe addition on biogenic silica produc-tion. This argues against a colimitation of the Si uptakemechanism by Fe. The type of multiple limitation, co- orsimultaneous, is likely dependent on the species of diatoms.
Although DFeNPSi addition relieved the colimitation ofSi uptake, BSi concentration did not increase substantiallyover the incubation period. This resulted in a very high spe-cific growth rate of lightly silicified diatoms. Using pigmentdata, we estimated a contribution of diatoms to the total Chla concentration of 42% at the end of the incubations. Al-though growing rapidly, diatoms did not fully dominate thephytoplankton community. Hutchins et al. (2002) reportedthat Fe addition in shipboard incubations with surface watersof the Peru Current resulted in a final composition of thephytoplankton community dominated equally by pennate di-atoms and haptophytes. This and the present study contrastwith results obtained during Fe-addition experiments inHNLC areas such as the Californian upwelling (Hutchinsand Bruland 1998) or the Southern Ocean (Sedwick et al.2002). Hutchins et al. (2002) suggested that, during the Peruupwelling experiments, Si limitation of diatoms at the endof the incubations precluded the diatoms from dominatingthe phytoplankton community. This was consistent with thedrawdown of Si(OH)4 to 2 mmol L21 at day 4, which is lowenough to limit Si uptake because a KSi of 2.9 mmol L21 hasbeen measured in this area. In our case, the growth of dia-toms did not decrease significantly the concentrations ofSi(OH)4 during the course of the incubation. The very lowabundance of diatoms at the beginning of the incubations ismore likely the explanation of the fact that diatoms were notdominant at the end of the incubation.
The nanophytoplankton size class responded only to the
addition of DFeNPSi, indicating also multiple limitation, byFe and other major nutrients. Si can be excluded as the lim-iting nutrient because siliceous organisms were not domi-nating this phytoplankton size class. The biomass reached inthe treatment with Fe was similar to that in the treatmentwith DFeNPSi at t 5 84 h. Nanophytoplankton growth de-creased in the Fe treatment after this time point. The initialconcentration of nitrate was 3.6 mmol L21 in our experiment.At t 5 84 h, there were 1.8 mmol L21 and 8 mmol L21 ofnitrate in the 1DFe and 1NPSi treatments, respectively. Wehypothesize that the treatment 1DFe became N limited inthe last part of the incubation. If true, such an N limitationcould also affect the growth of other phytoplankton groupsat the end of the incubations. The picophytoplankton groupresponded to Fe addition with or without major nutrientsadded. This group was also Fe limited. In a general manner,the decline of the biomass after t 5 84 h could be due tograzing because all the treatments were affected.
At Sta. 3, the responses during the incubation experimentswere smaller than at Sta. 1, especially for Chl a, POC, andprimary production for the whole phytoplankton communityand for Chl a in the microphytoplankton size class. The ini-tial composition of the phytoplankton community was verysimilar at these two stations, so it cannot explain the differ-ent responses observed during the experiments (Table 1).Nanophytoplankton contributed mainly to overall phyto-plankton biomass, and few diatoms were observed. Sta. 1and 3 also had similar concentrations of DFe, but Sta. 3 hadhigher concentrations of nitrate and Si(OH)4. Therefore, thedifference in the magnitude of the response during the in-cubation experiment shows that the limitation by the majornutrients at Sta. 3 was weaker than at Sta. 1. At Sta. 3, asignificant response of the microphytoplankton to NPSi andDFeNPSi additions was observed. Fe addition led to an in-crease in BSi similar to that measured at Sta. 1. This is alsotrue for the Si uptake rate. The half-saturation constant KSi
measured at Sta. 3 was 4.1 mmol L21 (Leblanc 2002), allow-ing the diatoms to take up Si(OH)4 at only 36% of the max-imal uptake rate. Therefore, Si and Fe likely colimited dia-tom growth also at Sta. 3.
Our results demonstrate that phytoplankton growth is co-limited by Fe and major nutrients when light limitation isremoved. The most pronounced decrease during the 5-d in-cubation in the control treatment was observed for NOx
(from 3.7 mmol L21 to 0.95 mmol L21 and from 5.6 mmolL21 to 0.86 mmol L21 at Sta. 1 and 3, respectively; data notshown). Based on this observation, we hypothesize that Nbecomes the limiting nutrient for phytoplankton growth athigher light intensities. The colimitations existing in earlyspring are, therefore, likely different from those prevailingat other times of the year.
Iron bioavailability: DFOB and Fe addition experi-ments—Desferrioxamine B (DFOB) is a trihydroxamate sid-erophore produced by terrestrial bacteria. This molecule hasbeen used to greatly reduce Fe uptake by the phytoplanktoncommunity in seawater (Wells et al. 1994; Hutchins et al.1999a; Wells 1999). Based on the idea that concentrationsof DFe were relatively high in the northeast Atlantic, wereduced Fe availability by the addition of DFOB. In our

2102 Blain et al.
experiments, DFOB addition lowered the phytoplankton ac-tivity compared with the control treatments. This confirmsthat the ambient concentrations of DFe were only moderatelylimiting for the phytoplankton. Even in the bottles with 10nmol L21 of DFOB, the biomass increased slowly. We dis-cuss hereafter which Fe pool could be bioavailable for thephytoplankton community in these experiments. In ourstudy, the ratio [DFOB]/[DFe] was 22, thus higher than theratio of 12.6 used in coastal waters (Hutchins et al. 1999a).In surface Antarctic waters, a ratio between 12 and 25 wasalso enough to preclude the growth of the small diatom Cha-toceros brevis (Timmermans et al. 2001). Based on mea-surements of natural ligand concentrations and apparent sta-bility constants at a station located 48 west of our samplingsites (Boye et al. 2003), we calculated that less than a fewpicomoles of DFe were still bound to natural Fe ligands afterDFOB addition. This residual DFe, not complexed byDFOB, could not be responsible for the observed growth inour bottles with DFOB additions. The bioavailability of Febound to siderophores has been investigated by several au-thors. In a general manner, marine heterotrophic bacteria uti-lize Fe bound to siderophores (Granger and Price 1999). Febound to various exogenous siderophores is taken up by Sy-nechococcus. This has been demonstrated using culture ex-periments (Hutchins et al. 1999b). Evidence has also beenprovided by the same investigators that Fe-siderophores arean available source of Fe for natural populations dominatedby heterotrophic bacteria and Synechococcus.
The issue whether Fe-siderophores are available for eu-karyotes is still a question of debate. Under Fe-deplete con-ditions, diatoms are able to acquire Fe from Fe-DFOB orFe-DFOE complexes (Soria-Dengg and Horstmann 1995). Indiatom cultures, Thalassiosira weissflogii and Skeletonemacostatum also used siderophore-bound Fe, although they pre-ferred Fe bound to tetrapyrol-type ligands (Hutchins et al.1999b). Recently, it was pointed out that caution should beexercised in interpreting the results of DFOB-addition ex-periments because the addition of DFOB might not imposeFe stress uniformly across the biological community (Mar-tinez et al. 2000). Consequently, subpopulations of marinephytoplankton and bacteria might use Fe bound to DFOB.This was also demonstrated under Fe-limited conditions(Granger and Price 1999; Maldonado and Price 1999). Ourresults showing that growth of some phytoplankton size clas-ses is possible even if DFOB is added could reinforce theprevious findings that Fe bound to DFOB can be taken upby cells. However, if this is true, it is not clear why thelargest phytoplankton size class is more efficient than thesmallest size class in taking up Fe from FeDFOB. This leadsus to examine an alternative hypothesis to explain our ex-periments: Fe reserves within the cells. At the end of ourincubations at Sta. 1 (t 5 5.4 d), primary production in theDFOB bottles was 28% of the C uptake measured in thecontrol. This compares quite well with previous results ofsimilar experiments (Wells 1999). Based on short-term in-cubations (7 h), the authors suggested that minor growth oflarge cells might be due to the use of an Fe reserve. Luxu-rious storage of Fe has been demonstrated (Sunda andHuntsman 1995), but it occurs mainly when cells are grow-ing in an Fe-replete environment. In our case, we have dem-
onstrated that large cells are moderately Fe limited. Consid-ering Fe limitation as a single factor controlling growth, thecells should not have large Fe reserves at the beginning ofthe experiment. However, as discussed in the previous sec-tion, at least the microphytoplankton is in fact colimited bya factor other than Fe; this might favor Fe storage within thecells, particularly at Sta. 1. It is also possible that the DFOB–Fe complexes were partly dissociated by sunlight during theincubations (Barbeau et al. 2001). If Fe released by suchphotodissociation was bioavailable, the large cells, beingmore Fe limited, could respond more than in other experi-ments with Fe additions.
Quantitative information on the bioavailability of Fe forthe phytoplankton community is given by the experimentcarried out at Sta. 2. The results summarized in Table 4 showthat the addition of 0.7 nmol L21 DFe provided enough Feto allow the different groups of phytoplankton to grow attheir maximum growth rates. Caveats of this approach havebeen previously discussed (Hutchins et al. 2002); however,useful information on the potential growth rate of the phy-toplankton community or groups within the community canbe inferred. Based on the net increase in Chl a, microphy-toplankton, nanophytoplankton, and picophytoplanktongrowth rates in the control treatment were 2/3 of the maxi-mal growth rate. At first glance, this result can be surprisingconsidering that the magnitude of Fe limitation has oftenbeen linked to cell size (Sunda and Huntsman 1997). Whenthe Fe resource is decreasing, smaller cells take advantagedue to a higher surface-to-volume ratio to maintain a growthrate close to the maximum, while large cells are already Felimited. This results in apparent saturation constants forgrowth rates that are lower for smaller than for larger cells(Blain et al. 2002; Hutchins et al. 2002). We see in the pre-vious section that DFOB addition impacted growth of thethree phytoplankton size classes in different manners, maybedue to the occurrence of Fe reserves. If the contribution ofthe Fe reserve to the growth rate of the cells could be re-moved, the microphytoplankton, which had the largest Fereserve, would have a lower m/mmax than the nanophyto-plankton. The same argument leads to a lower m/mmax fornanophytoplankton than for picophytoplankton. Therefore,the results of our experiments are not in conflict with thegeneral view that Fe limitation is dependent on the cell size.
Saharan dust, a potential source of bioavailable iron—Input of bioavailable Fe by dust deposition at the surface ofthe ocean was postulated to explain an increase in the bio-logical pump in the Southern Ocean during the glacial period(Martin 1990). In oligotrophic areas, dust deposition has alsobeen suggested to explain the switch between nitrogen- andphosphorus-limited regimes (Falkowski 1997). However,there is still little direct evidence of the link between dustdeposition and an increase in biological productivity in sur-face waters (Lenes et al. 2001). One of the reasons is thatdust deposition is of a highly sporadic nature. The area weinvestigated during our cruise is affected by Saharan dustoutbreaks, although the most prominent areas are found inthe tropical North Atlantic Ocean (Moulin et al. 1997). Thegoal of the experiment we conducted at Sta. 3 was to getinsight into the potential role of Saharan dust deposition on
2103Iron availability in the Atlantic Ocean
phytoplankton activity. In our experiment, the amount ofdust added in the incubation bottles (1.34 mg L21) was ad-justed to mimic dust concentrations following a large Sa-haran deposition event in a well-stratified surface layer. Ad-dition of Saharan dust stimulated growth of thephytoplankton community in a very similar manner as ironadditions did (Figs. 3–5). This demonstrated that Saharandust is indeed a potential source of bioavailable Fe for phy-toplankton. Considering that the Saharan dust used in theexperiment is characterized by a total concentrations of Feof 5% (w/w) (Guieu et al. 2002b), the total amount of par-ticulate Fe added to the bottle was 0.25 mg. Most of thedissolution occurred within the first 58 h. We calculated thatthe average amount of Fe resulting from the dissolution ofdust was ;0.6 nmol L21. From production of POC duringthe incubation (0.04 mmol L21) and a ratio Fe/POC 5 1 31025 mol mol21, the amount of Fe taken up by phytoplanktonwas estimated to be less than 0.04 nmol L21 and did notaffect significantly the concentration of DFe. Thus, the per-centage of dissolution was estimated to be 0.06%. Using thesame dust for a dissolution experiment conducted in Milli-Q water, Guieu et al. (2002a) established a relationship be-tween the percentage of dissolution and the concentration ofdust (%diss 5 20.054 3 ln[dust(mg L21)] 1 0.32). Apply-ing this equation to the dust concentration used in the presentstudy, the percentage of dissolution is 0.3%. The differencebetween these estimates could be due to the different mediaof dissolution. Milli-Q is more acidic than seawater andcould dissolve more Fe. Despite the low percentage of dis-solution of Saharan dust in seawater, the amount of Fe re-leased (0.6 nmol L21) was high enough to relieve the Felimitation in this area. This is consistent with the results inTable 2. If Fe was not directly used by the cells because theyare limited by another factor, e.g., major nutrients or light,the additional Fe could be stored. Saharan dust could there-fore be a possible source of Fe for luxurious Fe storage inthe northeast Atlantic Ocean.
References
BARBEAU, K., E. L. RUE, K. W. BRULAND, AND A. BUTTLER. 2001.Photochemical cycling of iron in the surface ocean mediatedby microbial iron(III)-binding ligands. Nature 413: 409–413.
BLAIN, S., P. SEDWICK, B. GRIFFITH, B. QUEGUINER, M. FIALA, P.PONDAVEN, AND P. TREGUER. 2002. Quantification and mod-eling of the iron limitation in the subantarctic zone of theSouthern Ocean. Deep-Sea Res. II 49: 3255–3275.
, AND OTHERS. 2001. A biogeochemical study of the islandmass effect in the context of the iron hypothesis: KerguelenIslands, Southern Ocean. Deep-Sea Res. I 48: 163–187.
BOYD, P. W., AND OTHERS. 2000. A mesoscale phytoplankton bloomin the polar Southern Ocean stimulated by iron fertilization.Nature 407: 695–702.
BOYE, M., A. P. ALDRICH, C. M. G. VAN DEN BERG, J. T. M. DE
JONG, M. VELDHUIS, AND H. J. W. DE BAAR. 2003. Horizontalgradient of the chemical speciation of iron in surface watersof the northeast Atlantic Ocean. Mar. Chem. 80: 129–143.
COALE, K. H., AND OTHERS. 1996. A massive phytoplankton bloominduced by an ecosystem scale iron fertilization experiment inthe equatorial Pacific Ocean. Nature 383: 495–501.
DE BAAR, H. J. W., J. T. M. DE JONG, D. C. E. BAKKER, B. M.LOSCHER, C. VETH, U. BATHMANN, AND V. SMETACEK. 1995.
Importance of iron for plankton blooms and carbon dioxidedrawdown in the Southern Ocean. Nature 373: 412–415.
DE JONG, J. T. M., M. BOYE, V. F. SCHOEMANN, R. F. NOLTING, AND
H. J. W. DE BAAR. 2000. Shipboard techniques based on flowinjection analysis for measuring dissolved Fe, Mn and Al inseawater. J. Environ. Monit. 2: 496–502.
DE LA ROCHA, C. L., D. A. HUTCHINS, M. A. BRZEZINSKI, AND Y.ZHANG. 2000. Effects of iron and zinc deficiency on elementalcomposition and silica production by diatoms. Mar. Ecol.Progr. Ser. 195: 71–79.
FALKOWSKI, P. G. 1997. Evolution of nitrogen cycle and its influ-ence on the biological sequestration of CO2 in the ocean. Na-ture 387: 272–275.
FIRME, F. F., D. A. HUTCHINS, K. W. BRULAND, E. L. RUE, AND D.A. WEEKS. 2003. Spatial and temporal variability in phyto-plankton iron limitation along the California coast and conse-quences for Si, N, and C biogeochemistry. Global Biogeochem.Cycles 17: 1016, doi:10.1029/2001GB001824.
GALL, M. P., R. STRZEPEK, M. MALDONADO, AND P. W. BOYD. 2001.Phytoplankton processes. Part 2: Rates of primary productionand factors controlling algal growth during the Southern OceanIron Release Experiment (SOIREE). Deep-Sea Res. II 48:2571–2590.
GRANGER, J., AND N. M. PRICE. 1999. The importance of sidero-phores in iron nutrition of heterotrophic marine bacteria. Lim-nol. Oceanogr. 44: 541–555.
GUIEU, C., Y. BOZEC, S. BLAIN, C. RIDAME, G. SARTHOU, AND N.LEBLOND. 2002a. Impact of Saharan dust inputs on dissolvediron concentrations in the Mediterranean Sea. Geophys. Res.Lett. 29: 1911–1914.
, M.-D. LOYE-PILOT, C. RIDAME, AND C. THOMAS. 2002b.Chemical characterization of the Saharan dust end-member;some biological implications for the western Mediterranean. J.Geophys. Res., 10.1029/2001JD000582.
HUTCHINS, D. A., AND K. W. BRULAND. 1998. Iron-limited diatomgrowth and Si : N uptake ratios in a coastal upwelling regime.Nature 393: 561–564.
, AND D. A., G. R. DITULLIO, Y. ZHANG, AND K. W. BRU-LAND. 1998. An iron limitation mosaic in the California up-welling regime. Limnol. Oceanogr. 43: 1037–1054.
, V. M. FRANCK, M. A. BRZEZINSKI, AND K. W. BRULAND.1999a. Inducing phytoplankton iron limitation in iron-repletecoastal waters with a strong chelating ligand. Limnol. Ocean-ogr. 44: 1009–1018.
, AND OTHERS. 2002. Phytoplankton iron limitation in theHumbolt Current and Peru upwelling. Limnol. Oceanogr. 47:997–1001.
HUTCHINS, D. A., A. E. WITTER, A. BUTLER, AND G. W. LUTHER
III. 1999b. Competition among marine phytoplankton for dif-ferent chelated iron species. Nature 400: 858–861.
LAES, A., S. BLAIN, P. LAAN, E. ACHTERBERG, G. SARTHOU, AND
H. J. W. DE BAAR. 2003. Deep dissolved iron profiles in theeastern Atlantic in relation to water masses. Geophys. Res.Lett. 30: 1902–1906.
LEBLANC, K. 2002. Variabilite spatiale et temporelle du cycle dusilicium dans divers milieux oligotrophes et mesotrophes.Ph.D. thesis, Univ. de Marseille II.
, B. QUEGUINER, M. FIALA, S. BLAIN, AND J. MORVAN.2002. Biogenic silica distribution and production rate mea-surements using the 32Si method in the Indian sector of theSubantarctic region of the Southern Ocean in summer (Janu-ary–February 1999). Deep-Sea Res. II 49: 3189–3206.
LENES, J. M., AND OTHERS. 2001. Iron fertilization and Trichodes-mium response on the West Florida shelf. Limnol. Oceanogr.46: 1261–1277.
MALDONADO, M. Y., AND N. M. PRICE. 1999. Utilization of iron
2104 Blain et al.
bound to strong organic ligands by plankton communities inthe subarctic Pacific Ocean. Deep-Sea Res. II 46: 2447–2473.
MARTIN, J. H. 1990. Glacial–interglacial CO2 change: The iron hy-pothesis. Paleoceanography 5: 1–13.
, S. E. FITZWATER, R. M. GORDON, C. N. HUNTER, AND S.J. TANNER. 1993. Iron, primary production and carbon-nitrogenflux studies during the JGOFS North Atlantic Bloom Experi-ment. Deep-Sea Res. II 40: 115–134.
MARTINEZ, J. S., M. G. HAYGOOD, AND A. BUTTLER. 2000. Iden-tification of a natural desferioxamine siderophore produced bya marine bacterium. Limnol. Oceanogr. 46: 420–424.
MOULIN, C., C. E. LAMBERT, F. DULAC, AND U. DAYAN. 1997.Control of atmospheric export of dust from North Africa bythe North Atlantic Oscillation. Nature 387: 691–694.
SARTHOU, G., AND C. JEANDEL. 2001. Seasonal variations of ironconcentrations in the Ligurian Sea and iron budget in the West-ern Mediterranean Sea. Mar. Chem. 74: 115–129.
SCIANDRA, A., AND OTHERS. 1997. Growth-compensating phenom-ena in continuous cultures of Dunaliella tertiolecta limited si-multaneously by light and nitrate. Limnol. Oceanogr. 42:1325–1339.
SEDWICK, P. N., S. BLAIN, B. QUEGUINER, F. B. GRIFFITHS, M. FI-ALA, E. BUCCIARELLI, AND M. DENIS. 2002. Resource limita-tions of phytoplankton growth in the Crozet Basin, Subantarc-tic Southern Ocean. Deep-Sea Res. II 49: 3327–3349.
SORIA-DENGG, S., AND U. HORSTMANN. 1995. Ferrioxamines B andE as iron sources for the marine diatom Phaedactylum tricor-nutum. Mar. Ecol. Prog. Ser. 127: 269–277.
STRICKLAND, J. D. H., AND T. R. PARSON. 1972. A practical hand-
book of seawater analysis. J. Fish. Res. Bd. Can. Bull. 167: 1–310.
SUNDA, W. G., AND S. A. HUNTSMAN. 1995. Iron uptake and growthlimitation in oceanic and coastal phytoplankton. Mar. Chem.50: 189–206.
, AND . 1997. Interrelated influence of iron, light andcell size on marine phytoplankton growth. Nature 390: 389–392.
TIMMERMANS, K. R., L. J. A. GERRINGA, H. J. W. DE BAAR, B. VAN
DER WAGT, M. J. W. VELDHUIS, J. T. M. DE JONG, AND P. L.CROOT. 2001. Growth rates of large and small Southern Oceandiatoms in relation to availability of iron in natural seawater.Limnol. Oceanogr. 46: 260–266.
VIDUSSI, F., H. CLAUSTRE, J. BUSTILLOS-GUZMAN, C. CAILLAU, AND
J.-C. MARTY. 1996. Determination of chlorophylls and carot-enoids of marine phytoplankton: Separation of chlorophyll afrom divinyl-chlorophyll a and zeaxanthin from lutein. J.Plankton Res. 18: 2377–2382.
, , B. MANCA, A. LUCHETTA, AND J.-C. MARTY.2001. Phytoplankton pigment distribution in relation to the up-per thermocline circulation in the eastern Mediterranean Seaduring winter. J. Geophys. Res. 106: 939–956.
WELLS, M. 1999. Manipulating iron availability in nearshore waters.Limnol. Oceanogr. 44: 1002–1008.
WELLS, M. L., N. M. PRICE, AND K. W. BRULAND. 1994. Iron lim-itation and the cyanobacterium Synechococcus in equatorialPacific waters. Limnol. Oceanogr. 39: 1481–1486.
Received: 2 December 2003Accepted: 9 June 2004Amended: 6 July 2004
Related Documents