Level 43, Grosvenor Place 225 George Street, Sydney NSW 2000 PO Box N43, Grosvenor Place, NSW 1220 1300-iShares (1300 474 2737) iShares.com.au ■ ISHARES <GO> 21 October 2010 Company Announcements Office ASX Limited ANNUAL REPORT TO FUND SHAREHOLDERS BlackRock Asset Management Australia Limited, on behalf of iShares® (iShares, Inc. and iShares Trust), makes this announcement. The attached ‘Annual Report to Shareholders’ document issued by iShares, Inc was lodged with the United States (“US”) Securities and Exchange Commission in connection with certain iShares® exchange traded funds having a financial year-end of 31 July including those cross-listed on ASX (“Funds”) as per the table below ASX Code Issuer Fund IZZ iShares Trust iShares FTSE/ Xinhua China 25 Note: Unless otherwise stated, financial and performance information is in US dollars. Contact information (websites and phone numbers) are generally US specific. For more information about the Funds (including Australian prospectuses) please go to iShares.com.au or call 1300-iShares (1300 474 2737). *** END *** Disclaimer: Before investing in an iShares fund, you should carefully consider the appropriateness of such products to your circumstances, read the applicable Australian prospectus and ASX announcements relating to the fund, and consult an investment adviser. iShares, Inc. ARBN 125 632 279 formed in Maryland USA; iShares Trust ARBN 125 632 411 organised in Delaware USA. The liability of shareholders is limited. c/- BlackRock Asset Management Australia Limited ABN 33 001 804 566 For personal use only

Welcome message from author
This document is posted to help you gain knowledge. Please leave a comment to let me know what you think about it! Share it to your friends and learn new things together.
Transcript
Level 43, Grosvenor Place225 George Street, Sydney NSW 2000
PO Box N43, Grosvenor Place, NSW 1220
1300-iShares (1300 474 2737)
iShares.com.au ■ ISHARES <GO>
21 October 2010
Company Announcements Office
ASX Limited
ANNUAL REPORT TO FUND SHAREHOLDERS
BlackRock Asset Management Australia Limited, on behalf of iShares® (iShares, Inc. and iShares Trust), makes this announcement.
The attached ‘Annual Report to Shareholders’ document issued by iShares, Inc was lodged with the United States (“US”) Securities and Exchange Commission in connection with certain iShares® exchange traded funds having a financial year-end of 31 July including those cross-listed on ASX (“Funds”) as per the table below
ASX Code Issuer Fund
IZZ iShares Trust iShares FTSE/ Xinhua China 25
Note: Unless otherwise stated, financial and performance information is in US dollars. Contact information (websites and phone numbers) are generally US specific. For more information about the Funds (including Australian prospectuses) please go to iShares.com.au or call 1300-iShares (1300 474 2737).
*** END ***
Disclaimer: Before investing in an iShares fund, you should carefully consider the appropriateness of such products to your circumstances, read the applicable Australian prospectus and ASX announcements relating to the fund, and consult an investment
adviser.
iShares, Inc. ARBN 125 632 279 formed in Maryland USA; iShares Trust ARBN 125 632 411 organised in Delaware USA. The liability of shareholders is limited.
c/- BlackRock Asset Management Australia Limited ABN 33 001 804 566
For
per
sona
l use
onl
y
2010 ANNUAL REPORT TO SHAREHOLDERS
iSHARES® FTSE/XINHUACHINA25INDEXFUNDiSHARES® FTSE SERIESiSHARES® MSCI SERIES
JULY 31, 2010
» Would you prefer to receive materials like this electronically?See inside back cover for details.
iShares FTSE Developed Small Cap ex-North America Index Fund | IFSM | NASDAQ
iShares FTSE/Xinhua China 25 Index Fund | FXI | NYSE Arca
iShares FTSE China (HK Listed) Index Fund | FCHI | NASDAQ
iShares MSCI ACWI Index Fund | ACWI | NASDAQ
iShares MSCI ACWI ex US Index Fund | ACWX | NASDAQ
iShares MSCI All Country Asia ex Japan Index Fund | AAXJ | NASDAQ
iShares MSCI EAFE Growth Index Fund | EFG | NYSE Arca
iShares MSCI EAFE Value Index Fund | EFV | NYSE Arca
iShares MSCI EAFE Small Cap Index Fund | SCZ | NYSE Arca
iShares MSCI Kokusai Index Fund | TOK | NYSE ArcaFor
per
sona
l use
onl
y

For
per
sona
l use
onl
y

Table of Contents
Management’s Discussions of Fund Performance . . . . . . . . . . . . . . . . . . . . . . . . . . . . . . . . . . . . . . . . . . . . . . . . . . . . . . . 1Shareholder Expenses (Unaudited) . . . . . . . . . . . . . . . . . . . . . . . . . . . . . . . . . . . . . . . . . . . . . . . . . . . . . . . . . . . . . . . . . 28Schedules of Investments . . . . . . . . . . . . . . . . . . . . . . . . . . . . . . . . . . . . . . . . . . . . . . . . . . . . . . . . . . . . . . . . . . . . . . . 30
iShares FTSE Developed Small Cap ex-North America Index Fund. . . . . . . . . . . . . . . . . . . . . . . . . . . . . . . . . . . . . . . . . . 30iShares FTSE/Xinhua China 25 Index Fund . . . . . . . . . . . . . . . . . . . . . . . . . . . . . . . . . . . . . . . . . . . . . . . . . . . . . . . . . . 41iShares FTSE China (HK Listed) Index Fund . . . . . . . . . . . . . . . . . . . . . . . . . . . . . . . . . . . . . . . . . . . . . . . . . . . . . . . . . 43iShares MSCI ACWI Index Fund . . . . . . . . . . . . . . . . . . . . . . . . . . . . . . . . . . . . . . . . . . . . . . . . . . . . . . . . . . . . . . . . . . 47iShares MSCI ACWI ex US Index Fund . . . . . . . . . . . . . . . . . . . . . . . . . . . . . . . . . . . . . . . . . . . . . . . . . . . . . . . . . . . . . 62iShares MSCI All Country Asia ex Japan Index Fund . . . . . . . . . . . . . . . . . . . . . . . . . . . . . . . . . . . . . . . . . . . . . . . . . . . 75iShares MSCI EAFE Growth Index Fund . . . . . . . . . . . . . . . . . . . . . . . . . . . . . . . . . . . . . . . . . . . . . . . . . . . . . . . . . . . . 80iShares MSCI EAFE Value Index Fund . . . . . . . . . . . . . . . . . . . . . . . . . . . . . . . . . . . . . . . . . . . . . . . . . . . . . . . . . . . . . 89iShares MSCI EAFE Small Cap Index Fund . . . . . . . . . . . . . . . . . . . . . . . . . . . . . . . . . . . . . . . . . . . . . . . . . . . . . . . . . . 97iShares MSCI Kokusai Index Fund . . . . . . . . . . . . . . . . . . . . . . . . . . . . . . . . . . . . . . . . . . . . . . . . . . . . . . . . . . . . . . . . 114
Financial Statements . . . . . . . . . . . . . . . . . . . . . . . . . . . . . . . . . . . . . . . . . . . . . . . . . . . . . . . . . . . . . . . . . . . . . . . . . . . 131Financial Highlights . . . . . . . . . . . . . . . . . . . . . . . . . . . . . . . . . . . . . . . . . . . . . . . . . . . . . . . . . . . . . . . . . . . . . . . . . . . . 142Notes to Financial Statements . . . . . . . . . . . . . . . . . . . . . . . . . . . . . . . . . . . . . . . . . . . . . . . . . . . . . . . . . . . . . . . . . . . . 152Report of Independent Registered Public Accounting Firm. . . . . . . . . . . . . . . . . . . . . . . . . . . . . . . . . . . . . . . . . . . . . . . . . 164Tax Information (Unaudited) . . . . . . . . . . . . . . . . . . . . . . . . . . . . . . . . . . . . . . . . . . . . . . . . . . . . . . . . . . . . . . . . . . . . . . 165Supplemental Information (Unaudited). . . . . . . . . . . . . . . . . . . . . . . . . . . . . . . . . . . . . . . . . . . . . . . . . . . . . . . . . . . . . . . 166Trustee and Officer Information (Unaudited) . . . . . . . . . . . . . . . . . . . . . . . . . . . . . . . . . . . . . . . . . . . . . . . . . . . . . . . . . . . 176The iShares Family of Funds . . . . . . . . . . . . . . . . . . . . . . . . . . . . . . . . . . . . . . . . . . . . . . . . . . . . . . . . . . . . . . . . . . . . . 180
For
per
sona
l use
onl
y
%%TRANSMSG*** Transmitting Job: B82515 PCN: 001000000 ***%%PCMSG| |00006|Yes|No|09/16/2010 20:08|0|0|Page is valid, no graphics -- Color: N|

THIS PAGE INTENTIONALLY LEFT BLANK.
For
per
sona
l use
onl
y
%%TRANSMSG*** Transmitting Job: B82515 PCN: 002000000 ***%%PCMSG| |00005|Yes|No|09/16/2010 20:08|0|0|Page is valid, no graphics -- Color: N|
Management’s Discussion of Fund PerformanceiSHARES» FTSE DEVELOPED SMALL CAP EX-NORTH AMERICA INDEX FUNDPerformance as of July 31, 2010
NAV MARKET INDEX NAV MARKET INDEX NAV MARKET INDEX
Year Ended 7/31/10 Inception to 7/31/10 Inception to 7/31/10
Average Annual Total Returns Cumulative Total Returns
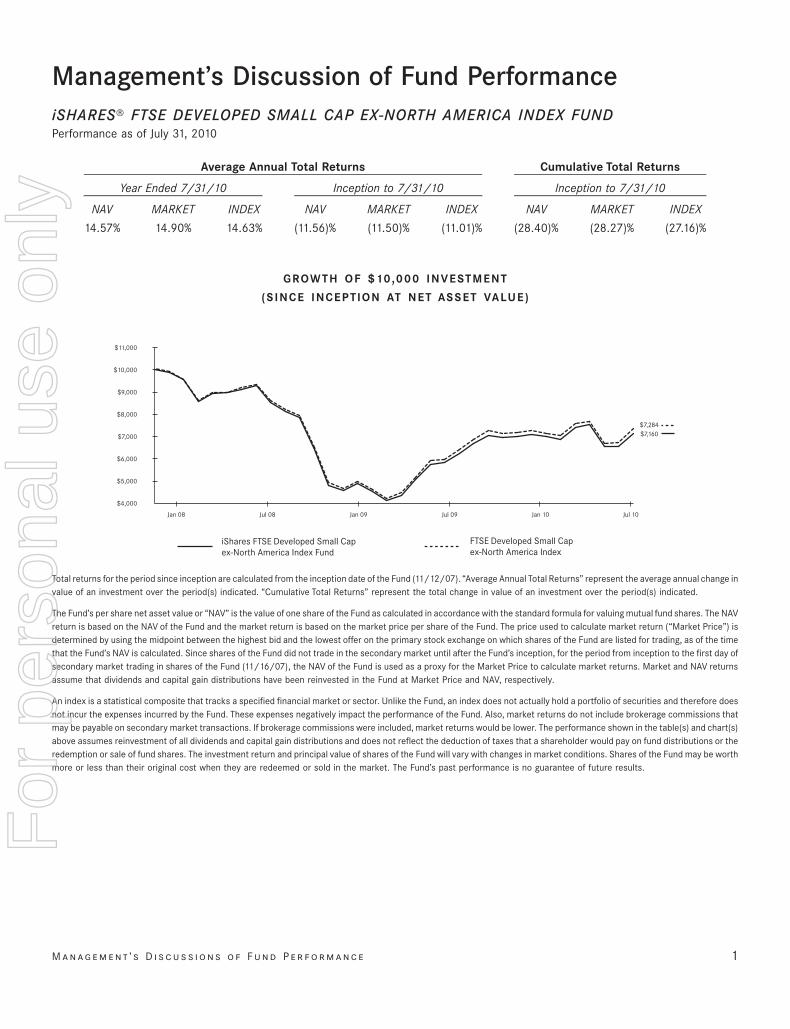
14.57% 14.90% 14.63% (11.56)% (11.50)% (11.01)% (28.40)% (28.27)% (27.16)%
GROWTH OF $10,000 INVESTMENT
(SINCE INCEPTION AT NET ASSET VALUE)
$7,284$7,160
$4,000
$5,000
$6,000
$7,000
$8,000
$9,000
$10,000
$11,000
Jul 10Jan 10Jul 09Jan 09Jul 08Jan 08
FTSE Developed Small Capex-North America Index
iShares FTSE Developed Small Capex-North America Index Fund
Total returns for the period since inception are calculated from the inception date of the Fund (11/12/07). “Average Annual Total Returns” represent the average annual change invalue of an investment over the period(s) indicated. “Cumulative Total Returns” represent the total change in value of an investment over the period(s) indicated.
The Fund’s per share net asset value or “NAV” is the value of one share of the Fund as calculated in accordance with the standard formula for valuing mutual fund shares. The NAVreturn is based on the NAV of the Fund and the market return is based on the market price per share of the Fund. The price used to calculate market return (“Market Price”) isdetermined by using the midpoint between the highest bid and the lowest offer on the primary stock exchange on which shares of the Fund are listed for trading, as of the timethat the Fund’s NAV is calculated. Since shares of the Fund did not trade in the secondary market until after the Fund’s inception, for the period from inception to the first day ofsecondary market trading in shares of the Fund (11/16/07), the NAV of the Fund is used as a proxy for the Market Price to calculate market returns. Market and NAV returnsassume that dividends and capital gain distributions have been reinvested in the Fund at Market Price and NAV, respectively.
An index is a statistical composite that tracks a specified financial market or sector. Unlike the Fund, an index does not actually hold a portfolio of securities and therefore doesnot incur the expenses incurred by the Fund. These expenses negatively impact the performance of the Fund. Also, market returns do not include brokerage commissions thatmay be payable on secondary market transactions. If brokerage commissions were included, market returns would be lower. The performance shown in the table(s) and chart(s)above assumes reinvestment of all dividends and capital gain distributions and does not reflect the deduction of taxes that a shareholder would pay on fund distributions or theredemption or sale of fund shares. The investment return and principal value of shares of the Fund will vary with changes in market conditions. Shares of the Fund may be worthmore or less than their original cost when they are redeemed or sold in the market. The Fund’s past performance is no guarantee of future results.
M a n a g e m e n t ’ s D i s c u s s i o n s o f F u n d P e r f o r m a n c e 1
For
per
sona
l use
onl
y
%%TRANSMSG*** Transmitting Job: B82515 PCN: 003000000 ***%%PCMSG|1 |00009|Yes|No|09/16/2010 20:08|0|0|Page/graphics valid 09/16/2010 20:10 -- Color: N|
SectorPercentage of
Net Assets
PORTFOLIO ALLOCATIONAs of 7/31/10
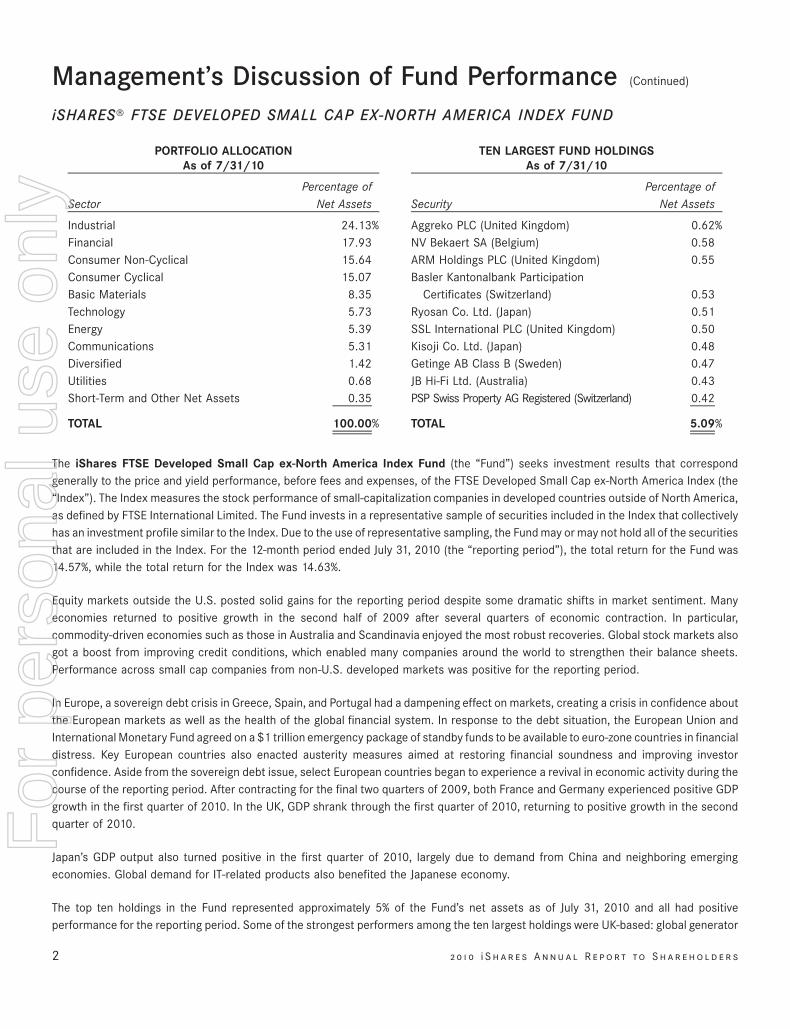
Industrial 24.13%Financial 17.93Consumer Non-Cyclical 15.64Consumer Cyclical 15.07Basic Materials 8.35Technology 5.73Energy 5.39Communications 5.31Diversified 1.42Utilities 0.68Short-Term and Other Net Assets 0.35
TOTAL 100.00%
SecurityPercentage of
Net Assets
TEN LARGEST FUND HOLDINGSAs of 7/31/10
Aggreko PLC (United Kingdom) 0.62%NV Bekaert SA (Belgium) 0.58ARM Holdings PLC (United Kingdom) 0.55Basler Kantonalbank Participation
Certificates (Switzerland) 0.53Ryosan Co. Ltd. (Japan) 0.51SSL International PLC (United Kingdom) 0.50Kisoji Co. Ltd. (Japan) 0.48Getinge AB Class B (Sweden) 0.47JB Hi-Fi Ltd. (Australia) 0.43PSP Swiss Property AG Registered (Switzerland) 0.42
TOTAL 5.09%
The iShares FTSE Developed Small Cap ex-North America Index Fund (the “Fund”) seeks investment results that correspondgenerally to the price and yield performance, before fees and expenses, of the FTSE Developed Small Cap ex-North America Index (the“Index”). The Index measures the stock performance of small-capitalization companies in developed countries outside of North America,as defined by FTSE International Limited. The Fund invests in a representative sample of securities included in the Index that collectivelyhas an investment profile similar to the Index. Due to the use of representative sampling, the Fund may or may not hold all of the securitiesthat are included in the Index. For the 12-month period ended July 31, 2010 (the “reporting period”), the total return for the Fund was14.57%, while the total return for the Index was 14.63%.
Equity markets outside the U.S. posted solid gains for the reporting period despite some dramatic shifts in market sentiment. Manyeconomies returned to positive growth in the second half of 2009 after several quarters of economic contraction. In particular,commodity-driven economies such as those in Australia and Scandinavia enjoyed the most robust recoveries. Global stock markets alsogot a boost from improving credit conditions, which enabled many companies around the world to strengthen their balance sheets.Performance across small cap companies from non-U.S. developed markets was positive for the reporting period.
In Europe, a sovereign debt crisis in Greece, Spain, and Portugal had a dampening effect on markets, creating a crisis in confidence aboutthe European markets as well as the health of the global financial system. In response to the debt situation, the European Union andInternational Monetary Fund agreed on a $1 trillion emergency package of standby funds to be available to euro-zone countries in financialdistress. Key European countries also enacted austerity measures aimed at restoring financial soundness and improving investorconfidence. Aside from the sovereign debt issue, select European countries began to experience a revival in economic activity during thecourse of the reporting period. After contracting for the final two quarters of 2009, both France and Germany experienced positive GDPgrowth in the first quarter of 2010. In the UK, GDP shrank through the first quarter of 2010, returning to positive growth in the secondquarter of 2010.
Japan’s GDP output also turned positive in the first quarter of 2010, largely due to demand from China and neighboring emergingeconomies. Global demand for IT-related products also benefited the Japanese economy.
The top ten holdings in the Fund represented approximately 5% of the Fund’s net assets as of July 31, 2010 and all had positiveperformance for the reporting period. Some of the strongest performers among the ten largest holdings were UK-based: global generator
2 2 0 1 0 i S h a r e s A n n u a l R e p o r t to S h a r e h o l d e r s
Management’s Discussion of Fund Performance (Continued)
iSHARES» FTSE DEVELOPED SMALL CAP EX-NORTH AMERICA INDEX FUND
For
per
sona
l use
onl
y
%%TRANSMSG*** Transmitting Job: B82515 PCN: 004000000 ***%%PCMSG|2 |00008|Yes|No|09/16/2010 20:08|0|0|Page is valid, no graphics -- Color: N|
rental company Aggreko PLC, digital technology company ARM Holdings PLC, and consumer products giant SSL International PLC, allhaving delivered triple-digit returns. Two Japanese companies, electronic component company Ryosan Co. Ltd. and restaurant companyKisoji Co. Ltd., posted modest gains.
M a n a g e m e n t ’ s D i s c u s s i o n s o f F u n d P e r f o r m a n c e 3
Management’s Discussion of Fund Performance (Continued)
iSHARES» FTSE DEVELOPED SMALL CAP EX-NORTH AMERICA INDEX FUND
For
per
sona
l use
onl
y
%%TRANSMSG*** Transmitting Job: B82515 PCN: 005000000 ***%%PCMSG|3 |00008|Yes|No|09/16/2010 20:08|0|0|Page is valid, no graphics -- Color: N|
Management’s Discussion of Fund PerformanceiSHARES» FTSE/XINHUA CHINA 25 INDEX FUNDPerformance as of July 31, 2010
NAV MARKET INDEX NAV MARKET INDEX NAV MARKET INDEX
Year Ended 7/31/10 Five Years Ended 7/31/10 Inception to 7/31/10
Average Annual Total Returns
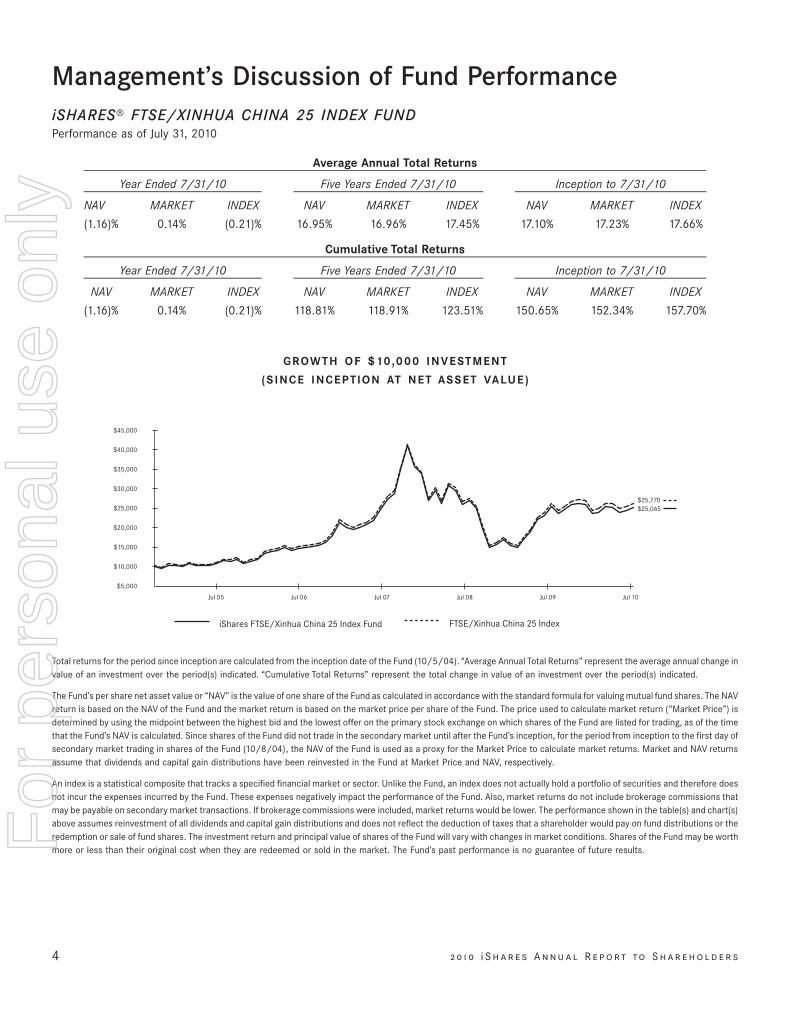
(1.16)% 0.14% (0.21)% 16.95% 16.96% 17.45% 17.10% 17.23% 17.66%
NAV MARKET INDEX NAV MARKET INDEX NAV MARKET INDEX
Year Ended 7/31/10 Five Years Ended 7/31/10 Inception to 7/31/10
Cumulative Total Returns
(1.16)% 0.14% (0.21)% 118.81% 118.91% 123.51% 150.65% 152.34% 157.70%
GROWTH OF $10,000 INVESTMENT
(SINCE INCEPTION AT NET ASSET VALUE)
$25,065$25,770
$5,000
$10,000
$15,000
$20,000
$25,000
$30,000
$35,000
$40,000
$45,000
Jul 10Jul 09Jul 08Jul 07Jul 06Jul 05
FTSE/Xinhua China 25 IndexiShares FTSE/Xinhua China 25 Index Fund
Total returns for the period since inception are calculated from the inception date of the Fund (10/5/04). “Average Annual Total Returns” represent the average annual change invalue of an investment over the period(s) indicated. “Cumulative Total Returns” represent the total change in value of an investment over the period(s) indicated.
The Fund’s per share net asset value or “NAV” is the value of one share of the Fund as calculated in accordance with the standard formula for valuing mutual fund shares. The NAVreturn is based on the NAV of the Fund and the market return is based on the market price per share of the Fund. The price used to calculate market return (“Market Price”) isdetermined by using the midpoint between the highest bid and the lowest offer on the primary stock exchange on which shares of the Fund are listed for trading, as of the timethat the Fund’s NAV is calculated. Since shares of the Fund did not trade in the secondary market until after the Fund’s inception, for the period from inception to the first day ofsecondary market trading in shares of the Fund (10/8/04), the NAV of the Fund is used as a proxy for the Market Price to calculate market returns. Market and NAV returnsassume that dividends and capital gain distributions have been reinvested in the Fund at Market Price and NAV, respectively.
An index is a statistical composite that tracks a specified financial market or sector. Unlike the Fund, an index does not actually hold a portfolio of securities and therefore doesnot incur the expenses incurred by the Fund. These expenses negatively impact the performance of the Fund. Also, market returns do not include brokerage commissions thatmay be payable on secondary market transactions. If brokerage commissions were included, market returns would be lower. The performance shown in the table(s) and chart(s)above assumes reinvestment of all dividends and capital gain distributions and does not reflect the deduction of taxes that a shareholder would pay on fund distributions or theredemption or sale of fund shares. The investment return and principal value of shares of the Fund will vary with changes in market conditions. Shares of the Fund may be worthmore or less than their original cost when they are redeemed or sold in the market. The Fund’s past performance is no guarantee of future results.
4 2 0 1 0 i S h a r e s A n n u a l R e p o r t to S h a r e h o l d e r s
For
per
sona
l use
onl
y
%%TRANSMSG*** Transmitting Job: B82515 PCN: 006000000 ***%%PCMSG|4 |00011|Yes|No|09/17/2010 01:43|0|0|Page/graphics valid 09/17/2010 01:44 -- Color: N|
SectorPercentage of
Net Assets
PORTFOLIO ALLOCATIONAs of 7/31/10
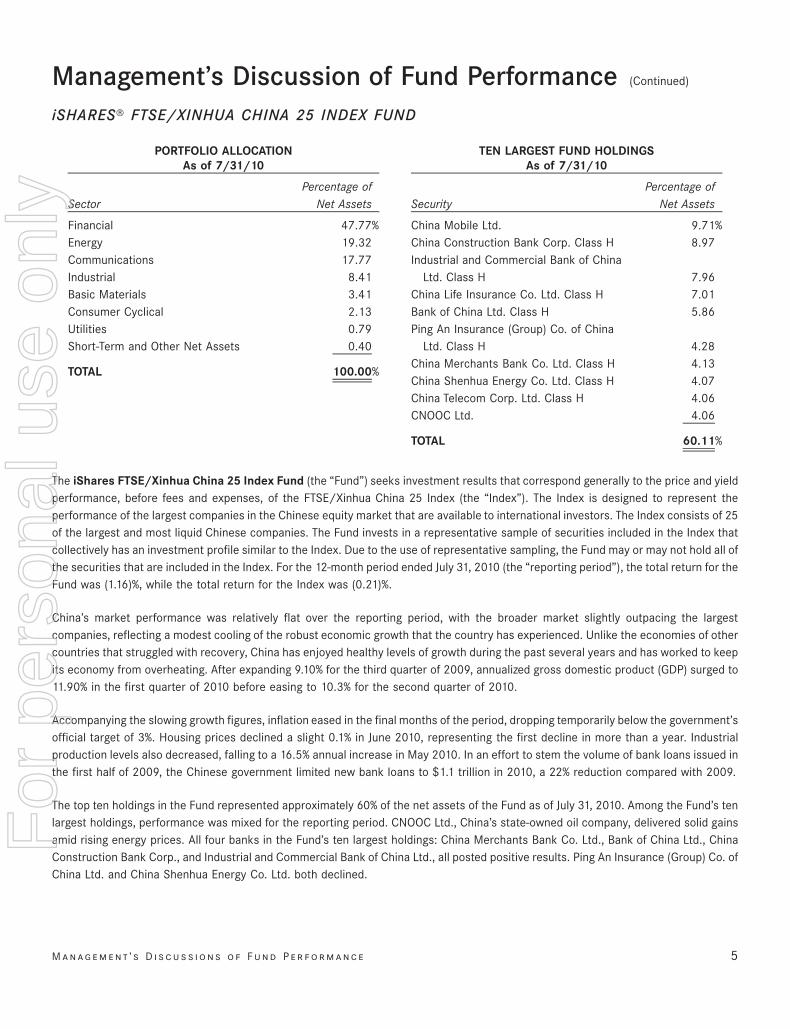
Financial 47.77%Energy 19.32Communications 17.77Industrial 8.41Basic Materials 3.41Consumer Cyclical 2.13Utilities 0.79Short-Term and Other Net Assets 0.40
TOTAL 100.00%
SecurityPercentage of
Net Assets
TEN LARGEST FUND HOLDINGSAs of 7/31/10
China Mobile Ltd. 9.71%China Construction Bank Corp. Class H 8.97Industrial and Commercial Bank of China
Ltd. Class H 7.96China Life Insurance Co. Ltd. Class H 7.01Bank of China Ltd. Class H 5.86Ping An Insurance (Group) Co. of China
Ltd. Class H 4.28China Merchants Bank Co. Ltd. Class H 4.13China Shenhua Energy Co. Ltd. Class H 4.07China Telecom Corp. Ltd. Class H 4.06CNOOC Ltd. 4.06
TOTAL 60.11%
The iShares FTSE/Xinhua China 25 Index Fund (the “Fund”) seeks investment results that correspond generally to the price and yieldperformance, before fees and expenses, of the FTSE/Xinhua China 25 Index (the “Index”). The Index is designed to represent theperformance of the largest companies in the Chinese equity market that are available to international investors. The Index consists of 25of the largest and most liquid Chinese companies. The Fund invests in a representative sample of securities included in the Index thatcollectively has an investment profile similar to the Index. Due to the use of representative sampling, the Fund may or may not hold all ofthe securities that are included in the Index. For the 12-month period ended July 31, 2010 (the “reporting period”), the total return for theFund was (1.16)%, while the total return for the Index was (0.21)%.
China’s market performance was relatively flat over the reporting period, with the broader market slightly outpacing the largestcompanies, reflecting a modest cooling of the robust economic growth that the country has experienced. Unlike the economies of othercountries that struggled with recovery, China has enjoyed healthy levels of growth during the past several years and has worked to keepits economy from overheating. After expanding 9.10% for the third quarter of 2009, annualized gross domestic product (GDP) surged to11.90% in the first quarter of 2010 before easing to 10.3% for the second quarter of 2010.
Accompanying the slowing growth figures, inflation eased in the final months of the period, dropping temporarily below the government’sofficial target of 3%. Housing prices declined a slight 0.1% in June 2010, representing the first decline in more than a year. Industrialproduction levels also decreased, falling to a 16.5% annual increase in May 2010. In an effort to stem the volume of bank loans issued inthe first half of 2009, the Chinese government limited new bank loans to $1.1 trillion in 2010, a 22% reduction compared with 2009.
The top ten holdings in the Fund represented approximately 60% of the net assets of the Fund as of July 31, 2010. Among the Fund’s tenlargest holdings, performance was mixed for the reporting period. CNOOC Ltd., China’s state-owned oil company, delivered solid gainsamid rising energy prices. All four banks in the Fund’s ten largest holdings: China Merchants Bank Co. Ltd., Bank of China Ltd., ChinaConstruction Bank Corp., and Industrial and Commercial Bank of China Ltd., all posted positive results. Ping An Insurance (Group) Co. ofChina Ltd. and China Shenhua Energy Co. Ltd. both declined.
M a n a g e m e n t ’ s D i s c u s s i o n s o f F u n d P e r f o r m a n c e 5
Management’s Discussion of Fund Performance (Continued)
iSHARES» FTSE/XINHUA CHINA 25 INDEX FUND
For
per
sona
l use
onl
y
%%TRANSMSG*** Transmitting Job: B82515 PCN: 007000000 ***%%PCMSG|5 |00009|Yes|No|09/16/2010 20:08|0|0|Page is valid, no graphics -- Color: N|
Management’s Discussion of Fund PerformanceiSHARES» FTSE CHINA (HK LISTED) INDEX FUNDPerformance as of July 31, 2010
NAV MARKET INDEX NAV MARKET INDEX NAV MARKET INDEX
Year Ended 7/31/10 Inception to 7/31/10 Inception to 7/31/10
Average Annual Total Returns Cumulative Total Returns
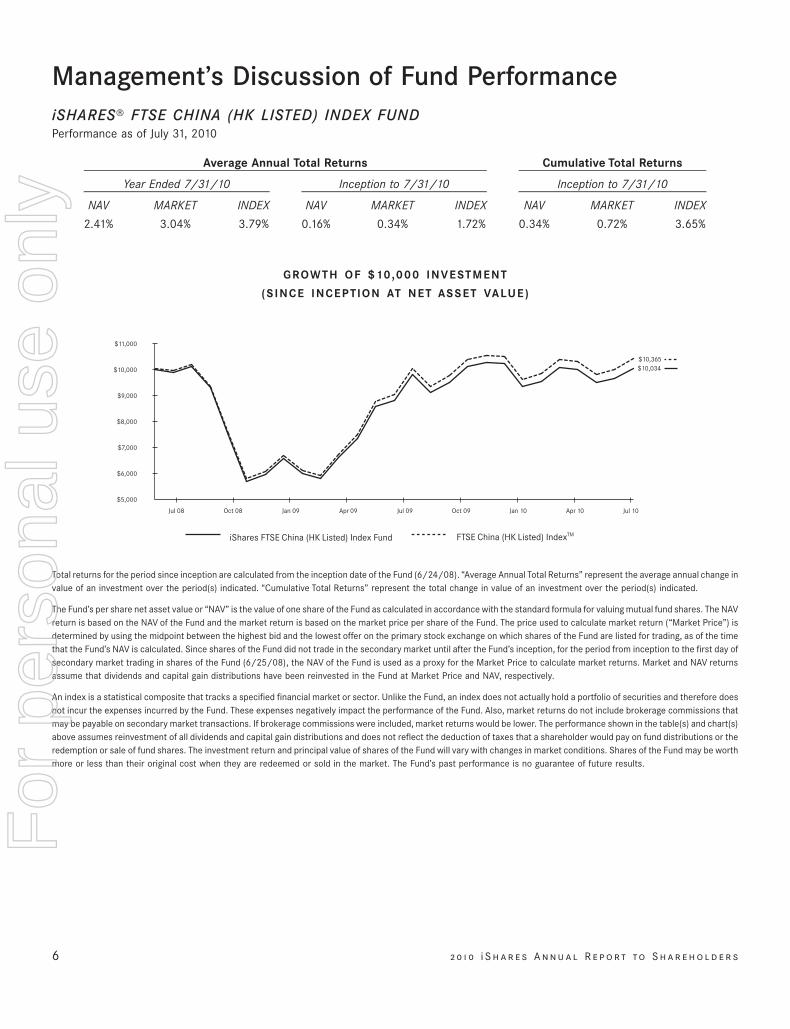
2.41% 3.04% 3.79% 0.16% 0.34% 1.72% 0.34% 0.72% 3.65%
GROWTH OF $10,000 INVESTMENT
(SINCE INCEPTION AT NET ASSET VALUE)
$10,365$10,034
$5,000
$6,000
$7,000
$8,000
$9,000
$10,000
$11,000
Jul 10Jan 10 Apr 10Jul 09 Oct 09Jan 09 Apr 09Oct 08Jul 08
FTSE China (HK Listed) IndexTMiShares FTSE China (HK Listed) Index Fund
Total returns for the period since inception are calculated from the inception date of the Fund (6/24/08). “Average Annual Total Returns” represent the average annual change invalue of an investment over the period(s) indicated. “Cumulative Total Returns” represent the total change in value of an investment over the period(s) indicated.
The Fund’s per share net asset value or “NAV” is the value of one share of the Fund as calculated in accordance with the standard formula for valuing mutual fund shares. The NAVreturn is based on the NAV of the Fund and the market return is based on the market price per share of the Fund. The price used to calculate market return (“Market Price”) isdetermined by using the midpoint between the highest bid and the lowest offer on the primary stock exchange on which shares of the Fund are listed for trading, as of the timethat the Fund’s NAV is calculated. Since shares of the Fund did not trade in the secondary market until after the Fund’s inception, for the period from inception to the first day ofsecondary market trading in shares of the Fund (6/25/08), the NAV of the Fund is used as a proxy for the Market Price to calculate market returns. Market and NAV returnsassume that dividends and capital gain distributions have been reinvested in the Fund at Market Price and NAV, respectively.
An index is a statistical composite that tracks a specified financial market or sector. Unlike the Fund, an index does not actually hold a portfolio of securities and therefore doesnot incur the expenses incurred by the Fund. These expenses negatively impact the performance of the Fund. Also, market returns do not include brokerage commissions thatmay be payable on secondary market transactions. If brokerage commissions were included, market returns would be lower. The performance shown in the table(s) and chart(s)above assumes reinvestment of all dividends and capital gain distributions and does not reflect the deduction of taxes that a shareholder would pay on fund distributions or theredemption or sale of fund shares. The investment return and principal value of shares of the Fund will vary with changes in market conditions. Shares of the Fund may be worthmore or less than their original cost when they are redeemed or sold in the market. The Fund’s past performance is no guarantee of future results.
6 2 0 1 0 i S h a r e s A n n u a l R e p o r t to S h a r e h o l d e r s
For
per
sona
l use
onl
y
%%TRANSMSG*** Transmitting Job: B82515 PCN: 008000000 ***%%PCMSG|6 |00011|Yes|No|09/16/2010 20:08|0|0|Page/graphics valid 09/16/2010 20:10 -- Color: N|
SectorPercentage of
Net Assets
PORTFOLIO ALLOCATIONAs of 7/31/10
Financial 46.63%Energy 17.57Communications 14.79Industrial 7.58Diversified 3.23Consumer Cyclical 2.88Consumer Non-Cyclical 2.82Basic Materials 2.63Utilities 1.41Technology 0.12Short-Term and Other Net Assets 0.34
TOTAL 100.00%
SecurityPercentage of
Net Assets
TEN LARGEST FUND HOLDINGSAs of 7/31/10
China Mobile Ltd. 11.08%China Construction Bank Corp. Class H 10.45Industrial and Commercial Bank of China
Ltd. Class H 8.68China Life Insurance Co. Ltd. Class H 6.03CNOOC Ltd. 5.52Bank of China Ltd. Class H 5.51PetroChina Co. Ltd. Class H 4.12Ping An Insurance (Group) Co. of China
Ltd. Class H 3.29China Petroleum & Chemical Corp.
Class H 2.52China Shenhua Energy Co. Ltd. Class H 2.41
TOTAL 59.61%
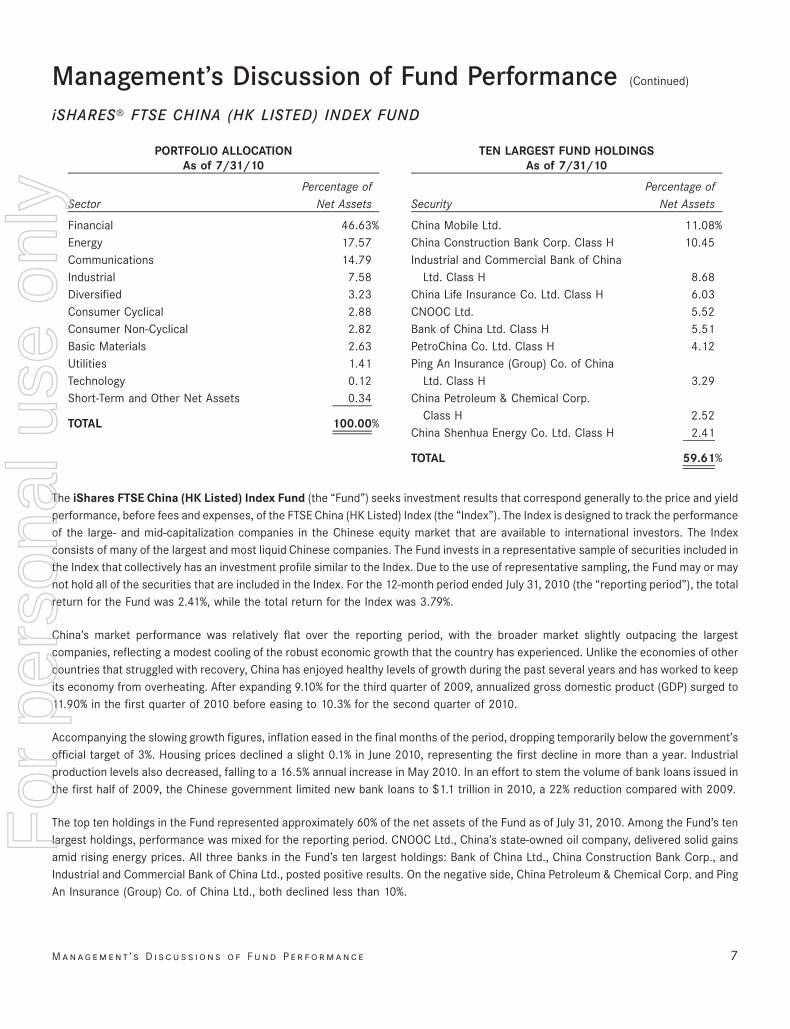
The iShares FTSE China (HK Listed) Index Fund (the “Fund”) seeks investment results that correspond generally to the price and yieldperformance, before fees and expenses, of the FTSE China (HK Listed) Index (the “Index”). The Index is designed to track the performanceof the large- and mid-capitalization companies in the Chinese equity market that are available to international investors. The Indexconsists of many of the largest and most liquid Chinese companies. The Fund invests in a representative sample of securities included inthe Index that collectively has an investment profile similar to the Index. Due to the use of representative sampling, the Fund may or maynot hold all of the securities that are included in the Index. For the 12-month period ended July 31, 2010 (the “reporting period”), the totalreturn for the Fund was 2.41%, while the total return for the Index was 3.79%.
China’s market performance was relatively flat over the reporting period, with the broader market slightly outpacing the largestcompanies, reflecting a modest cooling of the robust economic growth that the country has experienced. Unlike the economies of othercountries that struggled with recovery, China has enjoyed healthy levels of growth during the past several years and has worked to keepits economy from overheating. After expanding 9.10% for the third quarter of 2009, annualized gross domestic product (GDP) surged to11.90% in the first quarter of 2010 before easing to 10.3% for the second quarter of 2010.
Accompanying the slowing growth figures, inflation eased in the final months of the period, dropping temporarily below the government’sofficial target of 3%. Housing prices declined a slight 0.1% in June 2010, representing the first decline in more than a year. Industrialproduction levels also decreased, falling to a 16.5% annual increase in May 2010. In an effort to stem the volume of bank loans issued inthe first half of 2009, the Chinese government limited new bank loans to $1.1 trillion in 2010, a 22% reduction compared with 2009.
The top ten holdings in the Fund represented approximately 60% of the net assets of the Fund as of July 31, 2010. Among the Fund’s tenlargest holdings, performance was mixed for the reporting period. CNOOC Ltd., China’s state-owned oil company, delivered solid gainsamid rising energy prices. All three banks in the Fund’s ten largest holdings: Bank of China Ltd., China Construction Bank Corp., andIndustrial and Commercial Bank of China Ltd., posted positive results. On the negative side, China Petroleum & Chemical Corp. and PingAn Insurance (Group) Co. of China Ltd., both declined less than 10%.
M a n a g e m e n t ’ s D i s c u s s i o n s o f F u n d P e r f o r m a n c e 7
Management’s Discussion of Fund Performance (Continued)
iSHARES» FTSE CHINA (HK LISTED) INDEX FUND
For
per
sona
l use
onl
y
%%TRANSMSG*** Transmitting Job: B82515 PCN: 009000000 ***%%PCMSG|7 |00007|Yes|No|09/16/2010 20:08|0|0|Page is valid, no graphics -- Color: N|
Management’s Discussion of Fund PerformanceiSHARES» MSCI ACWI INDEX FUNDPerformance as of July 31, 2010
NAV MARKET INDEX NAV MARKET INDEX NAV MARKET INDEX
Year Ended 7/31/10 Inception to 7/31/10 Inception to 7/31/10
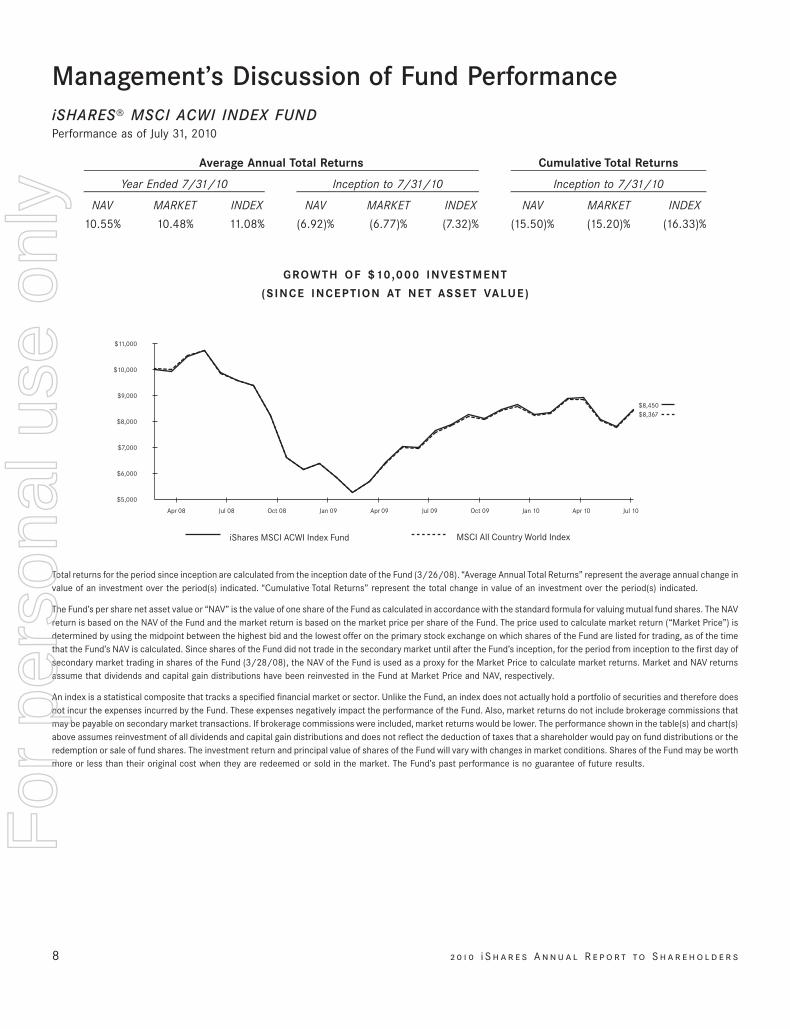
Average Annual Total Returns Cumulative Total Returns
10.55% 10.48% 11.08% (6.92)% (6.77)% (7.32)% (15.50)% (15.20)% (16.33)%
GROWTH OF $10,000 INVESTMENT
(SINCE INCEPTION AT NET ASSET VALUE)
$8,450$8,367
$5,000
$6,000
$7,000
$8,000
$9,000
$10,000
$11,000
Jul 10Oct 09 Jan 10 Apr 10Apr 09 Jul 09Oct 08 Jan 09Jul 08Apr 08
MSCI All Country World Index iShares MSCI ACWI Index Fund
Total returns for the period since inception are calculated from the inception date of the Fund (3/26/08). “Average Annual Total Returns” represent the average annual change invalue of an investment over the period(s) indicated. “Cumulative Total Returns” represent the total change in value of an investment over the period(s) indicated.
The Fund’s per share net asset value or “NAV” is the value of one share of the Fund as calculated in accordance with the standard formula for valuing mutual fund shares. The NAVreturn is based on the NAV of the Fund and the market return is based on the market price per share of the Fund. The price used to calculate market return (“Market Price”) isdetermined by using the midpoint between the highest bid and the lowest offer on the primary stock exchange on which shares of the Fund are listed for trading, as of the timethat the Fund’s NAV is calculated. Since shares of the Fund did not trade in the secondary market until after the Fund’s inception, for the period from inception to the first day ofsecondary market trading in shares of the Fund (3/28/08), the NAV of the Fund is used as a proxy for the Market Price to calculate market returns. Market and NAV returnsassume that dividends and capital gain distributions have been reinvested in the Fund at Market Price and NAV, respectively.
An index is a statistical composite that tracks a specified financial market or sector. Unlike the Fund, an index does not actually hold a portfolio of securities and therefore doesnot incur the expenses incurred by the Fund. These expenses negatively impact the performance of the Fund. Also, market returns do not include brokerage commissions thatmay be payable on secondary market transactions. If brokerage commissions were included, market returns would be lower. The performance shown in the table(s) and chart(s)above assumes reinvestment of all dividends and capital gain distributions and does not reflect the deduction of taxes that a shareholder would pay on fund distributions or theredemption or sale of fund shares. The investment return and principal value of shares of the Fund will vary with changes in market conditions. Shares of the Fund may be worthmore or less than their original cost when they are redeemed or sold in the market. The Fund’s past performance is no guarantee of future results.
8 2 0 1 0 i S h a r e s A n n u a l R e p o r t to S h a r e h o l d e r s
For
per
sona
l use
onl
y
%%TRANSMSG*** Transmitting Job: B82515 PCN: 010000000 ***%%PCMSG|8 |00009|Yes|No|09/16/2010 20:08|0|0|Page/graphics valid 09/16/2010 20:10 -- Color: N|
SectorPercentage of
Net Assets
PORTFOLIO ALLOCATIONAs of 7/31/10
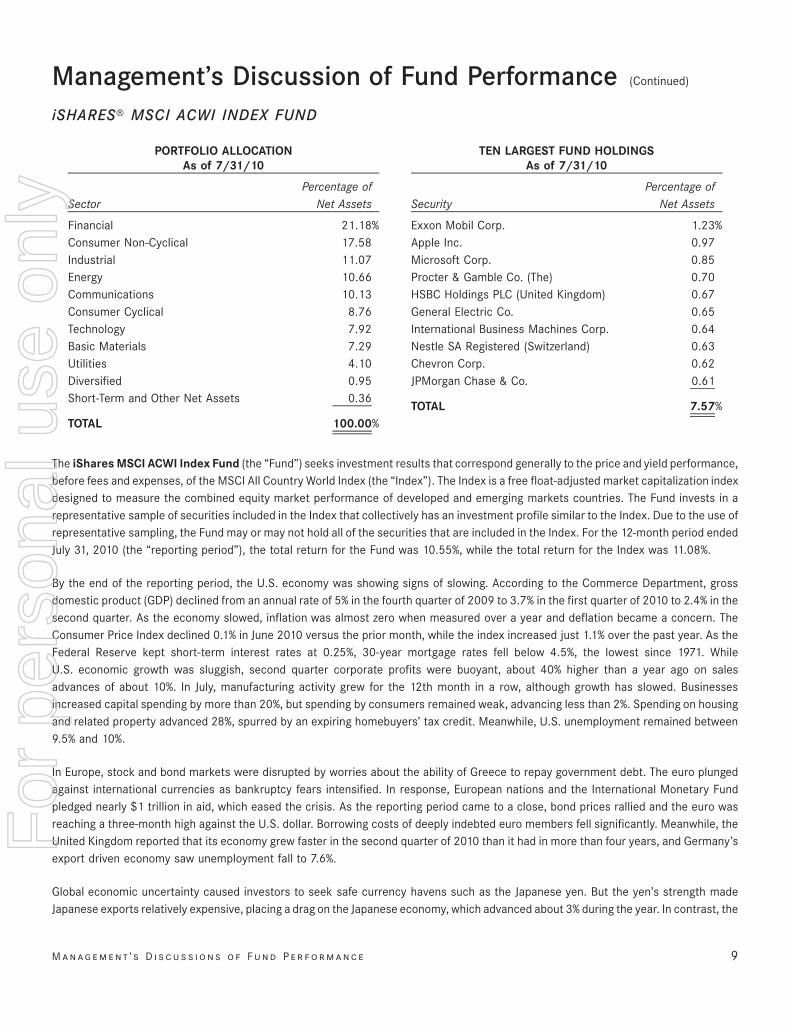
Financial 21.18%Consumer Non-Cyclical 17.58Industrial 11.07Energy 10.66Communications 10.13Consumer Cyclical 8.76Technology 7.92Basic Materials 7.29Utilities 4.10Diversified 0.95Short-Term and Other Net Assets 0.36
TOTAL 100.00%
SecurityPercentage of
Net Assets
TEN LARGEST FUND HOLDINGSAs of 7/31/10
Exxon Mobil Corp. 1.23%Apple Inc. 0.97Microsoft Corp. 0.85Procter & Gamble Co. (The) 0.70HSBC Holdings PLC (United Kingdom) 0.67General Electric Co. 0.65International Business Machines Corp. 0.64Nestle SA Registered (Switzerland) 0.63Chevron Corp. 0.62JPMorgan Chase & Co. 0.61
TOTAL 7.57%
The iShares MSCI ACWI Index Fund (the “Fund”) seeks investment results that correspond generally to the price and yield performance,before fees and expenses, of the MSCI All Country World Index (the “Index”). The Index is a free float-adjusted market capitalization indexdesigned to measure the combined equity market performance of developed and emerging markets countries. The Fund invests in arepresentative sample of securities included in the Index that collectively has an investment profile similar to the Index. Due to the use ofrepresentative sampling, the Fund may or may not hold all of the securities that are included in the Index. For the 12-month period endedJuly 31, 2010 (the “reporting period”), the total return for the Fund was 10.55%, while the total return for the Index was 11.08%.
By the end of the reporting period, the U.S. economy was showing signs of slowing. According to the Commerce Department, grossdomestic product (GDP) declined from an annual rate of 5% in the fourth quarter of 2009 to 3.7% in the first quarter of 2010 to 2.4% in thesecond quarter. As the economy slowed, inflation was almost zero when measured over a year and deflation became a concern. TheConsumer Price Index declined 0.1% in June 2010 versus the prior month, while the index increased just 1.1% over the past year. As theFederal Reserve kept short-term interest rates at 0.25%, 30-year mortgage rates fell below 4.5%, the lowest since 1971. WhileU.S. economic growth was sluggish, second quarter corporate profits were buoyant, about 40% higher than a year ago on salesadvances of about 10%. In July, manufacturing activity grew for the 12th month in a row, although growth has slowed. Businessesincreased capital spending by more than 20%, but spending by consumers remained weak, advancing less than 2%. Spending on housingand related property advanced 28%, spurred by an expiring homebuyers’ tax credit. Meanwhile, U.S. unemployment remained between9.5% and 10%.
In Europe, stock and bond markets were disrupted by worries about the ability of Greece to repay government debt. The euro plungedagainst international currencies as bankruptcy fears intensified. In response, European nations and the International Monetary Fundpledged nearly $1 trillion in aid, which eased the crisis. As the reporting period came to a close, bond prices rallied and the euro wasreaching a three-month high against the U.S. dollar. Borrowing costs of deeply indebted euro members fell significantly. Meanwhile, theUnited Kingdom reported that its economy grew faster in the second quarter of 2010 than it had in more than four years, and Germany’sexport driven economy saw unemployment fall to 7.6%.
Global economic uncertainty caused investors to seek safe currency havens such as the Japanese yen. But the yen’s strength madeJapanese exports relatively expensive, placing a drag on the Japanese economy, which advanced about 3% during the year. In contrast, the
M a n a g e m e n t ’ s D i s c u s s i o n s o f F u n d P e r f o r m a n c e 9
Management’s Discussion of Fund Performance (Continued)
iSHARES» MSCI ACWI INDEX FUND
For
per
sona
l use
onl
y
%%TRANSMSG*** Transmitting Job: B82515 PCN: 011000000 ***%%PCMSG|9 |00009|Yes|No|09/16/2010 20:08|0|0|Page is valid, no graphics -- Color: N|
Chinese government reiterated its priority of fast economic growth, signaling that it was backing away from moves made earlier in 2010 toreduce business activity. As it continued to post 10% growth, China surpassed Japan as the second largest economy in the world.
Of the Fund’s ten largest holdings as of July 31, 2010, nine posted gains during the reporting period. Apple Inc. was the strongestperformer, followed by Nestle SA, General Electric Co., Chevron Corp. and The Procter & Gamble Co. The largest holding in the Fund, ExxonMobil Corp. posted a loss for the period.
10 2 0 1 0 i S h a r e s A n n u a l R e p o r t to S h a r e h o l d e r s
Management’s Discussion of Fund Performance (Continued)
iSHARES» MSCI ACWI INDEX FUND
For
per
sona
l use
onl
y
%%TRANSMSG*** Transmitting Job: B82515 PCN: 012000000 ***%%PCMSG|10 |00005|Yes|No|09/16/2010 20:08|0|0|Page is valid, no graphics -- Color: N|
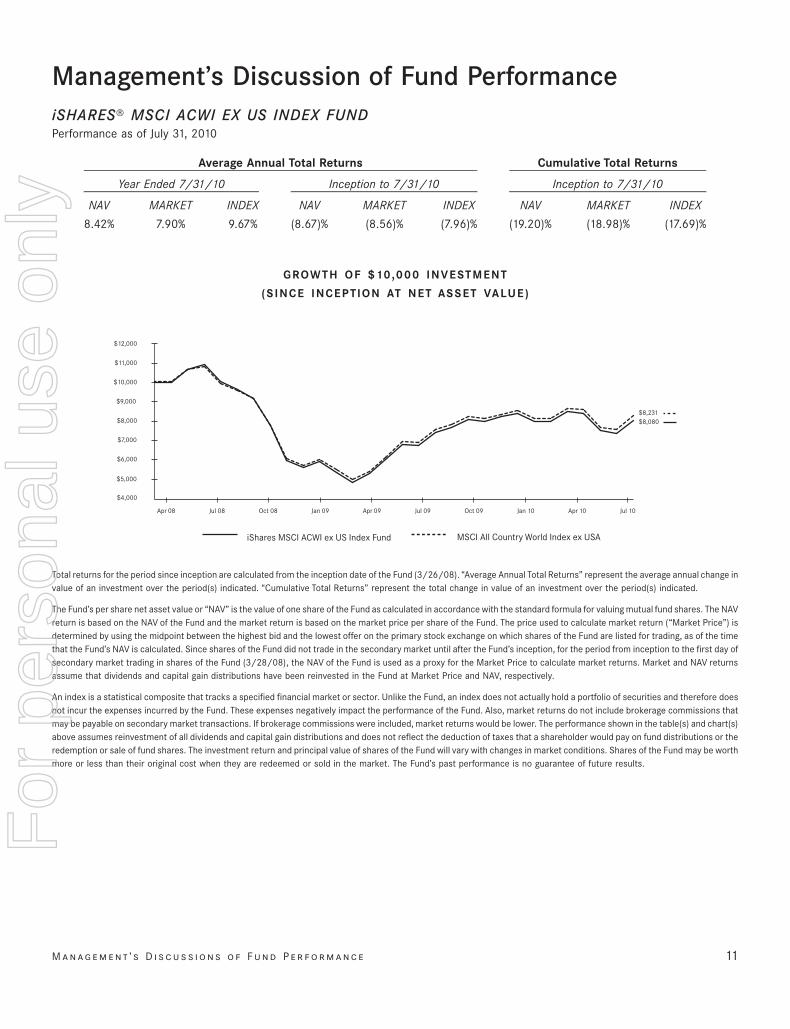
Management’s Discussion of Fund PerformanceiSHARES» MSCI ACWI EX US INDEX FUNDPerformance as of July 31, 2010
NAV MARKET INDEX NAV MARKET INDEX NAV MARKET INDEX
Year Ended 7/31/10 Inception to 7/31/10 Inception to 7/31/10
Average Annual Total Returns Cumulative Total Returns
8.42% 7.90% 9.67% (8.67)% (8.56)% (7.96)% (19.20)% (18.98)% (17.69)%
GROWTH OF $10,000 INVESTMENT
(SINCE INCEPTION AT NET ASSET VALUE)
$8,231$8,080
Jan 09Oct 08Apr 08 Jul 08 Apr 10 Jul 10Jan 10Oct 09Jul 09Apr 09
$4,000
$5,000
$6,000
$7,000
$8,000
$9,000
$10,000
$11,000
$12,000
MSCI All Country World Index ex USAiShares MSCI ACWI ex US Index Fund
Total returns for the period since inception are calculated from the inception date of the Fund (3/26/08). “Average Annual Total Returns” represent the average annual change invalue of an investment over the period(s) indicated. “Cumulative Total Returns” represent the total change in value of an investment over the period(s) indicated.
The Fund’s per share net asset value or “NAV” is the value of one share of the Fund as calculated in accordance with the standard formula for valuing mutual fund shares. The NAVreturn is based on the NAV of the Fund and the market return is based on the market price per share of the Fund. The price used to calculate market return (“Market Price”) isdetermined by using the midpoint between the highest bid and the lowest offer on the primary stock exchange on which shares of the Fund are listed for trading, as of the timethat the Fund’s NAV is calculated. Since shares of the Fund did not trade in the secondary market until after the Fund’s inception, for the period from inception to the first day ofsecondary market trading in shares of the Fund (3/28/08), the NAV of the Fund is used as a proxy for the Market Price to calculate market returns. Market and NAV returnsassume that dividends and capital gain distributions have been reinvested in the Fund at Market Price and NAV, respectively.
An index is a statistical composite that tracks a specified financial market or sector. Unlike the Fund, an index does not actually hold a portfolio of securities and therefore doesnot incur the expenses incurred by the Fund. These expenses negatively impact the performance of the Fund. Also, market returns do not include brokerage commissions thatmay be payable on secondary market transactions. If brokerage commissions were included, market returns would be lower. The performance shown in the table(s) and chart(s)above assumes reinvestment of all dividends and capital gain distributions and does not reflect the deduction of taxes that a shareholder would pay on fund distributions or theredemption or sale of fund shares. The investment return and principal value of shares of the Fund will vary with changes in market conditions. Shares of the Fund may be worthmore or less than their original cost when they are redeemed or sold in the market. The Fund’s past performance is no guarantee of future results.
M a n a g e m e n t ’ s D i s c u s s i o n s o f F u n d P e r f o r m a n c e 11
For
per
sona
l use
onl
y
%%TRANSMSG*** Transmitting Job: B82515 PCN: 013000000 ***%%PCMSG|11 |00010|Yes|No|09/16/2010 23:44|0|0|Page/graphics valid 09/17/2010 01:45 -- Color: N|
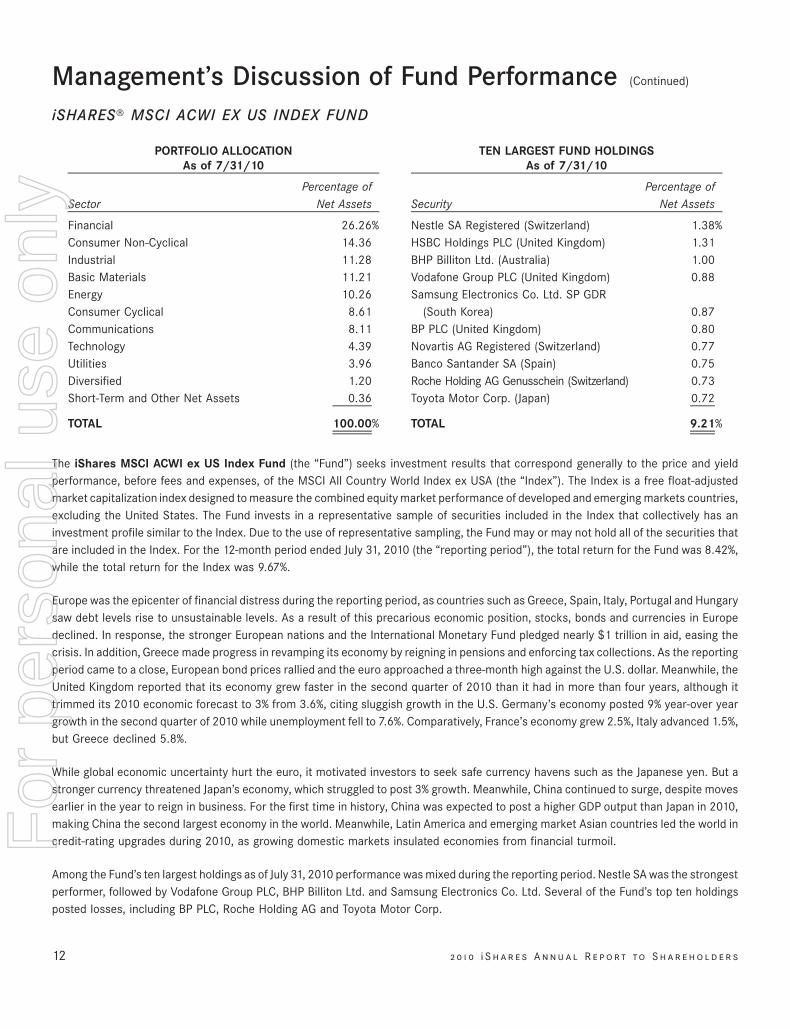
SectorPercentage of
Net Assets
PORTFOLIO ALLOCATIONAs of 7/31/10
Financial 26.26%Consumer Non-Cyclical 14.36Industrial 11.28Basic Materials 11.21Energy 10.26Consumer Cyclical 8.61Communications 8.11Technology 4.39Utilities 3.96Diversified 1.20Short-Term and Other Net Assets 0.36
TOTAL 100.00%
SecurityPercentage of
Net Assets
TEN LARGEST FUND HOLDINGSAs of 7/31/10
Nestle SA Registered (Switzerland) 1.38%HSBC Holdings PLC (United Kingdom) 1.31BHP Billiton Ltd. (Australia) 1.00Vodafone Group PLC (United Kingdom) 0.88Samsung Electronics Co. Ltd. SP GDR
(South Korea) 0.87BP PLC (United Kingdom) 0.80Novartis AG Registered (Switzerland) 0.77Banco Santander SA (Spain) 0.75Roche Holding AG Genusschein (Switzerland) 0.73Toyota Motor Corp. (Japan) 0.72
TOTAL 9.21%
The iShares MSCI ACWI ex US Index Fund (the “Fund”) seeks investment results that correspond generally to the price and yieldperformance, before fees and expenses, of the MSCI All Country World Index ex USA (the “Index”). The Index is a free float-adjustedmarket capitalization index designed to measure the combined equity market performance of developed and emerging markets countries,excluding the United States. The Fund invests in a representative sample of securities included in the Index that collectively has aninvestment profile similar to the Index. Due to the use of representative sampling, the Fund may or may not hold all of the securities thatare included in the Index. For the 12-month period ended July 31, 2010 (the “reporting period”), the total return for the Fund was 8.42%,while the total return for the Index was 9.67%.
Europe was the epicenter of financial distress during the reporting period, as countries such as Greece, Spain, Italy, Portugal and Hungarysaw debt levels rise to unsustainable levels. As a result of this precarious economic position, stocks, bonds and currencies in Europedeclined. In response, the stronger European nations and the International Monetary Fund pledged nearly $1 trillion in aid, easing thecrisis. In addition, Greece made progress in revamping its economy by reigning in pensions and enforcing tax collections. As the reportingperiod came to a close, European bond prices rallied and the euro approached a three-month high against the U.S. dollar. Meanwhile, theUnited Kingdom reported that its economy grew faster in the second quarter of 2010 than it had in more than four years, although ittrimmed its 2010 economic forecast to 3% from 3.6%, citing sluggish growth in the U.S. Germany’s economy posted 9% year-over yeargrowth in the second quarter of 2010 while unemployment fell to 7.6%. Comparatively, France’s economy grew 2.5%, Italy advanced 1.5%,but Greece declined 5.8%.
While global economic uncertainty hurt the euro, it motivated investors to seek safe currency havens such as the Japanese yen. But astronger currency threatened Japan’s economy, which struggled to post 3% growth. Meanwhile, China continued to surge, despite movesearlier in the year to reign in business. For the first time in history, China was expected to post a higher GDP output than Japan in 2010,making China the second largest economy in the world. Meanwhile, Latin America and emerging market Asian countries led the world incredit-rating upgrades during 2010, as growing domestic markets insulated economies from financial turmoil.
Among the Fund’s ten largest holdings as of July 31, 2010 performance was mixed during the reporting period. Nestle SA was the strongestperformer, followed by Vodafone Group PLC, BHP Billiton Ltd. and Samsung Electronics Co. Ltd. Several of the Fund’s top ten holdingsposted losses, including BP PLC, Roche Holding AG and Toyota Motor Corp.
12 2 0 1 0 i S h a r e s A n n u a l R e p o r t to S h a r e h o l d e r s
Management’s Discussion of Fund Performance (Continued)
iSHARES» MSCI ACWI EX US INDEX FUND
For
per
sona
l use
onl
y
%%TRANSMSG*** Transmitting Job: B82515 PCN: 014000000 ***%%PCMSG|12 |00009|Yes|No|09/16/2010 20:08|0|0|Page is valid, no graphics -- Color: N|
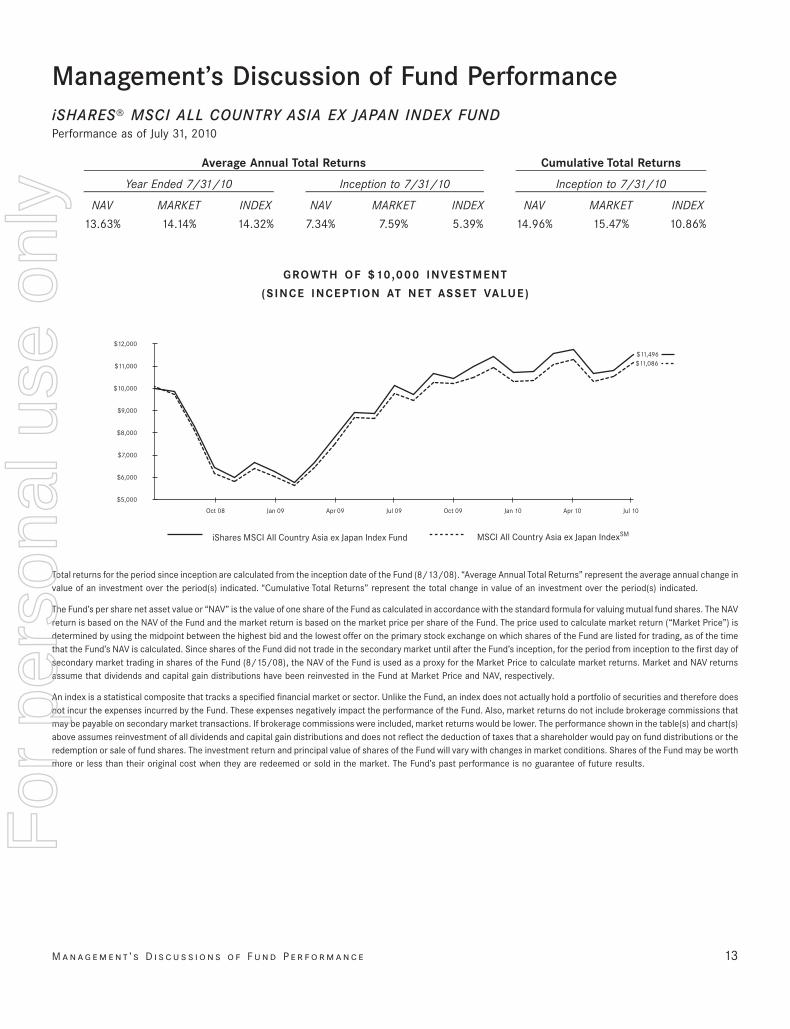
Management’s Discussion of Fund PerformanceiSHARES» MSCI ALL COUNTRY ASIA EX JAPAN INDEX FUNDPerformance as of July 31, 2010
NAV MARKET INDEX NAV MARKET INDEX NAV MARKET INDEX
Year Ended 7/31/10 Inception to 7/31/10 Inception to 7/31/10
Average Annual Total Returns Cumulative Total Returns
13.63% 14.14% 14.32% 7.34% 7.59% 5.39% 14.96% 15.47% 10.86%
GROWTH OF $10,000 INVESTMENT
(SINCE INCEPTION AT NET ASSET VALUE)
MSCI All Country Asia ex Japan IndexSMiShares MSCI All Country Asia ex Japan Index Fund
$11,496$11,086
Jul 10Apr 10Jan 10Oct 09Jul 09Apr 09Jan 09Oct 08
$5,000
$6,000
$7,000
$8,000
$9,000
$10,000
$11,000
$12,000
Total returns for the period since inception are calculated from the inception date of the Fund (8/13/08). “Average Annual Total Returns” represent the average annual change invalue of an investment over the period(s) indicated. “Cumulative Total Returns” represent the total change in value of an investment over the period(s) indicated.
The Fund’s per share net asset value or “NAV” is the value of one share of the Fund as calculated in accordance with the standard formula for valuing mutual fund shares. The NAVreturn is based on the NAV of the Fund and the market return is based on the market price per share of the Fund. The price used to calculate market return (“Market Price”) isdetermined by using the midpoint between the highest bid and the lowest offer on the primary stock exchange on which shares of the Fund are listed for trading, as of the timethat the Fund’s NAV is calculated. Since shares of the Fund did not trade in the secondary market until after the Fund’s inception, for the period from inception to the first day ofsecondary market trading in shares of the Fund (8/15/08), the NAV of the Fund is used as a proxy for the Market Price to calculate market returns. Market and NAV returnsassume that dividends and capital gain distributions have been reinvested in the Fund at Market Price and NAV, respectively.
An index is a statistical composite that tracks a specified financial market or sector. Unlike the Fund, an index does not actually hold a portfolio of securities and therefore doesnot incur the expenses incurred by the Fund. These expenses negatively impact the performance of the Fund. Also, market returns do not include brokerage commissions thatmay be payable on secondary market transactions. If brokerage commissions were included, market returns would be lower. The performance shown in the table(s) and chart(s)above assumes reinvestment of all dividends and capital gain distributions and does not reflect the deduction of taxes that a shareholder would pay on fund distributions or theredemption or sale of fund shares. The investment return and principal value of shares of the Fund will vary with changes in market conditions. Shares of the Fund may be worthmore or less than their original cost when they are redeemed or sold in the market. The Fund’s past performance is no guarantee of future results.
M a n a g e m e n t ’ s D i s c u s s i o n s o f F u n d P e r f o r m a n c e 13
For
per
sona
l use
onl
y
%%TRANSMSG*** Transmitting Job: B82515 PCN: 015000000 ***%%PCMSG|13 |00010|Yes|No|09/17/2010 01:44|0|0|Page/graphics valid 09/17/2010 01:47 -- Color: N|
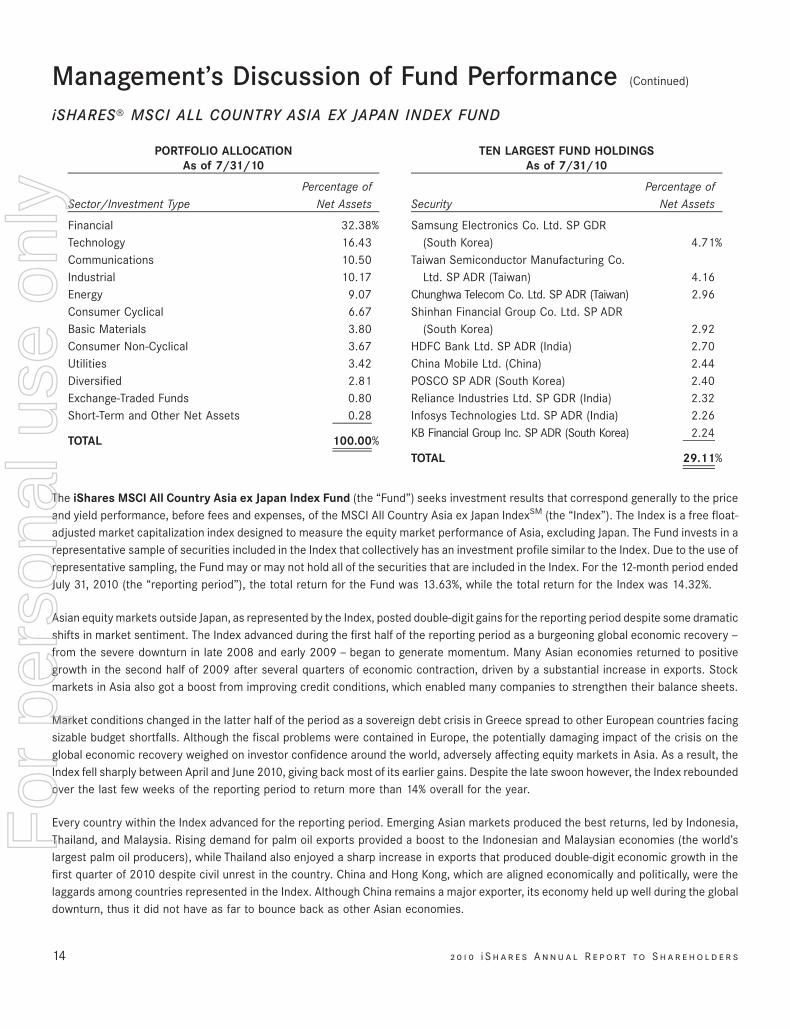
Sector/Investment TypePercentage of
Net Assets
PORTFOLIO ALLOCATIONAs of 7/31/10
Financial 32.38%Technology 16.43Communications 10.50Industrial 10.17Energy 9.07Consumer Cyclical 6.67Basic Materials 3.80Consumer Non-Cyclical 3.67Utilities 3.42Diversified 2.81Exchange-Traded Funds 0.80Short-Term and Other Net Assets 0.28
TOTAL 100.00%
SecurityPercentage of
Net Assets
TEN LARGEST FUND HOLDINGSAs of 7/31/10
Samsung Electronics Co. Ltd. SP GDR(South Korea) 4.71%
Taiwan Semiconductor Manufacturing Co.Ltd. SP ADR (Taiwan) 4.16
Chunghwa Telecom Co. Ltd. SP ADR (Taiwan) 2.96Shinhan Financial Group Co. Ltd. SP ADR
(South Korea) 2.92HDFC Bank Ltd. SP ADR (India) 2.70China Mobile Ltd. (China) 2.44POSCO SP ADR (South Korea) 2.40Reliance Industries Ltd. SP GDR (India) 2.32Infosys Technologies Ltd. SP ADR (India) 2.26KB Financial Group Inc. SP ADR (South Korea) 2.24
TOTAL 29.11%
The iShares MSCI All Country Asia ex Japan Index Fund (the “Fund”) seeks investment results that correspond generally to the priceand yield performance, before fees and expenses, of the MSCI All Country Asia ex Japan IndexSM (the “Index”). The Index is a free float-adjusted market capitalization index designed to measure the equity market performance of Asia, excluding Japan. The Fund invests in arepresentative sample of securities included in the Index that collectively has an investment profile similar to the Index. Due to the use ofrepresentative sampling, the Fund may or may not hold all of the securities that are included in the Index. For the 12-month period endedJuly 31, 2010 (the “reporting period”), the total return for the Fund was 13.63%, while the total return for the Index was 14.32%.
Asian equity markets outside Japan, as represented by the Index, posted double-digit gains for the reporting period despite some dramaticshifts in market sentiment. The Index advanced during the first half of the reporting period as a burgeoning global economic recovery —from the severe downturn in late 2008 and early 2009 — began to generate momentum. Many Asian economies returned to positivegrowth in the second half of 2009 after several quarters of economic contraction, driven by a substantial increase in exports. Stockmarkets in Asia also got a boost from improving credit conditions, which enabled many companies to strengthen their balance sheets.
Market conditions changed in the latter half of the period as a sovereign debt crisis in Greece spread to other European countries facingsizable budget shortfalls. Although the fiscal problems were contained in Europe, the potentially damaging impact of the crisis on theglobal economic recovery weighed on investor confidence around the world, adversely affecting equity markets in Asia. As a result, theIndex fell sharply between April and June 2010, giving back most of its earlier gains. Despite the late swoon however, the Index reboundedover the last few weeks of the reporting period to return more than 14% overall for the year.
Every country within the Index advanced for the reporting period. Emerging Asian markets produced the best returns, led by Indonesia,Thailand, and Malaysia. Rising demand for palm oil exports provided a boost to the Indonesian and Malaysian economies (the world’slargest palm oil producers), while Thailand also enjoyed a sharp increase in exports that produced double-digit economic growth in thefirst quarter of 2010 despite civil unrest in the country. China and Hong Kong, which are aligned economically and politically, were thelaggards among countries represented in the Index. Although China remains a major exporter, its economy held up well during the globaldownturn, thus it did not have as far to bounce back as other Asian economies.
14 2 0 1 0 i S h a r e s A n n u a l R e p o r t to S h a r e h o l d e r s
Management’s Discussion of Fund Performance (Continued)
iSHARES» MSCI ALL COUNTRY ASIA EX JAPAN INDEX FUND
For
per
sona
l use
onl
y
%%TRANSMSG*** Transmitting Job: B82515 PCN: 016000000 ***%%PCMSG|14 |00007|Yes|No|09/16/2010 20:08|0|0|Page is valid, no graphics -- Color: N|
Nine of the Fund’s ten largest holdings as of July 31, 2010, advanced for the reporting period. The best performers were two Indiancompanies, commercial bank HDFC Bank Ltd. and IT services company Infosys Technologies Ltd., each of which returned more than 40%for the reporting period. Other top performers included two South Korean firms, bank Shinhan Financial Group Co. Ltd. and electronicsmanufacturer Samsung Electronics Co. Ltd. (the Fund’s largest holding as of July 31, 2010). The only stock among the Fund’s top tenholdings to decline for the reporting period was Chinese wireless telecommunication services provider China Mobile Ltd.
M a n a g e m e n t ’ s D i s c u s s i o n s o f F u n d P e r f o r m a n c e 15
Management’s Discussion of Fund Performance (Continued)
iSHARES» MSCI ALL COUNTRY ASIA EX JAPAN INDEX FUND
For
per
sona
l use
onl
y
%%TRANSMSG*** Transmitting Job: B82515 PCN: 017000000 ***%%PCMSG|15 |00012|Yes|No|09/16/2010 20:08|0|0|Page is valid, no graphics -- Color: N|
Management’s Discussion of Fund PerformanceiSHARES» MSCI EAFE GROWTH INDEX FUNDPerformance as of July 31, 2010
NAV MARKET INDEX NAV MARKET INDEX NAV MARKET INDEX
Year Ended 7/31/10 Inception to 7/31/10 Inception to 7/31/10
Average Annual Total Returns Cumulative Total Returns
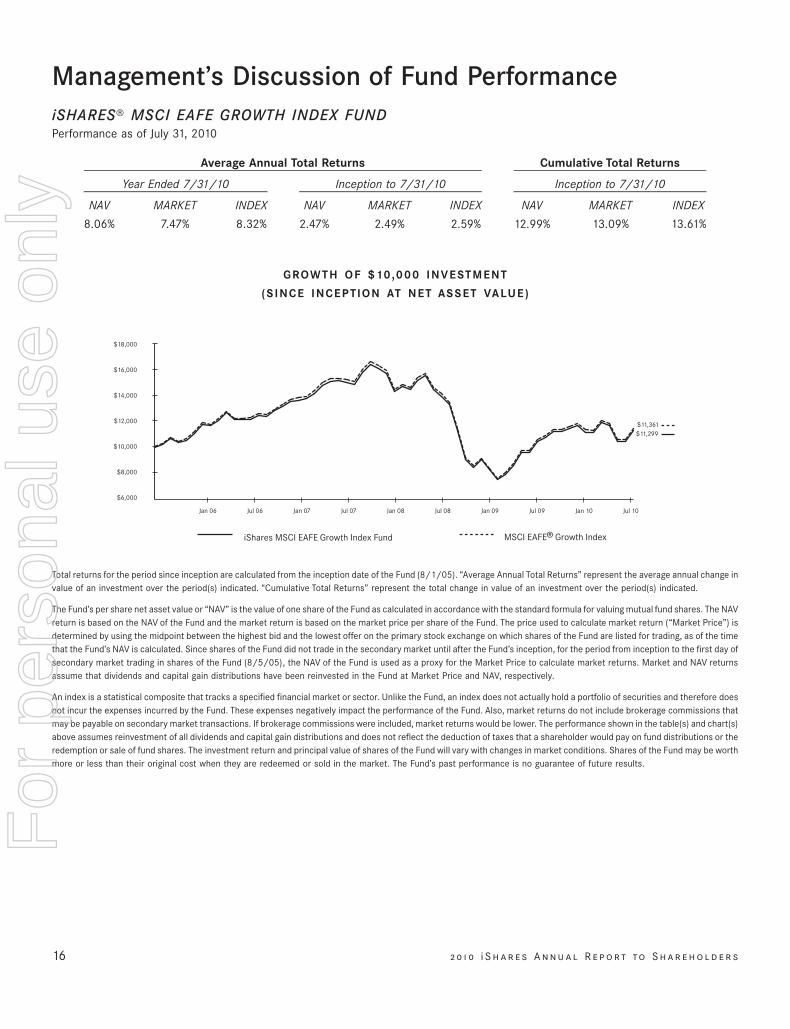
8.06% 7.47% 8.32% 2.47% 2.49% 2.59% 12.99% 13.09% 13.61%
GROWTH OF $10,000 INVESTMENT
(SINCE INCEPTION AT NET ASSET VALUE)
MSCI EAFE® Growth Index iShares MSCI EAFE Growth Index Fund
$11,361$11,299
$6,000
$8,000
$10,000
$12,000
$14,000
$16,000
$18,000
Jul 10Jan 10Jul 09Jan 09Jul 08Jan 08Jul 07Jan 07Jul 06Jan 06
Total returns for the period since inception are calculated from the inception date of the Fund (8/1/05). “Average Annual Total Returns” represent the average annual change invalue of an investment over the period(s) indicated. “Cumulative Total Returns” represent the total change in value of an investment over the period(s) indicated.
The Fund’s per share net asset value or “NAV” is the value of one share of the Fund as calculated in accordance with the standard formula for valuing mutual fund shares. The NAVreturn is based on the NAV of the Fund and the market return is based on the market price per share of the Fund. The price used to calculate market return (“Market Price”) isdetermined by using the midpoint between the highest bid and the lowest offer on the primary stock exchange on which shares of the Fund are listed for trading, as of the timethat the Fund’s NAV is calculated. Since shares of the Fund did not trade in the secondary market until after the Fund’s inception, for the period from inception to the first day ofsecondary market trading in shares of the Fund (8/5/05), the NAV of the Fund is used as a proxy for the Market Price to calculate market returns. Market and NAV returnsassume that dividends and capital gain distributions have been reinvested in the Fund at Market Price and NAV, respectively.
An index is a statistical composite that tracks a specified financial market or sector. Unlike the Fund, an index does not actually hold a portfolio of securities and therefore doesnot incur the expenses incurred by the Fund. These expenses negatively impact the performance of the Fund. Also, market returns do not include brokerage commissions thatmay be payable on secondary market transactions. If brokerage commissions were included, market returns would be lower. The performance shown in the table(s) and chart(s)above assumes reinvestment of all dividends and capital gain distributions and does not reflect the deduction of taxes that a shareholder would pay on fund distributions or theredemption or sale of fund shares. The investment return and principal value of shares of the Fund will vary with changes in market conditions. Shares of the Fund may be worthmore or less than their original cost when they are redeemed or sold in the market. The Fund’s past performance is no guarantee of future results.
16 2 0 1 0 i S h a r e s A n n u a l R e p o r t to S h a r e h o l d e r s
For
per
sona
l use
onl
y
%%TRANSMSG*** Transmitting Job: B82515 PCN: 018000000 ***%%PCMSG|16 |00006|Yes|No|09/16/2010 20:08|0|0|Page/graphics valid 09/16/2010 20:10 -- Color: N|
SectorPercentage of
Net Assets
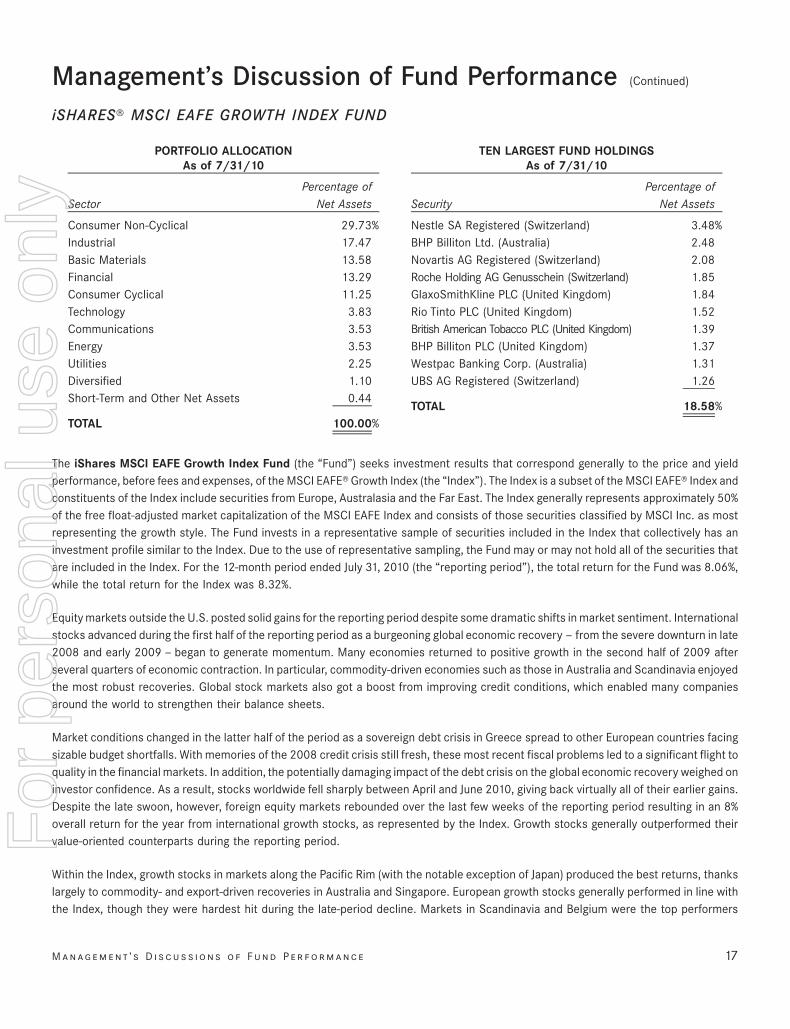
PORTFOLIO ALLOCATIONAs of 7/31/10
Consumer Non-Cyclical 29.73%Industrial 17.47Basic Materials 13.58Financial 13.29Consumer Cyclical 11.25Technology 3.83Communications 3.53Energy 3.53Utilities 2.25Diversified 1.10Short-Term and Other Net Assets 0.44
TOTAL 100.00%
SecurityPercentage of
Net Assets
TEN LARGEST FUND HOLDINGSAs of 7/31/10
Nestle SA Registered (Switzerland) 3.48%BHP Billiton Ltd. (Australia) 2.48Novartis AG Registered (Switzerland) 2.08Roche Holding AG Genusschein (Switzerland) 1.85GlaxoSmithKline PLC (United Kingdom) 1.84Rio Tinto PLC (United Kingdom) 1.52British American Tobacco PLC (United Kingdom) 1.39BHP Billiton PLC (United Kingdom) 1.37Westpac Banking Corp. (Australia) 1.31UBS AG Registered (Switzerland) 1.26
TOTAL 18.58%
The iShares MSCI EAFE Growth Index Fund (the “Fund”) seeks investment results that correspond generally to the price and yieldperformance, before fees and expenses, of the MSCI EAFE» Growth Index (the “Index”). The Index is a subset of the MSCI EAFE» Index andconstituents of the Index include securities from Europe, Australasia and the Far East. The Index generally represents approximately 50%of the free float-adjusted market capitalization of the MSCI EAFE Index and consists of those securities classified by MSCI Inc. as mostrepresenting the growth style. The Fund invests in a representative sample of securities included in the Index that collectively has aninvestment profile similar to the Index. Due to the use of representative sampling, the Fund may or may not hold all of the securities thatare included in the Index. For the 12-month period ended July 31, 2010 (the “reporting period”), the total return for the Fund was 8.06%,while the total return for the Index was 8.32%.
Equity markets outside the U.S. posted solid gains for the reporting period despite some dramatic shifts in market sentiment. Internationalstocks advanced during the first half of the reporting period as a burgeoning global economic recovery — from the severe downturn in late2008 and early 2009 — began to generate momentum. Many economies returned to positive growth in the second half of 2009 afterseveral quarters of economic contraction. In particular, commodity-driven economies such as those in Australia and Scandinavia enjoyedthe most robust recoveries. Global stock markets also got a boost from improving credit conditions, which enabled many companiesaround the world to strengthen their balance sheets.
Market conditions changed in the latter half of the period as a sovereign debt crisis in Greece spread to other European countries facingsizable budget shortfalls. With memories of the 2008 credit crisis still fresh, these most recent fiscal problems led to a significant flight toquality in the financial markets. In addition, the potentially damaging impact of the debt crisis on the global economic recovery weighed oninvestor confidence. As a result, stocks worldwide fell sharply between April and June 2010, giving back virtually all of their earlier gains.Despite the late swoon, however, foreign equity markets rebounded over the last few weeks of the reporting period resulting in an 8%overall return for the year from international growth stocks, as represented by the Index. Growth stocks generally outperformed theirvalue-oriented counterparts during the reporting period.
Within the Index, growth stocks in markets along the Pacific Rim (with the notable exception of Japan) produced the best returns, thankslargely to commodity- and export-driven recoveries in Australia and Singapore. European growth stocks generally performed in line withthe Index, though they were hardest hit during the late-period decline. Markets in Scandinavia and Belgium were the top performers
M a n a g e m e n t ’ s D i s c u s s i o n s o f F u n d P e r f o r m a n c e 17
Management’s Discussion of Fund Performance (Continued)
iSHARES» MSCI EAFE GROWTH INDEX FUND
For
per
sona
l use
onl
y
%%TRANSMSG*** Transmitting Job: B82515 PCN: 019000000 ***%%PCMSG|17 |00010|Yes|No|09/20/2010 15:22|0|0|Page is valid, no graphics -- Color: N|
among European bourses, while Greece was the laggard. The growth stocks in the Japanese equity market advanced modestly as weakdomestic demand cast doubt on the strength of the country’s economic rebound.
Eight of the Fund’s ten largest holdings as of July 31, 2010, advanced for the reporting period. The best performers included British miningcompany Rio Tinto PLC and Australian bank Westpac Banking Corp., both of which returned more than 25% for the reporting period. TheFund’s two largest holdings as of July 31, 2010, Swiss food producer Nestle SA and Australian mining company BHP Billiton Ltd., were alsoamong the top performers. The only two decliners among the Fund’s top ten holdings were pharmaceutical firms Roche Holding AG ofSwitzerland and GlaxoSmithKline PLC of the United Kingdom.
18 2 0 1 0 i S h a r e s A n n u a l R e p o r t to S h a r e h o l d e r s
Management’s Discussion of Fund Performance (Continued)
iSHARES» MSCI EAFE GROWTH INDEX FUND
For
per
sona
l use
onl
y
%%TRANSMSG*** Transmitting Job: B82515 PCN: 020000000 ***%%PCMSG|18 |00011|Yes|No|09/16/2010 20:08|0|0|Page is valid, no graphics -- Color: N|
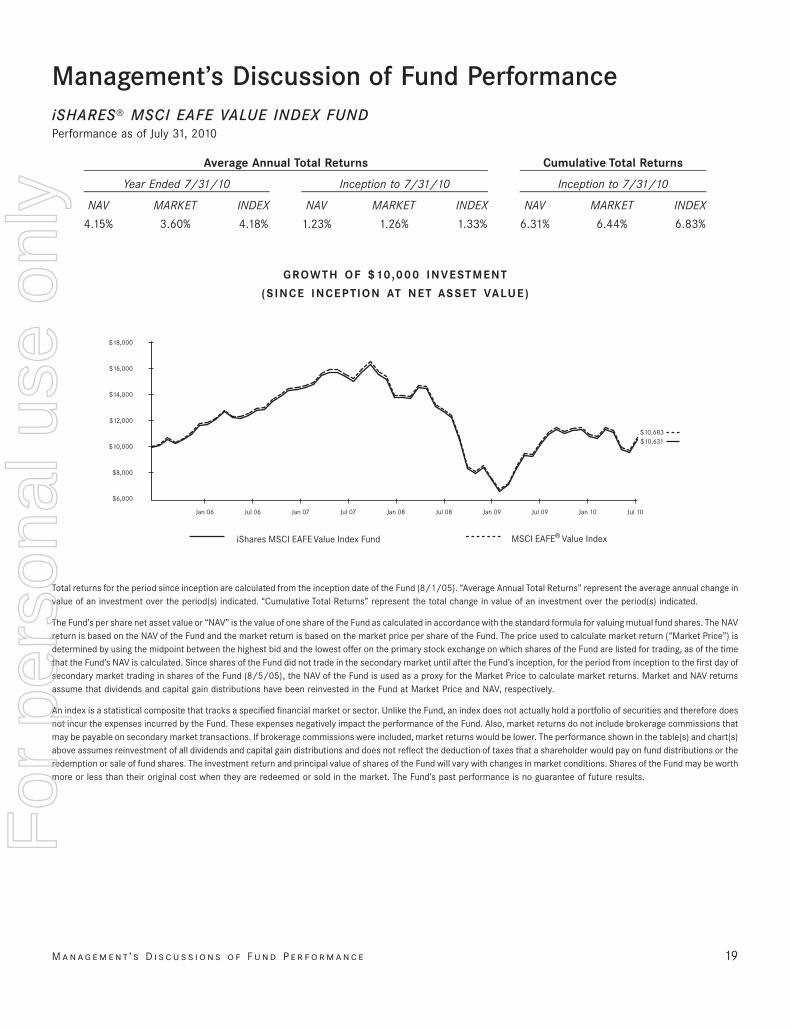
Management’s Discussion of Fund PerformanceiSHARES» MSCI EAFE VALUE INDEX FUNDPerformance as of July 31, 2010
NAV MARKET INDEX NAV MARKET INDEX NAV MARKET INDEX
Year Ended 7/31/10 Inception to 7/31/10 Inception to 7/31/10
Average Annual Total Returns Cumulative Total Returns
4.15% 3.60% 4.18% 1.23% 1.26% 1.33% 6.31% 6.44% 6.83%
GROWTH OF $10,000 INVESTMENT
(SINCE INCEPTION AT NET ASSET VALUE)
MSCI EAFE® Value Index iShares MSCI EAFE Value Index Fund
$10,683$10,631
$6,000
$8,000
$10,000
$12,000
$14,000
$16,000
$18,000
Jul 10Jan 10Jul 09Jan 09Jul 08Jan 08Jul 07Jan 07Jul 06Jan 06
Total returns for the period since inception are calculated from the inception date of the Fund (8/1/05). “Average Annual Total Returns” represent the average annual change invalue of an investment over the period(s) indicated. “Cumulative Total Returns” represent the total change in value of an investment over the period(s) indicated.
The Fund’s per share net asset value or “NAV” is the value of one share of the Fund as calculated in accordance with the standard formula for valuing mutual fund shares. The NAVreturn is based on the NAV of the Fund and the market return is based on the market price per share of the Fund. The price used to calculate market return (“Market Price”) isdetermined by using the midpoint between the highest bid and the lowest offer on the primary stock exchange on which shares of the Fund are listed for trading, as of the timethat the Fund’s NAV is calculated. Since shares of the Fund did not trade in the secondary market until after the Fund’s inception, for the period from inception to the first day ofsecondary market trading in shares of the Fund (8/5/05), the NAV of the Fund is used as a proxy for the Market Price to calculate market returns. Market and NAV returnsassume that dividends and capital gain distributions have been reinvested in the Fund at Market Price and NAV, respectively.
An index is a statistical composite that tracks a specified financial market or sector. Unlike the Fund, an index does not actually hold a portfolio of securities and therefore doesnot incur the expenses incurred by the Fund. These expenses negatively impact the performance of the Fund. Also, market returns do not include brokerage commissions thatmay be payable on secondary market transactions. If brokerage commissions were included, market returns would be lower. The performance shown in the table(s) and chart(s)above assumes reinvestment of all dividends and capital gain distributions and does not reflect the deduction of taxes that a shareholder would pay on fund distributions or theredemption or sale of fund shares. The investment return and principal value of shares of the Fund will vary with changes in market conditions. Shares of the Fund may be worthmore or less than their original cost when they are redeemed or sold in the market. The Fund’s past performance is no guarantee of future results.
M a n a g e m e n t ’ s D i s c u s s i o n s o f F u n d P e r f o r m a n c e 19
For
per
sona
l use
onl
y
%%TRANSMSG*** Transmitting Job: B82515 PCN: 021000000 ***%%PCMSG|19 |00006|Yes|No|09/16/2010 20:08|0|0|Page/graphics valid 09/16/2010 20:10 -- Color: N|
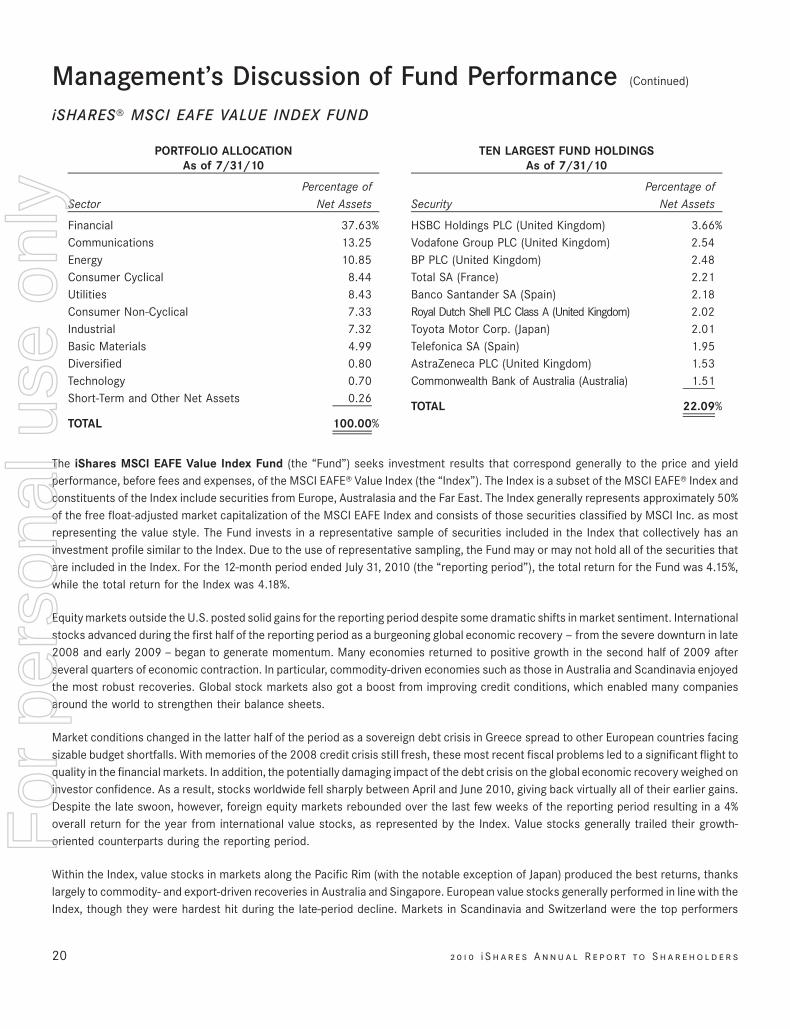
SectorPercentage of
Net Assets
PORTFOLIO ALLOCATIONAs of 7/31/10
Financial 37.63%Communications 13.25Energy 10.85Consumer Cyclical 8.44Utilities 8.43Consumer Non-Cyclical 7.33Industrial 7.32Basic Materials 4.99Diversified 0.80Technology 0.70Short-Term and Other Net Assets 0.26
TOTAL 100.00%
SecurityPercentage of
Net Assets
TEN LARGEST FUND HOLDINGSAs of 7/31/10
HSBC Holdings PLC (United Kingdom) 3.66%Vodafone Group PLC (United Kingdom) 2.54BP PLC (United Kingdom) 2.48Total SA (France) 2.21Banco Santander SA (Spain) 2.18Royal Dutch Shell PLC Class A (United Kingdom) 2.02Toyota Motor Corp. (Japan) 2.01Telefonica SA (Spain) 1.95AstraZeneca PLC (United Kingdom) 1.53Commonwealth Bank of Australia (Australia) 1.51
TOTAL 22.09%
The iShares MSCI EAFE Value Index Fund (the “Fund”) seeks investment results that correspond generally to the price and yieldperformance, before fees and expenses, of the MSCI EAFE» Value Index (the “Index”). The Index is a subset of the MSCI EAFE» Index andconstituents of the Index include securities from Europe, Australasia and the Far East. The Index generally represents approximately 50%of the free float-adjusted market capitalization of the MSCI EAFE Index and consists of those securities classified by MSCI Inc. as mostrepresenting the value style. The Fund invests in a representative sample of securities included in the Index that collectively has aninvestment profile similar to the Index. Due to the use of representative sampling, the Fund may or may not hold all of the securities thatare included in the Index. For the 12-month period ended July 31, 2010 (the “reporting period”), the total return for the Fund was 4.15%,while the total return for the Index was 4.18%.
Equity markets outside the U.S. posted solid gains for the reporting period despite some dramatic shifts in market sentiment. Internationalstocks advanced during the first half of the reporting period as a burgeoning global economic recovery — from the severe downturn in late2008 and early 2009 — began to generate momentum. Many economies returned to positive growth in the second half of 2009 afterseveral quarters of economic contraction. In particular, commodity-driven economies such as those in Australia and Scandinavia enjoyedthe most robust recoveries. Global stock markets also got a boost from improving credit conditions, which enabled many companiesaround the world to strengthen their balance sheets.
Market conditions changed in the latter half of the period as a sovereign debt crisis in Greece spread to other European countries facingsizable budget shortfalls. With memories of the 2008 credit crisis still fresh, these most recent fiscal problems led to a significant flight toquality in the financial markets. In addition, the potentially damaging impact of the debt crisis on the global economic recovery weighed oninvestor confidence. As a result, stocks worldwide fell sharply between April and June 2010, giving back virtually all of their earlier gains.Despite the late swoon, however, foreign equity markets rebounded over the last few weeks of the reporting period resulting in a 4%overall return for the year from international value stocks, as represented by the Index. Value stocks generally trailed their growth-oriented counterparts during the reporting period.
Within the Index, value stocks in markets along the Pacific Rim (with the notable exception of Japan) produced the best returns, thankslargely to commodity- and export-driven recoveries in Australia and Singapore. European value stocks generally performed in line with theIndex, though they were hardest hit during the late-period decline. Markets in Scandinavia and Switzerland were the top performers
20 2 0 1 0 i S h a r e s A n n u a l R e p o r t to S h a r e h o l d e r s
Management’s Discussion of Fund Performance (Continued)
iSHARES» MSCI EAFE VALUE INDEX FUND
For
per
sona
l use
onl
y
%%TRANSMSG*** Transmitting Job: B82515 PCN: 022000000 ***%%PCMSG|20 |00008|Yes|No|09/16/2010 20:08|0|0|Page is valid, no graphics -- Color: N|
among European bourses, while Greece and Portugal were the laggards. The value stocks in the Japanese equity market declined as weakdomestic demand cast doubt on the strength of the country’s economic rebound.
Six of the Fund’s ten largest holdings as of July 31, 2010, advanced for the reporting period. The top performer was Australian bankCommonwealth Bank of Australia, which returned more than 40% for the reporting period. Two telecommunication services companies,Telefonica SA of Spain and Vodafone Group PLC of the United Kingdom, were also among the best performers. The four decliners amongthe Fund’s top ten holdings were British energy producer BP PLC and Japanese auto maker Toyota Motor Corp., both of which posteddouble-digit declines, along with French energy company Total SA and Spanish bank Banco Santander SA.
M a n a g e m e n t ’ s D i s c u s s i o n s o f F u n d P e r f o r m a n c e 21
Management’s Discussion of Fund Performance (Continued)
iSHARES» MSCI EAFE VALUE INDEX FUND
For
per
sona
l use
onl
y
%%TRANSMSG*** Transmitting Job: B82515 PCN: 023000000 ***%%PCMSG|21 |00007|Yes|No|09/16/2010 20:08|0|0|Page is valid, no graphics -- Color: N|
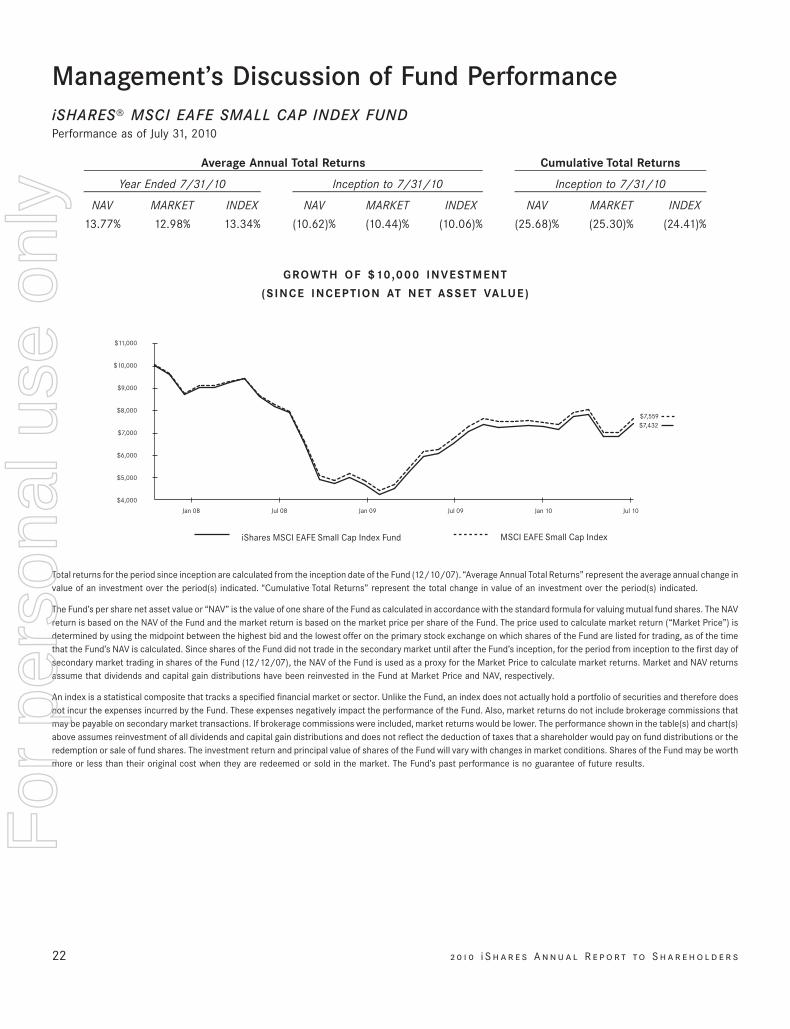
Management’s Discussion of Fund PerformanceiSHARES» MSCI EAFE SMALL CAP INDEX FUNDPerformance as of July 31, 2010
NAV MARKET INDEX NAV MARKET INDEX NAV MARKET INDEX
Year Ended 7/31/10 Inception to 7/31/10 Inception to 7/31/10
Average Annual Total Returns Cumulative Total Returns
13.77% 12.98% 13.34% (10.62)% (10.44)% (10.06)% (25.68)% (25.30)% (24.41)%
GROWTH OF $10,000 INVESTMENT
(SINCE INCEPTION AT NET ASSET VALUE)
MSCI EAFE Small Cap Index iShares MSCI EAFE Small Cap Index Fund
$7,559$7,432
Jul 10Jan 10Jul 09Jan 09Jul 08Jan 08
$4,000
$5,000
$6,000
$7,000
$8,000
$9,000
$10,000
$11,000
Total returns for the period since inception are calculated from the inception date of the Fund (12/10/07). “Average Annual Total Returns” represent the average annual change invalue of an investment over the period(s) indicated. “Cumulative Total Returns” represent the total change in value of an investment over the period(s) indicated.
The Fund’s per share net asset value or “NAV” is the value of one share of the Fund as calculated in accordance with the standard formula for valuing mutual fund shares. The NAVreturn is based on the NAV of the Fund and the market return is based on the market price per share of the Fund. The price used to calculate market return (“Market Price”) isdetermined by using the midpoint between the highest bid and the lowest offer on the primary stock exchange on which shares of the Fund are listed for trading, as of the timethat the Fund’s NAV is calculated. Since shares of the Fund did not trade in the secondary market until after the Fund’s inception, for the period from inception to the first day ofsecondary market trading in shares of the Fund (12/12/07), the NAV of the Fund is used as a proxy for the Market Price to calculate market returns. Market and NAV returnsassume that dividends and capital gain distributions have been reinvested in the Fund at Market Price and NAV, respectively.
An index is a statistical composite that tracks a specified financial market or sector. Unlike the Fund, an index does not actually hold a portfolio of securities and therefore doesnot incur the expenses incurred by the Fund. These expenses negatively impact the performance of the Fund. Also, market returns do not include brokerage commissions thatmay be payable on secondary market transactions. If brokerage commissions were included, market returns would be lower. The performance shown in the table(s) and chart(s)above assumes reinvestment of all dividends and capital gain distributions and does not reflect the deduction of taxes that a shareholder would pay on fund distributions or theredemption or sale of fund shares. The investment return and principal value of shares of the Fund will vary with changes in market conditions. Shares of the Fund may be worthmore or less than their original cost when they are redeemed or sold in the market. The Fund’s past performance is no guarantee of future results.
22 2 0 1 0 i S h a r e s A n n u a l R e p o r t to S h a r e h o l d e r s
For
per
sona
l use
onl
y
%%TRANSMSG*** Transmitting Job: B82515 PCN: 024000000 ***%%PCMSG|22 |00008|Yes|No|09/16/2010 20:08|0|0|Page/graphics valid 09/16/2010 20:10 -- Color: N|
SectorPercentage of
Net Assets
PORTFOLIO ALLOCATIONAs of 7/31/10
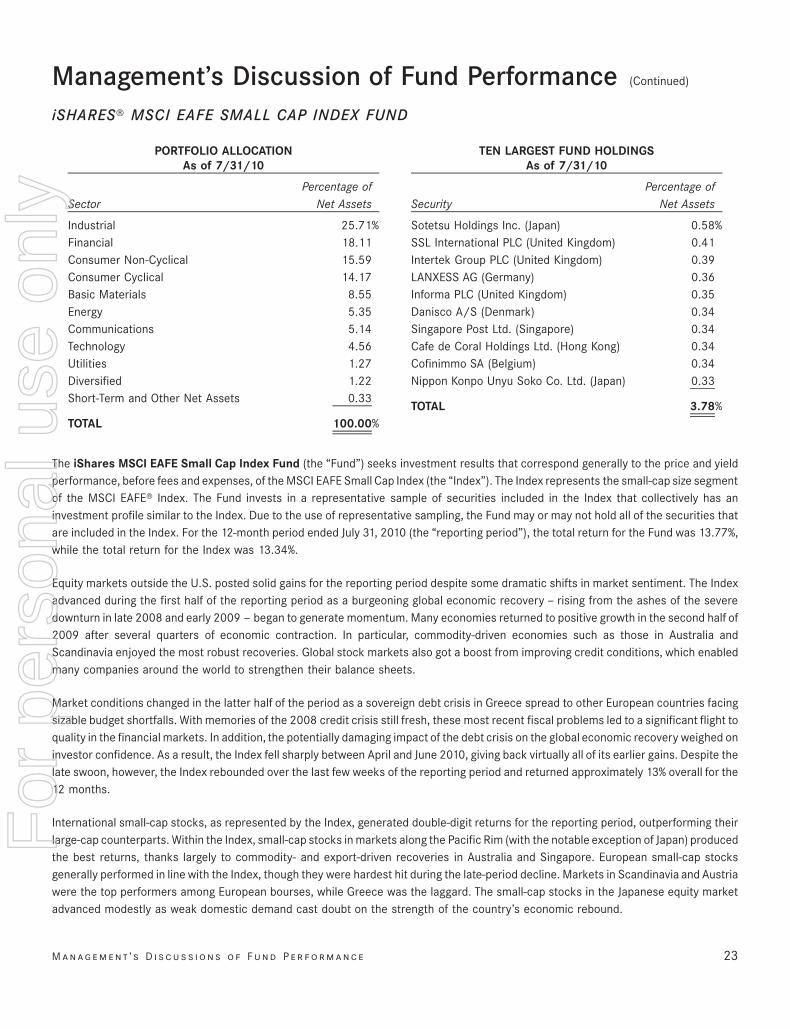
Industrial 25.71%Financial 18.11Consumer Non-Cyclical 15.59Consumer Cyclical 14.17Basic Materials 8.55Energy 5.35Communications 5.14Technology 4.56Utilities 1.27Diversified 1.22Short-Term and Other Net Assets 0.33
TOTAL 100.00%
SecurityPercentage of
Net Assets
TEN LARGEST FUND HOLDINGSAs of 7/31/10
Sotetsu Holdings Inc. (Japan) 0.58%SSL International PLC (United Kingdom) 0.41Intertek Group PLC (United Kingdom) 0.39LANXESS AG (Germany) 0.36Informa PLC (United Kingdom) 0.35Danisco A/S (Denmark) 0.34Singapore Post Ltd. (Singapore) 0.34Cafe de Coral Holdings Ltd. (Hong Kong) 0.34Cofinimmo SA (Belgium) 0.34Nippon Konpo Unyu Soko Co. Ltd. (Japan) 0.33
TOTAL 3.78%
The iShares MSCI EAFE Small Cap Index Fund (the “Fund”) seeks investment results that correspond generally to the price and yieldperformance, before fees and expenses, of the MSCI EAFE Small Cap Index (the “Index”). The Index represents the small-cap size segmentof the MSCI EAFE» Index. The Fund invests in a representative sample of securities included in the Index that collectively has aninvestment profile similar to the Index. Due to the use of representative sampling, the Fund may or may not hold all of the securities thatare included in the Index. For the 12-month period ended July 31, 2010 (the “reporting period”), the total return for the Fund was 13.77%,while the total return for the Index was 13.34%.
Equity markets outside the U.S. posted solid gains for the reporting period despite some dramatic shifts in market sentiment. The Indexadvanced during the first half of the reporting period as a burgeoning global economic recovery — rising from the ashes of the severedownturn in late 2008 and early 2009 — began to generate momentum. Many economies returned to positive growth in the second half of2009 after several quarters of economic contraction. In particular, commodity-driven economies such as those in Australia andScandinavia enjoyed the most robust recoveries. Global stock markets also got a boost from improving credit conditions, which enabledmany companies around the world to strengthen their balance sheets.
Market conditions changed in the latter half of the period as a sovereign debt crisis in Greece spread to other European countries facingsizable budget shortfalls. With memories of the 2008 credit crisis still fresh, these most recent fiscal problems led to a significant flight toquality in the financial markets. In addition, the potentially damaging impact of the debt crisis on the global economic recovery weighed oninvestor confidence. As a result, the Index fell sharply between April and June 2010, giving back virtually all of its earlier gains. Despite thelate swoon, however, the Index rebounded over the last few weeks of the reporting period and returned approximately 13% overall for the12 months.
International small-cap stocks, as represented by the Index, generated double-digit returns for the reporting period, outperforming theirlarge-cap counterparts. Within the Index, small-cap stocks in markets along the Pacific Rim (with the notable exception of Japan) producedthe best returns, thanks largely to commodity- and export-driven recoveries in Australia and Singapore. European small-cap stocksgenerally performed in line with the Index, though they were hardest hit during the late-period decline. Markets in Scandinavia and Austriawere the top performers among European bourses, while Greece was the laggard. The small-cap stocks in the Japanese equity marketadvanced modestly as weak domestic demand cast doubt on the strength of the country’s economic rebound.
M a n a g e m e n t ’ s D i s c u s s i o n s o f F u n d P e r f o r m a n c e 23
Management’s Discussion of Fund Performance (Continued)
iSHARES» MSCI EAFE SMALL CAP INDEX FUND
For
per
sona
l use
onl
y
%%TRANSMSG*** Transmitting Job: B82515 PCN: 025000000 ***%%PCMSG|23 |00009|Yes|No|09/16/2010 20:08|0|0|Page is valid, no graphics -- Color: N|
Each of the Fund’s ten largest holdings as of July 31, 2010, advanced for the reporting period. The best performer was British health careproducts maker SSL International PLC, which had triple-digit returns for the reporting period. Other top performers included Germanspecialty chemicals producer LANXESS AG, British publishing company Informa PLC, and Danish food production firm Danisco A/S. Theonly two stocks among the Fund’s top ten holdings to post single-digit gains for the reporting period were Belgian real estate firmCofinimmo SA and Japanese transportation services provider Nippon Konpo Unyu Soko Co. Ltd.
24 2 0 1 0 i S h a r e s A n n u a l R e p o r t to S h a r e h o l d e r s
Management’s Discussion of Fund Performance (Continued)
iSHARES» MSCI EAFE SMALL CAP INDEX FUND
For
per
sona
l use
onl
y
%%TRANSMSG*** Transmitting Job: B82515 PCN: 026000000 ***%%PCMSG|24 |00009|Yes|No|09/16/2010 20:08|0|0|Page is valid, no graphics -- Color: N|
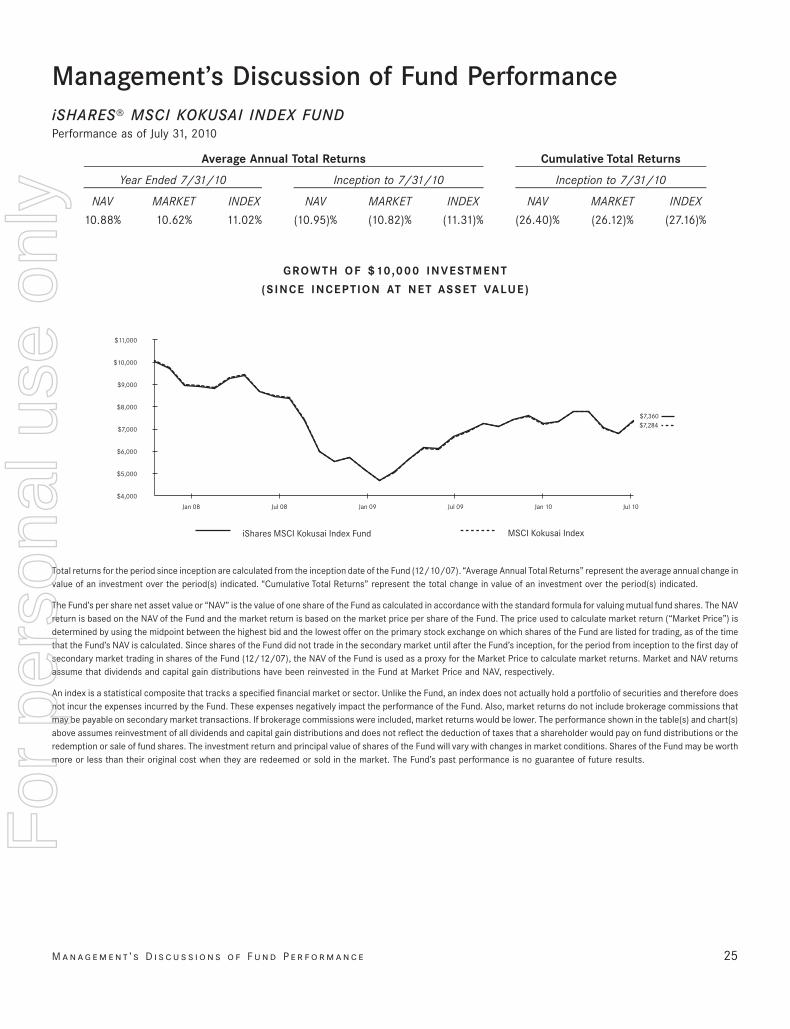
Management’s Discussion of Fund PerformanceiSHARES» MSCI KOKUSAI INDEX FUNDPerformance as of July 31, 2010
NAV MARKET INDEX NAV MARKET INDEX NAV MARKET INDEX
Year Ended 7/31/10 Inception to 7/31/10 Inception to 7/31/10
Average Annual Total Returns Cumulative Total Returns
10.88% 10.62% 11.02% (10.95)% (10.82)% (11.31)% (26.40)% (26.12)% (27.16)%
GROWTH OF $10,000 INVESTMENT
(SINCE INCEPTION AT NET ASSET VALUE)
MSCI Kokusai Index iShares MSCI Kokusai Index Fund
$7,360$7,284
Jul 10Jan 10Jul 09Jan 09Jul 08Jan 08
$4,000
$6,000
$7,000
$5,000
$8,000
$9,000
$10,000
$11,000
Total returns for the period since inception are calculated from the inception date of the Fund (12/10/07). “Average Annual Total Returns” represent the average annual change invalue of an investment over the period(s) indicated. “Cumulative Total Returns” represent the total change in value of an investment over the period(s) indicated.
The Fund’s per share net asset value or “NAV” is the value of one share of the Fund as calculated in accordance with the standard formula for valuing mutual fund shares. The NAVreturn is based on the NAV of the Fund and the market return is based on the market price per share of the Fund. The price used to calculate market return (“Market Price”) isdetermined by using the midpoint between the highest bid and the lowest offer on the primary stock exchange on which shares of the Fund are listed for trading, as of the timethat the Fund’s NAV is calculated. Since shares of the Fund did not trade in the secondary market until after the Fund’s inception, for the period from inception to the first day ofsecondary market trading in shares of the Fund (12/12/07), the NAV of the Fund is used as a proxy for the Market Price to calculate market returns. Market and NAV returnsassume that dividends and capital gain distributions have been reinvested in the Fund at Market Price and NAV, respectively.
An index is a statistical composite that tracks a specified financial market or sector. Unlike the Fund, an index does not actually hold a portfolio of securities and therefore doesnot incur the expenses incurred by the Fund. These expenses negatively impact the performance of the Fund. Also, market returns do not include brokerage commissions thatmay be payable on secondary market transactions. If brokerage commissions were included, market returns would be lower. The performance shown in the table(s) and chart(s)above assumes reinvestment of all dividends and capital gain distributions and does not reflect the deduction of taxes that a shareholder would pay on fund distributions or theredemption or sale of fund shares. The investment return and principal value of shares of the Fund will vary with changes in market conditions. Shares of the Fund may be worthmore or less than their original cost when they are redeemed or sold in the market. The Fund’s past performance is no guarantee of future results.
M a n a g e m e n t ’ s D i s c u s s i o n s o f F u n d P e r f o r m a n c e 25
For
per
sona
l use
onl
y
%%TRANSMSG*** Transmitting Job: B82515 PCN: 027000000 ***%%PCMSG|25 |00008|Yes|No|09/16/2010 20:08|0|0|Page/graphics valid 09/16/2010 20:10 -- Color: N|

SectorPercentage of
Net Assets
PORTFOLIO ALLOCATIONAs of 7/31/10
Financial 21.10%Consumer Non-Cyclical 20.51Energy 11.07Communications 10.16Industrial 10.03Technology 8.16Consumer Cyclical 6.93Basic Materials 6.92Utilities 4.02Diversified 0.79Short-Term and Other Net Assets 0.31
TOTAL 100.00%
SecurityPercentage of
Net Assets
TEN LARGEST FUND HOLDINGSAs of 7/31/10
Exxon Mobil Corp. 1.60%Apple Inc. 1.23Microsoft Corp. 1.07HSBC Holdings PLC (United Kingdom) 0.93Procter & Gamble Co. (The) 0.92Nestle SA Registered (Switzerland) 0.92International Business Machines Corp. 0.91General Electric Co. 0.91JPMorgan Chase & Co. 0.84Johnson & Johnson 0.82
TOTAL 10.15%
The iShares MSCI Kokusai Index Fund (the “Fund”) seeks investment results that correspond generally to the price and yieldperformance, before fees and expenses, of the MSCI Kokusai Index (the “Index”). The Index is designed to measure equity marketperformance in those countries that MSCI Inc. has classified as having developed economies, excluding Japan. The Fund invests in arepresentative sample of securities included in the Index that collectively has an investment profile similar to the Index. Due to the use ofrepresentative sampling, the Fund may or may not hold all of the securities that are included in the Index. For the 12-month period endedJuly 31, 2010 (the “reporting period”), the total return for the Fund was 10.88%, while the total return for the Index was 11.02%.
Equity markets outside Japan, as represented by the Index, posted solid gains for the reporting period despite some dramatic shifts inmarket sentiment. The Index advanced during the first half of the reporting period as a burgeoning global economic recovery — rising fromthe ashes of the severe downturn in late 2008 and early 2009 — began to generate momentum. Many economies returned to positivegrowth in the second half of 2009 after several quarters of economic contraction. In particular, commodity-driven economies such asthose in Australia and Scandinavia enjoyed the most robust recoveries. Global stock markets also got a boost from improving creditconditions, which enabled many companies around the world to strengthen their balance sheets.
Market conditions changed in the latter half of the period as a sovereign debt crisis in Greece spread to other European countries facingsizable budget shortfalls. With memories of the 2008 credit crisis still fresh, these most recent fiscal problems led to a significant flight toquality in the financial markets. In addition, the potentially damaging impact of the debt crisis on the global economic recovery weighed oninvestor confidence. As a result, the Index fell sharply between April and June 2010, giving back most of its earlier gains. Despite the lateswoon, however, the Index rebounded over the last few weeks of the reporting period and returned approximately 11% overall for the12 months.
Within the Index, markets along the Pacific Rim produced the best returns, thanks largely to commodity- and export-driven recoveries inAustralia and Singapore. The U.S. equity market also performed well, buoyed by better economic conditions and low inflation. Europeanmarkets, which were hardest hit during the late-period decline, underperformed the Index for the reporting period. Markets in Scandinaviawere the top performers among European bourses, while Greece was the laggard.
Eight of the Fund’s ten largest holdings as of July 31, 2010, advanced for the reporting period. By far, the best performer was U.S. consumerelectronics maker Apple Inc., which returned more than 50% for the reporting period. Other top performers included Swiss food producer
26 2 0 1 0 i S h a r e s A n n u a l R e p o r t to S h a r e h o l d e r s
Management’s Discussion of Fund Performance (Continued)
iSHARES» MSCI KOKUSAI INDEX FUND
For
per
sona
l use
onl
y
%%TRANSMSG*** Transmitting Job: B82515 PCN: 028000000 ***%%PCMSG|26 |00014|Yes|No|09/16/2010 20:08|0|0|Page is valid, no graphics -- Color: N|

Nestle SA and U.S. industrial conglomerate General Electric Co. Only two stocks among the Fund’s top ten holdings to decline for thereporting period were U.S. energy producer Exxon Mobil Corp., the Fund’s largest holding at period end, and U.S. health care productsmanufacturer Johnson & Johnson.
M a n a g e m e n t ’ s D i s c u s s i o n s o f F u n d P e r f o r m a n c e 27
Management’s Discussion of Fund Performance (Continued)
iSHARES» MSCI KOKUSAI INDEX FUND
For
per
sona
l use
onl
y
%%TRANSMSG*** Transmitting Job: B82515 PCN: 029000000 ***%%PCMSG|27 |00011|Yes|No|09/16/2010 20:08|0|0|Page is valid, no graphics -- Color: N|
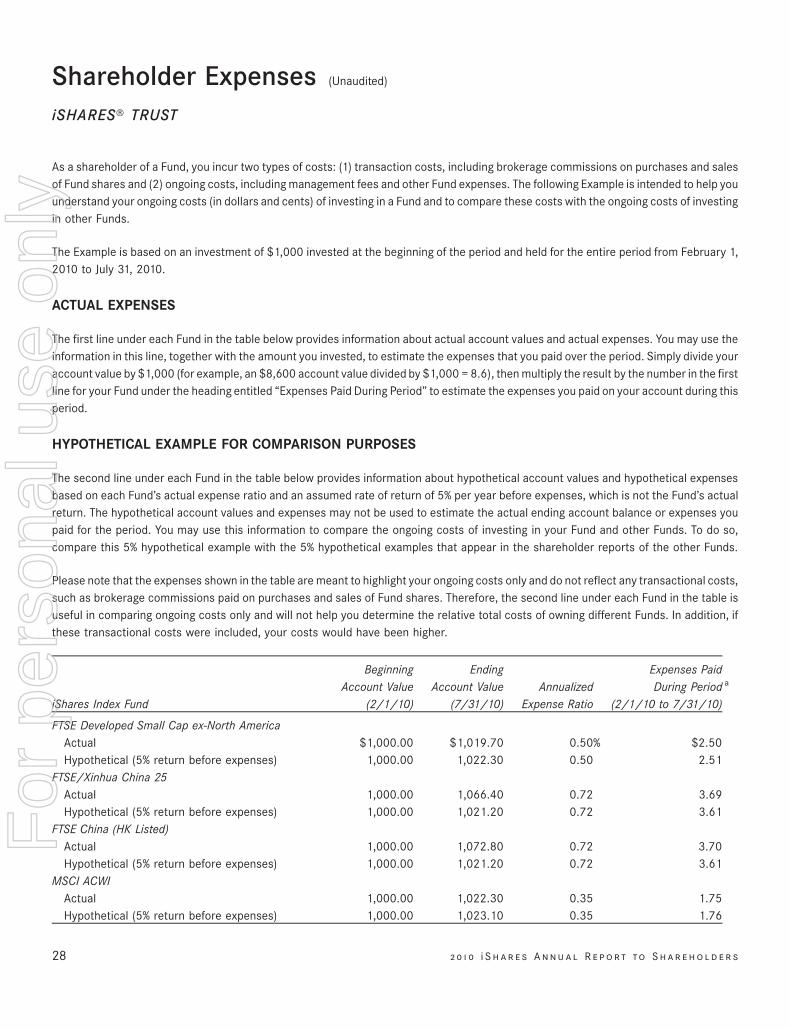
Shareholder Expenses (Unaudited)
iSHARES» TRUST
As a shareholder of a Fund, you incur two types of costs: (1) transaction costs, including brokerage commissions on purchases and salesof Fund shares and (2) ongoing costs, including management fees and other Fund expenses. The following Example is intended to help youunderstand your ongoing costs (in dollars and cents) of investing in a Fund and to compare these costs with the ongoing costs of investingin other Funds.
The Example is based on an investment of $1,000 invested at the beginning of the period and held for the entire period from February 1,2010 to July 31, 2010.
ACTUAL EXPENSES
The first line under each Fund in the table below provides information about actual account values and actual expenses. You may use theinformation in this line, together with the amount you invested, to estimate the expenses that you paid over the period. Simply divide youraccount value by $1,000 (for example, an $8,600 account value divided by $1,000 = 8.6), then multiply the result by the number in the firstline for your Fund under the heading entitled “Expenses Paid During Period” to estimate the expenses you paid on your account during thisperiod.
HYPOTHETICAL EXAMPLE FOR COMPARISON PURPOSES
The second line under each Fund in the table below provides information about hypothetical account values and hypothetical expensesbased on each Fund’s actual expense ratio and an assumed rate of return of 5% per year before expenses, which is not the Fund’s actualreturn. The hypothetical account values and expenses may not be used to estimate the actual ending account balance or expenses youpaid for the period. You may use this information to compare the ongoing costs of investing in your Fund and other Funds. To do so,compare this 5% hypothetical example with the 5% hypothetical examples that appear in the shareholder reports of the other Funds.
Please note that the expenses shown in the table are meant to highlight your ongoing costs only and do not reflect any transactional costs,such as brokerage commissions paid on purchases and sales of Fund shares. Therefore, the second line under each Fund in the table isuseful in comparing ongoing costs only and will not help you determine the relative total costs of owning different Funds. In addition, ifthese transactional costs were included, your costs would have been higher.
iShares Index Fund
BeginningAccount Value
(2/1/10)
EndingAccount Value
(7/31/10)Annualized
Expense Ratio
Expenses PaidDuring Period a
(2/1/10 to 7/31/10)
FTSE Developed Small Cap ex-North AmericaActual $1,000.00 $1,019.70 0.50% $2.50Hypothetical (5% return before expenses) 1,000.00 1,022.30 0.50 2.51
FTSE/Xinhua China 25Actual 1,000.00 1,066.40 0.72 3.69Hypothetical (5% return before expenses) 1,000.00 1,021.20 0.72 3.61
FTSE China (HK Listed)Actual 1,000.00 1,072.80 0.72 3.70Hypothetical (5% return before expenses) 1,000.00 1,021.20 0.72 3.61
MSCI ACWIActual 1,000.00 1,022.30 0.35 1.75Hypothetical (5% return before expenses) 1,000.00 1,023.10 0.35 1.76
28 2 0 1 0 i S h a r e s A n n u a l R e p o r t to S h a r e h o l d e r s
For
per
sona
l use
onl
y
%%TRANSMSG*** Transmitting Job: B82515 PCN: 030000000 ***%%PCMSG|28 |00010|Yes|No|09/16/2010 20:08|0|0|Page is valid, no graphics -- Color: N|
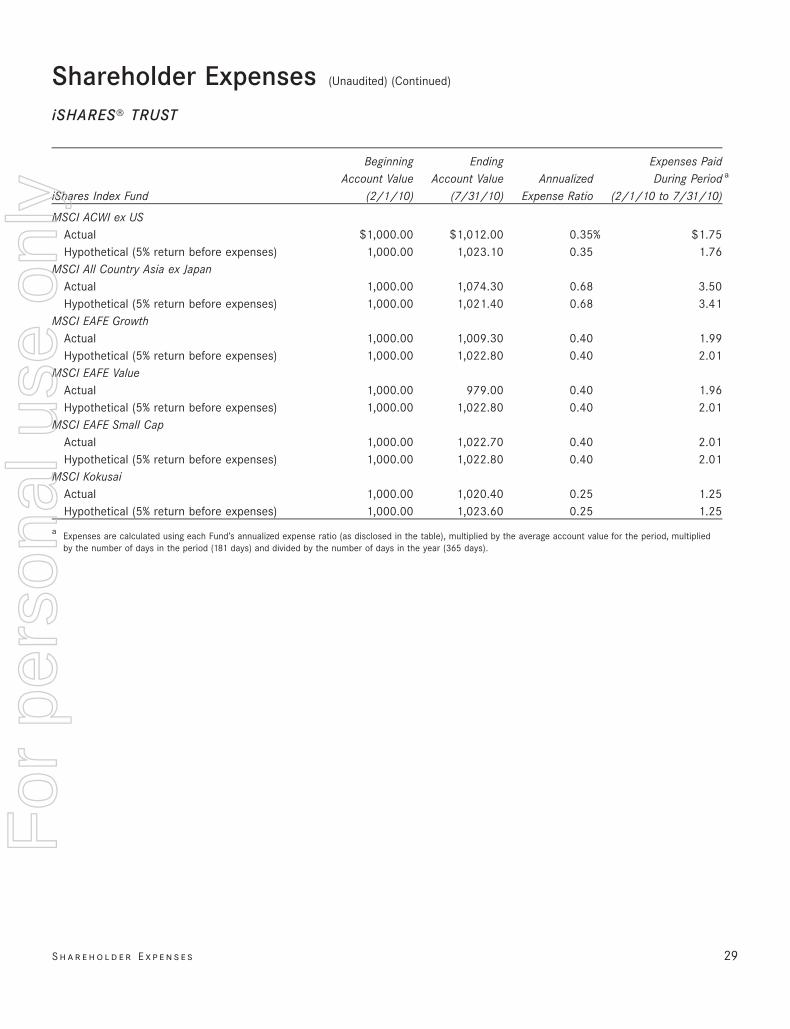
iShares Index Fund
BeginningAccount Value
(2/1/10)
EndingAccount Value
(7/31/10)Annualized
Expense Ratio
Expenses PaidDuring Period a
(2/1/10 to 7/31/10)
MSCI ACWI ex USActual $1,000.00 $1,012.00 0.35% $1.75Hypothetical (5% return before expenses) 1,000.00 1,023.10 0.35 1.76
MSCI All Country Asia ex JapanActual 1,000.00 1,074.30 0.68 3.50Hypothetical (5% return before expenses) 1,000.00 1,021.40 0.68 3.41
MSCI EAFE GrowthActual 1,000.00 1,009.30 0.40 1.99Hypothetical (5% return before expenses) 1,000.00 1,022.80 0.40 2.01
MSCI EAFE ValueActual 1,000.00 979.00 0.40 1.96Hypothetical (5% return before expenses) 1,000.00 1,022.80 0.40 2.01
MSCI EAFE Small CapActual 1,000.00 1,022.70 0.40 2.01Hypothetical (5% return before expenses) 1,000.00 1,022.80 0.40 2.01
MSCI KokusaiActual 1,000.00 1,020.40 0.25 1.25Hypothetical (5% return before expenses) 1,000.00 1,023.60 0.25 1.25
a Expenses are calculated using each Fund’s annualized expense ratio (as disclosed in the table), multiplied by the average account value for the period, multipliedby the number of days in the period (181 days) and divided by the number of days in the year (365 days).
S h a r e h o l d e r E x p e n s e s 29
Shareholder Expenses (Unaudited) (Continued)
iSHARES» TRUST
For
per
sona
l use
onl
y
%%TRANSMSG*** Transmitting Job: B82515 PCN: 031000000 ***%%PCMSG|29 |00004|Yes|No|09/16/2010 20:08|0|0|Page is valid, no graphics -- Color: N|
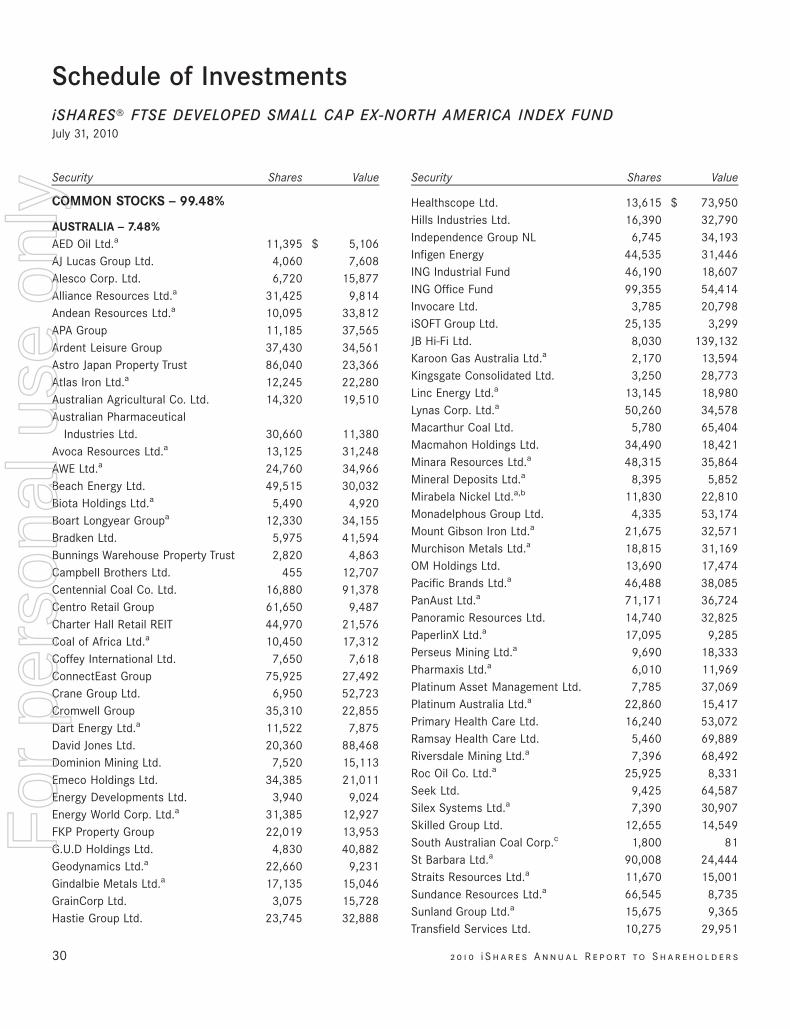
Schedule of InvestmentsiSHARES» FTSE DEVELOPED SMALL CAP EX-NORTH AMERICA INDEX FUNDJuly 31, 2010
Security Shares Value
COMMON STOCKS — 99.48%
AUSTRALIA — 7.48%AED Oil Ltd.a 11,395 $ 5,106AJ Lucas Group Ltd. 4,060 7,608Alesco Corp. Ltd. 6,720 15,877Alliance Resources Ltd.a 31,425 9,814Andean Resources Ltd.a 10,095 33,812APA Group 11,185 37,565Ardent Leisure Group 37,430 34,561Astro Japan Property Trust 86,040 23,366Atlas Iron Ltd.a 12,245 22,280Australian Agricultural Co. Ltd. 14,320 19,510Australian Pharmaceutical
Industries Ltd. 30,660 11,380Avoca Resources Ltd.a 13,125 31,248AWE Ltd.a 24,760 34,966Beach Energy Ltd. 49,515 30,032Biota Holdings Ltd.a 5,490 4,920Boart Longyear Groupa 12,330 34,155Bradken Ltd. 5,975 41,594Bunnings Warehouse Property Trust 2,820 4,863Campbell Brothers Ltd. 455 12,707Centennial Coal Co. Ltd. 16,880 91,378Centro Retail Group 61,650 9,487Charter Hall Retail REIT 44,970 21,576Coal of Africa Ltd.a 10,450 17,312Coffey International Ltd. 7,650 7,618ConnectEast Group 75,925 27,492Crane Group Ltd. 6,950 52,723Cromwell Group 35,310 22,855Dart Energy Ltd.a 11,522 7,875David Jones Ltd. 20,360 88,468Dominion Mining Ltd. 7,520 15,113Emeco Holdings Ltd. 34,385 21,011Energy Developments Ltd. 3,940 9,024Energy World Corp. Ltd.a 31,385 12,927FKP Property Group 22,019 13,953G.U.D Holdings Ltd. 4,830 40,882Geodynamics Ltd.a 22,660 9,231Gindalbie Metals Ltd.a 17,135 15,046GrainCorp Ltd. 3,075 15,728Hastie Group Ltd. 23,745 32,888
Security Shares Value
Healthscope Ltd. 13,615 $ 73,950Hills Industries Ltd. 16,390 32,790Independence Group NL 6,745 34,193Infigen Energy 44,535 31,446ING Industrial Fund 46,190 18,607ING Office Fund 99,355 54,414Invocare Ltd. 3,785 20,798iSOFT Group Ltd. 25,135 3,299JB Hi-Fi Ltd. 8,030 139,132Karoon Gas Australia Ltd.a 2,170 13,594Kingsgate Consolidated Ltd. 3,250 28,773Linc Energy Ltd.a 13,145 18,980Lynas Corp. Ltd.a 50,260 34,578Macarthur Coal Ltd. 5,780 65,404Macmahon Holdings Ltd. 34,490 18,421Minara Resources Ltd.a 48,315 35,864Mineral Deposits Ltd.a 8,395 5,852Mirabela Nickel Ltd.a,b 11,830 22,810Monadelphous Group Ltd. 4,335 53,174Mount Gibson Iron Ltd.a 21,675 32,571Murchison Metals Ltd.a 18,815 31,169OM Holdings Ltd. 13,690 17,474Pacific Brands Ltd.a 46,488 38,085PanAust Ltd.a 71,171 36,724Panoramic Resources Ltd. 14,740 32,825PaperlinX Ltd.a 17,095 9,285Perseus Mining Ltd.a 9,690 18,333Pharmaxis Ltd.a 6,010 11,969Platinum Asset Management Ltd. 7,785 37,069Platinum Australia Ltd.a 22,860 15,417Primary Health Care Ltd. 16,240 53,072Ramsay Health Care Ltd. 5,460 69,889Riversdale Mining Ltd.a 7,396 68,492Roc Oil Co. Ltd.a 25,925 8,331Seek Ltd. 9,425 64,587Silex Systems Ltd.a 7,390 30,907Skilled Group Ltd. 12,655 14,549South Australian Coal Corp.c 1,800 81St Barbara Ltd.a 90,008 24,444Straits Resources Ltd.a 11,670 15,001Sundance Resources Ltd.a 66,545 8,735Sunland Group Ltd.a 15,675 9,365Transfield Services Ltd. 10,275 29,951
30 2 0 1 0 i S h a r e s A n n u a l R e p o r t to S h a r e h o l d e r s
For
per
sona
l use
onl
y
%%TRANSMSG*** Transmitting Job: B82515 PCN: 032000000 ***%%PCMSG|30 |00010|Yes|No|09/16/2010 20:08|0|0|Page is valid, no graphics -- Color: N|
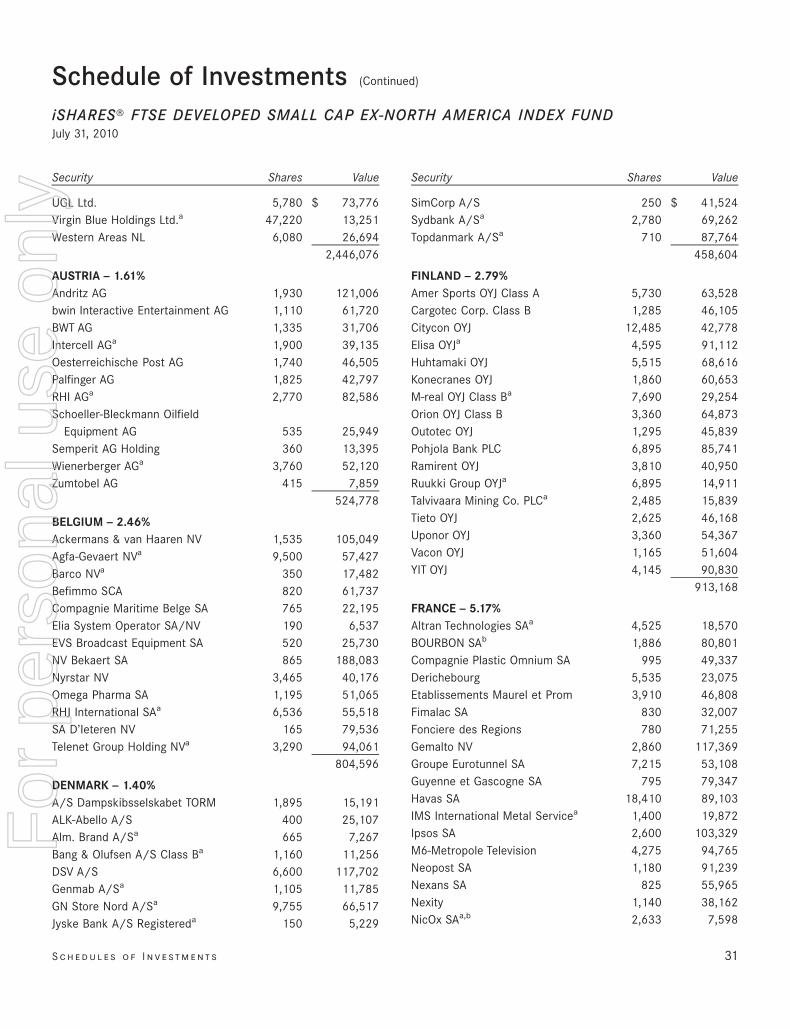
Security Shares Value
UGL Ltd. 5,780 $ 73,776Virgin Blue Holdings Ltd.a 47,220 13,251Western Areas NL 6,080 26,694
2,446,076
AUSTRIA — 1.61%Andritz AG 1,930 121,006bwin Interactive Entertainment AG 1,110 61,720BWT AG 1,335 31,706Intercell AGa 1,900 39,135Oesterreichische Post AG 1,740 46,505Palfinger AG 1,825 42,797RHI AGa 2,770 82,586Schoeller-Bleckmann Oilfield
Equipment AG 535 25,949Semperit AG Holding 360 13,395Wienerberger AGa 3,760 52,120Zumtobel AG 415 7,859
524,778
BELGIUM — 2.46%Ackermans & van Haaren NV 1,535 105,049Agfa-Gevaert NVa 9,500 57,427Barco NVa 350 17,482Befimmo SCA 820 61,737Compagnie Maritime Belge SA 765 22,195Elia System Operator SA/NV 190 6,537EVS Broadcast Equipment SA 520 25,730NV Bekaert SA 865 188,083Nyrstar NV 3,465 40,176Omega Pharma SA 1,195 51,065RHJ International SAa 6,536 55,518SA D’Ieteren NV 165 79,536Telenet Group Holding NVa 3,290 94,061
804,596
DENMARK — 1.40%A/S Dampskibsselskabet TORM 1,895 15,191ALK-Abello A/S 400 25,107Alm. Brand A/Sa 665 7,267Bang & Olufsen A/S Class Ba 1,160 11,256DSV A/S 6,600 117,702Genmab A/Sa 1,105 11,785GN Store Nord A/Sa 9,755 66,517Jyske Bank A/S Registereda 150 5,229
Security Shares Value
SimCorp A/S 250 $ 41,524Sydbank A/Sa 2,780 69,262Topdanmark A/Sa 710 87,764
458,604
FINLAND — 2.79%Amer Sports OYJ Class A 5,730 63,528Cargotec Corp. Class B 1,285 46,105Citycon OYJ 12,485 42,778Elisa OYJa 4,595 91,112Huhtamaki OYJ 5,515 68,616Konecranes OYJ 1,860 60,653M-real OYJ Class Ba 7,690 29,254Orion OYJ Class B 3,360 64,873Outotec OYJ 1,295 45,839Pohjola Bank PLC 6,895 85,741Ramirent OYJ 3,810 40,950Ruukki Group OYJa 6,895 14,911Talvivaara Mining Co. PLCa 2,485 15,839Tieto OYJ 2,625 46,168Uponor OYJ 3,360 54,367Vacon OYJ 1,165 51,604YIT OYJ 4,145 90,830
913,168
FRANCE — 5.17%Altran Technologies SAa 4,525 18,570BOURBON SAb 1,886 80,801Compagnie Plastic Omnium SA 995 49,337Derichebourg 5,535 23,075Etablissements Maurel et Prom 3,910 46,808Fimalac SA 830 32,007Fonciere des Regions 780 71,255Gemalto NV 2,860 117,369Groupe Eurotunnel SA 7,215 53,108Guyenne et Gascogne SA 795 79,347Havas SA 18,410 89,103IMS International Metal Servicea 1,400 19,872Ipsos SA 2,600 103,329M6-Metropole Television 4,275 94,765Neopost SA 1,180 91,239Nexans SA 825 55,965Nexity 1,140 38,162NicOx SAa,b 2,633 7,598
S c h e d u l e s o f I n v e st m e n t s 31
Schedule of Investments (Continued)
iSHARES» FTSE DEVELOPED SMALL CAP EX-NORTH AMERICA INDEX FUNDJuly 31, 2010
For
per
sona
l use
onl
y
%%TRANSMSG*** Transmitting Job: B82515 PCN: 033000000 ***%%PCMSG|31 |00011|Yes|No|09/16/2010 20:08|0|0|Page is valid, no graphics -- Color: N|
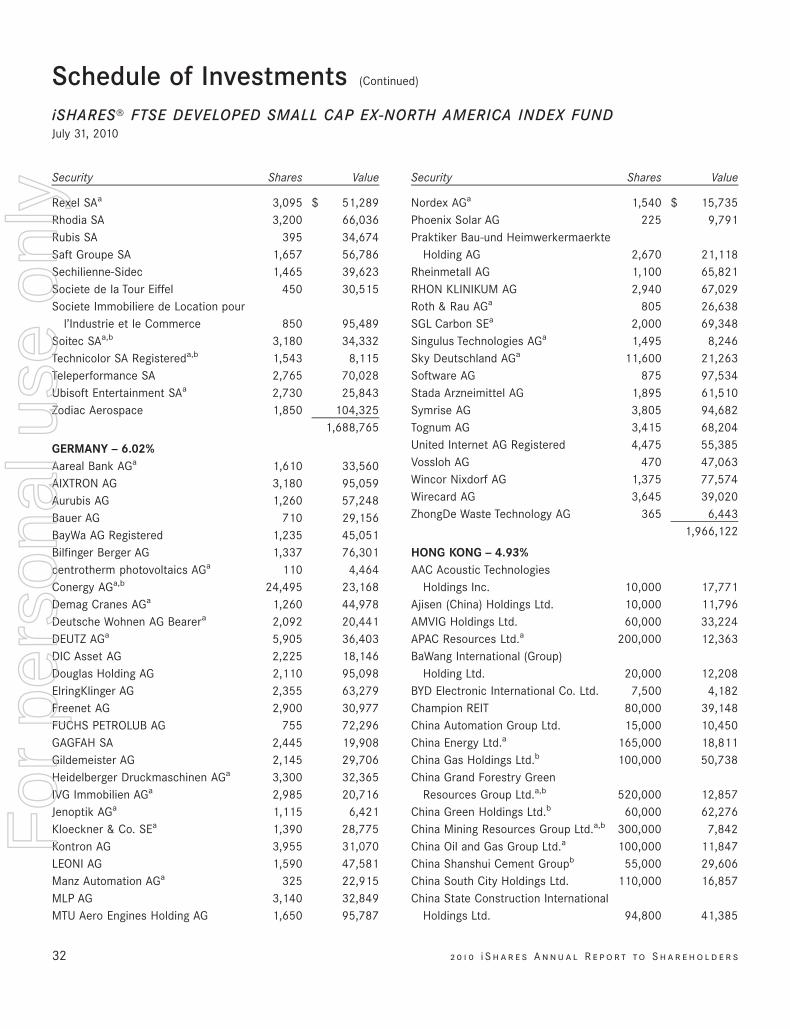
Security Shares Value
Rexel SAa 3,095 $ 51,289Rhodia SA 3,200 66,036Rubis SA 395 34,674Saft Groupe SA 1,657 56,786Sechilienne-Sidec 1,465 39,623Societe de la Tour Eiffel 450 30,515Societe Immobiliere de Location pour
l’Industrie et le Commerce 850 95,489Soitec SAa,b 3,180 34,332Technicolor SA Registereda,b 1,543 8,115Teleperformance SA 2,765 70,028Ubisoft Entertainment SAa 2,730 25,843Zodiac Aerospace 1,850 104,325
1,688,765
GERMANY — 6.02%Aareal Bank AGa 1,610 33,560AIXTRON AG 3,180 95,059Aurubis AG 1,260 57,248Bauer AG 710 29,156BayWa AG Registered 1,235 45,051Bilfinger Berger AG 1,337 76,301centrotherm photovoltaics AGa 110 4,464Conergy AGa,b 24,495 23,168Demag Cranes AGa 1,260 44,978Deutsche Wohnen AG Bearera 2,092 20,441DEUTZ AGa 5,905 36,403DIC Asset AG 2,225 18,146Douglas Holding AG 2,110 95,098ElringKlinger AG 2,355 63,279Freenet AG 2,900 30,977FUCHS PETROLUB AG 755 72,296GAGFAH SA 2,445 19,908Gildemeister AG 2,145 29,706Heidelberger Druckmaschinen AGa 3,300 32,365IVG Immobilien AGa 2,985 20,716Jenoptik AGa 1,115 6,421Kloeckner & Co. SEa 1,390 28,775Kontron AG 3,955 31,070LEONI AG 1,590 47,581Manz Automation AGa 325 22,915MLP AG 3,140 32,849MTU Aero Engines Holding AG 1,650 95,787
Security Shares Value
Nordex AGa 1,540 $ 15,735Phoenix Solar AG 225 9,791Praktiker Bau-und Heimwerkermaerkte
Holding AG 2,670 21,118Rheinmetall AG 1,100 65,821RHON KLINIKUM AG 2,940 67,029Roth & Rau AGa 805 26,638SGL Carbon SEa 2,000 69,348Singulus Technologies AGa 1,495 8,246Sky Deutschland AGa 11,600 21,263Software AG 875 97,534Stada Arzneimittel AG 1,895 61,510Symrise AG 3,805 94,682Tognum AG 3,415 68,204United Internet AG Registered 4,475 55,385Vossloh AG 470 47,063Wincor Nixdorf AG 1,375 77,574Wirecard AG 3,645 39,020ZhongDe Waste Technology AG 365 6,443
1,966,122
HONG KONG — 4.93%AAC Acoustic Technologies
Holdings Inc. 10,000 17,771Ajisen (China) Holdings Ltd. 10,000 11,796AMVIG Holdings Ltd. 60,000 33,224APAC Resources Ltd.a 200,000 12,363BaWang International (Group)
Holding Ltd. 20,000 12,208BYD Electronic International Co. Ltd. 7,500 4,182Champion REIT 80,000 39,148China Automation Group Ltd. 15,000 10,450China Energy Ltd.a 165,000 18,811China Gas Holdings Ltd.b 100,000 50,738China Grand Forestry Green
Resources Group Ltd.a,b 520,000 12,857China Green Holdings Ltd.b 60,000 62,276China Mining Resources Group Ltd.a,b 300,000 7,842China Oil and Gas Group Ltd.a 100,000 11,847China Shanshui Cement Groupb 55,000 29,606China South City Holdings Ltd. 110,000 16,857China State Construction International
Holdings Ltd. 94,800 41,385
32 2 0 1 0 i S h a r e s A n n u a l R e p o r t to S h a r e h o l d e r s
Schedule of Investments (Continued)
iSHARES» FTSE DEVELOPED SMALL CAP EX-NORTH AMERICA INDEX FUNDJuly 31, 2010
For
per
sona
l use
onl
y
%%TRANSMSG*** Transmitting Job: B82515 PCN: 034000000 ***%%PCMSG|32 |00009|Yes|No|09/16/2010 20:08|0|0|Page is valid, no graphics -- Color: N|
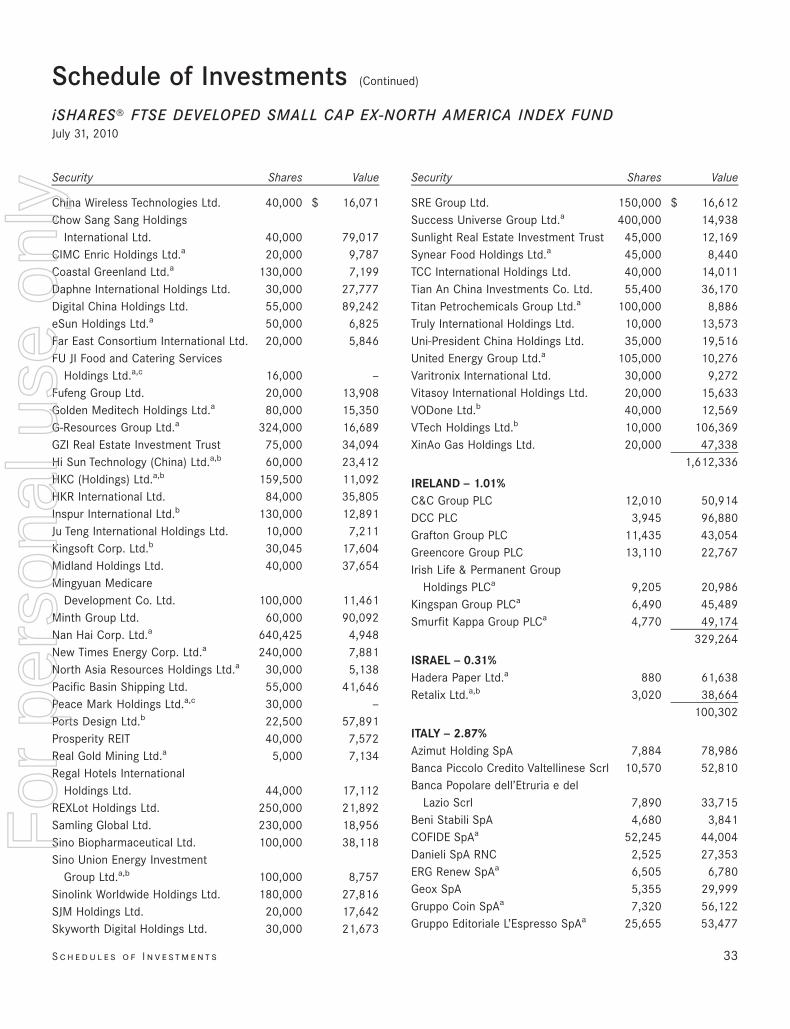
Security Shares Value
China Wireless Technologies Ltd. 40,000 $ 16,071Chow Sang Sang Holdings
International Ltd. 40,000 79,017CIMC Enric Holdings Ltd.a 20,000 9,787Coastal Greenland Ltd.a 130,000 7,199Daphne International Holdings Ltd. 30,000 27,777Digital China Holdings Ltd. 55,000 89,242eSun Holdings Ltd.a 50,000 6,825Far East Consortium International Ltd. 20,000 5,846FU JI Food and Catering Services
Holdings Ltd.a,c 16,000 —Fufeng Group Ltd. 20,000 13,908Golden Meditech Holdings Ltd.a 80,000 15,350G-Resources Group Ltd.a 324,000 16,689GZI Real Estate Investment Trust 75,000 34,094Hi Sun Technology (China) Ltd.a,b 60,000 23,412HKC (Holdings) Ltd.a,b 159,500 11,092HKR International Ltd. 84,000 35,805Inspur International Ltd.b 130,000 12,891Ju Teng International Holdings Ltd. 10,000 7,211Kingsoft Corp. Ltd.b 30,045 17,604Midland Holdings Ltd. 40,000 37,654Mingyuan Medicare
Development Co. Ltd. 100,000 11,461Minth Group Ltd. 60,000 90,092Nan Hai Corp. Ltd.a 640,425 4,948New Times Energy Corp. Ltd.a 240,000 7,881North Asia Resources Holdings Ltd.a 30,000 5,138Pacific Basin Shipping Ltd. 55,000 41,646Peace Mark Holdings Ltd.a,c 30,000 —Ports Design Ltd.b 22,500 57,891Prosperity REIT 40,000 7,572Real Gold Mining Ltd.a 5,000 7,134Regal Hotels International
Holdings Ltd. 44,000 17,112REXLot Holdings Ltd. 250,000 21,892Samling Global Ltd. 230,000 18,956Sino Biopharmaceutical Ltd. 100,000 38,118Sino Union Energy Investment
Group Ltd.a,b 100,000 8,757Sinolink Worldwide Holdings Ltd. 180,000 27,816SJM Holdings Ltd. 20,000 17,642Skyworth Digital Holdings Ltd. 30,000 21,673
Security Shares Value
SRE Group Ltd. 150,000 $ 16,612Success Universe Group Ltd.a 400,000 14,938Sunlight Real Estate Investment Trust 45,000 12,169Synear Food Holdings Ltd.a 45,000 8,440TCC International Holdings Ltd. 40,000 14,011Tian An China Investments Co. Ltd. 55,400 36,170Titan Petrochemicals Group Ltd.a 100,000 8,886Truly International Holdings Ltd. 10,000 13,573Uni-President China Holdings Ltd. 35,000 19,516United Energy Group Ltd.a 105,000 10,276Varitronix International Ltd. 30,000 9,272Vitasoy International Holdings Ltd. 20,000 15,633VODone Ltd.b 40,000 12,569VTech Holdings Ltd.b 10,000 106,369XinAo Gas Holdings Ltd. 20,000 47,338
1,612,336
IRELAND — 1.01%C&C Group PLC 12,010 50,914DCC PLC 3,945 96,880Grafton Group PLC 11,435 43,054Greencore Group PLC 13,110 22,767Irish Life & Permanent Group
Holdings PLCa 9,205 20,986Kingspan Group PLCa 6,490 45,489Smurfit Kappa Group PLCa 4,770 49,174
329,264
ISRAEL — 0.31%Hadera Paper Ltd.a 880 61,638Retalix Ltd.a,b 3,020 38,664
100,302
ITALY — 2.87%Azimut Holding SpA 7,884 78,986Banca Piccolo Credito Valtellinese Scrl 10,570 52,810Banca Popolare dell’Etruria e del
Lazio Scrl 7,890 33,715Beni Stabili SpA 4,680 3,841COFIDE SpAa 52,245 44,004Danieli SpA RNC 2,525 27,353ERG Renew SpAa 6,505 6,780Geox SpA 5,355 29,999Gruppo Coin SpAa 7,320 56,122Gruppo Editoriale L’Espresso SpAa 25,655 53,477
S c h e d u l e s o f I n v e st m e n t s 33
Schedule of Investments (Continued)
iSHARES» FTSE DEVELOPED SMALL CAP EX-NORTH AMERICA INDEX FUNDJuly 31, 2010
For
per
sona
l use
onl
y
%%TRANSMSG*** Transmitting Job: B82515 PCN: 035000000 ***%%PCMSG|33 |00006|Yes|No|09/16/2010 20:08|0|0|Page is valid, no graphics -- Color: N|
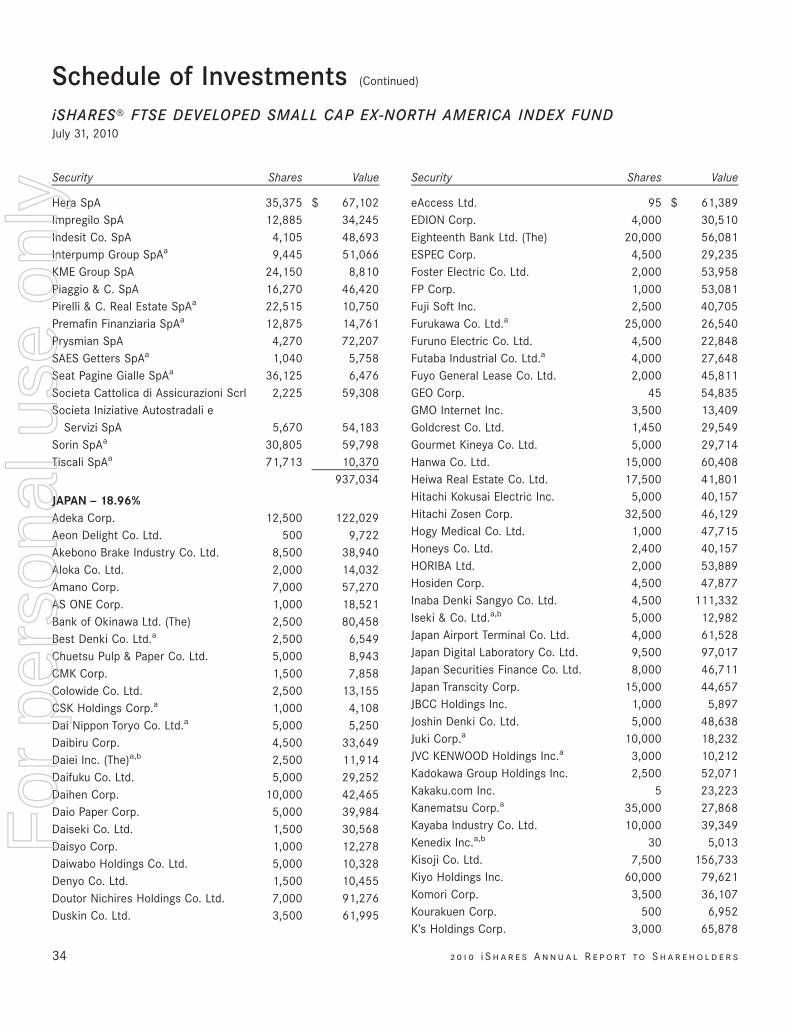
Security Shares Value
Hera SpA 35,375 $ 67,102Impregilo SpA 12,885 34,245Indesit Co. SpA 4,105 48,693Interpump Group SpAa 9,445 51,066KME Group SpA 24,150 8,810Piaggio & C. SpA 16,270 46,420Pirelli & C. Real Estate SpAa 22,515 10,750Premafin Finanziaria SpAa 12,875 14,761Prysmian SpA 4,270 72,207SAES Getters SpAa 1,040 5,758Seat Pagine Gialle SpAa 36,125 6,476Societa Cattolica di Assicurazioni Scrl 2,225 59,308Societa Iniziative Autostradali e
Servizi SpA 5,670 54,183Sorin SpAa 30,805 59,798Tiscali SpAa 71,713 10,370
937,034
JAPAN — 18.96%Adeka Corp. 12,500 122,029Aeon Delight Co. Ltd. 500 9,722Akebono Brake Industry Co. Ltd. 8,500 38,940Aloka Co. Ltd. 2,000 14,032Amano Corp. 7,000 57,270AS ONE Corp. 1,000 18,521Bank of Okinawa Ltd. (The) 2,500 80,458Best Denki Co. Ltd.a 2,500 6,549Chuetsu Pulp & Paper Co. Ltd. 5,000 8,943CMK Corp. 1,500 7,858Colowide Co. Ltd. 2,500 13,155CSK Holdings Corp.a 1,000 4,108Dai Nippon Toryo Co. Ltd.a 5,000 5,250Daibiru Corp. 4,500 33,649Daiei Inc. (The)a,b 2,500 11,914Daifuku Co. Ltd. 5,000 29,252Daihen Corp. 10,000 42,465Daio Paper Corp. 5,000 39,984Daiseki Co. Ltd. 1,500 30,568Daisyo Corp. 1,000 12,278Daiwabo Holdings Co. Ltd. 5,000 10,328Denyo Co. Ltd. 1,500 10,455Doutor Nichires Holdings Co. Ltd. 7,000 91,276Duskin Co. Ltd. 3,500 61,995
Security Shares Value
eAccess Ltd. 95 $ 61,389EDION Corp. 4,000 30,510Eighteenth Bank Ltd. (The) 20,000 56,081ESPEC Corp. 4,500 29,235Foster Electric Co. Ltd. 2,000 53,958FP Corp. 1,000 53,081Fuji Soft Inc. 2,500 40,705Furukawa Co. Ltd.a 25,000 26,540Furuno Electric Co. Ltd. 4,500 22,848Futaba Industrial Co. Ltd.a 4,000 27,648Fuyo General Lease Co. Ltd. 2,000 45,811GEO Corp. 45 54,835GMO Internet Inc. 3,500 13,409Goldcrest Co. Ltd. 1,450 29,549Gourmet Kineya Co. Ltd. 5,000 29,714Hanwa Co. Ltd. 15,000 60,408Heiwa Real Estate Co. Ltd. 17,500 41,801Hitachi Kokusai Electric Inc. 5,000 40,157Hitachi Zosen Corp. 32,500 46,129Hogy Medical Co. Ltd. 1,000 47,715Honeys Co. Ltd. 2,400 40,157HORIBA Ltd. 2,000 53,889Hosiden Corp. 4,500 47,877Inaba Denki Sangyo Co. Ltd. 4,500 111,332Iseki & Co. Ltd.a,b 5,000 12,982Japan Airport Terminal Co. Ltd. 4,000 61,528Japan Digital Laboratory Co. Ltd. 9,500 97,017Japan Securities Finance Co. Ltd. 8,000 46,711Japan Transcity Corp. 15,000 44,657JBCC Holdings Inc. 1,000 5,897Joshin Denki Co. Ltd. 5,000 48,638Juki Corp.a 10,000 18,232JVC KENWOOD Holdings Inc.a 3,000 10,212Kadokawa Group Holdings Inc. 2,500 52,071Kakaku.com Inc. 5 23,223Kanematsu Corp.a 35,000 27,868Kayaba Industry Co. Ltd. 10,000 39,349Kenedix Inc.a,b 30 5,013Kisoji Co. Ltd. 7,500 156,733Kiyo Holdings Inc. 60,000 79,621Komori Corp. 3,500 36,107Kourakuen Corp. 500 6,952K’s Holdings Corp. 3,000 65,878
34 2 0 1 0 i S h a r e s A n n u a l R e p o r t to S h a r e h o l d e r s
Schedule of Investments (Continued)
iSHARES» FTSE DEVELOPED SMALL CAP EX-NORTH AMERICA INDEX FUNDJuly 31, 2010
For
per
sona
l use
onl
y
%%TRANSMSG*** Transmitting Job: B82515 PCN: 036000000 ***%%PCMSG|34 |00012|Yes|No|09/16/2010 20:08|0|0|Page is valid, no graphics -- Color: N|
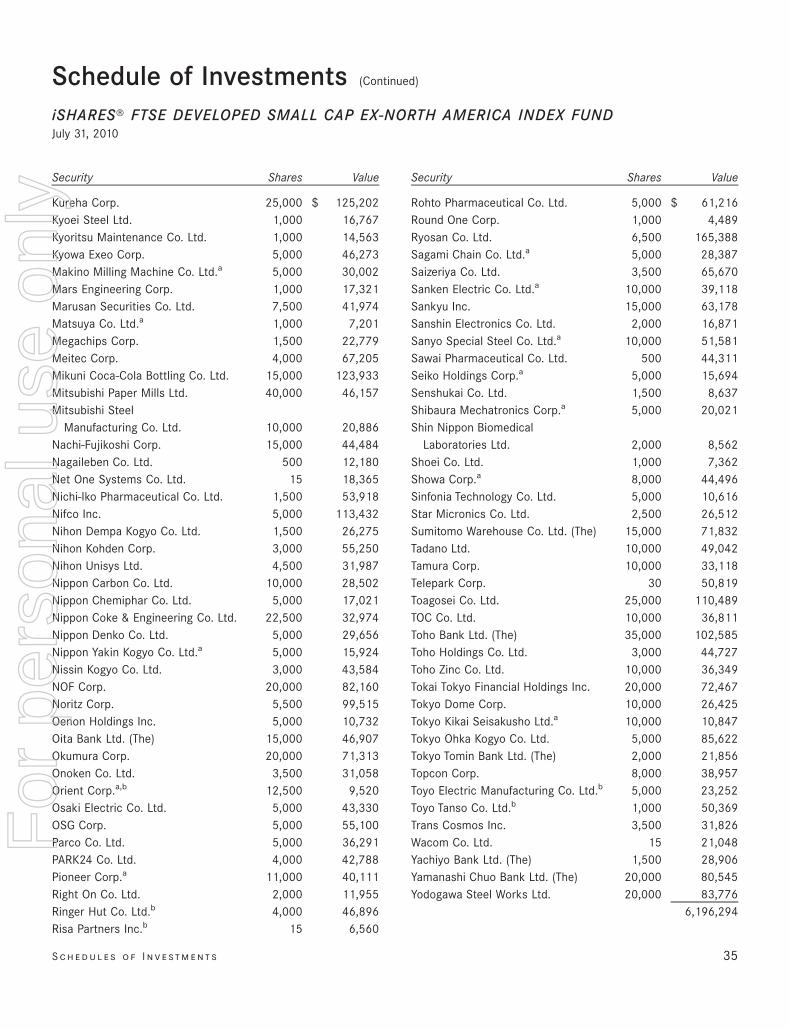
Security Shares Value
Kureha Corp. 25,000 $ 125,202Kyoei Steel Ltd. 1,000 16,767Kyoritsu Maintenance Co. Ltd. 1,000 14,563Kyowa Exeo Corp. 5,000 46,273Makino Milling Machine Co. Ltd.a 5,000 30,002Mars Engineering Corp. 1,000 17,321Marusan Securities Co. Ltd. 7,500 41,974Matsuya Co. Ltd.a 1,000 7,201Megachips Corp. 1,500 22,779Meitec Corp. 4,000 67,205Mikuni Coca-Cola Bottling Co. Ltd. 15,000 123,933Mitsubishi Paper Mills Ltd. 40,000 46,157Mitsubishi Steel
Manufacturing Co. Ltd. 10,000 20,886Nachi-Fujikoshi Corp. 15,000 44,484Nagaileben Co. Ltd. 500 12,180Net One Systems Co. Ltd. 15 18,365Nichi-Iko Pharmaceutical Co. Ltd. 1,500 53,918Nifco Inc. 5,000 113,432Nihon Dempa Kogyo Co. Ltd. 1,500 26,275Nihon Kohden Corp. 3,000 55,250Nihon Unisys Ltd. 4,500 31,987Nippon Carbon Co. Ltd. 10,000 28,502Nippon Chemiphar Co. Ltd. 5,000 17,021Nippon Coke & Engineering Co. Ltd. 22,500 32,974Nippon Denko Co. Ltd. 5,000 29,656Nippon Yakin Kogyo Co. Ltd.a 5,000 15,924Nissin Kogyo Co. Ltd. 3,000 43,584NOF Corp. 20,000 82,160Noritz Corp. 5,500 99,515Oenon Holdings Inc. 5,000 10,732Oita Bank Ltd. (The) 15,000 46,907Okumura Corp. 20,000 71,313Onoken Co. Ltd. 3,500 31,058Orient Corp.a,b 12,500 9,520Osaki Electric Co. Ltd. 5,000 43,330OSG Corp. 5,000 55,100Parco Co. Ltd. 5,000 36,291PARK24 Co. Ltd. 4,000 42,788Pioneer Corp.a 11,000 40,111Right On Co. Ltd. 2,000 11,955Ringer Hut Co. Ltd.b 4,000 46,896Risa Partners Inc.b 15 6,560
Security Shares Value
Rohto Pharmaceutical Co. Ltd. 5,000 $ 61,216Round One Corp. 1,000 4,489Ryosan Co. Ltd. 6,500 165,388Sagami Chain Co. Ltd.a 5,000 28,387Saizeriya Co. Ltd. 3,500 65,670Sanken Electric Co. Ltd.a 10,000 39,118Sankyu Inc. 15,000 63,178Sanshin Electronics Co. Ltd. 2,000 16,871Sanyo Special Steel Co. Ltd.a 10,000 51,581Sawai Pharmaceutical Co. Ltd. 500 44,311Seiko Holdings Corp.a 5,000 15,694Senshukai Co. Ltd. 1,500 8,637Shibaura Mechatronics Corp.a 5,000 20,021Shin Nippon Biomedical
Laboratories Ltd. 2,000 8,562Shoei Co. Ltd. 1,000 7,362Showa Corp.a 8,000 44,496Sinfonia Technology Co. Ltd. 5,000 10,616Star Micronics Co. Ltd. 2,500 26,512Sumitomo Warehouse Co. Ltd. (The) 15,000 71,832Tadano Ltd. 10,000 49,042Tamura Corp. 10,000 33,118Telepark Corp. 30 50,819Toagosei Co. Ltd. 25,000 110,489TOC Co. Ltd. 10,000 36,811Toho Bank Ltd. (The) 35,000 102,585Toho Holdings Co. Ltd. 3,000 44,727Toho Zinc Co. Ltd. 10,000 36,349Tokai Tokyo Financial Holdings Inc. 20,000 72,467Tokyo Dome Corp. 10,000 26,425Tokyo Kikai Seisakusho Ltd.a 10,000 10,847Tokyo Ohka Kogyo Co. Ltd. 5,000 85,622Tokyo Tomin Bank Ltd. (The) 2,000 21,856Topcon Corp. 8,000 38,957Toyo Electric Manufacturing Co. Ltd.b 5,000 23,252Toyo Tanso Co. Ltd.b 1,000 50,369Trans Cosmos Inc. 3,500 31,826Wacom Co. Ltd. 15 21,048Yachiyo Bank Ltd. (The) 1,500 28,906Yamanashi Chuo Bank Ltd. (The) 20,000 80,545Yodogawa Steel Works Ltd. 20,000 83,776
6,196,294
S c h e d u l e s o f I n v e st m e n t s 35
Schedule of Investments (Continued)
iSHARES» FTSE DEVELOPED SMALL CAP EX-NORTH AMERICA INDEX FUNDJuly 31, 2010
For
per
sona
l use
onl
y
%%TRANSMSG*** Transmitting Job: B82515 PCN: 037000000 ***%%PCMSG|35 |00009|Yes|No|09/16/2010 20:08|0|0|Page is valid, no graphics -- Color: N|
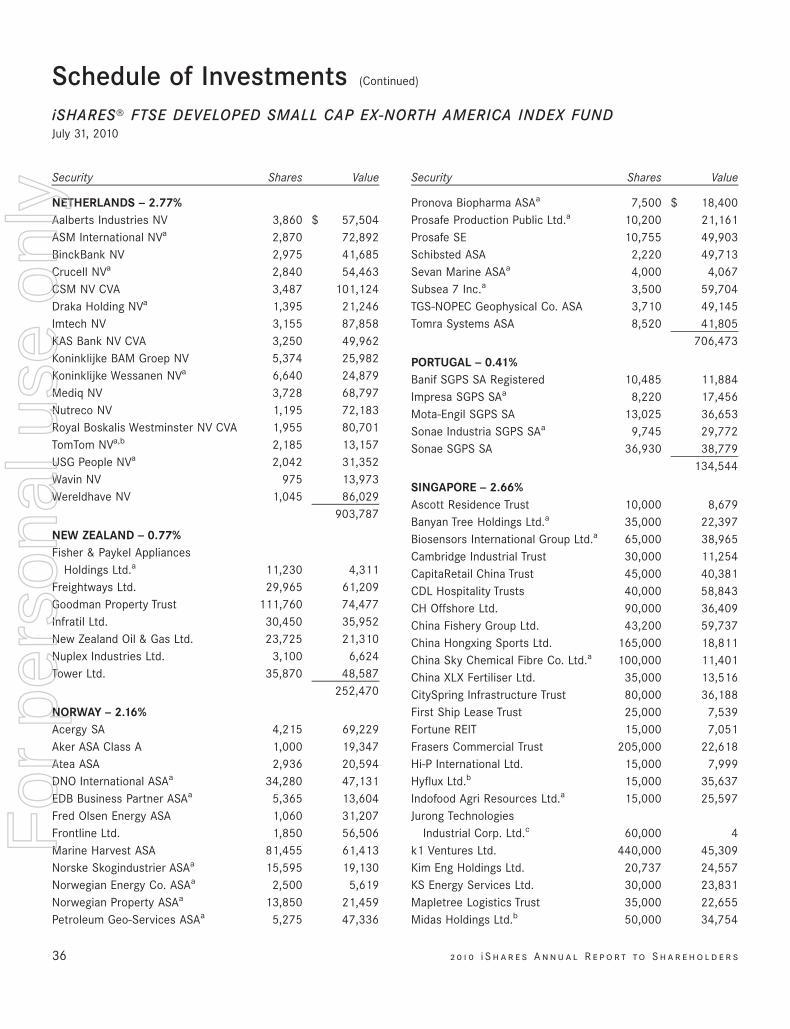
Security Shares Value
NETHERLANDS — 2.77%Aalberts Industries NV 3,860 $ 57,504ASM International NVa 2,870 72,892BinckBank NV 2,975 41,685Crucell NVa 2,840 54,463CSM NV CVA 3,487 101,124Draka Holding NVa 1,395 21,246Imtech NV 3,155 87,858KAS Bank NV CVA 3,250 49,962Koninklijke BAM Groep NV 5,374 25,982Koninklijke Wessanen NVa 6,640 24,879Mediq NV 3,728 68,797Nutreco NV 1,195 72,183Royal Boskalis Westminster NV CVA 1,955 80,701TomTom NVa,b 2,185 13,157USG People NVa 2,042 31,352Wavin NV 975 13,973Wereldhave NV 1,045 86,029
903,787
NEW ZEALAND — 0.77%Fisher & Paykel Appliances
Holdings Ltd.a 11,230 4,311Freightways Ltd. 29,965 61,209Goodman Property Trust 111,760 74,477Infratil Ltd. 30,450 35,952New Zealand Oil & Gas Ltd. 23,725 21,310Nuplex Industries Ltd. 3,100 6,624Tower Ltd. 35,870 48,587
252,470
NORWAY — 2.16%Acergy SA 4,215 69,229Aker ASA Class A 1,000 19,347Atea ASA 2,936 20,594DNO International ASAa 34,280 47,131EDB Business Partner ASAa 5,365 13,604Fred Olsen Energy ASA 1,060 31,207Frontline Ltd. 1,850 56,506Marine Harvest ASA 81,455 61,413Norske Skogindustrier ASAa 15,595 19,130Norwegian Energy Co. ASAa 2,500 5,619Norwegian Property ASAa 13,850 21,459Petroleum Geo-Services ASAa 5,275 47,336
Security Shares Value
Pronova Biopharma ASAa 7,500 $ 18,400Prosafe Production Public Ltd.a 10,200 21,161Prosafe SE 10,755 49,903Schibsted ASA 2,220 49,713Sevan Marine ASAa 4,000 4,067Subsea 7 Inc.a 3,500 59,704TGS-NOPEC Geophysical Co. ASA 3,710 49,145Tomra Systems ASA 8,520 41,805
706,473
PORTUGAL — 0.41%Banif SGPS SA Registered 10,485 11,884Impresa SGPS SAa 8,220 17,456Mota-Engil SGPS SA 13,025 36,653Sonae Industria SGPS SAa 9,745 29,772Sonae SGPS SA 36,930 38,779
134,544
SINGAPORE — 2.66%Ascott Residence Trust 10,000 8,679Banyan Tree Holdings Ltd.a 35,000 22,397Biosensors International Group Ltd.a 65,000 38,965Cambridge Industrial Trust 30,000 11,254CapitaRetail China Trust 45,000 40,381CDL Hospitality Trusts 40,000 58,843CH Offshore Ltd. 90,000 36,409China Fishery Group Ltd. 43,200 59,737China Hongxing Sports Ltd. 165,000 18,811China Sky Chemical Fibre Co. Ltd.a 100,000 11,401China XLX Fertiliser Ltd. 35,000 13,516CitySpring Infrastructure Trust 80,000 36,188First Ship Lease Trust 25,000 7,539Fortune REIT 15,000 7,051Frasers Commercial Trust 205,000 22,618Hi-P International Ltd. 15,000 7,999Hyflux Ltd.b 15,000 35,637Indofood Agri Resources Ltd.a 15,000 25,597Jurong Technologies
Industrial Corp. Ltd.c 60,000 4k1 Ventures Ltd. 440,000 45,309Kim Eng Holdings Ltd. 20,737 24,557KS Energy Services Ltd. 30,000 23,831Mapletree Logistics Trust 35,000 22,655Midas Holdings Ltd.b 50,000 34,754
36 2 0 1 0 i S h a r e s A n n u a l R e p o r t to S h a r e h o l d e r s
Schedule of Investments (Continued)
iSHARES» FTSE DEVELOPED SMALL CAP EX-NORTH AMERICA INDEX FUNDJuly 31, 2010
For
per
sona
l use
onl
y
%%TRANSMSG*** Transmitting Job: B82515 PCN: 038000000 ***%%PCMSG|36 |00010|Yes|No|09/16/2010 20:08|0|0|Page is valid, no graphics -- Color: N|
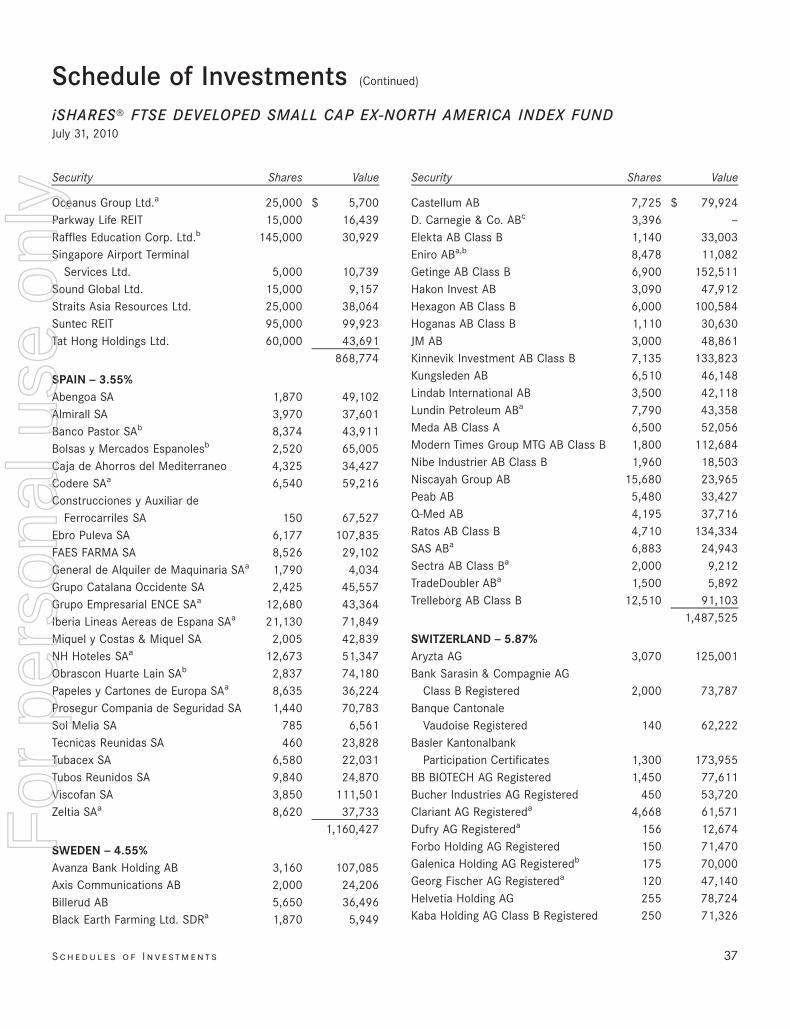
Security Shares Value
Oceanus Group Ltd.a 25,000 $ 5,700Parkway Life REIT 15,000 16,439Raffles Education Corp. Ltd.b 145,000 30,929Singapore Airport Terminal
Services Ltd. 5,000 10,739Sound Global Ltd. 15,000 9,157Straits Asia Resources Ltd. 25,000 38,064Suntec REIT 95,000 99,923Tat Hong Holdings Ltd. 60,000 43,691
868,774
SPAIN — 3.55%Abengoa SA 1,870 49,102Almirall SA 3,970 37,601Banco Pastor SAb 8,374 43,911Bolsas y Mercados Espanolesb 2,520 65,005Caja de Ahorros del Mediterraneo 4,325 34,427Codere SAa 6,540 59,216Construcciones y Auxiliar de
Ferrocarriles SA 150 67,527Ebro Puleva SA 6,177 107,835FAES FARMA SA 8,526 29,102General de Alquiler de Maquinaria SAa 1,790 4,034Grupo Catalana Occidente SA 2,425 45,557Grupo Empresarial ENCE SAa 12,680 43,364Iberia Lineas Aereas de Espana SAa 21,130 71,849Miquel y Costas & Miquel SA 2,005 42,839NH Hoteles SAa 12,673 51,347Obrascon Huarte Lain SAb 2,837 74,180Papeles y Cartones de Europa SAa 8,635 36,224Prosegur Compania de Seguridad SA 1,440 70,783Sol Melia SA 785 6,561Tecnicas Reunidas SA 460 23,828Tubacex SA 6,580 22,031Tubos Reunidos SA 9,840 24,870Viscofan SA 3,850 111,501Zeltia SAa 8,620 37,733
1,160,427
SWEDEN — 4.55%Avanza Bank Holding AB 3,160 107,085Axis Communications AB 2,000 24,206Billerud AB 5,650 36,496Black Earth Farming Ltd. SDRa 1,870 5,949
Security Shares Value
Castellum AB 7,725 $ 79,924D. Carnegie & Co. ABc 3,396 —Elekta AB Class B 1,140 33,003Eniro ABa,b 8,478 11,082Getinge AB Class B 6,900 152,511Hakon Invest AB 3,090 47,912Hexagon AB Class B 6,000 100,584Hoganas AB Class B 1,110 30,630JM AB 3,000 48,861Kinnevik Investment AB Class B 7,135 133,823Kungsleden AB 6,510 46,148Lindab International AB 3,500 42,118Lundin Petroleum ABa 7,790 43,358Meda AB Class A 6,500 52,056Modern Times Group MTG AB Class B 1,800 112,684Nibe Industrier AB Class B 1,960 18,503Niscayah Group AB 15,680 23,965Peab AB 5,480 33,427Q-Med AB 4,195 37,716Ratos AB Class B 4,710 134,334SAS ABa 6,883 24,943Sectra AB Class Ba 2,000 9,212TradeDoubler ABa 1,500 5,892Trelleborg AB Class B 12,510 91,103
1,487,525
SWITZERLAND — 5.87%Aryzta AG 3,070 125,001Bank Sarasin & Compagnie AG
Class B Registered 2,000 73,787Banque Cantonale
Vaudoise Registered 140 62,222Basler Kantonalbank
Participation Certificates 1,300 173,955BB BIOTECH AG Registered 1,450 77,611Bucher Industries AG Registered 450 53,720Clariant AG Registereda 4,668 61,571Dufry AG Registereda 156 12,674Forbo Holding AG Registered 150 71,470Galenica Holding AG Registeredb 175 70,000Georg Fischer AG Registereda 120 47,140Helvetia Holding AG 255 78,724Kaba Holding AG Class B Registered 250 71,326
S c h e d u l e s o f I n v e st m e n t s 37
Schedule of Investments (Continued)
iSHARES» FTSE DEVELOPED SMALL CAP EX-NORTH AMERICA INDEX FUNDJuly 31, 2010
For
per
sona
l use
onl
y
%%TRANSMSG*** Transmitting Job: B82515 PCN: 039000000 ***%%PCMSG|37 |00009|Yes|No|09/16/2010 20:08|0|0|Page is valid, no graphics -- Color: N|
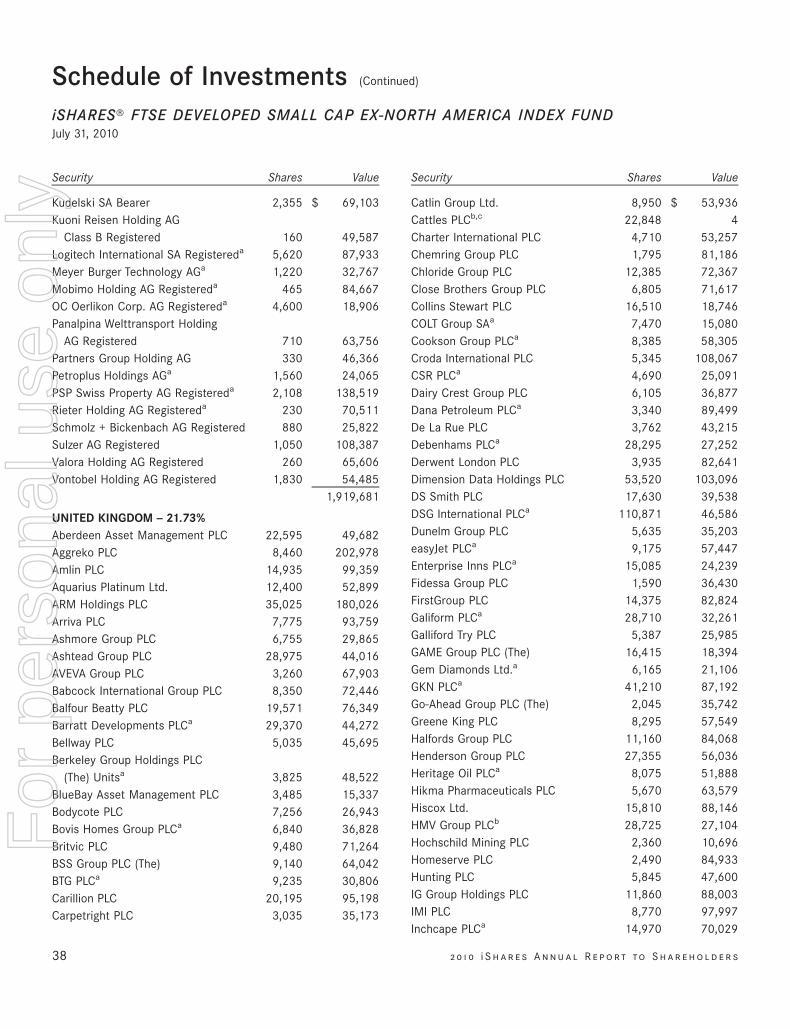
Security Shares Value
Kudelski SA Bearer 2,355 $ 69,103Kuoni Reisen Holding AG
Class B Registered 160 49,587Logitech International SA Registereda 5,620 87,933Meyer Burger Technology AGa 1,220 32,767Mobimo Holding AG Registereda 465 84,667OC Oerlikon Corp. AG Registereda 4,600 18,906Panalpina Welttransport Holding
AG Registered 710 63,756Partners Group Holding AG 330 46,366Petroplus Holdings AGa 1,560 24,065PSP Swiss Property AG Registereda 2,108 138,519Rieter Holding AG Registereda 230 70,511Schmolz + Bickenbach AG Registered 880 25,822Sulzer AG Registered 1,050 108,387Valora Holding AG Registered 260 65,606Vontobel Holding AG Registered 1,830 54,485
1,919,681
UNITED KINGDOM — 21.73%Aberdeen Asset Management PLC 22,595 49,682Aggreko PLC 8,460 202,978Amlin PLC 14,935 99,359Aquarius Platinum Ltd. 12,400 52,899ARM Holdings PLC 35,025 180,026Arriva PLC 7,775 93,759Ashmore Group PLC 6,755 29,865Ashtead Group PLC 28,975 44,016AVEVA Group PLC 3,260 67,903Babcock International Group PLC 8,350 72,446Balfour Beatty PLC 19,571 76,349Barratt Developments PLCa 29,370 44,272Bellway PLC 5,035 45,695Berkeley Group Holdings PLC
(The) Unitsa 3,825 48,522BlueBay Asset Management PLC 3,485 15,337Bodycote PLC 7,256 26,943Bovis Homes Group PLCa 6,840 36,828Britvic PLC 9,480 71,264BSS Group PLC (The) 9,140 64,042BTG PLCa 9,235 30,806Carillion PLC 20,195 95,198Carpetright PLC 3,035 35,173
Security Shares Value
Catlin Group Ltd. 8,950 $ 53,936Cattles PLCb,c 22,848 4Charter International PLC 4,710 53,257Chemring Group PLC 1,795 81,186Chloride Group PLC 12,385 72,367Close Brothers Group PLC 6,805 71,617Collins Stewart PLC 16,510 18,746COLT Group SAa 7,470 15,080Cookson Group PLCa 8,385 58,305Croda International PLC 5,345 108,067CSR PLCa 4,690 25,091Dairy Crest Group PLC 6,105 36,877Dana Petroleum PLCa 3,340 89,499De La Rue PLC 3,762 43,215Debenhams PLCa 28,295 27,252Derwent London PLC 3,935 82,641Dimension Data Holdings PLC 53,520 103,096DS Smith PLC 17,630 39,538DSG International PLCa 110,871 46,586Dunelm Group PLC 5,635 35,203easyJet PLCa 9,175 57,447Enterprise Inns PLCa 15,085 24,239Fidessa Group PLC 1,590 36,430FirstGroup PLC 14,375 82,824Galiform PLCa 28,710 32,261Galliford Try PLC 5,387 25,985GAME Group PLC (The) 16,415 18,394Gem Diamonds Ltd.a 6,165 21,106GKN PLCa 41,210 87,192Go-Ahead Group PLC (The) 2,045 35,742Greene King PLC 8,295 57,549Halfords Group PLC 11,160 84,068Henderson Group PLC 27,355 56,036Heritage Oil PLCa 8,075 51,888Hikma Pharmaceuticals PLC 5,670 63,579Hiscox Ltd. 15,810 88,146HMV Group PLCb 28,725 27,104Hochschild Mining PLC 2,360 10,696Homeserve PLC 2,490 84,933Hunting PLC 5,845 47,600IG Group Holdings PLC 11,860 88,003IMI PLC 8,770 97,997Inchcape PLCa 14,970 70,029
38 2 0 1 0 i S h a r e s A n n u a l R e p o r t to S h a r e h o l d e r s
Schedule of Investments (Continued)
iSHARES» FTSE DEVELOPED SMALL CAP EX-NORTH AMERICA INDEX FUNDJuly 31, 2010
For
per
sona
l use
onl
y
%%TRANSMSG*** Transmitting Job: B82515 PCN: 040000000 ***%%PCMSG|38 |00010|Yes|No|09/16/2010 20:08|0|0|Page is valid, no graphics -- Color: N|
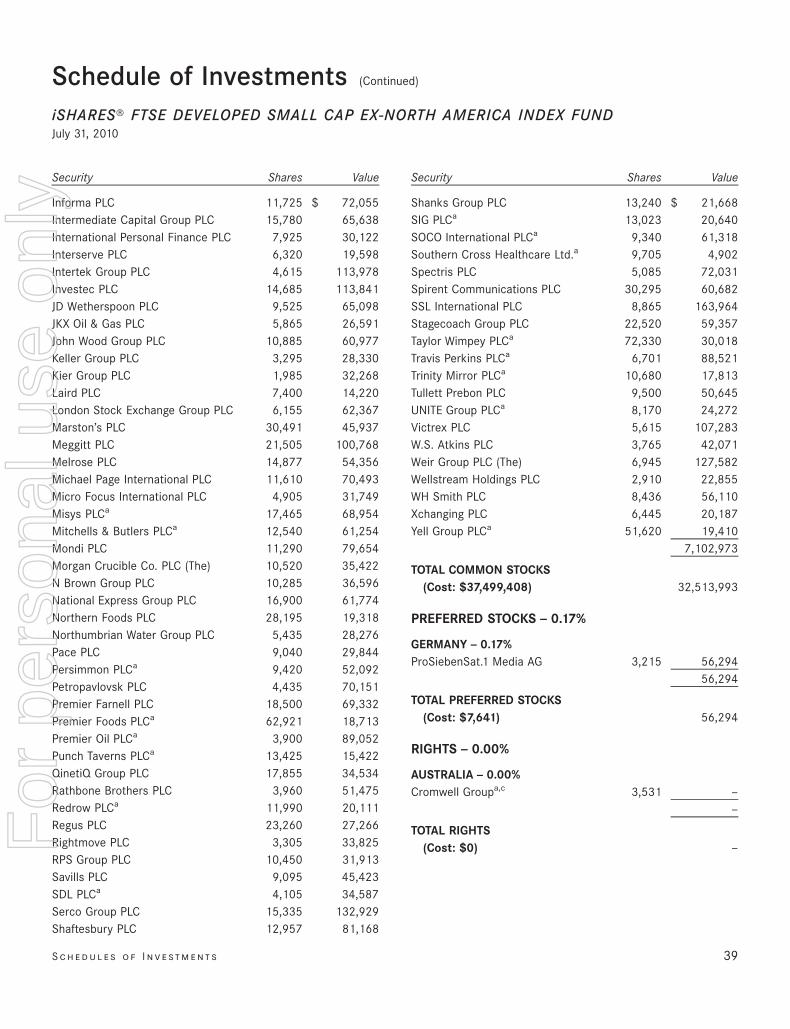
Security Shares Value
Informa PLC 11,725 $ 72,055Intermediate Capital Group PLC 15,780 65,638International Personal Finance PLC 7,925 30,122Interserve PLC 6,320 19,598Intertek Group PLC 4,615 113,978Investec PLC 14,685 113,841JD Wetherspoon PLC 9,525 65,098JKX Oil & Gas PLC 5,865 26,591John Wood Group PLC 10,885 60,977Keller Group PLC 3,295 28,330Kier Group PLC 1,985 32,268Laird PLC 7,400 14,220London Stock Exchange Group PLC 6,155 62,367Marston’s PLC 30,491 45,937Meggitt PLC 21,505 100,768Melrose PLC 14,877 54,356Michael Page International PLC 11,610 70,493Micro Focus International PLC 4,905 31,749Misys PLCa 17,465 68,954Mitchells & Butlers PLCa 12,540 61,254Mondi PLC 11,290 79,654Morgan Crucible Co. PLC (The) 10,520 35,422N Brown Group PLC 10,285 36,596National Express Group PLC 16,900 61,774Northern Foods PLC 28,195 19,318Northumbrian Water Group PLC 5,435 28,276Pace PLC 9,040 29,844Persimmon PLCa 9,420 52,092Petropavlovsk PLC 4,435 70,151Premier Farnell PLC 18,500 69,332Premier Foods PLCa 62,921 18,713Premier Oil PLCa 3,900 89,052Punch Taverns PLCa 13,425 15,422QinetiQ Group PLC 17,855 34,534Rathbone Brothers PLC 3,960 51,475Redrow PLCa 11,990 20,111Regus PLC 23,260 27,266Rightmove PLC 3,305 33,825RPS Group PLC 10,450 31,913Savills PLC 9,095 45,423SDL PLCa 4,105 34,587Serco Group PLC 15,335 132,929Shaftesbury PLC 12,957 81,168
Security Shares Value
Shanks Group PLC 13,240 $ 21,668SIG PLCa 13,023 20,640SOCO International PLCa 9,340 61,318Southern Cross Healthcare Ltd.a 9,705 4,902Spectris PLC 5,085 72,031Spirent Communications PLC 30,295 60,682SSL International PLC 8,865 163,964Stagecoach Group PLC 22,520 59,357Taylor Wimpey PLCa 72,330 30,018Travis Perkins PLCa 6,701 88,521Trinity Mirror PLCa 10,680 17,813Tullett Prebon PLC 9,500 50,645UNITE Group PLCa 8,170 24,272Victrex PLC 5,615 107,283W.S. Atkins PLC 3,765 42,071Weir Group PLC (The) 6,945 127,582Wellstream Holdings PLC 2,910 22,855WH Smith PLC 8,436 56,110Xchanging PLC 6,445 20,187Yell Group PLCa 51,620 19,410
7,102,973
TOTAL COMMON STOCKS(Cost: $37,499,408) 32,513,993
PREFERRED STOCKS — 0.17%
GERMANY — 0.17%ProSiebenSat.1 Media AG 3,215 56,294
56,294
TOTAL PREFERRED STOCKS(Cost: $7,641) 56,294
RIGHTS — 0.00%
AUSTRALIA — 0.00%Cromwell Groupa,c 3,531 —
—
TOTAL RIGHTS(Cost: $0) —
Schedule of Investments (Continued)
iSHARES» FTSE DEVELOPED SMALL CAP EX-NORTH AMERICA INDEX FUNDJuly 31, 2010
S c h e d u l e s o f I n v e st m e n t s 39
For
per
sona
l use
onl
y
%%TRANSMSG*** Transmitting Job: B82515 PCN: 041000000 ***%%PCMSG|39 |00013|Yes|No|09/20/2010 15:27|0|0|Page is valid, no graphics -- Color: N|
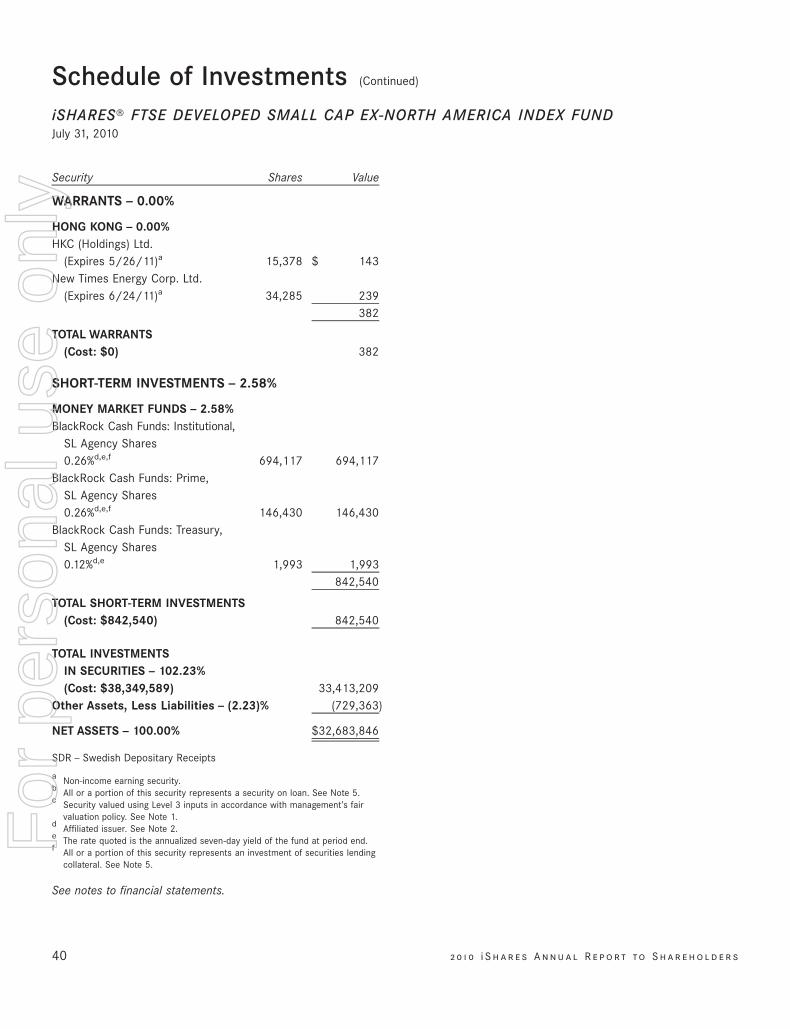
Security Shares Value
WARRANTS — 0.00%
HONG KONG — 0.00%HKC (Holdings) Ltd.
(Expires 5/26/11)a 15,378 $ 143New Times Energy Corp. Ltd.
(Expires 6/24/11)a 34,285 239382
TOTAL WARRANTS(Cost: $0) 382
SHORT-TERM INVESTMENTS — 2.58%
MONEY MARKET FUNDS — 2.58%BlackRock Cash Funds: Institutional,
SL Agency Shares0.26%d,e,f 694,117 694,117
BlackRock Cash Funds: Prime,SL Agency Shares0.26%d,e,f 146,430 146,430
BlackRock Cash Funds: Treasury,SL Agency Shares0.12%d,e 1,993 1,993
842,540
TOTAL SHORT-TERM INVESTMENTS(Cost: $842,540) 842,540
TOTAL INVESTMENTSIN SECURITIES — 102.23%(Cost: $38,349,589) 33,413,209
Other Assets, Less Liabilities — (2.23)% (729,363)
NET ASSETS — 100.00% $32,683,846
SDR — Swedish Depositary Receipts
a Non-income earning security.b All or a portion of this security represents a security on loan. See Note 5.c Security valued using Level 3 inputs in accordance with management’s fair
valuation policy. See Note 1.d Affiliated issuer. See Note 2.e The rate quoted is the annualized seven-day yield of the fund at period end.f All or a portion of this security represents an investment of securities lending
collateral. See Note 5.
See notes to financial statements.
Schedule of Investments (Continued)
iSHARES» FTSE DEVELOPED SMALL CAP EX-NORTH AMERICA INDEX FUNDJuly 31, 2010
40 2 0 1 0 i S h a r e s A n n u a l R e p o r t to S h a r e h o l d e r s
For
per
sona
l use
onl
y
%%TRANSMSG*** Transmitting Job: B82515 PCN: 042000000 ***%%PCMSG|40 |00009|Yes|No|09/20/2010 15:27|0|0|Page is valid, no graphics -- Color: N|
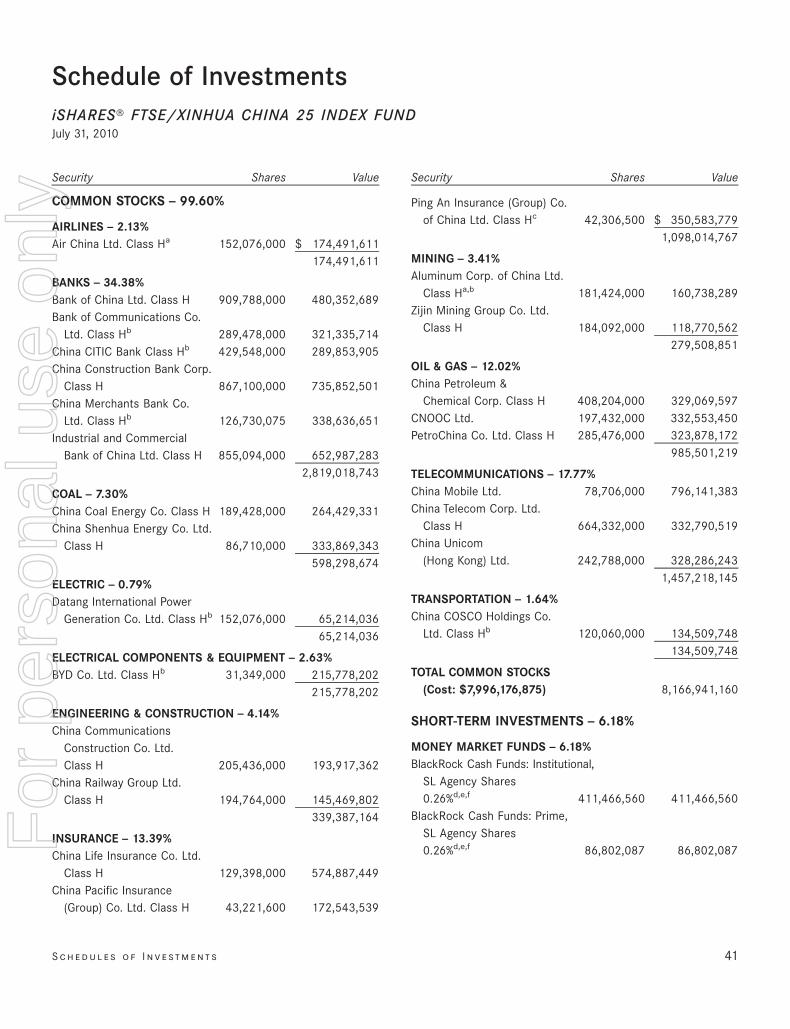
Schedule of InvestmentsiSHARES» FTSE/XINHUA CHINA 25 INDEX FUNDJuly 31, 2010
Security Shares Value
COMMON STOCKS — 99.60%
AIRLINES — 2.13%Air China Ltd. Class Ha 152,076,000 $ 174,491,611
174,491,611
BANKS — 34.38%Bank of China Ltd. Class H 909,788,000 480,352,689Bank of Communications Co.
Ltd. Class Hb 289,478,000 321,335,714China CITIC Bank Class Hb 429,548,000 289,853,905China Construction Bank Corp.
Class H 867,100,000 735,852,501China Merchants Bank Co.
Ltd. Class Hb 126,730,075 338,636,651Industrial and Commercial
Bank of China Ltd. Class H 855,094,000 652,987,2832,819,018,743
COAL — 7.30%China Coal Energy Co. Class H 189,428,000 264,429,331China Shenhua Energy Co. Ltd.
Class H 86,710,000 333,869,343598,298,674
ELECTRIC — 0.79%Datang International Power
Generation Co. Ltd. Class Hb 152,076,000 65,214,03665,214,036
ELECTRICAL COMPONENTS & EQUIPMENT — 2.63%BYD Co. Ltd. Class Hb 31,349,000 215,778,202
215,778,202
ENGINEERING & CONSTRUCTION — 4.14%China Communications
Construction Co. Ltd.Class H 205,436,000 193,917,362
China Railway Group Ltd.Class H 194,764,000 145,469,802
339,387,164
INSURANCE — 13.39%China Life Insurance Co. Ltd.
Class H 129,398,000 574,887,449China Pacific Insurance
(Group) Co. Ltd. Class H 43,221,600 172,543,539
Security Shares Value
Ping An Insurance (Group) Co.of China Ltd. Class Hc 42,306,500 $ 350,583,779
1,098,014,767
MINING — 3.41%Aluminum Corp. of China Ltd.
Class Ha,b 181,424,000 160,738,289Zijin Mining Group Co. Ltd.
Class H 184,092,000 118,770,562279,508,851
OIL & GAS — 12.02%China Petroleum &
Chemical Corp. Class H 408,204,000 329,069,597CNOOC Ltd. 197,432,000 332,553,450PetroChina Co. Ltd. Class H 285,476,000 323,878,172
985,501,219
TELECOMMUNICATIONS — 17.77%China Mobile Ltd. 78,706,000 796,141,383China Telecom Corp. Ltd.
Class H 664,332,000 332,790,519China Unicom
(Hong Kong) Ltd. 242,788,000 328,286,2431,457,218,145
TRANSPORTATION — 1.64%China COSCO Holdings Co.
Ltd. Class Hb 120,060,000 134,509,748134,509,748
TOTAL COMMON STOCKS(Cost: $7,996,176,875) 8,166,941,160
SHORT-TERM INVESTMENTS — 6.18%
MONEY MARKET FUNDS — 6.18%BlackRock Cash Funds: Institutional,
SL Agency Shares0.26%d,e,f 411,466,560 411,466,560
BlackRock Cash Funds: Prime,SL Agency Shares0.26%d,e,f 86,802,087 86,802,087
S c h e d u l e s o f I n v e st m e n t s 41
For
per
sona
l use
onl
y
%%TRANSMSG*** Transmitting Job: B82515 PCN: 043000000 ***%%PCMSG|41 |00010|Yes|No|09/16/2010 20:08|0|0|Page is valid, no graphics -- Color: N|
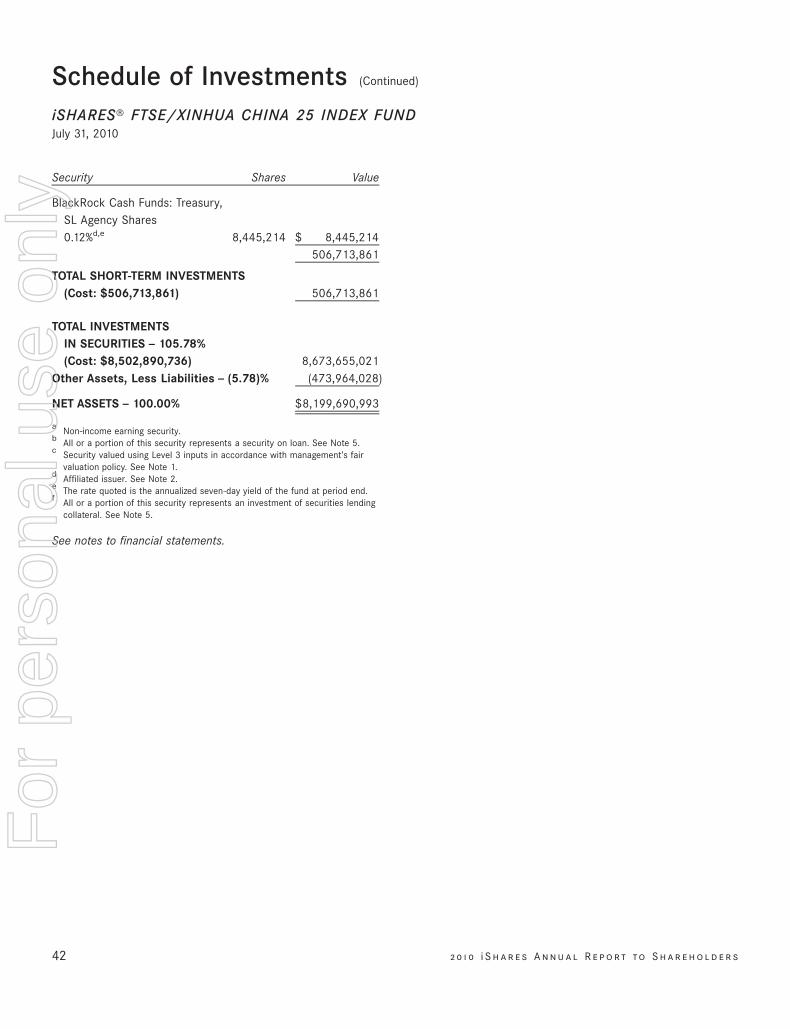
Security Shares Value
BlackRock Cash Funds: Treasury,SL Agency Shares0.12%d,e 8,445,214 $ 8,445,214
506,713,861
TOTAL SHORT-TERM INVESTMENTS(Cost: $506,713,861) 506,713,861
TOTAL INVESTMENTSIN SECURITIES — 105.78%(Cost: $8,502,890,736) 8,673,655,021
Other Assets, Less Liabilities — (5.78)% (473,964,028)
NET ASSETS — 100.00% $8,199,690,993
a Non-income earning security.b All or a portion of this security represents a security on loan. See Note 5.c Security valued using Level 3 inputs in accordance with management’s fair
valuation policy. See Note 1.d Affiliated issuer. See Note 2.e The rate quoted is the annualized seven-day yield of the fund at period end.f All or a portion of this security represents an investment of securities lending
collateral. See Note 5.
See notes to financial statements.
42 2 0 1 0 i S h a r e s A n n u a l R e p o r t to S h a r e h o l d e r s
Schedule of Investments (Continued)
iSHARES» FTSE/XINHUA CHINA 25 INDEX FUNDJuly 31, 2010
For
per
sona
l use
onl
y
%%TRANSMSG*** Transmitting Job: B82515 PCN: 044000000 ***%%PCMSG|42 |00011|Yes|No|09/16/2010 20:08|0|0|Page is valid, no graphics -- Color: N|
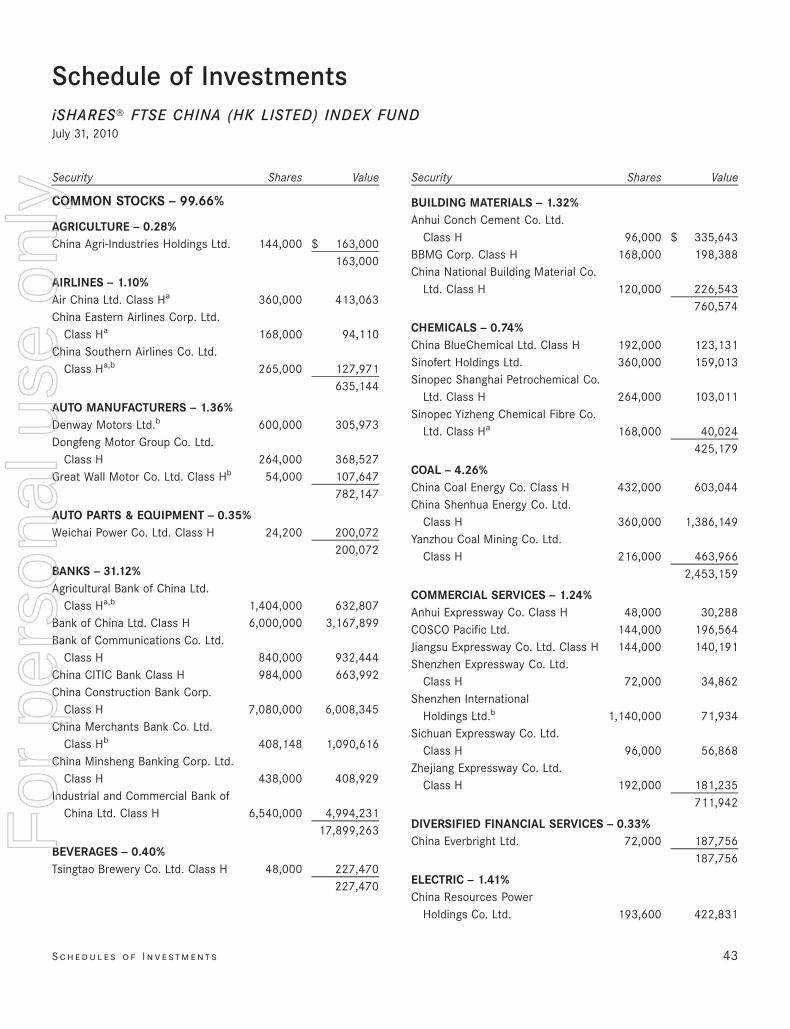
Schedule of InvestmentsiSHARES» FTSE CHINA (HK LISTED) INDEX FUNDJuly 31, 2010
Security Shares Value
COMMON STOCKS — 99.66%
AGRICULTURE — 0.28%China Agri-Industries Holdings Ltd. 144,000 $ 163,000
163,000
AIRLINES — 1.10%Air China Ltd. Class Ha 360,000 413,063China Eastern Airlines Corp. Ltd.
Class Ha 168,000 94,110China Southern Airlines Co. Ltd.
Class Ha,b 265,000 127,971635,144
AUTO MANUFACTURERS — 1.36%Denway Motors Ltd.b 600,000 305,973Dongfeng Motor Group Co. Ltd.
Class H 264,000 368,527Great Wall Motor Co. Ltd. Class Hb 54,000 107,647
782,147
AUTO PARTS & EQUIPMENT — 0.35%Weichai Power Co. Ltd. Class H 24,200 200,072
200,072
BANKS — 31.12%Agricultural Bank of China Ltd.
Class Ha,b 1,404,000 632,807Bank of China Ltd. Class H 6,000,000 3,167,899Bank of Communications Co. Ltd.
Class H 840,000 932,444China CITIC Bank Class H 984,000 663,992China Construction Bank Corp.
Class H 7,080,000 6,008,345China Merchants Bank Co. Ltd.
Class Hb 408,148 1,090,616China Minsheng Banking Corp. Ltd.
Class H 438,000 408,929Industrial and Commercial Bank of
China Ltd. Class H 6,540,000 4,994,23117,899,263
BEVERAGES — 0.40%Tsingtao Brewery Co. Ltd. Class H 48,000 227,470
227,470
Security Shares Value
BUILDING MATERIALS — 1.32%Anhui Conch Cement Co. Ltd.
Class H 96,000 $ 335,643BBMG Corp. Class H 168,000 198,388China National Building Material Co.
Ltd. Class H 120,000 226,543760,574
CHEMICALS — 0.74%China BlueChemical Ltd. Class H 192,000 123,131Sinofert Holdings Ltd. 360,000 159,013Sinopec Shanghai Petrochemical Co.
Ltd. Class H 264,000 103,011Sinopec Yizheng Chemical Fibre Co.
Ltd. Class Ha 168,000 40,024425,179
COAL — 4.26%China Coal Energy Co. Class H 432,000 603,044China Shenhua Energy Co. Ltd.
Class H 360,000 1,386,149Yanzhou Coal Mining Co. Ltd.
Class H 216,000 463,9662,453,159
COMMERCIAL SERVICES — 1.24%Anhui Expressway Co. Class H 48,000 30,288COSCO Pacific Ltd. 144,000 196,564Jiangsu Expressway Co. Ltd. Class H 144,000 140,191Shenzhen Expressway Co. Ltd.
Class H 72,000 34,862Shenzhen International
Holdings Ltd.b 1,140,000 71,934Sichuan Expressway Co. Ltd.
Class H 96,000 56,868Zhejiang Expressway Co. Ltd.
Class H 192,000 181,235711,942
DIVERSIFIED FINANCIAL SERVICES — 0.33%China Everbright Ltd. 72,000 187,756
187,756
ELECTRIC — 1.41%China Resources Power
Holdings Co. Ltd. 193,600 422,831
S c h e d u l e s o f I n v e st m e n t s 43
For
per
sona
l use
onl
y
%%TRANSMSG*** Transmitting Job: B82515 PCN: 045000000 ***%%PCMSG|43 |00010|Yes|No|09/16/2010 20:08|0|0|Page is valid, no graphics -- Color: N|
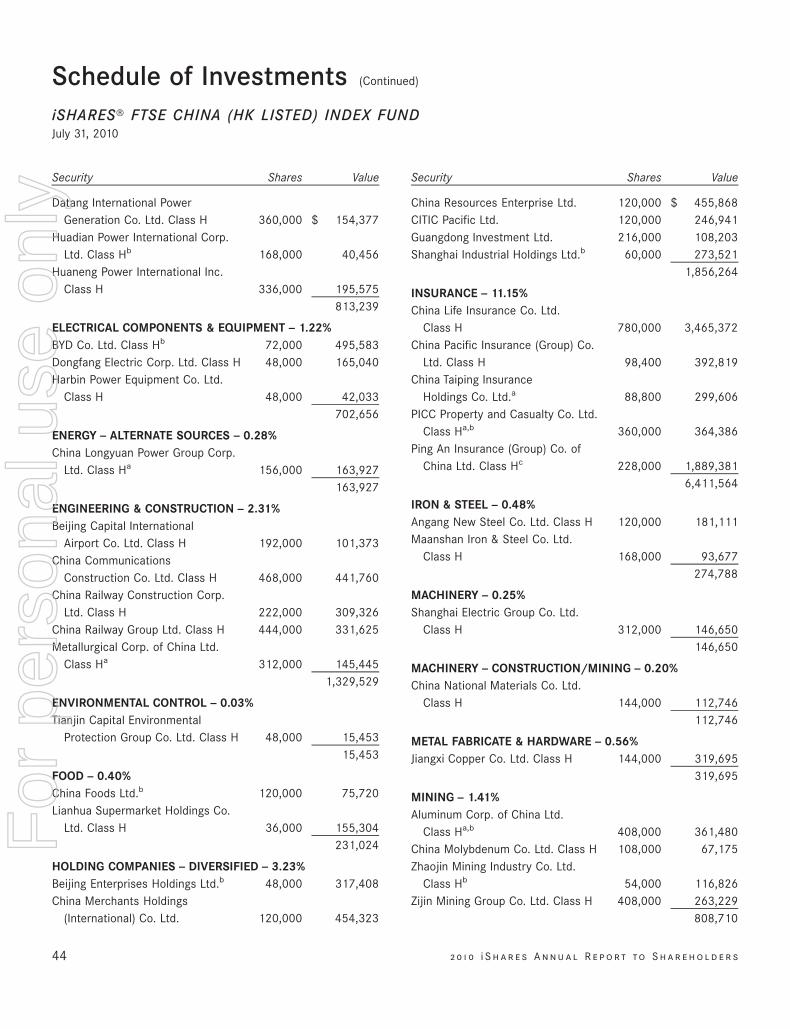
Security Shares Value
Datang International PowerGeneration Co. Ltd. Class H 360,000 $ 154,377
Huadian Power International Corp.Ltd. Class Hb 168,000 40,456
Huaneng Power International Inc.Class H 336,000 195,575
813,239
ELECTRICAL COMPONENTS & EQUIPMENT — 1.22%BYD Co. Ltd. Class Hb 72,000 495,583Dongfang Electric Corp. Ltd. Class H 48,000 165,040Harbin Power Equipment Co. Ltd.
Class H 48,000 42,033702,656
ENERGY — ALTERNATE SOURCES — 0.28%China Longyuan Power Group Corp.
Ltd. Class Ha 156,000 163,927163,927
ENGINEERING & CONSTRUCTION — 2.31%Beijing Capital International
Airport Co. Ltd. Class H 192,000 101,373China Communications
Construction Co. Ltd. Class H 468,000 441,760China Railway Construction Corp.
Ltd. Class H 222,000 309,326China Railway Group Ltd. Class H 444,000 331,625Metallurgical Corp. of China Ltd.
Class Ha 312,000 145,4451,329,529
ENVIRONMENTAL CONTROL — 0.03%Tianjin Capital Environmental
Protection Group Co. Ltd. Class H 48,000 15,45315,453
FOOD — 0.40%China Foods Ltd.b 120,000 75,720Lianhua Supermarket Holdings Co.
Ltd. Class H 36,000 155,304231,024
HOLDING COMPANIES — DIVERSIFIED — 3.23%Beijing Enterprises Holdings Ltd.b 48,000 317,408China Merchants Holdings
(International) Co. Ltd. 120,000 454,323
Security Shares Value
China Resources Enterprise Ltd. 120,000 $ 455,868CITIC Pacific Ltd. 120,000 246,941Guangdong Investment Ltd. 216,000 108,203Shanghai Industrial Holdings Ltd.b 60,000 273,521
1,856,264
INSURANCE — 11.15%China Life Insurance Co. Ltd.
Class H 780,000 3,465,372China Pacific Insurance (Group) Co.
Ltd. Class H 98,400 392,819China Taiping Insurance
Holdings Co. Ltd.a 88,800 299,606PICC Property and Casualty Co. Ltd.
Class Ha,b 360,000 364,386Ping An Insurance (Group) Co. of
China Ltd. Class Hc 228,000 1,889,3816,411,564
IRON & STEEL — 0.48%Angang New Steel Co. Ltd. Class H 120,000 181,111Maanshan Iron & Steel Co. Ltd.
Class H 168,000 93,677274,788
MACHINERY — 0.25%Shanghai Electric Group Co. Ltd.
Class H 312,000 146,650146,650
MACHINERY — CONSTRUCTION/MINING — 0.20%China National Materials Co. Ltd.
Class H 144,000 112,746112,746
METAL FABRICATE & HARDWARE — 0.56%Jiangxi Copper Co. Ltd. Class H 144,000 319,695
319,695
MINING — 1.41%Aluminum Corp. of China Ltd.
Class Ha,b 408,000 361,480China Molybdenum Co. Ltd. Class H 108,000 67,175Zhaojin Mining Industry Co. Ltd.
Class Hb 54,000 116,826Zijin Mining Group Co. Ltd. Class H 408,000 263,229
808,710
44 2 0 1 0 i S h a r e s A n n u a l R e p o r t to S h a r e h o l d e r s
Schedule of Investments (Continued)
iSHARES» FTSE CHINA (HK LISTED) INDEX FUNDJuly 31, 2010
For
per
sona
l use
onl
y
%%TRANSMSG*** Transmitting Job: B82515 PCN: 046000000 ***%%PCMSG|44 |00010|Yes|No|09/16/2010 20:08|0|0|Page is valid, no graphics -- Color: N|
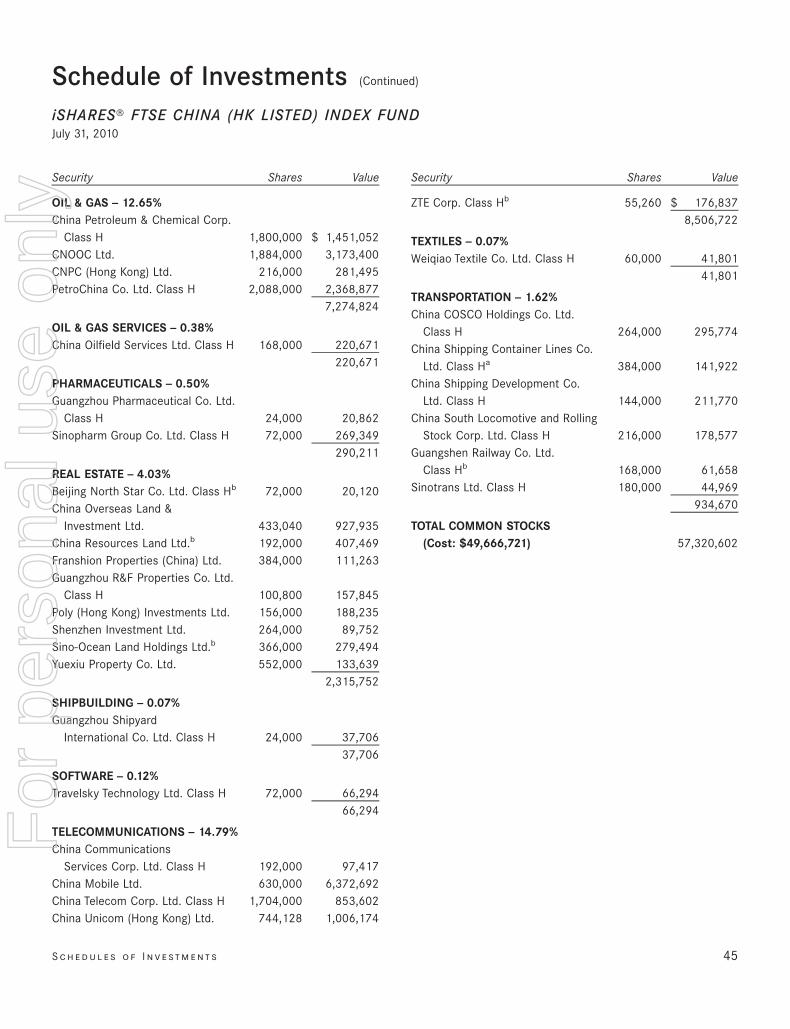
Security Shares Value
OIL & GAS — 12.65%China Petroleum & Chemical Corp.
Class H 1,800,000 $ 1,451,052CNOOC Ltd. 1,884,000 3,173,400CNPC (Hong Kong) Ltd. 216,000 281,495PetroChina Co. Ltd. Class H 2,088,000 2,368,877
7,274,824
OIL & GAS SERVICES — 0.38%China Oilfield Services Ltd. Class H 168,000 220,671
220,671
PHARMACEUTICALS — 0.50%Guangzhou Pharmaceutical Co. Ltd.
Class H 24,000 20,862Sinopharm Group Co. Ltd. Class H 72,000 269,349
290,211
REAL ESTATE — 4.03%Beijing North Star Co. Ltd. Class Hb 72,000 20,120China Overseas Land &
Investment Ltd. 433,040 927,935China Resources Land Ltd.b 192,000 407,469Franshion Properties (China) Ltd. 384,000 111,263Guangzhou R&F Properties Co. Ltd.
Class H 100,800 157,845Poly (Hong Kong) Investments Ltd. 156,000 188,235Shenzhen Investment Ltd. 264,000 89,752Sino-Ocean Land Holdings Ltd.b 366,000 279,494Yuexiu Property Co. Ltd. 552,000 133,639
2,315,752
SHIPBUILDING — 0.07%Guangzhou Shipyard
International Co. Ltd. Class H 24,000 37,70637,706
SOFTWARE — 0.12%Travelsky Technology Ltd. Class H 72,000 66,294
66,294
TELECOMMUNICATIONS — 14.79%China Communications
Services Corp. Ltd. Class H 192,000 97,417China Mobile Ltd. 630,000 6,372,692China Telecom Corp. Ltd. Class H 1,704,000 853,602China Unicom (Hong Kong) Ltd. 744,128 1,006,174
Security Shares Value
ZTE Corp. Class Hb 55,260 $ 176,8378,506,722
TEXTILES — 0.07%Weiqiao Textile Co. Ltd. Class H 60,000 41,801
41,801
TRANSPORTATION — 1.62%China COSCO Holdings Co. Ltd.
Class H 264,000 295,774China Shipping Container Lines Co.
Ltd. Class Ha 384,000 141,922China Shipping Development Co.
Ltd. Class H 144,000 211,770China South Locomotive and Rolling
Stock Corp. Ltd. Class H 216,000 178,577Guangshen Railway Co. Ltd.
Class Hb 168,000 61,658Sinotrans Ltd. Class H 180,000 44,969
934,670
TOTAL COMMON STOCKS(Cost: $49,666,721) 57,320,602
S c h e d u l e s o f I n v e st m e n t s 45
Schedule of Investments (Continued)
iSHARES» FTSE CHINA (HK LISTED) INDEX FUNDJuly 31, 2010
For
per
sona
l use
onl
y
%%TRANSMSG*** Transmitting Job: B82515 PCN: 047000000 ***%%PCMSG|45 |00009|Yes|No|09/16/2010 20:08|0|0|Page is valid, no graphics -- Color: N|
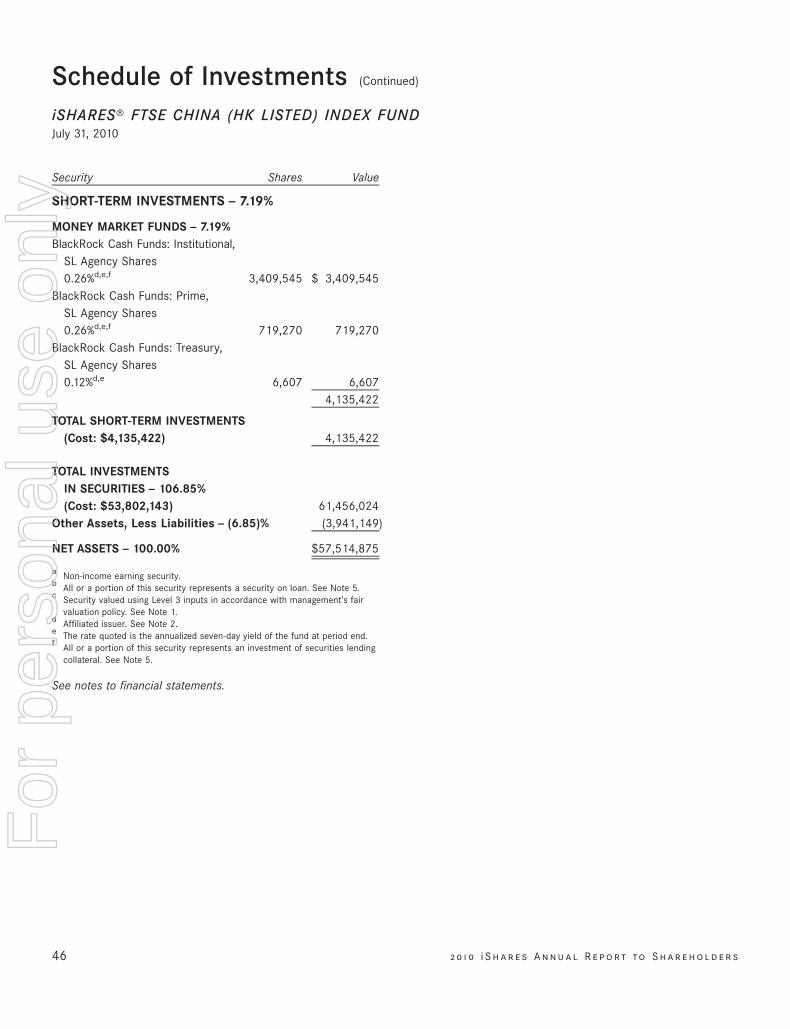
Security Shares Value
SHORT-TERM INVESTMENTS — 7.19%
MONEY MARKET FUNDS — 7.19%BlackRock Cash Funds: Institutional,
SL Agency Shares0.26%d,e,f 3,409,545 $ 3,409,545
BlackRock Cash Funds: Prime,SL Agency Shares0.26%d,e,f 719,270 719,270
BlackRock Cash Funds: Treasury,SL Agency Shares0.12%d,e 6,607 6,607
4,135,422
TOTAL SHORT-TERM INVESTMENTS(Cost: $4,135,422) 4,135,422
TOTAL INVESTMENTSIN SECURITIES — 106.85%(Cost: $53,802,143) 61,456,024
Other Assets, Less Liabilities — (6.85)% (3,941,149)
NET ASSETS — 100.00% $57,514,875
a Non-income earning security.b All or a portion of this security represents a security on loan. See Note 5.c Security valued using Level 3 inputs in accordance with management’s fair
valuation policy. See Note 1.d Affiliated issuer. See Note 2.e The rate quoted is the annualized seven-day yield of the fund at period end.f All or a portion of this security represents an investment of securities lending
collateral. See Note 5.
See notes to financial statements.
46 2 0 1 0 i S h a r e s A n n u a l R e p o r t to S h a r e h o l d e r s
Schedule of Investments (Continued)
iSHARES» FTSE CHINA (HK LISTED) INDEX FUNDJuly 31, 2010
For
per
sona
l use
onl
y
%%TRANSMSG*** Transmitting Job: B82515 PCN: 048000000 ***%%PCMSG|46 |00011|Yes|No|09/16/2010 20:08|0|0|Page is valid, no graphics -- Color: N|
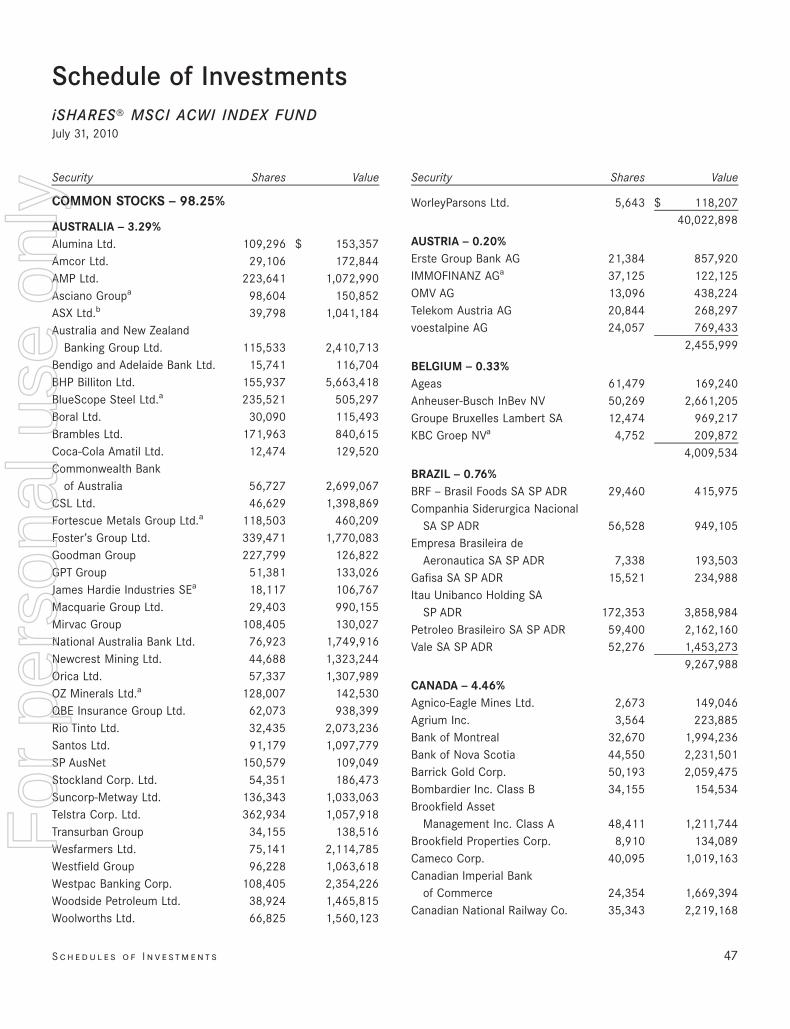
Schedule of InvestmentsiSHARES» MSCI ACWI INDEX FUNDJuly 31, 2010
Security Shares Value
COMMON STOCKS — 98.25%
AUSTRALIA — 3.29%Alumina Ltd. 109,296 $ 153,357Amcor Ltd. 29,106 172,844AMP Ltd. 223,641 1,072,990Asciano Groupa 98,604 150,852ASX Ltd.b 39,798 1,041,184Australia and New Zealand
Banking Group Ltd. 115,533 2,410,713Bendigo and Adelaide Bank Ltd. 15,741 116,704BHP Billiton Ltd. 155,937 5,663,418BlueScope Steel Ltd.a 235,521 505,297Boral Ltd. 30,090 115,493Brambles Ltd. 171,963 840,615Coca-Cola Amatil Ltd. 12,474 129,520Commonwealth Bank
of Australia 56,727 2,699,067CSL Ltd. 46,629 1,398,869Fortescue Metals Group Ltd.a 118,503 460,209Foster’s Group Ltd. 339,471 1,770,083Goodman Group 227,799 126,822GPT Group 51,381 133,026James Hardie Industries SEa 18,117 106,767Macquarie Group Ltd. 29,403 990,155Mirvac Group 108,405 130,027National Australia Bank Ltd. 76,923 1,749,916Newcrest Mining Ltd. 44,688 1,323,244Orica Ltd. 57,337 1,307,989OZ Minerals Ltd.a 128,007 142,530QBE Insurance Group Ltd. 62,073 938,399Rio Tinto Ltd. 32,435 2,073,236Santos Ltd. 91,179 1,097,779SP AusNet 150,579 109,049Stockland Corp. Ltd. 54,351 186,473Suncorp-Metway Ltd. 136,343 1,033,063Telstra Corp. Ltd. 362,934 1,057,918Transurban Group 34,155 138,516Wesfarmers Ltd. 75,141 2,114,785Westfield Group 96,228 1,063,618Westpac Banking Corp. 108,405 2,354,226Woodside Petroleum Ltd. 38,924 1,465,815Woolworths Ltd. 66,825 1,560,123
Security Shares Value
WorleyParsons Ltd. 5,643 $ 118,20740,022,898
AUSTRIA — 0.20%Erste Group Bank AG 21,384 857,920IMMOFINANZ AGa 37,125 122,125OMV AG 13,096 438,224Telekom Austria AG 20,844 268,297voestalpine AG 24,057 769,433
2,455,999
BELGIUM — 0.33%Ageas 61,479 169,240Anheuser-Busch InBev NV 50,269 2,661,205Groupe Bruxelles Lambert SA 12,474 969,217KBC Groep NVa 4,752 209,872
4,009,534
BRAZIL — 0.76%BRF — Brasil Foods SA SP ADR 29,460 415,975Companhia Siderurgica Nacional
SA SP ADR 56,528 949,105Empresa Brasileira de
Aeronautica SA SP ADR 7,338 193,503Gafisa SA SP ADR 15,521 234,988Itau Unibanco Holding SA
SP ADR 172,353 3,858,984Petroleo Brasileiro SA SP ADR 59,400 2,162,160Vale SA SP ADR 52,276 1,453,273
9,267,988
CANADA — 4.46%Agnico-Eagle Mines Ltd. 2,673 149,046Agrium Inc. 3,564 223,885Bank of Montreal 32,670 1,994,236Bank of Nova Scotia 44,550 2,231,501Barrick Gold Corp. 50,193 2,059,475Bombardier Inc. Class B 34,155 154,534Brookfield Asset
Management Inc. Class A 48,411 1,211,744Brookfield Properties Corp. 8,910 134,089Cameco Corp. 40,095 1,019,163Canadian Imperial Bank
of Commerce 24,354 1,669,394Canadian National Railway Co. 35,343 2,219,168
S c h e d u l e s o f I n v e st m e n t s 47
For
per
sona
l use
onl
y
%%TRANSMSG*** Transmitting Job: B82515 PCN: 049000000 ***%%PCMSG|47 |00013|Yes|No|09/16/2010 20:08|0|0|Page is valid, no graphics -- Color: N|
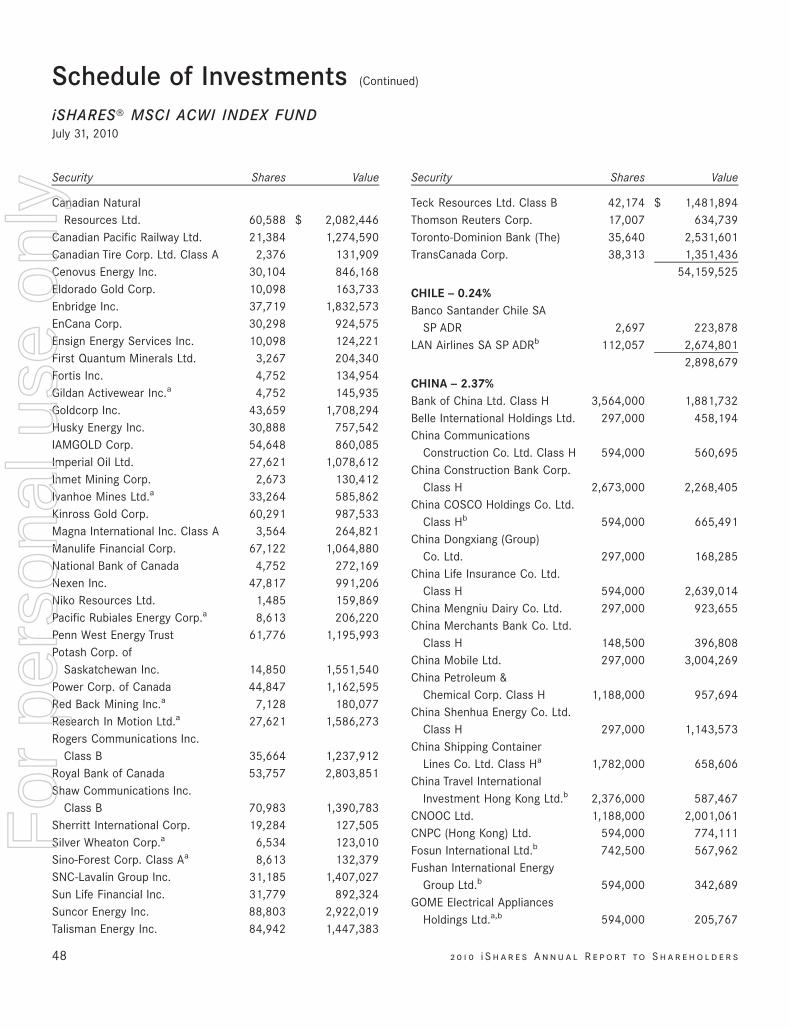
Security Shares Value
Canadian NaturalResources Ltd. 60,588 $ 2,082,446
Canadian Pacific Railway Ltd. 21,384 1,274,590Canadian Tire Corp. Ltd. Class A 2,376 131,909Cenovus Energy Inc. 30,104 846,168Eldorado Gold Corp. 10,098 163,733Enbridge Inc. 37,719 1,832,573EnCana Corp. 30,298 924,575Ensign Energy Services Inc. 10,098 124,221First Quantum Minerals Ltd. 3,267 204,340Fortis Inc. 4,752 134,954Gildan Activewear Inc.a 4,752 145,935Goldcorp Inc. 43,659 1,708,294Husky Energy Inc. 30,888 757,542IAMGOLD Corp. 54,648 860,085Imperial Oil Ltd. 27,621 1,078,612Inmet Mining Corp. 2,673 130,412Ivanhoe Mines Ltd.a 33,264 585,862Kinross Gold Corp. 60,291 987,533Magna International Inc. Class A 3,564 264,821Manulife Financial Corp. 67,122 1,064,880National Bank of Canada 4,752 272,169Nexen Inc. 47,817 991,206Niko Resources Ltd. 1,485 159,869Pacific Rubiales Energy Corp.a 8,613 206,220Penn West Energy Trust 61,776 1,195,993Potash Corp. of
Saskatchewan Inc. 14,850 1,551,540Power Corp. of Canada 44,847 1,162,595Red Back Mining Inc.a 7,128 180,077Research In Motion Ltd.a 27,621 1,586,273Rogers Communications Inc.
Class B 35,664 1,237,912Royal Bank of Canada 53,757 2,803,851Shaw Communications Inc.
Class B 70,983 1,390,783Sherritt International Corp. 19,284 127,505Silver Wheaton Corp.a 6,534 123,010Sino-Forest Corp. Class Aa 8,613 132,379SNC-Lavalin Group Inc. 31,185 1,407,027Sun Life Financial Inc. 31,779 892,324Suncor Energy Inc. 88,803 2,922,019Talisman Energy Inc. 84,942 1,447,383
Security Shares Value
Teck Resources Ltd. Class B 42,174 $ 1,481,894Thomson Reuters Corp. 17,007 634,739Toronto-Dominion Bank (The) 35,640 2,531,601TransCanada Corp. 38,313 1,351,436
54,159,525
CHILE — 0.24%Banco Santander Chile SA
SP ADR 2,697 223,878LAN Airlines SA SP ADRb 112,057 2,674,801
2,898,679
CHINA — 2.37%Bank of China Ltd. Class H 3,564,000 1,881,732Belle International Holdings Ltd. 297,000 458,194China Communications
Construction Co. Ltd. Class H 594,000 560,695China Construction Bank Corp.
Class H 2,673,000 2,268,405China COSCO Holdings Co. Ltd.
Class Hb 594,000 665,491China Dongxiang (Group)
Co. Ltd. 297,000 168,285China Life Insurance Co. Ltd.
Class H 594,000 2,639,014China Mengniu Dairy Co. Ltd. 297,000 923,655China Merchants Bank Co. Ltd.
Class H 148,500 396,808China Mobile Ltd. 297,000 3,004,269China Petroleum &
Chemical Corp. Class H 1,188,000 957,694China Shenhua Energy Co. Ltd.
Class H 297,000 1,143,573China Shipping Container
Lines Co. Ltd. Class Ha 1,782,000 658,606China Travel International
Investment Hong Kong Ltd.b 2,376,000 587,467CNOOC Ltd. 1,188,000 2,001,061CNPC (Hong Kong) Ltd. 594,000 774,111Fosun International Ltd.b 742,500 567,962Fushan International Energy
Group Ltd.b 594,000 342,689GOME Electrical Appliances
Holdings Ltd.a,b 594,000 205,767
48 2 0 1 0 i S h a r e s A n n u a l R e p o r t to S h a r e h o l d e r s
Schedule of Investments (Continued)
iSHARES» MSCI ACWI INDEX FUNDJuly 31, 2010
For
per
sona
l use
onl
y
%%TRANSMSG*** Transmitting Job: B82515 PCN: 050000000 ***%%PCMSG|48 |00011|Yes|No|09/16/2010 20:08|0|0|Page is valid, no graphics -- Color: N|
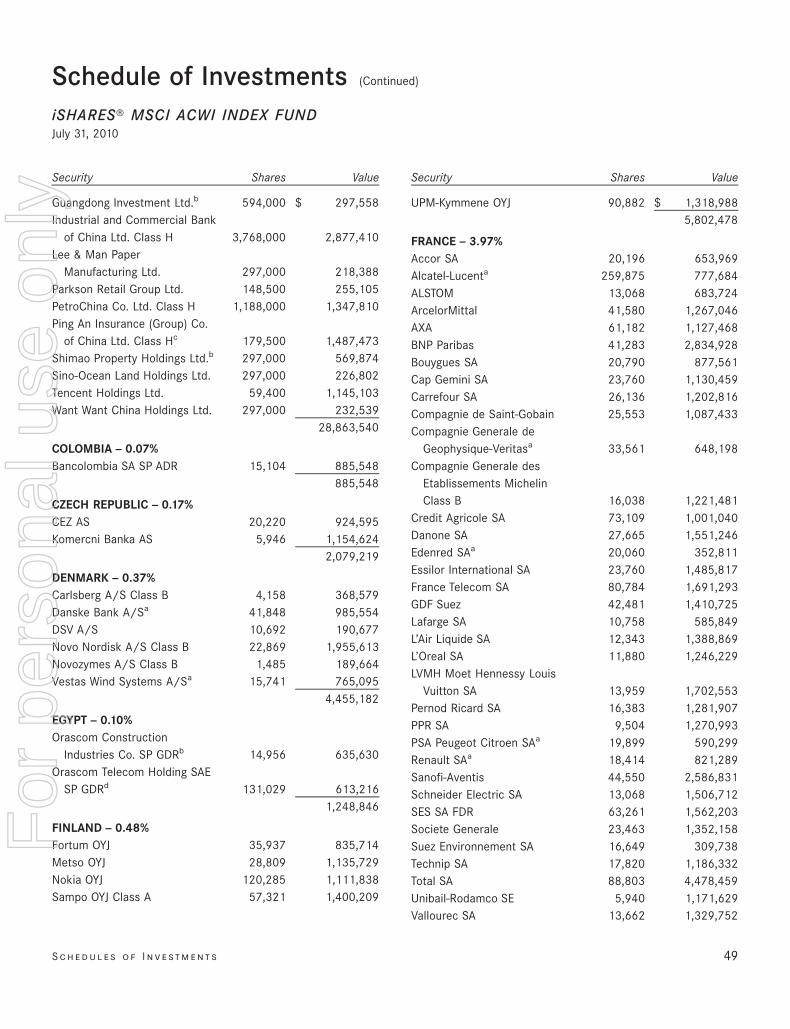
Security Shares Value
Guangdong Investment Ltd.b 594,000 $ 297,558Industrial and Commercial Bank
of China Ltd. Class H 3,768,000 2,877,410Lee & Man Paper
Manufacturing Ltd. 297,000 218,388Parkson Retail Group Ltd. 148,500 255,105PetroChina Co. Ltd. Class H 1,188,000 1,347,810Ping An Insurance (Group) Co.
of China Ltd. Class Hc 179,500 1,487,473Shimao Property Holdings Ltd.b 297,000 569,874Sino-Ocean Land Holdings Ltd. 297,000 226,802Tencent Holdings Ltd. 59,400 1,145,103Want Want China Holdings Ltd. 297,000 232,539
28,863,540
COLOMBIA — 0.07%Bancolombia SA SP ADR 15,104 885,548
885,548
CZECH REPUBLIC — 0.17%CEZ AS 20,220 924,595Komercni Banka AS 5,946 1,154,624
2,079,219
DENMARK — 0.37%Carlsberg A/S Class B 4,158 368,579Danske Bank A/Sa 41,848 985,554DSV A/S 10,692 190,677Novo Nordisk A/S Class B 22,869 1,955,613Novozymes A/S Class B 1,485 189,664Vestas Wind Systems A/Sa 15,741 765,095
4,455,182
EGYPT — 0.10%Orascom Construction
Industries Co. SP GDRb 14,956 635,630Orascom Telecom Holding SAE
SP GDRd 131,029 613,2161,248,846
FINLAND — 0.48%Fortum OYJ 35,937 835,714Metso OYJ 28,809 1,135,729Nokia OYJ 120,285 1,111,838Sampo OYJ Class A 57,321 1,400,209
Security Shares Value
UPM-Kymmene OYJ 90,882 $ 1,318,9885,802,478
FRANCE — 3.97%Accor SA 20,196 653,969Alcatel-Lucenta 259,875 777,684ALSTOM 13,068 683,724ArcelorMittal 41,580 1,267,046AXA 61,182 1,127,468BNP Paribas 41,283 2,834,928Bouygues SA 20,790 877,561Cap Gemini SA 23,760 1,130,459Carrefour SA 26,136 1,202,816Compagnie de Saint-Gobain 25,553 1,087,433Compagnie Generale de
Geophysique-Veritasa 33,561 648,198Compagnie Generale des
Etablissements MichelinClass B 16,038 1,221,481
Credit Agricole SA 73,109 1,001,040Danone SA 27,665 1,551,246Edenred SAa 20,060 352,811Essilor International SA 23,760 1,485,817France Telecom SA 80,784 1,691,293GDF Suez 42,481 1,410,725Lafarge SA 10,758 585,849L’Air Liquide SA 12,343 1,388,869L’Oreal SA 11,880 1,246,229LVMH Moet Hennessy Louis
Vuitton SA 13,959 1,702,553Pernod Ricard SA 16,383 1,281,907PPR SA 9,504 1,270,993PSA Peugeot Citroen SAa 19,899 590,299Renault SAa 18,414 821,289Sanofi-Aventis 44,550 2,586,831Schneider Electric SA 13,068 1,506,712SES SA FDR 63,261 1,562,203Societe Generale 23,463 1,352,158Suez Environnement SA 16,649 309,738Technip SA 17,820 1,186,332Total SA 88,803 4,478,459Unibail-Rodamco SE 5,940 1,171,629Vallourec SA 13,662 1,329,752
S c h e d u l e s o f I n v e st m e n t s 49
Schedule of Investments (Continued)
iSHARES» MSCI ACWI INDEX FUNDJuly 31, 2010
For
per
sona
l use
onl
y
%%TRANSMSG*** Transmitting Job: B82515 PCN: 051000000 ***%%PCMSG|49 |00009|Yes|No|09/16/2010 20:08|0|0|Page is valid, no graphics -- Color: N|
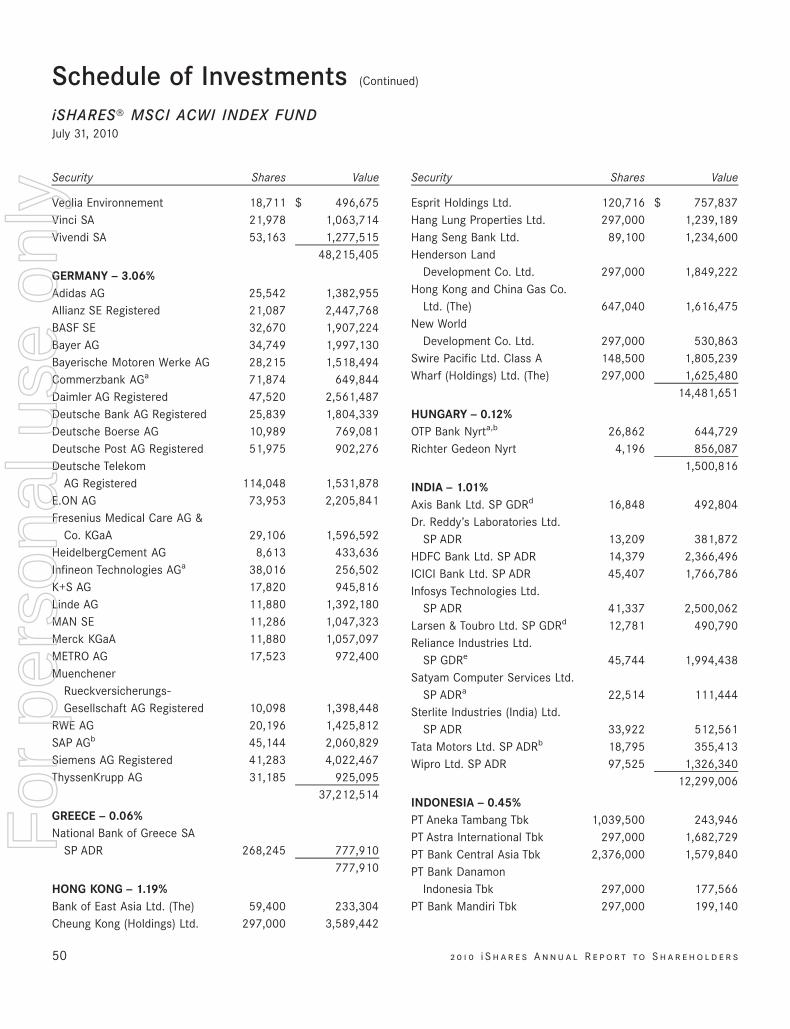
Security Shares Value
Veolia Environnement 18,711 $ 496,675Vinci SA 21,978 1,063,714Vivendi SA 53,163 1,277,515
48,215,405
GERMANY — 3.06%Adidas AG 25,542 1,382,955Allianz SE Registered 21,087 2,447,768BASF SE 32,670 1,907,224Bayer AG 34,749 1,997,130Bayerische Motoren Werke AG 28,215 1,518,494Commerzbank AGa 71,874 649,844Daimler AG Registered 47,520 2,561,487Deutsche Bank AG Registered 25,839 1,804,339Deutsche Boerse AG 10,989 769,081Deutsche Post AG Registered 51,975 902,276Deutsche Telekom
AG Registered 114,048 1,531,878E.ON AG 73,953 2,205,841Fresenius Medical Care AG &
Co. KGaA 29,106 1,596,592HeidelbergCement AG 8,613 433,636Infineon Technologies AGa 38,016 256,502K+S AG 17,820 945,816Linde AG 11,880 1,392,180MAN SE 11,286 1,047,323Merck KGaA 11,880 1,057,097METRO AG 17,523 972,400Muenchener
Rueckversicherungs-Gesellschaft AG Registered 10,098 1,398,448
RWE AG 20,196 1,425,812SAP AGb 45,144 2,060,829Siemens AG Registered 41,283 4,022,467ThyssenKrupp AG 31,185 925,095
37,212,514
GREECE — 0.06%National Bank of Greece SA
SP ADR 268,245 777,910777,910
HONG KONG — 1.19%Bank of East Asia Ltd. (The) 59,400 233,304Cheung Kong (Holdings) Ltd. 297,000 3,589,442
Security Shares Value
Esprit Holdings Ltd. 120,716 $ 757,837Hang Lung Properties Ltd. 297,000 1,239,189Hang Seng Bank Ltd. 89,100 1,234,600Henderson Land
Development Co. Ltd. 297,000 1,849,222Hong Kong and China Gas Co.
Ltd. (The) 647,040 1,616,475New World
Development Co. Ltd. 297,000 530,863Swire Pacific Ltd. Class A 148,500 1,805,239Wharf (Holdings) Ltd. (The) 297,000 1,625,480
14,481,651
HUNGARY — 0.12%OTP Bank Nyrta,b 26,862 644,729Richter Gedeon Nyrt 4,196 856,087
1,500,816
INDIA — 1.01%Axis Bank Ltd. SP GDRd 16,848 492,804Dr. Reddy’s Laboratories Ltd.
SP ADR 13,209 381,872HDFC Bank Ltd. SP ADR 14,379 2,366,496ICICI Bank Ltd. SP ADR 45,407 1,766,786Infosys Technologies Ltd.
SP ADR 41,337 2,500,062Larsen & Toubro Ltd. SP GDRd 12,781 490,790Reliance Industries Ltd.
SP GDRe 45,744 1,994,438Satyam Computer Services Ltd.
SP ADRa 22,514 111,444Sterlite Industries (India) Ltd.
SP ADR 33,922 512,561Tata Motors Ltd. SP ADRb 18,795 355,413Wipro Ltd. SP ADR 97,525 1,326,340
12,299,006
INDONESIA — 0.45%PT Aneka Tambang Tbk 1,039,500 243,946PT Astra International Tbk 297,000 1,682,729PT Bank Central Asia Tbk 2,376,000 1,579,840PT Bank Danamon
Indonesia Tbk 297,000 177,566PT Bank Mandiri Tbk 297,000 199,140
50 2 0 1 0 i S h a r e s A n n u a l R e p o r t to S h a r e h o l d e r s
Schedule of Investments (Continued)
iSHARES» MSCI ACWI INDEX FUNDJuly 31, 2010
For
per
sona
l use
onl
y
%%TRANSMSG*** Transmitting Job: B82515 PCN: 052000000 ***%%PCMSG|50 |00006|Yes|No|09/16/2010 20:08|0|0|Page is valid, no graphics -- Color: N|
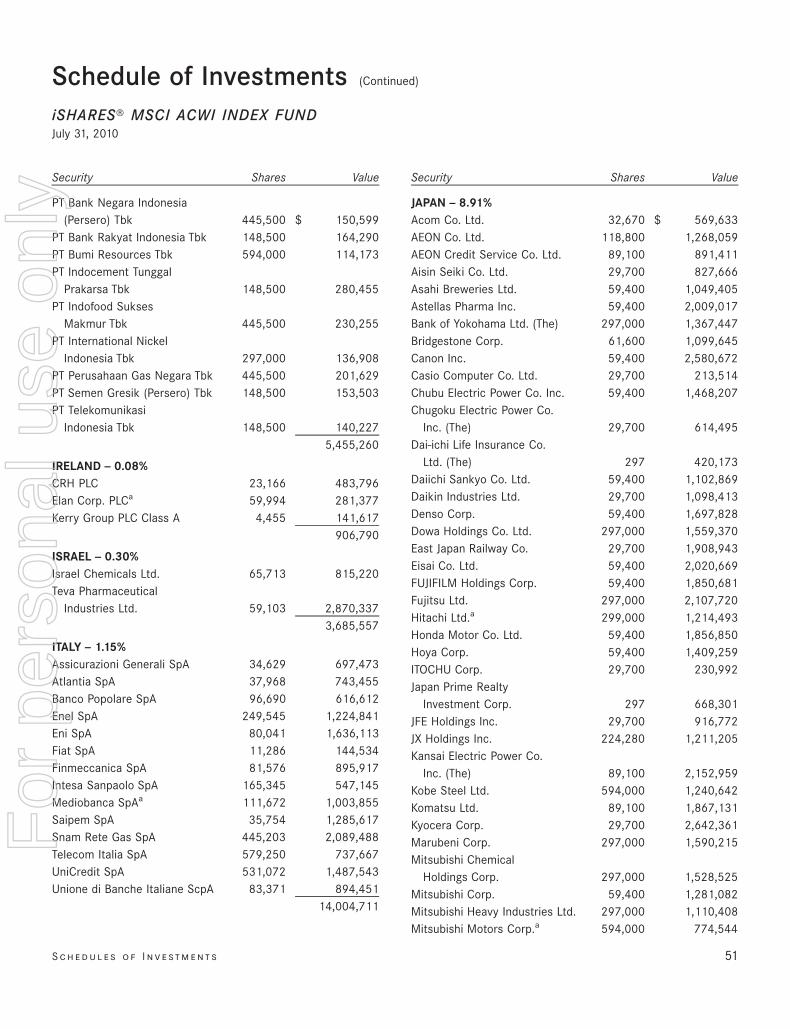
Security Shares Value
PT Bank Negara Indonesia(Persero) Tbk 445,500 $ 150,599
PT Bank Rakyat Indonesia Tbk 148,500 164,290PT Bumi Resources Tbk 594,000 114,173PT Indocement Tunggal
Prakarsa Tbk 148,500 280,455PT Indofood Sukses
Makmur Tbk 445,500 230,255PT International Nickel
Indonesia Tbk 297,000 136,908PT Perusahaan Gas Negara Tbk 445,500 201,629PT Semen Gresik (Persero) Tbk 148,500 153,503PT Telekomunikasi
Indonesia Tbk 148,500 140,2275,455,260
IRELAND — 0.08%CRH PLC 23,166 483,796Elan Corp. PLCa 59,994 281,377Kerry Group PLC Class A 4,455 141,617
906,790
ISRAEL — 0.30%Israel Chemicals Ltd. 65,713 815,220Teva Pharmaceutical
Industries Ltd. 59,103 2,870,3373,685,557
ITALY — 1.15%Assicurazioni Generali SpA 34,629 697,473Atlantia SpA 37,968 743,455Banco Popolare SpA 96,690 616,612Enel SpA 249,545 1,224,841Eni SpA 80,041 1,636,113Fiat SpA 11,286 144,534Finmeccanica SpA 81,576 895,917Intesa Sanpaolo SpA 165,345 547,145Mediobanca SpAa 111,672 1,003,855Saipem SpA 35,754 1,285,617Snam Rete Gas SpA 445,203 2,089,488Telecom Italia SpA 579,250 737,667UniCredit SpA 531,072 1,487,543Unione di Banche Italiane ScpA 83,371 894,451
14,004,711
Security Shares Value
JAPAN — 8.91%Acom Co. Ltd. 32,670 $ 569,633AEON Co. Ltd. 118,800 1,268,059AEON Credit Service Co. Ltd. 89,100 891,411Aisin Seiki Co. Ltd. 29,700 827,666Asahi Breweries Ltd. 59,400 1,049,405Astellas Pharma Inc. 59,400 2,009,017Bank of Yokohama Ltd. (The) 297,000 1,367,447Bridgestone Corp. 61,600 1,099,645Canon Inc. 59,400 2,580,672Casio Computer Co. Ltd. 29,700 213,514Chubu Electric Power Co. Inc. 59,400 1,468,207Chugoku Electric Power Co.
Inc. (The) 29,700 614,495Dai-ichi Life Insurance Co.
Ltd. (The) 297 420,173Daiichi Sankyo Co. Ltd. 59,400 1,102,869Daikin Industries Ltd. 29,700 1,098,413Denso Corp. 59,400 1,697,828Dowa Holdings Co. Ltd. 297,000 1,559,370East Japan Railway Co. 29,700 1,908,943Eisai Co. Ltd. 59,400 2,020,669FUJIFILM Holdings Corp. 59,400 1,850,681Fujitsu Ltd. 297,000 2,107,720Hitachi Ltd.a 299,000 1,214,493Honda Motor Co. Ltd. 59,400 1,856,850Hoya Corp. 59,400 1,409,259ITOCHU Corp. 29,700 230,992Japan Prime Realty
Investment Corp. 297 668,301JFE Holdings Inc. 29,700 916,772JX Holdings Inc. 224,280 1,211,205Kansai Electric Power Co.
Inc. (The) 89,100 2,152,959Kobe Steel Ltd. 594,000 1,240,642Komatsu Ltd. 89,100 1,867,131Kyocera Corp. 29,700 2,642,361Marubeni Corp. 297,000 1,590,215Mitsubishi Chemical
Holdings Corp. 297,000 1,528,525Mitsubishi Corp. 59,400 1,281,082Mitsubishi Heavy Industries Ltd. 297,000 1,110,408Mitsubishi Motors Corp.a 594,000 774,544
S c h e d u l e s o f I n v e st m e n t s 51
Schedule of Investments (Continued)
iSHARES» MSCI ACWI INDEX FUNDJuly 31, 2010
For
per
sona
l use
onl
y
%%TRANSMSG*** Transmitting Job: B82515 PCN: 053000000 ***%%PCMSG|51 |00007|Yes|No|09/16/2010 20:08|0|0|Page is valid, no graphics -- Color: N|
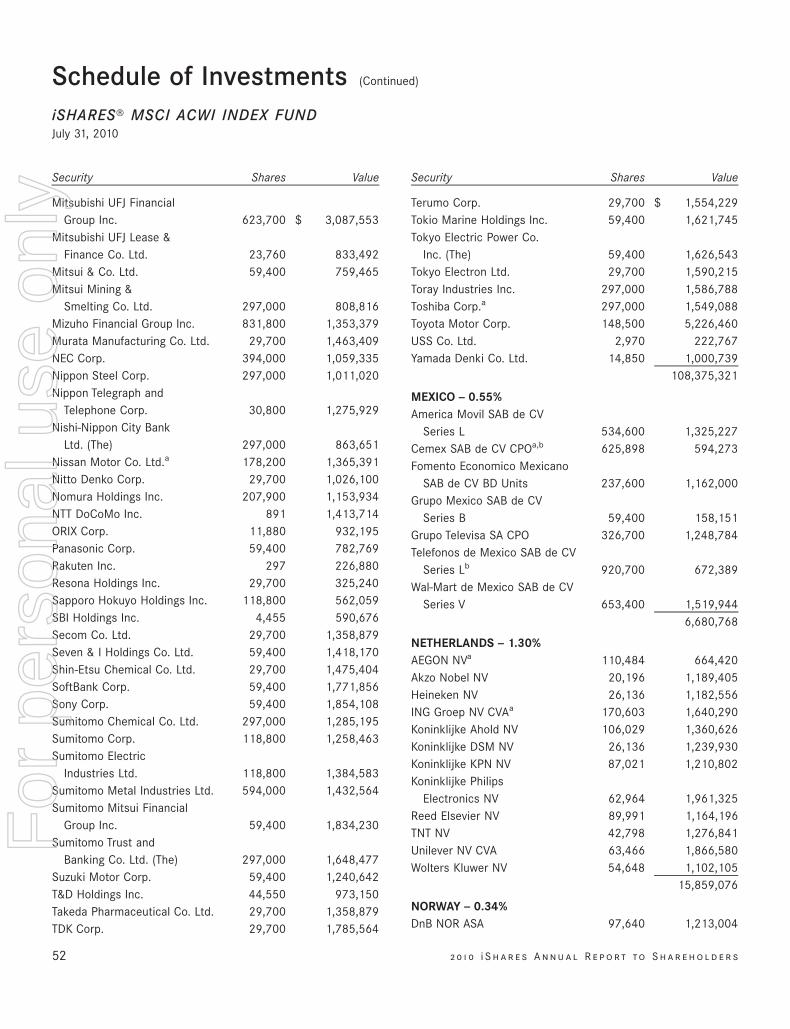
Security Shares Value
Mitsubishi UFJ FinancialGroup Inc. 623,700 $ 3,087,553
Mitsubishi UFJ Lease &Finance Co. Ltd. 23,760 833,492
Mitsui & Co. Ltd. 59,400 759,465Mitsui Mining &
Smelting Co. Ltd. 297,000 808,816Mizuho Financial Group Inc. 831,800 1,353,379Murata Manufacturing Co. Ltd. 29,700 1,463,409NEC Corp. 394,000 1,059,335Nippon Steel Corp. 297,000 1,011,020Nippon Telegraph and
Telephone Corp. 30,800 1,275,929Nishi-Nippon City Bank
Ltd. (The) 297,000 863,651Nissan Motor Co. Ltd.a 178,200 1,365,391Nitto Denko Corp. 29,700 1,026,100Nomura Holdings Inc. 207,900 1,153,934NTT DoCoMo Inc. 891 1,413,714ORIX Corp. 11,880 932,195Panasonic Corp. 59,400 782,769Rakuten Inc. 297 226,880Resona Holdings Inc. 29,700 325,240Sapporo Hokuyo Holdings Inc. 118,800 562,059SBI Holdings Inc. 4,455 590,676Secom Co. Ltd. 29,700 1,358,879Seven & I Holdings Co. Ltd. 59,400 1,418,170Shin-Etsu Chemical Co. Ltd. 29,700 1,475,404SoftBank Corp. 59,400 1,771,856Sony Corp. 59,400 1,854,108Sumitomo Chemical Co. Ltd. 297,000 1,285,195Sumitomo Corp. 118,800 1,258,463Sumitomo Electric
Industries Ltd. 118,800 1,384,583Sumitomo Metal Industries Ltd. 594,000 1,432,564Sumitomo Mitsui Financial
Group Inc. 59,400 1,834,230Sumitomo Trust and
Banking Co. Ltd. (The) 297,000 1,648,477Suzuki Motor Corp. 59,400 1,240,642T&D Holdings Inc. 44,550 973,150Takeda Pharmaceutical Co. Ltd. 29,700 1,358,879TDK Corp. 29,700 1,785,564
Security Shares Value
Terumo Corp. 29,700 $ 1,554,229Tokio Marine Holdings Inc. 59,400 1,621,745Tokyo Electric Power Co.
Inc. (The) 59,400 1,626,543Tokyo Electron Ltd. 29,700 1,590,215Toray Industries Inc. 297,000 1,586,788Toshiba Corp.a 297,000 1,549,088Toyota Motor Corp. 148,500 5,226,460USS Co. Ltd. 2,970 222,767Yamada Denki Co. Ltd. 14,850 1,000,739
108,375,321
MEXICO — 0.55%America Movil SAB de CV
Series L 534,600 1,325,227Cemex SAB de CV CPOa,b 625,898 594,273Fomento Economico Mexicano
SAB de CV BD Units 237,600 1,162,000Grupo Mexico SAB de CV
Series B 59,400 158,151Grupo Televisa SA CPO 326,700 1,248,784Telefonos de Mexico SAB de CV
Series Lb 920,700 672,389Wal-Mart de Mexico SAB de CV
Series V 653,400 1,519,9446,680,768
NETHERLANDS — 1.30%AEGON NVa 110,484 664,420Akzo Nobel NV 20,196 1,189,405Heineken NV 26,136 1,182,556ING Groep NV CVAa 170,603 1,640,290Koninklijke Ahold NV 106,029 1,360,626Koninklijke DSM NV 26,136 1,239,930Koninklijke KPN NV 87,021 1,210,802Koninklijke Philips
Electronics NV 62,964 1,961,325Reed Elsevier NV 89,991 1,164,196TNT NV 42,798 1,276,841Unilever NV CVA 63,466 1,866,580Wolters Kluwer NV 54,648 1,102,105
15,859,076
NORWAY — 0.34%DnB NOR ASA 97,640 1,213,004
52 2 0 1 0 i S h a r e s A n n u a l R e p o r t to S h a r e h o l d e r s
Schedule of Investments (Continued)
iSHARES» MSCI ACWI INDEX FUNDJuly 31, 2010
For
per
sona
l use
onl
y
%%TRANSMSG*** Transmitting Job: B82515 PCN: 054000000 ***%%PCMSG|52 |00006|Yes|No|09/16/2010 20:08|0|0|Page is valid, no graphics -- Color: N|
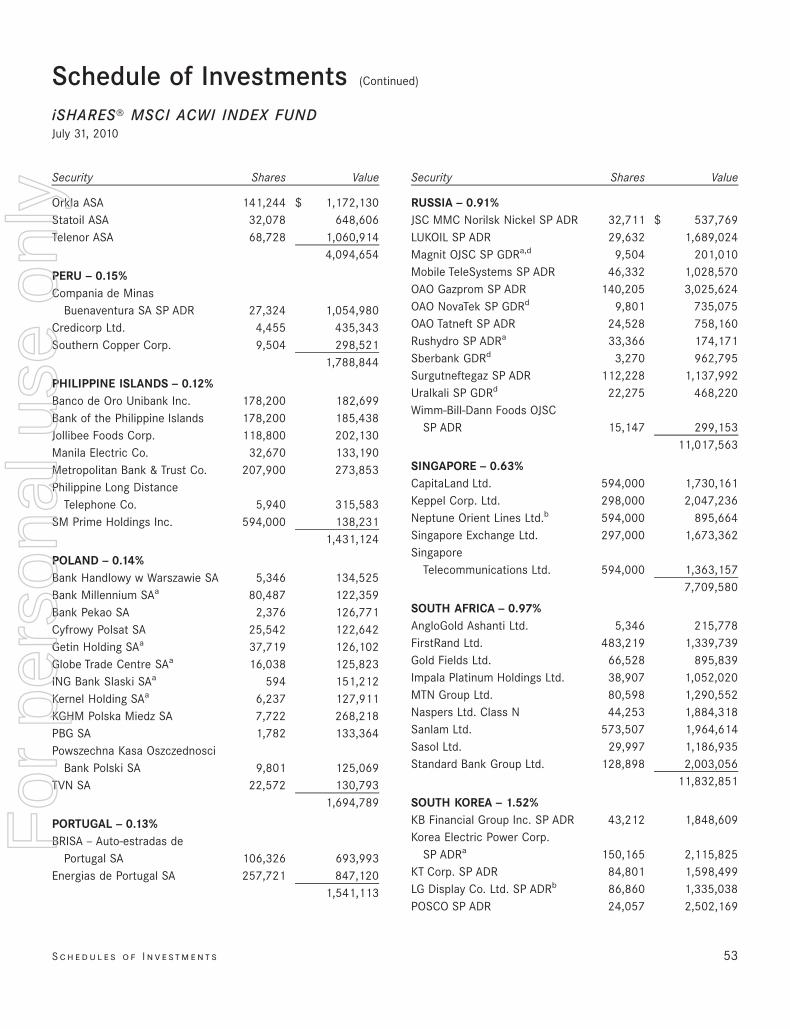
Security Shares Value
Orkla ASA 141,244 $ 1,172,130Statoil ASA 32,078 648,606Telenor ASA 68,728 1,060,914
4,094,654
PERU — 0.15%Compania de Minas
Buenaventura SA SP ADR 27,324 1,054,980Credicorp Ltd. 4,455 435,343Southern Copper Corp. 9,504 298,521
1,788,844
PHILIPPINE ISLANDS — 0.12%Banco de Oro Unibank Inc. 178,200 182,699Bank of the Philippine Islands 178,200 185,438Jollibee Foods Corp. 118,800 202,130Manila Electric Co. 32,670 133,190Metropolitan Bank & Trust Co. 207,900 273,853Philippine Long Distance
Telephone Co. 5,940 315,583SM Prime Holdings Inc. 594,000 138,231
1,431,124
POLAND — 0.14%Bank Handlowy w Warszawie SA 5,346 134,525Bank Millennium SAa 80,487 122,359Bank Pekao SA 2,376 126,771Cyfrowy Polsat SA 25,542 122,642Getin Holding SAa 37,719 126,102Globe Trade Centre SAa 16,038 125,823ING Bank Slaski SAa 594 151,212Kernel Holding SAa 6,237 127,911KGHM Polska Miedz SA 7,722 268,218PBG SA 1,782 133,364Powszechna Kasa Oszczednosci
Bank Polski SA 9,801 125,069TVN SA 22,572 130,793
1,694,789
PORTUGAL — 0.13%BRISA — Auto-estradas de
Portugal SA 106,326 693,993Energias de Portugal SA 257,721 847,120
1,541,113
Security Shares Value
RUSSIA — 0.91%JSC MMC Norilsk Nickel SP ADR 32,711 $ 537,769LUKOIL SP ADR 29,632 1,689,024Magnit OJSC SP GDRa,d 9,504 201,010Mobile TeleSystems SP ADR 46,332 1,028,570OAO Gazprom SP ADR 140,205 3,025,624OAO NovaTek SP GDRd 9,801 735,075OAO Tatneft SP ADR 24,528 758,160Rushydro SP ADRa 33,366 174,171Sberbank GDRd 3,270 962,795Surgutneftegaz SP ADR 112,228 1,137,992Uralkali SP GDRd 22,275 468,220Wimm-Bill-Dann Foods OJSC
SP ADR 15,147 299,15311,017,563
SINGAPORE — 0.63%CapitaLand Ltd. 594,000 1,730,161Keppel Corp. Ltd. 298,000 2,047,236Neptune Orient Lines Ltd.b 594,000 895,664Singapore Exchange Ltd. 297,000 1,673,362Singapore
Telecommunications Ltd. 594,000 1,363,1577,709,580
SOUTH AFRICA — 0.97%AngloGold Ashanti Ltd. 5,346 215,778FirstRand Ltd. 483,219 1,339,739Gold Fields Ltd. 66,528 895,839Impala Platinum Holdings Ltd. 38,907 1,052,020MTN Group Ltd. 80,598 1,290,552Naspers Ltd. Class N 44,253 1,884,318Sanlam Ltd. 573,507 1,964,614Sasol Ltd. 29,997 1,186,935Standard Bank Group Ltd. 128,898 2,003,056
11,832,851
SOUTH KOREA — 1.52%KB Financial Group Inc. SP ADR 43,212 1,848,609Korea Electric Power Corp.
SP ADRa 150,165 2,115,825KT Corp. SP ADR 84,801 1,598,499LG Display Co. Ltd. SP ADRb 86,860 1,335,038POSCO SP ADR 24,057 2,502,169
S c h e d u l e s o f I n v e st m e n t s 53
Schedule of Investments (Continued)
iSHARES» MSCI ACWI INDEX FUNDJuly 31, 2010
For
per
sona
l use
onl
y
%%TRANSMSG*** Transmitting Job: B82515 PCN: 055000000 ***%%PCMSG|53 |00006|Yes|No|09/16/2010 20:08|0|0|Page is valid, no graphics -- Color: N|
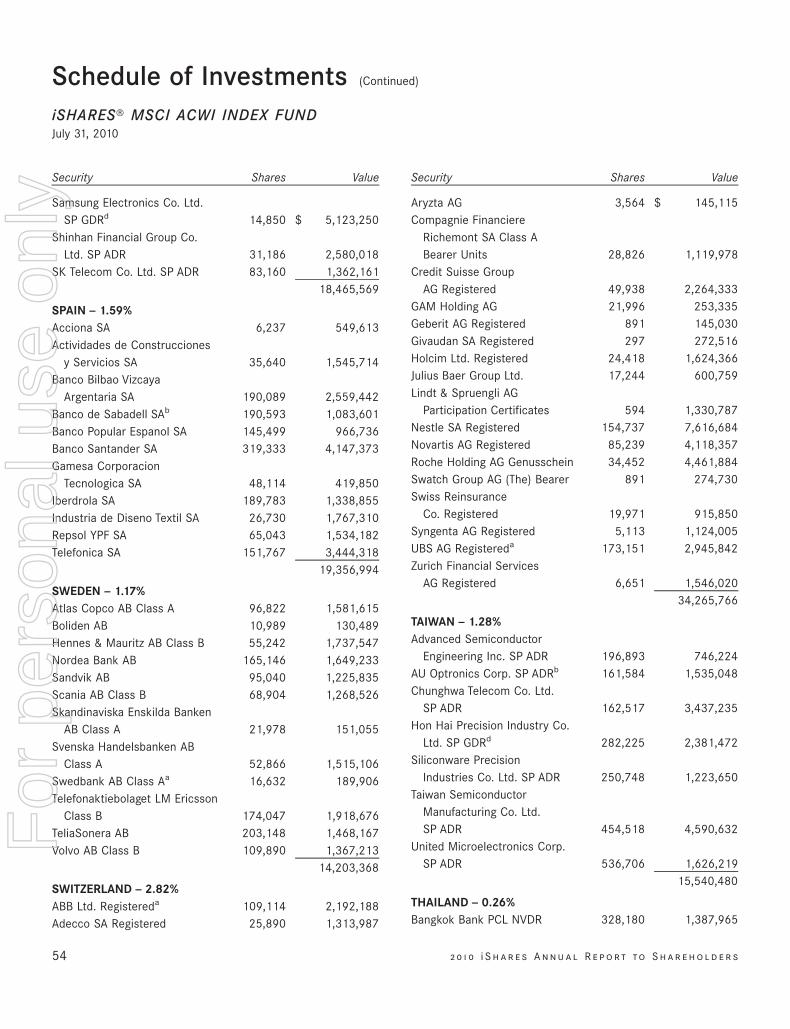
Security Shares Value
Samsung Electronics Co. Ltd.SP GDRd 14,850 $ 5,123,250
Shinhan Financial Group Co.Ltd. SP ADR 31,186 2,580,018
SK Telecom Co. Ltd. SP ADR 83,160 1,362,16118,465,569
SPAIN — 1.59%Acciona SA 6,237 549,613Actividades de Construcciones
y Servicios SA 35,640 1,545,714Banco Bilbao Vizcaya
Argentaria SA 190,089 2,559,442Banco de Sabadell SAb 190,593 1,083,601Banco Popular Espanol SA 145,499 966,736Banco Santander SA 319,333 4,147,373Gamesa Corporacion
Tecnologica SA 48,114 419,850Iberdrola SA 189,783 1,338,855Industria de Diseno Textil SA 26,730 1,767,310Repsol YPF SA 65,043 1,534,182Telefonica SA 151,767 3,444,318
19,356,994
SWEDEN — 1.17%Atlas Copco AB Class A 96,822 1,581,615Boliden AB 10,989 130,489Hennes & Mauritz AB Class B 55,242 1,737,547Nordea Bank AB 165,146 1,649,233Sandvik AB 95,040 1,225,835Scania AB Class B 68,904 1,268,526Skandinaviska Enskilda Banken
AB Class A 21,978 151,055Svenska Handelsbanken AB
Class A 52,866 1,515,106Swedbank AB Class Aa 16,632 189,906Telefonaktiebolaget LM Ericsson
Class B 174,047 1,918,676TeliaSonera AB 203,148 1,468,167Volvo AB Class B 109,890 1,367,213
14,203,368
SWITZERLAND — 2.82%ABB Ltd. Registereda 109,114 2,192,188Adecco SA Registered 25,890 1,313,987
Security Shares Value
Aryzta AG 3,564 $ 145,115Compagnie Financiere
Richemont SA Class ABearer Units 28,826 1,119,978
Credit Suisse GroupAG Registered 49,938 2,264,333
GAM Holding AG 21,996 253,335Geberit AG Registered 891 145,030Givaudan SA Registered 297 272,516Holcim Ltd. Registered 24,418 1,624,366Julius Baer Group Ltd. 17,244 600,759Lindt & Spruengli AG
Participation Certificates 594 1,330,787Nestle SA Registered 154,737 7,616,684Novartis AG Registered 85,239 4,118,357Roche Holding AG Genusschein 34,452 4,461,884Swatch Group AG (The) Bearer 891 274,730Swiss Reinsurance
Co. Registered 19,971 915,850Syngenta AG Registered 5,113 1,124,005UBS AG Registereda 173,151 2,945,842Zurich Financial Services
AG Registered 6,651 1,546,02034,265,766
TAIWAN — 1.28%Advanced Semiconductor
Engineering Inc. SP ADR 196,893 746,224AU Optronics Corp. SP ADRb 161,584 1,535,048Chunghwa Telecom Co. Ltd.
SP ADR 162,517 3,437,235Hon Hai Precision Industry Co.
Ltd. SP GDRd 282,225 2,381,472Siliconware Precision
Industries Co. Ltd. SP ADR 250,748 1,223,650Taiwan Semiconductor
Manufacturing Co. Ltd.SP ADR 454,518 4,590,632
United Microelectronics Corp.SP ADR 536,706 1,626,219
15,540,480
THAILAND — 0.26%Bangkok Bank PCL NVDR 328,180 1,387,965
54 2 0 1 0 i S h a r e s A n n u a l R e p o r t to S h a r e h o l d e r s
Schedule of Investments (Continued)
iSHARES» MSCI ACWI INDEX FUNDJuly 31, 2010
For
per
sona
l use
onl
y
%%TRANSMSG*** Transmitting Job: B82515 PCN: 056000000 ***%%PCMSG|54 |00007|Yes|No|09/16/2010 20:08|0|0|Page is valid, no graphics -- Color: N|
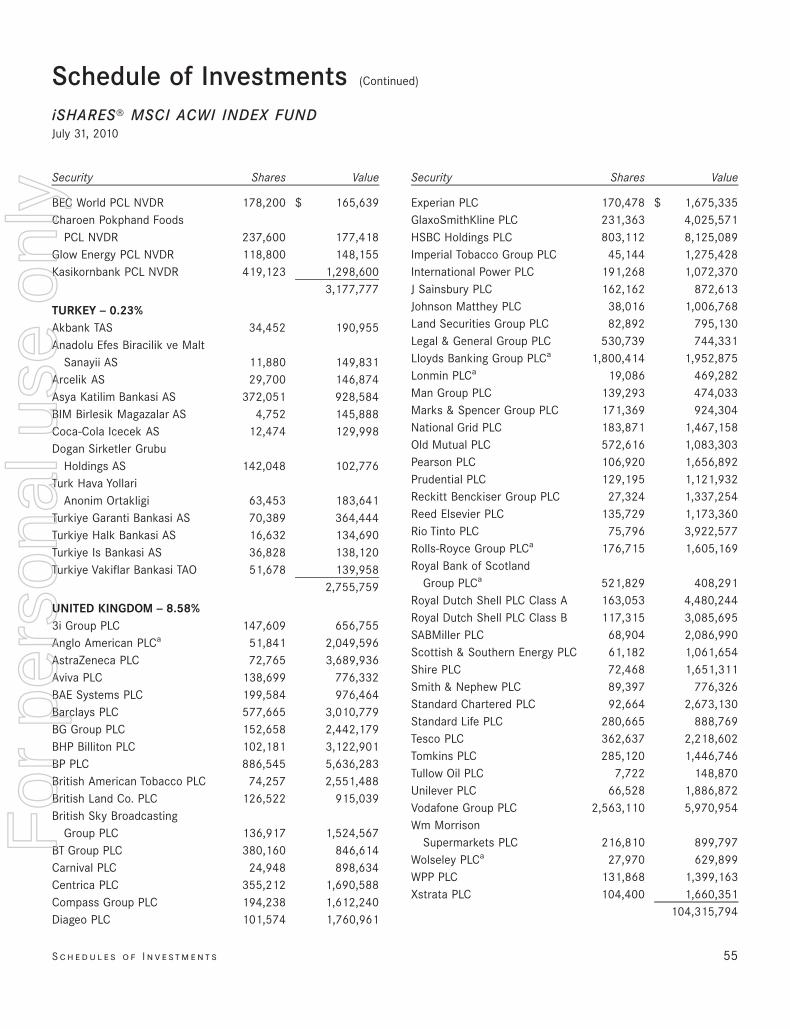
Security Shares Value
BEC World PCL NVDR 178,200 $ 165,639Charoen Pokphand Foods
PCL NVDR 237,600 177,418Glow Energy PCL NVDR 118,800 148,155Kasikornbank PCL NVDR 419,123 1,298,600
3,177,777
TURKEY — 0.23%Akbank TAS 34,452 190,955Anadolu Efes Biracilik ve Malt
Sanayii AS 11,880 149,831Arcelik AS 29,700 146,874Asya Katilim Bankasi AS 372,051 928,584BIM Birlesik Magazalar AS 4,752 145,888Coca-Cola Icecek AS 12,474 129,998Dogan Sirketler Grubu
Holdings AS 142,048 102,776Turk Hava Yollari
Anonim Ortakligi 63,453 183,641Turkiye Garanti Bankasi AS 70,389 364,444Turkiye Halk Bankasi AS 16,632 134,690Turkiye Is Bankasi AS 36,828 138,120Turkiye Vakiflar Bankasi TAO 51,678 139,958
2,755,759
UNITED KINGDOM — 8.58%3i Group PLC 147,609 656,755Anglo American PLCa 51,841 2,049,596AstraZeneca PLC 72,765 3,689,936Aviva PLC 138,699 776,332BAE Systems PLC 199,584 976,464Barclays PLC 577,665 3,010,779BG Group PLC 152,658 2,442,179BHP Billiton PLC 102,181 3,122,901BP PLC 886,545 5,636,283British American Tobacco PLC 74,257 2,551,488British Land Co. PLC 126,522 915,039British Sky Broadcasting
Group PLC 136,917 1,524,567BT Group PLC 380,160 846,614Carnival PLC 24,948 898,634Centrica PLC 355,212 1,690,588Compass Group PLC 194,238 1,612,240Diageo PLC 101,574 1,760,961
Security Shares Value
Experian PLC 170,478 $ 1,675,335GlaxoSmithKline PLC 231,363 4,025,571HSBC Holdings PLC 803,112 8,125,089Imperial Tobacco Group PLC 45,144 1,275,428International Power PLC 191,268 1,072,370J Sainsbury PLC 162,162 872,613Johnson Matthey PLC 38,016 1,006,768Land Securities Group PLC 82,892 795,130Legal & General Group PLC 530,739 744,331Lloyds Banking Group PLCa 1,800,414 1,952,875Lonmin PLCa 19,086 469,282Man Group PLC 139,293 474,033Marks & Spencer Group PLC 171,369 924,304National Grid PLC 183,871 1,467,158Old Mutual PLC 572,616 1,083,303Pearson PLC 106,920 1,656,892Prudential PLC 129,195 1,121,932Reckitt Benckiser Group PLC 27,324 1,337,254Reed Elsevier PLC 135,729 1,173,360Rio Tinto PLC 75,796 3,922,577Rolls-Royce Group PLCa 176,715 1,605,169Royal Bank of Scotland
Group PLCa 521,829 408,291Royal Dutch Shell PLC Class A 163,053 4,480,244Royal Dutch Shell PLC Class B 117,315 3,085,695SABMiller PLC 68,904 2,086,990Scottish & Southern Energy PLC 61,182 1,061,654Shire PLC 72,468 1,651,311Smith & Nephew PLC 89,397 776,326Standard Chartered PLC 92,664 2,673,130Standard Life PLC 280,665 888,769Tesco PLC 362,637 2,218,602Tomkins PLC 285,120 1,446,746Tullow Oil PLC 7,722 148,870Unilever PLC 66,528 1,886,872Vodafone Group PLC 2,563,110 5,970,954Wm Morrison
Supermarkets PLC 216,810 899,797Wolseley PLCa 27,970 629,899WPP PLC 131,868 1,399,163Xstrata PLC 104,400 1,660,351
104,315,794
S c h e d u l e s o f I n v e st m e n t s 55
Schedule of Investments (Continued)
iSHARES» MSCI ACWI INDEX FUNDJuly 31, 2010
For
per
sona
l use
onl
y
%%TRANSMSG*** Transmitting Job: B82515 PCN: 057000000 ***%%PCMSG|55 |00009|Yes|No|09/16/2010 20:08|0|0|Page is valid, no graphics -- Color: N|
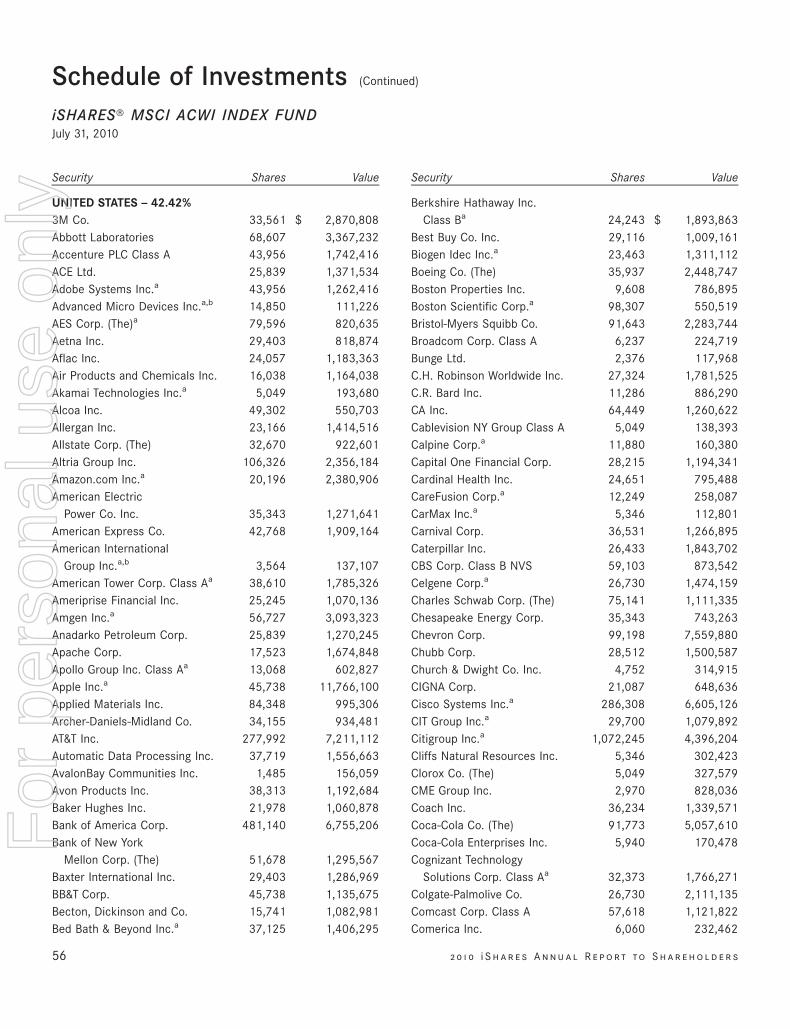
Security Shares Value
UNITED STATES — 42.42%3M Co. 33,561 $ 2,870,808Abbott Laboratories 68,607 3,367,232Accenture PLC Class A 43,956 1,742,416ACE Ltd. 25,839 1,371,534Adobe Systems Inc.a 43,956 1,262,416Advanced Micro Devices Inc.a,b 14,850 111,226AES Corp. (The)a 79,596 820,635Aetna Inc. 29,403 818,874Aflac Inc. 24,057 1,183,363Air Products and Chemicals Inc. 16,038 1,164,038Akamai Technologies Inc.a 5,049 193,680Alcoa Inc. 49,302 550,703Allergan Inc. 23,166 1,414,516Allstate Corp. (The) 32,670 922,601Altria Group Inc. 106,326 2,356,184Amazon.com Inc.a 20,196 2,380,906American Electric
Power Co. Inc. 35,343 1,271,641American Express Co. 42,768 1,909,164American International
Group Inc.a,b 3,564 137,107American Tower Corp. Class Aa 38,610 1,785,326Ameriprise Financial Inc. 25,245 1,070,136Amgen Inc.a 56,727 3,093,323Anadarko Petroleum Corp. 25,839 1,270,245Apache Corp. 17,523 1,674,848Apollo Group Inc. Class Aa 13,068 602,827Apple Inc.a 45,738 11,766,100Applied Materials Inc. 84,348 995,306Archer-Daniels-Midland Co. 34,155 934,481AT&T Inc. 277,992 7,211,112Automatic Data Processing Inc. 37,719 1,556,663AvalonBay Communities Inc. 1,485 156,059Avon Products Inc. 38,313 1,192,684Baker Hughes Inc. 21,978 1,060,878Bank of America Corp. 481,140 6,755,206Bank of New York
Mellon Corp. (The) 51,678 1,295,567Baxter International Inc. 29,403 1,286,969BB&T Corp. 45,738 1,135,675Becton, Dickinson and Co. 15,741 1,082,981Bed Bath & Beyond Inc.a 37,125 1,406,295
Security Shares Value
Berkshire Hathaway Inc.Class Ba 24,243 $ 1,893,863
Best Buy Co. Inc. 29,116 1,009,161Biogen Idec Inc.a 23,463 1,311,112Boeing Co. (The) 35,937 2,448,747Boston Properties Inc. 9,608 786,895Boston Scientific Corp.a 98,307 550,519Bristol-Myers Squibb Co. 91,643 2,283,744Broadcom Corp. Class A 6,237 224,719Bunge Ltd. 2,376 117,968C.H. Robinson Worldwide Inc. 27,324 1,781,525C.R. Bard Inc. 11,286 886,290CA Inc. 64,449 1,260,622Cablevision NY Group Class A 5,049 138,393Calpine Corp.a 11,880 160,380Capital One Financial Corp. 28,215 1,194,341Cardinal Health Inc. 24,651 795,488CareFusion Corp.a 12,249 258,087CarMax Inc.a 5,346 112,801Carnival Corp. 36,531 1,266,895Caterpillar Inc. 26,433 1,843,702CBS Corp. Class B NVS 59,103 873,542Celgene Corp.a 26,730 1,474,159Charles Schwab Corp. (The) 75,141 1,111,335Chesapeake Energy Corp. 35,343 743,263Chevron Corp. 99,198 7,559,880Chubb Corp. 28,512 1,500,587Church & Dwight Co. Inc. 4,752 314,915CIGNA Corp. 21,087 648,636Cisco Systems Inc.a 286,308 6,605,126CIT Group Inc.a 29,700 1,079,892Citigroup Inc.a 1,072,245 4,396,204Cliffs Natural Resources Inc. 5,346 302,423Clorox Co. (The) 5,049 327,579CME Group Inc. 2,970 828,036Coach Inc. 36,234 1,339,571Coca-Cola Co. (The) 91,773 5,057,610Coca-Cola Enterprises Inc. 5,940 170,478Cognizant Technology
Solutions Corp. Class Aa 32,373 1,766,271Colgate-Palmolive Co. 26,730 2,111,135Comcast Corp. Class A 57,618 1,121,822Comerica Inc. 6,060 232,462
56 2 0 1 0 i S h a r e s A n n u a l R e p o r t to S h a r e h o l d e r s
Schedule of Investments (Continued)
iSHARES» MSCI ACWI INDEX FUNDJuly 31, 2010
For
per
sona
l use
onl
y
%%TRANSMSG*** Transmitting Job: B82515 PCN: 058000000 ***%%PCMSG|56 |00009|Yes|No|09/16/2010 20:08|0|0|Page is valid, no graphics -- Color: N|
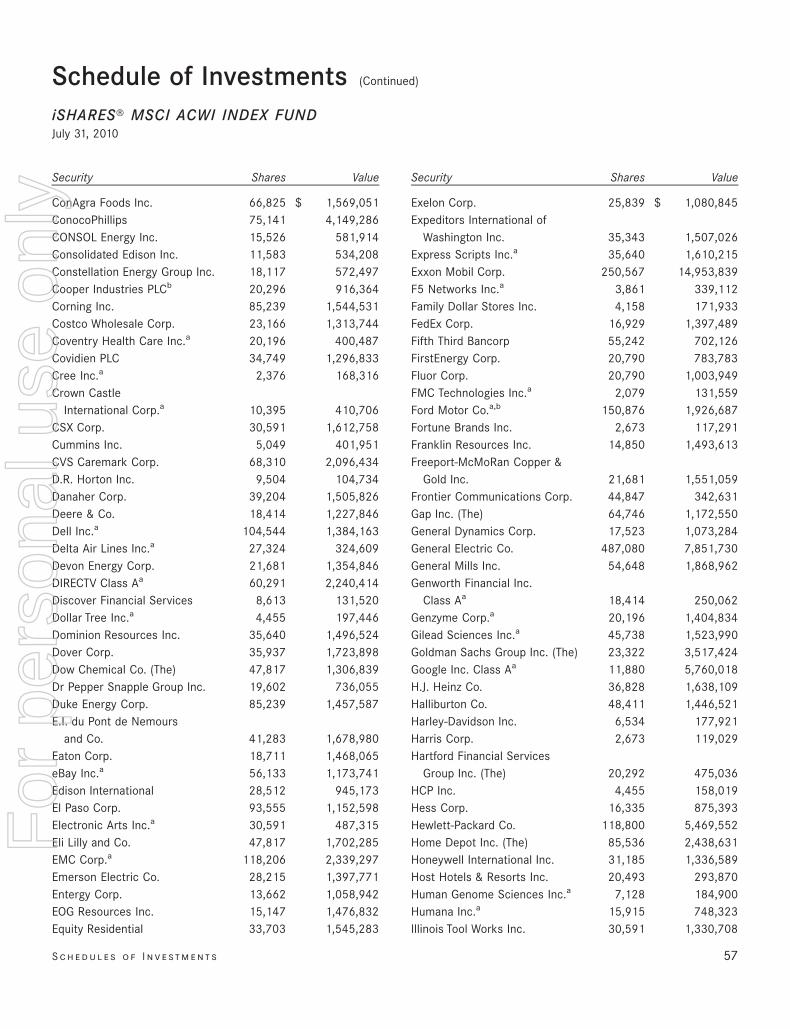
Security Shares Value
ConAgra Foods Inc. 66,825 $ 1,569,051ConocoPhillips 75,141 4,149,286CONSOL Energy Inc. 15,526 581,914Consolidated Edison Inc. 11,583 534,208Constellation Energy Group Inc. 18,117 572,497Cooper Industries PLCb 20,296 916,364Corning Inc. 85,239 1,544,531Costco Wholesale Corp. 23,166 1,313,744Coventry Health Care Inc.a 20,196 400,487Covidien PLC 34,749 1,296,833Cree Inc.a 2,376 168,316Crown Castle
International Corp.a 10,395 410,706CSX Corp. 30,591 1,612,758Cummins Inc. 5,049 401,951CVS Caremark Corp. 68,310 2,096,434D.R. Horton Inc. 9,504 104,734Danaher Corp. 39,204 1,505,826Deere & Co. 18,414 1,227,846Dell Inc.a 104,544 1,384,163Delta Air Lines Inc.a 27,324 324,609Devon Energy Corp. 21,681 1,354,846DIRECTV Class Aa 60,291 2,240,414Discover Financial Services 8,613 131,520Dollar Tree Inc.a 4,455 197,446Dominion Resources Inc. 35,640 1,496,524Dover Corp. 35,937 1,723,898Dow Chemical Co. (The) 47,817 1,306,839Dr Pepper Snapple Group Inc. 19,602 736,055Duke Energy Corp. 85,239 1,457,587E.I. du Pont de Nemours
and Co. 41,283 1,678,980Eaton Corp. 18,711 1,468,065eBay Inc.a 56,133 1,173,741Edison International 28,512 945,173El Paso Corp. 93,555 1,152,598Electronic Arts Inc.a 30,591 487,315Eli Lilly and Co. 47,817 1,702,285EMC Corp.a 118,206 2,339,297Emerson Electric Co. 28,215 1,397,771Entergy Corp. 13,662 1,058,942EOG Resources Inc. 15,147 1,476,832Equity Residential 33,703 1,545,283
Security Shares Value
Exelon Corp. 25,839 $ 1,080,845Expeditors International of
Washington Inc. 35,343 1,507,026Express Scripts Inc.a 35,640 1,610,215Exxon Mobil Corp. 250,567 14,953,839F5 Networks Inc.a 3,861 339,112Family Dollar Stores Inc. 4,158 171,933FedEx Corp. 16,929 1,397,489Fifth Third Bancorp 55,242 702,126FirstEnergy Corp. 20,790 783,783Fluor Corp. 20,790 1,003,949FMC Technologies Inc.a 2,079 131,559Ford Motor Co.a,b 150,876 1,926,687Fortune Brands Inc. 2,673 117,291Franklin Resources Inc. 14,850 1,493,613Freeport-McMoRan Copper &
Gold Inc. 21,681 1,551,059Frontier Communications Corp. 44,847 342,631Gap Inc. (The) 64,746 1,172,550General Dynamics Corp. 17,523 1,073,284General Electric Co. 487,080 7,851,730General Mills Inc. 54,648 1,868,962Genworth Financial Inc.
Class Aa 18,414 250,062Genzyme Corp.a 20,196 1,404,834Gilead Sciences Inc.a 45,738 1,523,990Goldman Sachs Group Inc. (The) 23,322 3,517,424Google Inc. Class Aa 11,880 5,760,018H.J. Heinz Co. 36,828 1,638,109Halliburton Co. 48,411 1,446,521Harley-Davidson Inc. 6,534 177,921Harris Corp. 2,673 119,029Hartford Financial Services
Group Inc. (The) 20,292 475,036HCP Inc. 4,455 158,019Hess Corp. 16,335 875,393Hewlett-Packard Co. 118,800 5,469,552Home Depot Inc. (The) 85,536 2,438,631Honeywell International Inc. 31,185 1,336,589Host Hotels & Resorts Inc. 20,493 293,870Human Genome Sciences Inc.a 7,128 184,900Humana Inc.a 15,915 748,323Illinois Tool Works Inc. 30,591 1,330,708
S c h e d u l e s o f I n v e st m e n t s 57
Schedule of Investments (Continued)
iSHARES» MSCI ACWI INDEX FUNDJuly 31, 2010
For
per
sona
l use
onl
y
%%TRANSMSG*** Transmitting Job: B82515 PCN: 059000000 ***%%PCMSG|57 |00008|Yes|No|09/16/2010 20:08|0|0|Page is valid, no graphics -- Color: N|
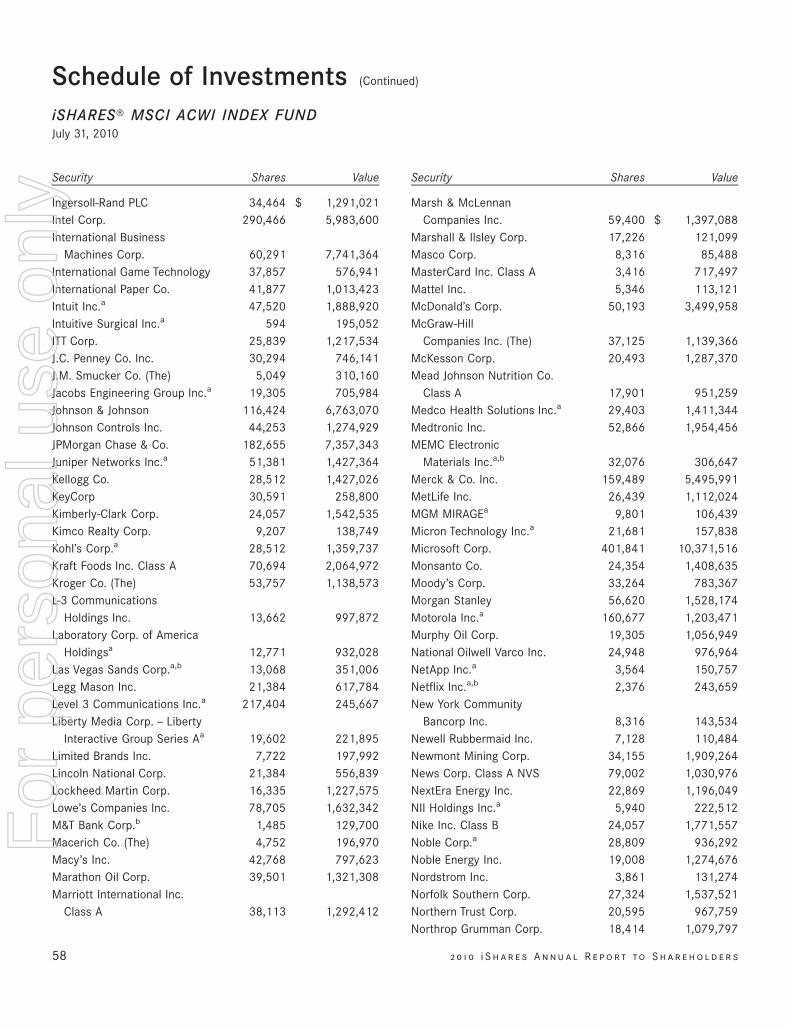
Security Shares Value
Ingersoll-Rand PLC 34,464 $ 1,291,021Intel Corp. 290,466 5,983,600International Business
Machines Corp. 60,291 7,741,364International Game Technology 37,857 576,941International Paper Co. 41,877 1,013,423Intuit Inc.a 47,520 1,888,920Intuitive Surgical Inc.a 594 195,052ITT Corp. 25,839 1,217,534J.C. Penney Co. Inc. 30,294 746,141J.M. Smucker Co. (The) 5,049 310,160Jacobs Engineering Group Inc.a 19,305 705,984Johnson & Johnson 116,424 6,763,070Johnson Controls Inc. 44,253 1,274,929JPMorgan Chase & Co. 182,655 7,357,343Juniper Networks Inc.a 51,381 1,427,364Kellogg Co. 28,512 1,427,026KeyCorp 30,591 258,800Kimberly-Clark Corp. 24,057 1,542,535Kimco Realty Corp. 9,207 138,749Kohl’s Corp.a 28,512 1,359,737Kraft Foods Inc. Class A 70,694 2,064,972Kroger Co. (The) 53,757 1,138,573L-3 Communications
Holdings Inc. 13,662 997,872Laboratory Corp. of America
Holdingsa 12,771 932,028Las Vegas Sands Corp.a,b 13,068 351,006Legg Mason Inc. 21,384 617,784Level 3 Communications Inc.a 217,404 245,667Liberty Media Corp. — Liberty
Interactive Group Series Aa 19,602 221,895Limited Brands Inc. 7,722 197,992Lincoln National Corp. 21,384 556,839Lockheed Martin Corp. 16,335 1,227,575Lowe’s Companies Inc. 78,705 1,632,342M&T Bank Corp.b 1,485 129,700Macerich Co. (The) 4,752 196,970Macy’s Inc. 42,768 797,623Marathon Oil Corp. 39,501 1,321,308Marriott International Inc.
Class A 38,113 1,292,412
Security Shares Value
Marsh & McLennanCompanies Inc. 59,400 $ 1,397,088
Marshall & Ilsley Corp. 17,226 121,099Masco Corp. 8,316 85,488MasterCard Inc. Class A 3,416 717,497Mattel Inc. 5,346 113,121McDonald’s Corp. 50,193 3,499,958McGraw-Hill
Companies Inc. (The) 37,125 1,139,366McKesson Corp. 20,493 1,287,370Mead Johnson Nutrition Co.
Class A 17,901 951,259Medco Health Solutions Inc.a 29,403 1,411,344Medtronic Inc. 52,866 1,954,456MEMC Electronic
Materials Inc.a,b 32,076 306,647Merck & Co. Inc. 159,489 5,495,991MetLife Inc. 26,439 1,112,024MGM MIRAGEa 9,801 106,439Micron Technology Inc.a 21,681 157,838Microsoft Corp. 401,841 10,371,516Monsanto Co. 24,354 1,408,635Moody’s Corp. 33,264 783,367Morgan Stanley 56,620 1,528,174Motorola Inc.a 160,677 1,203,471Murphy Oil Corp. 19,305 1,056,949National Oilwell Varco Inc. 24,948 976,964NetApp Inc.a 3,564 150,757Netflix Inc.a,b 2,376 243,659New York Community
Bancorp Inc. 8,316 143,534Newell Rubbermaid Inc. 7,128 110,484Newmont Mining Corp. 34,155 1,909,264News Corp. Class A NVS 79,002 1,030,976NextEra Energy Inc. 22,869 1,196,049NII Holdings Inc.a 5,940 222,512Nike Inc. Class B 24,057 1,771,557Noble Corp.a 28,809 936,292Noble Energy Inc. 19,008 1,274,676Nordstrom Inc. 3,861 131,274Norfolk Southern Corp. 27,324 1,537,521Northern Trust Corp. 20,595 967,759Northrop Grumman Corp. 18,414 1,079,797
58 2 0 1 0 i S h a r e s A n n u a l R e p o r t to S h a r e h o l d e r s
Schedule of Investments (Continued)
iSHARES» MSCI ACWI INDEX FUNDJuly 31, 2010
For
per
sona
l use
onl
y
%%TRANSMSG*** Transmitting Job: B82515 PCN: 060000000 ***%%PCMSG|58 |00008|Yes|No|09/16/2010 20:08|0|0|Page is valid, no graphics -- Color: N|
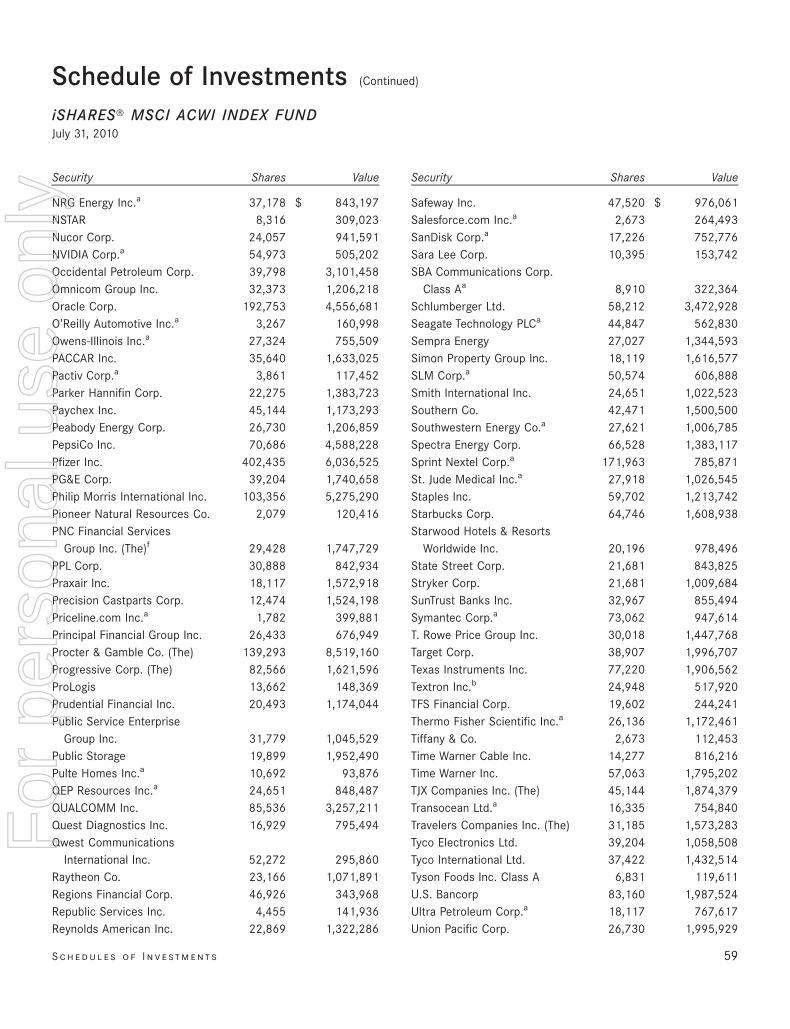
Security Shares Value
NRG Energy Inc.a 37,178 $ 843,197NSTAR 8,316 309,023Nucor Corp. 24,057 941,591NVIDIA Corp.a 54,973 505,202Occidental Petroleum Corp. 39,798 3,101,458Omnicom Group Inc. 32,373 1,206,218Oracle Corp. 192,753 4,556,681O’Reilly Automotive Inc.a 3,267 160,998Owens-Illinois Inc.a 27,324 755,509PACCAR Inc. 35,640 1,633,025Pactiv Corp.a 3,861 117,452Parker Hannifin Corp. 22,275 1,383,723Paychex Inc. 45,144 1,173,293Peabody Energy Corp. 26,730 1,206,859PepsiCo Inc. 70,686 4,588,228Pfizer Inc. 402,435 6,036,525PG&E Corp. 39,204 1,740,658Philip Morris International Inc. 103,356 5,275,290Pioneer Natural Resources Co. 2,079 120,416PNC Financial Services
Group Inc. (The)f 29,428 1,747,729PPL Corp. 30,888 842,934Praxair Inc. 18,117 1,572,918Precision Castparts Corp. 12,474 1,524,198Priceline.com Inc.a 1,782 399,881Principal Financial Group Inc. 26,433 676,949Procter & Gamble Co. (The) 139,293 8,519,160Progressive Corp. (The) 82,566 1,621,596ProLogis 13,662 148,369Prudential Financial Inc. 20,493 1,174,044Public Service Enterprise
Group Inc. 31,779 1,045,529Public Storage 19,899 1,952,490Pulte Homes Inc.a 10,692 93,876QEP Resources Inc.a 24,651 848,487QUALCOMM Inc. 85,536 3,257,211Quest Diagnostics Inc. 16,929 795,494Qwest Communications
International Inc. 52,272 295,860Raytheon Co. 23,166 1,071,891Regions Financial Corp. 46,926 343,968Republic Services Inc. 4,455 141,936Reynolds American Inc. 22,869 1,322,286
Security Shares Value
Safeway Inc. 47,520 $ 976,061Salesforce.com Inc.a 2,673 264,493SanDisk Corp.a 17,226 752,776Sara Lee Corp. 10,395 153,742SBA Communications Corp.
Class Aa 8,910 322,364Schlumberger Ltd. 58,212 3,472,928Seagate Technology PLCa 44,847 562,830Sempra Energy 27,027 1,344,593Simon Property Group Inc. 18,119 1,616,577SLM Corp.a 50,574 606,888Smith International Inc. 24,651 1,022,523Southern Co. 42,471 1,500,500Southwestern Energy Co.a 27,621 1,006,785Spectra Energy Corp. 66,528 1,383,117Sprint Nextel Corp.a 171,963 785,871St. Jude Medical Inc.a 27,918 1,026,545Staples Inc. 59,702 1,213,742Starbucks Corp. 64,746 1,608,938Starwood Hotels & Resorts
Worldwide Inc. 20,196 978,496State Street Corp. 21,681 843,825Stryker Corp. 21,681 1,009,684SunTrust Banks Inc. 32,967 855,494Symantec Corp.a 73,062 947,614T. Rowe Price Group Inc. 30,018 1,447,768Target Corp. 38,907 1,996,707Texas Instruments Inc. 77,220 1,906,562Textron Inc.b 24,948 517,920TFS Financial Corp. 19,602 244,241Thermo Fisher Scientific Inc.a 26,136 1,172,461Tiffany & Co. 2,673 112,453Time Warner Cable Inc. 14,277 816,216Time Warner Inc. 57,063 1,795,202TJX Companies Inc. (The) 45,144 1,874,379Transocean Ltd.a 16,335 754,840Travelers Companies Inc. (The) 31,185 1,573,283Tyco Electronics Ltd. 39,204 1,058,508Tyco International Ltd. 37,422 1,432,514Tyson Foods Inc. Class A 6,831 119,611U.S. Bancorp 83,160 1,987,524Ultra Petroleum Corp.a 18,117 767,617Union Pacific Corp. 26,730 1,995,929
S c h e d u l e s o f I n v e st m e n t s 59
Schedule of Investments (Continued)
iSHARES» MSCI ACWI INDEX FUNDJuly 31, 2010
For
per
sona
l use
onl
y
%%TRANSMSG*** Transmitting Job: B82515 PCN: 061000000 ***%%PCMSG|59 |00008|Yes|No|09/16/2010 20:08|0|0|Page is valid, no graphics -- Color: N|
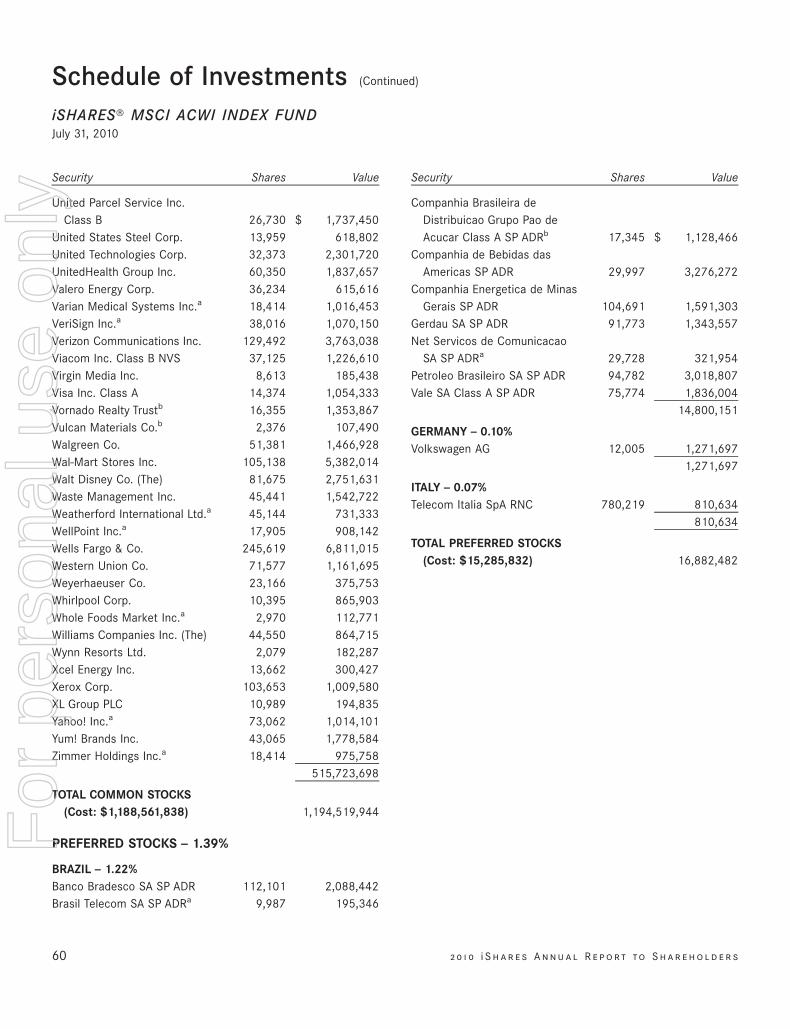
Security Shares Value
United Parcel Service Inc.Class B 26,730 $ 1,737,450
United States Steel Corp. 13,959 618,802United Technologies Corp. 32,373 2,301,720UnitedHealth Group Inc. 60,350 1,837,657Valero Energy Corp. 36,234 615,616Varian Medical Systems Inc.a 18,414 1,016,453VeriSign Inc.a 38,016 1,070,150Verizon Communications Inc. 129,492 3,763,038Viacom Inc. Class B NVS 37,125 1,226,610Virgin Media Inc. 8,613 185,438Visa Inc. Class A 14,374 1,054,333Vornado Realty Trustb 16,355 1,353,867Vulcan Materials Co.b 2,376 107,490Walgreen Co. 51,381 1,466,928Wal-Mart Stores Inc. 105,138 5,382,014Walt Disney Co. (The) 81,675 2,751,631Waste Management Inc. 45,441 1,542,722Weatherford International Ltd.a 45,144 731,333WellPoint Inc.a 17,905 908,142Wells Fargo & Co. 245,619 6,811,015Western Union Co. 71,577 1,161,695Weyerhaeuser Co. 23,166 375,753Whirlpool Corp. 10,395 865,903Whole Foods Market Inc.a 2,970 112,771Williams Companies Inc. (The) 44,550 864,715Wynn Resorts Ltd. 2,079 182,287Xcel Energy Inc. 13,662 300,427Xerox Corp. 103,653 1,009,580XL Group PLC 10,989 194,835Yahoo! Inc.a 73,062 1,014,101Yum! Brands Inc. 43,065 1,778,584Zimmer Holdings Inc.a 18,414 975,758
515,723,698
TOTAL COMMON STOCKS(Cost: $1,188,561,838) 1,194,519,944
PREFERRED STOCKS — 1.39%
BRAZIL — 1.22%Banco Bradesco SA SP ADR 112,101 2,088,442Brasil Telecom SA SP ADRa 9,987 195,346
Security Shares Value
Companhia Brasileira deDistribuicao Grupo Pao deAcucar Class A SP ADRb 17,345 $ 1,128,466
Companhia de Bebidas dasAmericas SP ADR 29,997 3,276,272
Companhia Energetica de MinasGerais SP ADR 104,691 1,591,303
Gerdau SA SP ADR 91,773 1,343,557Net Servicos de Comunicacao
SA SP ADRa 29,728 321,954Petroleo Brasileiro SA SP ADR 94,782 3,018,807Vale SA Class A SP ADR 75,774 1,836,004
14,800,151
GERMANY — 0.10%Volkswagen AG 12,005 1,271,697
1,271,697
ITALY — 0.07%Telecom Italia SpA RNC 780,219 810,634
810,634
TOTAL PREFERRED STOCKS(Cost: $15,285,832) 16,882,482
60 2 0 1 0 i S h a r e s A n n u a l R e p o r t to S h a r e h o l d e r s
Schedule of Investments (Continued)
iSHARES» MSCI ACWI INDEX FUNDJuly 31, 2010
For
per
sona
l use
onl
y
%%TRANSMSG*** Transmitting Job: B82515 PCN: 062000000 ***%%PCMSG|60 |00009|Yes|No|09/16/2010 20:08|0|0|Page is valid, no graphics -- Color: N|
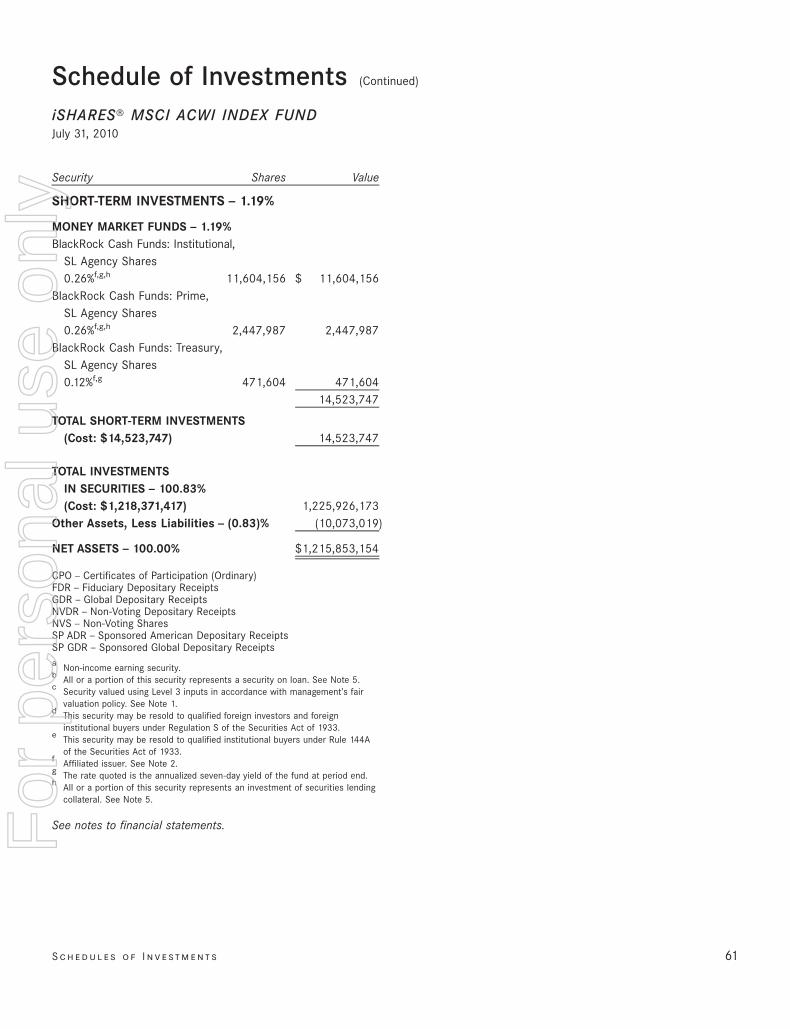
Security Shares Value
SHORT-TERM INVESTMENTS — 1.19%
MONEY MARKET FUNDS — 1.19%BlackRock Cash Funds: Institutional,
SL Agency Shares0.26%f,g,h 11,604,156 $ 11,604,156
BlackRock Cash Funds: Prime,SL Agency Shares0.26%f,g,h 2,447,987 2,447,987
BlackRock Cash Funds: Treasury,SL Agency Shares0.12%f,g 471,604 471,604
14,523,747
TOTAL SHORT-TERM INVESTMENTS(Cost: $14,523,747) 14,523,747
TOTAL INVESTMENTSIN SECURITIES — 100.83%(Cost: $1,218,371,417) 1,225,926,173
Other Assets, Less Liabilities — (0.83)% (10,073,019)
NET ASSETS — 100.00% $1,215,853,154
CPO — Certificates of Participation (Ordinary)FDR — Fiduciary Depositary ReceiptsGDR — Global Depositary ReceiptsNVDR — Non-Voting Depositary ReceiptsNVS — Non-Voting SharesSP ADR — Sponsored American Depositary ReceiptsSP GDR — Sponsored Global Depositary Receiptsa Non-income earning security.b All or a portion of this security represents a security on loan. See Note 5.c Security valued using Level 3 inputs in accordance with management’s fair
valuation policy. See Note 1.d This security may be resold to qualified foreign investors and foreign
institutional buyers under Regulation S of the Securities Act of 1933.e This security may be resold to qualified institutional buyers under Rule 144A
of the Securities Act of 1933.f Affiliated issuer. See Note 2.g The rate quoted is the annualized seven-day yield of the fund at period end.h All or a portion of this security represents an investment of securities lending
collateral. See Note 5.
See notes to financial statements.
S c h e d u l e s o f I n v e st m e n t s 61
Schedule of Investments (Continued)
iSHARES» MSCI ACWI INDEX FUNDJuly 31, 2010
For
per
sona
l use
onl
y
%%TRANSMSG*** Transmitting Job: B82515 PCN: 063000000 ***%%PCMSG|61 |00008|Yes|No|09/16/2010 20:08|0|0|Page is valid, no graphics -- Color: N|
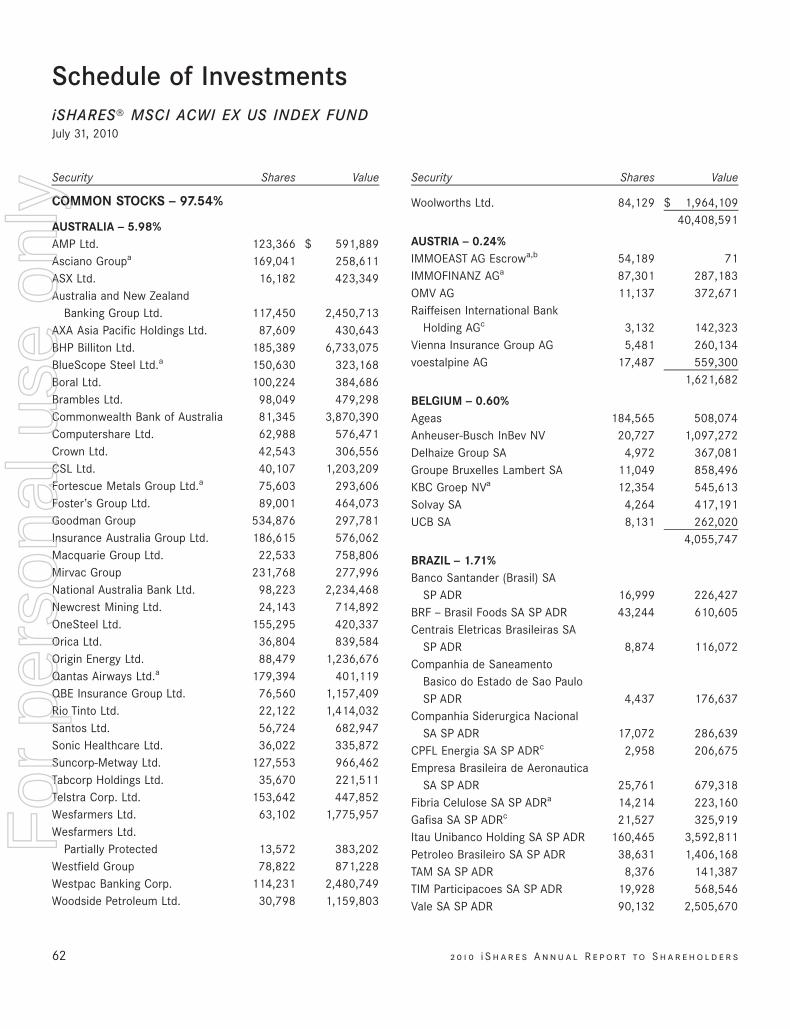
Schedule of InvestmentsiSHARES» MSCI ACWI EX US INDEX FUNDJuly 31, 2010
Security Shares Value
COMMON STOCKS — 97.54%
AUSTRALIA — 5.98%AMP Ltd. 123,366 $ 591,889Asciano Groupa 169,041 258,611ASX Ltd. 16,182 423,349Australia and New Zealand
Banking Group Ltd. 117,450 2,450,713AXA Asia Pacific Holdings Ltd. 87,609 430,643BHP Billiton Ltd. 185,389 6,733,075BlueScope Steel Ltd.a 150,630 323,168Boral Ltd. 100,224 384,686Brambles Ltd. 98,049 479,298Commonwealth Bank of Australia 81,345 3,870,390Computershare Ltd. 62,988 576,471Crown Ltd. 42,543 306,556CSL Ltd. 40,107 1,203,209Fortescue Metals Group Ltd.a 75,603 293,606Foster’s Group Ltd. 89,001 464,073Goodman Group 534,876 297,781Insurance Australia Group Ltd. 186,615 576,062Macquarie Group Ltd. 22,533 758,806Mirvac Group 231,768 277,996National Australia Bank Ltd. 98,223 2,234,468Newcrest Mining Ltd. 24,143 714,892OneSteel Ltd. 155,295 420,337Orica Ltd. 36,804 839,584Origin Energy Ltd. 88,479 1,236,676Qantas Airways Ltd.a 179,394 401,119QBE Insurance Group Ltd. 76,560 1,157,409Rio Tinto Ltd. 22,122 1,414,032Santos Ltd. 56,724 682,947Sonic Healthcare Ltd. 36,022 335,872Suncorp-Metway Ltd. 127,553 966,462Tabcorp Holdings Ltd. 35,670 221,511Telstra Corp. Ltd. 153,642 447,852Wesfarmers Ltd. 63,102 1,775,957Wesfarmers Ltd.
Partially Protected 13,572 383,202Westfield Group 78,822 871,228Westpac Banking Corp. 114,231 2,480,749Woodside Petroleum Ltd. 30,798 1,159,803
Security Shares Value
Woolworths Ltd. 84,129 $ 1,964,10940,408,591
AUSTRIA — 0.24%IMMOEAST AG Escrowa,b 54,189 71IMMOFINANZ AGa 87,301 287,183OMV AG 11,137 372,671Raiffeisen International Bank
Holding AGc 3,132 142,323Vienna Insurance Group AG 5,481 260,134voestalpine AG 17,487 559,300
1,621,682
BELGIUM — 0.60%Ageas 184,565 508,074Anheuser-Busch InBev NV 20,727 1,097,272Delhaize Group SA 4,972 367,081Groupe Bruxelles Lambert SA 11,049 858,496KBC Groep NVa 12,354 545,613Solvay SA 4,264 417,191UCB SA 8,131 262,020
4,055,747
BRAZIL — 1.71%Banco Santander (Brasil) SA
SP ADR 16,999 226,427BRF — Brasil Foods SA SP ADR 43,244 610,605Centrais Eletricas Brasileiras SA
SP ADR 8,874 116,072Companhia de Saneamento
Basico do Estado de Sao PauloSP ADR 4,437 176,637
Companhia Siderurgica NacionalSA SP ADR 17,072 286,639
CPFL Energia SA SP ADRc 2,958 206,675Empresa Brasileira de Aeronautica
SA SP ADR 25,761 679,318Fibria Celulose SA SP ADRa 14,214 223,160Gafisa SA SP ADRc 21,527 325,919Itau Unibanco Holding SA SP ADR 160,465 3,592,811Petroleo Brasileiro SA SP ADR 38,631 1,406,168TAM SA SP ADR 8,376 141,387TIM Participacoes SA SP ADR 19,928 568,546Vale SA SP ADR 90,132 2,505,670
62 2 0 1 0 i S h a r e s A n n u a l R e p o r t to S h a r e h o l d e r s
For
per
sona
l use
onl
y
%%TRANSMSG*** Transmitting Job: B82515 PCN: 064000000 ***%%PCMSG|62 |00011|Yes|No|09/16/2010 20:08|0|0|Page is valid, no graphics -- Color: N|
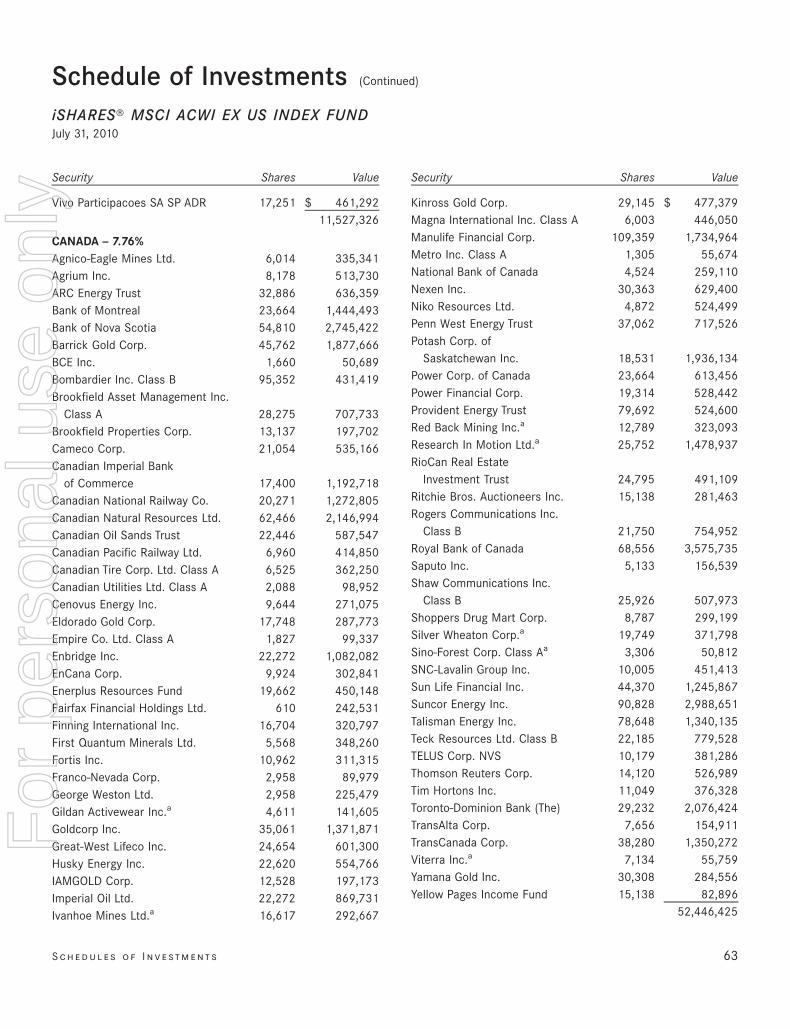
Security Shares Value
Vivo Participacoes SA SP ADR 17,251 $ 461,29211,527,326
CANADA — 7.76%Agnico-Eagle Mines Ltd. 6,014 335,341Agrium Inc. 8,178 513,730ARC Energy Trust 32,886 636,359Bank of Montreal 23,664 1,444,493Bank of Nova Scotia 54,810 2,745,422Barrick Gold Corp. 45,762 1,877,666BCE Inc. 1,660 50,689Bombardier Inc. Class B 95,352 431,419Brookfield Asset Management Inc.
Class A 28,275 707,733Brookfield Properties Corp. 13,137 197,702Cameco Corp. 21,054 535,166Canadian Imperial Bank
of Commerce 17,400 1,192,718Canadian National Railway Co. 20,271 1,272,805Canadian Natural Resources Ltd. 62,466 2,146,994Canadian Oil Sands Trust 22,446 587,547Canadian Pacific Railway Ltd. 6,960 414,850Canadian Tire Corp. Ltd. Class A 6,525 362,250Canadian Utilities Ltd. Class A 2,088 98,952Cenovus Energy Inc. 9,644 271,075Eldorado Gold Corp. 17,748 287,773Empire Co. Ltd. Class A 1,827 99,337Enbridge Inc. 22,272 1,082,082EnCana Corp. 9,924 302,841Enerplus Resources Fund 19,662 450,148Fairfax Financial Holdings Ltd. 610 242,531Finning International Inc. 16,704 320,797First Quantum Minerals Ltd. 5,568 348,260Fortis Inc. 10,962 311,315Franco-Nevada Corp. 2,958 89,979George Weston Ltd. 2,958 225,479Gildan Activewear Inc.a 4,611 141,605Goldcorp Inc. 35,061 1,371,871Great-West Lifeco Inc. 24,654 601,300Husky Energy Inc. 22,620 554,766IAMGOLD Corp. 12,528 197,173Imperial Oil Ltd. 22,272 869,731Ivanhoe Mines Ltd.a 16,617 292,667
Security Shares Value
Kinross Gold Corp. 29,145 $ 477,379Magna International Inc. Class A 6,003 446,050Manulife Financial Corp. 109,359 1,734,964Metro Inc. Class A 1,305 55,674National Bank of Canada 4,524 259,110Nexen Inc. 30,363 629,400Niko Resources Ltd. 4,872 524,499Penn West Energy Trust 37,062 717,526Potash Corp. of
Saskatchewan Inc. 18,531 1,936,134Power Corp. of Canada 23,664 613,456Power Financial Corp. 19,314 528,442Provident Energy Trust 79,692 524,600Red Back Mining Inc.a 12,789 323,093Research In Motion Ltd.a 25,752 1,478,937RioCan Real Estate
Investment Trust 24,795 491,109Ritchie Bros. Auctioneers Inc. 15,138 281,463Rogers Communications Inc.
Class B 21,750 754,952Royal Bank of Canada 68,556 3,575,735Saputo Inc. 5,133 156,539Shaw Communications Inc.
Class B 25,926 507,973Shoppers Drug Mart Corp. 8,787 299,199Silver Wheaton Corp.a 19,749 371,798Sino-Forest Corp. Class Aa 3,306 50,812SNC-Lavalin Group Inc. 10,005 451,413Sun Life Financial Inc. 44,370 1,245,867Suncor Energy Inc. 90,828 2,988,651Talisman Energy Inc. 78,648 1,340,135Teck Resources Ltd. Class B 22,185 779,528TELUS Corp. NVS 10,179 381,286Thomson Reuters Corp. 14,120 526,989Tim Hortons Inc. 11,049 376,328Toronto-Dominion Bank (The) 29,232 2,076,424TransAlta Corp. 7,656 154,911TransCanada Corp. 38,280 1,350,272Viterra Inc.a 7,134 55,759Yamana Gold Inc. 30,308 284,556Yellow Pages Income Fund 15,138 82,896
52,446,425
S c h e d u l e s o f I n v e st m e n t s 63
Schedule of Investments (Continued)
iSHARES» MSCI ACWI EX US INDEX FUNDJuly 31, 2010
For
per
sona
l use
onl
y
%%TRANSMSG*** Transmitting Job: B82515 PCN: 065000000 ***%%PCMSG|63 |00011|Yes|No|09/16/2010 20:08|0|0|Page is valid, no graphics -- Color: N|
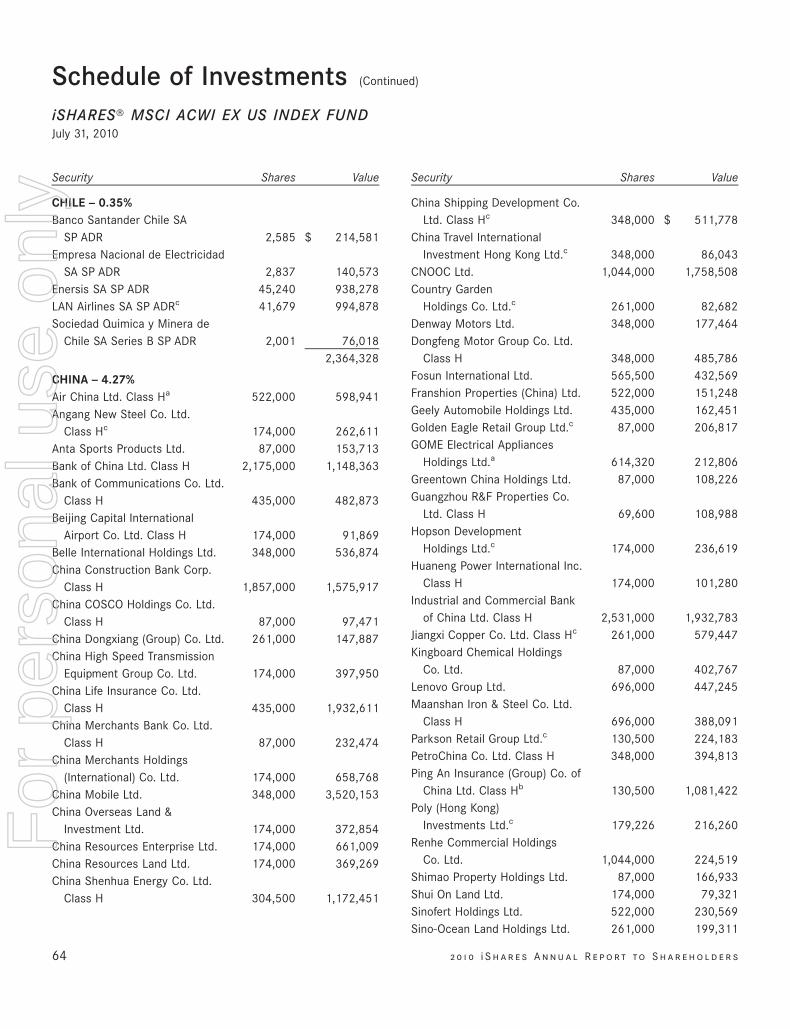
Security Shares Value
CHILE — 0.35%Banco Santander Chile SA
SP ADR 2,585 $ 214,581Empresa Nacional de Electricidad
SA SP ADR 2,837 140,573Enersis SA SP ADR 45,240 938,278LAN Airlines SA SP ADRc 41,679 994,878Sociedad Quimica y Minera de
Chile SA Series B SP ADR 2,001 76,0182,364,328
CHINA — 4.27%Air China Ltd. Class Ha 522,000 598,941Angang New Steel Co. Ltd.
Class Hc 174,000 262,611Anta Sports Products Ltd. 87,000 153,713Bank of China Ltd. Class H 2,175,000 1,148,363Bank of Communications Co. Ltd.
Class H 435,000 482,873Beijing Capital International
Airport Co. Ltd. Class H 174,000 91,869Belle International Holdings Ltd. 348,000 536,874China Construction Bank Corp.
Class H 1,857,000 1,575,917China COSCO Holdings Co. Ltd.
Class H 87,000 97,471China Dongxiang (Group) Co. Ltd. 261,000 147,887China High Speed Transmission
Equipment Group Co. Ltd. 174,000 397,950China Life Insurance Co. Ltd.
Class H 435,000 1,932,611China Merchants Bank Co. Ltd.
Class H 87,000 232,474China Merchants Holdings
(International) Co. Ltd. 174,000 658,768China Mobile Ltd. 348,000 3,520,153China Overseas Land &
Investment Ltd. 174,000 372,854China Resources Enterprise Ltd. 174,000 661,009China Resources Land Ltd. 174,000 369,269China Shenhua Energy Co. Ltd.
Class H 304,500 1,172,451
Security Shares Value
China Shipping Development Co.Ltd. Class Hc 348,000 $ 511,778
China Travel InternationalInvestment Hong Kong Ltd.c 348,000 86,043
CNOOC Ltd. 1,044,000 1,758,508Country Garden
Holdings Co. Ltd.c 261,000 82,682Denway Motors Ltd. 348,000 177,464Dongfeng Motor Group Co. Ltd.
Class H 348,000 485,786Fosun International Ltd. 565,500 432,569Franshion Properties (China) Ltd. 522,000 151,248Geely Automobile Holdings Ltd. 435,000 162,451Golden Eagle Retail Group Ltd.c 87,000 206,817GOME Electrical Appliances
Holdings Ltd.a 614,320 212,806Greentown China Holdings Ltd. 87,000 108,226Guangzhou R&F Properties Co.
Ltd. Class H 69,600 108,988Hopson Development
Holdings Ltd.c 174,000 236,619Huaneng Power International Inc.
Class H 174,000 101,280Industrial and Commercial Bank
of China Ltd. Class H 2,531,000 1,932,783Jiangxi Copper Co. Ltd. Class Hc 261,000 579,447Kingboard Chemical Holdings
Co. Ltd. 87,000 402,767Lenovo Group Ltd. 696,000 447,245Maanshan Iron & Steel Co. Ltd.
Class H 696,000 388,091Parkson Retail Group Ltd.c 130,500 224,183PetroChina Co. Ltd. Class H 348,000 394,813Ping An Insurance (Group) Co. of
China Ltd. Class Hb 130,500 1,081,422Poly (Hong Kong)
Investments Ltd.c 179,226 216,260Renhe Commercial Holdings
Co. Ltd. 1,044,000 224,519Shimao Property Holdings Ltd. 87,000 166,933Shui On Land Ltd. 174,000 79,321Sinofert Holdings Ltd. 522,000 230,569Sino-Ocean Land Holdings Ltd. 261,000 199,311
64 2 0 1 0 i S h a r e s A n n u a l R e p o r t to S h a r e h o l d e r s
Schedule of Investments (Continued)
iSHARES» MSCI ACWI EX US INDEX FUNDJuly 31, 2010
For
per
sona
l use
onl
y
%%TRANSMSG*** Transmitting Job: B82515 PCN: 066000000 ***%%PCMSG|64 |00008|Yes|No|09/16/2010 20:08|0|0|Page is valid, no graphics -- Color: N|
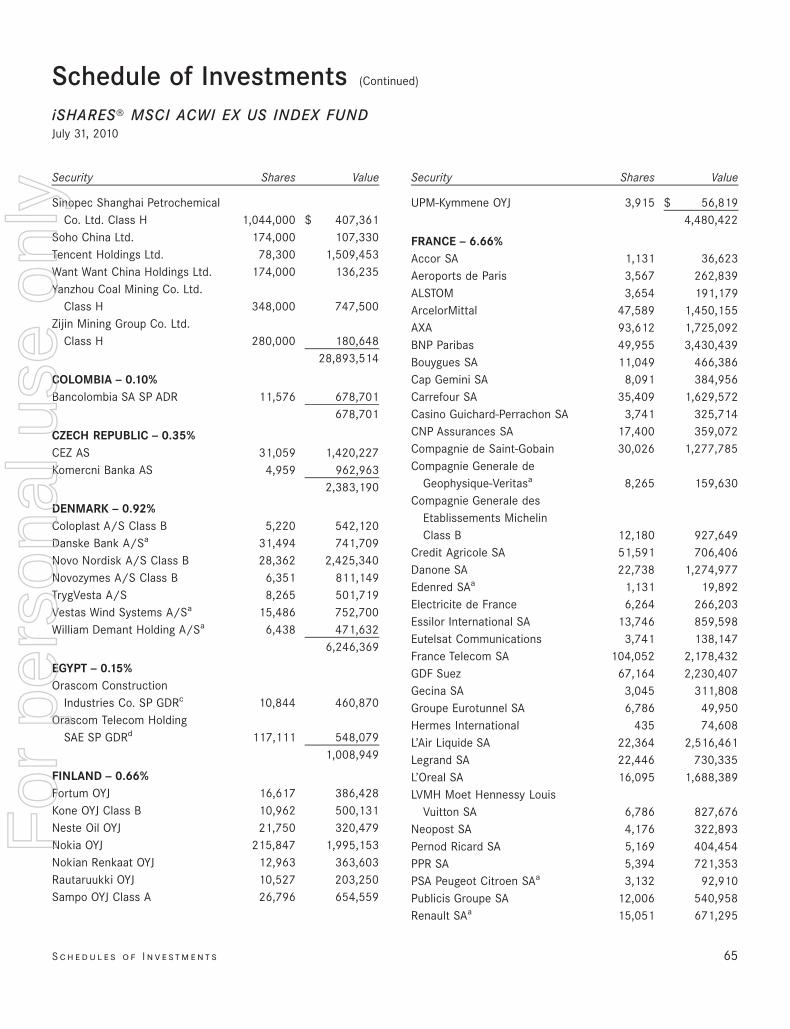
Security Shares Value
Sinopec Shanghai PetrochemicalCo. Ltd. Class H 1,044,000 $ 407,361
Soho China Ltd. 174,000 107,330Tencent Holdings Ltd. 78,300 1,509,453Want Want China Holdings Ltd. 174,000 136,235Yanzhou Coal Mining Co. Ltd.
Class H 348,000 747,500Zijin Mining Group Co. Ltd.
Class H 280,000 180,64828,893,514
COLOMBIA — 0.10%Bancolombia SA SP ADR 11,576 678,701
678,701
CZECH REPUBLIC — 0.35%CEZ AS 31,059 1,420,227Komercni Banka AS 4,959 962,963
2,383,190
DENMARK — 0.92%Coloplast A/S Class B 5,220 542,120Danske Bank A/Sa 31,494 741,709Novo Nordisk A/S Class B 28,362 2,425,340Novozymes A/S Class B 6,351 811,149TrygVesta A/S 8,265 501,719Vestas Wind Systems A/Sa 15,486 752,700William Demant Holding A/Sa 6,438 471,632
6,246,369
EGYPT — 0.15%Orascom Construction
Industries Co. SP GDRc 10,844 460,870Orascom Telecom Holding
SAE SP GDRd 117,111 548,0791,008,949
FINLAND — 0.66%Fortum OYJ 16,617 386,428Kone OYJ Class B 10,962 500,131Neste Oil OYJ 21,750 320,479Nokia OYJ 215,847 1,995,153Nokian Renkaat OYJ 12,963 363,603Rautaruukki OYJ 10,527 203,250Sampo OYJ Class A 26,796 654,559
Security Shares Value
UPM-Kymmene OYJ 3,915 $ 56,8194,480,422
FRANCE — 6.66%Accor SA 1,131 36,623Aeroports de Paris 3,567 262,839ALSTOM 3,654 191,179ArcelorMittal 47,589 1,450,155AXA 93,612 1,725,092BNP Paribas 49,955 3,430,439Bouygues SA 11,049 466,386Cap Gemini SA 8,091 384,956Carrefour SA 35,409 1,629,572Casino Guichard-Perrachon SA 3,741 325,714CNP Assurances SA 17,400 359,072Compagnie de Saint-Gobain 30,026 1,277,785Compagnie Generale de
Geophysique-Veritasa 8,265 159,630Compagnie Generale des
Etablissements MichelinClass B 12,180 927,649
Credit Agricole SA 51,591 706,406Danone SA 22,738 1,274,977Edenred SAa 1,131 19,892Electricite de France 6,264 266,203Essilor International SA 13,746 859,598Eutelsat Communications 3,741 138,147France Telecom SA 104,052 2,178,432GDF Suez 67,164 2,230,407Gecina SA 3,045 311,808Groupe Eurotunnel SA 6,786 49,950Hermes International 435 74,608L’Air Liquide SA 22,364 2,516,461Legrand SA 22,446 730,335L’Oreal SA 16,095 1,688,389LVMH Moet Hennessy Louis
Vuitton SA 6,786 827,676Neopost SA 4,176 322,893Pernod Ricard SA 5,169 404,454PPR SA 5,394 721,353PSA Peugeot Citroen SAa 3,132 92,910Publicis Groupe SA 12,006 540,958Renault SAa 15,051 671,295
S c h e d u l e s o f I n v e st m e n t s 65
Schedule of Investments (Continued)
iSHARES» MSCI ACWI EX US INDEX FUNDJuly 31, 2010
For
per
sona
l use
onl
y
%%TRANSMSG*** Transmitting Job: B82515 PCN: 067000000 ***%%PCMSG|65 |00008|Yes|No|09/16/2010 20:08|0|0|Page is valid, no graphics -- Color: N|
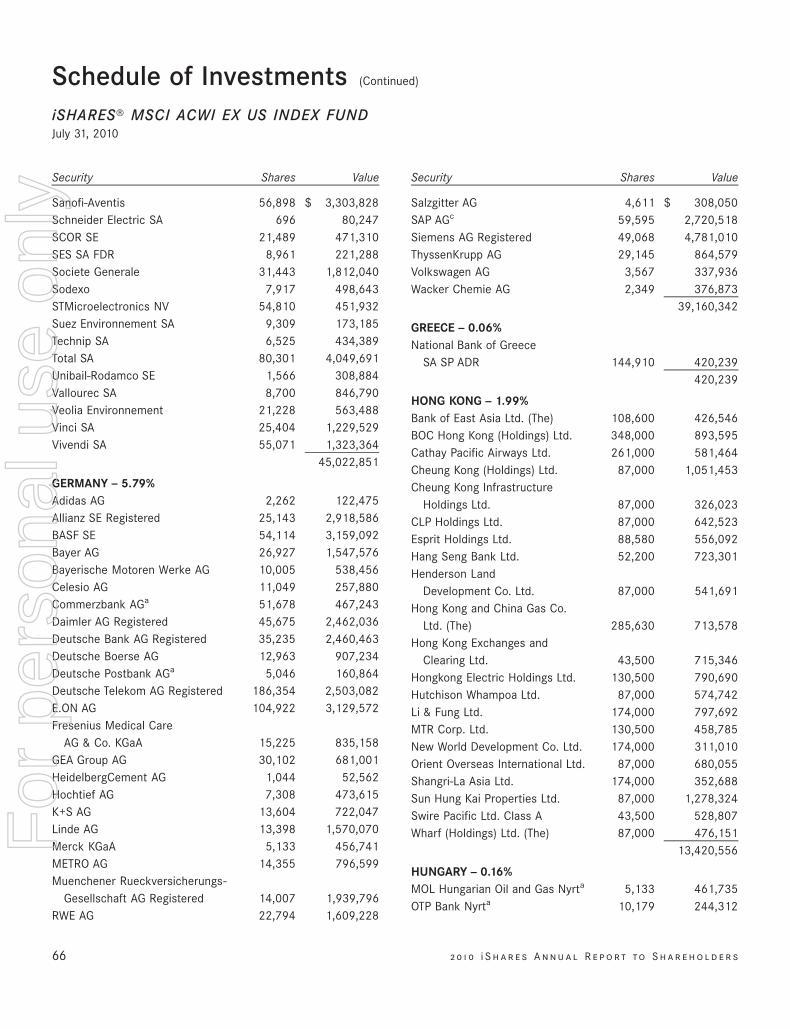
Security Shares Value
Sanofi-Aventis 56,898 $ 3,303,828Schneider Electric SA 696 80,247SCOR SE 21,489 471,310SES SA FDR 8,961 221,288Societe Generale 31,443 1,812,040Sodexo 7,917 498,643STMicroelectronics NV 54,810 451,932Suez Environnement SA 9,309 173,185Technip SA 6,525 434,389Total SA 80,301 4,049,691Unibail-Rodamco SE 1,566 308,884Vallourec SA 8,700 846,790Veolia Environnement 21,228 563,488Vinci SA 25,404 1,229,529Vivendi SA 55,071 1,323,364
45,022,851
GERMANY — 5.79%Adidas AG 2,262 122,475Allianz SE Registered 25,143 2,918,586BASF SE 54,114 3,159,092Bayer AG 26,927 1,547,576Bayerische Motoren Werke AG 10,005 538,456Celesio AG 11,049 257,880Commerzbank AGa 51,678 467,243Daimler AG Registered 45,675 2,462,036Deutsche Bank AG Registered 35,235 2,460,463Deutsche Boerse AG 12,963 907,234Deutsche Postbank AGa 5,046 160,864Deutsche Telekom AG Registered 186,354 2,503,082E.ON AG 104,922 3,129,572Fresenius Medical Care
AG & Co. KGaA 15,225 835,158GEA Group AG 30,102 681,001HeidelbergCement AG 1,044 52,562Hochtief AG 7,308 473,615K+S AG 13,604 722,047Linde AG 13,398 1,570,070Merck KGaA 5,133 456,741METRO AG 14,355 796,599Muenchener Rueckversicherungs-
Gesellschaft AG Registered 14,007 1,939,796RWE AG 22,794 1,609,228
Security Shares Value
Salzgitter AG 4,611 $ 308,050SAP AGc 59,595 2,720,518Siemens AG Registered 49,068 4,781,010ThyssenKrupp AG 29,145 864,579Volkswagen AG 3,567 337,936Wacker Chemie AG 2,349 376,873
39,160,342
GREECE — 0.06%National Bank of Greece
SA SP ADR 144,910 420,239420,239
HONG KONG — 1.99%Bank of East Asia Ltd. (The) 108,600 426,546BOC Hong Kong (Holdings) Ltd. 348,000 893,595Cathay Pacific Airways Ltd. 261,000 581,464Cheung Kong (Holdings) Ltd. 87,000 1,051,453Cheung Kong Infrastructure
Holdings Ltd. 87,000 326,023CLP Holdings Ltd. 87,000 642,523Esprit Holdings Ltd. 88,580 556,092Hang Seng Bank Ltd. 52,200 723,301Henderson Land
Development Co. Ltd. 87,000 541,691Hong Kong and China Gas Co.
Ltd. (The) 285,630 713,578Hong Kong Exchanges and
Clearing Ltd. 43,500 715,346Hongkong Electric Holdings Ltd. 130,500 790,690Hutchison Whampoa Ltd. 87,000 574,742Li & Fung Ltd. 174,000 797,692MTR Corp. Ltd. 130,500 458,785New World Development Co. Ltd. 174,000 311,010Orient Overseas International Ltd. 87,000 680,055Shangri-La Asia Ltd. 174,000 352,688Sun Hung Kai Properties Ltd. 87,000 1,278,324Swire Pacific Ltd. Class A 43,500 528,807Wharf (Holdings) Ltd. (The) 87,000 476,151
13,420,556
HUNGARY — 0.16%MOL Hungarian Oil and Gas Nyrta 5,133 461,735OTP Bank Nyrta 10,179 244,312
66 2 0 1 0 i S h a r e s A n n u a l R e p o r t to S h a r e h o l d e r s
Schedule of Investments (Continued)
iSHARES» MSCI ACWI EX US INDEX FUNDJuly 31, 2010
For
per
sona
l use
onl
y
%%TRANSMSG*** Transmitting Job: B82515 PCN: 068000000 ***%%PCMSG|66 |00008|Yes|No|09/16/2010 20:08|0|0|Page is valid, no graphics -- Color: N|
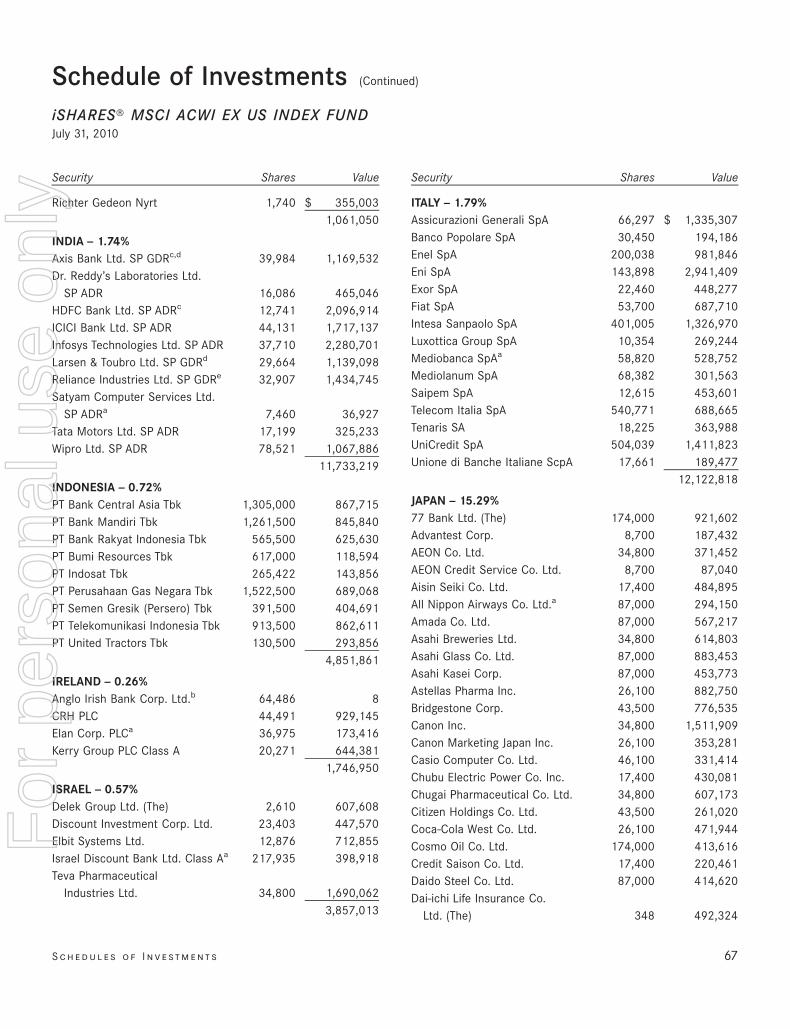
Security Shares Value
Richter Gedeon Nyrt 1,740 $ 355,0031,061,050
INDIA — 1.74%Axis Bank Ltd. SP GDRc,d 39,984 1,169,532Dr. Reddy’s Laboratories Ltd.
SP ADR 16,086 465,046HDFC Bank Ltd. SP ADRc 12,741 2,096,914ICICI Bank Ltd. SP ADR 44,131 1,717,137Infosys Technologies Ltd. SP ADR 37,710 2,280,701Larsen & Toubro Ltd. SP GDRd 29,664 1,139,098Reliance Industries Ltd. SP GDRe 32,907 1,434,745Satyam Computer Services Ltd.
SP ADRa 7,460 36,927Tata Motors Ltd. SP ADR 17,199 325,233Wipro Ltd. SP ADR 78,521 1,067,886
11,733,219
INDONESIA — 0.72%PT Bank Central Asia Tbk 1,305,000 867,715PT Bank Mandiri Tbk 1,261,500 845,840PT Bank Rakyat Indonesia Tbk 565,500 625,630PT Bumi Resources Tbk 617,000 118,594PT Indosat Tbk 265,422 143,856PT Perusahaan Gas Negara Tbk 1,522,500 689,068PT Semen Gresik (Persero) Tbk 391,500 404,691PT Telekomunikasi Indonesia Tbk 913,500 862,611PT United Tractors Tbk 130,500 293,856
4,851,861
IRELAND — 0.26%Anglo Irish Bank Corp. Ltd.b 64,486 8CRH PLC 44,491 929,145Elan Corp. PLCa 36,975 173,416Kerry Group PLC Class A 20,271 644,381
1,746,950
ISRAEL — 0.57%Delek Group Ltd. (The) 2,610 607,608Discount Investment Corp. Ltd. 23,403 447,570Elbit Systems Ltd. 12,876 712,855Israel Discount Bank Ltd. Class Aa 217,935 398,918Teva Pharmaceutical
Industries Ltd. 34,800 1,690,0623,857,013
Security Shares Value
ITALY — 1.79%Assicurazioni Generali SpA 66,297 $ 1,335,307Banco Popolare SpA 30,450 194,186Enel SpA 200,038 981,846Eni SpA 143,898 2,941,409Exor SpA 22,460 448,277Fiat SpA 53,700 687,710Intesa Sanpaolo SpA 401,005 1,326,970Luxottica Group SpA 10,354 269,244Mediobanca SpAa 58,820 528,752Mediolanum SpA 68,382 301,563Saipem SpA 12,615 453,601Telecom Italia SpA 540,771 688,665Tenaris SA 18,225 363,988UniCredit SpA 504,039 1,411,823Unione di Banche Italiane ScpA 17,661 189,477
12,122,818
JAPAN — 15.29%77 Bank Ltd. (The) 174,000 921,602Advantest Corp. 8,700 187,432AEON Co. Ltd. 34,800 371,452AEON Credit Service Co. Ltd. 8,700 87,040Aisin Seiki Co. Ltd. 17,400 484,895All Nippon Airways Co. Ltd.a 87,000 294,150Amada Co. Ltd. 87,000 567,217Asahi Breweries Ltd. 34,800 614,803Asahi Glass Co. Ltd. 87,000 883,453Asahi Kasei Corp. 87,000 453,773Astellas Pharma Inc. 26,100 882,750Bridgestone Corp. 43,500 776,535Canon Inc. 34,800 1,511,909Canon Marketing Japan Inc. 26,100 353,281Casio Computer Co. Ltd. 46,100 331,414Chubu Electric Power Co. Inc. 17,400 430,081Chugai Pharmaceutical Co. Ltd. 34,800 607,173Citizen Holdings Co. Ltd. 43,500 261,020Coca-Cola West Co. Ltd. 26,100 471,944Cosmo Oil Co. Ltd. 174,000 413,616Credit Saison Co. Ltd. 17,400 220,461Daido Steel Co. Ltd. 87,000 414,620Dai-ichi Life Insurance Co.
Ltd. (The) 348 492,324
S c h e d u l e s o f I n v e st m e n t s 67
Schedule of Investments (Continued)
iSHARES» MSCI ACWI EX US INDEX FUNDJuly 31, 2010
For
per
sona
l use
onl
y
%%TRANSMSG*** Transmitting Job: B82515 PCN: 069000000 ***%%PCMSG|67 |00008|Yes|No|09/16/2010 20:08|0|0|Page is valid, no graphics -- Color: N|
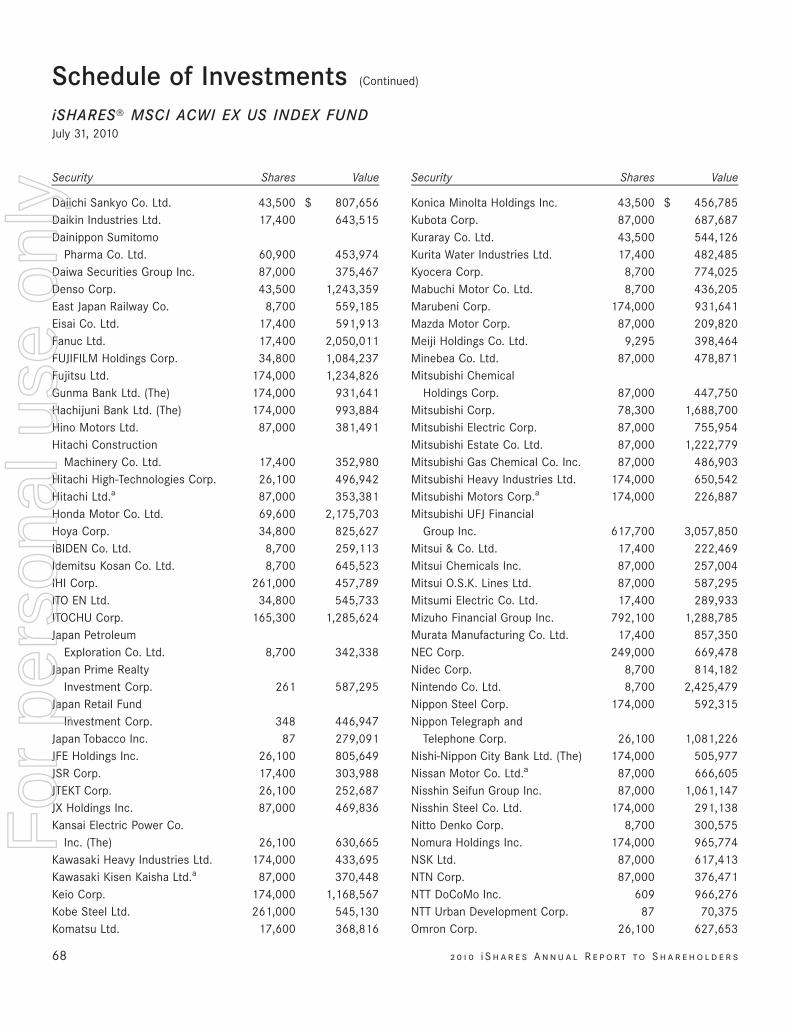
Security Shares Value
Daiichi Sankyo Co. Ltd. 43,500 $ 807,656Daikin Industries Ltd. 17,400 643,515Dainippon Sumitomo
Pharma Co. Ltd. 60,900 453,974Daiwa Securities Group Inc. 87,000 375,467Denso Corp. 43,500 1,243,359East Japan Railway Co. 8,700 559,185Eisai Co. Ltd. 17,400 591,913Fanuc Ltd. 17,400 2,050,011FUJIFILM Holdings Corp. 34,800 1,084,237Fujitsu Ltd. 174,000 1,234,826Gunma Bank Ltd. (The) 174,000 931,641Hachijuni Bank Ltd. (The) 174,000 993,884Hino Motors Ltd. 87,000 381,491Hitachi Construction
Machinery Co. Ltd. 17,400 352,980Hitachi High-Technologies Corp. 26,100 496,942Hitachi Ltd.a 87,000 353,381Honda Motor Co. Ltd. 69,600 2,175,703Hoya Corp. 34,800 825,627IBIDEN Co. Ltd. 8,700 259,113Idemitsu Kosan Co. Ltd. 8,700 645,523IHI Corp. 261,000 457,789ITO EN Ltd. 34,800 545,733ITOCHU Corp. 165,300 1,285,624Japan Petroleum
Exploration Co. Ltd. 8,700 342,338Japan Prime Realty
Investment Corp. 261 587,295Japan Retail Fund
Investment Corp. 348 446,947Japan Tobacco Inc. 87 279,091JFE Holdings Inc. 26,100 805,649JSR Corp. 17,400 303,988JTEKT Corp. 26,100 252,687JX Holdings Inc. 87,000 469,836Kansai Electric Power Co.
Inc. (The) 26,100 630,665Kawasaki Heavy Industries Ltd. 174,000 433,695Kawasaki Kisen Kaisha Ltd.a 87,000 370,448Keio Corp. 174,000 1,168,567Kobe Steel Ltd. 261,000 545,130Komatsu Ltd. 17,600 368,816
Security Shares Value
Konica Minolta Holdings Inc. 43,500 $ 456,785Kubota Corp. 87,000 687,687Kuraray Co. Ltd. 43,500 544,126Kurita Water Industries Ltd. 17,400 482,485Kyocera Corp. 8,700 774,025Mabuchi Motor Co. Ltd. 8,700 436,205Marubeni Corp. 174,000 931,641Mazda Motor Corp. 87,000 209,820Meiji Holdings Co. Ltd. 9,295 398,464Minebea Co. Ltd. 87,000 478,871Mitsubishi Chemical
Holdings Corp. 87,000 447,750Mitsubishi Corp. 78,300 1,688,700Mitsubishi Electric Corp. 87,000 755,954Mitsubishi Estate Co. Ltd. 87,000 1,222,779Mitsubishi Gas Chemical Co. Inc. 87,000 486,903Mitsubishi Heavy Industries Ltd. 174,000 650,542Mitsubishi Motors Corp.a 174,000 226,887Mitsubishi UFJ Financial
Group Inc. 617,700 3,057,850Mitsui & Co. Ltd. 17,400 222,469Mitsui Chemicals Inc. 87,000 257,004Mitsui O.S.K. Lines Ltd. 87,000 587,295Mitsumi Electric Co. Ltd. 17,400 289,933Mizuho Financial Group Inc. 792,100 1,288,785Murata Manufacturing Co. Ltd. 17,400 857,350NEC Corp. 249,000 669,478Nidec Corp. 8,700 814,182Nintendo Co. Ltd. 8,700 2,425,479Nippon Steel Corp. 174,000 592,315Nippon Telegraph and
Telephone Corp. 26,100 1,081,226Nishi-Nippon City Bank Ltd. (The) 174,000 505,977Nissan Motor Co. Ltd.a 87,000 666,605Nisshin Seifun Group Inc. 87,000 1,061,147Nisshin Steel Co. Ltd. 174,000 291,138Nitto Denko Corp. 8,700 300,575Nomura Holdings Inc. 174,000 965,774NSK Ltd. 87,000 617,413NTN Corp. 87,000 376,471NTT DoCoMo Inc. 609 966,276NTT Urban Development Corp. 87 70,375Omron Corp. 26,100 627,653
68 2 0 1 0 i S h a r e s A n n u a l R e p o r t to S h a r e h o l d e r s
Schedule of Investments (Continued)
iSHARES» MSCI ACWI EX US INDEX FUNDJuly 31, 2010
For
per
sona
l use
onl
y
%%TRANSMSG*** Transmitting Job: B82515 PCN: 070000000 ***%%PCMSG|68 |00008|Yes|No|09/16/2010 20:08|0|0|Page is valid, no graphics -- Color: N|
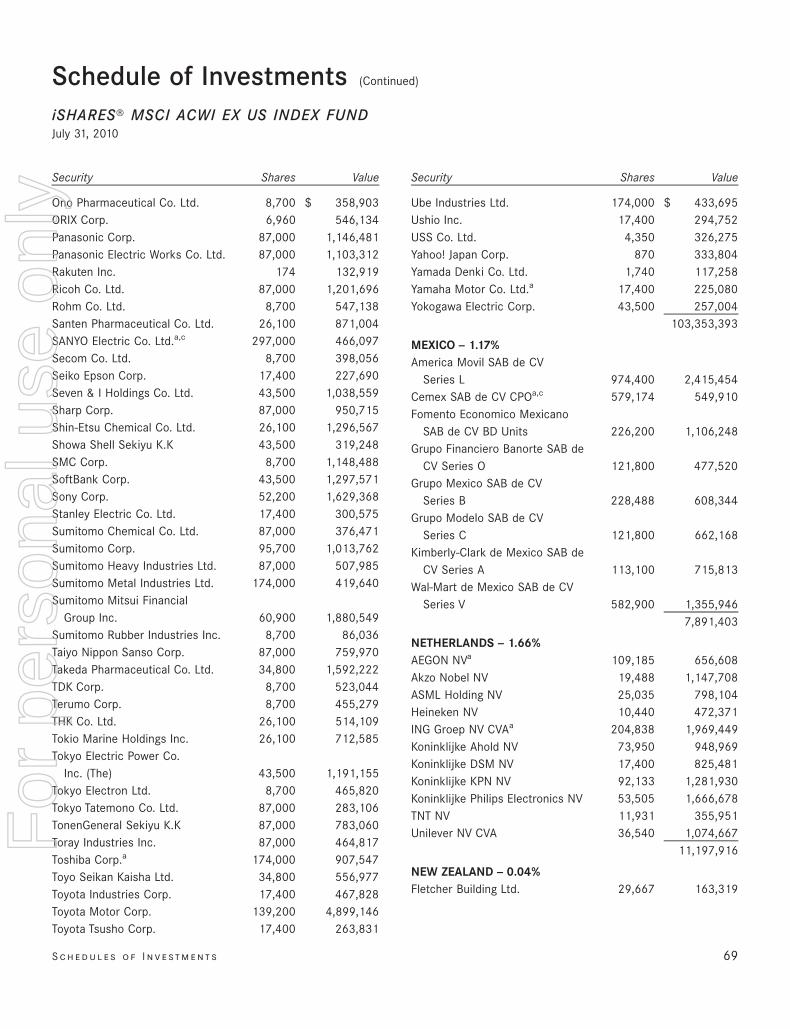
Security Shares Value
Ono Pharmaceutical Co. Ltd. 8,700 $ 358,903ORIX Corp. 6,960 546,134Panasonic Corp. 87,000 1,146,481Panasonic Electric Works Co. Ltd. 87,000 1,103,312Rakuten Inc. 174 132,919Ricoh Co. Ltd. 87,000 1,201,696Rohm Co. Ltd. 8,700 547,138Santen Pharmaceutical Co. Ltd. 26,100 871,004SANYO Electric Co. Ltd.a,c 297,000 466,097Secom Co. Ltd. 8,700 398,056Seiko Epson Corp. 17,400 227,690Seven & I Holdings Co. Ltd. 43,500 1,038,559Sharp Corp. 87,000 950,715Shin-Etsu Chemical Co. Ltd. 26,100 1,296,567Showa Shell Sekiyu K.K 43,500 319,248SMC Corp. 8,700 1,148,488SoftBank Corp. 43,500 1,297,571Sony Corp. 52,200 1,629,368Stanley Electric Co. Ltd. 17,400 300,575Sumitomo Chemical Co. Ltd. 87,000 376,471Sumitomo Corp. 95,700 1,013,762Sumitomo Heavy Industries Ltd. 87,000 507,985Sumitomo Metal Industries Ltd. 174,000 419,640Sumitomo Mitsui Financial
Group Inc. 60,900 1,880,549Sumitomo Rubber Industries Inc. 8,700 86,036Taiyo Nippon Sanso Corp. 87,000 759,970Takeda Pharmaceutical Co. Ltd. 34,800 1,592,222TDK Corp. 8,700 523,044Terumo Corp. 8,700 455,279THK Co. Ltd. 26,100 514,109Tokio Marine Holdings Inc. 26,100 712,585Tokyo Electric Power Co.
Inc. (The) 43,500 1,191,155Tokyo Electron Ltd. 8,700 465,820Tokyo Tatemono Co. Ltd. 87,000 283,106TonenGeneral Sekiyu K.K 87,000 783,060Toray Industries Inc. 87,000 464,817Toshiba Corp.a 174,000 907,547Toyo Seikan Kaisha Ltd. 34,800 556,977Toyota Industries Corp. 17,400 467,828Toyota Motor Corp. 139,200 4,899,146Toyota Tsusho Corp. 17,400 263,831
Security Shares Value
Ube Industries Ltd. 174,000 $ 433,695Ushio Inc. 17,400 294,752USS Co. Ltd. 4,350 326,275Yahoo! Japan Corp. 870 333,804Yamada Denki Co. Ltd. 1,740 117,258Yamaha Motor Co. Ltd.a 17,400 225,080Yokogawa Electric Corp. 43,500 257,004
103,353,393
MEXICO — 1.17%America Movil SAB de CV
Series L 974,400 2,415,454Cemex SAB de CV CPOa,c 579,174 549,910Fomento Economico Mexicano
SAB de CV BD Units 226,200 1,106,248Grupo Financiero Banorte SAB de
CV Series O 121,800 477,520Grupo Mexico SAB de CV
Series B 228,488 608,344Grupo Modelo SAB de CV
Series C 121,800 662,168Kimberly-Clark de Mexico SAB de
CV Series A 113,100 715,813Wal-Mart de Mexico SAB de CV
Series V 582,900 1,355,9467,891,403
NETHERLANDS — 1.66%AEGON NVa 109,185 656,608Akzo Nobel NV 19,488 1,147,708ASML Holding NV 25,035 798,104Heineken NV 10,440 472,371ING Groep NV CVAa 204,838 1,969,449Koninklijke Ahold NV 73,950 948,969Koninklijke DSM NV 17,400 825,481Koninklijke KPN NV 92,133 1,281,930Koninklijke Philips Electronics NV 53,505 1,666,678TNT NV 11,931 355,951Unilever NV CVA 36,540 1,074,667
11,197,916
NEW ZEALAND — 0.04%Fletcher Building Ltd. 29,667 163,319
S c h e d u l e s o f I n v e st m e n t s 69
Schedule of Investments (Continued)
iSHARES» MSCI ACWI EX US INDEX FUNDJuly 31, 2010
For
per
sona
l use
onl
y
%%TRANSMSG*** Transmitting Job: B82515 PCN: 071000000 ***%%PCMSG|69 |00008|Yes|No|09/16/2010 20:08|0|0|Page is valid, no graphics -- Color: N|
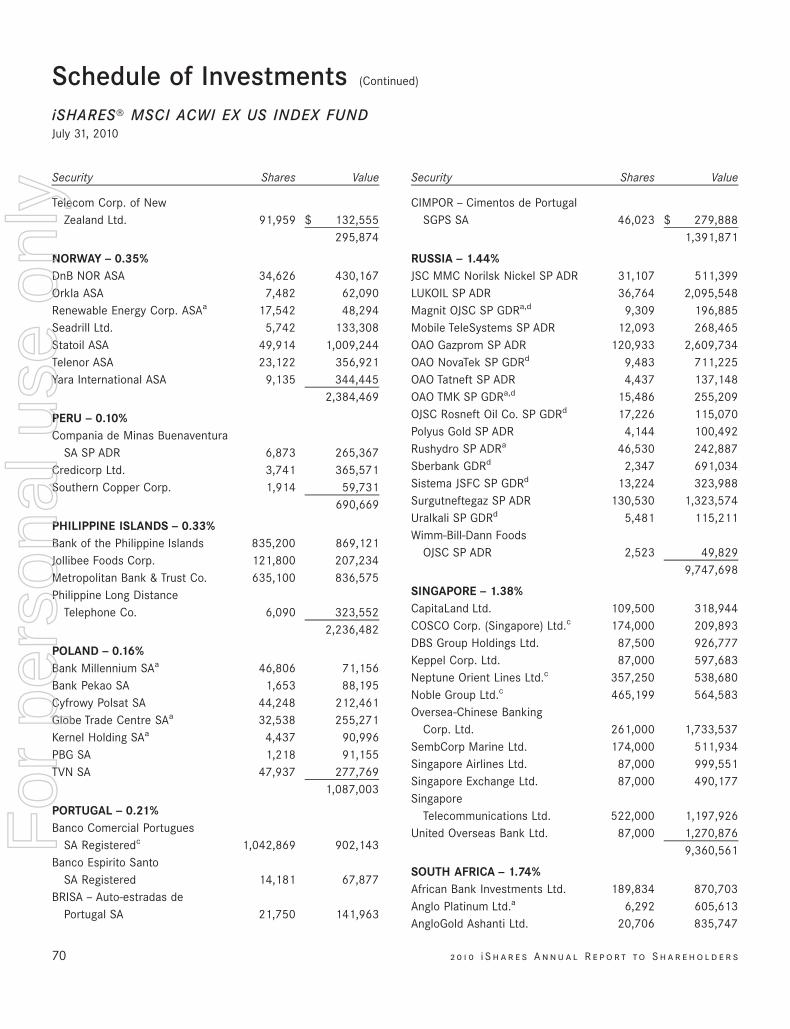
Security Shares Value
Telecom Corp. of NewZealand Ltd. 91,959 $ 132,555
295,874
NORWAY — 0.35%DnB NOR ASA 34,626 430,167Orkla ASA 7,482 62,090Renewable Energy Corp. ASAa 17,542 48,294Seadrill Ltd. 5,742 133,308Statoil ASA 49,914 1,009,244Telenor ASA 23,122 356,921Yara International ASA 9,135 344,445
2,384,469
PERU — 0.10%Compania de Minas Buenaventura
SA SP ADR 6,873 265,367Credicorp Ltd. 3,741 365,571Southern Copper Corp. 1,914 59,731
690,669
PHILIPPINE ISLANDS — 0.33%Bank of the Philippine Islands 835,200 869,121Jollibee Foods Corp. 121,800 207,234Metropolitan Bank & Trust Co. 635,100 836,575Philippine Long Distance
Telephone Co. 6,090 323,5522,236,482
POLAND — 0.16%Bank Millennium SAa 46,806 71,156Bank Pekao SA 1,653 88,195Cyfrowy Polsat SA 44,248 212,461Globe Trade Centre SAa 32,538 255,271Kernel Holding SAa 4,437 90,996PBG SA 1,218 91,155TVN SA 47,937 277,769
1,087,003
PORTUGAL — 0.21%Banco Comercial Portugues
SA Registeredc 1,042,869 902,143Banco Espirito Santo
SA Registered 14,181 67,877BRISA — Auto-estradas de
Portugal SA 21,750 141,963
Security Shares Value
CIMPOR — Cimentos de PortugalSGPS SA 46,023 $ 279,888
1,391,871
RUSSIA — 1.44%JSC MMC Norilsk Nickel SP ADR 31,107 511,399LUKOIL SP ADR 36,764 2,095,548Magnit OJSC SP GDRa,d 9,309 196,885Mobile TeleSystems SP ADR 12,093 268,465OAO Gazprom SP ADR 120,933 2,609,734OAO NovaTek SP GDRd 9,483 711,225OAO Tatneft SP ADR 4,437 137,148OAO TMK SP GDRa,d 15,486 255,209OJSC Rosneft Oil Co. SP GDRd 17,226 115,070Polyus Gold SP ADR 4,144 100,492Rushydro SP ADRa 46,530 242,887Sberbank GDRd 2,347 691,034Sistema JSFC SP GDRd 13,224 323,988Surgutneftegaz SP ADR 130,530 1,323,574Uralkali SP GDRd 5,481 115,211Wimm-Bill-Dann Foods
OJSC SP ADR 2,523 49,8299,747,698
SINGAPORE — 1.38%CapitaLand Ltd. 109,500 318,944COSCO Corp. (Singapore) Ltd.c 174,000 209,893DBS Group Holdings Ltd. 87,500 926,777Keppel Corp. Ltd. 87,000 597,683Neptune Orient Lines Ltd.c 357,250 538,680Noble Group Ltd.c 465,199 564,583Oversea-Chinese Banking
Corp. Ltd. 261,000 1,733,537SembCorp Marine Ltd. 174,000 511,934Singapore Airlines Ltd. 87,000 999,551Singapore Exchange Ltd. 87,000 490,177Singapore
Telecommunications Ltd. 522,000 1,197,926United Overseas Bank Ltd. 87,000 1,270,876
9,360,561
SOUTH AFRICA — 1.74%African Bank Investments Ltd. 189,834 870,703Anglo Platinum Ltd.a 6,292 605,613AngloGold Ashanti Ltd. 20,706 835,747
70 2 0 1 0 i S h a r e s A n n u a l R e p o r t to S h a r e h o l d e r s
Schedule of Investments (Continued)
iSHARES» MSCI ACWI EX US INDEX FUNDJuly 31, 2010
For
per
sona
l use
onl
y
%%TRANSMSG*** Transmitting Job: B82515 PCN: 072000000 ***%%PCMSG|70 |00008|Yes|No|09/16/2010 20:08|0|0|Page is valid, no graphics -- Color: N|
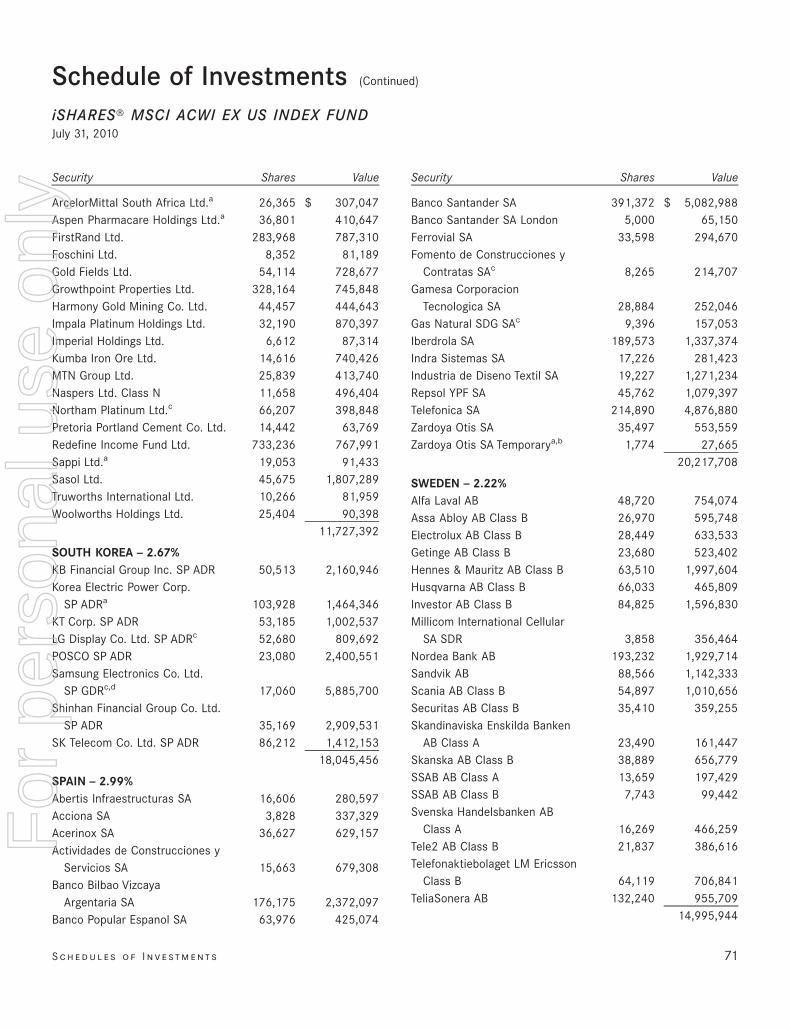
Security Shares Value
ArcelorMittal South Africa Ltd.a 26,365 $ 307,047Aspen Pharmacare Holdings Ltd.a 36,801 410,647FirstRand Ltd. 283,968 787,310Foschini Ltd. 8,352 81,189Gold Fields Ltd. 54,114 728,677Growthpoint Properties Ltd. 328,164 745,848Harmony Gold Mining Co. Ltd. 44,457 444,643Impala Platinum Holdings Ltd. 32,190 870,397Imperial Holdings Ltd. 6,612 87,314Kumba Iron Ore Ltd. 14,616 740,426MTN Group Ltd. 25,839 413,740Naspers Ltd. Class N 11,658 496,404Northam Platinum Ltd.c 66,207 398,848Pretoria Portland Cement Co. Ltd. 14,442 63,769Redefine Income Fund Ltd. 733,236 767,991Sappi Ltd.a 19,053 91,433Sasol Ltd. 45,675 1,807,289Truworths International Ltd. 10,266 81,959Woolworths Holdings Ltd. 25,404 90,398
11,727,392
SOUTH KOREA — 2.67%KB Financial Group Inc. SP ADR 50,513 2,160,946Korea Electric Power Corp.
SP ADRa 103,928 1,464,346KT Corp. SP ADR 53,185 1,002,537LG Display Co. Ltd. SP ADRc 52,680 809,692POSCO SP ADR 23,080 2,400,551Samsung Electronics Co. Ltd.
SP GDRc,d 17,060 5,885,700Shinhan Financial Group Co. Ltd.
SP ADR 35,169 2,909,531SK Telecom Co. Ltd. SP ADR 86,212 1,412,153
18,045,456
SPAIN — 2.99%Abertis Infraestructuras SA 16,606 280,597Acciona SA 3,828 337,329Acerinox SA 36,627 629,157Actividades de Construcciones y
Servicios SA 15,663 679,308Banco Bilbao Vizcaya
Argentaria SA 176,175 2,372,097Banco Popular Espanol SA 63,976 425,074
Security Shares Value
Banco Santander SA 391,372 $ 5,082,988Banco Santander SA London 5,000 65,150Ferrovial SA 33,598 294,670Fomento de Construcciones y
Contratas SAc 8,265 214,707Gamesa Corporacion
Tecnologica SA 28,884 252,046Gas Natural SDG SAc 9,396 157,053Iberdrola SA 189,573 1,337,374Indra Sistemas SA 17,226 281,423Industria de Diseno Textil SA 19,227 1,271,234Repsol YPF SA 45,762 1,079,397Telefonica SA 214,890 4,876,880Zardoya Otis SA 35,497 553,559Zardoya Otis SA Temporarya,b 1,774 27,665
20,217,708
SWEDEN — 2.22%Alfa Laval AB 48,720 754,074Assa Abloy AB Class B 26,970 595,748Electrolux AB Class B 28,449 633,533Getinge AB Class B 23,680 523,402Hennes & Mauritz AB Class B 63,510 1,997,604Husqvarna AB Class B 66,033 465,809Investor AB Class B 84,825 1,596,830Millicom International Cellular
SA SDR 3,858 356,464Nordea Bank AB 193,232 1,929,714Sandvik AB 88,566 1,142,333Scania AB Class B 54,897 1,010,656Securitas AB Class B 35,410 359,255Skandinaviska Enskilda Banken
AB Class A 23,490 161,447Skanska AB Class B 38,889 656,779SSAB AB Class A 13,659 197,429SSAB AB Class B 7,743 99,442Svenska Handelsbanken AB
Class A 16,269 466,259Tele2 AB Class B 21,837 386,616Telefonaktiebolaget LM Ericsson
Class B 64,119 706,841TeliaSonera AB 132,240 955,709
14,995,944
S c h e d u l e s o f I n v e st m e n t s 71
Schedule of Investments (Continued)
iSHARES» MSCI ACWI EX US INDEX FUNDJuly 31, 2010
For
per
sona
l use
onl
y
%%TRANSMSG*** Transmitting Job: B82515 PCN: 073000000 ***%%PCMSG|71 |00008|Yes|No|09/16/2010 20:08|0|0|Page is valid, no graphics -- Color: N|
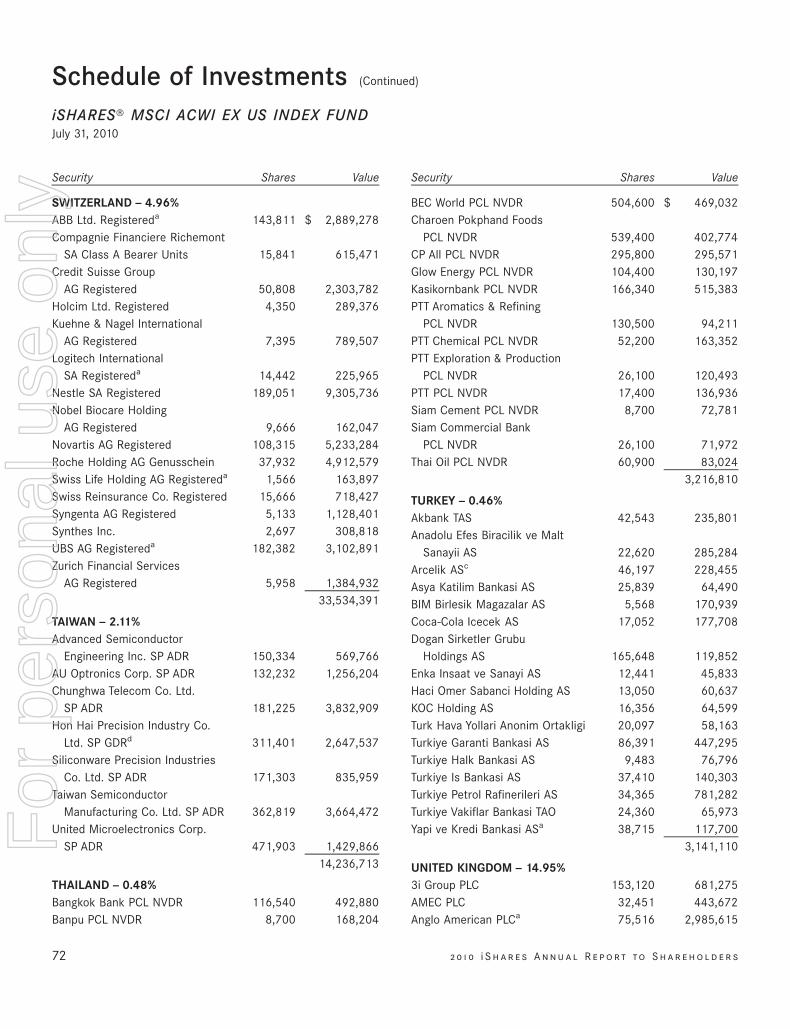
Security Shares Value
SWITZERLAND — 4.96%ABB Ltd. Registereda 143,811 $ 2,889,278Compagnie Financiere Richemont
SA Class A Bearer Units 15,841 615,471Credit Suisse Group
AG Registered 50,808 2,303,782Holcim Ltd. Registered 4,350 289,376Kuehne & Nagel International
AG Registered 7,395 789,507Logitech International
SA Registereda 14,442 225,965Nestle SA Registered 189,051 9,305,736Nobel Biocare Holding
AG Registered 9,666 162,047Novartis AG Registered 108,315 5,233,284Roche Holding AG Genusschein 37,932 4,912,579Swiss Life Holding AG Registereda 1,566 163,897Swiss Reinsurance Co. Registered 15,666 718,427Syngenta AG Registered 5,133 1,128,401Synthes Inc. 2,697 308,818UBS AG Registereda 182,382 3,102,891Zurich Financial Services
AG Registered 5,958 1,384,93233,534,391
TAIWAN — 2.11%Advanced Semiconductor
Engineering Inc. SP ADR 150,334 569,766AU Optronics Corp. SP ADR 132,232 1,256,204Chunghwa Telecom Co. Ltd.
SP ADR 181,225 3,832,909Hon Hai Precision Industry Co.
Ltd. SP GDRd 311,401 2,647,537Siliconware Precision Industries
Co. Ltd. SP ADR 171,303 835,959Taiwan Semiconductor
Manufacturing Co. Ltd. SP ADR 362,819 3,664,472United Microelectronics Corp.
SP ADR 471,903 1,429,86614,236,713
THAILAND — 0.48%Bangkok Bank PCL NVDR 116,540 492,880Banpu PCL NVDR 8,700 168,204
Security Shares Value
BEC World PCL NVDR 504,600 $ 469,032Charoen Pokphand Foods
PCL NVDR 539,400 402,774CP All PCL NVDR 295,800 295,571Glow Energy PCL NVDR 104,400 130,197Kasikornbank PCL NVDR 166,340 515,383PTT Aromatics & Refining
PCL NVDR 130,500 94,211PTT Chemical PCL NVDR 52,200 163,352PTT Exploration & Production
PCL NVDR 26,100 120,493PTT PCL NVDR 17,400 136,936Siam Cement PCL NVDR 8,700 72,781Siam Commercial Bank
PCL NVDR 26,100 71,972Thai Oil PCL NVDR 60,900 83,024
3,216,810
TURKEY — 0.46%Akbank TAS 42,543 235,801Anadolu Efes Biracilik ve Malt
Sanayii AS 22,620 285,284Arcelik ASc 46,197 228,455Asya Katilim Bankasi AS 25,839 64,490BIM Birlesik Magazalar AS 5,568 170,939Coca-Cola Icecek AS 17,052 177,708Dogan Sirketler Grubu
Holdings AS 165,648 119,852Enka Insaat ve Sanayi AS 12,441 45,833Haci Omer Sabanci Holding AS 13,050 60,637KOC Holding AS 16,356 64,599Turk Hava Yollari Anonim Ortakligi 20,097 58,163Turkiye Garanti Bankasi AS 86,391 447,295Turkiye Halk Bankasi AS 9,483 76,796Turkiye Is Bankasi AS 37,410 140,303Turkiye Petrol Rafinerileri AS 34,365 781,282Turkiye Vakiflar Bankasi TAO 24,360 65,973Yapi ve Kredi Bankasi ASa 38,715 117,700
3,141,110
UNITED KINGDOM — 14.95%3i Group PLC 153,120 681,275AMEC PLC 32,451 443,672Anglo American PLCa 75,516 2,985,615
72 2 0 1 0 i S h a r e s A n n u a l R e p o r t to S h a r e h o l d e r s
Schedule of Investments (Continued)
iSHARES» MSCI ACWI EX US INDEX FUNDJuly 31, 2010
For
per
sona
l use
onl
y
%%TRANSMSG*** Transmitting Job: B82515 PCN: 074000000 ***%%PCMSG|72 |00008|Yes|No|09/16/2010 20:08|0|0|Page is valid, no graphics -- Color: N|
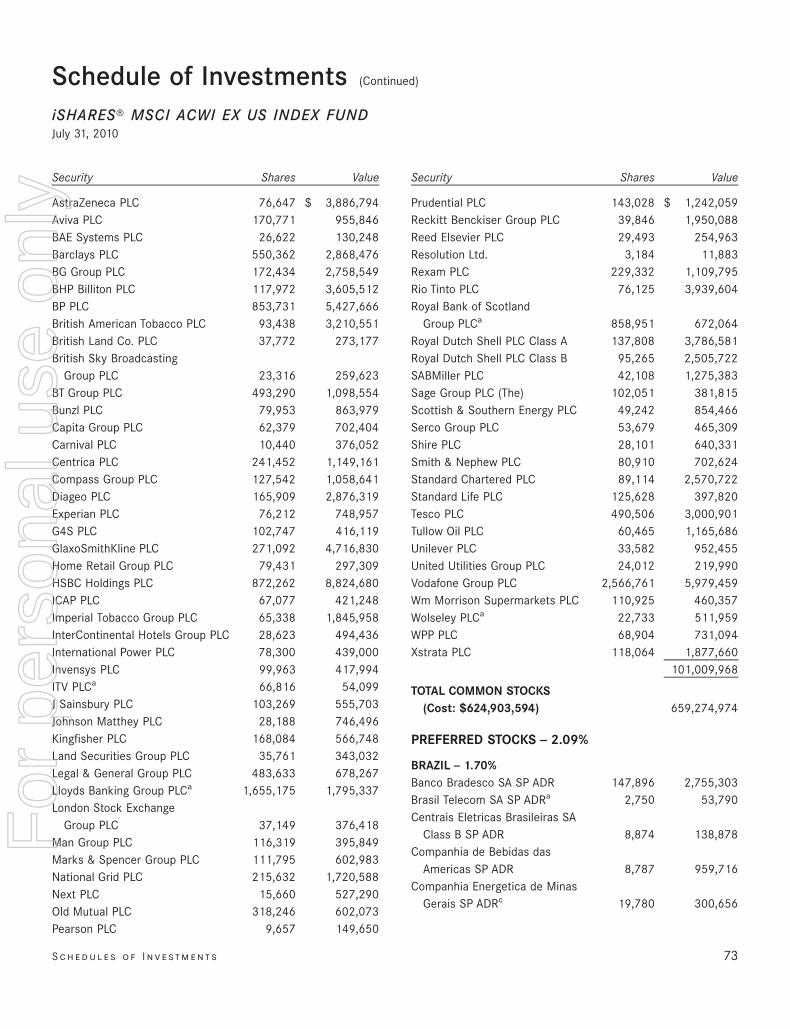
Security Shares Value
AstraZeneca PLC 76,647 $ 3,886,794Aviva PLC 170,771 955,846BAE Systems PLC 26,622 130,248Barclays PLC 550,362 2,868,476BG Group PLC 172,434 2,758,549BHP Billiton PLC 117,972 3,605,512BP PLC 853,731 5,427,666British American Tobacco PLC 93,438 3,210,551British Land Co. PLC 37,772 273,177British Sky Broadcasting
Group PLC 23,316 259,623BT Group PLC 493,290 1,098,554Bunzl PLC 79,953 863,979Capita Group PLC 62,379 702,404Carnival PLC 10,440 376,052Centrica PLC 241,452 1,149,161Compass Group PLC 127,542 1,058,641Diageo PLC 165,909 2,876,319Experian PLC 76,212 748,957G4S PLC 102,747 416,119GlaxoSmithKline PLC 271,092 4,716,830Home Retail Group PLC 79,431 297,309HSBC Holdings PLC 872,262 8,824,680ICAP PLC 67,077 421,248Imperial Tobacco Group PLC 65,338 1,845,958InterContinental Hotels Group PLC 28,623 494,436International Power PLC 78,300 439,000Invensys PLC 99,963 417,994ITV PLCa 66,816 54,099J Sainsbury PLC 103,269 555,703Johnson Matthey PLC 28,188 746,496Kingfisher PLC 168,084 566,748Land Securities Group PLC 35,761 343,032Legal & General Group PLC 483,633 678,267Lloyds Banking Group PLCa 1,655,175 1,795,337London Stock Exchange
Group PLC 37,149 376,418Man Group PLC 116,319 395,849Marks & Spencer Group PLC 111,795 602,983National Grid PLC 215,632 1,720,588Next PLC 15,660 527,290Old Mutual PLC 318,246 602,073Pearson PLC 9,657 149,650
Security Shares Value
Prudential PLC 143,028 $ 1,242,059Reckitt Benckiser Group PLC 39,846 1,950,088Reed Elsevier PLC 29,493 254,963Resolution Ltd. 3,184 11,883Rexam PLC 229,332 1,109,795Rio Tinto PLC 76,125 3,939,604Royal Bank of Scotland
Group PLCa 858,951 672,064Royal Dutch Shell PLC Class A 137,808 3,786,581Royal Dutch Shell PLC Class B 95,265 2,505,722SABMiller PLC 42,108 1,275,383Sage Group PLC (The) 102,051 381,815Scottish & Southern Energy PLC 49,242 854,466Serco Group PLC 53,679 465,309Shire PLC 28,101 640,331Smith & Nephew PLC 80,910 702,624Standard Chartered PLC 89,114 2,570,722Standard Life PLC 125,628 397,820Tesco PLC 490,506 3,000,901Tullow Oil PLC 60,465 1,165,686Unilever PLC 33,582 952,455United Utilities Group PLC 24,012 219,990Vodafone Group PLC 2,566,761 5,979,459Wm Morrison Supermarkets PLC 110,925 460,357Wolseley PLCa 22,733 511,959WPP PLC 68,904 731,094Xstrata PLC 118,064 1,877,660
101,009,968
TOTAL COMMON STOCKS(Cost: $624,903,594) 659,274,974
PREFERRED STOCKS — 2.09%
BRAZIL — 1.70%Banco Bradesco SA SP ADR 147,896 2,755,303Brasil Telecom SA SP ADRa 2,750 53,790Centrais Eletricas Brasileiras SA
Class B SP ADR 8,874 138,878Companhia de Bebidas das
Americas SP ADR 8,787 959,716Companhia Energetica de Minas
Gerais SP ADRc 19,780 300,656
S c h e d u l e s o f I n v e st m e n t s 73
Schedule of Investments (Continued)
iSHARES» MSCI ACWI EX US INDEX FUNDJuly 31, 2010
For
per
sona
l use
onl
y
%%TRANSMSG*** Transmitting Job: B82515 PCN: 075000000 ***%%PCMSG|73 |00009|Yes|No|09/16/2010 20:08|0|0|Page is valid, no graphics -- Color: N|
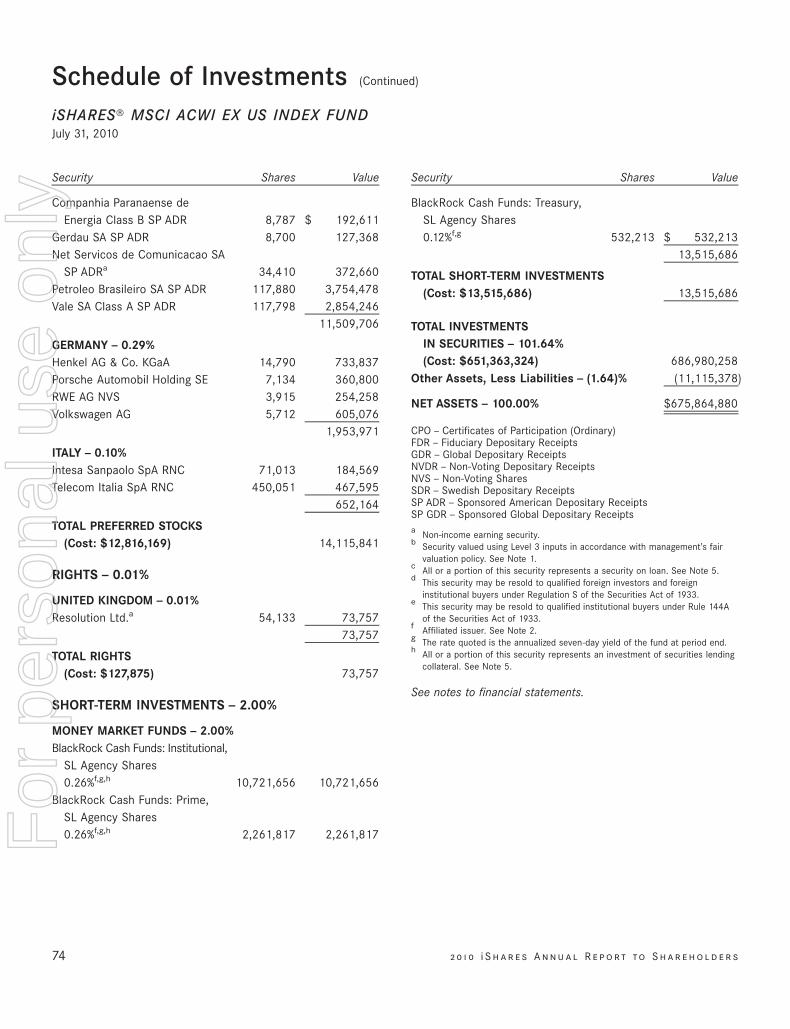
Security Shares Value
Companhia Paranaense deEnergia Class B SP ADR 8,787 $ 192,611
Gerdau SA SP ADR 8,700 127,368Net Servicos de Comunicacao SA
SP ADRa 34,410 372,660Petroleo Brasileiro SA SP ADR 117,880 3,754,478Vale SA Class A SP ADR 117,798 2,854,246
11,509,706
GERMANY — 0.29%Henkel AG & Co. KGaA 14,790 733,837Porsche Automobil Holding SE 7,134 360,800RWE AG NVS 3,915 254,258Volkswagen AG 5,712 605,076
1,953,971
ITALY — 0.10%Intesa Sanpaolo SpA RNC 71,013 184,569Telecom Italia SpA RNC 450,051 467,595
652,164
TOTAL PREFERRED STOCKS(Cost: $12,816,169) 14,115,841
RIGHTS — 0.01%
UNITED KINGDOM — 0.01%Resolution Ltd.a 54,133 73,757
73,757
TOTAL RIGHTS(Cost: $127,875) 73,757
SHORT-TERM INVESTMENTS — 2.00%
MONEY MARKET FUNDS — 2.00%BlackRock Cash Funds: Institutional,
SL Agency Shares0.26%f,g,h 10,721,656 10,721,656
BlackRock Cash Funds: Prime,SL Agency Shares0.26%f,g,h 2,261,817 2,261,817
Security Shares Value
BlackRock Cash Funds: Treasury,SL Agency Shares0.12%f,g 532,213 $ 532,213
13,515,686
TOTAL SHORT-TERM INVESTMENTS(Cost: $13,515,686) 13,515,686
TOTAL INVESTMENTSIN SECURITIES — 101.64%(Cost: $651,363,324) 686,980,258
Other Assets, Less Liabilities — (1.64)% (11,115,378)
NET ASSETS — 100.00% $675,864,880
CPO — Certificates of Participation (Ordinary)FDR — Fiduciary Depositary ReceiptsGDR — Global Depositary ReceiptsNVDR — Non-Voting Depositary ReceiptsNVS — Non-Voting SharesSDR — Swedish Depositary ReceiptsSP ADR — Sponsored American Depositary ReceiptsSP GDR — Sponsored Global Depositary Receiptsa Non-income earning security.b Security valued using Level 3 inputs in accordance with management’s fair
valuation policy. See Note 1.c All or a portion of this security represents a security on loan. See Note 5.d This security may be resold to qualified foreign investors and foreign
institutional buyers under Regulation S of the Securities Act of 1933.e This security may be resold to qualified institutional buyers under Rule 144A
of the Securities Act of 1933.f Affiliated issuer. See Note 2.g The rate quoted is the annualized seven-day yield of the fund at period end.h All or a portion of this security represents an investment of securities lending
collateral. See Note 5.
See notes to financial statements.
74 2 0 1 0 i S h a r e s A n n u a l R e p o r t to S h a r e h o l d e r s
Schedule of Investments (Continued)
iSHARES» MSCI ACWI EX US INDEX FUNDJuly 31, 2010
For
per
sona
l use
onl
y
%%TRANSMSG*** Transmitting Job: B82515 PCN: 076000000 ***%%PCMSG|74 |00008|Yes|No|09/16/2010 20:08|0|0|Page is valid, no graphics -- Color: N|
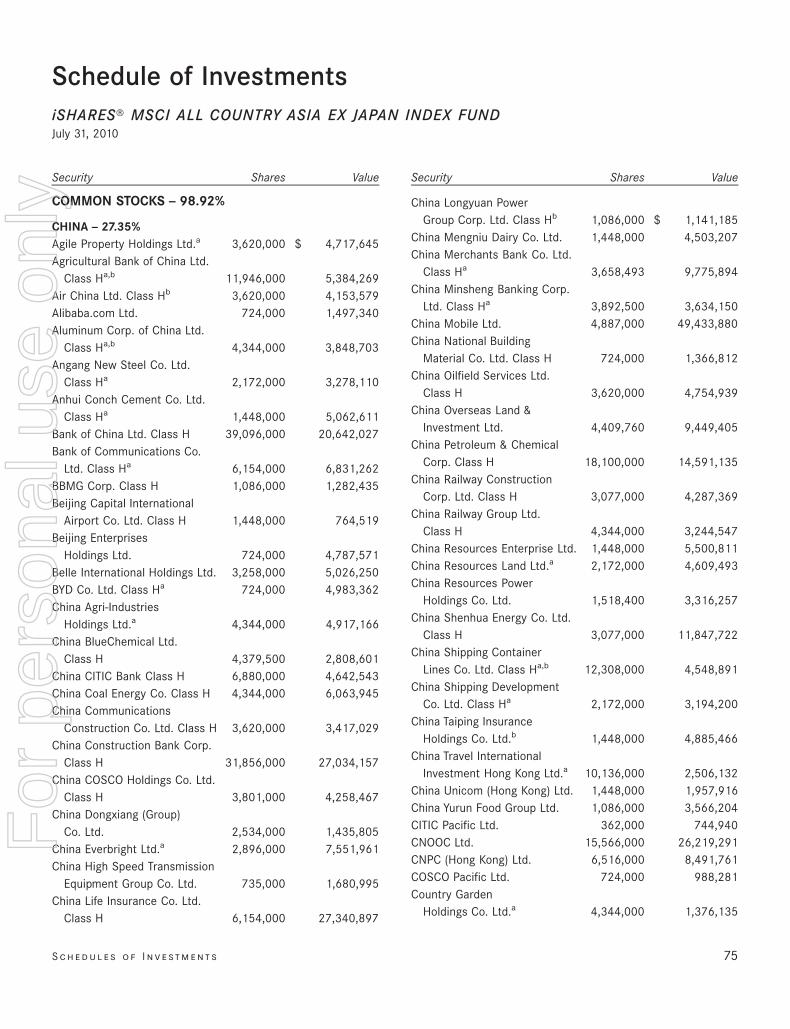
Schedule of InvestmentsiSHARES» MSCI ALL COUNTRY ASIA EX JAPAN INDEX FUNDJuly 31, 2010
Security Shares Value
COMMON STOCKS — 98.92%
CHINA — 27.35%Agile Property Holdings Ltd.a 3,620,000 $ 4,717,645Agricultural Bank of China Ltd.
Class Ha,b 11,946,000 5,384,269Air China Ltd. Class Hb 3,620,000 4,153,579Alibaba.com Ltd. 724,000 1,497,340Aluminum Corp. of China Ltd.
Class Ha,b 4,344,000 3,848,703Angang New Steel Co. Ltd.
Class Ha 2,172,000 3,278,110Anhui Conch Cement Co. Ltd.
Class Ha 1,448,000 5,062,611Bank of China Ltd. Class H 39,096,000 20,642,027Bank of Communications Co.
Ltd. Class Ha 6,154,000 6,831,262BBMG Corp. Class H 1,086,000 1,282,435Beijing Capital International
Airport Co. Ltd. Class H 1,448,000 764,519Beijing Enterprises
Holdings Ltd. 724,000 4,787,571Belle International Holdings Ltd. 3,258,000 5,026,250BYD Co. Ltd. Class Ha 724,000 4,983,362China Agri-Industries
Holdings Ltd.a 4,344,000 4,917,166China BlueChemical Ltd.
Class H 4,379,500 2,808,601China CITIC Bank Class H 6,880,000 4,642,543China Coal Energy Co. Class H 4,344,000 6,063,945China Communications
Construction Co. Ltd. Class H 3,620,000 3,417,029China Construction Bank Corp.
Class H 31,856,000 27,034,157China COSCO Holdings Co. Ltd.
Class H 3,801,000 4,258,467China Dongxiang (Group)
Co. Ltd. 2,534,000 1,435,805China Everbright Ltd.a 2,896,000 7,551,961China High Speed Transmission
Equipment Group Co. Ltd. 735,000 1,680,995China Life Insurance Co. Ltd.
Class H 6,154,000 27,340,897
Security Shares Value
China Longyuan PowerGroup Corp. Ltd. Class Hb 1,086,000 $ 1,141,185
China Mengniu Dairy Co. Ltd. 1,448,000 4,503,207China Merchants Bank Co. Ltd.
Class Ha 3,658,493 9,775,894China Minsheng Banking Corp.
Ltd. Class Ha 3,892,500 3,634,150China Mobile Ltd. 4,887,000 49,433,880China National Building
Material Co. Ltd. Class H 724,000 1,366,812China Oilfield Services Ltd.
Class H 3,620,000 4,754,939China Overseas Land &
Investment Ltd. 4,409,760 9,449,405China Petroleum & Chemical
Corp. Class H 18,100,000 14,591,135China Railway Construction
Corp. Ltd. Class H 3,077,000 4,287,369China Railway Group Ltd.
Class H 4,344,000 3,244,547China Resources Enterprise Ltd. 1,448,000 5,500,811China Resources Land Ltd.a 2,172,000 4,609,493China Resources Power
Holdings Co. Ltd. 1,518,400 3,316,257China Shenhua Energy Co. Ltd.
Class H 3,077,000 11,847,722China Shipping Container
Lines Co. Ltd. Class Ha,b 12,308,000 4,548,891China Shipping Development
Co. Ltd. Class Ha 2,172,000 3,194,200China Taiping Insurance
Holdings Co. Ltd.b 1,448,000 4,885,466China Travel International
Investment Hong Kong Ltd.a 10,136,000 2,506,132China Unicom (Hong Kong) Ltd. 1,448,000 1,957,916China Yurun Food Group Ltd. 1,086,000 3,566,204CITIC Pacific Ltd. 362,000 744,940CNOOC Ltd. 15,566,000 26,219,291CNPC (Hong Kong) Ltd. 6,516,000 8,491,761COSCO Pacific Ltd. 724,000 988,281Country Garden
Holdings Co. Ltd.a 4,344,000 1,376,135
S c h e d u l e s o f I n v e st m e n t s 75
For
per
sona
l use
onl
y
%%TRANSMSG*** Transmitting Job: B82515 PCN: 077000000 ***%%PCMSG|75 |00012|Yes|No|09/16/2010 20:08|0|0|Page is valid, no graphics -- Color: N|
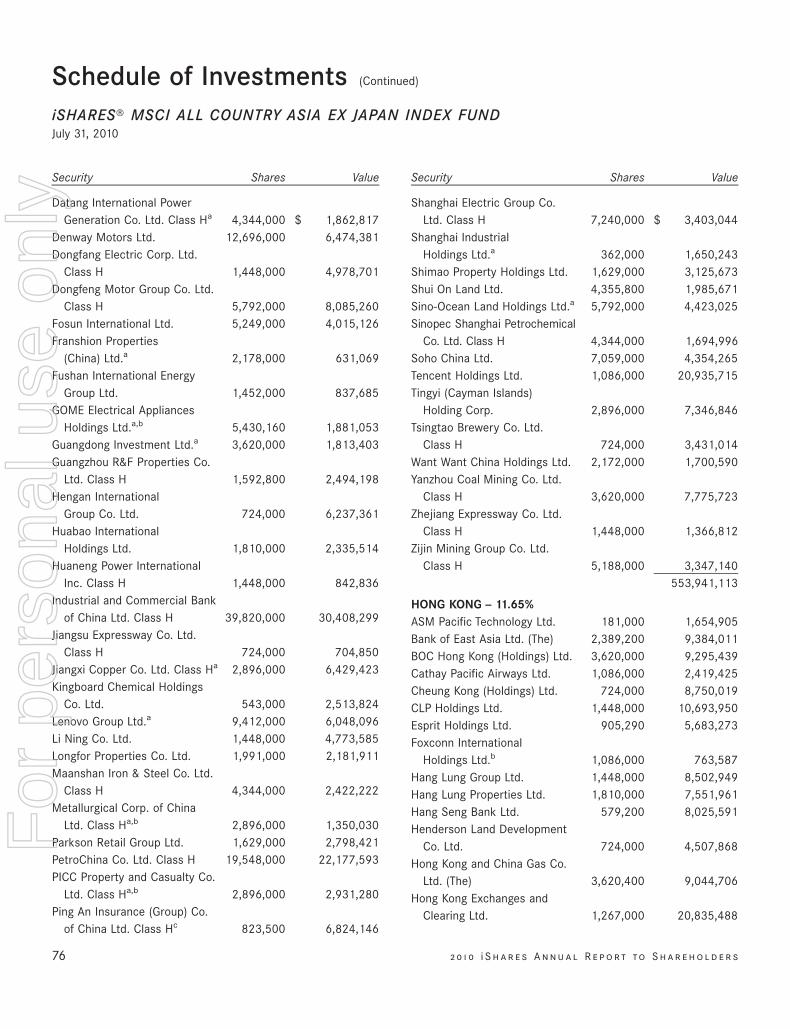
Security Shares Value
Datang International PowerGeneration Co. Ltd. Class Ha 4,344,000 $ 1,862,817
Denway Motors Ltd. 12,696,000 6,474,381Dongfang Electric Corp. Ltd.
Class H 1,448,000 4,978,701Dongfeng Motor Group Co. Ltd.
Class H 5,792,000 8,085,260Fosun International Ltd. 5,249,000 4,015,126Franshion Properties
(China) Ltd.a 2,178,000 631,069Fushan International Energy
Group Ltd. 1,452,000 837,685GOME Electrical Appliances
Holdings Ltd.a,b 5,430,160 1,881,053Guangdong Investment Ltd.a 3,620,000 1,813,403Guangzhou R&F Properties Co.
Ltd. Class H 1,592,800 2,494,198Hengan International
Group Co. Ltd. 724,000 6,237,361Huabao International
Holdings Ltd. 1,810,000 2,335,514Huaneng Power International
Inc. Class H 1,448,000 842,836Industrial and Commercial Bank
of China Ltd. Class H 39,820,000 30,408,299Jiangsu Expressway Co. Ltd.
Class H 724,000 704,850Jiangxi Copper Co. Ltd. Class Ha 2,896,000 6,429,423Kingboard Chemical Holdings
Co. Ltd. 543,000 2,513,824Lenovo Group Ltd.a 9,412,000 6,048,096Li Ning Co. Ltd. 1,448,000 4,773,585Longfor Properties Co. Ltd. 1,991,000 2,181,911Maanshan Iron & Steel Co. Ltd.
Class H 4,344,000 2,422,222Metallurgical Corp. of China
Ltd. Class Ha,b 2,896,000 1,350,030Parkson Retail Group Ltd. 1,629,000 2,798,421PetroChina Co. Ltd. Class H 19,548,000 22,177,593PICC Property and Casualty Co.
Ltd. Class Ha,b 2,896,000 2,931,280Ping An Insurance (Group) Co.
of China Ltd. Class Hc 823,500 6,824,146
Security Shares Value
Shanghai Electric Group Co.Ltd. Class H 7,240,000 $ 3,403,044
Shanghai IndustrialHoldings Ltd.a 362,000 1,650,243
Shimao Property Holdings Ltd. 1,629,000 3,125,673Shui On Land Ltd. 4,355,800 1,985,671Sino-Ocean Land Holdings Ltd.a 5,792,000 4,423,025Sinopec Shanghai Petrochemical
Co. Ltd. Class H 4,344,000 1,694,996Soho China Ltd. 7,059,000 4,354,265Tencent Holdings Ltd. 1,086,000 20,935,715Tingyi (Cayman Islands)
Holding Corp. 2,896,000 7,346,846Tsingtao Brewery Co. Ltd.
Class H 724,000 3,431,014Want Want China Holdings Ltd. 2,172,000 1,700,590Yanzhou Coal Mining Co. Ltd.
Class H 3,620,000 7,775,723Zhejiang Expressway Co. Ltd.
Class H 1,448,000 1,366,812Zijin Mining Group Co. Ltd.
Class H 5,188,000 3,347,140553,941,113
HONG KONG — 11.65%ASM Pacific Technology Ltd. 181,000 1,654,905Bank of East Asia Ltd. (The) 2,389,200 9,384,011BOC Hong Kong (Holdings) Ltd. 3,620,000 9,295,439Cathay Pacific Airways Ltd. 1,086,000 2,419,425Cheung Kong (Holdings) Ltd. 724,000 8,750,019CLP Holdings Ltd. 1,448,000 10,693,950Esprit Holdings Ltd. 905,290 5,683,273Foxconn International
Holdings Ltd.b 1,086,000 763,587Hang Lung Group Ltd. 1,448,000 8,502,949Hang Lung Properties Ltd. 1,810,000 7,551,961Hang Seng Bank Ltd. 579,200 8,025,591Henderson Land Development
Co. Ltd. 724,000 4,507,868Hong Kong and China Gas Co.
Ltd. (The) 3,620,400 9,044,706Hong Kong Exchanges and
Clearing Ltd. 1,267,000 20,835,488
76 2 0 1 0 i S h a r e s A n n u a l R e p o r t to S h a r e h o l d e r s
Schedule of Investments (Continued)
iSHARES» MSCI ALL COUNTRY ASIA EX JAPAN INDEX FUNDJuly 31, 2010
For
per
sona
l use
onl
y
%%TRANSMSG*** Transmitting Job: B82515 PCN: 078000000 ***%%PCMSG|76 |00012|Yes|No|09/16/2010 20:08|0|0|Page is valid, no graphics -- Color: N|
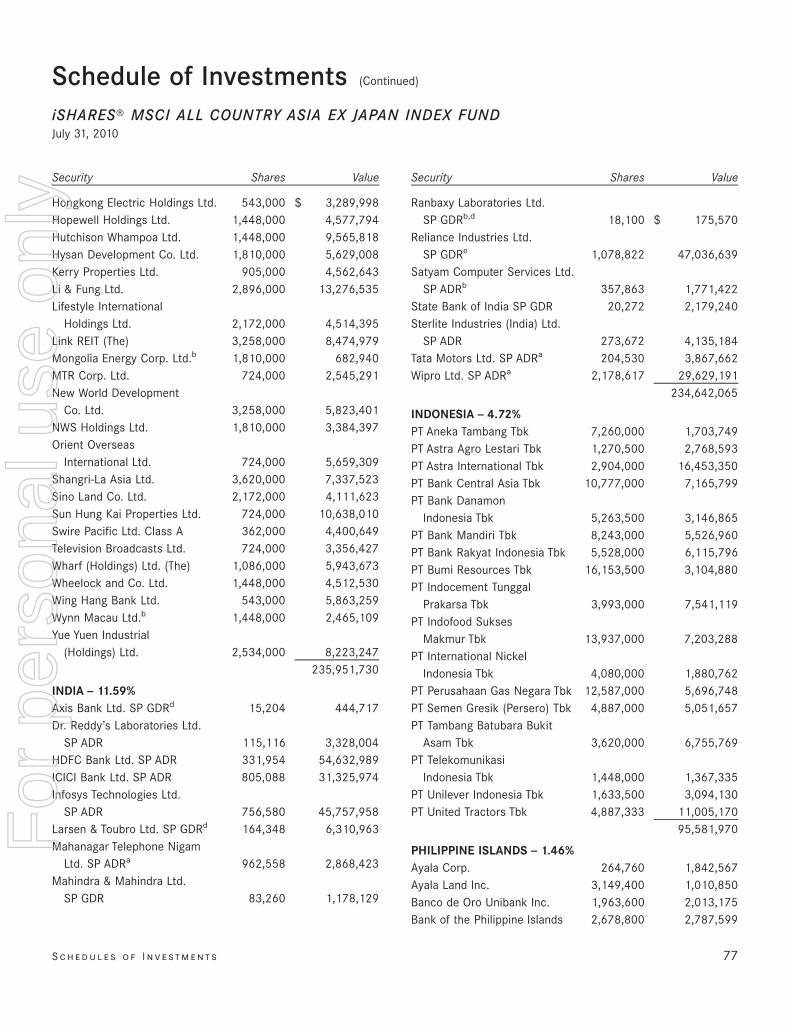
Security Shares Value
Hongkong Electric Holdings Ltd. 543,000 $ 3,289,998Hopewell Holdings Ltd. 1,448,000 4,577,794Hutchison Whampoa Ltd. 1,448,000 9,565,818Hysan Development Co. Ltd. 1,810,000 5,629,008Kerry Properties Ltd. 905,000 4,562,643Li & Fung Ltd. 2,896,000 13,276,535Lifestyle International
Holdings Ltd. 2,172,000 4,514,395Link REIT (The) 3,258,000 8,474,979Mongolia Energy Corp. Ltd.b 1,810,000 682,940MTR Corp. Ltd. 724,000 2,545,291New World Development
Co. Ltd. 3,258,000 5,823,401NWS Holdings Ltd. 1,810,000 3,384,397Orient Overseas
International Ltd. 724,000 5,659,309Shangri-La Asia Ltd. 3,620,000 7,337,523Sino Land Co. Ltd. 2,172,000 4,111,623Sun Hung Kai Properties Ltd. 724,000 10,638,010Swire Pacific Ltd. Class A 362,000 4,400,649Television Broadcasts Ltd. 724,000 3,356,427Wharf (Holdings) Ltd. (The) 1,086,000 5,943,673Wheelock and Co. Ltd. 1,448,000 4,512,530Wing Hang Bank Ltd. 543,000 5,863,259Wynn Macau Ltd.b 1,448,000 2,465,109Yue Yuen Industrial
(Holdings) Ltd. 2,534,000 8,223,247235,951,730
INDIA — 11.59%Axis Bank Ltd. SP GDRd 15,204 444,717Dr. Reddy’s Laboratories Ltd.
SP ADR 115,116 3,328,004HDFC Bank Ltd. SP ADR 331,954 54,632,989ICICI Bank Ltd. SP ADR 805,088 31,325,974Infosys Technologies Ltd.
SP ADR 756,580 45,757,958Larsen & Toubro Ltd. SP GDRd 164,348 6,310,963Mahanagar Telephone Nigam
Ltd. SP ADRa 962,558 2,868,423Mahindra & Mahindra Ltd.
SP GDR 83,260 1,178,129
Security Shares Value
Ranbaxy Laboratories Ltd.SP GDRb,d 18,100 $ 175,570
Reliance Industries Ltd.SP GDRe 1,078,822 47,036,639
Satyam Computer Services Ltd.SP ADRb 357,863 1,771,422
State Bank of India SP GDR 20,272 2,179,240Sterlite Industries (India) Ltd.
SP ADR 273,672 4,135,184Tata Motors Ltd. SP ADRa 204,530 3,867,662Wipro Ltd. SP ADRa 2,178,617 29,629,191
234,642,065
INDONESIA — 4.72%PT Aneka Tambang Tbk 7,260,000 1,703,749PT Astra Agro Lestari Tbk 1,270,500 2,768,593PT Astra International Tbk 2,904,000 16,453,350PT Bank Central Asia Tbk 10,777,000 7,165,799PT Bank Danamon
Indonesia Tbk 5,263,500 3,146,865PT Bank Mandiri Tbk 8,243,000 5,526,960PT Bank Rakyat Indonesia Tbk 5,528,000 6,115,796PT Bumi Resources Tbk 16,153,500 3,104,880PT Indocement Tunggal
Prakarsa Tbk 3,993,000 7,541,119PT Indofood Sukses
Makmur Tbk 13,937,000 7,203,288PT International Nickel
Indonesia Tbk 4,080,000 1,880,762PT Perusahaan Gas Negara Tbk 12,587,000 5,696,748PT Semen Gresik (Persero) Tbk 4,887,000 5,051,657PT Tambang Batubara Bukit
Asam Tbk 3,620,000 6,755,769PT Telekomunikasi
Indonesia Tbk 1,448,000 1,367,335PT Unilever Indonesia Tbk 1,633,500 3,094,130PT United Tractors Tbk 4,887,333 11,005,170
95,581,970
PHILIPPINE ISLANDS — 1.46%Ayala Corp. 264,760 1,842,567Ayala Land Inc. 3,149,400 1,010,850Banco de Oro Unibank Inc. 1,963,600 2,013,175Bank of the Philippine Islands 2,678,800 2,787,599
S c h e d u l e s o f I n v e st m e n t s 77
Schedule of Investments (Continued)
iSHARES» MSCI ALL COUNTRY ASIA EX JAPAN INDEX FUNDJuly 31, 2010
For
per
sona
l use
onl
y
%%TRANSMSG*** Transmitting Job: B82515 PCN: 079000000 ***%%PCMSG|77 |00006|Yes|No|09/16/2010 20:08|0|0|Page is valid, no graphics -- Color: N|
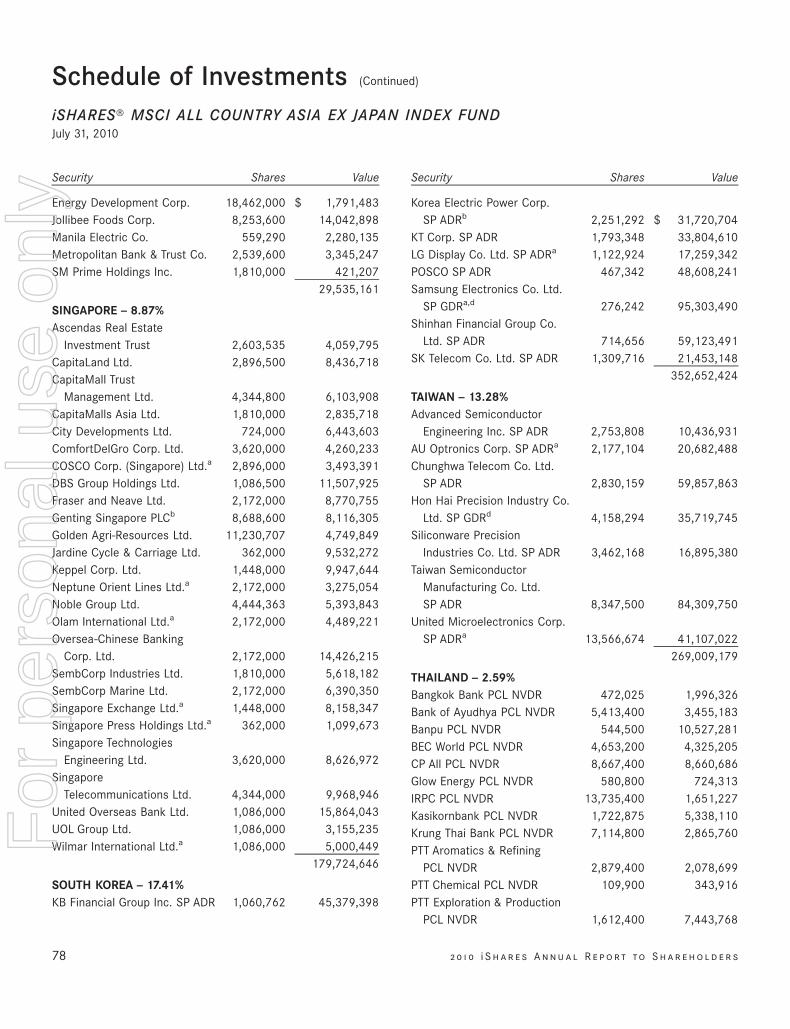
Security Shares Value
Energy Development Corp. 18,462,000 $ 1,791,483Jollibee Foods Corp. 8,253,600 14,042,898Manila Electric Co. 559,290 2,280,135Metropolitan Bank & Trust Co. 2,539,600 3,345,247SM Prime Holdings Inc. 1,810,000 421,207
29,535,161
SINGAPORE — 8.87%Ascendas Real Estate
Investment Trust 2,603,535 4,059,795CapitaLand Ltd. 2,896,500 8,436,718CapitaMall Trust
Management Ltd. 4,344,800 6,103,908CapitaMalls Asia Ltd. 1,810,000 2,835,718City Developments Ltd. 724,000 6,443,603ComfortDelGro Corp. Ltd. 3,620,000 4,260,233COSCO Corp. (Singapore) Ltd.a 2,896,000 3,493,391DBS Group Holdings Ltd. 1,086,500 11,507,925Fraser and Neave Ltd. 2,172,000 8,770,755Genting Singapore PLCb 8,688,600 8,116,305Golden Agri-Resources Ltd. 11,230,707 4,749,849Jardine Cycle & Carriage Ltd. 362,000 9,532,272Keppel Corp. Ltd. 1,448,000 9,947,644Neptune Orient Lines Ltd.a 2,172,000 3,275,054Noble Group Ltd. 4,444,363 5,393,843Olam International Ltd.a 2,172,000 4,489,221Oversea-Chinese Banking
Corp. Ltd. 2,172,000 14,426,215SembCorp Industries Ltd. 1,810,000 5,618,182SembCorp Marine Ltd. 2,172,000 6,390,350Singapore Exchange Ltd.a 1,448,000 8,158,347Singapore Press Holdings Ltd.a 362,000 1,099,673Singapore Technologies
Engineering Ltd. 3,620,000 8,626,972Singapore
Telecommunications Ltd. 4,344,000 9,968,946United Overseas Bank Ltd. 1,086,000 15,864,043UOL Group Ltd. 1,086,000 3,155,235Wilmar International Ltd.a 1,086,000 5,000,449
179,724,646
SOUTH KOREA — 17.41%KB Financial Group Inc. SP ADR 1,060,762 45,379,398
Security Shares Value
Korea Electric Power Corp.SP ADRb 2,251,292 $ 31,720,704
KT Corp. SP ADR 1,793,348 33,804,610LG Display Co. Ltd. SP ADRa 1,122,924 17,259,342POSCO SP ADR 467,342 48,608,241Samsung Electronics Co. Ltd.
SP GDRa,d 276,242 95,303,490Shinhan Financial Group Co.
Ltd. SP ADR 714,656 59,123,491SK Telecom Co. Ltd. SP ADR 1,309,716 21,453,148
352,652,424
TAIWAN — 13.28%Advanced Semiconductor
Engineering Inc. SP ADR 2,753,808 10,436,931AU Optronics Corp. SP ADRa 2,177,104 20,682,488Chunghwa Telecom Co. Ltd.
SP ADR 2,830,159 59,857,863Hon Hai Precision Industry Co.
Ltd. SP GDRd 4,158,294 35,719,745Siliconware Precision
Industries Co. Ltd. SP ADR 3,462,168 16,895,380Taiwan Semiconductor
Manufacturing Co. Ltd.SP ADR 8,347,500 84,309,750
United Microelectronics Corp.SP ADRa 13,566,674 41,107,022
269,009,179
THAILAND — 2.59%Bangkok Bank PCL NVDR 472,025 1,996,326Bank of Ayudhya PCL NVDR 5,413,400 3,455,183Banpu PCL NVDR 544,500 10,527,281BEC World PCL NVDR 4,653,200 4,325,205CP All PCL NVDR 8,667,400 8,660,686Glow Energy PCL NVDR 580,800 724,313IRPC PCL NVDR 13,735,400 1,651,227Kasikornbank PCL NVDR 1,722,875 5,338,110Krung Thai Bank PCL NVDR 7,114,800 2,865,760PTT Aromatics & Refining
PCL NVDR 2,879,400 2,078,699PTT Chemical PCL NVDR 109,900 343,916PTT Exploration & Production
PCL NVDR 1,612,400 7,443,768
78 2 0 1 0 i S h a r e s A n n u a l R e p o r t to S h a r e h o l d e r s
Schedule of Investments (Continued)
iSHARES» MSCI ALL COUNTRY ASIA EX JAPAN INDEX FUNDJuly 31, 2010
For
per
sona
l use
onl
y
%%TRANSMSG*** Transmitting Job: B82515 PCN: 080000000 ***%%PCMSG|78 |00005|Yes|No|09/16/2010 20:08|0|0|Page is valid, no graphics -- Color: N|
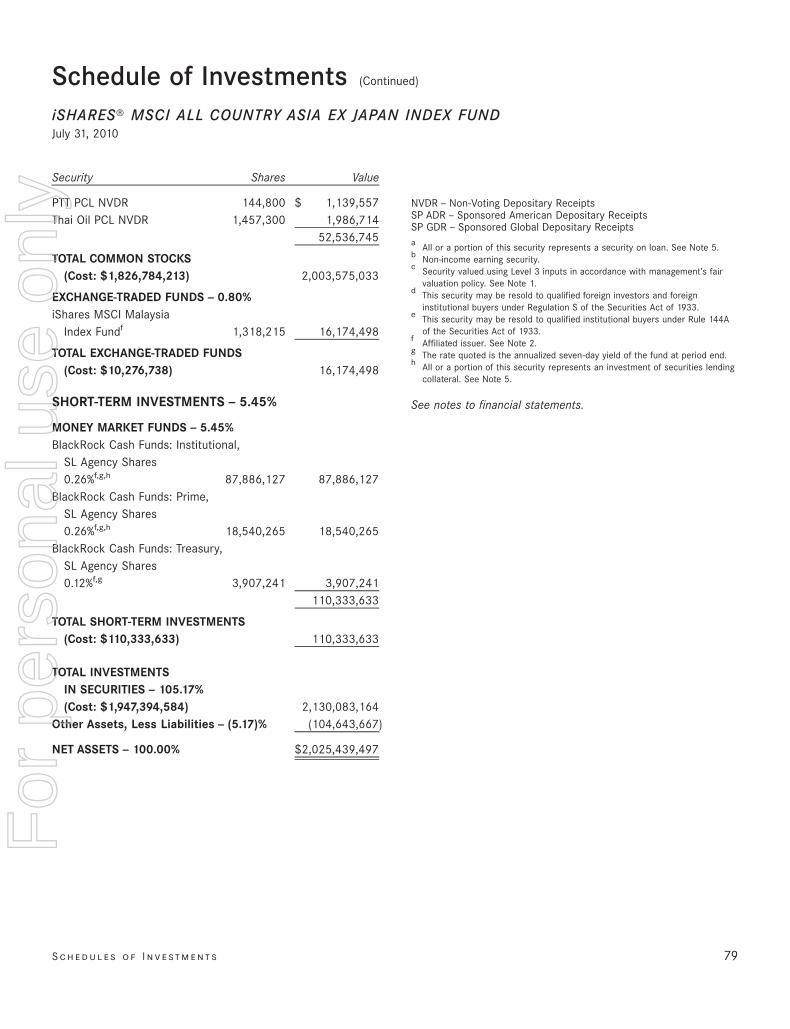
Security Shares Value
PTT PCL NVDR 144,800 $ 1,139,557Thai Oil PCL NVDR 1,457,300 1,986,714
52,536,745
TOTAL COMMON STOCKS(Cost: $1,826,784,213) 2,003,575,033
EXCHANGE-TRADED FUNDS — 0.80%iShares MSCI Malaysia
Index Fundf 1,318,215 16,174,498
TOTAL EXCHANGE-TRADED FUNDS(Cost: $10,276,738) 16,174,498
SHORT-TERM INVESTMENTS — 5.45%
MONEY MARKET FUNDS — 5.45%BlackRock Cash Funds: Institutional,
SL Agency Shares0.26%f,g,h 87,886,127 87,886,127
BlackRock Cash Funds: Prime,SL Agency Shares0.26%f,g,h 18,540,265 18,540,265
BlackRock Cash Funds: Treasury,SL Agency Shares0.12%f,g 3,907,241 3,907,241
110,333,633
TOTAL SHORT-TERM INVESTMENTS(Cost: $110,333,633) 110,333,633
TOTAL INVESTMENTSIN SECURITIES — 105.17%(Cost: $1,947,394,584) 2,130,083,164
Other Assets, Less Liabilities — (5.17)% (104,643,667)
NET ASSETS — 100.00% $2,025,439,497
NVDR — Non-Voting Depositary ReceiptsSP ADR — Sponsored American Depositary ReceiptsSP GDR — Sponsored Global Depositary Receiptsa All or a portion of this security represents a security on loan. See Note 5.b Non-income earning security.c Security valued using Level 3 inputs in accordance with management’s fair
valuation policy. See Note 1.d This security may be resold to qualified foreign investors and foreign
institutional buyers under Regulation S of the Securities Act of 1933.e This security may be resold to qualified institutional buyers under Rule 144A
of the Securities Act of 1933.f Affiliated issuer. See Note 2.g The rate quoted is the annualized seven-day yield of the fund at period end.h All or a portion of this security represents an investment of securities lending
collateral. See Note 5.
See notes to financial statements.
S c h e d u l e s o f I n v e st m e n t s 79
Schedule of Investments (Continued)
iSHARES» MSCI ALL COUNTRY ASIA EX JAPAN INDEX FUNDJuly 31, 2010
For
per
sona
l use
onl
y
%%TRANSMSG*** Transmitting Job: B82515 PCN: 081000000 ***%%PCMSG|79 |00005|Yes|No|09/16/2010 20:08|0|0|Page is valid, no graphics -- Color: N|
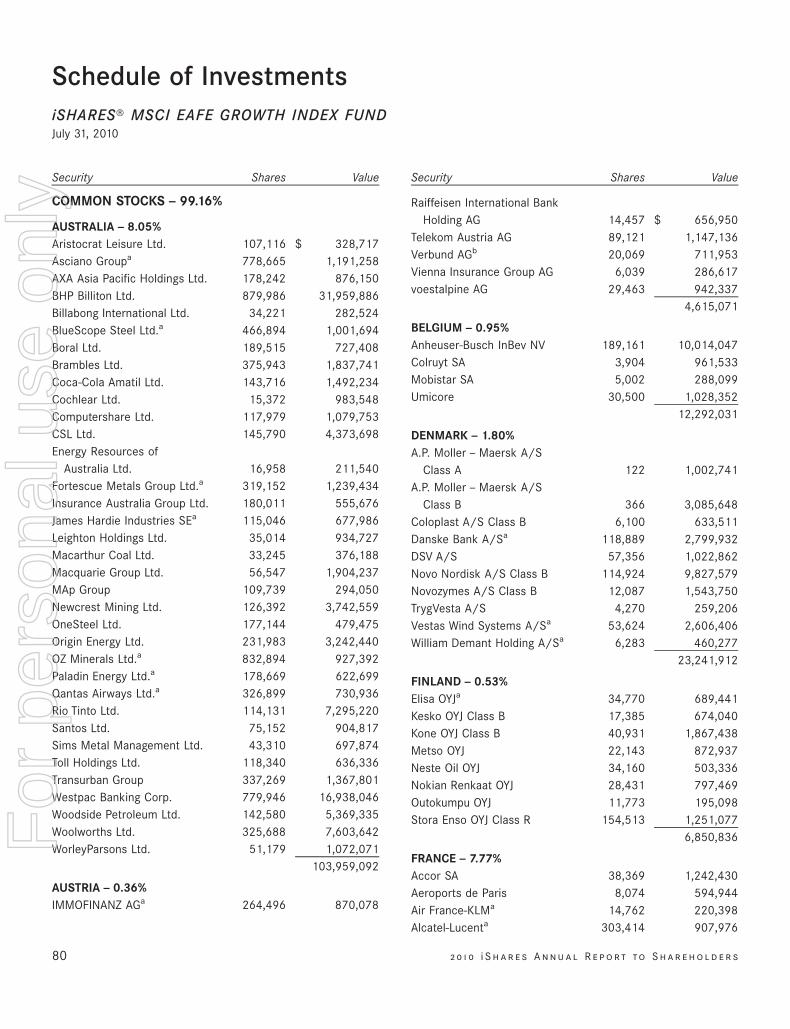
Schedule of InvestmentsiSHARES» MSCI EAFE GROWTH INDEX FUNDJuly 31, 2010
Security Shares Value
COMMON STOCKS — 99.16%
AUSTRALIA — 8.05%Aristocrat Leisure Ltd. 107,116 $ 328,717Asciano Groupa 778,665 1,191,258AXA Asia Pacific Holdings Ltd. 178,242 876,150BHP Billiton Ltd. 879,986 31,959,886Billabong International Ltd. 34,221 282,524BlueScope Steel Ltd.a 466,894 1,001,694Boral Ltd. 189,515 727,408Brambles Ltd. 375,943 1,837,741Coca-Cola Amatil Ltd. 143,716 1,492,234Cochlear Ltd. 15,372 983,548Computershare Ltd. 117,979 1,079,753CSL Ltd. 145,790 4,373,698Energy Resources of
Australia Ltd. 16,958 211,540Fortescue Metals Group Ltd.a 319,152 1,239,434Insurance Australia Group Ltd. 180,011 555,676James Hardie Industries SEa 115,046 677,986Leighton Holdings Ltd. 35,014 934,727Macarthur Coal Ltd. 33,245 376,188Macquarie Group Ltd. 56,547 1,904,237MAp Group 109,739 294,050Newcrest Mining Ltd. 126,392 3,742,559OneSteel Ltd. 177,144 479,475Origin Energy Ltd. 231,983 3,242,440OZ Minerals Ltd.a 832,894 927,392Paladin Energy Ltd.a 178,669 622,699Qantas Airways Ltd.a 326,899 730,936Rio Tinto Ltd. 114,131 7,295,220Santos Ltd. 75,152 904,817Sims Metal Management Ltd. 43,310 697,874Toll Holdings Ltd. 118,340 636,336Transurban Group 337,269 1,367,801Westpac Banking Corp. 779,946 16,938,046Woodside Petroleum Ltd. 142,580 5,369,335Woolworths Ltd. 325,688 7,603,642WorleyParsons Ltd. 51,179 1,072,071
103,959,092
AUSTRIA — 0.36%IMMOFINANZ AGa 264,496 870,078
Security Shares Value
Raiffeisen International BankHolding AG 14,457 $ 656,950
Telekom Austria AG 89,121 1,147,136Verbund AGb 20,069 711,953Vienna Insurance Group AG 6,039 286,617voestalpine AG 29,463 942,337
4,615,071
BELGIUM — 0.95%Anheuser-Busch InBev NV 189,161 10,014,047Colruyt SA 3,904 961,533Mobistar SA 5,002 288,099Umicore 30,500 1,028,352
12,292,031
DENMARK — 1.80%A.P. Moller — Maersk A/S
Class A 122 1,002,741A.P. Moller — Maersk A/S
Class B 366 3,085,648Coloplast A/S Class B 6,100 633,511Danske Bank A/Sa 118,889 2,799,932DSV A/S 57,356 1,022,862Novo Nordisk A/S Class B 114,924 9,827,579Novozymes A/S Class B 12,087 1,543,750TrygVesta A/S 4,270 259,206Vestas Wind Systems A/Sa 53,624 2,606,406William Demant Holding A/Sa 6,283 460,277
23,241,912
FINLAND — 0.53%Elisa OYJa 34,770 689,441Kesko OYJ Class B 17,385 674,040Kone OYJ Class B 40,931 1,867,438Metso OYJ 22,143 872,937Neste Oil OYJ 34,160 503,336Nokian Renkaat OYJ 28,431 797,469Outokumpu OYJ 11,773 195,098Stora Enso OYJ Class R 154,513 1,251,077
6,850,836
FRANCE — 7.77%Accor SA 38,369 1,242,430Aeroports de Paris 8,074 594,944Air France-KLMa 14,762 220,398Alcatel-Lucenta 303,414 907,976
80 2 0 1 0 i S h a r e s A n n u a l R e p o r t to S h a r e h o l d e r s
For
per
sona
l use
onl
y
%%TRANSMSG*** Transmitting Job: B82515 PCN: 082000000 ***%%PCMSG|80 |00010|Yes|No|09/16/2010 20:08|0|0|Page is valid, no graphics -- Color: N|
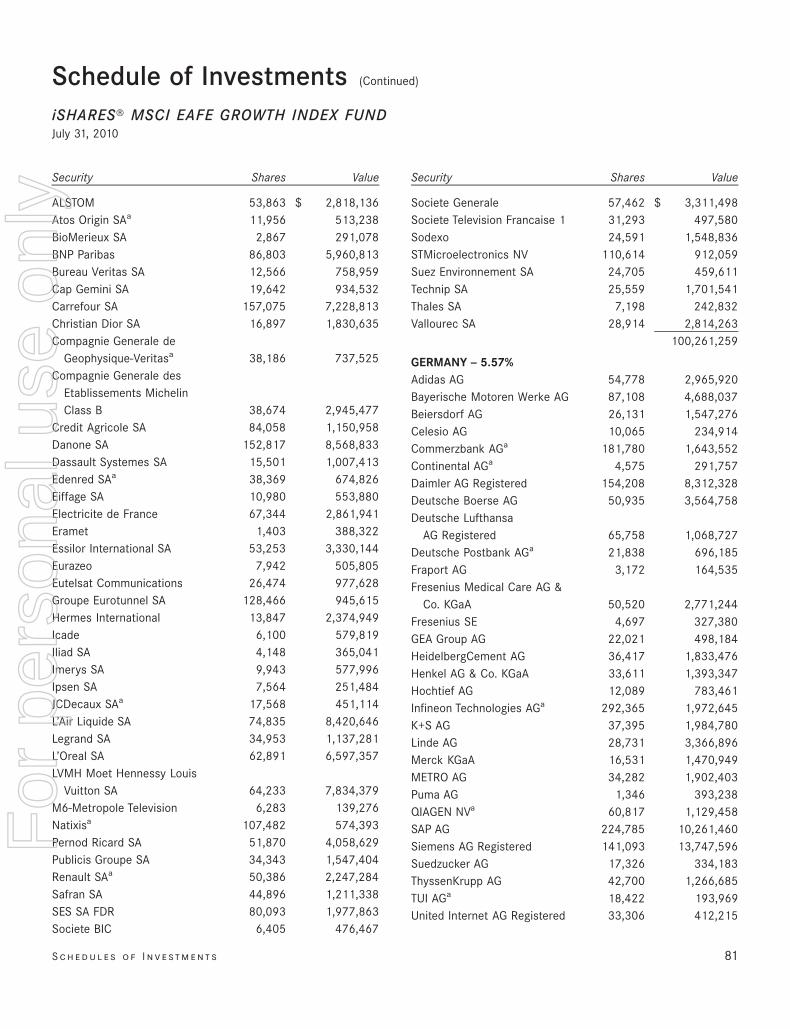
Security Shares Value
ALSTOM 53,863 $ 2,818,136Atos Origin SAa 11,956 513,238BioMerieux SA 2,867 291,078BNP Paribas 86,803 5,960,813Bureau Veritas SA 12,566 758,959Cap Gemini SA 19,642 934,532Carrefour SA 157,075 7,228,813Christian Dior SA 16,897 1,830,635Compagnie Generale de
Geophysique-Veritasa 38,186 737,525Compagnie Generale des
Etablissements MichelinClass B 38,674 2,945,477
Credit Agricole SA 84,058 1,150,958Danone SA 152,817 8,568,833Dassault Systemes SA 15,501 1,007,413Edenred SAa 38,369 674,826Eiffage SA 10,980 553,880Electricite de France 67,344 2,861,941Eramet 1,403 388,322Essilor International SA 53,253 3,330,144Eurazeo 7,942 505,805Eutelsat Communications 26,474 977,628Groupe Eurotunnel SA 128,466 945,615Hermes International 13,847 2,374,949Icade 6,100 579,819Iliad SA 4,148 365,041Imerys SA 9,943 577,996Ipsen SA 7,564 251,484JCDecaux SAa 17,568 451,114L’Air Liquide SA 74,835 8,420,646Legrand SA 34,953 1,137,281L’Oreal SA 62,891 6,597,357LVMH Moet Hennessy Louis
Vuitton SA 64,233 7,834,379M6-Metropole Television 6,283 139,276Natixisa 107,482 574,393Pernod Ricard SA 51,870 4,058,629Publicis Groupe SA 34,343 1,547,404Renault SAa 50,386 2,247,284Safran SA 44,896 1,211,338SES SA FDR 80,093 1,977,863Societe BIC 6,405 476,467
Security Shares Value
Societe Generale 57,462 $ 3,311,498Societe Television Francaise 1 31,293 497,580Sodexo 24,591 1,548,836STMicroelectronics NV 110,614 912,059Suez Environnement SA 24,705 459,611Technip SA 25,559 1,701,541Thales SA 7,198 242,832Vallourec SA 28,914 2,814,263
100,261,259
GERMANY — 5.57%Adidas AG 54,778 2,965,920Bayerische Motoren Werke AG 87,108 4,688,037Beiersdorf AG 26,131 1,547,276Celesio AG 10,065 234,914Commerzbank AGa 181,780 1,643,552Continental AGa 4,575 291,757Daimler AG Registered 154,208 8,312,328Deutsche Boerse AG 50,935 3,564,758Deutsche Lufthansa
AG Registered 65,758 1,068,727Deutsche Postbank AGa 21,838 696,185Fraport AG 3,172 164,535Fresenius Medical Care AG &
Co. KGaA 50,520 2,771,244Fresenius SE 4,697 327,380GEA Group AG 22,021 498,184HeidelbergCement AG 36,417 1,833,476Henkel AG & Co. KGaA 33,611 1,393,347Hochtief AG 12,089 783,461Infineon Technologies AGa 292,365 1,972,645K+S AG 37,395 1,984,780Linde AG 28,731 3,366,896Merck KGaA 16,531 1,470,949METRO AG 34,282 1,902,403Puma AG 1,346 393,238QIAGEN NVa 60,817 1,129,458SAP AG 224,785 10,261,460Siemens AG Registered 141,093 13,747,596Suedzucker AG 17,326 334,183ThyssenKrupp AG 42,700 1,266,685TUI AGa 18,422 193,969United Internet AG Registered 33,306 412,215
S c h e d u l e s o f I n v e st m e n t s 81
Schedule of Investments (Continued)
iSHARES» MSCI EAFE GROWTH INDEX FUNDJuly 31, 2010
For
per
sona
l use
onl
y
%%TRANSMSG*** Transmitting Job: B82515 PCN: 083000000 ***%%PCMSG|81 |00009|Yes|No|09/16/2010 20:08|0|0|Page is valid, no graphics -- Color: N|
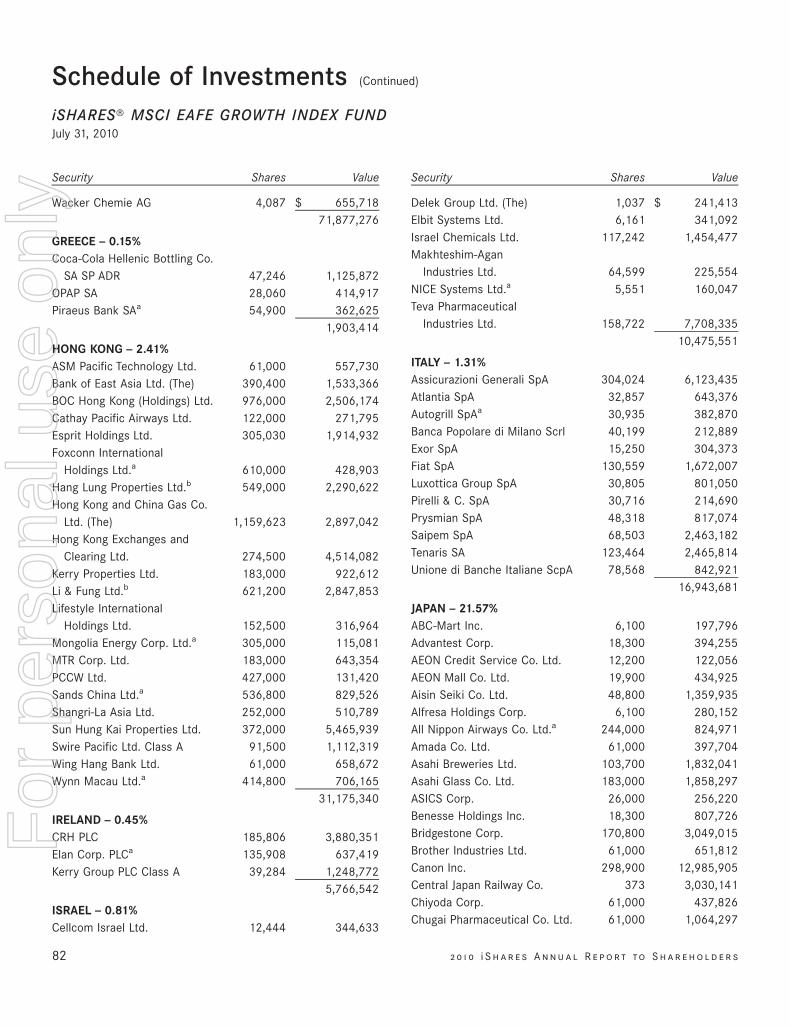
Security Shares Value
Wacker Chemie AG 4,087 $ 655,71871,877,276
GREECE — 0.15%Coca-Cola Hellenic Bottling Co.
SA SP ADR 47,246 1,125,872OPAP SA 28,060 414,917Piraeus Bank SAa 54,900 362,625
1,903,414
HONG KONG — 2.41%ASM Pacific Technology Ltd. 61,000 557,730Bank of East Asia Ltd. (The) 390,400 1,533,366BOC Hong Kong (Holdings) Ltd. 976,000 2,506,174Cathay Pacific Airways Ltd. 122,000 271,795Esprit Holdings Ltd. 305,030 1,914,932Foxconn International
Holdings Ltd.a 610,000 428,903Hang Lung Properties Ltd.b 549,000 2,290,622Hong Kong and China Gas Co.
Ltd. (The) 1,159,623 2,897,042Hong Kong Exchanges and
Clearing Ltd. 274,500 4,514,082Kerry Properties Ltd. 183,000 922,612Li & Fung Ltd.b 621,200 2,847,853Lifestyle International
Holdings Ltd. 152,500 316,964Mongolia Energy Corp. Ltd.a 305,000 115,081MTR Corp. Ltd. 183,000 643,354PCCW Ltd. 427,000 131,420Sands China Ltd.a 536,800 829,526Shangri-La Asia Ltd. 252,000 510,789Sun Hung Kai Properties Ltd. 372,000 5,465,939Swire Pacific Ltd. Class A 91,500 1,112,319Wing Hang Bank Ltd. 61,000 658,672Wynn Macau Ltd.a 414,800 706,165
31,175,340
IRELAND — 0.45%CRH PLC 185,806 3,880,351Elan Corp. PLCa 135,908 637,419Kerry Group PLC Class A 39,284 1,248,772
5,766,542
ISRAEL — 0.81%Cellcom Israel Ltd. 12,444 344,633
Security Shares Value
Delek Group Ltd. (The) 1,037 $ 241,413Elbit Systems Ltd. 6,161 341,092Israel Chemicals Ltd. 117,242 1,454,477Makhteshim-Agan
Industries Ltd. 64,599 225,554NICE Systems Ltd.a 5,551 160,047Teva Pharmaceutical
Industries Ltd. 158,722 7,708,33510,475,551
ITALY — 1.31%Assicurazioni Generali SpA 304,024 6,123,435Atlantia SpA 32,857 643,376Autogrill SpAa 30,935 382,870Banca Popolare di Milano Scrl 40,199 212,889Exor SpA 15,250 304,373Fiat SpA 130,559 1,672,007Luxottica Group SpA 30,805 801,050Pirelli & C. SpA 30,716 214,690Prysmian SpA 48,318 817,074Saipem SpA 68,503 2,463,182Tenaris SA 123,464 2,465,814Unione di Banche Italiane ScpA 78,568 842,921
16,943,681
JAPAN — 21.57%ABC-Mart Inc. 6,100 197,796Advantest Corp. 18,300 394,255AEON Credit Service Co. Ltd. 12,200 122,056AEON Mall Co. Ltd. 19,900 434,925Aisin Seiki Co. Ltd. 48,800 1,359,935Alfresa Holdings Corp. 6,100 280,152All Nippon Airways Co. Ltd.a 244,000 824,971Amada Co. Ltd. 61,000 397,704Asahi Breweries Ltd. 103,700 1,832,041Asahi Glass Co. Ltd. 183,000 1,858,297ASICS Corp. 26,000 256,220Benesse Holdings Inc. 18,300 807,726Bridgestone Corp. 170,800 3,049,015Brother Industries Ltd. 61,000 651,812Canon Inc. 298,900 12,985,905Central Japan Railway Co. 373 3,030,141Chiyoda Corp. 61,000 437,826Chugai Pharmaceutical Co. Ltd. 61,000 1,064,297
82 2 0 1 0 i S h a r e s A n n u a l R e p o r t to S h a r e h o l d e r s
Schedule of Investments (Continued)
iSHARES» MSCI EAFE GROWTH INDEX FUNDJuly 31, 2010
For
per
sona
l use
onl
y
%%TRANSMSG*** Transmitting Job: B82515 PCN: 084000000 ***%%PCMSG|82 |00006|Yes|No|09/16/2010 20:08|0|0|Page is valid, no graphics -- Color: N|
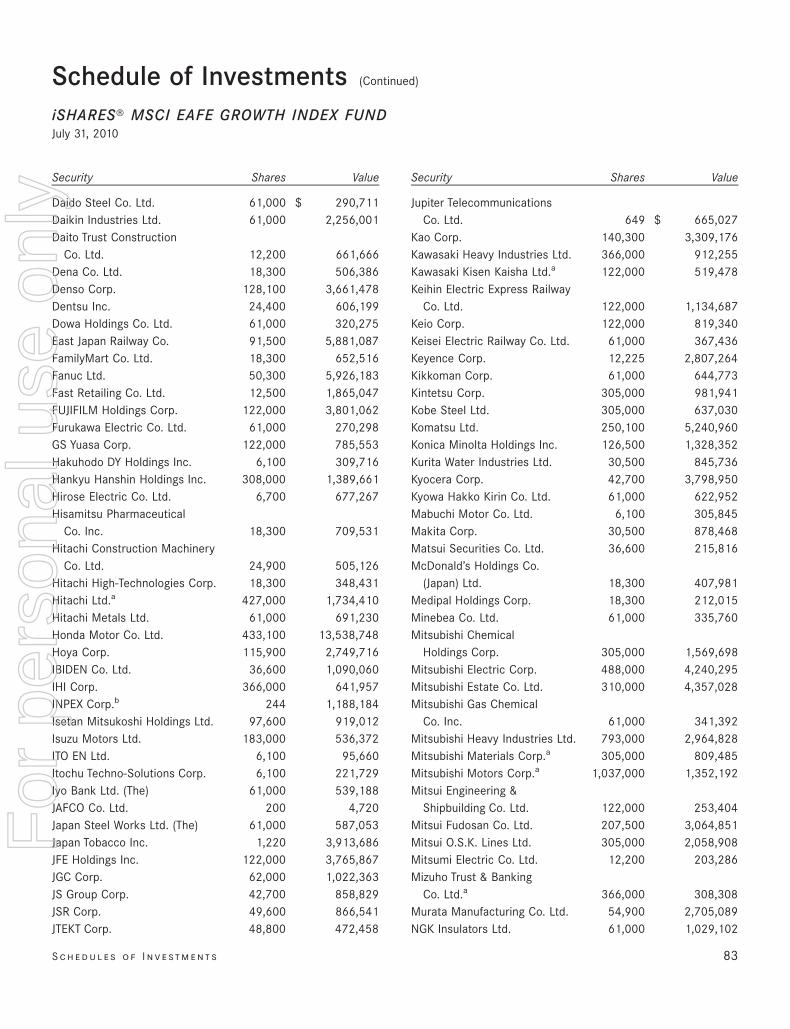
Security Shares Value
Daido Steel Co. Ltd. 61,000 $ 290,711Daikin Industries Ltd. 61,000 2,256,001Daito Trust Construction
Co. Ltd. 12,200 661,666Dena Co. Ltd. 18,300 506,386Denso Corp. 128,100 3,661,478Dentsu Inc. 24,400 606,199Dowa Holdings Co. Ltd. 61,000 320,275East Japan Railway Co. 91,500 5,881,087FamilyMart Co. Ltd. 18,300 652,516Fanuc Ltd. 50,300 5,926,183Fast Retailing Co. Ltd. 12,500 1,865,047FUJIFILM Holdings Corp. 122,000 3,801,062Furukawa Electric Co. Ltd. 61,000 270,298GS Yuasa Corp. 122,000 785,553Hakuhodo DY Holdings Inc. 6,100 309,716Hankyu Hanshin Holdings Inc. 308,000 1,389,661Hirose Electric Co. Ltd. 6,700 677,267Hisamitsu Pharmaceutical
Co. Inc. 18,300 709,531Hitachi Construction Machinery
Co. Ltd. 24,900 505,126Hitachi High-Technologies Corp. 18,300 348,431Hitachi Ltd.a 427,000 1,734,410Hitachi Metals Ltd. 61,000 691,230Honda Motor Co. Ltd. 433,100 13,538,748Hoya Corp. 115,900 2,749,716IBIDEN Co. Ltd. 36,600 1,090,060IHI Corp. 366,000 641,957INPEX Corp.b 244 1,188,184Isetan Mitsukoshi Holdings Ltd. 97,600 919,012Isuzu Motors Ltd. 183,000 536,372ITO EN Ltd. 6,100 95,660Itochu Techno-Solutions Corp. 6,100 221,729Iyo Bank Ltd. (The) 61,000 539,188JAFCO Co. Ltd. 200 4,720Japan Steel Works Ltd. (The) 61,000 587,053Japan Tobacco Inc. 1,220 3,913,686JFE Holdings Inc. 122,000 3,765,867JGC Corp. 62,000 1,022,363JS Group Corp. 42,700 858,829JSR Corp. 49,600 866,541JTEKT Corp. 48,800 472,458
Security Shares Value
Jupiter TelecommunicationsCo. Ltd. 649 $ 665,027
Kao Corp. 140,300 3,309,176Kawasaki Heavy Industries Ltd. 366,000 912,255Kawasaki Kisen Kaisha Ltd.a 122,000 519,478Keihin Electric Express Railway
Co. Ltd. 122,000 1,134,687Keio Corp. 122,000 819,340Keisei Electric Railway Co. Ltd. 61,000 367,436Keyence Corp. 12,225 2,807,264Kikkoman Corp. 61,000 644,773Kintetsu Corp. 305,000 981,941Kobe Steel Ltd. 305,000 637,030Komatsu Ltd. 250,100 5,240,960Konica Minolta Holdings Inc. 126,500 1,328,352Kurita Water Industries Ltd. 30,500 845,736Kyocera Corp. 42,700 3,798,950Kyowa Hakko Kirin Co. Ltd. 61,000 622,952Mabuchi Motor Co. Ltd. 6,100 305,845Makita Corp. 30,500 878,468Matsui Securities Co. Ltd. 36,600 215,816McDonald’s Holdings Co.
(Japan) Ltd. 18,300 407,981Medipal Holdings Corp. 18,300 212,015Minebea Co. Ltd. 61,000 335,760Mitsubishi Chemical
Holdings Corp. 305,000 1,569,698Mitsubishi Electric Corp. 488,000 4,240,295Mitsubishi Estate Co. Ltd. 310,000 4,357,028Mitsubishi Gas Chemical
Co. Inc. 61,000 341,392Mitsubishi Heavy Industries Ltd. 793,000 2,964,828Mitsubishi Materials Corp.a 305,000 809,485Mitsubishi Motors Corp.a 1,037,000 1,352,192Mitsui Engineering &
Shipbuilding Co. Ltd. 122,000 253,404Mitsui Fudosan Co. Ltd. 207,500 3,064,851Mitsui O.S.K. Lines Ltd. 305,000 2,058,908Mitsumi Electric Co. Ltd. 12,200 203,286Mizuho Trust & Banking
Co. Ltd.a 366,000 308,308Murata Manufacturing Co. Ltd. 54,900 2,705,089NGK Insulators Ltd. 61,000 1,029,102
S c h e d u l e s o f I n v e st m e n t s 83
Schedule of Investments (Continued)
iSHARES» MSCI EAFE GROWTH INDEX FUNDJuly 31, 2010
For
per
sona
l use
onl
y
%%TRANSMSG*** Transmitting Job: B82515 PCN: 085000000 ***%%PCMSG|83 |00006|Yes|No|09/16/2010 20:08|0|0|Page is valid, no graphics -- Color: N|
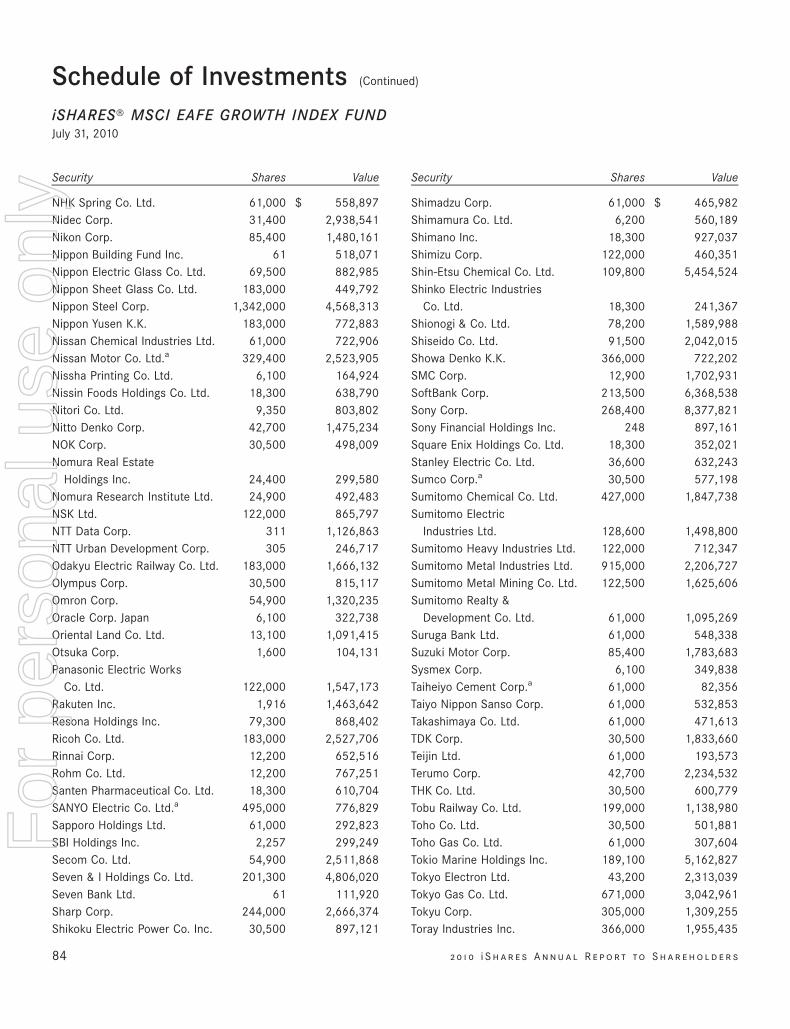
Security Shares Value
NHK Spring Co. Ltd. 61,000 $ 558,897Nidec Corp. 31,400 2,938,541Nikon Corp. 85,400 1,480,161Nippon Building Fund Inc. 61 518,071Nippon Electric Glass Co. Ltd. 69,500 882,985Nippon Sheet Glass Co. Ltd. 183,000 449,792Nippon Steel Corp. 1,342,000 4,568,313Nippon Yusen K.K. 183,000 772,883Nissan Chemical Industries Ltd. 61,000 722,906Nissan Motor Co. Ltd.a 329,400 2,523,905Nissha Printing Co. Ltd. 6,100 164,924Nissin Foods Holdings Co. Ltd. 18,300 638,790Nitori Co. Ltd. 9,350 803,802Nitto Denko Corp. 42,700 1,475,234NOK Corp. 30,500 498,009Nomura Real Estate
Holdings Inc. 24,400 299,580Nomura Research Institute Ltd. 24,900 492,483NSK Ltd. 122,000 865,797NTT Data Corp. 311 1,126,863NTT Urban Development Corp. 305 246,717Odakyu Electric Railway Co. Ltd. 183,000 1,666,132Olympus Corp. 30,500 815,117Omron Corp. 54,900 1,320,235Oracle Corp. Japan 6,100 322,738Oriental Land Co. Ltd. 13,100 1,091,415Otsuka Corp. 1,600 104,131Panasonic Electric Works
Co. Ltd. 122,000 1,547,173Rakuten Inc. 1,916 1,463,642Resona Holdings Inc. 79,300 868,402Ricoh Co. Ltd. 183,000 2,527,706Rinnai Corp. 12,200 652,516Rohm Co. Ltd. 12,200 767,251Santen Pharmaceutical Co. Ltd. 18,300 610,704SANYO Electric Co. Ltd.a 495,000 776,829Sapporo Holdings Ltd. 61,000 292,823SBI Holdings Inc. 2,257 299,249Secom Co. Ltd. 54,900 2,511,868Seven & I Holdings Co. Ltd. 201,300 4,806,020Seven Bank Ltd. 61 111,920Sharp Corp. 244,000 2,666,374Shikoku Electric Power Co. Inc. 30,500 897,121
Security Shares Value
Shimadzu Corp. 61,000 $ 465,982Shimamura Co. Ltd. 6,200 560,189Shimano Inc. 18,300 927,037Shimizu Corp. 122,000 460,351Shin-Etsu Chemical Co. Ltd. 109,800 5,454,524Shinko Electric Industries
Co. Ltd. 18,300 241,367Shionogi & Co. Ltd. 78,200 1,589,988Shiseido Co. Ltd. 91,500 2,042,015Showa Denko K.K. 366,000 722,202SMC Corp. 12,900 1,702,931SoftBank Corp. 213,500 6,368,538Sony Corp. 268,400 8,377,821Sony Financial Holdings Inc. 248 897,161Square Enix Holdings Co. Ltd. 18,300 352,021Stanley Electric Co. Ltd. 36,600 632,243Sumco Corp.a 30,500 577,198Sumitomo Chemical Co. Ltd. 427,000 1,847,738Sumitomo Electric
Industries Ltd. 128,600 1,498,800Sumitomo Heavy Industries Ltd. 122,000 712,347Sumitomo Metal Industries Ltd. 915,000 2,206,727Sumitomo Metal Mining Co. Ltd. 122,500 1,625,606Sumitomo Realty &
Development Co. Ltd. 61,000 1,095,269Suruga Bank Ltd. 61,000 548,338Suzuki Motor Corp. 85,400 1,783,683Sysmex Corp. 6,100 349,838Taiheiyo Cement Corp.a 61,000 82,356Taiyo Nippon Sanso Corp. 61,000 532,853Takashimaya Co. Ltd. 61,000 471,613TDK Corp. 30,500 1,833,660Teijin Ltd. 61,000 193,573Terumo Corp. 42,700 2,234,532THK Co. Ltd. 30,500 600,779Tobu Railway Co. Ltd. 199,000 1,138,980Toho Co. Ltd. 30,500 501,881Toho Gas Co. Ltd. 61,000 307,604Tokio Marine Holdings Inc. 189,100 5,162,827Tokyo Electron Ltd. 43,200 2,313,039Tokyo Gas Co. Ltd. 671,000 3,042,961Tokyu Corp. 305,000 1,309,255Toray Industries Inc. 366,000 1,955,435
84 2 0 1 0 i S h a r e s A n n u a l R e p o r t to S h a r e h o l d e r s
Schedule of Investments (Continued)
iSHARES» MSCI EAFE GROWTH INDEX FUNDJuly 31, 2010
For
per
sona
l use
onl
y
%%TRANSMSG*** Transmitting Job: B82515 PCN: 086000000 ***%%PCMSG|84 |00006|Yes|No|09/16/2010 20:08|0|0|Page is valid, no graphics -- Color: N|
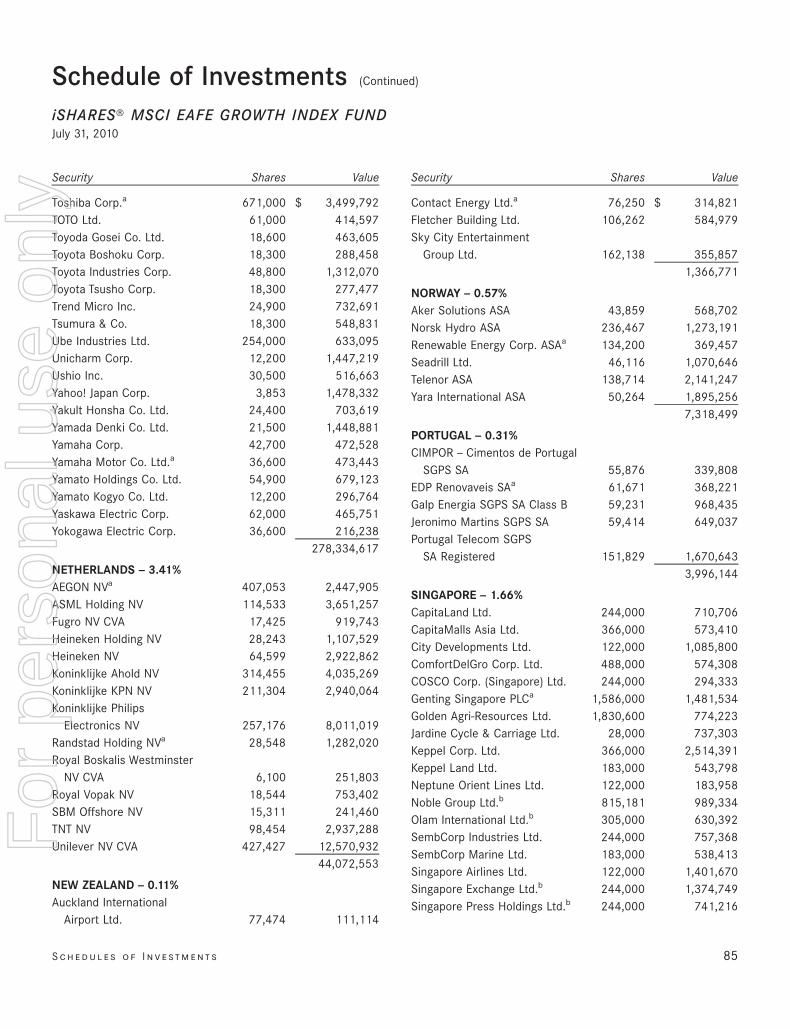
Security Shares Value
Toshiba Corp.a 671,000 $ 3,499,792TOTO Ltd. 61,000 414,597Toyoda Gosei Co. Ltd. 18,600 463,605Toyota Boshoku Corp. 18,300 288,458Toyota Industries Corp. 48,800 1,312,070Toyota Tsusho Corp. 18,300 277,477Trend Micro Inc. 24,900 732,691Tsumura & Co. 18,300 548,831Ube Industries Ltd. 254,000 633,095Unicharm Corp. 12,200 1,447,219Ushio Inc. 30,500 516,663Yahoo! Japan Corp. 3,853 1,478,332Yakult Honsha Co. Ltd. 24,400 703,619Yamada Denki Co. Ltd. 21,500 1,448,881Yamaha Corp. 42,700 472,528Yamaha Motor Co. Ltd.a 36,600 473,443Yamato Holdings Co. Ltd. 54,900 679,123Yamato Kogyo Co. Ltd. 12,200 296,764Yaskawa Electric Corp. 62,000 465,751Yokogawa Electric Corp. 36,600 216,238
278,334,617
NETHERLANDS — 3.41%AEGON NVa 407,053 2,447,905ASML Holding NV 114,533 3,651,257Fugro NV CVA 17,425 919,743Heineken Holding NV 28,243 1,107,529Heineken NV 64,599 2,922,862Koninklijke Ahold NV 314,455 4,035,269Koninklijke KPN NV 211,304 2,940,064Koninklijke Philips
Electronics NV 257,176 8,011,019Randstad Holding NVa 28,548 1,282,020Royal Boskalis Westminster
NV CVA 6,100 251,803Royal Vopak NV 18,544 753,402SBM Offshore NV 15,311 241,460TNT NV 98,454 2,937,288Unilever NV CVA 427,427 12,570,932
44,072,553
NEW ZEALAND — 0.11%Auckland International
Airport Ltd. 77,474 111,114
Security Shares Value
Contact Energy Ltd.a 76,250 $ 314,821Fletcher Building Ltd. 106,262 584,979Sky City Entertainment
Group Ltd. 162,138 355,8571,366,771
NORWAY — 0.57%Aker Solutions ASA 43,859 568,702Norsk Hydro ASA 236,467 1,273,191Renewable Energy Corp. ASAa 134,200 369,457Seadrill Ltd. 46,116 1,070,646Telenor ASA 138,714 2,141,247Yara International ASA 50,264 1,895,256
7,318,499
PORTUGAL — 0.31%CIMPOR — Cimentos de Portugal
SGPS SA 55,876 339,808EDP Renovaveis SAa 61,671 368,221Galp Energia SGPS SA Class B 59,231 968,435Jeronimo Martins SGPS SA 59,414 649,037Portugal Telecom SGPS
SA Registered 151,829 1,670,6433,996,144
SINGAPORE — 1.66%CapitaLand Ltd. 244,000 710,706CapitaMalls Asia Ltd. 366,000 573,410City Developments Ltd. 122,000 1,085,800ComfortDelGro Corp. Ltd. 488,000 574,308COSCO Corp. (Singapore) Ltd. 244,000 294,333Genting Singapore PLCa 1,586,000 1,481,534Golden Agri-Resources Ltd. 1,830,600 774,223Jardine Cycle & Carriage Ltd. 28,000 737,303Keppel Corp. Ltd. 366,000 2,514,391Keppel Land Ltd. 183,000 543,798Neptune Orient Lines Ltd. 122,000 183,958Noble Group Ltd.b 815,181 989,334Olam International Ltd.b 305,000 630,392SembCorp Industries Ltd. 244,000 757,368SembCorp Marine Ltd. 183,000 538,413Singapore Airlines Ltd. 122,000 1,401,670Singapore Exchange Ltd.b 244,000 1,374,749Singapore Press Holdings Ltd.b 244,000 741,216
S c h e d u l e s o f I n v e st m e n t s 85
Schedule of Investments (Continued)
iSHARES» MSCI EAFE GROWTH INDEX FUNDJuly 31, 2010
For
per
sona
l use
onl
y
%%TRANSMSG*** Transmitting Job: B82515 PCN: 087000000 ***%%PCMSG|85 |00007|Yes|No|09/16/2010 20:08|0|0|Page is valid, no graphics -- Color: N|
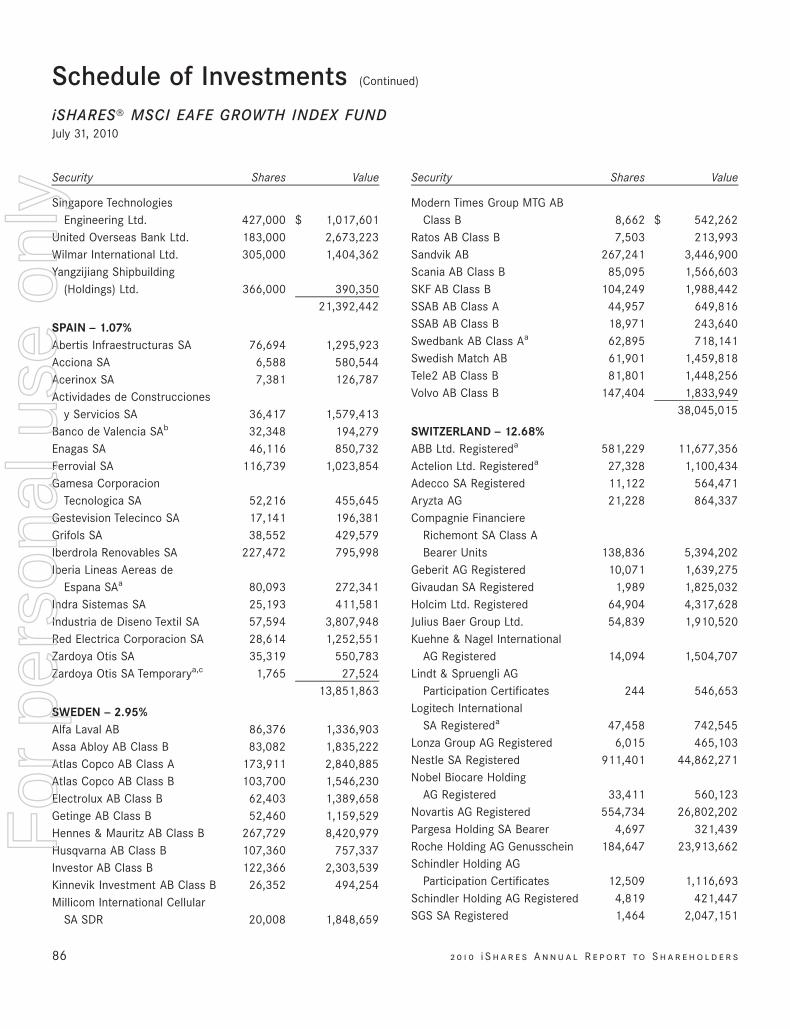
Security Shares Value
Singapore TechnologiesEngineering Ltd. 427,000 $ 1,017,601
United Overseas Bank Ltd. 183,000 2,673,223Wilmar International Ltd. 305,000 1,404,362Yangzijiang Shipbuilding
(Holdings) Ltd. 366,000 390,35021,392,442
SPAIN — 1.07%Abertis Infraestructuras SA 76,694 1,295,923Acciona SA 6,588 580,544Acerinox SA 7,381 126,787Actividades de Construcciones
y Servicios SA 36,417 1,579,413Banco de Valencia SAb 32,348 194,279Enagas SA 46,116 850,732Ferrovial SA 116,739 1,023,854Gamesa Corporacion
Tecnologica SA 52,216 455,645Gestevision Telecinco SA 17,141 196,381Grifols SA 38,552 429,579Iberdrola Renovables SA 227,472 795,998Iberia Lineas Aereas de
Espana SAa 80,093 272,341Indra Sistemas SA 25,193 411,581Industria de Diseno Textil SA 57,594 3,807,948Red Electrica Corporacion SA 28,614 1,252,551Zardoya Otis SA 35,319 550,783Zardoya Otis SA Temporarya,c 1,765 27,524
13,851,863
SWEDEN — 2.95%Alfa Laval AB 86,376 1,336,903Assa Abloy AB Class B 83,082 1,835,222Atlas Copco AB Class A 173,911 2,840,885Atlas Copco AB Class B 103,700 1,546,230Electrolux AB Class B 62,403 1,389,658Getinge AB Class B 52,460 1,159,529Hennes & Mauritz AB Class B 267,729 8,420,979Husqvarna AB Class B 107,360 757,337Investor AB Class B 122,366 2,303,539Kinnevik Investment AB Class B 26,352 494,254Millicom International Cellular
SA SDR 20,008 1,848,659
Security Shares Value
Modern Times Group MTG ABClass B 8,662 $ 542,262
Ratos AB Class B 7,503 213,993Sandvik AB 267,241 3,446,900Scania AB Class B 85,095 1,566,603SKF AB Class B 104,249 1,988,442SSAB AB Class A 44,957 649,816SSAB AB Class B 18,971 243,640Swedbank AB Class Aa 62,895 718,141Swedish Match AB 61,901 1,459,818Tele2 AB Class B 81,801 1,448,256Volvo AB Class B 147,404 1,833,949
38,045,015
SWITZERLAND — 12.68%ABB Ltd. Registereda 581,229 11,677,356Actelion Ltd. Registereda 27,328 1,100,434Adecco SA Registered 11,122 564,471Aryzta AG 21,228 864,337Compagnie Financiere
Richemont SA Class ABearer Units 138,836 5,394,202
Geberit AG Registered 10,071 1,639,275Givaudan SA Registered 1,989 1,825,032Holcim Ltd. Registered 64,904 4,317,628Julius Baer Group Ltd. 54,839 1,910,520Kuehne & Nagel International
AG Registered 14,094 1,504,707Lindt & Spruengli AG
Participation Certificates 244 546,653Logitech International
SA Registereda 47,458 742,545Lonza Group AG Registered 6,015 465,103Nestle SA Registered 911,401 44,862,271Nobel Biocare Holding
AG Registered 33,411 560,123Novartis AG Registered 554,734 26,802,202Pargesa Holding SA Bearer 4,697 321,439Roche Holding AG Genusschein 184,647 23,913,662Schindler Holding AG
Participation Certificates 12,509 1,116,693Schindler Holding AG Registered 4,819 421,447SGS SA Registered 1,464 2,047,151
86 2 0 1 0 i S h a r e s A n n u a l R e p o r t to S h a r e h o l d e r s
Schedule of Investments (Continued)
iSHARES» MSCI EAFE GROWTH INDEX FUNDJuly 31, 2010
For
per
sona
l use
onl
y
%%TRANSMSG*** Transmitting Job: B82515 PCN: 088000000 ***%%PCMSG|86 |00006|Yes|No|09/16/2010 20:08|0|0|Page is valid, no graphics -- Color: N|
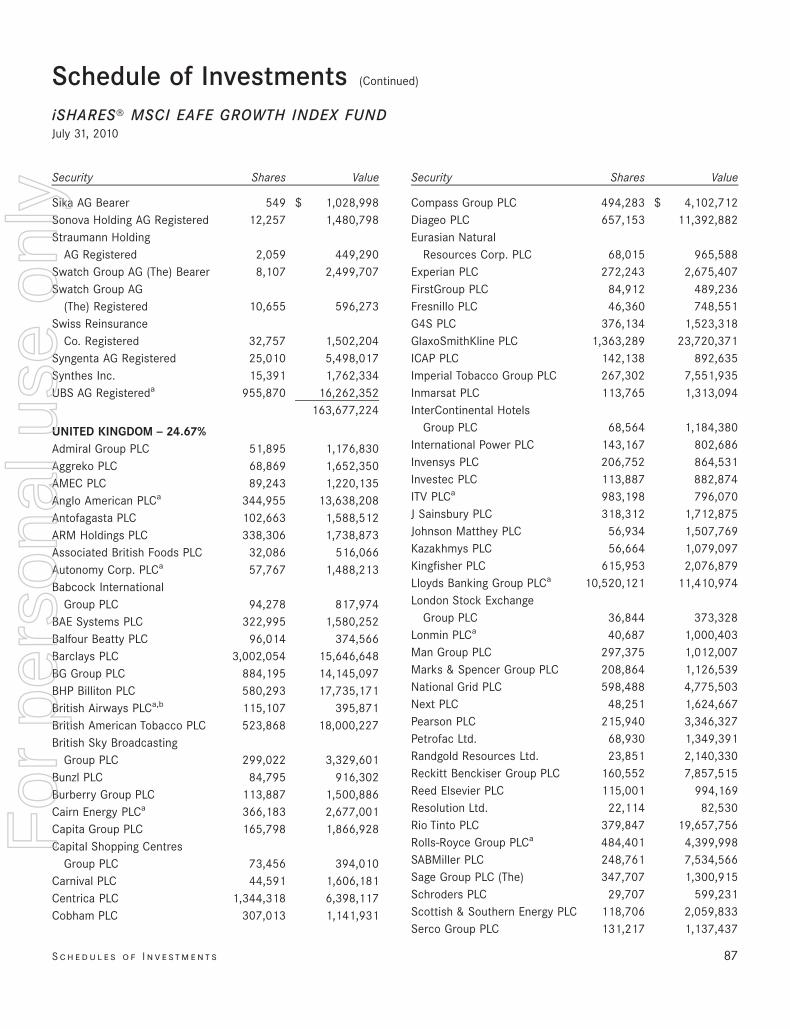
Security Shares Value
Sika AG Bearer 549 $ 1,028,998Sonova Holding AG Registered 12,257 1,480,798Straumann Holding
AG Registered 2,059 449,290Swatch Group AG (The) Bearer 8,107 2,499,707Swatch Group AG
(The) Registered 10,655 596,273Swiss Reinsurance
Co. Registered 32,757 1,502,204Syngenta AG Registered 25,010 5,498,017Synthes Inc. 15,391 1,762,334UBS AG Registereda 955,870 16,262,352
163,677,224
UNITED KINGDOM — 24.67%Admiral Group PLC 51,895 1,176,830Aggreko PLC 68,869 1,652,350AMEC PLC 89,243 1,220,135Anglo American PLCa 344,955 13,638,208Antofagasta PLC 102,663 1,588,512ARM Holdings PLC 338,306 1,738,873Associated British Foods PLC 32,086 516,066Autonomy Corp. PLCa 57,767 1,488,213Babcock International
Group PLC 94,278 817,974BAE Systems PLC 322,995 1,580,252Balfour Beatty PLC 96,014 374,566Barclays PLC 3,002,054 15,646,648BG Group PLC 884,195 14,145,097BHP Billiton PLC 580,293 17,735,171British Airways PLCa,b 115,107 395,871British American Tobacco PLC 523,868 18,000,227British Sky Broadcasting
Group PLC 299,022 3,329,601Bunzl PLC 84,795 916,302Burberry Group PLC 113,887 1,500,886Cairn Energy PLCa 366,183 2,677,001Capita Group PLC 165,798 1,866,928Capital Shopping Centres
Group PLC 73,456 394,010Carnival PLC 44,591 1,606,181Centrica PLC 1,344,318 6,398,117Cobham PLC 307,013 1,141,931
Security Shares Value
Compass Group PLC 494,283 $ 4,102,712Diageo PLC 657,153 11,392,882Eurasian Natural
Resources Corp. PLC 68,015 965,588Experian PLC 272,243 2,675,407FirstGroup PLC 84,912 489,236Fresnillo PLC 46,360 748,551G4S PLC 376,134 1,523,318GlaxoSmithKline PLC 1,363,289 23,720,371ICAP PLC 142,138 892,635Imperial Tobacco Group PLC 267,302 7,551,935Inmarsat PLC 113,765 1,313,094InterContinental Hotels
Group PLC 68,564 1,184,380International Power PLC 143,167 802,686Invensys PLC 206,752 864,531Investec PLC 113,887 882,874ITV PLCa 983,198 796,070J Sainsbury PLC 318,312 1,712,875Johnson Matthey PLC 56,934 1,507,769Kazakhmys PLC 56,664 1,079,097Kingfisher PLC 615,953 2,076,879Lloyds Banking Group PLCa 10,520,121 11,410,974London Stock Exchange
Group PLC 36,844 373,328Lonmin PLCa 40,687 1,000,403Man Group PLC 297,375 1,012,007Marks & Spencer Group PLC 208,864 1,126,539National Grid PLC 598,488 4,775,503Next PLC 48,251 1,624,667Pearson PLC 215,940 3,346,327Petrofac Ltd. 68,930 1,349,391Randgold Resources Ltd. 23,851 2,140,330Reckitt Benckiser Group PLC 160,552 7,857,515Reed Elsevier PLC 115,001 994,169Resolution Ltd. 22,114 82,530Rio Tinto PLC 379,847 19,657,756Rolls-Royce Group PLCa 484,401 4,399,998SABMiller PLC 248,761 7,534,566Sage Group PLC (The) 347,707 1,300,915Schroders PLC 29,707 599,231Scottish & Southern Energy PLC 118,706 2,059,833Serco Group PLC 131,217 1,137,437
S c h e d u l e s o f I n v e st m e n t s 87
Schedule of Investments (Continued)
iSHARES» MSCI EAFE GROWTH INDEX FUNDJuly 31, 2010
For
per
sona
l use
onl
y
%%TRANSMSG*** Transmitting Job: B82515 PCN: 089000000 ***%%PCMSG|87 |00007|Yes|No|09/16/2010 20:08|0|0|Page is valid, no graphics -- Color: N|
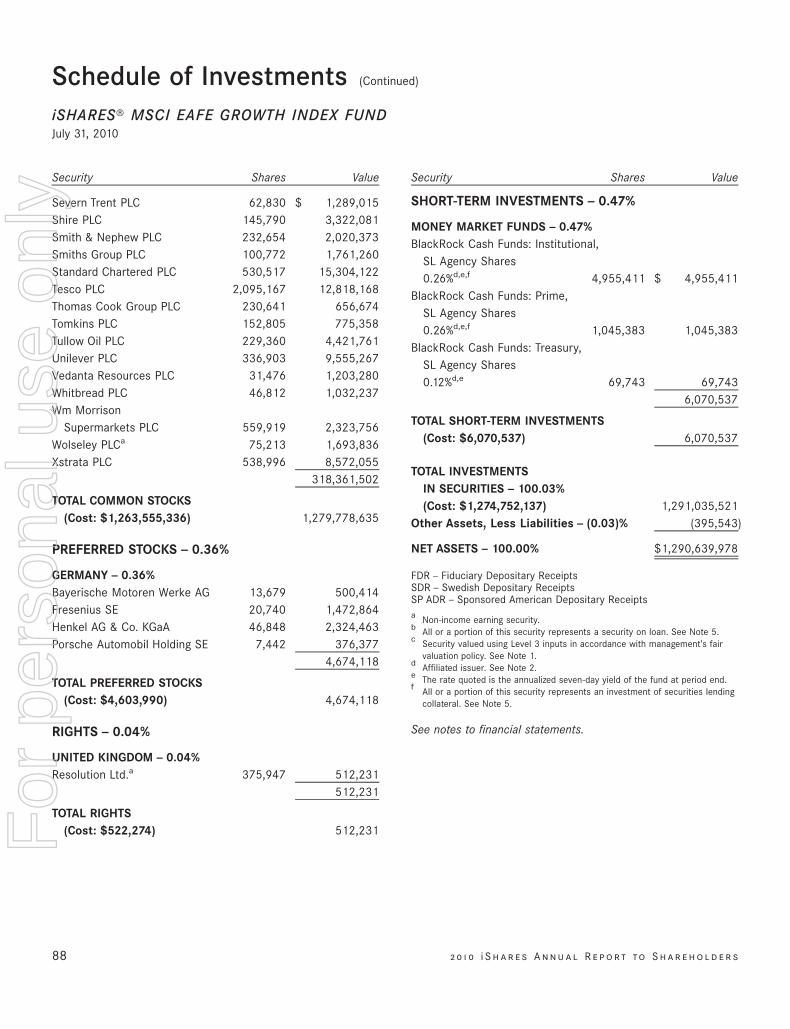
Security Shares Value
Severn Trent PLC 62,830 $ 1,289,015Shire PLC 145,790 3,322,081Smith & Nephew PLC 232,654 2,020,373Smiths Group PLC 100,772 1,761,260Standard Chartered PLC 530,517 15,304,122Tesco PLC 2,095,167 12,818,168Thomas Cook Group PLC 230,641 656,674Tomkins PLC 152,805 775,358Tullow Oil PLC 229,360 4,421,761Unilever PLC 336,903 9,555,267Vedanta Resources PLC 31,476 1,203,280Whitbread PLC 46,812 1,032,237Wm Morrison
Supermarkets PLC 559,919 2,323,756Wolseley PLCa 75,213 1,693,836Xstrata PLC 538,996 8,572,055
318,361,502
TOTAL COMMON STOCKS(Cost: $1,263,555,336) 1,279,778,635
PREFERRED STOCKS — 0.36%
GERMANY — 0.36%Bayerische Motoren Werke AG 13,679 500,414Fresenius SE 20,740 1,472,864Henkel AG & Co. KGaA 46,848 2,324,463Porsche Automobil Holding SE 7,442 376,377
4,674,118
TOTAL PREFERRED STOCKS(Cost: $4,603,990) 4,674,118
RIGHTS — 0.04%
UNITED KINGDOM — 0.04%Resolution Ltd.a 375,947 512,231
512,231
TOTAL RIGHTS(Cost: $522,274) 512,231
Security Shares Value
SHORT-TERM INVESTMENTS — 0.47%
MONEY MARKET FUNDS — 0.47%BlackRock Cash Funds: Institutional,
SL Agency Shares0.26%d,e,f 4,955,411 $ 4,955,411
BlackRock Cash Funds: Prime,SL Agency Shares0.26%d,e,f 1,045,383 1,045,383
BlackRock Cash Funds: Treasury,SL Agency Shares0.12%d,e 69,743 69,743
6,070,537
TOTAL SHORT-TERM INVESTMENTS(Cost: $6,070,537) 6,070,537
TOTAL INVESTMENTSIN SECURITIES — 100.03%(Cost: $1,274,752,137) 1,291,035,521
Other Assets, Less Liabilities — (0.03)% (395,543)
NET ASSETS — 100.00% $1,290,639,978
FDR — Fiduciary Depositary ReceiptsSDR — Swedish Depositary ReceiptsSP ADR — Sponsored American Depositary Receiptsa Non-income earning security.b All or a portion of this security represents a security on loan. See Note 5.c Security valued using Level 3 inputs in accordance with management’s fair
valuation policy. See Note 1.d Affiliated issuer. See Note 2.e The rate quoted is the annualized seven-day yield of the fund at period end.f All or a portion of this security represents an investment of securities lending
collateral. See Note 5.
See notes to financial statements.
88 2 0 1 0 i S h a r e s A n n u a l R e p o r t to S h a r e h o l d e r s
Schedule of Investments (Continued)
iSHARES» MSCI EAFE GROWTH INDEX FUNDJuly 31, 2010
For
per
sona
l use
onl
y
%%TRANSMSG*** Transmitting Job: B82515 PCN: 090000000 ***%%PCMSG|88 |00006|Yes|No|09/16/2010 20:08|0|0|Page is valid, no graphics -- Color: N|
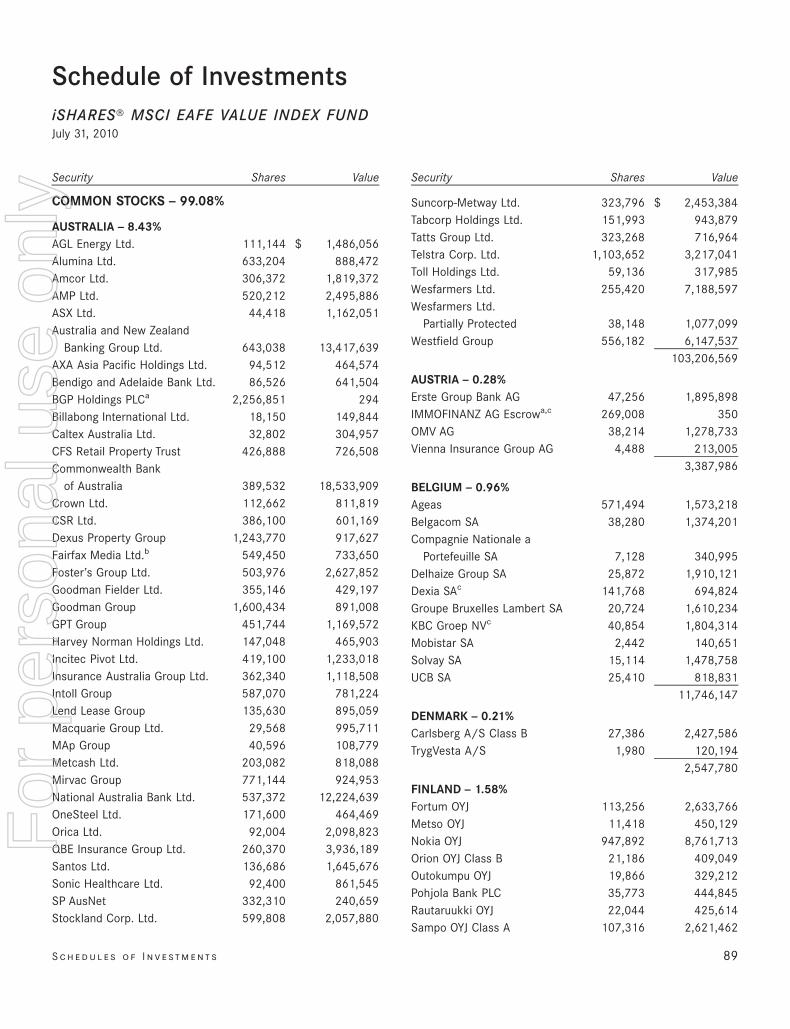
Schedule of InvestmentsiSHARES» MSCI EAFE VALUE INDEX FUNDJuly 31, 2010
Security Shares Value
COMMON STOCKS — 99.08%
AUSTRALIA — 8.43%AGL Energy Ltd. 111,144 $ 1,486,056Alumina Ltd. 633,204 888,472Amcor Ltd. 306,372 1,819,372AMP Ltd. 520,212 2,495,886ASX Ltd. 44,418 1,162,051Australia and New Zealand
Banking Group Ltd. 643,038 13,417,639AXA Asia Pacific Holdings Ltd. 94,512 464,574Bendigo and Adelaide Bank Ltd. 86,526 641,504BGP Holdings PLCa 2,256,851 294Billabong International Ltd. 18,150 149,844Caltex Australia Ltd. 32,802 304,957CFS Retail Property Trust 426,888 726,508Commonwealth Bank
of Australia 389,532 18,533,909Crown Ltd. 112,662 811,819CSR Ltd. 386,100 601,169Dexus Property Group 1,243,770 917,627Fairfax Media Ltd.b 549,450 733,650Foster’s Group Ltd. 503,976 2,627,852Goodman Fielder Ltd. 355,146 429,197Goodman Group 1,600,434 891,008GPT Group 451,744 1,169,572Harvey Norman Holdings Ltd. 147,048 465,903Incitec Pivot Ltd. 419,100 1,233,018Insurance Australia Group Ltd. 362,340 1,118,508Intoll Group 587,070 781,224Lend Lease Group 135,630 895,059Macquarie Group Ltd. 29,568 995,711MAp Group 40,596 108,779Metcash Ltd. 203,082 818,088Mirvac Group 771,144 924,953National Australia Bank Ltd. 537,372 12,224,639OneSteel Ltd. 171,600 464,469Orica Ltd. 92,004 2,098,823QBE Insurance Group Ltd. 260,370 3,936,189Santos Ltd. 136,686 1,645,676Sonic Healthcare Ltd. 92,400 861,545SP AusNet 332,310 240,659Stockland Corp. Ltd. 599,808 2,057,880
Security Shares Value
Suncorp-Metway Ltd. 323,796 $ 2,453,384Tabcorp Holdings Ltd. 151,993 943,879Tatts Group Ltd. 323,268 716,964Telstra Corp. Ltd. 1,103,652 3,217,041Toll Holdings Ltd. 59,136 317,985Wesfarmers Ltd. 255,420 7,188,597Wesfarmers Ltd.
Partially Protected 38,148 1,077,099Westfield Group 556,182 6,147,537
103,206,569
AUSTRIA — 0.28%Erste Group Bank AG 47,256 1,895,898IMMOFINANZ AG Escrowa,c 269,008 350OMV AG 38,214 1,278,733Vienna Insurance Group AG 4,488 213,005
3,387,986
BELGIUM — 0.96%Ageas 571,494 1,573,218Belgacom SA 38,280 1,374,201Compagnie Nationale a
Portefeuille SA 7,128 340,995Delhaize Group SA 25,872 1,910,121Dexia SAc 141,768 694,824Groupe Bruxelles Lambert SA 20,724 1,610,234KBC Groep NVc 40,854 1,804,314Mobistar SA 2,442 140,651Solvay SA 15,114 1,478,758UCB SA 25,410 818,831
11,746,147
DENMARK — 0.21%Carlsberg A/S Class B 27,386 2,427,586TrygVesta A/S 1,980 120,194
2,547,780
FINLAND — 1.58%Fortum OYJ 113,256 2,633,766Metso OYJ 11,418 450,129Nokia OYJ 947,892 8,761,713Orion OYJ Class B 21,186 409,049Outokumpu OYJ 19,866 329,212Pohjola Bank PLC 35,773 444,845Rautaruukki OYJ 22,044 425,614Sampo OYJ Class A 107,316 2,621,462
S c h e d u l e s o f I n v e st m e n t s 89
For
per
sona
l use
onl
y
%%TRANSMSG*** Transmitting Job: B82515 PCN: 091000000 ***%%PCMSG|89 |00007|Yes|No|09/16/2010 20:08|0|0|Page is valid, no graphics -- Color: N|
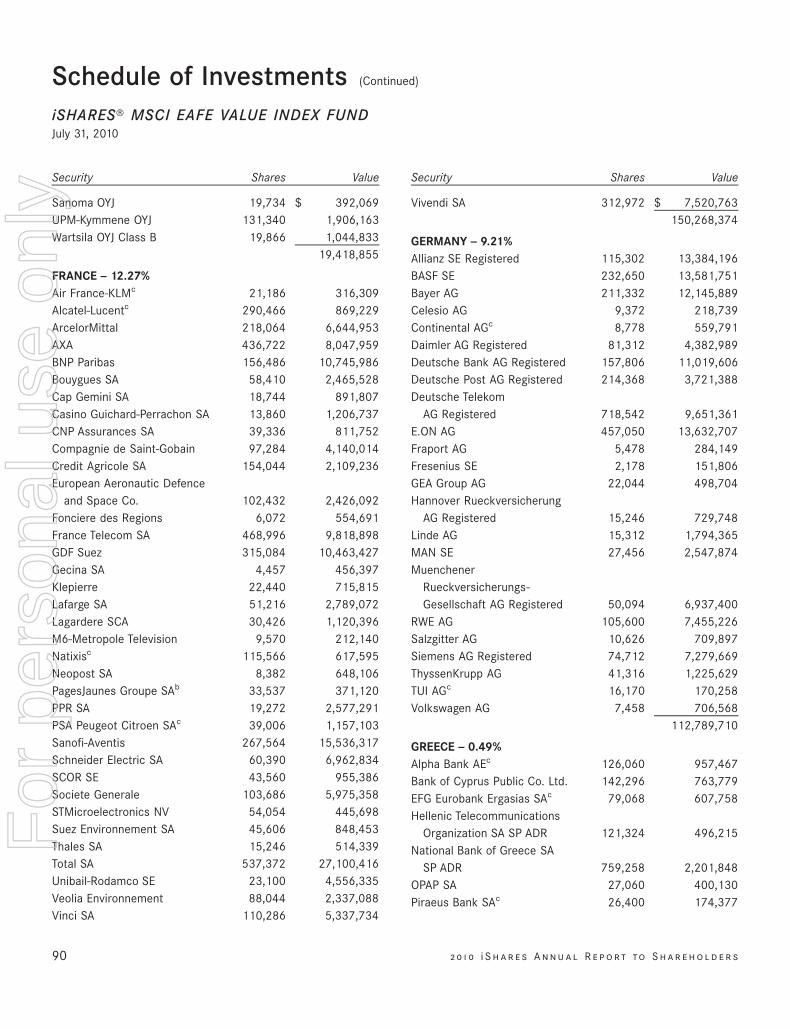
Security Shares Value
Sanoma OYJ 19,734 $ 392,069UPM-Kymmene OYJ 131,340 1,906,163Wartsila OYJ Class B 19,866 1,044,833
19,418,855
FRANCE — 12.27%Air France-KLMc 21,186 316,309Alcatel-Lucentc 290,466 869,229ArcelorMittal 218,064 6,644,953AXA 436,722 8,047,959BNP Paribas 156,486 10,745,986Bouygues SA 58,410 2,465,528Cap Gemini SA 18,744 891,807Casino Guichard-Perrachon SA 13,860 1,206,737CNP Assurances SA 39,336 811,752Compagnie de Saint-Gobain 97,284 4,140,014Credit Agricole SA 154,044 2,109,236European Aeronautic Defence
and Space Co. 102,432 2,426,092Fonciere des Regions 6,072 554,691France Telecom SA 468,996 9,818,898GDF Suez 315,084 10,463,427Gecina SA 4,457 456,397Klepierre 22,440 715,815Lafarge SA 51,216 2,789,072Lagardere SCA 30,426 1,120,396M6-Metropole Television 9,570 212,140Natixisc 115,566 617,595Neopost SA 8,382 648,106PagesJaunes Groupe SAb 33,537 371,120PPR SA 19,272 2,577,291PSA Peugeot Citroen SAc 39,006 1,157,103Sanofi-Aventis 267,564 15,536,317Schneider Electric SA 60,390 6,962,834SCOR SE 43,560 955,386Societe Generale 103,686 5,975,358STMicroelectronics NV 54,054 445,698Suez Environnement SA 45,606 848,453Thales SA 15,246 514,339Total SA 537,372 27,100,416Unibail-Rodamco SE 23,100 4,556,335Veolia Environnement 88,044 2,337,088Vinci SA 110,286 5,337,734
Security Shares Value
Vivendi SA 312,972 $ 7,520,763150,268,374
GERMANY — 9.21%Allianz SE Registered 115,302 13,384,196BASF SE 232,650 13,581,751Bayer AG 211,332 12,145,889Celesio AG 9,372 218,739Continental AGc 8,778 559,791Daimler AG Registered 81,312 4,382,989Deutsche Bank AG Registered 157,806 11,019,606Deutsche Post AG Registered 214,368 3,721,388Deutsche Telekom
AG Registered 718,542 9,651,361E.ON AG 457,050 13,632,707Fraport AG 5,478 284,149Fresenius SE 2,178 151,806GEA Group AG 22,044 498,704Hannover Rueckversicherung
AG Registered 15,246 729,748Linde AG 15,312 1,794,365MAN SE 27,456 2,547,874Muenchener
Rueckversicherungs-Gesellschaft AG Registered 50,094 6,937,400
RWE AG 105,600 7,455,226Salzgitter AG 10,626 709,897Siemens AG Registered 74,712 7,279,669ThyssenKrupp AG 41,316 1,225,629TUI AGc 16,170 170,258Volkswagen AG 7,458 706,568
112,789,710
GREECE — 0.49%Alpha Bank AEc 126,060 957,467Bank of Cyprus Public Co. Ltd. 142,296 763,779EFG Eurobank Ergasias SAc 79,068 607,758Hellenic Telecommunications
Organization SA SP ADR 121,324 496,215National Bank of Greece SA
SP ADR 759,258 2,201,848OPAP SA 27,060 400,130Piraeus Bank SAc 26,400 174,377
90 2 0 1 0 i S h a r e s A n n u a l R e p o r t to S h a r e h o l d e r s
Schedule of Investments (Continued)
iSHARES» MSCI EAFE VALUE INDEX FUNDJuly 31, 2010
For
per
sona
l use
onl
y
%%TRANSMSG*** Transmitting Job: B82515 PCN: 092000000 ***%%PCMSG|90 |00010|Yes|No|09/16/2010 20:08|0|0|Page is valid, no graphics -- Color: N|
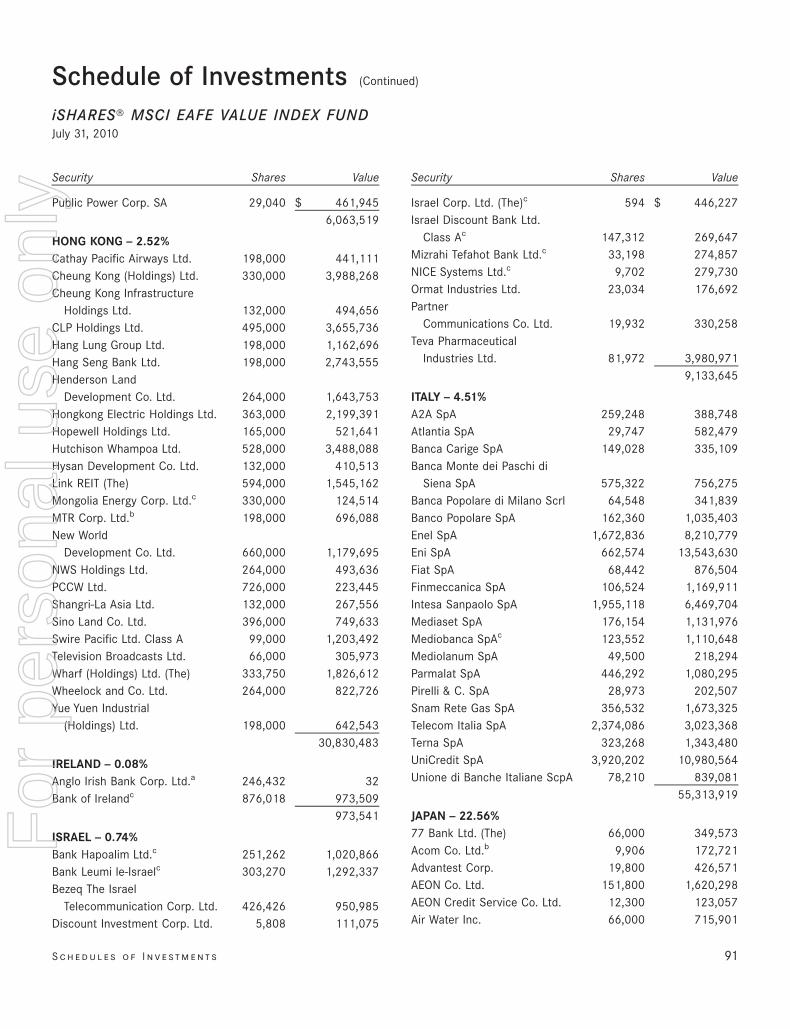
Security Shares Value
Public Power Corp. SA 29,040 $ 461,9456,063,519
HONG KONG — 2.52%Cathay Pacific Airways Ltd. 198,000 441,111Cheung Kong (Holdings) Ltd. 330,000 3,988,268Cheung Kong Infrastructure
Holdings Ltd. 132,000 494,656CLP Holdings Ltd. 495,000 3,655,736Hang Lung Group Ltd. 198,000 1,162,696Hang Seng Bank Ltd. 198,000 2,743,555Henderson Land
Development Co. Ltd. 264,000 1,643,753Hongkong Electric Holdings Ltd. 363,000 2,199,391Hopewell Holdings Ltd. 165,000 521,641Hutchison Whampoa Ltd. 528,000 3,488,088Hysan Development Co. Ltd. 132,000 410,513Link REIT (The) 594,000 1,545,162Mongolia Energy Corp. Ltd.c 330,000 124,514MTR Corp. Ltd.b 198,000 696,088New World
Development Co. Ltd. 660,000 1,179,695NWS Holdings Ltd. 264,000 493,636PCCW Ltd. 726,000 223,445Shangri-La Asia Ltd. 132,000 267,556Sino Land Co. Ltd. 396,000 749,633Swire Pacific Ltd. Class A 99,000 1,203,492Television Broadcasts Ltd. 66,000 305,973Wharf (Holdings) Ltd. (The) 333,750 1,826,612Wheelock and Co. Ltd. 264,000 822,726Yue Yuen Industrial
(Holdings) Ltd. 198,000 642,54330,830,483
IRELAND — 0.08%Anglo Irish Bank Corp. Ltd.a 246,432 32Bank of Irelandc 876,018 973,509
973,541
ISRAEL — 0.74%Bank Hapoalim Ltd.c 251,262 1,020,866Bank Leumi le-Israelc 303,270 1,292,337Bezeq The Israel
Telecommunication Corp. Ltd. 426,426 950,985Discount Investment Corp. Ltd. 5,808 111,075
Security Shares Value
Israel Corp. Ltd. (The)c 594 $ 446,227Israel Discount Bank Ltd.
Class Ac 147,312 269,647Mizrahi Tefahot Bank Ltd.c 33,198 274,857NICE Systems Ltd.c 9,702 279,730Ormat Industries Ltd. 23,034 176,692Partner
Communications Co. Ltd. 19,932 330,258Teva Pharmaceutical
Industries Ltd. 81,972 3,980,9719,133,645
ITALY — 4.51%A2A SpA 259,248 388,748Atlantia SpA 29,747 582,479Banca Carige SpA 149,028 335,109Banca Monte dei Paschi di
Siena SpA 575,322 756,275Banca Popolare di Milano Scrl 64,548 341,839Banco Popolare SpA 162,360 1,035,403Enel SpA 1,672,836 8,210,779Eni SpA 662,574 13,543,630Fiat SpA 68,442 876,504Finmeccanica SpA 106,524 1,169,911Intesa Sanpaolo SpA 1,955,118 6,469,704Mediaset SpA 176,154 1,131,976Mediobanca SpAc 123,552 1,110,648Mediolanum SpA 49,500 218,294Parmalat SpA 446,292 1,080,295Pirelli & C. SpA 28,973 202,507Snam Rete Gas SpA 356,532 1,673,325Telecom Italia SpA 2,374,086 3,023,368Terna SpA 323,268 1,343,480UniCredit SpA 3,920,202 10,980,564Unione di Banche Italiane ScpA 78,210 839,081
55,313,919
JAPAN — 22.56%77 Bank Ltd. (The) 66,000 349,573Acom Co. Ltd.b 9,906 172,721Advantest Corp. 19,800 426,571AEON Co. Ltd. 151,800 1,620,298AEON Credit Service Co. Ltd. 12,300 123,057Air Water Inc. 66,000 715,901
S c h e d u l e s o f I n v e st m e n t s 91
Schedule of Investments (Continued)
iSHARES» MSCI EAFE VALUE INDEX FUNDJuly 31, 2010
For
per
sona
l use
onl
y
%%TRANSMSG*** Transmitting Job: B82515 PCN: 093000000 ***%%PCMSG|91 |00007|Yes|No|09/16/2010 20:08|0|0|Page is valid, no graphics -- Color: N|
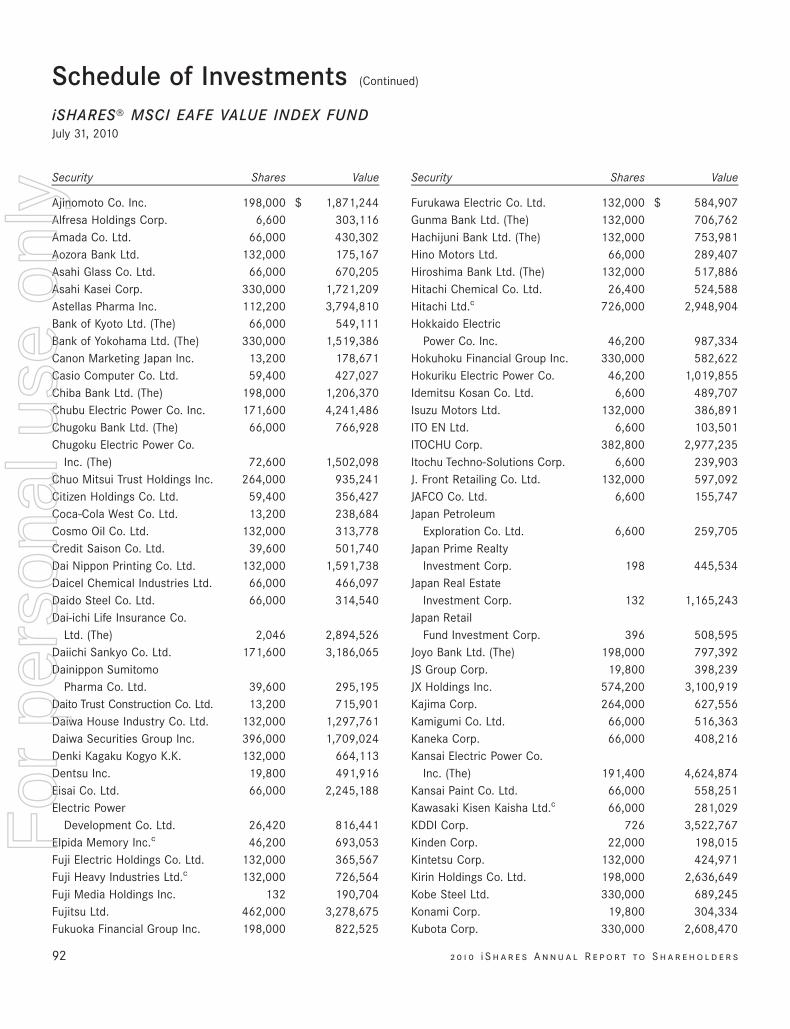
Security Shares Value
Ajinomoto Co. Inc. 198,000 $ 1,871,244Alfresa Holdings Corp. 6,600 303,116Amada Co. Ltd. 66,000 430,302Aozora Bank Ltd. 132,000 175,167Asahi Glass Co. Ltd. 66,000 670,205Asahi Kasei Corp. 330,000 1,721,209Astellas Pharma Inc. 112,200 3,794,810Bank of Kyoto Ltd. (The) 66,000 549,111Bank of Yokohama Ltd. (The) 330,000 1,519,386Canon Marketing Japan Inc. 13,200 178,671Casio Computer Co. Ltd. 59,400 427,027Chiba Bank Ltd. (The) 198,000 1,206,370Chubu Electric Power Co. Inc. 171,600 4,241,486Chugoku Bank Ltd. (The) 66,000 766,928Chugoku Electric Power Co.
Inc. (The) 72,600 1,502,098Chuo Mitsui Trust Holdings Inc. 264,000 935,241Citizen Holdings Co. Ltd. 59,400 356,427Coca-Cola West Co. Ltd. 13,200 238,684Cosmo Oil Co. Ltd. 132,000 313,778Credit Saison Co. Ltd. 39,600 501,740Dai Nippon Printing Co. Ltd. 132,000 1,591,738Daicel Chemical Industries Ltd. 66,000 466,097Daido Steel Co. Ltd. 66,000 314,540Dai-ichi Life Insurance Co.
Ltd. (The) 2,046 2,894,526Daiichi Sankyo Co. Ltd. 171,600 3,186,065Dainippon Sumitomo
Pharma Co. Ltd. 39,600 295,195Daito Trust Construction Co. Ltd. 13,200 715,901Daiwa House Industry Co. Ltd. 132,000 1,297,761Daiwa Securities Group Inc. 396,000 1,709,024Denki Kagaku Kogyo K.K. 132,000 664,113Dentsu Inc. 19,800 491,916Eisai Co. Ltd. 66,000 2,245,188Electric Power
Development Co. Ltd. 26,420 816,441Elpida Memory Inc.c 46,200 693,053Fuji Electric Holdings Co. Ltd. 132,000 365,567Fuji Heavy Industries Ltd.c 132,000 726,564Fuji Media Holdings Inc. 132 190,704Fujitsu Ltd. 462,000 3,278,675Fukuoka Financial Group Inc. 198,000 822,525
Security Shares Value
Furukawa Electric Co. Ltd. 132,000 $ 584,907Gunma Bank Ltd. (The) 132,000 706,762Hachijuni Bank Ltd. (The) 132,000 753,981Hino Motors Ltd. 66,000 289,407Hiroshima Bank Ltd. (The) 132,000 517,886Hitachi Chemical Co. Ltd. 26,400 524,588Hitachi Ltd.c 726,000 2,948,904Hokkaido Electric
Power Co. Inc. 46,200 987,334Hokuhoku Financial Group Inc. 330,000 582,622Hokuriku Electric Power Co. 46,200 1,019,855Idemitsu Kosan Co. Ltd. 6,600 489,707Isuzu Motors Ltd. 132,000 386,891ITO EN Ltd. 6,600 103,501ITOCHU Corp. 382,800 2,977,235Itochu Techno-Solutions Corp. 6,600 239,903J. Front Retailing Co. Ltd. 132,000 597,092JAFCO Co. Ltd. 6,600 155,747Japan Petroleum
Exploration Co. Ltd. 6,600 259,705Japan Prime Realty
Investment Corp. 198 445,534Japan Real Estate
Investment Corp. 132 1,165,243Japan Retail
Fund Investment Corp. 396 508,595Joyo Bank Ltd. (The) 198,000 797,392JS Group Corp. 19,800 398,239JX Holdings Inc. 574,200 3,100,919Kajima Corp. 264,000 627,556Kamigumi Co. Ltd. 66,000 516,363Kaneka Corp. 66,000 408,216Kansai Electric Power Co.
Inc. (The) 191,400 4,624,874Kansai Paint Co. Ltd. 66,000 558,251Kawasaki Kisen Kaisha Ltd.c 66,000 281,029KDDI Corp. 726 3,522,767Kinden Corp. 22,000 198,015Kintetsu Corp. 132,000 424,971Kirin Holdings Co. Ltd. 198,000 2,636,649Kobe Steel Ltd. 330,000 689,245Konami Corp. 19,800 304,334Kubota Corp. 330,000 2,608,470
92 2 0 1 0 i S h a r e s A n n u a l R e p o r t to S h a r e h o l d e r s
Schedule of Investments (Continued)
iSHARES» MSCI EAFE VALUE INDEX FUNDJuly 31, 2010
For
per
sona
l use
onl
y
%%TRANSMSG*** Transmitting Job: B82515 PCN: 094000000 ***%%PCMSG|92 |00006|Yes|No|09/16/2010 20:08|0|0|Page is valid, no graphics -- Color: N|
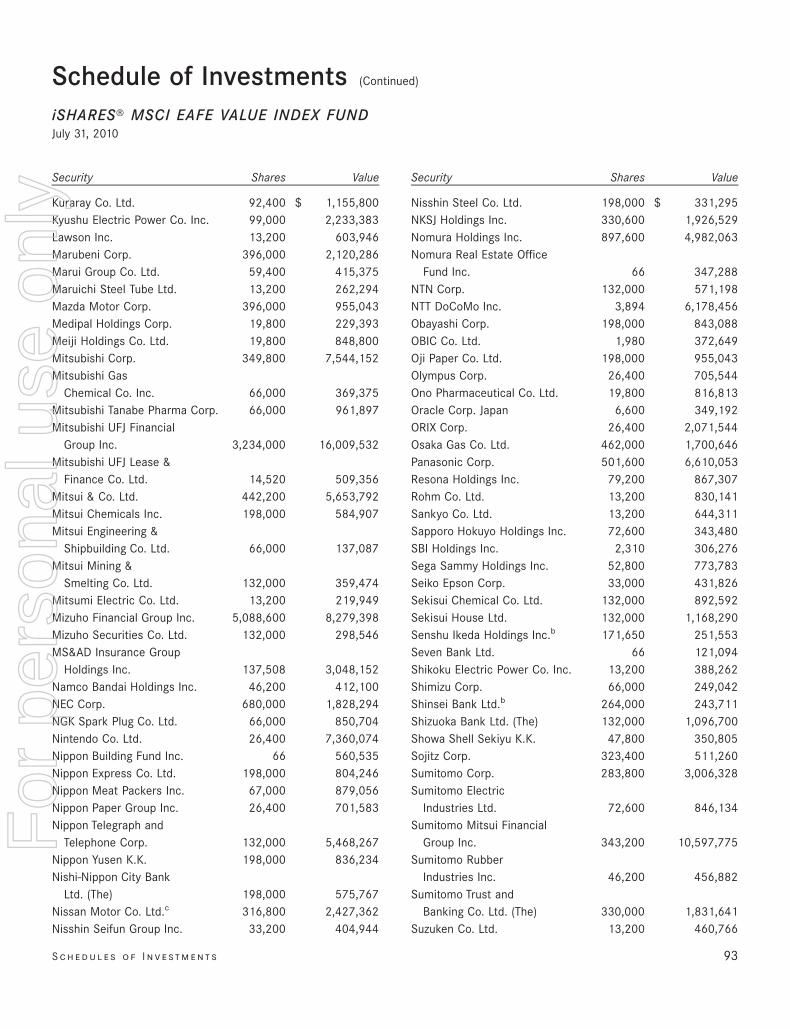
Security Shares Value
Kuraray Co. Ltd. 92,400 $ 1,155,800Kyushu Electric Power Co. Inc. 99,000 2,233,383Lawson Inc. 13,200 603,946Marubeni Corp. 396,000 2,120,286Marui Group Co. Ltd. 59,400 415,375Maruichi Steel Tube Ltd. 13,200 262,294Mazda Motor Corp. 396,000 955,043Medipal Holdings Corp. 19,800 229,393Meiji Holdings Co. Ltd. 19,800 848,800Mitsubishi Corp. 349,800 7,544,152Mitsubishi Gas
Chemical Co. Inc. 66,000 369,375Mitsubishi Tanabe Pharma Corp. 66,000 961,897Mitsubishi UFJ Financial
Group Inc. 3,234,000 16,009,532Mitsubishi UFJ Lease &
Finance Co. Ltd. 14,520 509,356Mitsui & Co. Ltd. 442,200 5,653,792Mitsui Chemicals Inc. 198,000 584,907Mitsui Engineering &
Shipbuilding Co. Ltd. 66,000 137,087Mitsui Mining &
Smelting Co. Ltd. 132,000 359,474Mitsumi Electric Co. Ltd. 13,200 219,949Mizuho Financial Group Inc. 5,088,600 8,279,398Mizuho Securities Co. Ltd. 132,000 298,546MS&AD Insurance Group
Holdings Inc. 137,508 3,048,152Namco Bandai Holdings Inc. 46,200 412,100NEC Corp. 680,000 1,828,294NGK Spark Plug Co. Ltd. 66,000 850,704Nintendo Co. Ltd. 26,400 7,360,074Nippon Building Fund Inc. 66 560,535Nippon Express Co. Ltd. 198,000 804,246Nippon Meat Packers Inc. 67,000 879,056Nippon Paper Group Inc. 26,400 701,583Nippon Telegraph and
Telephone Corp. 132,000 5,468,267Nippon Yusen K.K. 198,000 836,234Nishi-Nippon City Bank
Ltd. (The) 198,000 575,767Nissan Motor Co. Ltd.c 316,800 2,427,362Nisshin Seifun Group Inc. 33,200 404,944
Security Shares Value
Nisshin Steel Co. Ltd. 198,000 $ 331,295NKSJ Holdings Inc. 330,600 1,926,529Nomura Holdings Inc. 897,600 4,982,063Nomura Real Estate Office
Fund Inc. 66 347,288NTN Corp. 132,000 571,198NTT DoCoMo Inc. 3,894 6,178,456Obayashi Corp. 198,000 843,088OBIC Co. Ltd. 1,980 372,649Oji Paper Co. Ltd. 198,000 955,043Olympus Corp. 26,400 705,544Ono Pharmaceutical Co. Ltd. 19,800 816,813Oracle Corp. Japan 6,600 349,192ORIX Corp. 26,400 2,071,544Osaka Gas Co. Ltd. 462,000 1,700,646Panasonic Corp. 501,600 6,610,053Resona Holdings Inc. 79,200 867,307Rohm Co. Ltd. 13,200 830,141Sankyo Co. Ltd. 13,200 644,311Sapporo Hokuyo Holdings Inc. 72,600 343,480SBI Holdings Inc. 2,310 306,276Sega Sammy Holdings Inc. 52,800 773,783Seiko Epson Corp. 33,000 431,826Sekisui Chemical Co. Ltd. 132,000 892,592Sekisui House Ltd. 132,000 1,168,290Senshu Ikeda Holdings Inc.b 171,650 251,553Seven Bank Ltd. 66 121,094Shikoku Electric Power Co. Inc. 13,200 388,262Shimizu Corp. 66,000 249,042Shinsei Bank Ltd.b 264,000 243,711Shizuoka Bank Ltd. (The) 132,000 1,096,700Showa Shell Sekiyu K.K. 47,800 350,805Sojitz Corp. 323,400 511,260Sumitomo Corp. 283,800 3,006,328Sumitomo Electric
Industries Ltd. 72,600 846,134Sumitomo Mitsui Financial
Group Inc. 343,200 10,597,775Sumitomo Rubber
Industries Inc. 46,200 456,882Sumitomo Trust and
Banking Co. Ltd. (The) 330,000 1,831,641Suzuken Co. Ltd. 13,200 460,766
S c h e d u l e s o f I n v e st m e n t s 93
Schedule of Investments (Continued)
iSHARES» MSCI EAFE VALUE INDEX FUNDJuly 31, 2010
For
per
sona
l use
onl
y
%%TRANSMSG*** Transmitting Job: B82515 PCN: 095000000 ***%%PCMSG|93 |00005|Yes|No|09/16/2010 20:08|0|0|Page is valid, no graphics -- Color: N|
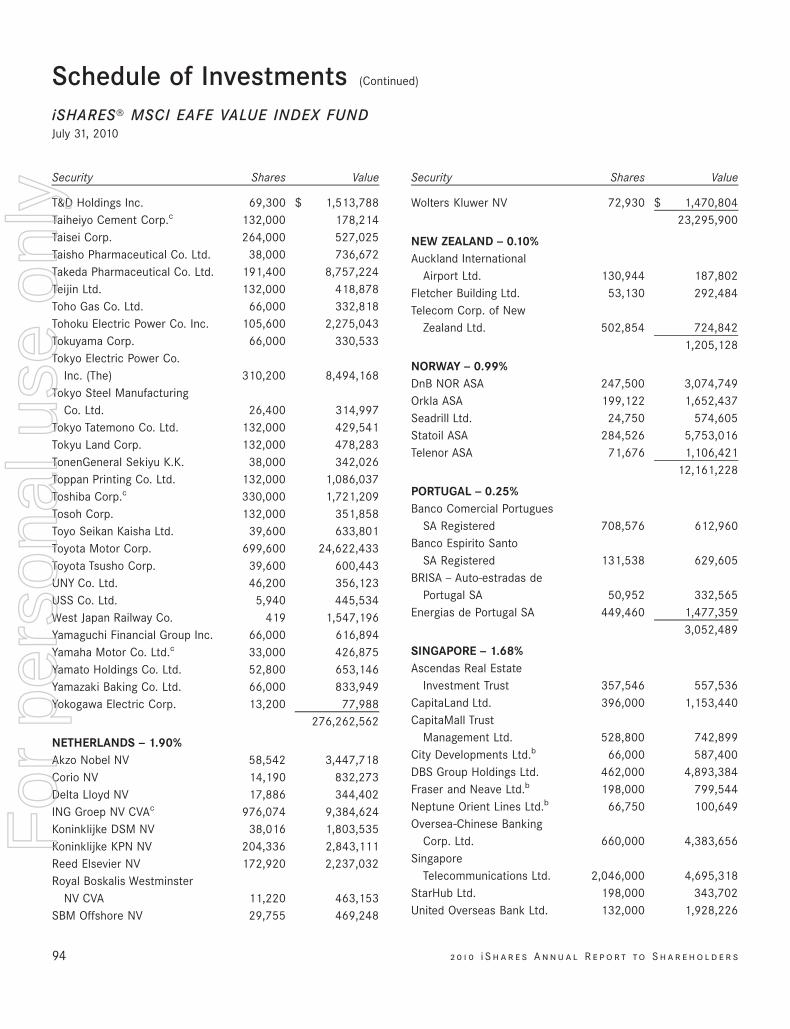
Security Shares Value
T&D Holdings Inc. 69,300 $ 1,513,788Taiheiyo Cement Corp.c 132,000 178,214Taisei Corp. 264,000 527,025Taisho Pharmaceutical Co. Ltd. 38,000 736,672Takeda Pharmaceutical Co. Ltd. 191,400 8,757,224Teijin Ltd. 132,000 418,878Toho Gas Co. Ltd. 66,000 332,818Tohoku Electric Power Co. Inc. 105,600 2,275,043Tokuyama Corp. 66,000 330,533Tokyo Electric Power Co.
Inc. (The) 310,200 8,494,168Tokyo Steel Manufacturing
Co. Ltd. 26,400 314,997Tokyo Tatemono Co. Ltd. 132,000 429,541Tokyu Land Corp. 132,000 478,283TonenGeneral Sekiyu K.K. 38,000 342,026Toppan Printing Co. Ltd. 132,000 1,086,037Toshiba Corp.c 330,000 1,721,209Tosoh Corp. 132,000 351,858Toyo Seikan Kaisha Ltd. 39,600 633,801Toyota Motor Corp. 699,600 24,622,433Toyota Tsusho Corp. 39,600 600,443UNY Co. Ltd. 46,200 356,123USS Co. Ltd. 5,940 445,534West Japan Railway Co. 419 1,547,196Yamaguchi Financial Group Inc. 66,000 616,894Yamaha Motor Co. Ltd.c 33,000 426,875Yamato Holdings Co. Ltd. 52,800 653,146Yamazaki Baking Co. Ltd. 66,000 833,949Yokogawa Electric Corp. 13,200 77,988
276,262,562
NETHERLANDS — 1.90%Akzo Nobel NV 58,542 3,447,718Corio NV 14,190 832,273Delta Lloyd NV 17,886 344,402ING Groep NV CVAc 976,074 9,384,624Koninklijke DSM NV 38,016 1,803,535Koninklijke KPN NV 204,336 2,843,111Reed Elsevier NV 172,920 2,237,032Royal Boskalis Westminster
NV CVA 11,220 463,153SBM Offshore NV 29,755 469,248
Security Shares Value
Wolters Kluwer NV 72,930 $ 1,470,80423,295,900
NEW ZEALAND — 0.10%Auckland International
Airport Ltd. 130,944 187,802Fletcher Building Ltd. 53,130 292,484Telecom Corp. of New
Zealand Ltd. 502,854 724,8421,205,128
NORWAY — 0.99%DnB NOR ASA 247,500 3,074,749Orkla ASA 199,122 1,652,437Seadrill Ltd. 24,750 574,605Statoil ASA 284,526 5,753,016Telenor ASA 71,676 1,106,421
12,161,228
PORTUGAL — 0.25%Banco Comercial Portugues
SA Registered 708,576 612,960Banco Espirito Santo
SA Registered 131,538 629,605BRISA — Auto-estradas de
Portugal SA 50,952 332,565Energias de Portugal SA 449,460 1,477,359
3,052,489
SINGAPORE — 1.68%Ascendas Real Estate
Investment Trust 357,546 557,536CapitaLand Ltd. 396,000 1,153,440CapitaMall Trust
Management Ltd. 528,800 742,899City Developments Ltd.b 66,000 587,400DBS Group Holdings Ltd. 462,000 4,893,384Fraser and Neave Ltd.b 198,000 799,544Neptune Orient Lines Ltd.b 66,750 100,649Oversea-Chinese Banking
Corp. Ltd. 660,000 4,383,656Singapore
Telecommunications Ltd. 2,046,000 4,695,318StarHub Ltd. 198,000 343,702United Overseas Bank Ltd. 132,000 1,928,226
94 2 0 1 0 i S h a r e s A n n u a l R e p o r t to S h a r e h o l d e r s
Schedule of Investments (Continued)
iSHARES» MSCI EAFE VALUE INDEX FUNDJuly 31, 2010
For
per
sona
l use
onl
y
%%TRANSMSG*** Transmitting Job: B82515 PCN: 096000000 ***%%PCMSG|94 |00005|Yes|No|09/16/2010 20:08|0|0|Page is valid, no graphics -- Color: N|
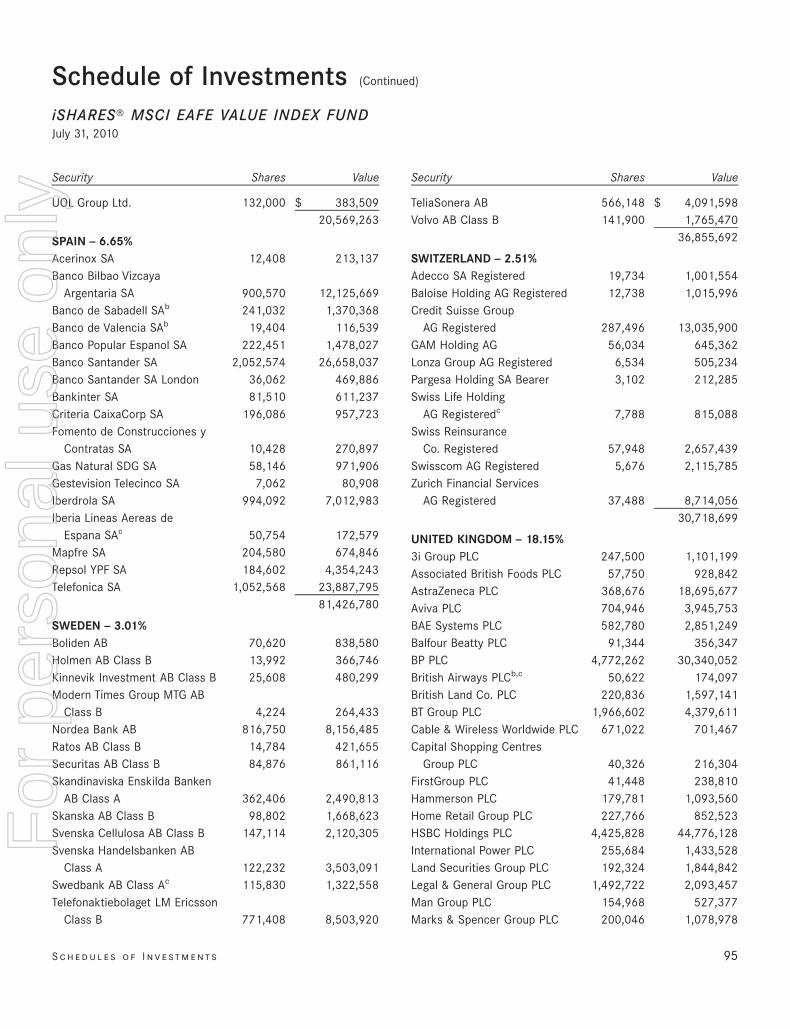
Security Shares Value
UOL Group Ltd. 132,000 $ 383,50920,569,263
SPAIN — 6.65%Acerinox SA 12,408 213,137Banco Bilbao Vizcaya
Argentaria SA 900,570 12,125,669Banco de Sabadell SAb 241,032 1,370,368Banco de Valencia SAb 19,404 116,539Banco Popular Espanol SA 222,451 1,478,027Banco Santander SA 2,052,574 26,658,037Banco Santander SA London 36,062 469,886Bankinter SA 81,510 611,237Criteria CaixaCorp SA 196,086 957,723Fomento de Construcciones y
Contratas SA 10,428 270,897Gas Natural SDG SA 58,146 971,906Gestevision Telecinco SA 7,062 80,908Iberdrola SA 994,092 7,012,983Iberia Lineas Aereas de
Espana SAc 50,754 172,579Mapfre SA 204,580 674,846Repsol YPF SA 184,602 4,354,243Telefonica SA 1,052,568 23,887,795
81,426,780
SWEDEN — 3.01%Boliden AB 70,620 838,580Holmen AB Class B 13,992 366,746Kinnevik Investment AB Class B 25,608 480,299Modern Times Group MTG AB
Class B 4,224 264,433Nordea Bank AB 816,750 8,156,485Ratos AB Class B 14,784 421,655Securitas AB Class B 84,876 861,116Skandinaviska Enskilda Banken
AB Class A 362,406 2,490,813Skanska AB Class B 98,802 1,668,623Svenska Cellulosa AB Class B 147,114 2,120,305Svenska Handelsbanken AB
Class A 122,232 3,503,091Swedbank AB Class Ac 115,830 1,322,558Telefonaktiebolaget LM Ericsson
Class B 771,408 8,503,920
Security Shares Value
TeliaSonera AB 566,148 $ 4,091,598Volvo AB Class B 141,900 1,765,470
36,855,692
SWITZERLAND — 2.51%Adecco SA Registered 19,734 1,001,554Baloise Holding AG Registered 12,738 1,015,996Credit Suisse Group
AG Registered 287,496 13,035,900GAM Holding AG 56,034 645,362Lonza Group AG Registered 6,534 505,234Pargesa Holding SA Bearer 3,102 212,285Swiss Life Holding
AG Registeredc 7,788 815,088Swiss Reinsurance
Co. Registered 57,948 2,657,439Swisscom AG Registered 5,676 2,115,785Zurich Financial Services
AG Registered 37,488 8,714,05630,718,699
UNITED KINGDOM — 18.15%3i Group PLC 247,500 1,101,199Associated British Foods PLC 57,750 928,842AstraZeneca PLC 368,676 18,695,677Aviva PLC 704,946 3,945,753BAE Systems PLC 582,780 2,851,249Balfour Beatty PLC 91,344 356,347BP PLC 4,772,262 30,340,052British Airways PLCb,c 50,622 174,097British Land Co. PLC 220,836 1,597,141BT Group PLC 1,966,602 4,379,611Cable & Wireless Worldwide PLC 671,022 701,467Capital Shopping Centres
Group PLC 40,326 216,304FirstGroup PLC 41,448 238,810Hammerson PLC 179,781 1,093,560Home Retail Group PLC 227,766 852,523HSBC Holdings PLC 4,425,828 44,776,128International Power PLC 255,684 1,433,528Land Securities Group PLC 192,324 1,844,842Legal & General Group PLC 1,492,722 2,093,457Man Group PLC 154,968 527,377Marks & Spencer Group PLC 200,046 1,078,978
S c h e d u l e s o f I n v e st m e n t s 95
Schedule of Investments (Continued)
iSHARES» MSCI EAFE VALUE INDEX FUNDJuly 31, 2010
For
per
sona
l use
onl
y
%%TRANSMSG*** Transmitting Job: B82515 PCN: 097000000 ***%%PCMSG|95 |00005|Yes|No|09/16/2010 20:08|0|0|Page is valid, no graphics -- Color: N|
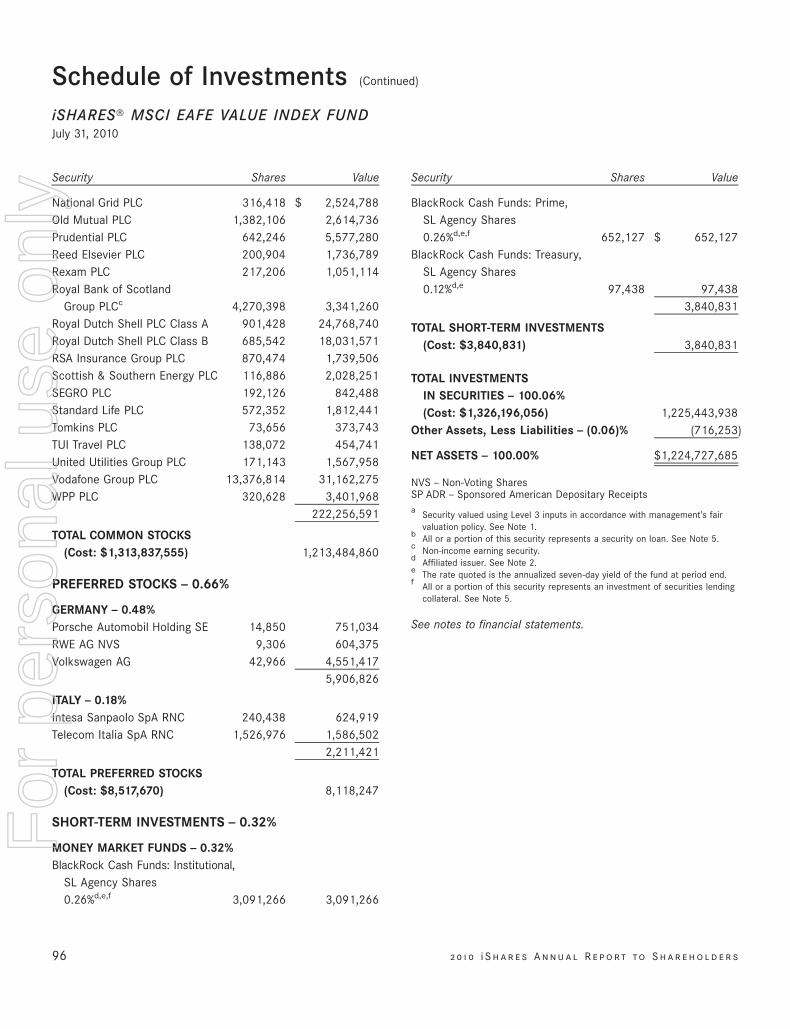
Security Shares Value
National Grid PLC 316,418 $ 2,524,788Old Mutual PLC 1,382,106 2,614,736Prudential PLC 642,246 5,577,280Reed Elsevier PLC 200,904 1,736,789Rexam PLC 217,206 1,051,114Royal Bank of Scotland
Group PLCc 4,270,398 3,341,260Royal Dutch Shell PLC Class A 901,428 24,768,740Royal Dutch Shell PLC Class B 685,542 18,031,571RSA Insurance Group PLC 870,474 1,739,506Scottish & Southern Energy PLC 116,886 2,028,251SEGRO PLC 192,126 842,488Standard Life PLC 572,352 1,812,441Tomkins PLC 73,656 373,743TUI Travel PLC 138,072 454,741United Utilities Group PLC 171,143 1,567,958Vodafone Group PLC 13,376,814 31,162,275WPP PLC 320,628 3,401,968
222,256,591
TOTAL COMMON STOCKS(Cost: $1,313,837,555) 1,213,484,860
PREFERRED STOCKS — 0.66%
GERMANY — 0.48%Porsche Automobil Holding SE 14,850 751,034RWE AG NVS 9,306 604,375Volkswagen AG 42,966 4,551,417
5,906,826
ITALY — 0.18%Intesa Sanpaolo SpA RNC 240,438 624,919Telecom Italia SpA RNC 1,526,976 1,586,502
2,211,421
TOTAL PREFERRED STOCKS(Cost: $8,517,670) 8,118,247
SHORT-TERM INVESTMENTS — 0.32%
MONEY MARKET FUNDS — 0.32%BlackRock Cash Funds: Institutional,
SL Agency Shares0.26%d,e,f 3,091,266 3,091,266
Security Shares Value
BlackRock Cash Funds: Prime,SL Agency Shares0.26%d,e,f 652,127 $ 652,127
BlackRock Cash Funds: Treasury,SL Agency Shares0.12%d,e 97,438 97,438
3,840,831
TOTAL SHORT-TERM INVESTMENTS(Cost: $3,840,831) 3,840,831
TOTAL INVESTMENTSIN SECURITIES — 100.06%(Cost: $1,326,196,056) 1,225,443,938
Other Assets, Less Liabilities — (0.06)% (716,253)
NET ASSETS — 100.00% $1,224,727,685
NVS — Non-Voting SharesSP ADR — Sponsored American Depositary Receiptsa Security valued using Level 3 inputs in accordance with management’s fair
valuation policy. See Note 1.b All or a portion of this security represents a security on loan. See Note 5.c Non-income earning security.d Affiliated issuer. See Note 2.e The rate quoted is the annualized seven-day yield of the fund at period end.f All or a portion of this security represents an investment of securities lending
collateral. See Note 5.
See notes to financial statements.
96 2 0 1 0 i S h a r e s A n n u a l R e p o r t to S h a r e h o l d e r s
Schedule of Investments (Continued)
iSHARES» MSCI EAFE VALUE INDEX FUNDJuly 31, 2010
For
per
sona
l use
onl
y
%%TRANSMSG*** Transmitting Job: B82515 PCN: 098000000 ***%%PCMSG|96 |00006|Yes|No|09/16/2010 20:08|0|0|Page is valid, no graphics -- Color: N|
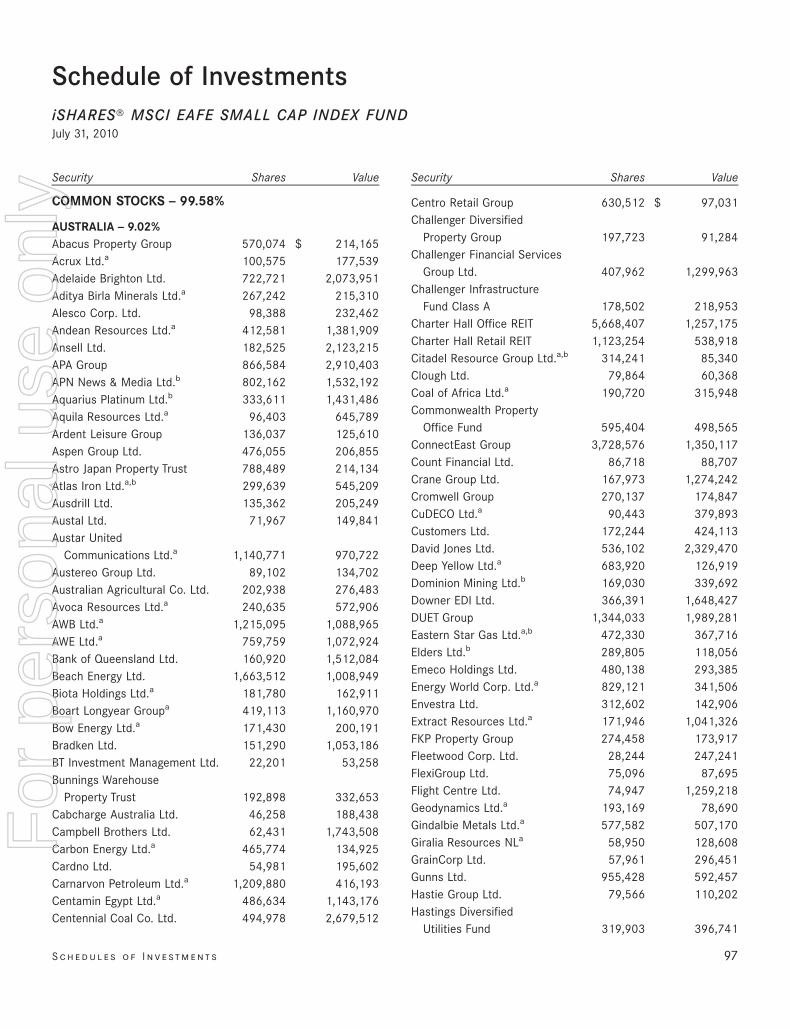
Schedule of InvestmentsiSHARES» MSCI EAFE SMALL CAP INDEX FUNDJuly 31, 2010
Security Shares Value
COMMON STOCKS — 99.58%
AUSTRALIA — 9.02%Abacus Property Group 570,074 $ 214,165Acrux Ltd.a 100,575 177,539Adelaide Brighton Ltd. 722,721 2,073,951Aditya Birla Minerals Ltd.a 267,242 215,310Alesco Corp. Ltd. 98,388 232,462Andean Resources Ltd.a 412,581 1,381,909Ansell Ltd. 182,525 2,123,215APA Group 866,584 2,910,403APN News & Media Ltd.b 802,162 1,532,192Aquarius Platinum Ltd.b 333,611 1,431,486Aquila Resources Ltd.a 96,403 645,789Ardent Leisure Group 136,037 125,610Aspen Group Ltd. 476,055 206,855Astro Japan Property Trust 788,489 214,134Atlas Iron Ltd.a,b 299,639 545,209Ausdrill Ltd. 135,362 205,249Austal Ltd. 71,967 149,841Austar United
Communications Ltd.a 1,140,771 970,722Austereo Group Ltd. 89,102 134,702Australian Agricultural Co. Ltd. 202,938 276,483Avoca Resources Ltd.a 240,635 572,906AWB Ltd.a 1,215,095 1,088,965AWE Ltd.a 759,759 1,072,924Bank of Queensland Ltd. 160,920 1,512,084Beach Energy Ltd. 1,663,512 1,008,949Biota Holdings Ltd.a 181,780 162,911Boart Longyear Groupa 419,113 1,160,970Bow Energy Ltd.a 171,430 200,191Bradken Ltd. 151,290 1,053,186BT Investment Management Ltd. 22,201 53,258Bunnings Warehouse
Property Trust 192,898 332,653Cabcharge Australia Ltd. 46,258 188,438Campbell Brothers Ltd. 62,431 1,743,508Carbon Energy Ltd.a 465,774 134,925Cardno Ltd. 54,981 195,602Carnarvon Petroleum Ltd.a 1,209,880 416,193Centamin Egypt Ltd.a 486,634 1,143,176Centennial Coal Co. Ltd. 494,978 2,679,512
Security Shares Value
Centro Retail Group 630,512 $ 97,031Challenger Diversified
Property Group 197,723 91,284Challenger Financial Services
Group Ltd. 407,962 1,299,963Challenger Infrastructure
Fund Class A 178,502 218,953Charter Hall Office REIT 5,668,407 1,257,175Charter Hall Retail REIT 1,123,254 538,918Citadel Resource Group Ltd.a,b 314,241 85,340Clough Ltd. 79,864 60,368Coal of Africa Ltd.a 190,720 315,948Commonwealth Property
Office Fund 595,404 498,565ConnectEast Group 3,728,576 1,350,117Count Financial Ltd. 86,718 88,707Crane Group Ltd. 167,973 1,274,242Cromwell Group 270,137 174,847CuDECO Ltd.a 90,443 379,893Customers Ltd. 172,244 424,113David Jones Ltd. 536,102 2,329,470Deep Yellow Ltd.a 683,920 126,919Dominion Mining Ltd.b 169,030 339,692Downer EDI Ltd. 366,391 1,648,427DUET Group 1,344,033 1,989,281Eastern Star Gas Ltd.a,b 472,330 367,716Elders Ltd.b 289,805 118,056Emeco Holdings Ltd. 480,138 293,385Energy World Corp. Ltd.a 829,121 341,506Envestra Ltd. 312,602 142,906Extract Resources Ltd.a 171,946 1,041,326FKP Property Group 274,458 173,917Fleetwood Corp. Ltd. 28,244 247,241FlexiGroup Ltd. 75,096 87,695Flight Centre Ltd. 74,947 1,259,218Geodynamics Ltd.a 193,169 78,690Gindalbie Metals Ltd.a 577,582 507,170Giralia Resources NLa 58,950 128,608GrainCorp Ltd. 57,961 296,451Gunns Ltd. 955,428 592,457Hastie Group Ltd. 79,566 110,202Hastings Diversified
Utilities Fund 319,903 396,741
S c h e d u l e s o f I n v e st m e n t s 97
For
per
sona
l use
onl
y
%%TRANSMSG*** Transmitting Job: B82515 PCN: 099000000 ***%%PCMSG|97 |00009|Yes|No|09/16/2010 20:08|0|0|Page is valid, no graphics -- Color: N|
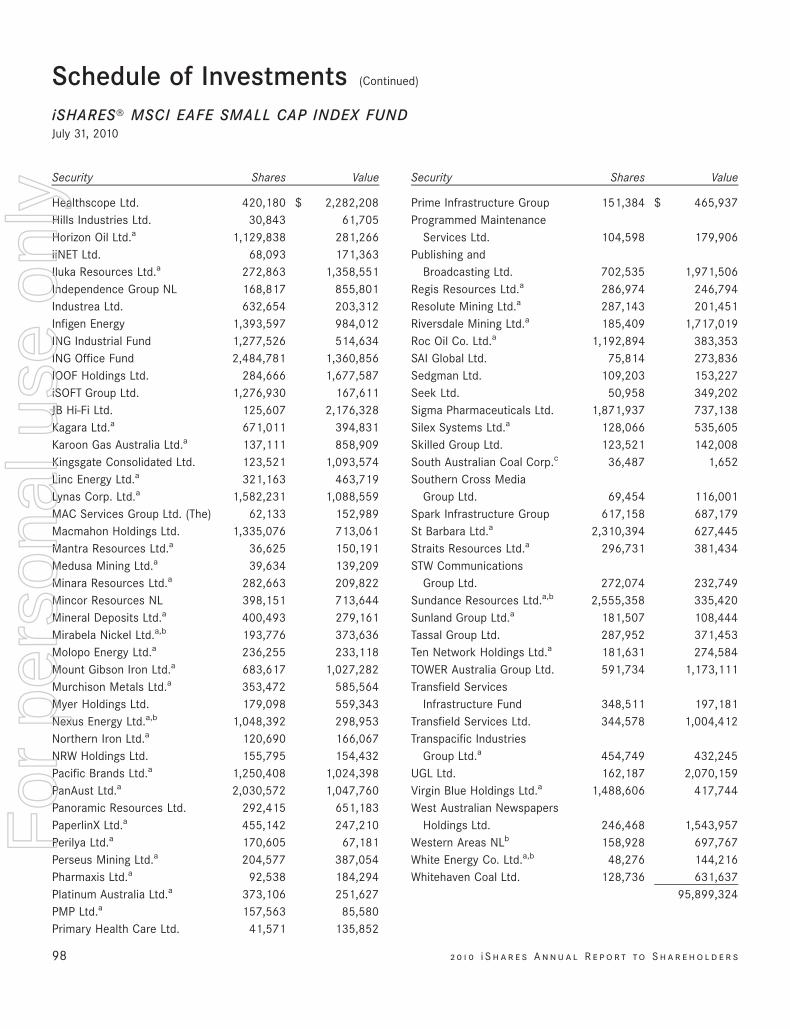
Security Shares Value
Healthscope Ltd. 420,180 $ 2,282,208Hills Industries Ltd. 30,843 61,705Horizon Oil Ltd.a 1,129,838 281,266iiNET Ltd. 68,093 171,363Iluka Resources Ltd.a 272,863 1,358,551Independence Group NL 168,817 855,801Industrea Ltd. 632,654 203,312Infigen Energy 1,393,597 984,012ING Industrial Fund 1,277,526 514,634ING Office Fund 2,484,781 1,360,856IOOF Holdings Ltd. 284,666 1,677,587iSOFT Group Ltd. 1,276,930 167,611JB Hi-Fi Ltd. 125,607 2,176,328Kagara Ltd.a 671,011 394,831Karoon Gas Australia Ltd.a 137,111 858,909Kingsgate Consolidated Ltd. 123,521 1,093,574Linc Energy Ltd.a 321,163 463,719Lynas Corp. Ltd.a 1,582,231 1,088,559MAC Services Group Ltd. (The) 62,133 152,989Macmahon Holdings Ltd. 1,335,076 713,061Mantra Resources Ltd.a 36,625 150,191Medusa Mining Ltd.a 39,634 139,209Minara Resources Ltd.a 282,663 209,822Mincor Resources NL 398,151 713,644Mineral Deposits Ltd.a 400,493 279,161Mirabela Nickel Ltd.a,b 193,776 373,636Molopo Energy Ltd.a 236,255 233,118Mount Gibson Iron Ltd.a 683,617 1,027,282Murchison Metals Ltd.a 353,472 585,564Myer Holdings Ltd. 179,098 559,343Nexus Energy Ltd.a,b 1,048,392 298,953Northern Iron Ltd.a 120,690 166,067NRW Holdings Ltd. 155,795 154,432Pacific Brands Ltd.a 1,250,408 1,024,398PanAust Ltd.a 2,030,572 1,047,760Panoramic Resources Ltd. 292,415 651,183PaperlinX Ltd.a 455,142 247,210Perilya Ltd.a 170,605 67,181Perseus Mining Ltd.a 204,577 387,054Pharmaxis Ltd.a 92,538 184,294Platinum Australia Ltd.a 373,106 251,627PMP Ltd.a 157,563 85,580Primary Health Care Ltd. 41,571 135,852
Security Shares Value
Prime Infrastructure Group 151,384 $ 465,937Programmed Maintenance
Services Ltd. 104,598 179,906Publishing and
Broadcasting Ltd. 702,535 1,971,506Regis Resources Ltd.a 286,974 246,794Resolute Mining Ltd.a 287,143 201,451Riversdale Mining Ltd.a 185,409 1,717,019Roc Oil Co. Ltd.a 1,192,894 383,353SAI Global Ltd. 75,814 273,836Sedgman Ltd. 109,203 153,227Seek Ltd. 50,958 349,202Sigma Pharmaceuticals Ltd. 1,871,937 737,138Silex Systems Ltd.a 128,066 535,605Skilled Group Ltd. 123,521 142,008South Australian Coal Corp.c 36,487 1,652Southern Cross Media
Group Ltd. 69,454 116,001Spark Infrastructure Group 617,158 687,179St Barbara Ltd.a 2,310,394 627,445Straits Resources Ltd.a 296,731 381,434STW Communications
Group Ltd. 272,074 232,749Sundance Resources Ltd.a,b 2,555,358 335,420Sunland Group Ltd.a 181,507 108,444Tassal Group Ltd. 287,952 371,453Ten Network Holdings Ltd.a 181,631 274,584TOWER Australia Group Ltd. 591,734 1,173,111Transfield Services
Infrastructure Fund 348,511 197,181Transfield Services Ltd. 344,578 1,004,412Transpacific Industries
Group Ltd.a 454,749 432,245UGL Ltd. 162,187 2,070,159Virgin Blue Holdings Ltd.a 1,488,606 417,744West Australian Newspapers
Holdings Ltd. 246,468 1,543,957Western Areas NLb 158,928 697,767White Energy Co. Ltd.a,b 48,276 144,216Whitehaven Coal Ltd. 128,736 631,637
95,899,324
98 2 0 1 0 i S h a r e s A n n u a l R e p o r t to S h a r e h o l d e r s
Schedule of Investments (Continued)
iSHARES» MSCI EAFE SMALL CAP INDEX FUNDJuly 31, 2010
For
per
sona
l use
onl
y
%%TRANSMSG*** Transmitting Job: B82515 PCN: 100000000 ***%%PCMSG|98 |00010|Yes|No|09/16/2010 20:08|0|0|Page is valid, no graphics -- Color: N|
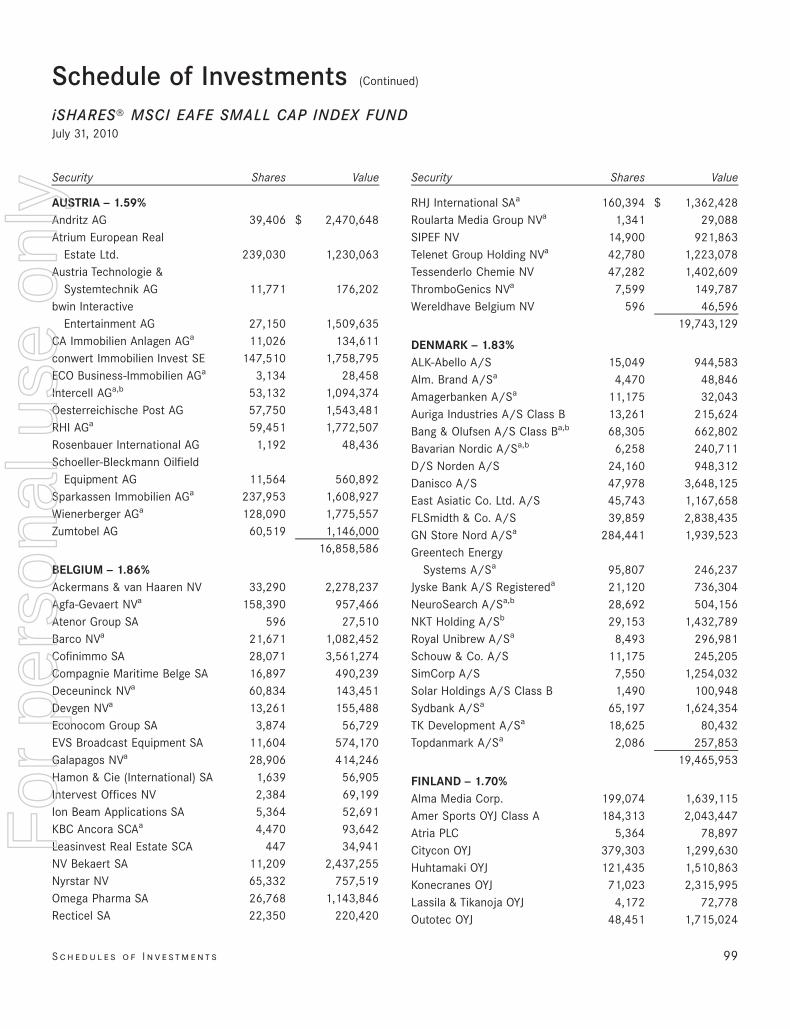
Security Shares Value
AUSTRIA — 1.59%Andritz AG 39,406 $ 2,470,648Atrium European Real
Estate Ltd. 239,030 1,230,063Austria Technologie &
Systemtechnik AG 11,771 176,202bwin Interactive
Entertainment AG 27,150 1,509,635CA Immobilien Anlagen AGa 11,026 134,611conwert Immobilien Invest SE 147,510 1,758,795ECO Business-Immobilien AGa 3,134 28,458Intercell AGa,b 53,132 1,094,374Oesterreichische Post AG 57,750 1,543,481RHI AGa 59,451 1,772,507Rosenbauer International AG 1,192 48,436Schoeller-Bleckmann Oilfield
Equipment AG 11,564 560,892Sparkassen Immobilien AGa 237,953 1,608,927Wienerberger AGa 128,090 1,775,557Zumtobel AG 60,519 1,146,000
16,858,586
BELGIUM — 1.86%Ackermans & van Haaren NV 33,290 2,278,237Agfa-Gevaert NVa 158,390 957,466Atenor Group SA 596 27,510Barco NVa 21,671 1,082,452Cofinimmo SA 28,071 3,561,274Compagnie Maritime Belge SA 16,897 490,239Deceuninck NVa 60,834 143,451Devgen NVa 13,261 155,488Econocom Group SA 3,874 56,729EVS Broadcast Equipment SA 11,604 574,170Galapagos NVa 28,906 414,246Hamon & Cie (International) SA 1,639 56,905Intervest Offices NV 2,384 69,199Ion Beam Applications SA 5,364 52,691KBC Ancora SCAa 4,470 93,642Leasinvest Real Estate SCA 447 34,941NV Bekaert SA 11,209 2,437,255Nyrstar NV 65,332 757,519Omega Pharma SA 26,768 1,143,846Recticel SA 22,350 220,420
Security Shares Value
RHJ International SAa 160,394 $ 1,362,428Roularta Media Group NVa 1,341 29,088SIPEF NV 14,900 921,863Telenet Group Holding NVa 42,780 1,223,078Tessenderlo Chemie NV 47,282 1,402,609ThromboGenics NVa 7,599 149,787Wereldhave Belgium NV 596 46,596
19,743,129
DENMARK — 1.83%ALK-Abello A/S 15,049 944,583Alm. Brand A/Sa 4,470 48,846Amagerbanken A/Sa 11,175 32,043Auriga Industries A/S Class B 13,261 215,624Bang & Olufsen A/S Class Ba,b 68,305 662,802Bavarian Nordic A/Sa,b 6,258 240,711D/S Norden A/S 24,160 948,312Danisco A/S 47,978 3,648,125East Asiatic Co. Ltd. A/S 45,743 1,167,658FLSmidth & Co. A/S 39,859 2,838,435GN Store Nord A/Sa 284,441 1,939,523Greentech Energy
Systems A/Sa 95,807 246,237Jyske Bank A/S Registereda 21,120 736,304NeuroSearch A/Sa,b 28,692 504,156NKT Holding A/Sb 29,153 1,432,789Royal Unibrew A/Sa 8,493 296,981Schouw & Co. A/S 11,175 245,205SimCorp A/S 7,550 1,254,032Solar Holdings A/S Class B 1,490 100,948Sydbank A/Sa 65,197 1,624,354TK Development A/Sa 18,625 80,432Topdanmark A/Sa 2,086 257,853
19,465,953
FINLAND — 1.70%Alma Media Corp. 199,074 1,639,115Amer Sports OYJ Class A 184,313 2,043,447Atria PLC 5,364 78,897Citycon OYJ 379,303 1,299,630Huhtamaki OYJ 121,435 1,510,863Konecranes OYJ 71,023 2,315,995Lassila & Tikanoja OYJ 4,172 72,778Outotec OYJ 48,451 1,715,024
S c h e d u l e s o f I n v e st m e n t s 99
Schedule of Investments (Continued)
iSHARES» MSCI EAFE SMALL CAP INDEX FUNDJuly 31, 2010
For
per
sona
l use
onl
y
%%TRANSMSG*** Transmitting Job: B82515 PCN: 101000000 ***%%PCMSG|99 |00009|Yes|No|09/16/2010 20:08|0|0|Page is valid, no graphics -- Color: N|
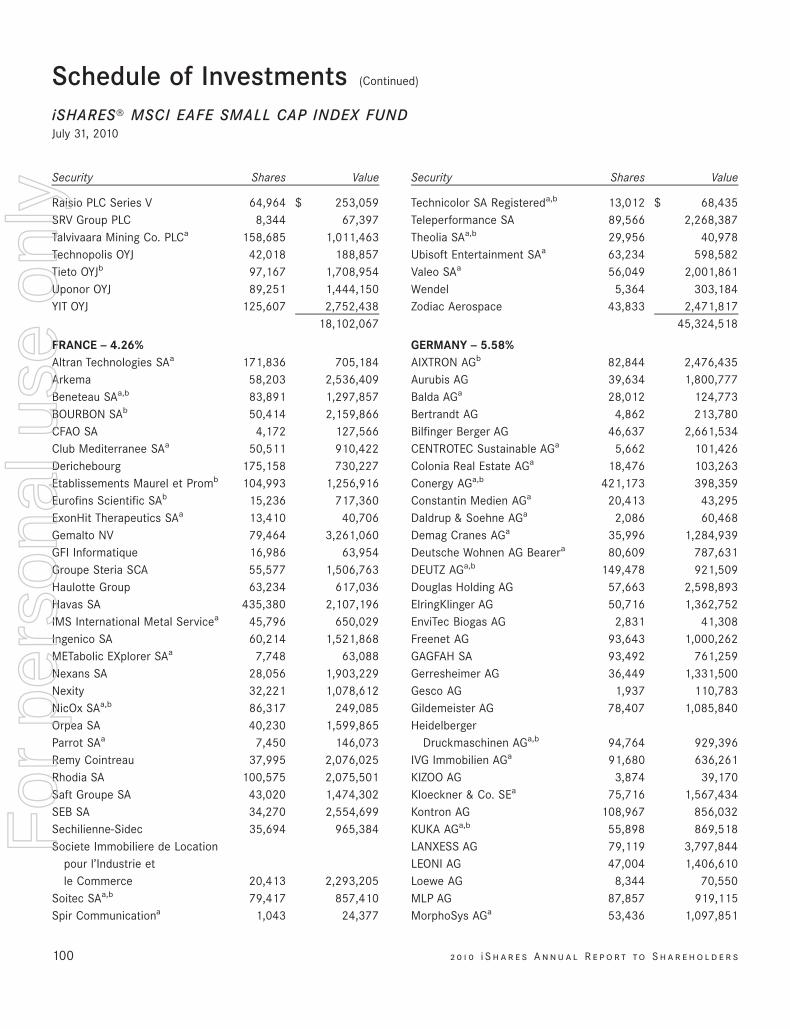
Security Shares Value
Raisio PLC Series V 64,964 $ 253,059SRV Group PLC 8,344 67,397Talvivaara Mining Co. PLCa 158,685 1,011,463Technopolis OYJ 42,018 188,857Tieto OYJb 97,167 1,708,954Uponor OYJ 89,251 1,444,150YIT OYJ 125,607 2,752,438
18,102,067
FRANCE — 4.26%Altran Technologies SAa 171,836 705,184Arkema 58,203 2,536,409Beneteau SAa,b 83,891 1,297,857BOURBON SAb 50,414 2,159,866CFAO SA 4,172 127,566Club Mediterranee SAa 50,511 910,422Derichebourg 175,158 730,227Etablissements Maurel et Promb 104,993 1,256,916Eurofins Scientific SAb 15,236 717,360ExonHit Therapeutics SAa 13,410 40,706Gemalto NV 79,464 3,261,060GFI Informatique 16,986 63,954Groupe Steria SCA 55,577 1,506,763Haulotte Group 63,234 617,036Havas SA 435,380 2,107,196IMS International Metal Servicea 45,796 650,029Ingenico SA 60,214 1,521,868METabolic EXplorer SAa 7,748 63,088Nexans SA 28,056 1,903,229Nexity 32,221 1,078,612NicOx SAa,b 86,317 249,085Orpea SA 40,230 1,599,865Parrot SAa 7,450 146,073Remy Cointreau 37,995 2,076,025Rhodia SA 100,575 2,075,501Saft Groupe SA 43,020 1,474,302SEB SA 34,270 2,554,699Sechilienne-Sidec 35,694 965,384Societe Immobiliere de Location
pour l’Industrie etle Commerce 20,413 2,293,205
Soitec SAa,b 79,417 857,410Spir Communicationa 1,043 24,377
Security Shares Value
Technicolor SA Registereda,b 13,012 $ 68,435Teleperformance SA 89,566 2,268,387Theolia SAa,b 29,956 40,978Ubisoft Entertainment SAa 63,234 598,582Valeo SAa 56,049 2,001,861Wendel 5,364 303,184Zodiac Aerospace 43,833 2,471,817
45,324,518
GERMANY — 5.58%AIXTRON AGb 82,844 2,476,435Aurubis AG 39,634 1,800,777Balda AGa 28,012 124,773Bertrandt AG 4,862 213,780Bilfinger Berger AG 46,637 2,661,534CENTROTEC Sustainable AGa 5,662 101,426Colonia Real Estate AGa 18,476 103,263Conergy AGa,b 421,173 398,359Constantin Medien AGa 20,413 43,295Daldrup & Soehne AGa 2,086 60,468Demag Cranes AGa 35,996 1,284,939Deutsche Wohnen AG Bearera 80,609 787,631DEUTZ AGa,b 149,478 921,509Douglas Holding AG 57,663 2,598,893ElringKlinger AG 50,716 1,362,752EnviTec Biogas AG 2,831 41,308Freenet AG 93,643 1,000,262GAGFAH SA 93,492 761,259Gerresheimer AG 36,449 1,331,500Gesco AG 1,937 110,783Gildemeister AG 78,407 1,085,840Heidelberger
Druckmaschinen AGa,b 94,764 929,396IVG Immobilien AGa 91,680 636,261KIZOO AG 3,874 39,170Kloeckner & Co. SEa 75,716 1,567,434Kontron AG 108,967 856,032KUKA AGa,b 55,898 869,518LANXESS AG 79,119 3,797,844LEONI AG 47,004 1,406,610Loewe AG 8,344 70,550MLP AG 87,857 919,115MorphoSys AGa 53,436 1,097,851
100 2 0 1 0 i S h a r e s A n n u a l R e p o r t to S h a r e h o l d e r s
Schedule of Investments (Continued)
iSHARES» MSCI EAFE SMALL CAP INDEX FUNDJuly 31, 2010
For
per
sona
l use
onl
y
%%TRANSMSG*** Transmitting Job: B82515 PCN: 102000000 ***%%PCMSG|100 |00011|Yes|No|09/16/2010 20:08|0|0|Page is valid, no graphics -- Color: N|
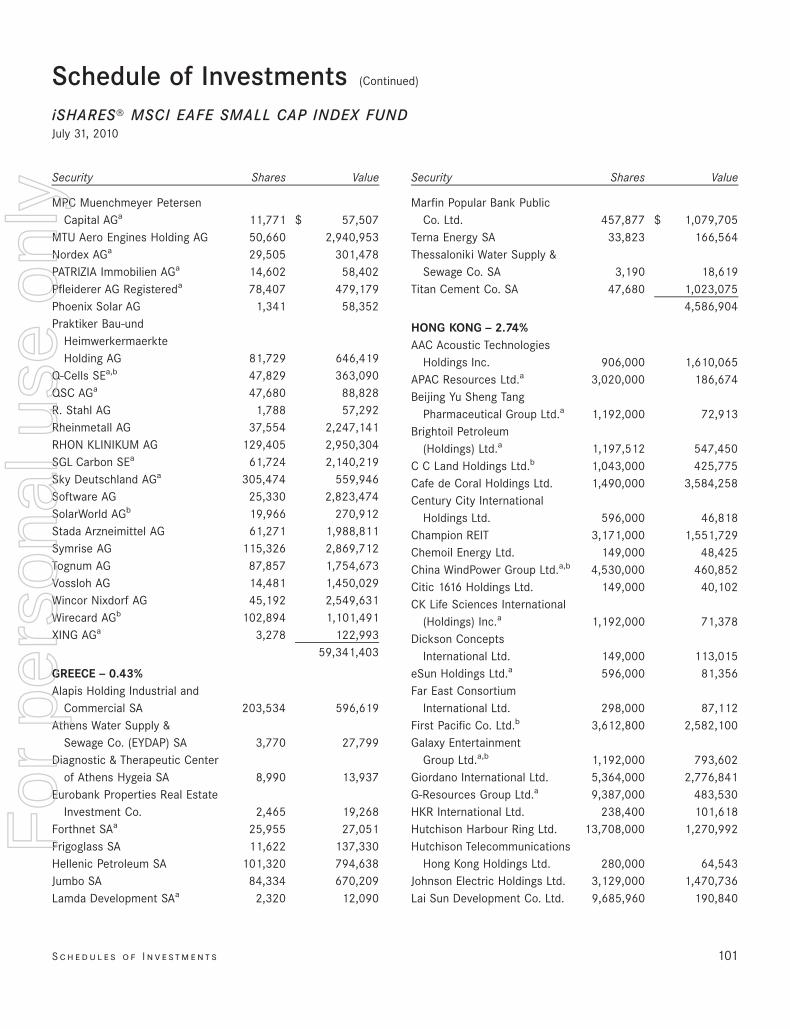
Security Shares Value
MPC Muenchmeyer PetersenCapital AGa 11,771 $ 57,507
MTU Aero Engines Holding AG 50,660 2,940,953Nordex AGa 29,505 301,478PATRIZIA Immobilien AGa 14,602 58,402Pfleiderer AG Registereda 78,407 479,179Phoenix Solar AG 1,341 58,352Praktiker Bau-und
HeimwerkermaerkteHolding AG 81,729 646,419
Q-Cells SEa,b 47,829 363,090QSC AGa 47,680 88,828R. Stahl AG 1,788 57,292Rheinmetall AG 37,554 2,247,141RHON KLINIKUM AG 129,405 2,950,304SGL Carbon SEa 61,724 2,140,219Sky Deutschland AGa 305,474 559,946Software AG 25,330 2,823,474SolarWorld AGb 19,966 270,912Stada Arzneimittel AG 61,271 1,988,811Symrise AG 115,326 2,869,712Tognum AG 87,857 1,754,673Vossloh AG 14,481 1,450,029Wincor Nixdorf AG 45,192 2,549,631Wirecard AGb 102,894 1,101,491XING AGa 3,278 122,993
59,341,403
GREECE — 0.43%Alapis Holding Industrial and
Commercial SA 203,534 596,619Athens Water Supply &
Sewage Co. (EYDAP) SA 3,770 27,799Diagnostic & Therapeutic Center
of Athens Hygeia SA 8,990 13,937Eurobank Properties Real Estate
Investment Co. 2,465 19,268Forthnet SAa 25,955 27,051Frigoglass SA 11,622 137,330Hellenic Petroleum SA 101,320 794,638Jumbo SA 84,334 670,209Lamda Development SAa 2,320 12,090
Security Shares Value
Marfin Popular Bank PublicCo. Ltd. 457,877 $ 1,079,705
Terna Energy SA 33,823 166,564Thessaloniki Water Supply &
Sewage Co. SA 3,190 18,619Titan Cement Co. SA 47,680 1,023,075
4,586,904
HONG KONG — 2.74%AAC Acoustic Technologies
Holdings Inc. 906,000 1,610,065APAC Resources Ltd.a 3,020,000 186,674Beijing Yu Sheng Tang
Pharmaceutical Group Ltd.a 1,192,000 72,913Brightoil Petroleum
(Holdings) Ltd.a 1,197,512 547,450C C Land Holdings Ltd.b 1,043,000 425,775Cafe de Coral Holdings Ltd. 1,490,000 3,584,258Century City International
Holdings Ltd. 596,000 46,818Champion REIT 3,171,000 1,551,729Chemoil Energy Ltd. 149,000 48,425China WindPower Group Ltd.a,b 4,530,000 460,852Citic 1616 Holdings Ltd. 149,000 40,102CK Life Sciences International
(Holdings) Inc.a 1,192,000 71,378Dickson Concepts
International Ltd. 149,000 113,015eSun Holdings Ltd.a 596,000 81,356Far East Consortium
International Ltd. 298,000 87,112First Pacific Co. Ltd.b 3,612,800 2,582,100Galaxy Entertainment
Group Ltd.a,b 1,192,000 793,602Giordano International Ltd. 5,364,000 2,776,841G-Resources Group Ltd.a 9,387,000 483,530HKR International Ltd. 238,400 101,618Hutchison Harbour Ring Ltd. 13,708,000 1,270,992Hutchison Telecommunications
Hong Kong Holdings Ltd. 280,000 64,543Johnson Electric Holdings Ltd. 3,129,000 1,470,736Lai Sun Development Co. Ltd. 9,685,960 190,840
S c h e d u l e s o f I n v e st m e n t s 101
Schedule of Investments (Continued)
iSHARES» MSCI EAFE SMALL CAP INDEX FUNDJuly 31, 2010
For
per
sona
l use
onl
y
%%TRANSMSG*** Transmitting Job: B82515 PCN: 103000000 ***%%PCMSG|101 |00010|Yes|No|09/16/2010 20:08|0|0|Page is valid, no graphics -- Color: N|
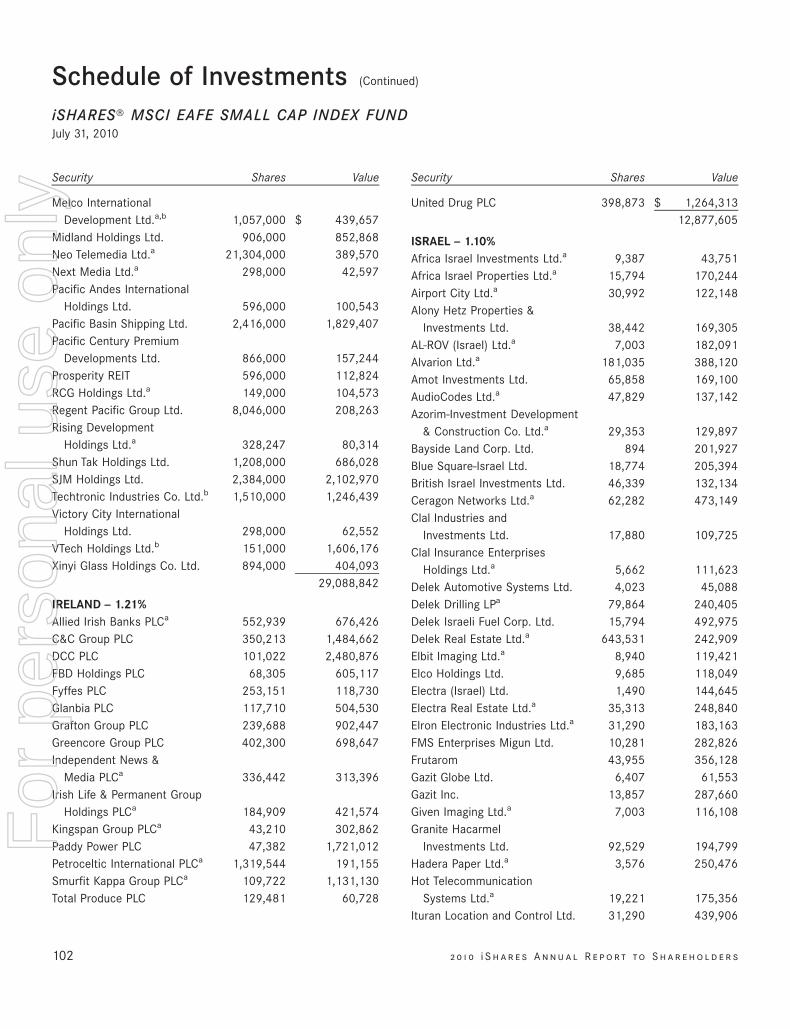
Security Shares Value
Melco InternationalDevelopment Ltd.a,b 1,057,000 $ 439,657
Midland Holdings Ltd. 906,000 852,868Neo Telemedia Ltd.a 21,304,000 389,570Next Media Ltd.a 298,000 42,597Pacific Andes International
Holdings Ltd. 596,000 100,543Pacific Basin Shipping Ltd. 2,416,000 1,829,407Pacific Century Premium
Developments Ltd. 866,000 157,244Prosperity REIT 596,000 112,824RCG Holdings Ltd.a 149,000 104,573Regent Pacific Group Ltd. 8,046,000 208,263Rising Development
Holdings Ltd.a 328,247 80,314Shun Tak Holdings Ltd. 1,208,000 686,028SJM Holdings Ltd. 2,384,000 2,102,970Techtronic Industries Co. Ltd.b 1,510,000 1,246,439Victory City International
Holdings Ltd. 298,000 62,552VTech Holdings Ltd.b 151,000 1,606,176Xinyi Glass Holdings Co. Ltd. 894,000 404,093
29,088,842
IRELAND — 1.21%Allied Irish Banks PLCa 552,939 676,426C&C Group PLC 350,213 1,484,662DCC PLC 101,022 2,480,876FBD Holdings PLC 68,305 605,117Fyffes PLC 253,151 118,730Glanbia PLC 117,710 504,530Grafton Group PLC 239,688 902,447Greencore Group PLC 402,300 698,647Independent News &
Media PLCa 336,442 313,396Irish Life & Permanent Group
Holdings PLCa 184,909 421,574Kingspan Group PLCa 43,210 302,862Paddy Power PLC 47,382 1,721,012Petroceltic International PLCa 1,319,544 191,155Smurfit Kappa Group PLCa 109,722 1,131,130Total Produce PLC 129,481 60,728
Security Shares Value
United Drug PLC 398,873 $ 1,264,31312,877,605
ISRAEL — 1.10%Africa Israel Investments Ltd.a 9,387 43,751Africa Israel Properties Ltd.a 15,794 170,244Airport City Ltd.a 30,992 122,148Alony Hetz Properties &
Investments Ltd. 38,442 169,305AL-ROV (Israel) Ltd.a 7,003 182,091Alvarion Ltd.a 181,035 388,120Amot Investments Ltd. 65,858 169,100AudioCodes Ltd.a 47,829 137,142Azorim-Investment Development
& Construction Co. Ltd.a 29,353 129,897Bayside Land Corp. Ltd. 894 201,927Blue Square-Israel Ltd. 18,774 205,394British Israel Investments Ltd. 46,339 132,134Ceragon Networks Ltd.a 62,282 473,149Clal Industries and
Investments Ltd. 17,880 109,725Clal Insurance Enterprises
Holdings Ltd.a 5,662 111,623Delek Automotive Systems Ltd. 4,023 45,088Delek Drilling LPa 79,864 240,405Delek Israeli Fuel Corp. Ltd. 15,794 492,975Delek Real Estate Ltd.a 643,531 242,909Elbit Imaging Ltd.a 8,940 119,421Elco Holdings Ltd. 9,685 118,049Electra (Israel) Ltd. 1,490 144,645Electra Real Estate Ltd.a 35,313 248,840Elron Electronic Industries Ltd.a 31,290 183,163FMS Enterprises Migun Ltd. 10,281 282,826Frutarom 43,955 356,128Gazit Globe Ltd. 6,407 61,553Gazit Inc. 13,857 287,660Given Imaging Ltd.a 7,003 116,108Granite Hacarmel
Investments Ltd. 92,529 194,799Hadera Paper Ltd.a 3,576 250,476Hot Telecommunication
Systems Ltd.a 19,221 175,356Ituran Location and Control Ltd. 31,290 439,906
102 2 0 1 0 i S h a r e s A n n u a l R e p o r t to S h a r e h o l d e r s
Schedule of Investments (Continued)
iSHARES» MSCI EAFE SMALL CAP INDEX FUNDJuly 31, 2010
For
per
sona
l use
onl
y
%%TRANSMSG*** Transmitting Job: B82515 PCN: 104000000 ***%%PCMSG|102 |00005|Yes|No|09/16/2010 20:08|0|0|Page is valid, no graphics -- Color: N|
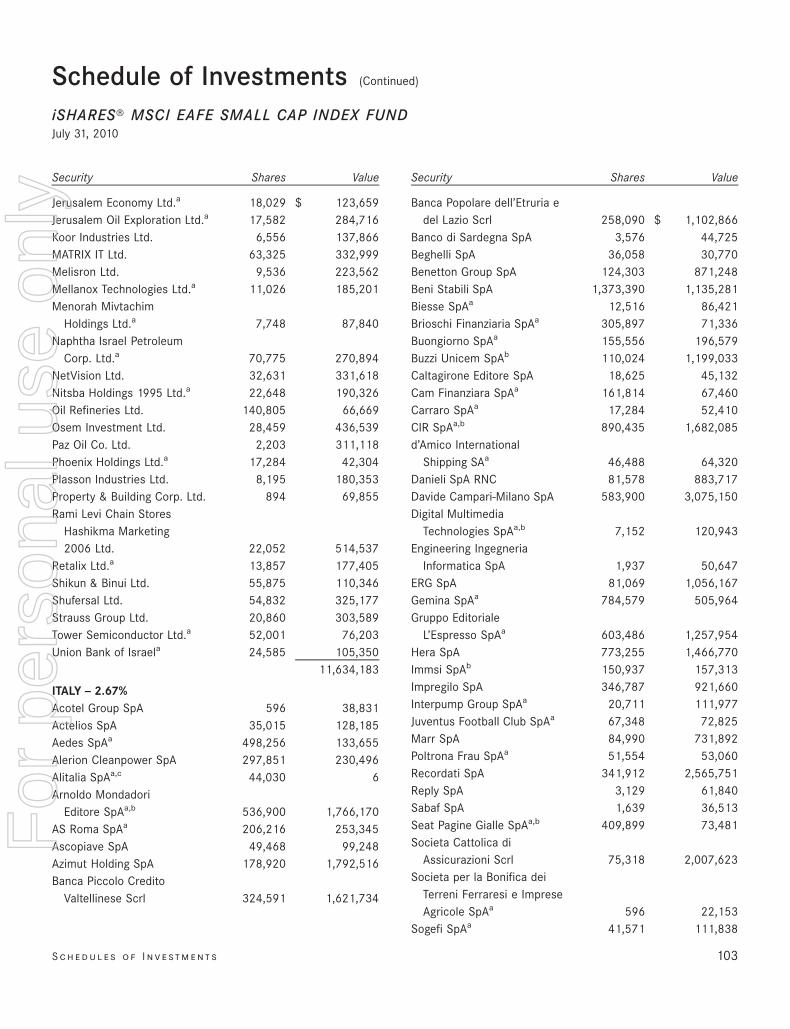
Security Shares Value
Jerusalem Economy Ltd.a 18,029 $ 123,659Jerusalem Oil Exploration Ltd.a 17,582 284,716Koor Industries Ltd. 6,556 137,866MATRIX IT Ltd. 63,325 332,999Melisron Ltd. 9,536 223,562Mellanox Technologies Ltd.a 11,026 185,201Menorah Mivtachim
Holdings Ltd.a 7,748 87,840Naphtha Israel Petroleum
Corp. Ltd.a 70,775 270,894NetVision Ltd. 32,631 331,618Nitsba Holdings 1995 Ltd.a 22,648 190,326Oil Refineries Ltd. 140,805 66,669Osem Investment Ltd. 28,459 436,539Paz Oil Co. Ltd. 2,203 311,118Phoenix Holdings Ltd.a 17,284 42,304Plasson Industries Ltd. 8,195 180,353Property & Building Corp. Ltd. 894 69,855Rami Levi Chain Stores
Hashikma Marketing2006 Ltd. 22,052 514,537
Retalix Ltd.a 13,857 177,405Shikun & Binui Ltd. 55,875 110,346Shufersal Ltd. 54,832 325,177Strauss Group Ltd. 20,860 303,589Tower Semiconductor Ltd.a 52,001 76,203Union Bank of Israela 24,585 105,350
11,634,183
ITALY — 2.67%Acotel Group SpA 596 38,831Actelios SpA 35,015 128,185Aedes SpAa 498,256 133,655Alerion Cleanpower SpA 297,851 230,496Alitalia SpAa,c 44,030 6Arnoldo Mondadori
Editore SpAa,b 536,900 1,766,170AS Roma SpAa 206,216 253,345Ascopiave SpA 49,468 99,248Azimut Holding SpA 178,920 1,792,516Banca Piccolo Credito
Valtellinese Scrl 324,591 1,621,734
Security Shares Value
Banca Popolare dell’Etruria edel Lazio Scrl 258,090 $ 1,102,866
Banco di Sardegna SpA 3,576 44,725Beghelli SpA 36,058 30,770Benetton Group SpA 124,303 871,248Beni Stabili SpA 1,373,390 1,135,281Biesse SpAa 12,516 86,421Brioschi Finanziaria SpAa 305,897 71,336Buongiorno SpAa 155,556 196,579Buzzi Unicem SpAb 110,024 1,199,033Caltagirone Editore SpA 18,625 45,132Cam Finanziara SpAa 161,814 67,460Carraro SpAa 17,284 52,410CIR SpAa,b 890,435 1,682,085d’Amico International
Shipping SAa 46,488 64,320Danieli SpA RNC 81,578 883,717Davide Campari-Milano SpA 583,900 3,075,150Digital Multimedia
Technologies SpAa,b 7,152 120,943Engineering Ingegneria
Informatica SpA 1,937 50,647ERG SpA 81,069 1,056,167Gemina SpAa 784,579 505,964Gruppo Editoriale
L’Espresso SpAa 603,486 1,257,954Hera SpA 773,255 1,466,770Immsi SpAb 150,937 157,313Impregilo SpA 346,787 921,660Interpump Group SpAa 20,711 111,977Juventus Football Club SpAa 67,348 72,825Marr SpA 84,990 731,892Poltrona Frau SpAa 51,554 53,060Recordati SpA 341,912 2,565,751Reply SpA 3,129 61,840Sabaf SpA 1,639 36,513Seat Pagine Gialle SpAa,b 409,899 73,481Societa Cattolica di
Assicurazioni Scrl 75,318 2,007,623Societa per la Bonifica dei
Terreni Ferraresi e ImpreseAgricole SpAa 596 22,153
Sogefi SpAa 41,571 111,838
S c h e d u l e s o f I n v e st m e n t s 103
Schedule of Investments (Continued)
iSHARES» MSCI EAFE SMALL CAP INDEX FUNDJuly 31, 2010
For
per
sona
l use
onl
y
%%TRANSMSG*** Transmitting Job: B82515 PCN: 105000000 ***%%PCMSG|103 |00008|Yes|No|09/16/2010 20:08|0|0|Page is valid, no graphics -- Color: N|
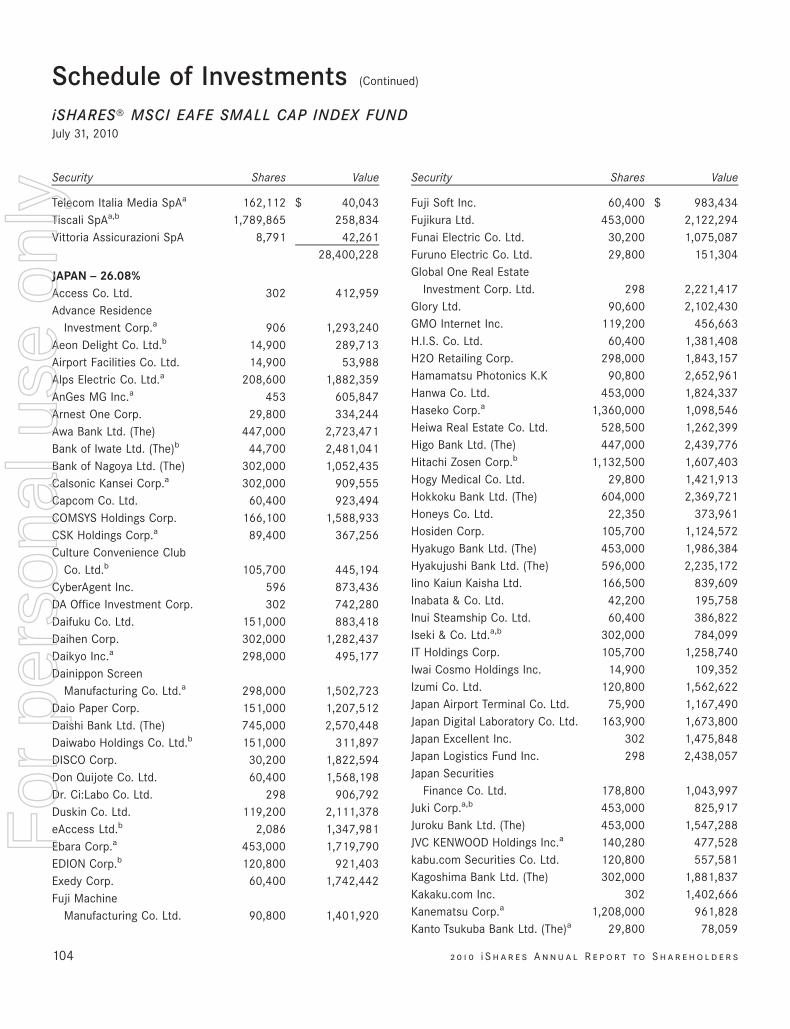
Security Shares Value
Telecom Italia Media SpAa 162,112 $ 40,043Tiscali SpAa,b 1,789,865 258,834Vittoria Assicurazioni SpA 8,791 42,261
28,400,228
JAPAN — 26.08%Access Co. Ltd. 302 412,959Advance Residence
Investment Corp.a 906 1,293,240Aeon Delight Co. Ltd.b 14,900 289,713Airport Facilities Co. Ltd. 14,900 53,988Alps Electric Co. Ltd.a 208,600 1,882,359AnGes MG Inc.a 453 605,847Arnest One Corp. 29,800 334,244Awa Bank Ltd. (The) 447,000 2,723,471Bank of Iwate Ltd. (The)b 44,700 2,481,041Bank of Nagoya Ltd. (The) 302,000 1,052,435Calsonic Kansei Corp.a 302,000 909,555Capcom Co. Ltd. 60,400 923,494COMSYS Holdings Corp. 166,100 1,588,933CSK Holdings Corp.a 89,400 367,256Culture Convenience Club
Co. Ltd.b 105,700 445,194CyberAgent Inc. 596 873,436DA Office Investment Corp. 302 742,280Daifuku Co. Ltd. 151,000 883,418Daihen Corp. 302,000 1,282,437Daikyo Inc.a 298,000 495,177Dainippon Screen
Manufacturing Co. Ltd.a 298,000 1,502,723Daio Paper Corp. 151,000 1,207,512Daishi Bank Ltd. (The) 745,000 2,570,448Daiwabo Holdings Co. Ltd.b 151,000 311,897DISCO Corp. 30,200 1,822,594Don Quijote Co. Ltd. 60,400 1,568,198Dr. Ci:Labo Co. Ltd. 298 906,792Duskin Co. Ltd. 119,200 2,111,378eAccess Ltd.b 2,086 1,347,981Ebara Corp.a 453,000 1,719,790EDION Corp.b 120,800 921,403Exedy Corp. 60,400 1,742,442Fuji Machine
Manufacturing Co. Ltd. 90,800 1,401,920
Security Shares Value
Fuji Soft Inc. 60,400 $ 983,434Fujikura Ltd. 453,000 2,122,294Funai Electric Co. Ltd. 30,200 1,075,087Furuno Electric Co. Ltd. 29,800 151,304Global One Real Estate
Investment Corp. Ltd. 298 2,221,417Glory Ltd. 90,600 2,102,430GMO Internet Inc. 119,200 456,663H.I.S. Co. Ltd. 60,400 1,381,408H2O Retailing Corp. 298,000 1,843,157Hamamatsu Photonics K.K 90,800 2,652,961Hanwa Co. Ltd. 453,000 1,824,337Haseko Corp.a 1,360,000 1,098,546Heiwa Real Estate Co. Ltd. 528,500 1,262,399Higo Bank Ltd. (The) 447,000 2,439,776Hitachi Zosen Corp.b 1,132,500 1,607,403Hogy Medical Co. Ltd. 29,800 1,421,913Hokkoku Bank Ltd. (The) 604,000 2,369,721Honeys Co. Ltd. 22,350 373,961Hosiden Corp. 105,700 1,124,572Hyakugo Bank Ltd. (The) 453,000 1,986,384Hyakujushi Bank Ltd. (The) 596,000 2,235,172Iino Kaiun Kaisha Ltd. 166,500 839,609Inabata & Co. Ltd. 42,200 195,758Inui Steamship Co. Ltd. 60,400 386,822Iseki & Co. Ltd.a,b 302,000 784,099IT Holdings Corp. 105,700 1,258,740Iwai Cosmo Holdings Inc. 14,900 109,352Izumi Co. Ltd. 120,800 1,562,622Japan Airport Terminal Co. Ltd. 75,900 1,167,490Japan Digital Laboratory Co. Ltd. 163,900 1,673,800Japan Excellent Inc. 302 1,475,848Japan Logistics Fund Inc. 298 2,438,057Japan Securities
Finance Co. Ltd. 178,800 1,043,997Juki Corp.a,b 453,000 825,917Juroku Bank Ltd. (The) 453,000 1,547,288JVC KENWOOD Holdings Inc.a 140,280 477,528kabu.com Securities Co. Ltd. 120,800 557,581Kagoshima Bank Ltd. (The) 302,000 1,881,837Kakaku.com Inc. 302 1,402,666Kanematsu Corp.a 1,208,000 961,828Kanto Tsukuba Bank Ltd. (The)a 29,800 78,059
104 2 0 1 0 i S h a r e s A n n u a l R e p o r t to S h a r e h o l d e r s
Schedule of Investments (Continued)
iSHARES» MSCI EAFE SMALL CAP INDEX FUNDJuly 31, 2010
For
per
sona
l use
onl
y
%%TRANSMSG*** Transmitting Job: B82515 PCN: 106000000 ***%%PCMSG|104 |00008|Yes|No|09/16/2010 20:08|0|0|Page is valid, no graphics -- Color: N|
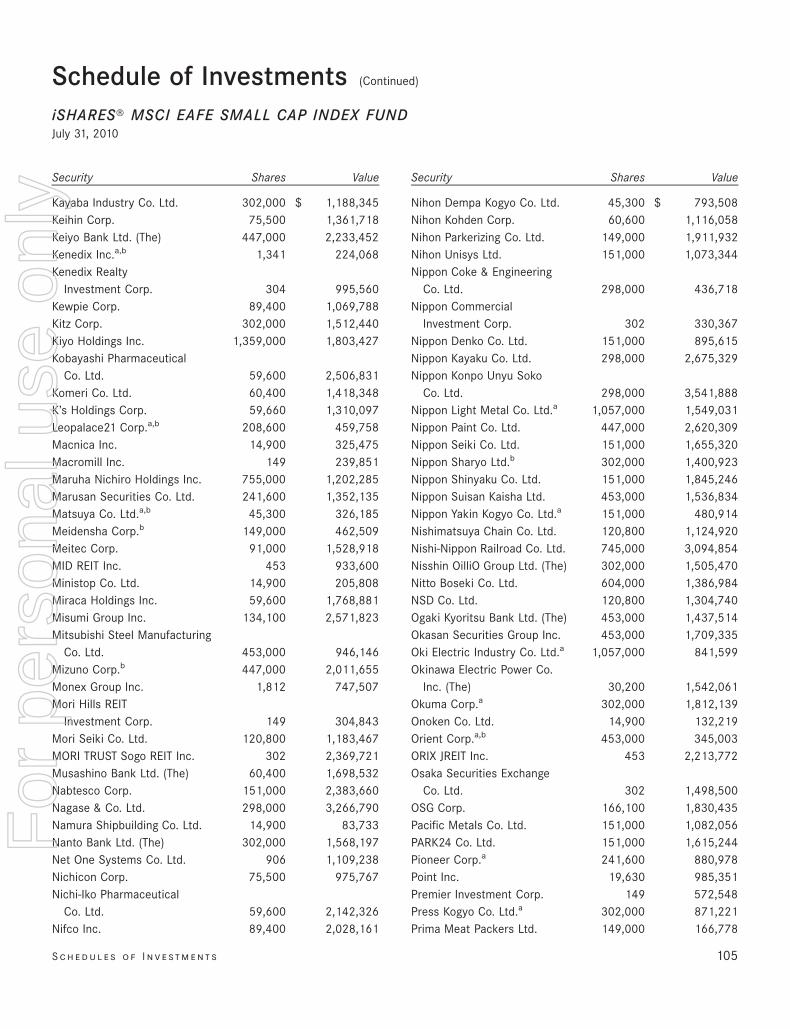
Security Shares Value
Kayaba Industry Co. Ltd. 302,000 $ 1,188,345Keihin Corp. 75,500 1,361,718Keiyo Bank Ltd. (The) 447,000 2,233,452Kenedix Inc.a,b 1,341 224,068Kenedix Realty
Investment Corp. 304 995,560Kewpie Corp. 89,400 1,069,788Kitz Corp. 302,000 1,512,440Kiyo Holdings Inc. 1,359,000 1,803,427Kobayashi Pharmaceutical
Co. Ltd. 59,600 2,506,831Komeri Co. Ltd. 60,400 1,418,348K’s Holdings Corp. 59,660 1,310,097Leopalace21 Corp.a,b 208,600 459,758Macnica Inc. 14,900 325,475Macromill Inc. 149 239,851Maruha Nichiro Holdings Inc. 755,000 1,202,285Marusan Securities Co. Ltd. 241,600 1,352,135Matsuya Co. Ltd.a,b 45,300 326,185Meidensha Corp.b 149,000 462,509Meitec Corp. 91,000 1,528,918MID REIT Inc. 453 933,600Ministop Co. Ltd. 14,900 205,808Miraca Holdings Inc. 59,600 1,768,881Misumi Group Inc. 134,100 2,571,823Mitsubishi Steel Manufacturing
Co. Ltd. 453,000 946,146Mizuno Corp.b 447,000 2,011,655Monex Group Inc. 1,812 747,507Mori Hills REIT
Investment Corp. 149 304,843Mori Seiki Co. Ltd. 120,800 1,183,467MORI TRUST Sogo REIT Inc. 302 2,369,721Musashino Bank Ltd. (The) 60,400 1,698,532Nabtesco Corp. 151,000 2,383,660Nagase & Co. Ltd. 298,000 3,266,790Namura Shipbuilding Co. Ltd. 14,900 83,733Nanto Bank Ltd. (The) 302,000 1,568,197Net One Systems Co. Ltd. 906 1,109,238Nichicon Corp. 75,500 975,767Nichi-Iko Pharmaceutical
Co. Ltd. 59,600 2,142,326Nifco Inc. 89,400 2,028,161
Security Shares Value
Nihon Dempa Kogyo Co. Ltd. 45,300 $ 793,508Nihon Kohden Corp. 60,600 1,116,058Nihon Parkerizing Co. Ltd. 149,000 1,911,932Nihon Unisys Ltd. 151,000 1,073,344Nippon Coke & Engineering
Co. Ltd. 298,000 436,718Nippon Commercial
Investment Corp. 302 330,367Nippon Denko Co. Ltd. 151,000 895,615Nippon Kayaku Co. Ltd. 298,000 2,675,329Nippon Konpo Unyu Soko
Co. Ltd. 298,000 3,541,888Nippon Light Metal Co. Ltd.a 1,057,000 1,549,031Nippon Paint Co. Ltd. 447,000 2,620,309Nippon Seiki Co. Ltd. 151,000 1,655,320Nippon Sharyo Ltd.b 302,000 1,400,923Nippon Shinyaku Co. Ltd. 151,000 1,845,246Nippon Suisan Kaisha Ltd. 453,000 1,536,834Nippon Yakin Kogyo Co. Ltd.a 151,000 480,914Nishimatsuya Chain Co. Ltd. 120,800 1,124,920Nishi-Nippon Railroad Co. Ltd. 745,000 3,094,854Nisshin OilliO Group Ltd. (The) 302,000 1,505,470Nitto Boseki Co. Ltd. 604,000 1,386,984NSD Co. Ltd. 120,800 1,304,740Ogaki Kyoritsu Bank Ltd. (The) 453,000 1,437,514Okasan Securities Group Inc. 453,000 1,709,335Oki Electric Industry Co. Ltd.a 1,057,000 841,599Okinawa Electric Power Co.
Inc. (The) 30,200 1,542,061Okuma Corp.a 302,000 1,812,139Onoken Co. Ltd. 14,900 132,219Orient Corp.a,b 453,000 345,003ORIX JREIT Inc. 453 2,213,772Osaka Securities Exchange
Co. Ltd. 302 1,498,500OSG Corp. 166,100 1,830,435Pacific Metals Co. Ltd. 151,000 1,082,056PARK24 Co. Ltd. 151,000 1,615,244Pioneer Corp.a 241,600 880,978Point Inc. 19,630 985,351Premier Investment Corp. 149 572,548Press Kogyo Co. Ltd.a 302,000 871,221Prima Meat Packers Ltd. 149,000 166,778
S c h e d u l e s o f I n v e st m e n t s 105
Schedule of Investments (Continued)
iSHARES» MSCI EAFE SMALL CAP INDEX FUNDJuly 31, 2010
For
per
sona
l use
onl
y
%%TRANSMSG*** Transmitting Job: B82515 PCN: 107000000 ***%%PCMSG|105 |00008|Yes|No|09/16/2010 20:08|0|0|Page is valid, no graphics -- Color: N|
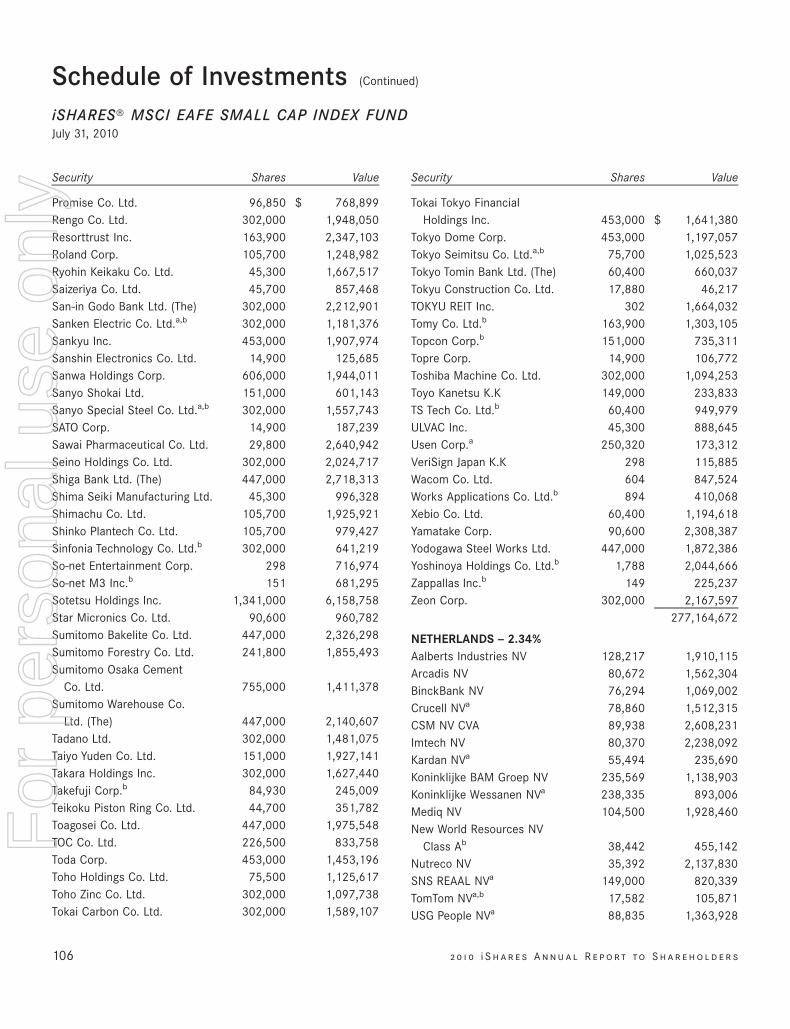
Security Shares Value
Promise Co. Ltd. 96,850 $ 768,899Rengo Co. Ltd. 302,000 1,948,050Resorttrust Inc. 163,900 2,347,103Roland Corp. 105,700 1,248,982Ryohin Keikaku Co. Ltd. 45,300 1,667,517Saizeriya Co. Ltd. 45,700 857,468San-in Godo Bank Ltd. (The) 302,000 2,212,901Sanken Electric Co. Ltd.a,b 302,000 1,181,376Sankyu Inc. 453,000 1,907,974Sanshin Electronics Co. Ltd. 14,900 125,685Sanwa Holdings Corp. 606,000 1,944,011Sanyo Shokai Ltd. 151,000 601,143Sanyo Special Steel Co. Ltd.a,b 302,000 1,557,743SATO Corp. 14,900 187,239Sawai Pharmaceutical Co. Ltd. 29,800 2,640,942Seino Holdings Co. Ltd. 302,000 2,024,717Shiga Bank Ltd. (The) 447,000 2,718,313Shima Seiki Manufacturing Ltd. 45,300 996,328Shimachu Co. Ltd. 105,700 1,925,921Shinko Plantech Co. Ltd. 105,700 979,427Sinfonia Technology Co. Ltd.b 302,000 641,219So-net Entertainment Corp. 298 716,974So-net M3 Inc.b 151 681,295Sotetsu Holdings Inc. 1,341,000 6,158,758Star Micronics Co. Ltd. 90,600 960,782Sumitomo Bakelite Co. Ltd. 447,000 2,326,298Sumitomo Forestry Co. Ltd. 241,800 1,855,493Sumitomo Osaka Cement
Co. Ltd. 755,000 1,411,378Sumitomo Warehouse Co.
Ltd. (The) 447,000 2,140,607Tadano Ltd. 302,000 1,481,075Taiyo Yuden Co. Ltd. 151,000 1,927,141Takara Holdings Inc. 302,000 1,627,440Takefuji Corp.b 84,930 245,009Teikoku Piston Ring Co. Ltd. 44,700 351,782Toagosei Co. Ltd. 447,000 1,975,548TOC Co. Ltd. 226,500 833,758Toda Corp. 453,000 1,453,196Toho Holdings Co. Ltd. 75,500 1,125,617Toho Zinc Co. Ltd. 302,000 1,097,738Tokai Carbon Co. Ltd. 302,000 1,589,107
Security Shares Value
Tokai Tokyo FinancialHoldings Inc. 453,000 $ 1,641,380
Tokyo Dome Corp. 453,000 1,197,057Tokyo Seimitsu Co. Ltd.a,b 75,700 1,025,523Tokyo Tomin Bank Ltd. (The) 60,400 660,037Tokyu Construction Co. Ltd. 17,880 46,217TOKYU REIT Inc. 302 1,664,032Tomy Co. Ltd.b 163,900 1,303,105Topcon Corp.b 151,000 735,311Topre Corp. 14,900 106,772Toshiba Machine Co. Ltd. 302,000 1,094,253Toyo Kanetsu K.K 149,000 233,833TS Tech Co. Ltd.b 60,400 949,979ULVAC Inc. 45,300 888,645Usen Corp.a 250,320 173,312VeriSign Japan K.K 298 115,885Wacom Co. Ltd. 604 847,524Works Applications Co. Ltd.b 894 410,068Xebio Co. Ltd. 60,400 1,194,618Yamatake Corp. 90,600 2,308,387Yodogawa Steel Works Ltd. 447,000 1,872,386Yoshinoya Holdings Co. Ltd.b 1,788 2,044,666Zappallas Inc.b 149 225,237Zeon Corp. 302,000 2,167,597
277,164,672
NETHERLANDS — 2.34%Aalberts Industries NV 128,217 1,910,115Arcadis NV 80,672 1,562,304BinckBank NV 76,294 1,069,002Crucell NVa 78,860 1,512,315CSM NV CVA 89,938 2,608,231Imtech NV 80,370 2,238,092Kardan NVa 55,494 235,690Koninklijke BAM Groep NV 235,569 1,138,903Koninklijke Wessanen NVa 238,335 893,006Mediq NV 104,500 1,928,460New World Resources NV
Class Ab 38,442 455,142Nutreco NV 35,392 2,137,830SNS REAAL NVa 149,000 820,339TomTom NVa,b 17,582 105,871USG People NVa 88,835 1,363,928
106 2 0 1 0 i S h a r e s A n n u a l R e p o r t to S h a r e h o l d e r s
Schedule of Investments (Continued)
iSHARES» MSCI EAFE SMALL CAP INDEX FUNDJuly 31, 2010
For
per
sona
l use
onl
y
%%TRANSMSG*** Transmitting Job: B82515 PCN: 108000000 ***%%PCMSG|106 |00008|Yes|No|09/16/2010 20:08|0|0|Page is valid, no graphics -- Color: N|
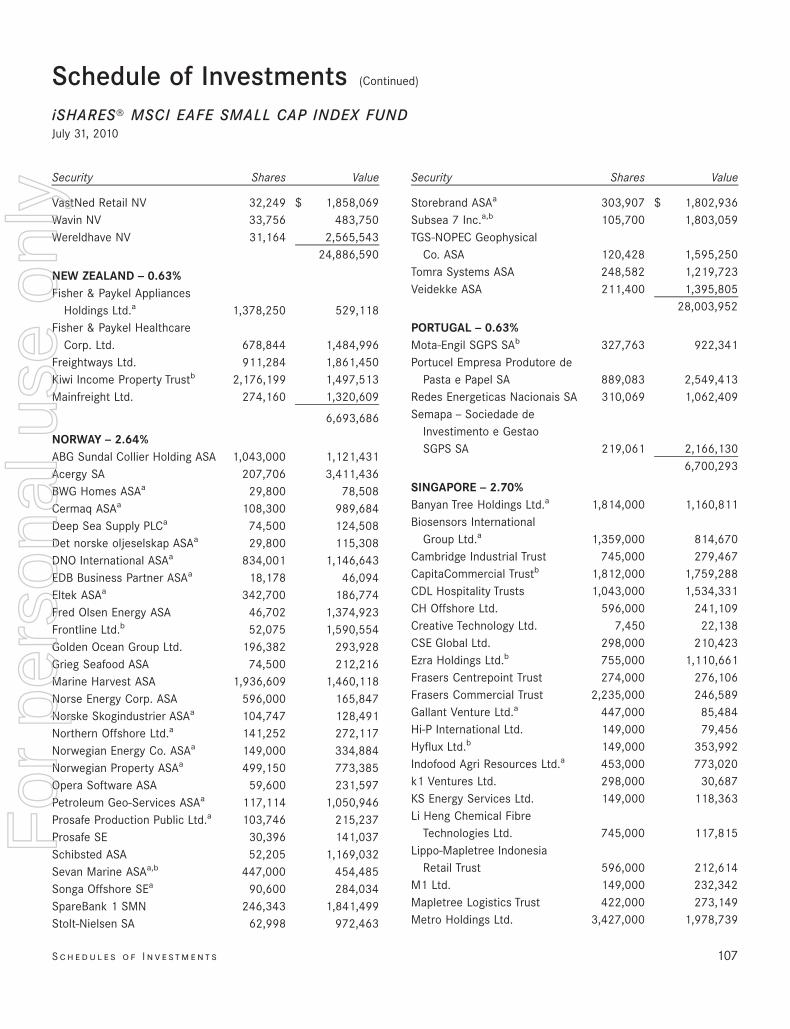
Security Shares Value
VastNed Retail NV 32,249 $ 1,858,069Wavin NV 33,756 483,750Wereldhave NV 31,164 2,565,543
24,886,590
NEW ZEALAND — 0.63%Fisher & Paykel Appliances
Holdings Ltd.a 1,378,250 529,118Fisher & Paykel Healthcare
Corp. Ltd. 678,844 1,484,996Freightways Ltd. 911,284 1,861,450Kiwi Income Property Trustb 2,176,199 1,497,513Mainfreight Ltd. 274,160 1,320,609
6,693,686
NORWAY — 2.64%ABG Sundal Collier Holding ASA 1,043,000 1,121,431Acergy SA 207,706 3,411,436BWG Homes ASAa 29,800 78,508Cermaq ASAa 108,300 989,684Deep Sea Supply PLCa 74,500 124,508Det norske oljeselskap ASAa 29,800 115,308DNO International ASAa 834,001 1,146,643EDB Business Partner ASAa 18,178 46,094Eltek ASAa 342,700 186,774Fred Olsen Energy ASA 46,702 1,374,923Frontline Ltd.b 52,075 1,590,554Golden Ocean Group Ltd. 196,382 293,928Grieg Seafood ASA 74,500 212,216Marine Harvest ASA 1,936,609 1,460,118Norse Energy Corp. ASA 596,000 165,847Norske Skogindustrier ASAa 104,747 128,491Northern Offshore Ltd.a 141,252 272,117Norwegian Energy Co. ASAa 149,000 334,884Norwegian Property ASAa 499,150 773,385Opera Software ASA 59,600 231,597Petroleum Geo-Services ASAa 117,114 1,050,946Prosafe Production Public Ltd.a 103,746 215,237Prosafe SE 30,396 141,037Schibsted ASA 52,205 1,169,032Sevan Marine ASAa,b 447,000 454,485Songa Offshore SEa 90,600 284,034SpareBank 1 SMN 246,343 1,841,499Stolt-Nielsen SA 62,998 972,463
Security Shares Value
Storebrand ASAa 303,907 $ 1,802,936Subsea 7 Inc.a,b 105,700 1,803,059TGS-NOPEC Geophysical
Co. ASA 120,428 1,595,250Tomra Systems ASA 248,582 1,219,723Veidekke ASA 211,400 1,395,805
28,003,952
PORTUGAL — 0.63%Mota-Engil SGPS SAb 327,763 922,341Portucel Empresa Produtore de
Pasta e Papel SA 889,083 2,549,413Redes Energeticas Nacionais SA 310,069 1,062,409Semapa — Sociedade de
Investimento e GestaoSGPS SA 219,061 2,166,130
6,700,293
SINGAPORE — 2.70%Banyan Tree Holdings Ltd.a 1,814,000 1,160,811Biosensors International
Group Ltd.a 1,359,000 814,670Cambridge Industrial Trust 745,000 279,467CapitaCommercial Trustb 1,812,000 1,759,288CDL Hospitality Trusts 1,043,000 1,534,331CH Offshore Ltd. 596,000 241,109Creative Technology Ltd. 7,450 22,138CSE Global Ltd. 298,000 210,423Ezra Holdings Ltd.b 755,000 1,110,661Frasers Centrepoint Trust 274,000 276,106Frasers Commercial Trust 2,235,000 246,589Gallant Venture Ltd.a 447,000 85,484Hi-P International Ltd. 149,000 79,456Hyflux Ltd.b 149,000 353,992Indofood Agri Resources Ltd.a 453,000 773,020k1 Ventures Ltd. 298,000 30,687KS Energy Services Ltd. 149,000 118,363Li Heng Chemical Fibre
Technologies Ltd. 745,000 117,815Lippo-Mapletree Indonesia
Retail Trust 596,000 212,614M1 Ltd. 149,000 232,342Mapletree Logistics Trust 422,000 273,149Metro Holdings Ltd. 3,427,000 1,978,739
S c h e d u l e s o f I n v e st m e n t s 107
Schedule of Investments (Continued)
iSHARES» MSCI EAFE SMALL CAP INDEX FUNDJuly 31, 2010
For
per
sona
l use
onl
y
%%TRANSMSG*** Transmitting Job: B82515 PCN: 109000000 ***%%PCMSG|107 |00008|Yes|No|09/16/2010 20:08|0|0|Page is valid, no graphics -- Color: N|
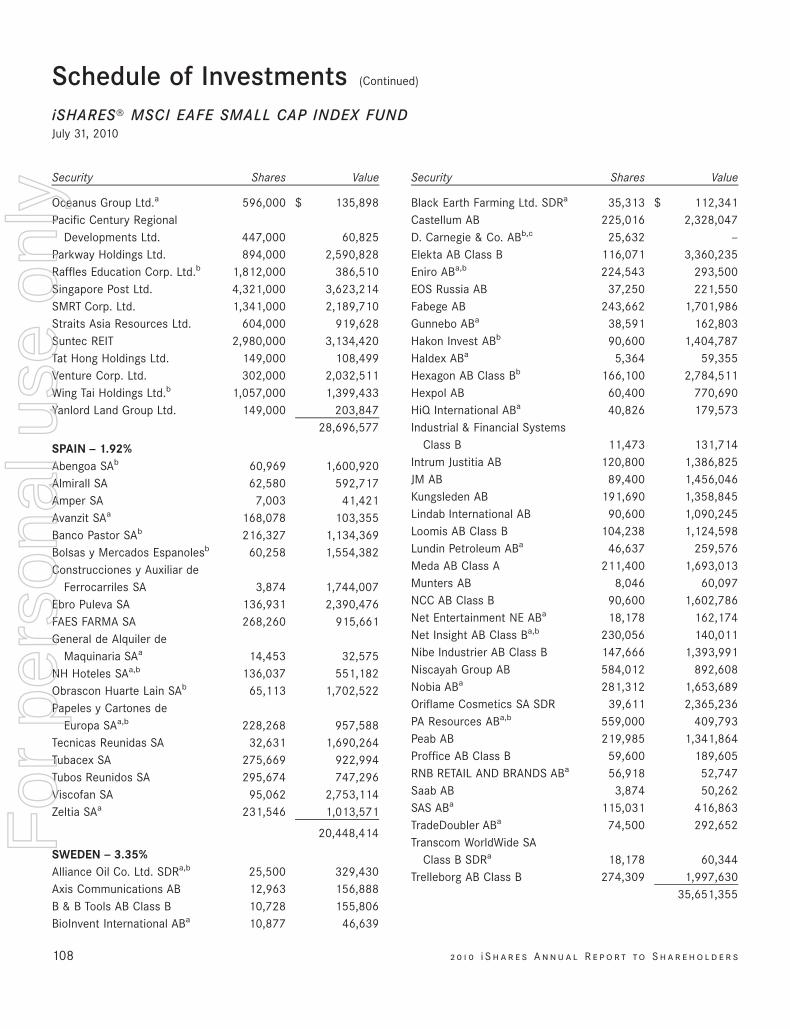
Security Shares Value
Oceanus Group Ltd.a 596,000 $ 135,898Pacific Century Regional
Developments Ltd. 447,000 60,825Parkway Holdings Ltd. 894,000 2,590,828Raffles Education Corp. Ltd.b 1,812,000 386,510Singapore Post Ltd. 4,321,000 3,623,214SMRT Corp. Ltd. 1,341,000 2,189,710Straits Asia Resources Ltd. 604,000 919,628Suntec REIT 2,980,000 3,134,420Tat Hong Holdings Ltd. 149,000 108,499Venture Corp. Ltd. 302,000 2,032,511Wing Tai Holdings Ltd.b 1,057,000 1,399,433Yanlord Land Group Ltd. 149,000 203,847
28,696,577
SPAIN — 1.92%Abengoa SAb 60,969 1,600,920Almirall SA 62,580 592,717Amper SA 7,003 41,421Avanzit SAa 168,078 103,355Banco Pastor SAb 216,327 1,134,369Bolsas y Mercados Espanolesb 60,258 1,554,382Construcciones y Auxiliar de
Ferrocarriles SA 3,874 1,744,007Ebro Puleva SA 136,931 2,390,476FAES FARMA SA 268,260 915,661General de Alquiler de
Maquinaria SAa 14,453 32,575NH Hoteles SAa,b 136,037 551,182Obrascon Huarte Lain SAb 65,113 1,702,522Papeles y Cartones de
Europa SAa,b 228,268 957,588Tecnicas Reunidas SA 32,631 1,690,264Tubacex SA 275,669 922,994Tubos Reunidos SA 295,674 747,296Viscofan SA 95,062 2,753,114Zeltia SAa 231,546 1,013,571
20,448,414
SWEDEN — 3.35%Alliance Oil Co. Ltd. SDRa,b 25,500 329,430Axis Communications AB 12,963 156,888B & B Tools AB Class B 10,728 155,806BioInvent International ABa 10,877 46,639
Security Shares Value
Black Earth Farming Ltd. SDRa 35,313 $ 112,341Castellum AB 225,016 2,328,047D. Carnegie & Co. ABb,c 25,632 —Elekta AB Class B 116,071 3,360,235Eniro ABa,b 224,543 293,500EOS Russia AB 37,250 221,550Fabege AB 243,662 1,701,986Gunnebo ABa 38,591 162,803Hakon Invest ABb 90,600 1,404,787Haldex ABa 5,364 59,355Hexagon AB Class Bb 166,100 2,784,511Hexpol AB 60,400 770,690HiQ International ABa 40,826 179,573Industrial & Financial Systems
Class B 11,473 131,714Intrum Justitia AB 120,800 1,386,825JM AB 89,400 1,456,046Kungsleden AB 191,690 1,358,845Lindab International AB 90,600 1,090,245Loomis AB Class B 104,238 1,124,598Lundin Petroleum ABa 46,637 259,576Meda AB Class A 211,400 1,693,013Munters AB 8,046 60,097NCC AB Class B 90,600 1,602,786Net Entertainment NE ABa 18,178 162,174Net Insight AB Class Ba,b 230,056 140,011Nibe Industrier AB Class B 147,666 1,393,991Niscayah Group AB 584,012 892,608Nobia ABa 281,312 1,653,689Oriflame Cosmetics SA SDR 39,611 2,365,236PA Resources ABa,b 559,000 409,793Peab AB 219,985 1,341,864Proffice AB Class B 59,600 189,605RNB RETAIL AND BRANDS ABa 56,918 52,747Saab AB 3,874 50,262SAS ABa 115,031 416,863TradeDoubler ABa 74,500 292,652Transcom WorldWide SA
Class B SDRa 18,178 60,344Trelleborg AB Class B 274,309 1,997,630
35,651,355
108 2 0 1 0 i S h a r e s A n n u a l R e p o r t to S h a r e h o l d e r s
Schedule of Investments (Continued)
iSHARES» MSCI EAFE SMALL CAP INDEX FUNDJuly 31, 2010
For
per
sona
l use
onl
y
%%TRANSMSG*** Transmitting Job: B82515 PCN: 110000000 ***%%PCMSG|108 |00008|Yes|No|09/16/2010 20:08|0|0|Page is valid, no graphics -- Color: N|
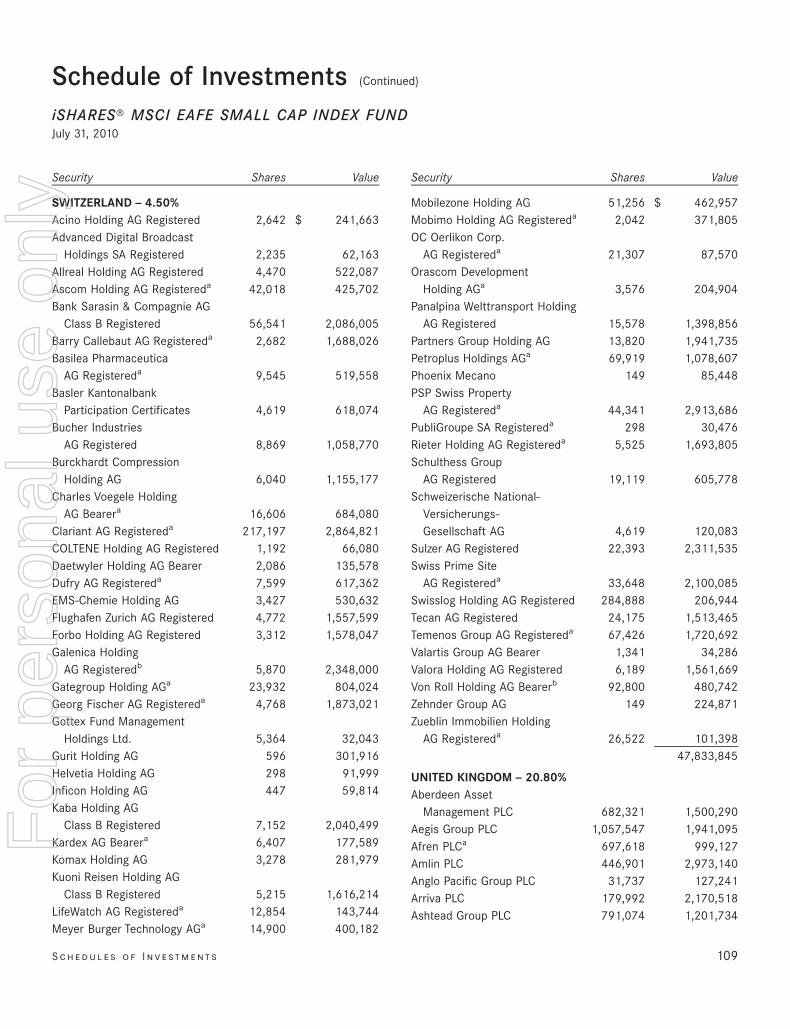
Security Shares Value
SWITZERLAND — 4.50%Acino Holding AG Registered 2,642 $ 241,663Advanced Digital Broadcast
Holdings SA Registered 2,235 62,163Allreal Holding AG Registered 4,470 522,087Ascom Holding AG Registereda 42,018 425,702Bank Sarasin & Compagnie AG
Class B Registered 56,541 2,086,005Barry Callebaut AG Registereda 2,682 1,688,026Basilea Pharmaceutica
AG Registereda 9,545 519,558Basler Kantonalbank
Participation Certificates 4,619 618,074Bucher Industries
AG Registered 8,869 1,058,770Burckhardt Compression
Holding AG 6,040 1,155,177Charles Voegele Holding
AG Bearera 16,606 684,080Clariant AG Registereda 217,197 2,864,821COLTENE Holding AG Registered 1,192 66,080Daetwyler Holding AG Bearer 2,086 135,578Dufry AG Registereda 7,599 617,362EMS-Chemie Holding AG 3,427 530,632Flughafen Zurich AG Registered 4,772 1,557,599Forbo Holding AG Registered 3,312 1,578,047Galenica Holding
AG Registeredb 5,870 2,348,000Gategroup Holding AGa 23,932 804,024Georg Fischer AG Registereda 4,768 1,873,021Gottex Fund Management
Holdings Ltd. 5,364 32,043Gurit Holding AG 596 301,916Helvetia Holding AG 298 91,999Inficon Holding AG 447 59,814Kaba Holding AG
Class B Registered 7,152 2,040,499Kardex AG Bearera 6,407 177,589Komax Holding AG 3,278 281,979Kuoni Reisen Holding AG
Class B Registered 5,215 1,616,214LifeWatch AG Registereda 12,854 143,744Meyer Burger Technology AGa 14,900 400,182
Security Shares Value
Mobilezone Holding AG 51,256 $ 462,957Mobimo Holding AG Registereda 2,042 371,805OC Oerlikon Corp.
AG Registereda 21,307 87,570Orascom Development
Holding AGa 3,576 204,904Panalpina Welttransport Holding
AG Registered 15,578 1,398,856Partners Group Holding AG 13,820 1,941,735Petroplus Holdings AGa 69,919 1,078,607Phoenix Mecano 149 85,448PSP Swiss Property
AG Registereda 44,341 2,913,686PubliGroupe SA Registereda 298 30,476Rieter Holding AG Registereda 5,525 1,693,805Schulthess Group
AG Registered 19,119 605,778Schweizerische National-
Versicherungs-Gesellschaft AG 4,619 120,083
Sulzer AG Registered 22,393 2,311,535Swiss Prime Site
AG Registereda 33,648 2,100,085Swisslog Holding AG Registered 284,888 206,944Tecan AG Registered 24,175 1,513,465Temenos Group AG Registereda 67,426 1,720,692Valartis Group AG Bearer 1,341 34,286Valora Holding AG Registered 6,189 1,561,669Von Roll Holding AG Bearerb 92,800 480,742Zehnder Group AG 149 224,871Zueblin Immobilien Holding
AG Registereda 26,522 101,39847,833,845
UNITED KINGDOM — 20.80%Aberdeen Asset
Management PLC 682,321 1,500,290Aegis Group PLC 1,057,547 1,941,095Afren PLCa 697,618 999,127Amlin PLC 446,901 2,973,140Anglo Pacific Group PLC 31,737 127,241Arriva PLC 179,992 2,170,518Ashtead Group PLC 791,074 1,201,734
S c h e d u l e s o f I n v e st m e n t s 109
Schedule of Investments (Continued)
iSHARES» MSCI EAFE SMALL CAP INDEX FUNDJuly 31, 2010
For
per
sona
l use
onl
y
%%TRANSMSG*** Transmitting Job: B82515 PCN: 111000000 ***%%PCMSG|109 |00008|Yes|No|09/16/2010 20:08|0|0|Page is valid, no graphics -- Color: N|
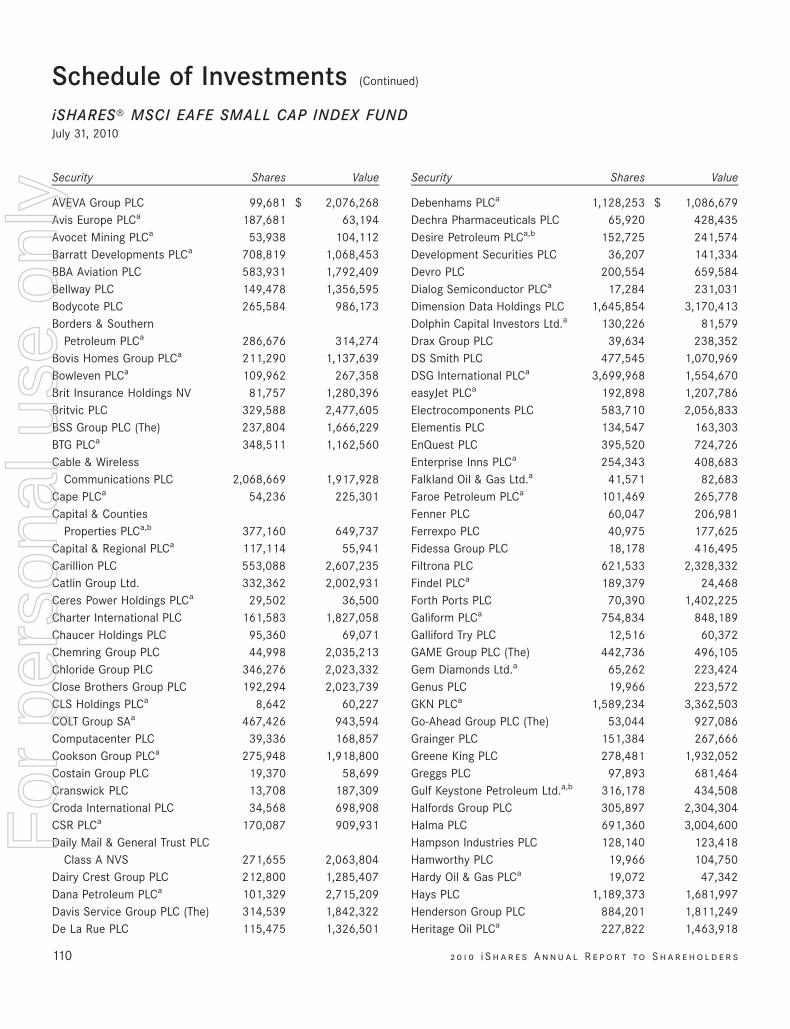
Security Shares Value
AVEVA Group PLC 99,681 $ 2,076,268Avis Europe PLCa 187,681 63,194Avocet Mining PLCa 53,938 104,112Barratt Developments PLCa 708,819 1,068,453BBA Aviation PLC 583,931 1,792,409Bellway PLC 149,478 1,356,595Bodycote PLC 265,584 986,173Borders & Southern
Petroleum PLCa 286,676 314,274Bovis Homes Group PLCa 211,290 1,137,639Bowleven PLCa 109,962 267,358Brit Insurance Holdings NV 81,757 1,280,396Britvic PLC 329,588 2,477,605BSS Group PLC (The) 237,804 1,666,229BTG PLCa 348,511 1,162,560Cable & Wireless
Communications PLC 2,068,669 1,917,928Cape PLCa 54,236 225,301Capital & Counties
Properties PLCa,b 377,160 649,737Capital & Regional PLCa 117,114 55,941Carillion PLC 553,088 2,607,235Catlin Group Ltd. 332,362 2,002,931Ceres Power Holdings PLCa 29,502 36,500Charter International PLC 161,583 1,827,058Chaucer Holdings PLC 95,360 69,071Chemring Group PLC 44,998 2,035,213Chloride Group PLC 346,276 2,023,332Close Brothers Group PLC 192,294 2,023,739CLS Holdings PLCa 8,642 60,227COLT Group SAa 467,426 943,594Computacenter PLC 39,336 168,857Cookson Group PLCa 275,948 1,918,800Costain Group PLC 19,370 58,699Cranswick PLC 13,708 187,309Croda International PLC 34,568 698,908CSR PLCa 170,087 909,931Daily Mail & General Trust PLC
Class A NVS 271,655 2,063,804Dairy Crest Group PLC 212,800 1,285,407Dana Petroleum PLCa 101,329 2,715,209Davis Service Group PLC (The) 314,539 1,842,322De La Rue PLC 115,475 1,326,501
Security Shares Value
Debenhams PLCa 1,128,253 $ 1,086,679Dechra Pharmaceuticals PLC 65,920 428,435Desire Petroleum PLCa,b 152,725 241,574Development Securities PLC 36,207 141,334Devro PLC 200,554 659,584Dialog Semiconductor PLCa 17,284 231,031Dimension Data Holdings PLC 1,645,854 3,170,413Dolphin Capital Investors Ltd.a 130,226 81,579Drax Group PLC 39,634 238,352DS Smith PLC 477,545 1,070,969DSG International PLCa 3,699,968 1,554,670easyJet PLCa 192,898 1,207,786Electrocomponents PLC 583,710 2,056,833Elementis PLC 134,547 163,303EnQuest PLC 395,520 724,726Enterprise Inns PLCa 254,343 408,683Falkland Oil & Gas Ltd.a 41,571 82,683Faroe Petroleum PLCa 101,469 265,778Fenner PLC 60,047 206,981Ferrexpo PLC 40,975 177,625Fidessa Group PLC 18,178 416,495Filtrona PLC 621,533 2,328,332Findel PLCa 189,379 24,468Forth Ports PLC 70,390 1,402,225Galiform PLCa 754,834 848,189Galliford Try PLC 12,516 60,372GAME Group PLC (The) 442,736 496,105Gem Diamonds Ltd.a 65,262 223,424Genus PLC 19,966 223,572GKN PLCa 1,589,234 3,362,503Go-Ahead Group PLC (The) 53,044 927,086Grainger PLC 151,384 267,666Greene King PLC 278,481 1,932,052Greggs PLC 97,893 681,464Gulf Keystone Petroleum Ltd.a,b 316,178 434,508Halfords Group PLC 305,897 2,304,304Halma PLC 691,360 3,004,600Hampson Industries PLC 128,140 123,418Hamworthy PLC 19,966 104,750Hardy Oil & Gas PLCa 19,072 47,342Hays PLC 1,189,373 1,681,997Henderson Group PLC 884,201 1,811,249Heritage Oil PLCa 227,822 1,463,918
110 2 0 1 0 i S h a r e s A n n u a l R e p o r t to S h a r e h o l d e r s
Schedule of Investments (Continued)
iSHARES» MSCI EAFE SMALL CAP INDEX FUNDJuly 31, 2010
For
per
sona
l use
onl
y
%%TRANSMSG*** Transmitting Job: B82515 PCN: 112000000 ***%%PCMSG|110 |00008|Yes|No|09/16/2010 20:08|0|0|Page is valid, no graphics -- Color: N|
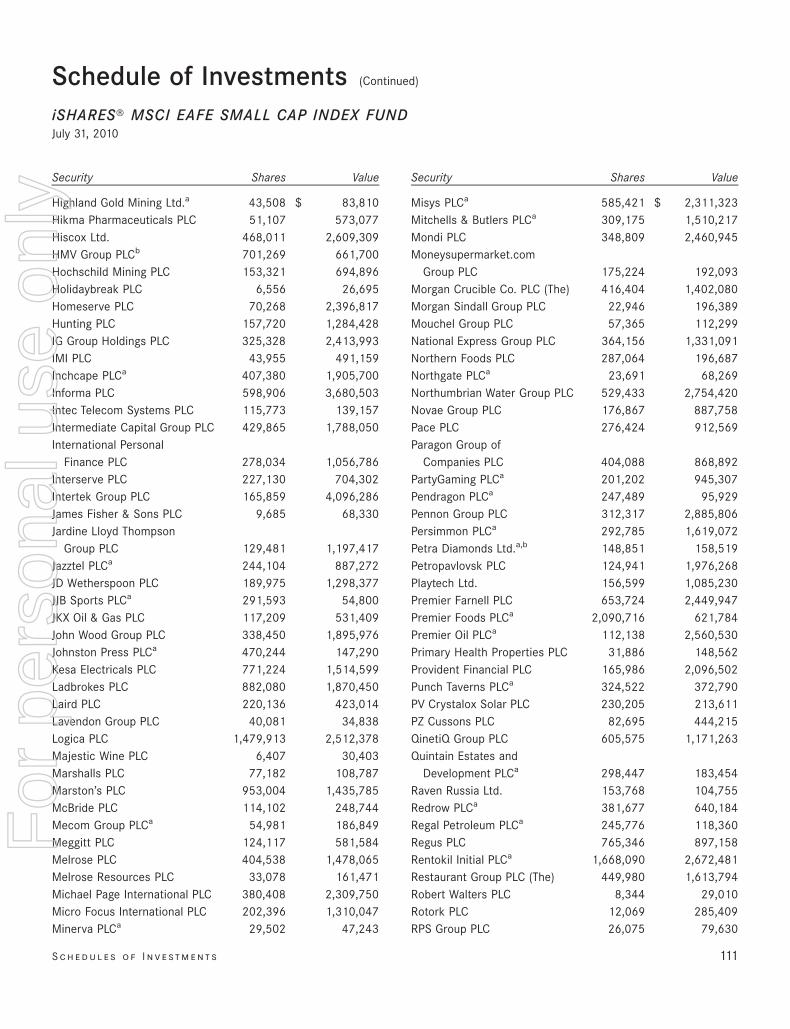
Security Shares Value
Highland Gold Mining Ltd.a 43,508 $ 83,810Hikma Pharmaceuticals PLC 51,107 573,077Hiscox Ltd. 468,011 2,609,309HMV Group PLCb 701,269 661,700Hochschild Mining PLC 153,321 694,896Holidaybreak PLC 6,556 26,695Homeserve PLC 70,268 2,396,817Hunting PLC 157,720 1,284,428IG Group Holdings PLC 325,328 2,413,993IMI PLC 43,955 491,159Inchcape PLCa 407,380 1,905,700Informa PLC 598,906 3,680,503Intec Telecom Systems PLC 115,773 139,157Intermediate Capital Group PLC 429,865 1,788,050International Personal
Finance PLC 278,034 1,056,786Interserve PLC 227,130 704,302Intertek Group PLC 165,859 4,096,286James Fisher & Sons PLC 9,685 68,330Jardine Lloyd Thompson
Group PLC 129,481 1,197,417Jazztel PLCa 244,104 887,272JD Wetherspoon PLC 189,975 1,298,377JJB Sports PLCa 291,593 54,800JKX Oil & Gas PLC 117,209 531,409John Wood Group PLC 338,450 1,895,976Johnston Press PLCa 470,244 147,290Kesa Electricals PLC 771,224 1,514,599Ladbrokes PLC 882,080 1,870,450Laird PLC 220,136 423,014Lavendon Group PLC 40,081 34,838Logica PLC 1,479,913 2,512,378Majestic Wine PLC 6,407 30,403Marshalls PLC 77,182 108,787Marston’s PLC 953,004 1,435,785McBride PLC 114,102 248,744Mecom Group PLCa 54,981 186,849Meggitt PLC 124,117 581,584Melrose PLC 404,538 1,478,065Melrose Resources PLC 33,078 161,471Michael Page International PLC 380,408 2,309,750Micro Focus International PLC 202,396 1,310,047Minerva PLCa 29,502 47,243
Security Shares Value
Misys PLCa 585,421 $ 2,311,323Mitchells & Butlers PLCa 309,175 1,510,217Mondi PLC 348,809 2,460,945Moneysupermarket.com
Group PLC 175,224 192,093Morgan Crucible Co. PLC (The) 416,404 1,402,080Morgan Sindall Group PLC 22,946 196,389Mouchel Group PLC 57,365 112,299National Express Group PLC 364,156 1,331,091Northern Foods PLC 287,064 196,687Northgate PLCa 23,691 68,269Northumbrian Water Group PLC 529,433 2,754,420Novae Group PLC 176,867 887,758Pace PLC 276,424 912,569Paragon Group of
Companies PLC 404,088 868,892PartyGaming PLCa 201,202 945,307Pendragon PLCa 247,489 95,929Pennon Group PLC 312,317 2,885,806Persimmon PLCa 292,785 1,619,072Petra Diamonds Ltd.a,b 148,851 158,519Petropavlovsk PLC 124,941 1,976,268Playtech Ltd. 156,599 1,085,230Premier Farnell PLC 653,724 2,449,947Premier Foods PLCa 2,090,716 621,784Premier Oil PLCa 112,138 2,560,530Primary Health Properties PLC 31,886 148,562Provident Financial PLC 165,986 2,096,502Punch Taverns PLCa 324,522 372,790PV Crystalox Solar PLC 230,205 213,611PZ Cussons PLC 82,695 444,215QinetiQ Group PLC 605,575 1,171,263Quintain Estates and
Development PLCa 298,447 183,454Raven Russia Ltd. 153,768 104,755Redrow PLCa 381,677 640,184Regal Petroleum PLCa 245,776 118,360Regus PLC 765,346 897,158Rentokil Initial PLCa 1,668,090 2,672,481Restaurant Group PLC (The) 449,980 1,613,794Robert Walters PLC 8,344 29,010Rotork PLC 12,069 285,409RPS Group PLC 26,075 79,630
S c h e d u l e s o f I n v e st m e n t s 111
Schedule of Investments (Continued)
iSHARES» MSCI EAFE SMALL CAP INDEX FUNDJuly 31, 2010
For
per
sona
l use
onl
y
%%TRANSMSG*** Transmitting Job: B82515 PCN: 113000000 ***%%PCMSG|111 |00008|Yes|No|09/16/2010 20:08|0|0|Page is valid, no graphics -- Color: N|
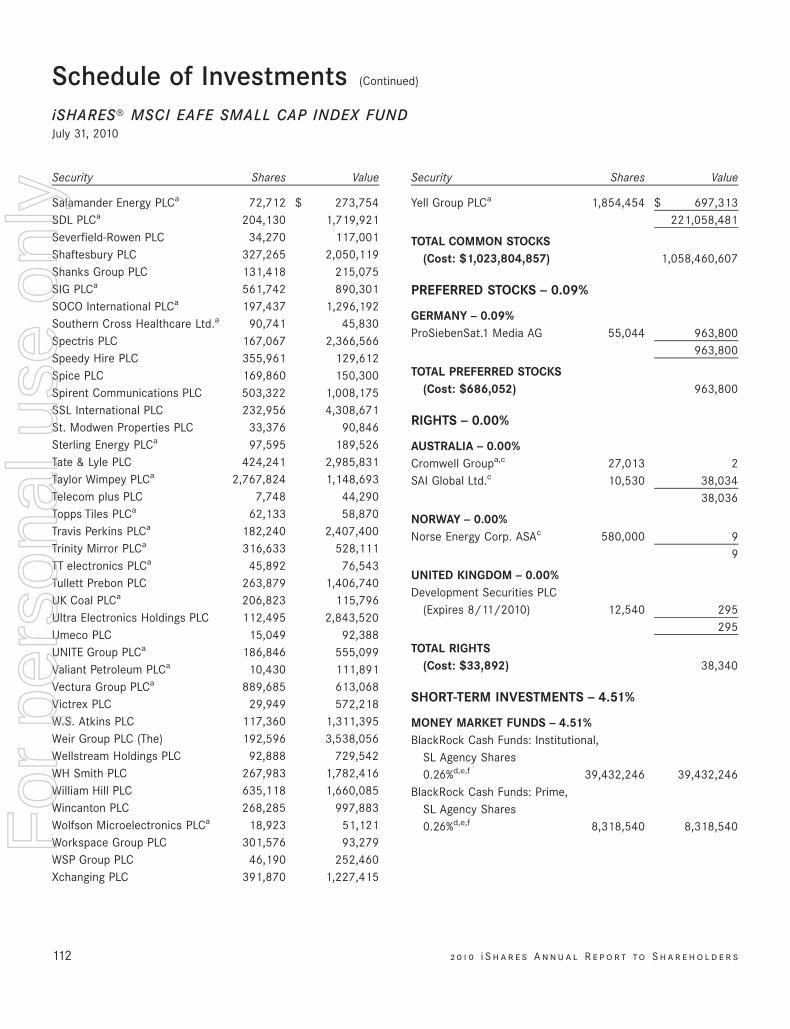
Security Shares Value
Salamander Energy PLCa 72,712 $ 273,754SDL PLCa 204,130 1,719,921Severfield-Rowen PLC 34,270 117,001Shaftesbury PLC 327,265 2,050,119Shanks Group PLC 131,418 215,075SIG PLCa 561,742 890,301SOCO International PLCa 197,437 1,296,192Southern Cross Healthcare Ltd.a 90,741 45,830Spectris PLC 167,067 2,366,566Speedy Hire PLC 355,961 129,612Spice PLC 169,860 150,300Spirent Communications PLC 503,322 1,008,175SSL International PLC 232,956 4,308,671St. Modwen Properties PLC 33,376 90,846Sterling Energy PLCa 97,595 189,526Tate & Lyle PLC 424,241 2,985,831Taylor Wimpey PLCa 2,767,824 1,148,693Telecom plus PLC 7,748 44,290Topps Tiles PLCa 62,133 58,870Travis Perkins PLCa 182,240 2,407,400Trinity Mirror PLCa 316,633 528,111TT electronics PLCa 45,892 76,543Tullett Prebon PLC 263,879 1,406,740UK Coal PLCa 206,823 115,796Ultra Electronics Holdings PLC 112,495 2,843,520Umeco PLC 15,049 92,388UNITE Group PLCa 186,846 555,099Valiant Petroleum PLCa 10,430 111,891Vectura Group PLCa 889,685 613,068Victrex PLC 29,949 572,218W.S. Atkins PLC 117,360 1,311,395Weir Group PLC (The) 192,596 3,538,056Wellstream Holdings PLC 92,888 729,542WH Smith PLC 267,983 1,782,416William Hill PLC 635,118 1,660,085Wincanton PLC 268,285 997,883Wolfson Microelectronics PLCa 18,923 51,121Workspace Group PLC 301,576 93,279WSP Group PLC 46,190 252,460Xchanging PLC 391,870 1,227,415
Security Shares Value
Yell Group PLCa 1,854,454 $ 697,313221,058,481
TOTAL COMMON STOCKS(Cost: $1,023,804,857) 1,058,460,607
PREFERRED STOCKS — 0.09%
GERMANY — 0.09%ProSiebenSat.1 Media AG 55,044 963,800
963,800
TOTAL PREFERRED STOCKS(Cost: $686,052) 963,800
RIGHTS — 0.00%
AUSTRALIA — 0.00%Cromwell Groupa,c 27,013 2SAI Global Ltd.c 10,530 38,034
38,036
NORWAY — 0.00%Norse Energy Corp. ASAc 580,000 9
9
UNITED KINGDOM — 0.00%Development Securities PLC
(Expires 8/11/2010) 12,540 295295
TOTAL RIGHTS(Cost: $33,892) 38,340
SHORT-TERM INVESTMENTS — 4.51%
MONEY MARKET FUNDS — 4.51%BlackRock Cash Funds: Institutional,
SL Agency Shares0.26%d,e,f 39,432,246 39,432,246
BlackRock Cash Funds: Prime,SL Agency Shares0.26%d,e,f 8,318,540 8,318,540
112 2 0 1 0 i S h a r e s A n n u a l R e p o r t to S h a r e h o l d e r s
Schedule of Investments (Continued)
iSHARES» MSCI EAFE SMALL CAP INDEX FUNDJuly 31, 2010
For
per
sona
l use
onl
y
%%TRANSMSG*** Transmitting Job: B82515 PCN: 114000000 ***%%PCMSG|112 |00005|Yes|No|09/16/2010 20:08|0|0|Page is valid, no graphics -- Color: N|
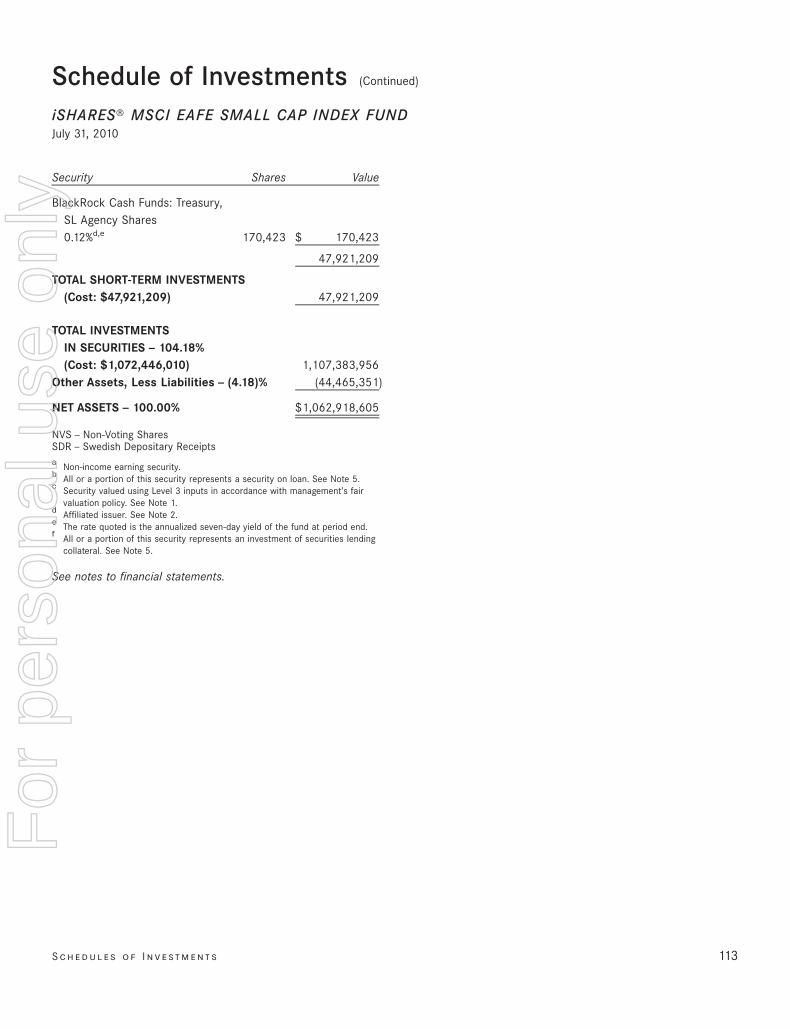
Security Shares Value
BlackRock Cash Funds: Treasury,SL Agency Shares0.12%d,e 170,423 $ 170,423
47,921,209
TOTAL SHORT-TERM INVESTMENTS(Cost: $47,921,209) 47,921,209
TOTAL INVESTMENTSIN SECURITIES — 104.18%(Cost: $1,072,446,010) 1,107,383,956
Other Assets, Less Liabilities — (4.18)% (44,465,351)
NET ASSETS — 100.00% $1,062,918,605
NVS — Non-Voting SharesSDR — Swedish Depositary Receiptsa Non-income earning security.b All or a portion of this security represents a security on loan. See Note 5.c Security valued using Level 3 inputs in accordance with management’s fair
valuation policy. See Note 1.d Affiliated issuer. See Note 2.e The rate quoted is the annualized seven-day yield of the fund at period end.f All or a portion of this security represents an investment of securities lending
collateral. See Note 5.
See notes to financial statements.
S c h e d u l e s o f I n v e st m e n t s 113
Schedule of Investments (Continued)
iSHARES» MSCI EAFE SMALL CAP INDEX FUNDJuly 31, 2010
For
per
sona
l use
onl
y
%%TRANSMSG*** Transmitting Job: B82515 PCN: 115000000 ***%%PCMSG|113 |00007|Yes|No|09/16/2010 20:08|0|0|Page is valid, no graphics -- Color: N|
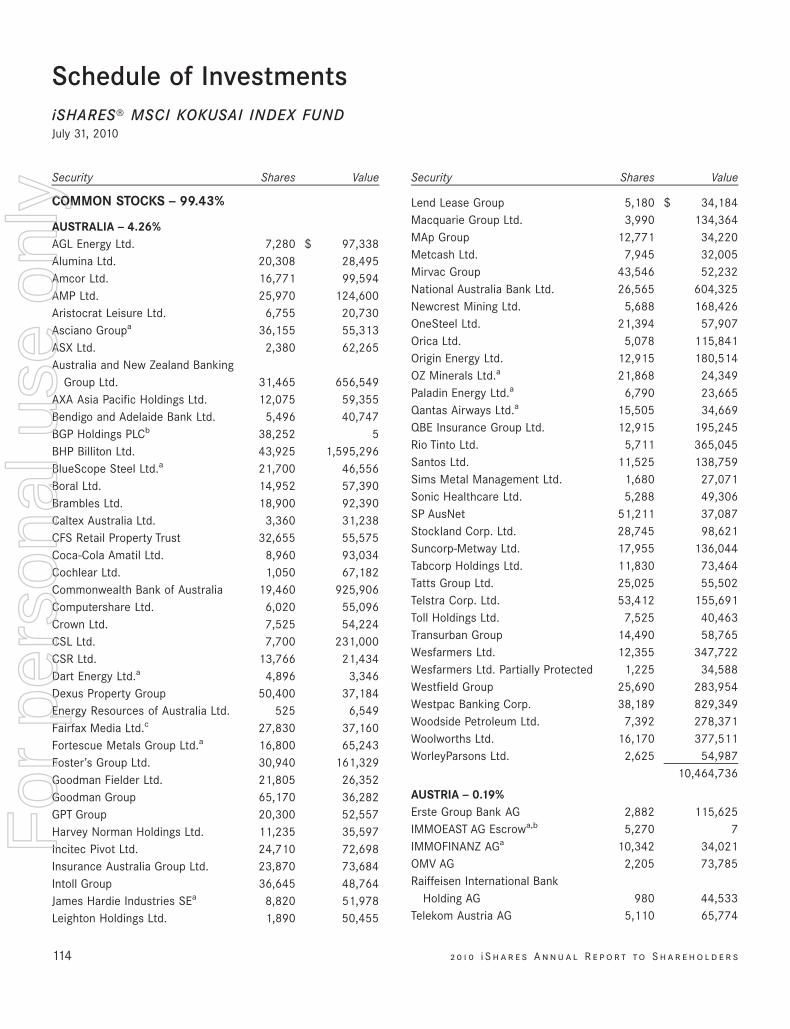
Schedule of InvestmentsiSHARES» MSCI KOKUSAI INDEX FUNDJuly 31, 2010
Security Shares Value
COMMON STOCKS — 99.43%
AUSTRALIA — 4.26%AGL Energy Ltd. 7,280 $ 97,338Alumina Ltd. 20,308 28,495Amcor Ltd. 16,771 99,594AMP Ltd. 25,970 124,600Aristocrat Leisure Ltd. 6,755 20,730Asciano Groupa 36,155 55,313ASX Ltd. 2,380 62,265Australia and New Zealand Banking
Group Ltd. 31,465 656,549AXA Asia Pacific Holdings Ltd. 12,075 59,355Bendigo and Adelaide Bank Ltd. 5,496 40,747BGP Holdings PLCb 38,252 5BHP Billiton Ltd. 43,925 1,595,296BlueScope Steel Ltd.a 21,700 46,556Boral Ltd. 14,952 57,390Brambles Ltd. 18,900 92,390Caltex Australia Ltd. 3,360 31,238CFS Retail Property Trust 32,655 55,575Coca-Cola Amatil Ltd. 8,960 93,034Cochlear Ltd. 1,050 67,182Commonwealth Bank of Australia 19,460 925,906Computershare Ltd. 6,020 55,096Crown Ltd. 7,525 54,224CSL Ltd. 7,700 231,000CSR Ltd. 13,766 21,434Dart Energy Ltd.a 4,896 3,346Dexus Property Group 50,400 37,184Energy Resources of Australia Ltd. 525 6,549Fairfax Media Ltd.c 27,830 37,160Fortescue Metals Group Ltd.a 16,800 65,243Foster’s Group Ltd. 30,940 161,329Goodman Fielder Ltd. 21,805 26,352Goodman Group 65,170 36,282GPT Group 20,300 52,557Harvey Norman Holdings Ltd. 11,235 35,597Incitec Pivot Ltd. 24,710 72,698Insurance Australia Group Ltd. 23,870 73,684Intoll Group 36,645 48,764James Hardie Industries SEa 8,820 51,978Leighton Holdings Ltd. 1,890 50,455
Security Shares Value
Lend Lease Group 5,180 $ 34,184Macquarie Group Ltd. 3,990 134,364MAp Group 12,771 34,220Metcash Ltd. 7,945 32,005Mirvac Group 43,546 52,232National Australia Bank Ltd. 26,565 604,325Newcrest Mining Ltd. 5,688 168,426OneSteel Ltd. 21,394 57,907Orica Ltd. 5,078 115,841Origin Energy Ltd. 12,915 180,514OZ Minerals Ltd.a 21,868 24,349Paladin Energy Ltd.a 6,790 23,665Qantas Airways Ltd.a 15,505 34,669QBE Insurance Group Ltd. 12,915 195,245Rio Tinto Ltd. 5,711 365,045Santos Ltd. 11,525 138,759Sims Metal Management Ltd. 1,680 27,071Sonic Healthcare Ltd. 5,288 49,306SP AusNet 51,211 37,087Stockland Corp. Ltd. 28,745 98,621Suncorp-Metway Ltd. 17,955 136,044Tabcorp Holdings Ltd. 11,830 73,464Tatts Group Ltd. 25,025 55,502Telstra Corp. Ltd. 53,412 155,691Toll Holdings Ltd. 7,525 40,463Transurban Group 14,490 58,765Wesfarmers Ltd. 12,355 347,722Wesfarmers Ltd. Partially Protected 1,225 34,588Westfield Group 25,690 283,954Westpac Banking Corp. 38,189 829,349Woodside Petroleum Ltd. 7,392 278,371Woolworths Ltd. 16,170 377,511WorleyParsons Ltd. 2,625 54,987
10,464,736
AUSTRIA — 0.19%Erste Group Bank AG 2,882 115,625IMMOEAST AG Escrowa,b 5,270 7IMMOFINANZ AGa 10,342 34,021OMV AG 2,205 73,785Raiffeisen International Bank
Holding AG 980 44,533Telekom Austria AG 5,110 65,774
114 2 0 1 0 i S h a r e s A n n u a l R e p o r t to S h a r e h o l d e r s
For
per
sona
l use
onl
y
%%TRANSMSG*** Transmitting Job: B82515 PCN: 116000000 ***%%PCMSG|114 |00006|Yes|No|09/16/2010 20:08|0|0|Page is valid, no graphics -- Color: N|
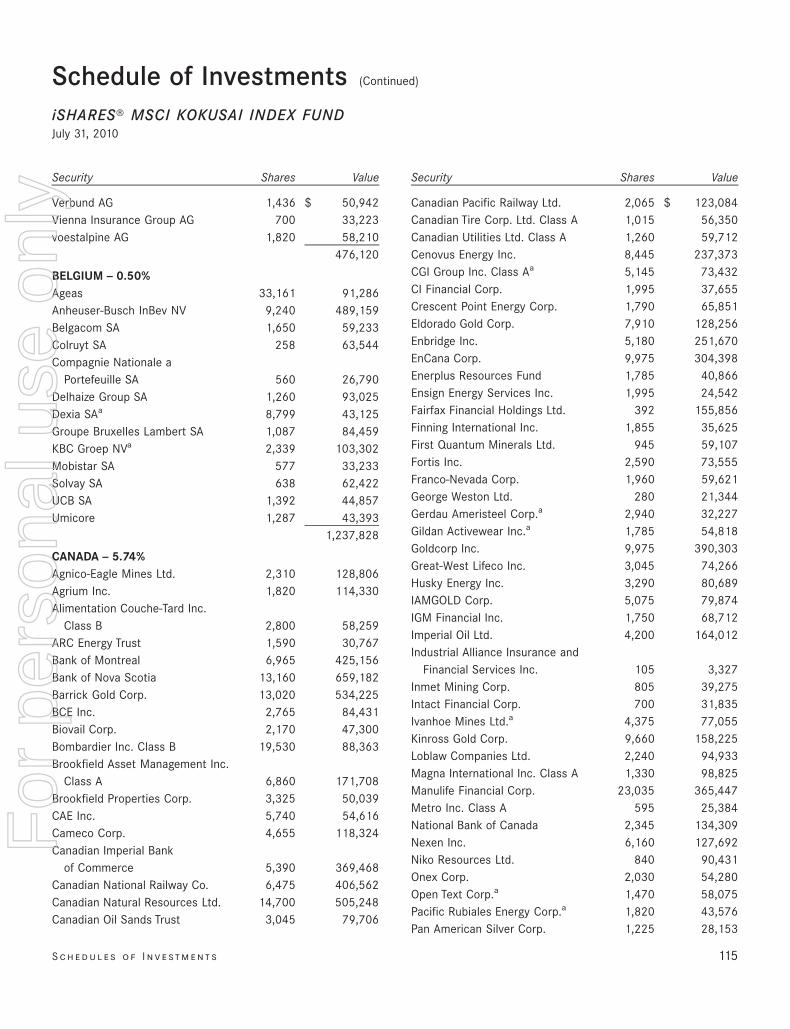
Security Shares Value
Verbund AG 1,436 $ 50,942Vienna Insurance Group AG 700 33,223voestalpine AG 1,820 58,210
476,120
BELGIUM — 0.50%Ageas 33,161 91,286Anheuser-Busch InBev NV 9,240 489,159Belgacom SA 1,650 59,233Colruyt SA 258 63,544Compagnie Nationale a
Portefeuille SA 560 26,790Delhaize Group SA 1,260 93,025Dexia SAa 8,799 43,125Groupe Bruxelles Lambert SA 1,087 84,459KBC Groep NVa 2,339 103,302Mobistar SA 577 33,233Solvay SA 638 62,422UCB SA 1,392 44,857Umicore 1,287 43,393
1,237,828
CANADA — 5.74%Agnico-Eagle Mines Ltd. 2,310 128,806Agrium Inc. 1,820 114,330Alimentation Couche-Tard Inc.
Class B 2,800 58,259ARC Energy Trust 1,590 30,767Bank of Montreal 6,965 425,156Bank of Nova Scotia 13,160 659,182Barrick Gold Corp. 13,020 534,225BCE Inc. 2,765 84,431Biovail Corp. 2,170 47,300Bombardier Inc. Class B 19,530 88,363Brookfield Asset Management Inc.
Class A 6,860 171,708Brookfield Properties Corp. 3,325 50,039CAE Inc. 5,740 54,616Cameco Corp. 4,655 118,324Canadian Imperial Bank
of Commerce 5,390 369,468Canadian National Railway Co. 6,475 406,562Canadian Natural Resources Ltd. 14,700 505,248Canadian Oil Sands Trust 3,045 79,706
Security Shares Value
Canadian Pacific Railway Ltd. 2,065 $ 123,084Canadian Tire Corp. Ltd. Class A 1,015 56,350Canadian Utilities Ltd. Class A 1,260 59,712Cenovus Energy Inc. 8,445 237,373CGI Group Inc. Class Aa 5,145 73,432CI Financial Corp. 1,995 37,655Crescent Point Energy Corp. 1,790 65,851Eldorado Gold Corp. 7,910 128,256Enbridge Inc. 5,180 251,670EnCana Corp. 9,975 304,398Enerplus Resources Fund 1,785 40,866Ensign Energy Services Inc. 1,995 24,542Fairfax Financial Holdings Ltd. 392 155,856Finning International Inc. 1,855 35,625First Quantum Minerals Ltd. 945 59,107Fortis Inc. 2,590 73,555Franco-Nevada Corp. 1,960 59,621George Weston Ltd. 280 21,344Gerdau Ameristeel Corp.a 2,940 32,227Gildan Activewear Inc.a 1,785 54,818Goldcorp Inc. 9,975 390,303Great-West Lifeco Inc. 3,045 74,266Husky Energy Inc. 3,290 80,689IAMGOLD Corp. 5,075 79,874IGM Financial Inc. 1,750 68,712Imperial Oil Ltd. 4,200 164,012Industrial Alliance Insurance and
Financial Services Inc. 105 3,327Inmet Mining Corp. 805 39,275Intact Financial Corp. 700 31,835Ivanhoe Mines Ltd.a 4,375 77,055Kinross Gold Corp. 9,660 158,225Loblaw Companies Ltd. 2,240 94,933Magna International Inc. Class A 1,330 98,825Manulife Financial Corp. 23,035 365,447Metro Inc. Class A 595 25,384National Bank of Canada 2,345 134,309Nexen Inc. 6,160 127,692Niko Resources Ltd. 840 90,431Onex Corp. 2,030 54,280Open Text Corp.a 1,470 58,075Pacific Rubiales Energy Corp.a 1,820 43,576Pan American Silver Corp. 1,225 28,153
S c h e d u l e s o f I n v e st m e n t s 115
Schedule of Investments (Continued)
iSHARES» MSCI KOKUSAI INDEX FUNDJuly 31, 2010
For
per
sona
l use
onl
y
%%TRANSMSG*** Transmitting Job: B82515 PCN: 117000000 ***%%PCMSG|115 |00010|Yes|No|09/16/2010 20:08|0|0|Page is valid, no graphics -- Color: N|
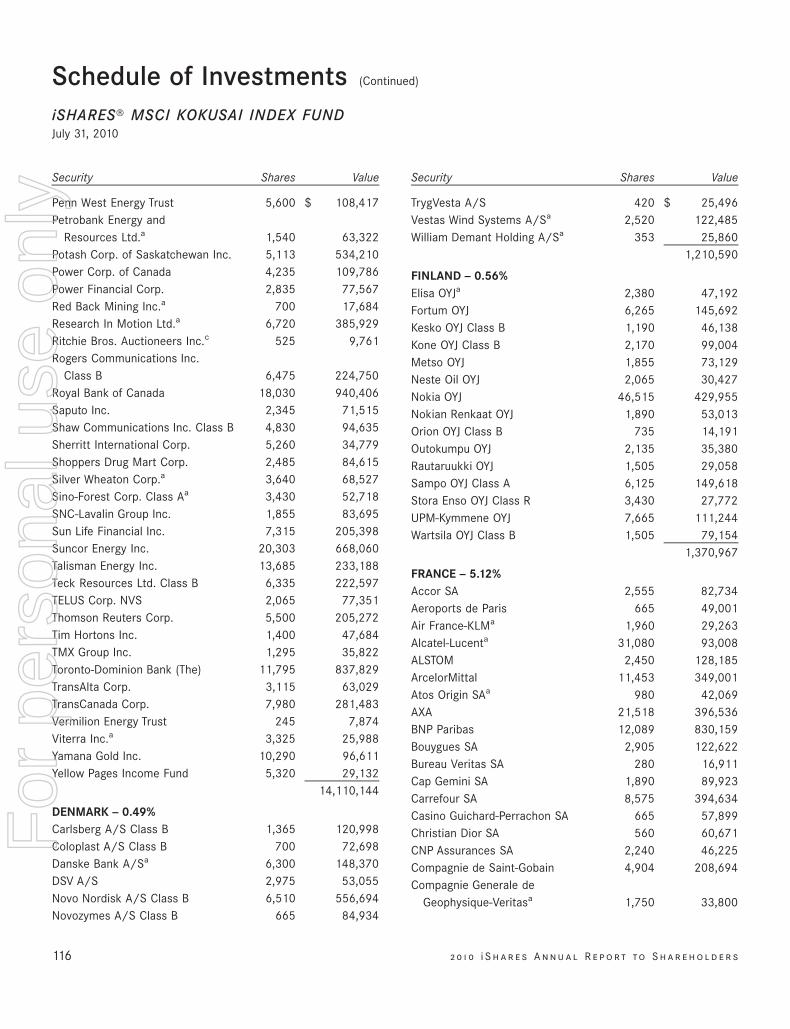
Security Shares Value
Penn West Energy Trust 5,600 $ 108,417Petrobank Energy and
Resources Ltd.a 1,540 63,322Potash Corp. of Saskatchewan Inc. 5,113 534,210Power Corp. of Canada 4,235 109,786Power Financial Corp. 2,835 77,567Red Back Mining Inc.a 700 17,684Research In Motion Ltd.a 6,720 385,929Ritchie Bros. Auctioneers Inc.c 525 9,761Rogers Communications Inc.
Class B 6,475 224,750Royal Bank of Canada 18,030 940,406Saputo Inc. 2,345 71,515Shaw Communications Inc. Class B 4,830 94,635Sherritt International Corp. 5,260 34,779Shoppers Drug Mart Corp. 2,485 84,615Silver Wheaton Corp.a 3,640 68,527Sino-Forest Corp. Class Aa 3,430 52,718SNC-Lavalin Group Inc. 1,855 83,695Sun Life Financial Inc. 7,315 205,398Suncor Energy Inc. 20,303 668,060Talisman Energy Inc. 13,685 233,188Teck Resources Ltd. Class B 6,335 222,597TELUS Corp. NVS 2,065 77,351Thomson Reuters Corp. 5,500 205,272Tim Hortons Inc. 1,400 47,684TMX Group Inc. 1,295 35,822Toronto-Dominion Bank (The) 11,795 837,829TransAlta Corp. 3,115 63,029TransCanada Corp. 7,980 281,483Vermilion Energy Trust 245 7,874Viterra Inc.a 3,325 25,988Yamana Gold Inc. 10,290 96,611Yellow Pages Income Fund 5,320 29,132
14,110,144
DENMARK — 0.49%Carlsberg A/S Class B 1,365 120,998Coloplast A/S Class B 700 72,698Danske Bank A/Sa 6,300 148,370DSV A/S 2,975 53,055Novo Nordisk A/S Class B 6,510 556,694Novozymes A/S Class B 665 84,934
Security Shares Value
TrygVesta A/S 420 $ 25,496Vestas Wind Systems A/Sa 2,520 122,485William Demant Holding A/Sa 353 25,860
1,210,590
FINLAND — 0.56%Elisa OYJa 2,380 47,192Fortum OYJ 6,265 145,692Kesko OYJ Class B 1,190 46,138Kone OYJ Class B 2,170 99,004Metso OYJ 1,855 73,129Neste Oil OYJ 2,065 30,427Nokia OYJ 46,515 429,955Nokian Renkaat OYJ 1,890 53,013Orion OYJ Class B 735 14,191Outokumpu OYJ 2,135 35,380Rautaruukki OYJ 1,505 29,058Sampo OYJ Class A 6,125 149,618Stora Enso OYJ Class R 3,430 27,772UPM-Kymmene OYJ 7,665 111,244Wartsila OYJ Class B 1,505 79,154
1,370,967
FRANCE — 5.12%Accor SA 2,555 82,734Aeroports de Paris 665 49,001Air France-KLMa 1,960 29,263Alcatel-Lucenta 31,080 93,008ALSTOM 2,450 128,185ArcelorMittal 11,453 349,001Atos Origin SAa 980 42,069AXA 21,518 396,536BNP Paribas 12,089 830,159Bouygues SA 2,905 122,622Bureau Veritas SA 280 16,911Cap Gemini SA 1,890 89,923Carrefour SA 8,575 394,634Casino Guichard-Perrachon SA 665 57,899Christian Dior SA 560 60,671CNP Assurances SA 2,240 46,225Compagnie de Saint-Gobain 4,904 208,694Compagnie Generale de
Geophysique-Veritasa 1,750 33,800
116 2 0 1 0 i S h a r e s A n n u a l R e p o r t to S h a r e h o l d e r s
Schedule of Investments (Continued)
iSHARES» MSCI KOKUSAI INDEX FUNDJuly 31, 2010
For
per
sona
l use
onl
y
%%TRANSMSG*** Transmitting Job: B82515 PCN: 118000000 ***%%PCMSG|116 |00008|Yes|No|09/16/2010 20:08|0|0|Page is valid, no graphics -- Color: N|
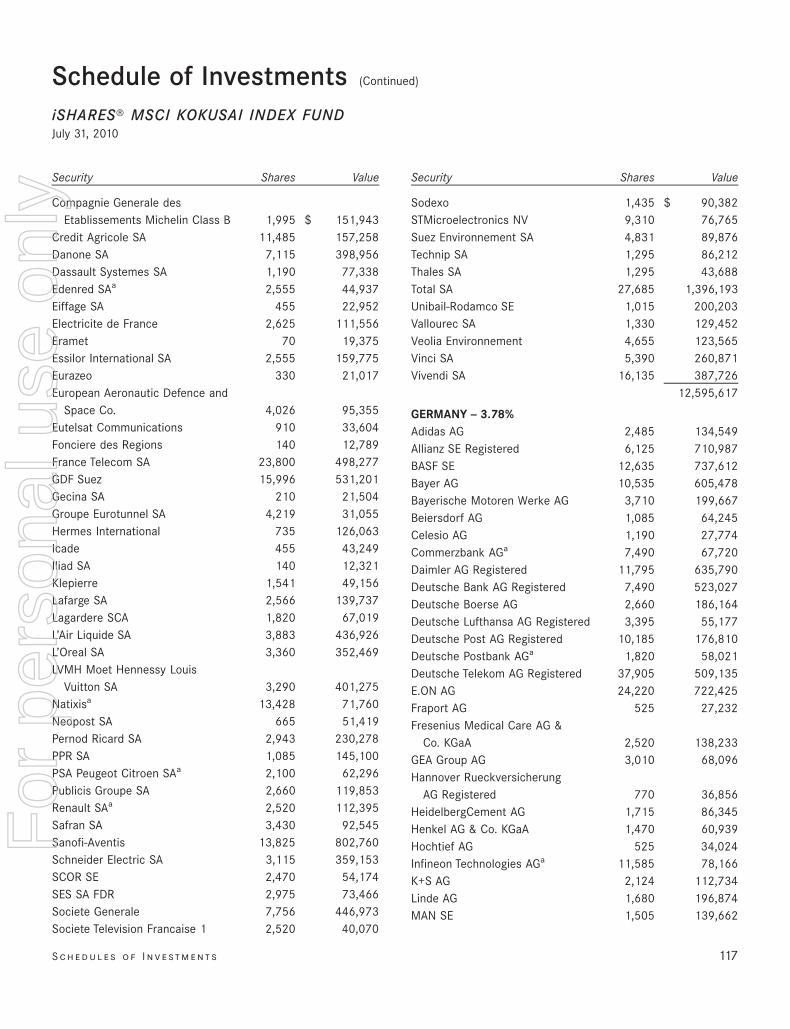
Security Shares Value
Compagnie Generale desEtablissements Michelin Class B 1,995 $ 151,943
Credit Agricole SA 11,485 157,258Danone SA 7,115 398,956Dassault Systemes SA 1,190 77,338Edenred SAa 2,555 44,937Eiffage SA 455 22,952Electricite de France 2,625 111,556Eramet 70 19,375Essilor International SA 2,555 159,775Eurazeo 330 21,017European Aeronautic Defence and
Space Co. 4,026 95,355Eutelsat Communications 910 33,604Fonciere des Regions 140 12,789France Telecom SA 23,800 498,277GDF Suez 15,996 531,201Gecina SA 210 21,504Groupe Eurotunnel SA 4,219 31,055Hermes International 735 126,063Icade 455 43,249Iliad SA 140 12,321Klepierre 1,541 49,156Lafarge SA 2,566 139,737Lagardere SCA 1,820 67,019L’Air Liquide SA 3,883 436,926L’Oreal SA 3,360 352,469LVMH Moet Hennessy Louis
Vuitton SA 3,290 401,275Natixisa 13,428 71,760Neopost SA 665 51,419Pernod Ricard SA 2,943 230,278PPR SA 1,085 145,100PSA Peugeot Citroen SAa 2,100 62,296Publicis Groupe SA 2,660 119,853Renault SAa 2,520 112,395Safran SA 3,430 92,545Sanofi-Aventis 13,825 802,760Schneider Electric SA 3,115 359,153SCOR SE 2,470 54,174SES SA FDR 2,975 73,466Societe Generale 7,756 446,973Societe Television Francaise 1 2,520 40,070
Security Shares Value
Sodexo 1,435 $ 90,382STMicroelectronics NV 9,310 76,765Suez Environnement SA 4,831 89,876Technip SA 1,295 86,212Thales SA 1,295 43,688Total SA 27,685 1,396,193Unibail-Rodamco SE 1,015 200,203Vallourec SA 1,330 129,452Veolia Environnement 4,655 123,565Vinci SA 5,390 260,871Vivendi SA 16,135 387,726
12,595,617
GERMANY — 3.78%Adidas AG 2,485 134,549Allianz SE Registered 6,125 710,987BASF SE 12,635 737,612Bayer AG 10,535 605,478Bayerische Motoren Werke AG 3,710 199,667Beiersdorf AG 1,085 64,245Celesio AG 1,190 27,774Commerzbank AGa 7,490 67,720Daimler AG Registered 11,795 635,790Deutsche Bank AG Registered 7,490 523,027Deutsche Boerse AG 2,660 186,164Deutsche Lufthansa AG Registered 3,395 55,177Deutsche Post AG Registered 10,185 176,810Deutsche Postbank AGa 1,820 58,021Deutsche Telekom AG Registered 37,905 509,135E.ON AG 24,220 722,425Fraport AG 525 27,232Fresenius Medical Care AG &
Co. KGaA 2,520 138,233GEA Group AG 3,010 68,096Hannover Rueckversicherung
AG Registered 770 36,856HeidelbergCement AG 1,715 86,345Henkel AG & Co. KGaA 1,470 60,939Hochtief AG 525 34,024Infineon Technologies AGa 11,585 78,166K+S AG 2,124 112,734Linde AG 1,680 196,874MAN SE 1,505 139,662
S c h e d u l e s o f I n v e st m e n t s 117
Schedule of Investments (Continued)
iSHARES» MSCI KOKUSAI INDEX FUNDJuly 31, 2010
For
per
sona
l use
onl
y
%%TRANSMSG*** Transmitting Job: B82515 PCN: 119000000 ***%%PCMSG|117 |00008|Yes|No|09/16/2010 20:08|0|0|Page is valid, no graphics -- Color: N|
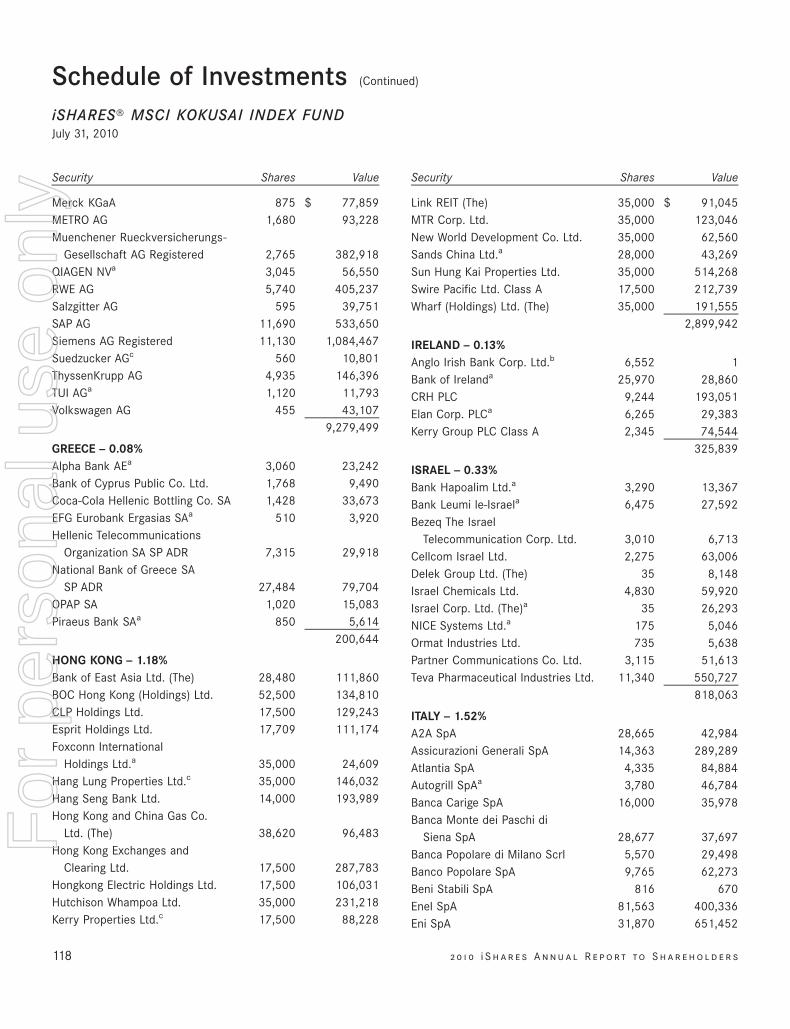
Security Shares Value
Merck KGaA 875 $ 77,859METRO AG 1,680 93,228Muenchener Rueckversicherungs-
Gesellschaft AG Registered 2,765 382,918QIAGEN NVa 3,045 56,550RWE AG 5,740 405,237Salzgitter AG 595 39,751SAP AG 11,690 533,650Siemens AG Registered 11,130 1,084,467Suedzucker AGc 560 10,801ThyssenKrupp AG 4,935 146,396TUI AGa 1,120 11,793Volkswagen AG 455 43,107
9,279,499
GREECE — 0.08%Alpha Bank AEa 3,060 23,242Bank of Cyprus Public Co. Ltd. 1,768 9,490Coca-Cola Hellenic Bottling Co. SA 1,428 33,673EFG Eurobank Ergasias SAa 510 3,920Hellenic Telecommunications
Organization SA SP ADR 7,315 29,918National Bank of Greece SA
SP ADR 27,484 79,704OPAP SA 1,020 15,083Piraeus Bank SAa 850 5,614
200,644
HONG KONG — 1.18%Bank of East Asia Ltd. (The) 28,480 111,860BOC Hong Kong (Holdings) Ltd. 52,500 134,810CLP Holdings Ltd. 17,500 129,243Esprit Holdings Ltd. 17,709 111,174Foxconn International
Holdings Ltd.a 35,000 24,609Hang Lung Properties Ltd.c 35,000 146,032Hang Seng Bank Ltd. 14,000 193,989Hong Kong and China Gas Co.
Ltd. (The) 38,620 96,483Hong Kong Exchanges and
Clearing Ltd. 17,500 287,783Hongkong Electric Holdings Ltd. 17,500 106,031Hutchison Whampoa Ltd. 35,000 231,218Kerry Properties Ltd.c 17,500 88,228
Security Shares Value
Link REIT (The) 35,000 $ 91,045MTR Corp. Ltd. 35,000 123,046New World Development Co. Ltd. 35,000 62,560Sands China Ltd.a 28,000 43,269Sun Hung Kai Properties Ltd. 35,000 514,268Swire Pacific Ltd. Class A 17,500 212,739Wharf (Holdings) Ltd. (The) 35,000 191,555
2,899,942
IRELAND — 0.13%Anglo Irish Bank Corp. Ltd.b 6,552 1Bank of Irelanda 25,970 28,860CRH PLC 9,244 193,051Elan Corp. PLCa 6,265 29,383Kerry Group PLC Class A 2,345 74,544
325,839
ISRAEL — 0.33%Bank Hapoalim Ltd.a 3,290 13,367Bank Leumi le-Israela 6,475 27,592Bezeq The Israel
Telecommunication Corp. Ltd. 3,010 6,713Cellcom Israel Ltd. 2,275 63,006Delek Group Ltd. (The) 35 8,148Israel Chemicals Ltd. 4,830 59,920Israel Corp. Ltd. (The)a 35 26,293NICE Systems Ltd.a 175 5,046Ormat Industries Ltd. 735 5,638Partner Communications Co. Ltd. 3,115 51,613Teva Pharmaceutical Industries Ltd. 11,340 550,727
818,063
ITALY — 1.52%A2A SpA 28,665 42,984Assicurazioni Generali SpA 14,363 289,289Atlantia SpA 4,335 84,884Autogrill SpAa 3,780 46,784Banca Carige SpA 16,000 35,978Banca Monte dei Paschi di
Siena SpA 28,677 37,697Banca Popolare di Milano Scrl 5,570 29,498Banco Popolare SpA 9,765 62,273Beni Stabili SpA 816 670Enel SpA 81,563 400,336Eni SpA 31,870 651,452
118 2 0 1 0 i S h a r e s A n n u a l R e p o r t to S h a r e h o l d e r s
Schedule of Investments (Continued)
iSHARES» MSCI KOKUSAI INDEX FUNDJuly 31, 2010
For
per
sona
l use
onl
y
%%TRANSMSG*** Transmitting Job: B82515 PCN: 120000000 ***%%PCMSG|118 |00010|Yes|No|09/16/2010 20:08|0|0|Page is valid, no graphics -- Color: N|
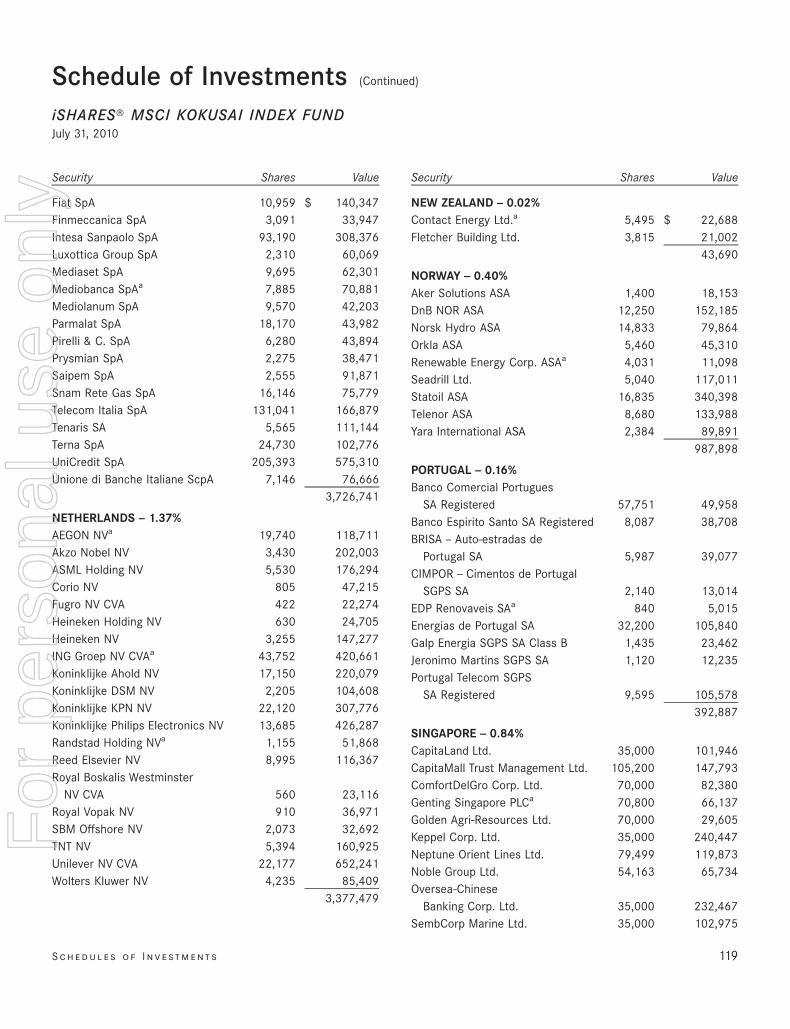
Security Shares Value
Fiat SpA 10,959 $ 140,347Finmeccanica SpA 3,091 33,947Intesa Sanpaolo SpA 93,190 308,376Luxottica Group SpA 2,310 60,069Mediaset SpA 9,695 62,301Mediobanca SpAa 7,885 70,881Mediolanum SpA 9,570 42,203Parmalat SpA 18,170 43,982Pirelli & C. SpA 6,280 43,894Prysmian SpA 2,275 38,471Saipem SpA 2,555 91,871Snam Rete Gas SpA 16,146 75,779Telecom Italia SpA 131,041 166,879Tenaris SA 5,565 111,144Terna SpA 24,730 102,776UniCredit SpA 205,393 575,310Unione di Banche Italiane ScpA 7,146 76,666
3,726,741
NETHERLANDS — 1.37%AEGON NVa 19,740 118,711Akzo Nobel NV 3,430 202,003ASML Holding NV 5,530 176,294Corio NV 805 47,215Fugro NV CVA 422 22,274Heineken Holding NV 630 24,705Heineken NV 3,255 147,277ING Groep NV CVAa 43,752 420,661Koninklijke Ahold NV 17,150 220,079Koninklijke DSM NV 2,205 104,608Koninklijke KPN NV 22,120 307,776Koninklijke Philips Electronics NV 13,685 426,287Randstad Holding NVa 1,155 51,868Reed Elsevier NV 8,995 116,367Royal Boskalis Westminster
NV CVA 560 23,116Royal Vopak NV 910 36,971SBM Offshore NV 2,073 32,692TNT NV 5,394 160,925Unilever NV CVA 22,177 652,241Wolters Kluwer NV 4,235 85,409
3,377,479
Security Shares Value
NEW ZEALAND — 0.02%Contact Energy Ltd.a 5,495 $ 22,688Fletcher Building Ltd. 3,815 21,002
43,690
NORWAY — 0.40%Aker Solutions ASA 1,400 18,153DnB NOR ASA 12,250 152,185Norsk Hydro ASA 14,833 79,864Orkla ASA 5,460 45,310Renewable Energy Corp. ASAa 4,031 11,098Seadrill Ltd. 5,040 117,011Statoil ASA 16,835 340,398Telenor ASA 8,680 133,988Yara International ASA 2,384 89,891
987,898
PORTUGAL — 0.16%Banco Comercial Portugues
SA Registered 57,751 49,958Banco Espirito Santo SA Registered 8,087 38,708BRISA — Auto-estradas de
Portugal SA 5,987 39,077CIMPOR — Cimentos de Portugal
SGPS SA 2,140 13,014EDP Renovaveis SAa 840 5,015Energias de Portugal SA 32,200 105,840Galp Energia SGPS SA Class B 1,435 23,462Jeronimo Martins SGPS SA 1,120 12,235Portugal Telecom SGPS
SA Registered 9,595 105,578392,887
SINGAPORE — 0.84%CapitaLand Ltd. 35,000 101,946CapitaMall Trust Management Ltd. 105,200 147,793ComfortDelGro Corp. Ltd. 70,000 82,380Genting Singapore PLCa 70,800 66,137Golden Agri-Resources Ltd. 70,000 29,605Keppel Corp. Ltd. 35,000 240,447Neptune Orient Lines Ltd. 79,499 119,873Noble Group Ltd. 54,163 65,734Oversea-Chinese
Banking Corp. Ltd. 35,000 232,467SembCorp Marine Ltd. 35,000 102,975
S c h e d u l e s o f I n v e st m e n t s 119
Schedule of Investments (Continued)
iSHARES» MSCI KOKUSAI INDEX FUNDJuly 31, 2010
For
per
sona
l use
onl
y
%%TRANSMSG*** Transmitting Job: B82515 PCN: 121000000 ***%%PCMSG|119 |00009|Yes|No|09/16/2010 20:08|0|0|Page is valid, no graphics -- Color: N|
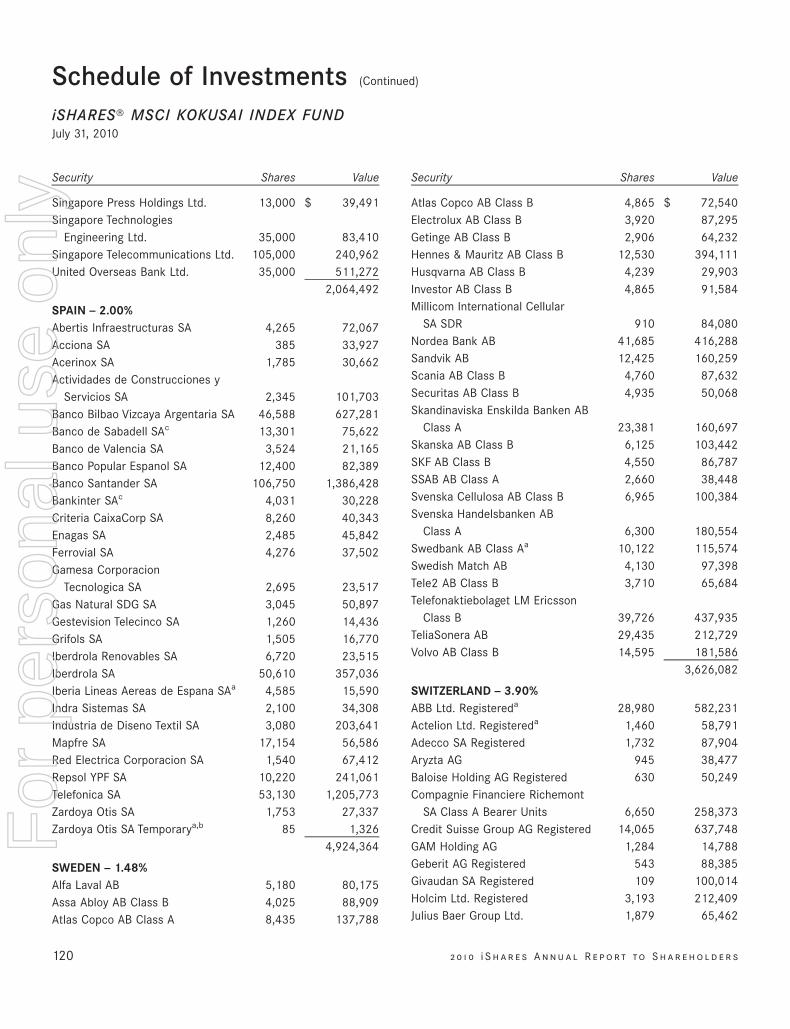
Security Shares Value
Singapore Press Holdings Ltd. 13,000 $ 39,491Singapore Technologies
Engineering Ltd. 35,000 83,410Singapore Telecommunications Ltd. 105,000 240,962United Overseas Bank Ltd. 35,000 511,272
2,064,492
SPAIN — 2.00%Abertis Infraestructuras SA 4,265 72,067Acciona SA 385 33,927Acerinox SA 1,785 30,662Actividades de Construcciones y
Servicios SA 2,345 101,703Banco Bilbao Vizcaya Argentaria SA 46,588 627,281Banco de Sabadell SAc 13,301 75,622Banco de Valencia SA 3,524 21,165Banco Popular Espanol SA 12,400 82,389Banco Santander SA 106,750 1,386,428Bankinter SAc 4,031 30,228Criteria CaixaCorp SA 8,260 40,343Enagas SA 2,485 45,842Ferrovial SA 4,276 37,502Gamesa Corporacion
Tecnologica SA 2,695 23,517Gas Natural SDG SA 3,045 50,897Gestevision Telecinco SA 1,260 14,436Grifols SA 1,505 16,770Iberdrola Renovables SA 6,720 23,515Iberdrola SA 50,610 357,036Iberia Lineas Aereas de Espana SAa 4,585 15,590Indra Sistemas SA 2,100 34,308Industria de Diseno Textil SA 3,080 203,641Mapfre SA 17,154 56,586Red Electrica Corporacion SA 1,540 67,412Repsol YPF SA 10,220 241,061Telefonica SA 53,130 1,205,773Zardoya Otis SA 1,753 27,337Zardoya Otis SA Temporarya,b 85 1,326
4,924,364
SWEDEN — 1.48%Alfa Laval AB 5,180 80,175Assa Abloy AB Class B 4,025 88,909Atlas Copco AB Class A 8,435 137,788
Security Shares Value
Atlas Copco AB Class B 4,865 $ 72,540Electrolux AB Class B 3,920 87,295Getinge AB Class B 2,906 64,232Hennes & Mauritz AB Class B 12,530 394,111Husqvarna AB Class B 4,239 29,903Investor AB Class B 4,865 91,584Millicom International Cellular
SA SDR 910 84,080Nordea Bank AB 41,685 416,288Sandvik AB 12,425 160,259Scania AB Class B 4,760 87,632Securitas AB Class B 4,935 50,068Skandinaviska Enskilda Banken AB
Class A 23,381 160,697Skanska AB Class B 6,125 103,442SKF AB Class B 4,550 86,787SSAB AB Class A 2,660 38,448Svenska Cellulosa AB Class B 6,965 100,384Svenska Handelsbanken AB
Class A 6,300 180,554Swedbank AB Class Aa 10,122 115,574Swedish Match AB 4,130 97,398Tele2 AB Class B 3,710 65,684Telefonaktiebolaget LM Ericsson
Class B 39,726 437,935TeliaSonera AB 29,435 212,729Volvo AB Class B 14,595 181,586
3,626,082
SWITZERLAND — 3.90%ABB Ltd. Registereda 28,980 582,231Actelion Ltd. Registereda 1,460 58,791Adecco SA Registered 1,732 87,904Aryzta AG 945 38,477Baloise Holding AG Registered 630 50,249Compagnie Financiere Richemont
SA Class A Bearer Units 6,650 258,373Credit Suisse Group AG Registered 14,065 637,748GAM Holding AG 1,284 14,788Geberit AG Registered 543 88,385Givaudan SA Registered 109 100,014Holcim Ltd. Registered 3,193 212,409Julius Baer Group Ltd. 1,879 65,462
120 2 0 1 0 i S h a r e s A n n u a l R e p o r t to S h a r e h o l d e r s
Schedule of Investments (Continued)
iSHARES» MSCI KOKUSAI INDEX FUNDJuly 31, 2010
For
per
sona
l use
onl
y
%%TRANSMSG*** Transmitting Job: B82515 PCN: 122000000 ***%%PCMSG|120 |00009|Yes|No|09/16/2010 20:08|0|0|Page is valid, no graphics -- Color: N|
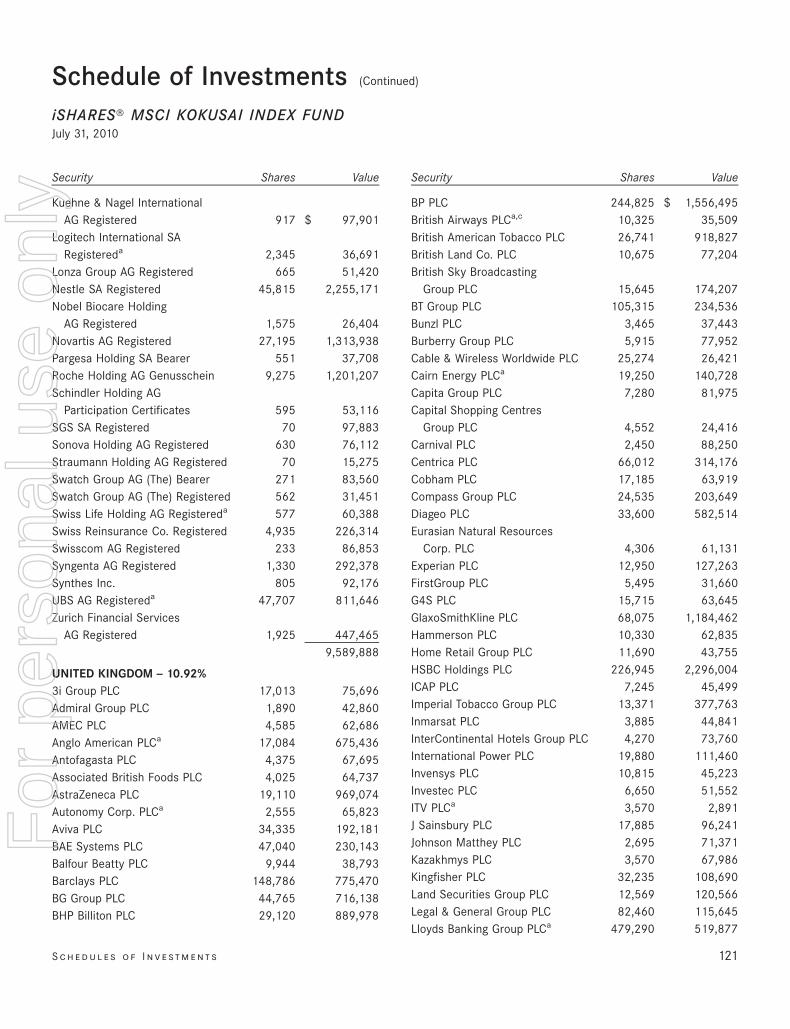
Security Shares Value
Kuehne & Nagel InternationalAG Registered 917 $ 97,901
Logitech International SARegistereda 2,345 36,691
Lonza Group AG Registered 665 51,420Nestle SA Registered 45,815 2,255,171Nobel Biocare Holding
AG Registered 1,575 26,404Novartis AG Registered 27,195 1,313,938Pargesa Holding SA Bearer 551 37,708Roche Holding AG Genusschein 9,275 1,201,207Schindler Holding AG
Participation Certificates 595 53,116SGS SA Registered 70 97,883Sonova Holding AG Registered 630 76,112Straumann Holding AG Registered 70 15,275Swatch Group AG (The) Bearer 271 83,560Swatch Group AG (The) Registered 562 31,451Swiss Life Holding AG Registereda 577 60,388Swiss Reinsurance Co. Registered 4,935 226,314Swisscom AG Registered 233 86,853Syngenta AG Registered 1,330 292,378Synthes Inc. 805 92,176UBS AG Registereda 47,707 811,646Zurich Financial Services
AG Registered 1,925 447,4659,589,888
UNITED KINGDOM — 10.92%3i Group PLC 17,013 75,696Admiral Group PLC 1,890 42,860AMEC PLC 4,585 62,686Anglo American PLCa 17,084 675,436Antofagasta PLC 4,375 67,695Associated British Foods PLC 4,025 64,737AstraZeneca PLC 19,110 969,074Autonomy Corp. PLCa 2,555 65,823Aviva PLC 34,335 192,181BAE Systems PLC 47,040 230,143Balfour Beatty PLC 9,944 38,793Barclays PLC 148,786 775,470BG Group PLC 44,765 716,138BHP Billiton PLC 29,120 889,978
Security Shares Value
BP PLC 244,825 $ 1,556,495British Airways PLCa,c 10,325 35,509British American Tobacco PLC 26,741 918,827British Land Co. PLC 10,675 77,204British Sky Broadcasting
Group PLC 15,645 174,207BT Group PLC 105,315 234,536Bunzl PLC 3,465 37,443Burberry Group PLC 5,915 77,952Cable & Wireless Worldwide PLC 25,274 26,421Cairn Energy PLCa 19,250 140,728Capita Group PLC 7,280 81,975Capital Shopping Centres
Group PLC 4,552 24,416Carnival PLC 2,450 88,250Centrica PLC 66,012 314,176Cobham PLC 17,185 63,919Compass Group PLC 24,535 203,649Diageo PLC 33,600 582,514Eurasian Natural Resources
Corp. PLC 4,306 61,131Experian PLC 12,950 127,263FirstGroup PLC 5,495 31,660G4S PLC 15,715 63,645GlaxoSmithKline PLC 68,075 1,184,462Hammerson PLC 10,330 62,835Home Retail Group PLC 11,690 43,755HSBC Holdings PLC 226,945 2,296,004ICAP PLC 7,245 45,499Imperial Tobacco Group PLC 13,371 377,763Inmarsat PLC 3,885 44,841InterContinental Hotels Group PLC 4,270 73,760International Power PLC 19,880 111,460Invensys PLC 10,815 45,223Investec PLC 6,650 51,552ITV PLCa 3,570 2,891J Sainsbury PLC 17,885 96,241Johnson Matthey PLC 2,695 71,371Kazakhmys PLC 3,570 67,986Kingfisher PLC 32,235 108,690Land Securities Group PLC 12,569 120,566Legal & General Group PLC 82,460 115,645Lloyds Banking Group PLCa 479,290 519,877
S c h e d u l e s o f I n v e st m e n t s 121
Schedule of Investments (Continued)
iSHARES» MSCI KOKUSAI INDEX FUNDJuly 31, 2010
For
per
sona
l use
onl
y
%%TRANSMSG*** Transmitting Job: B82515 PCN: 123000000 ***%%PCMSG|121 |00009|Yes|No|09/16/2010 20:08|0|0|Page is valid, no graphics -- Color: N|
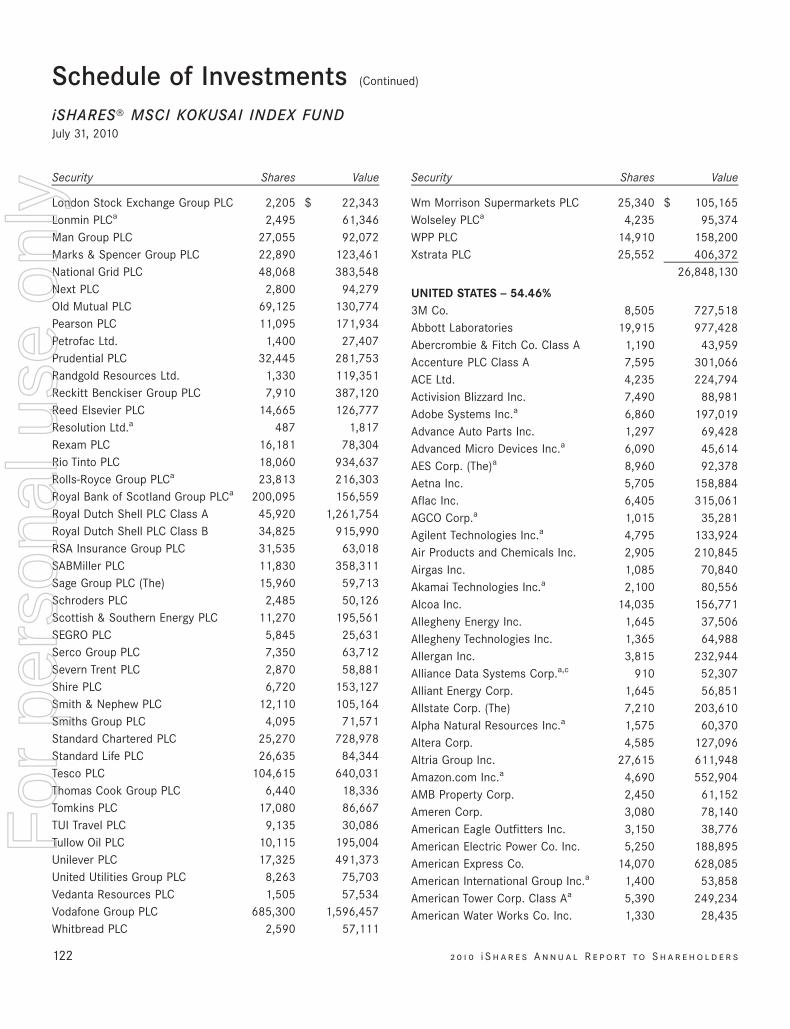
Security Shares Value
London Stock Exchange Group PLC 2,205 $ 22,343Lonmin PLCa 2,495 61,346Man Group PLC 27,055 92,072Marks & Spencer Group PLC 22,890 123,461National Grid PLC 48,068 383,548Next PLC 2,800 94,279Old Mutual PLC 69,125 130,774Pearson PLC 11,095 171,934Petrofac Ltd. 1,400 27,407Prudential PLC 32,445 281,753Randgold Resources Ltd. 1,330 119,351Reckitt Benckiser Group PLC 7,910 387,120Reed Elsevier PLC 14,665 126,777Resolution Ltd.a 487 1,817Rexam PLC 16,181 78,304Rio Tinto PLC 18,060 934,637Rolls-Royce Group PLCa 23,813 216,303Royal Bank of Scotland Group PLCa 200,095 156,559Royal Dutch Shell PLC Class A 45,920 1,261,754Royal Dutch Shell PLC Class B 34,825 915,990RSA Insurance Group PLC 31,535 63,018SABMiller PLC 11,830 358,311Sage Group PLC (The) 15,960 59,713Schroders PLC 2,485 50,126Scottish & Southern Energy PLC 11,270 195,561SEGRO PLC 5,845 25,631Serco Group PLC 7,350 63,712Severn Trent PLC 2,870 58,881Shire PLC 6,720 153,127Smith & Nephew PLC 12,110 105,164Smiths Group PLC 4,095 71,571Standard Chartered PLC 25,270 728,978Standard Life PLC 26,635 84,344Tesco PLC 104,615 640,031Thomas Cook Group PLC 6,440 18,336Tomkins PLC 17,080 86,667TUI Travel PLC 9,135 30,086Tullow Oil PLC 10,115 195,004Unilever PLC 17,325 491,373United Utilities Group PLC 8,263 75,703Vedanta Resources PLC 1,505 57,534Vodafone Group PLC 685,300 1,596,457Whitbread PLC 2,590 57,111
Security Shares Value
Wm Morrison Supermarkets PLC 25,340 $ 105,165Wolseley PLCa 4,235 95,374WPP PLC 14,910 158,200Xstrata PLC 25,552 406,372
26,848,130
UNITED STATES — 54.46%3M Co. 8,505 727,518Abbott Laboratories 19,915 977,428Abercrombie & Fitch Co. Class A 1,190 43,959Accenture PLC Class A 7,595 301,066ACE Ltd. 4,235 224,794Activision Blizzard Inc. 7,490 88,981Adobe Systems Inc.a 6,860 197,019Advance Auto Parts Inc. 1,297 69,428Advanced Micro Devices Inc.a 6,090 45,614AES Corp. (The)a 8,960 92,378Aetna Inc. 5,705 158,884Aflac Inc. 6,405 315,061AGCO Corp.a 1,015 35,281Agilent Technologies Inc.a 4,795 133,924Air Products and Chemicals Inc. 2,905 210,845Airgas Inc. 1,085 70,840Akamai Technologies Inc.a 2,100 80,556Alcoa Inc. 14,035 156,771Allegheny Energy Inc. 1,645 37,506Allegheny Technologies Inc. 1,365 64,988Allergan Inc. 3,815 232,944Alliance Data Systems Corp.a,c 910 52,307Alliant Energy Corp. 1,645 56,851Allstate Corp. (The) 7,210 203,610Alpha Natural Resources Inc.a 1,575 60,370Altera Corp. 4,585 127,096Altria Group Inc. 27,615 611,948Amazon.com Inc.a 4,690 552,904AMB Property Corp. 2,450 61,152Ameren Corp. 3,080 78,140American Eagle Outfitters Inc. 3,150 38,776American Electric Power Co. Inc. 5,250 188,895American Express Co. 14,070 628,085American International Group Inc.a 1,400 53,858American Tower Corp. Class Aa 5,390 249,234American Water Works Co. Inc. 1,330 28,435
122 2 0 1 0 i S h a r e s A n n u a l R e p o r t to S h a r e h o l d e r s
Schedule of Investments (Continued)
iSHARES» MSCI KOKUSAI INDEX FUNDJuly 31, 2010
For
per
sona
l use
onl
y
%%TRANSMSG*** Transmitting Job: B82515 PCN: 124000000 ***%%PCMSG|122 |00010|Yes|No|09/16/2010 20:08|0|0|Page is valid, no graphics -- Color: N|
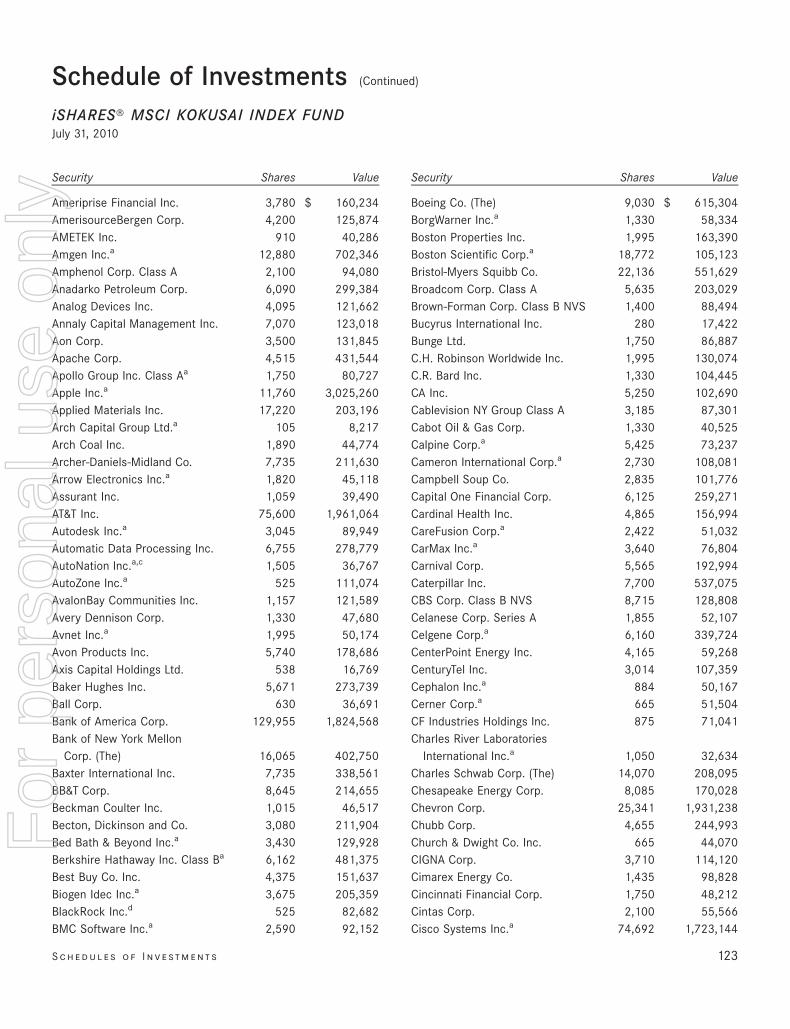
Security Shares Value
Ameriprise Financial Inc. 3,780 $ 160,234AmerisourceBergen Corp. 4,200 125,874AMETEK Inc. 910 40,286Amgen Inc.a 12,880 702,346Amphenol Corp. Class A 2,100 94,080Anadarko Petroleum Corp. 6,090 299,384Analog Devices Inc. 4,095 121,662Annaly Capital Management Inc. 7,070 123,018Aon Corp. 3,500 131,845Apache Corp. 4,515 431,544Apollo Group Inc. Class Aa 1,750 80,727Apple Inc.a 11,760 3,025,260Applied Materials Inc. 17,220 203,196Arch Capital Group Ltd.a 105 8,217Arch Coal Inc. 1,890 44,774Archer-Daniels-Midland Co. 7,735 211,630Arrow Electronics Inc.a 1,820 45,118Assurant Inc. 1,059 39,490AT&T Inc. 75,600 1,961,064Autodesk Inc.a 3,045 89,949Automatic Data Processing Inc. 6,755 278,779AutoNation Inc.a,c 1,505 36,767AutoZone Inc.a 525 111,074AvalonBay Communities Inc. 1,157 121,589Avery Dennison Corp. 1,330 47,680Avnet Inc.a 1,995 50,174Avon Products Inc. 5,740 178,686Axis Capital Holdings Ltd. 538 16,769Baker Hughes Inc. 5,671 273,739Ball Corp. 630 36,691Bank of America Corp. 129,955 1,824,568Bank of New York Mellon
Corp. (The) 16,065 402,750Baxter International Inc. 7,735 338,561BB&T Corp. 8,645 214,655Beckman Coulter Inc. 1,015 46,517Becton, Dickinson and Co. 3,080 211,904Bed Bath & Beyond Inc.a 3,430 129,928Berkshire Hathaway Inc. Class Ba 6,162 481,375Best Buy Co. Inc. 4,375 151,637Biogen Idec Inc.a 3,675 205,359BlackRock Inc.d 525 82,682BMC Software Inc.a 2,590 92,152
Security Shares Value
Boeing Co. (The) 9,030 $ 615,304BorgWarner Inc.a 1,330 58,334Boston Properties Inc. 1,995 163,390Boston Scientific Corp.a 18,772 105,123Bristol-Myers Squibb Co. 22,136 551,629Broadcom Corp. Class A 5,635 203,029Brown-Forman Corp. Class B NVS 1,400 88,494Bucyrus International Inc. 280 17,422Bunge Ltd. 1,750 86,887C.H. Robinson Worldwide Inc. 1,995 130,074C.R. Bard Inc. 1,330 104,445CA Inc. 5,250 102,690Cablevision NY Group Class A 3,185 87,301Cabot Oil & Gas Corp. 1,330 40,525Calpine Corp.a 5,425 73,237Cameron International Corp.a 2,730 108,081Campbell Soup Co. 2,835 101,776Capital One Financial Corp. 6,125 259,271Cardinal Health Inc. 4,865 156,994CareFusion Corp.a 2,422 51,032CarMax Inc.a 3,640 76,804Carnival Corp. 5,565 192,994Caterpillar Inc. 7,700 537,075CBS Corp. Class B NVS 8,715 128,808Celanese Corp. Series A 1,855 52,107Celgene Corp.a 6,160 339,724CenterPoint Energy Inc. 4,165 59,268CenturyTel Inc. 3,014 107,359Cephalon Inc.a 884 50,167Cerner Corp.a 665 51,504CF Industries Holdings Inc. 875 71,041Charles River Laboratories
International Inc.a 1,050 32,634Charles Schwab Corp. (The) 14,070 208,095Chesapeake Energy Corp. 8,085 170,028Chevron Corp. 25,341 1,931,238Chubb Corp. 4,655 244,993Church & Dwight Co. Inc. 665 44,070CIGNA Corp. 3,710 114,120Cimarex Energy Co. 1,435 98,828Cincinnati Financial Corp. 1,750 48,212Cintas Corp. 2,100 55,566Cisco Systems Inc.a 74,692 1,723,144
S c h e d u l e s o f I n v e st m e n t s 123
Schedule of Investments (Continued)
iSHARES» MSCI KOKUSAI INDEX FUNDJuly 31, 2010
For
per
sona
l use
onl
y
%%TRANSMSG*** Transmitting Job: B82515 PCN: 125000000 ***%%PCMSG|123 |00007|Yes|No|09/16/2010 20:08|0|0|Page is valid, no graphics -- Color: N|
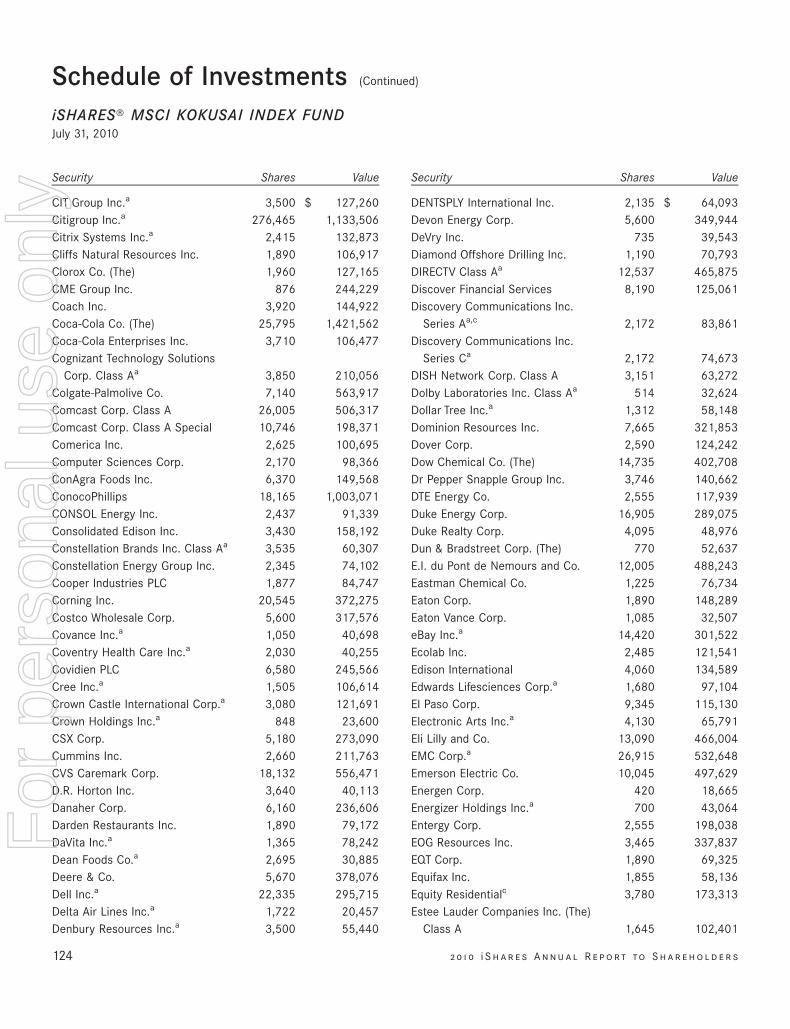
Security Shares Value
CIT Group Inc.a 3,500 $ 127,260Citigroup Inc.a 276,465 1,133,506Citrix Systems Inc.a 2,415 132,873Cliffs Natural Resources Inc. 1,890 106,917Clorox Co. (The) 1,960 127,165CME Group Inc. 876 244,229Coach Inc. 3,920 144,922Coca-Cola Co. (The) 25,795 1,421,562Coca-Cola Enterprises Inc. 3,710 106,477Cognizant Technology Solutions
Corp. Class Aa 3,850 210,056Colgate-Palmolive Co. 7,140 563,917Comcast Corp. Class A 26,005 506,317Comcast Corp. Class A Special 10,746 198,371Comerica Inc. 2,625 100,695Computer Sciences Corp. 2,170 98,366ConAgra Foods Inc. 6,370 149,568ConocoPhillips 18,165 1,003,071CONSOL Energy Inc. 2,437 91,339Consolidated Edison Inc. 3,430 158,192Constellation Brands Inc. Class Aa 3,535 60,307Constellation Energy Group Inc. 2,345 74,102Cooper Industries PLC 1,877 84,747Corning Inc. 20,545 372,275Costco Wholesale Corp. 5,600 317,576Covance Inc.a 1,050 40,698Coventry Health Care Inc.a 2,030 40,255Covidien PLC 6,580 245,566Cree Inc.a 1,505 106,614Crown Castle International Corp.a 3,080 121,691Crown Holdings Inc.a 848 23,600CSX Corp. 5,180 273,090Cummins Inc. 2,660 211,763CVS Caremark Corp. 18,132 556,471D.R. Horton Inc. 3,640 40,113Danaher Corp. 6,160 236,606Darden Restaurants Inc. 1,890 79,172DaVita Inc.a 1,365 78,242Dean Foods Co.a 2,695 30,885Deere & Co. 5,670 378,076Dell Inc.a 22,335 295,715Delta Air Lines Inc.a 1,722 20,457Denbury Resources Inc.a 3,500 55,440
Security Shares Value
DENTSPLY International Inc. 2,135 $ 64,093Devon Energy Corp. 5,600 349,944DeVry Inc. 735 39,543Diamond Offshore Drilling Inc. 1,190 70,793DIRECTV Class Aa 12,537 465,875Discover Financial Services 8,190 125,061Discovery Communications Inc.
Series Aa,c 2,172 83,861Discovery Communications Inc.
Series Ca 2,172 74,673DISH Network Corp. Class A 3,151 63,272Dolby Laboratories Inc. Class Aa 514 32,624Dollar Tree Inc.a 1,312 58,148Dominion Resources Inc. 7,665 321,853Dover Corp. 2,590 124,242Dow Chemical Co. (The) 14,735 402,708Dr Pepper Snapple Group Inc. 3,746 140,662DTE Energy Co. 2,555 117,939Duke Energy Corp. 16,905 289,075Duke Realty Corp. 4,095 48,976Dun & Bradstreet Corp. (The) 770 52,637E.I. du Pont de Nemours and Co. 12,005 488,243Eastman Chemical Co. 1,225 76,734Eaton Corp. 1,890 148,289Eaton Vance Corp. 1,085 32,507eBay Inc.a 14,420 301,522Ecolab Inc. 2,485 121,541Edison International 4,060 134,589Edwards Lifesciences Corp.a 1,680 97,104El Paso Corp. 9,345 115,130Electronic Arts Inc.a 4,130 65,791Eli Lilly and Co. 13,090 466,004EMC Corp.a 26,915 532,648Emerson Electric Co. 10,045 497,629Energen Corp. 420 18,665Energizer Holdings Inc.a 700 43,064Entergy Corp. 2,555 198,038EOG Resources Inc. 3,465 337,837EQT Corp. 1,890 69,325Equifax Inc. 1,855 58,136Equity Residentialc 3,780 173,313Estee Lauder Companies Inc. (The)
Class A 1,645 102,401
124 2 0 1 0 i S h a r e s A n n u a l R e p o r t to S h a r e h o l d e r s
Schedule of Investments (Continued)
iSHARES» MSCI KOKUSAI INDEX FUNDJuly 31, 2010
For
per
sona
l use
onl
y
%%TRANSMSG*** Transmitting Job: B82515 PCN: 126000000 ***%%PCMSG|124 |00007|Yes|No|09/16/2010 20:08|0|0|Page is valid, no graphics -- Color: N|
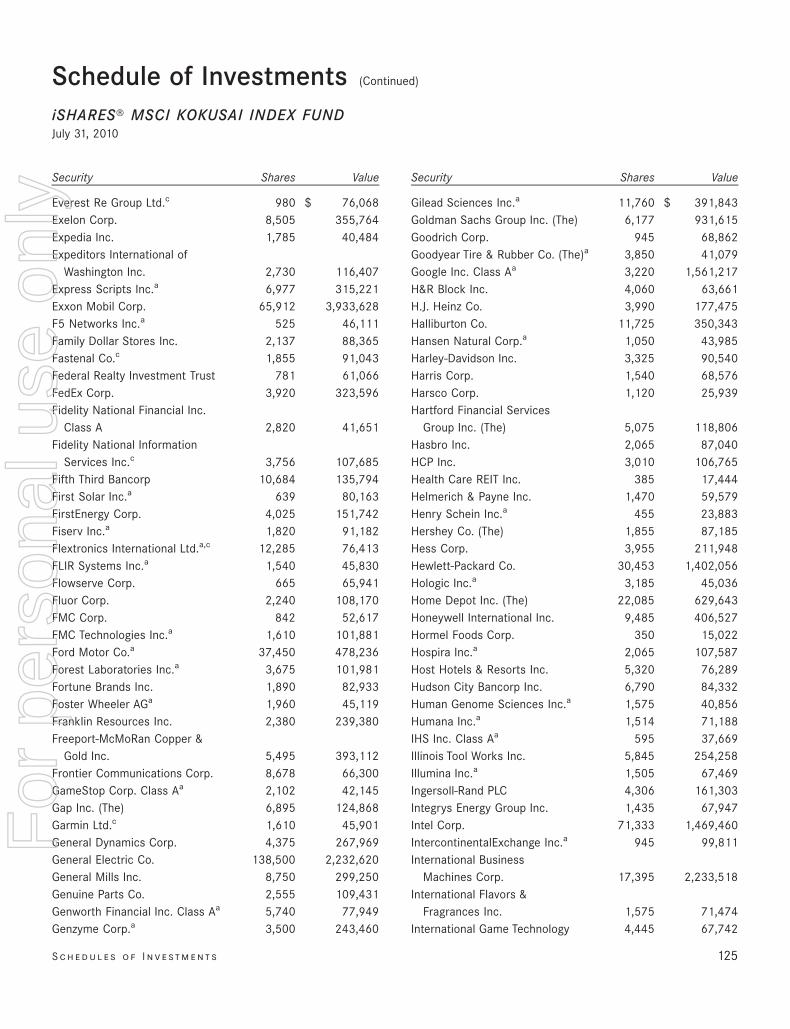
Security Shares Value
Everest Re Group Ltd.c 980 $ 76,068Exelon Corp. 8,505 355,764Expedia Inc. 1,785 40,484Expeditors International of
Washington Inc. 2,730 116,407Express Scripts Inc.a 6,977 315,221Exxon Mobil Corp. 65,912 3,933,628F5 Networks Inc.a 525 46,111Family Dollar Stores Inc. 2,137 88,365Fastenal Co.c 1,855 91,043Federal Realty Investment Trust 781 61,066FedEx Corp. 3,920 323,596Fidelity National Financial Inc.
Class A 2,820 41,651Fidelity National Information
Services Inc.c 3,756 107,685Fifth Third Bancorp 10,684 135,794First Solar Inc.a 639 80,163FirstEnergy Corp. 4,025 151,742Fiserv Inc.a 1,820 91,182Flextronics International Ltd.a,c 12,285 76,413FLIR Systems Inc.a 1,540 45,830Flowserve Corp. 665 65,941Fluor Corp. 2,240 108,170FMC Corp. 842 52,617FMC Technologies Inc.a 1,610 101,881Ford Motor Co.a 37,450 478,236Forest Laboratories Inc.a 3,675 101,981Fortune Brands Inc. 1,890 82,933Foster Wheeler AGa 1,960 45,119Franklin Resources Inc. 2,380 239,380Freeport-McMoRan Copper &
Gold Inc. 5,495 393,112Frontier Communications Corp. 8,678 66,300GameStop Corp. Class Aa 2,102 42,145Gap Inc. (The) 6,895 124,868Garmin Ltd.c 1,610 45,901General Dynamics Corp. 4,375 267,969General Electric Co. 138,500 2,232,620General Mills Inc. 8,750 299,250Genuine Parts Co. 2,555 109,431Genworth Financial Inc. Class Aa 5,740 77,949Genzyme Corp.a 3,500 243,460
Security Shares Value
Gilead Sciences Inc.a 11,760 $ 391,843Goldman Sachs Group Inc. (The) 6,177 931,615Goodrich Corp. 945 68,862Goodyear Tire & Rubber Co. (The)a 3,850 41,079Google Inc. Class Aa 3,220 1,561,217H&R Block Inc. 4,060 63,661H.J. Heinz Co. 3,990 177,475Halliburton Co. 11,725 350,343Hansen Natural Corp.a 1,050 43,985Harley-Davidson Inc. 3,325 90,540Harris Corp. 1,540 68,576Harsco Corp. 1,120 25,939Hartford Financial Services
Group Inc. (The) 5,075 118,806Hasbro Inc. 2,065 87,040HCP Inc. 3,010 106,765Health Care REIT Inc. 385 17,444Helmerich & Payne Inc. 1,470 59,579Henry Schein Inc.a 455 23,883Hershey Co. (The) 1,855 87,185Hess Corp. 3,955 211,948Hewlett-Packard Co. 30,453 1,402,056Hologic Inc.a 3,185 45,036Home Depot Inc. (The) 22,085 629,643Honeywell International Inc. 9,485 406,527Hormel Foods Corp. 350 15,022Hospira Inc.a 2,065 107,587Host Hotels & Resorts Inc. 5,320 76,289Hudson City Bancorp Inc. 6,790 84,332Human Genome Sciences Inc.a 1,575 40,856Humana Inc.a 1,514 71,188IHS Inc. Class Aa 595 37,669Illinois Tool Works Inc. 5,845 254,258Illumina Inc.a 1,505 67,469Ingersoll-Rand PLC 4,306 161,303Integrys Energy Group Inc. 1,435 67,947Intel Corp. 71,333 1,469,460IntercontinentalExchange Inc.a 945 99,811International Business
Machines Corp. 17,395 2,233,518International Flavors &
Fragrances Inc. 1,575 71,474International Game Technology 4,445 67,742
S c h e d u l e s o f I n v e st m e n t s 125
Schedule of Investments (Continued)
iSHARES» MSCI KOKUSAI INDEX FUNDJuly 31, 2010
For
per
sona
l use
onl
y
%%TRANSMSG*** Transmitting Job: B82515 PCN: 127000000 ***%%PCMSG|125 |00007|Yes|No|09/16/2010 20:08|0|0|Page is valid, no graphics -- Color: N|
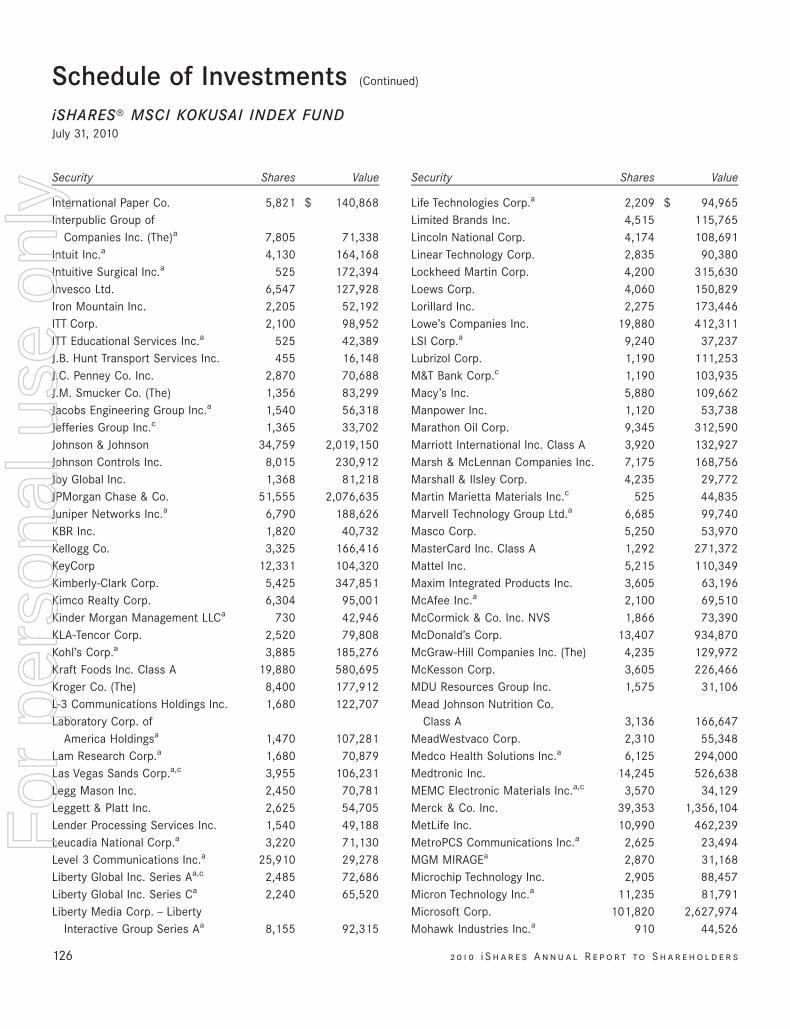
Security Shares Value
International Paper Co. 5,821 $ 140,868Interpublic Group of
Companies Inc. (The)a 7,805 71,338Intuit Inc.a 4,130 164,168Intuitive Surgical Inc.a 525 172,394Invesco Ltd. 6,547 127,928Iron Mountain Inc. 2,205 52,192ITT Corp. 2,100 98,952ITT Educational Services Inc.a 525 42,389J.B. Hunt Transport Services Inc. 455 16,148J.C. Penney Co. Inc. 2,870 70,688J.M. Smucker Co. (The) 1,356 83,299Jacobs Engineering Group Inc.a 1,540 56,318Jefferies Group Inc.c 1,365 33,702Johnson & Johnson 34,759 2,019,150Johnson Controls Inc. 8,015 230,912Joy Global Inc. 1,368 81,218JPMorgan Chase & Co. 51,555 2,076,635Juniper Networks Inc.a 6,790 188,626KBR Inc. 1,820 40,732Kellogg Co. 3,325 166,416KeyCorp 12,331 104,320Kimberly-Clark Corp. 5,425 347,851Kimco Realty Corp. 6,304 95,001Kinder Morgan Management LLCa 730 42,946KLA-Tencor Corp. 2,520 79,808Kohl’s Corp.a 3,885 185,276Kraft Foods Inc. Class A 19,880 580,695Kroger Co. (The) 8,400 177,912L-3 Communications Holdings Inc. 1,680 122,707Laboratory Corp. of
America Holdingsa 1,470 107,281Lam Research Corp.a 1,680 70,879Las Vegas Sands Corp.a,c 3,955 106,231Legg Mason Inc. 2,450 70,781Leggett & Platt Inc. 2,625 54,705Lender Processing Services Inc. 1,540 49,188Leucadia National Corp.a 3,220 71,130Level 3 Communications Inc.a 25,910 29,278Liberty Global Inc. Series Aa,c 2,485 72,686Liberty Global Inc. Series Ca 2,240 65,520Liberty Media Corp. — Liberty
Interactive Group Series Aa 8,155 92,315
Security Shares Value
Life Technologies Corp.a 2,209 $ 94,965Limited Brands Inc. 4,515 115,765Lincoln National Corp. 4,174 108,691Linear Technology Corp. 2,835 90,380Lockheed Martin Corp. 4,200 315,630Loews Corp. 4,060 150,829Lorillard Inc. 2,275 173,446Lowe’s Companies Inc. 19,880 412,311LSI Corp.a 9,240 37,237Lubrizol Corp. 1,190 111,253M&T Bank Corp.c 1,190 103,935Macy’s Inc. 5,880 109,662Manpower Inc. 1,120 53,738Marathon Oil Corp. 9,345 312,590Marriott International Inc. Class A 3,920 132,927Marsh & McLennan Companies Inc. 7,175 168,756Marshall & Ilsley Corp. 4,235 29,772Martin Marietta Materials Inc.c 525 44,835Marvell Technology Group Ltd.a 6,685 99,740Masco Corp. 5,250 53,970MasterCard Inc. Class A 1,292 271,372Mattel Inc. 5,215 110,349Maxim Integrated Products Inc. 3,605 63,196McAfee Inc.a 2,100 69,510McCormick & Co. Inc. NVS 1,866 73,390McDonald’s Corp. 13,407 934,870McGraw-Hill Companies Inc. (The) 4,235 129,972McKesson Corp. 3,605 226,466MDU Resources Group Inc. 1,575 31,106Mead Johnson Nutrition Co.
Class A 3,136 166,647MeadWestvaco Corp. 2,310 55,348Medco Health Solutions Inc.a 6,125 294,000Medtronic Inc. 14,245 526,638MEMC Electronic Materials Inc.a,c 3,570 34,129Merck & Co. Inc. 39,353 1,356,104MetLife Inc. 10,990 462,239MetroPCS Communications Inc.a 2,625 23,494MGM MIRAGEa 2,870 31,168Microchip Technology Inc. 2,905 88,457Micron Technology Inc.a 11,235 81,791Microsoft Corp. 101,820 2,627,974Mohawk Industries Inc.a 910 44,526
126 2 0 1 0 i S h a r e s A n n u a l R e p o r t to S h a r e h o l d e r s
Schedule of Investments (Continued)
iSHARES» MSCI KOKUSAI INDEX FUNDJuly 31, 2010
For
per
sona
l use
onl
y
%%TRANSMSG*** Transmitting Job: B82515 PCN: 128000000 ***%%PCMSG|126 |00009|Yes|No|09/16/2010 20:08|0|0|Page is valid, no graphics -- Color: N|
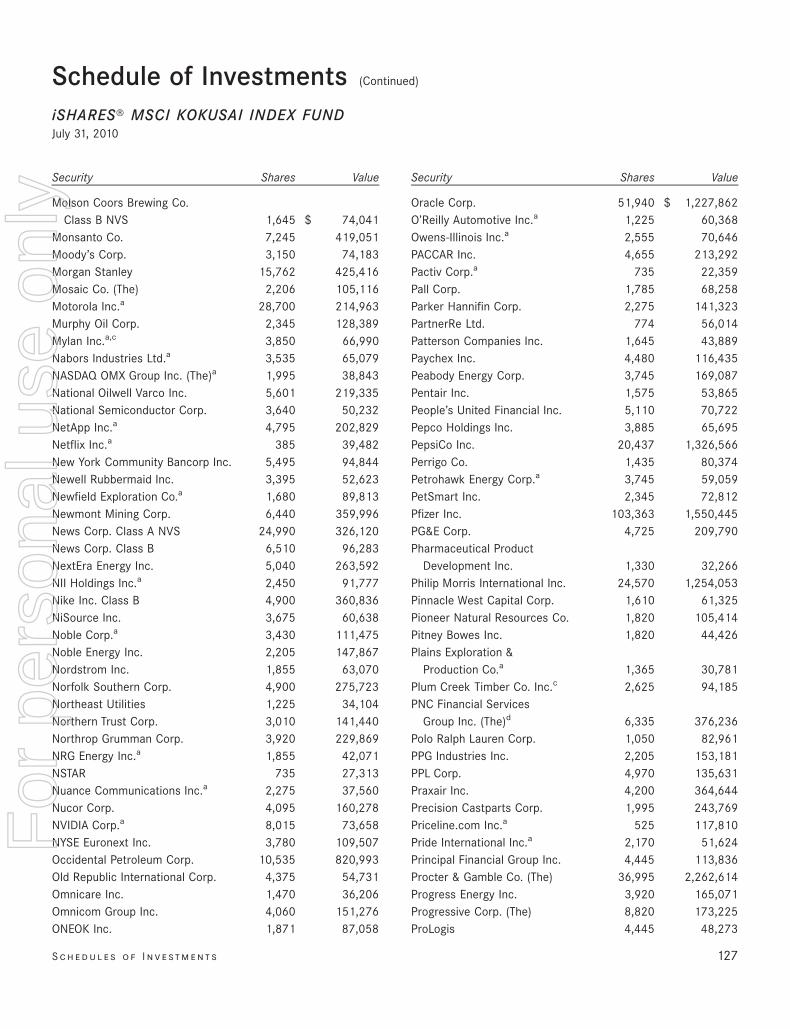
Security Shares Value
Molson Coors Brewing Co.Class B NVS 1,645 $ 74,041
Monsanto Co. 7,245 419,051Moody’s Corp. 3,150 74,183Morgan Stanley 15,762 425,416Mosaic Co. (The) 2,206 105,116Motorola Inc.a 28,700 214,963Murphy Oil Corp. 2,345 128,389Mylan Inc.a,c 3,850 66,990Nabors Industries Ltd.a 3,535 65,079NASDAQ OMX Group Inc. (The)a 1,995 38,843National Oilwell Varco Inc. 5,601 219,335National Semiconductor Corp. 3,640 50,232NetApp Inc.a 4,795 202,829Netflix Inc.a 385 39,482New York Community Bancorp Inc. 5,495 94,844Newell Rubbermaid Inc. 3,395 52,623Newfield Exploration Co.a 1,680 89,813Newmont Mining Corp. 6,440 359,996News Corp. Class A NVS 24,990 326,120News Corp. Class B 6,510 96,283NextEra Energy Inc. 5,040 263,592NII Holdings Inc.a 2,450 91,777Nike Inc. Class B 4,900 360,836NiSource Inc. 3,675 60,638Noble Corp.a 3,430 111,475Noble Energy Inc. 2,205 147,867Nordstrom Inc. 1,855 63,070Norfolk Southern Corp. 4,900 275,723Northeast Utilities 1,225 34,104Northern Trust Corp. 3,010 141,440Northrop Grumman Corp. 3,920 229,869NRG Energy Inc.a 1,855 42,071NSTAR 735 27,313Nuance Communications Inc.a 2,275 37,560Nucor Corp. 4,095 160,278NVIDIA Corp.a 8,015 73,658NYSE Euronext Inc. 3,780 109,507Occidental Petroleum Corp. 10,535 820,993Old Republic International Corp. 4,375 54,731Omnicare Inc. 1,470 36,206Omnicom Group Inc. 4,060 151,276ONEOK Inc. 1,871 87,058
Security Shares Value
Oracle Corp. 51,940 $ 1,227,862O’Reilly Automotive Inc.a 1,225 60,368Owens-Illinois Inc.a 2,555 70,646PACCAR Inc. 4,655 213,292Pactiv Corp.a 735 22,359Pall Corp. 1,785 68,258Parker Hannifin Corp. 2,275 141,323PartnerRe Ltd. 774 56,014Patterson Companies Inc. 1,645 43,889Paychex Inc. 4,480 116,435Peabody Energy Corp. 3,745 169,087Pentair Inc. 1,575 53,865People’s United Financial Inc. 5,110 70,722Pepco Holdings Inc. 3,885 65,695PepsiCo Inc. 20,437 1,326,566Perrigo Co. 1,435 80,374Petrohawk Energy Corp.a 3,745 59,059PetSmart Inc. 2,345 72,812Pfizer Inc. 103,363 1,550,445PG&E Corp. 4,725 209,790Pharmaceutical Product
Development Inc. 1,330 32,266Philip Morris International Inc. 24,570 1,254,053Pinnacle West Capital Corp. 1,610 61,325Pioneer Natural Resources Co. 1,820 105,414Pitney Bowes Inc. 1,820 44,426Plains Exploration &
Production Co.a 1,365 30,781Plum Creek Timber Co. Inc.c 2,625 94,185PNC Financial Services
Group Inc. (The)d 6,335 376,236Polo Ralph Lauren Corp. 1,050 82,961PPG Industries Inc. 2,205 153,181PPL Corp. 4,970 135,631Praxair Inc. 4,200 364,644Precision Castparts Corp. 1,995 243,769Priceline.com Inc.a 525 117,810Pride International Inc.a 2,170 51,624Principal Financial Group Inc. 4,445 113,836Procter & Gamble Co. (The) 36,995 2,262,614Progress Energy Inc. 3,920 165,071Progressive Corp. (The) 8,820 173,225ProLogis 4,445 48,273
S c h e d u l e s o f I n v e st m e n t s 127
Schedule of Investments (Continued)
iSHARES» MSCI KOKUSAI INDEX FUNDJuly 31, 2010
For
per
sona
l use
onl
y
%%TRANSMSG*** Transmitting Job: B82515 PCN: 129000000 ***%%PCMSG|127 |00010|Yes|No|09/16/2010 20:08|0|0|Page is valid, no graphics -- Color: N|
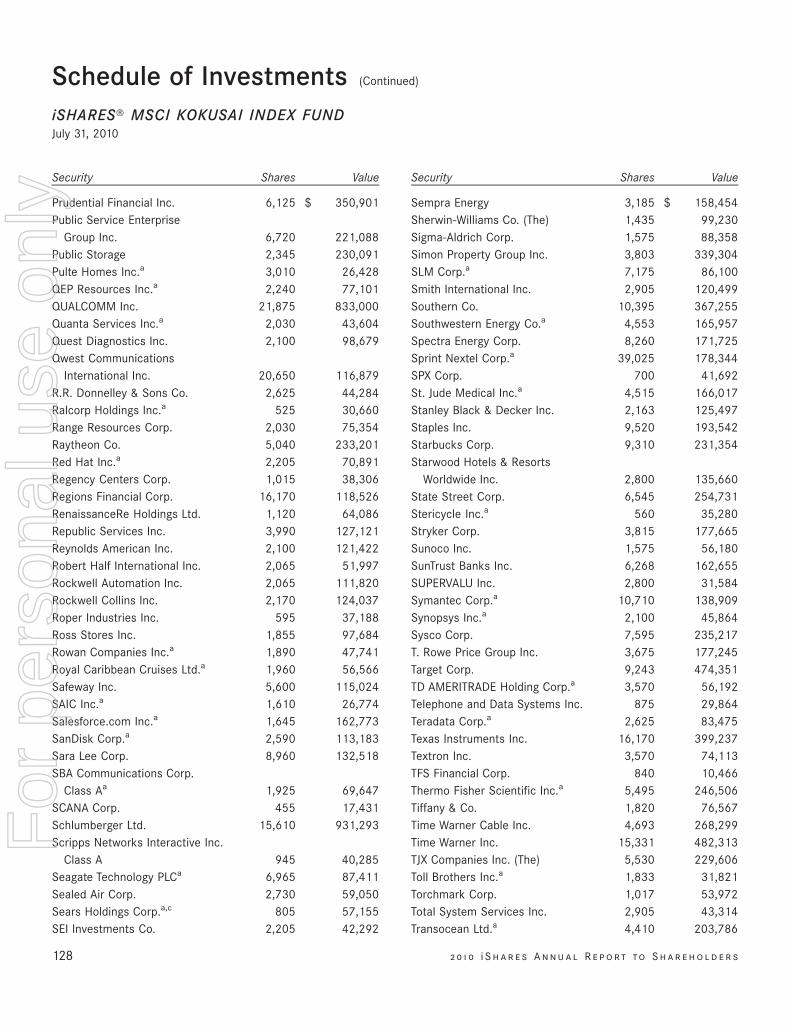
Security Shares Value
Prudential Financial Inc. 6,125 $ 350,901Public Service Enterprise
Group Inc. 6,720 221,088Public Storage 2,345 230,091Pulte Homes Inc.a 3,010 26,428QEP Resources Inc.a 2,240 77,101QUALCOMM Inc. 21,875 833,000Quanta Services Inc.a 2,030 43,604Quest Diagnostics Inc. 2,100 98,679Qwest Communications
International Inc. 20,650 116,879R.R. Donnelley & Sons Co. 2,625 44,284Ralcorp Holdings Inc.a 525 30,660Range Resources Corp. 2,030 75,354Raytheon Co. 5,040 233,201Red Hat Inc.a 2,205 70,891Regency Centers Corp. 1,015 38,306Regions Financial Corp. 16,170 118,526RenaissanceRe Holdings Ltd. 1,120 64,086Republic Services Inc. 3,990 127,121Reynolds American Inc. 2,100 121,422Robert Half International Inc. 2,065 51,997Rockwell Automation Inc. 2,065 111,820Rockwell Collins Inc. 2,170 124,037Roper Industries Inc. 595 37,188Ross Stores Inc. 1,855 97,684Rowan Companies Inc.a 1,890 47,741Royal Caribbean Cruises Ltd.a 1,960 56,566Safeway Inc. 5,600 115,024SAIC Inc.a 1,610 26,774Salesforce.com Inc.a 1,645 162,773SanDisk Corp.a 2,590 113,183Sara Lee Corp. 8,960 132,518SBA Communications Corp.
Class Aa 1,925 69,647SCANA Corp. 455 17,431Schlumberger Ltd. 15,610 931,293Scripps Networks Interactive Inc.
Class A 945 40,285Seagate Technology PLCa 6,965 87,411Sealed Air Corp. 2,730 59,050Sears Holdings Corp.a,c 805 57,155SEI Investments Co. 2,205 42,292
Security Shares Value
Sempra Energy 3,185 $ 158,454Sherwin-Williams Co. (The) 1,435 99,230Sigma-Aldrich Corp. 1,575 88,358Simon Property Group Inc. 3,803 339,304SLM Corp.a 7,175 86,100Smith International Inc. 2,905 120,499Southern Co. 10,395 367,255Southwestern Energy Co.a 4,553 165,957Spectra Energy Corp. 8,260 171,725Sprint Nextel Corp.a 39,025 178,344SPX Corp. 700 41,692St. Jude Medical Inc.a 4,515 166,017Stanley Black & Decker Inc. 2,163 125,497Staples Inc. 9,520 193,542Starbucks Corp. 9,310 231,354Starwood Hotels & Resorts
Worldwide Inc. 2,800 135,660State Street Corp. 6,545 254,731Stericycle Inc.a 560 35,280Stryker Corp. 3,815 177,665Sunoco Inc. 1,575 56,180SunTrust Banks Inc. 6,268 162,655SUPERVALU Inc. 2,800 31,584Symantec Corp.a 10,710 138,909Synopsys Inc.a 2,100 45,864Sysco Corp. 7,595 235,217T. Rowe Price Group Inc. 3,675 177,245Target Corp. 9,243 474,351TD AMERITRADE Holding Corp.a 3,570 56,192Telephone and Data Systems Inc. 875 29,864Teradata Corp.a 2,625 83,475Texas Instruments Inc. 16,170 399,237Textron Inc. 3,570 74,113TFS Financial Corp. 840 10,466Thermo Fisher Scientific Inc.a 5,495 246,506Tiffany & Co. 1,820 76,567Time Warner Cable Inc. 4,693 268,299Time Warner Inc. 15,331 482,313TJX Companies Inc. (The) 5,530 229,606Toll Brothers Inc.a 1,833 31,821Torchmark Corp. 1,017 53,972Total System Services Inc. 2,905 43,314Transocean Ltd.a 4,410 203,786
128 2 0 1 0 i S h a r e s A n n u a l R e p o r t to S h a r e h o l d e r s
Schedule of Investments (Continued)
iSHARES» MSCI KOKUSAI INDEX FUNDJuly 31, 2010
For
per
sona
l use
onl
y
%%TRANSMSG*** Transmitting Job: B82515 PCN: 130000000 ***%%PCMSG|128 |00010|Yes|No|09/16/2010 20:08|0|0|Page is valid, no graphics -- Color: N|
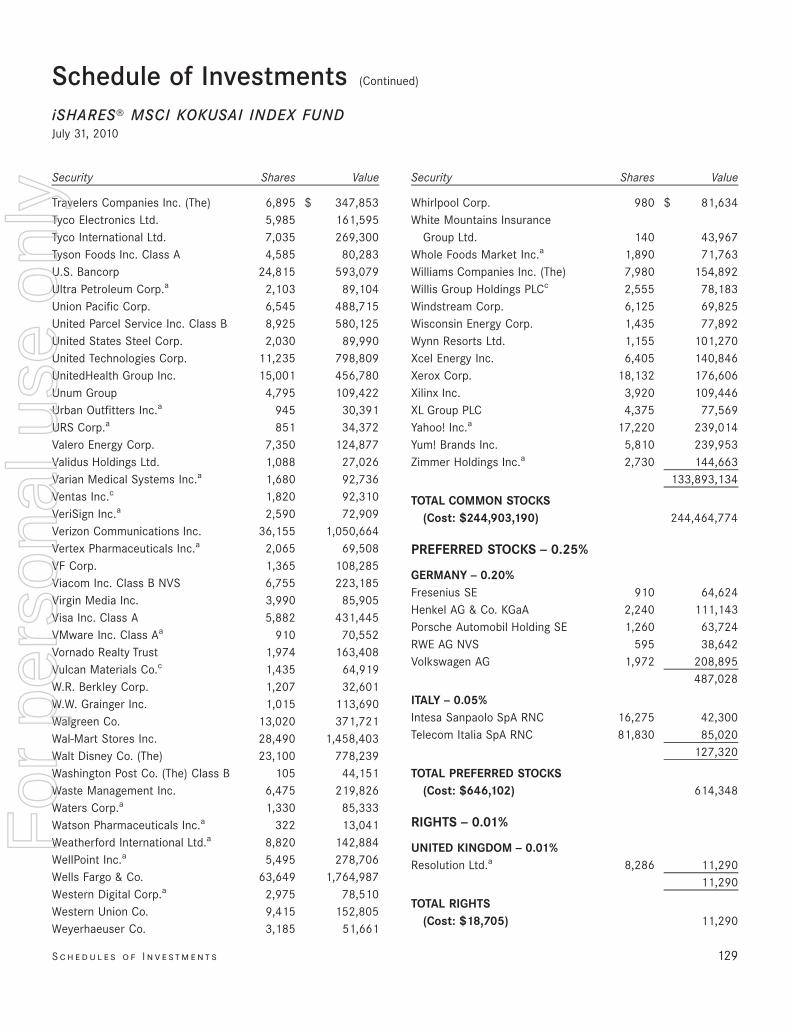
Security Shares Value
Travelers Companies Inc. (The) 6,895 $ 347,853Tyco Electronics Ltd. 5,985 161,595Tyco International Ltd. 7,035 269,300Tyson Foods Inc. Class A 4,585 80,283U.S. Bancorp 24,815 593,079Ultra Petroleum Corp.a 2,103 89,104Union Pacific Corp. 6,545 488,715United Parcel Service Inc. Class B 8,925 580,125United States Steel Corp. 2,030 89,990United Technologies Corp. 11,235 798,809UnitedHealth Group Inc. 15,001 456,780Unum Group 4,795 109,422Urban Outfitters Inc.a 945 30,391URS Corp.a 851 34,372Valero Energy Corp. 7,350 124,877Validus Holdings Ltd. 1,088 27,026Varian Medical Systems Inc.a 1,680 92,736Ventas Inc.c 1,820 92,310VeriSign Inc.a 2,590 72,909Verizon Communications Inc. 36,155 1,050,664Vertex Pharmaceuticals Inc.a 2,065 69,508VF Corp. 1,365 108,285Viacom Inc. Class B NVS 6,755 223,185Virgin Media Inc. 3,990 85,905Visa Inc. Class A 5,882 431,445VMware Inc. Class Aa 910 70,552Vornado Realty Trust 1,974 163,408Vulcan Materials Co.c 1,435 64,919W.R. Berkley Corp. 1,207 32,601W.W. Grainger Inc. 1,015 113,690Walgreen Co. 13,020 371,721Wal-Mart Stores Inc. 28,490 1,458,403Walt Disney Co. (The) 23,100 778,239Washington Post Co. (The) Class B 105 44,151Waste Management Inc. 6,475 219,826Waters Corp.a 1,330 85,333Watson Pharmaceuticals Inc.a 322 13,041Weatherford International Ltd.a 8,820 142,884WellPoint Inc.a 5,495 278,706Wells Fargo & Co. 63,649 1,764,987Western Digital Corp.a 2,975 78,510Western Union Co. 9,415 152,805Weyerhaeuser Co. 3,185 51,661
Security Shares Value
Whirlpool Corp. 980 $ 81,634White Mountains Insurance
Group Ltd. 140 43,967Whole Foods Market Inc.a 1,890 71,763Williams Companies Inc. (The) 7,980 154,892Willis Group Holdings PLCc 2,555 78,183Windstream Corp. 6,125 69,825Wisconsin Energy Corp. 1,435 77,892Wynn Resorts Ltd. 1,155 101,270Xcel Energy Inc. 6,405 140,846Xerox Corp. 18,132 176,606Xilinx Inc. 3,920 109,446XL Group PLC 4,375 77,569Yahoo! Inc.a 17,220 239,014Yum! Brands Inc. 5,810 239,953Zimmer Holdings Inc.a 2,730 144,663
133,893,134
TOTAL COMMON STOCKS(Cost: $244,903,190) 244,464,774
PREFERRED STOCKS — 0.25%
GERMANY — 0.20%Fresenius SE 910 64,624Henkel AG & Co. KGaA 2,240 111,143Porsche Automobil Holding SE 1,260 63,724RWE AG NVS 595 38,642Volkswagen AG 1,972 208,895
487,028
ITALY — 0.05%Intesa Sanpaolo SpA RNC 16,275 42,300Telecom Italia SpA RNC 81,830 85,020
127,320
TOTAL PREFERRED STOCKS(Cost: $646,102) 614,348
RIGHTS — 0.01%
UNITED KINGDOM — 0.01%Resolution Ltd.a 8,286 11,290
11,290
TOTAL RIGHTS(Cost: $18,705) 11,290
S c h e d u l e s o f I n v e st m e n t s 129
Schedule of Investments (Continued)
iSHARES» MSCI KOKUSAI INDEX FUNDJuly 31, 2010
For
per
sona
l use
onl
y
%%TRANSMSG*** Transmitting Job: B82515 PCN: 131000000 ***%%PCMSG|129 |00010|Yes|No|09/16/2010 20:08|0|0|Page is valid, no graphics -- Color: N|
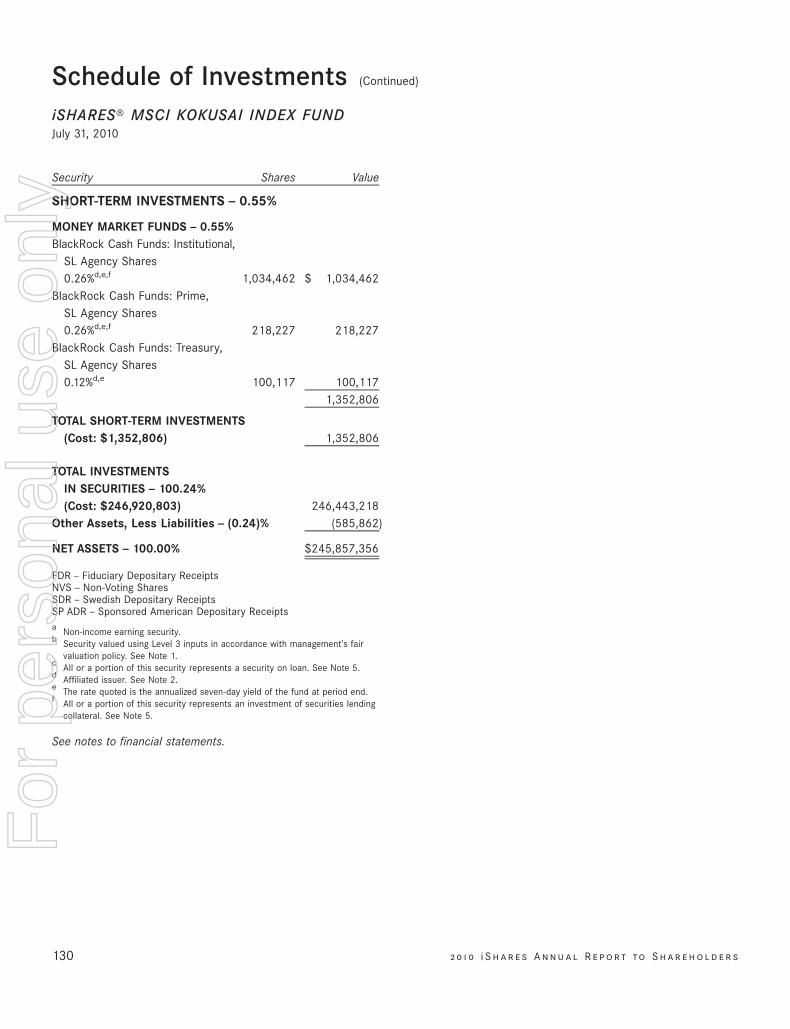
Security Shares Value
SHORT-TERM INVESTMENTS — 0.55%
MONEY MARKET FUNDS — 0.55%BlackRock Cash Funds: Institutional,
SL Agency Shares0.26%d,e,f 1,034,462 $ 1,034,462
BlackRock Cash Funds: Prime,SL Agency Shares0.26%d,e,f 218,227 218,227
BlackRock Cash Funds: Treasury,SL Agency Shares0.12%d,e 100,117 100,117
1,352,806
TOTAL SHORT-TERM INVESTMENTS(Cost: $1,352,806) 1,352,806
TOTAL INVESTMENTSIN SECURITIES — 100.24%(Cost: $246,920,803) 246,443,218
Other Assets, Less Liabilities — (0.24)% (585,862)
NET ASSETS — 100.00% $245,857,356
FDR — Fiduciary Depositary ReceiptsNVS — Non-Voting SharesSDR — Swedish Depositary ReceiptsSP ADR — Sponsored American Depositary Receiptsa Non-income earning security.b Security valued using Level 3 inputs in accordance with management’s fair
valuation policy. See Note 1.c All or a portion of this security represents a security on loan. See Note 5.d Affiliated issuer. See Note 2.e The rate quoted is the annualized seven-day yield of the fund at period end.f All or a portion of this security represents an investment of securities lending
collateral. See Note 5.
See notes to financial statements.
130 2 0 1 0 i S h a r e s A n n u a l R e p o r t to S h a r e h o l d e r s
Schedule of Investments (Continued)
iSHARES» MSCI KOKUSAI INDEX FUNDJuly 31, 2010
For
per
sona
l use
onl
y
%%TRANSMSG*** Transmitting Job: B82515 PCN: 132000000 ***%%PCMSG|130 |00011|Yes|No|09/16/2010 20:08|0|0|Page is valid, no graphics -- Color: N|
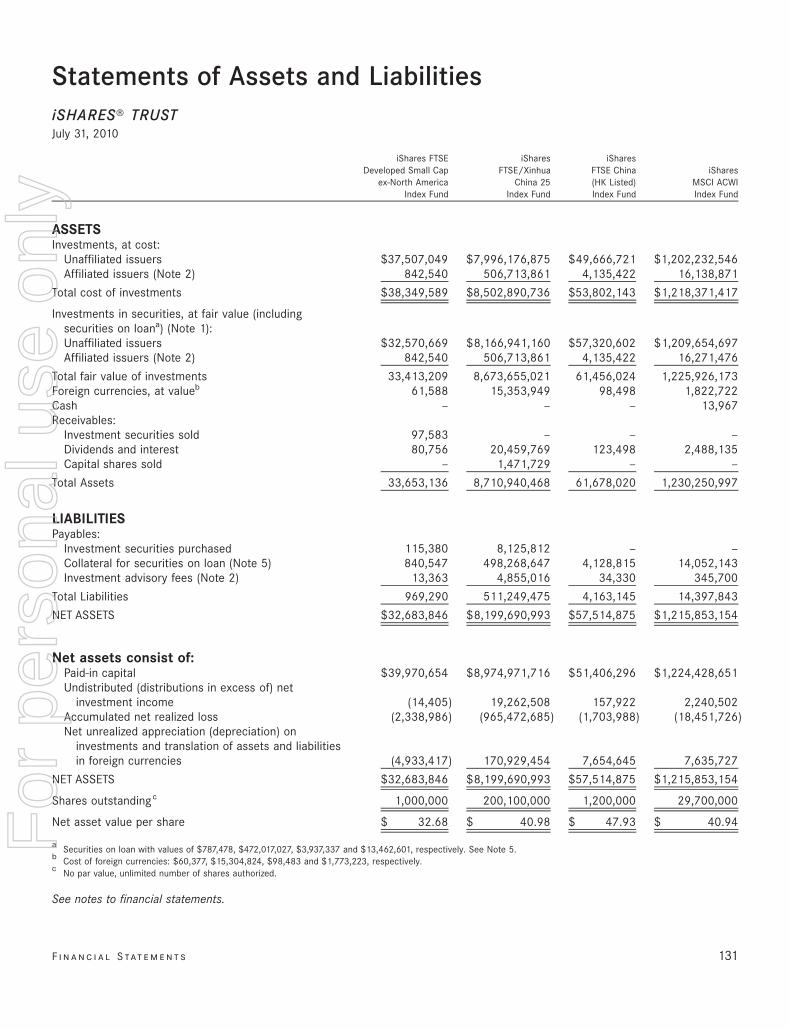
Statements of Assets and LiabilitiesiSHARES» TRUSTJuly 31, 2010
iShares FTSEDeveloped Small Cap
ex-North AmericaIndex Fund
iSharesFTSE/Xinhua
China 25Index Fund
iSharesFTSE China(HK Listed)Index Fund
iSharesMSCI ACWIIndex Fund
ASSETSInvestments, at cost:
Unaffiliated issuers $37,507,049 $7,996,176,875 $49,666,721 $1,202,232,546Affiliated issuers (Note 2) 842,540 506,713,861 4,135,422 16,138,871
Total cost of investments $38,349,589 $8,502,890,736 $53,802,143 $1,218,371,417
Investments in securities, at fair value (includingsecurities on loana) (Note 1):Unaffiliated issuers $32,570,669 $8,166,941,160 $57,320,602 $1,209,654,697Affiliated issuers (Note 2) 842,540 506,713,861 4,135,422 16,271,476
Total fair value of investments 33,413,209 8,673,655,021 61,456,024 1,225,926,173Foreign currencies, at valueb 61,588 15,353,949 98,498 1,822,722Cash — — — 13,967Receivables:
Investment securities sold 97,583 — — —Dividends and interest 80,756 20,459,769 123,498 2,488,135Capital shares sold — 1,471,729 — —
Total Assets 33,653,136 8,710,940,468 61,678,020 1,230,250,997
LIABILITIESPayables:
Investment securities purchased 115,380 8,125,812 — —Collateral for securities on loan (Note 5) 840,547 498,268,647 4,128,815 14,052,143Investment advisory fees (Note 2) 13,363 4,855,016 34,330 345,700
Total Liabilities 969,290 511,249,475 4,163,145 14,397,843
NET ASSETS $32,683,846 $8,199,690,993 $57,514,875 $1,215,853,154
Net assets consist of:Paid-in capital $39,970,654 $8,974,971,716 $51,406,296 $1,224,428,651Undistributed (distributions in excess of) net
investment income (14,405) 19,262,508 157,922 2,240,502Accumulated net realized loss (2,338,986) (965,472,685) (1,703,988) (18,451,726)Net unrealized appreciation (depreciation) on
investments and translation of assets and liabilitiesin foreign currencies (4,933,417) 170,929,454 7,654,645 7,635,727
NET ASSETS $32,683,846 $8,199,690,993 $57,514,875 $1,215,853,154
Shares outstandingc 1,000,000 200,100,000 1,200,000 29,700,000
Net asset value per share $ 32.68 $ 40.98 $ 47.93 $ 40.94
a Securities on loan with values of $787,478, $472,017,027, $3,937,337 and $13,462,601, respectively. See Note 5.b Cost of foreign currencies: $60,377, $15,304,824, $98,483 and $1,773,223, respectively.c No par value, unlimited number of shares authorized.
See notes to financial statements.
F i n a n c i a l S tat e m e n t s 131
For
per
sona
l use
onl
y
%%TRANSMSG*** Transmitting Job: B82515 PCN: 133000000 ***%%PCMSG|131 |00014|Yes|No|09/16/2010 20:08|0|0|Page is valid, no graphics -- Color: N|
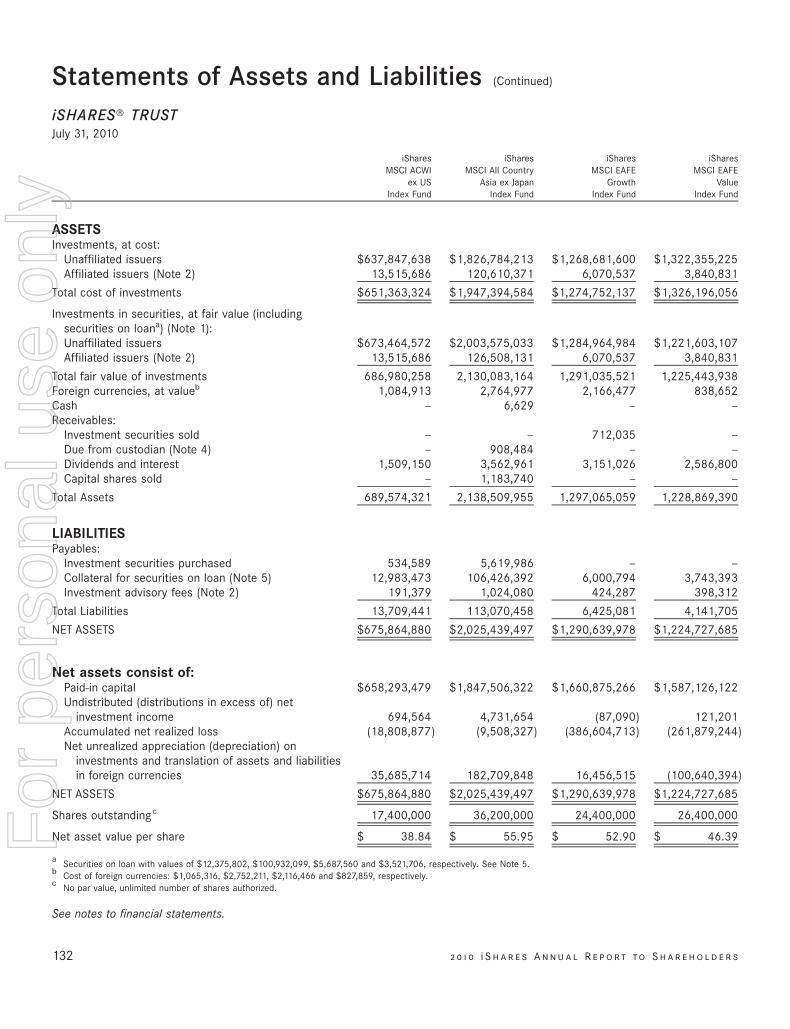
iSharesMSCI ACWI
ex USIndex Fund
iSharesMSCI All Country
Asia ex JapanIndex Fund
iSharesMSCI EAFE
GrowthIndex Fund
iSharesMSCI EAFE
ValueIndex Fund
ASSETSInvestments, at cost:
Unaffiliated issuers $637,847,638 $1,826,784,213 $1,268,681,600 $1,322,355,225Affiliated issuers (Note 2) 13,515,686 120,610,371 6,070,537 3,840,831
Total cost of investments $651,363,324 $1,947,394,584 $1,274,752,137 $1,326,196,056
Investments in securities, at fair value (includingsecurities on loana) (Note 1):Unaffiliated issuers $673,464,572 $2,003,575,033 $1,284,964,984 $1,221,603,107Affiliated issuers (Note 2) 13,515,686 126,508,131 6,070,537 3,840,831
Total fair value of investments 686,980,258 2,130,083,164 1,291,035,521 1,225,443,938Foreign currencies, at valueb 1,084,913 2,764,977 2,166,477 838,652Cash — 6,629 — —Receivables:
Investment securities sold — — 712,035 —Due from custodian (Note 4) — 908,484 — —Dividends and interest 1,509,150 3,562,961 3,151,026 2,586,800Capital shares sold — 1,183,740 — —
Total Assets 689,574,321 2,138,509,955 1,297,065,059 1,228,869,390
LIABILITIESPayables:
Investment securities purchased 534,589 5,619,986 — —Collateral for securities on loan (Note 5) 12,983,473 106,426,392 6,000,794 3,743,393Investment advisory fees (Note 2) 191,379 1,024,080 424,287 398,312
Total Liabilities 13,709,441 113,070,458 6,425,081 4,141,705
NET ASSETS $675,864,880 $2,025,439,497 $1,290,639,978 $1,224,727,685
Net assets consist of:Paid-in capital $658,293,479 $1,847,506,322 $1,660,875,266 $1,587,126,122Undistributed (distributions in excess of) net
investment income 694,564 4,731,654 (87,090) 121,201Accumulated net realized loss (18,808,877) (9,508,327) (386,604,713) (261,879,244)Net unrealized appreciation (depreciation) on
investments and translation of assets and liabilitiesin foreign currencies 35,685,714 182,709,848 16,456,515 (100,640,394)
NET ASSETS $675,864,880 $2,025,439,497 $1,290,639,978 $1,224,727,685
Shares outstandingc 17,400,000 36,200,000 24,400,000 26,400,000
Net asset value per share $ 38.84 $ 55.95 $ 52.90 $ 46.39
a Securities on loan with values of $12,375,802, $100,932,099, $5,687,560 and $3,521,706, respectively. See Note 5.b Cost of foreign currencies: $1,065,316, $2,752,211, $2,116,466 and $827,859, respectively.c No par value, unlimited number of shares authorized.
See notes to financial statements.
132 2 0 1 0 i S h a r e s A n n u a l R e p o r t to S h a r e h o l d e r s
Statements of Assets and Liabilities (Continued)
iSHARES» TRUSTJuly 31, 2010
For
per
sona
l use
onl
y
%%TRANSMSG*** Transmitting Job: B82515 PCN: 134000000 ***%%PCMSG|132 |00016|Yes|No|09/16/2010 20:08|0|0|Page is valid, no graphics -- Color: N|
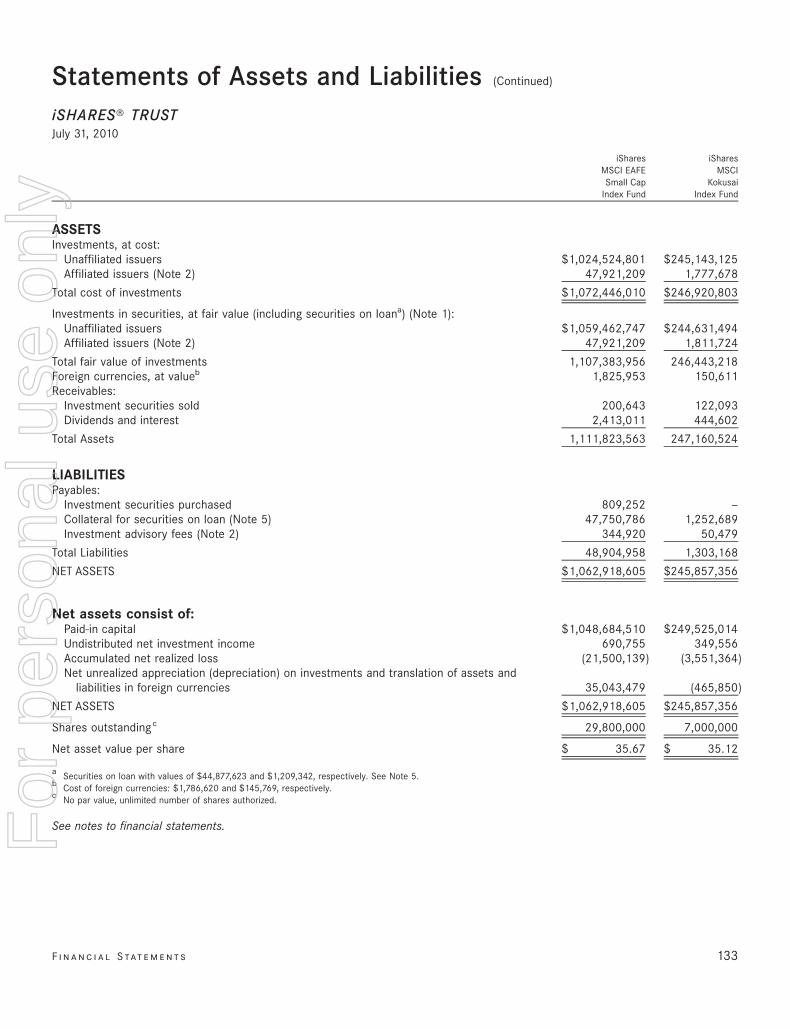
iSharesMSCI EAFESmall Cap
Index Fund
iSharesMSCI
KokusaiIndex Fund
ASSETSInvestments, at cost:
Unaffiliated issuers $1,024,524,801 $245,143,125Affiliated issuers (Note 2) 47,921,209 1,777,678
Total cost of investments $1,072,446,010 $246,920,803
Investments in securities, at fair value (including securities on loana) (Note 1):Unaffiliated issuers $1,059,462,747 $244,631,494Affiliated issuers (Note 2) 47,921,209 1,811,724
Total fair value of investments 1,107,383,956 246,443,218Foreign currencies, at valueb 1,825,953 150,611Receivables:
Investment securities sold 200,643 122,093Dividends and interest 2,413,011 444,602
Total Assets 1,111,823,563 247,160,524
LIABILITIESPayables:
Investment securities purchased 809,252 —Collateral for securities on loan (Note 5) 47,750,786 1,252,689Investment advisory fees (Note 2) 344,920 50,479
Total Liabilities 48,904,958 1,303,168
NET ASSETS $1,062,918,605 $245,857,356
Net assets consist of:Paid-in capital $1,048,684,510 $249,525,014Undistributed net investment income 690,755 349,556Accumulated net realized loss (21,500,139) (3,551,364)Net unrealized appreciation (depreciation) on investments and translation of assets and
liabilities in foreign currencies 35,043,479 (465,850)
NET ASSETS $1,062,918,605 $245,857,356
Shares outstandingc 29,800,000 7,000,000
Net asset value per share $ 35.67 $ 35.12
a Securities on loan with values of $44,877,623 and $1,209,342, respectively. See Note 5.b Cost of foreign currencies: $1,786,620 and $145,769, respectively.c No par value, unlimited number of shares authorized.
See notes to financial statements.
F i n a n c i a l S tat e m e n t s 133
Statements of Assets and Liabilities (Continued)
iSHARES» TRUSTJuly 31, 2010
For
per
sona
l use
onl
y
%%TRANSMSG*** Transmitting Job: B82515 PCN: 135000000 ***%%PCMSG|133 |00013|Yes|No|09/16/2010 20:08|0|0|Page is valid, no graphics -- Color: N|
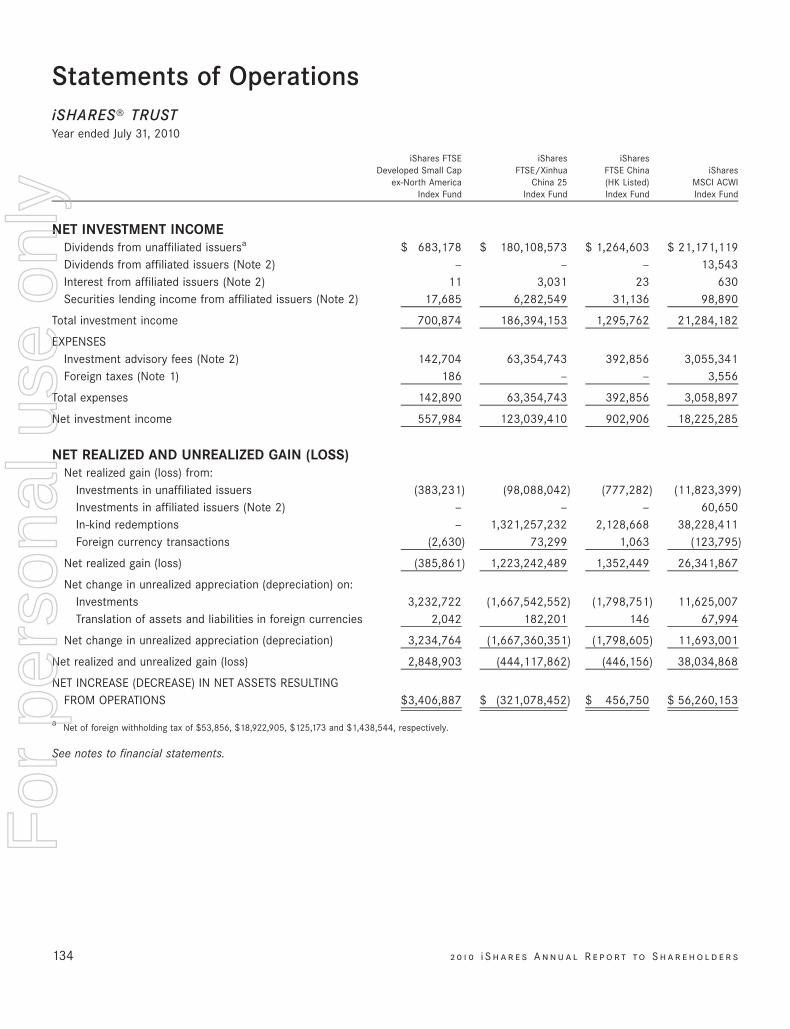
Statements of OperationsiSHARES» TRUSTYear ended July 31, 2010
iShares FTSEDeveloped Small Cap
ex-North AmericaIndex Fund
iSharesFTSE/Xinhua
China 25Index Fund
iSharesFTSE China(HK Listed)Index Fund
iSharesMSCI ACWIIndex Fund
NET INVESTMENT INCOMEDividends from unaffiliated issuersa $ 683,178 $ 180,108,573 $ 1,264,603 $ 21,171,119Dividends from affiliated issuers (Note 2) — — — 13,543Interest from affiliated issuers (Note 2) 11 3,031 23 630Securities lending income from affiliated issuers (Note 2) 17,685 6,282,549 31,136 98,890
Total investment income 700,874 186,394,153 1,295,762 21,284,182
EXPENSESInvestment advisory fees (Note 2) 142,704 63,354,743 392,856 3,055,341Foreign taxes (Note 1) 186 — — 3,556
Total expenses 142,890 63,354,743 392,856 3,058,897
Net investment income 557,984 123,039,410 902,906 18,225,285
NET REALIZED AND UNREALIZED GAIN (LOSS)Net realized gain (loss) from:
Investments in unaffiliated issuers (383,231) (98,088,042) (777,282) (11,823,399)Investments in affiliated issuers (Note 2) — — — 60,650In-kind redemptions — 1,321,257,232 2,128,668 38,228,411Foreign currency transactions (2,630) 73,299 1,063 (123,795)
Net realized gain (loss) (385,861) 1,223,242,489 1,352,449 26,341,867
Net change in unrealized appreciation (depreciation) on:Investments 3,232,722 (1,667,542,552) (1,798,751) 11,625,007Translation of assets and liabilities in foreign currencies 2,042 182,201 146 67,994
Net change in unrealized appreciation (depreciation) 3,234,764 (1,667,360,351) (1,798,605) 11,693,001
Net realized and unrealized gain (loss) 2,848,903 (444,117,862) (446,156) 38,034,868
NET INCREASE (DECREASE) IN NET ASSETS RESULTINGFROM OPERATIONS $3,406,887 $ (321,078,452) $ 456,750 $ 56,260,153
a Net of foreign withholding tax of $53,856, $18,922,905, $125,173 and $1,438,544, respectively.
See notes to financial statements.
134 2 0 1 0 i S h a r e s A n n u a l R e p o r t to S h a r e h o l d e r s
For
per
sona
l use
onl
y
%%TRANSMSG*** Transmitting Job: B82515 PCN: 136000000 ***%%PCMSG|134 |00013|Yes|No|09/16/2010 20:08|0|0|Page is valid, no graphics -- Color: N|
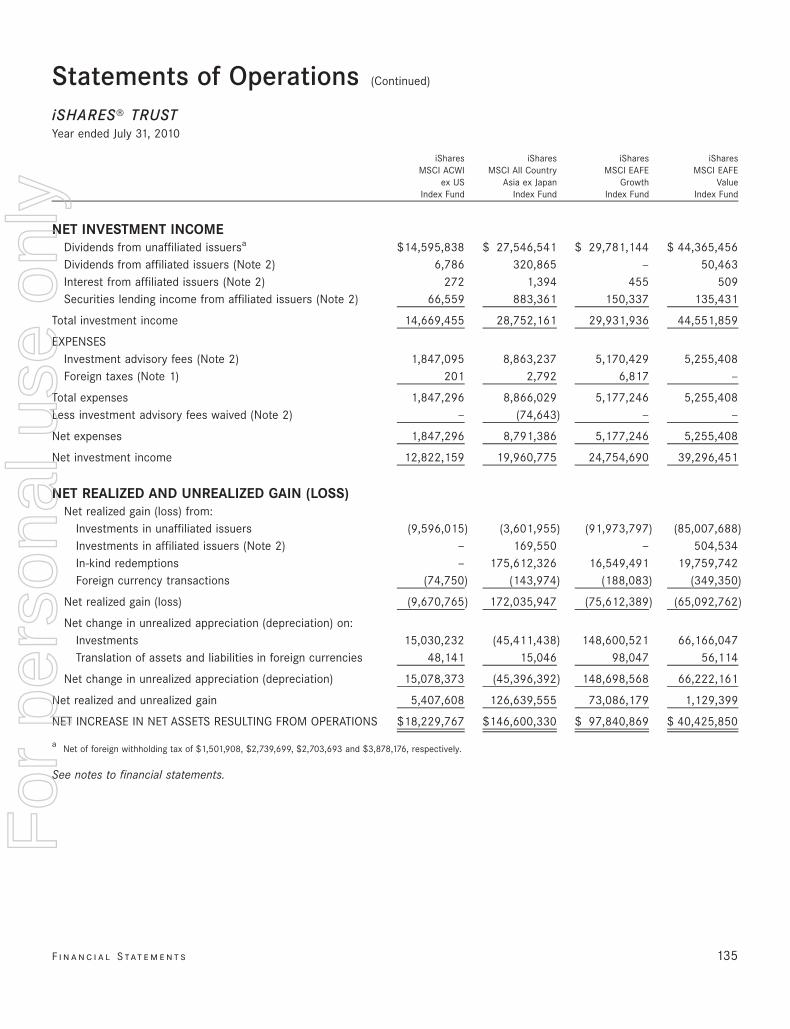
iSharesMSCI ACWI
ex USIndex Fund
iSharesMSCI All Country
Asia ex JapanIndex Fund
iSharesMSCI EAFE
GrowthIndex Fund
iSharesMSCI EAFE
ValueIndex Fund
NET INVESTMENT INCOMEDividends from unaffiliated issuersa $14,595,838 $ 27,546,541 $ 29,781,144 $ 44,365,456Dividends from affiliated issuers (Note 2) 6,786 320,865 — 50,463Interest from affiliated issuers (Note 2) 272 1,394 455 509Securities lending income from affiliated issuers (Note 2) 66,559 883,361 150,337 135,431
Total investment income 14,669,455 28,752,161 29,931,936 44,551,859
EXPENSESInvestment advisory fees (Note 2) 1,847,095 8,863,237 5,170,429 5,255,408Foreign taxes (Note 1) 201 2,792 6,817 —
Total expenses 1,847,296 8,866,029 5,177,246 5,255,408Less investment advisory fees waived (Note 2) — (74,643) — —
Net expenses 1,847,296 8,791,386 5,177,246 5,255,408
Net investment income 12,822,159 19,960,775 24,754,690 39,296,451
NET REALIZED AND UNREALIZED GAIN (LOSS)Net realized gain (loss) from:
Investments in unaffiliated issuers (9,596,015) (3,601,955) (91,973,797) (85,007,688)Investments in affiliated issuers (Note 2) — 169,550 — 504,534In-kind redemptions — 175,612,326 16,549,491 19,759,742Foreign currency transactions (74,750) (143,974) (188,083) (349,350)
Net realized gain (loss) (9,670,765) 172,035,947 (75,612,389) (65,092,762)
Net change in unrealized appreciation (depreciation) on:Investments 15,030,232 (45,411,438) 148,600,521 66,166,047Translation of assets and liabilities in foreign currencies 48,141 15,046 98,047 56,114
Net change in unrealized appreciation (depreciation) 15,078,373 (45,396,392) 148,698,568 66,222,161
Net realized and unrealized gain 5,407,608 126,639,555 73,086,179 1,129,399
NET INCREASE IN NET ASSETS RESULTING FROM OPERATIONS $18,229,767 $146,600,330 $ 97,840,869 $ 40,425,850
a Net of foreign withholding tax of $1,501,908, $2,739,699, $2,703,693 and $3,878,176, respectively.
See notes to financial statements.
F i n a n c i a l S tat e m e n t s 135
Statements of Operations (Continued)
iSHARES» TRUSTYear ended July 31, 2010
For
per
sona
l use
onl
y
%%TRANSMSG*** Transmitting Job: B82515 PCN: 137000000 ***%%PCMSG|135 |00016|Yes|No|09/16/2010 20:08|0|0|Page is valid, no graphics -- Color: N|
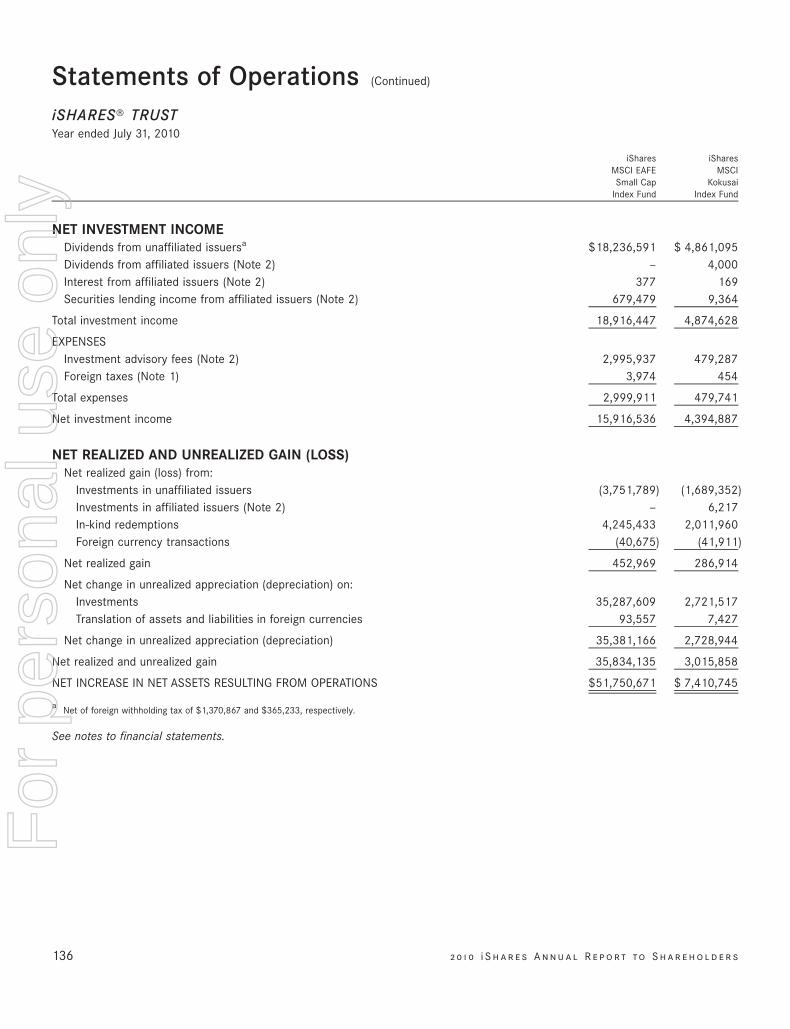
iSharesMSCI EAFESmall Cap
Index Fund
iSharesMSCI
KokusaiIndex Fund
NET INVESTMENT INCOMEDividends from unaffiliated issuersa $18,236,591 $ 4,861,095Dividends from affiliated issuers (Note 2) — 4,000Interest from affiliated issuers (Note 2) 377 169Securities lending income from affiliated issuers (Note 2) 679,479 9,364
Total investment income 18,916,447 4,874,628
EXPENSESInvestment advisory fees (Note 2) 2,995,937 479,287Foreign taxes (Note 1) 3,974 454
Total expenses 2,999,911 479,741
Net investment income 15,916,536 4,394,887
NET REALIZED AND UNREALIZED GAIN (LOSS)Net realized gain (loss) from:
Investments in unaffiliated issuers (3,751,789) (1,689,352)Investments in affiliated issuers (Note 2) — 6,217In-kind redemptions 4,245,433 2,011,960Foreign currency transactions (40,675) (41,911)
Net realized gain 452,969 286,914
Net change in unrealized appreciation (depreciation) on:Investments 35,287,609 2,721,517Translation of assets and liabilities in foreign currencies 93,557 7,427
Net change in unrealized appreciation (depreciation) 35,381,166 2,728,944
Net realized and unrealized gain 35,834,135 3,015,858
NET INCREASE IN NET ASSETS RESULTING FROM OPERATIONS $51,750,671 $ 7,410,745
a Net of foreign withholding tax of $1,370,867 and $365,233, respectively.
See notes to financial statements.
136 2 0 1 0 i S h a r e s A n n u a l R e p o r t to S h a r e h o l d e r s
Statements of Operations (Continued)
iSHARES» TRUSTYear ended July 31, 2010
For
per
sona
l use
onl
y
%%TRANSMSG*** Transmitting Job: B82515 PCN: 138000000 ***%%PCMSG|136 |00014|Yes|No|09/16/2010 20:08|0|0|Page is valid, no graphics -- Color: N|
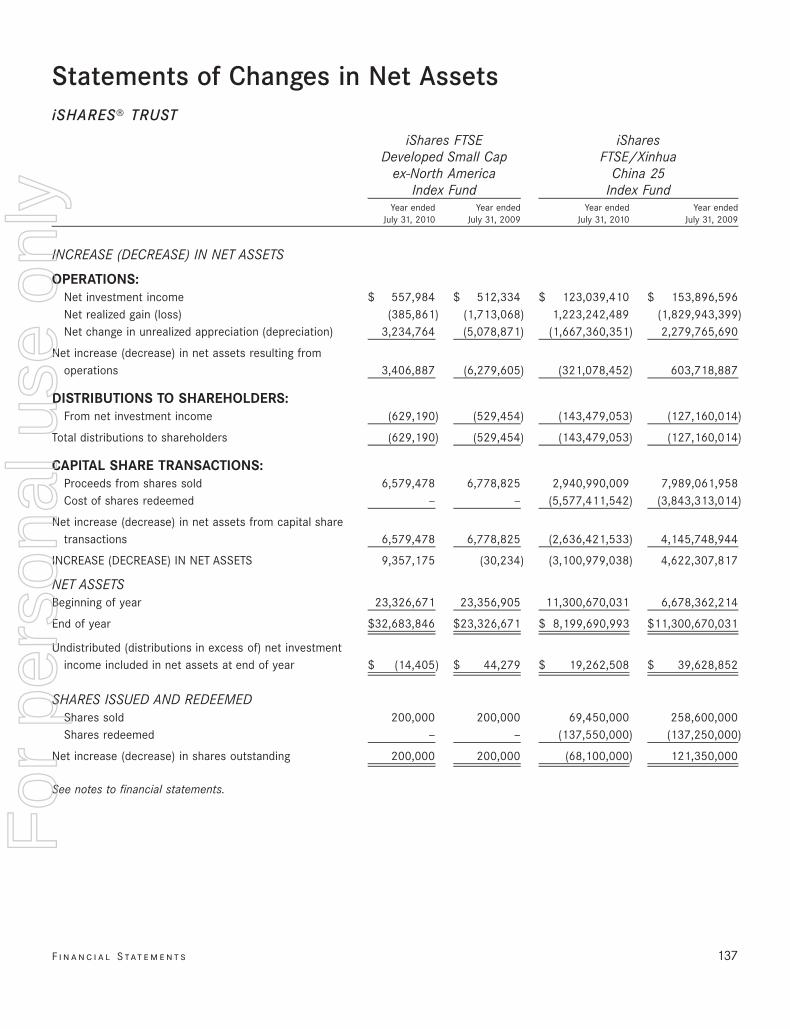
Statements of Changes in Net AssetsiSHARES» TRUST
Year endedJuly 31, 2010
Year endedJuly 31, 2009
Year endedJuly 31, 2010
Year endedJuly 31, 2009
iShares FTSEDeveloped Small Cap
ex-North AmericaIndex Fund
iSharesFTSE/Xinhua
China 25Index Fund
INCREASE (DECREASE) IN NET ASSETS
OPERATIONS:Net investment income $ 557,984 $ 512,334 $ 123,039,410 $ 153,896,596Net realized gain (loss) (385,861) (1,713,068) 1,223,242,489 (1,829,943,399)Net change in unrealized appreciation (depreciation) 3,234,764 (5,078,871) (1,667,360,351) 2,279,765,690
Net increase (decrease) in net assets resulting fromoperations 3,406,887 (6,279,605) (321,078,452) 603,718,887
DISTRIBUTIONS TO SHAREHOLDERS:From net investment income (629,190) (529,454) (143,479,053) (127,160,014)
Total distributions to shareholders (629,190) (529,454) (143,479,053) (127,160,014)
CAPITAL SHARE TRANSACTIONS:Proceeds from shares sold 6,579,478 6,778,825 2,940,990,009 7,989,061,958Cost of shares redeemed — — (5,577,411,542) (3,843,313,014)
Net increase (decrease) in net assets from capital sharetransactions 6,579,478 6,778,825 (2,636,421,533) 4,145,748,944
INCREASE (DECREASE) IN NET ASSETS 9,357,175 (30,234) (3,100,979,038) 4,622,307,817
NET ASSETSBeginning of year 23,326,671 23,356,905 11,300,670,031 6,678,362,214
End of year $32,683,846 $23,326,671 $ 8,199,690,993 $11,300,670,031
Undistributed (distributions in excess of) net investmentincome included in net assets at end of year $ (14,405) $ 44,279 $ 19,262,508 $ 39,628,852
SHARES ISSUED AND REDEEMEDShares sold 200,000 200,000 69,450,000 258,600,000Shares redeemed — — (137,550,000) (137,250,000)
Net increase (decrease) in shares outstanding 200,000 200,000 (68,100,000) 121,350,000
See notes to financial statements.
F i n a n c i a l S tat e m e n t s 137
For
per
sona
l use
onl
y
%%TRANSMSG*** Transmitting Job: B82515 PCN: 139000000 ***%%PCMSG|137 |00014|Yes|No|09/16/2010 20:08|0|0|Page is valid, no graphics -- Color: N|
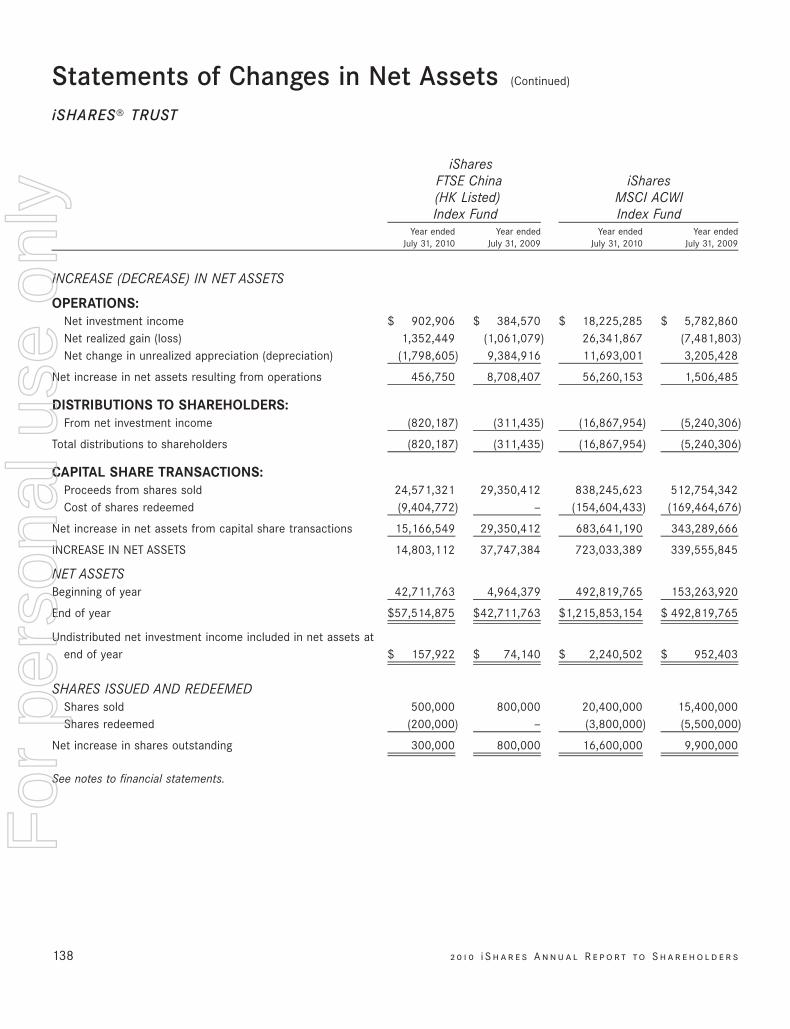
Year endedJuly 31, 2010
Year endedJuly 31, 2009
Year endedJuly 31, 2010
Year endedJuly 31, 2009
iSharesFTSE China(HK Listed)Index Fund
iSharesMSCI ACWIIndex Fund
INCREASE (DECREASE) IN NET ASSETS
OPERATIONS:Net investment income $ 902,906 $ 384,570 $ 18,225,285 $ 5,782,860Net realized gain (loss) 1,352,449 (1,061,079) 26,341,867 (7,481,803)Net change in unrealized appreciation (depreciation) (1,798,605) 9,384,916 11,693,001 3,205,428
Net increase in net assets resulting from operations 456,750 8,708,407 56,260,153 1,506,485
DISTRIBUTIONS TO SHAREHOLDERS:From net investment income (820,187) (311,435) (16,867,954) (5,240,306)
Total distributions to shareholders (820,187) (311,435) (16,867,954) (5,240,306)
CAPITAL SHARE TRANSACTIONS:Proceeds from shares sold 24,571,321 29,350,412 838,245,623 512,754,342Cost of shares redeemed (9,404,772) — (154,604,433) (169,464,676)
Net increase in net assets from capital share transactions 15,166,549 29,350,412 683,641,190 343,289,666
INCREASE IN NET ASSETS 14,803,112 37,747,384 723,033,389 339,555,845
NET ASSETSBeginning of year 42,711,763 4,964,379 492,819,765 153,263,920
End of year $57,514,875 $42,711,763 $1,215,853,154 $ 492,819,765
Undistributed net investment income included in net assets atend of year $ 157,922 $ 74,140 $ 2,240,502 $ 952,403
SHARES ISSUED AND REDEEMEDShares sold 500,000 800,000 20,400,000 15,400,000Shares redeemed (200,000) — (3,800,000) (5,500,000)
Net increase in shares outstanding 300,000 800,000 16,600,000 9,900,000
See notes to financial statements.
138 2 0 1 0 i S h a r e s A n n u a l R e p o r t to S h a r e h o l d e r s
Statements of Changes in Net Assets (Continued)
iSHARES» TRUST
For
per
sona
l use
onl
y
%%TRANSMSG*** Transmitting Job: B82515 PCN: 140000000 ***%%PCMSG|138 |00016|Yes|No|09/16/2010 20:08|0|0|Page is valid, no graphics -- Color: N|
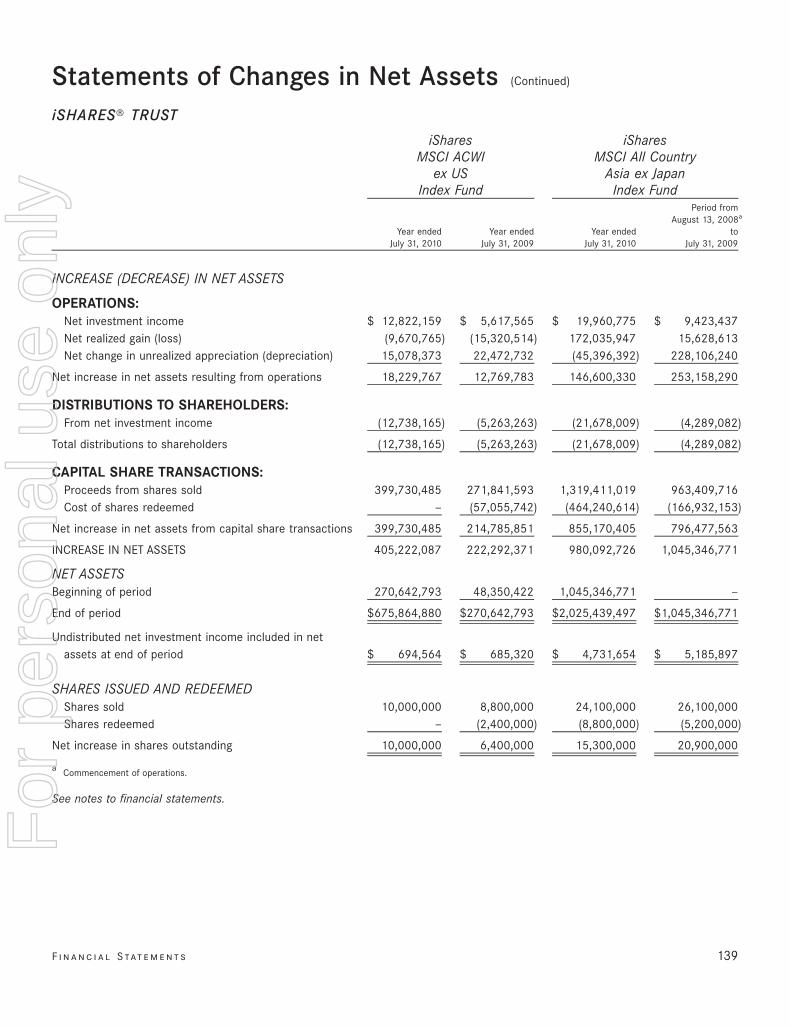
Year endedJuly 31, 2010
Year endedJuly 31, 2009
Year endedJuly 31, 2010
Period fromAugust 13, 2008a
toJuly 31, 2009
iSharesMSCI ACWI
ex USIndex Fund
iSharesMSCI All Country
Asia ex JapanIndex Fund
INCREASE (DECREASE) IN NET ASSETS
OPERATIONS:Net investment income $ 12,822,159 $ 5,617,565 $ 19,960,775 $ 9,423,437Net realized gain (loss) (9,670,765) (15,320,514) 172,035,947 15,628,613Net change in unrealized appreciation (depreciation) 15,078,373 22,472,732 (45,396,392) 228,106,240
Net increase in net assets resulting from operations 18,229,767 12,769,783 146,600,330 253,158,290
DISTRIBUTIONS TO SHAREHOLDERS:From net investment income (12,738,165) (5,263,263) (21,678,009) (4,289,082)
Total distributions to shareholders (12,738,165) (5,263,263) (21,678,009) (4,289,082)
CAPITAL SHARE TRANSACTIONS:Proceeds from shares sold 399,730,485 271,841,593 1,319,411,019 963,409,716Cost of shares redeemed — (57,055,742) (464,240,614) (166,932,153)
Net increase in net assets from capital share transactions 399,730,485 214,785,851 855,170,405 796,477,563
INCREASE IN NET ASSETS 405,222,087 222,292,371 980,092,726 1,045,346,771
NET ASSETSBeginning of period 270,642,793 48,350,422 1,045,346,771 —
End of period $675,864,880 $270,642,793 $2,025,439,497 $1,045,346,771
Undistributed net investment income included in netassets at end of period $ 694,564 $ 685,320 $ 4,731,654 $ 5,185,897
SHARES ISSUED AND REDEEMEDShares sold 10,000,000 8,800,000 24,100,000 26,100,000Shares redeemed — (2,400,000) (8,800,000) (5,200,000)
Net increase in shares outstanding 10,000,000 6,400,000 15,300,000 20,900,000
a Commencement of operations.
See notes to financial statements.
F i n a n c i a l S tat e m e n t s 139
Statements of Changes in Net Assets (Continued)
iSHARES» TRUST
For
per
sona
l use
onl
y
%%TRANSMSG*** Transmitting Job: B82515 PCN: 141000000 ***%%PCMSG|139 |00014|Yes|No|09/16/2010 20:08|0|0|Page is valid, no graphics -- Color: N|
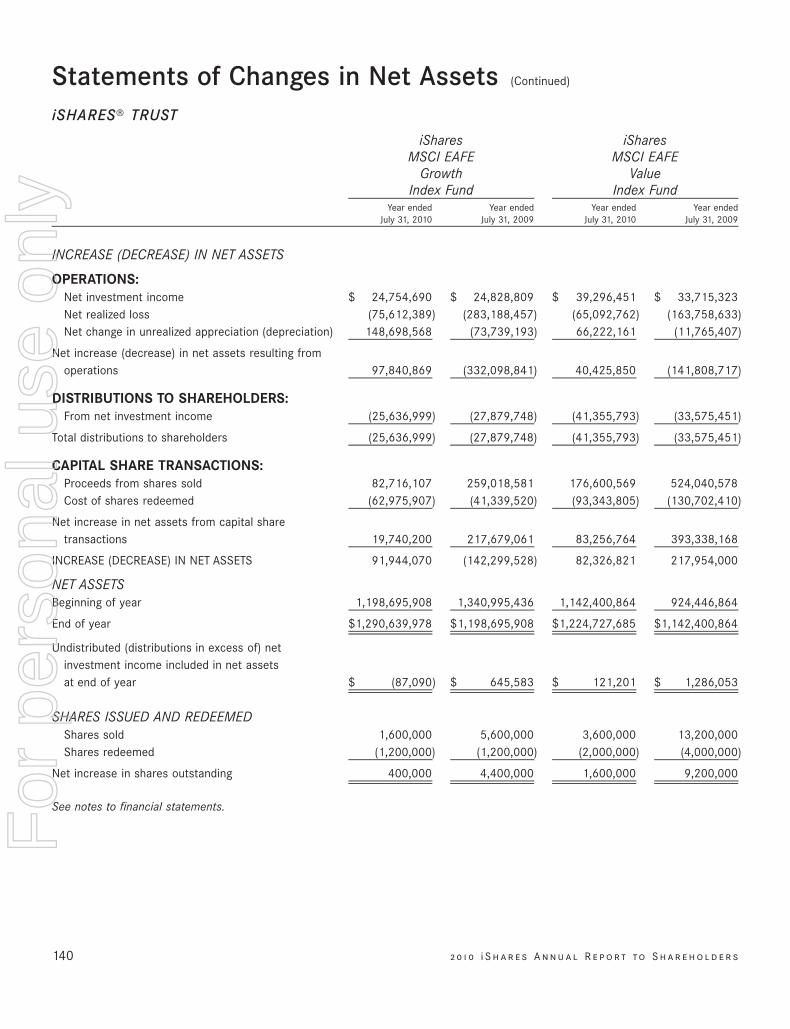
Year endedJuly 31, 2010
Year endedJuly 31, 2009
Year endedJuly 31, 2010
Year endedJuly 31, 2009
iSharesMSCI EAFE
GrowthIndex Fund
iSharesMSCI EAFE
ValueIndex Fund
INCREASE (DECREASE) IN NET ASSETS
OPERATIONS:Net investment income $ 24,754,690 $ 24,828,809 $ 39,296,451 $ 33,715,323Net realized loss (75,612,389) (283,188,457) (65,092,762) (163,758,633)Net change in unrealized appreciation (depreciation) 148,698,568 (73,739,193) 66,222,161 (11,765,407)
Net increase (decrease) in net assets resulting fromoperations 97,840,869 (332,098,841) 40,425,850 (141,808,717)
DISTRIBUTIONS TO SHAREHOLDERS:From net investment income (25,636,999) (27,879,748) (41,355,793) (33,575,451)
Total distributions to shareholders (25,636,999) (27,879,748) (41,355,793) (33,575,451)
CAPITAL SHARE TRANSACTIONS:Proceeds from shares sold 82,716,107 259,018,581 176,600,569 524,040,578Cost of shares redeemed (62,975,907) (41,339,520) (93,343,805) (130,702,410)
Net increase in net assets from capital sharetransactions 19,740,200 217,679,061 83,256,764 393,338,168
INCREASE (DECREASE) IN NET ASSETS 91,944,070 (142,299,528) 82,326,821 217,954,000
NET ASSETSBeginning of year 1,198,695,908 1,340,995,436 1,142,400,864 924,446,864
End of year $1,290,639,978 $1,198,695,908 $1,224,727,685 $1,142,400,864
Undistributed (distributions in excess of) netinvestment income included in net assetsat end of year $ (87,090) $ 645,583 $ 121,201 $ 1,286,053
SHARES ISSUED AND REDEEMEDShares sold 1,600,000 5,600,000 3,600,000 13,200,000Shares redeemed (1,200,000) (1,200,000) (2,000,000) (4,000,000)
Net increase in shares outstanding 400,000 4,400,000 1,600,000 9,200,000
See notes to financial statements.
140 2 0 1 0 i S h a r e s A n n u a l R e p o r t to S h a r e h o l d e r s
Statements of Changes in Net Assets (Continued)
iSHARES» TRUST
For
per
sona
l use
onl
y
%%TRANSMSG*** Transmitting Job: B82515 PCN: 142000000 ***%%PCMSG|140 |00016|Yes|No|09/16/2010 20:08|0|0|Page is valid, no graphics -- Color: N|
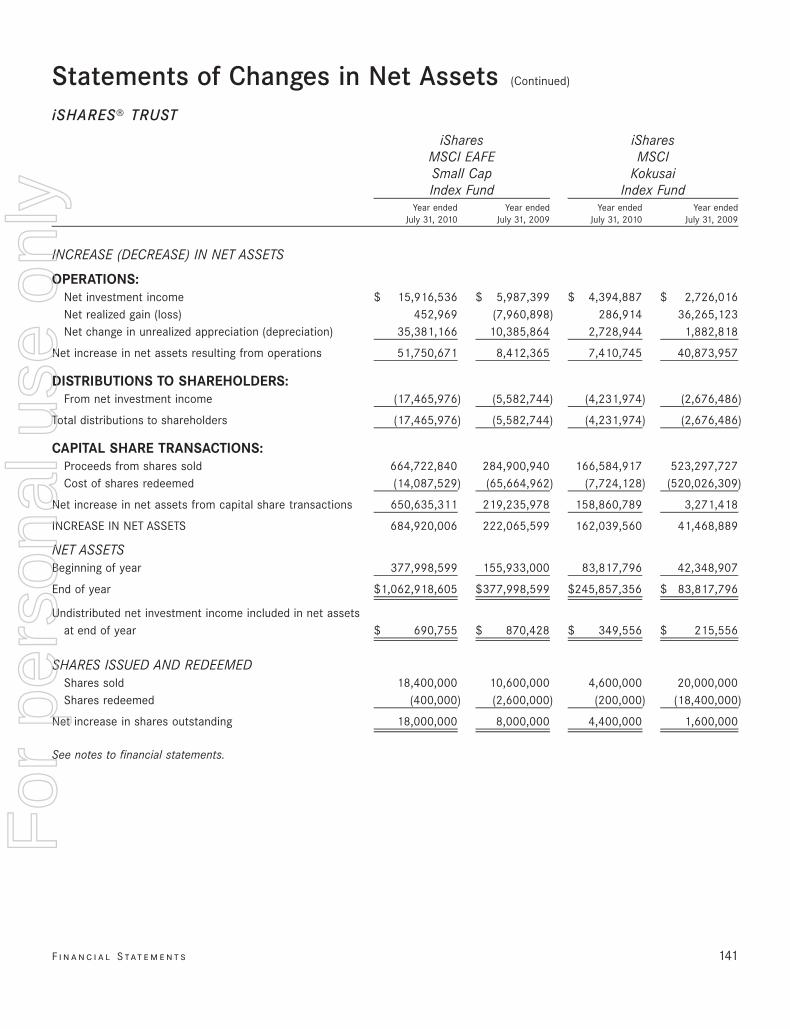
Year endedJuly 31, 2010
Year endedJuly 31, 2009
Year endedJuly 31, 2010
Year endedJuly 31, 2009
iSharesMSCI EAFESmall CapIndex Fund
iSharesMSCI
KokusaiIndex Fund
INCREASE (DECREASE) IN NET ASSETS
OPERATIONS:Net investment income $ 15,916,536 $ 5,987,399 $ 4,394,887 $ 2,726,016Net realized gain (loss) 452,969 (7,960,898) 286,914 36,265,123Net change in unrealized appreciation (depreciation) 35,381,166 10,385,864 2,728,944 1,882,818
Net increase in net assets resulting from operations 51,750,671 8,412,365 7,410,745 40,873,957
DISTRIBUTIONS TO SHAREHOLDERS:From net investment income (17,465,976) (5,582,744) (4,231,974) (2,676,486)
Total distributions to shareholders (17,465,976) (5,582,744) (4,231,974) (2,676,486)
CAPITAL SHARE TRANSACTIONS:Proceeds from shares sold 664,722,840 284,900,940 166,584,917 523,297,727Cost of shares redeemed (14,087,529) (65,664,962) (7,724,128) (520,026,309)
Net increase in net assets from capital share transactions 650,635,311 219,235,978 158,860,789 3,271,418
INCREASE IN NET ASSETS 684,920,006 222,065,599 162,039,560 41,468,889
NET ASSETSBeginning of year 377,998,599 155,933,000 83,817,796 42,348,907
End of year $1,062,918,605 $377,998,599 $245,857,356 $ 83,817,796
Undistributed net investment income included in net assetsat end of year $ 690,755 $ 870,428 $ 349,556 $ 215,556
SHARES ISSUED AND REDEEMEDShares sold 18,400,000 10,600,000 4,600,000 20,000,000Shares redeemed (400,000) (2,600,000) (200,000) (18,400,000)
Net increase in shares outstanding 18,000,000 8,000,000 4,400,000 1,600,000
See notes to financial statements.
F i n a n c i a l S tat e m e n t s 141
Statements of Changes in Net Assets (Continued)
iSHARES» TRUST
For
per
sona
l use
onl
y
%%TRANSMSG*** Transmitting Job: B82515 PCN: 143000000 ***%%PCMSG|141 |00016|Yes|No|09/16/2010 20:08|0|0|Page is valid, no graphics -- Color: N|
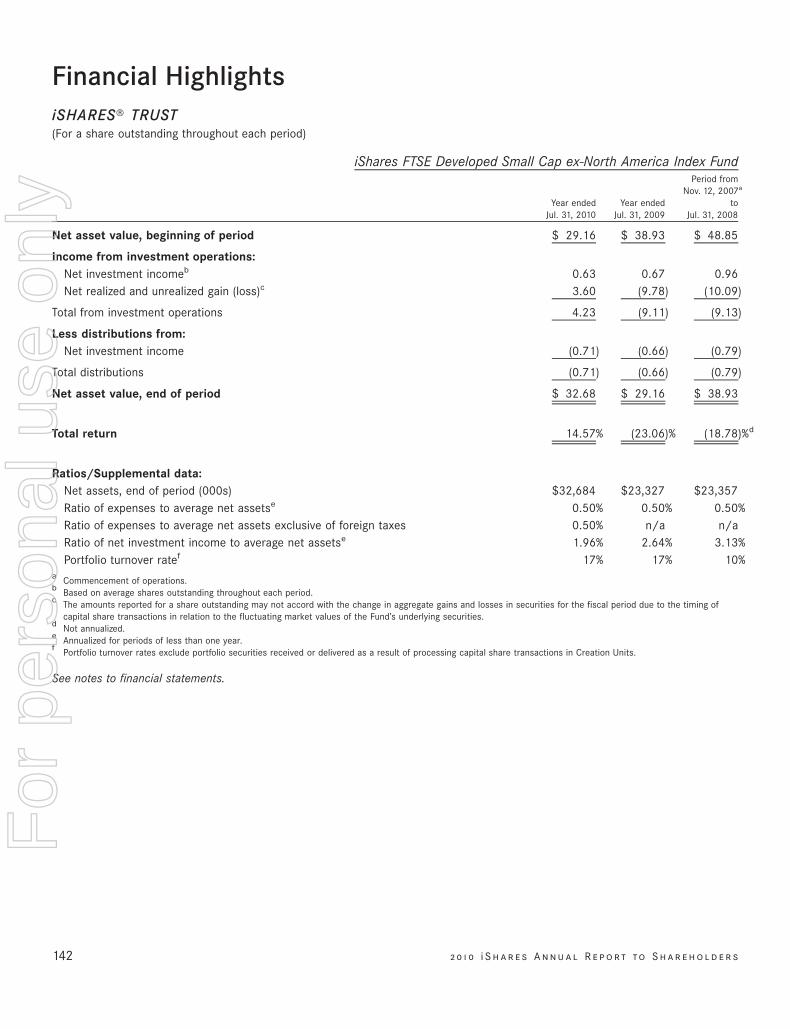
Financial HighlightsiSHARES» TRUST(For a share outstanding throughout each period)
Year endedJul. 31, 2010
Year endedJul. 31, 2009
Period fromNov. 12, 2007a
toJul. 31, 2008
iShares FTSE Developed Small Cap ex-North America Index Fund
Net asset value, beginning of period $ 29.16 $ 38.93 $ 48.85
Income from investment operations:Net investment incomeb 0.63 0.67 0.96Net realized and unrealized gain (loss)c 3.60 (9.78) (10.09)
Total from investment operations 4.23 (9.11) (9.13)
Less distributions from:Net investment income (0.71) (0.66) (0.79)
Total distributions (0.71) (0.66) (0.79)
Net asset value, end of period $ 32.68 $ 29.16 $ 38.93
Total return 14.57% (23.06)% (18.78)%d
Ratios/Supplemental data:Net assets, end of period (000s) $32,684 $23,327 $23,357Ratio of expenses to average net assetse 0.50% 0.50% 0.50%Ratio of expenses to average net assets exclusive of foreign taxes 0.50% n/a n/aRatio of net investment income to average net assetse 1.96% 2.64% 3.13%Portfolio turnover ratef 17% 17% 10%
a Commencement of operations.b Based on average shares outstanding throughout each period.c The amounts reported for a share outstanding may not accord with the change in aggregate gains and losses in securities for the fiscal period due to the timing of
capital share transactions in relation to the fluctuating market values of the Fund’s underlying securities.d Not annualized.e Annualized for periods of less than one year.f Portfolio turnover rates exclude portfolio securities received or delivered as a result of processing capital share transactions in Creation Units.
See notes to financial statements.
142 2 0 1 0 i S h a r e s A n n u a l R e p o r t to S h a r e h o l d e r s
For
per
sona
l use
onl
y
%%TRANSMSG*** Transmitting Job: B82515 PCN: 144000000 ***%%PCMSG|142 |00009|Yes|No|09/16/2010 20:08|0|0|Page is valid, no graphics -- Color: N|
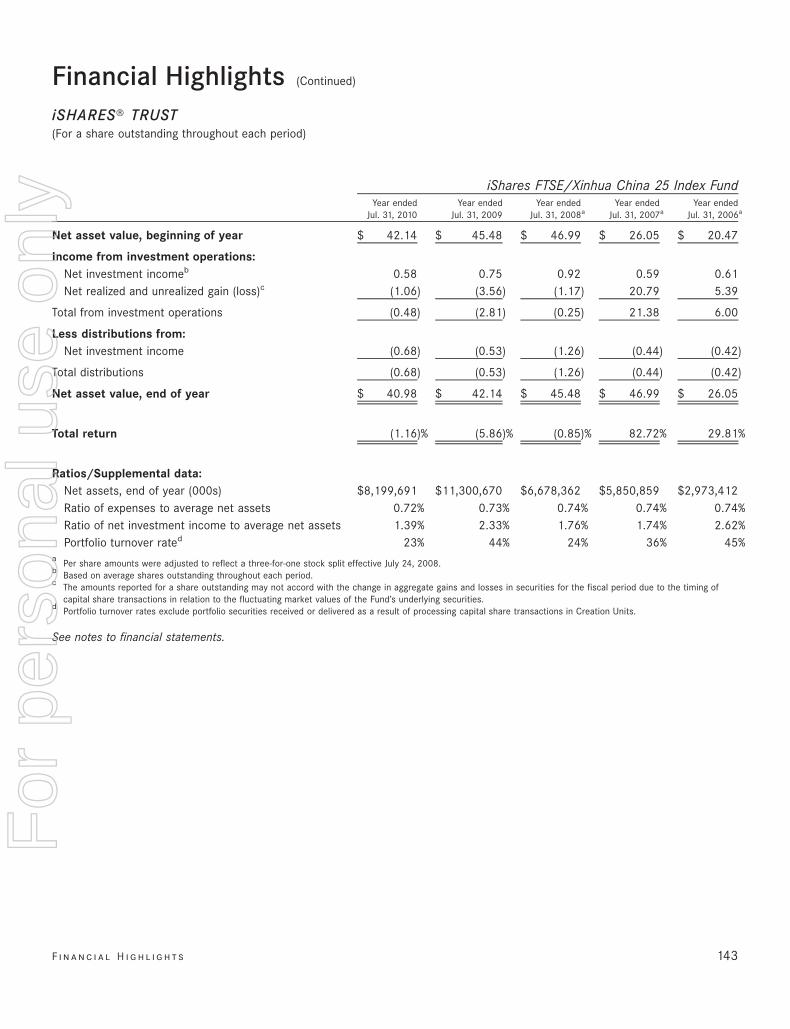
Year endedJul. 31, 2010
Year endedJul. 31, 2009
Year endedJul. 31, 2008a
Year endedJul. 31, 2007a
Year endedJul. 31, 2006a
iShares FTSE/Xinhua China 25 Index Fund
Net asset value, beginning of year $ 42.14 $ 45.48 $ 46.99 $ 26.05 $ 20.47
Income from investment operations:Net investment incomeb 0.58 0.75 0.92 0.59 0.61Net realized and unrealized gain (loss)c (1.06) (3.56) (1.17) 20.79 5.39
Total from investment operations (0.48) (2.81) (0.25) 21.38 6.00
Less distributions from:Net investment income (0.68) (0.53) (1.26) (0.44) (0.42)
Total distributions (0.68) (0.53) (1.26) (0.44) (0.42)
Net asset value, end of year $ 40.98 $ 42.14 $ 45.48 $ 46.99 $ 26.05
Total return (1.16)% (5.86)% (0.85)% 82.72% 29.81%
Ratios/Supplemental data:Net assets, end of year (000s) $8,199,691 $11,300,670 $6,678,362 $5,850,859 $2,973,412Ratio of expenses to average net assets 0.72% 0.73% 0.74% 0.74% 0.74%Ratio of net investment income to average net assets 1.39% 2.33% 1.76% 1.74% 2.62%Portfolio turnover rated 23% 44% 24% 36% 45%
a Per share amounts were adjusted to reflect a three-for-one stock split effective July 24, 2008.b Based on average shares outstanding throughout each period.c The amounts reported for a share outstanding may not accord with the change in aggregate gains and losses in securities for the fiscal period due to the timing of
capital share transactions in relation to the fluctuating market values of the Fund’s underlying securities.d Portfolio turnover rates exclude portfolio securities received or delivered as a result of processing capital share transactions in Creation Units.
See notes to financial statements.
F i n a n c i a l H i g h l i g h t s 143
Financial Highlights (Continued)
iSHARES» TRUST(For a share outstanding throughout each period)
For
per
sona
l use
onl
y
%%TRANSMSG*** Transmitting Job: B82515 PCN: 145000000 ***%%PCMSG|143 |00009|Yes|No|09/16/2010 20:08|0|0|Page is valid, no graphics -- Color: N|
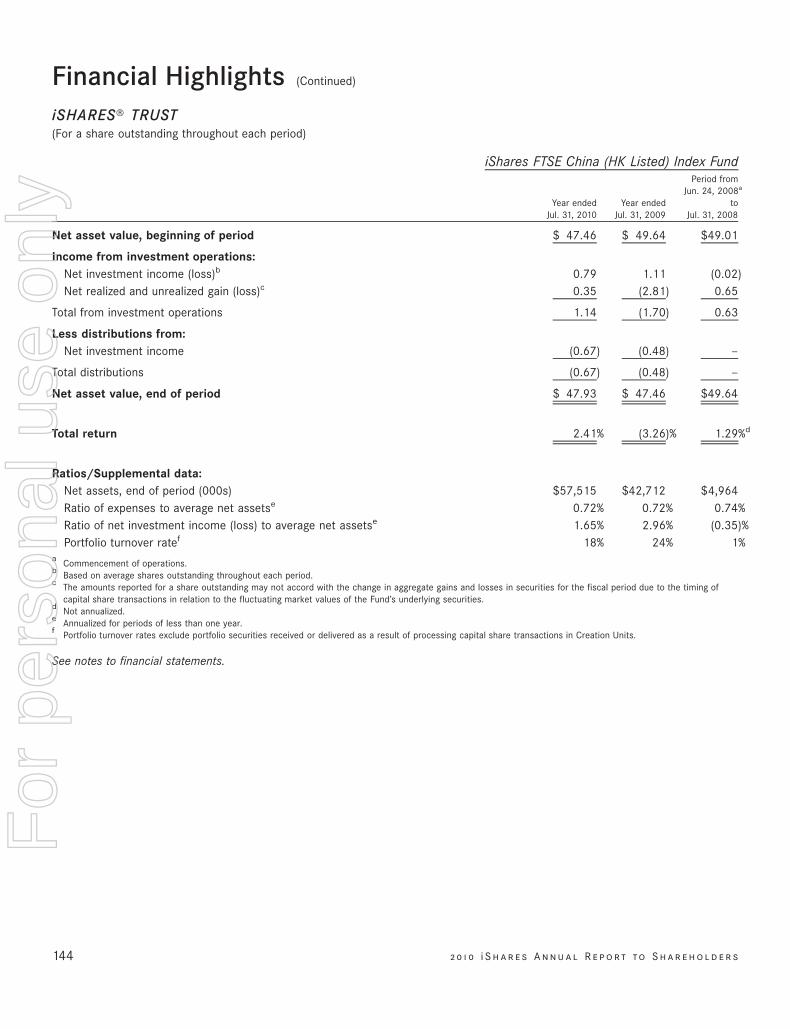
Year endedJul. 31, 2010
Year endedJul. 31, 2009
Period fromJun. 24, 2008a
toJul. 31, 2008
iShares FTSE China (HK Listed) Index Fund
Net asset value, beginning of period $ 47.46 $ 49.64 $49.01
Income from investment operations:Net investment income (loss)b 0.79 1.11 (0.02)Net realized and unrealized gain (loss)c 0.35 (2.81) 0.65
Total from investment operations 1.14 (1.70) 0.63
Less distributions from:Net investment income (0.67) (0.48) —
Total distributions (0.67) (0.48) —
Net asset value, end of period $ 47.93 $ 47.46 $49.64
Total return 2.41% (3.26)% 1.29%d
Ratios/Supplemental data:Net assets, end of period (000s) $57,515 $42,712 $4,964Ratio of expenses to average net assetse 0.72% 0.72% 0.74%Ratio of net investment income (loss) to average net assetse 1.65% 2.96% (0.35)%Portfolio turnover ratef 18% 24% 1%
a Commencement of operations.b Based on average shares outstanding throughout each period.c The amounts reported for a share outstanding may not accord with the change in aggregate gains and losses in securities for the fiscal period due to the timing of
capital share transactions in relation to the fluctuating market values of the Fund’s underlying securities.d Not annualized.e Annualized for periods of less than one year.f Portfolio turnover rates exclude portfolio securities received or delivered as a result of processing capital share transactions in Creation Units.
See notes to financial statements.
144 2 0 1 0 i S h a r e s A n n u a l R e p o r t to S h a r e h o l d e r s
Financial Highlights (Continued)
iSHARES» TRUST(For a share outstanding throughout each period)
For
per
sona
l use
onl
y
%%TRANSMSG*** Transmitting Job: B82515 PCN: 146000000 ***%%PCMSG|144 |00010|Yes|No|09/16/2010 20:08|0|0|Page is valid, no graphics -- Color: N|
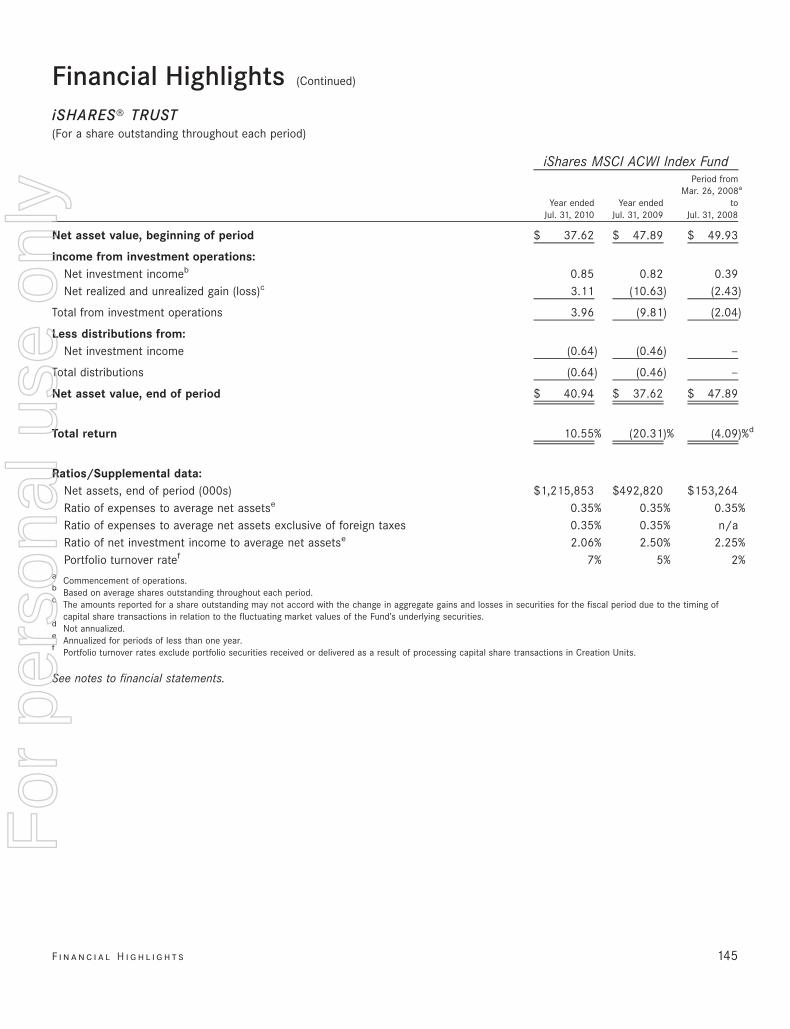
Year endedJul. 31, 2010
Year endedJul. 31, 2009
Period fromMar. 26, 2008a
toJul. 31, 2008
iShares MSCI ACWI Index Fund
Net asset value, beginning of period $ 37.62 $ 47.89 $ 49.93
Income from investment operations:Net investment incomeb 0.85 0.82 0.39Net realized and unrealized gain (loss)c 3.11 (10.63) (2.43)
Total from investment operations 3.96 (9.81) (2.04)
Less distributions from:Net investment income (0.64) (0.46) —
Total distributions (0.64) (0.46) —
Net asset value, end of period $ 40.94 $ 37.62 $ 47.89
Total return 10.55% (20.31)% (4.09)%d
Ratios/Supplemental data:Net assets, end of period (000s) $1,215,853 $492,820 $153,264Ratio of expenses to average net assetse 0.35% 0.35% 0.35%Ratio of expenses to average net assets exclusive of foreign taxes 0.35% 0.35% n/aRatio of net investment income to average net assetse 2.06% 2.50% 2.25%Portfolio turnover ratef 7% 5% 2%
a Commencement of operations.b Based on average shares outstanding throughout each period.c The amounts reported for a share outstanding may not accord with the change in aggregate gains and losses in securities for the fiscal period due to the timing of
capital share transactions in relation to the fluctuating market values of the Fund’s underlying securities.d Not annualized.e Annualized for periods of less than one year.f Portfolio turnover rates exclude portfolio securities received or delivered as a result of processing capital share transactions in Creation Units.
See notes to financial statements.
F i n a n c i a l H i g h l i g h t s 145
Financial Highlights (Continued)
iSHARES» TRUST(For a share outstanding throughout each period)
For
per
sona
l use
onl
y
%%TRANSMSG*** Transmitting Job: B82515 PCN: 147000000 ***%%PCMSG|145 |00007|Yes|No|09/16/2010 20:08|0|0|Page is valid, no graphics -- Color: N|
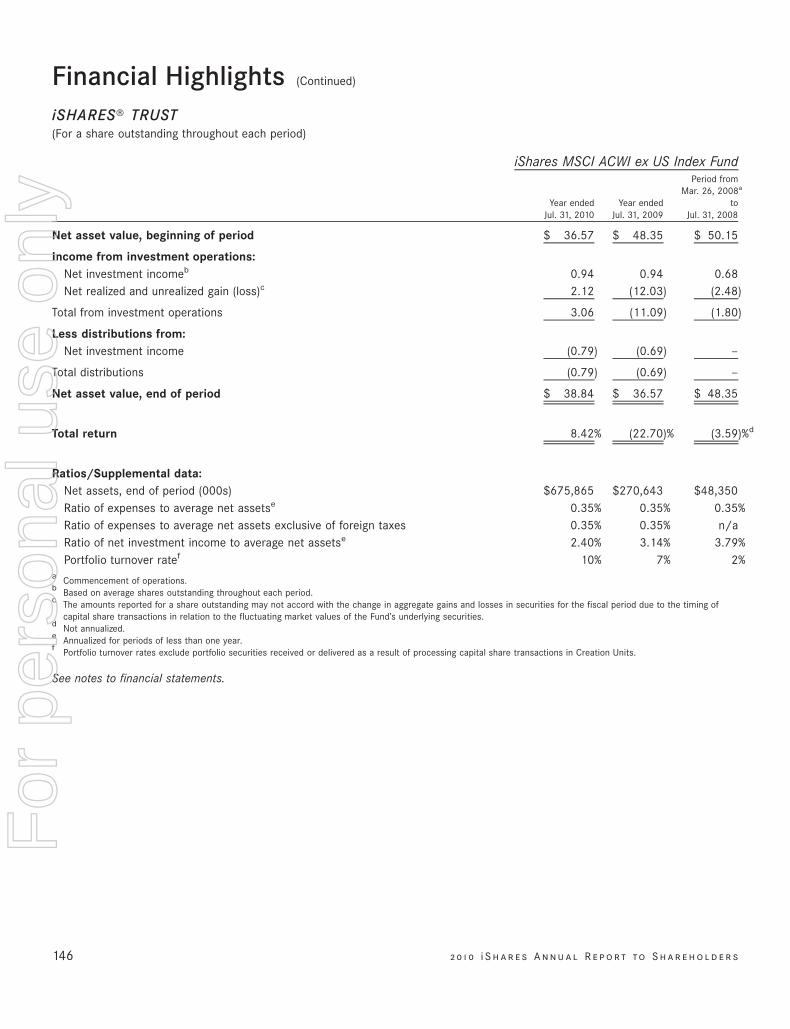
Year endedJul. 31, 2010
Year endedJul. 31, 2009
Period fromMar. 26, 2008a
toJul. 31, 2008
iShares MSCI ACWI ex US Index Fund
Net asset value, beginning of period $ 36.57 $ 48.35 $ 50.15
Income from investment operations:Net investment incomeb 0.94 0.94 0.68Net realized and unrealized gain (loss)c 2.12 (12.03) (2.48)
Total from investment operations 3.06 (11.09) (1.80)
Less distributions from:Net investment income (0.79) (0.69) —
Total distributions (0.79) (0.69) —
Net asset value, end of period $ 38.84 $ 36.57 $ 48.35
Total return 8.42% (22.70)% (3.59)%d
Ratios/Supplemental data:Net assets, end of period (000s) $675,865 $270,643 $48,350Ratio of expenses to average net assetse 0.35% 0.35% 0.35%Ratio of expenses to average net assets exclusive of foreign taxes 0.35% 0.35% n/aRatio of net investment income to average net assetse 2.40% 3.14% 3.79%Portfolio turnover ratef 10% 7% 2%
a Commencement of operations.b Based on average shares outstanding throughout each period.c The amounts reported for a share outstanding may not accord with the change in aggregate gains and losses in securities for the fiscal period due to the timing of
capital share transactions in relation to the fluctuating market values of the Fund’s underlying securities.d Not annualized.e Annualized for periods of less than one year.f Portfolio turnover rates exclude portfolio securities received or delivered as a result of processing capital share transactions in Creation Units.
See notes to financial statements.
146 2 0 1 0 i S h a r e s A n n u a l R e p o r t to S h a r e h o l d e r s
Financial Highlights (Continued)
iSHARES» TRUST(For a share outstanding throughout each period)
For
per
sona
l use
onl
y
%%TRANSMSG*** Transmitting Job: B82515 PCN: 148000000 ***%%PCMSG|146 |00010|Yes|No|09/16/2010 20:08|0|0|Page is valid, no graphics -- Color: N|
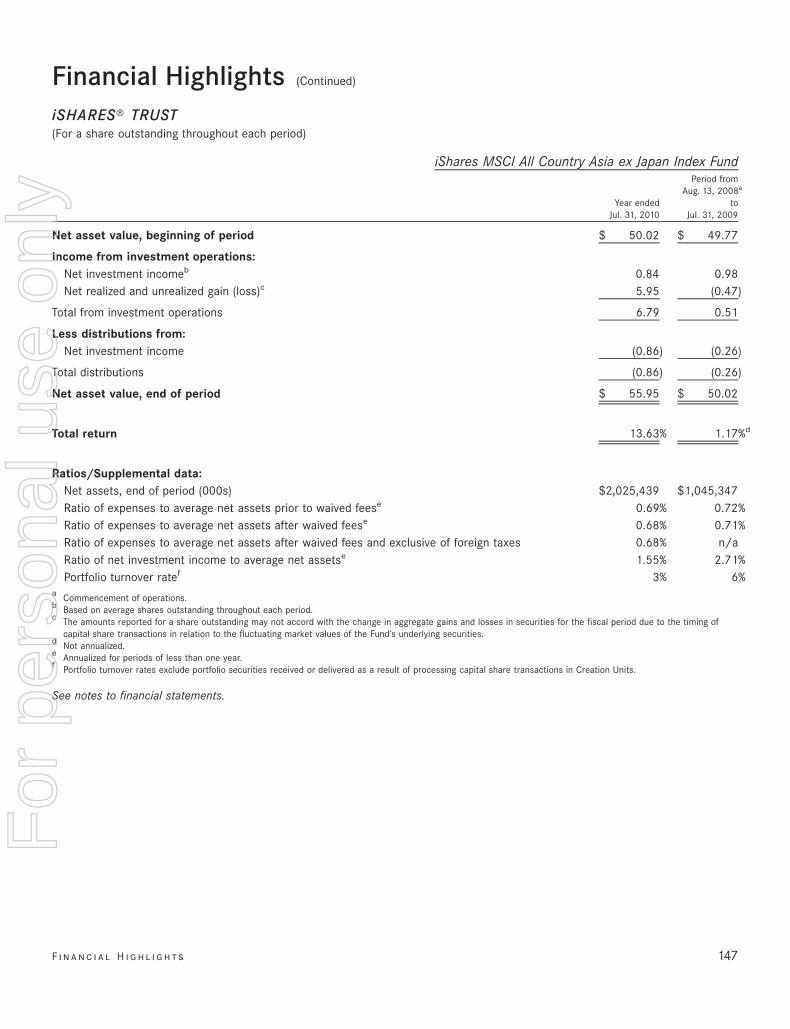
Year endedJul. 31, 2010
Period fromAug. 13, 2008a
toJul. 31, 2009
iShares MSCI All Country Asia ex Japan Index Fund
Net asset value, beginning of period $ 50.02 $ 49.77
Income from investment operations:Net investment incomeb 0.84 0.98Net realized and unrealized gain (loss)c 5.95 (0.47)
Total from investment operations 6.79 0.51
Less distributions from:Net investment income (0.86) (0.26)
Total distributions (0.86) (0.26)
Net asset value, end of period $ 55.95 $ 50.02
Total return 13.63% 1.17%d
Ratios/Supplemental data:Net assets, end of period (000s) $2,025,439 $1,045,347Ratio of expenses to average net assets prior to waived feese 0.69% 0.72%Ratio of expenses to average net assets after waived feese 0.68% 0.71%Ratio of expenses to average net assets after waived fees and exclusive of foreign taxes 0.68% n/aRatio of net investment income to average net assetse 1.55% 2.71%Portfolio turnover ratef 3% 6%
a Commencement of operations.b Based on average shares outstanding throughout each period.c The amounts reported for a share outstanding may not accord with the change in aggregate gains and losses in securities for the fiscal period due to the timing of
capital share transactions in relation to the fluctuating market values of the Fund’s underlying securities.d Not annualized.e Annualized for periods of less than one year.f Portfolio turnover rates exclude portfolio securities received or delivered as a result of processing capital share transactions in Creation Units.
See notes to financial statements.
F i n a n c i a l H i g h l i g h t s 147
Financial Highlights (Continued)
iSHARES» TRUST(For a share outstanding throughout each period)
For
per
sona
l use
onl
y
%%TRANSMSG*** Transmitting Job: B82515 PCN: 149000000 ***%%PCMSG|147 |00007|Yes|No|09/16/2010 20:08|0|0|Page is valid, no graphics -- Color: N|
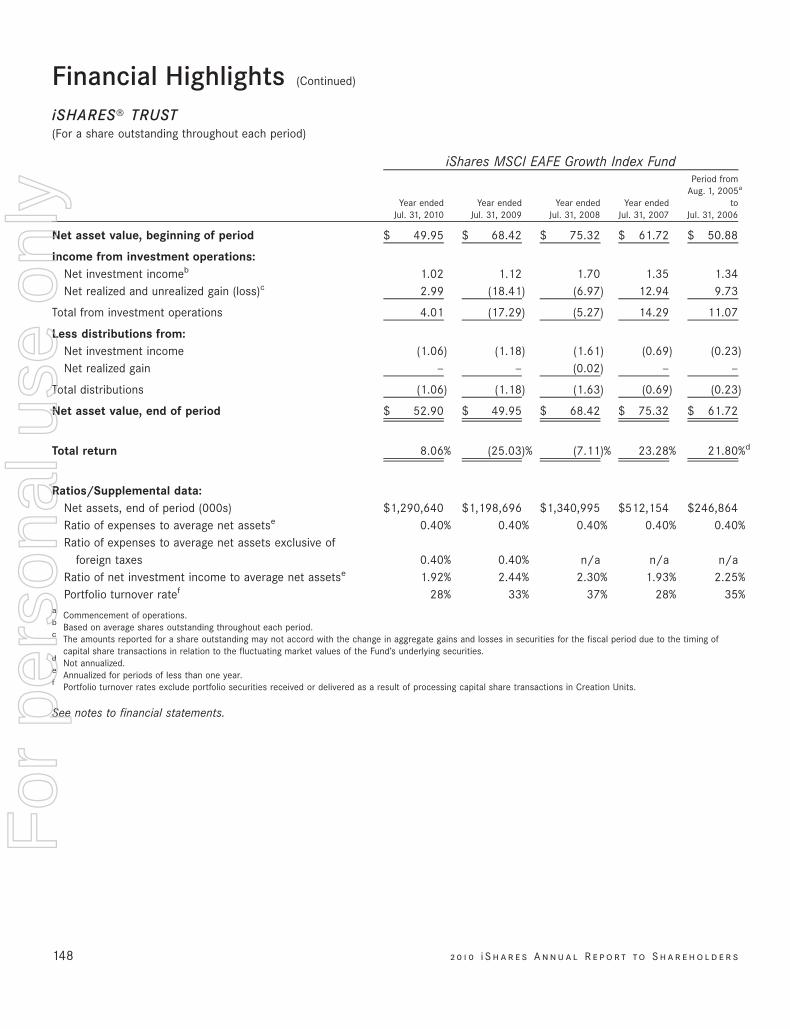
Year endedJul. 31, 2010
Year endedJul. 31, 2009
Year endedJul. 31, 2008
Year endedJul. 31, 2007
Period fromAug. 1, 2005a
toJul. 31, 2006
iShares MSCI EAFE Growth Index Fund
Net asset value, beginning of period $ 49.95 $ 68.42 $ 75.32 $ 61.72 $ 50.88
Income from investment operations:Net investment incomeb 1.02 1.12 1.70 1.35 1.34Net realized and unrealized gain (loss)c 2.99 (18.41) (6.97) 12.94 9.73
Total from investment operations 4.01 (17.29) (5.27) 14.29 11.07
Less distributions from:Net investment income (1.06) (1.18) (1.61) (0.69) (0.23)Net realized gain — — (0.02) — —
Total distributions (1.06) (1.18) (1.63) (0.69) (0.23)
Net asset value, end of period $ 52.90 $ 49.95 $ 68.42 $ 75.32 $ 61.72
Total return 8.06% (25.03)% (7.11)% 23.28% 21.80%d
Ratios/Supplemental data:Net assets, end of period (000s) $1,290,640 $1,198,696 $1,340,995 $512,154 $246,864Ratio of expenses to average net assetse 0.40% 0.40% 0.40% 0.40% 0.40%Ratio of expenses to average net assets exclusive of
foreign taxes 0.40% 0.40% n/a n/a n/aRatio of net investment income to average net assetse 1.92% 2.44% 2.30% 1.93% 2.25%Portfolio turnover ratef 28% 33% 37% 28% 35%
a Commencement of operations.b Based on average shares outstanding throughout each period.c The amounts reported for a share outstanding may not accord with the change in aggregate gains and losses in securities for the fiscal period due to the timing of
capital share transactions in relation to the fluctuating market values of the Fund’s underlying securities.d Not annualized.e Annualized for periods of less than one year.f Portfolio turnover rates exclude portfolio securities received or delivered as a result of processing capital share transactions in Creation Units.
See notes to financial statements.
148 2 0 1 0 i S h a r e s A n n u a l R e p o r t to S h a r e h o l d e r s
Financial Highlights (Continued)
iSHARES» TRUST(For a share outstanding throughout each period)
For
per
sona
l use
onl
y
%%TRANSMSG*** Transmitting Job: B82515 PCN: 150000000 ***%%PCMSG|148 |00009|Yes|No|09/16/2010 20:08|0|0|Page is valid, no graphics -- Color: N|
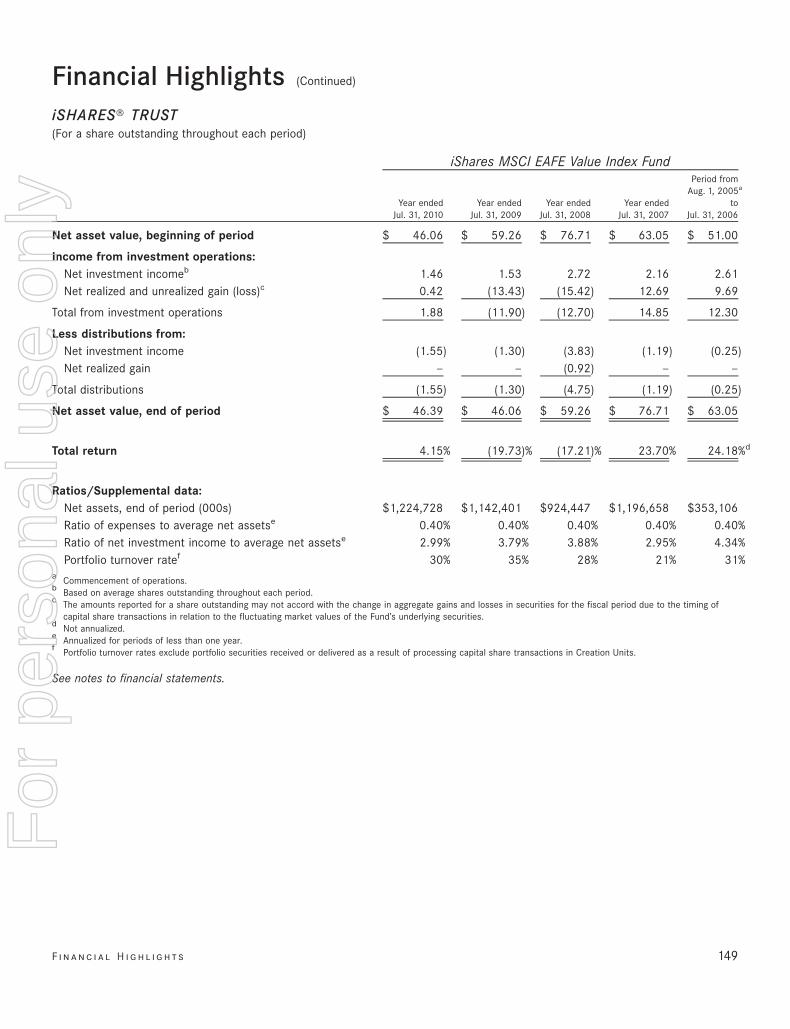
Year endedJul. 31, 2010
Year endedJul. 31, 2009
Year endedJul. 31, 2008
Year endedJul. 31, 2007
Period fromAug. 1, 2005a
toJul. 31, 2006
iShares MSCI EAFE Value Index Fund
Net asset value, beginning of period $ 46.06 $ 59.26 $ 76.71 $ 63.05 $ 51.00
Income from investment operations:Net investment incomeb 1.46 1.53 2.72 2.16 2.61Net realized and unrealized gain (loss)c 0.42 (13.43) (15.42) 12.69 9.69
Total from investment operations 1.88 (11.90) (12.70) 14.85 12.30
Less distributions from:Net investment income (1.55) (1.30) (3.83) (1.19) (0.25)Net realized gain — — (0.92) — —
Total distributions (1.55) (1.30) (4.75) (1.19) (0.25)
Net asset value, end of period $ 46.39 $ 46.06 $ 59.26 $ 76.71 $ 63.05
Total return 4.15% (19.73)% (17.21)% 23.70% 24.18%d
Ratios/Supplemental data:Net assets, end of period (000s) $1,224,728 $1,142,401 $924,447 $1,196,658 $353,106Ratio of expenses to average net assetse 0.40% 0.40% 0.40% 0.40% 0.40%Ratio of net investment income to average net assetse 2.99% 3.79% 3.88% 2.95% 4.34%Portfolio turnover ratef 30% 35% 28% 21% 31%
a Commencement of operations.b Based on average shares outstanding throughout each period.c The amounts reported for a share outstanding may not accord with the change in aggregate gains and losses in securities for the fiscal period due to the timing of
capital share transactions in relation to the fluctuating market values of the Fund’s underlying securities.d Not annualized.e Annualized for periods of less than one year.f Portfolio turnover rates exclude portfolio securities received or delivered as a result of processing capital share transactions in Creation Units.
See notes to financial statements.
F i n a n c i a l H i g h l i g h t s 149
Financial Highlights (Continued)
iSHARES» TRUST(For a share outstanding throughout each period)
For
per
sona
l use
onl
y
%%TRANSMSG*** Transmitting Job: B82515 PCN: 151000000 ***%%PCMSG|149 |00013|Yes|No|09/16/2010 20:08|0|0|Page is valid, no graphics -- Color: N|
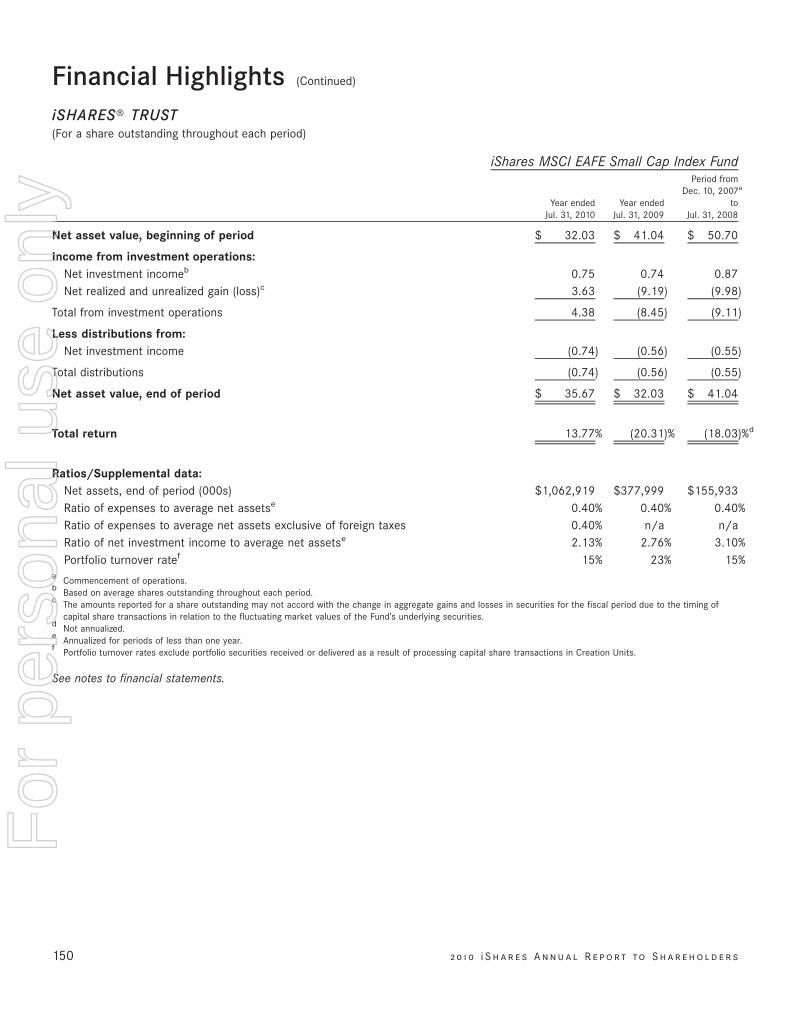
Year endedJul. 31, 2010
Year endedJul. 31, 2009
Period fromDec. 10, 2007a
toJul. 31, 2008
iShares MSCI EAFE Small Cap Index Fund
Net asset value, beginning of period $ 32.03 $ 41.04 $ 50.70
Income from investment operations:Net investment incomeb 0.75 0.74 0.87Net realized and unrealized gain (loss)c 3.63 (9.19) (9.98)
Total from investment operations 4.38 (8.45) (9.11)
Less distributions from:Net investment income (0.74) (0.56) (0.55)
Total distributions (0.74) (0.56) (0.55)
Net asset value, end of period $ 35.67 $ 32.03 $ 41.04
Total return 13.77% (20.31)% (18.03)%d
Ratios/Supplemental data:Net assets, end of period (000s) $1,062,919 $377,999 $155,933Ratio of expenses to average net assetse 0.40% 0.40% 0.40%Ratio of expenses to average net assets exclusive of foreign taxes 0.40% n/a n/aRatio of net investment income to average net assetse 2.13% 2.76% 3.10%Portfolio turnover ratef 15% 23% 15%
a Commencement of operations.b Based on average shares outstanding throughout each period.c The amounts reported for a share outstanding may not accord with the change in aggregate gains and losses in securities for the fiscal period due to the timing of
capital share transactions in relation to the fluctuating market values of the Fund’s underlying securities.d Not annualized.e Annualized for periods of less than one year.f Portfolio turnover rates exclude portfolio securities received or delivered as a result of processing capital share transactions in Creation Units.
See notes to financial statements.
150 2 0 1 0 i S h a r e s A n n u a l R e p o r t to S h a r e h o l d e r s
Financial Highlights (Continued)
iSHARES» TRUST(For a share outstanding throughout each period)
For
per
sona
l use
onl
y
%%TRANSMSG*** Transmitting Job: B82515 PCN: 152000000 ***%%PCMSG|150 |00012|Yes|No|09/16/2010 20:08|0|0|Page is valid, no graphics -- Color: N|
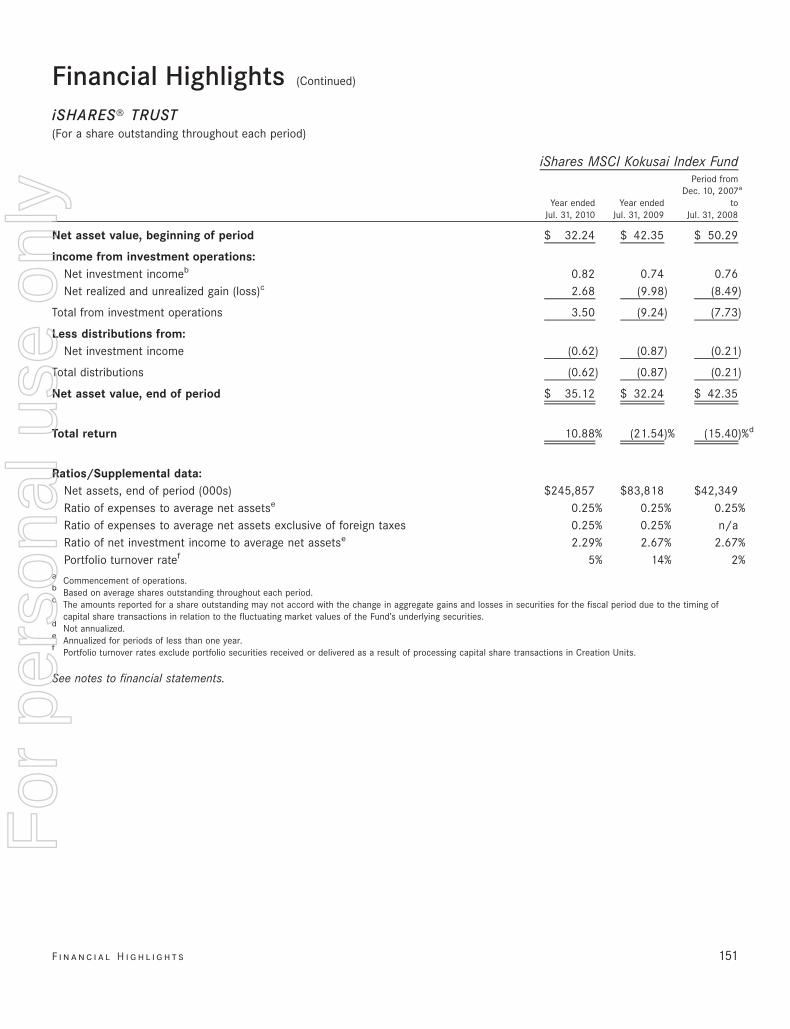
Year endedJul. 31, 2010
Year endedJul. 31, 2009
Period fromDec. 10, 2007a
toJul. 31, 2008
iShares MSCI Kokusai Index Fund
Net asset value, beginning of period $ 32.24 $ 42.35 $ 50.29
Income from investment operations:Net investment incomeb 0.82 0.74 0.76Net realized and unrealized gain (loss)c 2.68 (9.98) (8.49)
Total from investment operations 3.50 (9.24) (7.73)
Less distributions from:Net investment income (0.62) (0.87) (0.21)
Total distributions (0.62) (0.87) (0.21)
Net asset value, end of period $ 35.12 $ 32.24 $ 42.35
Total return 10.88% (21.54)% (15.40)%d
Ratios/Supplemental data:Net assets, end of period (000s) $245,857 $83,818 $42,349Ratio of expenses to average net assetse 0.25% 0.25% 0.25%Ratio of expenses to average net assets exclusive of foreign taxes 0.25% 0.25% n/aRatio of net investment income to average net assetse 2.29% 2.67% 2.67%Portfolio turnover ratef 5% 14% 2%
a Commencement of operations.b Based on average shares outstanding throughout each period.c The amounts reported for a share outstanding may not accord with the change in aggregate gains and losses in securities for the fiscal period due to the timing of
capital share transactions in relation to the fluctuating market values of the Fund’s underlying securities.d Not annualized.e Annualized for periods of less than one year.f Portfolio turnover rates exclude portfolio securities received or delivered as a result of processing capital share transactions in Creation Units.
See notes to financial statements.
F i n a n c i a l H i g h l i g h t s 151
Financial Highlights (Continued)
iSHARES» TRUST(For a share outstanding throughout each period)
For
per
sona
l use
onl
y
%%TRANSMSG*** Transmitting Job: B82515 PCN: 153000000 ***%%PCMSG|151 |00009|Yes|No|09/16/2010 20:08|0|0|Page is valid, no graphics -- Color: N|
Notes to Financial StatementsiSHARES» TRUST
iShares Trust (the “Trust”) is registered under the Investment Company Act of 1940, as amended (the “1940 Act”), as an open-endmanagement investment company. The Trust was established as a Delaware statutory trust pursuant to an Agreement and Declaration ofTrust dated December 16, 1999.
These financial statements relate only to the iShares FTSE Developed Small Cap ex-North America, iShares FTSE/Xinhua China 25,iShares FTSE China (HK Listed), iShares MSCI ACWI, iShares MSCI ACWI ex US, iShares MSCI All Country Asia ex Japan, iShares MSCIEAFE Growth, iShares MSCI EAFE Value, iShares MSCI EAFE Small Cap and iShares MSCI Kokusai Index Funds (each, a “Fund,”collectively, the “Funds”).
The investment objective of each Fund is to seek investment results that correspond generally to the price and yield performance, beforefees and expenses, of its underlying index. The investment adviser uses a “passive” or index approach to achieve each Fund’s investmentobjective. Each of the Funds is classified as a non-diversified fund under the 1940 Act. Non-diversified funds generally hold securities offewer issuers than diversified funds and may be more susceptible to the risks associated with these particular issuers, or to a singleeconomic, political or regulatory occurrence affecting these issuers.
Each Fund invests in the securities of non-U.S. issuers that may trade in non-U.S. markets. This may involve certain considerations andrisks not typically associated with securities of U.S. issuers. Such risks include, but are not limited to: generally less liquid and lessefficient securities markets; generally greater price volatility; exchange rate fluctuations and exchange controls; imposition of restrictionson the expatriation of funds or other assets of the Fund; less publicly available information about issuers; the imposition of withholding orother taxes; higher transaction and custody costs; settlement delays and risk of loss attendant in settlement procedures; difficulties inenforcing contractual obligations; less regulation of securities markets; different accounting, disclosure and reporting requirements;more substantial governmental involvement in the economy; higher inflation rates; greater social, economic and political uncertainties;the risk of nationalization or expropriation of assets and the risk of war.
Pursuant to the Trust’s organizational documents, the Funds’ officers and trustees are indemnified against certain liabilities that may ariseout of the performance of their duties to the Funds. Additionally, in the normal course of business, the Funds enter into contracts withservice providers that contain general indemnification clauses. The Funds’ maximum exposure under these arrangements is unknown asthis would involve future claims that may be made against the Funds that have not yet occurred.
1. SIGNIFICANT ACCOUNTING POLICIES
The following significant accounting policies are consistently followed by the Trust in the preparation of its financial statements inconformity with accounting principles generally accepted in the United States of America (“U.S. GAAP”). The preparation of financialstatements in conformity with U.S. GAAP requires management to make certain estimates and assumptions that affect the reportedamounts of assets and liabilities and disclosures of contingent assets and liabilities at the date of the financial statements and thereported amounts of revenue and expenses during the reporting period. Actual results could differ from those estimates.
SECURITY VALUATION
The securities and other assets of each Fund are valued pursuant to the pricing policy and procedures approved by the Board of Trusteesof the Trust (the “Board”) using a fair value hierarchy that prioritizes the inputs to valuation techniques used to measure fair value intothree broad levels. Inputs may be based on independent market data (“observable inputs”) or they may be internally developed(“unobservable inputs”). The hierarchy gives the highest priority to unadjusted quoted prices in active markets for identical assets or
152 2 0 1 0 i S h a r e s A n n u a l R e p o r t to S h a r e h o l d e r s
For
per
sona
l use
onl
y
%%TRANSMSG*** Transmitting Job: B82515 PCN: 154000000 ***%%PCMSG|152 |00008|Yes|No|09/16/2010 20:08|0|0|Page is valid, no graphics -- Color: N|
liabilities (Level 1 measurements) and the lowest priority to unobservable inputs (Level 3 measurements). The three levels of the fair valuehierarchy are as follows:
• Level 1 — Inputs that reflect unadjusted quoted prices in active markets for identical assets or liabilities that the Fund has the abilityto access at the measurement date (a “Level 1 Price”);
• Level 2 — Inputs other than quoted prices included within Level 1 that are observable for the asset or liability either directly orindirectly, including quoted prices for similar assets or liabilities in active markets, quoted prices for identical or similar assets orliabilities in markets that are not considered to be active, inputs other than quoted prices that are observable for the asset orliability, and inputs that are derived principally from or corroborated by observable market data by correlation or other means (a“Level 2 Price”);
• Level 3 — Inputs that are unobservable for the asset or liability (a “Level 3 Price”).
The availability of observable inputs can vary from security to security and is affected by a wide variety of factors, including, for example,the type of security, whether the security is new and not yet established in the marketplace, the liquidity of markets, and othercharacteristics particular to the security. Inputs may include price information, volatility statistics, specific and broad credit data, liquiditystatistics, and other factors. To the extent that valuation is based on models or inputs that are less observable or unobservable in themarket, the determination of fair value requires more judgment. Accordingly, the degree of judgment exercised in determining fair value isgreatest for instruments categorized in Level 3 of the fair value hierarchy.
The level of a value determined for a financial instrument within the fair value hierarchy is based on the lowest level of any input that issignificant to the fair value measurement in its entirety. The categorization of a value determined for a financial instrument within thehierarchy is based upon the pricing transparency of the instrument and does not necessarily correspond to the Funds’ perceived risk ofthat instrument.
Investments whose values are based on quoted market prices in active markets, and whose values are therefore classified as Level 1Prices, include active listed equities. The Funds do not adjust the quoted price for such instruments, even in situations where the Fundshold a large position and a sale could reasonably impact the quoted price.
Investments that trade in markets that are not considered to be active, but whose values are based on inputs such as quoted marketprices, dealer quotations or valuations provided by alternative pricing sources supported by observable inputs are classified withinLevel 2. These generally include U.S. government and sovereign obligations, most government agency securities, investment-gradecorporate bonds, certain mortgage products, less liquid listed equities, and state, municipal and provincial obligations. As Level 2investments include positions that are not traded in active markets and/or are subject to transfer restrictions, valuations may be adjustedto reflect illiquidity and/or non-transferability, which are generally based on available market information.
Investments whose values are classified as Level 3 Prices have significant unobservable inputs, as they may trade infrequently or not atall. Investments whose values are classified as Level 3 Prices may include unlisted securities related to corporate actions, securitieswhose trading have been suspended or which have been de-listed from their primary trading exchange, less liquid corporate debtsecurities (including distressed debt instruments), collateralized debt obligations, and less liquid mortgage securities (backed by eithercommercial or residential real estate). When observable prices are not available for these securities, the Funds use one or more valuationtechniques (e.g., the market approach or the income approach) for which sufficient and reliable data is available. Within Level 3 of the fairvalue hierarchy, the use of the market approach generally consists of using comparable market transactions, while the use of the incomeapproach generally consists of the net present value of estimated future cash flows, adjusted as appropriate for liquidity, credit, marketand/or other risk factors.
N ot e s to F i n a n c i a l S tat e m e n t s 153
Notes to Financial Statements (Continued)
iSHARES» TRUST
For
per
sona
l use
onl
y
%%TRANSMSG*** Transmitting Job: B82515 PCN: 155000000 ***%%PCMSG|153 |00008|Yes|No|09/16/2010 20:08|0|0|Page is valid, no graphics -- Color: N|
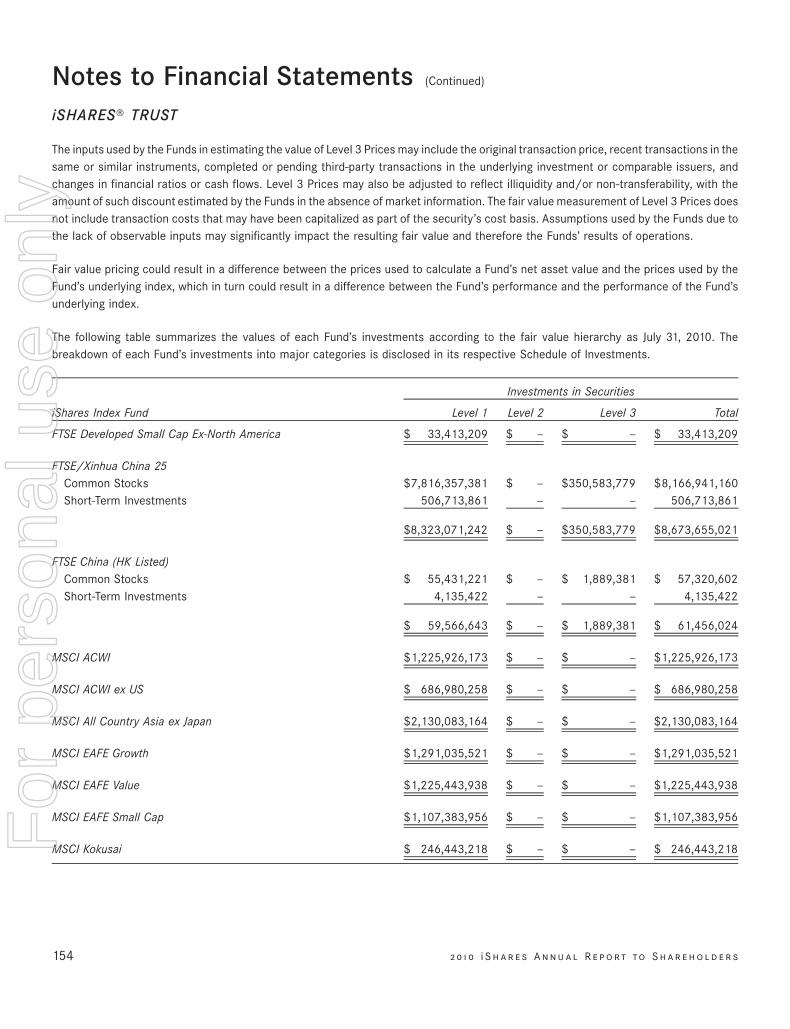
The inputs used by the Funds in estimating the value of Level 3 Prices may include the original transaction price, recent transactions in thesame or similar instruments, completed or pending third-party transactions in the underlying investment or comparable issuers, andchanges in financial ratios or cash flows. Level 3 Prices may also be adjusted to reflect illiquidity and/or non-transferability, with theamount of such discount estimated by the Funds in the absence of market information. The fair value measurement of Level 3 Prices doesnot include transaction costs that may have been capitalized as part of the security’s cost basis. Assumptions used by the Funds due tothe lack of observable inputs may significantly impact the resulting fair value and therefore the Funds’ results of operations.
Fair value pricing could result in a difference between the prices used to calculate a Fund’s net asset value and the prices used by theFund’s underlying index, which in turn could result in a difference between the Fund’s performance and the performance of the Fund’sunderlying index.
The following table summarizes the values of each Fund’s investments according to the fair value hierarchy as July 31, 2010. Thebreakdown of each Fund’s investments into major categories is disclosed in its respective Schedule of Investments.
iShares Index Fund Level 1 Level 2 Level 3 Total
Investments in Securities
FTSE Developed Small Cap Ex-North America $ 33,413,209 $ — $ — $ 33,413,209
FTSE/Xinhua China 25Common Stocks $7,816,357,381 $ — $350,583,779 $8,166,941,160Short-Term Investments 506,713,861 — — 506,713,861
$8,323,071,242 $ — $350,583,779 $8,673,655,021
FTSE China (HK Listed)Common Stocks $ 55,431,221 $ — $ 1,889,381 $ 57,320,602Short-Term Investments 4,135,422 — — 4,135,422
$ 59,566,643 $ — $ 1,889,381 $ 61,456,024
MSCI ACWI $1,225,926,173 $ — $ — $1,225,926,173
MSCI ACWI ex US $ 686,980,258 $ — $ — $ 686,980,258
MSCI All Country Asia ex Japan $2,130,083,164 $ — $ — $2,130,083,164
MSCI EAFE Growth $1,291,035,521 $ — $ — $1,291,035,521
MSCI EAFE Value $1,225,443,938 $ — $ — $1,225,443,938
MSCI EAFE Small Cap $1,107,383,956 $ — $ — $1,107,383,956
MSCI Kokusai $ 246,443,218 $ — $ — $ 246,443,218
154 2 0 1 0 i S h a r e s A n n u a l R e p o r t to S h a r e h o l d e r s
Notes to Financial Statements (Continued)
iSHARES» TRUST
For
per
sona
l use
onl
y
%%TRANSMSG*** Transmitting Job: B82515 PCN: 156000000 ***%%PCMSG|154 |00008|Yes|No|09/16/2010 20:08|0|0|Page is valid, no graphics -- Color: N|
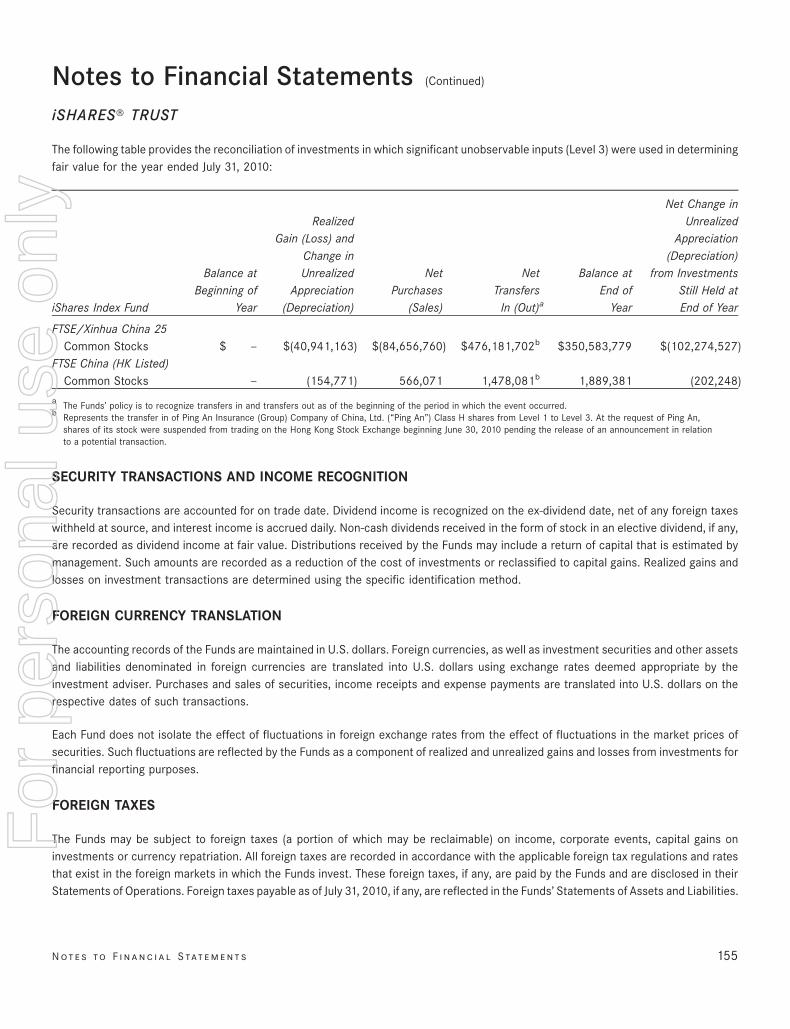
The following table provides the reconciliation of investments in which significant unobservable inputs (Level 3) were used in determiningfair value for the year ended July 31, 2010:
iShares Index Fund
Balance atBeginning of
Year
RealizedGain (Loss) and
Change inUnrealized
Appreciation(Depreciation)
NetPurchases
(Sales)
NetTransfers
In (Out)a
Balance atEnd of
Year
Net Change inUnrealized
Appreciation(Depreciation)
from InvestmentsStill Held atEnd of Year
FTSE/Xinhua China 25Common Stocks $ — $(40,941,163) $(84,656,760) $476,181,702b $350,583,779 $(102,274,527)
FTSE China (HK Listed)Common Stocks — (154,771) 566,071 1,478,081b 1,889,381 (202,248)
a The Funds’ policy is to recognize transfers in and transfers out as of the beginning of the period in which the event occurred.b Represents the transfer in of Ping An Insurance (Group) Company of China, Ltd. (“Ping An”) Class H shares from Level 1 to Level 3. At the request of Ping An,
shares of its stock were suspended from trading on the Hong Kong Stock Exchange beginning June 30, 2010 pending the release of an announcement in relationto a potential transaction.
SECURITY TRANSACTIONS AND INCOME RECOGNITION
Security transactions are accounted for on trade date. Dividend income is recognized on the ex-dividend date, net of any foreign taxeswithheld at source, and interest income is accrued daily. Non-cash dividends received in the form of stock in an elective dividend, if any,are recorded as dividend income at fair value. Distributions received by the Funds may include a return of capital that is estimated bymanagement. Such amounts are recorded as a reduction of the cost of investments or reclassified to capital gains. Realized gains andlosses on investment transactions are determined using the specific identification method.
FOREIGN CURRENCY TRANSLATION
The accounting records of the Funds are maintained in U.S. dollars. Foreign currencies, as well as investment securities and other assetsand liabilities denominated in foreign currencies are translated into U.S. dollars using exchange rates deemed appropriate by theinvestment adviser. Purchases and sales of securities, income receipts and expense payments are translated into U.S. dollars on therespective dates of such transactions.
Each Fund does not isolate the effect of fluctuations in foreign exchange rates from the effect of fluctuations in the market prices ofsecurities. Such fluctuations are reflected by the Funds as a component of realized and unrealized gains and losses from investments forfinancial reporting purposes.
FOREIGN TAXES
The Funds may be subject to foreign taxes (a portion of which may be reclaimable) on income, corporate events, capital gains oninvestments or currency repatriation. All foreign taxes are recorded in accordance with the applicable foreign tax regulations and ratesthat exist in the foreign markets in which the Funds invest. These foreign taxes, if any, are paid by the Funds and are disclosed in theirStatements of Operations. Foreign taxes payable as of July 31, 2010, if any, are reflected in the Funds’ Statements of Assets and Liabilities.
N ot e s to F i n a n c i a l S tat e m e n t s 155
Notes to Financial Statements (Continued)
iSHARES» TRUST
For
per
sona
l use
onl
y
%%TRANSMSG*** Transmitting Job: B82515 PCN: 157000000 ***%%PCMSG|155 |00012|Yes|No|09/16/2010 20:08|0|0|Page is valid, no graphics -- Color: N|
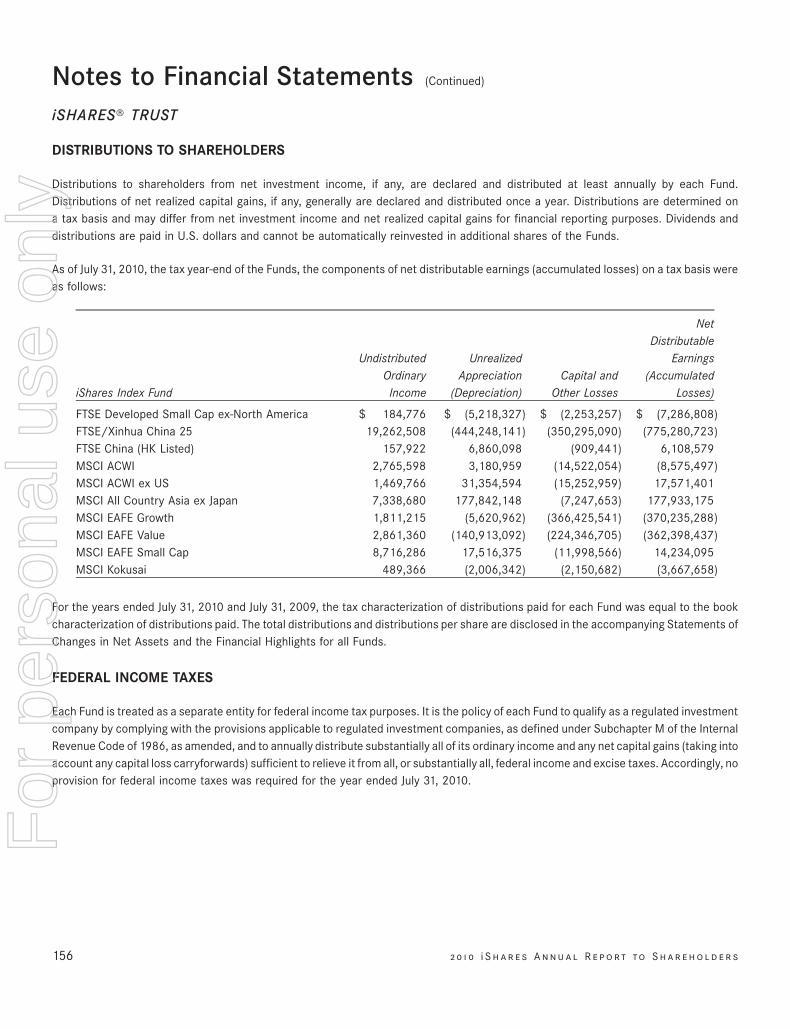
DISTRIBUTIONS TO SHAREHOLDERS
Distributions to shareholders from net investment income, if any, are declared and distributed at least annually by each Fund.Distributions of net realized capital gains, if any, generally are declared and distributed once a year. Distributions are determined ona tax basis and may differ from net investment income and net realized capital gains for financial reporting purposes. Dividends anddistributions are paid in U.S. dollars and cannot be automatically reinvested in additional shares of the Funds.
As of July 31, 2010, the tax year-end of the Funds, the components of net distributable earnings (accumulated losses) on a tax basis wereas follows:
iShares Index Fund
UndistributedOrdinary
Income
UnrealizedAppreciation
(Depreciation)Capital and
Other Losses
NetDistributable
Earnings(Accumulated
Losses)
FTSE Developed Small Cap ex-North America $ 184,776 $ (5,218,327) $ (2,253,257) $ (7,286,808)FTSE/Xinhua China 25 19,262,508 (444,248,141) (350,295,090) (775,280,723)FTSE China (HK Listed) 157,922 6,860,098 (909,441) 6,108,579MSCI ACWI 2,765,598 3,180,959 (14,522,054) (8,575,497)MSCI ACWI ex US 1,469,766 31,354,594 (15,252,959) 17,571,401MSCI All Country Asia ex Japan 7,338,680 177,842,148 (7,247,653) 177,933,175MSCI EAFE Growth 1,811,215 (5,620,962) (366,425,541) (370,235,288)MSCI EAFE Value 2,861,360 (140,913,092) (224,346,705) (362,398,437)MSCI EAFE Small Cap 8,716,286 17,516,375 (11,998,566) 14,234,095MSCI Kokusai 489,366 (2,006,342) (2,150,682) (3,667,658)
For the years ended July 31, 2010 and July 31, 2009, the tax characterization of distributions paid for each Fund was equal to the bookcharacterization of distributions paid. The total distributions and distributions per share are disclosed in the accompanying Statements ofChanges in Net Assets and the Financial Highlights for all Funds.
FEDERAL INCOME TAXES
Each Fund is treated as a separate entity for federal income tax purposes. It is the policy of each Fund to qualify as a regulated investmentcompany by complying with the provisions applicable to regulated investment companies, as defined under Subchapter M of the InternalRevenue Code of 1986, as amended, and to annually distribute substantially all of its ordinary income and any net capital gains (taking intoaccount any capital loss carryforwards) sufficient to relieve it from all, or substantially all, federal income and excise taxes. Accordingly, noprovision for federal income taxes was required for the year ended July 31, 2010.
156 2 0 1 0 i S h a r e s A n n u a l R e p o r t to S h a r e h o l d e r s
Notes to Financial Statements (Continued)
iSHARES» TRUST
For
per
sona
l use
onl
y
%%TRANSMSG*** Transmitting Job: B82515 PCN: 158000000 ***%%PCMSG|156 |00014|Yes|No|09/16/2010 20:08|0|0|Page is valid, no graphics -- Color: N|
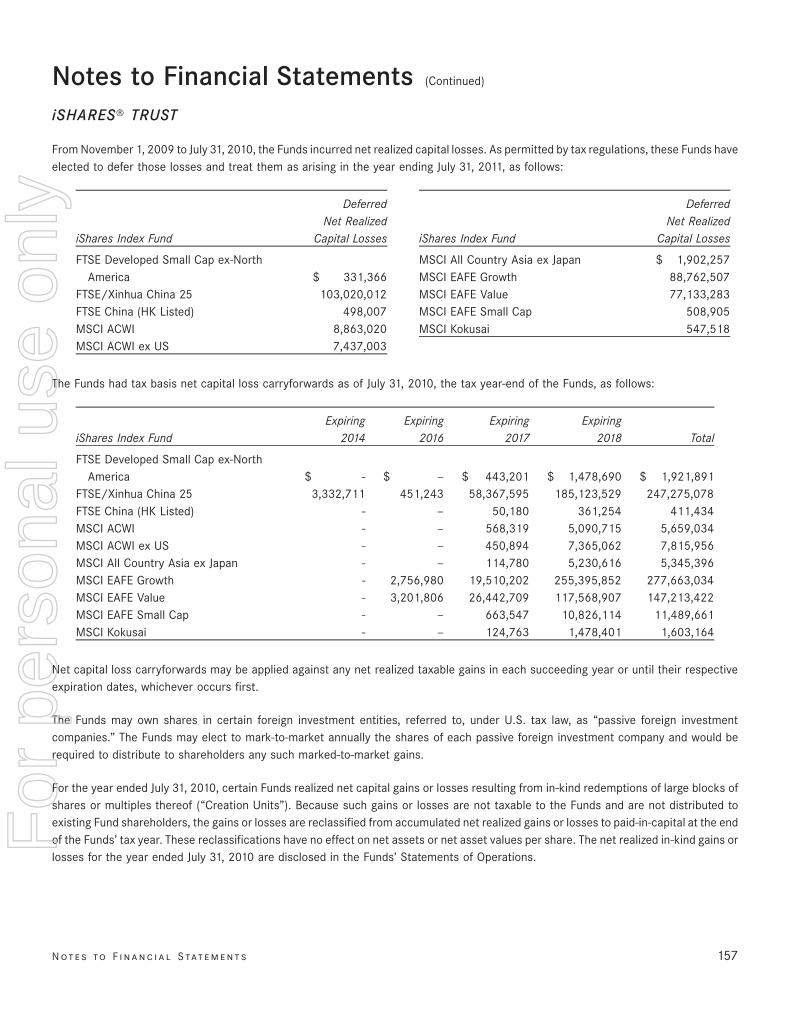
From November 1, 2009 to July 31, 2010, the Funds incurred net realized capital losses. As permitted by tax regulations, these Funds haveelected to defer those losses and treat them as arising in the year ending July 31, 2011, as follows:
iShares Index Fund
DeferredNet Realized
Capital Losses
FTSE Developed Small Cap ex-NorthAmerica $ 331,366
FTSE/Xinhua China 25 103,020,012FTSE China (HK Listed) 498,007MSCI ACWI 8,863,020MSCI ACWI ex US 7,437,003
iShares Index Fund
DeferredNet Realized
Capital Losses
MSCI All Country Asia ex Japan $ 1,902,257MSCI EAFE Growth 88,762,507MSCI EAFE Value 77,133,283MSCI EAFE Small Cap 508,905MSCI Kokusai 547,518
The Funds had tax basis net capital loss carryforwards as of July 31, 2010, the tax year-end of the Funds, as follows:
iShares Index FundExpiring
2014Expiring
2016Expiring
2017Expiring
2018 Total
FTSE Developed Small Cap ex-NorthAmerica $ - $ — $ 443,201 $ 1,478,690 $ 1,921,891
FTSE/Xinhua China 25 3,332,711 451,243 58,367,595 185,123,529 247,275,078FTSE China (HK Listed) - — 50,180 361,254 411,434MSCI ACWI - — 568,319 5,090,715 5,659,034MSCI ACWI ex US - — 450,894 7,365,062 7,815,956MSCI All Country Asia ex Japan - — 114,780 5,230,616 5,345,396MSCI EAFE Growth - 2,756,980 19,510,202 255,395,852 277,663,034MSCI EAFE Value - 3,201,806 26,442,709 117,568,907 147,213,422MSCI EAFE Small Cap - — 663,547 10,826,114 11,489,661MSCI Kokusai - — 124,763 1,478,401 1,603,164
Net capital loss carryforwards may be applied against any net realized taxable gains in each succeeding year or until their respectiveexpiration dates, whichever occurs first.
The Funds may own shares in certain foreign investment entities, referred to, under U.S. tax law, as “passive foreign investmentcompanies.” The Funds may elect to mark-to-market annually the shares of each passive foreign investment company and would berequired to distribute to shareholders any such marked-to-market gains.
For the year ended July 31, 2010, certain Funds realized net capital gains or losses resulting from in-kind redemptions of large blocks ofshares or multiples thereof (“Creation Units”). Because such gains or losses are not taxable to the Funds and are not distributed toexisting Fund shareholders, the gains or losses are reclassified from accumulated net realized gains or losses to paid-in-capital at the endof the Funds’ tax year. These reclassifications have no effect on net assets or net asset values per share. The net realized in-kind gains orlosses for the year ended July 31, 2010 are disclosed in the Funds’ Statements of Operations.
N ot e s to F i n a n c i a l S tat e m e n t s 157
Notes to Financial Statements (Continued)
iSHARES» TRUST
For
per
sona
l use
onl
y
%%TRANSMSG*** Transmitting Job: B82515 PCN: 159000000 ***%%PCMSG|157 |00008|Yes|No|09/16/2010 20:08|0|0|Page is valid, no graphics -- Color: N|
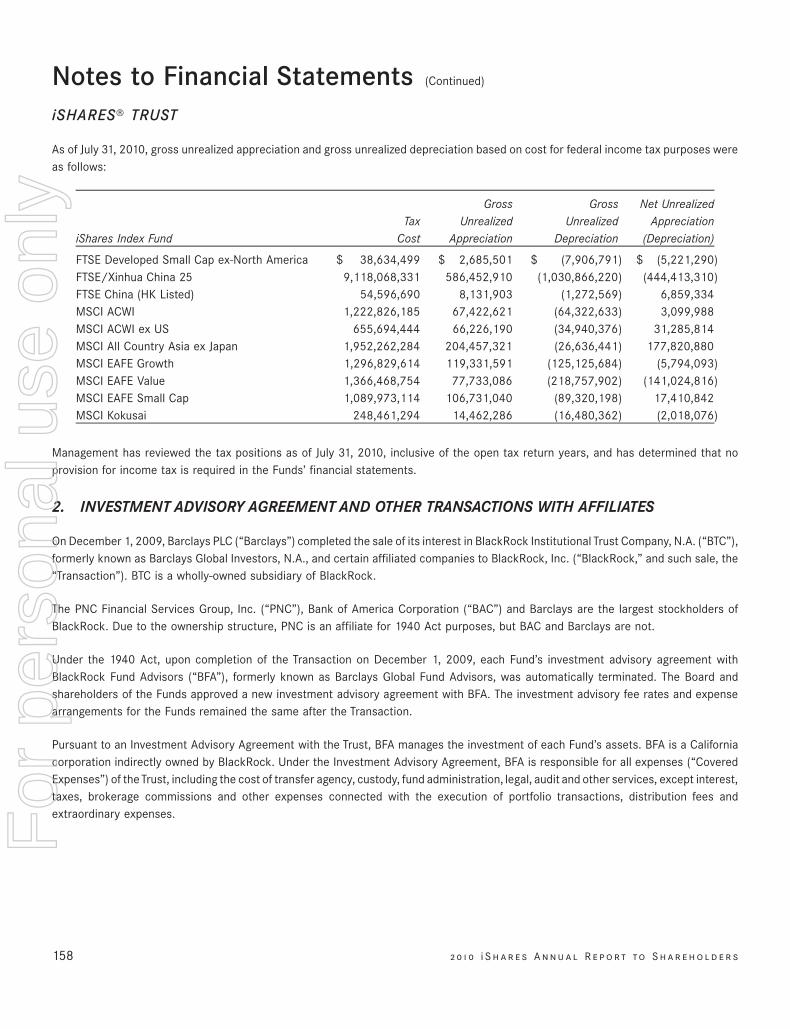
As of July 31, 2010, gross unrealized appreciation and gross unrealized depreciation based on cost for federal income tax purposes wereas follows:
iShares Index FundTax
Cost
GrossUnrealized
Appreciation
GrossUnrealized
Depreciation
Net UnrealizedAppreciation
(Depreciation)
FTSE Developed Small Cap ex-North America $ 38,634,499 $ 2,685,501 $ (7,906,791) $ (5,221,290)FTSE/Xinhua China 25 9,118,068,331 586,452,910 (1,030,866,220) (444,413,310)FTSE China (HK Listed) 54,596,690 8,131,903 (1,272,569) 6,859,334MSCI ACWI 1,222,826,185 67,422,621 (64,322,633) 3,099,988MSCI ACWI ex US 655,694,444 66,226,190 (34,940,376) 31,285,814MSCI All Country Asia ex Japan 1,952,262,284 204,457,321 (26,636,441) 177,820,880MSCI EAFE Growth 1,296,829,614 119,331,591 (125,125,684) (5,794,093)MSCI EAFE Value 1,366,468,754 77,733,086 (218,757,902) (141,024,816)MSCI EAFE Small Cap 1,089,973,114 106,731,040 (89,320,198) 17,410,842MSCI Kokusai 248,461,294 14,462,286 (16,480,362) (2,018,076)
Management has reviewed the tax positions as of July 31, 2010, inclusive of the open tax return years, and has determined that noprovision for income tax is required in the Funds’ financial statements.
2. INVESTMENT ADVISORY AGREEMENT AND OTHER TRANSACTIONS WITH AFFILIATES
On December 1, 2009, Barclays PLC (“Barclays”) completed the sale of its interest in BlackRock Institutional Trust Company, N.A. (“BTC”),formerly known as Barclays Global Investors, N.A., and certain affiliated companies to BlackRock, Inc. (“BlackRock,” and such sale, the“Transaction”). BTC is a wholly-owned subsidiary of BlackRock.
The PNC Financial Services Group, Inc. (“PNC”), Bank of America Corporation (“BAC”) and Barclays are the largest stockholders ofBlackRock. Due to the ownership structure, PNC is an affiliate for 1940 Act purposes, but BAC and Barclays are not.
Under the 1940 Act, upon completion of the Transaction on December 1, 2009, each Fund’s investment advisory agreement withBlackRock Fund Advisors (“BFA”), formerly known as Barclays Global Fund Advisors, was automatically terminated. The Board andshareholders of the Funds approved a new investment advisory agreement with BFA. The investment advisory fee rates and expensearrangements for the Funds remained the same after the Transaction.
Pursuant to an Investment Advisory Agreement with the Trust, BFA manages the investment of each Fund’s assets. BFA is a Californiacorporation indirectly owned by BlackRock. Under the Investment Advisory Agreement, BFA is responsible for all expenses (“CoveredExpenses”) of the Trust, including the cost of transfer agency, custody, fund administration, legal, audit and other services, except interest,taxes, brokerage commissions and other expenses connected with the execution of portfolio transactions, distribution fees andextraordinary expenses.
158 2 0 1 0 i S h a r e s A n n u a l R e p o r t to S h a r e h o l d e r s
Notes to Financial Statements (Continued)
iSHARES» TRUST
For
per
sona
l use
onl
y
%%TRANSMSG*** Transmitting Job: B82515 PCN: 160000000 ***%%PCMSG|158 |00010|Yes|No|09/16/2010 20:08|0|0|Page is valid, no graphics -- Color: N|
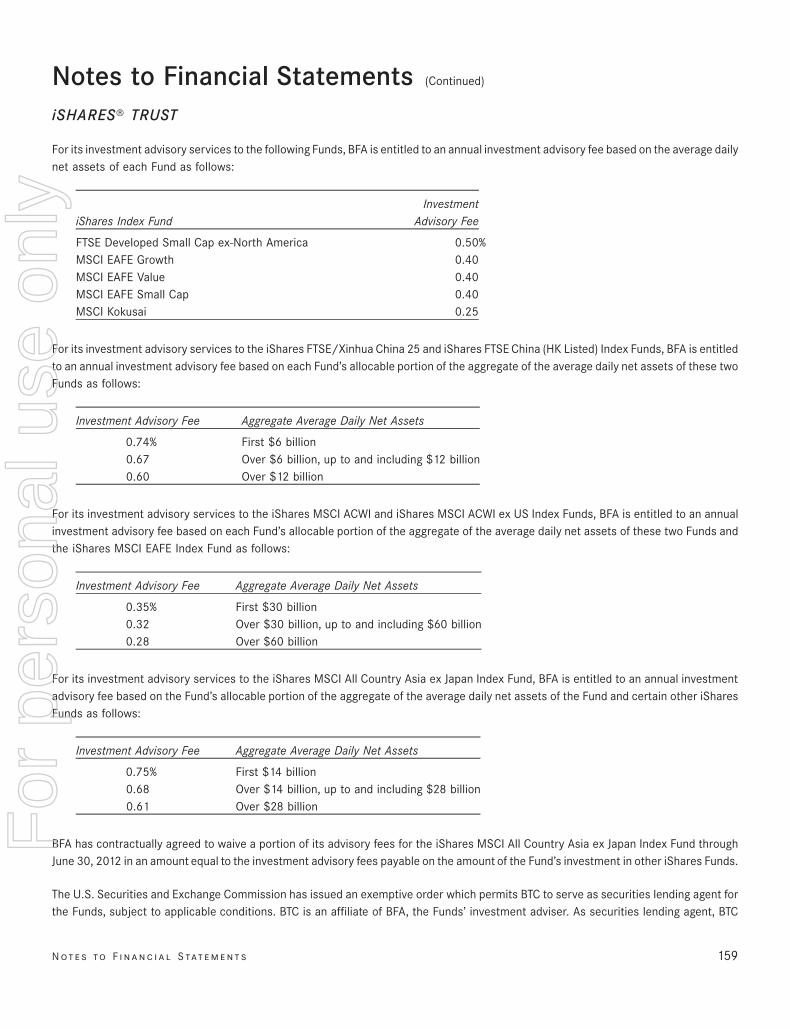
For its investment advisory services to the following Funds, BFA is entitled to an annual investment advisory fee based on the average dailynet assets of each Fund as follows:
iShares Index FundInvestment
Advisory Fee
FTSE Developed Small Cap ex-North America 0.50%MSCI EAFE Growth 0.40MSCI EAFE Value 0.40MSCI EAFE Small Cap 0.40MSCI Kokusai 0.25
For its investment advisory services to the iShares FTSE/Xinhua China 25 and iShares FTSE China (HK Listed) Index Funds, BFA is entitledto an annual investment advisory fee based on each Fund’s allocable portion of the aggregate of the average daily net assets of these twoFunds as follows:
Investment Advisory Fee Aggregate Average Daily Net Assets
0.74% First $6 billion0.67 Over $6 billion, up to and including $12 billion0.60 Over $12 billion
For its investment advisory services to the iShares MSCI ACWI and iShares MSCI ACWI ex US Index Funds, BFA is entitled to an annualinvestment advisory fee based on each Fund’s allocable portion of the aggregate of the average daily net assets of these two Funds andthe iShares MSCI EAFE Index Fund as follows:
Investment Advisory Fee Aggregate Average Daily Net Assets
0.35% First $30 billion0.32 Over $30 billion, up to and including $60 billion0.28 Over $60 billion
For its investment advisory services to the iShares MSCI All Country Asia ex Japan Index Fund, BFA is entitled to an annual investmentadvisory fee based on the Fund’s allocable portion of the aggregate of the average daily net assets of the Fund and certain other iSharesFunds as follows:
Investment Advisory Fee Aggregate Average Daily Net Assets
0.75% First $14 billion0.68 Over $14 billion, up to and including $28 billion0.61 Over $28 billion
BFA has contractually agreed to waive a portion of its advisory fees for the iShares MSCI All Country Asia ex Japan Index Fund throughJune 30, 2012 in an amount equal to the investment advisory fees payable on the amount of the Fund’s investment in other iShares Funds.
The U.S. Securities and Exchange Commission has issued an exemptive order which permits BTC to serve as securities lending agent forthe Funds, subject to applicable conditions. BTC is an affiliate of BFA, the Funds’ investment adviser. As securities lending agent, BTC
N ot e s to F i n a n c i a l S tat e m e n t s 159
Notes to Financial Statements (Continued)
iSHARES» TRUST
For
per
sona
l use
onl
y
%%TRANSMSG*** Transmitting Job: B82515 PCN: 161000000 ***%%PCMSG|159 |00009|Yes|No|09/16/2010 20:08|0|0|Page is valid, no graphics -- Color: N|
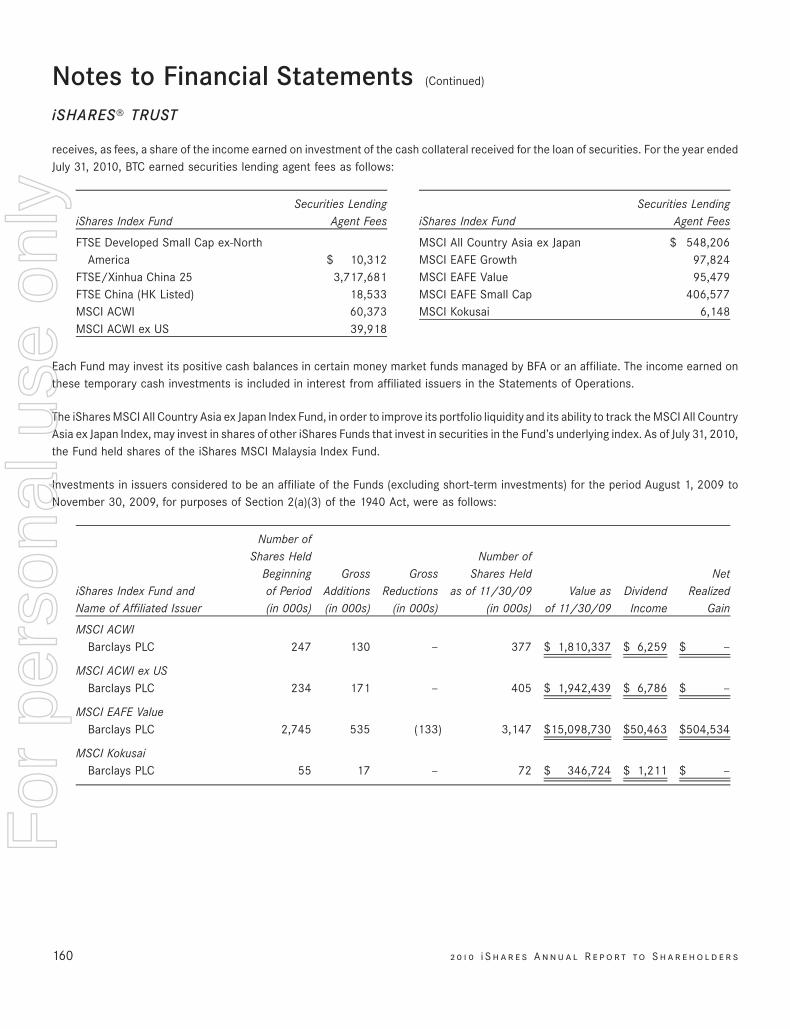
receives, as fees, a share of the income earned on investment of the cash collateral received for the loan of securities. For the year endedJuly 31, 2010, BTC earned securities lending agent fees as follows:
iShares Index FundSecurities Lending
Agent Fees
FTSE Developed Small Cap ex-NorthAmerica $ 10,312
FTSE/Xinhua China 25 3,717,681FTSE China (HK Listed) 18,533MSCI ACWI 60,373MSCI ACWI ex US 39,918
iShares Index FundSecurities Lending
Agent Fees
MSCI All Country Asia ex Japan $ 548,206MSCI EAFE Growth 97,824MSCI EAFE Value 95,479MSCI EAFE Small Cap 406,577MSCI Kokusai 6,148
Each Fund may invest its positive cash balances in certain money market funds managed by BFA or an affiliate. The income earned onthese temporary cash investments is included in interest from affiliated issuers in the Statements of Operations.
The iShares MSCI All Country Asia ex Japan Index Fund, in order to improve its portfolio liquidity and its ability to track the MSCI All CountryAsia ex Japan Index, may invest in shares of other iShares Funds that invest in securities in the Fund’s underlying index. As of July 31, 2010,the Fund held shares of the iShares MSCI Malaysia Index Fund.
Investments in issuers considered to be an affiliate of the Funds (excluding short-term investments) for the period August 1, 2009 toNovember 30, 2009, for purposes of Section 2(a)(3) of the 1940 Act, were as follows:
iShares Index Fund andName of Affiliated Issuer
Number ofShares Held
Beginningof Period(in 000s)
GrossAdditions(in 000s)
GrossReductions
(in 000s)
Number ofShares Held
as of 11/30/09(in 000s)
Value asof 11/30/09
DividendIncome
NetRealized
Gain
MSCI ACWIBarclays PLC 247 130 — 377 $ 1,810,337 $ 6,259 $ —
MSCI ACWI ex USBarclays PLC 234 171 — 405 $ 1,942,439 $ 6,786 $ —
MSCI EAFE ValueBarclays PLC 2,745 535 (133) 3,147 $15,098,730 $50,463 $504,534
MSCI KokusaiBarclays PLC 55 17 — 72 $ 346,724 $ 1,211 $ —
160 2 0 1 0 i S h a r e s A n n u a l R e p o r t to S h a r e h o l d e r s
Notes to Financial Statements (Continued)
iSHARES» TRUST
For
per
sona
l use
onl
y
%%TRANSMSG*** Transmitting Job: B82515 PCN: 162000000 ***%%PCMSG|160 |00010|Yes|No|09/16/2010 20:08|0|0|Page is valid, no graphics -- Color: N|
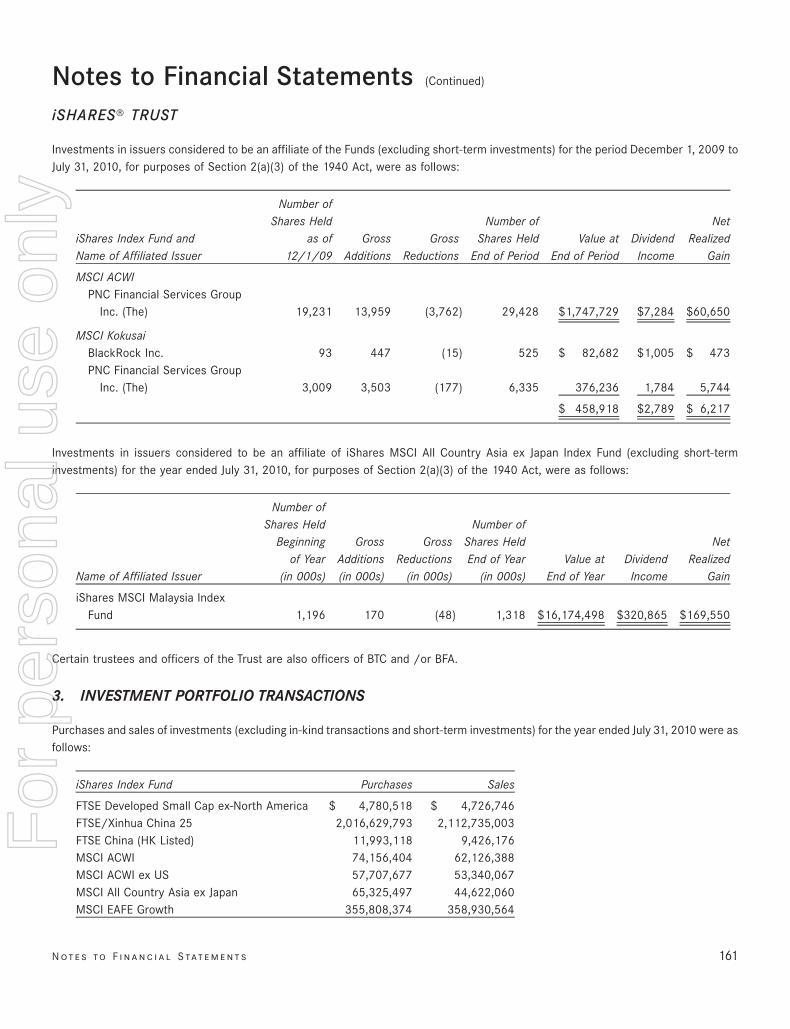
Investments in issuers considered to be an affiliate of the Funds (excluding short-term investments) for the period December 1, 2009 toJuly 31, 2010, for purposes of Section 2(a)(3) of the 1940 Act, were as follows:
iShares Index Fund andName of Affiliated Issuer
Number ofShares Held
as of12/1/09
GrossAdditions
GrossReductions
Number ofShares Held
End of PeriodValue at
End of PeriodDividend
Income
NetRealized
Gain
MSCI ACWIPNC Financial Services Group
Inc. (The) 19,231 13,959 (3,762) 29,428 $1,747,729 $7,284 $60,650
MSCI KokusaiBlackRock Inc. 93 447 (15) 525 $ 82,682 $1,005 $ 473PNC Financial Services Group
Inc. (The) 3,009 3,503 (177) 6,335 376,236 1,784 5,744
$ 458,918 $2,789 $ 6,217
Investments in issuers considered to be an affiliate of iShares MSCI All Country Asia ex Japan Index Fund (excluding short-terminvestments) for the year ended July 31, 2010, for purposes of Section 2(a)(3) of the 1940 Act, were as follows:
Name of Affiliated Issuer
Number ofShares Held
Beginningof Year
(in 000s)
GrossAdditions(in 000s)
GrossReductions
(in 000s)
Number ofShares HeldEnd of Year
(in 000s)Value at
End of YearDividend
Income
NetRealized
Gain
iShares MSCI Malaysia IndexFund 1,196 170 (48) 1,318 $16,174,498 $320,865 $169,550
Certain trustees and officers of the Trust are also officers of BTC and /or BFA.
3. INVESTMENT PORTFOLIO TRANSACTIONS
Purchases and sales of investments (excluding in-kind transactions and short-term investments) for the year ended July 31, 2010 were asfollows:
iShares Index Fund Purchases Sales
FTSE Developed Small Cap ex-North America $ 4,780,518 $ 4,726,746FTSE/Xinhua China 25 2,016,629,793 2,112,735,003FTSE China (HK Listed) 11,993,118 9,426,176MSCI ACWI 74,156,404 62,126,388MSCI ACWI ex US 57,707,677 53,340,067MSCI All Country Asia ex Japan 65,325,497 44,622,060MSCI EAFE Growth 355,808,374 358,930,564
N ot e s to F i n a n c i a l S tat e m e n t s 161
Notes to Financial Statements (Continued)
iSHARES» TRUST
For
per
sona
l use
onl
y
%%TRANSMSG*** Transmitting Job: B82515 PCN: 163000000 ***%%PCMSG|161 |00010|Yes|No|09/16/2010 20:08|0|0|Page is valid, no graphics -- Color: N|
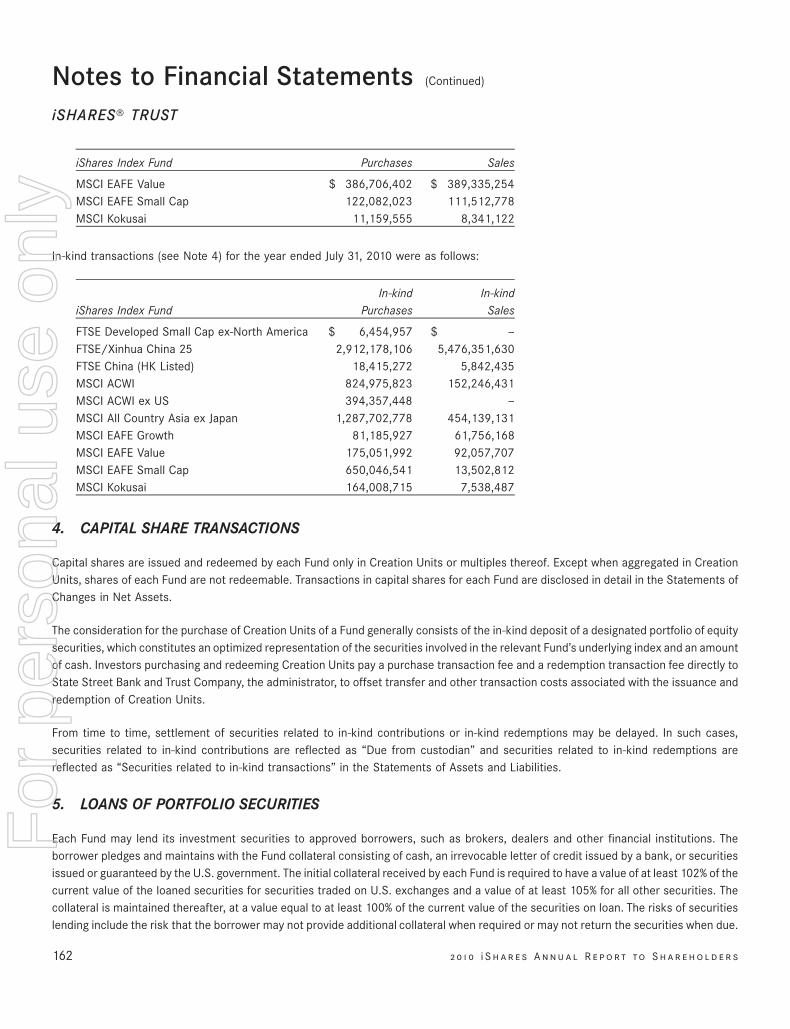
iShares Index Fund Purchases Sales
MSCI EAFE Value $ 386,706,402 $ 389,335,254MSCI EAFE Small Cap 122,082,023 111,512,778MSCI Kokusai 11,159,555 8,341,122
In-kind transactions (see Note 4) for the year ended July 31, 2010 were as follows:
iShares Index FundIn-kind
PurchasesIn-kind
Sales
FTSE Developed Small Cap ex-North America $ 6,454,957 $ —FTSE/Xinhua China 25 2,912,178,106 5,476,351,630FTSE China (HK Listed) 18,415,272 5,842,435MSCI ACWI 824,975,823 152,246,431MSCI ACWI ex US 394,357,448 —MSCI All Country Asia ex Japan 1,287,702,778 454,139,131MSCI EAFE Growth 81,185,927 61,756,168MSCI EAFE Value 175,051,992 92,057,707MSCI EAFE Small Cap 650,046,541 13,502,812MSCI Kokusai 164,008,715 7,538,487
4. CAPITAL SHARE TRANSACTIONS
Capital shares are issued and redeemed by each Fund only in Creation Units or multiples thereof. Except when aggregated in CreationUnits, shares of each Fund are not redeemable. Transactions in capital shares for each Fund are disclosed in detail in the Statements ofChanges in Net Assets.
The consideration for the purchase of Creation Units of a Fund generally consists of the in-kind deposit of a designated portfolio of equitysecurities, which constitutes an optimized representation of the securities involved in the relevant Fund’s underlying index and an amountof cash. Investors purchasing and redeeming Creation Units pay a purchase transaction fee and a redemption transaction fee directly toState Street Bank and Trust Company, the administrator, to offset transfer and other transaction costs associated with the issuance andredemption of Creation Units.
From time to time, settlement of securities related to in-kind contributions or in-kind redemptions may be delayed. In such cases,securities related to in-kind contributions are reflected as “Due from custodian” and securities related to in-kind redemptions arereflected as “Securities related to in-kind transactions” in the Statements of Assets and Liabilities.
5. LOANS OF PORTFOLIO SECURITIES
Each Fund may lend its investment securities to approved borrowers, such as brokers, dealers and other financial institutions. Theborrower pledges and maintains with the Fund collateral consisting of cash, an irrevocable letter of credit issued by a bank, or securitiesissued or guaranteed by the U.S. government. The initial collateral received by each Fund is required to have a value of at least 102% of thecurrent value of the loaned securities for securities traded on U.S. exchanges and a value of at least 105% for all other securities. Thecollateral is maintained thereafter, at a value equal to at least 100% of the current value of the securities on loan. The risks of securitieslending include the risk that the borrower may not provide additional collateral when required or may not return the securities when due.
162 2 0 1 0 i S h a r e s A n n u a l R e p o r t to S h a r e h o l d e r s
Notes to Financial Statements (Continued)
iSHARES» TRUST
For
per
sona
l use
onl
y
%%TRANSMSG*** Transmitting Job: B82515 PCN: 164000000 ***%%PCMSG|162 |00009|Yes|No|09/16/2010 20:08|0|0|Page is valid, no graphics -- Color: N|
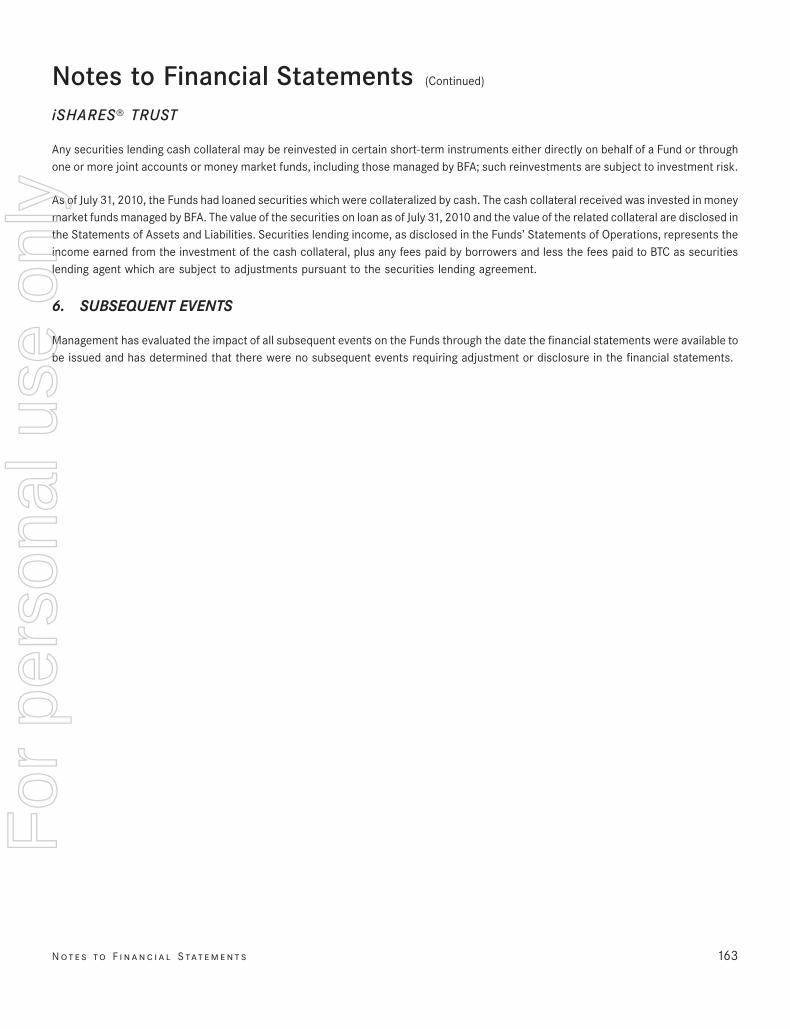
Any securities lending cash collateral may be reinvested in certain short-term instruments either directly on behalf of a Fund or throughone or more joint accounts or money market funds, including those managed by BFA; such reinvestments are subject to investment risk.
As of July 31, 2010, the Funds had loaned securities which were collateralized by cash. The cash collateral received was invested in moneymarket funds managed by BFA. The value of the securities on loan as of July 31, 2010 and the value of the related collateral are disclosed inthe Statements of Assets and Liabilities. Securities lending income, as disclosed in the Funds’ Statements of Operations, represents theincome earned from the investment of the cash collateral, plus any fees paid by borrowers and less the fees paid to BTC as securitieslending agent which are subject to adjustments pursuant to the securities lending agreement.
6. SUBSEQUENT EVENTS
Management has evaluated the impact of all subsequent events on the Funds through the date the financial statements were available tobe issued and has determined that there were no subsequent events requiring adjustment or disclosure in the financial statements.
N ot e s to F i n a n c i a l S tat e m e n t s 163
Notes to Financial Statements (Continued)
iSHARES» TRUST
For
per
sona
l use
onl
y
%%TRANSMSG*** Transmitting Job: B82515 PCN: 165000000 ***%%PCMSG|163 |00010|Yes|No|09/16/2010 20:08|0|0|Page is valid, no graphics -- Color: N|
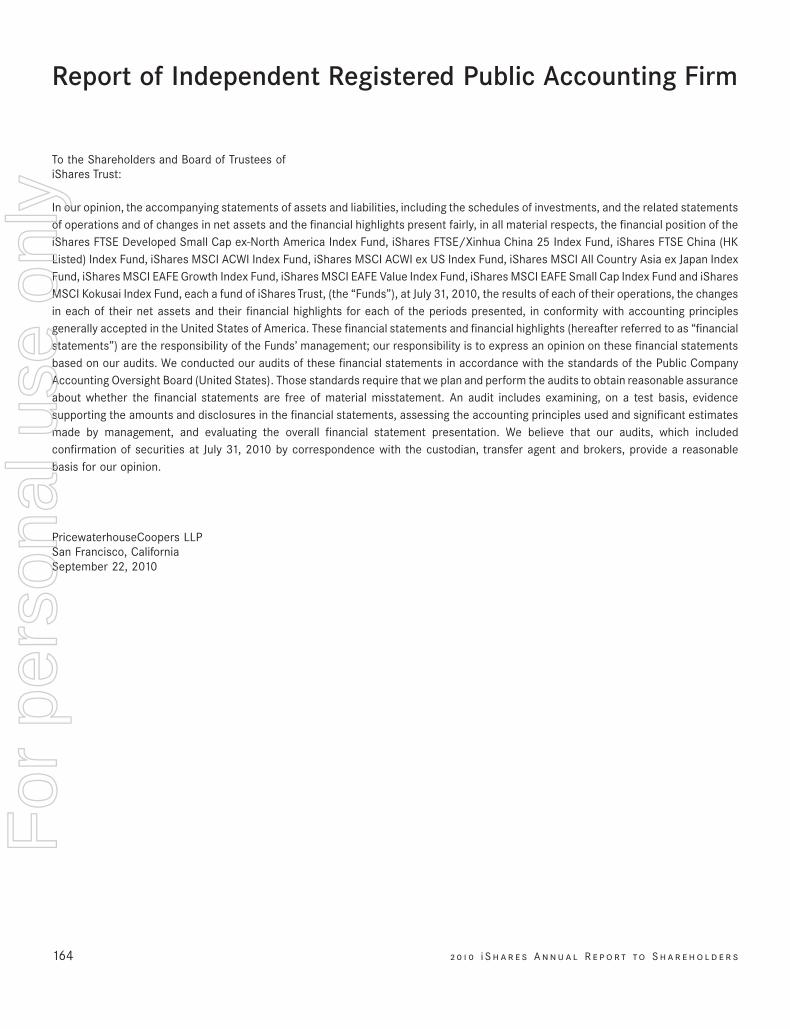
Report of Independent Registered Public Accounting Firm
To the Shareholders and Board of Trustees ofiShares Trust:
In our opinion, the accompanying statements of assets and liabilities, including the schedules of investments, and the related statementsof operations and of changes in net assets and the financial highlights present fairly, in all material respects, the financial position of theiShares FTSE Developed Small Cap ex-North America Index Fund, iShares FTSE/Xinhua China 25 Index Fund, iShares FTSE China (HKListed) Index Fund, iShares MSCI ACWI Index Fund, iShares MSCI ACWI ex US Index Fund, iShares MSCI All Country Asia ex Japan IndexFund, iShares MSCI EAFE Growth Index Fund, iShares MSCI EAFE Value Index Fund, iShares MSCI EAFE Small Cap Index Fund and iSharesMSCI Kokusai Index Fund, each a fund of iShares Trust, (the “Funds”), at July 31, 2010, the results of each of their operations, the changesin each of their net assets and their financial highlights for each of the periods presented, in conformity with accounting principlesgenerally accepted in the United States of America. These financial statements and financial highlights (hereafter referred to as “financialstatements”) are the responsibility of the Funds’ management; our responsibility is to express an opinion on these financial statementsbased on our audits. We conducted our audits of these financial statements in accordance with the standards of the Public CompanyAccounting Oversight Board (United States). Those standards require that we plan and perform the audits to obtain reasonable assuranceabout whether the financial statements are free of material misstatement. An audit includes examining, on a test basis, evidencesupporting the amounts and disclosures in the financial statements, assessing the accounting principles used and significant estimatesmade by management, and evaluating the overall financial statement presentation. We believe that our audits, which includedconfirmation of securities at July 31, 2010 by correspondence with the custodian, transfer agent and brokers, provide a reasonablebasis for our opinion.
PricewaterhouseCoopers LLPSan Francisco, CaliforniaSeptember 22, 2010
164 2 0 1 0 i S h a r e s A n n u a l R e p o r t to S h a r e h o l d e r s
For
per
sona
l use
onl
y
%%TRANSMSG*** Transmitting Job: B82515 PCN: 166000000 ***%%PCMSG|164 |00009|Yes|No|09/16/2010 20:08|0|0|Page is valid, no graphics -- Color: N|
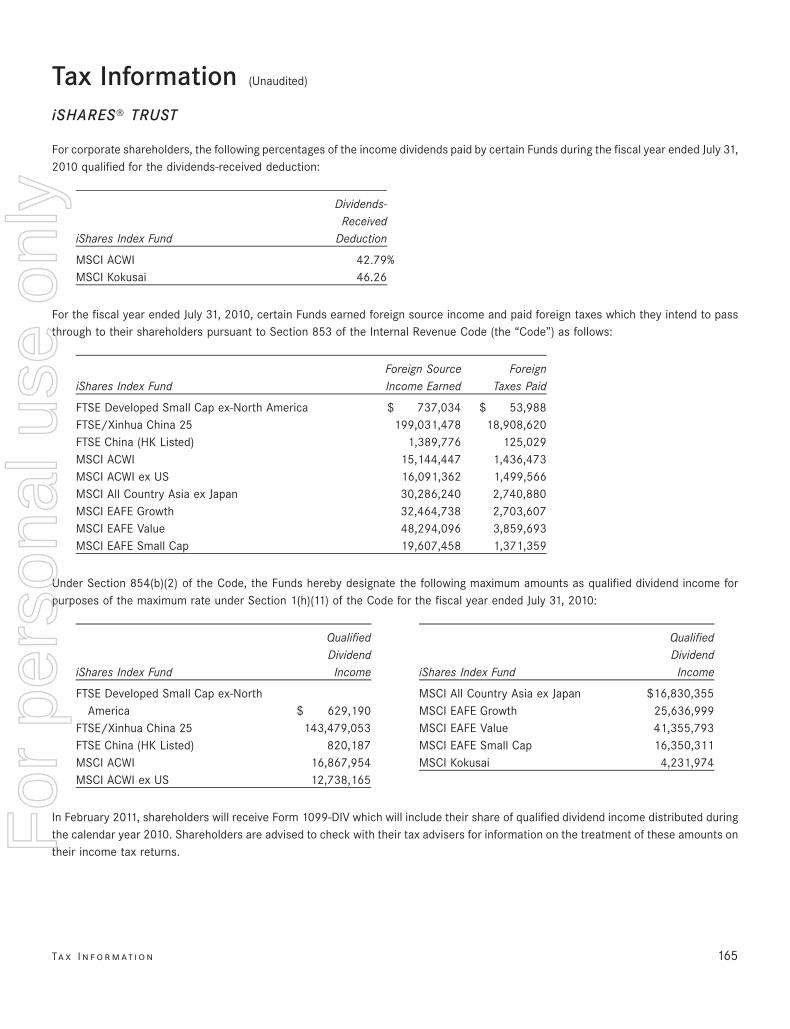
Tax Information (Unaudited)
iSHARES» TRUST
For corporate shareholders, the following percentages of the income dividends paid by certain Funds during the fiscal year ended July 31,2010 qualified for the dividends-received deduction:
iShares Index Fund
Dividends-Received
Deduction
MSCI ACWI 42.79%MSCI Kokusai 46.26
For the fiscal year ended July 31, 2010, certain Funds earned foreign source income and paid foreign taxes which they intend to passthrough to their shareholders pursuant to Section 853 of the Internal Revenue Code (the “Code”) as follows:
iShares Index FundForeign SourceIncome Earned
ForeignTaxes Paid
FTSE Developed Small Cap ex-North America $ 737,034 $ 53,988FTSE/Xinhua China 25 199,031,478 18,908,620FTSE China (HK Listed) 1,389,776 125,029MSCI ACWI 15,144,447 1,436,473MSCI ACWI ex US 16,091,362 1,499,566MSCI All Country Asia ex Japan 30,286,240 2,740,880MSCI EAFE Growth 32,464,738 2,703,607MSCI EAFE Value 48,294,096 3,859,693MSCI EAFE Small Cap 19,607,458 1,371,359
Under Section 854(b)(2) of the Code, the Funds hereby designate the following maximum amounts as qualified dividend income forpurposes of the maximum rate under Section 1(h)(11) of the Code for the fiscal year ended July 31, 2010:
iShares Index Fund
QualifiedDividend
Income
FTSE Developed Small Cap ex-NorthAmerica $ 629,190
FTSE/Xinhua China 25 143,479,053FTSE China (HK Listed) 820,187MSCI ACWI 16,867,954MSCI ACWI ex US 12,738,165
iShares Index Fund
QualifiedDividend
Income
MSCI All Country Asia ex Japan $16,830,355MSCI EAFE Growth 25,636,999MSCI EAFE Value 41,355,793MSCI EAFE Small Cap 16,350,311MSCI Kokusai 4,231,974
In February 2011, shareholders will receive Form 1099-DIV which will include their share of qualified dividend income distributed duringthe calendar year 2010. Shareholders are advised to check with their tax advisers for information on the treatment of these amounts ontheir income tax returns.
Ta x I n f o r m at i o n 165
For
per
sona
l use
onl
y
%%TRANSMSG*** Transmitting Job: B82515 PCN: 167000000 ***%%PCMSG|165 |00010|Yes|No|09/16/2010 20:08|0|0|Page is valid, no graphics -- Color: N|
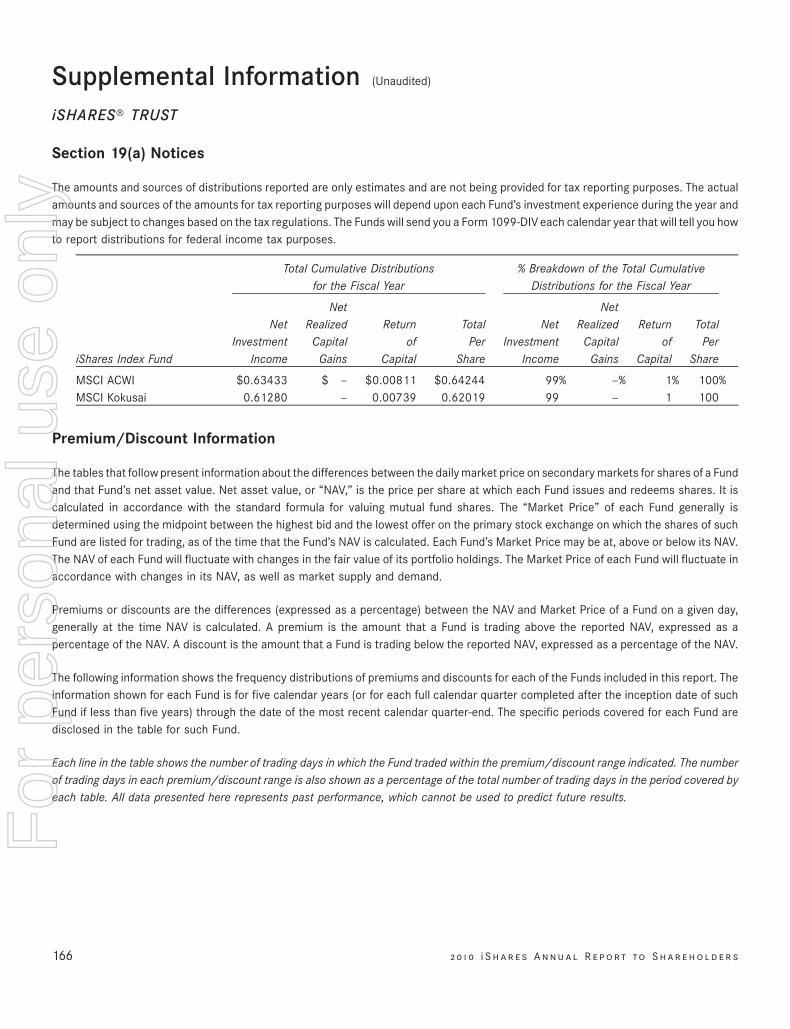
Supplemental Information (Unaudited)
iSHARES» TRUST
Section 19(a) Notices
The amounts and sources of distributions reported are only estimates and are not being provided for tax reporting purposes. The actualamounts and sources of the amounts for tax reporting purposes will depend upon each Fund’s investment experience during the year andmay be subject to changes based on the tax regulations. The Funds will send you a Form 1099-DIV each calendar year that will tell you howto report distributions for federal income tax purposes.
iShares Index Fund
NetInvestment
Income
NetRealized
CapitalGains
Returnof
Capital
TotalPer
Share
NetInvestment
Income
NetRealized
CapitalGains
Returnof
Capital
TotalPer
Share
Total Cumulative Distributionsfor the Fiscal Year
% Breakdown of the Total CumulativeDistributions for the Fiscal Year
MSCI ACWI $0.63433 $ — $0.00811 $0.64244 99% —% 1% 100%MSCI Kokusai 0.61280 — 0.00739 0.62019 99 — 1 100
Premium/Discount Information
The tables that follow present information about the differences between the daily market price on secondary markets for shares of a Fundand that Fund’s net asset value. Net asset value, or “NAV,” is the price per share at which each Fund issues and redeems shares. It iscalculated in accordance with the standard formula for valuing mutual fund shares. The “Market Price” of each Fund generally isdetermined using the midpoint between the highest bid and the lowest offer on the primary stock exchange on which the shares of suchFund are listed for trading, as of the time that the Fund’s NAV is calculated. Each Fund’s Market Price may be at, above or below its NAV.The NAV of each Fund will fluctuate with changes in the fair value of its portfolio holdings. The Market Price of each Fund will fluctuate inaccordance with changes in its NAV, as well as market supply and demand.
Premiums or discounts are the differences (expressed as a percentage) between the NAV and Market Price of a Fund on a given day,generally at the time NAV is calculated. A premium is the amount that a Fund is trading above the reported NAV, expressed as apercentage of the NAV. A discount is the amount that a Fund is trading below the reported NAV, expressed as a percentage of the NAV.
The following information shows the frequency distributions of premiums and discounts for each of the Funds included in this report. Theinformation shown for each Fund is for five calendar years (or for each full calendar quarter completed after the inception date of suchFund if less than five years) through the date of the most recent calendar quarter-end. The specific periods covered for each Fund aredisclosed in the table for such Fund.
Each line in the table shows the number of trading days in which the Fund traded within the premium/discount range indicated. The numberof trading days in each premium/discount range is also shown as a percentage of the total number of trading days in the period covered byeach table. All data presented here represents past performance, which cannot be used to predict future results.
166 2 0 1 0 i S h a r e s A n n u a l R e p o r t to S h a r e h o l d e r s
For
per
sona
l use
onl
y
%%TRANSMSG*** Transmitting Job: B82515 PCN: 168000000 ***%%PCMSG|166 |00008|Yes|No|09/17/2010 10:50|0|0|Page is valid, no graphics -- Color: N|
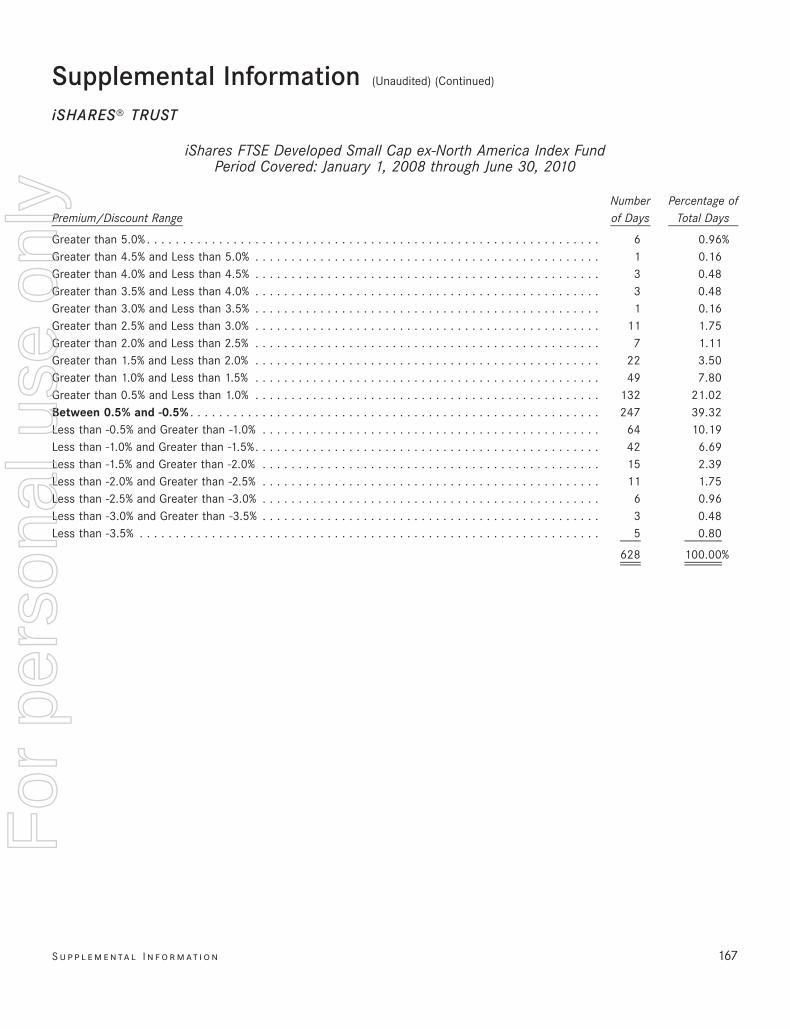
iShares FTSE Developed Small Cap ex-North America Index FundPeriod Covered: January 1, 2008 through June 30, 2010
Premium/Discount RangeNumberof Days
Percentage ofTotal Days
Greater than 5.0% . . . . . . . . . . . . . . . . . . . . . . . . . . . . . . . . . . . . . . . . . . . . . . . . . . . . . . . . . . . . . . . 6 0.96%Greater than 4.5% and Less than 5.0% . . . . . . . . . . . . . . . . . . . . . . . . . . . . . . . . . . . . . . . . . . . . . . . . 1 0.16Greater than 4.0% and Less than 4.5% . . . . . . . . . . . . . . . . . . . . . . . . . . . . . . . . . . . . . . . . . . . . . . . . 3 0.48Greater than 3.5% and Less than 4.0% . . . . . . . . . . . . . . . . . . . . . . . . . . . . . . . . . . . . . . . . . . . . . . . . 3 0.48Greater than 3.0% and Less than 3.5% . . . . . . . . . . . . . . . . . . . . . . . . . . . . . . . . . . . . . . . . . . . . . . . . 1 0.16Greater than 2.5% and Less than 3.0% . . . . . . . . . . . . . . . . . . . . . . . . . . . . . . . . . . . . . . . . . . . . . . . . 11 1.75Greater than 2.0% and Less than 2.5% . . . . . . . . . . . . . . . . . . . . . . . . . . . . . . . . . . . . . . . . . . . . . . . . 7 1.11Greater than 1.5% and Less than 2.0% . . . . . . . . . . . . . . . . . . . . . . . . . . . . . . . . . . . . . . . . . . . . . . . . 22 3.50Greater than 1.0% and Less than 1.5% . . . . . . . . . . . . . . . . . . . . . . . . . . . . . . . . . . . . . . . . . . . . . . . . 49 7.80Greater than 0.5% and Less than 1.0% . . . . . . . . . . . . . . . . . . . . . . . . . . . . . . . . . . . . . . . . . . . . . . . . 132 21.02Between 0.5% and -0.5% . . . . . . . . . . . . . . . . . . . . . . . . . . . . . . . . . . . . . . . . . . . . . . . . . . . . . . . . . 247 39.32Less than -0.5% and Greater than -1.0% . . . . . . . . . . . . . . . . . . . . . . . . . . . . . . . . . . . . . . . . . . . . . . . 64 10.19Less than -1.0% and Greater than -1.5%. . . . . . . . . . . . . . . . . . . . . . . . . . . . . . . . . . . . . . . . . . . . . . . . 42 6.69Less than -1.5% and Greater than -2.0% . . . . . . . . . . . . . . . . . . . . . . . . . . . . . . . . . . . . . . . . . . . . . . . 15 2.39Less than -2.0% and Greater than -2.5% . . . . . . . . . . . . . . . . . . . . . . . . . . . . . . . . . . . . . . . . . . . . . . . 11 1.75Less than -2.5% and Greater than -3.0% . . . . . . . . . . . . . . . . . . . . . . . . . . . . . . . . . . . . . . . . . . . . . . . 6 0.96Less than -3.0% and Greater than -3.5% . . . . . . . . . . . . . . . . . . . . . . . . . . . . . . . . . . . . . . . . . . . . . . . 3 0.48Less than -3.5% . . . . . . . . . . . . . . . . . . . . . . . . . . . . . . . . . . . . . . . . . . . . . . . . . . . . . . . . . . . . . . . . 5 0.80
628 100.00%
S u p p l e m e n ta l I n f o r m at i o n 167
Supplemental Information (Unaudited) (Continued)
iSHARES» TRUST
For
per
sona
l use
onl
y
%%TRANSMSG*** Transmitting Job: B82515 PCN: 169000000 ***%%PCMSG|167 |00008|Yes|No|09/16/2010 20:08|0|0|Page is valid, no graphics -- Color: N|
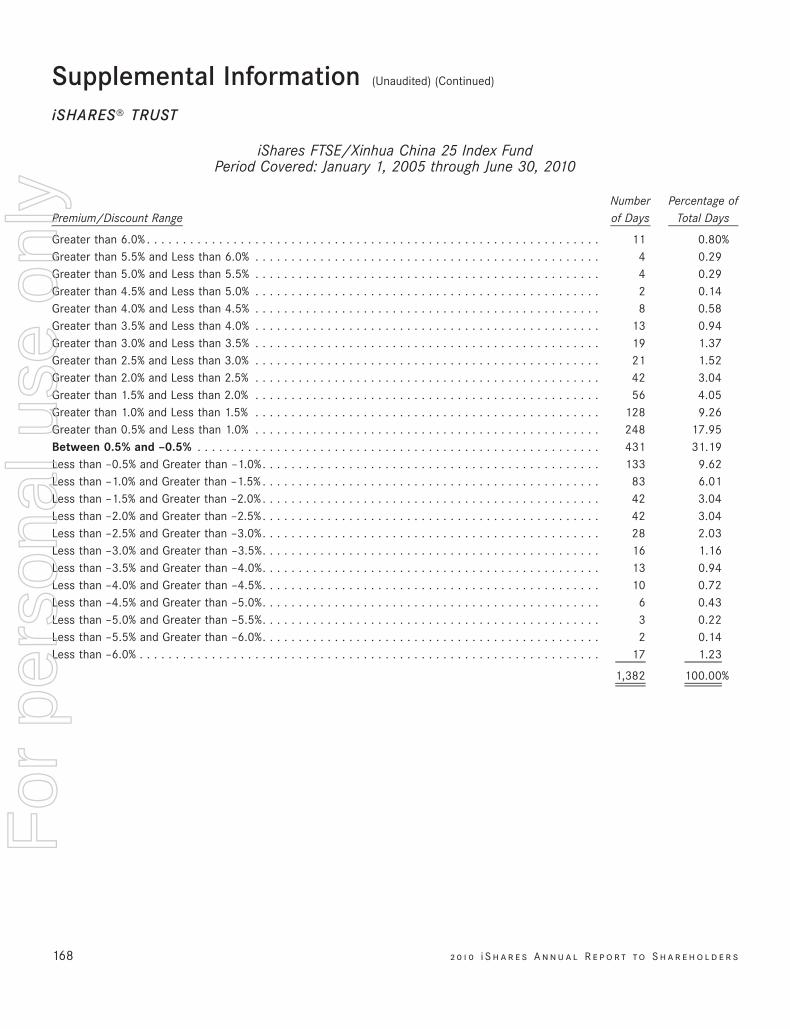
iShares FTSE/Xinhua China 25 Index FundPeriod Covered: January 1, 2005 through June 30, 2010
Premium/Discount RangeNumberof Days
Percentage ofTotal Days
Greater than 6.0% . . . . . . . . . . . . . . . . . . . . . . . . . . . . . . . . . . . . . . . . . . . . . . . . . . . . . . . . . . . . . . . 11 0.80%Greater than 5.5% and Less than 6.0% . . . . . . . . . . . . . . . . . . . . . . . . . . . . . . . . . . . . . . . . . . . . . . . . 4 0.29Greater than 5.0% and Less than 5.5% . . . . . . . . . . . . . . . . . . . . . . . . . . . . . . . . . . . . . . . . . . . . . . . . 4 0.29Greater than 4.5% and Less than 5.0% . . . . . . . . . . . . . . . . . . . . . . . . . . . . . . . . . . . . . . . . . . . . . . . . 2 0.14Greater than 4.0% and Less than 4.5% . . . . . . . . . . . . . . . . . . . . . . . . . . . . . . . . . . . . . . . . . . . . . . . . 8 0.58Greater than 3.5% and Less than 4.0% . . . . . . . . . . . . . . . . . . . . . . . . . . . . . . . . . . . . . . . . . . . . . . . . 13 0.94Greater than 3.0% and Less than 3.5% . . . . . . . . . . . . . . . . . . . . . . . . . . . . . . . . . . . . . . . . . . . . . . . . 19 1.37Greater than 2.5% and Less than 3.0% . . . . . . . . . . . . . . . . . . . . . . . . . . . . . . . . . . . . . . . . . . . . . . . . 21 1.52Greater than 2.0% and Less than 2.5% . . . . . . . . . . . . . . . . . . . . . . . . . . . . . . . . . . . . . . . . . . . . . . . . 42 3.04Greater than 1.5% and Less than 2.0% . . . . . . . . . . . . . . . . . . . . . . . . . . . . . . . . . . . . . . . . . . . . . . . . 56 4.05Greater than 1.0% and Less than 1.5% . . . . . . . . . . . . . . . . . . . . . . . . . . . . . . . . . . . . . . . . . . . . . . . . 128 9.26Greater than 0.5% and Less than 1.0% . . . . . . . . . . . . . . . . . . . . . . . . . . . . . . . . . . . . . . . . . . . . . . . . 248 17.95Between 0.5% and –0.5% . . . . . . . . . . . . . . . . . . . . . . . . . . . . . . . . . . . . . . . . . . . . . . . . . . . . . . . . 431 31.19Less than –0.5% and Greater than –1.0%. . . . . . . . . . . . . . . . . . . . . . . . . . . . . . . . . . . . . . . . . . . . . . . 133 9.62Less than –1.0% and Greater than –1.5% . . . . . . . . . . . . . . . . . . . . . . . . . . . . . . . . . . . . . . . . . . . . . . . 83 6.01Less than –1.5% and Greater than –2.0% . . . . . . . . . . . . . . . . . . . . . . . . . . . . . . . . . . . . . . . . . . . . . . . 42 3.04Less than –2.0% and Greater than –2.5%. . . . . . . . . . . . . . . . . . . . . . . . . . . . . . . . . . . . . . . . . . . . . . . 42 3.04Less than –2.5% and Greater than –3.0%. . . . . . . . . . . . . . . . . . . . . . . . . . . . . . . . . . . . . . . . . . . . . . . 28 2.03Less than –3.0% and Greater than –3.5%. . . . . . . . . . . . . . . . . . . . . . . . . . . . . . . . . . . . . . . . . . . . . . . 16 1.16Less than –3.5% and Greater than –4.0%. . . . . . . . . . . . . . . . . . . . . . . . . . . . . . . . . . . . . . . . . . . . . . . 13 0.94Less than –4.0% and Greater than –4.5%. . . . . . . . . . . . . . . . . . . . . . . . . . . . . . . . . . . . . . . . . . . . . . . 10 0.72Less than –4.5% and Greater than –5.0%. . . . . . . . . . . . . . . . . . . . . . . . . . . . . . . . . . . . . . . . . . . . . . . 6 0.43Less than –5.0% and Greater than –5.5%. . . . . . . . . . . . . . . . . . . . . . . . . . . . . . . . . . . . . . . . . . . . . . . 3 0.22Less than –5.5% and Greater than –6.0%. . . . . . . . . . . . . . . . . . . . . . . . . . . . . . . . . . . . . . . . . . . . . . . 2 0.14Less than –6.0% . . . . . . . . . . . . . . . . . . . . . . . . . . . . . . . . . . . . . . . . . . . . . . . . . . . . . . . . . . . . . . . . 17 1.23
1,382 100.00%
168 2 0 1 0 i S h a r e s A n n u a l R e p o r t to S h a r e h o l d e r s
Supplemental Information (Unaudited) (Continued)
iSHARES» TRUST
For
per
sona
l use
onl
y
%%TRANSMSG*** Transmitting Job: B82515 PCN: 170000000 ***%%PCMSG|168 |00006|Yes|No|09/16/2010 20:08|0|0|Page is valid, no graphics -- Color: N|
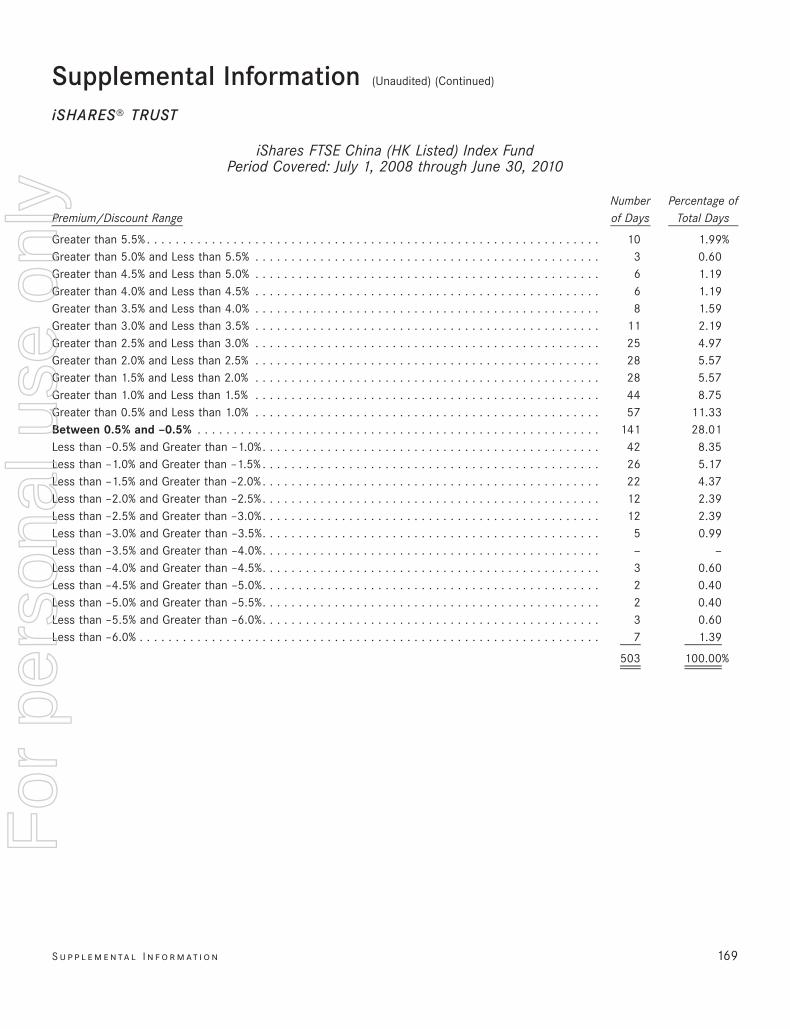
iShares FTSE China (HK Listed) Index FundPeriod Covered: July 1, 2008 through June 30, 2010
Premium/Discount RangeNumberof Days
Percentage ofTotal Days
Greater than 5.5% . . . . . . . . . . . . . . . . . . . . . . . . . . . . . . . . . . . . . . . . . . . . . . . . . . . . . . . . . . . . . . . 10 1.99%Greater than 5.0% and Less than 5.5% . . . . . . . . . . . . . . . . . . . . . . . . . . . . . . . . . . . . . . . . . . . . . . . . 3 0.60Greater than 4.5% and Less than 5.0% . . . . . . . . . . . . . . . . . . . . . . . . . . . . . . . . . . . . . . . . . . . . . . . . 6 1.19Greater than 4.0% and Less than 4.5% . . . . . . . . . . . . . . . . . . . . . . . . . . . . . . . . . . . . . . . . . . . . . . . . 6 1.19Greater than 3.5% and Less than 4.0% . . . . . . . . . . . . . . . . . . . . . . . . . . . . . . . . . . . . . . . . . . . . . . . . 8 1.59Greater than 3.0% and Less than 3.5% . . . . . . . . . . . . . . . . . . . . . . . . . . . . . . . . . . . . . . . . . . . . . . . . 11 2.19Greater than 2.5% and Less than 3.0% . . . . . . . . . . . . . . . . . . . . . . . . . . . . . . . . . . . . . . . . . . . . . . . . 25 4.97Greater than 2.0% and Less than 2.5% . . . . . . . . . . . . . . . . . . . . . . . . . . . . . . . . . . . . . . . . . . . . . . . . 28 5.57Greater than 1.5% and Less than 2.0% . . . . . . . . . . . . . . . . . . . . . . . . . . . . . . . . . . . . . . . . . . . . . . . . 28 5.57Greater than 1.0% and Less than 1.5% . . . . . . . . . . . . . . . . . . . . . . . . . . . . . . . . . . . . . . . . . . . . . . . . 44 8.75Greater than 0.5% and Less than 1.0% . . . . . . . . . . . . . . . . . . . . . . . . . . . . . . . . . . . . . . . . . . . . . . . . 57 11.33Between 0.5% and –0.5% . . . . . . . . . . . . . . . . . . . . . . . . . . . . . . . . . . . . . . . . . . . . . . . . . . . . . . . . 141 28.01Less than –0.5% and Greater than –1.0%. . . . . . . . . . . . . . . . . . . . . . . . . . . . . . . . . . . . . . . . . . . . . . . 42 8.35Less than –1.0% and Greater than –1.5% . . . . . . . . . . . . . . . . . . . . . . . . . . . . . . . . . . . . . . . . . . . . . . . 26 5.17Less than –1.5% and Greater than –2.0% . . . . . . . . . . . . . . . . . . . . . . . . . . . . . . . . . . . . . . . . . . . . . . . 22 4.37Less than –2.0% and Greater than –2.5%. . . . . . . . . . . . . . . . . . . . . . . . . . . . . . . . . . . . . . . . . . . . . . . 12 2.39Less than –2.5% and Greater than –3.0%. . . . . . . . . . . . . . . . . . . . . . . . . . . . . . . . . . . . . . . . . . . . . . . 12 2.39Less than –3.0% and Greater than –3.5%. . . . . . . . . . . . . . . . . . . . . . . . . . . . . . . . . . . . . . . . . . . . . . . 5 0.99Less than –3.5% and Greater than –4.0%. . . . . . . . . . . . . . . . . . . . . . . . . . . . . . . . . . . . . . . . . . . . . . . — —Less than –4.0% and Greater than –4.5%. . . . . . . . . . . . . . . . . . . . . . . . . . . . . . . . . . . . . . . . . . . . . . . 3 0.60Less than –4.5% and Greater than –5.0%. . . . . . . . . . . . . . . . . . . . . . . . . . . . . . . . . . . . . . . . . . . . . . . 2 0.40Less than –5.0% and Greater than –5.5%. . . . . . . . . . . . . . . . . . . . . . . . . . . . . . . . . . . . . . . . . . . . . . . 2 0.40Less than –5.5% and Greater than –6.0%. . . . . . . . . . . . . . . . . . . . . . . . . . . . . . . . . . . . . . . . . . . . . . . 3 0.60Less than –6.0% . . . . . . . . . . . . . . . . . . . . . . . . . . . . . . . . . . . . . . . . . . . . . . . . . . . . . . . . . . . . . . . . 7 1.39
503 100.00%
S u p p l e m e n ta l I n f o r m at i o n 169
Supplemental Information (Unaudited) (Continued)
iSHARES» TRUST
For
per
sona
l use
onl
y
%%TRANSMSG*** Transmitting Job: B82515 PCN: 171000000 ***%%PCMSG|169 |00005|Yes|No|09/16/2010 20:08|0|0|Page is valid, no graphics -- Color: N|
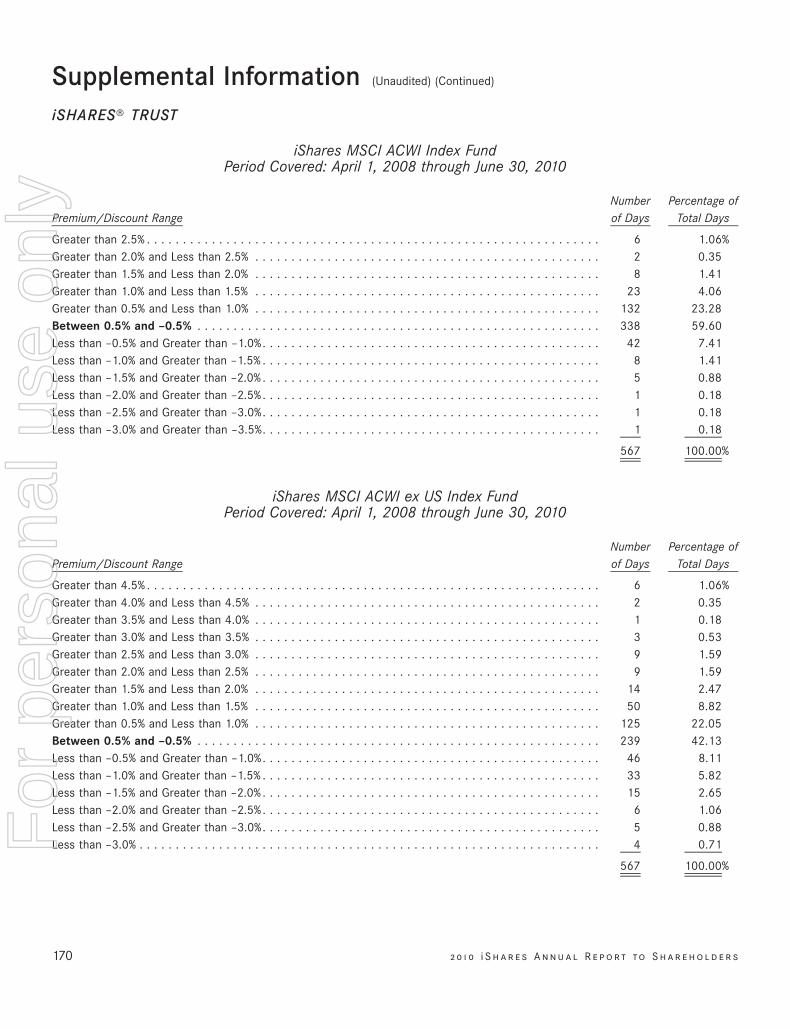
iShares MSCI ACWI Index FundPeriod Covered: April 1, 2008 through June 30, 2010
Premium/Discount RangeNumberof Days
Percentage ofTotal Days
Greater than 2.5% . . . . . . . . . . . . . . . . . . . . . . . . . . . . . . . . . . . . . . . . . . . . . . . . . . . . . . . . . . . . . . . 6 1.06%Greater than 2.0% and Less than 2.5% . . . . . . . . . . . . . . . . . . . . . . . . . . . . . . . . . . . . . . . . . . . . . . . . 2 0.35Greater than 1.5% and Less than 2.0% . . . . . . . . . . . . . . . . . . . . . . . . . . . . . . . . . . . . . . . . . . . . . . . . 8 1.41Greater than 1.0% and Less than 1.5% . . . . . . . . . . . . . . . . . . . . . . . . . . . . . . . . . . . . . . . . . . . . . . . . 23 4.06Greater than 0.5% and Less than 1.0% . . . . . . . . . . . . . . . . . . . . . . . . . . . . . . . . . . . . . . . . . . . . . . . . 132 23.28Between 0.5% and –0.5% . . . . . . . . . . . . . . . . . . . . . . . . . . . . . . . . . . . . . . . . . . . . . . . . . . . . . . . . 338 59.60Less than –0.5% and Greater than –1.0%. . . . . . . . . . . . . . . . . . . . . . . . . . . . . . . . . . . . . . . . . . . . . . . 42 7.41Less than –1.0% and Greater than –1.5% . . . . . . . . . . . . . . . . . . . . . . . . . . . . . . . . . . . . . . . . . . . . . . . 8 1.41Less than –1.5% and Greater than –2.0% . . . . . . . . . . . . . . . . . . . . . . . . . . . . . . . . . . . . . . . . . . . . . . . 5 0.88Less than –2.0% and Greater than –2.5%. . . . . . . . . . . . . . . . . . . . . . . . . . . . . . . . . . . . . . . . . . . . . . . 1 0.18Less than –2.5% and Greater than –3.0%. . . . . . . . . . . . . . . . . . . . . . . . . . . . . . . . . . . . . . . . . . . . . . . 1 0.18Less than –3.0% and Greater than –3.5%. . . . . . . . . . . . . . . . . . . . . . . . . . . . . . . . . . . . . . . . . . . . . . . 1 0.18
567 100.00%
iShares MSCI ACWI ex US Index FundPeriod Covered: April 1, 2008 through June 30, 2010
Premium/Discount RangeNumberof Days
Percentage ofTotal Days
Greater than 4.5% . . . . . . . . . . . . . . . . . . . . . . . . . . . . . . . . . . . . . . . . . . . . . . . . . . . . . . . . . . . . . . . 6 1.06%Greater than 4.0% and Less than 4.5% . . . . . . . . . . . . . . . . . . . . . . . . . . . . . . . . . . . . . . . . . . . . . . . . 2 0.35Greater than 3.5% and Less than 4.0% . . . . . . . . . . . . . . . . . . . . . . . . . . . . . . . . . . . . . . . . . . . . . . . . 1 0.18Greater than 3.0% and Less than 3.5% . . . . . . . . . . . . . . . . . . . . . . . . . . . . . . . . . . . . . . . . . . . . . . . . 3 0.53Greater than 2.5% and Less than 3.0% . . . . . . . . . . . . . . . . . . . . . . . . . . . . . . . . . . . . . . . . . . . . . . . . 9 1.59Greater than 2.0% and Less than 2.5% . . . . . . . . . . . . . . . . . . . . . . . . . . . . . . . . . . . . . . . . . . . . . . . . 9 1.59Greater than 1.5% and Less than 2.0% . . . . . . . . . . . . . . . . . . . . . . . . . . . . . . . . . . . . . . . . . . . . . . . . 14 2.47Greater than 1.0% and Less than 1.5% . . . . . . . . . . . . . . . . . . . . . . . . . . . . . . . . . . . . . . . . . . . . . . . . 50 8.82Greater than 0.5% and Less than 1.0% . . . . . . . . . . . . . . . . . . . . . . . . . . . . . . . . . . . . . . . . . . . . . . . . 125 22.05Between 0.5% and –0.5% . . . . . . . . . . . . . . . . . . . . . . . . . . . . . . . . . . . . . . . . . . . . . . . . . . . . . . . . 239 42.13Less than –0.5% and Greater than –1.0%. . . . . . . . . . . . . . . . . . . . . . . . . . . . . . . . . . . . . . . . . . . . . . . 46 8.11Less than –1.0% and Greater than –1.5% . . . . . . . . . . . . . . . . . . . . . . . . . . . . . . . . . . . . . . . . . . . . . . . 33 5.82Less than –1.5% and Greater than –2.0% . . . . . . . . . . . . . . . . . . . . . . . . . . . . . . . . . . . . . . . . . . . . . . . 15 2.65Less than –2.0% and Greater than –2.5%. . . . . . . . . . . . . . . . . . . . . . . . . . . . . . . . . . . . . . . . . . . . . . . 6 1.06Less than –2.5% and Greater than –3.0%. . . . . . . . . . . . . . . . . . . . . . . . . . . . . . . . . . . . . . . . . . . . . . . 5 0.88Less than –3.0% . . . . . . . . . . . . . . . . . . . . . . . . . . . . . . . . . . . . . . . . . . . . . . . . . . . . . . . . . . . . . . . . 4 0.71
567 100.00%
170 2 0 1 0 i S h a r e s A n n u a l R e p o r t to S h a r e h o l d e r s
Supplemental Information (Unaudited) (Continued)
iSHARES» TRUST
For
per
sona
l use
onl
y
%%TRANSMSG*** Transmitting Job: B82515 PCN: 172000000 ***%%PCMSG|170 |00009|Yes|No|09/16/2010 20:08|0|0|Page is valid, no graphics -- Color: N|
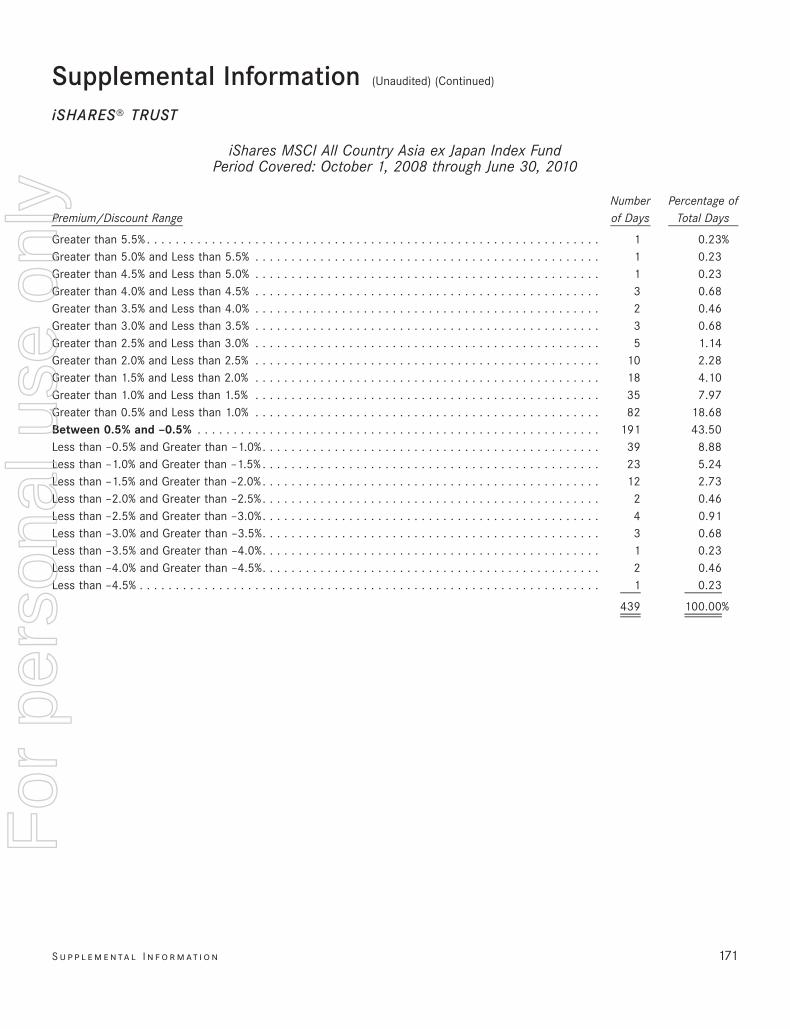
iShares MSCI All Country Asia ex Japan Index FundPeriod Covered: October 1, 2008 through June 30, 2010
Premium/Discount RangeNumberof Days
Percentage ofTotal Days
Greater than 5.5% . . . . . . . . . . . . . . . . . . . . . . . . . . . . . . . . . . . . . . . . . . . . . . . . . . . . . . . . . . . . . . . 1 0.23%Greater than 5.0% and Less than 5.5% . . . . . . . . . . . . . . . . . . . . . . . . . . . . . . . . . . . . . . . . . . . . . . . . 1 0.23Greater than 4.5% and Less than 5.0% . . . . . . . . . . . . . . . . . . . . . . . . . . . . . . . . . . . . . . . . . . . . . . . . 1 0.23Greater than 4.0% and Less than 4.5% . . . . . . . . . . . . . . . . . . . . . . . . . . . . . . . . . . . . . . . . . . . . . . . . 3 0.68Greater than 3.5% and Less than 4.0% . . . . . . . . . . . . . . . . . . . . . . . . . . . . . . . . . . . . . . . . . . . . . . . . 2 0.46Greater than 3.0% and Less than 3.5% . . . . . . . . . . . . . . . . . . . . . . . . . . . . . . . . . . . . . . . . . . . . . . . . 3 0.68Greater than 2.5% and Less than 3.0% . . . . . . . . . . . . . . . . . . . . . . . . . . . . . . . . . . . . . . . . . . . . . . . . 5 1.14Greater than 2.0% and Less than 2.5% . . . . . . . . . . . . . . . . . . . . . . . . . . . . . . . . . . . . . . . . . . . . . . . . 10 2.28Greater than 1.5% and Less than 2.0% . . . . . . . . . . . . . . . . . . . . . . . . . . . . . . . . . . . . . . . . . . . . . . . . 18 4.10Greater than 1.0% and Less than 1.5% . . . . . . . . . . . . . . . . . . . . . . . . . . . . . . . . . . . . . . . . . . . . . . . . 35 7.97Greater than 0.5% and Less than 1.0% . . . . . . . . . . . . . . . . . . . . . . . . . . . . . . . . . . . . . . . . . . . . . . . . 82 18.68Between 0.5% and –0.5% . . . . . . . . . . . . . . . . . . . . . . . . . . . . . . . . . . . . . . . . . . . . . . . . . . . . . . . . 191 43.50Less than –0.5% and Greater than –1.0%. . . . . . . . . . . . . . . . . . . . . . . . . . . . . . . . . . . . . . . . . . . . . . . 39 8.88Less than –1.0% and Greater than –1.5% . . . . . . . . . . . . . . . . . . . . . . . . . . . . . . . . . . . . . . . . . . . . . . . 23 5.24Less than –1.5% and Greater than –2.0% . . . . . . . . . . . . . . . . . . . . . . . . . . . . . . . . . . . . . . . . . . . . . . . 12 2.73Less than –2.0% and Greater than –2.5%. . . . . . . . . . . . . . . . . . . . . . . . . . . . . . . . . . . . . . . . . . . . . . . 2 0.46Less than –2.5% and Greater than –3.0%. . . . . . . . . . . . . . . . . . . . . . . . . . . . . . . . . . . . . . . . . . . . . . . 4 0.91Less than –3.0% and Greater than –3.5%. . . . . . . . . . . . . . . . . . . . . . . . . . . . . . . . . . . . . . . . . . . . . . . 3 0.68Less than –3.5% and Greater than –4.0%. . . . . . . . . . . . . . . . . . . . . . . . . . . . . . . . . . . . . . . . . . . . . . . 1 0.23Less than –4.0% and Greater than –4.5%. . . . . . . . . . . . . . . . . . . . . . . . . . . . . . . . . . . . . . . . . . . . . . . 2 0.46Less than –4.5% . . . . . . . . . . . . . . . . . . . . . . . . . . . . . . . . . . . . . . . . . . . . . . . . . . . . . . . . . . . . . . . . 1 0.23
439 100.00%
S u p p l e m e n ta l I n f o r m at i o n 171
Supplemental Information (Unaudited) (Continued)
iSHARES» TRUST
For
per
sona
l use
onl
y
%%TRANSMSG*** Transmitting Job: B82515 PCN: 173000000 ***%%PCMSG|171 |00007|Yes|No|09/16/2010 20:08|0|0|Page is valid, no graphics -- Color: N|
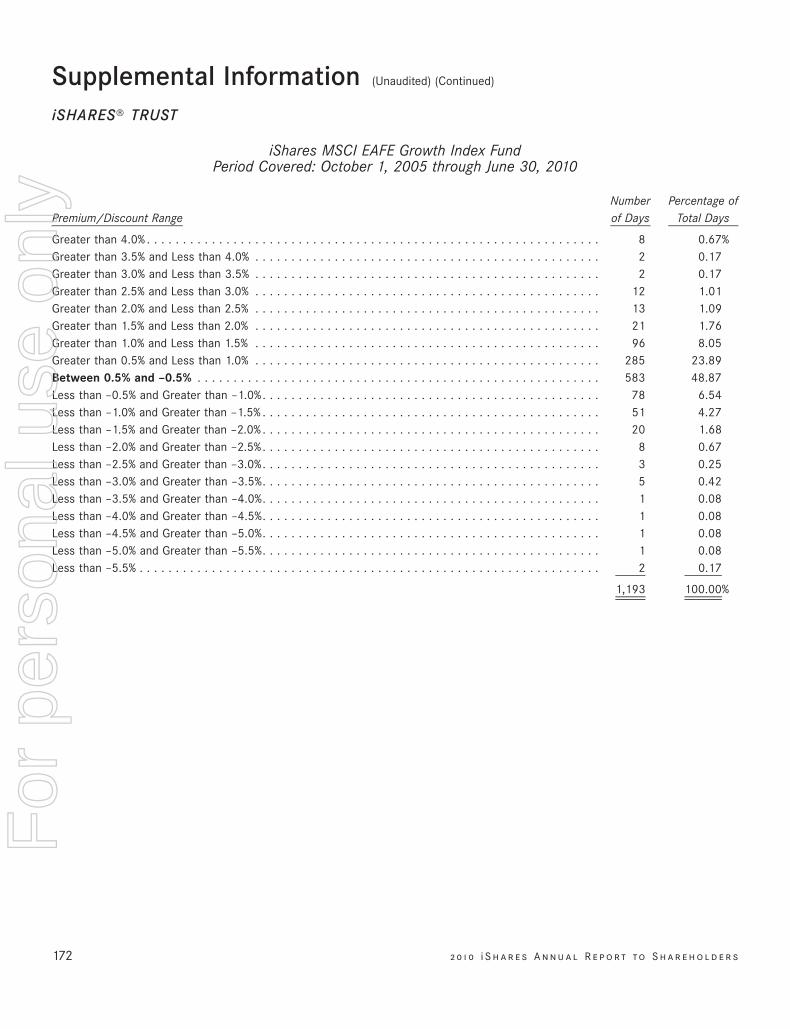
iShares MSCI EAFE Growth Index FundPeriod Covered: October 1, 2005 through June 30, 2010
Premium/Discount RangeNumberof Days
Percentage ofTotal Days
Greater than 4.0% . . . . . . . . . . . . . . . . . . . . . . . . . . . . . . . . . . . . . . . . . . . . . . . . . . . . . . . . . . . . . . . 8 0.67%Greater than 3.5% and Less than 4.0% . . . . . . . . . . . . . . . . . . . . . . . . . . . . . . . . . . . . . . . . . . . . . . . . 2 0.17Greater than 3.0% and Less than 3.5% . . . . . . . . . . . . . . . . . . . . . . . . . . . . . . . . . . . . . . . . . . . . . . . . 2 0.17Greater than 2.5% and Less than 3.0% . . . . . . . . . . . . . . . . . . . . . . . . . . . . . . . . . . . . . . . . . . . . . . . . 12 1.01Greater than 2.0% and Less than 2.5% . . . . . . . . . . . . . . . . . . . . . . . . . . . . . . . . . . . . . . . . . . . . . . . . 13 1.09Greater than 1.5% and Less than 2.0% . . . . . . . . . . . . . . . . . . . . . . . . . . . . . . . . . . . . . . . . . . . . . . . . 21 1.76Greater than 1.0% and Less than 1.5% . . . . . . . . . . . . . . . . . . . . . . . . . . . . . . . . . . . . . . . . . . . . . . . . 96 8.05Greater than 0.5% and Less than 1.0% . . . . . . . . . . . . . . . . . . . . . . . . . . . . . . . . . . . . . . . . . . . . . . . . 285 23.89Between 0.5% and –0.5% . . . . . . . . . . . . . . . . . . . . . . . . . . . . . . . . . . . . . . . . . . . . . . . . . . . . . . . . 583 48.87Less than –0.5% and Greater than –1.0%. . . . . . . . . . . . . . . . . . . . . . . . . . . . . . . . . . . . . . . . . . . . . . . 78 6.54Less than –1.0% and Greater than –1.5% . . . . . . . . . . . . . . . . . . . . . . . . . . . . . . . . . . . . . . . . . . . . . . . 51 4.27Less than –1.5% and Greater than –2.0% . . . . . . . . . . . . . . . . . . . . . . . . . . . . . . . . . . . . . . . . . . . . . . . 20 1.68Less than –2.0% and Greater than –2.5%. . . . . . . . . . . . . . . . . . . . . . . . . . . . . . . . . . . . . . . . . . . . . . . 8 0.67Less than –2.5% and Greater than –3.0%. . . . . . . . . . . . . . . . . . . . . . . . . . . . . . . . . . . . . . . . . . . . . . . 3 0.25Less than –3.0% and Greater than –3.5%. . . . . . . . . . . . . . . . . . . . . . . . . . . . . . . . . . . . . . . . . . . . . . . 5 0.42Less than –3.5% and Greater than –4.0%. . . . . . . . . . . . . . . . . . . . . . . . . . . . . . . . . . . . . . . . . . . . . . . 1 0.08Less than –4.0% and Greater than –4.5%. . . . . . . . . . . . . . . . . . . . . . . . . . . . . . . . . . . . . . . . . . . . . . . 1 0.08Less than –4.5% and Greater than –5.0%. . . . . . . . . . . . . . . . . . . . . . . . . . . . . . . . . . . . . . . . . . . . . . . 1 0.08Less than –5.0% and Greater than –5.5%. . . . . . . . . . . . . . . . . . . . . . . . . . . . . . . . . . . . . . . . . . . . . . . 1 0.08Less than –5.5% . . . . . . . . . . . . . . . . . . . . . . . . . . . . . . . . . . . . . . . . . . . . . . . . . . . . . . . . . . . . . . . . 2 0.17
1,193 100.00%
172 2 0 1 0 i S h a r e s A n n u a l R e p o r t to S h a r e h o l d e r s
Supplemental Information (Unaudited) (Continued)
iSHARES» TRUST
For
per
sona
l use
onl
y
%%TRANSMSG*** Transmitting Job: B82515 PCN: 174000000 ***%%PCMSG|172 |00007|Yes|No|09/16/2010 20:08|0|0|Page is valid, no graphics -- Color: N|
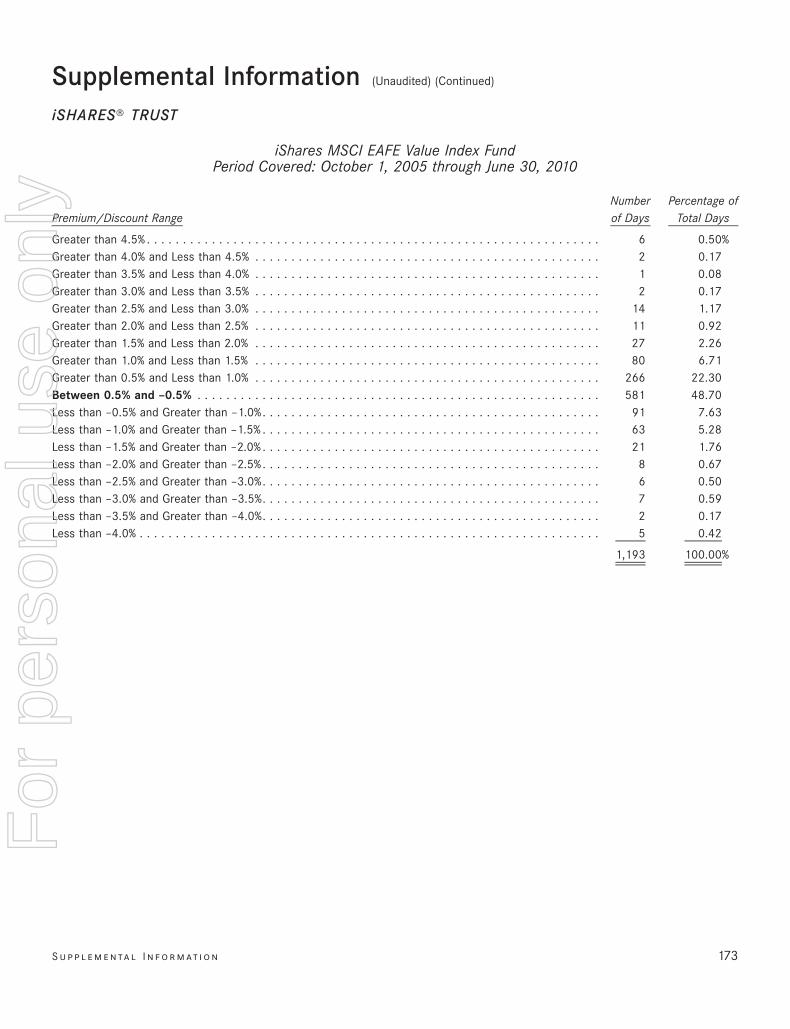
iShares MSCI EAFE Value Index FundPeriod Covered: October 1, 2005 through June 30, 2010
Premium/Discount RangeNumberof Days
Percentage ofTotal Days
Greater than 4.5% . . . . . . . . . . . . . . . . . . . . . . . . . . . . . . . . . . . . . . . . . . . . . . . . . . . . . . . . . . . . . . . 6 0.50%Greater than 4.0% and Less than 4.5% . . . . . . . . . . . . . . . . . . . . . . . . . . . . . . . . . . . . . . . . . . . . . . . . 2 0.17Greater than 3.5% and Less than 4.0% . . . . . . . . . . . . . . . . . . . . . . . . . . . . . . . . . . . . . . . . . . . . . . . . 1 0.08Greater than 3.0% and Less than 3.5% . . . . . . . . . . . . . . . . . . . . . . . . . . . . . . . . . . . . . . . . . . . . . . . . 2 0.17Greater than 2.5% and Less than 3.0% . . . . . . . . . . . . . . . . . . . . . . . . . . . . . . . . . . . . . . . . . . . . . . . . 14 1.17Greater than 2.0% and Less than 2.5% . . . . . . . . . . . . . . . . . . . . . . . . . . . . . . . . . . . . . . . . . . . . . . . . 11 0.92Greater than 1.5% and Less than 2.0% . . . . . . . . . . . . . . . . . . . . . . . . . . . . . . . . . . . . . . . . . . . . . . . . 27 2.26Greater than 1.0% and Less than 1.5% . . . . . . . . . . . . . . . . . . . . . . . . . . . . . . . . . . . . . . . . . . . . . . . . 80 6.71Greater than 0.5% and Less than 1.0% . . . . . . . . . . . . . . . . . . . . . . . . . . . . . . . . . . . . . . . . . . . . . . . . 266 22.30Between 0.5% and –0.5% . . . . . . . . . . . . . . . . . . . . . . . . . . . . . . . . . . . . . . . . . . . . . . . . . . . . . . . . 581 48.70Less than –0.5% and Greater than –1.0%. . . . . . . . . . . . . . . . . . . . . . . . . . . . . . . . . . . . . . . . . . . . . . . 91 7.63Less than –1.0% and Greater than –1.5% . . . . . . . . . . . . . . . . . . . . . . . . . . . . . . . . . . . . . . . . . . . . . . . 63 5.28Less than –1.5% and Greater than –2.0% . . . . . . . . . . . . . . . . . . . . . . . . . . . . . . . . . . . . . . . . . . . . . . . 21 1.76Less than –2.0% and Greater than –2.5%. . . . . . . . . . . . . . . . . . . . . . . . . . . . . . . . . . . . . . . . . . . . . . . 8 0.67Less than –2.5% and Greater than –3.0%. . . . . . . . . . . . . . . . . . . . . . . . . . . . . . . . . . . . . . . . . . . . . . . 6 0.50Less than –3.0% and Greater than –3.5%. . . . . . . . . . . . . . . . . . . . . . . . . . . . . . . . . . . . . . . . . . . . . . . 7 0.59Less than –3.5% and Greater than –4.0%. . . . . . . . . . . . . . . . . . . . . . . . . . . . . . . . . . . . . . . . . . . . . . . 2 0.17Less than –4.0% . . . . . . . . . . . . . . . . . . . . . . . . . . . . . . . . . . . . . . . . . . . . . . . . . . . . . . . . . . . . . . . . 5 0.42
1,193 100.00%
S u p p l e m e n ta l I n f o r m at i o n 173
Supplemental Information (Unaudited) (Continued)
iSHARES» TRUST
For
per
sona
l use
onl
y
%%TRANSMSG*** Transmitting Job: B82515 PCN: 175000000 ***%%PCMSG|173 |00008|Yes|No|09/16/2010 20:08|0|0|Page is valid, no graphics -- Color: N|
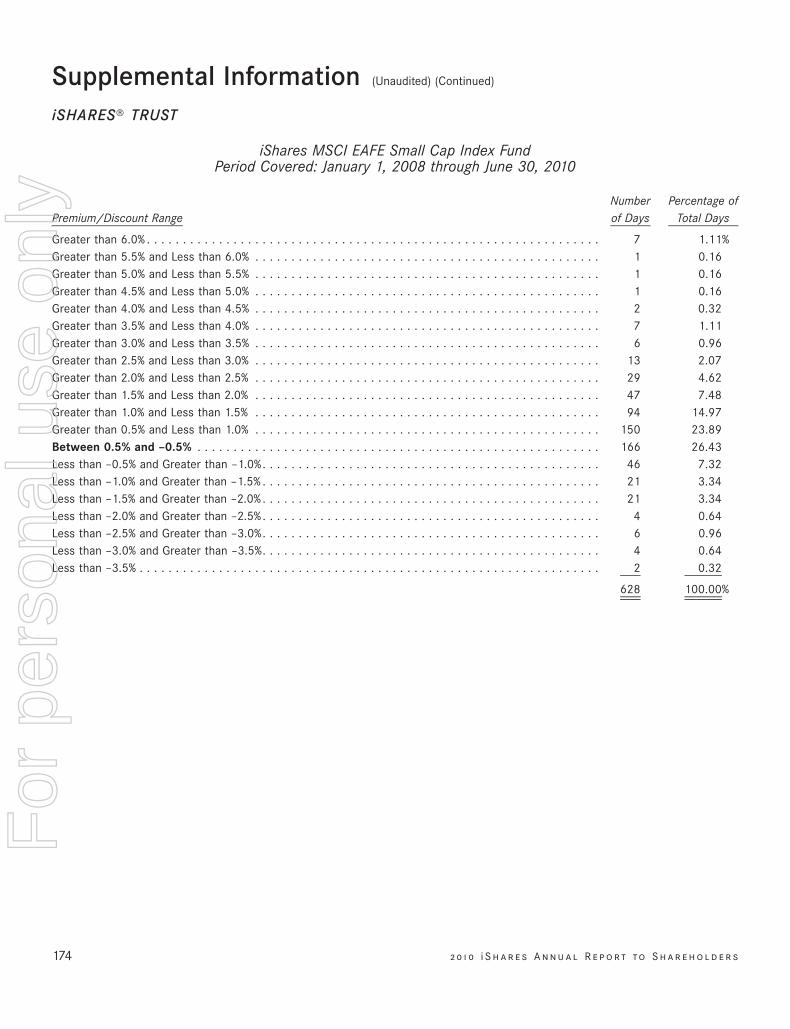
iShares MSCI EAFE Small Cap Index FundPeriod Covered: January 1, 2008 through June 30, 2010
Premium/Discount RangeNumberof Days
Percentage ofTotal Days
Greater than 6.0% . . . . . . . . . . . . . . . . . . . . . . . . . . . . . . . . . . . . . . . . . . . . . . . . . . . . . . . . . . . . . . . 7 1.11%Greater than 5.5% and Less than 6.0% . . . . . . . . . . . . . . . . . . . . . . . . . . . . . . . . . . . . . . . . . . . . . . . . 1 0.16Greater than 5.0% and Less than 5.5% . . . . . . . . . . . . . . . . . . . . . . . . . . . . . . . . . . . . . . . . . . . . . . . . 1 0.16Greater than 4.5% and Less than 5.0% . . . . . . . . . . . . . . . . . . . . . . . . . . . . . . . . . . . . . . . . . . . . . . . . 1 0.16Greater than 4.0% and Less than 4.5% . . . . . . . . . . . . . . . . . . . . . . . . . . . . . . . . . . . . . . . . . . . . . . . . 2 0.32Greater than 3.5% and Less than 4.0% . . . . . . . . . . . . . . . . . . . . . . . . . . . . . . . . . . . . . . . . . . . . . . . . 7 1.11Greater than 3.0% and Less than 3.5% . . . . . . . . . . . . . . . . . . . . . . . . . . . . . . . . . . . . . . . . . . . . . . . . 6 0.96Greater than 2.5% and Less than 3.0% . . . . . . . . . . . . . . . . . . . . . . . . . . . . . . . . . . . . . . . . . . . . . . . . 13 2.07Greater than 2.0% and Less than 2.5% . . . . . . . . . . . . . . . . . . . . . . . . . . . . . . . . . . . . . . . . . . . . . . . . 29 4.62Greater than 1.5% and Less than 2.0% . . . . . . . . . . . . . . . . . . . . . . . . . . . . . . . . . . . . . . . . . . . . . . . . 47 7.48Greater than 1.0% and Less than 1.5% . . . . . . . . . . . . . . . . . . . . . . . . . . . . . . . . . . . . . . . . . . . . . . . . 94 14.97Greater than 0.5% and Less than 1.0% . . . . . . . . . . . . . . . . . . . . . . . . . . . . . . . . . . . . . . . . . . . . . . . . 150 23.89Between 0.5% and –0.5% . . . . . . . . . . . . . . . . . . . . . . . . . . . . . . . . . . . . . . . . . . . . . . . . . . . . . . . . 166 26.43Less than –0.5% and Greater than –1.0%. . . . . . . . . . . . . . . . . . . . . . . . . . . . . . . . . . . . . . . . . . . . . . . 46 7.32Less than –1.0% and Greater than –1.5% . . . . . . . . . . . . . . . . . . . . . . . . . . . . . . . . . . . . . . . . . . . . . . . 21 3.34Less than –1.5% and Greater than –2.0% . . . . . . . . . . . . . . . . . . . . . . . . . . . . . . . . . . . . . . . . . . . . . . . 21 3.34Less than –2.0% and Greater than –2.5%. . . . . . . . . . . . . . . . . . . . . . . . . . . . . . . . . . . . . . . . . . . . . . . 4 0.64Less than –2.5% and Greater than –3.0%. . . . . . . . . . . . . . . . . . . . . . . . . . . . . . . . . . . . . . . . . . . . . . . 6 0.96Less than –3.0% and Greater than –3.5%. . . . . . . . . . . . . . . . . . . . . . . . . . . . . . . . . . . . . . . . . . . . . . . 4 0.64Less than –3.5% . . . . . . . . . . . . . . . . . . . . . . . . . . . . . . . . . . . . . . . . . . . . . . . . . . . . . . . . . . . . . . . . 2 0.32
628 100.00%
174 2 0 1 0 i S h a r e s A n n u a l R e p o r t to S h a r e h o l d e r s
Supplemental Information (Unaudited) (Continued)
iSHARES» TRUST
For
per
sona
l use
onl
y
%%TRANSMSG*** Transmitting Job: B82515 PCN: 176000000 ***%%PCMSG|174 |00007|Yes|No|09/16/2010 20:08|0|0|Page is valid, no graphics -- Color: N|
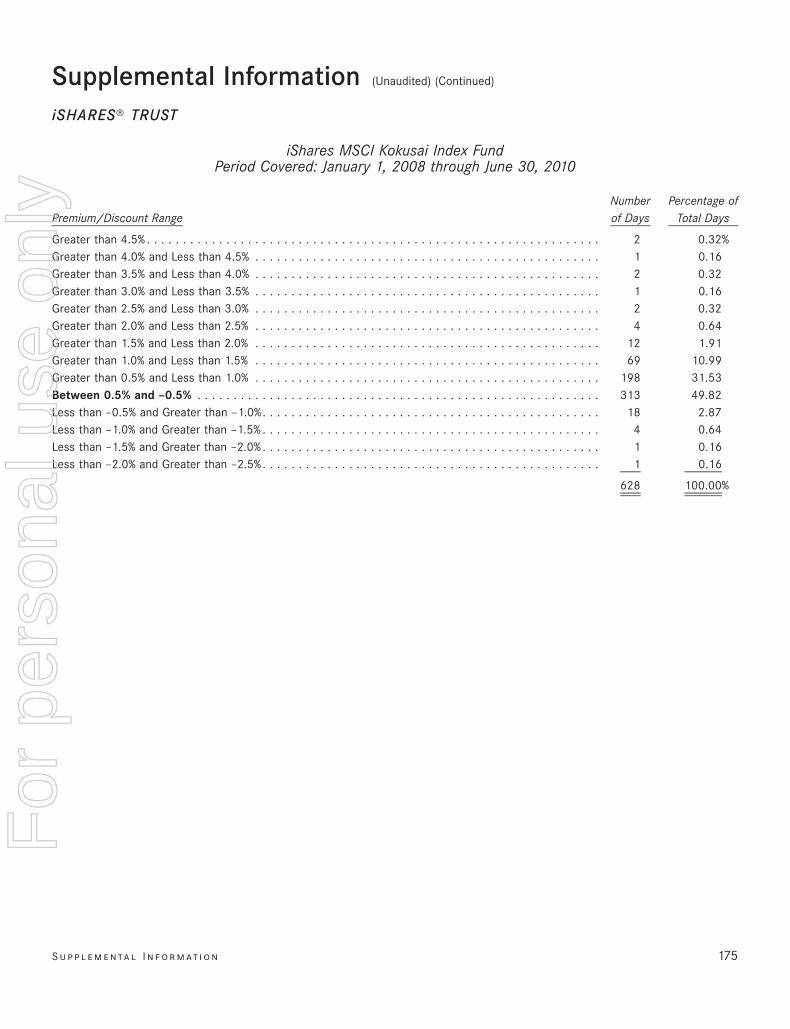
iShares MSCI Kokusai Index FundPeriod Covered: January 1, 2008 through June 30, 2010
Premium/Discount RangeNumberof Days
Percentage ofTotal Days
Greater than 4.5% . . . . . . . . . . . . . . . . . . . . . . . . . . . . . . . . . . . . . . . . . . . . . . . . . . . . . . . . . . . . . . . 2 0.32%Greater than 4.0% and Less than 4.5% . . . . . . . . . . . . . . . . . . . . . . . . . . . . . . . . . . . . . . . . . . . . . . . . 1 0.16Greater than 3.5% and Less than 4.0% . . . . . . . . . . . . . . . . . . . . . . . . . . . . . . . . . . . . . . . . . . . . . . . . 2 0.32Greater than 3.0% and Less than 3.5% . . . . . . . . . . . . . . . . . . . . . . . . . . . . . . . . . . . . . . . . . . . . . . . . 1 0.16Greater than 2.5% and Less than 3.0% . . . . . . . . . . . . . . . . . . . . . . . . . . . . . . . . . . . . . . . . . . . . . . . . 2 0.32Greater than 2.0% and Less than 2.5% . . . . . . . . . . . . . . . . . . . . . . . . . . . . . . . . . . . . . . . . . . . . . . . . 4 0.64Greater than 1.5% and Less than 2.0% . . . . . . . . . . . . . . . . . . . . . . . . . . . . . . . . . . . . . . . . . . . . . . . . 12 1.91Greater than 1.0% and Less than 1.5% . . . . . . . . . . . . . . . . . . . . . . . . . . . . . . . . . . . . . . . . . . . . . . . . 69 10.99Greater than 0.5% and Less than 1.0% . . . . . . . . . . . . . . . . . . . . . . . . . . . . . . . . . . . . . . . . . . . . . . . . 198 31.53Between 0.5% and –0.5% . . . . . . . . . . . . . . . . . . . . . . . . . . . . . . . . . . . . . . . . . . . . . . . . . . . . . . . . 313 49.82Less than –0.5% and Greater than –1.0%. . . . . . . . . . . . . . . . . . . . . . . . . . . . . . . . . . . . . . . . . . . . . . . 18 2.87Less than –1.0% and Greater than –1.5% . . . . . . . . . . . . . . . . . . . . . . . . . . . . . . . . . . . . . . . . . . . . . . . 4 0.64Less than –1.5% and Greater than –2.0% . . . . . . . . . . . . . . . . . . . . . . . . . . . . . . . . . . . . . . . . . . . . . . . 1 0.16Less than –2.0% and Greater than –2.5%. . . . . . . . . . . . . . . . . . . . . . . . . . . . . . . . . . . . . . . . . . . . . . . 1 0.16
628 100.00%
S u p p l e m e n ta l I n f o r m at i o n 175
Supplemental Information (Unaudited) (Continued)
iSHARES» TRUST
For
per
sona
l use
onl
y
%%TRANSMSG*** Transmitting Job: B82515 PCN: 177000000 ***%%PCMSG|175 |00007|Yes|No|09/16/2010 20:08|0|0|Page is valid, no graphics -- Color: N|
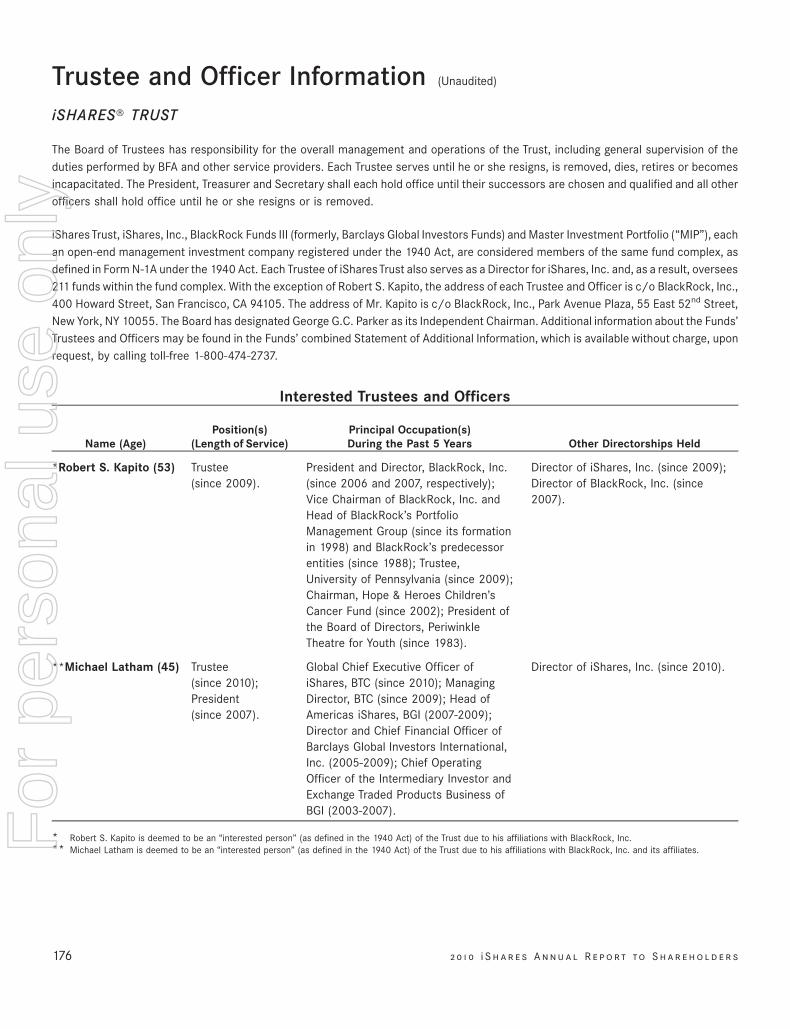
Trustee and Officer Information (Unaudited)
iSHARES» TRUST
The Board of Trustees has responsibility for the overall management and operations of the Trust, including general supervision of theduties performed by BFA and other service providers. Each Trustee serves until he or she resigns, is removed, dies, retires or becomesincapacitated. The President, Treasurer and Secretary shall each hold office until their successors are chosen and qualified and all otherofficers shall hold office until he or she resigns or is removed.
iShares Trust, iShares, Inc., BlackRock Funds III (formerly, Barclays Global Investors Funds) and Master Investment Portfolio (“MIP”), eachan open-end management investment company registered under the 1940 Act, are considered members of the same fund complex, asdefined in Form N-1A under the 1940 Act. Each Trustee of iShares Trust also serves as a Director for iShares, Inc. and, as a result, oversees211 funds within the fund complex. With the exception of Robert S. Kapito, the address of each Trustee and Officer is c/o BlackRock, Inc.,400 Howard Street, San Francisco, CA 94105. The address of Mr. Kapito is c/o BlackRock, Inc., Park Avenue Plaza, 55 East 52nd Street,New York, NY 10055. The Board has designated George G.C. Parker as its Independent Chairman. Additional information about the Funds’Trustees and Officers may be found in the Funds’ combined Statement of Additional Information, which is available without charge, uponrequest, by calling toll-free 1-800-474-2737.
Name (Age)Position(s)
(Length of Service)Principal Occupation(s)During the Past 5 Years Other Directorships Held
Interested Trustees and Officers
*Robert S. Kapito (53) Trustee(since 2009).
President and Director, BlackRock, Inc.(since 2006 and 2007, respectively);Vice Chairman of BlackRock, Inc. andHead of BlackRock’s PortfolioManagement Group (since its formationin 1998) and BlackRock’s predecessorentities (since 1988); Trustee,University of Pennsylvania (since 2009);Chairman, Hope & Heroes Children’sCancer Fund (since 2002); President ofthe Board of Directors, PeriwinkleTheatre for Youth (since 1983).
Director of iShares, Inc. (since 2009);Director of BlackRock, Inc. (since2007).
**Michael Latham (45) Trustee(since 2010);President(since 2007).
Global Chief Executive Officer ofiShares, BTC (since 2010); ManagingDirector, BTC (since 2009); Head ofAmericas iShares, BGI (2007-2009);Director and Chief Financial Officer ofBarclays Global Investors International,Inc. (2005-2009); Chief OperatingOfficer of the Intermediary Investor andExchange Traded Products Business ofBGI (2003-2007).
Director of iShares, Inc. (since 2010).
* Robert S. Kapito is deemed to be an “interested person” (as defined in the 1940 Act) of the Trust due to his affiliations with BlackRock, Inc.** Michael Latham is deemed to be an “interested person” (as defined in the 1940 Act) of the Trust due to his affiliations with BlackRock, Inc. and its affiliates.
176 2 0 1 0 i S h a r e s A n n u a l R e p o r t to S h a r e h o l d e r s
For
per
sona
l use
onl
y
%%TRANSMSG*** Transmitting Job: B82515 PCN: 178000000 ***%%PCMSG|176 |00007|Yes|No|09/16/2010 20:08|0|0|Page is valid, no graphics -- Color: N|
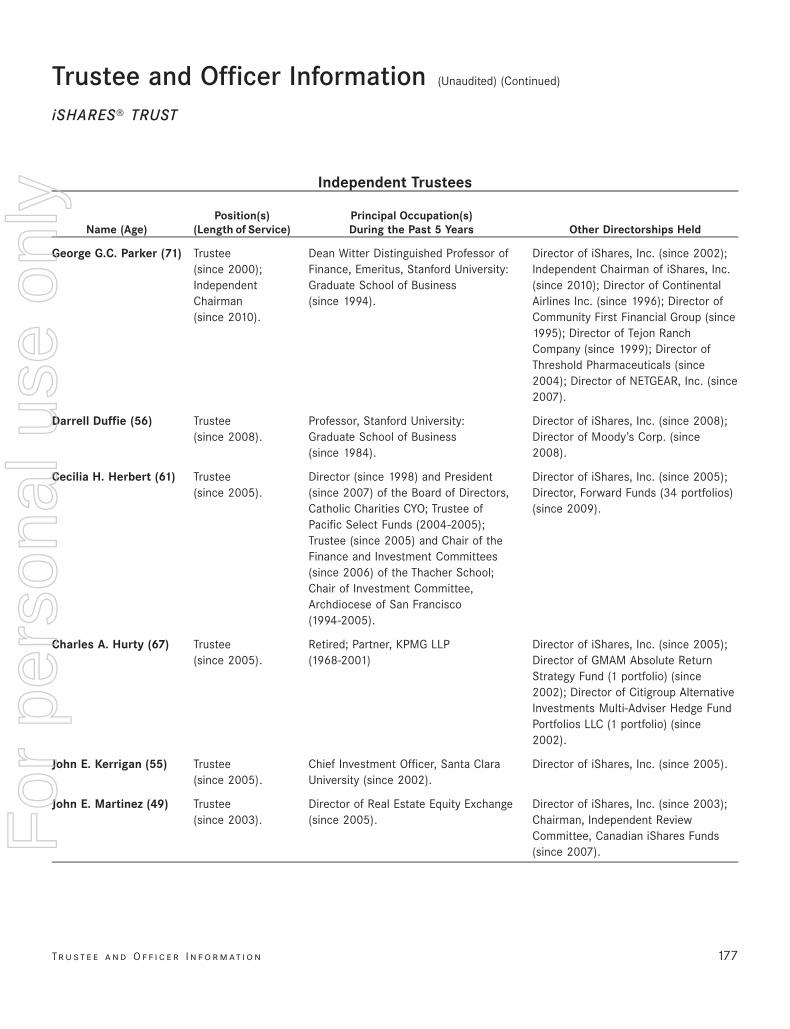
Name (Age)Position(s)
(Length of Service)Principal Occupation(s)During the Past 5 Years Other Directorships Held
Independent Trustees
George G.C. Parker (71) Trustee(since 2000);IndependentChairman(since 2010).
Dean Witter Distinguished Professor ofFinance, Emeritus, Stanford University:Graduate School of Business(since 1994).
Director of iShares, Inc. (since 2002);Independent Chairman of iShares, Inc.(since 2010); Director of ContinentalAirlines Inc. (since 1996); Director ofCommunity First Financial Group (since1995); Director of Tejon RanchCompany (since 1999); Director ofThreshold Pharmaceuticals (since2004); Director of NETGEAR, Inc. (since2007).
Darrell Duffie (56) Trustee(since 2008).
Professor, Stanford University:Graduate School of Business(since 1984).
Director of iShares, Inc. (since 2008);Director of Moody’s Corp. (since2008).
Cecilia H. Herbert (61) Trustee(since 2005).
Director (since 1998) and President(since 2007) of the Board of Directors,Catholic Charities CYO; Trustee ofPacific Select Funds (2004-2005);Trustee (since 2005) and Chair of theFinance and Investment Committees(since 2006) of the Thacher School;Chair of Investment Committee,Archdiocese of San Francisco(1994-2005).
Director of iShares, Inc. (since 2005);Director, Forward Funds (34 portfolios)(since 2009).
Charles A. Hurty (67) Trustee(since 2005).
Retired; Partner, KPMG LLP(1968-2001)
Director of iShares, Inc. (since 2005);Director of GMAM Absolute ReturnStrategy Fund (1 portfolio) (since2002); Director of Citigroup AlternativeInvestments Multi-Adviser Hedge FundPortfolios LLC (1 portfolio) (since2002).
John E. Kerrigan (55) Trustee(since 2005).
Chief Investment Officer, Santa ClaraUniversity (since 2002).
Director of iShares, Inc. (since 2005).
John E. Martinez (49) Trustee(since 2003).
Director of Real Estate Equity Exchange(since 2005).
Director of iShares, Inc. (since 2003);Chairman, Independent ReviewCommittee, Canadian iShares Funds(since 2007).
Tr u s t e e a n d O f f i c e r I n f o r m at i o n 177
Trustee and Officer Information (Unaudited) (Continued)
iSHARES» TRUST
For
per
sona
l use
onl
y
%%TRANSMSG*** Transmitting Job: B82515 PCN: 179000000 ***%%PCMSG|177 |00009|Yes|No|09/16/2010 20:08|0|0|Page is valid, no graphics -- Color: N|
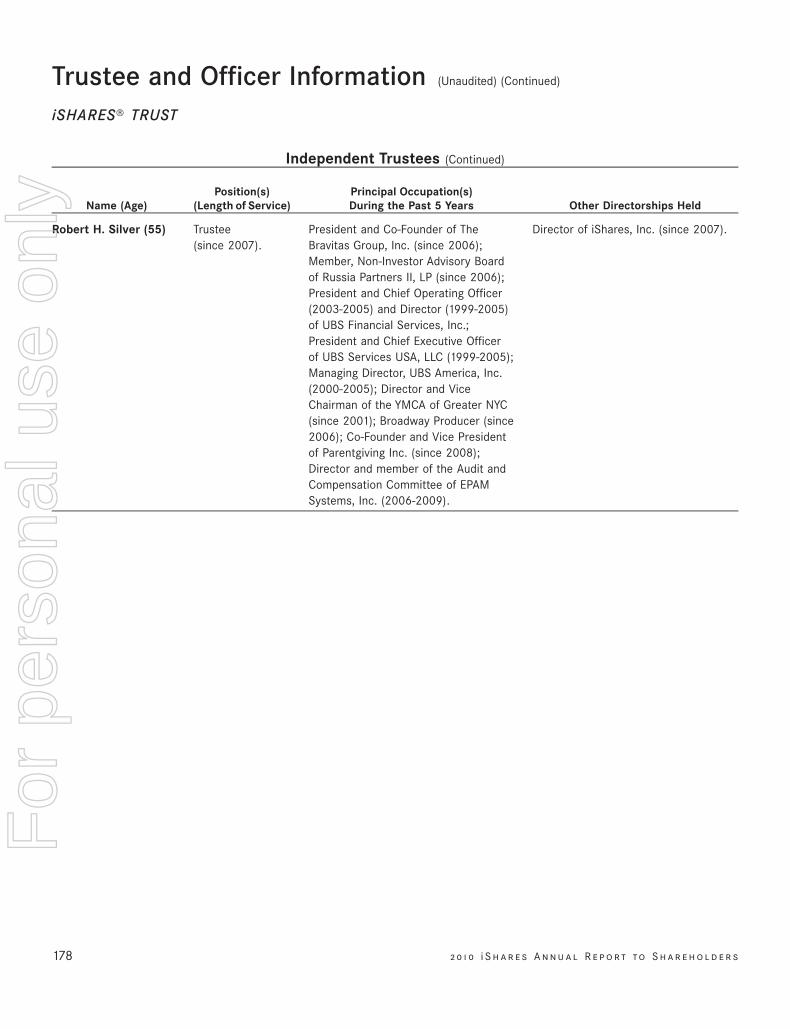
Name (Age)Position(s)
(Length of Service)Principal Occupation(s)During the Past 5 Years Other Directorships Held
Independent Trustees (Continued)
Robert H. Silver (55) Trustee(since 2007).
President and Co-Founder of TheBravitas Group, Inc. (since 2006);Member, Non-Investor Advisory Boardof Russia Partners II, LP (since 2006);President and Chief Operating Officer(2003-2005) and Director (1999-2005)of UBS Financial Services, Inc.;President and Chief Executive Officerof UBS Services USA, LLC (1999-2005);Managing Director, UBS America, Inc.(2000-2005); Director and ViceChairman of the YMCA of Greater NYC(since 2001); Broadway Producer (since2006); Co-Founder and Vice Presidentof Parentgiving Inc. (since 2008);Director and member of the Audit andCompensation Committee of EPAMSystems, Inc. (2006-2009).
Director of iShares, Inc. (since 2007).
178 2 0 1 0 i S h a r e s A n n u a l R e p o r t to S h a r e h o l d e r s
Trustee and Officer Information (Unaudited) (Continued)
iSHARES» TRUST
For
per
sona
l use
onl
y
%%TRANSMSG*** Transmitting Job: B82515 PCN: 180000000 ***%%PCMSG|178 |00009|Yes|No|09/16/2010 20:08|0|0|Page is valid, no graphics -- Color: N|
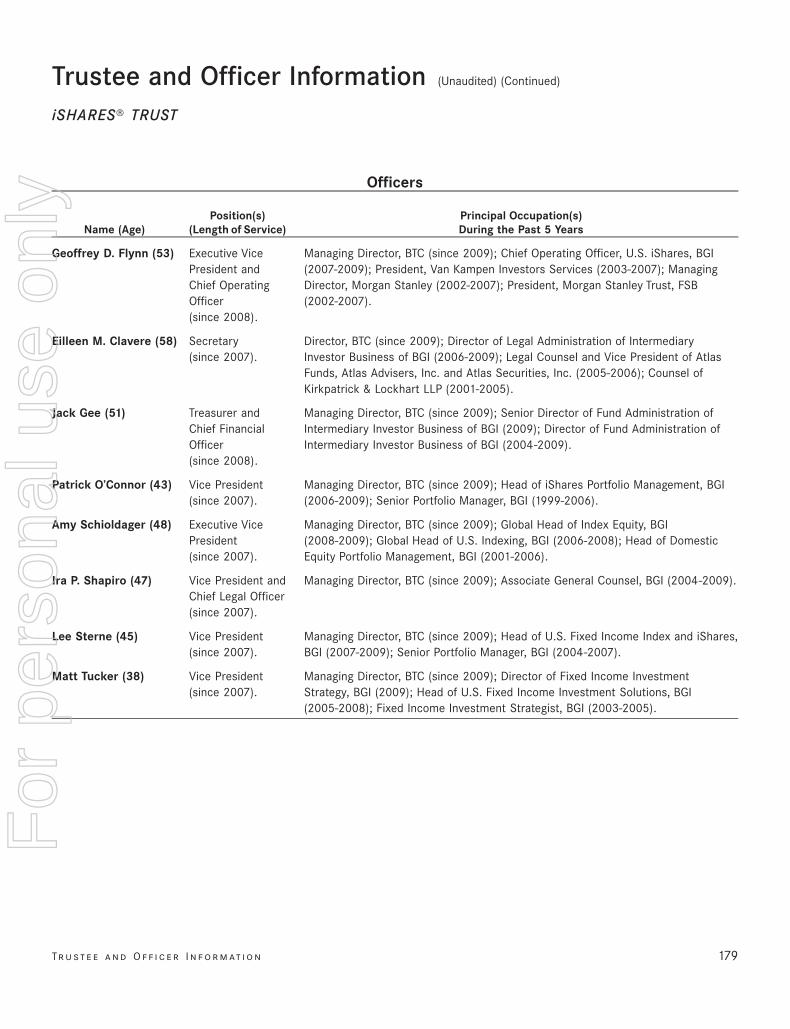
Name (Age)Position(s)
(Length of Service)Principal Occupation(s)During the Past 5 Years
Officers
Geoffrey D. Flynn (53) Executive VicePresident andChief OperatingOfficer(since 2008).
Managing Director, BTC (since 2009); Chief Operating Officer, U.S. iShares, BGI(2007-2009); President, Van Kampen Investors Services (2003-2007); ManagingDirector, Morgan Stanley (2002-2007); President, Morgan Stanley Trust, FSB(2002-2007).
Eilleen M. Clavere (58) Secretary(since 2007).
Director, BTC (since 2009); Director of Legal Administration of IntermediaryInvestor Business of BGI (2006-2009); Legal Counsel and Vice President of AtlasFunds, Atlas Advisers, Inc. and Atlas Securities, Inc. (2005-2006); Counsel ofKirkpatrick & Lockhart LLP (2001-2005).
Jack Gee (51) Treasurer andChief FinancialOfficer(since 2008).
Managing Director, BTC (since 2009); Senior Director of Fund Administration ofIntermediary Investor Business of BGI (2009); Director of Fund Administration ofIntermediary Investor Business of BGI (2004-2009).
Patrick O’Connor (43) Vice President(since 2007).
Managing Director, BTC (since 2009); Head of iShares Portfolio Management, BGI(2006-2009); Senior Portfolio Manager, BGI (1999-2006).
Amy Schioldager (48) Executive VicePresident(since 2007).
Managing Director, BTC (since 2009); Global Head of Index Equity, BGI(2008-2009); Global Head of U.S. Indexing, BGI (2006-2008); Head of DomesticEquity Portfolio Management, BGI (2001-2006).
Ira P. Shapiro (47) Vice President andChief Legal Officer(since 2007).
Managing Director, BTC (since 2009); Associate General Counsel, BGI (2004-2009).
Lee Sterne (45) Vice President(since 2007).
Managing Director, BTC (since 2009); Head of U.S. Fixed Income Index and iShares,BGI (2007-2009); Senior Portfolio Manager, BGI (2004-2007).
Matt Tucker (38) Vice President(since 2007).
Managing Director, BTC (since 2009); Director of Fixed Income InvestmentStrategy, BGI (2009); Head of U.S. Fixed Income Investment Solutions, BGI(2005-2008); Fixed Income Investment Strategist, BGI (2003-2005).
Tr u s t e e a n d O f f i c e r I n f o r m at i o n 179
Trustee and Officer Information (Unaudited) (Continued)
iSHARES» TRUST
For
per
sona
l use
onl
y
%%TRANSMSG*** Transmitting Job: B82515 PCN: 181000000 ***%%PCMSG|179 |00009|Yes|No|09/16/2010 20:08|0|0|Page is valid, no graphics -- Color: N|
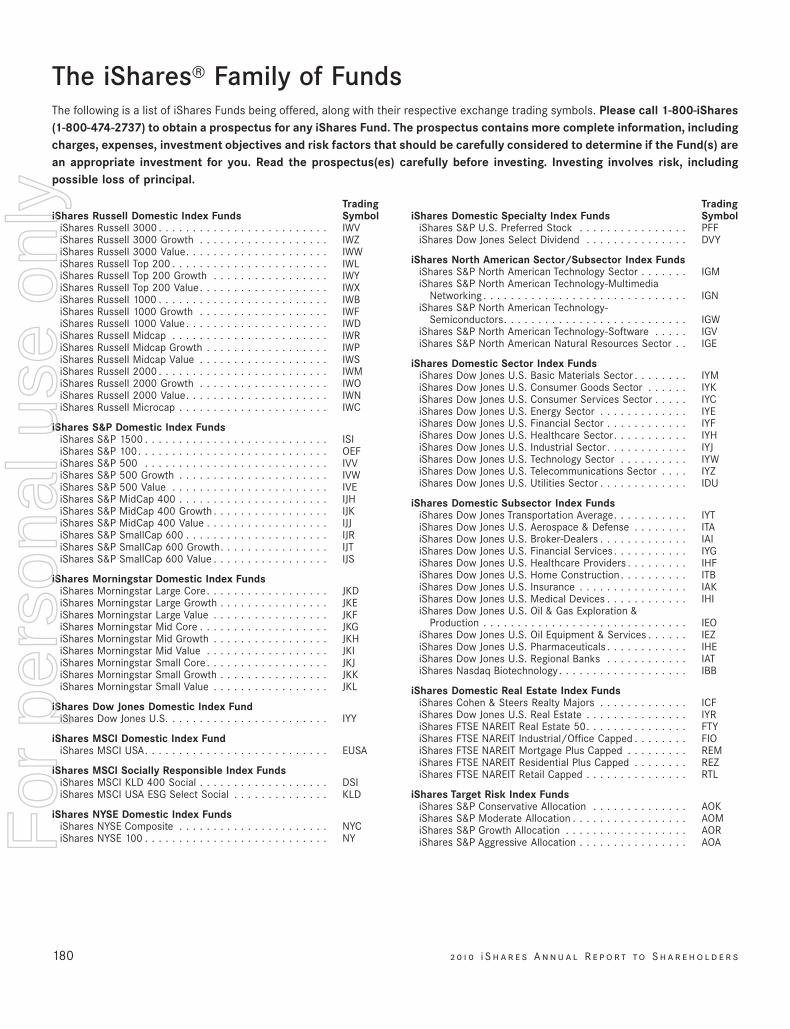
The iShares» Family of FundsThe following is a list of iShares Funds being offered, along with their respective exchange trading symbols. Please call 1-800-iShares(1-800-474-2737) to obtain a prospectus for any iShares Fund. The prospectus contains more complete information, includingcharges, expenses, investment objectives and risk factors that should be carefully considered to determine if the Fund(s) arean appropriate investment for you. Read the prospectus(es) carefully before investing. Investing involves risk, includingpossible loss of principal.
iShares Russell Domestic Index FundsTradingSymbol
iShares Russell 3000 . . . . . . . . . . . . . . . . . . . . . . . . . IWViShares Russell 3000 Growth . . . . . . . . . . . . . . . . . . . IWZiShares Russell 3000 Value. . . . . . . . . . . . . . . . . . . . . IWWiShares Russell Top 200 . . . . . . . . . . . . . . . . . . . . . . . IWLiShares Russell Top 200 Growth . . . . . . . . . . . . . . . . . IWYiShares Russell Top 200 Value. . . . . . . . . . . . . . . . . . . IWXiShares Russell 1000 . . . . . . . . . . . . . . . . . . . . . . . . . IWBiShares Russell 1000 Growth . . . . . . . . . . . . . . . . . . . IWFiShares Russell 1000 Value . . . . . . . . . . . . . . . . . . . . . IWDiShares Russell Midcap . . . . . . . . . . . . . . . . . . . . . . . IWRiShares Russell Midcap Growth . . . . . . . . . . . . . . . . . . IWPiShares Russell Midcap Value . . . . . . . . . . . . . . . . . . . IWSiShares Russell 2000 . . . . . . . . . . . . . . . . . . . . . . . . . IWMiShares Russell 2000 Growth . . . . . . . . . . . . . . . . . . . IWOiShares Russell 2000 Value. . . . . . . . . . . . . . . . . . . . . IWNiShares Russell Microcap . . . . . . . . . . . . . . . . . . . . . . IWC
iShares S&P Domestic Index FundsiShares S&P 1500 . . . . . . . . . . . . . . . . . . . . . . . . . . . ISIiShares S&P 100. . . . . . . . . . . . . . . . . . . . . . . . . . . . OEFiShares S&P 500 . . . . . . . . . . . . . . . . . . . . . . . . . . . IVViShares S&P 500 Growth . . . . . . . . . . . . . . . . . . . . . . IVWiShares S&P 500 Value . . . . . . . . . . . . . . . . . . . . . . . IVEiShares S&P MidCap 400 . . . . . . . . . . . . . . . . . . . . . . IJHiShares S&P MidCap 400 Growth . . . . . . . . . . . . . . . . . IJKiShares S&P MidCap 400 Value . . . . . . . . . . . . . . . . . . IJJiShares S&P SmallCap 600 . . . . . . . . . . . . . . . . . . . . . IJRiShares S&P SmallCap 600 Growth. . . . . . . . . . . . . . . . IJTiShares S&P SmallCap 600 Value . . . . . . . . . . . . . . . . . IJS
iShares Morningstar Domestic Index FundsiShares Morningstar Large Core. . . . . . . . . . . . . . . . . . JKDiShares Morningstar Large Growth . . . . . . . . . . . . . . . . JKEiShares Morningstar Large Value . . . . . . . . . . . . . . . . . JKFiShares Morningstar Mid Core . . . . . . . . . . . . . . . . . . . JKGiShares Morningstar Mid Growth . . . . . . . . . . . . . . . . . JKHiShares Morningstar Mid Value . . . . . . . . . . . . . . . . . . JKIiShares Morningstar Small Core . . . . . . . . . . . . . . . . . . JKJiShares Morningstar Small Growth . . . . . . . . . . . . . . . . JKKiShares Morningstar Small Value . . . . . . . . . . . . . . . . . JKL
iShares Dow Jones Domestic Index FundiShares Dow Jones U.S. . . . . . . . . . . . . . . . . . . . . . . . IYY
iShares MSCI Domestic Index FundiShares MSCI USA. . . . . . . . . . . . . . . . . . . . . . . . . . . EUSA
iShares MSCI Socially Responsible Index FundsiShares MSCI KLD 400 Social . . . . . . . . . . . . . . . . . . . DSIiShares MSCI USA ESG Select Social . . . . . . . . . . . . . . KLD
iShares NYSE Domestic Index FundsiShares NYSE Composite . . . . . . . . . . . . . . . . . . . . . . NYCiShares NYSE 100 . . . . . . . . . . . . . . . . . . . . . . . . . . . NY
iShares Domestic Specialty Index FundsTradingSymbol
iShares S&P U.S. Preferred Stock . . . . . . . . . . . . . . . . PFFiShares Dow Jones Select Dividend . . . . . . . . . . . . . . . DVY
iShares North American Sector/Subsector Index FundsiShares S&P North American Technology Sector . . . . . . . IGMiShares S&P North American Technology-Multimedia
Networking . . . . . . . . . . . . . . . . . . . . . . . . . . . . . . IGNiShares S&P North American Technology-
Semiconductors. . . . . . . . . . . . . . . . . . . . . . . . . . . IGWiShares S&P North American Technology-Software . . . . . IGViShares S&P North American Natural Resources Sector . . IGE
iShares Domestic Sector Index FundsiShares Dow Jones U.S. Basic Materials Sector . . . . . . . . IYMiShares Dow Jones U.S. Consumer Goods Sector . . . . . . IYKiShares Dow Jones U.S. Consumer Services Sector . . . . . IYCiShares Dow Jones U.S. Energy Sector . . . . . . . . . . . . . IYEiShares Dow Jones U.S. Financial Sector . . . . . . . . . . . . IYFiShares Dow Jones U.S. Healthcare Sector. . . . . . . . . . . IYHiShares Dow Jones U.S. Industrial Sector . . . . . . . . . . . . IYJiShares Dow Jones U.S. Technology Sector . . . . . . . . . . IYWiShares Dow Jones U.S. Telecommunications Sector . . . . IYZiShares Dow Jones U.S. Utilities Sector . . . . . . . . . . . . . IDU
iShares Domestic Subsector Index FundsiShares Dow Jones Transportation Average. . . . . . . . . . . IYTiShares Dow Jones U.S. Aerospace & Defense . . . . . . . . ITAiShares Dow Jones U.S. Broker-Dealers . . . . . . . . . . . . . IAIiShares Dow Jones U.S. Financial Services . . . . . . . . . . . IYGiShares Dow Jones U.S. Healthcare Providers . . . . . . . . . IHFiShares Dow Jones U.S. Home Construction . . . . . . . . . . ITBiShares Dow Jones U.S. Insurance . . . . . . . . . . . . . . . . IAKiShares Dow Jones U.S. Medical Devices . . . . . . . . . . . . IHIiShares Dow Jones U.S. Oil & Gas Exploration &
Production . . . . . . . . . . . . . . . . . . . . . . . . . . . . . . IEOiShares Dow Jones U.S. Oil Equipment & Services . . . . . . IEZiShares Dow Jones U.S. Pharmaceuticals . . . . . . . . . . . . IHEiShares Dow Jones U.S. Regional Banks . . . . . . . . . . . . IATiShares Nasdaq Biotechnology . . . . . . . . . . . . . . . . . . . IBB
iShares Domestic Real Estate Index FundsiShares Cohen & Steers Realty Majors . . . . . . . . . . . . . ICFiShares Dow Jones U.S. Real Estate . . . . . . . . . . . . . . . IYRiShares FTSE NAREIT Real Estate 50. . . . . . . . . . . . . . . FTYiShares FTSE NAREIT Industrial/Office Capped . . . . . . . . FIOiShares FTSE NAREIT Mortgage Plus Capped . . . . . . . . . REMiShares FTSE NAREIT Residential Plus Capped . . . . . . . . REZiShares FTSE NAREIT Retail Capped . . . . . . . . . . . . . . . RTL
iShares Target Risk Index FundsiShares S&P Conservative Allocation . . . . . . . . . . . . . . AOKiShares S&P Moderate Allocation . . . . . . . . . . . . . . . . . AOMiShares S&P Growth Allocation . . . . . . . . . . . . . . . . . . AORiShares S&P Aggressive Allocation . . . . . . . . . . . . . . . . AOA
180 2 0 1 0 i S h a r e s A n n u a l R e p o r t to S h a r e h o l d e r s
For
per
sona
l use
onl
y
%%TRANSMSG*** Transmitting Job: B82515 PCN: 182000000 ***%%PCMSG|180 |00008|Yes|No|09/16/2010 20:08|0|0|Page is valid, no graphics -- Color: N|
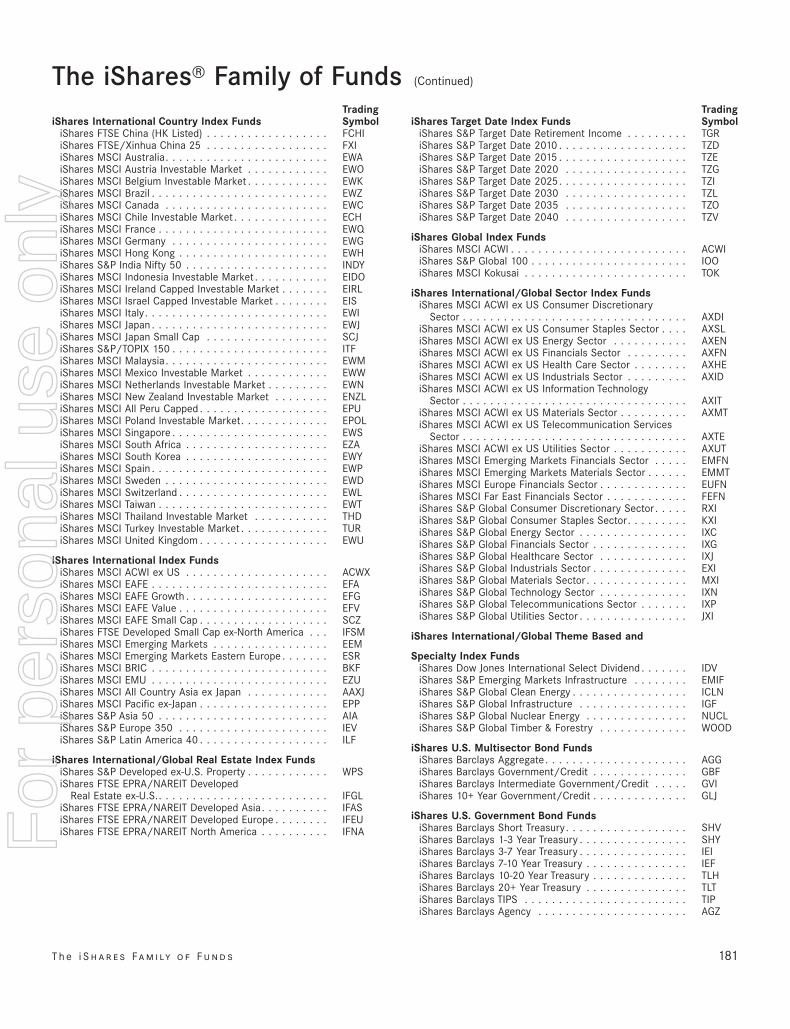
iShares International Country Index FundsTradingSymbol
iShares FTSE China (HK Listed) . . . . . . . . . . . . . . . . . . FCHIiShares FTSE/Xinhua China 25 . . . . . . . . . . . . . . . . . . FXIiShares MSCI Australia. . . . . . . . . . . . . . . . . . . . . . . . EWAiShares MSCI Austria Investable Market . . . . . . . . . . . . EWOiShares MSCI Belgium Investable Market . . . . . . . . . . . . EWKiShares MSCI Brazil . . . . . . . . . . . . . . . . . . . . . . . . . . EWZiShares MSCI Canada . . . . . . . . . . . . . . . . . . . . . . . . EWCiShares MSCI Chile Investable Market . . . . . . . . . . . . . . ECHiShares MSCI France . . . . . . . . . . . . . . . . . . . . . . . . . EWQiShares MSCI Germany . . . . . . . . . . . . . . . . . . . . . . . EWGiShares MSCI Hong Kong . . . . . . . . . . . . . . . . . . . . . . EWHiShares S&P India Nifty 50 . . . . . . . . . . . . . . . . . . . . . INDYiShares MSCI Indonesia Investable Market . . . . . . . . . . . EIDOiShares MSCI Ireland Capped Investable Market . . . . . . . EIRLiShares MSCI Israel Capped Investable Market . . . . . . . . EISiShares MSCI Italy. . . . . . . . . . . . . . . . . . . . . . . . . . . EWIiShares MSCI Japan . . . . . . . . . . . . . . . . . . . . . . . . . . EWJiShares MSCI Japan Small Cap . . . . . . . . . . . . . . . . . . SCJiShares S&P/TOPIX 150 . . . . . . . . . . . . . . . . . . . . . . . ITFiShares MSCI Malaysia. . . . . . . . . . . . . . . . . . . . . . . . EWMiShares MSCI Mexico Investable Market . . . . . . . . . . . . EWWiShares MSCI Netherlands Investable Market . . . . . . . . . EWNiShares MSCI New Zealand Investable Market . . . . . . . . ENZLiShares MSCI All Peru Capped . . . . . . . . . . . . . . . . . . . EPUiShares MSCI Poland Investable Market. . . . . . . . . . . . . EPOLiShares MSCI Singapore . . . . . . . . . . . . . . . . . . . . . . . EWSiShares MSCI South Africa . . . . . . . . . . . . . . . . . . . . . EZAiShares MSCI South Korea . . . . . . . . . . . . . . . . . . . . . EWYiShares MSCI Spain . . . . . . . . . . . . . . . . . . . . . . . . . . EWPiShares MSCI Sweden . . . . . . . . . . . . . . . . . . . . . . . . EWDiShares MSCI Switzerland . . . . . . . . . . . . . . . . . . . . . . EWLiShares MSCI Taiwan . . . . . . . . . . . . . . . . . . . . . . . . . EWTiShares MSCI Thailand Investable Market . . . . . . . . . . . THDiShares MSCI Turkey Investable Market . . . . . . . . . . . . . TURiShares MSCI United Kingdom . . . . . . . . . . . . . . . . . . . EWU
iShares International Index FundsiShares MSCI ACWI ex US . . . . . . . . . . . . . . . . . . . . . ACWXiShares MSCI EAFE . . . . . . . . . . . . . . . . . . . . . . . . . . EFAiShares MSCI EAFE Growth . . . . . . . . . . . . . . . . . . . . . EFGiShares MSCI EAFE Value . . . . . . . . . . . . . . . . . . . . . . EFViShares MSCI EAFE Small Cap . . . . . . . . . . . . . . . . . . . SCZiShares FTSE Developed Small Cap ex-North America . . . IFSMiShares MSCI Emerging Markets . . . . . . . . . . . . . . . . . EEMiShares MSCI Emerging Markets Eastern Europe . . . . . . . ESRiShares MSCI BRIC . . . . . . . . . . . . . . . . . . . . . . . . . . BKFiShares MSCI EMU . . . . . . . . . . . . . . . . . . . . . . . . . . EZUiShares MSCI All Country Asia ex Japan . . . . . . . . . . . . AAXJiShares MSCI Pacific ex-Japan . . . . . . . . . . . . . . . . . . . EPPiShares S&P Asia 50 . . . . . . . . . . . . . . . . . . . . . . . . . AIAiShares S&P Europe 350 . . . . . . . . . . . . . . . . . . . . . . IEViShares S&P Latin America 40 . . . . . . . . . . . . . . . . . . . ILF
iShares International/Global Real Estate Index FundsiShares S&P Developed ex-U.S. Property . . . . . . . . . . . . WPSiShares FTSE EPRA/NAREIT Developed
Real Estate ex-U.S.. . . . . . . . . . . . . . . . . . . . . . . . . IFGLiShares FTSE EPRA/NAREIT Developed Asia. . . . . . . . . . IFASiShares FTSE EPRA/NAREIT Developed Europe . . . . . . . . IFEUiShares FTSE EPRA/NAREIT North America . . . . . . . . . . IFNA
iShares Target Date Index FundsTradingSymbol
iShares S&P Target Date Retirement Income . . . . . . . . . TGRiShares S&P Target Date 2010 . . . . . . . . . . . . . . . . . . . TZDiShares S&P Target Date 2015 . . . . . . . . . . . . . . . . . . . TZEiShares S&P Target Date 2020 . . . . . . . . . . . . . . . . . . TZGiShares S&P Target Date 2025. . . . . . . . . . . . . . . . . . . TZIiShares S&P Target Date 2030 . . . . . . . . . . . . . . . . . . TZLiShares S&P Target Date 2035 . . . . . . . . . . . . . . . . . . TZOiShares S&P Target Date 2040 . . . . . . . . . . . . . . . . . . TZV
iShares Global Index FundsiShares MSCI ACWI . . . . . . . . . . . . . . . . . . . . . . . . . . ACWIiShares S&P Global 100 . . . . . . . . . . . . . . . . . . . . . . . IOOiShares MSCI Kokusai . . . . . . . . . . . . . . . . . . . . . . . . TOK
iShares International/Global Sector Index FundsiShares MSCI ACWI ex US Consumer Discretionary
Sector . . . . . . . . . . . . . . . . . . . . . . . . . . . . . . . . . AXDIiShares MSCI ACWI ex US Consumer Staples Sector . . . . AXSLiShares MSCI ACWI ex US Energy Sector . . . . . . . . . . . AXENiShares MSCI ACWI ex US Financials Sector . . . . . . . . . AXFNiShares MSCI ACWI ex US Health Care Sector . . . . . . . . AXHEiShares MSCI ACWI ex US Industrials Sector . . . . . . . . . AXIDiShares MSCI ACWI ex US Information Technology
Sector . . . . . . . . . . . . . . . . . . . . . . . . . . . . . . . . . AXITiShares MSCI ACWI ex US Materials Sector . . . . . . . . . . AXMTiShares MSCI ACWI ex US Telecommunication Services
Sector . . . . . . . . . . . . . . . . . . . . . . . . . . . . . . . . . AXTEiShares MSCI ACWI ex US Utilities Sector . . . . . . . . . . . AXUTiShares MSCI Emerging Markets Financials Sector . . . . . EMFNiShares MSCI Emerging Markets Materials Sector . . . . . . EMMTiShares MSCI Europe Financials Sector . . . . . . . . . . . . . EUFNiShares MSCI Far East Financials Sector . . . . . . . . . . . . FEFNiShares S&P Global Consumer Discretionary Sector . . . . . RXIiShares S&P Global Consumer Staples Sector. . . . . . . . . KXIiShares S&P Global Energy Sector . . . . . . . . . . . . . . . . IXCiShares S&P Global Financials Sector . . . . . . . . . . . . . . IXGiShares S&P Global Healthcare Sector . . . . . . . . . . . . . IXJiShares S&P Global Industrials Sector . . . . . . . . . . . . . . EXIiShares S&P Global Materials Sector . . . . . . . . . . . . . . . MXIiShares S&P Global Technology Sector . . . . . . . . . . . . . IXNiShares S&P Global Telecommunications Sector . . . . . . . IXPiShares S&P Global Utilities Sector . . . . . . . . . . . . . . . . JXI
iShares International/Global Theme Based and
Specialty Index FundsiShares Dow Jones International Select Dividend . . . . . . . IDViShares S&P Emerging Markets Infrastructure . . . . . . . . EMIFiShares S&P Global Clean Energy . . . . . . . . . . . . . . . . . ICLNiShares S&P Global Infrastructure . . . . . . . . . . . . . . . . IGFiShares S&P Global Nuclear Energy . . . . . . . . . . . . . . . NUCLiShares S&P Global Timber & Forestry . . . . . . . . . . . . . WOOD
iShares U.S. Multisector Bond FundsiShares Barclays Aggregate. . . . . . . . . . . . . . . . . . . . . AGGiShares Barclays Government/Credit . . . . . . . . . . . . . . GBFiShares Barclays Intermediate Government/Credit . . . . . GVIiShares 10+ Year Government/Credit . . . . . . . . . . . . . . GLJ
iShares U.S. Government Bond FundsiShares Barclays Short Treasury. . . . . . . . . . . . . . . . . . SHViShares Barclays 1-3 Year Treasury . . . . . . . . . . . . . . . . SHYiShares Barclays 3-7 Year Treasury . . . . . . . . . . . . . . . . IEIiShares Barclays 7-10 Year Treasury . . . . . . . . . . . . . . . IEFiShares Barclays 10-20 Year Treasury . . . . . . . . . . . . . . TLHiShares Barclays 20+ Year Treasury . . . . . . . . . . . . . . . TLTiShares Barclays TIPS . . . . . . . . . . . . . . . . . . . . . . . . TIPiShares Barclays Agency . . . . . . . . . . . . . . . . . . . . . . AGZ
T h e i S h a r e s Fa m i ly o f F u n d s 181
The iShares» Family of Funds (Continued)
For
per
sona
l use
onl
y
%%TRANSMSG*** Transmitting Job: B82515 PCN: 183000000 ***%%PCMSG|181 |00013|Yes|No|09/16/2010 20:08|0|0|Page is valid, no graphics -- Color: N|
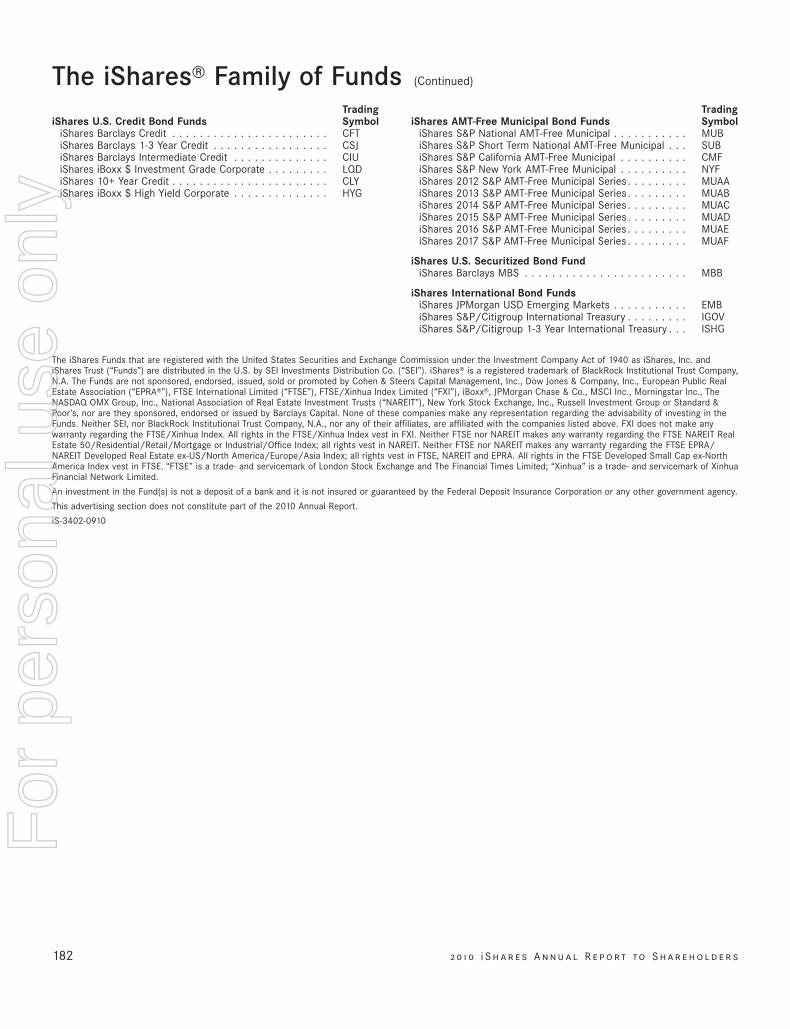
iShares U.S. Credit Bond FundsTradingSymbol
iShares Barclays Credit . . . . . . . . . . . . . . . . . . . . . . . CFTiShares Barclays 1-3 Year Credit . . . . . . . . . . . . . . . . . CSJiShares Barclays Intermediate Credit . . . . . . . . . . . . . . CIUiShares iBoxx $ Investment Grade Corporate . . . . . . . . . LQDiShares 10+ Year Credit . . . . . . . . . . . . . . . . . . . . . . . CLYiShares iBoxx $ High Yield Corporate . . . . . . . . . . . . . . HYG
iShares AMT-Free Municipal Bond FundsTradingSymbol
iShares S&P National AMT-Free Municipal . . . . . . . . . . . MUBiShares S&P Short Term National AMT-Free Municipal . . . SUBiShares S&P California AMT-Free Municipal . . . . . . . . . . CMFiShares S&P New York AMT-Free Municipal . . . . . . . . . . NYFiShares 2012 S&P AMT-Free Municipal Series . . . . . . . . . MUAAiShares 2013 S&P AMT-Free Municipal Series . . . . . . . . . MUABiShares 2014 S&P AMT-Free Municipal Series . . . . . . . . . MUACiShares 2015 S&P AMT-Free Municipal Series . . . . . . . . . MUADiShares 2016 S&P AMT-Free Municipal Series . . . . . . . . . MUAEiShares 2017 S&P AMT-Free Municipal Series . . . . . . . . . MUAF
iShares U.S. Securitized Bond FundiShares Barclays MBS . . . . . . . . . . . . . . . . . . . . . . . . MBB
iShares International Bond FundsiShares JPMorgan USD Emerging Markets . . . . . . . . . . . EMBiShares S&P/Citigroup International Treasury . . . . . . . . . IGOViShares S&P/Citigroup 1-3 Year International Treasury . . . ISHG
The iShares Funds that are registered with the United States Securities and Exchange Commission under the Investment Company Act of 1940 as iShares, Inc. andiShares Trust (“Funds”) are distributed in the U.S. by SEI Investments Distribution Co. (“SEI”). iShares» is a registered trademark of BlackRock Institutional Trust Company,N.A. The Funds are not sponsored, endorsed, issued, sold or promoted by Cohen & Steers Capital Management, Inc., Dow Jones & Company, Inc., European Public RealEstate Association (“EPRA»”), FTSE International Limited (“FTSE”), FTSE/Xinhua Index Limited (“FXI”), iBoxx», JPMorgan Chase & Co., MSCI Inc., Morningstar Inc., TheNASDAQ OMX Group, Inc., National Association of Real Estate Investment Trusts (“NAREIT”), New York Stock Exchange, Inc., Russell Investment Group or Standard &Poor’s, nor are they sponsored, endorsed or issued by Barclays Capital. None of these companies make any representation regarding the advisability of investing in theFunds. Neither SEI, nor BlackRock Institutional Trust Company, N.A., nor any of their affiliates, are affiliated with the companies listed above. FXI does not make anywarranty regarding the FTSE/Xinhua Index. All rights in the FTSE/Xinhua Index vest in FXI. Neither FTSE nor NAREIT makes any warranty regarding the FTSE NAREIT RealEstate 50/Residential/Retail/Mortgage or Industrial/Office Index; all rights vest in NAREIT. Neither FTSE nor NAREIT makes any warranty regarding the FTSE EPRA/NAREIT Developed Real Estate ex-US/North America/Europe/Asia Index; all rights vest in FTSE, NAREIT and EPRA. All rights in the FTSE Developed Small Cap ex-NorthAmerica Index vest in FTSE. “FTSE” is a trade- and servicemark of London Stock Exchange and The Financial Times Limited; “Xinhua” is a trade- and servicemark of XinhuaFinancial Network Limited.
An investment in the Fund(s) is not a deposit of a bank and it is not insured or guaranteed by the Federal Deposit Insurance Corporation or any other government agency.
This advertising section does not constitute part of the 2010 Annual Report.
iS-3402-0910
182 2 0 1 0 i S h a r e s A n n u a l R e p o r t to S h a r e h o l d e r s
The iShares» Family of Funds (Continued)
For
per
sona
l use
onl
y
%%TRANSMSG*** Transmitting Job: B82515 PCN: 184000000 ***%%PCMSG|182 |00009|Yes|No|09/16/2010 20:08|0|0|Page is valid, no graphics -- Color: N|

Dear iShares Shareholder:
Electronic delivery is the easiest, most convenient way to receive reporting on your iShares holdings. In
addition, it’s a way we can all care for our environment. To that end, we are pleased to offer shareholder
reports and prospectuses online.
Once you have enrolled, you will no longer receive shareholder reports and prospectuses in the mail.
Instead, you will receive e-mail notifications announcing that the shareholder report or prospectus has
been posted on the iShares website at www.iShares.com and is available to be viewed or downloaded.
To sign up for electronic delivery, please follow these simple steps:
1. Go to www.icsdelivery.com.
2. From the main page, select the first letter of your brokerage firm’s name.
3. Select your brokerage institution from the list that follows. If your brokerage firm is not listed, electronic
delivery may not be available. Please contact your brokerage firm or financial adviser.
4. Fill out the appropriate information and provide the e-mail address where you would like your
notifications sent.
Your information and e-mail address will be kept confidential and only used to deliver documents to you.
If at any time you are not satisfied, you can cancel electronic delivery at www.icsdelivery.com and once
again receive physical delivery of your materials. If you have any questions, please contact your brokerage
firm or financial adviser.
For
per
sona
l use
onl
y
bethtim
Cross-Out
bethtim
Cross-Out
For more information:
WWW.iSHARES.COM1-800-iShares (1-800-474-2737)
This report is intended for the Funds’ shareholders. It may not be distributed to prospective investors unless it is preceded oraccompanied by the current prospectus.
Investing involves risk, including possible loss of principal.
The iShares Funds are distributed by SEI Investments Distribution Co. (SEI).
The iShares Funds are not sponsored, endorsed, issued, sold or promoted by FTSE International Limited (“FTSE”), FTSE/Xinhua Index Limited(“FXI”) or MSCI Inc., nor do these companies make any representation regarding the advisability of investing in the iShares Funds. FXI does notmake any warranty regarding the FTSE/Xinhua Index. All rights in the FTSE/Xinhua Index vest in FXI. All rights in the FTSE Developed Small Capex-North America Index vest in FTSE. “FTSE” is a trade- and servicemark of London Stock Exchange and The Financial Times Limited; “Xinhua”is a trade- and servicemark of Xinhua Financial Network Limited. Neither SEI, nor BlackRock Institutional Trust Company, N.A., nor any of theiraffiliates, are affiliated with the companies listed above.
A description of the policies that the Funds use to determine how to vote proxies relating to portfolio securities and information about how theFunds voted proxies relating to portfolio securities during the most recent twelve-month period ending June 30 is available without charge, uponrequest, by calling toll-free 1-800-474-2737; on the Funds’ website at www.iShares.com; and on the U.S. Securities and Exchange Commission(SEC) website at www.sec.gov.
The Funds file their complete schedules of portfolio holdings with the SEC for the first and third quarters of each fiscal year on Form N-Q. TheFunds’ Forms N-Q are available on the SEC’s website or may be reviewed and copied at the SEC’s Public Reference Room in Washington, D.C.Information on the operation of the Public Reference Room may be obtained by calling 1-800-SEC-0330. The iShares FTSE/Xinhua China 25Index Fund and the iShares FTSE Series also disclose their complete schedules of portfolio holdings on a daily and monthly basis on the Funds’website. The iShares MSCI Series disclose their complete schedules of portfolio holdings on a monthly basis on the Funds’ website.
Certain financial information required by regulations or listing exchange rules in jurisdictions outside the U.S. in which iShares Funds arecross-listed may be publicly filed in those jurisdictions. This information is available upon request by calling 1-800-474-2737.
©2010 BlackRock Institutional Trust Company, N.A. All rights reserved. iShares® is a registered trademark of BlackRock Institutional TrustCompany, N.A. All other trademarks, servicemarks, or registered trademarks are the property of their respective owners.iS
-AR-
72-0
710 F
or p
erso
nal u
se o
nly
bethtim
Cross-Out
Related Documents


