Black-White Unions: West Indians and African Americans Compared Author(s): Suzanne Model and Gene Fisher Source: Demography, Vol. 38, No. 2 (May, 2001), pp. 177-185 Published by: Population Association of America Stable URL: http://www.jstor.org/stable/3088299 Accessed: 21/12/2009 20:33 Your use of the JSTOR archive indicates your acceptance of JSTOR's Terms and Conditions of Use, available at http://www.jstor.org/page/info/about/policies/terms.jsp. JSTOR's Terms and Conditions of Use provides, in part, that unless you have obtained prior permission, you may not download an entire issue of a journal or multiple copies of articles, and you may use content in the JSTOR archive only for your personal, non-commercial use. Please contact the publisher regarding any further use of this work. Publisher contact information may be obtained at http://www.jstor.org/action/showPublisher?publisherCode=paa. Each copy of any part of a JSTOR transmission must contain the same copyright notice that appears on the screen or printed page of such transmission. JSTOR is a not-for-profit service that helps scholars, researchers, and students discover, use, and build upon a wide range of content in a trusted digital archive. We use information technology and tools to increase productivity and facilitate new forms of scholarship. For more information about JSTOR, please contact [email protected]. Population Association of America is collaborating with JSTOR to digitize, preserve and extend access to Demography. http://www.jstor.org

Welcome message from author
This document is posted to help you gain knowledge. Please leave a comment to let me know what you think about it! Share it to your friends and learn new things together.
Transcript
Black-White Unions: West Indians and African Americans ComparedAuthor(s): Suzanne Model and Gene FisherSource: Demography, Vol. 38, No. 2 (May, 2001), pp. 177-185Published by: Population Association of AmericaStable URL: http://www.jstor.org/stable/3088299Accessed: 21/12/2009 20:33
Your use of the JSTOR archive indicates your acceptance of JSTOR's Terms and Conditions of Use, available athttp://www.jstor.org/page/info/about/policies/terms.jsp. JSTOR's Terms and Conditions of Use provides, in part, that unlessyou have obtained prior permission, you may not download an entire issue of a journal or multiple copies of articles, and youmay use content in the JSTOR archive only for your personal, non-commercial use.
Please contact the publisher regarding any further use of this work. Publisher contact information may be obtained athttp://www.jstor.org/action/showPublisher?publisherCode=paa.
Each copy of any part of a JSTOR transmission must contain the same copyright notice that appears on the screen or printedpage of such transmission.
JSTOR is a not-for-profit service that helps scholars, researchers, and students discover, use, and build upon a wide range ofcontent in a trusted digital archive. We use information technology and tools to increase productivity and facilitate new formsof scholarship. For more information about JSTOR, please contact [email protected].
Population Association of America is collaborating with JSTOR to digitize, preserve and extend access toDemography.
http://www.jstor.org
BLACK-WHITE UNIONS: WEST INDIANS AND AFRICAN AMERICANS COMPARED*
SUZANNE MODEL AND GENE FISHER
In this research we use 1990 PUMS data to compare the pro- pensity for unions between African Americans and native whites with the propensity for unions between British West Indians and na- tive whites. In addition, we distinguish women and men. Descriptive statistics indicate that West Indians, with the exception of men who arrived as adults, are more likely than African Americans to have white partners. After the introduction of controls for several corre- lates of intermarriage, however, West Indian men of any generation have lower exogamy rates than African American men, while ex- ogamy rates are higher among West Indian women who arrived as children or who were born in the United States than among African American women. Thus we find no consistent evidence of greater exogamy for British West Indians than for African Americans.
T he arrival of record numbers of Asians, Latinos, and Afri- cans during the second half of the twentieth century has in- fused new life into scholarship on intermarriage. Research- ers already have discovered high rates of intermarriage be- tween whites and several native-born Asian American and Hispanic groups (Farley 1996; Gilbertson, Fitzpatrick, and Yang 1996; Qian 1997), but intermarriage between whites and persons of African heritage appears to be rare. In 1994 only 7% of all couples containing a black partner included a white spouse (U.S. Bureau of the Census 1995). Yet, because most U.S. blacks are African Americans, aggregate figures say little about the marital patterns of black immigrants and their offspring. According to some observers, relations be- tween whites and West Indians, especially British West Indi- ans, are more cordial than relations between whites and Af- rican Americans (Arnold 1996; Foner 1985; Waters 1999). This possibility motivates us to ask, what proportion of Brit- ish West Indians have white partners? How does that propor- tion compare with the proportion of African Americans with white partners? And what happens to these proportions when controls are introduced for group size, education, and other determinants of interracial unions?
With these questions in mind, we examine partnerships among whites, British West Indians, and African Ameri- cans. The data come from the 1990 U.S. Census and in- clude both married and cohabiting individuals. Before con-
'Suzanne Model and Gene Fisher, Department of Sociology, Thomp- son Hall, 200 Hicks Way, University of Massachusetts, Amherst, MA 01003- 9277; E-mail: [email protected]. We thank Douglas Anderton and Greta Gilbertson for comments and suggestions. A previous version of this paper was presented at the 1998 annual meetings of the American Socio- logical Association, held in San Francisco.
Demography, Volume 38-Number 2, May 2001: 177-185
trols are introduced, unions between West Indians and na- tive whites generally occur at higher rates than unions be- tween African Americans and native whites. After the in- troduction of controls, West Indian men of any generation have lower exogamy rates than African Americans, while exogamy rates are higher among West Indian women who arrived as children or who were born in the United States than among African American women. We find no differ- ence, however, in the exogamy rates of African American women and West Indian women who arrived as adults or teens. In addition, for both West Indian men and women, exogamy rates tend to increase with generation. We inter- pret these findings as consonant with "straight line" as- similation theory rather than with the idea that relations between whites and West Indians are more cordial than be- tween whites and African Americans.
THEORETICAL EXPECTATIONS Of the factors known to influence interracial relationships, three have received special attention: opportunity, hypergamy, and attitudes (Blau, Blum, and Schwartz 1982; Lieberson and Waters 1988; Merton 1941). By opportunity, scholars mean the likelihood that women and men of differ- ent backgrounds will become acquainted. Opportunity is pri- marily a structural phenomenon, governed by conditions such as sex ratios, group size, and residential segregation. Hypergamy refers to the practice whereby women marry men of higher social status than themselves. A disproportionate number of black-white marriages involve pairings between low-status white women and high-status black men (Schoen 1995). This may contribute to another trend: black men marry whites more often than do black women (Kalmijn 1993, 1998). Finally, the attitudes relevant to interracial pair- ings include how strongly members of a particular racial or ethnic group oppose exogamy and how they rank members of different out-groups as mates. Attitudes toward intermar- riage are influenced by demographic variables such as nativ- ity, age, and education, but attitudes also vary among ethnic and racial groups for cultural and historical reasons.
In developing our hypotheses, we emphasize two deter- minants of attitudes: group membership and generation. This is not to deny the effects, on attitudes, of demographic variables such as age and education. Yet, because the effects of these variables are understood more clearly, we treat them as covariates (Kalmijn 1998). We focus here on the partnership choices of members of three groups: native-born non-Hispanic whites, African Americans, and British West
177
DEMOGRAPHY, VOLUME 38-NUMBER 2, MAY 2001
Indians.1 For the British West Indians, we construct four generational categories: the foreign-born who arrived as adults, the foreign-born who arrived as teens, the foreign- born who arrived in childhood, and the native-born (Oropesa and Landale 1997). We introduce these genera- tional categories for two reasons. First, we introduce them because the U.S. Census provides no information on date of marriage. As a result of this omission, we cannot distinguish between foreign-born persons in unions initiated before ar- rival from those in unions initiated after arrival. Also, the longer single immigrants live in the United States, the more likely they are to find a partner of another background (Hwang and Saenz 1990); one objective of our generational categories is to take this fact into account. Second, we ex- pect that the attitudes associated with West Indian partner- ships are a nonlinear function of generation.
Before justifying the expectation of nonlinearity, we de- velop our key hypothesis: native white-West Indian pairs will be more common, all else being equal, than native white- African American pairs. To support this expectation, we take into account the attitudes of whites and both groups of blacks. In this regard, two data sources are helpful: the responses to a special module of the General Social Survey (GSS) and the responses to ethnographers' interviews with West Indian Americans. In 1990 the GSS inquired about feelings toward several new immigrant groups, including West Indian blacks (Smith 1991). Respondents were asked to rank groups in terms of their social standing, on a scale ranging from 1 (low) to 9 (high). West Indian blacks received an average standing of 3.56, a score lower than for "Negroes" (4.17) and nearly identical to that for African blacks (3.58). The term Negroes was used in order to maximize comparability with older ver- sions of the survey. The terms African American and/or Brit- ish West Indian probably would have yielded higher scores. Still, if these figures mirror perceptions about intermarriage, then whites feel more positively about unions with African Americans than with West Indians.
Yet, a large ethnographic literature argues otherwise (Arnold 1996; Foner 1985; Gordon 1979; Waters 1996, 1999). Most British West Indians maintain that they receive better treatment from whites than do African Americans. A Belizean teacher in Los Angeles told Faye Arnold, "West In- dians are treated the best....[T]o be truthful-I have spoken to a few people and they told me that they had dealings with Whites-you know people working with white people-and they feel that foreign Blacks are treated a little more consid- erate than American" (1996:16). Caribbean blacks have a variety of explanations for this more cordial reception. Their diligence and dependability are cited frequently; among re- lated considerations, West Indians are said to be more com- fortable with white authority than are African Americans, to be less angry toward whites, and not to feel that American society "owes them something" (Foner 1985; Waters 1999).
1. For simplicity, we refer to native-born non-Hispanic whites as "na- tive whites." We eliminate foreign-born non-Hispanic whites because in- cluding them would require additional theory and would make the model more complex.
One way to reconcile these contradictory findings is to suppose that the whites who ranked "Negroes" more favor- ably than West Indian blacks in the GSS had little if any con- tact with West Indians. West Indians are a relatively small and geographically segregated group; the majority of Ameri- can whites probably have never encountered any. Moreover, some West Indians have admitted to ethnographers that they take steps, when meeting whites, to communicate their heri- tage and the meaning of that heritage. Another respondent told Faye Arnold, "I always go to school the first week. I volunteer. I join the PTA, the Parents Council, you name it. I let those teachers know...that we come from Trinidad and Tobago so our culture is different. We expect our kids to be...students and will do what is needed to see that they do" (1996:25). If this scenario is common, then whites who have contact with West Indians may view the Islanders more fa- vorably than they perceive African Americans.
With respect to the black side of the equation, no study has systematically addressed whether West Indians and Afri- can Americans differ in their attitudes toward whites. In Hildebrandt's (1999) interviews with intermarried blacks, however, African American respondents reported hearing stronger objections from friends and family than did Carib- bean respondents. Mary Waters also speculates that West In- dians view whites with less rancor. A Trinidadian teacher ex- plains, "I'm not American, and I do not see myself as having been deprived by the whites of America. To the contrary, I came here, I was accepted, I was acknowledged for what I knew and I am in a position now where I am earning a good salary" (Waters 1999:144). In sum, there is no reason to ex- pect that West Indians will view the taking of a white partner less favorably than do African Americans, and some reason to expect that they will view it more favorably.
With regard to the effect of generation, "straight line" assimilation theory predicts that the foreign-born are less ex- ogamous than the native-born, and that the younger the age at which an immigrant arrives, the more predisposed to in- termarriage he or she will be (Alba and Nee 1997). In the case of West Indians and whites, however, we suspect that the "straight line" model will not hold. Rather, we believe that the intermarriage rate will be highest among West Indi- ans who arrived as teens, followed (in order) by those who arrived in childhood, the native-born, and West Indians who arrived as adults.
Our reasons for expecting this pattern are based on both whites' and West Indians' attitudes. With respect to whites, even though we hypothesize that they rank West Indians above African Americans, they cannot always distinguish between the two groups of blacks. The usual way to identify a West Indian heritage is by "hearing that rich English ac- cent coming from a black face" (Arnold 1996:18). For this reason, some accentless West Indians have special mecha- nisms for conveying their heritage. Mary Waters describes the strategies of New York adolescents: "One girl carried a Guyanese map as part of her key chain so that when people looked at her keys they would ask her about it and she could tell them that her parents were from Guyana. One young
178
BLACK-WHITE UNIONS
woman described having her mother teach her an accent so that she can use it when she applied for a job or a place to live" (1996:182-83). With respect to retaining a distinctive accent, research indicates that puberty is the most common turning point (Pinker 1995). Perhaps if the accent is socially desirable, younger arrivals can retain it; contrary to popular belief, however, even children's speech patterns are not en- tirely voluntary (Lippi-Green 1997). Putting these consider- ations together, we expect that whites view relationships with West Indian teen arrivals most favorably, followed (in order) by childhood arrivals (some of whom will retain their ac- cent), the native-born, and unmarried adult arrivals.
Finally, from the West Indian perspective, all observers agree that those who arrive as adults will be least interested in a white partner. Some will be involved in relationships they initiated before emigrating; others will marry later, but their relatively slight familiarity with American life will re- duce the attractiveness of a white mate. If level of assimila- tion were the only relevant factor, we would predict that na- tive-born West Indians would be the most likely to choose a native white partner. Research indicates, however, that the less obvious their accent and the more assimilated they be- come, the less confident are West Indians that racism can be surmounted (Vickerman 1999; Waters 1999). As a result, later generations are more antagonistic toward whites and feel a greater bond with African Americans. Therefore we hypothesize that teen arrivals will be most open to white mates, followed by childhood arrivals, the native-born, and, finally, adult arrivals. This is the same order of preference we associate with whites.
DATA AND METHODS The data come from the 5% Public Use Microdata Sample (PUMS) of the 1990 U.S. Census. Persons under 16 and same-sex pairs were excluded. We consider both married and cohabiting couples because "much of the decline in marriage has been offset by increased living together without being married" (Bumpass and Sweet 1989:615). Partners were matched irrespective of their position in the household. To identify cohabiting pairs, the U.S. census provides the code "unmarried partner of household head." Calculations based on this code underestimate the cohabiting population, but the data offer no alternative. Another problem is that the PUMS does not take dissolved unions into account. Because inter- racial partnerships are likely to be more fragile than intraracial partnerships, we underestimate the total number of interracial unions over the life course (Jones 1996). Yet, we see no reason to expect a significant difference in the rate of dissolved unions between West Indians and whites and between African Americans and whites. Still, the 1990 cen- sus is less than ideal for the study of intermarriage.
The large size of the PUMS disposed us to sample, but defining the groups of interest was a precondition for sam- pling. Following Kalmijn (1996), we defined as African American persons black on race, born in the United States, non-Hispanic, and reporting no ancestry other than black, African, or American. West Indians were black on race and
non-Hispanic; they were either born in one of 39 British West Indian countries or native-born and reported at least one Brit- ish West Indian ancestor. The remaining individuals were classified as "other." Following the development of these definitions, we sampled one in seven endogamous African American pairs, one in 100 endogamous non-Hispanic white pairs, and one in 10 endogamous "other" pairs. All other combinations were included in their entirety. Finally, using information on year of arrival to estimate the age of arrival for immigrants, we created seven race/ethnic/generation cat- egories: native-born West Indians, foreign-born West Indi- ans who arrived as children (before age 13), those who ar- rived as teens (after age 12 for all; before 18 for women and before 20 for men), those who arrived as adults (after age 17 for women, after 19 for men), African Americans, native whites, and all others.
Before moving on, we must point out that research has cast doubt on the reliability of the ancestry question for iden- tifying native-born West Indians. Qualitative studies suggest that native-born West Indians of lower socioeconomic status may be more likely to identify as African American (Waters 1996, 1999). Because West Indians of higher socioeconomic status are probably more exogamous than their lower-status counterparts, this bias in reporting may lead to inflated esti- mates of exogamy among native-born West Indians. At the same time, our decision to disaggregate foreign-born West Indians by age of arrival allows us to measure quite confi- dently the effects of generation.
Drawing on prior research, our analysis also includes five covariates: age, education, hypergamy, cohabitation, and place of residence. All but the last of these are dichotomized because our sample does not contain enough interracial unions to support division into a very large number of cat- egories. For the same reason, we employ only the man's age and education rather than the age and education of each part- ner. Here we briefly justify the choice of variables.
To begin with age, younger people are expected to ex- hibit higher rates because the passage of time is associated with increasing tolerance for exogamy (Patterson 1997). Age is divided into two categories: under 33 and over 32.
Educational attainment is also an influence, partly be- cause educational institutions provide opportunities for otherwise segregated groups to intermingle and partly be- cause higher education promotes universalistic attitudes (Kalmijn 1998). Education is divided at the median: those with more than a high school diploma and those with the diploma or less.
Next is the variable that identifies hypergamous couples; that is, couples in which the man's education is greater than the woman's. Merton (1941) suggested that black-white unions were disproportionately hypergamous because this combination upgraded both partners: it brought economic improvement to lower-status white women while providing black males a partner from a more prestigious race. We used the entire range of educational values in the PUMS to create this measure; all couples in which the male's code was higher than the female's were defined as hypergamous.
179
DEMOGRAPHY, VOLUME 38-NUMBER 2, MAY 2001
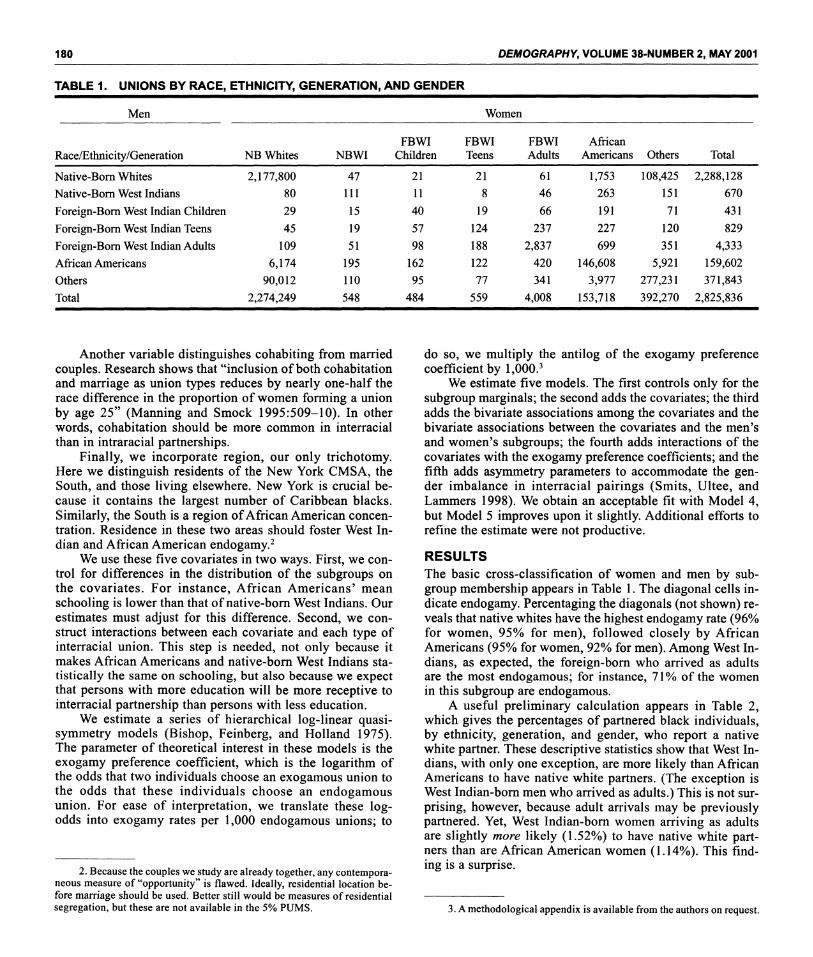
TABLE 1. UNIONS BY RACE, ETHNICITY, GENERATION, AND GENDER
Men Women
FBWI FBWI FBWI African Race/Ethnicity/Generation NB Whites NBWI Children Teens Adults Americans Others Total
Native-Born Whites 2,177,800 47 21 21 61 1,753 108,425 2,288,128 Native-Born West Indians 80 111 11 8 46 263 151 670
Foreign-Born West Indian Children 29 15 40 19 66 191 71 431
Foreign-Born West Indian Teens 45 19 57 124 237 227 120 829
Foreign-Bor West Indian Adults 109 51 98 188 2,837 699 351 4,333 African Americans 6,174 195 162 122 420 146,608 5,921 159,602 Others 90,012 110 95 77 341 3,977 277,231 371,843 Total 2,274,249 548 484 559 4,008 153,718 392,270 2,825,836
Another variable distinguishes cohabiting from married couples. Research shows that "inclusion of both cohabitation and marriage as union types reduces by nearly one-half the race difference in the proportion of women forming a union by age 25" (Manning and Smock 1995:509-10). In other words, cohabitation should be more common in interracial than in intraracial partnerships.
Finally, we incorporate region, our only trichotomy. Here we distinguish residents of the New York CMSA, the South, and those living elsewhere. New York is crucial be- cause it contains the largest number of Caribbean blacks. Similarly, the South is a region of African American concen- tration. Residence in these two areas should foster West In- dian and African American endogamy.2
We use these five covariates in two ways. First, we con- trol for differences in the distribution of the subgroups on the covariates. For instance, African Americans' mean schooling is lower than that of native-born West Indians. Our estimates must adjust for this difference. Second, we con- struct interactions between each covariate and each type of interracial union. This step is needed, not only because it makes African Americans and native-born West Indians sta- tistically the same on schooling, but also because we expect that persons with more education will be more receptive to interracial partnership than persons with less education.
We estimate a series of hierarchical log-linear quasi- symmetry models (Bishop, Feinberg, and Holland 1975). The parameter of theoretical interest in these models is the exogamy preference coefficient, which is the logarithm of the odds that two individuals choose an exogamous union to the odds that these individuals choose an endogamous union. For ease of interpretation, we translate these log- odds into exogamy rates per 1,000 endogamous unions; to
2. Because the couples we study are already together, any contempora- neous measure of "opportunity" is flawed. Ideally, residential location be- fore marriage should be used. Better still would be measures of residential segregation, but these are not available in the 5% PUMS.
do so, we multiply the antilog of the exogamy preference coefficient by 1,000.3
We estimate five models. The first controls only for the subgroup marginals; the second adds the covariates; the third adds the bivariate associations among the covariates and the bivariate associations between the covariates and the men's and women's subgroups; the fourth adds interactions of the covariates with the exogamy preference coefficients; and the fifth adds asymmetry parameters to accommodate the gen- der imbalance in interracial pairings (Smits, Ultee, and Lammers 1998). We obtain an acceptable fit with Model 4, but Model 5 improves upon it slightly. Additional efforts to refine the estimate were not productive.
RESULTS The basic cross-classification of women and men by sub- group membership appears in Table 1. The diagonal cells in- dicate endogamy. Percentaging the diagonals (not shown) re- veals that native whites have the highest endogamy rate (96% for women, 95% for men), followed closely by African Americans (95% for women, 92% for men). Among West In- dians, as expected, the foreign-born who arrived as adults are the most endogamous; for instance, 71% of the women in this subgroup are endogamous.
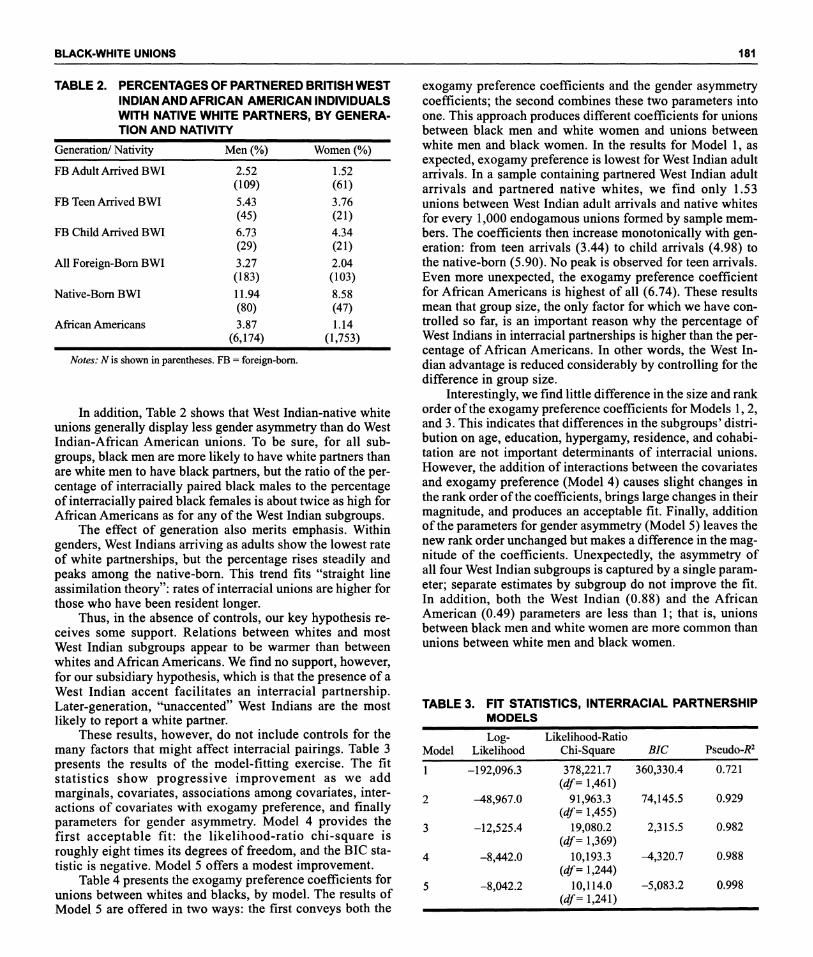
A useful preliminary calculation appears in Table 2, which gives the percentages of partnered black individuals, by ethnicity, generation, and gender, who report a native white partner. These descriptive statistics show that West In- dians, with only one exception, are more likely than African Americans to have native white partners. (The exception is West Indian-born men who arrived as adults.) This is not sur- prising, however, because adult arrivals may be previously partnered. Yet, West Indian-born women arriving as adults are slightly more likely (1.52%) to have native white part- ners than are African American women (1.14%). This find- ing is a surprise.
3. A methodological appendix is available from the authors on request.
180
BLACK-WHITE UNIONS
TABLE 2. PERCENTAGES OF PARTNERED BRITISH WEST INDIAN AND AFRICAN AMERICAN INDIVIDUALS WITH NATIVE WHITE PARTNERS, BY GENERA- TION AND NATIVITY
Generation/ Nativity Men (%) Women (%)
FB Adult Arrived BWI 2.52 1.52 (109) (61)
FB Teen Arrived BWI 5.43 3.76 (45) (21)
FB Child Arrived BWI 6.73 4.34 (29) (21)
All Foreign-Born BWI 3.27 2.04 (183) (103)
Native-Born BWI 11.94 8.58 (80) (47)
African Americans 3.87 1.14 (6,174) (1,753)
Notes: N is shown in parentheses. FB = foreign-born.
In addition, Table 2 shows that West Indian-native white unions generally display less gender asymmetry than do West Indian-African American unions. To be sure, for all sub- groups, black men are more likely to have white partners than are white men to have black partners, but the ratio of the per- centage of interracially paired black males to the percentage of interracially paired black females is about twice as high for African Americans as for any of the West Indian subgroups.
The effect of generation also merits emphasis. Within genders, West Indians arriving as adults show the lowest rate of white partnerships, but the percentage rises steadily and peaks among the native-born. This trend fits "straight line assimilation theory": rates of interracial unions are higher for those who have been resident longer.
Thus, in the absence of controls, our key hypothesis re- ceives some support. Relations between whites and most West Indian subgroups appear to be warmer than between whites and African Americans. We find no support, however, for our subsidiary hypothesis, which is that the presence of a West Indian accent facilitates an interracial partnership. Later-generation, "unaccented" West Indians are the most likely to report a white partner.
These results, however, do not include controls for the many factors that might affect interracial pairings. Table 3 presents the results of the model-fitting exercise. The fit statistics show progressive improvement as we add marginals, covariates, associations among covariates, inter- actions of covariates with exogamy preference, and finally parameters for gender asymmetry. Model 4 provides the first acceptable fit: the likelihood-ratio chi-square is roughly eight times its degrees of freedom, and the BIC sta- tistic is negative. Model 5 offers a modest improvement.
Table 4 presents the exogamy preference coefficients for unions between whites and blacks, by model. The results of Model 5 are offered in two ways: the first conveys both the
exogamy preference coefficients and the gender asymmetry coefficients; the second combines these two parameters into one. This approach produces different coefficients for unions between black men and white women and unions between white men and black women. In the results for Model 1, as expected, exogamy preference is lowest for West Indian adult arrivals. In a sample containing partnered West Indian adult arrivals and partnered native whites, we find only 1.53 unions between West Indian adult arrivals and native whites for every 1,000 endogamous unions formed by sample mem- bers. The coefficients then increase monotonically with gen- eration: from teen arrivals (3.44) to child arrivals (4.98) to the native-born (5.90). No peak is observed for teen arrivals. Even more unexpected, the exogamy preference coefficient for African Americans is highest of all (6.74). These results mean that group size, the only factor for which we have con- trolled so far, is an important reason why the percentage of West Indians in interracial partnerships is higher than the per- centage of African Americans. In other words, the West In- dian advantage is reduced considerably by controlling for the difference in group size.
Interestingly, we find little difference in the size and rank order of the exogamy preference coefficients for Models 1, 2, and 3. This indicates that differences in the subgroups' distri- bution on age, education, hypergamy, residence, and cohabi- tation are not important determinants of interracial unions. However, the addition of interactions between the covariates and exogamy preference (Model 4) causes slight changes in the rank order of the coefficients, brings large changes in their magnitude, and produces an acceptable fit. Finally, addition of the parameters for gender asymmetry (Model 5) leaves the new rank order unchanged but makes a difference in the mag- nitude of the coefficients. Unexpectedly, the asymmetry of all four West Indian subgroups is captured by a single param- eter; separate estimates by subgroup do not improve the fit. In addition, both the West Indian (0.88) and the African American (0.49) parameters are less than 1; that is, unions between black men and white women are more common than unions between white men and black women.
TABLE 3. FIT STATISTICS, INTERRACIAL PARTNERSHIP MODELS
Log- Likelihood-Ratio Model Likelihood Chi-Square BIC Pseudo-R2
1 -192,096.3 378,221.7 360,330.4 0.721 (df= 1,461)
2 -48,967.0 91,963.3 74,145.5 0.929 (df= 1,455)
3 -12,525.4 19,080.2 2,315.5 0.982 (df= 1,369)
4 -8,442.0 10,193.3 -4,320.7 0.988 (df= 1,244)
5 -8,042.2 10,114.0 -5,083.2 0.998 (df= 1,241)
181
DEMOGRAPHY, VOLUME 38-NUMBER 2, MAY 2001
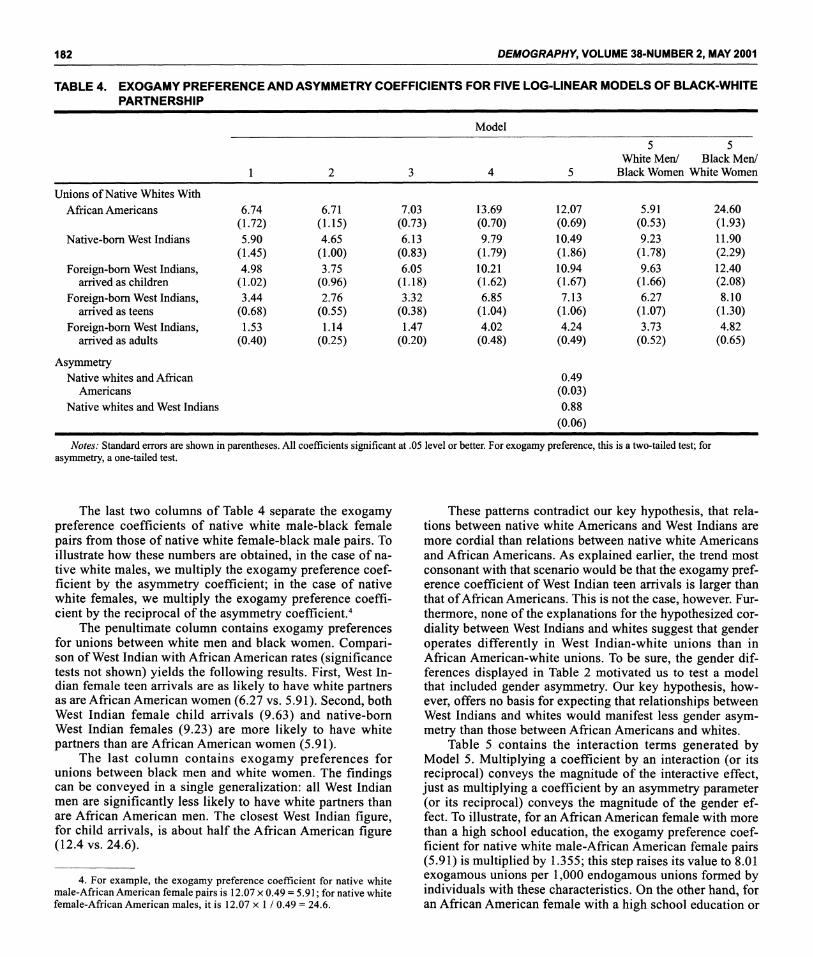
TABLE 4. EXOGAMY PREFERENCE AND ASYMMETRY COEFFICIENTS FOR FIVE LOG-LINEAR MODELS OF BLACK-WHITE PARTNERSHIP
Model
5 5 White Men/ Black Men/
1 2 3 4 5 Black Women White Women
Unions of Native Whites With African Americans 6.74 6.71 7.03 13.69 12.07 5.91 24.60
(1.72) (1.15) (0.73) (0.70) (0.69) (0.53) (1.93) Native-born West Indians 5.90 4.65 6.13 9.79 10.49 9.23 11.90
(1.45) (1.00) (0.83) (1.79) (1.86) (1.78) (2.29) Foreign-born West Indians, 4.98 3.75 6.05 10.21 10.94 9.63 12.40
arrived as children (1.02) (0.96) (1.18) (1.62) (1.67) (1.66) (2.08) Foreign-born West Indians, 3.44 2.76 3.32 6.85 7.13 6.27 8.10
arrived as teens (0.68) (0.55) (0.38) (1.04) (1.06) (1.07) (1.30) Foreign-born West Indians, 1.53 1.14 1.47 4.02 4.24 3.73 4.82
arrived as adults (0.40) (0.25) (0.20) (0.48) (0.49) (0.52) (0.65)
Asymmetry Native whites and African 0.49
Americans (0.03) Native whites and West Indians 0.88
(0.06)
Notes: Standard errors are shown in parentheses. All coefficients significant at .05 level or better. For exogamy preference, asymmetry, a one-tailed test.
The last two columns of Table 4 separate the exogamy preference coefficients of native white male-black female pairs from those of native white female-black male pairs. To illustrate how these numbers are obtained, in the case of na- tive white males, we multiply the exogamy preference coef- ficient by the asymmetry coefficient; in the case of native white females, we multiply the exogamy preference coeffi- cient by the reciprocal of the asymmetry coefficient.4
The penultimate column contains exogamy preferences for unions between white men and black women. Compari- son of West Indian with African American rates (significance tests not shown) yields the following results. First, West In- dian female teen arrivals are as likely to have white partners as are African American women (6.27 vs. 5.91). Second, both West Indian female child arrivals (9.63) and native-born West Indian females (9.23) are more likely to have white partners than are African American women (5.91).
The last column contains exogamy preferences for unions between black men and white women. The findings can be conveyed in a single generalization: all West Indian men are significantly less likely to have white partners than are African American men. The closest West Indian figure, for child arrivals, is about half the African American figure (12.4 vs. 24.6).
4. For example, the exogamy preference coefficient for native white male-African American female pairs is 12.07 x 0.49 = 5.91; for native white female-African American males, it is 12.07 x 1 / 0.49 = 24.6.
this is a two-tailed test; for
These patterns contradict our key hypothesis, that rela- tions between native white Americans and West Indians are more cordial than relations between native white Americans and African Americans. As explained earlier, the trend most consonant with that scenario would be that the exogamy pref- erence coefficient of West Indian teen arrivals is larger than that of African Americans. This is not the case, however. Fur- thermore, none of the explanations for the hypothesized cor- diality between West Indians and whites suggest that gender operates differently in West Indian-white unions than in African American-white unions. To be sure, the gender dif- ferences displayed in Table 2 motivated us to test a model that included gender asymmetry. Our key hypothesis, how- ever, offers no basis for expecting that relationships between West Indians and whites would manifest less gender asym- metry than those between African Americans and whites.
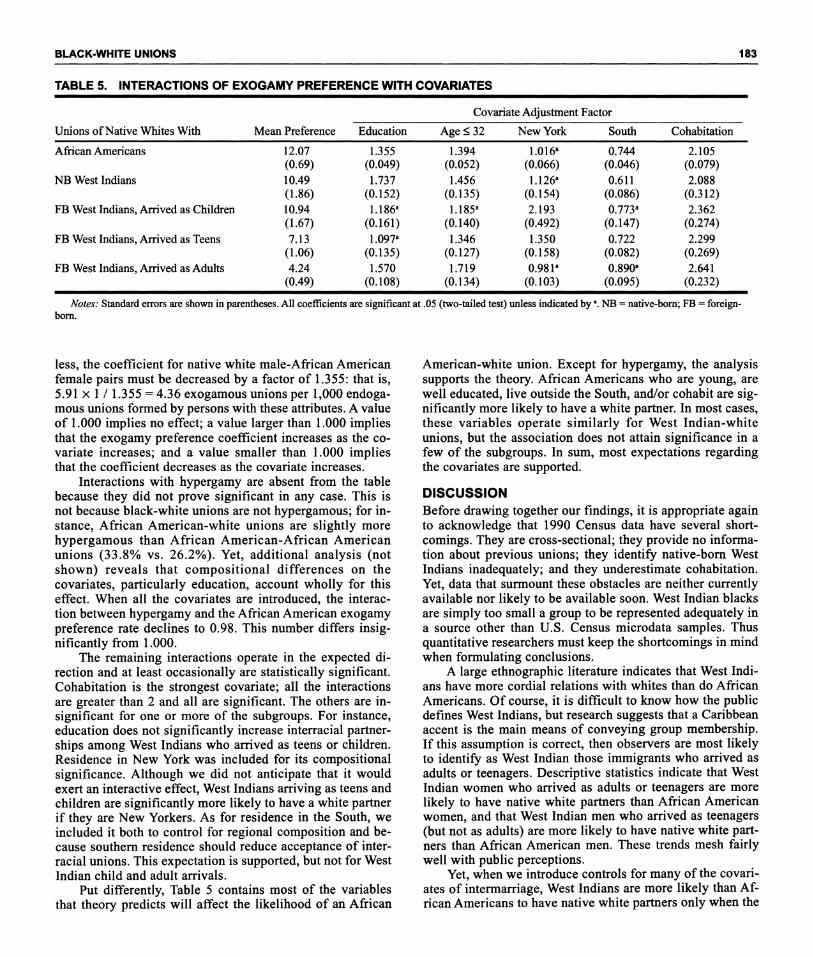
Table 5 contains the interaction terms generated by Model 5. Multiplying a coefficient by an interaction (or its reciprocal) conveys the magnitude of the interactive effect, just as multiplying a coefficient by an asymmetry parameter (or its reciprocal) conveys the magnitude of the gender ef- fect. To illustrate, for an African American female with more than a high school education, the exogamy preference coef- ficient for native white male-African American female pairs (5.91) is multiplied by 1.355; this step raises its value to 8.01 exogamous unions per 1,000 endogamous unions formed by individuals with these characteristics. On the other hand, for an African American female with a high school education or
182
BLACK-WHITE UNIONS
TABLE 5. INTERACTIONS OF EXOGAMY PREFERENCE WITH COVARIATES
Covariate Adjustment Factor
Unions of Native Whites With Mean Preference Education Age < 32 New York South Cohabitation
African Americans 12.07 1.355 1.394 1.016a 0.744 2.105 (0.69) (0.049) (0.052) (0.066) (0.046) (0.079)
NB West Indians 10.49 1.737 1.456 1.126a 0.611 2.088 (1.86) (0.152) (0.135) (0.154) (0.086) (0.312)
FB West Indians, Arrived as Children 10.94 1.186a 1.185a 2.193 0.773a 2.362 (1.67) (0.161) (0.140) (0.492) (0.147) (0.274)
FB West Indians, Arrived as Teens 7.13 1.097a 1.346 1.350 0.722 2.299 (1.06) (0.135) (0.127) (0.158) (0.082) (0.269)
FB West Indians, Arrived as Adults 4.24 1.570 1.719 0.981a 0.890a 2.641 (0.49) (0.108) (0.134) (0.103) (0.095) (0.232)
Notes: Standard errors are shown in parentheses. All coefficients are significant at .05 (two-tailed test) unless indicated by a. NB = native-born; FB = foreign- bomn.
less, the coefficient for native white male-African American female pairs must be decreased by a factor of 1.355: that is, 5.91 x 1 / 1.355 = 4.36 exogamous unions per 1,000 endoga- mous unions formed by persons with these attributes. A value of 1.000 implies no effect; a value larger than 1.000 implies that the exogamy preference coefficient increases as the co- variate increases; and a value smaller than 1.000 implies that the coefficient decreases as the covariate increases.
Interactions with hypergamy are absent from the table because they did not prove significant in any case. This is not because black-white unions are not hypergamous; for in- stance, African American-white unions are slightly more hypergamous than African American-African American unions (33.8% vs. 26.2%). Yet, additional analysis (not shown) reveals that compositional differences on the covariates, particularly education, account wholly for this effect. When all the covariates are introduced, the interac- tion between hypergamy and the African American exogamy preference rate declines to 0.98. This number differs insig- nificantly from 1.000.
The remaining interactions operate in the expected di- rection and at least occasionally are statistically significant. Cohabitation is the strongest covariate; all the interactions are greater than 2 and all are significant. The others are in- significant for one or more of the subgroups. For instance, education does not significantly increase interracial partner- ships among West Indians who arrived as teens or children. Residence in New York was included for its compositional significance. Although we did not anticipate that it would exert an interactive effect, West Indians arriving as teens and children are significantly more likely to have a white partner if they are New Yorkers. As for residence in the South, we included it both to control for regional composition and be- cause southern residence should reduce acceptance of inter- racial unions. This expectation is supported, but not for West Indian child and adult arrivals.
Put differently, Table 5 contains most of the variables that theory predicts will affect the likelihood of an African
American-white union. Except for hypergamy, the analysis supports the theory. African Americans who are young, are well educated, live outside the South, and/or cohabit are sig- nificantly more likely to have a white partner. In most cases, these variables operate similarly for West Indian-white unions, but the association does not attain significance in a few of the subgroups. In sum, most expectations regarding the covariates are supported.
DISCUSSION Before drawing together our findings, it is appropriate again to acknowledge that 1990 Census data have several short- comings. They are cross-sectional; they provide no informa- tion about previous unions; they identify native-born West Indians inadequately; and they underestimate cohabitation. Yet, data that surmount these obstacles are neither currently available nor likely to be available soon. West Indian blacks are simply too small a group to be represented adequately in a source other than U.S. Census microdata samples. Thus quantitative researchers must keep the shortcomings in mind when formulating conclusions.
A large ethnographic literature indicates that West Indi- ans have more cordial relations with whites than do African Americans. Of course, it is difficult to know how the public defines West Indians, but research suggests that a Caribbean accent is the main means of conveying group membership. If this assumption is correct, then observers are most likely to identify as West Indian those immigrants who arrived as adults or teenagers. Descriptive statistics indicate that West Indian women who arrived as adults or teenagers are more likely to have native white partners than African American women, and that West Indian men who arrived as teenagers (but not as adults) are more likely to have native white part- ners than African American men. These trends mesh fairly well with public perceptions.
Yet, when we introduce controls for many of the covari- ates of intermarriage, West Indians are more likely than Af- rican Americans to have native white partners only when the
183
DEMOGRAPHY, VOLUME 38-NUMBER 2, MAY 2001
West Indians are later-generation females. Moreover, for both genders, the likelihood that a West Indian has a native white partner is higher for those who arrived as children or were born in America than for those who arrived as teens or adults. These patterns accord more closely with "straight line" assimilation theory, which anticipates that the foreign- bor/native-born boundary inhibits attraction, than with the "cordiality" hypothesis, which anticipates that the foreign- born/native-born boundary enhances attraction (Pagnini and Morgan 1990; Waters 1999).
Yet, our results diverge from "straight line" assimilation theory in that they do not reveal an additional increase in exogamy preference among the native-born. We do not inter- pret this plateau as evidence that the "straight line" assimila- tion interpretation is incorrect, however, because our esti- mate of native-born West Indians may be flawed. The reason for the flaw, as Waters (1996, 1999) proposed, is that less highly educated native-born West Indians may be more likely to identify in the census as African American than as West Indian. It is difficult to predict just how such a decision might affect the native-born exogamy preference rate. Our findings imply that an African American identity, relative to a West Indian identity, increases the exogamy rate for men but decreases it for women. At the same time, education in- creases the exogamy rate, regardless of gender or ethnicity. Unfortunately our data do not allow us to quantify the effect of these countervailing forces. Therefore, following Hirschman (1994), we place greater emphasis on the find- ings obtained for immigrants who arrived as children or teen- agers; these findings accord with "straight line assimilation theory."
Even so, most Americans, black and white, honor the "one drop" rule (Waters 1991). According to this conven- tion, "a black is any person with any known African black ancestry" (Davis 1991:5). Hence, for persons of West Indian descent, "straight line" assimilation means assimilation to an African American rather than a European American lifestyle. For some, this implies an "underclass" outlook. In the inner city, as Portes and Zhou observe, some children of black immigrants are already taking on "the adversarial sub- culture developed by native youths to cope with their own difficult situation" (1993:83). For many more, assimilation to an African American lifestyle implies a middle-class out- look (Neckerman, Carter, and Lee 1999). Regardless of so- cial class, however, being an African American means being treated differently: it means discrimination in the housing market, in the labor market, in obtaining a taxi. For this rea- son, Waters (1999) observes that black immigrants pursue assimilation more ambivalently than do white immigrants. Moreover, because of the "one drop" rule, this ambivalence is just as strong for interracially paired West Indians as for intraracially paired West Indians. Thus, although a compari- son of West Indian-white unions and African American- white unions is theoretically interesting, until the "one drop" rule is abandoned, interracial partnerships will not carry the same implications for assimilation that interethnic partnerships do.
REFERENCES
Alba, R. and V. Nee. 1997. "Rethinking Assimilation for a New Era of Immigration." International Migration Review 31:826-74.
Arnold, F.W. 1996. "Los Angeles West Indian Immigrant Women: "Claimin' De Not Black, De Jus' Tillin' De Bitter Harvest." Pre- sented at the annual meetings of the American Sociological As- sociation, August, New York.
Bishop, Y.M.M., S.E. Fienberg, and P.W. Holland. 1975. Discrete Multivariate Analysis. Cambridge, MA: MIT Press.
Blau, P.M., T.C. Blum, and J.E. Schwartz. 1982. "Heterogeneity and Intermarriage." American Sociological Review 47:45-62.
Bumpass, L.L. and J.A. Sweet. 1989. "National Estimates of Co- habitation." Demography 26:615-25.
Davis, F.J. 1991. Who Is Black? University Park: The Pennsylva- nia State University Press.
Farley, R. 1996. The New American Reality. New York: Russell Sage Foundation.
Foner, N. 1985. "Race and Color: Jamaican Migrants in London and New York City." International Migration Review 19:708-27.
Gilbertson, G., J. Fitzpatrick, and L. Yang. 1996. "Hispanic Inter- marriage in New York City: New Evidence From 1991." Inter- national Migration Review 30:445-59.
Gordon, M. 1979. "Identification and Adaptation: A Study of Two Groups of Jamaican Immigrants in New York City." PhD dis- sertation, Department of Sociology, City University of New York.
Hildebrandt, M. 1999. "The Role of Black Ethnicity in Interracial Marriages." Presented at the annual meetings of the Eastern So- ciological Society, March 5, Boston.
Hirschman, C. 1994. "Problems and Prospects of Studying Immi- grant Adaptation From the 1990 Population Census: From Gen- erational Comparisons to the Process of 'Becoming American.'" International Migration Review 28:690-713.
Hwang, S.-S. and R. Saenz. 1990. "The Problem Posed by Immi- grants Married Abroad on Intermarriage Research: The Case of Asian Americans." International Migration Review 24:563-76.
Jones, F.L. 1996. "Convergence and Divergence in Ethnic Divorce Patterns: A Research Note." Journal of Marriage and the Fam- ily 58:213-18.
Kalmijn, M. 1993. "Trends in Black/White Intermarriage." Social Forces 72:119-46.
. 1996. "The Socioeconomic Assimilation of Caribbean American Blacks." Social Forces 74:911-30.
. 1998. "Intermarriage and Homogamy: Causes, Patterns and Trends." Pp. 395-421 in Annual Review of Sociology 24, edited by K.S. Cook and J. Hagan. Palo Alto: Annual Reviews Inc.
Lieberson, S. and M.C. Waters. 1988. From Many Strands. New York: Russell Sage Foundation.
Lippi-Green, R. 1997. English With an Accent. London: Routledge. Manning, W.D. and P.J. Smock. 1995. "Why Marry? Race and the
Transition to Marriage Among Cohabitors." Demography 32:509-19.
Merton, R. 1941. "Intermarriage and Social Structure: Fact and Theory." Psychiatry 4:361-74.
Neckerman, K.M., P. Carter, and J. Lee. 1999. "Segmented Assimi-
184
BLACK-WHITE UNIONS
lation and Minority Cultures of Mobility." Ethnic and Racial Studies 22:945-65.
Oropesa, R.S. and N.S. Landale. 1997. "In Search of the New Sec- ond Generation: Alternative Strategies for Identifying Second Generation Children and Understanding Their Acquisition of English." Sociological Perspectives 40:429-55.
Pagnini, D.L. and S.P. Morgan. 1990. "Intermarriage and Social Distance Among U.S. Immigrants at the Turn of the Century." American Journal of Sociology 96:405-32.
Patterson, 0. 1997. The Ordeal of Integration. Washington, DC: Civitas.
Pinker, S. 1995. The Language Instinct. New York: Harper. Portes, A. and M. Zhou. 1993. "The New Second Generation: Seg-
mented Assimilation and Its Variants." Annals of the American Academy of Political and Social Science 530:74-96.
Qian, Z. 1997. "Breaking the Racial Barriers: Variations in Interra- cial Marriage Between 1980 and 1990." Demography 34:263- 76.
Schoen, R. 1995. "The Widening Gap Between Black and White Marriage Rates: Context and Implications." Pp. 103-16 in The Decline in Marriage Among African Americans, edited by M.B.
Tucker and C. Mitchell-Kernan. New York: Russell Sage Foun- dation.
Smith, T. 1991. What Do Americans Think About Jews? New York: American Jewish Committee.
Smits, J., W. Ultee, and J. Lammers. 1998. "Educational Ho- mogamy in 65 Countries: An Explanation of Differences in
Openness Using Country-Level Explanatory Variables." Ameri- can Sociological Review 63:264-85.
U.S. Bureau of the Census. 1995. Statistical Abstract of the United States: 1995. 115th ed. Washington, DC: U.S. Bureau of the Census.
Vickerman, M. 1999. Crosscurrents: West Indian Immigrants and Race. New York: Oxford University Press.
Waters, M.C. 1991. "The Role of Lineage in Identity Formation Among Black Americans." Qualitative Sociology 14:57-56.
. 1996. "Ethnic and Racial Identities of Second Generation Black Immigrants in New York City." Pp. 171-96 in The New Second Generation, edited by A. Portes. New York: Russell
Sage Foundation. .1999. Black Identities: West Indian Immigrant Dreams and
American Realities. New York: Russell Sage Foundation.
185
Related Documents


