1. Introduction At the end of 2019, confirmed cases of Coronavirus Disease 2019 (COVID-19) caused by a novel virus, named SARS-CoV-2 (severe acute respiratory syndrome coronavirus 2) later, appeared in Wuhan, a megaci- ty in central China. The disease spread abruptly throughout the whole country in the following months (He et al., 2020; Kang et al., 2020; Liu et al., 2020; Tian et al., 2020; C. Wang et al., 2020; P.-F. Wang et al., 2020; Z. Huang et al., 2020; H. Zheng et al., 2020). On January 23, the 2020 Lunar New Year’s Eve, at least 29 prov- inces of China had confirmed cases (Kraemer et al., 2020; Wu et al., 2020). To prevent a further escalation of the virus transmission, China extended the Spring Festival holiday, shut down commercial activities, urged people to stay at home, and even locked down entire cities. These counter-virus measures were ongoing until circa February 17. Due to the drastic reduction in human activity, substantial reductions of anthropogenic emissions from transportation and industrial production occurred, confirmed by observations. Ground-based measure- ments and satellite observations revealed a sharp reduction of nitrogen dioxide (NO 2 ) levels during the lockdown period, consistent with the transportation statistics (Feng et al., 2020; X. Huang et al., 2021). While some improvements in air quality tend to occur every year during the Lunar Year’s holidays, the rel- ative decreases of observed primary air pollutants in 2020 were all more pronounced than in the preceding Abstract During the Lunar New Year Holiday of 2020, China implemented an unprecedented lockdown to fight the COVID-19 outbreak, which strongly affected the anthropogenic emissions. We utilized elemental carbon observations (equivalent to black carbon, BC) from 42 sites and performed inverse modeling to determine the impact of the lockdown on the weekly BC emissions and quantify the effect of the stagnant conditions on BC observations in densely populated eastern and northern China. BC emissions declined 70% (eastern China) and 48% (northern China) compared to the first half of January. In northern China, under the stagnant conditions of the first week of the lockdown, the observed BC concentrations rose unexpectedly (29%) even though the BC emissions fell. The emissions declined substantially thereafter until a week after the lockdown ended. On the contrary, in eastern China, BC emissions dropped sharply in the first week and recovered synchronously with the end of the lockdown. Plain Language Summary During the lockdown that was implemented to fight the COVID-19 disease in China, most traffic and production activities were suddenly interrupted, resulting in unprecedented abrupt anthropogenic emission changes. We performed inverse modeling based on black carbon observations to reveal the regional changes of BC emissions in densely populated eastern and northern China on a weekly basis from January 1 to March 10, 2020. We found maximum reductions of 70% in eastern China and 48% in northern China and also found different storylines of the emission responses to the lockdown in these two regions. With the high spatio-temporal resolution emissions and the understanding of the meteorological processes, the abnormal BC observations of the first week of the lockdown were quantified. This study provides not only emission information deriving from the impacts of the disastrous pandemic, but also a competitive method to assess the influences of meteorological conditions on air pollutants. JIA ET AL. © 2021. American Geophysical Union. All Rights Reserved. Black Carbon Emission Reduction Due to COVID-19 Lockdown in China Mengwei Jia 1 , Nikolaos Evangeliou 2 , Sabine Eckhardt 2 , Xin Huang 1 , Jian Gao 3 , Aijun Ding 1 , and Andreas Stohl 4 1 Joint International Research Laboratory of Atmospheric and Earth System Sciences, School of Atmospheric Sciences, Nanjing University, Nanjing, China, 2 Department of Atmospheric and Climate Research, NILU – Norwegian Institute for Air Research, Kjeller, Norway, 3 Chinese Research Academy of Environmental Sciences, Beijing, China, 4 Department of Meteorology and Geophysics, University of Vienna, UZA II, Vienna, Austria Key Points: • Inverse modeling based on measurements at 42 sites was conducted to investigate the black carbon (BC) emission changes during the COVID-19 in China • With 70% and 48% BC emission reductions, large regional and temporal differences existed in eastern and northern China during the lockdown • By inverse modeling, the effect of stagnant conditions on ambient BC concentrations can be quantified Supporting Information: Supporting Information may be found in the online version of this article. Correspondence to: M. Jia, [email protected] Citation: Jia, M., Evangeliou, N., Eckhardt, S., Huang, X., Gao, J., Ding, A., & Stohl, A. (2021). Black carbon emission reduction due to COVID-19 lockdown in China. Geophysical Research Letters, 48, e2021GL093243. https://doi. org/10.1029/2021GL093243 Received 4 MAR 2021 Accepted 22 MAR 2021 10.1029/2021GL093243 Special Section: The COVID-19 pandemic: linking health, society and environment RESEARCH LETTER 1 of 10

Welcome message from author
This document is posted to help you gain knowledge. Please leave a comment to let me know what you think about it! Share it to your friends and learn new things together.
Transcript
1. IntroductionAt the end of 2019, confirmed cases of Coronavirus Disease 2019 (COVID-19) caused by a novel virus, named SARS-CoV-2 (severe acute respiratory syndrome coronavirus 2) later, appeared in Wuhan, a megaci-ty in central China. The disease spread abruptly throughout the whole country in the following months (He et al., 2020; Kang et al., 2020; Liu et al., 2020; Tian et al., 2020; C. Wang et al., 2020; P.-F. Wang et al., 2020; Z. Huang et al., 2020; H. Zheng et al., 2020). On January 23, the 2020 Lunar New Year’s Eve, at least 29 prov-inces of China had confirmed cases (Kraemer et al., 2020; Wu et al., 2020). To prevent a further escalation of the virus transmission, China extended the Spring Festival holiday, shut down commercial activities, urged people to stay at home, and even locked down entire cities. These counter-virus measures were ongoing until circa February 17.
Due to the drastic reduction in human activity, substantial reductions of anthropogenic emissions from transportation and industrial production occurred, confirmed by observations. Ground-based measure-ments and satellite observations revealed a sharp reduction of nitrogen dioxide (NO2) levels during the lockdown period, consistent with the transportation statistics (Feng et al., 2020; X. Huang et al., 2021). While some improvements in air quality tend to occur every year during the Lunar Year’s holidays, the rel-ative decreases of observed primary air pollutants in 2020 were all more pronounced than in the preceding
Abstract During the Lunar New Year Holiday of 2020, China implemented an unprecedented lockdown to fight the COVID-19 outbreak, which strongly affected the anthropogenic emissions. We utilized elemental carbon observations (equivalent to black carbon, BC) from 42 sites and performed inverse modeling to determine the impact of the lockdown on the weekly BC emissions and quantify the effect of the stagnant conditions on BC observations in densely populated eastern and northern China. BC emissions declined 70% (eastern China) and 48% (northern China) compared to the first half of January. In northern China, under the stagnant conditions of the first week of the lockdown, the observed BC concentrations rose unexpectedly (29%) even though the BC emissions fell. The emissions declined substantially thereafter until a week after the lockdown ended. On the contrary, in eastern China, BC emissions dropped sharply in the first week and recovered synchronously with the end of the lockdown.
Plain Language Summary During the lockdown that was implemented to fight the COVID-19 disease in China, most traffic and production activities were suddenly interrupted, resulting in unprecedented abrupt anthropogenic emission changes. We performed inverse modeling based on black carbon observations to reveal the regional changes of BC emissions in densely populated eastern and northern China on a weekly basis from January 1 to March 10, 2020. We found maximum reductions of 70% in eastern China and 48% in northern China and also found different storylines of the emission responses to the lockdown in these two regions. With the high spatio-temporal resolution emissions and the understanding of the meteorological processes, the abnormal BC observations of the first week of the lockdown were quantified. This study provides not only emission information deriving from the impacts of the disastrous pandemic, but also a competitive method to assess the influences of meteorological conditions on air pollutants.
JIA ET AL.
© 2021. American Geophysical Union. All Rights Reserved.
Black Carbon Emission Reduction Due to COVID-19 Lockdown in ChinaMengwei Jia1 , Nikolaos Evangeliou2 , Sabine Eckhardt2, Xin Huang1 , Jian Gao3, Aijun Ding1 , and Andreas Stohl4
1Joint International Research Laboratory of Atmospheric and Earth System Sciences, School of Atmospheric Sciences, Nanjing University, Nanjing, China, 2Department of Atmospheric and Climate Research, NILU – Norwegian Institute for Air Research, Kjeller, Norway, 3Chinese Research Academy of Environmental Sciences, Beijing, China, 4Department of Meteorology and Geophysics, University of Vienna, UZA II, Vienna, Austria
Key Points:• Inverse modeling based on
measurements at 42 sites was conducted to investigate the black carbon (BC) emission changes during the COVID-19 in China
• With 70% and 48% BC emission reductions, large regional and temporal differences existed in eastern and northern China during the lockdown
• By inverse modeling, the effect of stagnant conditions on ambient BC concentrations can be quantified
Supporting Information:Supporting Information may be found in the online version of this article.
Correspondence to:M. Jia,[email protected]
Citation:Jia, M., Evangeliou, N., Eckhardt, S., Huang, X., Gao, J., Ding, A., & Stohl, A. (2021). Black carbon emission reduction due to COVID-19 lockdown in China. Geophysical Research Letters, 48, e2021GL093243. https://doi.org/10.1029/2021GL093243
Received 4 MAR 2021Accepted 22 MAR 2021
10.1029/2021GL093243
Special Section:The COVID-19 pandemic: linking health, society and environment
RESEARCH LETTER
1 of 10
Geophysical Research Letters
years (Feng et al., 2020; He et al., 2020; B. Zheng et al., 2020). These substantial improvements in air quality were believed to be highly correlated with COVID-19-related emissions reductions.
Eastern China and northern China are the most urbanized and industrialized areas with large anthro-pogenic pollutant emissions in China (Cai et al., 2018). Originating primarily from fossil fuel consump-tion, black carbon (BC) is an indicator of direct emissions due to the stability of its chemical properties (Bond et al., 2013; A. J. Ding et al., 2016; X. Huang et al., 2021; Qin & Xie, 2012; Shen et al., 2010; Wang et al., 2011, 2014; Zhao et al., 2020). Besides, BC plays a vital role in the aerosol-planetary boundary layer in-teractions that can enhance the haze pollution and is thought to have stronger effects on morbidity than fine particles in general (A. J. Ding et al., 2016; Geng et al., 2013; X. Huang et al., 2020; Wang et al., 2013; Zhao et al., 2020). It is also thought that air pollution, and especially particulate matter, can aid the transmission of SARS-CoV-2 and increase the severity of illness in COVID-19 patients (Domingo & Rovira, 2020; Yao et al., 2020; Zhang et al., 2020; Zhu et al., 2020). Therefore, the BC emissions in eastern and northern China can influence an enormous population’s health. The changes in BC emissions during COVID-19 have been reckoned over Europe (Evangeliou et al., 2020). However, we still lack realistic emission estimates of BC during the COVID-19 lockdown, especially with information on temporal variation during the lockdown period (X. Huang et al., 2021).
With the so-called bottom-up method, it is challenging to calculate actual emission changes in such a short time interval due to the lack of highly resolved and reliable activity data (A. Ding et al., 2019; Li et al., 2017; B. Zheng et al., 2018). In this situation, top-down estimates based on observed atmospheric concentrations offer an alternative to quantifying the emission changes. One top-down method, atmospheric inversion, was therefore adopted in this study to quantify the BC emissions in eastern and northern China at high spa-tial and temporal resolution. It uses an atmospheric transport model to relate changes in observed concen-trations to emissions and optimizes the emissions in a statistically rigorous way (Thompson & Stohl, 2014; Thompson et al., 2015). Here, we present the optimized emissions obtained with the Bayesian inversion framework, namely FLEXINVERT+, in eastern and northern China, before, during, and after the lock-down. We evaluate the optimized emissions’ reliability and analyze their spatial and temporal changes during this period. With the optimized emissions and atmospheric transport simulations, the effect of the stagnant conditions on the abnormal BC observations was quantified.
2. ResultsTo investigate the BC emission fluxes during the Lunar New Year of 2020 in northern and eastern China, we conducted inversions using FLEXINVERT+, a top-down Bayesian inversion framework (Thompson & Stohl, 2014) based on source-receptor relationships (SRRs) calculated by the Lagrangian particle dispersion model FLEXPART (Pisso et al., 2019; Stohl et al., 2005). FLEXINVERT+ optimizes the emissions in a sta-tistically rigorous way (Thompson et al., 2015) by combining prior information on the emissions, measured ambient BC concentrations, and transport model calculations. Considering that BC transport is a strictly linear process in FLEXPART, simulated BC concentrations at a receptor site can be defined as the vector of emission fluxes multiplied with the SRR matrix. Bayes’ theorem offers a method for determining emis-sion fluxes by regularizing the problem using prior information about the fluxes. In this way, an optimized posterior distribution of the fluxes can be found from the observations’ distribution and the prior fluxes, minimizing a cost function that considers the uncertainties in the prior emissions, the observations, and the model calculations (Thompson et al., 2015). More detailed information on FLEXINVERT+ is given in Text S1. We ran the inversion from January 1, 2020, to March 10, 2020, and determined the emissions with weekly time resolution.
The locations of the measurement stations are shown in Table S1 and Figure S1. Forty-two stations were included in the inversion calculations (red stars in Figure S1a). According to the summed-up SRRs of these stations for the whole period (Figure S1b), a variable-resolution latitude-longitude grid was produced to reduce the dimension of the inversion problem, shown in Figure S1c. The variable-resolution grid started with a coarse resolution of 1.6° × 1.6° and was refined in three steps to the highest resolution of 0.2° × 0.2° near the measurement stations. Text S2 provides more detailed information on the observational network and meteorological fields used for calculating SRRs.
JIA ET AL.
10.1029/2021GL093243
2 of 10
Geophysical Research Letters
Posterior emissions can be affected drastically by using different prior inventories. To reduce uncertainties of inversion results, in the present study, six emission inventories were used as the candidates of prior emis-sion information: ACCMIP (Emissions for Atmospheric Chemistry and Climate Model Intercomparison Project) version 5 (Lamarque et al., 2013), EDGAR (Emissions Database for Global Atmospheric Research) version HTAP_V2.2 (Janssens-Maenhout et al., 2015), MACCity (Monitoring Atmospheric Composition & Climate/megaCITY-Zoom for the ENvironment) (Lamarque et al., 2010), PKU (Peking University global emission inventories) (Wang et al., 2014), and ECLIPSE (Evaluating the CLimate and Air Quality ImPacts of ShortlivEd Pollutants) version 5 and version 6 (Klimont et al., 2017). There are considerable discrepan-cies between BC emissions in these existing emission inventories due to differences in the data sources, emission factors, and spatiotemporal resolutions. For the whole year, as shown in Table S2, the highest total BC emissions of all categories (PKU) is about 1.62 times the lowest one (ECLIPSEv6). From January 1 to March 10, 2020, the total BC emissions differences of all categories were mainly concentrated in eastern and northern China (Figure S2). Besides, the uncertainties of the posterior emissions (caused by the use of different prior information) averaged from January 1 to March 10 are presented in Figure S3. They were estimated from 20% to 60% in large regions around the observational sites.
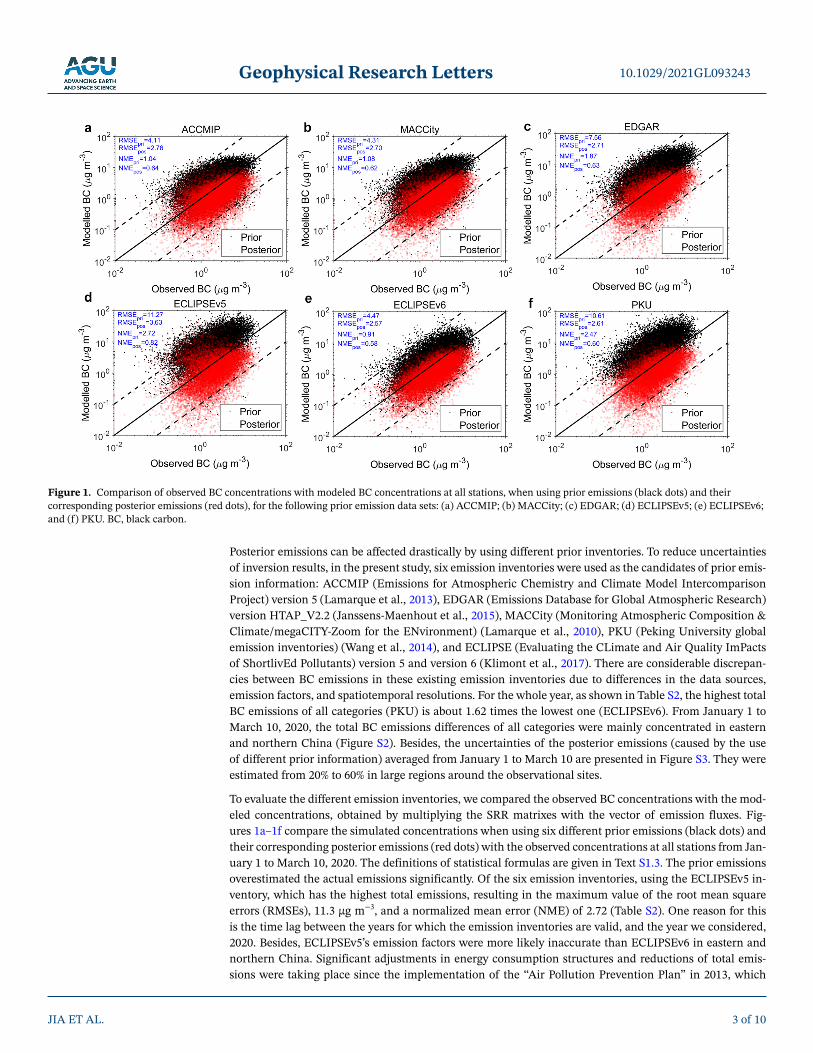
To evaluate the different emission inventories, we compared the observed BC concentrations with the mod-eled concentrations, obtained by multiplying the SRR matrixes with the vector of emission fluxes. Fig-ures 1a–1f compare the simulated concentrations when using six different prior emissions (black dots) and their corresponding posterior emissions (red dots) with the observed concentrations at all stations from Jan-uary 1 to March 10, 2020. The definitions of statistical formulas are given in Text S1.3. The prior emissions overestimated the actual emissions significantly. Of the six emission inventories, using the ECLIPSEv5 in-ventory, which has the highest total emissions, resulting in the maximum value of the root mean square errors (RMSEs), 11.3 μg m−3, and a normalized mean error (NME) of 2.72 (Table S2). One reason for this is the time lag between the years for which the emission inventories are valid, and the year we considered, 2020. Besides, ECLIPSEv5’s emission factors were more likely inaccurate than ECLIPSEv6 in eastern and northern China. Significant adjustments in energy consumption structures and reductions of total emis-sions were taking place since the implementation of the “Air Pollution Prevention Plan” in 2013, which
JIA ET AL.
10.1029/2021GL093243
3 of 10
Figure 1. Comparison of observed BC concentrations with modeled BC concentrations at all stations, when using prior emissions (black dots) and their corresponding posterior emissions (red dots), for the following prior emission data sets: (a) ACCMIP; (b) MACCity; (c) EDGAR; (d) ECLIPSEv5; (e) ECLIPSEv6; and (f) PKU. BC, black carbon.
Geophysical Research Letters
are effective policies on air pollution improvements in China, especially in winter (D. Ding et al., 2019; Liu et al., 2015; Q. Zhang et al., 2019; X. Zhang et al., 2019). In the present study, the gaps between prior emis-sions and actual emissions can be narrowed through inverse modeling. After optimizing, the maximum RMSE of posterior emissions dropped from 11.3 to 3.6 μg m−3 (ECLIPSEv5), even less than the minimum RMSE of prior emissions (ACCMIP). The posterior of ECLIPSEv6 showed the best performance (RMSE-pos = 2.6 μg m−3; NMEpos = 0.58) among all six posterior emission data sets.
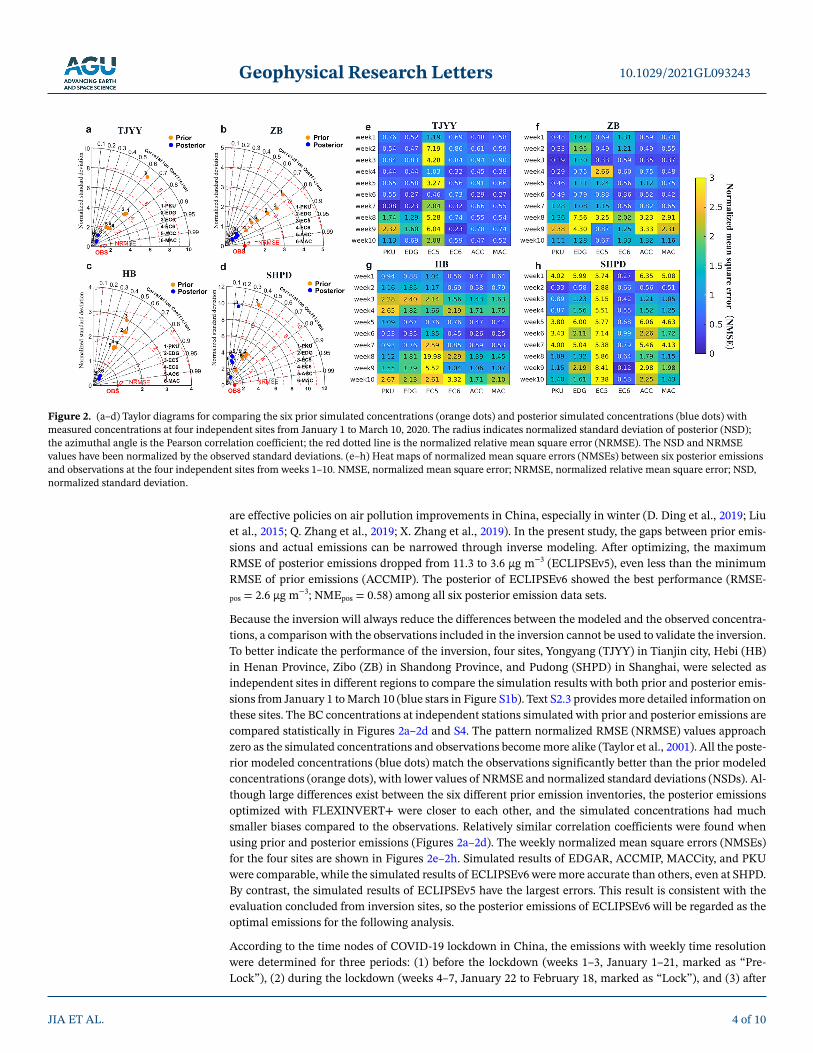
Because the inversion will always reduce the differences between the modeled and the observed concentra-tions, a comparison with the observations included in the inversion cannot be used to validate the inversion. To better indicate the performance of the inversion, four sites, Yongyang (TJYY) in Tianjin city, Hebi (HB) in Henan Province, Zibo (ZB) in Shandong Province, and Pudong (SHPD) in Shanghai, were selected as independent sites in different regions to compare the simulation results with both prior and posterior emis-sions from January 1 to March 10 (blue stars in Figure S1b). Text S2.3 provides more detailed information on these sites. The BC concentrations at independent stations simulated with prior and posterior emissions are compared statistically in Figures 2a–2d and S4. The pattern normalized RMSE (NRMSE) values approach zero as the simulated concentrations and observations become more alike (Taylor et al., 2001). All the poste-rior modeled concentrations (blue dots) match the observations significantly better than the prior modeled concentrations (orange dots), with lower values of NRMSE and normalized standard deviations (NSDs). Al-though large differences exist between the six different prior emission inventories, the posterior emissions optimized with FLEXINVERT+ were closer to each other, and the simulated concentrations had much smaller biases compared to the observations. Relatively similar correlation coefficients were found when using prior and posterior emissions (Figures 2a–2d). The weekly normalized mean square errors (NMSEs) for the four sites are shown in Figures 2e–2h. Simulated results of EDGAR, ACCMIP, MACCity, and PKU were comparable, while the simulated results of ECLIPSEv6 were more accurate than others, even at SHPD. By contrast, the simulated results of ECLIPSEv5 have the largest errors. This result is consistent with the evaluation concluded from inversion sites, so the posterior emissions of ECLIPSEv6 will be regarded as the optimal emissions for the following analysis.
According to the time nodes of COVID-19 lockdown in China, the emissions with weekly time resolution were determined for three periods: (1) before the lockdown (weeks 1–3, January 1–21, marked as “Pre-Lock”), (2) during the lockdown (weeks 4–7, January 22 to February 18, marked as “Lock”), and (3) after
JIA ET AL.
10.1029/2021GL093243
4 of 10
Figure 2. (a–d) Taylor diagrams for comparing the six prior simulated concentrations (orange dots) and posterior simulated concentrations (blue dots) with measured concentrations at four independent sites from January 1 to March 10, 2020. The radius indicates normalized standard deviation of posterior (NSD); the azimuthal angle is the Pearson correlation coefficient; the red dotted line is the normalized relative mean square error (NRMSE). The NSD and NRMSE values have been normalized by the observed standard deviations. (e–h) Heat maps of normalized mean square errors (NMSEs) between six posterior emissions and observations at the four independent sites from weeks 1–10. NMSE, normalized mean square error; NRMSE, normalized relative mean square error; NSD, normalized standard deviation.
Geophysical Research Letters
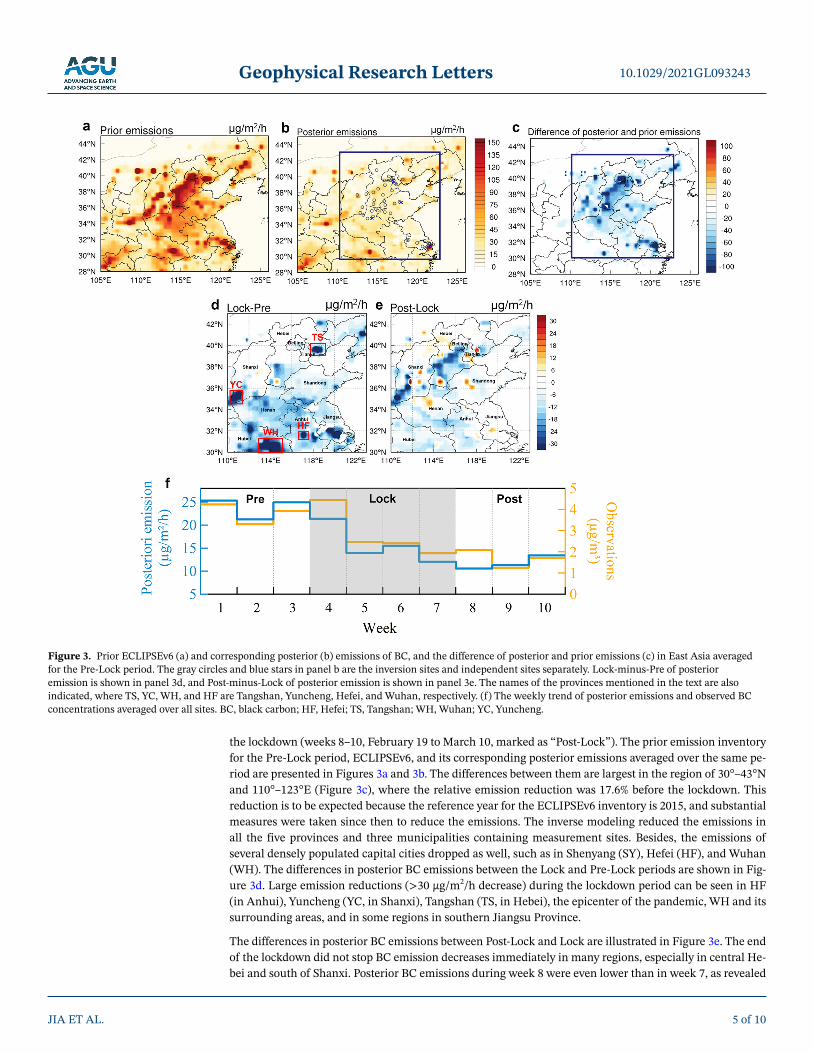
the lockdown (weeks 8–10, February 19 to March 10, marked as “Post-Lock”). The prior emission inventory for the Pre-Lock period, ECLIPSEv6, and its corresponding posterior emissions averaged over the same pe-riod are presented in Figures 3a and 3b. The differences between them are largest in the region of 30°–43°N and 110°–123°E (Figure 3c), where the relative emission reduction was 17.6% before the lockdown. This reduction is to be expected because the reference year for the ECLIPSEv6 inventory is 2015, and substantial measures were taken since then to reduce the emissions. The inverse modeling reduced the emissions in all the five provinces and three municipalities containing measurement sites. Besides, the emissions of several densely populated capital cities dropped as well, such as in Shenyang (SY), Hefei (HF), and Wuhan (WH). The differences in posterior BC emissions between the Lock and Pre-Lock periods are shown in Fig-ure 3d. Large emission reductions (>30 μg/m2/h decrease) during the lockdown period can be seen in HF (in Anhui), Yuncheng (YC, in Shanxi), Tangshan (TS, in Hebei), the epicenter of the pandemic, WH and its surrounding areas, and in some regions in southern Jiangsu Province.
The differences in posterior BC emissions between Post-Lock and Lock are illustrated in Figure 3e. The end of the lockdown did not stop BC emission decreases immediately in many regions, especially in central He-bei and south of Shanxi. Posterior BC emissions during week 8 were even lower than in week 7, as revealed
JIA ET AL.
10.1029/2021GL093243
5 of 10
Figure 3. Prior ECLIPSEv6 (a) and corresponding posterior (b) emissions of BC, and the difference of posterior and prior emissions (c) in East Asia averaged for the Pre-Lock period. The gray circles and blue stars in panel b are the inversion sites and independent sites separately. Lock-minus-Pre of posterior emission is shown in panel 3d, and Post-minus-Lock of posterior emission is shown in panel 3e. The names of the provinces mentioned in the text are also indicated, where TS, YC, WH, and HF are Tangshan, Yuncheng, Hefei, and Wuhan, respectively. (f) The weekly trend of posterior emissions and observed BC concentrations averaged over all sites. BC, black carbon; HF, Hefei; TS, Tangshan; WH, Wuhan; YC, Yuncheng.
Geophysical Research Letters
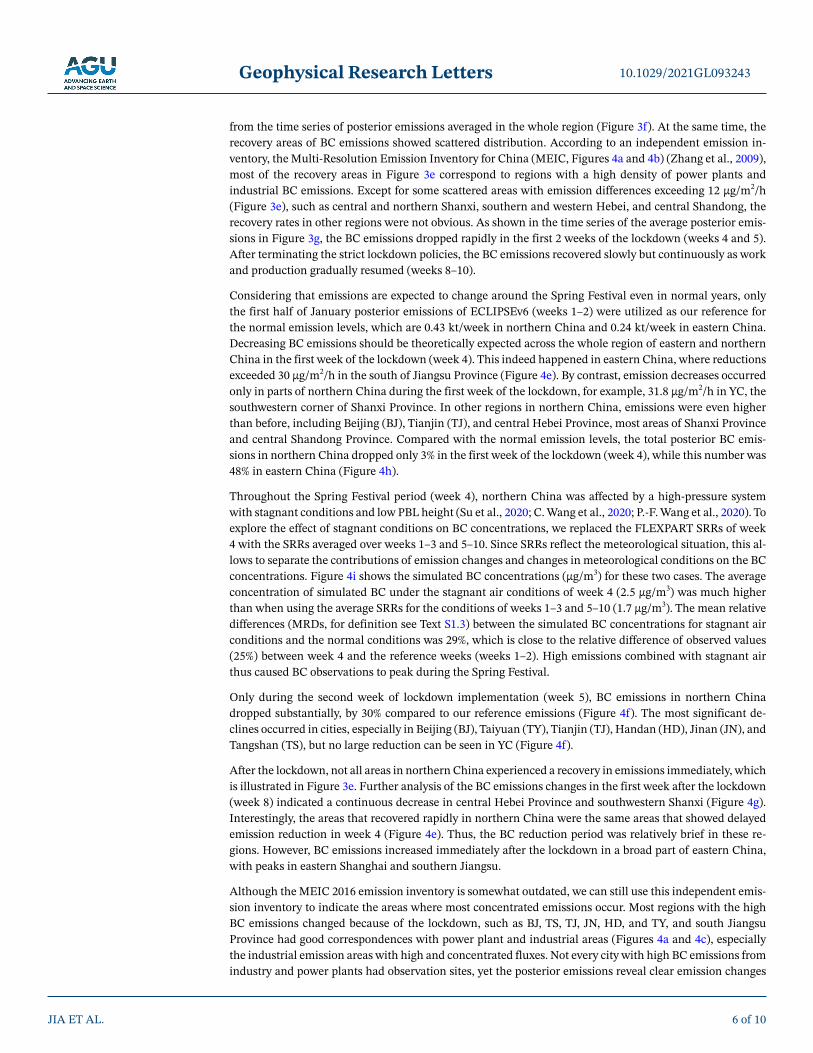
from the time series of posterior emissions averaged in the whole region (Figure 3f). At the same time, the recovery areas of BC emissions showed scattered distribution. According to an independent emission in-ventory, the Multi-Resolution Emission Inventory for China (MEIC, Figures 4a and 4b) (Zhang et al., 2009), most of the recovery areas in Figure 3e correspond to regions with a high density of power plants and industrial BC emissions. Except for some scattered areas with emission differences exceeding 12 μg/m2/h (Figure 3e), such as central and northern Shanxi, southern and western Hebei, and central Shandong, the recovery rates in other regions were not obvious. As shown in the time series of the average posterior emis-sions in Figure 3g, the BC emissions dropped rapidly in the first 2 weeks of the lockdown (weeks 4 and 5). After terminating the strict lockdown policies, the BC emissions recovered slowly but continuously as work and production gradually resumed (weeks 8–10).
Considering that emissions are expected to change around the Spring Festival even in normal years, only the first half of January posterior emissions of ECLIPSEv6 (weeks 1–2) were utilized as our reference for the normal emission levels, which are 0.43 kt/week in northern China and 0.24 kt/week in eastern China. Decreasing BC emissions should be theoretically expected across the whole region of eastern and northern China in the first week of the lockdown (week 4). This indeed happened in eastern China, where reductions exceeded 30 μg/m2/h in the south of Jiangsu Province (Figure 4e). By contrast, emission decreases occurred only in parts of northern China during the first week of the lockdown, for example, 31.8 μg/m2/h in YC, the southwestern corner of Shanxi Province. In other regions in northern China, emissions were even higher than before, including Beijing (BJ), Tianjin (TJ), and central Hebei Province, most areas of Shanxi Province and central Shandong Province. Compared with the normal emission levels, the total posterior BC emis-sions in northern China dropped only 3% in the first week of the lockdown (week 4), while this number was 48% in eastern China (Figure 4h).
Throughout the Spring Festival period (week 4), northern China was affected by a high-pressure system with stagnant conditions and low PBL height (Su et al., 2020; C. Wang et al., 2020; P.-F. Wang et al., 2020). To explore the effect of stagnant conditions on BC concentrations, we replaced the FLEXPART SRRs of week 4 with the SRRs averaged over weeks 1–3 and 5–10. Since SRRs reflect the meteorological situation, this al-lows to separate the contributions of emission changes and changes in meteorological conditions on the BC concentrations. Figure 4i shows the simulated BC concentrations (μg/m3) for these two cases. The average concentration of simulated BC under the stagnant air conditions of week 4 (2.5 μg/m3) was much higher than when using the average SRRs for the conditions of weeks 1–3 and 5–10 (1.7 μg/m3). The mean relative differences (MRDs, for definition see Text S1.3) between the simulated BC concentrations for stagnant air conditions and the normal conditions was 29%, which is close to the relative difference of observed values (25%) between week 4 and the reference weeks (weeks 1–2). High emissions combined with stagnant air thus caused BC observations to peak during the Spring Festival.
Only during the second week of lockdown implementation (week 5), BC emissions in northern China dropped substantially, by 30% compared to our reference emissions (Figure 4f). The most significant de-clines occurred in cities, especially in Beijing (BJ), Taiyuan (TY), Tianjin (TJ), Handan (HD), Jinan (JN), and Tangshan (TS), but no large reduction can be seen in YC (Figure 4f).
After the lockdown, not all areas in northern China experienced a recovery in emissions immediately, which is illustrated in Figure 3e. Further analysis of the BC emissions changes in the first week after the lockdown (week 8) indicated a continuous decrease in central Hebei Province and southwestern Shanxi (Figure 4g). Interestingly, the areas that recovered rapidly in northern China were the same areas that showed delayed emission reduction in week 4 (Figure 4e). Thus, the BC reduction period was relatively brief in these re-gions. However, BC emissions increased immediately after the lockdown in a broad part of eastern China, with peaks in eastern Shanghai and southern Jiangsu.
Although the MEIC 2016 emission inventory is somewhat outdated, we can still use this independent emis-sion inventory to indicate the areas where most concentrated emissions occur. Most regions with the high BC emissions changed because of the lockdown, such as BJ, TS, TJ, JN, HD, and TY, and south Jiangsu Province had good correspondences with power plant and industrial areas (Figures 4a and 4c), especially the industrial emission areas with high and concentrated fluxes. Not every city with high BC emissions from industry and power plants had observation sites, yet the posterior emissions reveal clear emission changes
JIA ET AL.
10.1029/2021GL093243
6 of 10
Geophysical Research Letters
JIA ET AL.
10.1029/2021GL093243
7 of 10
Figure 4. Power plant (a), residential (b), industrial (c), and transportation (d) emissions of BC from the Multi-Resolution Emission Inventory for China (MEIC) in March 2016. Panels (e–g) show maps of weekly changes in posterior BC emissions for (e) the difference in emissions between weeks 4 and 3, (f) weeks 5 and 4, and (g) weeks 8 and 7. Panel (h) shows the posterior BC emissions (kt/week), and observed BC concentrations (μg/m3) averaged over the domains of eastern and northern China. Panel (i) shows the simulated BC concentrations (μg/m3) under the normal condition and the stagnant condition during week 4. BC, black carbon; MEIC, Multi-Resolution Emission Inventory for China.

Geophysical Research Letters
there, which lends credibility to the FLEXINVERT+ inversion modeling. Besides, the patterns of residential and transportation emissions were not similar to the concentrated BC emission change areas (Figures 4b and 4d) but the extensive and limited emission change regions over eastern and northern China.
Generally, compared to the normal emission levels, the weeks with the lowest emissions during the lock-down showed 70% and 48% reductions of the BC emissions in eastern (week 7) and northern China (week 8), respectively. In Europe, an average decrease of 11% in BC emissions was reported due to the COVID-19 lockdowns, (8%–42% in different countries) (Evangeliou et al., 2020). Despite the recovery of the emissions after the lockdown, BC emissions in both eastern and northern China were still substantially lower (by 62% and 43%, respectively) in weeks 8–10 than during the first half of January, before the lockdown.
3. ConclusionsTo investigate the spatio-temporal changes of BC emissions due to the COVID-19 lockdown in eastern and northern China and reveal the abnormal increase of BC observations during the Spring Festival, we used BC observations from 42 sites and a Bayesian inversion framework, FLEXINVERT+, to determine weekly BC emissions from January 1 to March 10, 2020. Six emission inventories were used as the candidates of prior emission information to find the optimum prior emission data set for the inversion. Using prior as well as posterior emissions, the simulated BC concentrations were compared to observed concentrations at all inversion and independent sites, and ECLIPSEv6 stood out from the other five prior emission inventories as the most accurate prior inventory. Analysis of the inversions based on this best-case prior emission scenario (ECLIPSEv6) for the periods before, during, and after the lockdown revealed that the BC emissions signif-icantly declined in all eight provinces and municipalities in eastern and northern China. The maximum weekly emission reductions caused by the lockdown were 70% in eastern China and 48% in northern China.
In some industrial regions of northern China, emissions were surprisingly not reduced during the first week of the lockdown, resulting in a mere 3% decrease of total posterior BC emissions in northern China. The continued high emissions combined with stagnant air conditions led to the peak BC concentrations in the ambient atmosphere during the Spring Festival. We estimate that the stagnant conditions were respon-sible for increasing BC concentrations by 29% compared to the average meteorological conditions before and after the Sprint Festival week. Only during the second week of the lockdown, emissions were strongly reduced in northern China as a whole. The industrial and power plant emission regions that had a delayed response to the lockdown, also recovered their emissions immediately after the lockdown, while reduced emissions still prevailed in most other regions of northern China. On the contrary, in entire eastern China, the BC emission fluxes dropped sharply with 48% reduction at the beginning of lockdown and recovered uniformly but slowly after the lockdown was over. In the following three weeks after the lockdown, BC emissions were still substantially lower (by 62% and 43%, respectively) in eastern and northern China than during the first half of January before the lockdown. This study provides not only emission information deriving from the impacts of the disastrous pandemic, but also a competitive method to assess the impact of meteorological conditions on air pollutants.
Data Availability StatementThe associated data can be downloaded online (https://doi.org/10.5281/zenodo.4318950).
ReferencesBond, T. C., Doherty, S. J., Fahey, D. W., Forster, P. M., Berntsen, T., DeAngelo, B. J., et al. (2013). Bounding the role of black carbon in
the climate system: A scientific assessment. Journal of Geophysical Research: Atmospheres, 118, 5380–5552. https://doi.org/10.1002/jgrd.50171
Cai, B., Wang, X., Huang, G., Wang, J., Cao, D., Baetz, B. W., et al. (2018). Spatiotemporal changes of China's carbon emissions. Geophysical Research Letters, 45, 8536–8546. https://doi.org/10.1029/2018gl079564
Ding, A., Huang, X., Nie, W., Chi, X., Xu, Z., Zheng, L., et al. (2019). Significant reduction of PM2.5 in eastern China due to region-al-scale emission control: Evidence from SORPES in 2011-2018. Atmospheric Chemistry and Physics, 19(18), 11791–11801. https://doi.org/10.5194/acp-19-11791-2019
Ding, A. J., Huang, X., Nie, W., Sun, J. N., Kerminen, V. M., Petäjä, T., et al. (2016). Enhanced haze pollution by black carbon in megacities in China. Geophysical Research Letters, 43(6), 2873–2879. https://doi.org/10.1002/2016gl067745
JIA ET AL.
10.1029/2021GL093243
8 of 10
AcknowledgmentsThis study was supported by the National Natural Science Foundation of China (Grant nos. 41725020 and 92044301). M. Jia received addition-al support from the Program B for Outstanding Ph.D. candidate of Nanjing University. N. Evangeliou and S. Eckhardt received funding from Arctic Monitoring and Assessment Program (AMAP) and from the Research Council of Norway (Project ID: 275407, COMBAT – Quantification of Global Ammonia Sources constrained by a Bayesian Inversion Technique).
Geophysical Research Letters
Ding, D., Xing, J., Wang, S. X., Liu, K. Y., & Hao, J. M. (2019). Estimated contributions of emissions controls, meteorological factors, population growth, and changes in baseline mortality to reductions in ambient PM2.5 and PM2.5-related mortality in China, 2013-2017. Environmental Health Perspectives, 127(6), 067009. https://doi.org/10.1289/ehp4157
Domingo, J. L., & Rovira, J. (2020). Effects of air pollutants on the transmission and severity of respiratory viral infections. Environmental Research, 187, 109650. https://doi.org/10.1016/j.envres.2020.109650
Evangeliou, N., Platt, S. M., Eckhardt, S., Myhre, C. L., Laj, P., Alados-Arboledas, L., et al. (2020). Changes in black carbon emissions over Europe due to COVID-19 lockdowns. Atmospheric Chemistry and Physics, 21(4), 2675–2692. https://doi.org/10.5194/acp-2020-1005
Feng, S., Jiang, F., Wang, H., Wang, H., Ju, W., Shen, Y., et al. (2020). NOx emission changes over China during the COVID-19 epidemic inferred from surface NO2 observations. Geophysical Research Letters, 47(19), e2020GL090080. https://doi.org/10.1029/2020gl090080
Geng, F., Hua, J., Mu, Z., Peng, L., Xu, X., Chen, R., & Kan, H. (2013). Differentiating the associations of black carbon and fine particle with daily mortality in a Chinese city. Environmental Research, 120, 27–32. https://doi.org/10.1016/j.envres.2012.08.007
He, G., Pan, Y., & Tanaka, T. (2020). The short-term impacts of COVID-19 lockdown on urban air pollution in China. Nature Sustainability, 3, 1005–1011. https://doi.org/10.1038/s41893-020-0581-y
Huang, X., Ding, A., Wang, Z., Ding, K., Gao, J., Chai, F., & Fu, C. (2020). Amplified transboundary transport of haze by aerosol-boundary layer interaction in China. Nature Geoscience, 13, 428–434. https://doi.org/10.1038/s41561-020-0583-4
Huang, X., Ding, A. J., Gao, J., Zheng, B., Zhou, D., Qi, X., et al. (2021). Enhanced secondary pollution offset reduction of primary emis-sions during COVID-19 lockdown in China. National Science Review, 8(2), nwaa137. https://doi.org/10.1093/nsr/nwaa137
Huang, Z., Kong, S. F., Chen, N., Yan, Y., Liu, D., Zhu, B., et al. (2020). Significant changes in the chemical compositions and sourc-es of PM2.5 Wuhan since the city lockdown as COVID-19. Science of the Total Environment, 739, 140000. https://doi.org/10.1016/j.scitotenv.2020.140000
Kang, D., Choi, H., Kim, J.-H., & Choi, J. (2020). Spatial epidemic dynamics of the COVID-19 outbreak in China. International Journal of Infectious Diseases, 94, 96–102. https://doi.org/10.1016/j.ijid.2020.03.076
Klimont, Z., Kupiainen, K., Heyes, C., Purohit, P., Cofala, J., Rafaj, P., et al. (2017). Global anthropogenic emissions of particulate matter including black carbon. Atmospheric Chemistry and Physics, 17, 8681–8723. https://doi.org/10.5194/acp-17-8681-2017
Kraemer, M. U. G., Yang, C.-H., Gutierrez, B., Wu, C.-H., Klein, B., Pigott, D. M., et al. (2020). The effect of human mobility and control measures on the COVID-19 epidemic in China. Science, 368, 493–497. https://doi.org/10.1126/science.abb4218
Li, M., Zhang, Q., Kurokawa, J. I., Woo, J.-H., He, K., Lu, Z., et al. (2017). MIX: A mosaic anthropogenic emission inventory under the international collaboration framework of the MICS-Asia and HTAP. Atmospheric Chemistry and Physics, 17(2). https://doi.org/10.5194/acp-17-935-2017
Liu, L. (2020). Emerging study on the transmission of the novel coronavirus (COVID-19) from urban perspective: Evidence from China. Cities, 103. https://doi.org/10.1016/j.cities.2020.102759
Liu, Z., Guan, D., Wei, W., Davis, S. J., Ciais, P., Bai, J., et al. (2015). Reduced carbon emission estimates from fossil fuel combustion and cement production in China. Nature, 524, 335–338. https://doi.org/10.1038/nature14677
Pisso, I., Sollum, E., Grythe, H., Kristiansen, N. I., Cassiani, M., Eckhardt, S., et al. (2019). The Lagrangian particle dispersion model FL-EXPART version 10.3. Geoscientific Model Development, 12, 1–67. https://doi.org/10.5194/gmd-12-4955-2019
Qin, Y., & Xie, S. D. (2012). Spatial and temporal variation of anthropogenic black carbon emissions in China for the period 1980-2009. Atmospheric Chemistry and Physics, 12, 4825–4841. https://doi.org/10.5194/acp-12-4825-2012
Shen, G., Yang, Y., Wang, W., Tao, S., Zhu, C., Min, Y., et al. (2010). Emission factors of particulate matter and elemental carbon for crop residues and coals burned in typical household stoves in China. Environmental Science & Technology, 44(18), 7157–7162. https://doi.org/10.1021/es101313y
Stohl, A., Forster, C., Frank, A., Seibert, P., & Wotawa, G. (2005). Technical note: The Lagrangian particle dispersion model FLEXPART version 6.2. Atmospheric Chemistry and Physics, 5(9), 2461–2474. https://doi.org/10.5194/acp-5-2461-2005
Su, T., Li, Z., Zheng, Y., Luan, Q., & Guo, J. (2020). Abnormally shallow boundary layer associated with severe air pollution during the COVID-19 lockdown in China. Geophysical Research Letters, 47, e2020GL090041. https://doi.org/10.1029/2020gl090041
Taylor, K. E. (2001). Summarizing multiple aspects of model performance in a single diagram. Journal of Geophysical Research, 106(D7), 7183–7192. https://doi.org/10.1029/2000jd900719
Thompson, R. L., & Stohl, A. (2014). FLEXINVERT: An atmospheric Bayesian inversion framework for determining surface fluxes of trace species using an optimized grid. Geoscientific Model Development, 7(5), 2223–2242. https://doi.org/10.5194/gmd-7-2223-2014
Thompson, R. L., Stohl, A., Zhou, L. X., Dlugokencky, E., Fukuyama, Y., Tohjima, Y., et al. (2015). Methane emissions in East Asia for 2000-2011 estimated using an atmospheric Bayesian inversion. Journal of Geophysical Research – D: Atmospheres, 120, 4352–4369. https://doi.org/10.1002/2014jd022394
Tian, H., Liu, Y., Li, Y., Wu, C.-H., Chen, B., Kraemer, M. U. G., et al. (2020). An investigation of transmission control measures during the first 50 days of the COVID-19 epidemic in China. Science, 368, 638–642. https://doi.org/10.1126/science.abb6105
Wang, C., Horby, P. W., Hayden, F. G., & Gao, G. F. (2020). A novel coronavirus outbreak of global health concern. Lancet, 395, 496. https://doi.org/10.1016/s0140-6736(20)30185-9
Wang, P. F., Chen, K. Y., Zhu, S. Q., Wang, P., & Zhang, H. L. (2020). Severe air pollution events not avoided by reduced anthropogenic activities during COVID-19 outbreak. Resources, Conservation & Recycling, 158, 104814. https://doi.org/10.1016/j.resconrec.2020.104814
Wang, R., Tao, S., Balkanski, Y., Ciais, P., Boucher, O., Liu, J., et al. (2014). Exposure to ambient black carbon derived from a unique in-ventory and high-resolution model. Proceedings of the National Academy of Sciences of the United States of America, 111(7), 2459–2463. https://doi.org/10.1073/pnas.1318763111
Wang, X., Chen, R., Meng, X., Geng, F., Wang, C., & Kan, H. (2013). Associations between fine particle, coarse particle, black carbon and hospital visits in a Chinese city. The Science of the Total Environment, 458–460, 1–6. https://doi.org/10.1016/j.scitotenv.2013.04.008
Wang, Z., Wang, T., Gao, R., Xue, L., Guo, J., Zhou, Y., et al. (2011). Source and variation of carbonaceous aerosols at Mount Tai, North China: Results from a semi-continuous instrument. Atmospheric Environment, 45(9), 1655–1667. https://doi.org/10.1016/j.atmosenv.2011.01.006
Wu, J., Gamber, M., & Sun, W. (2020). Does Wuhan need to be in lockdown during the Chinese lunar new year? International Journal of Environmental Research and Public Health, 17(3), 1002. https://doi.org/10.3390/ijerph17031002
Yao, Y., Pan, J. H., Liu, Z. X., Meng, X., Wang, W., Kan, H., & Wang, W. (2020). Temporal association between particulate matter pollution and case fatality rate of COVID-19 in Wuhan. Environmental Research, 189, 109941. https://doi.org/10.1016/j.envres.2020.109941
Zhang, Q., Streets, D. G., Carmichael, G. R., He, K. B., Huo, H., Kannari, A., et al. (2009). Asian emissions in 2006 for the NASA INTEX-B mission. Atmospheric Chemistry and Physics, 9, 5131–5153. https://doi.org/10.5194/acp-9-5131-2009
JIA ET AL.
10.1029/2021GL093243
9 of 10
Geophysical Research Letters
Zhang, Q., Zheng, Y. X., Tong, D., Shao, M., Wang, S., Zhang, Y., et al. (2019). Drivers of improved PM2.5 air quality in China from 2013 to 2017. Proceedings of the National Academy of Sciences of the United States of America, 116(49). 201907956.
Zhang, R. Y., Li, Y. X., Zhang, A. L., Wang, Y., & Molina, M. J. (2020). Identifying airborne transmission as the dominant route for the spread of COVID-19. Proceedings of the National Academy of Sciences of the United States of America, 117(26). 202009637. https://doi.org/10.1073/pnas.2009637117
Zhang, X., Xu, X., Ding, Y., Liu, Y., Zhang, H., Wang, Y., & Zhong, J. (2019). The impact of meteorological changes from 2013 to 2017 on PM2.5 mass reduction in key regions in China. Science China Earth Sciences, 62, 1885–1902. https://doi.org/10.1007/s11430-019-9343-3
Zhao, D. L., Liu, D. T., Yu, C. J., Tian, P., Hu, D., Zhou, W., et al. (2020). Vertical evolution of black carbon characteristics and heating rate during a haze event in Beijing Winter. Science of the Total Environment, 709, 136251. https://doi.org/10.1016/j.scitotenv.2019.136251
Zheng, B., Geng, G. N., Ciais, P., Davis, S. J., Martin, R. V., Meng, J., et al. (2020). Satellite-based estimates of decline and rebound in China’s CO2 emissions during COVID-19 pandemic. Science Advances, 6(49), eabd4998. https://doi.org/10.1126/sciadv.abd4998
Zheng, B., Tong, D., Li, M., Liu, F., Hong, C., Geng, G., et al. (2018). Trends in China's anthropogenic emissions since 2010 as the conse-quence of clean air actions. Atmospheric Chemistry and Physics, 18, 14095–14111. https://doi.org/10.5194/acp-18-14095-2018
Zheng, H., Kong, S., Chen, N., Yan, Y., Liu, D., Zhu, B., et al. (2020). Significant changes in the chemical compositions and sources of PM2.5 in Wuhan since the city lockdown as COVID-19. Science of the Total Environment, 739, 140000. https://doi.org/10.1016/j.scitotenv.2020.140000
Zhu, Y. J., Xie, J. G., Huang, F. M., & Cao, L. Q. (2020). Association between short-term exposure to air pollution and COVID-19 infection: Evidence from China. The Science of the Total Environment, 727, 138704. https://doi.org/10.1016/j.scitotenv.2020.138704
References From the Supporting InformationBrunner, D., Arnold, T., Henne, S., Manning, A., Thompson, R. L., Maione, M., et al. (2017). Comparison of four inverse modelling systems
applied to the estimation of HFC- 125, HFC-134a, and SF6 emissions over Europe. Atmospheric Chemistry and Physics, 17, 10651–10674.Cassiani, M., Stohl, A., & Brioude, J. (2014). Lagrangian stochastic modelling of dispersion in the convective boundary layer with skewed
turbulence conditions and a vertical density gradient: Formulation and implementation in the FLEXPART model. Boundary-Layer Meteorology, 154(3), 367–390.
Ding, A. J., Wang, T., Xue, L. K., Gao, J., Stohl, A., Lei, H., et al. (2009). Transport of north China air pollution by midlatitude cyclones: Case study of aircraft measurements in summer 2007. Journal of Geophysical Research, 114, D08304.
Evangeliou, N., Thompson, L. R., Eckhardt, S., & Stohl, A. (2018). Top-down estimates of black carbon emissions at high latitudes using an atmospheric transport model and a Bayesian inversion framework. Atmospheric Chemistry and Physics, 18(20), 15307–15327.
Fang, X. K., Park, S., Saito, T., Tunnicliffe, R., Ganesan, A. L., Rigby, M., et al. (2019). Rapid increase in ozone-depleting chloroform emis-sions from China. Nature Geoscience, 12, 89–93.
Forster, C., Stohl, A., & Seibert, P. (2007). Parameterization of convective transport in a Lagrangian particle dispersion model and its eval-uation. Journal of Applied Meteorology and Climatology, 46(4), 403–422.
Grythe, H., Kristiansen, N. I., Zwaaftink, C. D. G., Eckhardt, S., Ström, J., Tunved, P., et al. (2017). A new aerosol wet removal scheme for the Lagrangian particle model FLEXPARTv10. Geoscientific Model Development, 10, 1447–1466.
Janssens-Maenhout, G., Crippa, M., Guizzardi, D., Dentener, F., Muntean, M., Pouliot, G., et al. (2015). HTAP_v2.2: A mosaic of regional and global emission grid maps for 2008 and 2010 to study hemispheric transport of air pollution. Atmospheric Chemistry and Physics, 15, 11411–11432.
Kljun, N., Rotach, M. W., & Schmid, H. P. (2002). A three-dimensional backward Lagrangian footprint model for a wide range of bounda-ry-layer stratifications. Boundary-Layer Meteo, 103(2), 205–226.
Lai, A. C. K., & Chen, F. Z. (2007). Comparison of a new Eulerian model with a modified Lagrangian approach for particle distribution and deposition indoors. Atmospheric Environment, 41, 5249–5256.
Lamarque, J. F., Bond, T. C., Eyring, V., Granier, C., Heil, A., Klimont, Z., et al. (2010). Historical (1850-2000) gridded anthropogenic and biomass burning emissions of reactive gases and aerosols: Methodology and application. Atmospheric Chemistry and Physics, 10, 7017–7039.
Lamarque, J. F., Shindell, D. T., Josse, B., Young, P. J., Cionni, I., Eyring, V., et al. (2013). The Atmospheric Chemistry and Climate Model Intercomparison Project (ACCMIP): Overview and description of models, simulations and climate diagnostics. Geoscientific Model Development, 6, 179–206.
Long, C. M., Nascarella, M. A., & Valberg, P. A. (2013). Carbon black vs. black carbon and other airborne materials containing elemental carbon: Physical and chemical distinctions. Environmental Pollution, 181, 271–286.
Manning, A. J., Ryall, D. B., & Derwent, R. G. (2003). Estimating European emissions of ozone-depleting and greenhouse gases using observations and a modeling back-attribution technique. Journal of Geophysical Research, 108, 4405.
Seibert, P., & Frank, A. (2004). Source-receptor matrix calculation with a Lagrangian particle dispersion model in backward mode. Atmos-pheric Chemistry and Physics, 4, 51–63.
Stohl, A. (1998). Computation, accuracy and applications of trajectories—A review and bibliography. Atmospheric Environment, 32(6), 947–966.
Stohl, A., Forster, C., Eckhardt, S., Spichtinger, N., Huntrieser, H., Heland, J., et al. (2003). A backward modeling study of intercontinental pollution transport using aircraft measurements. Journal of Geophysical Research, 108(D12), 4370.
Stohl, A., Kim, J., Li, S., O'Doherty, S., Mühle, J., Salameh, P. K., et al. (2010). Hydrochlorofluoro carbon and hydrofluorocarbon emissions in East Asia determined by inverse modeling. Atmospheric Chemistry and Physics, 10, 3545–3560.
Thompson, R. L., Sasakawa, M., Machida, T., Aalto, T., Worthy, D., Lavric, J. V., et al. (2017). Methane fluxes in the high northern latitudes for 2005–2013 estimated using a Bayesian atmospheric inversion. Atmospheric Chemistry and Physics, 17, 3553–3572.
Wu, L., Bocquet, M., Lauvaux, T., Chevallier, F., Rayner, P., Davis, K., et al. (2011). Optimal representation of source-sink fluxes for mesos-cale carbon dioxide inversion with synthetic data. Journal of Geophysical Research, 116. D21304.
JIA ET AL.
10.1029/2021GL093243
10 of 10
Related Documents


