1 Black Box Software Testing Copyright © 2003-5 Cem Kaner & James Bach Black Box Software Testing Spring 2005 by Cem Kaner, J.D., Ph.D. Professor of Software Engineering Florida Institute of Technology and James Bach Principal, Satisfice Inc. Copyright (c) Cem Kaner & James Bach, 2000-2005 This work is licensed under the Creative Commons Attribution-ShareAlike License. To view a copy of this license, visit http://creativecommons.org/licenses/by-sa/2.0/ or send a letter to Creative Commons, 559 Nathan Abbott Way, Stanford, California 94305, USA. These notes are partially based on research that was supported by NSF Grant EIA-0113539 ITR/SY+PE: "Improving the Education of Software Testers." Any opinions, findings and conclusions or recommendations expressed in this material are those of the author(s) and do not necessarily reflect the views of the National Science Foundation.

Black Box Software Testing Copyright © 2003-5 Cem Kaner & James Bach 1 Black Box Software Testing Spring 2005 by Cem Kaner, J.D., Ph.D. Professor of Software.
Dec 13, 2015
Welcome message from author
This document is posted to help you gain knowledge. Please leave a comment to let me know what you think about it! Share it to your friends and learn new things together.
Transcript

1Black Box Software Testing Copyright © 2003-5 Cem Kaner & James Bach
Black Box Software Testing
Spring 2005by
Cem Kaner, J.D., Ph.D.Professor of Software EngineeringFlorida Institute of Technologyand
James BachPrincipal, Satisfice Inc.
Copyright (c) Cem Kaner & James Bach, 2000-2005This work is licensed under the Creative Commons Attribution-ShareAlike License. To view a copy of this license, visit http://creativecommons.org/licenses/by-sa/2.0/ or send a letter to Creative Commons, 559 Nathan Abbott Way, Stanford, California 94305, USA.
These notes are partially based on research that was supported by NSF Grant EIA-0113539 ITR/SY+PE: "Improving the Education of Software Testers." Any opinions, findings and conclusions or recommendations expressed in this material are those of the author(s) and do not necessarily reflect the views of the National Science Foundation.

2Black Box Software Testing Copyright © 2003-5 Cem Kaner & James Bach
Key Challenges of Testing (2) Complete Testing Is Impossible

3Black Box Software Testing Copyright © 2003-5 Cem Kaner & James Bach
Complete testing?What do we mean by "complete testing"?
• Complete "coverage": Tested every line / branch / basis path?• Testers not finding new bugs?• Test plan complete?
• After all, if there are more bugs, you can find them if you do more testing. So testing couldn't yet be "complete."
Complete testing must mean that, at the end oftesting, you know there are no remaining unknown bugs.

4Black Box Software Testing Copyright © 2003-5 Cem Kaner & James Bach
Complete coverage?Some people (try to) simplify away the problem of complete testing by advocating "complete coverage."
• What is coverage?– Extent of testing of certain attributes or pieces of the program, such
as statement coverage or branch coverage or condition coverage.– Extent of testing completed, compared to a population of possible
tests.• Typical definitions are oversimplified. They miss, for example,
– Interesting data values and data combinations– Missing code– Interrupts and other parallel operations
• The number of variables we might measure is stunning. I (Kaner) listed 101 examples in Software Negligence & Testing Coverage.

5Black Box Software Testing Copyright © 2003-5 Cem Kaner & James Bach
Complete coverage?
• Consider the following program:
Input A // the program accepts any
Input B // integer into A and B
Print A/B
• We can achieve complete coverage easily.
• Set A to 2 and B to 1 and you’ve covered every statement (and every branch) in this program.
• But this doesn’t achieve complete testing. – What test is missing?
– What bug was missed?

6Black Box Software Testing Copyright © 2003-5 Cem Kaner & James Bach
Complete coverage?Some people (try to) simplify away the problem of complete testing by advocating "complete coverage."
• What is coverage?– Extent of testing of certain attributes or pieces of the program, such
as statement coverage or branch coverage or condition coverage.– Extent of testing completed, compared to a population of possible
tests.• Typical definitions are oversimplified. They miss, for example,
– Interesting data values and data combinations– Interrupts and other parallel operations– Missing code
• The number of variables we might measure is stunning. I (Kaner) listed 101 examples in Software Negligence & Testing Coverage.

7Black Box Software Testing Copyright © 2003-5 Cem Kaner & James Bach
Measuring and achieving high coverageCoverage measurement is a good tool to show how far you are from complete testing.
• But it’s a lousy tool for investigating how close you are to completion.• Driving testing to achieve “high” coverage is likely to yield a mass of
low-power tests.– People optimize what we measure them against, at the expense of what
we don’t measure.• For more on measurement distortion and dysfunction, read Bob
Austin’s book, Measurement and Management of Performance in Organizations.
– Brian Marick discusses this and other problems with this and several other issues in his papers at www.testing.com (e.g. How to Misuse Code Coverage). Marick has been involved in development of several of the commercial coverage tools.

8Black Box Software Testing Copyright © 2003-5 Cem Kaner & James Bach
What about bug find rates?Some people measure completeness of testing
with bug curves: • New bugs found per week ("Defect arrival rate")
• Bugs still open (each week)
• Ratio of bugs found to bugs fixed (per week)
Week
Bu
gs
Pe
r W
eek

9Black Box Software Testing Copyright © 2003-5 Cem Kaner & James Bach
Weibull reliability model Bug curves can be useful progress indicators, but some people fit the data to theoretical curves to determine when the project will complete.The model’s assumptions• Testing occurs in a way similar to the way the software will be operated.• All defects are equally likely to be encountered.• Defects are corrected instantaneously, without introducing additional
defects.• All defects are independent.• There is a fixed, finite number of defects in the software at the start of
testing.• The time to arrival of a defect follows the Weibull distribution.• The number of defects detected in a testing interval is independent of the
number detected in other testing intervals for any finite collection of intervals.– See Erik Simmons, When Will We Be Done Testing? Software Defect Arrival
Modelling with the Weibull Distribution.

10Black Box Software Testing Copyright © 2003-5 Cem Kaner & James Bach
The Weibull modelI think it’s absurd to rely on a distributional model (or any model) when every assumption it makes about testing is obviously false.
• One of the advocates of this approach points out that
“Luckily, the Weibull is robust to most violations.”
– This illustrates the use of surrogate measures—we don’t have an attribute description or model for the attribute we really want to measure, so we use something else, that is allegedly “robust”, in its place. This can be very dangerous
– The Weibull distribution has a shape parameter that allows it to take a very wide range of shapes. If you have a curve that generally rises then falls (one mode), you can approximate it with a Weibull.
BUT WHAT DOES THAT TELL US? HOW SHOULD WE INTERPRET IT?

11Black Box Software Testing Copyright © 2003-5 Cem Kaner & James Bach
Side effects of bug curves
• When development teams are pushed to show project bug curves that look like the Weibull curve, they are pressured to show a rapid rise in their bug counts, an early peak, and a steady decline of bugs found per week.
• In practice, project teams, including testers, in this situation often adopt dysfunctional methods, doing things that will be bad for the project over the long run in order to make the numbers go up quickly.
• For more on measurement dysfunction, read Bob Austin’s book, Measurement and Management of Performance in Organizations.– For more observations of problems like these in reputable
software companies, see Doug Hoffman's article, The Dark Side of Software Metrics.

12Black Box Software Testing Copyright © 2003-5 Cem Kaner & James Bach
Side effects of bug curves:Early testing
• Predictions from these curves are based on parameters estimated from the data. You can start estimating the parameters once the curve has hit its peak and gone down a bit.
• The sooner the project hits its peak, the earlier we would predict the product will ship.
• So, early in testing, the pressure on testers is to drive the bug count up quickly, as soon as possible.
Week
Bu
gs
Pe
r W
ee
k

13Black Box Software Testing Copyright © 2003-5 Cem Kaner & James Bach
Side effects of bug curvesEarlier in testing, the pressure is to increase bug counts. In response, testers will:
• Run tests of features known to be broken or incomplete.• Run multiple related tests to find multiple related bugs.• Look for easy bugs in high quantities rather than hard bugs.• Less emphasis on infrastructure, automation architecture, tools and
more emphasis of bug finding. (Short term payoff but long term inefficiency.)

14Black Box Software Testing Copyright © 2003-5 Cem Kaner & James Bach
Side effects of bug curves:Later in testing
• After we get past the peak, the expectation is that testers will find fewer bugs each week than they found the week before.
• Based on the number of bugs found at the peak, and the number of weeks it took to reach the peak, the model can predict the later curve, how many bugs per week in each subsequent week.
Week
Bu
gs
Pe
r W
ee
k

15Black Box Software Testing Copyright © 2003-5 Cem Kaner & James Bach
Side effects of bug curvesLater in testing, the pressure is to decrease the new bug rate:• Run lots of already-run regression tests.• Don’t look as hard for new bugs.• Shift focus to appraisal, status reporting.• Classify unrelated bugs as duplicates.• Class related bugs as duplicates (and closed), hiding key data about
the symptoms / causes of the problem.• Postpone bug reporting until after the measurement checkpoint
(milestone). (Some bugs are lost.)• Report bugs informally, keeping them out of the tracking system.• Testers get sent to the movies before measurement checkpoints.• Programmers ignore bugs they find until testers report them.• Bugs are taken personally.• More bugs are rejected.

16Black Box Software Testing Copyright © 2003-5 Cem Kaner & James Bach
Bad models are counterproductive
Shouldn't We Strive For This ?
Week
Bu
gs
Pe
r W
ee
k

17Black Box Software Testing Copyright © 2003-5 Cem Kaner & James Bach
Testers live and breathe tradeoffsThe time needed for test-related tasks is infinitely larger than the time available.
Example: Time you spend on
- analyzing, troubleshooting, and effectively describing a failure
Is time no longer available for
- Designing tests - Documenting tests
- Executing tests - Automating tests
- Reviews, inspections - Supporting tech support
- Retooling - Training other staff

18Black Box Software Testing Copyright © 2003-5 Cem Kaner & James Bach
Let's consider the nature of the infinite set of testsThere are enormous numbers of possible tests. To test everything, you would have to:
• Test every possible input to every variable (including output variables and intermediate results variables).
• Test every possible combination of inputs to every combination of variables.
• Test every possible sequence through the program.
• Test every hardware / software configuration, including configurations of servers not under your control.
• Test every way in which any user might try to use the program.
» Read The Impossibility of Complete Testing

19Black Box Software Testing Copyright © 2003-5 Cem Kaner & James Bach
Inputs to individual variablesConsider the “valid” inputs
• Doug Hoffman worked for MASPAR (the Massively Parallel computer, 64K parallel processors).
• The MASPAR computer has several built-in mathematical functions. We’re going to consider the Integer square root.
• This function takes a 32-bit word as an input. Any bit pattern in that word can be interpreted as an integer whose value is between 0 and 232-1. There are 4,294,967,296 possible inputs to this function.
• How many of them should we test? • How many would you test?

20Black Box Software Testing Copyright © 2003-5 Cem Kaner & James Bach
Inputs to individual variablesConsider the “valid” inputs
What if you knew this machine was to be used for mission-critical and life-critical applications.?–To test the 32-bit integer square root function, Hoffman checked all values (all 4,294,967,296 of them). This took the computer about 6 minutes to run the tests and compare the results to an oracle.
–There were 2 (two) errors, neither of them near any boundary. (The underlying error was that a bit was sometimes mis-set, but in most error cases, there was no effect on the final calculated result.) Without an exhaustive test, these errors probably wouldn’t have shown up.
–What about the 64-bit integer square root? How could we find the time to run all of these? If we don't run them all, don't we risk missing some bugs?
21Black Box Software Testing Copyright © 2003-5 Cem Kaner & James Bach
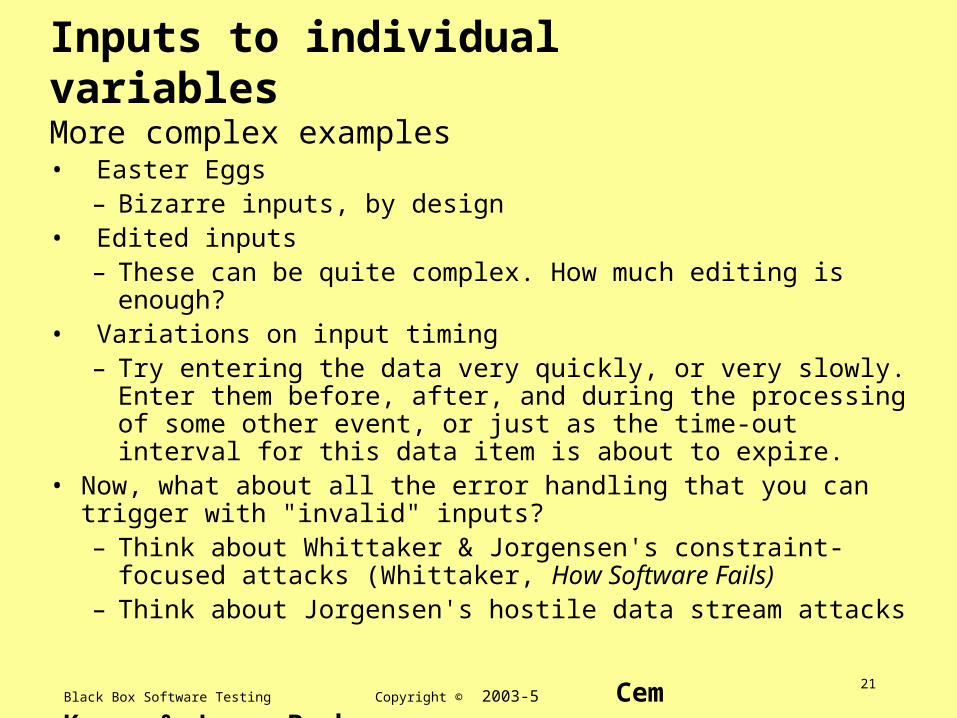
Inputs to individual variablesMore complex examples
• Easter Eggs– Bizarre inputs, by design
• Edited inputs – These can be quite complex. How much editing is enough?
• Variations on input timing– Try entering the data very quickly, or very slowly. Enter them
before, after, and during the processing of some other event, or just as the time-out interval for this data item is about to expire.
• Now, what about all the error handling that you can trigger with "invalid" inputs?– Think about Whittaker & Jorgensen's constraint-focused attacks
(Whittaker, How Software Fails)– Think about Jorgensen's hostile data stream attacks

22Black Box Software Testing Copyright © 2003-5 Cem Kaner & James Bach
When people challenge extreme value tests…
“No user would do that.”
“No user I can think of, who I like,would do that on purpose.”
Who aren’t you thinking of?Who don’t you like who might really use this product?What might good users do by accident?

23Black Box Software Testing Copyright © 2003-5 Cem Kaner & James Bach
Combination testingVariables interact. • Example 1: a program crashed when attempting
to print preview a high resolution (back then, 600x600 dpi) output on a high resolution screen. The option selections for printer resolution and screen resolution were interacting.
• Example 2: American Airlines couldn’t print tickets if a string concatenating the fares associated with all segments was too long.
• Example 3: Memory leak in WordStar if text was marked Bold / Italic (rather than Italic / Bold)

24Black Box Software Testing Copyright © 2003-5 Cem Kaner & James Bach
Combination testingVariables interact.
Suppose there are N independent variables. • Label the number of choices for the variables as V1, V2
through VN.• The total number of possible combinations is
V1 x V2 x . . . x VN. This is huge.– A field that accepts only {1, 2, 3} and another that accepts
only {A, B, C} yields 9 cases, 1A, 1B, 1C, 2A, 2B, 2C, 3A, 3B, & 3C.
– Combine two fields that accept one digit (0 to 9) each, yields 10 x 10 = 100 possible combinations.
– 318,979,564,000 possible combinations of the first four moves in chess.

25Black Box Software Testing Copyright © 2003-5 Cem Kaner & James Bach
Sequences
A
B
C
D
E
F
G
H
I
X EXIT
< 20 timesthrough the loop
Here’s an example that shows that there are too many paths to test in even a fairly simple program. This is from Myers, The Art of Software Testing.

26Black Box Software Testing Copyright © 2003-5 Cem Kaner & James Bach
Sequences
A
B
C
D
E
F
G
H
I
X EXIT
< 20 timesthrough the loop
There are 5 ways to get from A to X. One of them is ABX--EXIT

27Black Box Software Testing Copyright © 2003-5 Cem Kaner & James Bach
Sequences
A
B
C
D
E
F
G
H
I
X EXIT
< 20 timesthrough the loop
A second path is ACDFX--EXIT

28Black Box Software Testing Copyright © 2003-5 Cem Kaner & James Bach
Sequences
A
B
C
D
E
F
G
H
I
X EXIT
< 20 timesthrough the loop
Third: ACDGX--EXIT

29Black Box Software Testing Copyright © 2003-5 Cem Kaner & James Bach
Sequences
A
B
C
D
E
F
G
H
I
X EXIT
< 20 timesthrough the loop
Fourth: ACEHX--EXIT

30Black Box Software Testing Copyright © 2003-5 Cem Kaner & James Bach
Sequences
A
B
C
D
E
F
G
H
I
X EXIT
< 20 timesthrough the loop
Fifth: ACEIX--EXIT. There are 5 ways to get from A to the EXIT if you go through X only once.

31Black Box Software Testing Copyright © 2003-5 Cem Kaner & James Bach
Sequences
A
B
C
D
E
F
G
H
I
X EXIT
< 20 timesthrough the loop
But you can go through X more than once. Here’s another path. ACEHXABX--EXIT.

32Black Box Software Testing Copyright © 2003-5 Cem Kaner & James Bach
Sequences
There are 5 ways to get to X the first time, 5 more to get back to X the second time, so there are 5 x 5 = 25 cases for reaching EXIT by passing through X twice.
A
B
C
D
E
F
G
H
I
X EXIT
< 20 timesthrough the loop

33Black Box Software Testing Copyright © 2003-5 Cem Kaner & James Bach
SequencesAnalyzing Myers’ example
• There are 51 + 52 + ... + 519 + 520 = 1014 = 100 trillion paths through the program.
• It would take only a billion years to test every path (if one could write, execute and verify a test case every five minutes).

34Black Box Software Testing Copyright © 2003-5 Cem Kaner & James Bach
Sequences
A
B
C
D
E
F
G
H
I
X EXIT
< 20 timesthrough the loop
The stack bug was just like this program, with a garbage collector at B (the idle state) and a stack leak at F (hang up from hold). If you hit F N times without touching B, when you try to put a 21-Nth call on hold, you overflow the stack and crash.
CleanupMemory leak

35Black Box Software Testing Copyright © 2003-5 Cem Kaner & James Bach
Phone System: The Telenova Stack Failure
Telenova Station Set 1. Integrated voice and data.108 voice features, 110 data features. 1984.

36Black Box Software Testing Copyright © 2003-5 Cem Kaner & James Bach
The Telenova Stack Failure
Context-sensitive display
10-deep hold queue10-deep wait queue

37Black Box Software Testing Copyright © 2003-5 Cem Kaner & James Bach
The Telenova Stack FailureA simplified state diagram showing the bug
Caller hung up
Idle
Connected
On Hold
Ringing
Youhung up

38Black Box Software Testing Copyright © 2003-5 Cem Kaner & James Bach
The Telenova Stack FailureThe bug that triggered the simulation:
Beta customer (a stock broker) reported random failures • Could be frequent at peak times• An individual phone would crash and reboot, with other phones crashing while
the first was rebooting• On a particularly busy day, service was disrupted all (East Coast) afternoonWe were mystified:• All individual functions worked• We had tested all lines and branches.Ultimately, we found the bug in the hold queue• Up to 10 calls on hold, each adds record to the stack• Initially, the system checked stack whenever call was added or removed, but this
took too much system time. So we dropped the checks and added these– Stack has room for 20 calls (just in case)– Stack reset (forced to zero) when we knew it should be empty
• The error handling made it almost impossible for us to detect the problem in the lab. Because we couldn’t put more than 10 calls on the stack (unless we knew the magic error), we couldn’t get to 21 calls to cause the stack overflow.

39Black Box Software Testing Copyright © 2003-5 Cem Kaner & James Bach
Telenova Stack Failure
Idle
Connected
On Hold
RingingCaller
hung up
Youhung up

40Black Box Software Testing Copyright © 2003-5 Cem Kaner & James Bach
Sequences
A
B
C
D
E
F
G
H
I
X EXIT
< 20 timesthrough the loop
The stack bug was just like this program, with a garbage collector at B (the idle state) and a stack leak at F (hang up from hold). If you hit F N times without touching B, when you try to put a 21-Nth call on hold, you overflow the stack and crash.
IdleCaller hangs up

41Black Box Software Testing Copyright © 2003-5 Cem Kaner & James Bach
Telenova Stack FailureWhy are we spending so much time on this example?
• Because it illustrates several important points:– Simplistic approaches to path testing can miss critical defects.
– Critical defects can arise under circumstances that appear (in a test lab) so specialized that you would never intentionally test for them.
– When (in some future course or book) you hear a new methodology for combination testing or path testing, I want you to test it against this defect. If you had no suspicion that there was a stack corruption problem in this program, would the new method lead you to find this bug?
• This example lays a foundation for our introduction to random / statistical testing. We’ll return to it later this term.

42Black Box Software Testing Copyright © 2003-5 Cem Kaner & James Bach
Telenova Stack Failure
Having found and fixed the hold-stack bug, should we assume
that we’ve taken care of the problemor that if there is one long-sequence bug,
there will be more?
Hmmm…If you kill a cockroach in your kitchen,
do you assumeyou’ve killed the last bug?
Or do you call the exterminator?

43Black Box Software Testing Copyright © 2003-5 Cem Kaner & James Bach
Closing Thoughts
We’ve addressed two key challenges today:• The impossibility of complete testing: No how much testing you do, there
will be additional plausible tests.– The more time you spend running tests, the less time you have for other test-
related activities.– People (standards organizations, trainers, certifiers, managers) will make long,
long lists of tasks for you to do and documents for you to create. But you can’t do them all.
– What you do, and what you do not do, are matters of judgment.• The measurement problem: the field hasn’t reached consensus on how to
measure how much testing has been done, how much is enough, or how to measure how close you are to release.– We might be able to return to this topic later in the term. The main work comes in
your course on software metrics.– For now, you should be familiar with the idea of coverage, that there are many
types of coverage, with status curves, and side effects of measurement.
Related Documents