meaStudies 08 Mannheim Research Institute for the Economics of Aging Formation and Updating of Subjective Life Expectancy: Evidence from Germany Bjarne Steffen

Welcome message from author
This document is posted to help you gain knowledge. Please leave a comment to let me know what you think about it! Share it to your friends and learn new things together.
Transcript

meaStudies 08
mea
Stud
ies 0
8
Mannheim Research Institute for the Economics of Aging
meaMannheimer Forschungsinstitut Ökonomie und demografischer Wandel
L13, 17Universität Mannheim68131 Mannheim
Tel 0621 - 181 18 62Fax 0621 - 181 18 63
info mea.uni-mannheim.dewww.mea.uni-mannheim.de
Formation and Updating of Subjective Life Expectancy:Evidence from Germany
Bjar
ne St
effe
n
For
mat
ion
and
Upda
ting
of Su
bjec
tive
Life
Expe
ctan
cy: E
vide
nce
from
Ger
man
y
Bjarne Steffen
studies02cover.indd 1 27.05.2009 15:48:15

Formation and Updating
of Subjective Life Expectancy:
Evidence from Germany1
Bjarne Ste�en2
May 2009
1The following text is based on my diploma thesis in fall 2008. I am verygrateful to Professor Börsch-Supan for valuable support and encouragement dur-ing my studies at University of Mannheim. I would like to thank Daniel Schunkfor giving me the opportunity to work with the SAVE data. Alexander Ludwigand Martin Salm have been excellent thesis supervisors, their advice improvedmy work a lot. I also thank seminar participants at MEA for helpful comments.
2The author can be reached at mail@bjarneste�en.de

ii

Contents
1 Subjective Life Expectancy Matters: Motivation and
De�nitions 1
1.1 Reasons to Study Subjective LifeExpectancy . . . . . . . . . . . . . . . . . . . . . . . . 2
1.1.1 Decisions on Old-Age Provision . . . . . . . . . 2
1.1.2 Decisions on Lifestyle and Behavior . . . . . . . 4
1.1.3 Understanding Human Behavior . . . . . . . . 5
1.2 Structure of the Study . . . . . . . . . . . . . . . . . . 6
1.3 De�nition of Basic Concepts . . . . . . . . . . . . . . . 6
1.3.1 Measures of Remaining Life . . . . . . . . . . . 6
1.3.2 Actuarial and Subjective Life Expectancies . . 8
2 What We Know:
Past Research 11
2.1 Psychology . . . . . . . . . . . . . . . . . . . . . . . . 12
2.1.1 Heuristics and Biases in Estimation of Proba-bilities . . . . . . . . . . . . . . . . . . . . . . . 12
2.1.2 Attitudes Toward Death . . . . . . . . . . . . . 13
2.1.3 Correlational Studies . . . . . . . . . . . . . . . 14
2.1.4 Summary of Empirical Evidence . . . . . . . . 17
2.2 Sociology . . . . . . . . . . . . . . . . . . . . . . . . . 18
2.2.1 Theory on Individual Risk Perception . . . . . 18
2.2.2 Subjective LE by Age and Sex . . . . . . . . . 20
iii

2.2.3 The Importance of Socioeconomic Status . . . . 212.2.4 Social Support through Family Relationships . 232.2.5 Summary of Empirical Evidence . . . . . . . . 23
2.3 Epidemiology . . . . . . . . . . . . . . . . . . . . . . . 242.3.1 General Self-Ratings as Predictors of Mortality 242.3.2 Subjective LE as Predictor of Mortality . . . . 242.3.3 Summary of Empirical Evidence . . . . . . . . 26
2.4 Economics . . . . . . . . . . . . . . . . . . . . . . . . . 262.4.1 Methodological Discussions . . . . . . . . . . . 262.4.2 Consistency of Subjective and Actuarial Esti-
mates . . . . . . . . . . . . . . . . . . . . . . . 302.4.3 Survival Probabilities by Age, Sex and other
Correlates . . . . . . . . . . . . . . . . . . . . . 332.4.4 Updating of Survival Probabilities . . . . . . . 39
2.5 Summary: What we Know . . . . . . . . . . . . . . . . 45
3 What we Want to Know:
Contribution of the Study 51
3.1 Joint Analysis of Determinants . . . . . . . . . . . . . 523.2 Analysis of Subjective LE in Germany . . . . . . . . . 523.3 Understanding Updating of Subjective LE . . . . . . . 533.4 Split-up of Subjective LE . . . . . . . . . . . . . . . . 54
4 Determinants of Subjective Life Expectancy: New Ev-
idence from Germany 55
4.1 Data and Variables . . . . . . . . . . . . . . . . . . . . 564.1.1 Pooled SAVE Sample . . . . . . . . . . . . . . 564.1.2 Variable Construction . . . . . . . . . . . . . . 61
4.2 Descriptive Analysis . . . . . . . . . . . . . . . . . . . 684.2.1 Personal LE Compared to Age Group . . . . . 684.2.2 Comparison of Subjective and Actuarial LE . . 73
4.3 Regression Analysis . . . . . . . . . . . . . . . . . . . . 784.3.1 Regression Models . . . . . . . . . . . . . . . . 784.3.2 Regression Results . . . . . . . . . . . . . . . . 81
iv
4.3.3 Discussion . . . . . . . . . . . . . . . . . . . . . 91
5 Updating of Subjective Life Expectancy: Testing a
Simple Model 97
5.1 Model . . . . . . . . . . . . . . . . . . . . . . . . . . . 985.1.1 Background and Motivation . . . . . . . . . . . 985.1.2 Updating Model . . . . . . . . . . . . . . . . . 99
5.2 Data and Variables . . . . . . . . . . . . . . . . . . . . 1015.2.1 Panel Dataset . . . . . . . . . . . . . . . . . . . 1015.2.2 Variable Construction . . . . . . . . . . . . . . 101
5.3 Descriptive Analysis . . . . . . . . . . . . . . . . . . . 1055.4 Regression Analysis . . . . . . . . . . . . . . . . . . . . 108
5.4.1 Regression Models and Formal Hypothesis . . . 1085.4.2 Regression Results . . . . . . . . . . . . . . . . 1105.4.3 Discussion . . . . . . . . . . . . . . . . . . . . . 114
6 Conclusion 115
6.1 Summary and Implications . . . . . . . . . . . . . . . 1166.2 Future Research . . . . . . . . . . . . . . . . . . . . . . 117
A Results from Sensitivity Analyses 119
B Questions on Subjective LE 131
Bibliography 133
v

vi

List of Figures
1.1 Example of survival curve . . . . . . . . . . . . . . . . 9
2.1 Example of probability visualization . . . . . . . . . . 302.2 Subjective and Objective Survival Functions . . . . . . 312.3 Survival Probabilities in HRS 2002-2004 . . . . . . . . 37
4.1 Age Distribution in SAVE 2005-2007 (unweighted) . . 604.2 Estimations of LE in SAVE by Age . . . . . . . . . . . 694.3 LE Compared to Average (unweighted) . . . . . . . . . 704.4 Comparison with Average at Di�erent Ages . . . . . . 714.5 Reasons for Expected Shorter or Longer Life . . . . . . 724.6 Subjective and Actuarial LE . . . . . . . . . . . . . . . 744.7 International Comparison of Subjective LE . . . . . . 764.8 Estimated Average and Actuarial LE . . . . . . . . . . 77
5.1 Adjustment of Subjective LE . . . . . . . . . . . . . . 1065.2 Illustration of Selection E�ect . . . . . . . . . . . . . . 114
vii

viii

List of Tables
2.1 Hurd, McGarry (1995) . . . . . . . . . . . . . . . . . 35
2.2 Hurd, McFadden, Gan 1998 . . . . . . . . . . . . . . . 36
2.3 Betz (2005) . . . . . . . . . . . . . . . . . . . . . . . . 38
4.1 Dataset Preparation . . . . . . . . . . . . . . . . . . . 61
4.2 Overview Variables part 1 . . . . . . . . . . . . . . . . 66
4.3 Overview Variables part 2 . . . . . . . . . . . . . . . . 67
4.4 Determinants of Subjective LE: Regression Results (Men) 83
4.5 Determinants of Subjective LE: Regression Results (Men)-continued- . . . . . . . . . . . . . . . . . . . . . . . . 84
4.6 Determinants of Subjective LE: Regression Results (Women). . . . . . . . . . . . . . . . . . . . . . . . . . . . . . . 85
4.7 Determinants of Subjective LE: Regression Results (Women)-continued- . . . . . . . . . . . . . . . . . . . . . . . . 86
4.8 Selection Model �Implausible Answers� . . . . . . . . 93
5.1 Overview Health Variables . . . . . . . . . . . . . . . . 102
5.2 Panel Responses Concerning Illnesses . . . . . . . . . . 104
5.3 Health Shock Heterogeneity in LE . . . . . . . . . . . 105
5.4 Transition Matrices (LE Compared to Average) . . . . 107
5.5 Transition Probabilities (LE Compared to Average) . . 107
5.6 Regression Results Updating (Men) . . . . . . . . . . . 111
5.7 Regression Results Updating (Women) . . . . . . . . . 112
ix

A.1 Regression Results Unweighted (Men) . . . . . . . . . 120A.2 Regression Results Unweighted (Men) -continued- . . . 121A.3 Regression Results Unweighted (Women) . . . . . . . . 122A.4 Regression Results Unweighted (Women) -continued- . 123A.5 Regression Results Including Implausible Answers (Men)124A.6 Regression Results Including Implausible Answers (Men)
-continued- . . . . . . . . . . . . . . . . . . . . . . . . 125A.7 Regression Results Including Implausible Answers (Women)
. . . . . . . . . . . . . . . . . . . . . . . . . . . . . . . 126A.8 Regression Results Including Implausible Answers (Women)
-continued- . . . . . . . . . . . . . . . . . . . . . . . . 127A.9 Regression Results Updating with Access Panel-Dummy
(Men) . . . . . . . . . . . . . . . . . . . . . . . . . . . 128A.10 Regression Results Updating with Access Panel-Dummy
(Women) . . . . . . . . . . . . . . . . . . . . . . . . . 129
x

Chapter 1
Subjective Life Expectancy
Matters: Motivation and
De�nitions
As an input variable of individual decision-making, subjective life ex-pectancy substantially in�uences economic decisions. Examples in-clude old-age provision of the younger, dissaving of the older, andlife-shortening behavior like smoking or self-induced obesity. Thischapter evaluates the reasons to study subjective life expectancy froman economist's point of view and introduces basic concepts and de�-nitions.
1

1.1 Reasons to Study Subjective Life
Expectancy
Understanding subjective expectations is a fundamental step in theanalysis of important economic decisions. The future is uncertain,and in many situations an objective probability distribution of fu-ture states of the world is unavailable or di�cult to obtain. The sit-uation of an unavailable objective probability distribution has beenformalized by Savage (1954), who shows how individuals can basetheir decisions on a subjective probability distribution.
One of the major uncertainties all individuals are faced with is thelength of their life. Even though re�ection about the probability todie is unpleasant and rarely explicitly done1, important decisions can-not be made without taking into consideration one's life expectancy,and inappropriate expectations can have grave consequences.
1.1.1 Decisions on Old-Age Provision
Most obvious, all decisions concerning life-cycle consumption andsaving are a�ected by longevity expectations. Based on certain as-sumptions (rational individuals, diminishing marginal utility of con-sumption) and given a hump-shaped income distribution over life-time, the life-cycle model derives paths of consumption, labor supply,and savings from the dynamic optimization problem over a horizonT (see Modigliani and Brumberg (1954)). Empirical evidence showsthat extended versions of the pure life-cycle model describe many pat-terns of retirement savings reasonably well (see, e.g., Browning and
1People seem to follow what Greek philosopher Epicurus advised in his letter toMenoeceus: �Accustom yourself to believe that death is nothing to us, for good andevil imply awareness, and death is the privation of all awareness; therefore a rightunderstanding that death is nothing to us makes the mortality of life enjoyable,not by adding to life an unlimited time, but by taking away the yearning afterimmortality.�
2

Crossley (2001) for empirical evidence and Camerer and Loewenstein(2004) for limitations of the rational life-cycle model).
But what is the relevant horizon T? Empirical life-cycle-models ei-ther use the expected value of peoples' life expectancy (T = E[LE]),or they implement an age-dependent probability to survive in everyperiod such that
∑st = E[LE]. However, studies show that people
on average do not draw on actuarial mortality tables, but have a sub-jective survival curve which di�ers in several ways (see section 2.4.2).This seriously a�ects retirement saving decisions in younger years, a�eld of growing importance given the increasing necessity of privateold-age provisions (such as 401(k) plans in the U.S. or Riester-Rentenin Germany). Understanding determinants of saving decisions is ofprofessional interest for the life insurance and investment industry:Knowing the typical factors which lead people to estimate an espe-cially high or low life expectancy can help to design and sell speci�cinvestment plans.
Besides the �nancial retail sector, policy makers, too, should careabout subjective life expectancies: An adequate estimation is of highimportance for individuals who su�er from sharp income cuts in themoment of retirement if they did not save enough. This also in�u-ences the economy as a whole, which is a�ected by a lower capitalstock and higher expenses to support poor elderly persons.
For instance, a simulation study for Germany showed that underesti-mated longevity probability can explain why 60% of German house-holds do not save su�ciently to cover the reduction in public pensionincome from the Riester reform act (Börsch-Supan, Essig, and Wilke(2005))2. Other decisions a�ected by subjective life expectatancies
2In recent years, the investments in private old-age provisions increased inGermany. See Börsch-Supan, Coppola, Essig, Eymann, and Schunk (2008) for adescription of recent trends.
3

are the moment of retirement and the decision whether to annu-itize wealth, which has been empirically analyzed for the U.S. (Hurd,Smith, and Zissimopoulos (2004)). It is an open question if sys-tematic downward-biases in subjective life expectancies might alsoin�uence the public opinion concerning pension reforms increasingthe retirement age.
1.1.2 Decisions on Lifestyle and Behavior
Besides savings, important decisions about unhealthy behavior arerelated to subjective life expectancy. One of the fastest growing pub-lic health problems in the United States is obesity, with 32.2% ofadults being obese in 2004 (Ogden (2006)). In Europe the situationis worsening as well: Germany, for instance, counts about 32 mio.overweight people who risk to become obese (Bundesministerium fürGesundheit (2008)3). Even though severe health consequences ofobesity are commonly known, economic research agrees that mostof the overweight is caused by self-determined overeating and aki-netic lifestyle (Bleich, Cutler, Murray, and Adams (2007)). Negativehealth consequences (including diabetes, cancer, cardiovascular dis-ease and osteoarthritis) are illustrated by the resulting excess mor-tality. Do people underestimate excess mortality when they decide tostick to their unhealthy lifestyle? Empirical research using the Healthand Retirement Survey found that misperception of negative conse-quences is actually widespread: While people with a very high bodymass index (BMI) report slightly lower subjective longevity proba-bilities, the reductions are signi�cantly less than those obtained fromactuarial survival curves (Falba and Busch (2005)).
Another widespread unhealthy behavior is smoking. The negativehealth consequences provoked extensive discussions whether legisla-
3In June 2008, the German Federal Government launched an action plan�Deutschland In Form� increasing e�orts to �ght obesity.
4

tion has to put more e�ort into enlightening people of the danger,resulting in large warnings on tobacco packagings. In the EuropeanUnion, these warnings include the remark �smokers die younger � (seeAnnex I of Art 5(2)(b), European Union (2001)). Indeed, longitudi-nal analyses indicate a reduction in life expectancy of 3 to 10 yearsdepending on the intensity of smoking (Doll, Peto, Boreham, andSutherland (2004)). Given the prevalence of smoking, the questionwhether this fact is correctly mirrored in subjective life expectan-cies is of large economic relevance. An empirical study using HRS(Health and Retirement Study) data found that smokers in generalreport lower subjective longevity probabilities than non-smokers, butno di�erences can be found between occasional and chain smokers(Smith, Taylor, Sloan, Johnson, and Desvousges (2001)).
Summarizing the facts above, people might keep unhealthy habitsbecause they underestimate life-expectancy reductions from their be-havior. Furthermore, another case of suboptimal decision-making oc-curs if people stick to unhealthy behavior because they (incorrectly)believe to have a short life expectancy anyway (e.g. because of geneticdisposition). Evidence shows that people smoke more and tend toovereat if they have a short subjective life expectancy (Fang, Keane,Khwaja, Salm, and Silverman (2007)).
1.1.3 Understanding Human Behavior
Looking at the areas a�ected, an understanding of the formation andupdating of subjective life expectancy contributes to precise modelingof economic decision making in a substantial way. This study sum-marizes what we know about subjective life expectancy, and providesnew evidence using the German SAVE panel to split up longevity ex-pectations and shed light on their determinants. To this extent, itadds a small piece to a better understanding of individual economicdecision making.
5

1.2 Structure of the Study
The remainder of the study is organized as follows: After some ba-sic de�nitions, chapter 2 summarizes past research on subjective lifeexpectancy. While many important characteristics have been iden-ti�ed, some shortcomings of the literature become apparent and areelaborated in chapter 3: Most of the previous studies focus on theU.S. and results cannot necessarily be transfered to other countries;often only a partial analysis of single e�ects is done; and typicallynot subjective life expectancies but subjective survival probabilitiesare analyzed.
To contribute to these issues, empirical analyses are done in two steps:First, chapter 4 introduces the German SAVE dataset, which is usedto identify basic patterns of subjective life expectancy in Germany.Multivariate analyses provide evidence about the relative importanceof the determinants studied in various previous papers. A split-upof subjective life expectancy into estimated average life expectancyand individual relative expectations provides further insights. Sec-ond, chapter 5 presents a model for the updating of subjective lifeexpectancy, suggesting that people apply a simple heuristic. Themodel is tested using the panel dimension of the SAVE data.
Finally, chapter 6 discusses implications and ideas for further re-search. Some sensitivity analyses as well as an excerpt of the SAVEquestionnaire can be found in the appendix.
1.3 De�nition of Basic Concepts
1.3.1 Measures of Remaining Life
As straightforward as subjective life expectancy sounds, a couple ofdi�erent measures are commonly used, and de�nitions are not thesame across studies. To clarify the discussion, the following terms
6

are used in this study:
� Remaining Life Expectancy (RLE) is the �average numberof years of life remaining to a group of persons reaching a certainage� (Nam (1994)).
E [Remaining Y ears|Age] (1.1)
It decreases if a person gets older, for instance from 82 yearsat birth down to 4 years at an age of ninety.
� We de�ne Life Expectancy (LE) as the sum of RLE andcurrent age:
(LE |Age) = (RLE |Age) + Age (1.2)
Actuarial values are straightforward calculated using life tables.Subjective values can be obtained by surveys. However, peo-ple are not necessarily used to the concept of expected values.Consequently, people might answer a point estimation of themost probable age of demise instead (the modus). The typi-cal phrasing of questionnaires (�To what age do you expect tolive?�) is unclear whether it asks for the mean or the expectedvalue. In actuarial data, the two statistics are quite di�erent:The highest number of deaths occurs at the age of 84 for menand 89 for women, while the average life expectancy (at an ageof 50 years) is 79 for men and 83 for women.
In the literature, some authors use the term �longevity ex-pectancy� in order to distinguish it from �life expectancy� whichis solely used for RLE by these authors. In this study, the shortform �LE� refers to life expectancy as described in equation(1.2). However, all statements are also true for RLE (as this isjust LE less the current age).
7

� Naturally, a probability distribution (like the one for the mo-ment of death) is not completely characterized by its mean).Consequently, Survival Probabilities are used besides LEto describe expectations. They can be described as point es-timation of the probability to reach a speci�c age, for exam-ple �50%�. Survival probabilities can be measured with surveyquestions (e.g., �Using any number from 0 to 100 where 0 equalsabsolutely no chance and 100 equals absolutely certain, what doyou think are the chances you will live to be 75 or more?�).However it might be di�cult for the respondents to think inprobabilities (see section 2.4.1). The following notation is used:
20ps60 describes the probability to reach an age of 60 at a current
age of 20, the superscript s refers to subjective probabilities (ascompared to a for actuarial probabilities). If it is clear from thecontext at which age the respondents are asked, the notationis simpli�ed to ps
60.
� Theoretically, an inquiry of di�erent survival probabilities canlead to a complete characterization of the probability distribu-tion. One way to describe the distribution is the cumulativedistribution function cdf of ages at death, giving a monotonicincreasing curve. However, the convention is to use SurvivalCurves, a common concept in demography. Survival curvesplot the probability of survival until di�erent ages, leading toa monotonic decreasing curve. Figure 1.1 gives an example.
1.3.2 Actuarial and Subjective Life Expectancies
All the indicators presented above can be used to measure subjec-tive as well as objective values. This study addresses subjective LE,as it is usually surveyed in interviews. For comparison we refer toactuarial LE at some points, which objectively projects from the ac-tuarial age-speci�c survival rates as they can be found in life tables.
8

Figure 1.1: Example of survival curve
It should always be kept in mind that these numbers do not includeexpected improvements in LE in the future. Some models have beendeveloped to account for the evolution of mortality rates, most promi-nently Lee and Carter (1992). The ongoing discussion among demog-raphers concerning the �right� extrapolation shows that it is di�cultto predict future technological trends4. To be able to make somestatements nonetheless, Schnabel, Kistowski, and Vaupel (2005) aswell as Börsch-Supan and Wilke (2007) extrapolate past mortalityimprovements linearly to estimate di�erent scenarios for Germany.
Due to the high uncertainty of any extrapolation, this study followsthe convention to use actuarial LE from life tables, and keeps in mindthat these values underestimate �true actuarial� longevity and ratherpresent a lower bound. At some points we will come back to thispoint, but for most purposes the approximation is reasonably good.
4See the articles and letters in Science 02/2001 and 06/2001.
9

10

Chapter 2
What We Know:
Past Research
Given the relevance of subjective LE, a considerable amount of re-search has been pursued. It lies in the nature of the question thatscientists from various �elds have been active in this area, namelypsychologists, sociologists, epidemiologists and economists. However,the literature seems quite separated; most researchers refer to previ-ous work only from their own �eld. This chapter therefore tries toprovide a synopsis of what we know so far. First, relevant work frompsychology is described, followed by the presentation of two streamsof sociological research. Subsequently evidence from epidemiology ispresented. The emphasis �nally lies on economic studies, discussingmethodological questions, summarizing evaluations of subjective LEin representative samples, and giving an overview on theory and ev-idence of the process of updating these expectations. Finally, a col-lection in table form summarizes all evidence to serve as a handyoverview for future research.
11

2.1 Psychology
Psychology de�nes its scope as the study of mental processes andbehavior of humans (Gazzaniga and Heatherton (2003)). Hence itis natural that Psychological Science contributes to the understand-ing of subjective LE. In particular, Scienti�c Psychology identi�essome typical heuristics which can help to understand the formationof subjective expectations in general. They are presented at a shortglance. More speci�cally, Applied Psychology puts some e�ort intothe understanding of subjective LE. While no cohesive theory for theformation of subjective LE has been developed so far, a couple ofempirical studies address interpersonal di�erences.
2.1.1 Heuristics and Biases in Estimation of Probabil-ities
An important stream of psychological research explores the way howpeople estimate probabilities when required by a situation of uncer-tainty. The foundations are laid by Kahneman and Tversky (1973),Tversky and Kahneman (1974). Based on experimental data andsurvey responses, they develop a theory of probability estimationsunder uncertainty: Estimates are based on heuristics. While theseheuristics sometimes yield reasonable estimates, they often cause bi-ases. Most of the observed biases in probability estimation can beexplained with two rules of thumb, namely the availability heuristicand the representativeness heuristic ((Reed (2004)).
Availability Heuristic
The availability heuristic postulates that humans estimate probabil-ities by taking into consideration the ease with which di�erent real-izations come to their mind. An alternative de�nition describes it asthe �over reliance on readily available, apparently relevant informa-tion in determining one's subjective beliefs� (Tversky and Kahneman
12

(1974)). For example, it is possible that people estimate their LE byrecalling the age at death of their acquaintances.
Slovic, Fischho�, and Lichtenstein (1976) apply the availability heuris-tic to explore how people estimate the probability of 41 di�erentcauses of death (including diseases, natural hazards, accidents, andsuicide). A sample of students conducted paired comparisons, result-ing in strong evidence for the application of an availability heuristic,and especially underlining biases by media reports on certain deathcauses.
Representativeness Heuristic
The representativeness heuristic is relevant for the estimation of prob-abilities whether an event belongs to a certain category, or whethera realization is caused by some random process. A heuristic estima-tion is based on the extent to which the event is typical of the cate-gory/process, its representativeness (Kahneman and Tversky (1972)).The heuristic might be relevant for the formation of subjective LE,as the reliance on representativeness leads to a negligence of samplesizes and prior probabilities.
Relevance for Subjective LE
While the availability heuristic and the representativeness heuristichave been formulated for the estimation of probabilities in general,they certainly apply also to expectations concerning longevity. Inconsequence, the theory on heuristics under uncertainty has in�u-enced both applied psychology and sociology (section 2.2.1).
2.1.2 Attitudes Toward Death
The relevant literature in applied psychology starts with research con-cerning the attitude toward death. Several studies reviewed in Lester
13

(1967) explore the relationship between the fear of death, personal-ity and demographic variables. The �ndings have been contradictory,giving an inconclusive image of attitudes toward death. For instance,Middleton (1936) uses a survey among 825 students to show that col-lege students are totally unconcerned about death. He asks questionslike �How frequently do you think about your death?� in an anony-mous questionnaire.
In contrast, Alexander, Colby, and Alderstein (1957) claim the con-cept of death having the same importance to college students as sexand school. To con�rm their thesis, they perform an experiment in agroup of 31 Princeton undergraduates (chosen to be representative,as they claim): An apparatus measuring the voltage between palmand dorsal as well as reaction times is used to distinguish the reactionto stimulus words related to di�erent concepts.
The two studies exemplify the major problem of early research on at-titudes toward death: The usage of a variety of measurement methodsleads to researches actually assessing slightly di�erent things. Someadvances however have been made to standardize measures, like theCollet-Lester Fear of Death Scale (Lester (1990)). A recent collectionof �ndings concerning subjective attitudes toward death is providedby Kastenbaum (2006).
2.1.3 Correlational Studies
A couple of studies explore subjective LE more speci�cally, focusingon the �numerical estimate people make regarding their expected lifespans� (Robbins (1988b)), their subjective LE. All of these studiesuse surveys asking participants about their longevity expectations aswell as other variables under study.
The �rst contribution has been made by Handal (1969), who usesa survey among 116 graduate students in an (untypically wide) age
14

range of 20 to 64. He presents one of the �rst comparisons of
subjective and actuarial estimates (taking the latter from USBureau of the Census (1964)). The reported subjective LE is signif-icantly overestimated for men, while this is not the case for women.This stems from the fact that there is no signi�cant di�erence amongsubjective life expectancies of men and women, while actuarial LEdi�ers by 6 years.
Handal's �ndings are widely cited within the psychological litera-ture. It is important to note, however, that the comparisons havebeen done in a simpli�ed way: He compares the mean of the subjec-tive LE over all same-sex respondents with the actuarial LE of themean age of the participants. Given the wide age range (with anequally wide range of actuarial LE), a simple comparison of meansseems obscure. It cannot be said, for instance, whether the e�ectamong men is caused by some very old or very young outliers, orwhether the not-e�ect among women is caused because the biases ofdi�erent age groups cancel out.
The general pattern was, however, con�rmed by Tolor and Murphy(1967). Using a survey of 48 participants of a counselor trainingprogram (age span not provided), they also �nd men generally over-estimating their life expectancies (unlike women). Interestingly, thisis the case even though they tend to be accurate in their estimationof average life expectancies for men. The results are also replicatedby Joubert (1992) (using a sample of 225 students).
As an explanation, Handal as well as Tolor and Murphy suggestthat �subjective life expectancy� is di�erently interpreted by menand women. �For women, [subjective LE] appears to be a critical in-dicator of attitudes toward death, whereas for men, it appears to be amanifestation of a defensive attitude toward death� (Handal (1969)).
15

Some other correlates of LE have been examined. In a second step,Handal (1969) tests the correlation of death anxiety and subjec-tive LE, using a standard A�ective Adjective Check List of Anxiety(developed by Zuckerman (1960)) in the sample described above. Forwomen he �nds a negative correlation of death anxiety and subjectiveLE, even when �general anxiety� is partialed out. For men, no signif-icant correlation is found. Joubert (1992) also uses his sample to testanother relation, the role of happiness. Using a nine-point Lickertscale, he asks participants to rate their present happiness. Again,there is a signi�cant positive correlation between happiness and sub-jective LE for women, but not for men. Teahan and Kastenbaum(1970) study the correlation of unemployment and subjective
LE, using a sample of 29 men participating in a rehabilitation pro-gram (age range 21-44, all Afro-Americans). They �nd that self-estimated longevity is signi�cantly lower for hard-core unemployed(which is de�ned as having had no single job for longer than threemonth during the last two years).
Several studies examine the subjective LE as a correlate of fam-
ily LE. Robbins (1988a) asked a sample of 18 female undergradu-ates to report their subjective LE, as well as a subjective estimateof the �rough length of life� in their family, and the ages at death ofparents, grandparents and siblings. She �nds a correlation of 47%between subjective LE and the average family age at death, as wellas a correlation of 77% between subjective LE and subjective �roughfamily length of life�. This leads her to conclude that respondentsare sophisticated insofar as they base their individual estimates onthe parents' death rate, which she claims is more precise than takingthe national average because mortality is correlated within families.Unfortunately no attempt is made to compare the validity of the al-ternative estimator.
In a follow-up study, Robbins (1988b) uses a larger sample includ-
16

ing male participants (in total 86 undergraduates). The correlationsreported are 26% for average family age at death and 68% for thesubjective �family rough length of life�. Additionally, the analysisgoes beyond the �rst study in two aspects. First, the correlation be-tween subjective LE and the average family age at death is higher(35%) when the latter is corrected for �nonnatural causes� of death(not further speci�ed). Second, a multivariate regression shows thatsubjective LE is best predicted by subjective family LE (no correc-tion for endogeneity is attempted).
Finally, the e�ect of premature parental death has been ex-amined. In a survey, 36 college students with at least one parentwho died prematurely have been compared to 36 matched partici-pants (Denes-Raj and Ehrlichman (1991)). Those who lost a parentprematurely reported a lower subjective LE than the control group.
2.1.4 Summary of Empirical Evidence
Looking at the empirical evidence from applied psychology, it can besaid that a variety of correlates have been examined. The pertinenceof these correlates is manifested, as well as the di�erences betweenmen and women. However, the presented studies are characterizedby two caveats: First, their datasets are very small, sometimes notbigger than a small class of undergrads. The composition of mostlypsychology students as well as the prevalence of Caucasians, womenor other groups delivers non-representative samples and allows quan-titative propositions only for the studied group itself.
Second, most of the studies examine correlations one after the otherand perform t-tests whether these are signi�cantly di�erent from zero,but do not conduct multivariate regressions. So, unfortunately, theavailable data is not exhausted, as it might be interesting to look atthe interaction of di�erent correlates as well.
17

Taking all this into consideration, applied psychology provides a ba-sis of qualitative information on subjective LE. To make quantita-tive propositions, however, it is essential to use larger, representativedatasets and employ methods from empirical social research.
2.2 Sociology
Sociology is the systematic study of the society, patterns of socialrelationships, social interaction, and culture (Calhoun (2002)), sothe formation of subjective LE is seen in the environment of socialrelationships and culture. Analogously to psychology, the literaturecan be divided into (1) theoretical articles related to subjective riskperception in general and (2) empirical studies addressing subjectiveLE directly.
2.2.1 Theory on Individual Risk Perception
A constructivist stream of literature analyzes individual risk percep-tion. In the context of policy decisions requiring the aggregation ofindividual risk perceptions, sociological research tries to explore thedeterminants of individual risk; given the empirical fact that per-ceived risk does not necessarily coincide with objective risk (the lit-erature distinguishes subjective and objective risk as �individual riskconcept� and �classical risk concept�, respectively). �The risks thatkill you are not necessarily the risks that anger and frighten you�(Sandman (1987)).
Main insights of this research can be summarized as follows: In-dividual risk perception is a function of cognitive and motivationalsystems (as explored in psychology), but especially of the social, po-litical and cultural environment. Sociologists recognize three majorcharacteristics of the environment in�uencing risk percep-
tion: Voluntariness, Controllability and Responsibility, as well as the
18

direction of in�uence. They can quickly be described using examples:(1) Voluntariness: The subjective risk to su�er from accidents ishigher if the risk stems from involuntary risks (like the risk to bekilled from a military low-level �ight over a densely populated neigh-borhood) than risks stemming from voluntary activities (like gettingon board of a plane for a private �ight) (Luhmann (1993)). (2)
Controllability : Individuals underestimate risks as soon as theyhave an in�uence on it due to overcon�dence, causing an e�ect la-beled �unrealistic optimism�. E.g., most people think to be aboveaverage concerning driving skills, and underestimate the risk of fa-tal car accidents. (Weinstein (1984)). (3) Responsibility : Naturalrisks are underweighted compared to man-made risks (e.g. the risk ofearthquakes contrary to the risk of pesticides). Overviews by Junger-mann and Slovic (1993) and Douglas and Wildavsky (1983) providefurther information about this literature.
Relevance for Subjective LE
The whole stream of literature has in common that the subjectiverisk of single events is evaluated, each of which might end one's life.LE (as well as survival probabilities) can be interpreted as the aggre-gation of the risks of all thinkable events which could �nish the lifeearlier. For instance, the probability to survive the next year couldbe split up as
Psurvive =∏
(1− PoxPkx) (2.1)
where Pox is the probability that a certain event x (heart attack,car accident, nuclear meltdown) happens, and Pkx is the probabilitythat one is killed in that event (assuming that probabilities of di�er-ent events are independent). Insofar, knowledge about psychologicaland sociological biases in the perception of Po and Pk can help tounderstand biases in the aggregate.
One could hypothesize that in today's industrialized society most
19

risks to die early are non-voluntary and non controllable, leading peo-ple to rather overestimate these risks and hence underestimate theirsubjective survival probability and LE. One could also hypothesizethat people especially prone to �voluntary� and �controllable� risk(for example pilots) should relatively overestimate their LE. How-ever, an unknown number of di�erent events can end life, and insofarit is hardly possible to formulate hypothesis which are testable (andhence scienti�c in a Popper sense).
The analysis of life expectancies cannot be done bottom-up - but thetheory on individual risk perception can still give some insight whichbiases might occur, and plays a role comparable to the psychologicaltheory described in section 2.1.1.
2.2.2 Subjective LE by Age and Sex
The sociologists Mirowsky and Ross choose a top-down approachto explore subjective LE empirically, without a speci�c theory ofindividual risk in mind. They are using the 1995 Aging, Status andSense of Control Representative Survey (ASOC), a national telephonesurvey among 2000 Americans, most of them being older than 59.As starting point, Mirowsky (1999) evaluates whether subjective LEcorresponds to actuarial estimates by age, sex and race. Using a two-stage sample selection framework to control for item nonresponse ofLE, he tests various hypotheses using the following regression model:
dS−A = δS − δA = a0 + a1xmale + a2xblack + a3 (age− 45) + udS−A
(2.2)where δS and δA are the subjective and the actuarial life expectan-cies and xi are dummy variables. The actuarial expectancies aretaken from standard life tables (US Bureau of the Census (1995)).Major results are the following: First, probit estimations of the sam-ple selection model show that the probability to answer the ques-tion on subjective LE strongly decreases with age. Second, a broad
20

congruity can be stated between actuarial and subjective LE (cor-relation of 0.79), mostly stemming from the fact that both subjec-tive and actuarial LE are mainly driven by age. Third, subjectiveLE is higher than actuarial, on average about one year. The hy-pothesis that people take cohort mortality trends into account whenestimating personal LE is however rejected. This idea would im-ply that the di�erence between subjective and actuarial LE shouldget smaller with growing age (as less lifetime is left for technologicalprogress), but in contrast the di�erence increases with age (a3 is posi-tive). The author infers that �younger respondents do not incorporatefavorable mortality trends� and �people seem to get more optimisticwith age�. Fourth, Mirowsky �nds what he calls sex and race anoma-lies, with men and Afro-Americans seriously overestimating their LE.Both these groups report approximately the same subjective LE aswomen and whites, even though actuarial LE are lower (about 5 yearsfor men and about 7 years for blacks). Mirowsky �nally discusses the�ndings and concludes that economists and policy makers should notexpect the public to make informed decisions about things like old-age pension savings.
The analysis is an early example of a methodologically clean study,which uses a representative sample and corrects for sample selectionbiases. Insofar it is comparable to economic papers presented below,with the main di�erence that subjective LE is studied (instead ofsurvival probabilities).
2.2.3 The Importance of Socioeconomic Status
Based on the same data, a subsequent study of Mirowsky and Ross(2000) tests whether Americans expect longer lives the higher theirachieved socioeconomic status is. The authors hypothesize a causalin�uence on subjective LE by three aspects of a person's socioe-conomic status: Education, employment/occupation and economicwell-being. Education regulates the access to occupation, income
21

and wealth, and is seen to in�uence subjective LE because of cur-rent health and con�dence about meeting future needs. The surveymeasures education in years. Following the authors, employment af-fects expectations through the same channels as education (namelyhealth condition and con�dence of the future); both current employ-ment and the occupation history play a role. The survey containsa number of dummy variables for the respondent's and the spouse'semployment. In their analyses, Mirowsky and Ross include the fol-lowing: Whether retired, disabled, in school, part-time employed,ever unemployed for over 6 months. In addition, a numerical pres-tige score is assigned based on the current job (following the systemof Nakao, Hodge, and Treas (1990)). Finally, economic well-being isincluded by income and the current or recent presence of economichardship, where economic hardship means a lack of money to payfundamentals like daily bills, clothes, or the rent.
Additionally, Mirowsky and Ross include a number of other explana-tory variables, including what they call �potential mediators� (Mea-sures on objective and subjective health, health behavior and self-con�dence) and �possible confounders� (the basic demographics age,sex and race they analyzed in the �rst study). Out of many results,the most important �ndings of the regression analysis are the fol-lowing: Each additional year of education increases the predictedLE by about .7 years, and adults currently in school expect to liveabout 2.5 years longer than same-age adults in full-time jobs. Peoplecurrently unable to work because of disabilities have a shorter LEof 3.3 years, and economic hardship strongly reduces subjective LE(On average by 4 years if the hardship is long-past and by 8 yearsfor current hardship). The e�ects seem to work through both of themediators health and self-con�dence. All e�ects are smaller in a lin-ear regression without adjustment for sample selection biases, butremain signi�cant.
22

2.2.4 Social Support through Family Relationships
A third study using the ASOC survey studies whether family relation-ships increase subjective LE (Ross and Mirowsky (2002)). By fam-ily relationships they mean marital and child-parent relationships.These relationships are indeed worth being analyzed, as they are usu-ally bonded by a�ection and mutual obligation, providing potentialfor informal social support (Umberson, Williams, and Shar (2000)).Using a regression model similar to the ones described above, Rossand Mirowsky �nd that having adult children and living parents in-creases subjective LE, while young children at home and marriagehave no in�uence (exception: marriage has a small e�ect for oldermen). There is a strong correlation between subjective LE and thereported emotional support as well as informal health support.
The authors hypothesize three channels for the positive e�ect of fam-ily relationships: By creating assurance about the future, by reinforc-ing health habits, and by improving current health. These hypothe-ses are not formally tested, but an analysis of related variables showsthat the �rst channel has the strongest impact: Projected securityabout the future seems to be crucial for the length of life a personexpects.
2.2.5 Summary of Empirical Evidence
The research presented above contributes signi�cantly to an under-standing of subjective LE: A general correlation between actuarialand subjective LE is found, but at the same time severe biases con-cerning the relative LE of men and Afro-Americans occur. Variousmeasures of an individual's socioeconomic situation underline theimportance of economic status, and family relations play a role byproviding social support. All these determinants have been stud-ied using the same dataset. Insofar additional outside evidence isstrongly required. However the �ndings are a good starting point for
23

further research.
2.3 Epidemiology
Epidemiology studies the health and illness of populations and thefactors a�ecting it (Rothman (2002)). One typical measure of healthis LE, and many studies examine possible predictors. Typically, �sub-jective� measures are phrased as �self-rating� in epidemiological ter-minology.
2.3.1 General Self-Ratings as Predictors of Mortality
An extensive literature demonstrates that self-ratings of health pre-dict mortality, even after controlling for objective health measures,health habits, and sociodemographic characteristics. For an overviewsee Strawbridge and Wallhagen (1999).
2.3.2 Subjective LE as Predictor of Mortality
The �rst contribution including speci�cally subjective LE in additionto self-ratings of health is Van Doorn and Kasl (1998). Using a com-munity sample of 1468 respondents of the Australian LongitudinalStudy of Ageing (ALSA) and performing a logit regression whetherpeople are dead in the second wave, they �nd that subjective LE pre-dicts mortality, even when subjective health is included. The e�ectis stronger for men than for women. Their main contribution is tohave shown that subjective LE has an independent e�ect on actuar-ial LE, and is not just a proxy of subjective health. However, thenon-representativeness of the sample is a major limitation.
Siegel, Bradley, and Kasl (2003) provide results on a representativebasis, using the HRS and AHEAD surveys. AHEAD is a nationalrepresentative survey among persons aged 70 or older. The strati�eddataset contains 5262 respondents who are followed for two years
24

(1993-1995). The HRS contains respondents aged 51-61. 8975 re-spondents are followed for three years (detailed description of datasets in section 2.4.3). During the preparation of their dataset, Siegelet al. note that respondents eliminated due to missing answers ofsubjective LE are older, which is in line with Mirowsky (1999). Theyare also less educated, less likely to be white and less healthy.
A National Death Index tracker �le provides information about theactuarial mortality of the sample. 9% of the men and 5% of thewomen in AHEAD died during the three years, compared to 4% and2% in the younger HRS sample. To analyze the predictive powerof subjective LE, a Cox proportional hazard model (Cox (1972)) isestimated with the hazard function:
hi (t) = h0 (t) exp {1xi1 + . . . +k xik} (2.3)
The hazard rate hi(t) gives the probability to live an additionalday, conditional on having lived until t. Explanatory variables jxij
include subjective LE, subjective health, objective health measures,health behaviors and sociodemographic variables.
Summarizing their �ndings, Siegel et al. �nd that subjective LE is apredictor of mortality: People who expect to live longer are less likelyto die during the period under study. The risk ratio for the likelihoodis signi�cantly lower for a reasonable di�erential in the subjective LE(between 2% and 20%). The e�ect is stronger for men in the HRSsample but not in AHEAD. Including subjective health measuresinto the estimation, the e�ect of subjective LE remains statisticallysigni�cant in AHEAD, but not in HRS. The authors conclude thatsubjective LE is a better estimator among older people.
25

2.3.3 Summary of Empirical Evidence
Epidemiological Research shows convincingly that individuals are ingeneral quali�ed to estimate their LE (whether this is especially truefor very old people should be subject to further research). While nopropositions concerning systematic biases are made, it is clear thatsubjective measures of LE have some predictive power of actuarialmortality.
2.4 Economics
Given the relevance of subjective LE as well as the increasing avail-ability of extensive datasets, a couple of economists deal with thetopic. This section sketches the methodological debates those re-searchers carried out within the economists' community, as well asthe methods employed and all relevant results.
2.4.1 Methodological Discussions
At �rst glance, it might surprise seeing economists measuring the for-mation of subjective LE, which could be interpreted as another ex-ample of �Economic Imperialism� (Lazear (2000)), economists occu-pying intellectual territory outside their own �eld. Maybe economistsshould just use the results of psychologists and sociologists to feedtheir life-cycle models? As Hamermesh (2004) put it: �Our abilityto push buttons in STATA, SAS, TSP, or whatever is not unique:Psychologists and sociologists are perfectly capable of doing that.� Hesees the strength of economics in the �extend to which we can bringeconomic theory� into the game.
Economists exploring subjective LE do not explicitly justify theiragenda, but there are clear reasons why economists should deal withsubjective measures of LE or survival rates: Most importantly, a
26

deeper knowledge of the patterns and systematic biases in the forma-tion of expected longevity is crucial for life-cycle-models and other�elds of economic analysis, as pointed out in chapter 1. Researchfrom other �elds does not provide this information su�ciently accu-rate. Therefore, the simple necessity of better estimations justi�esresearch. Furthermore, looking at the updating of expectations (in-cluding life expectations), economic theory, too, enters the arena andcontributes to the understanding, as demonstrated in the following.
Measurement of Expectations
Apart from the general question whether economists should deal withlongevity expectations at all, a long debate occurred whether thecharacteristic to be the result of survey responses disquali�es sub-jective measures from economic relevance. The discussion emergedin Manski (2004), who summarizes the necessities and possibilitiesto measure expectations by asking for subjective probabilities. Thepossibility to measure expectations is fundamental for all researchon subjective longevity expectations, no matter whether they aremeasured as survival probabilities or longevity expectations. Conse-quently this discussion is presented in some detail.
Manski's motivation to examine the measurement of expectationsis the following: Many empirical studies aim to identify a utilityfunction which embodies individuals' preferences using informationabout their choices. For instance, the classical revealed preferencesanalysis infers preferences of an individual by observing consumptionbundles she chooses facing di�erent budget constraints and relativeprices (Samuelson (1938), Samuelson (1948)). If this information isnot available (as it is usually the case in practice), a modi�ed formof revealed preference analysis is still possible, if the decisions of arandom sample of heterogeneous individuals (facing the same dis-crete choice problem) are known. Imposing assumptions about thepopulation distribution of preferences, a probabilistic choice model
27

can be estimated (McFadden (1974)). Most researchers would agreewith the statement that �it is better to rely on what people actuallydo, and not on what they say�.
In the case of partial information, however, Manski (2004) arguesthat revealed preference analysis is meaningless without knowledgeof the agents' underlying expectations. Revealed preference analysisis straightforward given full information. In realistic settings, how-ever, decision makers are usually not sure about the outcomes ofalternative actions (which is undoubtedly true for decisions involvingthe length of life). Individuals have to form subjective expectations.The probabilistic density function expressing these expectations to-gether with the utility function expressing the underlying preferencescan only jointly be identi�ed. A particular set of choices can be con-sistent with various speci�cations of preferences and expectations;Manski (2002) shows this for a standard ultimatum game.
The conventional remedy is assuming rational expectations, withother words the subjective probability density being equal to theobjective, true probability distribution of outcomes. This assump-tion may lead to severe biases. In the case of an ultimatum game,for instance, a researcher might conclude a strong preference for fair-ness from experimental observations, even though the participantshave standard preferences maximizing own payo�s, but expect theircounterpart to reject the o�er if unequal payo�s are proposed. A la-bor economist might infer that high school students are unconcernedabout future earnings during their decision whether to attend college,even though they are very concerned but succumb to biased expecta-tions concerning returns of further education (Manski (1993)). Theseexamples illustrate the caveats of the assumption of rational expec-tations in order to reveal preferences from individuals' choices.
Given the case that identi�cation of subjective expectations is cru-
28

cial to predict behavior based on revealed preference analysis, Manski(2004) discusses several ways to measure expectations directly, by ad-dressing individuals in surveys. The �rst approach, verbal questionsto measure expectations, is widely used by attitudinal researchers (e.g.�How likely do you think it is that you will loose your job - very likely,fairly likely, not too likely, or not at all likely?�). However, this typeof questions su�ers from the persistent problem that interpersonalcomparisons are impossible (e.g., the interpretation of �fairly likely�may di�er among individuals). The second and more promising ap-proach is to ask explicitly for probabilistic expectations, to get anabsolute numerical scale which is interpersonally comparable. Thismethod has been used for a long time in cognitive psychology andrecently as well in economics (even though a �rst application canalready be found in Juster (1966)). (Example: �What do you thinkis the percent chance that you will lose your job during the next 12month?�). Surveys using this type of questions include the Healthans Retirement Study (HRS), the Survey of Economic Expectations(SEE) and SAVE (a detailed description of these datasets follows).
Thinking in Probabilities
A problem speci�c to the study of subjective probabilities is that peo-ple are often not used to think in probabilities. A numerical prob-ability is usually only dimly available, as people have not thoughtenough about it in the moment they are asked (Spetzler and Staelvon Holstein (1975), Morgan and Henrion (1990)). In survey practice,some advances have been made concerning presentation and framingof these questions in order to achieve reasonable answers. For in-stance, the HRS survey includes a �training question� (concerningthe probability that it rains tomorrow) before subjective probabili-ties are asked for, and the SAVE survey presents a graphical numberray (�gure 2.1).
29

Figure 2.1: Example of probability visualization
These methods, however, do not remedy another problem, which isone of the central �ndings in prospect theory: People have problemsespecially with very high and very low probabilities, one of the char-acteristics of the probability weighting function which is empiricallymeasured in prospect theory (Kahneman and Tversky (2000)).
Naturally, the problem of elicitation of probabilities does not a�ectthe measurement of subjective LE (in years). This is a major advan-tage of studying subjective LE instead of subjective survival proba-bilities.
2.4.2 Consistency of Subjective and Actuarial Esti-mates
Economic research on subjective LE starts with Hamermesh (1985).Given the enormous rise of actuarial LE in the 20th century, he exam-ines whether subjective LE incorporates these advances, and hencethe common practice to use actuarial life expectancies in empiricalstudies testing life-cycle models is justi�ed.
The analysis is based on a survey with two samples of (a) about400 male economists and (b) about 450 randomly chosen individu-als. The economists have been chosen because they are assumed tobe familiar with probabilities. The random sample has been addedto get an idea how the typical consumer might think (even though
30

Figure 2.2: Subjective and Objective Survival FunctionsSource: Hamermesh 1985
no representativeness is reached). Besides basic demographics, thequestionnaire asks for subjective estimations of longevity, survivalprobabilities ps
60 and ps80 as well as for parent mortality, smoking and
exercise behavior. Results do not qualitatively di�er between the twogroups.
Hamermesh analyzes three types of consistency between subjectiveand actuarial LE. First, the consistency in shape of subjectivesurvival distributions is examined. The survey contains questionsregarding the subjective probability to reach an age of 60 and 80, re-spectively, and these values are used to �t a Weibull survival function(Figure 2.2). This subjective functions turns out to be �atter thanthe actuarial survival function, a result which is illustrated by directcomparison of ps
60 − pa60 and ps
80 − pa80: The respondents on average
underestimate the probability to reach an age of 60, but overesti-mate the probability to reach an age of 80. This result is conformwith the �ndings of Ludwig and Zimper (2007) who use the repre-sentative survey HRS; as well as the study of Betz (2005) (see below).
Second, Hamermesh examines demographic and expectational
consistency. The hypotheses tested can be described with the fol-
31

lowing equation:
x + esx = β0 + β1
(x + e0
x
)+ β2DELx (2.4)
where DELx is the predicted change in LE a person of age x canexpect based on improvement in life tables during 1940-1980. He�nds that the joint hypothesis of β0 = 0, β1 = β2 = 1 describes thedata better than any other hypothesis, and concludes that joint de-mographic and expectational consistency describe the respondents'LE quite well (meaning consistency with life tables while taking intoaccount further improvements in longevity).
Third, objective consistency is addressed. Some questions con-cerning characteristics in�uencing LE have been included into thesurvey, and the coe�cients of a simple regression on dummy vari-ables describe the importance of this factors for individual LE. Tworesults are presented: On the one hand, the in�uence of personalbehavior (speci�cally, smoking and regular exercises) is estimatedconsistently with actual in�uence. On the other hand, the in�uenceof parents' and grandparents' longevity is largely overestimated.
Respondents with particular old or young relatives seem to base theirown subjective LE much more on this information than evidence ongenetic e�ects and non-genetic familial e�ects (from twin studies)suggest. This is in line with the availability heuristic described insection 2.1.1. Hamermesh summarizes that people do indeed ex-trapolate from actual life tables when they have to determine theirindividual LE, but with a subjective survival function being �atterthan the actual distribution.
Börsch-Supan, Essig, and Wilke (2005) analyze the consistency ofsubjective and actuarial estimates of LE in Germany, using a small,representative subsample of the SAVE study (access panel with 487observations). As described in more detail below (section 3.4), the
32

survey asks respondents to estimate both the average LE for peo-ple of their age, and their individual subjective LE. Looking at the�rst measure, men overestimate the average LE by 1.4 years, whilewomen state an estimated average LE which is 0.5 years lower thanthe actuarial value. However, actuarial values are taken from life ta-bles, which do not incorporate technological progress. Consequently,subjective estimates should be well above actuarial LE. The authorsconclude that respondents underestimate average LE.
The comparison is done by comparing mean LE over age, which re-duces the explanatory power (section 2.1.3). In contrast, individualsubjective LE is compared to actuarial values for �ve di�erent ageintervals. The basic pattern is the same, showing individuals underes-timate their subjective LE. Insofar, the German data contradicts the�ndings for the U.S. The number of observations in the study is small(especially after being divided into di�erent age intervals), hence ananalysis with a larger sample is needed to make solid statements.
2.4.3 Survival Probabilities by Age, Sex and other Cor-relates
In empirical research, many economists study subjective survivalprobabilities (measured in percentage) instead of subjective LE (mea-sured in years). One advantage of measuring longevity expectationsin survival probabilities is that the results can be mapped directlyinto models of intertemporal decision-making, which usually requiresurvival probabilities. Another advantage is the compatibility withBaysian updating models (see section 5) which are formulated inprobabilities, not in years. Two major surveys, HRS and AHEAD,measure longevity expectations in survival probabilities, and a cou-ple of papers use these data. The main drawback, however, is thedi�culty people have to think in probabilities (section 2.4.1).
33

Subjective Survival Probabilities in the Age Group 50-61
The Health and Retirement Study (HRS) is a representative lon-gitudinal survey data set, covering US-American households withthe head of the household in the age of 51-61 during the �rst inter-view in 1992. It contains a question asking explicitly for subjectivesurvival probabilities, which has been extensively analyzed. Whilethe �rst wave asked all respondents to report ps
75 and ps85, subse-
quent waves ask only for one value, where the target age of interest(80, 85, 90, 95, 100) is chosen to be about 11-15 years higher than therespondent's age (RAND (2008)).
Hurd and McGarry (1995) evaluate the �rst wave cross-sectional,to �nd out whether (1) the subjective probabilities behave like sur-vival probabilities, if (2) their averages are close to actuarial aver-ages, and whether they (3) correlate with other variables in a similarway as actuarial survival probabilities. Insofar the research ques-tion is pretty much the same as in Mirowsky (1999), with the maindi�erence that subjective probabilities are evaluated, in contrast tosubjective LE. Actuarial probabilities are taken from US Bureau ofthe Census (1993).
Their results show that in principle all these questions can be an-swered positively: (1) Talking about survival probabilities, for thesame individual ps
85 should be smaller than ps75 (internal consis-
tency). Indeed, for 70.1% it is true that ps85 < ps
75, while only 2.5%report ps
85 > ps75. A surprisingly high share of people, however, report
ps85 = ps
75, mostly bunching at 0%, 50% or 100% for both probabil-ities. However, Hurd and McGarry conclude that this inconsistencyis tolerable. Addtionally, the basic pattern is con�rmed by Elder(2007).
(2) In a comparison with life tables, they show that the aver-age estimates of ps
75 are close to actuarial averages for men, while
34

women signi�cantly underestimate it (0.66 and 0.75, respectively).Regarding survival to age 85, men report a higher subjective prob-ability than actuarial survival, while that is not the case for women(table 2.1). The authors interpret this pattern as incorporation offuture improvement of life expectancies. As the age of 85 is moredistant than the age of 75, there is more time for technological ad-vancements. However, this does not explain the gender di�erences.
HRS: Average Probabilities of Living to Age 75 or 85
Men Women
To 75 To 85 To 75 To 85
Subjective (HRS 1992) 0.62 0.39 0.66 0.46Actuarial (1990 life table) 0.60 0.26 0.75 0.45
Table 2.1: Hurd, McGarry (1995)
(3) In a third step, Hurd and McGarry (1995) explore the correla-tion of subjective survival probabilities with socioeconomic variables,health conditions and behavior as well as family longevity (externalvalidation of variation). They �nd the highest income quartilehaving a ps
75 which is 0.11 higher than the lowest quartile, besidessimilar variation in wealth and education. Smokers report a lowernumber, which is qualitatively in line with the actuarial situation.The highest correlation, however, can be found with perceived health.For instance, men reporting an excellent health report have a ps
75
which is 0.41 higher than for men in poor health. This �nding con-�rms the evidence from Siegel, Bradley, and Kasl (2003) (see section2.3.2).
In a �nal step, the authors combine the correlates in a linear regres-sion. The coe�cients of the mentioned variables have the expectedsign; the inclusion of self-perceived health strongly reduces coe�-cients of other explanatory variables, but they remain signi�cantlydi�erent from zero.
35

Subjective Survival Probabilities of the Older Old
In a subsequent study, Hurd, McFadden, and Gan (1998) evaluatesubjective survival probabilities of the AHEAD survey, with partici-pants signi�cantly older than in the �rst HRS wave. Their main goalis to estimate survival curves and include them into a fairly complexlife cycle-model; on their way they however present some facts whichare in the scope of this study.
The survey of the Asset and Health Dynamics among the Oldest Old(AHEAD) is a representative biennial survey, covering US-Americansborn in 1923 or earlier from 1993 on. Like the HRS (into whichAHEAD has been merged later), a question asks for subjective sur-vival probabilities. Again, the target age of interest (80, 85, 90, 95, 100)is chosen to be about 11-15 years higher than the respondent's age.
AHEAD: Average Probabilities of Living to 85, 90, 95 or 100
To 85 To 90 To 95 To 100
Subjective (AHEAD 1993) 0.51 0.38 0.31 0.29Actuarial (1992 life table) 0.50 0.33 0.16 0.05
Table 2.2: Hurd, McFadden, Gan 1998
Table 2.2 presents a comparison of subjective and actuarial sur-vival probabilities, arranged in a table similar to the HRS results(unfortunately no sex di�erences are reported). As in the HRS,the younger respondents (age 70-79) have average subjective survivalprobabilities close to the actuarial estimates. The older groups, how-ever, show ps much higher than pa, with a growing overestimation inage.
36

Figure 2.3: Survival Probabilities in HRS 2002-2004Source: Ludwig, Zimper 2007
This pattern is con�rmed by Ludwig and Zimper (2007). They ana-lyze a pooled dataset of HRS consisting of the waves 2002-2004. Incontrast to the sample of Hurd and McGarry (1995), the later wavescontain a wider age range, as they follow the original participantsas they get older. As mentioned, subjective survival probabilitiesare asked in a way comparable to AHEAD during the later HRSwaves (di�erent target ages). Figure 2.3 shows ps and pa for men ofdi�erent ages. Ludwig and Zimper explain the pattern by growingoptimism with age; a discussion is delayed to the section on updatingLE (2.4.4).
Subjective Survival Probabilities in Europe
While most of the evidence cited so far is based on American HRSdata, Betz (2005) uses the �rst wave of the Survey of Health, Age-
37

ing and Retirement in Europe (SHARE) to repeat the analysis ofHurd and McGarry (1995). SHARE is a cross-national survey ofmicro data on health and socio-economic status; the �rst wave hasbeen conducted in 2004, including data from 10 countries from Scan-dinavia, Central Europe and the Mediterranean. The �nal datasetused by Betz (2005) contains 19, 225 observations (after deletion ofitem nonresponse and very old respondents). SHARE respondentsare asked for the expected probability to survive until a target agechosen to be 10-15 years away. As only one target age is asked for,no check of internal consistency can be performed, and only step (2)and (3) of Hurd and McGarry (1995) are followed.
In a comparison with life tables from the respective countries, ob-servations are pooled over countries in a �rst step. Table 2.3 presentskey statistics in a way similar to the results above. The main �nding,with younger people underestimating their survival probability to alower target age, and older respondents overestimating the probabil-ity to survive to a higher target age, is con�rmed. In a second step,the author discusses di�erences in subjective survival probabilitiesbetween countries. They seem to be small, which, however, might bedue to the fact that observations are averaged over target ages andgenders in the analysis.
SHARE: Average Probabilities of Living to Age 75 or 85
Men Women
To 75 To 85 To 75 To 85
Subjective (SHARE 2004) 0.69 0.55 0.70 0.54Actuarial (various life tables) 0.70 0.43 0.83 0.58
Table 2.3: Betz (2005)
In addition, the correlation of subjective survival probabilitieswith socioeconomic variables is analyzed with cross-tabulations
38

and regressions. In line with evidence from HRS, perceived healthcorrelates negatively with subjective survival probabilities. In con-trast, however, a positive correlation can be found between smokingand subjective probabilities for very high target ages. In sum, Betz(2005) concludes that the �ndings of Hurd and McGarry (1995) holdfor European individuals.
Summary of Empirical Evidence
To summarize economists' �ndings on determinants of subjective es-timates, one can say that while the �middle-age-group� estimates sur-vival probabilities quite accurately (at least on average), older people(70 and beyond) increasingly overestimate their survival probabili-ties. The reason might be that people do not internalize that annualsurvival rates decrease with age. Di�erentiated by sex, men are rela-tively more optimistic than women according to life tables, which isin line with the sociological evidence on subjective LE.
2.4.4 Updating of Survival Probabilities
Besides analyzing the determinants of subjective longevity measuresin cross-samples, an increasing economic literature analyzes the up-dating of subjective survival probabilities, hence the extent to whichnew information is incorporated into expectations. The new informa-tion under study are individual health shocks occurring to a personparticipating in a panel study. Most studies are based on HRS data;all papers on updating focus on subjective survival probabilities.
Foundations of Baysian Updating
Based on the binomial probability model, the theory of rational updat-ing has been developed by Viscusi (1984), Viscusi (1985). He showsthat a rational individual, applying Bayes' theorem to new informa-tion, will have a risk perception which is a linear function of his prior
39

beliefs:
Pt =(
θ
θ + γ
)· Pt−1 +
(γ
θ + γ
)· S (2.5)
where Pt−1 are the prior subjective beliefs, (θ/(θ + γ)) the relativeinformation of the prior, (γ/(θ +γ)) the relative precision of the newinformation, and S is the risk equivalent of the new information.
Baysian Updating in HRS
Smith, Taylor, Sloan, Johnson, and Desvousges (2001) apply a Baysianupdating model to evaluate how new information embodied in exoge-nous health shocks changes the longevity expectations of smokers andnon-smokers. They �nd that smokers update their longevity expec-tations di�erently from non-smokers or ex-smokers. Especially if thehealth shock corresponds to smoking (e.g., lung cancer), they reducetheir LE (measured as subjective probability to reach an age of 75)more dramatically than non-smokers.
Their sample includes 12,692 persons appearing in both the 1992and 1994 wave of HRS. Two ways are chosen to analyze the dif-ferences in updating procedures among smokers, non-smokers andex-smokers. First, two hypotheses are tested with chi-square tests:It can be maintained that smokers, former smokers, and non-smokershave di�erent distributions of their subjective longevity probabilitiesin both waves. Additionally (and more interestingly), these groupsadjust their longevity expectations di�erently if a health shock occursamong the two waves, which is shown using a chi-square analysis testfor cross tabulations for smokers, non-smokers, and ex-smokers. Twodi�erent �health shocks� are taken into account: Serious health eventswhich are smoking related and other serious health events. They�nd that current smokers only react to smoking-related shocks, whilenon-smokers update their longevity expectations after both types ofshocks.
40

Several criteria are applied to use only �severe� health shocks, with-out presentation of rigorous arguments for the choice of the particularcriteria. For instance, it is required that a person stayed at least 3days in hospital between the waves (even though the survey questionon hospital stays is not related to particular health events). Unfor-tunately, their analysis is not repeated including all health shockswhich would provide an important sensitivity analysis.
Second, Smith et al. use a formal updating model in order to beable to control for other di�erences among the groups of smokers,former smokers and non-smokers. Various demographic control vari-ables are included as well as a third type of health shocks: Worseningof activity limitations reported in the survey (e.g. climbing stairs).In the notation of equation (2.5), individual risk perception Pt isdescribed as
Pt =(
θ
θ + γ
)·Pt−1+
(γ
θ + γ
)×f(SSt−1, GSt−1,∆PCt,∆ARt, z1, z2 . . . zk)
(2.6)where f(·) is the risk equivalent of the health shock (based on the
smoking related health event SSt−1, the general health event GSt−1,the changes in existing conditions ∆PCt and the changes in activityrestrictions ∆ARt). The structure of f(·) is assumed to be linear.Describing both the health shocks and the demographic controls asxj , the model simpli�es to
Pt = (θ/θ + γ)Pt−1 + α0 +k∑
j=1
αjxj (2.7)
Estimations support the hypothesis of smokers using a di�erent up-dating rule than non-smokers, and motivate the authors to discussseveral possible explanations for the di�erences which might be iden-ti�ed in focus group interviews. The main advance of the paper,however, is the development of a methodology to estimate an updat-ing model from panel data.
41

Hurd and McGarry (2002) use the same HRS waves and con�rmthe �nding that people do update their subjective survival probabil-ity when a negative health shock occurs, using a di�erent model byregressing the di�erence in subjective survival probabilities betweentwo waves on explanatory variables:
pst − ps
t−1 = f(xβ) (2.8)
Out of a list of diseases, they �nd only newly diagnosed cancer to havea negative in�uence on subjective survival probabilities. Besides, alsothe death of a parent has a negative in�uence, especially if the demiseoccurs at a young age (under 75).
Baysian Updating and Medical Test Outcomes
One of the shortcomings the HRS data face is noise in the answers tothe health questions. Liu, Tsou, and Hammitt (2007) exploit paneldata from the National Health Insurance Program in Taiwan (NHI),which has detailed information based on a physical examination be-tween the two waves. 620 participants of the voluntary examinationat a Taipeh hospital answered both a survey before and after theexamination in 2001. The authors test an updating model similarto equation (2.6), where f(·) contains (besides basic demographics)in di�erent regressions (1) the number of abnormal test items in theexamination, (2) the number of recommendations received from thedoctors and (3) the number of health shocks. Health shocks have nosigni�cant in�uence in the data, while (1) and (2) reduce subjectivesurvival probabilities. The authors interpret this outcome as supportfor the Baysian updating model.
Non-Baysian Updating
In a recent paper, Ludwig and Zimper (2007) extent the rationallearning model by including psychological biases, leading to a Non-
42

Baysian Updating Model. Starting from the fact that people increas-ingly overestimate their subjective survival probabilities as they getolder in the HRS data (Figure 2.3), they suggest a �myside bias�as explanation: Given the emotional content of death expectations,older people might have an optimistic bias in the interpretation ofnew information, leading them to ignore anything that makes a closedeath more likely. In contrast, young people might be more rationalin their assessment, as their prospective demise is still far away andless emotionally loaded.
The learning model is based on Choquet Expected Utility (CEU)theory, which uses non-additive probability measures to account forambiguity aversion. Optimism or pessimism are assumed to bias theupdating process, by solving the ambiguity which arises given newinformation. In its parsimonious version, posterior beliefs of an indi-vidual of age j to survive until age m are
vj (m|j) = δjλ + (1− δj) π̃j (m|j) (2.9)
with
δj=δ
δ+(1−δ)φjπ(j), π̃j(m|j)=
(φm+ξj
φj+ξj
)πj(m|j) , ξ= ψ
α+β(2.10)
where the parameters are described as follows: φ as an initial bias inthe additive estimator re�ecting over- or underestimation, ξ as thestrength of the rational Bayesian updating process, δ as measure forambiguity and λ as the degree of optimism or pessimism by whichan individual resolves his ambiguity.
Besides the theoretical modeling, the model is estimated using apooled sample of the HRS waves 2000-2004. It explains 78% of theaverage variation in subjective beliefs for men and 96% for women(4%/7% of total variation in subjective beliefs). The authors comparethe psychological bias model to a rational Baysian updating model,
43

which is insigni�cant (all R2 close to zero); they conclude that therational updating model is violated in the data and the psycholog-ical learning model is a handy alternative to be used in life-cyclesimulations.
Summary of Empirical Evidence
Summarizing the �ndings on updating models, the data indeed re-�ects Baysian behavior, with people reducing their subjective sur-vival probabilities if they experience a negative health shock. Smok-ers seem to update in a di�erent way than non-smokers, being ex-cessively concerned about smoking-related health shocks. The agepattern of subjective survival probabilities can be explained quiteaccurately with an extended model allowing for psychological biasesin the interpretation of health e�ects.
44

2.5 Summary: What we Know
Finding Sample StudyGeneral Consistency (by Age, Sex)Subjective LE largely overesti-mated by younger men (ca. 6years), because they do not ac-count for actuarial di�erence towomen
116 graduate stu-dents
Handal(1969)
48 participants ofcounselor program
Tolor andMurphy(1967)
225 students Joubert(1992)
High positive correlation (79%)between subjective and actuarialLE
2000 US individuals(representative)
Mirowsky(1999)
Subjective LE slightly higherthan actuarial, di�erence in-creases with age
2000 US individuals(representative)
Mirowsky(1999)
In Germany, subjective LE andestimated average LE lower thanactuarial LE
487 German indi-viduals from SAVE(representative)
Börsch-Supan, Essig,and Wilke(2005)
Subjective LE with predictivepower for actuarial LE, besidesobjective and subjective healthmeasures
1468 Australianindividuals (non-representative)
Van Doornand Kasl(1998)
5262 (8975) USindividuals fromHRS (AHEAD)(representative)
Siegel,Bradley, andKasl (2003)
45

Finding Sample StudyHigh "consistency in shape"(form of survival function), sub-jective survival function slightly�atter (underestimate p60s,overestimate p80s)
400 maleeconomists, 450randomly chosenUS individuals
Hamermesh(1985)
"Internal consistency": p85s <p75s for most individuals 50-61years old
7946 US individu-als from HRS (rep-resentative)
Hurd and Mc-Garry (1995)
Men 50-61 years old estimate p75consistently, overestimate p85
7946 US individu-als from HRS (rep-resentative)
Hurd and Mc-Garry (1995)
19225 Europeanindividuals fromSHARE (represen-tative)
Betz (2005)
Women 50-61 years old underes-timate p75, estimate p85 consis-tently
7946 US individu-als from HRS (rep-resentative)
Hurd and Mc-Garry (1995)
19225 Europeanindividuals fromSHARE (represen-tative)
Betz (2005)
70-79 years old individuals es-timate p85 consistently, oversti-mate p90, p95, p100. Overersti-mation increases with target age
7393 US individualsfrom AHEAD (rep-resentative)
Hurd, McFad-den, and Gan(1998)
In�uence of FamilyPositive correlation (26-47%) ofsubjective LE with average fam-ily age at death
18 female undergradstudents
Robbins(1988a)
86 undergrad stu-dents
Robbins(1988b)
High positive correlation (68-77%)of subjective LE with"Rough family length of life"(estimation of family LE)
18 female undergradstudents
Robbins(1988a)
46

Finding Sample Study86 undergrad stu-dents
Robbins(1988b)
Lower subjective LE if prematureparental death occured
36 college studentsplus 36 matches
Denes-Rajand Ehrlich-man (1991)
In�uence of parents' and grand-parents' longevity largely over-estimated compared to actuarialdata
400 maleeconomists, 450randomly chosenUS individuals
Hamermesh(1985)
Living parents increase subjectiveLE
2000 US individuals(representative)
Ross andMirowsky(2002)
Adult children increase subjectiveLE, no e�ect of young children athome
2000 US individuals(representative)
Ross andMirowsky(2002)
No e�ect of marriage on subjec-tive LE
2000 US individuals(representative)
Ross andMirowsky(2002)
Positive correlation between sub-jective LE and reported emotionalsupport by family members
2000 US individuals(representative)
Ross andMirowsky(2002)
In�uence of EducationSubjective LE is lower for hard-core unemployed
29 men in rehabprogram
Teahan andKastenbaum(1970)
Education increases subjectiveLE / subjective survival proba-bilities (1 additional year of ed-ucation �> 0.7 years of subjectiveLE)
2000 US individuals(representative)
Mirowsky andRoss (2000)
47

Finding Sample Study7946 US individu-als from HRS (rep-resentative)
Hurd and Mc-Garry (1995)
Individuals in school with highersubjective LE (+2.5 years) com-pared to same-age full time-employees
2000 US individuals(representative)
Mirowsky andRoss (2000)
Economic hardship decreases sub-jective LE (4-8 years)
2000 US individuals(representative)
Mirowsky andRoss (2000)
In�uence of Economic SituationHigh income correlates with highsubjective survival probabilities(Highest income quartile: subjec-tive survival probability +0.11)
7946 US individu-als from HRS (rep-resentative)
Hurd and Mc-Garry (1995)
Wealth correlates with high sub-jective survival probabilities
7946 US individu-als from HRS (rep-resentative)
Hurd and Mc-Garry (1995)
In�uence of Lifestyle BehaviorSubjective LE / subjective sur-vival probabilities lower for smok-ers
400 maleeconomists, 450randomly chosenUS individuals
Hamermesh(1985)
7946 US individu-als from HRS (rep-resentative)
Hurd and Mc-Garry (1995)
Subjective LE higher for individ-uals regularly exercising
400 maleeconomists, 450randomly chosenUS individuals
Hamermesh(1985)
In�uence of Emotional FactorsNegative correlation of subjectiveLE and death anxiety (only forwomen)
116 graduate stu-dents
Handal(1969)
48

Finding Sample StudyPositive correlation of subjec-tive LE and happiness (only forwomen)
225 students Joubert(1992)
In�uence of Other FactorsHigh positive correlation of sub-jective LE and perceived health
7946 US individu-als from HRS (rep-resentative)
Hurd and Mc-Garry (1995)
Blacks overestimate subjectiveLE (ca. 7 years)
2000 US individuals(representative)
Mirowsky(1999)
Updating of Subjective Survival ProbabilitiesPeople reduce p75 if experiencingnegative health shock
12692 panel respon-dents from HRS(representative)
Smith, Tay-lor, Sloan,Johnson, andDesvousges(2001)
12692 panel respon-dents from HRS(representative)
Hurd and Mc-Garry (2002)
620 participants ofTaipeh hospital ex-amination
Liu, Tsou,and Hammitt(2007)
Smokers reduce p75 excessivelyif experiencing "smoking-related"health shock
12692 panel respon-dents from HRS(representative)
Smith, Tay-lor, Sloan,Johnson, andDesvousges(2001)
People reduce p75 if experiencingparental death
12692 panel respon-dents from HRS(representative)
Hurd and Mc-Garry (2002)
49

50

Chapter 3
What we Want to Know:
Contribution of the Study
The literature overview provided in the last chapter gives a picture ofsubjective LE, which is quite detailed in some regions and rather fuzzyin others. Several issues are addressed in the empirical part of thestudy, which introduces a split-up of subjective LE as a new analysismethod.
51

3.1 Joint Analysis of Determinants
Many of the studies discussed above address one possible determinantof subjective LE, for instance unemployment, education or family sit-uation. Especially the correlational studies do not take into accountomitted variables and often interaction of di�erent e�ects is unex-plored.
The following analysis provides multivariate regressions includingvariables from all relevant groups of determinants and allows to singleout the relative importance of in�uence factors. While we certainlystill cannot answer all questions due to the limited number of vari-ables in the available dataset, it is a step toward a more completeidea of the formation of subjective LE.
3.2 Analysis of Subjective LE in Germany
Most of the evidence in subjective LE refers to US data1, whichshould not be surprising: With a GDP of about $ 14 trillion peryear, the United States are the world's most important economy,and with a population of 304 million also the largest country of thedeveloped world. Many researchers are based at American universi-ties, resulting in a traditional predominance of US-related studies inmajor scienti�c journals. In addition, the HRS provides superb dataon subjective survival probabilities of Americans, which led to a wideuse of these data.
However, it is not certain whether the measured perception of Amer-icans can be taken as �general human behavior� and simply be trans-fered to other countries. Without a doubt, cultural di�erences be-tween the US and for instance Germany are not trivial. In his in-
1Exceptions are Van Doorn and Kasl (1998)/Australia, Betz (2005)/Europeand Liu, Tsou, and Hammitt (2007)/Taiwan.
52

�uential work, Hofstede (2001) shows that despite all intra-nationalheterogeneity, countries di�er signi�cantly in various dimensions ofculture, including Uncertainty Avoidance and Long- vs. Short-TermOrientation2. Consequently, there is no guarantee that German in-dividuals exhibit the same patterns in subjective LE as Americanindividuals. Additional evidence for the relevance of cross-countrydi�erences in subjective variables is provided by research on self-reported health (Jürges (2007)).
With the SAVE study, a comprehensive dataset is available for Ger-many, o�ering the opportunity to analyze subjective LE of the Ger-mans. The following analyses provide evidence which can help Ger-man policy makers to react adequately to biases of subjective LE intheir country.
3.3 Understanding Updating of Subjective LE
Past research provides some evidence on the updating of subjectivesurvival probabilities if health shocks occur. Probabilities �t wellinto Baysian updating models, and the HRS dataset (providing largesample sizes) and the (very accurate) NHI dataset from Taiwan havebeen used to show signi�cant updating e�ects. No study has yet in-vestigated how di�erent health shocks are re�ected in the intuitive,easy-to-access measure of subjective LE (in years). This paper sug-gests a simple model of LE updating and tests it using the paneldimension of SAVE.
2Out of 53 countries, Germany ranks 29 in the Uncertainty Avoidance Index,while the United States rank 46. The Long-Term Orientation Index providesvalues for 23 countries, Germany ranks 14 and the United States 17.
53

3.4 Split-up of Subjective LE
The most innovative contribution of this study, though, is the intro-duction of a new method to analyze subjective LE: The breakdownof subjective LE into the individual perception how long people liveon average (the estimated average LE), and the subjective ex-pectancy how much shorter / longer an individual lives compared tothe average (the subjective LE compared to average). While the�rst is in�uenced by the knowledge an individual has on actuarial lifeexpectancies as well as the reference group an individual considers as�average�, the second is a result of individual knowledge on personallongevity factors (like health situation etc.) and individual optimism/ pessimism. Dividing subjective LE into these possible causes ofbiases helps to understand where biases stem from. This informationcan be used to decide how to address a certain incorrect pattern insubjective LE if policy makers want to improve individual decisionmaking.
The SAVE survey includes several questions inquiring both dimen-sions of subjective LE. The comparison of these helps to understandthe reasons for biases in subjective LE and provides an assessmentof the rationality of updating procedures.
54

Chapter 4
Determinants of Subjective
Life Expectancy: New
Evidence from Germany
The empirical part of the study tries to answer the open issues sum-marized in the last chapter. This is achieved using data from theSAVE survey, which is pooled in a �rst step. This chapter describesthe sample and available variables, as well as empirical models andestimation strategy. Descriptive statistics give an intuitive overviewof LE in Germany, and numerous regressions provide evidence on therole particular determinants play in the formation of subjective LE.
55

4.1 Data and Variables
This section describes the dataset and variables used for the descrip-tive and inductive analyses in this chapter. The same data and vari-ables also provide the basis for the analysis of updating behavior inthe next chapter.
4.1.1 Pooled SAVE Sample
The SAVE study is a national representative survey of sociological,psychological, and �nancial characteristics of German households.Started in 2001, it has been conducted annually from 2005 on, sur-veying about 3000 households on a panel basis. SAVE is coordinatedby the Mannheim Research Institute for the Economics of Aging(MEA), interviews are conducted by TNS Infratest. The shift toan annual cycle in 2005 also brought a major extension of the ques-tionnaire, including detailed questions about the respondents' healthstatus. The following paragraphs describe the preparation of thedataset.
Unit Nonresponse and Weighting
Following the convention, non-participation in the survey, despite be-ing chosen by a random selection process, is called unit nonresponse,as opposed to item nonresponse, the refusal to answer a certain ques-tion within an otherwise completed questionnaire.
Participants of SAVE are chosen from a multiple strati�ed multi-stage random sample, including all German speaking households inGermany with a household head of eighteen years or older1. Partici-pation in the study is voluntary, however various incentives together
1A small number of respondents has been selected on a quota basis duringthe experimental phase of the study and remained in the panel until 2006 (357respondents in 2005, out of which 333 reappear in 2006).
56

with a special interviewer training are used to secure a high partici-pation rate. Response rates vary between the years; 25%-50% refuseto take part in the study in every year (Schunk (2006), Börsch-Supan,Coppola, Essig, Eymann, and Schunk (2008)).
A unit nonresponse rate of around 50% might cause biases if therefusal occurs systematically. For instance, one might imagine high-income individuals to be especially time-constraint and hence denyingparticipation more often than low-income individuals. In economicterms, they have a lower marginal utility of money (and hence a lowerutility of the incentive o�ered for participation) and a lower utilityof the �entertainment value� of the survey.
To reach representativeness, weights are calculated based on theMikrozensus (a mandatory survey of the Federal Statistical O�ceof Germany). The following analysis uses weights based on incomeand age provided by MEA (Method 1 in Schunk (2006)). Weights arecalculated as follows: Observations in SAVE are split into nine cells(3 age classes and 3 income classes), and the relative frequencies ofthese cells are compared to the relative frequencies of the respectivecells in the Mikrozensus (from 2004, 2005 and 2006, respectively),giving 9 di�erent weights for each year.
Weights are calculated for the whole dataset, for each year individu-ally. In the analysis of this chapter, three years are pooled. However,many observations are from individuals who stay in the sample forall three waves, and the general structure of the sample does notchange between the years. Hence each year's weights can be used forthe respective observations. In the preparation of our dataset, someobservations are deleted, e.g. because of missing values (see below).Because of this, weights do no longer exactly �t to get representativeresults from regression analyses. Still, as the number of missing val-ues is very low, a bias in the results is very unlikely.
57

Besides theses points, the literature in applied econometrics discusseswhether the use of sampling weights is inappropriate in general (Win-ship and Radbill (1994)). To be sure that our results are not drivenby weighting issues, the regressions are also repeated unweighted.Respective results are reported in the appendix.
Item Nonresponse and Imputation
A couple of reasons may cause item nonresponse, including privacyconcerns and cognitive barriers. This has to be taken into account, ase�ects might be over- or understated if item nonresponse is not ran-dom, but di�ers between groups like income quintiles or age classes.The phenomenon has been analyzed beginning with the research ofFerber (1966). Beatty and Herrmann (2002) provide an overview ofthe literature. For the SAVE survey, Essig and Winter (2003) an-alyze nonresponse patterns for certain variables (but not subjectiveLE).
Most of the missing values in SAVE occur in �nancial variables (in-come, savings, wealth). Unlike those variables, the sociodemographicand psychological variables used in the following analysis are easy tounderstand and do not raise considerable privacy concerns. Insofar,the response rates are high (see below), and biases in the estimatesare not very likely.
One way to address item nonresponse is the imputation of missingvalues. The main advantage of the work with imputed datasets is thesimplicity of application: A researcher can simply use the dataset asif item nonresponse would not exist. For SAVE, an iterative multipleimputation procedure has been used to impute missing values. Ina �rst step, the conditional distribution of missing variables is esti-mated using regression methods on a sample with complete data. Theconditioning on as many variables as possible preserves the multi-
58

variate correlation structure of the data. In a second step, a Markov-Chain Monte-Carlo method is used to replace the missing answers inthe full data set by multiple draws from the estimated conditionaldistribution (Schunk (2008)).
Due to the stochastic nature of the imputation procedure, �ve dif-ferent datasets are calculated for the imputation of every wave. Ru-bin (1987) presents a procedure how to average regression results inthese datasets and modify standard errors of estimations to reachresults comparable to an analysis of single datasets. The procedure(sometimes referred to as �Rubin's Rules�) is implemented in stan-dard software packages (see Schafer and Olsen (1998) for an overviewand Carlin, Li, Greenwood, and Co�ey (2003) for a STATA package).
A shortcoming of Rubin's Rule is the high amount of required com-putations, especially if several independently imputed waves are com-bined and maximum likelihood estimators are used (as in this study).The alternative is to use single datasets and perform sensitivity analy-ses with other outcomes of the imputation procedure (Rubin (1987)).In this paper, each year's dataset No. 1 is used for all the resultsstated below. Tests repeated the analysis with combinations of otherdatasets, leading the same results.
A remaining caveat is the dependent variable: Using imputed vari-ables on the left hand side (LHS) of a regression could bias estima-tors, as missing values in the LHS variable are imputed using ba-sic demographic variables, who also show up on the right hand side(RHS). Consequently, a regression analysis would estimate a corre-lation structure between the LHS and the RHS variables which hasbeen partly created during the imputation procedure. Due to thecomplexity of the imputation procedure, a correction of the estima-tions for imputed correlation is hardly possible.
59
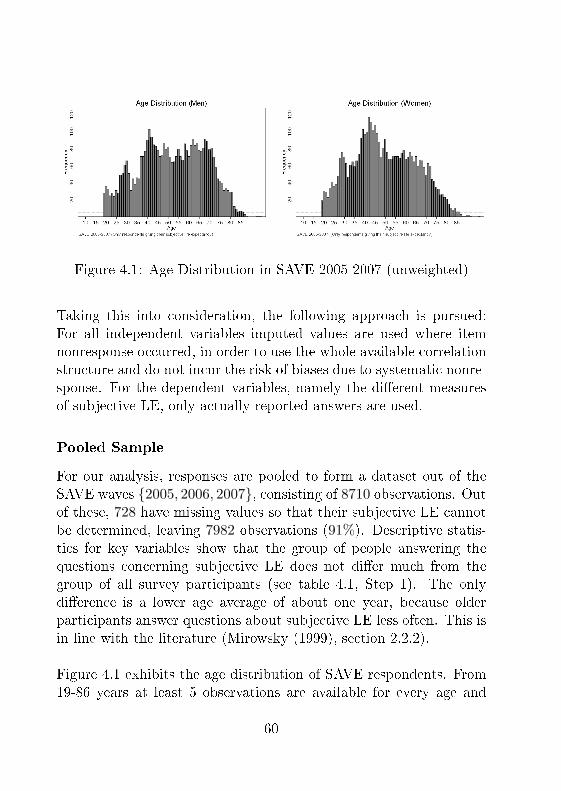
Figure 4.1: Age Distribution in SAVE 2005-2007 (unweighted)
Taking this into consideration, the following approach is pursued:For all independent variables imputed values are used where itemnonresponse occurred, in order to use the whole available correlationstructure and do not incur the risk of biases due to systematic nonre-sponse. For the dependent variables, namely the di�erent measuresof subjective LE, only actually reported answers are used.
Pooled Sample
For our analysis, responses are pooled to form a dataset out of theSAVE waves {2005, 2006, 2007}, consisting of 8710 observations. Outof these, 728 have missing values so that their subjective LE cannotbe determined, leaving 7982 observations (91%). Descriptive statis-tics for key variables show that the group of people answering thequestions concerning subjective LE does not di�er much from thegroup of all survey participants (see table 4.1, Step 1). The onlydi�erence is a lower age average of about one year, because olderparticipants answer questions about subjective LE less often. This isin line with the literature (Mirowsky (1999), section 2.2.2).
Figure 4.1 exhibits the age distribution of SAVE respondents. From19-86 years at least 5 observations are available for every age and
60

sex. Much of the following analysis is done per age class, and reason-able conclusions require an adequate number of observations. Con-sequently, the following analysis is limited to the age interval [19, 86]for both men and women (table 4.1, Step 2).
Finally, respondents reporting a subjective LE below their currentage (as described in the next section) are deleted. This might causebiases, but the number of such illogical reported subjective LE is verylow (62 observations, 0.7%). The resulting dataset shows almost thesame demographic structure as before (table 4.1, Step 3; see alsosection 4.3.3).
Comparison of Characteristic Variables in Dataset Preparation
Raw data Step 1a Step 2b Step 3c
Observations 8710 7982 7964 7902Male 49.1% 49.7% 49.7% 49.6%Married 59.0% 59.6% 59.7% 59.7%With children 77.5% 77.3% 77.3% 77.3%With Abitur 27.3% 28.3% 28.3% 28.5%Aged 51.6 (16.1) 50.7 (15.8) 50.7 (15.7) 50.5 (15.6)Income (EUR)d 2312 (1841) 2331 (1835) 2332 (1835) 2334 (1829)
aDeleted if missing values for subjective LEbOnly age interval 19-86 yearscDeleted if subjective LE < agedMean (Standard Deviation)
Table 4.1: Dataset Preparation
4.1.2 Variable Construction
Before presenting descriptive and inductive statistics, this subsectiondescribes the construction of the dependent variable as well as theregressors. Some lines motivate the choice of these particular vari-ables.
61

Measures of Subjective LE
In the SAVE study, subjective LE is surveyed in several steps. First,respondents are asked which age they think men and women of theirage will reach on average (LEavr). In a next step, the interviewer askswhether the respondent beliefs to live shorter, longer or about thesame as average (C). Finally, he asks how many years the respondentbelieves to live shorter or longer than average (if this has been statedbefore) (Y earsi, i = shorter,longer)2. Together, these variables allowto calculate individual subjective LE (SLEind):
SLEind = LEavr − 1 (C = shorter)·Y earsshorter + 1 (C = longer)·Y earslonger
(4.1)In this study, the compound measure SLEind is analyzed besides thesingle variables LEavr and C. Compared to the literature, the ques-tions concerning SLE are non-standard, as they include a hint to useLEavr as reference group for the determination of personal subjectiveLE. The over reliance on the average family length of life reportedrepeatedly in the literature might be reduced by this design (section2.1.3). For our purposes - the analysis of a representative populationsample - this does not matter, if anything it reduces noise and makesit easier to determine typical determinants of subjective LE3.
The major advantage of the SAVE design is the additional infor-mation the dataset provides: We do not only know the subjectiveLE of the individuals, but also what they perceive as being the aver-age LE and if they believe to live shorter or longer than the average(and how much). Insofar we can distinguish biases in estimated av-erage LE and determinants of the individual relative LE (being acomposition of private information and optimism/pessimism).
2The exact wording of the questions can be found in appendix B.3Of course only determinants other than over reliance on average family length
of life can be determined.
62

Independent Variables
To reveal the interaction of di�erent determinants of subjective LE,several groups of RHS variables are included into the regressions (fol-lowing the structure of literature table. The use of particular vari-ables is discussed brie�y; available variables which are not includedare mentioned as well.
� General characteristics include the respondents' age, sex,and region. Due to the actuarial gap of life expectancies be-tween men and women, as well as the structural di�erencebetween male and female biographies, all analyses are doneseparately for men and women. This divides the sample size inhalves, but there is no alternative: Interaction terms betweensex and all other determinants would have the same limitingconsequence for the precision of estimators. Furthermore, inde-pendent analyses for men and women can be seen as additionalsensitivity analyses.
In regressions, the respondents' age is included as a linear andquadratic term. It is normalized around the sample mean (sep-arately for men and women) to be able to interpret the signsof the respective coe�cients. Additional non-linearities at crit-ical ages (e.g., 65 years) have been checked for but could notbe identi�ed in any regression. Some age e�ects might also becaptured by the dummy variable for �retired� (see below).
The sample size does not allow an analysis on state level, be-cause the subsamples are not representative for single Bun-desländer. To allow at least for di�erences between Westernand Eastern Germany, a dummy variable Eastern Germany
is included into regressions.
� Past research showed that family characteristics play an im-portant role in the formation of subjective LE. Dummy vari-
63

ables for marital status, whether the respondent is widowedand the existence of children are included. The numberof children living in the household or outside the household isinsigni�cant (as well as various nonlinear speci�cations). In-formation on parental longevity is not available in the SAVEsurvey.
� Out of the available measures of education, dummy vari-ables for passing at least the Abitur (German university en-trance quali�cation) and for the completion of at least un-dergraduate studies at a college or university (GermanFachhochschul- or Universitätsstudium) are included. Otherquali�cations are insigni�cant.
To proxy how well-informed a person is, we tried to includethe availability of an internet access and the frequency of usingthe internet. In most regressions the respective estimators havehowever been insigni�cant. Unfortunately, no adequate proxyis available for education-independent knowledge or expertise4.
� One strength of the SAVE survey is detailed data concerningthe participants' economic situation. The regression analysisincludes household income in linear and quadratic speci�ca-tion, as well as a dummy whether the respondent is retired.Wealth variables are insigni�cant, probably due to noise inmeasurement of wealth (which includes items like claims fromoccupational pension plans which are di�cult to specify).
To examine the e�ect of unemployment, two dummy variablesare included. �Current unemployment� refers to the presentsituation, while �Unemployment history� measures whether aperson has ever been unemployed for at least six months.
4Beginning in 2007, the SAVE survey contains a quiz part to measure �nancialliteracy ; the results might be used as soon as they are available for several years.
64

� The importance of lifestyle and behavior for actuarial LEmakes it imperative to include these dimensions into the anal-ysis of subjective LE. To measure the in�uence of smoking,dummy variables for current smokers and former smokers areincluded, as well as dummies for the (at least) weekly con-
sumption of alcohol and (at least) weekly exercise. In ad-dition a dummy measures whether participants do voluntarywork on a regular basis.
� Given the particular importance the individual health situ-
ation has for subjective LE, variables have been carefully se-lected to describe the perceived health conditions. Particulardiseases and disorders are too diverse to occur in a representa-tive way, so the information content is used only later in theanalysis of updating (chapter 5). For this chapter, two dummyvariables are used as summary measures: Bad health describesa respondent calling her health status as �bad� or �very bad�(1 or 2 on a 5-point scale). Long-term health problems con-tains the answer to a yes/no- question asking for chronic healthproblems. Naturally both variables can be true for one person.
Tables 4.2 and 4.3 provide an overview of all variables used.
65

VariableDe�nitionsandSummary
Statistics1/2
Variable
De�nition
Mean
Std.Dev.
Male
1ifpersonismale
.4956
.5000
Age(raw
)Respondent'sage(years)
50.50
15.59
Age
Agestandardized
aroundweigh
tedmean
4.179
15.57
Agesquared
Standardized
agesquared
259.8
287.8
East
1iflives
inEasternGermany
.2766
.4474
Married
1ifmarriedandlives
together
withspouse
.5973
.4905
Widow
ed1ifwidow
ed.0697
.2547
Children
1ifhasatleast
1child
.7725
.4193
Practicalhelp
1ifreceived
practicalassistance
duringlast
year
.4403
.4965
Highschool(A
bitur)
1ifachieved
educationisAbiturorhigher
.2848
.4513
College(H
ochschule)
1ifcompleteduniversity
studies(incl.FH)
.1631
.3695
Income
Monthly
household
net
income(in1000EUR)
2.339
1.828
Incomesquared
Incomesquared
8.789
37.747
Retired
1ifretired
8.789
37.747
Currentunem
ployment
1ifiscurrentlyunem
ployed
.0909
.2876
Unem
ploymenthistory
1ifever
beenunem
ployed
for6month
orlonger
.3190
.4661
CurrentSmoker
1ifsm
okes
regularly
.2887
.4532
Ex-smoker
1ifisnonsm
oker,butsm
oked
regularlyearlier
.2890
.4533
Weekly
drinking
1ifconsumes
alcoholatleast
weekly
.2890
.4533
Voluntary
work
1ifengages
inthecommunityvoluntarily
.6415
.4796
Table4.2:
OverviewVariablespart1
66

VariableDe�nitionsandSummary
Statistics2/2
Variable
De�nition
Mean
Std.Dev.
Badhealth
1rankshealthstatusasbadorverybad
.0863
.2808
Long-term
healthproblems
1ifreportslong-term
healthproblems
.4703
.4991
Estim
atedAvrLE(m
ale)
Estim
atedaverageLEofage-group(years)
77.00
5.619
Estim
atedAvrLE(fem
ale)
Estim
atedaverageLEofage-group(years)
81.43
5.703
ExpectLElonger
1ifexpects
tolivelonger
thanaverage
.1601
.3667
ExpectLEnotshorter
1ifexpects
tolivelonger
orsameasaverage
.8484
.3587
LE
SubjectiveLE(years)
79.18
8.005
Yeare�ect2005
1ifobservationisfrom
2005
.2660
.4419
Yeare�ect2006
1ifobservationisfrom
2006
.4014
.4902
Table4.3:
OverviewVariablespart2
67

4.2 Descriptive Analysis
To answer the question what subjective LE in Germany looks like,some charts exhibit typical patterns and give an idea where biasesstem from.
4.2.1 Personal LE Compared to Age Group
To start, �gure 4.2 compares the means of subjective LE and es-timated average LE by sex and age. If people on average do notover- or underestimate their relative LE compared to a same-sex agegroup, the two measures should be on average the same. This is in-deed the case, with a correlation between SLEind and LEavr of 0.736and 0.745 for males and females, respectively.
The graph shows the development of SLEind and LEavr as people getolder. In line with the high correlation the measures follow closely.However, for the group of old men (from about 70 years on) and veryold women (from 80 years on), the mean subjective LE lies well abovethe estimated average LE.
The high correlation between the means of individual subjective LEand expected average LE can in principle stem from two facts: Ei-ther most people believe to live about as long as the average. Orthe individuals' relative LE deviate about the same in both direc-tions and cancel out in the mean. Figure 4.3, plotting the combineddistribution of Cshorter and Clonger, shows that both e�ects play arole, but the �rst one is more important: 65.0% of male and 72.6%of female respondents expect to live about as long as average. Thisis surprisingly high, given the heterogeneity in personal health situa-tion, socioeconomic status, family situation etc. Among men, 16.2%believe to live shorter, compared to 18.8% expecting to live longer.For women, the number of respondents expecting to live shorter isslightly higher than the number of those expecting to live longer
68

Figure 4.2: Estimations of LE in SAVE by Age
(14.1% and 13.2%, respectively).
Figure 4.4 supports an hypothesis which already arose from �gure4.2: The overhang of people expecting to live longer stems from thevery old. Especially among men older than 75 and women older than80, up to 50% believe to live longer than average, compared to al-most 0% believing to life shorter. This is in line with the model ofLudwig and Zimper (2007), who hypothize that people become moreoptimistic as they get older. The pattern found here, however, couldalso be caused by sample selection e�ects or a misunderstanding ofthe question (section 4.3.3).
A natural question is why people believe to live shorter or longerthan average. The SAVE survey asks for the reasons, o�ering fourdi�erent explanations (multiple answers are possible). The distribu-tion of the reasons can be found in �gure 4.5. The main reason for anexpected shorter life is by large a poor health status (64.0% for men
69

Figure 4.3: LE Compared to Average (unweighted)
and 65.2% for women). Among the people expecting a longer life, theo�ered reasons play about the same role. Interestingly, the length oflife of close relatives is seen as in�uencing own LE about twice as of-ten if the relatives reached a high age, compared to an early demise.Furthermore, a healthy way of life is named as reason by 68.0%/66.6%of those expecting a longer life, while only 18.0%/28.0% of those ex-pecting a shorter life attribute this fact to an unhealthy way of life.
Summary
To summarize the key �ndings so far: More than two thirds of Ger-mans believe to have about the same LE as their age group, withwomen believing to be average more than men. Among older people,the proportion of optimists believing to live longer than average in-creases strongly. Bad health conditions are seen as the main reasonfor a life shorter than average.
70

Figure 4.4: Comparison with Average at Di�erent Ages
71

Figure 4.5: Reasons for Expected Shorter or Longer Life
72

4.2.2 Comparison of Subjective and Actuarial LE
A comparison of mean subjective LE with actuarial LE for a same-sex age group provides evidence on the accuracy of individual es-timations and the direction of systematic biases. For comparison,actuarial data is taken from Statistisches Bundesamt (2007). A sim-pli�ed con�dence interval of subjective LE is calculated (assumingthat the distribution of SLEage j is reasonably well approximated bya normal distribution) as follows5:
{SLEage j ± 1.96 SD(SLEage j)/
√nage j
}(4.2)
Figure 4.6 shows that average subjective LE follows actuarial LE,which is also re�ected in the correlation between mean subjective LEand actuarial LE of 85.9% for men / 84.3% for women. Consideringthe fact that actuarial LE is calculated from life tables that do notincorporate technical progress (see the discussion in section 1.3.2),individuals should slightly overestimate their subjective LE. In sharpcontrast, the subjective LE curve lies below the actuarial curve, ex-hibiting both men and women on average signi�cantly underestimat-ing their subjective LE. This is true for a wide age rank, only thevery young (below 35 - where actuarial LE is still low) and the veryold (men older 75, women older 80) seem to be in the actuarial region.
This pattern of systematic underestimation contrasts the �ndings inpast research with American data, stating that estimations of sub-jective LE are quite well on average and if anything slightly overes-timated. Figure 4.7 provides a comparison of the German LE curves
5Unlike the regressions in the next section, the descriptive analysis providedhere does not require a special treatment of standard errors due to the originalpanel structure of the pooled dataset. Con�dence intervals are calculated foreach group of same age respondents, and no individual appears twice in the datahaving the same age.
73

Figure 4.6: Subjective and Actuarial LE
74

with US data from Mirowsky (1999)6. Naturally the comparison canonly give a brief idea due to numerous di�erences in the design of thetwo studies7. However, it seems evident that the strong underesti-mation of subjective LE is a phenomenon in the German data whichdi�ers from America.
What drives the downward bias? A German pessimism concerningindividual LE, wide-spread ignorance of improvements in LE overthe last 40 years, or a mixture of both? The split-up of LE questionsin SAVE at least partly explains the puzzle. The fact that a largemajority expects to live about as long as average (�gure 4.3) makesthe case for a general underestimation of average LE as explanation.We saw that at an old age, people tend to be more optimistic con-cerning their individual LE compared to average (�gure 4.4). Thiscould explain the convergence of mean subjective LE to actuarial LEin old age groups.
To examine this hypothesis, �gure 4.8 plots the mean estimated av-erage LE together with actuarial LE for men and women. The es-timated curve lies signi�cantly below the actuarial curve for all agegroups from about 35 years on, underlining that the downward-biasof subjective LE is caused by an estimation of average LE which istoo low.
Summary
Unlike Americans, Germans on average underestimate their subjec-tive LE; this is true for men and women. The downward bias is causedby a general underestimation of average LE, which is canceled outby individual optimism only among the very old.
6No di�erentiation between men and women is possible here given the dataprovided by Mirowsky (1999).
7The ASOC data is 10 years older, the question was asked in a di�erent way,and the survey has been conducted via phone. For more details see section 2.2.2.
75

Figure 4.7: International Comparison of Subjective LE
76

Figure 4.8: Estimated Average and Actuarial LE
77

4.3 Regression Analysis
The descriptive statistics presented above reveal some basic patternsof subjective LE in Germany. To make statements about the im-portance of di�erent in�uence factors, however, a formal regressionanalysis is needed. This section describes the estimation strategy,followed by the regression results and an interpretation of the out-comes.
4.3.1 Regression Models
With past research and the descriptive analysis in mind, subjectiveLE is assumed to be a function of determinants which can be repre-sented by seven major groups:
SLE = f(Sex,Age, Fam,Edu, Econ, LStyle,Health) (4.3)
where Fam are variables describing the family situation, Edu de-scribe education, Econ are variables describing the economic situa-tion, LStyle describe lifestyle and behavior and Health are healthvariables. In order to split up the e�ect of subjective LE as describedin section 3.4, several empirical models are estimated.
Linear Regressions
The compound measure subjective LE (SLE) and the estimated aver-age LE (EstAvr) are estimated with a linear regression model (somenon-linearities are captured by the speci�cation of variables, see sec-tion ??). For notational ease, all independent variables are noted asxk:
SLEi = β0 +∑
βkxik + εi (4.4)
E [SLEi|xi] = x′iβ (4.5)
As SLE can only have positive values, a left-censored tobit modelwould be the most precise formulation. Results however do not di�er
78

from OLS regressions8, so only OLS estimations are presented hereto get coe�cients which are easy to interpret.
To determine the signi�cance of estimators for βk, the structure ofthe data has to be taken into consideration: As three waves of thesurvey are pooled, some observations come from the same person indi�erent years. This is desired for the updating analysis in the nextchapter, but for pooled regression it biases the standard errors ofβk-estimators because the εi from one person at di�erent times arecorrelated. To account for this, the standard errors reported withregression coe�cients are robust Huber-White-Sandwich estimates9.Finally, dummy variables are included to measure year e�ects.
Probit Estimations
Concerning relative expectations, two probit estimations analyze thein�uence of the Xk on the probability to belong to the ExpLongerand ExpNotShorter :
E [ExpLonger|xi] = Φ(x′
iβ)
with Φ (·) = Normal c.d.f.(4.6)
The dummy variable ExpLonger is 1 if a person expects to live longerthan average and 0 otherwise. ExpNotShorter is 1 if a person be-lieves to live longer than average or about the same as the averageand 0 only if she believes to live shorter. This speci�cation has been
8This is not surprising as all observations are way above zero (the smallestvalues are 40 for SLE and 50 for EstAvr).
9 The robust variance estimator is
V̂robust = V̂
(M∑k=1
u(G)k
′u(G)k
)V̂
where V̂ = (−∂2 ln L/∂β2)−1 is the conventional variance estimator, M is the
number of di�erent persons (consisting of several observations j) and u(G)k =∑
j∈Gk∂ ln Lj/∂β is the contribution of the kth person to ∂ ln L/∂β.
79

chosen to make the interpretation of the sign comparable: Positivecoe�cients always refer to a longer expected life, negative coe�cientsto a shorter life.
Two reasons speak in favor of two separate probit estimations insteadof one ordered probit : First, the ordered probit mixes two di�erente�ects, because it does not necessarily mean the same for a person to�deviate to above� from average or to �deviate to below�. For exampleit could be that the �rst one is rather a psychological phenomenon(driven by optimism), while the second one is rather an informationissue. Of course this is only an (untestable) hypothesis, but the two-probit-design is surely more �exible to allow for di�erent in�uencestructures for the e�ects10.
The second reason is a rather pragmatic one: In the two-probit-designwe have two distinct estimations, as the groups of people di�er. Com-paring results across groups then provides us with a �double check�.
In order to interpret the size of e�ects, the tables below reportmarginal e�ects instead of probit coe�cients11. Ruud (2000), p.755discusses alternative approaches to measure marginal e�ects, con-cluding that sample means of the derivatives of the regression func-tion (and sample mean di�erences for dummy variables, respectively)are most appropriate. Given the size of the dataset, however, it isinfeasible to numerically calculate the marginal e�ects for each of the7902 observations12. Following the convention, the partial derivativesare consequently evaluated at the sample means of the explanatory
10Alternatively, a multinominal logit model would allow for the same �exibility.11Naturally no �marginal e�ects� are calculated for the constant, even though
a constant is part of the estimated speci�cation (see equation (4.6)).12With the standard laptop computer used for the estimations (1.5 GHz, 540
MB RAM) it takes about 160 hours.
80

variables, calculating marginal e�ects as
Φ(x1
i′β̂)− Φ
(x0
i′β̂)
(4.7)
for dummy variables, where xai is xi with the dummy variable for
which the marginal e�ect is calculated set equal to a = 0, 1 and allother variables are set to their sample mean. For continuous variables(age, income) marginal e�ects are calculated as
β̂ φ(x̄′β̂
)with φ (·) = Normal c.d.f. (4.8)
Weighting
Estimations are weighted as described in section 4.1.1. For a sensi-tivity analysis, all estimations have been repeated unweighted. Theresults (which do not di�er much) are reported in the appendix, dif-ferences are also mentioned in the text.
4.3.2 Regression Results
The regression analysis provides ample evidence on the determinantsof subjective LE. All results can be found in tables 4.4 and 4.6 for menand women respectively, and are discussed following the structureintroduced in section 2.5.
In�uence of General Characteristics
Concerning the Age of the respondents, subjective LE of both menand women exhibit a pattern consistent with actuarial data. Highlysigni�cant positive coe�cients13 indicate that subjective LE increaseswith age, and it increases at an increasing rate. The linear e�ect ofage on estimated average LE is insigni�cant14, the quadratic e�ect is
13Remember that age is normalized around the weighted mean.14The unweighted regressions show a signi�cant positive e�ect, which is how-
ever low in magnitude.
81

signi�cantly positive. All coe�cients in the probit estimations con-cerning estimated relative LE are positive and highly signi�cant.
Summarizing, age has an e�ect on subjective LE consistent with actu-arial data, while the increase in age is mostly driven by an improvingrelative estimation (�optimism�) with age, and not so much by in-creased estimated average LE. Hence the descriptive results remainvalid given extensive control variables.
Subjective LE does not di�er signi�cantly between Western- andEastern Germany. However, the dummy variable East has a sig-ni�cant e�ect on estimated average LE, which is 0.7 (0.6) years lowerfor men (women). Apparently respondents refer to di�erent groupsas �the average�, and consider the fact that actuarial LE is indeedlower in Eastern Germany (Statistisches Bundesamt (2007)).
82

Men:Determinants
ofSubjectiveLE
Variable
I:Subjective
II:E�ecton
II:E�ecton
IV:Estim
ated
LE
Pr(longer)
Pr(notshorter)
AverageLE
General
Age
.0646***
.00269***
.00208**
.0187
(.0205)
(.00087)
(.00085)
(.0153)
Agesquared
.00711***
.000139***
.000192***
.00447***
(.000851)
(.00004)
(.00004)
(.000678)
East
-.420
.000417
.0192
-.701**
(0.332)
(.0199)
(.0175)
(.331)
Familysituation
Married
-.115
-.0139
.0395**
-.253
(.488)
(.0227)
(.0189)
(.323)
Widow
ed.795
.0711
.0373
-.258
(.968)
(.0553)
(.0395)
(.661)
Children
-.630
-.000434
-.0251
-.902**
(.542)
(.0250)
(.0196)
(.376)
Practicalhelp
.767**
-.00906
.0262*
.658***
(.350)
(.0165)
(.0145)
(.251)
Education
Highschool(A
bitur)
1.068**
.0637***
-.0731***
.862**
(.553)
(.0234)
(.026)
(.407)
College(H
ochschule)
.387
-.0197
.0319
.763*
(.599)
(.0241)
(.0217)
(.452)
Economicsituation
Income
.171
-.00795
-.00189
.217*
(.161)
(.00789)
(.00915)
(.125)
Incomesquared
-.00326
.000305
.000431
-.00723*
(.00585)
(.00028)
(.00051)
(.00412)
Table4.4:
Determinants
ofSubjectiveLE:RegressionResults(M
en)
83

Retired
-.0440
-.0136
-.0284
.341
(.674)
(.0230)
(.0286)
(.412)
Currentunem
ployment
-1.33*
-.0368
.000303
-.599
(.697)
(.0286)
(.0281)
(.516)
Unem
ploymenthistory
.0122
.0160
-.0221
-.0380
(.464)
(.0210)
(.0185)
(.332)
LifestyleandBehavior
Currentsm
oker
-2.07***
-.0632***
-.0548**
-1.13***
(.499)
(.0195)
(.0224)
(.366)
Ex-smoker
-1.15***
-.0500***
-.0267
-.524*
(.406)
(.0178)
(.0203)
(.305)
Weekly
drinking
.436
-.0281*
.0373**
.304
(.370)
(.0165)
(.0161)
(.279)
Weekly
exercise
.464
.0389**
.0247
.00285
(.365)
(.0161)
(.0161)
(.275)
Voluntary
work
-.769**
.00362
.000806
-.626**
(.361)
(.0160)
(.0149)
(.265)
Healthstatus
Badhealth
-4.53***
-.0922***
-.258***
-.926
(.775)
(.0212)
(.0391)
(.582)
Long-term
healthprob.
-2.72***
-.0979***
-.139***
-.356
(.417)
(.0180)
(.0189)
(.289)
Controls
Yeare�ect2005
-.116
.0677***
.0234*
-.961***
(.283)
(.0160)
(.0135)
(.220)
Yeare�ect2006
-.354
.0250
.0302**
-.953***
(.319)
(.0153)
(.0136)
(.247)
Constant
77.7***
��
77.2***
(.816)
(.639)
Figuresin
parenthesisare
robust
standard
errors.***,**and*represent
statisticalsigni�cance
at1%,5%
and10%
level,respectively.
Table4.5:
Determinants
ofSubjectiveLE:RegressionResults(M
en)-continued-
84

Women:Determinants
ofSLE
Variable
I:Subjective
II:E�ecton
II:E�ecton
IV:Estim
ated
LE
Pr(longer)
Pr(notshorter)
AverageLE
General
Age
.0526***
.00228***
.000521
.0128
(.0179)
(.00061)
(.00074)
(.0139)
Agesquared
.00518***
.0000788***
.000139***
.00267***
(.000710)
(.00003)
(.00003)
(.000634)
East
-.324
-.000856
.01032
-.537*
(.394)
(.0153)
(.0150)
(.308)
Familysituation
Married
-.195
-.0492***
.00970
-.0923
(.419)
(.0162)
(.0164)
(.327)
Widow
ed-.214
.00189
-.00294
-.275
(.614)
(.0206)
(.0264)
(.472)
Children
-.320
-.0034
.0137
-.746*
(.489)
(.0182)
(.0197)
(.388)
Practicalhelp
-.420
-.000662
-.0243*
-.0273
(.328)
(.0120)
(.0132)
(.272)
Education
Highschool(A
bitur)
.501
.0265
-.0380
.737**
(.492)
(.0172)
(.0238)
(.372)
College(H
ochschule)
.789
.0193
-.0105
.832**
(.565)
(.0216)
(.0260)
(.412)
Economicsituation
Income
.454***
.0200*
.0170**
.206*
(.146)
(.0112)
(.00732)
(.120)
Incomesquared
-.0155***
-.00152*
-.000837**
-.00292
(.00470)
(.00089)
(.00035)
(.00388)
Table4.6:
Determinants
ofSubjectiveLE:RegressionResults(W
omen)
85

Retired
-.761
-.0371**
-.0430*
.321
(.557)
(.0183)
(.0241)
(.369)
Currentunem
ployment
.642
.00511
.0130
.269
(.572)
(.0211)
(.0206)
(.467)
Unem
ploymenthistory
-.867**
-.00213
-.0243
-.357
(.397)
(.0147)
(.0156)
(.316)
LifestyleandBehavior
Currentsm
oker
-1.79***
-.0252*
-.0441**
-1.40***
(.445)
(.0155)
(.0187)
(.352)
Ex-smoker
-.603
-.0160
-.0328*
.0886
(.411)
(.0147)
(.0199)
(.324)
Weekly
drinking
.980***
.00986
.0148
.663**
(.337)
(.0137)
(.0146)
(.264)
Weekly
exercise
.268
.0177
-.0130
.0214
(.332)
(.0124)
(.0134)
(.262)
Voluntary
work
.256
-.0181
.0156
.315
(.331)
(.0127)
(.0140)
(.264)
Healthstatus
Badhealth
-4.53***
-.0882***
-.203***
-.495
(.747)
(.0117)
(.0359)
(.510)
Long-term
healthprob.
-2.46***
-.0627***
-.134***
-.555**
(.347)
(.0126)
(.0158)
(.278)
Controls
Yeare�ect2005
.122
.0560***
-.0168
-.244
(.267)
(.0134)
(.0141)
(.225)
Yeare�ect2006
-.703***
.000984
.00831
-.757***
(.259)
(.0120)
(.0122)
(.218)
Constant
81.2***
��
81.2***
(.713)
(.569)
Figuresin
parenthesisare
robust
standard
errors.***,**and*represent
statisticalsigni�cance
at1%,5%
and10%
level,respectively.
Table4.7:
Determinants
ofSubjectiveLE:RegressionResults(W
omen)-continued-
86

In�uence of Family Situation
Beingmarried has no signi�cant e�ect on subjective or reported aver-age LE. The in�uence on relative expectations is inconclusive: Beingmarried reduces the probability to live longer than average (signi�-cant for women), but also increases the probability to expect to livenot shorter (signi�cant for men). Together, the estimations indicatethat being married makes people feeling more average. Alternatively,it could be the case that individuals with an average health and LEmarry more often.
No e�ect of being widowed could be found in any regression. Thisdoes not stem from too little observations (551 individuals in thedataset are widowed). A spouse's death seems to have very littlein�uence on subjective LE.
Similarly, no signi�cant e�ect of children on subjective LE couldbe found in the data. They do however in�uence estimated averageLE: Men with children estimate the average LE 0.9 years shortercompared to their childless counterparts, women estimate 0.7 yearsshorter. There is no self-evident explanation of this e�ect, which isalso to weak to in�uence subjective LE.
The last characteristic of individuals' family situation under study isthe question whether they receive practical assistance from membersof the family outside the household or friends (examples given to therespondents include minor repairs, shopping, �lling out forms, andhelp for elderly people). Among male respondents, practical helpsigni�cantly increases subjective LE by 0.8 years, which is almostcompletely explained by a higher estimated average LE. Apparentlymen who receive practical help in their daily life are either betterinformed about improvements in LE, or they are in general moreoptimistic about people's longevity as they see that somebody caresabout people in need. For women, however, no signi�cant e�ect could
87

be found.
In�uence of Education
People having passed the German university entrance quali�cationAbitur estimate average LE 0.9/0.7 years (men/women) higher thanpeople without Abitur, which leads to a signi�cantly higher subjec-tive LE for men. People graduated from college or university estimateaverage LE an additional 0.8 years higher. A possible explanationis that higher educated people refer to a reference group of othereducated people, who indeed have a higher average LE. It is alsovery likely that better educated people are in general better informedabout actuarial LE.
The in�uence of education measures on relative expectations is in-signi�cant for women and inconclusive for men (positive for ExpLonger,negative for ExpNotShorter, which can again be interpreted as atrend to the average for educated individuals).
In�uence of Economic Situation
For women, subjective LE increases signi�cantly with a higher in-come, with a decreasing rate in income. About one half is causedby a higher estimated average LE, and half by improved relative es-timations. For men only a higher average LE is estimated, but nosigni�cant change of relative expectations can be seen in the data.
Being retired leaves the estimated average LE unchanged, whichmakes sense as the reference group of a person, as well as the in-formation she has, should not change in the moment of retirement.The two measures of relative expectations however worsen signi�-cantly for women (but not for men). This could be interpreted asincreased melancholy once women are retired. Equally, it could justre�ect nonlinearities in the in�uence of age (even though women are
88

retired at very di�erent ages).
In line with the literature, unemployment has a negative e�ect onsubjective LE. For men, current unemployment reduces subjectiveLE by 1.3 years. For women, more important than the current situ-ation seems to be whether one has ever been long-term unemployed(that means more than six month in a row): It reduces subjectiveLE by 0.9 years.
In�uence of Lifestyle and Behavior
All the measures of lifestyle and behavior included in the regressionsigni�cantly in�uence at least some of the LE variables. Most promi-nently, smoking reduces subjective LE by 2.1 years for men and 1.8years for women. Having once been a regular smoker still has ane�ect about half in magnitude. A strong reduction in LE is justi�edgiven the evidence on actuarial LE of smokers (section 1.1.2), whichindicates an even higher reduction. While they re�ect the case ofbeing a smoker in their subjective LE, smokers attribute this not somuch to their relative position (and hence their behavior): The highreduction is mostly driven by a lower estimated average LE, which ac-counts for 52%/74% of the subjective LE reduction of men/women.Apparently smokers know that they live shorter than nonsmokers(the probit estimates are all negative, most of them signi�cant); butthey underestimate the magnitude of life-shortening caused by theirbehavior. The reported subjective LE is driven down mostly by thelower estimated average, probably because smokers have a referencegroup of mostly other smokers or because they are in general moreignorant concerning LE. It might also be the case that smokers over-state the percentage of smokers in the population, and consequentlyestimate a lower average LE.
The in�uence of drinking alcohol is inconclusive: For men both mea-sures of relative expectation point in di�erent directions, and for
89

women both estimated average LE and subjective LE are signi�-cantly increased. Apparently �weekly drinker� are a group that dif-fers in some aspects not covered by the other variables.
Doing weekly exercise (sports or vigorous physical activity on thejob) makes men expecting a life longer than average, while the esti-mated average LE is not a�ected. It seems that people doing sportsknow well that physical activities improve their health and LE com-pared to their peers who do not. This is in line with the result thata healthy way of life is seen as major reason for a life longer thanaverage (by those who do expect to live longer) (section 4.2.1).
Finally, voluntary engagement in the community is analyzed as pos-sible determinant of subjective LE. For women, no signi�cant e�ectcan be found; for men the estimated average LE (and in consequencethe subjective LE) decrease by 0.6 years. Di�erent stories could ex-plain this relationship: Maybe many of the volunteers engage in carefor sick people, which makes them more aware of life-shortening dis-eases; maybe the group of volunteers simply represents a certain typeof person (like less educated people, or rural people typically engagedin �re brigades). As no further information about the type of volun-tary engagement is available, this cannot be determined. One resulthowever remains: Voluntary engagement has no in�uence on relativeLE compared to the average.
In�uence of Health Status
By far the most important determinant of subjective LE is individualhealth status. People with a bad health status have a subjective LEwhich is 4.5 years lower (same for men and women). Remember thatabout 9% report a bad health status, compared to 48% reportinglong-term health problems. The latter also reduces subjective LE by2.7/2.5 years (men/women). Out of the people in a bad health sta-tus, 99% also report long-term health problems, so in sum the 10%
90

with the worst health status have a subjective LE which is about 7years shorter, and the 39% who do not report a bad health statusbut still have long-term health problems still have a subjective LE2.5 years shorter. These determinants are by far the most importantin magnitude.
Unlike many determinants before, the health status does not a�ectthe estimated average LE at all, but drives tremendously down rela-tive LE. In contrast to smokers for instance, people with a bad healthstatus seem to realize very well that their condition is speci�c to themand therefore expect to live shorter than average (while the estimatedaverage is una�ected).
4.3.3 Discussion
While the construction of the dataset as well as variable constructionand regression design try to avoid possible biases in the estimations asmuch as possible, no analysis using real-world panel data is perfect.Consequently, the analysis presented above has limitations and raisessome doubts. The most important possible objections are discussedin the following paragraphs.
Non-Representativeness of Survey Participants
As noted above, observations are weighted along the dimensions ageand income in order to reach representativeness for Germany. How-ever, long-term studies using the German SOEP data showed thatthe average (actuarial) LE of survey participants is slightly higherthan life tables would predict (Schnell and Trappmann (2006)). Thereason is that persons in a very bad state of health excessively refuseto participate or continue the survey (Lampert, Kroll, and Dunkel-berg (2007)). Most likely the same is true for the SAVE dataset.
This type of sample selection bias however does not a�ect the ro-
91

bustness of our main results. Descriptive statistics showed a down-ward bias of subjective LE - a sample selection would lead to anunderestimation of the e�ect. The same is true for the regressionresults concerning the in�uence of health variables on subjective LE.If the group of bad-health-individuals in the sample would consistonly of relatively healthy people (because the very unhealthy indi-viduals dropped out of the panel), the importance of health statusas determinant of subjective LE would be underestimated. Insofar,both e�ects are robust. For the other regression coe�cients (educa-tion, income etc.) the e�ect is not so clear. However, no plausiblereason explains why a sample selection of the very unhealthy shoulda�ect the distribution of education in the sample. And the incomedistribution is adjusted via weighting.
Systematically Implausible LE Estimations
As described is section 4.1.1, some participants state an obviouslyimplausible subjective LE which is lower than their current age. Thedeletion of these observations could bias the analysis, as the indi-cation of an implausible LE might not occur randomly. However,implausible answers appear very seldom, and the 62 implausible an-swers distribute quite even: For men only 3 age classes have morethan 2 implausible answers, for women no age class.
To see if implausible answers about subjective LE occur randomly, asimple selection model is estimated, in line with all analysis in thispaper separately for men and women:
E [Implausible|xi] = Φ(x′
iβ)
with Φ (·) = Normal c.d.f.(4.9)
The dummy variable Implausible is 1 if a person states an implau-sible subjective LE and 0 otherwise. The probit coe�cients of anunweighted regression are summarized in table 4.8 (standard errorsare clustered as described in section 4.1.1). An interpretation of the
92

coe�cients might be misleading due to the small number of implau-sible observations (41 men/21 women, in a regression with 23 inde-pendent variables). However, a couple of coe�cients are signi�cantlydi�erent from zero, so it cannot be ruled out that the exclusion ofimplausible responses biases the analysis.
In�uence on Probability to Report Implausible Subjective LE
Men Women
Age .079581*** (.0236501) .0294013*** (.00916)Age squared .0004918 (.0005775) .0007749** (.0003859)East .2980743 (.1950328) -.4217431** (.2098739)Married -.1619043 (.1693728) -.1200174 (.2719678)Widowed -.257785 (.2745856) -.2544146 (.3053988)Children -.3767487** (.1949592) .2645622 (.2482102)Practical Help -.1883816 (.1692296) .1704562 (.1768927)High school (Abitur) -.4175799 (.2865708) -a
College (Hochschule) .0916776 (.2838075) -a
Income .0269993 (.1079878) -.2376209* (.1389443)Income squared -.0016419 (.0050466) .0167796** (.0074072)Retired -.3313734 (.2938231) -.0188226 (.2718441)Current unemployment 1.001609*** (.3793931) .4859143 (.390884)Unemployment History -.4901231** (.2175534) .1507961 (.2213986)Current smoker .4071759* (.2158613) .0748209 (.2281655)Ex-smoker -.1288544 (.1731651) -.070165 (.270934)Weekly drinking -.1957761 (.1525808) -.7119718** (.2869914)Weekly exercise .1090337 (.1460902) .4038988** (.189944)Voluntary work .2001357 (.1499111) -.394544* (.2148008)Bad health .4675475** (.1993365) .7890664*** (.1829867)Long term health prob. -.0638602 (.1719378) -.116144 (.2273461)Year e�ect 2005 -.0223418 (.1870715) -.2519767 (.2254913)Year e�ect 2006 .039822 (.1754758) -.3852816* (.2282698)Constant -3.597045*** (.4832002) -3.002437*** (.435779)
aEducation variables perfectly predicted failure for women and have therefore beenexcludedFigures in parenthesis are robust standard errors. ***,** and * represent statistical
signi�cance at 1%, 5% and 10% level, respectively.
Table 4.8: Selection Model �Implausible Answers�
To be sure, regression analyses have been repeated with a datasetincluding the implausible answers as sensitivity analyses (results arereported in tables A.5 and A.7 in the appendix). The coe�cients for
93

income e�ects among male individuals are insigni�cant in the regres-sion for estimated average LE. While they are the same in magnitudethis is caused by increased noise from the implausible observations.For women, the coe�cient for education (high school) almost doubles- which stems from the fact that none of the implausible respondents(reporting a very low subjective LE) has passed the Abitur.
All other coe�cients remain signi�cant and in the same magnitudein all regressions and probit estimations. Hence the treatment of im-plausible answers does not a�ect the results presented in this chapter.
Misunderstanding of Survey Questions
Finally, one could argue that people systematically misunderstandthe survey questions concerning LE. If they understand �What av-erage age do you believe men/women of your cohort will reach?�instead of the correct question �What average age do you believemen/women of your age will reach?�, they would report somethingdi�erent than we expect to measure. The same is true for the ques-tion �If you think of your own situation and your state of health, doyou think that, in comparison to other men/women of your age group,your lifespan will be... shorter/about the same/longer?� which couldbe misunderstood in a similar way.
In principal, we can never be totally sure what people actually thinkwhen they read a survey question, probably only a in-depth inter-view right after posing the question could reveal the way of thought.However, in the special case of this question it seems very unlikelythat people by large misunderstand the question. The formulation isvery straightforward, and no reason is visible why people should notunderstand the simple words �of your age�.
In addition, some evidence in the data points toward the case that atleast most people do not confuse �age� and �cohort� in the question:
94

As will be shown in the next chapter, a time series of the same per-son being asked several years in a row shows an estimated averageLE which increases with every year a person gets older. This makessense for the right version of the question, as LE increases with age. Itcontradicts however the �cohort� version of the question, as a cohortLE does not increase while an additional years passes15. So while itcannot be ruled out that some individuals (esp. in very old years)misunderstand the question in the described way, this is surely notthe case for the largest part of the sample. Besides it should be keptin mind that all results concerning the compound measure �subjec-tive LE� remain valid however the questions are understood, as in thecase of a misunderstanding, the personal additional LE compared toaverage will be correspondingly higher.
15Besides the technological progress in health care etc. which is negligible forthe time span of one year.
95

96

Chapter 5
Updating of Subjective Life
Expectancy: Testing a
Simple Model
Chapter 4 evaluated the most important determinants. In order tofully understand subjective LE, economists additionally analyze peo-ple's updating when new information concerning their LE becomeavailable. Past research analyzed updating of survival probabilitiesif health shocks occur. Using the SAVE data introduced in the lastchapter, this chapter goes beyond available evidence in two aspects:First, instead of the development of subjective survival probabilities,the updating of the more intuitive measure LE (a number of yearsinstead of a probability) is analyzed. Second, subjective LE is splitup in line with the analysis above, leading to a deeper understandinghow people update their LE if they experience a health shock.
97

5.1 Model
How people change their expectations when new information is avail-able is a question of high relevance in the study of subjective LE.This section develops a simple updating model of subjective LE ifidiosyncratic shocks occur, which will be tested using SAVE data.
5.1.1 Background and Motivation
The literature shows that some e�orts have been made to understandupdating procedures (section 2.4.4). The theoretical framework is thetheory of choice under uncertainty. While the discussion in psychol-ogy centers on the question whether probability is at all an appropri-ate formalism to model mental processes in the case of uncertainty(Henrion (1999)), economic theory has developed the expected utilityframework to analyze choices under uncertainty. The case of an un-available objective probability distribution and the need of subjectiveexpectations has been formalized by Savage (1954) within the ratio-nal utility maximization framework as subjective probability theoryand is part of mainstream economic theory (see Mas-Colell, Whin-ston, and Green (1995), p. 205-208).
A particular updating rule, which is often assumed to be appliedby rational individuals, is the Rule of Bayes. Together with cer-tain assumptions concerning the distribution of the prior, it requiresto take an average of the old expectation and the new information,weighted by the information content and precision of the informa-tion. This is implemented in the papers who study the updating ofsubjective survival probabilities (see section 2.4.4). The applicationof this framework requires however the formulation of the expecta-tions as probabilities. As discussed above, thinking in probabilities isnot necessarily something people are used to, and in our special caseof LE, subjective LE (measured in years) is an alternative measureof what people think how much lifetime remains. The last chapter
98

analyzed determinants of this measure for Germany, and this chapterexplores how people update their subjective LE.
5.1.2 Updating Model
Given the fact that LE is measured in years, the Baysian updatingframework cannot be directly applied. One possibility would be toproceed in an analogical way and assume the new subjective LEto be a weighted average of the old subjective LE and some newinformation. The weighted average makes sense for probabilities,however it is not apparent why individuals should apply such a rathercomplex procedure when they have to adjust an absolute number ofyears. This study suggests that individuals proceed using a simpleheuristic, which requires them to add or subtract some years fromtheir original LE if any new information requires them to adjust it.That is
SLEt = SLEt−1 + ∆ (5.1)
where ∆ is the (positive or negative) adjustment of LE. In our panel,individuals are interviewed every year, hence t are years. Adjustmentof subjective LE between the years can be made for at least tworeasons: First, actuarial LE increases with age, hence an individualshould increase subjective LE every year just for being older than theyear before (∆Age Adjustment). This captures the non-occurrence ofnegative health shocks as well as positive health shocks and growingoptimism with age. LE increases with an increasing rate in age, hencethe annual adjustment should also increase in age. Summarizing, thesupposed age adjustment is
∆Age Adjustment = α0 + α1Age with α0, α1 > 0 (5.2)
The second reason for adjustments are idiosyncratic shocks(∆idiosyncratic). The analysis in chapter 4 singled out the individual
99

health situation as most important determinant of subjective LE, sothe following analysis studies health shocks. While positive healthshocks are imaginable1, we focus on the prevalent event of negativehealth shocks (like the unexpected diagnosis of a severe illness orthe unexpected worsening of medical conditions). If negative healthshocks are measured with a dummy variable Dshock which is 1 if ashock occurred and 0 otherwise, the supposed idiosyncratic adjust-ment is
∆idiosyncratic = β Dshock with β < 0 (5.3)
Putting the pieces together, we get our model for the updating ofsubjective LE,
SLEt = SLEt−1 + α0 + α1Age︸ ︷︷ ︸∆Age Adjustment
+ β Dshock︸ ︷︷ ︸∆idiosyncratic
(5.4)
which can be rearranged as
SLEt−SLEt−1 = α0+α1Age+β Dshock with α0, α1 > 0; β < 0(5.5)
Looking at the adjustment of estimated average LE(LEavr,t − LEavr,t−1), equation (5.5) should apply with the sameconditions for α0, α1. β instead should be equal to zero, as an id-iosyncratic shock contains no information on the average LE of anage group. Finally, the relative estimations of individual LE com-pared to average should also be updated if a health shock occurs. Ifpeople learn in a rational way, we should see
Pr (C = shorter)t > Pr (C = shorter)t−1 if Dshock = 1 (5.6)
Pr (C = longer)t < Pr (C = shorter)t−1 if Dshock = 1 (5.7)
1For instance, the diagnosis that a previously known tumor surprisinglystopped growing.
100

5.2 Data and Variables
To test the updating model of subjective LE, we exploit the paneldimension of the SAVE survey.
5.2.1 Panel Dataset
We base our analysis on the three SAVE waves 2005-2007, applyingexactly the same clearing up and imputation procedure as describedin section 4.1.1. For this chapter's analysis, all regressions are un-weighted - the number of people experiencing health shocks is toolow to make representative statements for the German population atwhole. Besides, the purpose of this chapter is to test a simple modelof updating behavior, and there is no need to put higher or lowerweight on observations for that.
5.2.2 Variable Construction
In addition to the variables already used in chapter 4, an indicatorof negative health shocks is generated. The survey does not ask ex-plicitly for health events between the waves, so shocks are inferredfrom the following information: Survey participants indicate whichillnesses or symptoms they su�er from. The list of possible illnesseshas been extended over the years, but for all years under study thefollowing options are o�ered: Heart disease, high blood pressure, highcholesterol level, stroke or circulatory problems a�ecting the brain,chronic diseases of the lung or asthma, cancer or malignant tumorsexcluding minor cases of skin cancer, stomach ulcers or duodenal ul-cer. Table 5.1 gives an idea how widespread each of these symptomsare.
If a person did not indicate to su�er from an illness in the year be-fore, but now indicates to su�er from it, we call it a negative health
101

Overview of Illnesses and Health Shocks
Illness Frequency Number of Shocks
Heart disease 14.6% 149High blood pressure 37.8% 254High cholesterol level 22.5% 251Stroke 3.2% 36Chronic Lung disease 10.2% 100Cancer 5.7% 75Stomach/duodenal ulcer 4.4% 81Negative Health Shock � 767Long-term health problems 47.0% 468
Table 5.1: Overview Health Variables
shock of that particular illness. Consequently, a health shock canonly be determined for two years (2006 and 2007), as we need theinformation from the year before to identify health shocks (whichparallels the measures on LE: There we also need the informationfrom the year before to determine the adjustment). This results in4141 �second-year observations�, which constitute the dataset used inthis chapter. The last column in table 5.1 shows that high blood pres-sure and high cholesterol level are the most common health shocks,in contrast to stroke and cancer who are rather rare.
All shocks are combined in the measure NegativeHealthShock, whichis 1 for a certain individual who experienced at least one shock be-tween the waves and 0 otherwise. Naturally this measure containssome noise as respondents might forget a certain symptom once in awhile. Table 5.2 shows how the respondents' indications of illnessesvary over time.2 Besides negative shocks, also a signi�cant numberof positive health shocks occur (people stating an illness in periodt − 1 which is not stated in period t), while positive shocks appear
2The table describes the pattern for those respondents who took part in allthree waves (2005, 2006, 2007). As described in section 5.2.1, for the constructionof health shocks also individuals appearing in two waves are used.
102

less often than negative shocks. The phrasing of the health ques-tion does not rule out positive shocks, as speci�c illnesses might haveimproved and be no longer relevant for a person. In any case, theexistence of positive shocks does not reduce the information contentof the measure NegativeHealthShock ; the following analysis will showthat it is su�ciently precise to have a signi�cant updating e�ect.
For additional tests, an alternative measure of health shocks is con-structed using the variable on long-term health problems which hasalready been described in the last chapter: ChronicHealthShock is 1 ifa respondent su�ers from long-term health problems now, but did nothave long-term health problems in the last period, and 0 otherwise.The correlation between the two measures is quite low (0.0916), indi-cating that ChronicHealthShock measures somewhat di�erent healthshocks than NegativeHealthShock, and a separate analysis of the al-ternative variable provides additional evidence.
103

Illness
Indication2005-2007
Illness
nnn
yyy
nny
nyy
ynn
yyn
nyn
yny
Heartdisease
76.0%
8.5%
4.1%
2.7%
3.9%
0.7%
2.6%
1.4%
Highbloodpressure
45.4%
30.0%
3.9%
7.0%
5.6%
2.5%
4.1%
2.1%
Highcholesterollevel
63.4%
9.2%
5.2%
5.8%
6.3%
1.8%
4.7%
3.6%
Stroke
95.6%
0.8%
0.7%
0.7%
0.9%
0.3%
0.8%
0.4%
ChronicLungdisease
82.4%
4.7%
1.4%
1.4%
5.8%
1.2%
2.1%
1.0%
Cancer
91.0%
2.3%
2.3%
1.0%
0.8%
0.4%
1.9%
0.3%
Stomach/duodenalulcer
90.3%
1.7%
2.5%
1.7%
0.9%
0.4%
2.1%
0.5%
Long-term
healthproblems
40.9%
30.3%
6.9%
6.9%
4.0%
3.0%
4.1%
3.9%
Answersto
thequestionwhether
therespondentsu�ersfrom
acertain
illnessin
theyears
2005,2006,2007(y=yes,n=no).Only
respondentsappearingin
allthreewaves.
Table5.2:
PanelResponsesConcerningIllnesses
104

5.3 Descriptive Analysis
Before testing the updating model formally, this section provides acouple of descriptive statistics which give a �rst impression of updat-ing processes in the SAVE data.
To start with, �gure 5.1 shows the distribution of adjustments insubjective LE between two waves (a kernel density estimate is usedto smooth the focal points at 0, +/- 5, +/- 10 years). The curve forindividuals having incurred a health shock during the last year liesleft of the curve for individuals without health shocks, indicating thata health shock leads some people to reduce their LE. The di�erencebetween the graphs is small, the comparison in table 5.3, however,is more clear. The mean adjustment without health shock is +.23years, while the mean adjustment in the case of health shock is −.57years. The absolute value of subjective LE also has a lower meanfor the health-shock group. A t-test shows that both measures aresigni�cantly di�erent between the groups with- and without healthshocks (t-statistics: 3.10 and 2.78).
Means of Subjective LE and Adjustments
Without With
Health Shock Health Shock
Subjective LE 78.99 78.12Adjustment subjective LE .2277 -.5750
Estimated average LE 79.28 78.75Adjustment estimated avr LE .4364 .1447
Table 5.3: Health Shock Heterogeneity in LE
Remarkably, the mean adjustment of estimated average LE is posi-tive for individuals with and without health shocks, and the di�erencebetween the absolute values of estimated average LE is lower thanthe di�erence between subjective life expectancies. T-tests show that
105

Figure 5.1: Adjustment of Subjective LE
di�erences in EstAvr and the respective adjustments are not signi�-cantly di�erent between the groups with- and without health shock(t-statistics: 1.66 and 1.44). It seems that people (correctly) primar-ily update their LE relative to their same-age peers and (correctly)increase estimated average LE to re�ect their older age.
This hypothesis is supported by the dummy variables measuring LEcompared to average. As discussed, respondents are asked to clas-sify themselves into three groups, depending on whether they be-lieve to live shorter, longer or about the same as average. Table5.4 shows transition matrices for the switching behavior between twowaves of SAVE, separately for individuals with and without healthshocks. Without health shocks, 15.8% switch to a �worse� group3,compared to 20.1% if a health shock occurred. The di�erence is
3�Same� instead of �Longer�; or �Shorter� instead of �Longer� or �Same�.
106

mainly caused by the higher number of individuals switching from�Same� to �Shorter� (10.3% compared to 7.0%). To parallel the anal-ysis from the last chapter, the switching behavior is also shown interms of the groups used for binary comparisons (�Expect longer�and �Expect not shorter�, table 5.5).
Transition Without Health Shock
From To Longer Same Shorter
Longer 7.6% 8.2% 0.6%Same 6.4% 53.9% 7.0%Shorter 0.6% 7.3% 8.5%
improvement: 14.3 % worsening: 15.8 %
Transition With Health Shock
From To Longer Same Shorter
Longer 7.6% 9.0% 0.8%Same 5.4% 50.5% 10.3%Shorter 0.8% 6.7% 9.1%
improvement: 12.9 % worsening: 20.1 %
Table 5.4: Transition Matrices (LE Compared to Average)
Transition between LE Groups
Leave Group Leave Group
�Expect Longer� �Expect Not Shorter�
Without Health Shock 8.8% 7.6%With Health Shock 9.8% 11.1%
Table 5.5: Transition Probabilities (LE Compared to Average)
107

5.4 Regression Analysis
To see whether the descriptive evidence allows inferences, regressionanalyses are performed to formally test the model. This section de-scribes the regression setup and formulates hypotheses to test thetheoretical updating model (equation (5.4)).
5.4.1 Regression Models and Formal Hypothesis
Following the theoretical model developed above, empirical modelsare formulated alike the speci�cations in chapter 4:
E [Adj_SLEi|Agei, Dshocki ] = αSLE0 + αSLE
1 Agei + βSLE Dshocki
(5.8)
E [Adj_Avri|Agei, Dshocki ] = αAvr0 +αAvr
1 Agei+βAvr Dshocki (5.9)
E [LELi|Agei, Dshocki ] = Φ(αL
0 + αL1 Agei + βL Dshocki
)(5.10)
E [LENSi|Agei, Dshocki ] = Φ(αNS
0 + αNS1 Agei + βNS Dshocki
)(5.11)
where the adjustments are de�ned asAdj_SLEi = (SLEt − SLEt−1)i andAdj_Avri = (EstAvrt − EstAvrt−1)i, respectively. LELi (�LeaveExpect Longer�) is a dummy variable which is 1 if a person expectedto live longer than average in the last wave and now expects to liveabout the same or shorter. Analogously, LENSi (�Leave ExpectNot Shorter�) is a dummy variable which is 1 if a person expectedto live longer than average or about the same in the last wave andnow expects to live shorter. Φ (·) is a Normal c.d.f. Reported stan-dard errors of coe�cients are robust in the sense that they allow
108

for intra-personal correlation (as described in section 4.3.1), and adummy captures year e�ects4. To allow gender-speci�c di�erences,all regressions are done separately for men and women.
To test whether survey participants in SAVE update their subjectiveLE rationally in a way described in the model (5.4), the followingconditions have to hold:
1. αSLE0 > 0
2. αSLE1 > 0
3. βSLE < 0
4. αAvr0 > 0
5. αAvr1 > 0
6. βAvr = 0
7. βL > 0 ∨ βNS > 0
Conditions 1 and 4 secure that people take into account the growingLE with age, conditions 2 and 5 are required to re�ect the fact thatLE increases quadratically with age. Condition 3 secures that somepeople reduce their subjective LE if they experience a negative health
4The year dummies are included to make sure that the other variables' e�ectsare not driven by year e�ects. Hence the coe�cients do not a�ect this chapter'sresults. It is however remarkably that in most regressions the year dummy 2006is signi�cantly negative and high in magnitude. One possible explanation is thatSAVE consists of di�erent subsamples (Börsch-Supan, Coppola, Essig, Eymann,and Schunk (2008), p.36). From 2006 on, a large access panel- refresher groupenters the sample. To explore whether good health and optimism of the refreshergroup drive the year e�ects, regressions are repeated including a dummy forthe access panel. Results are reported in the appendix (tables A.9 and A.10).The access panel-dummy is negative, and the year e�ects stay almost the same.All results concerning the updating model remain the same in signi�cance andmagnitude.
109

shock, while condition 6 says that the estimated average LE is nota�ected by individual health e�ects. Finally, condition 7 requires thatsome people change their relative LE downwards because of healthshocks. Putting the pieces together, the model described in equation(5.4) can be maintained if the alternative hypothesis of conditions1-7 can be rejected5.
5.4.2 Regression Results
Parameter estimates together with standard errors are presented intables 5.6 and 5.7, for men and women respectively. First, the con-stant α0 is positive for all speci�cations of Adj_SLE andAdj_EstAvr, signi�cantly larger than zero for 7 out of 8 speci�ca-tions. Hence the hypothesis that people do not account for growingLE with age can be rejected; on average respondents realize that theirsubjective LE increases with every year they live. The coe�cient α1,which measures the quadratic in�uence of age, is signi�cantly posi-tive only for women (in all speci�cations). For men we cannot rejectthe hypothesis that people are unaware of their LE increasing at anincreasing age in our data, while women on average do increase theirsubjective LE and the estimated average LE when they get older6.
Second, the parameter β is signi�cantly negative in almost all spec-i�cations of Adj_SLE. The �rst speci�cation, a newly appearing ill-
5Condition 6 requires that a coe�cient is exactly zero. Naturally the alter-native hypothesis (that the variable is unequal zero) cannot be rejected if thesample is unequal the full population. So all we can do is to look whether thenull hypothesis can be maintained given the data.
6To be consistent with regression results in the last chapter, the signi�cancelevels of coe�cients in tables 5.6 and 5.7 (the �stars�) are signi�cance levels forthe null hypothesis κ 6= 0, where κ is any coe�cient. To be exact, however, thehypothesis κ ≥ (≤)0 has to be rejected in order to maintain the conditions statedabove. There could be a situation where the stated coe�cient is not signi�cantlydi�erent from zero, but signi�cantly smaller (larger) than zero. However, this isnot the case for our results.
110

In�uence on LE Adjustments (Men)
Adj_SLE Adj_EstAvr
I II I II
Negative health shock (β) -.813* -.186(.450) (.341)
Chronic health shock (β) -1.62*** -.339(.537) (.448)
Age (α1) .000257 -.00174 .00382 .00334(.00860) (.00843) (.00727) (.00720)
Constant (α0) .533* .598** .920*** .932(.362) (.206) (.157) (.159)
Year dummy 2006 -.668* -.771** -.658** -.681**(.362) (.358) (.289) (.282)
Updating of LE compared to Average (Men)
Leave Leave
�Expect Longer� �Expect not shorter�
I II I II
Negative health shock (β) .00639 .263***(.0983) (.0974)
Chronic health shock (β) .183* .209*(.112) (.117)
Age (α1) .0117*** .0101*** -.00276 -.000880(.00291) (.00249) (.00256) (.00231)
Constant (α0) -1.47*** -1.43*** -1.28*** -1.34***(.0704) (.0573) (.0628) (.0539)
Year dummy 2006 .200** .146* -.223** -.113(.0862) (.0793) (.0892) (.0839)
Figures in parenthesis are robust standard errors. ***,** and * representstatistical signi�cance at 1%, 5% and 10% level, respectively.
Table 5.6: Regression Results Updating (Men)
111

In�uence on LE Adjustments (Women)
Adj_SLE Adj_EstAvr
I II I II
Negative health shock (β) -.742* -.333(.422) (.360)
Chronic health shock (β) -1.75*** -.333(.515) (.409)
Age (α1) .0182** .0149* .0190** .0178**(.00919) (.00895) (.00794) (.00781)
Constant (α0) .577*** .681*** .653*** .646***(.199) (.202) (.171) (.173)
Year dummy 2006 -.833** -.927** -1.05*** -1.09***(.364) (.366) (.307) (.306)
Updating of LE compared to Average (Women)
Leave Leave
�Expect Longer� �Expect not shorter�
I II I II
Negative health shock (β) .0282 .182*(.108) (.104)
Chronic health shock (β) .314*** .439***(.114) (.113)
Age (α1) .00390 .00584** .00458 .00539**(.00309) (.00273) (.00295) (.00275)
Constant (α0) -1.47*** -1.51*** -1.45*** -1.54***(.0665) (.0567) (.0667) (.0579)
Year dummy 2006 .0640 .0638 -.149 -.0712(.0915) (.0860) (.0945) (.0904)
Figures in parenthesis are robust standard errors. ***,** and * representstatistical signi�cance at 1%, 5% and 10% level, respectively.
Table 5.7: Regression Results Updating (Women)
112

ness (NegativeHealthShock) leads people to reduce their subjectiveLE on average by 0.81 years for men and 0.74 years for women (sig-ni�cantly negative). The alternative health shock measure, a newlyappearing chronic health problem (ChronicHealthShock) has an evenlarger e�ect: 1.61 years reduction for men and 1.75 years reductionfor women. Looking at the estimations concerning the transitionprobability between the groups with di�erent relative LE, we �ndthat a negative health shock strongly increases the probability toswitch to the group �Expecting life shorter than average� (signi�-cant for men and women in both speci�cations). In contrast, thein�uence on the probability to leave the group �expecting life longerthan average� is signi�cantly positive only in the second speci�ca-tion (ChronicHealthShock) and smaller in magnitude. Hence we cancon�rm the idea from the descriptive analysis (table 5.5) that thetypical dynamic is that people expecting to live about as long asaverage switch to the group �shorter than average� when they expe-rience a health shock.
While a negative health shock strongly in�uences subjective LE, therespective parameter (βAvr) is insigni�cant for all speci�cations ofAdj_EstAvr, the adjustment of estimated average LE. We can main-tain hypothesis 6; people (correctly) do not change their estimationof average LE if they personally su�er from an illness.
Summary
To summarize, people increase estimated average LE and their per-sonal subjective LE as they get older, women quadratically with age.A negative health shock reduces subjective LE - because people thenexpect to live shorter than average.
113

Figure 5.2: Illustration of Selection E�ect
5.4.3 Discussion
Concerning limitations of the regression setup, most of the pointsmade in section 4.3.3 remain valid. In addition, a selection e�ect isrelevant for the panel setup: Only respondents who stay part of thepanel for a second year can be used for the analysis. We analyzehealth shocks; naturally a health shock can be more or less severe.A very bad health shock may lead people to drop out of the sample(either because they decease or because they move to nursing homesand are no longer reachable for the interviewer). In consequence, ouranalysis only includes health shocks which are not too severe. Figure5.2 illustrates the selection e�ect.
The �ndings, however, should not be challenged by this possible bias:We �nd respondents to signi�cantly reduce their subjective LE dueto a health shock. If this is true for the relatively light health shocksin the sample, this is even more true for the population with heavierhealth shocks. The selection bias rather underestimates than overes-timates the e�ect.
114

Chapter 6
Conclusion
This chapter summarizes main �ndings of the empirical analyses,in the light of the questions posed in chapter 3. Implications arediscussed, and two projects for future research are sketched out.
115

6.1 Summary and Implications
Given the relevance of subjective LE for individual decision-making,this study aims to understand the formation and updating of subjec-tive LE. A synopsis of literature from di�erent sciences summarizeswhat is known, but also identi�es several open questions. We try toanswer them with data from the German SAVE study.
As starting point, basic patterns of subjective LE in Germany arerevealed. We show that Germans on average underestimate theirsubjective LE - the mean of subjective LE lies even below the curveof actuarial LE from life tables (which do not account for technolog-ical progress). The underestimation occurs in a wide age range forboth men and women. Given the importance of personal decisionsconcerning old-age provision, the underestimation of subjective LE isa serious issue for Germany (in contrast to the United States, whereestimates seem to be quite accurate).
To analyze the causes of LE underestimation, subjective LE is split upin estimated average LE and individual relative expectations. Abouttwo thirds of the Germans expect to live about as long as average;consequently the underestimation of subjective LE is caused by anunderestimation of average LE. We conclude that we have do not haveto address individual pessimism, but wide-spread ignorance concern-ing actuarial LE in Germany.
Besides basic patterns of subjective LE, we explore the relative im-portance of determinants. A joint analysis of many factors addressedin the literature shows that by far the most important determinant isthe individual health situation. In a joint regression, the importanceof economic variables is rather small. Smoking signi�cantly reducessubjective LE, but this is mostly driven by a lower estimated aver-age LE. In contrast, the better educated a person is, the higher are
116

estimates of average LE. This supports the idea that the underesti-mation of average LE is caused by a lack of information.
Finally, a simple updating model is successfully tested in the paneldata. Estimations show that individuals update their subjective LEquite rationally: A negative health shock leads people to adjust theirindividual LE compared to average, while estimated average LE re-mains unchanged. The updating dynamics show that people do ad-just their subjective LE on a regular basis, and raise the hope thata more precise general knowledge of average LE can lead to a higherquality of individuals' economic decisions.
6.2 Future Research
While this study added some pieces to the understanding of sub-jective LE, the work also raised new questions, which are to be ad-dressed by future research. Two �elds are particularly important:First, more empirical evidence is needed to understand what peopleactually mean when they report a subjective LE. As discussed atseveral points, it is not really clear whether (1) respondents reportan expected value of their LE or the modus, and if (2) they correctlyunderstand the questionnaire and answer what they are asked for,for example the average LE for people of their age (and not theircohort). These issues should be addressed with a detailed survey onsubjective LE or by the use of elaborate interviews in a small sample.
Second, it is an open question how the updating model for subjec-tive LE presented here interacts with updating models for subjectivesurvival probabilities. In the same way as Hamermesh (1985) checksbasic consistency of subjective LE and subjective survival probabil-ities, a future step is to analyze if people update subjective survivalprobabilities and subjective LE in a consistent way. From a theoret-ical point of view, we plan to rewrite the heuristic updating model
117

by basing the updating of subjective LE on estimated probabilities,which allows to parameterize the identi�ed split-up in a Baysian up-dating framework as in Viscusi (1984).
118

Appendix A
Results from Sensitivity
Analyses
The following tables report regression results from additional regres-sions as described in the text. Tables A.1 through A.4 repeat the anal-ysis from chapter 4 putting equal weight on all observations. TablesA.5 through A.8 show the results for a dataset, where implausible an-swers (subjective LE lower than current age) have not been excluded.Finally, tables A.9 and A.10 repeat regressions from chapter 5 includ-ing a dummy for the access panel-subsample.
119

Men:Determinants
ofSubjectiveLE(U
nweightedRegression)
Variable
I:Subjective
II:E�ecton
II:E�ecton
IV:Estim
ated
LE
Pr(longer)
Pr(notshorter)
AverageLE
General
Age
.1370673***
.0039349***
.0040254***
.0666737***
(.0180801)
(.00082)
(.00073)
(.0122822)
Agesquared
.0074007***
.0001407**
.0001859***
.0048822***
(.0006694)
(.00003)
(.00003)
(.0005472)
East
-.6646813*
-.0223756
-.0022462
-.6181944**
(.3562022)
(.01718)
(.01548)
(.2650959)
Familysituation
Married
-.0961781
-.0275898
.0488468***
-.1955365
(.4160746)
(.02091)
(.01703)
(.2769533)
Widow
ed.5888712
.243198
.0339362
-.4961546
(.8463983)
(.1606803)
(.0328)
(.6590451)
Children
-.6914973
-.0021703
-.0240855
-.8036297**
(.4533136)
(.02294)
(.01737)
(.3140046)
Practicalhelp
.6836468**
.0006744
.0162056
.5355396***
(.2711007)
(.01399)
(.01177)
(.196324)
Education
Highschool(A
bitur)
.8654305**
.0648834***
-.0612013***
.7593799**
(.4334129)
(.02108)
(.02005)
(.3003161)
College(H
ochschule)
.2306389
-.0036254
.0322815*
.3806929
(.4698828)
(.02284)
(.01803)
(.3350313)
Economicsituation
Income
.2281174*
-.004197
-.0053082
.246146**
(.1389544)
(.00719)
(.00707)
(.1032733)
Incomesquared
-.0052164
.0001917
.0003077
-.0082446**
(.005783)
(.00026)
(.00028)
(.0039096)
TableA.1:RegressionResultsUnweighted(M
en)
120

Retired
-.5243003
-.012226
-.035418
.0412692
(.5467958)
(.026)
(.02226)
(.3386787)
Currentunem
ployment
-1.222195*
-.0173406
.0046906
-.6520204
(.6364939)
(.02729)
(.02402)
(.4498977)
Unem
ploymenthistory
-.0454379
.0211968
-.0129243
-.23673
(.3747584)
(.01808)
(.01585)
(.2550914)
LifestyleandBehavior
Currentsm
oker
-1.632349***
-.0641934***
-.0359844**
-.867585***
(.4129794)
(.01752)
(.01813)
(.2873802)
Ex-smoker
-.9081469***
-.0387409**
-.0157298
-.3940171*
(.3401539)
(.01633)
(.01679)
(.240851)
Weekly
drinking
.3094951
-.0220192
.0322474**
.235766
(.3056721)
(.01469)
(.01331)
(.2160169)
Weekly
exercise
.1871198
.0299296**
.0244806*
-.1246891
(.3056721)
(.01404)
(.0131)
(.2059059)
Voluntary
work
-.4737944*
-.003387
-.0010936
-.3412085*
(.2778829)
(.01424)
(.01269)
.2059451
Healthstatus
Badhealth
-3.798882***
-.0978579***
-.2647469***
-.3506972
(.5450501)
(.01913)
(.03199)
(.3815254)
Long-term
healthprob.
-2.762923***
-.1048262***
-.1347716***
-.6638354***
(.3248351)
(.01598)
(.0142)
(.2250463)
Controls
Yeare�ect2005
-.1079127
.0718275***
.0267656**
-.9649493***
(.2590772)
(.01605)
(.01251)
(.19674)
Yeare�ect2006
-.2781992
.0157504
.0215423**
-.7077192***
(.2150869)
(.01229)
(.0109)
(.1670115)
Constant
78.16611***
��
77.32214***
(.6949766)
(.5291731)
Figuresin
parenthesisare
robust
standard
errors.***,**and*represent
statisticalsigni�cance
at1%,5%
and10%
level,respectively.
TableA.2:RegressionResultsUnweighted(M
en)-continued-
121

Women:Determinants
ofSLE(U
nweightedRegression)
Variable
I:Subjective
II:E�ecton
II:E�ecton
IV:Estim
ated
LE
Pr(longer)
Pr(notshorter)
AverageLE
General
Age
.0828767***
.0030115***
.0017965***
.0283287***
(.0133553)
(.00057)
(.00061)
(.0102894)
Agesquared
.0046519***
.0000824***
.0001209***
.0025861***
(.0006528)
(.00003)
(.00003)
(.0005048)
East
-.4502587
.0040095
-.0003856
-.6411892**
(.3356985)
(.01441)
(.01356)
(.2582352)
Familysituation
Married
-.6004872
-.0602007***
.0024203
-.3212943
(.3793452)
(.01596)
(.01495)
(.2844756)
Widow
ed-.308539
-.0113915
.0033067
-.3448593
(.4936888)
(.01992)
(.02204)
(.3815327)
Children
-.0826248
-.0000615
.0171387
-.5240323*
(.4030136)
(.017)
(.01687)
(.315644)
Practicalhelp
-.2771013
.0026665
-.0188514*
.0037227
(.2593873)
(.01137)
(.01134)
(.2073759)
Education
Highschool(A
bitur)
.5482609
.0416974**
-.022422
.4501216
(.419143)
(.01763)
(.01946)
(.3012323)
College(H
ochschule)
.6656705
.0125025
-.0118834
.8575095**
(.493367)
(.02037)
(.02174)
(.3440487)
Economicsituation
Income
.4547582***
.0179488*
.0110348**
.2739975***
(.1231056)
(.00936)
(.00555)
(.1021644)
Incomesquared
-.0160041***
-.0013175*
-.0005722***
-.0059235
(.0044158)
(.00077)
(.0002)
(.0041781)
TableA.3:RegressionResultsUnweighted(W
omen)
122

Retired
-.6090641
-.0372492**
-.0484161**
.2261673
(.4135245)
(.01724)
(.01965)
(.2822265)
Currentunem
ployment
.6317584
.0199949
.0131278
.2126265
(.4859361)
(.02271)
(.01739)
(.3812125)
Unem
ploymenthistory
-.9295226***
.000534
-.0258699*
-.4172806*
(.32446)
(.01407)
(.01366)
(.252786)
LifestyleandBehavior
Currentsm
oker
-1.560756***
-.0298775**
-.0306412*
-1.254041***
(.3723036)
(.01415)
(.01599)
(.2892196)
Ex-smoker
-.6283424*
-.0137106
-.0219297
-.1118814
(.3424904)
(.01387)
(.01601)
(.2647754)
Weekly
drinking
.9054049***
.012898
.0129177
.6284686***
(.2808842)
(.01249)
(.01264)
.218222
Weekly
exercise
.1599274
.0196145*
-.0025782
-.0958564
(.2621911)
(.01168)
(.0113)
(.2006791)
Voluntary
work
.2801611
-.0098914
.0010903
.4501247**
(.2605772)
(.0116)
(.01161)
(.1999405)
Healthstatus
Badhealth
-3.884172***
-.0755267***
-.1950286***
-.2194916
(.5456886)
(.01491)
(.02945)
(.3680408)
Long-term
healthprob.
-2.465588***
-.0858544***
-.1332877***
-.5054893**
(.2898606)
(.01217)
(.01383)
(.2217764)
Controls
Yeare�ect2005
.1374084
.0550103***
-.0168734
-.2262156
(.2568509)
(.01357)
(.01323)
(.2112348)
Yeare�ect2006
-.56982***
.0080449
.0048569
-.6461321***
(.1954921)
(.01071)
(.01023)
(.1650587)
Constant
81.43103***
��
81.14939***
(.6258149)
.4926883
Figuresin
parenthesisare
robust
standard
errors.***,**and*represent
statisticalsigni�cance
at1%,5%
and10%
level,respectively.
TableA.4:RegressionResultsUnweighted(W
omen)-continued-
123

Men:Determinants
ofSubjectiveLE(IncludingIm
plausibleAnswers)
Variable
I:Subjective
II:E�ecton
II:E�ecton
IV:Estim
ated
LE
Pr(longer)
Pr(notshorter)
AverageLE
General
Age
.0498698**
.0024152***
.0014626*
.011353
(.0207527)
(.00085)
(.00088)
(.0153426)
Agesquared
.0064801***
.0001248***
.00017***
.0041256***
(.0008404)
(.00004)
(.00004)
(.0006608)
East
-.4515118
.0006698
.0216427
-.7437163**
(.4324625)
(.01976)
(.01752)
(.3302309)
Familysituation
Married
-.0713665
-.0132854
.0415139**
-.2283854
(.4901351)
(.02263)
(.01907)
(.3232207)
Widow
ed.7208537
.0637352
.0474386
-.3275952
(.9978609)
(.05389)
(.03669)
(.6850669)
Children
-.597577
-.0005788
-.0231257
-.8949342**
(.5416038)
(.02484)
(.0199)
(.3747274)
Practicalhelp
.7273563**
-.0095288
.0237476*
.6510973***
(.3500523)
(.01642)
(.01463)
(.2504101)
Education
Highschool(A
bitur)
1.075694**
.0648068***
-.0701648***
.8433887**
(.5508046)
(.02329)
(.0257)
(.4051096)
College(H
ochschule)
.3951865
-.0201276
.0293187
.7979836*
(.5970498)
(.02378)
(.0223)
(.449212)
Economicsituation
Income
.1618167
-.0080405
-.0001592
.1947266
(.162515)
(.00788)
(.00915)
(.1262083)
Incomesquared
-.0029871
.00031
.0003731
-.0066453
(.0058605)
(.00028)
(.0005)
(.0041338)
TableA.5:RegressionResultsIncludingIm
plausibleAnswers(M
en)
124

Retired
.2329796
-.0069585
-.0188425
.4948303
(.6710791)
(.02955)
(.02819)
(.4079725)
Currentunem
ployment
-1.424078**
-.0385728
.0010239
-.6774973
(.697302)
(.02833)
(.02827)
(.5159436)
Unem
ploymenthistory
.0969295
.0176765
-.018621
.0022332
(.4645124)
(.02103)
(.01859)
(.3318686)
LifestyleandBehavior
Currentsm
oker
-2.201193***
-.0645125***
-.0610468***
-1.174101***
(.4991318)
(.0193)
(.02257)
(.3644713)
Ex-smoker
-1.138475***
-.0504557***
-.0262064
-.4966497*
(.4039346)
(.0176)
(.02024)
(.3040676)
Weekly
drinking
.5033534
-.0256915
.039999**
.3273468
(.3698008)
(.01641)
(.01615)
(.2775427)
Weekly
exercise
.4557604
.0380518**
.0258949
-.0090061
(.3639569)
(.01599)
(.01615)
(.2740021)
Voluntary
work
-.7663239**
.003757
-.0025039
-.6041803**
(.3593888)
(.01593)
(.01496)
(.2638649)
Healthstatus
Badhealth
-4.693616***
-.0917965***
-.2593526***
-1.063915*
(.7706294)
(.02095)
(.03848)
(.5745738)
Long-term
healthprob.
-2.670732***
-.0961512***
-.1382222***
-.3431116
(.4161944)
(.01785)
(.01894)
(.2879831)
Controls
Yeare�ect2005
-.0449346
.0688478***
.0256084*
-.9216082***
(.2854609)
(.01594)
(.01362)
(.2199342)
Yeare�ect2006
-.3008668
.026333*
.0319688**
-.9288975***
(.3207214)
(.01521)
(.01373)
(.2463218)
Constant
77.62562***
��
77.24047***
(.8168836)
(.6384993)
Figuresin
parenthesisare
robust
standard
errors.***,**and*represent
statisticalsigni�cance
at1%,5%
and10%
level,respectively.
TableA.6:RegressionResultsIncludingIm
plausibleAnswers(M
en)-continued-
125

Women:Determinants
ofSLE(IncludingIm
plausibleAnswers)
Variable
I:Subjective
II:E�ecton
II:E�ecton
IV:Estim
ated
LE
Pr(longer)
Pr(notshorter)
AverageLE
General
Age
.039149**
.0021998***
.0004262
.0016937
(.019888)
(.00061)
(.00074)
(.01617)
Agesquared
.0046531***
.0000739***
.0001403***
.0021561***
(.0008909)
(.00003)
(.00003)
(.000742)
East
-.3036604
-.0007339
.0138685
-.5701446*
(0.457)
(.01513)
(.015)
(0.077)
Familysituation
Married
-.1219419
-.0483357***
.0069339
.0167714
(.4357751)
(.01607)
(.01648)
(.3446811)
Widow
ed.143949
.0030937
-.0013687
.0328427
(.6927093)
(.02057)
(.02586)
(.5644275)
Children
-.4158634
-.0039901
.0118961
-.8098626**
(.4908833)
(.01812)
(.01968)
(.3905141)
Practicalhelp
-.5595906*
-.0008295
-.0264272**
-.1378086
(.3354113)
(.01189)
(.01314)
(.2797078)
Education
Highschool(A
bitur)
.5563627
.0268873
-.0378846
.7842124**
(.4937165)
(.0171)
(.02394)
(.3751461)
College(H
ochschule)
.8385807
.0193031
-.0106281
.8771828**
(.5656265)
(.02144)
(.02627)
(.4133928)
Economicsituation
Income
.5656265***
.0199393*
.0193907**
.2055086*
(.1497913)
(.01058)
(.00794)
(.1217492)
Incomesquared
-.0173517***
-.0015464*
-.0009178**
-.0038436
(.0054325)
(.00083)
(.00041)
(.0044454)
TableA.7:RegressionResultsIncludingIm
plausibleAnswers(W
omen)
126

Retired
-.3874641
-.0348642**
-.0444911*
.677524
(.6590699)
(.0182)
(.02399)
(.5034067)
Currentunem
ployment
.5974661
.0052185
.0109479
.2869141
(.594693)
(.02103)
(.02118)
(.4747147)
Unem
ploymenthistory
-.8526848**
-.0019896
-.024124
-.3536811
(.3999995)
(.01465)
(.01563)
(.3183563)
LifestyleandBehavior
Currentsm
oker
-1.795849***
-.0247028
-.0449346**
-1.396124***
(.448064)
(.01539)
(.01875)
(.3525118)
Ex-smoker
-.5538815
-.0155823
-.0339683*
.1440914
(.4107903)
(.01461)
(.01993)
(.3230234)
Weekly
drinking
1.045149***
.0100935
.0148571
.7214336***
(.3377372)
(.0136)
(.01465)
(.2641227)
Weekly
exercise
.2828429
.0176776
-.0144701
.0622069
(.3396919)
(.01233)
(.01346)
(.2683958)
Voluntary
work
.3162585
-.017559
.0173207
.3466551
(.3417478)
(.01258)
(.01412)
(.2713481)
Healthstatus
Badhealth
-4.631726***
-.0893769***
-.2075288***
-.5473615
(.7408451)
(.01144)
(.0355)
(.5096213)
Long-term
healthprob.
-2.463629***
-.0626618***
-.1333163***
-.5727781**
(.350563)
(.01257)
(.01577)
(.2830089)
Controls
Yeare�ect2005
.1030561
.0555194***
-.015355
-.2873231
(.2930221)
(.01333)
(.01419)
(.2468023)
Yeare�ect2006
-.6089763**
.0011108
.0113522
-.7086169***
(.262918)
(.01194)
(.01223)
(.220556)
Constant
81.03485***
��
81.10066***
(.7199113)
(.5733142)
Figuresin
parenthesisare
robust
standard
errors.***,**and*represent
statisticalsigni�cance
at1%,5%
and10%
level,respectively.
TableA.8:RegressionResultsIncludingIm
plausibleAnswers(W
omen)-continued-
127

In�uence on LE Adjustments with Access Panel- Dummy (Men)
Adj_SLE Adj_EstAvr
I II I II
Negative health shock (β) -.945** -.296(.460) (.348)
Chronic health shock (β) -1.59*** -.314(.537) (.446)
Age (α1) .00483 -.00204 .00803 .00305(.0101) (.00840) (.00829) (.00719)
Constant (α0) .958*** .907*** 1.26*** 1.18***(.324) (.258) (.254) (.207)
Access Panel -.615** -.535** -.536** -.477**(.311) (.269) (.237) (.212)
Year dummy 2006 -.920** -.932** -.868*** -.825***(.386) (.366) (.310) (.291)
Figures in parenthesis are robust standard errors. ***,** and * representstatistical signi�cance at 1%, 5% and 10% level, respectively.
Table A.9: Regression Results Updating with Access Panel-Dummy(Men)
128

In�uence on LE Adjustments with Access Panel- Dummy (Women)
Adj_SLE Adj_EstAvr
I II I II
Negative health shock (β) -.667 -.316(.434) (.371)
Chronic health shock (β) -1.74*** -.329(.514) (.409)
Age (α1) .020* .0150* .0196** .0178**(.0101) (.00896) (.00888) (.00782)
Constant (α0) .240 .450* .527** .483**(.301) (.260) (.253) (.220)
Access Panel .282 .344 .0540 .197(.341) (.303) (.298) (.265)
Year dummy 2006 -.615 -.790** -1.01*** -1.01***(.414) (.398) (.339) (.334)
Figures in parenthesis are robust standard errors. ***,** and * representstatistical signi�cance at 1%, 5% and 10% level, respectively.
Table A.10: Regression Results Updating with Access Panel-Dummy(Women)
129

130

Appendix B
Questions on Subjective LE
We provide an excerpt from the SAVE survey containing the exactwording of all questions concerning life expectancies. The full surveycan be found in Börsch-Supan, Coppola, Essig, Eymann, and Schunk(2008).
1. What average age do you believe men/women of your age will reach?- Men (Year:)- Woman (Year:)
2. If you think of your own situation and your state of health, do you thinkthat, in comparison to other men/women of your age group, your lifespan will be. . .- Shorter? (Continue with 3a)- Approximately as long as the average? (Done)- Longer? (Continue with 3b)
3a. By how many years?- (Number of years:) (Continue with 4a)
3b. By how many years?- (Number of years:) (Continue with 4b)
131

4a. Why don't you think you will live as long as the average?- Because of existing illnesses or disability- Because of your lifestyle- Because of the death at a young age of close relatives- For other reasons (specify)
4b. Why do you think you will live longer than average?- Because of your good state of health- Because of your lifestyle- Because of the old age of close relatives- For other reasons (specify)
132

Bibliography
Alexander, I., R. Colby, and A. Alderstein (1957): �Is deatha matter of indi�erence?,� Journal of Psychology, 42, 277�283.
Beatty, P., and D. Herrmann (2002): �To answer or not to an-swer: Decision processes related to survey item nonresponse,� inSurvey Nonresponse, ed. by R. Groves, D. Dillman, J. Eltinge, andR. Little, pp. 71�85. Wiley New York.
Betz, F. (2005): To Be, or Not to Be: That is the Question -An Evaluation of the Subjective Survival Probabilities in SHARE.diploma thesis, Universität Mannheim.
Bleich, S., D. Cutler, C. Murray, and A. Adams (2007):�Why is the Developed World Obese?,� NBER working paper se-ries, 12954.
Browning, M., and T. F. Crossley (2001): �The life-cycle modelof consumption and saving,� Journal of Economic Perspectives,15(3), 3�22.
Börsch-Supan, A., M. Coppola, L. Essig, A. Eymann, and
D. Schunk (2008): The German SAVE Study: Design and Re-sults. MEA Study No. 6, Mannheim Research Institute for theEconomics of Aging.
133

Börsch-Supan, A., L. Essig, and C. Wilke (2005): Rentenlückenund Lebenserwartung. Wie sich die Deutschen auf den Anstieg vor-bereiten. Deutsches Institut für Altersvorsorge.
Börsch-Supan, A., and C. Wilke (2007): �Szenarien zur Mittel-und Langfristigen Entwicklung der Anzahl der Erwerbspersonenund der Erwerbstätigen in Deutschland,� MEA Discussion Paper,Universität Mannheim, 157.
Bundesministerium für Gesundheit (2008): �Wir bringenDeutschland IN FORM Seehofer und Schmidt stellen �IN FORMDeutschlands Initiative für gesunde Ernährung und mehr Bewe-gung� vor,� press release June 25th.
Calhoun, C. (2002): Dictionary of the Social Sciences. Oxford Uni-versity Press.
Camerer, C., and G. Loewenstein (2004): �Behavioural Eco-nomics: Past, Present, Future,� in Advances in Behavioural Eco-nomics, ed. by C. Camerer, G. Loewenstein, and M. Rabin, pp.3�51. Princeton University Press.
Carlin, J., N. Li, P. Greenwood, and C. Coffey (2003): �Toolsfor analyzing multiple imputed datasets,� The Stata Journal, 3(3),226�244.
Cox, D. (1972): �Regression models and life tables,� Journal of theRoyal Statistical Society B, 34, 187�220.
Denes-Raj, V., and H. Ehrlichman (1991): �E�ects of PrematureParental Death on Subjective Life Expectancy, Death Anxiety, andHealth Behavior,� Omega - Journal of Death and Dying, 23(4),309�321.
Doll, R., R. Peto, J. Boreham, and I. Sutherland
(2004): �Mortality in relation to smoking: 50 years' ob-
134

servations on male British doctors,� British Medical Journal,doi:10.1136/bmj.38142.554479.AE.
Douglas, M., and A. Wildavsky (1983): Risk and Culture. Uni-versity of California at Berkeley Press.
Elder, T. (2007): �Subjective Survival Probabilities in the Healthand Retirement Study: Systematic Biases and Predictive Validity,�University of Michigan Retirement Research Center, 2007-159.
Essig, L., and J. Winter (2003): �Item nonresponse to �nan-cial questions in household surveys: An experimental study of in-terviewer and mode e�ect,� MEA Discussion Paper, UniversitätMannheim, 39.
European Union (2001): �Directive 2001/37/EC of the EuropeanParliament and of the Council of 5 June 2001 on the approximationof the laws, regulations and administrative provisions of the Mem-ber States concerning the manufacture, presentation and sale oftobacco products,� O�cial Journal of the European Communities,L 194/26.
Falba, T., and S. Busch (2005): �Survival Expectations of theObese: Is Excess Mortality Re�ected in Perceptions?,� Obesity Re-search, 13(4), 754�761.
Fang, H., M. Keane, A. Khwaja, M. Salm, and D. Silverman
(2007): �Testing the mechanisms of structural models: The caseof the Mickey Mantle e�ect,� American Economic Review (Papersand Proceedings), 97(2), 53�59.
Ferber, R. (1966): �Public Opinion Quarterly,� Obesity Research,30(3), 399�415.
Gazzaniga, M., and T. Heatherton (2003): Psychological Sci-ence. W.W.Norton.
135

Hamermesh, D. (1985): �Expectations, Life Expectancy, and Eco-nomic Behavior,� Quarterly Journal of Economics, 100(2), 389�408.
(2004): �Subjective Outcomes in Economics,� Southern Eco-nomic Journal, 71(1), 2�11.
Handal, P. (1969): �The Relationship between Subjective Life Ex-pectancy, Death Anxiety and General Anxiety,� Journal of ClinicalPsychology, 23, 39�42.
Henrion, M. (1999): �Uncertainty,� in The MIT Encyclopedia ofthe Cognitive Sciences, ed. by R. Wilson, and F. Keil, pp. 853�855.The MIT Press.
Hofstede, G. (2001): Culture's consequences: Comparing values,behaviors, institutions and organizations across Nations. Sage Pub-lications.
Hurd, M., D. McFadden, and L. Gan (1998): �Subjective sur-vival curves and life cycle behavior,� in Inquiries in the Economicsof Aging, ed. by D. Wise, pp. 259�305. University of Chicago Press.
Hurd, M., and K. McGarry (1995): �Evaluation of the Subjec-tive Probabilities of Survival in the Health and Retirement Study,�Journal of Human Resources, 30, S268�S292.
(2002): �The predictive Validity of Subjective Probabilitiesof Survival,� The Economic Journal, 112, 966�985.
Hurd, M., J. Smith, and J. Zissimopoulos (2004): �The E�ectsof Subjective Survival on Retirement and Social Security Claim-ing,� Journal of Applied Econometrics, 19, 761�775.
Joubert, C. (1992): �Happiness, Time Consciousness, and Subjec-tive Life Expectancy,� Perceptual and Motor Skills, 74, 649�650.
136

Jürges, H. (2007): �True health vs. response styles: Exploring cross-country di�erences in self-reported health,� Health Economics,16(2), 163�178.
Jungermann, P., and P. Slovic (1993): �Charakteristika indi-vidueller Risikowahrnehmung,� in Riskante Technologien: Re�ex-ion und Regulation, ed. by W. Krohn, and G. Krücken, pp. 79�100.Suhrkamp.
Juster, T. (1966): �Consumer Buying Intentions and PurchaseProbability: An Experiment in Survey Design,� Journal of theAmerican Statistical Association, (61), 658�696.
Kahneman, D., and A. Tversky (1972): �Subjective Probabil-ity: A Judgment of Representativeness,� Cognitive Psychology, (3),430�454.
(1973): �On the Psychology of Prediction,� PsychologicalReview, (80), 237�251.
(2000): �Prospect Theory: An Analysis of Decision underRisk,� Econometrica, 47, 263�291.
Kastenbaum, R. (2006): Death, Society, and the Human Experi-ence. Allyn Bacon.
Lampert, T., L. Kroll, and A. Dunkelberg (2007): �SozialeUngleichheit der Lebenserwartung in Deutschland,� Aus Politikund Zeitgeschichte, (42), 11�18.
Lazear, E. (2000): �Economic Imperialism,� Quarterly Journal ofEconomics, 115(1), 99�146.
Lee, R., and L. Carter (1992): �Modeling and Forecasting theTime Series of U.S. Mortality,� Journal of the American StatisticalAssociation, 87, 659�671.
137

Lester, D. (1967): �Experimental and Correlational Studies of theFear of Death,� Psychological Bulletin, 67(1), 27�36.
(1990): �The Collet-Lester Fear of Death Scale,� Death Stud-ies, 14, 451�468.
Liu, J., M. Tsou, and J. Hammitt (2007): �Health Informationand Subjective Survival Probability: Evidence from Taiwan,� Jour-nal of Risk Research, 10(2), 149�175.
Ludwig, A., and A. Zimper (2007): �A Parsimonious Model ofSubjective Life Expectancy - Bayesian Learning with PsychologicalBias,� MEA Discussion Paper, Universität Mannheim, 154.
Luhmann, N. (1993): �Die Moral des Risikos und das Risiko derMoral,� in Risiko und Gesellschaft. Grundlagen und Ergebnisse in-terdisziplinärer Risikoforschung, ed. by G. Bechmann, pp. 327�338.Westdeutscher Verlag.
Manski, C. (1993): �Adolescent Econometricians: How do YouthInfer the Return to Schooling?,� in Studies of Supply and Demandin Higher Education, ed. by C. Clotfelder, and M. Rothschild, pp.43�57. University of Chicago Press.
(2002): �Identi�cation of Decision Rules in Experimentson Simple Games of Proposal and Response,� European EconomicReview, (46), 880�891.
(2004): �Measuring Expectations,� Econometrica, 72(5),1329�1376.
Mas-Colell, A., M. Whinston, and J. Green (1995): Microe-conomic Theory. Oxford University Press.
McFadden, D. (1974): �Conditional Logit Analysis of QualitativeChoice Behavior,� in Frontiers in Econometrics, ed. by P. Zarem-bka, pp. 105�142. Academic Press.
138

Middleton, W. (1936): �Some reactions toward death among col-lege students,� Journal of Abnormal and Social Psychology, 31,165�173.
Mirowsky, J. (1999): �Subjective life expectancy in the US: cor-respondence to actuarial estimates by age, sex and race,� SocialScience and Medicine, 49, 967�979.
Mirowsky, J., and C. Ross (2000): �Socioeconomic Status andSubjective Life Expectancy,� Social Psychology Quarterly, 63(2),133�151.
Modigliani, F., and R. H. Brumberg (1954): �Utility analysisand aggregate consumption functions: an attempt at integration,�in The Collected Papers of Franco Modigliani: Volume 2, The LifeCycle Hypothesis of Saving, ed. by A. Abel, pp. 128�197. The MITPress.
Morgan, M., and M. Henrion (1990): Uncertainty. A guide todealing with uncertainty in quantitative risk and policy analysis.Cambridge University Press.
Nakao, K., R. Hodge, and J. Treas (1990): On Revising Pres-tige Scores for All Occupations (GSS Methodological Report 69).National Opinion Research center Chicago.
Nam, C. (1994): Understanding Population Change. F.E. Peacock.
Ogden, C. e. a. (2006): �Prevalence of Overweight and Obesity inthe United States, 1999-2004,� Journal of the American MedicalAssociation, 295(13), 1549�1555.
RAND (2008): �RAND HRS Data Documentation,� RAND Centerfor the Study of Aging.
Reed, S. (2004): Cognition - Theory and Applications. ThomsonWadsworth.
139

Robbins, R. (1988a): �Subjective Life Expectancy as a Correlate ofFamily Life Expectancy,� Psychological Reports, 62, 442.
(1988b): �Objective and Subjective Factors in EstimatingLife Expectancy,� Psychological Reports, 63, 47�53.
Ross, C., and J. Mirowsky (2002): �Family Relationships, SocialSupport and Subjective Life Expectancy,� Journal of Health andSocial Behavior, 43(4), 469�489.
Rothman, K. (2002): Epidemiology: An introduction. Oxford Uni-versity Press.
Rubin, D. (1987): Multiple Imputation for Nonresponse in Surveys.John Wiley New York.
Ruud, P. (2000): An Introduction to Classical Econometric Theory.Oxford University Press.
Samuelson, P. (1938): �A Note on the Pure Theory of ConsumerBehavior,� Economica, (5), 61�71.
(1948): �Consumption Theory in Terms of Revealed Prefer-ences,� Economica, (15), 243�253.
Sandman, P. (1987): �Risk Communication: Facing Public Out-rage,� Environmental Protection Journal, (11), 21�41.
Savage, L. (1954): The Foundations of Statistics. Wiley New York.
Schafer, J., and M. Olsen (1998): �Multiple Imputation for Mul-tivariate Missing-Data Problems: A Data Analyst's Perspective,�Multivariate Behavioral Research, 33(4), 545�571.
Schnabel, S., K. Kistowski, and J. Vaupel (2005): �Immerneue Rekorde und kein Ende in Sicht,� Demogra�sche Forschung,2(2), 3.
140

Schnell, R., and M. Trappmann (2006): �Konsequenzen derPanelmortalität im SOEP für Schätzungen der Lebenserwartung,�Arbeitspapier - Zentrum für Quantitative Methoden und Survey-forschung, 2.
Schunk, D. (2006): �The German SAVE Survey: Documen-tation and Methodology,� MEA Discussion Paper, UniversitätMannheim, 109.
(2008): �A Markov Chain Monte Carlo Algorithm for Multi-ple Imputation in Large Surveys,� Advances in Statistical Analysis,(92), 101�114.
Siegel, M., E. Bradley, and S. Kasl (2003): �Self-Rated LifeExpectancy as a Predictor of Mortality: Evidence from the HRSand AHEAD Surveys,� Gerontology, 49, 265�271.
Slovic, P., B. Fischhoff, and S. Lichtenstein (1976): �Cog-nitive processes and societal risk taking,� in Cognition and socialbehavior, ed. by J. Caroll, and J. Payne. Erlbaum.
Smith, V., D. Taylor, F. Sloan, F. Johnson, and
W. Desvousges (2001): �Do Smokers Respond to HealthShocks?,� The Review of Economics and Statistics, 83(4), 675�687.
Spetzler, C., and C. Stael von Holstein (1975): �Probabilityencoding in decision analysis,� Management Science, 43, 357�370.
Statistisches Bundesamt (2007): Sterbetafel 2004/2006.
Strawbridge, W., and M. Wallhagen (1999): �Self-rated healthand mortality over three decades,� Research on Aging, (21), 402�416.
Teahan, J., and R. Kastenbaum (1970): �Subjective Life Ex-pectancy and Future Time Perspective as Predictors of Job Suc-cess in the Hard-Core Unemployed,� Omega- Journal of Death andDying, 1(3), 189�200.
141

Tolor, A., and V. Murphy (1967): �Some psychological correlatesof subjective life expectancy,� Journal of Clinical Psychology, 23,21�24.
Tversky, A., and D. Kahneman (1974): �Judgement under Un-certainty: Heuristics and Biases,� Science, 185, 1124�1131.
Umberson, D., K. Williams, and S. Shar (2000): �Medical So-ciology and Health Psychology,� in The Handbook of Medical So-ciology, 5th. ed., ed. by C. Bird, P. Conrad, and A. Fremont, pp.353�64. Prentice Hall.
US Bureau of the Census (1964): Statistical Abstracts of theUnited States 1964. Government Printing O�ce.
(1993): Statistical Abstracts of the United States 1993. Gov-ernment Printing O�ce.
(1995): Statistical Abstracts of the United States 1995. Gov-ernment Printing O�ce.
Van Doorn, C., and S. Kasl (1998): �Can parental longevity andself-rated life expectancy predict mortality among older persons?Results from an Australian cohort,� Journals of Gerontology SeriesB: Psychological Sciences and Social Sciences, 53B, 28�34.
Viscusi, K. (1984): �A Bayesian Perspective on Biases in Risk Per-ception,� Economic Letters, 17, 59�62.
(1985): �Are Individuals Bayesian Decision Makers?,� Amer-ican Economic Review (Papers and Proceedings), 75(2), 381�385.
Weinstein, N. (1984): �Why It Won't Happen to Me: Perceptionsof Risk Factors and Susceptibility,� Health Psychology, 3, 431�457.
Winship, C., and L. Radbill (1994): �Sampling Weights and Re-gression Analysis,� Sociological Methods and Research, 23, 230�257.
142

Zuckerman, M. (1960): �The development of an a�ective adjectivecheck list for the measurement of anxiety,� Journal of Consultingand Clinical Psychology, 24, 457�462.
143

meaStudies 08
mea
Stud
ies 0
8
Mannheim Research Institute for the Economics of Aging
meaMannheimer Forschungsinstitut Ökonomie und demografischer Wandel
L13, 17Universität Mannheim68131 Mannheim
Tel 0621 - 181 18 62Fax 0621 - 181 18 63
info mea.uni-mannheim.dewww.mea.uni-mannheim.de
Formation and Updating of Subjective Life Expectancy:Evidence from Germany
Bjar
ne St
effe
n
For
mat
ion
and
Upda
ting
of Su
bjec
tive
Life
Expe
ctan
cy: E
vide
nce
from
Ger
man
y
Bjarne Steffen
studies02cover.indd 1 27.05.2009 15:48:15
Related Documents


