BISHOP ANSTEY HIGH SCHOOL EAST AND TRINITY COLLEGE EAST (BATCE) Sixth Form TRINCITY, TRINIDAD AND TOBAGO, WEST INDIES CENTRE NO. 160570 CXC CAPE Physics Unit 2 Lab Manual 2015-2016

Welcome message from author
This document is posted to help you gain knowledge. Please leave a comment to let me know what you think about it! Share it to your friends and learn new things together.
Transcript

BISHOP ANSTEY HIGH SCHOOL EAST ANDTRINITY COLLEGE EAST (BATCE)
Sixth FormTRINCITY, TRINIDAD AND TOBAGO, WEST INDIES
CENTRE NO. 160570
CXC CAPE PhysicsUnit 2 Lab Manual
2015-2016

c© Copyright by Bishop Anstey High School East and Trinity College East(BATCE) 2015
All Rights Reserved
ii
Rules and Regulations of the Laboratory
1. All experiments in this laboratory manual must be performed and written scriptsfor each experiment must be submitted to your class teacher to obtain a practicalcoursework mark.
2. Commencement of sessions: You are expected to be at your experiment station punc-tually.
3. Preparation: Laboratory manuals are available at the class website. These manualscontain a description of all the laboratory experiments that must be performed aspart of the requirements for CAPE Physics SBAs. Students are required to prepareadequately for their assigned laboratory experiment prior the start of the session.Preparation includes reading the experimental description adequately and perform-ing the necessary research to enable one to perform the experiment with ease in thelaboratory.
4. Starting experiments: All laboratory equipment must be checked prior to studentscommencing their experiments. DO NOT switch ON equipment until it is checkedby your teacher!!
5. Laboratory report submission: All laboratory reports must be submitted to the classteacher ONLY on the date it is due. If your laboratory report submission date fallson a public holiday, then the report must be submitted on the next available schoolday. Laboratory reports must be submitted with the appropriate cover sheet (with allthe details completed) and a signed anti-plagiarism sheet. Students will given untilthe following day, of performing the experiment, at 10:30am (break time) to submittheir lab reports. At this time the student would sign the teachers’ lab record book asevidence the lab was submitted.
6. Absenteeism: Students absent from any experiment must provide a medical/excuseto administration.
7. Students who are absent on the day of the lab practical activity would be scheduledwith the lab technician to perform the lab within a one week period from the date of
iii
the missed lab. They are to sign the lab technician’s rcord book with the date the labwas performed. This report would be due the following day at 10:30am.
8. Students who fail to submit their lab reports at the deadline would be marked as nowork submitted. Special allowances would be given to studetns with a valid excuse,for example a death in the family or physical injury. This excuse must be confirmedvia a note and phone call from the parents or medical where applicable, on the daythe report is due.
9. Laboratory requirements: For each laboratory session students are required to bringtheir laboratory manual, writing paper, graph pages, a scientific calculator and otherstationery items inclusive of pen/pencils, erasers, rulers and geometrical instruments(if needed for the laboratory experiment).
10. Laboratory attire: Students are required to wear a laboratory coat and closed shoeswhile present in the laboratory.
11. Work stations: Students must remain at their assigned work station for the durationof the laboratory session. If a student needs to leave the work station, permissionmust be sought and granted from the class teacher.
12. Difficulties with an experiment: Students experiencing difficulties with experimentsshould seek assistance from their class teacher.
13. At the end of each laboratory session: At the end of each experiment, students arerequired to take all their results to their teacher for review and correction. Theseresults pages must be signed by the teacher and must be included in the laboratoryreport. The signed results pages must not be altered after the teacher has fixed his/hersignature. Students must seek the permission of the teacher prior to the exiting of thelaboratory at the end of each session. Additionally, before students leave their workstation they must ensure that they have removed all their personal belongings andreplaced all equipment to the designated area. A check of equipment assigned toeach student will be made by the technicians at the end of each laboratory exercise.Students should not leave the laboratory until this check is made. Students will haveto pay a compensation fee for missing or broken equipment.
14. Copying and plagiarism in the lab scripts are strictly forbidden. Plagiarized workwill not be marked.
15. General rules: Students are not permitted to eat, drink or smoke in the laboratory.The use of the internet is strictly permitted for laboratory research only.
16. Mobile phones: The use of mobile phones is not permitted for the duration of thelaboratory session unless approval is given.
iv
Policy Principles
Practical work and lab reports are an important part of the student’s understanding of thesubject area. They provide an avenue where theory taught in the classroom can be tested,applied and/or proved. Practical work engages students, helps them to develop importantskills, to understand the process of scientific investigation and develop their understandingof concepts.
Lab Reports form 20% of the student’s Caribbean Advanced Proficiency Examinations(CAPE) Physics grade.
Timely submission of work ensures students can receive timely feedback from theirteachers. Also scripts written up during the practical activity ensures that the studentsrecall information clearly about the experimental procedure (e.g. the method, sources oferror, teacher’s guidelines).
v

Format for Written Reports
0. Cover SheetTitle of Experiment, your name, date that experiment was performed, partners’ names.(First and last names. Get the spelling right!)
1. TitleTitles should be straightforward, informative, and less than ten words (i.e. Not "Lab #4"but "Lab #4: Sample Analysis using the Debye-Sherrer Method").
2. Aim/Objective(s)
3. Theory/ Introduction1-2 paragraphs. Summarize the basic physics of your experiment. Include equations andother principle things the reader would need to know in order to understand the experiment.Keep it short!
If there are standard or accepted values known these should be included in this section.
4. ApparatusThis can usually be a simple list, but make sure it is accurate and complete.
5. DiagramThese should be clearly labelled with a title.
6. Method/ Procedure/ Experimental DetailsThis section describes the process in chronological order. Using clear paragraph structure(or step by step format), explain all steps in the order they actually happened, not as they
vi
were supposed to happen. If you’ve done it right, another researcher should be able toduplicate your experiment. It is always written in past tense.
7. Precautions & Sources of Error
Indicate what steps were taken to reduce/eliminate random and systematic errors.Note: Mistakes are not classified as errors.
8. Results
The original raw data that you take in the lab. This should be easy to follow, in tabular form.Poor data recording skills lead to poor writeups. If your raw data is illegible, the grade willsuffer. The table should have a title and include the uncertainty of the measurement as wellas the unit in the heading (e.g. Variable ± uncertainty in the measurement/ unit).
9. Sample Calculations
Include a few of your calculations in this section, e.g. one of each type. Do not show eachand every calculation.
10. General Analysis
The computed results are shown in a clear and concise manner utilizing properly labelledtables and graphs. “Table/Graph showing results” is not an appropriate title. Each columnof the table must have a heading and units, if applicable. Tables must be bordered by4 lines and neatly constructed. If a graph is to be drawn, it must include the following:title, appropriate scales, accurate plotting of points, drawing best straight line (smoothlines through experimental data points) and labeling of axes. Slope calculations shouldbe included after the graph. Each graph should convey a complete message and be fullyunderstandable without referring to any other section in the report.
11. Error Analysis
This section must include the pertinent computed uncertainties (error estimates). It is im-portant here that the rule governing significant figures be used in computing and displayingthese values.
vii
12. DiscussionThis is the most important part of your report, because here, you show that you understandthe experiment beyond the simple level of completing it. Explain. Analyse. Interpret.Some people like to think of this as the "subjective" part of the report. By that, they meanthis is what is not readily observable. This part of the lab focuses on a question of under-standing "What is the significance or meaning of the results?" To answer this question, useboth aspects of discussion:
Analysis: What do the results indicate clearly? What have you found? Explain whatyou know with certainty based on your results and draw conclusions.
Interpretation: What is the significance of the results? What ambiguities exist? Whatquestions might we raise? Find logical explanations for problems in the data.
The experimental results should be compared with predicted values. If known valuesexist, the results should be compared with these and a reference given (see below). Dis-crepancies should be considered in the light of the experimental error obtained and otherrandom and systematic errors not evaluated numerically in ‘Results’. If no known value isavailable, it is still important to consider all the possible errors. Then discuss the experi-ment in general, its advantages and failings, procedural difficulties, ways of improving itetc.
If any questions are asked in the lab manual, they should be answered in this section ofthe report.
13. Final Results with Errors and ConclusionThis should indicate how well the experiments have fulfilled the aims stated at the begin-ning. Simply state what you know now for sure, as a result of the lab, and justify yourstatement.
14. ReferencesAny source of material used in the report should be listed here.
Note:Labs are always to follow this format except for planning and design labs. Labs are to becommunicated in a logical way using correct grammar and spelling.
viii

Contents
Rules and Regulations of the Laboratory iii
Policy Principles v
Format for Written Reports vi
1 Lab #1: Electrostatics 1
2 Lab #2 - ORR: Capacitance 3
3 Lab #3 - ORR: Capacitor Discharge 5
4 Lab #4 - ORR & MM: EMF and Internal Resistance 8
5 Lab #5 - ORR: Determining the resistance of a voltmeter 11
6 Lab #6 - A&I: Resistance per unit length of wire D 14
7 Lab #7 - P&D: P.D. and I relationship across a filament 16
ix

x CONTENTS

Chapter 1
Lab #1: Electrostatics
A leaf electrometer consists of an aluminum leaf which hangs at an angle θ to the vertical
when a potential difference VXY is applied betweeen the metal cap X and the conducting
case Y of the electrometer.
Figure 1.1: Leaf Electrometer
1

2 CHAPTER 1. LAB #1: ELECTROSTATICS
It is calibrated by connecting different values of VXY across XY , with the following
results:
VXY/V 100 200 300 400 500 600 700 800 900 1000 1100 1200θ/ 11 14 18 23 30 37 45 53 62 69 74 78
Table 1.1:
a) Plot a graph of θ against VXY .
b) The rate of change of θ with VXY is known as the sensitivity of the electrometer.
Over what range of potential differences is the sensitivity approximately constant?
Calculate the sensitivity over this range. Show all your working.
c) It is suggested that, between 300V and 700V , the potential difference is proportional to
sin θ .
Draw up a suitable table of values and plot a graph to test this suggestion. Does your graph
support the suggestion?

Chapter 2
Lab #2 - ORR: Capacitance
To determine a capacitance by measuring the time constant
of RC circuits
In this experiment you are to determine a capacitance by measuring the time constant of
RC circuits. Record all observations and deductions in your lab book.
a) Connect the circuit shown in Figure 2.1 using a 10 kΩ resistor for R. Make sure that
both switches are open.
Figure 2.1: RC Circuit
3

4 CHAPTER 2. LAB #2 - ORR: CAPACITANCE
Close switch A and wait for the voltmeter reading to reach V0, its maximum value. Record
V0 and the value of S, where S = 0.632 V0.
Open A and close B to discharge the capacitor.
b) The time constant τ of the circuit is equal to the time taken for the voltage to reach S
after switch A is closed with the capacitor initially discharged and switch B open.
Measure the time constant of the circuit as accurately as you can.
c) Replace the 10 kΩ resistor with one of the other resistors and determine the new value
for τ . Repeat the procedure until you have values of the time constant for circuits
containing each of the resistors provided.
Tabulate all your values of τ and R, the value of the resistance used.
d) Use a graph page and plot a graph of τ/s (y-axis) against R/kΩ(x-axis).
Given that τ = RC, use the graph to obtain a value for C, the capacitance of C.
e) The resistance values are quoted to a tolerance of 1%. State a range of values in which
the true value of capacitance might lie. Show how you arrived at your answer.

Chapter 3
Lab #3 - ORR: Capacitor Discharge
To investigate the rate at which a capacitor discharges through
a voltmeter
Part 1
(a)(i) Connect the circuit shown in Fig. 3.1. You should ensure that the postive (+) terminal
of the power supply is connected to the + terminal of the capacitor C1(blue). Initially
switch S should be closed.
Figure 3.1: Capacitor Circuit
5

6 CHAPTER 3. LAB #3 - ORR: CAPACITOR DISCHARGE
(ii) Record the inital reading Vo of the analogue voltmeter.
(b) (i) Open switch S and simultaneously start a stopwatch.
(ii) Measure and record values of the potential difference V and time t until
the reading on the voltmeter becomes less than Vo/10.
(c) (i) Plot a graph of V (y-axis) against t (x-axis).
(ii) Use your graph to determine the time τ for the potential difference across
the capacitor to fall from Vo to Vo/5.
(d) (i) τ and C are related by the formula
τ =CRv ln5
where Rv is the resistance of the voltmeter and
C is the capacitance of the capacitor C1.
Use your answer from (c) (ii) and the value of the capacitance C
(written on the capacitor) to determine a value for Rv.
(ii) Justify the number of significant figures which you have given for Rv.
Part 2
(e) (i) Connect a second capacitor C2 (yellow) in series with the first capacitor C1 (blue) so that
the circuit is now as shown in Fig. 3.2
Figure 3.2: Capacitor Series Circuit

7
(ii) Repeat (b)(i) and (b)(ii).(f) (i) For the second set of results and using the same set of axes as before,
plot a graph of V against t.
(ii) Use the graph to determine a value for the capacitance of the capacitor C2.
Chapter 4
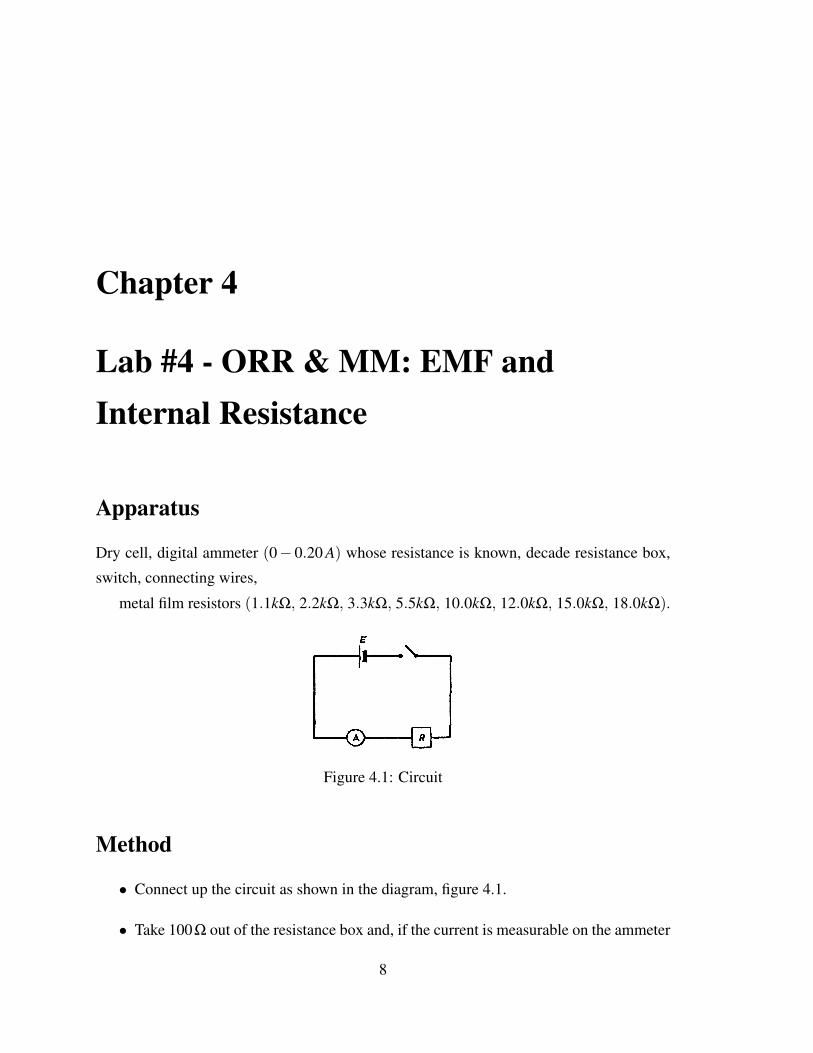
Lab #4 - ORR & MM: EMF andInternal Resistance
Apparatus
Dry cell, digital ammeter (0− 0.20 A) whose resistance is known, decade resistance box,
switch, connecting wires,
metal film resistors (1.1kΩ, 2.2kΩ, 3.3kΩ, 5.5kΩ, 10.0kΩ, 12.0kΩ, 15.0kΩ, 18.0kΩ).
Figure 4.1: Circuit
Method
• Connect up the circuit as shown in the diagram, figure 4.1.
• Take 100Ω out of the resistance box and, if the current is measurable on the ammeter
8

9
scale record both the current and the resistance box reading.
• Gradually reduce the resistance of the box until the current has risen to about 0.1A.
Tabulate the results:
Resistance boxreading R (Ω)
Ammeter readingI (A)
1/I (A−1)
Table 4.1:
• Plot a graph with values of R/Ω as ordinates (y-axis) against the corresponding value
of 1I (A
−1) as abscissae (x-axis).
Experimental Details
1. The current through most resistance boxes should never exceed about 0.1A.
2. Before taking any readings give all the plugs in the resistance box a half-turn to
ensure that they are properly in.
3. If the resistance box possesses an infinity plug it may be used instead of a circuit key.
4. Check the ammeter for zero error and if necessary re-set for zero reading by the
adjusting screw provided.
Theory and calculation
Let E represent the e.m.f. of the cell, RC its internal resistance, supposed constant, R the
resistance box reading, RA the resistance of the ammeter and I the current in the circuit.
Then
ER+RC +RA
= I (4.1)

10 CHAPTER 4. LAB #4 - ORR & MM: EMF AND INTERNAL RESISTANCE
Therefore,
R = E ·[
1I− (RC +RA)
](4.2)
Hence, the graph of R/Ω (ordinates) against 1I (A
−1) (abscissae) is a straight line whose
slope is the magnitude of E and whose negative intercept on the R axis is the magnitude of
(RC +RA).
Measure the slope from the co-ordinates of two convenient points on the straight line.
Produce the line to cut the axis of R and read off the intercept. Subtract the ammeter
resistance to find the internal resistance RC of the cell.
Errors and accuracy
The error in R may be neglected in comparison with the much larger possible error in I
which depends on the range, sensitivity and scale markings of the ammeter used. From the
graph estimate the likely errors in E and RC from the difference between the values found
from the chosen line and those obtained from other possible straight lines drawn through
the points (see the handout on Errors, Uncertainties & their Analysis).

Chapter 5
Lab #5 - ORR: Determining theresistance of a voltmeter
Apparatus
Analogue Voltmeter reading to 1.5 or 3V, two accumulators, 4 batteries with battery holder,
resistance box of total resistance not less than 1000 Ω, switch, leads with alligator clips,
metal film resistors (1kΩ, 1.5kΩ, 2.2kΩ, 3.3kΩ, 4.7kΩ, 5.5kΩ, 8kΩ, 9.4kΩ).
Figure 5.1: Circuit
Method
• Connect up the circuit as shown in the diagram, figure 5.1.
11

12CHAPTER 5. LAB #5 - ORR: DETERMINING THE RESISTANCE OF A VOLTMETER
• Take out a large resistance from the resistance box R and note whether any reading
is obtained on the voltmeter scale. Decrease R until the voltmeter reading is at its
maximum on the scale. Record the resistance R and the voltmeter reading V .
• Increase R in suitable steps to make full use of the voltmeter scale. Tabulate the
results:
Resistance boxreading R (Ω)
Voltmeterreading V (V )
1/V (V−1)
Table 5.1:
• Plot a graph with values of R/Ω as ordinates (y-axis) against the corresponding value
of 1V (V−1) as abscissae (x-axis).
Experimental Details
1. The current through most resistance boxes should never exceed about 0.1A.
2. Before taking any readings give all the plugs in the resistance box a half-turn to
ensure that they are properly in.
3. If the resistance box possesses an infinity plug it may be used instead of a circuit key.
4. Check the ammeter for zero error and if necessary re-set for zero reading by the
adjusting screw provided.
Theory and calculation
Let E represent the total e.m.f. of the circuit, R the resistance box reading, V the voltmeter
reading, and RV the resistance of the voltmeter.

13
Then the current I in the circuit is
I =E
R+RV(5.1)
assuming the resistance of the accumulators in the circuit to be negligible.
Hence, the voltage across the voltmeter is
V = IRV =E
R+RV·RV (5.2)
Rearranging,
R+RV = ERV · 1V
(5.3)
or
R = ERV · 1V−RV (5.4)
Thus, the graph of R/Ω (ordinates) against 1V (V−1) (abscissae) is a straight line whose
negative intercept on the R axis is the magnitude of RV .
Errors and accuracy
The error in R may be neglected in comparison with the much larger possible error in V
which depends on the range, sensitivity and scale markings of the voltmeter used. From
the graph estimate the likely errors in RV from the difference between the values found
from the chosen line and those obtained from other possible straight lines drawn through
the points (see the handout on Errors, Uncertainties & their Analysis).

Chapter 6
Lab #6 - A&I: Resistance per unit lengthof wire D
Apparatus
1.5V dry cell, analogue ammeter, connecting wires with alligator clips, switch, meter rule,
100cm length of wire (wire B), and 15cm length of wire (wire D).
Figure 6.1: Circuit
In this experiment you will use a wire (labelled B) of known resistance per unit length
(which should be taken to be 4.00 Ωm−1) to find the combined resistance of a cell and an
ammeter. You will use this value to find the resistance per unit length of a second wire
(labelled D).
14

15
Procedure
(a) Set up the circuit of figure 6.1.
(b) For different lengths of wire B in the circuit, record the following quantities in a table
S the scale reading of the current as shown on the ammeter,
b the length of wire B used,
Rb the resistance of length b of wire B, and
1/S
(c) Insert 15.0 cm of wire D between the switch and the cell. Repeat the procedure of
part (b), record your readings in your table.
(d) Both graphs are of the form
Rb = k1S− r (6.1)
where k is a constant, and r is the resistance of the other components of the circuit used.
• Plot graphs of your values from (b) and (c). For your graphs, use the same axes and
scales, extending the R/Ω axis to include R/Ω =−2.
(e) Deduce from the graphs values for
(i) the combined resistance of the cell and ammeter,
(ii) the resistance of the length of wire D used in (c). Hence calculate the resistance per
unit length of wire D.
(You may assume that the circuit leads have negligible resistance.)

Chapter 7
Lab #7 - P&D: P.D. and I relationshipacross a filament
Objective
In this experiment you will investigate the relationship between the potential difference
across a filament and the current in it.
Instructions
Choosing from the apparatus provided, set up a circuit to enable you to investigate the
relationship
V ∝ In (7.1)
where V = the p.d. across the filament lamp,
I = the current in the filament
and n is a constant, the value of which you are to determine.
16
Related Documents