BIS Working Papers No 612 Monetary policy and bank lending in a low interest rate environment: diminishing effectiveness? by Claudio Borio and Leonardo Gambacorta Monetary and Economic Department February 2017 JEL classification: E44, E51, E52 Keywords: Bank lending, monetary transmission mechanisms, low interest rate environment

Welcome message from author
This document is posted to help you gain knowledge. Please leave a comment to let me know what you think about it! Share it to your friends and learn new things together.
Transcript
BIS Working PapersNo 612
Monetary policy and bank lending in a low interest rate environment: diminishing effectiveness? by Claudio Borio and Leonardo Gambacorta
Monetary and Economic Department
February 2017
JEL classification: E44, E51, E52
Keywords: Bank lending, monetary transmission mechanisms, low interest rate environment
BIS Working Papers are written by members of the Monetary and Economic Department of the Bank for International Settlements, and from time to time by other economists, and are published by the Bank. The papers are on subjects of topical interest and are technical in character. The views expressed in them are those of their authors and not necessarily the views of the BIS.
This publication is available on the BIS website (www.bis.org).
© Bank for International Settlements 2017. All rights reserved. Brief excerpts may be reproduced or translated provided the source is stated.
ISSN 1020-0959 (print) ISSN 1682-7678 (online)
WP612 Monetary policy and bank lending in a low interest rate environment i
Monetary policy and bank lending in a low interest rate environment: diminishing effectiveness?
Claudio Borio and Leonardo Gambacorta1
Abstract
This paper analyses the effectiveness of monetary policy on bank lending in a low interest rate environment. Based on a sample of 108 large international banks, our empirical analysis suggests that reductions in short-term interest rates are less effective in stimulating bank lending growth when rates reach a very low level. This result holds after controlling for business and financial cycle conditions and different bank-specific characteristics such as liquidity, capitalisation, funding costs, bank risk and income diversification. We find that the impact of low rates on the profitability of banks’ traditional intermediation activity helps explain the subdued evolution of lending in the period 2010–14.
JEL classification: E44, E51, E52.
Keywords: Bank lending, monetary transmission mechanisms, low interest rate environment.
1 Bank for International Settlements. E-mail addresses: [email protected] and
[email protected]. We thank Ugo Albertazzi, Michael Brei, Enzo Dia, Boris Hofmann, Paolo Emilio Mistrulli, Federico Signoretti, Hyun Song Shin, Nikola Tarashev, David VanHoose and three anonymous referees for comments and suggestions. The views expressed here are those of the authors only, and not necessarily those of the Bank for International Settlements. This paper is forthcoming in the Journal of Macroeconomics.

WP612 Monetary policy and bank lending in a low interest rate environment iii
Contents
Abstract ......................................................................................................................................................... i
Introduction ............................................................................................................................................... 1
1. The link between low interest rates and lending ................................................................ 3
2. Empirical analysis ............................................................................................................................. 4
The data ............................................................................................................................................. 4
The econometric model ............................................................................................................... 6
The results ......................................................................................................................................... 9
Test for the existence of a “net interest income” channel ........................................... 14
Conclusion ................................................................................................................................................ 19
References ................................................................................................................................................ 20

WP612 Monetary policy and bank lending in a low interest rate environment 1
Introduction
Since the Great Financial Crisis of 2007–09, central banks have taken extraordinary measures to boost demand and inflation. In spite of this, growth has been disappointingly weak and inflation stubbornly low.
There are many possible reasons for this outcome. Not least, there is a general sense that, post-crisis, monetary policy has faced stiff headwinds which may have sapped its effectiveness. Several factors may have played a role, including large debt overhangs, an impaired banking system, and the need to shift resources away from temporarily bloated sectors, such as construction or financial services (Andrés et al (2014), Amador and Nagengast (2015), Borio et al (2016)). These arguments, and others, are variants of the pushing-on-a-string view, which posits that, at very low interest rates, monetary policy may lose some of its traction (De Long and Summers (1988), Karras (1996), Stiglitz (2008), Gambacorta and Rossi (2010)).
In this paper, we explore an additional mechanism. This relates to the possibility that the supply of bank loans may become less responsive at very low interest rates, even controlling for demand and other bank-specific conditions. One potential reason could be the negative impact of very low rates on the profitability of banks’ lending business.
Cross-country as well as various country-specific studies support the debilitating impact of persistently very low interest rates on banks’ net interest margins (NIMs). Using data for 3,418 banks from 47 countries over the period 2005–13, Claessens et al (2016) find such evidence. Borio et al (2017) obtain similar results for a sample of 108 relatively large international banks, many from Europe and Japan and 16 from the United States. In particular, they find a non-linear relationship between the interest rate level and the slope of the yield curve, on the one hand, and banks' net interest income and profitability (return on assets), on the other. Genay and Podjasek (2014) also find that persistently low interest rates depress US banks’ NIMs. They also note, however, that the direct effects of low rates are small relative to the economic benefits, including through better support for asset quality. For Germany, Busch and Memmel (2015) argue that, in normal interest rate environments, the long-run effect of a 100 basis point change in the interest rate on NIMs is very small, close to 7 basis points. By contrast, they find that, in the recent low interest rate environment, banks’ interest margins for retail deposits, especially for term deposits, have declined by up to 97 basis points. The Deutsche Bundesbank's Financial Stability Review of September 2015, analysing 1,500 banks, also finds that persistently low interest rates are one of the main risk factors weighing on German banks’ profitability. Analysis for Japan reaches similar conclusions (Deutsche Bank (2013)).2 3
2 This, of course, does not imply over any given period and in a specific jurisdiction the overall impact
on bank profitability may be negative, Rostagno et al (2016) argued that, on balance, the introduction of negative interest rates had not weakened profitability, especially once its estimated overall impact on aggregate demand was taken into account (general equilibrium effects). Similar results were found by Turk (2016) who analyses the impact of negative interest rates on the profitability of Danish and Swedish banks: the author argued that lower interest income was offset by reductions in wholesale funding costs and higher fee income.
3 There is also additional evidence based on market, rather than accounting, data. In particular, English et al (2012) find that while equity prices of US banks fall following unanticipated increases in interest rates or a steepening of the yield curve, a large maturity gap weakens this effect. Thus, because of their maturity transformation function, banks gain from a higher interest rate or a steeper yield curve.
2 WP612 Monetary policy and bank lending in a low interest rate environment
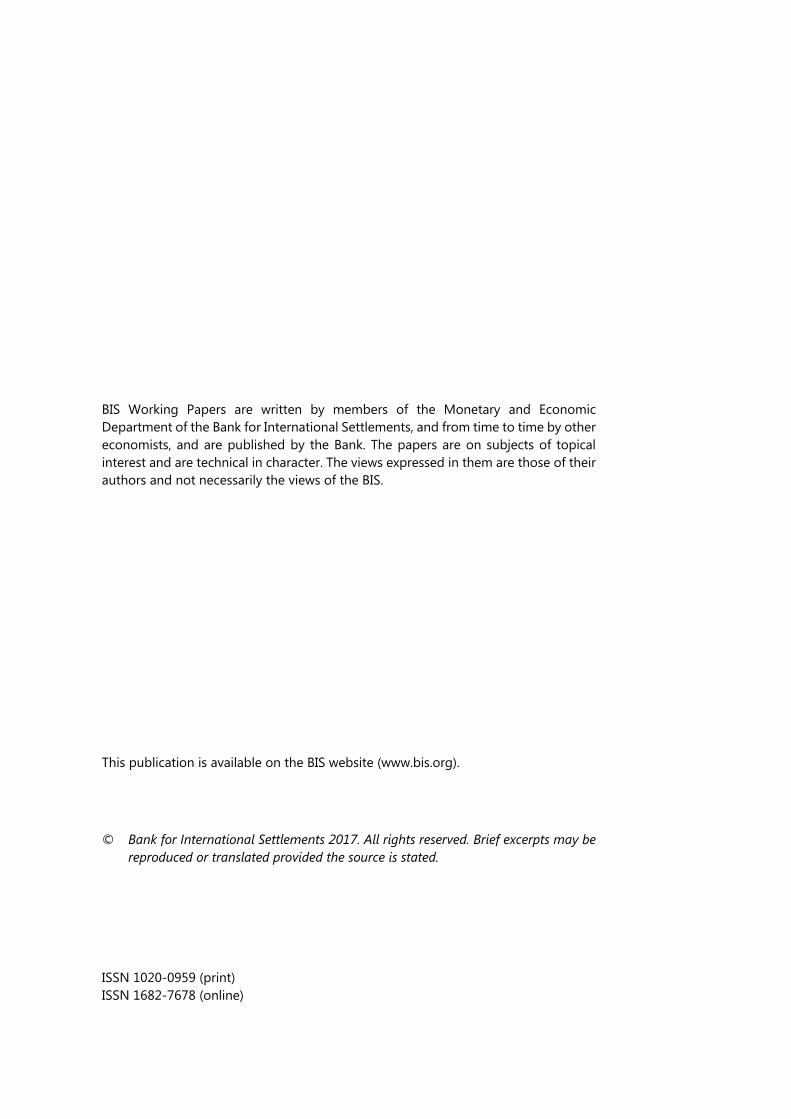
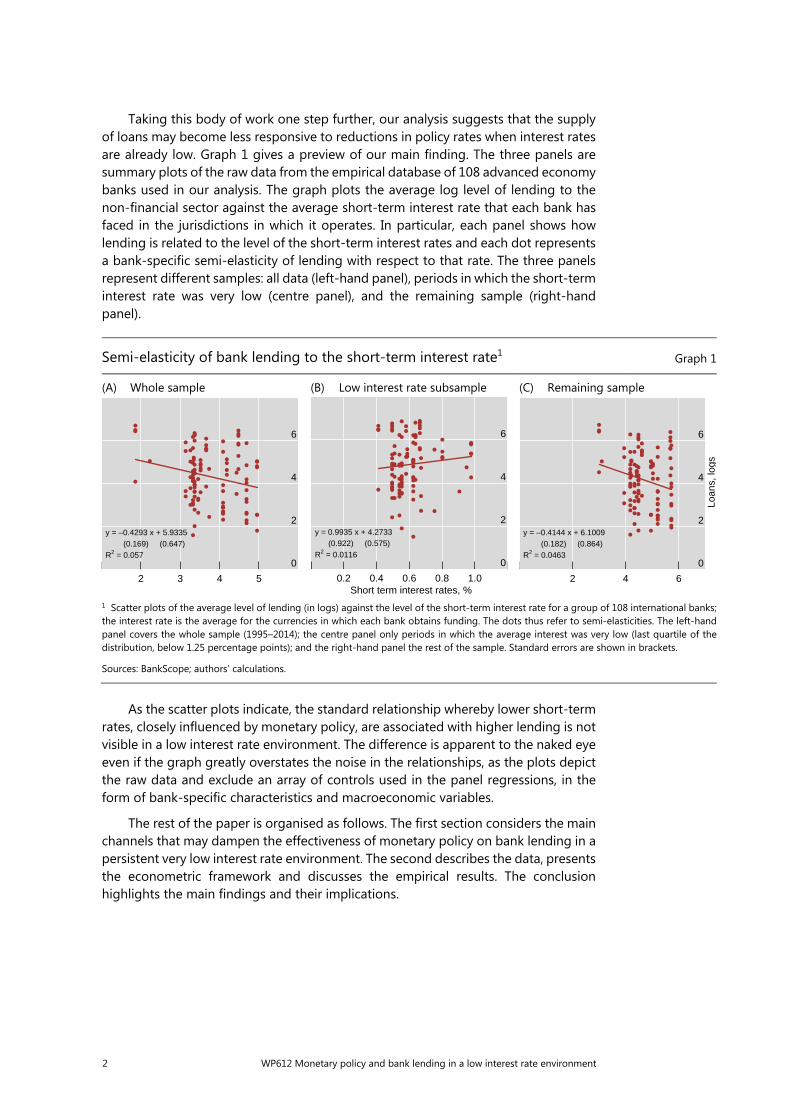
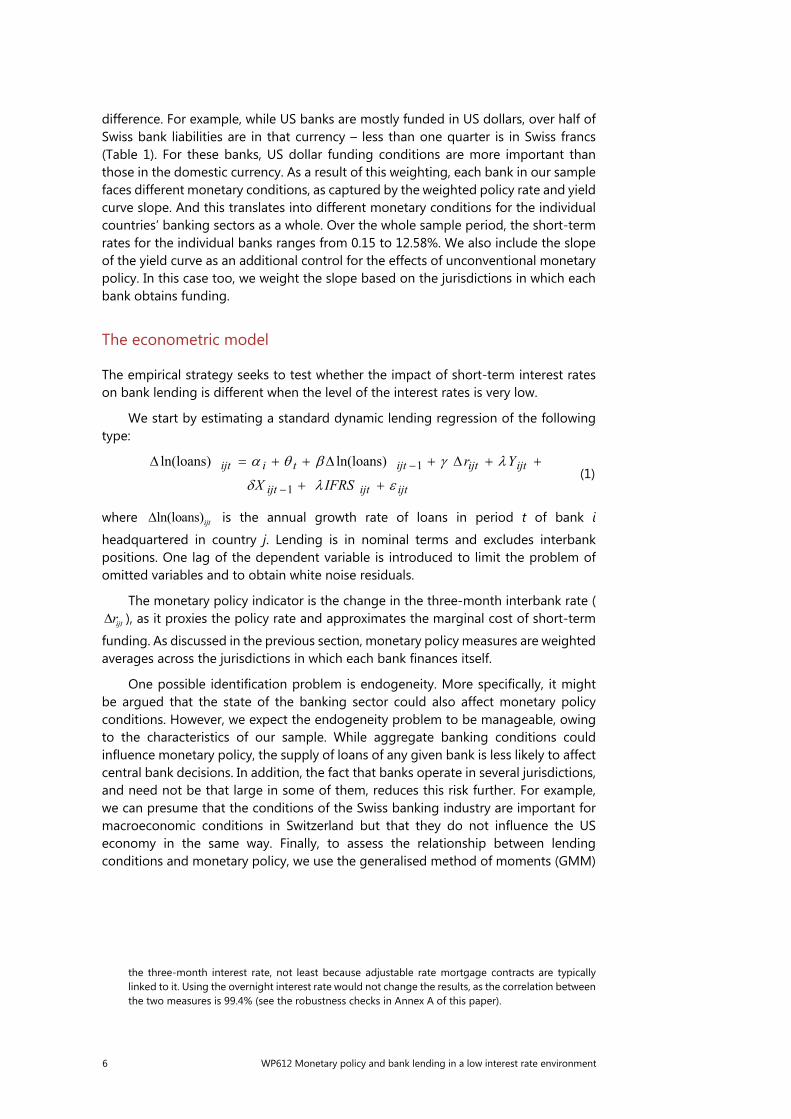
Taking this body of work one step further, our analysis suggests that the supply of loans may become less responsive to reductions in policy rates when interest rates are already low. Graph 1 gives a preview of our main finding. The three panels are summary plots of the raw data from the empirical database of 108 advanced economy banks used in our analysis. The graph plots the average log level of lending to the non-financial sector against the average short-term interest rate that each bank has faced in the jurisdictions in which it operates. In particular, each panel shows how lending is related to the level of the short-term interest rates and each dot represents a bank-specific semi-elasticity of lending with respect to that rate. The three panels represent different samples: all data (left-hand panel), periods in which the short-term interest rate was very low (centre panel), and the remaining sample (right-hand panel).
As the scatter plots indicate, the standard relationship whereby lower short-term rates, closely influenced by monetary policy, are associated with higher lending is not visible in a low interest rate environment. The difference is apparent to the naked eye even if the graph greatly overstates the noise in the relationships, as the plots depict the raw data and exclude an array of controls used in the panel regressions, in the form of bank-specific characteristics and macroeconomic variables.
The rest of the paper is organised as follows. The first section considers the main channels that may dampen the effectiveness of monetary policy on bank lending in a persistent very low interest rate environment. The second describes the data, presents the econometric framework and discusses the empirical results. The conclusion highlights the main findings and their implications.
Semi-elasticity of bank lending to the short-term interest rate1 Graph 1
(A) Whole sample (B) Low interest rate subsample (C) Remaining sample
1 Scatter plots of the average level of lending (in logs) against the level of the short-term interest rate for a group of 108 international banks; the interest rate is the average for the currencies in which each bank obtains funding. The dots thus refer to semi-elasticities. The left-hand panel covers the whole sample (1995–2014); the centre panel only periods in which the average interest was very low (last quartile of thedistribution, below 1.25 percentage points); and the right-hand panel the rest of the sample. Standard errors are shown in brackets.
Sources: BankScope; authors’ calculations.
0
2
4
6
2 3 4 5
y = –0.4293 x + 5.9335 (0.169) (0.647)R2 = 0.057
0
2
4
6
0.2 0.4 0.6 0.8 1.0
y = 0.9935 x + 4.2733 (0.922) (0.575)R2 = 0.0116
Short term interest rates, %
0
2
4
6
2 4 6
y = –0.4144 x + 6.1009 (0.182) (0.864)R2 = 0.0463
Loan
s, lo
gs
WP612 Monetary policy and bank lending in a low interest rate environment 3
1. The link between low interest rates and lending
Why might monetary policy be less effective in boosting lending at very low interest rates?
One possibility might be through the impact of very low rates on the profitability of the lending business (Borio et al (2017)). Persistently low rates depress bank profitability by sapping interest rate margins. The main channel is the “retail deposits endowment effect”. This effect derives from the fact that bank deposits are generally priced as a markdown on market rates, typically reflecting some form of oligopolistic power and transaction services.4 If the markdown becomes smaller as money market rates fall, then monetary policy easing will reduce net interest income. The endowment effect was a big source of profits at high inflation rates and when competition within the banking sector and between banks and non-banks was very limited, such as in many countries in the late 1970s. It has again become quite prominent, but operating in reverse, post-crisis, as interest rates have become extraordinarily low: as the deposit rate cannot fall below 0, at least to any significant extent, the markdown is compressed when the policy rate is reduced to very low levels. This means that the relationship between net interest income and interest rates is non-linear (concave). As market rates decline, this squeezes margins (the “endowment effect” progressively vanishes). All else equal, unless banks raise loan rates to compensate, this reduces the return on lending activities, possibly reducing banks’ willingness to lend.
How could the reduction in bank profitability in turn depress lending? First, if banks regard capital as scarce, they would naturally allocate it to activities that, at the margin, are more profitable. Low interest rates would reduce the profitability of the lending business, by sapping the net interest margin, while cutting less, and possibly even increasing, the profitability of more investment banking-type business lines, such as underwriting of securities issuance or trading or mergers and acquisitions.5 In addition, lending could also be cut if banks privilege market share over profits and need to meet a minimum profit constraint, as might be the case if they need to keep their shareholders satisfied (Baumol (1959)).6 Under those conditions, a reduction in profits would induce banks to cut volumes so as to meet their minimum targets. Loans could be affected if banks have some oligopolistic power over some segments. For instance, in Switzerland banks actually raised mortgage loan rates in response to the introduction of negative interest rates (Bech and Malkhozov (2016)).7
4 The stickiness of deposit rates with respect to monetary policy changes has been extensively analysed
in the literature (see, among others, Borio and Fritz (1995), Freixas and Rochet (1997), Hannan and Berger (1991), Hutchison (1995), Neumark and Sharpe (1992), Rosen (2002) and Gambacorta and Iannotti (2007)).
5 For instance, this could arise to the extent that those wholesale activities rely less on cheap retail funding.
6 Technically, a Lagrange multiplier is associated with the profit constraint, increasing the sensitivity of volumes to its relaxation.
7 Our focus here is on the impact of the short-term rate in particular. We do not consider, for instance, measures through which the central bank may also relax any funding liquidity constraints banks may face. As an example, Lenza et al (2010) find that quantitative easing – and the other non-standard measures introduced by central banks that changed the composition of the asset side of their balance
4 WP612 Monetary policy and bank lending in a low interest rate environment
The impact would tend to increase as the low interest rate environment persists. Any short-term valuation gains linked to lower rates would disappear or, if the assets are held to maturity, even reverse.8 And as lower profitability makes it harder to accumulate capital, the very basis for additional lending is eroded (Gambacorta and Shin (2016)).
In any econometric analysis, it is important to disentangle the above mechanisms from broader factors that may go hand in hand with very low rates. Examples include the impact of a financial crisis on banks’ balance sheets and/or on agents’ propensity to invest and consume. For example, when banks’ soundness is in doubt, they may naturally cut back on lending. Similarly, overindebted borrowers may wish to consolidate and repair their balance sheets, reducing the demand for funding. In both cases, the equilibrium volume of lending would become less responsive to lower policy rates. Such headwinds would naturally reduce the effectiveness of monetary policy easing. In the empirical part, therefore, we will do our best to control for the influence of such factors.
2. Empirical analysis
The data
We use bank-level data from BankScope, a commercial database maintained by Fitch and Bureau van Dijk. We consider consolidated balance sheet statements, in line with the view that an internationally active bank takes strategic decisions on its worldwide consolidated assets and liabilities. All major international banks are included. The sample covers 20 years from 1995 to 2014, a period spanning different economic cycles, a wave of consolidation and the Great Financial Crisis. The data are annual.
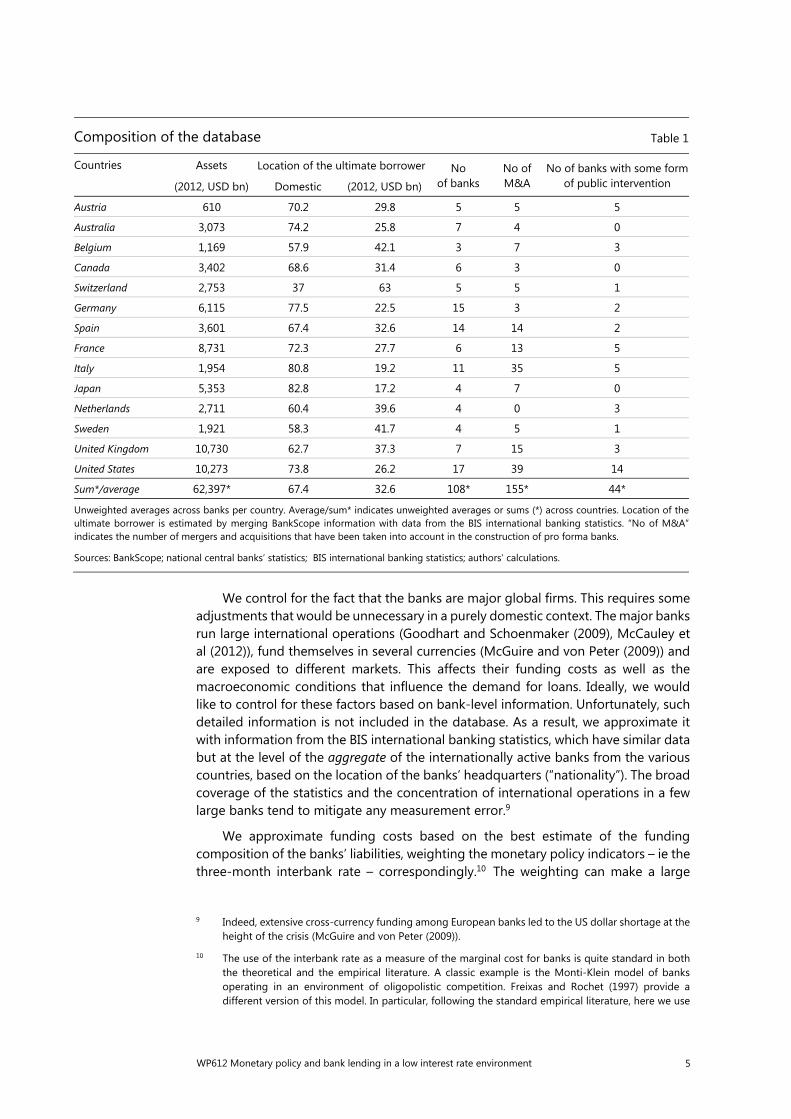
We adjust the sample in a number of ways. First, we control for 155 mergers and acquisitions over the period by constructing pro forma entities at the bank holding level. This procedure obviously limits the number of banks in the sample. To ensure consistently broad coverage, we select banks by country in descending order of size so as to cover at least 80% of the domestic banking systems in the G10 countries (Belgium, Canada, France, Germany, Italy, Japan, the Netherlands, Sweden, Switzerland, the United Kingdom and the United States) plus Austria, Australia and Spain. The merger-adjusted sample comprises a final set of 108 pro forma banks, including the acquisitions in each bank’s merger history based on 267 banks in total. The sample thus covers over 70% of worldwide bank assets as reported in The Banker Magazine for the top 1,000 banks for end-2008. For each country, Table 1 shows the number of banks in the sample that are headquartered in each country.
sheets (so-called ‘qualitative easing’) – acted mainly through their effects on interest rates and, in particular, on money market spreads. For a general assessment of the impact of ECB’s non-standard monetary policy measures on the euro area economy see Giannone et al (2012), who find small but significant effects on both loans and real economic activity.
8 Brunnermeier and Koby (2016) develop a model that identifies a “reversal interest rate”, a rate at which accommodative monetary policy “reverses” its effects and becomes contractionary. The reversal interest rate depends on various factors: (i) banks' asset holdings with fixed (non-floating) interest payments; (ii) the degree of interest rate pass-through to the loan rate and deposit rate; (iii) the amount of banks’ wholesale funding; and (iv) dividend policy.
WP612 Monetary policy and bank lending in a low interest rate environment 5
We control for the fact that the banks are major global firms. This requires some adjustments that would be unnecessary in a purely domestic context. The major banks run large international operations (Goodhart and Schoenmaker (2009), McCauley et al (2012)), fund themselves in several currencies (McGuire and von Peter (2009)) and are exposed to different markets. This affects their funding costs as well as the macroeconomic conditions that influence the demand for loans. Ideally, we would like to control for these factors based on bank-level information. Unfortunately, such detailed information is not included in the database. As a result, we approximate it with information from the BIS international banking statistics, which have similar data but at the level of the aggregate of the internationally active banks from the various countries, based on the location of the banks’ headquarters (“nationality”). The broad coverage of the statistics and the concentration of international operations in a few large banks tend to mitigate any measurement error.9
We approximate funding costs based on the best estimate of the funding composition of the banks’ liabilities, weighting the monetary policy indicators – ie the three-month interbank rate – correspondingly.10 The weighting can make a large
9 Indeed, extensive cross-currency funding among European banks led to the US dollar shortage at the
height of the crisis (McGuire and von Peter (2009)).
10 The use of the interbank rate as a measure of the marginal cost for banks is quite standard in both the theoretical and the empirical literature. A classic example is the Monti-Klein model of banks operating in an environment of oligopolistic competition. Freixas and Rochet (1997) provide a different version of this model. In particular, following the standard empirical literature, here we use
Composition of the database Table 1
Countries Assets Location of the ultimate borrower No of banks
No of M&A
No of banks with some form of public intervention (2012, USD bn) Domestic (2012, USD bn)
Austria 610 70.2 29.8 5 5 5
Australia 3,073 74.2 25.8 7 4 0
Belgium 1,169 57.9 42.1 3 7 3
Canada 3,402 68.6 31.4 6 3 0
Switzerland 2,753 37 63 5 5 1
Germany 6,115 77.5 22.5 15 3 2
Spain 3,601 67.4 32.6 14 14 2
France 8,731 72.3 27.7 6 13 5
Italy 1,954 80.8 19.2 11 35 5
Japan 5,353 82.8 17.2 4 7 0
Netherlands 2,711 60.4 39.6 4 0 3
Sweden 1,921 58.3 41.7 4 5 1
United Kingdom 10,730 62.7 37.3 7 15 3
United States 10,273 73.8 26.2 17 39 14
Sum*/average 62,397* 67.4 32.6 108* 155* 44*
Unweighted averages across banks per country. Average/sum* indicates unweighted averages or sums (*) across countries. Location of the ultimate borrower is estimated by merging BankScope information with data from the BIS international banking statistics. “No of M&A” indicates the number of mergers and acquisitions that have been taken into account in the construction of pro forma banks.
Sources: BankScope; national central banks’ statistics; BIS international banking statistics; authors’ calculations.
6 WP612 Monetary policy and bank lending in a low interest rate environment
difference. For example, while US banks are mostly funded in US dollars, over half of Swiss bank liabilities are in that currency – less than one quarter is in Swiss francs (Table 1). For these banks, US dollar funding conditions are more important than those in the domestic currency. As a result of this weighting, each bank in our sample faces different monetary conditions, as captured by the weighted policy rate and yield curve slope. And this translates into different monetary conditions for the individual countries’ banking sectors as a whole. Over the whole sample period, the short-term rates for the individual banks ranges from 0.15 to 12.58%. We also include the slope of the yield curve as an additional control for the effects of unconventional monetary policy. In this case too, we weight the slope based on the jurisdictions in which each bank obtains funding.
The econometric model
The empirical strategy seeks to test whether the impact of short-term interest rates on bank lending is different when the level of the interest rates is very low.
We start by estimating a standard dynamic lending regression of the following type:
ijtijtijt
ijtijtijttiijt
IFRSX
Yr
ln(loans)ln(loans)
1
1 (1)
where ln(loans)ijt is the annual growth rate of loans in period t of bank i
headquartered in country j. Lending is in nominal terms and excludes interbank positions. One lag of the dependent variable is introduced to limit the problem of omitted variables and to obtain white noise residuals.
The monetary policy indicator is the change in the three-month interbank rate (ijtr ), as it proxies the policy rate and approximates the marginal cost of short-term
funding. As discussed in the previous section, monetary policy measures are weighted averages across the jurisdictions in which each bank finances itself.
One possible identification problem is endogeneity. More specifically, it might be argued that the state of the banking sector could also affect monetary policy conditions. However, we expect the endogeneity problem to be manageable, owing to the characteristics of our sample. While aggregate banking conditions could influence monetary policy, the supply of loans of any given bank is less likely to affect central bank decisions. In addition, the fact that banks operate in several jurisdictions, and need not be that large in some of them, reduces this risk further. For example, we can presume that the conditions of the Swiss banking industry are important for macroeconomic conditions in Switzerland but that they do not influence the US economy in the same way. Finally, to assess the relationship between lending conditions and monetary policy, we use the generalised method of moments (GMM)
the three-month interest rate, not least because adjustable rate mortgage contracts are typically linked to it. Using the overnight interest rate would not change the results, as the correlation between the two measures is 99.4% (see the robustness checks in Annex A of this paper).
WP612 Monetary policy and bank lending in a low interest rate environment 7
estimator for dynamic panel data. This further contributes to mitigating the endogeneity issue.11
We then introduce a wide range of controls. The vector ijtY includes bank-
weighted cyclical indicators to control for loan demand conditions. In particular, the vector contains: (i) real GDP growth; (ii) CPI inflation; (iii) house price growth; and (iv) the yield curve slope (the difference between the 10-year government bond yield and the three-month interbank rate). The vector 1ijtX includes bank-specific characteristics
that could affect the supply of lending: (i) the cost of debt funding (funding expenses over total non-equity funding); (ii) the leverage ratio (equity to total assets); (iii) the liquidity ratio (cash and securities holdings over total assets); (iv) a diversification ratio, given by non-interest income to total income; and (v) a dummy variable that takes the value of 1 if a bank had public capital on its balance sheet in any given year and 0 otherwise. We also include a dummy variable IFRSijt that takes the value of 1 once a bank has adopted International Financial Reporting Standards (IFRS) and 0 otherwise.12 As an additional precaution, bank-specific characteristics are lagged by one year (t–1) in order to mitigate a possible endogeneity problem between the bank-specific control variables and lending dynamics.
We include also time and bank fixed effects ( t and i , respectively). These variables do not represent the focus of our analysis but are very important for taking into account different country-specific institutional characteristics and loan demand shifts due to, say, global liquidity conditions. Note that the inclusion of bank fixed effects allows us to interpret the coefficient estimates as variations within banks over time. Summary statistics of the specific variables used in the regressions by jurisdiction are reported in Table 2.
In order to verify if the effect of monetary policy on lending changes in periods of low interest rates, we modify equation (1) slightly. Specifically, we introduce an additional interaction term, given by the product between the annual change in short-term rate ( ijtr ) and a dummy for a low interest rate environment ( Lowrateijt ). The
dummy takes the value of 1 if the three-month interbank rate is lower than 1.25% and 0 elsewhere. Thus, we estimate:
1
1
ln (loans) ln(loans) * Low rate
ijt i t ijt ijt ijt ijt
ijt ijt ijt ijt
r rY X IFRS
(2)
11 The model is estimated using the GMM estimator due to Arellano and Bond (1991), which ensures
efficiency and consistency provided that the model is not subject to serial correlation of order two and that the instruments are valid (which is here tested with the Hansen test). We employ the system version of the estimator, because it tends to outperform the difference GMM estimator in terms of consistency and efficiency as it uses both the difference and the levels equation (Blundell and Bond (1998)).
12 This dummy controls for changes in the measurement of certain balance sheet items and other differences in accounting due to the introduction of the new IFRS standards, notably for the rules concerning the offsetting of derivatives on the asset and liability side. Most countries (except Canada, Japan and the United States) changed accounting standards from local Generally Accepted Accounting Practices (GAAP) to IFRS in 2005–06.

8 W
P612 Monetary policy and bank lending in a low
interest rate environment
Characteristics of the database, by region Table 2
Region
Growth rate of lending
(%)1
Three-month interbank
rate, adjusted2 (%)
Share of sample with low level of
interest rates3
(%)
Slope of the yield curve,
adjusted (pp)2
Share of sample with a financial crisis
(%)4
Real GDP growth,
adjusted (%)5
House price growth,
adjusted (%)5
Cost of funding (%)6
Leverage ratio (%)7
Liquidity ratio (%)8
Diversifi-cation ratio
(%)9
Number of banks
Asia-Pacific 5.67 3.43 17.7 0.88 3.8 2.41 3.46 3.48 5.62 11.50 35.61 11
Euro area 4.88 3.18 24.8 1.29 18.8 1.62 3.58 3.57 5.26 14.94 35.42 58
Other Europe 3.39 3.58 26.4 1.07 12.0 2.05 4.33 2.89 4.80 16.54 44.73 16
North America 4.52 3.07 31.9 1.43 10.6 2.39 4.08 2.30 7.68 19.94 47.68 23
Average/sum* 4.65 3.25 25.0 1.24 15.8 2.00 4.00 3.18 5.73 15.89 39.49 108*
Unweighted averages across banks per region over the period 1994–2014. Asia-Pacific: AU and JP; euro area: AT, BE, DE, ES, FR, IT and NL; North America: CA and US; other Europe: CH, SE and UK. “Average/sum*” indicates unweighted averages or sums across countries.
1 Deflated with the consumer price index. 2 “Adjusted” refers to the weighting for the funding composition of the banks’ liabilities (ie funding conditions are weighted based on the jurisdictions in which the banks obtain their funding). 3 A year is considered to have a low level of interest rates if the three-month interbank rate is in the first quartile of the distribution (below 1.25%). 4 The slope of the yield curve is given by the difference between the 10-year government bond yield and the three-month interbank rate. 4 To date a financial crisis, we rely on a combination of Borio and Drehmann (2009), Laeven and Valencia (2012) and Reinhart and Rogoff (2009). Following Bech et al (2014), the dummy takes the value of 1 in the crisis year and in all the subsequent years of falling real GDP. 5 “Adjusted” refers to the adjustment of the macroeconomic variables for the location of international claims on a consolidated basis. 6 Total funding expenses divided by total funding. Excluding equity 7 Equity and reserves over total assets. 8 Cash and government securities over total assets. 9 Non-interest income over total income.
Sources: BankScope; authors’ calculations.
WP612 Monetary policy and bank lending in a low interest rate environment 9
The specific definition of the dummy, with the 1.25% threshold, is the same as that used in Claessens et al (2016), who study the impact of low interest rates on banks’ interest margins. In our database, this is equivalent to considering any differential impact on the first quartile of the distribution of the short-term rate. We will test the robustness of this result later, by considering another dummy that takes the value of 1 for rates in the first decile of the distribution, equivalent to a three-month interbank rate below 0.43%.
The coefficient on the interaction term between the change in the short rate and the low interest rate environment dummy ( * Lowrateijt ijtr ) indicates the differential
impact that a change in the money market rate has on lending when the level of such interest rate is low. Therefore, the sign and statistical significance of this coefficient are a direct test of the different effectiveness of monetary policy in the two regimes. In particular, a positive coefficient implies reduced effectiveness, ie overall a lower responsiveness of the loan volume.
The results
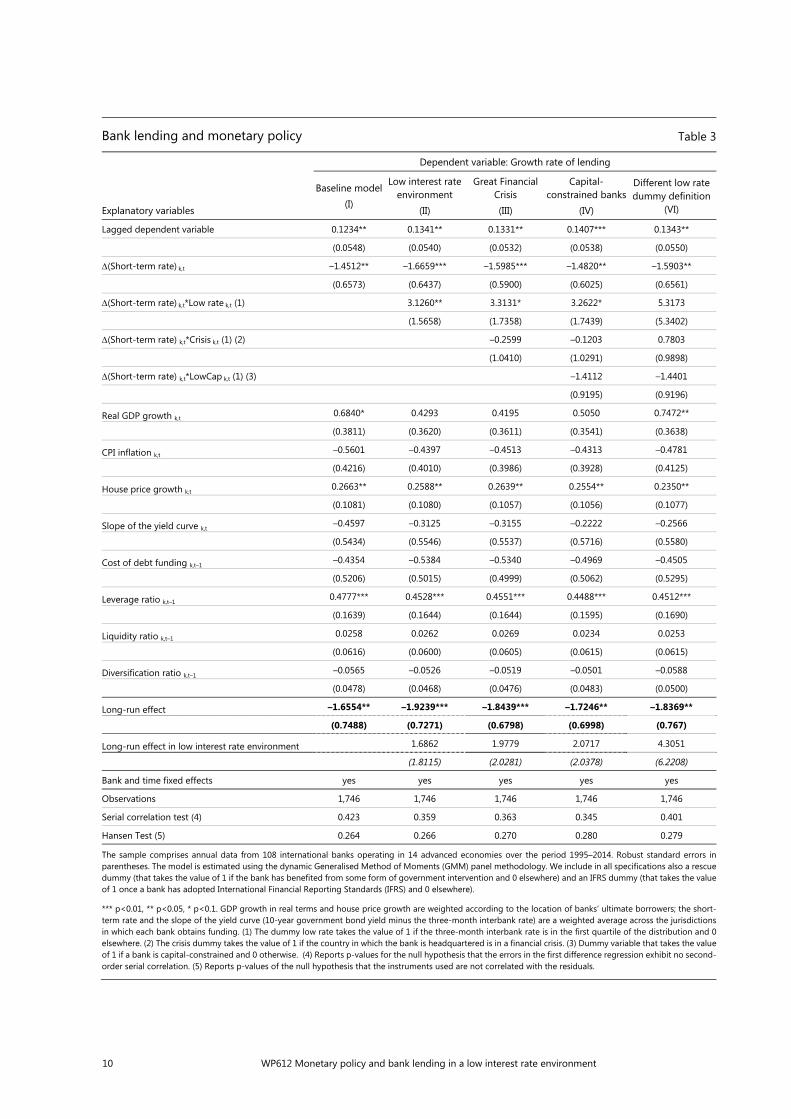
Results for the baseline model are presented in the first column of Table 3.
The results for the whole sample suggest that the baseline regression is a valid benchmark. The response of bank lending to changes in the short-term interest rates has the expected negative sign and is statistically significant. A 1 percentage point reduction in the interest rate boosts lending by 1.5% in the short run (within a year) and by 1.7% in the long-run.13 These effects are very similar to those reported in other studies (eg Gambacorta and Marqués-Ibáñez (2011), who analyse a sample of more than 1,000 banks from the European Union member states and the United States).
All the coefficients of the control variables have the expected sign. Among bank-specific characteristics, the most significant variable is bank leverage: well capitalised banks supply more lending, in line with the view that they have easier access to debt funding and at cheaper rates. A 1 percentage point increase in the equity-to-total assets ratio is associated with a higher subsequent growth rate in lending of around 0.5 percentage points per year. This is similar to the result obtained in Gambacorta and Shin (2016).
The results of the test are reported in the second column of Table 3.
They point to a loss of monetary policy effectiveness in a low interest rate environment. The coefficient on the interaction term * Lowrateijt ijtr is positive
and significant. In particular, the response of bank lending to short-term interest rates is not statistically significant either in the short run (1.460 with a standard error of 1.554)14 or in the long run (1.686 and 1.811, respectively). The rest of the results do not change.
13 The long-run impact of bank lending with respect to the money market rate is calculated as
ln(loans)1r
. The associated standard error, for this and similar coefficients below, is calculated
by means of the delta method (Rao (1973)).
14 The short-run impact in a low interest rate environment is given by –1.6659 + 3.1260 = 1.4601.
10 WP612 Monetary policy and bank lending in a low interest rate environment
Bank lending and monetary policy Table 3
Explanatory variables
Dependent variable: Growth rate of lending
Baseline model(I)
Low interest rate environment
(II)
Great Financial Crisis (III)
Capital- constrained banks
(IV)
Different low rate dummy definition
(VI)
Lagged dependent variable 0.1234** 0.1341** 0.1331** 0.1407*** 0.1343**
(0.0548) (0.0540) (0.0532) (0.0538) (0.0550)
(Short-term rate) k,t –1.4512** –1.6659*** –1.5985*** –1.4820** –1.5903**
(0.6573) (0.6437) (0.5900) (0.6025) (0.6561)
(Short-term rate) k,t*Low rate k,t (1) 3.1260** 3.3131* 3.2622* 5.3173
(1.5658) (1.7358) (1.7439) (5.3402)
(Short-term rate) k,t*Crisis k,t (1) (2) –0.2599 –0.1203 0.7803
(1.0410) (1.0291) (0.9898)
(Short-term rate) k,t*LowCap k,t (1) (3) –1.4112 –1.4401
(0.9195) (0.9196)
Real GDP growth k,t 0.6840* 0.4293 0.4195 0.5050 0.7472**
(0.3811) (0.3620) (0.3611) (0.3541) (0.3638)
CPI inflation k,t –0.5601 –0.4397 –0.4513 –0.4313 –0.4781
(0.4216) (0.4010) (0.3986) (0.3928) (0.4125)
House price growth k,t 0.2663** 0.2588** 0.2639** 0.2554** 0.2350**
(0.1081) (0.1080) (0.1057) (0.1056) (0.1077)
Slope of the yield curve k,t –0.4597 –0.3125 –0.3155 –0.2222 –0.2566
(0.5434) (0.5546) (0.5537) (0.5716) (0.5580)
Cost of debt funding k,t–1 –0.4354 –0.5384 –0.5340 –0.4969 –0.4505
(0.5206) (0.5015) (0.4999) (0.5062) (0.5295)
Leverage ratio k,t–1 0.4777*** 0.4528*** 0.4551*** 0.4488*** 0.4512***
(0.1639) (0.1644) (0.1644) (0.1595) (0.1690)
Liquidity ratio k,t–1 0.0258 0.0262 0.0269 0.0234 0.0253
(0.0616) (0.0600) (0.0605) (0.0615) (0.0615)
Diversification ratio k,t–1 –0.0565 –0.0526 –0.0519 –0.0501 –0.0588
(0.0478) (0.0468) (0.0476) (0.0483) (0.0500)
Long-run effect –1.6554** –1.9239*** –1.8439*** –1.7246** –1.8369**
(0.7488) (0.7271) (0.6798) (0.6998) (0.767)
Long-run effect in low interest rate environment 1.6862 1.9779 2.0717 4.3051
(1.8115) (2.0281) (2.0378) (6.2208)
Bank and time fixed effects yes yes yes yes yes
Observations 1,746 1,746 1,746 1,746 1,746
Serial correlation test (4) 0.423 0.359 0.363 0.345 0.401
Hansen Test (5) 0.264 0.266 0.270 0.280 0.279
The sample comprises annual data from 108 international banks operating in 14 advanced economies over the period 1995–2014. Robust standard errors in parentheses. The model is estimated using the dynamic Generalised Method of Moments (GMM) panel methodology. We include in all specifications also a rescue dummy (that takes the value of 1 if the bank has benefited from some form of government intervention and 0 elsewhere) and an IFRS dummy (that takes the value of 1 once a bank has adopted International Financial Reporting Standards (IFRS) and 0 elsewhere).
*** p<0.01, ** p<0.05, * p<0.1. GDP growth in real terms and house price growth are weighted according to the location of banks’ ultimate borrowers; the short-term rate and the slope of the yield curve (10-year government bond yield minus the three-month interbank rate) are a weighted average across the jurisdictions in which each bank obtains funding. (1) The dummy low rate takes the value of 1 if the three-month interbank rate is in the first quartile of the distribution and 0 elsewhere. (2) The crisis dummy takes the value of 1 if the country in which the bank is headquartered is in a financial crisis. (3) Dummy variable that takes the value of 1 if a bank is capital-constrained and 0 otherwise. (4) Reports p-values for the null hypothesis that the errors in the first difference regression exhibit no second-order serial correlation. (5) Reports p-values of the null hypothesis that the instruments used are not correlated with the residuals.
WP612 Monetary policy and bank lending in a low interest rate environment 11
The evidence is quite robust. It survives even if we control for the possibly reduced effectiveness of monetary policy in periods of downturns associated with a financial crises, owing to the well-known headwinds involved. We test for this by introducing an additional interaction term in equation (2), equal to the product between the annual change in the short-term rate ( ijtr ) and a crisis dummy
( C risis ijt ) that takes the value of 1 if the country in which the bank is headquartered
is in a downturn associated with a financial crisis. To date a financial crisis, we rely on a combination of Borio and Drehmann (2009), Laeven and Valencia (2012) and Reinhart and Rogoff (2009). Following Bech et al (2014), the dummy takes the value of 1 in the crisis year and in all the subsequent years of falling real GDP. The dummy is 0 again when real GDP starts to grow. Specifically, the model becomes:
1
1
ln(loans) ln(loans) * Lowrate * Crisis
ijt i t ijt ijt ijt ijt
ijt jt ijt ijt ijt ijt
r rr Y X IFRS
(3)
As the third column of Table 3 indicates, the coefficient on the interaction term * Lowrateijt ijtr is still positive, although the significance is reduced to the 10%
level. In particular, the response of bank lending to short-term interest rates in a low interest rate environment is not statistically significant either in the short run (1.714 with a standard error of 1.721)15 or in the long run (1.979 and 2.028, respectively). The other coefficients hardly change.
The results also hold if we control for weak bank balance sheets. Here, we enrich equation (2) with an additional interaction term given by the product between the annual change in short-term rate ( ijtr ) and a dummy LowCapijt , which takes the
value of 1 if a bank’s regulatory capital buffer – the difference between the regulatory capital ratio and the regulatory minimum – is in the lowest decile of the distribution.16 In particular, we estimate the following model:
1
1
ln(loans) ln(loans) * Lowrate
* Crisis * LowC ap ijt i t ijt ijt ijt ijt
ijt jt ijt ijt ijt ijt ijt ijt
r rr r Y X IFRS
(4)
As reported in the fourth column of Table 3, the coefficient on the interaction term ijtijtr rate Low * is still positive and significant at the 10% level. Again, the
response of bank lending to short-term interest rates is not statistically significant either in the short run (1.780 with a standard error of 1.708)17 or in the long run (2.072 and 2.037). Other results remain unchanged.
15 The short-run impact in a low interest rate environment is given by –1.5985 + 3.3131 = 1.7146.
16 Following Brei and Gambacorta (2016), we consider a bank as capital-constrained when the distance of a bank’s capital ratio from the regulatory minimum is lower than the 10th percentile of the distribution of distances, taking into account regulatory differences across countries. While all countries have minimum requirements for risk-weighted capital ratios (for Basel I: Tier 1/RWA > 4%, total capital/RWA > 8%), additional limits were imposed on banks’ leverage ratios in Canada and the United States (Barth et al (2013)). Constrained banks have, on average, a Basel III leverage ratio of 3.4% and a Tier 1/RWA of 6.3%, while for unconstrained banks the ratios are, respectively, 4.8% and 9.6%.
17 In this case, the short-run impact in a low interest rate environment is given by –1.4820 + 3.2622 = 2.072.
12 WP612 Monetary policy and bank lending in a low interest rate environment
The evidence survives a tighter specification of the low interest rate environment. We reduce the threshold on the short-term rate from 1.25% to 0.43%. Thus, instead of considering the first quartile of the distribution of short-term rates, we look at the first decile. The results do not change qualitatively, but the reduction of the observations for the low interest rate environment makes inference less precise (last column of Table 3). The coefficient on the interaction term * Lowrateijt ijtr is still
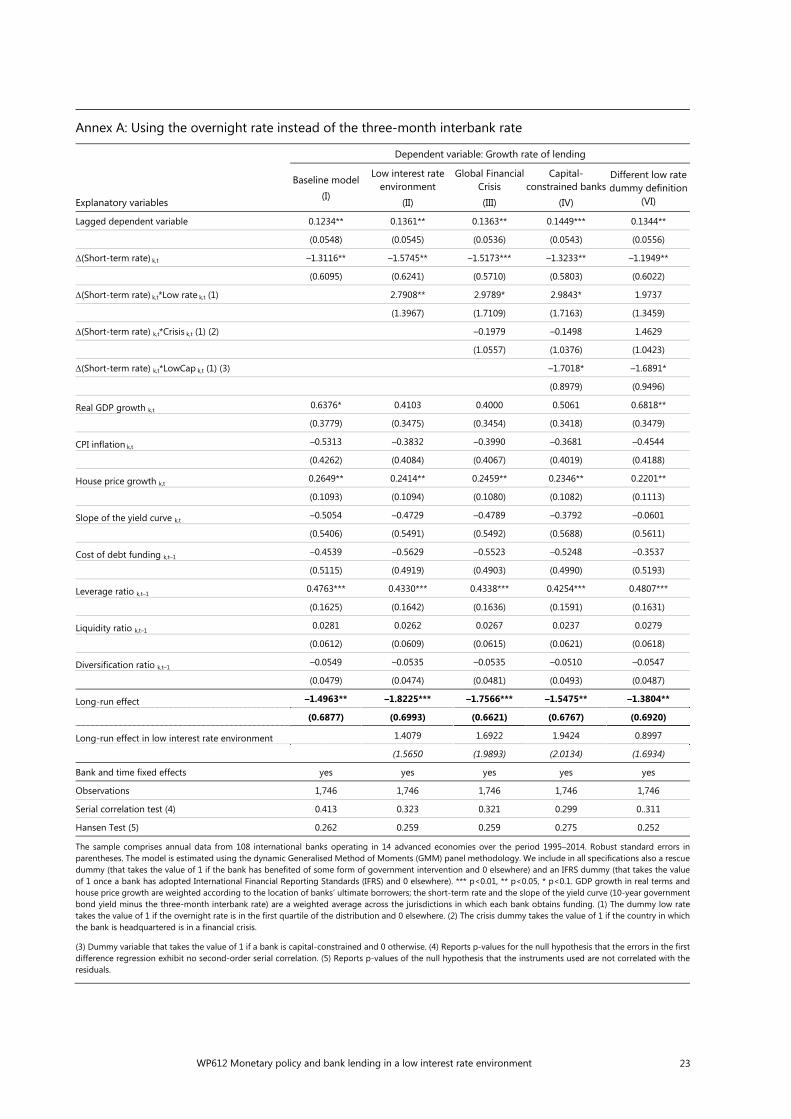
positive but no longer statistically significant. Even so, the response of bank lending to short-term interest rates at such low rates is still not statistically significant either in the short run (3.727 with a standard error of 5.329)18 or in the long run (4.305 and 6.221). Again, there is little change in the other regression coefficients. The results reported in Table 3 are qualitatively similar if we consider as monetary policy indicator (marginal funding cost for banks) the overnight rate instead of the three-month interbank rate (see Annex A) or if we use a simple sample split instead of a threshold dummy to identify the low interest rate environment (see Annex B).19 Moreover, the results are also very similar using the Driscoll-Kraay fixed effect estimator that is robust to very general forms of cross-sectional ("country") dependence.20
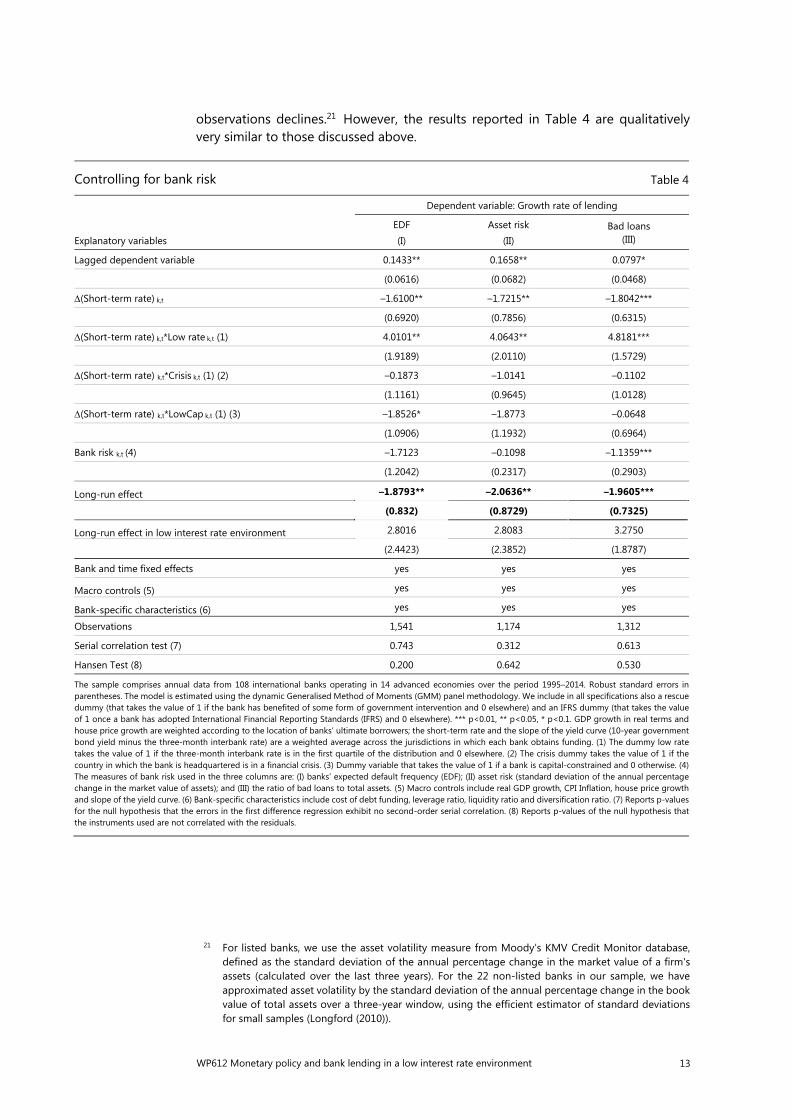
As an additional robustness test, we include different measures of bank risk. Indeed, some recent papers find a significant link between low interest rates and banks’ risk-taking (Altunbas et al (2014), Jiménez et al (2014), Ioannidou et al (2015)). This has given support to a different dimension of the monetary transmission mechanism: the so-called risk-taking channel (Adrian and Shin (2010), Borio and Zhu (2012)). There are at least two ways in which this channel may operate. First, low returns on investments, such as government (risk-free) securities, may increase incentives for banks, asset managers and other players to take on more risk for contractual or institutional reasons (for example, to meet a target nominal return). Second, low interest rates affect valuations, incomes and cash flows, which in turn can modify banks’ perceptions of risk, given the measurement systems in place.
To control for this channel, we include in specification (4), one at a time, three different measures of bank risk: (i) banks’ expected default frequency (EDF); (ii) asset risk (standard deviation of the annual percentage change in the market value of assets); and (iii) the ratio of bad loans to total assets. Since information on the bank risk measures is not available for all the banks in the sample, the number of
18 Using the different low interest rate dummy definition, the short-run impact is given by –1.5903 +
5.3173 = 3.7270. Even in this case, the coefficient is not statistically different from 0.
19 As the definition of the dummy used to identify the low interest rate environment could be considered somewhat arbitrary, we performed an additional test by simply splitting the sample into two subperiods, 1995–2008 and 2009–14. The graph in Annex C shows that the interbank rate’s substantial drop to a very low nominal level took place in 2009. Moreover, as indicated in Annex D, interest rates were already very low in Japan in the 2000s. For this reason, we have included Japan in the second subsample. The results in the first two columns of the table in Annex B are qualitatively very similar to those reported in the second column of Table 3. Results are also very similar including 2008 (the year of the Lehman default) in the second subperiod (see columns III and IV in the table contained in Annex B).
20 See Driscoll and Kraay (1998). The results are not included for the sake of brevity but are available upon request.
WP612 Monetary policy and bank lending in a low interest rate environment 13
observations declines.21 However, the results reported in Table 4 are qualitatively very similar to those discussed above.
21 For listed banks, we use the asset volatility measure from Moody’s KMV Credit Monitor database,
defined as the standard deviation of the annual percentage change in the market value of a firm's assets (calculated over the last three years). For the 22 non-listed banks in our sample, we have approximated asset volatility by the standard deviation of the annual percentage change in the book value of total assets over a three-year window, using the efficient estimator of standard deviations for small samples (Longford (2010)).
Controlling for bank risk Table 4
Explanatory variables
Dependent variable: Growth rate of lending
EDF (I)
Asset risk (II)
Bad loans (III)
Lagged dependent variable 0.1433** 0.1658** 0.0797*
(0.0616) (0.0682) (0.0468)
(Short-term rate) k,t –1.6100** –1.7215** –1.8042***
(0.6920) (0.7856) (0.6315)
(Short-term rate) k,t*Low rate k,t (1) 4.0101** 4.0643** 4.8181***
(1.9189) (2.0110) (1.5729)
(Short-term rate) k,t*Crisis k,t (1) (2) –0.1873 –1.0141 –0.1102
(1.1161) (0.9645) (1.0128)
(Short-term rate) k,t*LowCap k,t (1) (3) –1.8526* –1.8773 –0.0648
(1.0906) (1.1932) (0.6964)
Bank risk k,t (4) –1.7123 –0.1098 –1.1359***
(1.2042) (0.2317) (0.2903)
Long-run effect –1.8793** –2.0636** –1.9605***
(0.832) (0.8729) (0.7325)
Long-run effect in low interest rate environment 2.8016 2.8083 3.2750
(2.4423) (2.3852) (1.8787)
Bank and time fixed effects yes yes yes
Macro controls (5) yes yes yes
Bank-specific characteristics (6) yes yes yes
Observations 1,541 1,174 1,312
Serial correlation test (7) 0.743 0.312 0.613
Hansen Test (8) 0.200 0.642 0.530
The sample comprises annual data from 108 international banks operating in 14 advanced economies over the period 1995–2014. Robust standard errors in parentheses. The model is estimated using the dynamic Generalised Method of Moments (GMM) panel methodology. We include in all specifications also a rescue dummy (that takes the value of 1 if the bank has benefited of some form of government intervention and 0 elsewhere) and an IFRS dummy (that takes the value of 1 once a bank has adopted International Financial Reporting Standards (IFRS) and 0 elsewhere). *** p<0.01, ** p<0.05, * p<0.1. GDP growth in real terms andhouse price growth are weighted according to the location of banks’ ultimate borrowers; the short-term rate and the slope of the yield curve (10-year government bond yield minus the three-month interbank rate) are a weighted average across the jurisdictions in which each bank obtains funding. (1) The dummy low rate takes the value of 1 if the three-month interbank rate is in the first quartile of the distribution and 0 elsewhere. (2) The crisis dummy takes the value of 1 if the country in which the bank is headquartered is in a financial crisis. (3) Dummy variable that takes the value of 1 if a bank is capital-constrained and 0 otherwise. (4) The measures of bank risk used in the three columns are: (I) banks’ expected default frequency (EDF); (II) asset risk (standard deviation of the annual percentage change in the market value of assets); and (III) the ratio of bad loans to total assets. (5) Macro controls include real GDP growth, CPI Inflation, house price growth and slope of the yield curve. (6) Bank-specific characteristics include cost of debt funding, leverage ratio, liquidity ratio and diversification ratio. (7) Reports p-values for the null hypothesis that the errors in the first difference regression exhibit no second-order serial correlation. (8) Reports p-values of the null hypothesis that the instruments used are not correlated with the residuals.
14 WP612 Monetary policy and bank lending in a low interest rate environment
Test for the existence of a “net interest income” channel
The previous results indicate that monetary policy is less effective in a low interest rate environment controlling for downturns associated with a financial crisis, a possibly different behaviour of capital-constrained banks and heterogeneity in bank risk. However, they do not shed light on the actual mechanism at work. As discussed in Section 2, one possible channel, still relatively unexplored, is the reduction in the profitability of traditional intermediation activity. If this is the case, we should observe a lower sensitivity of lending to changes in interest rates for those banks most vulnerable to such a reduction.
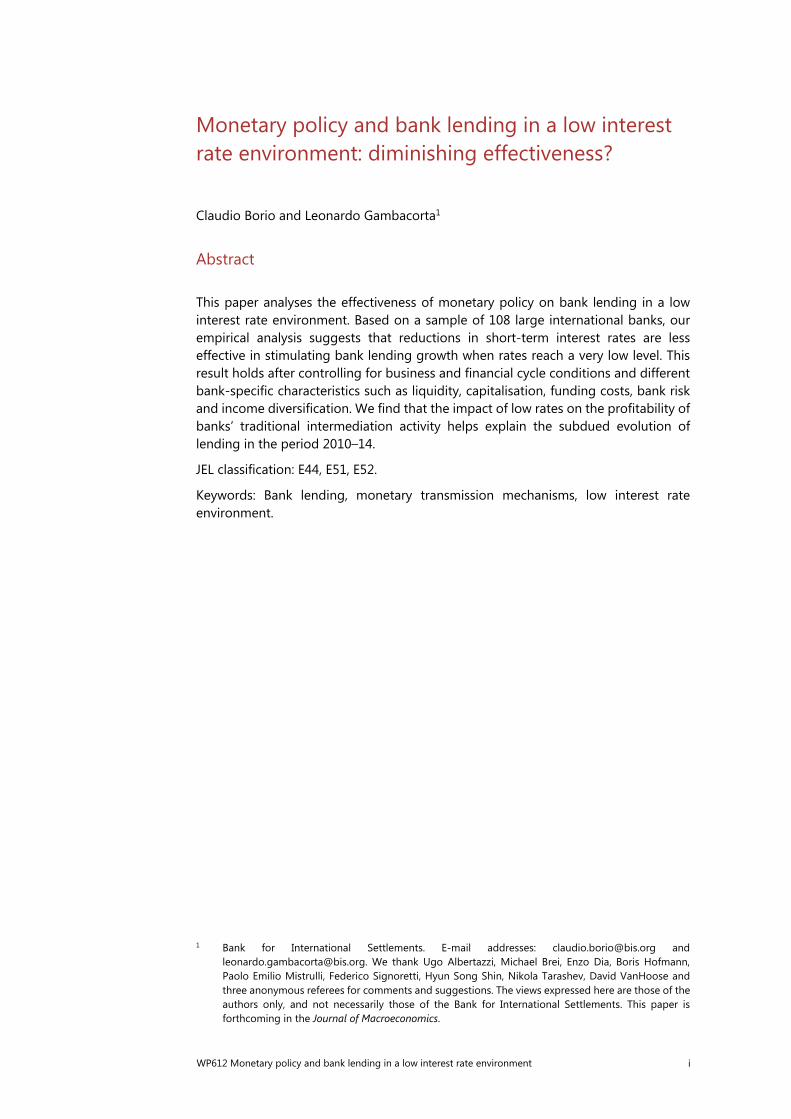
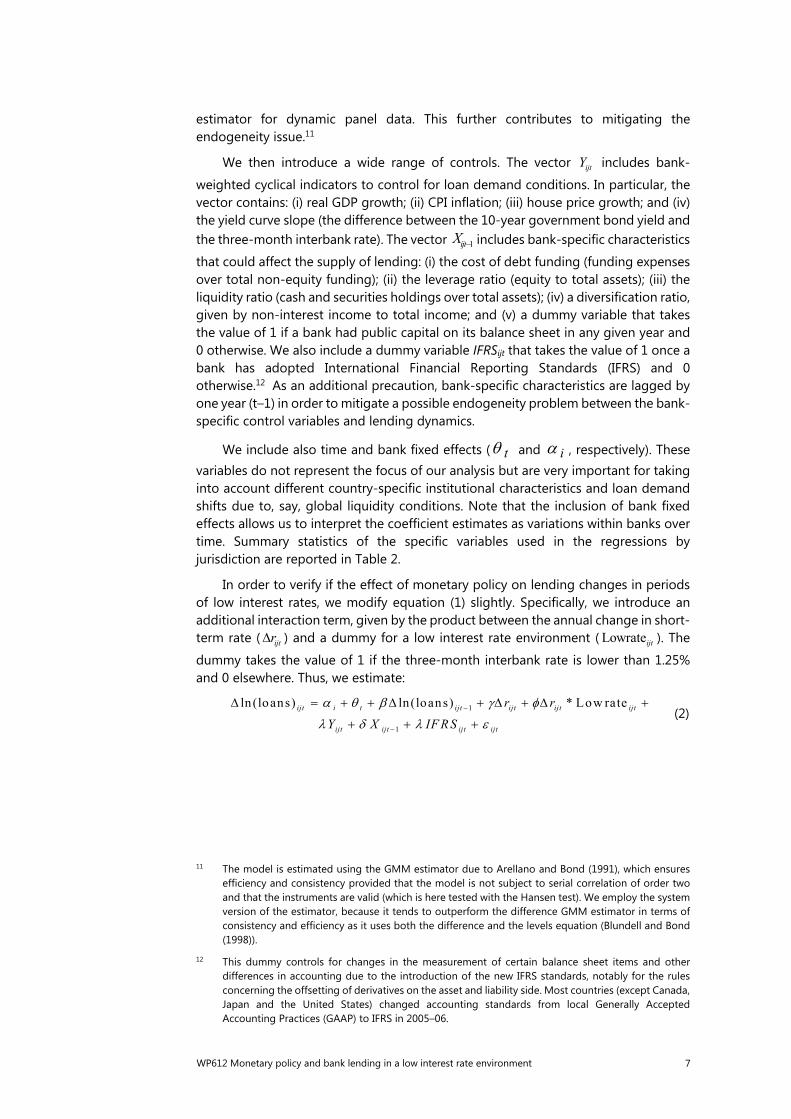
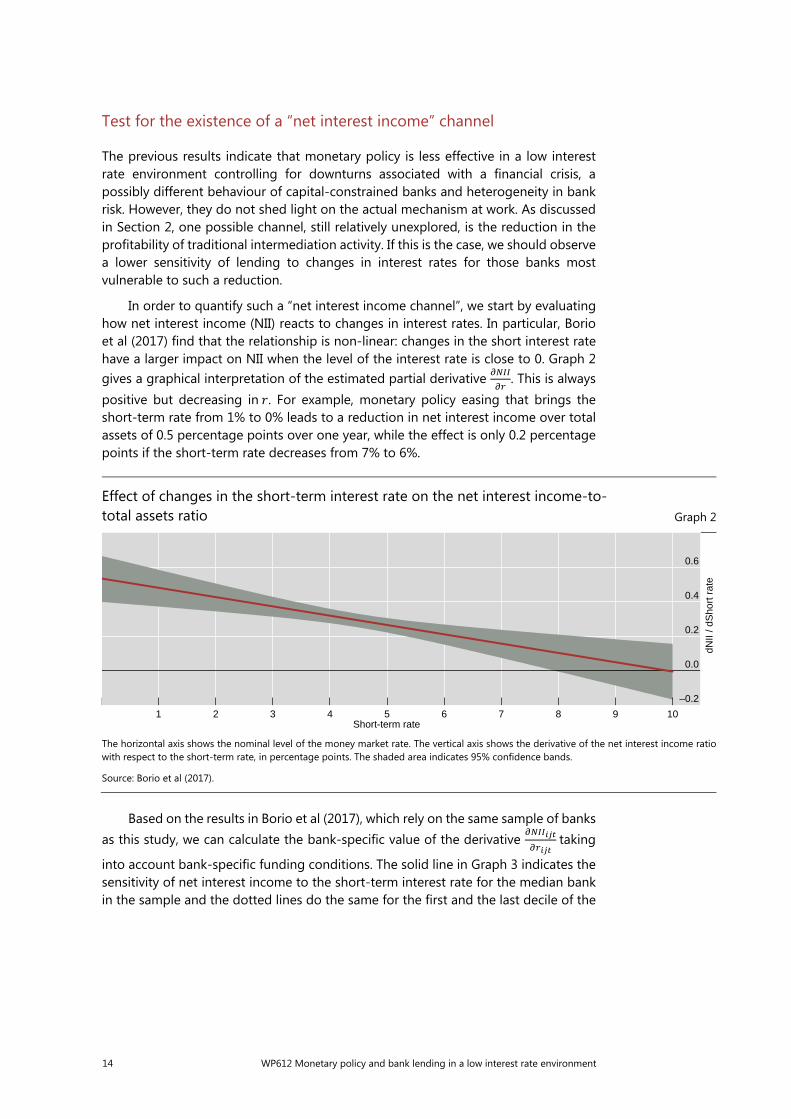
In order to quantify such a “net interest income channel”, we start by evaluating how net interest income (NII) reacts to changes in interest rates. In particular, Borio et al (2017) find that the relationship is non-linear: changes in the short interest rate have a larger impact on NII when the level of the interest rate is close to 0. Graph 2 gives a graphical interpretation of the estimated partial derivative . This is always positive but decreasing in . For example, monetary policy easing that brings the short-term rate from 1% to 0% leads to a reduction in net interest income over total assets of 0.5 percentage points over one year, while the effect is only 0.2 percentage points if the short-term rate decreases from 7% to 6%.
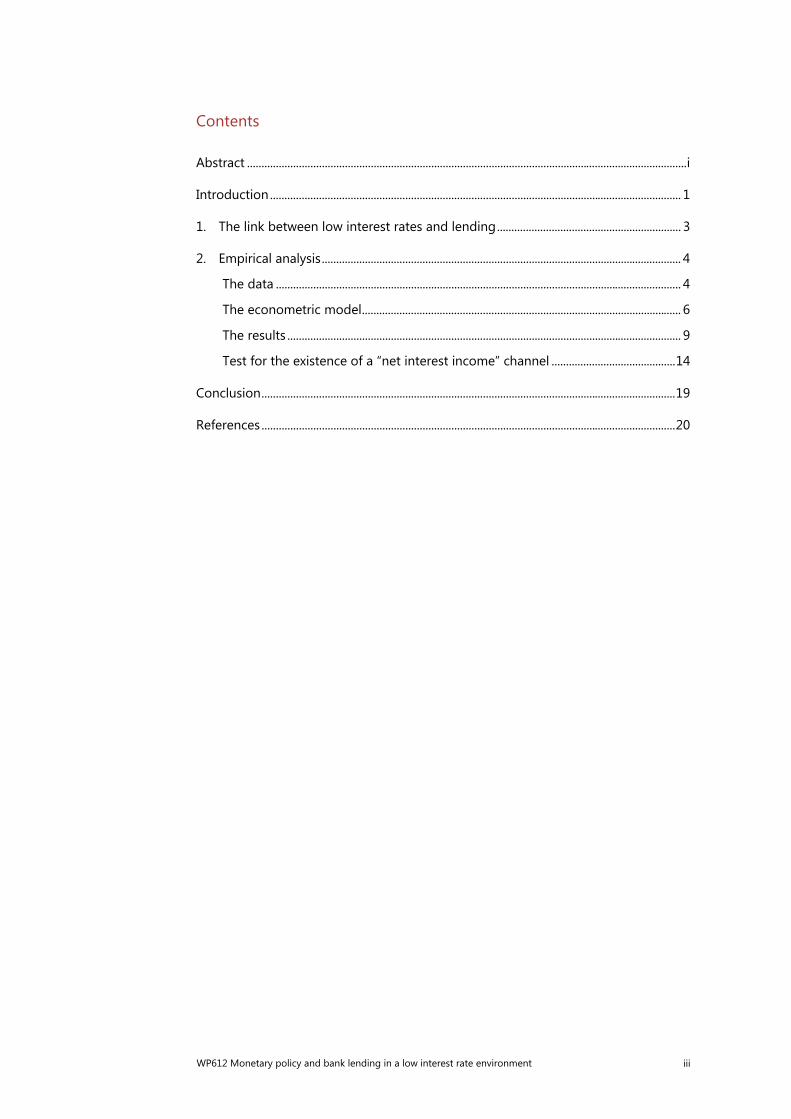
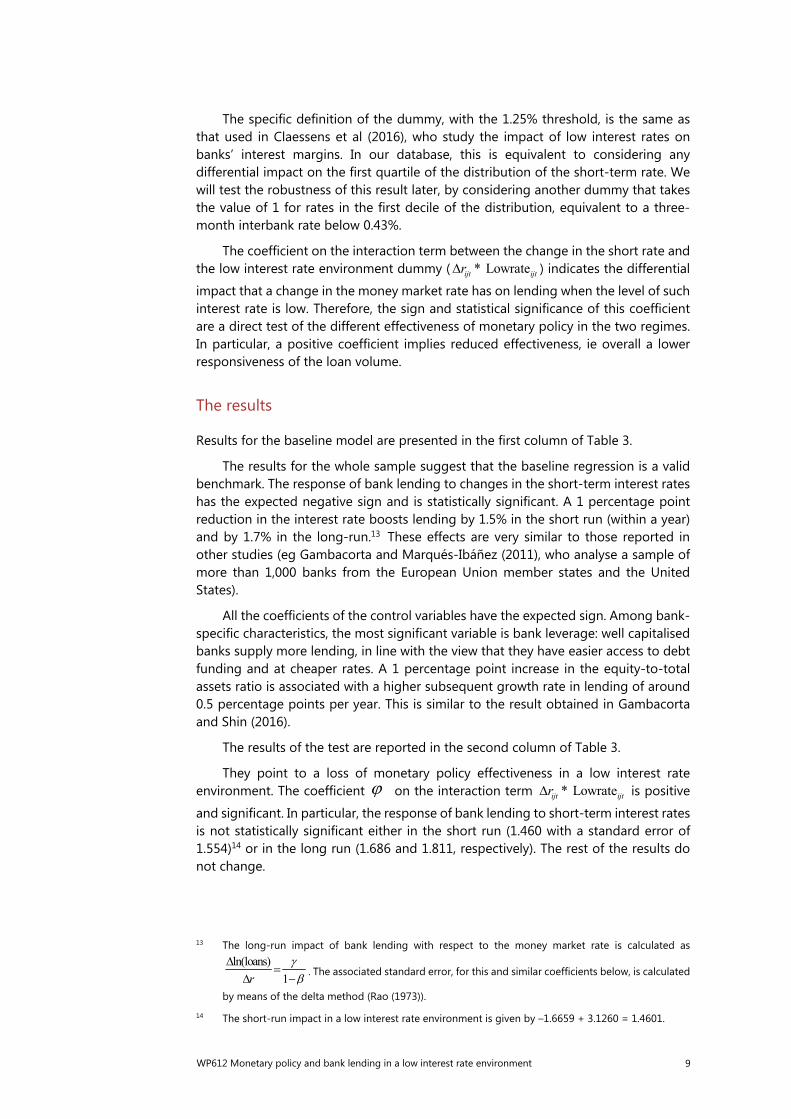
Based on the results in Borio et al (2017), which rely on the same sample of banks as this study, we can calculate the bank-specific value of the derivative taking
into account bank-specific funding conditions. The solid line in Graph 3 indicates the sensitivity of net interest income to the short-term interest rate for the median bank in the sample and the dotted lines do the same for the first and the last decile of the
Effect of changes in the short-term interest rate on the net interest income-to- total assets ratio Graph 2
The horizontal axis shows the nominal level of the money market rate. The vertical axis shows the derivative of the net interest income ratiowith respect to the short-term rate, in percentage points. The shaded area indicates 95% confidence bands.
Source: Borio et al (2017).
–0.2
0.0
0.2
0.4
0.6
1 2 3 4 5 6 7 8 9 10Short-term rate
dNII
/ dS
hort
rat
e

WP612 Monetary policy and bank lending in a low interest rate environment 15
distribution, respectively. As expected, the sensitivity increases in the last part of the sample, given the lower interest rate environment.22
To evaluate the overall impact of changes in monetary policy on the NII, we can now multiply the bank-specific derivative by the bank-specific change in the
interest rate ijtr and the lagged value of the or
∗ ijtr ∗
To test for the existence of an “NII channel”, we can then add such a triple interaction to equation (4) and estimate the following model:
1
ijt1 1
ijt
ln(loans) ln(loans) * Lowrate * Crisis
* LowCap [ * * ]
ijt i t ijt ijt ijt ijt ijt jt
NIIijt ijt ijt ijt ijt ijt ijt ijt
r
r r r
r r NII Y X IFRS
(5)
where the coefficient tests directly the effectiveness of monetary policy on bank lending as a function of its impact on NII. For example, the long-run impact of monetary policy on lending for a bank that is not capital-constrained is given by:
22 Borio et al (2017), who rely on the same sample of banks as this study, document that the negative
effects on net interest income caused by a reduction in interest rates dominate other positive effects on non-interest income and provisions. Moreover, the relationship between bank’s return-on-assets (ROA) and the money market rate is concave (as in the case of the net interest margin). For example, a monetary policy easing that lowers the short-term rate from 1% to 0% reduces the ROA by 0.4 percentage points over one year, while the effect is only –0.15 percentage points if the short-term rate decreases from 7% to 6%.
Sensitivity of the net interest margin to the short-term interest rate (NIM/r)1 Graph 3
1 The solid line indicates the sensitivity of net interest income to the short-term interest rate (NIM/r) for the median bank in the sample. The calculation is based on the non-linear model developed in Borio et al (2017), where the derivative increases as interest rates decline. Theobserved sensitivity thus increases in the last part of the sample as interest rates fall. The dotted lines correspond to the first and the lastdecile of the distribution.
Sources: Authors’ calculations based on Borio et al (2017).
0.0
0.1
0.2
0.3
0.4
0.5
1996 1998 2000 2002 2004 2006 2008 2010 2012 2014
p10 Median p90
16 WP612 Monetary policy and bank lending in a low interest rate environment
1
Lowrate*]*[ ln(loans) 1
ijt
ijtijtijt
r
NII
ijt
ijtNII
r
This includes also the additional effect due to a low interest rate environment L o w ra te 1i j t .
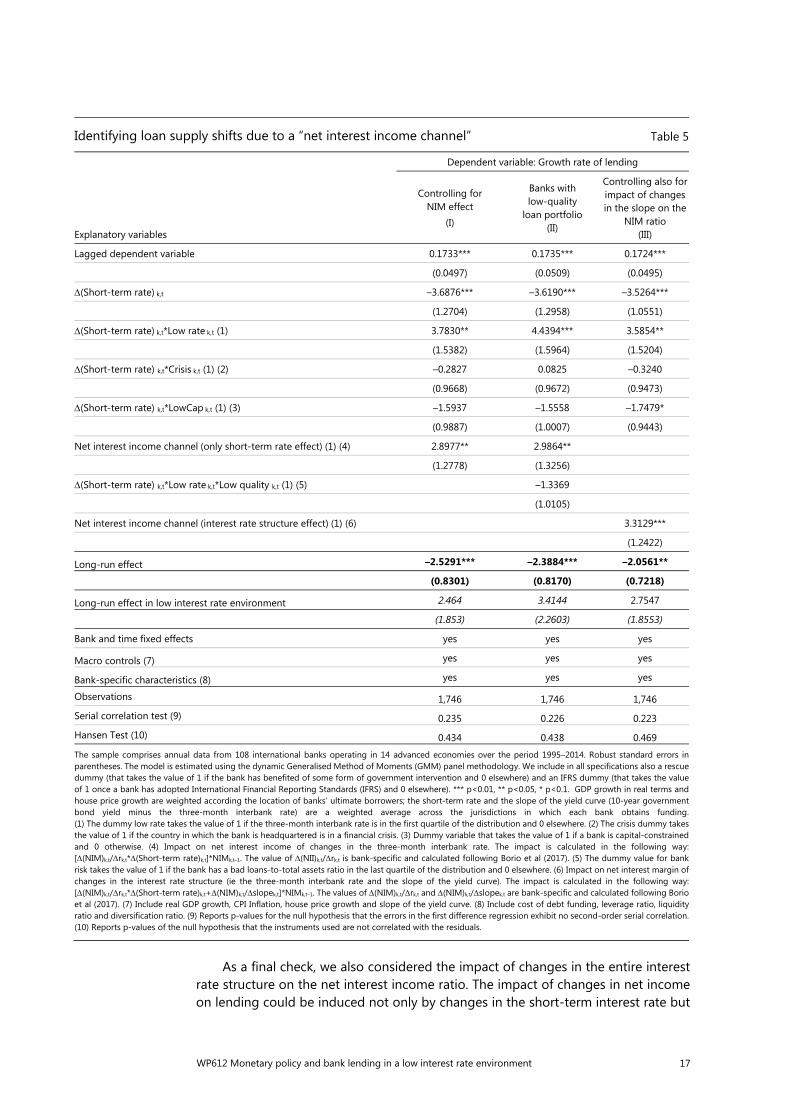
As reported in the first column of Table 5, the coefficient on the triple interaction term is positive and significant, indicating that lending by banks with a larger NII channel is less responsive to reductions in interest rates. Other results remain unchanged.
The exact quantification of the long-run impact is now complicated by the fact
that the derivative ln(loans) ijt
ijtr
is a function of the term ]*[ 1
ijt
ijt
ijt
r
NII NII , which
varies across banks and over time. However, from Graph 2 we see that the value of
the derivative ijt
ijt
r
NII
in a low interest rate environment (below 1.25%) is around 0.5
compared with an average effect of 0.3 in the rest of the sample. And for the NII ratio, we can consider, for simplicity, the value of the NII for the median bank in the two subsamples, equal to 1.3 and 1.8, respectively. On this basis, we can then calculate the value of the long-run effects (bottom of Table 5).
The findings confirm the previous results. The response of bank lending to the short-term interest rate is statistically significant only in the case of a normal interest rate environment (the long-run effect is –2.529*** with a standard error of 0.830), while it is not statistically different from 0 in a low interest rate environment (2.464 and 1.853).
As an additional robustness check, we control for heterogeneity in loan quality. During a financial crisis and its aftermath, low interest rates could also induce “evergreening policies”, postponing necessary balance sheet adjustments (Barseghyan (2010)). Given the low cost of forbearance, very low interest rates may disguise underlying credit weakness, encouraging banks to “extend and pretend” and to bet that loans to low-quality borrowers will be repaid. This is an issue for supervisory authorities in particular. Past experience has shown that persistently very low rates can pave the way for an increase in “zombie lending”, ie the rollover of non-viable loans. The experience of Japan in the 1990s is instructive: banks permitted debtors to roll over loans on which they could afford the near-zero interest payments but not repayments of principal (Caballero et al (2008)). This, in turn, reduces the incentives to reallocate resources to areas of more vigorous growth and hence possibly also lower potential output. More recent evidence drawn from credit register data suggests that evergreening practices have taken place during the crisis in Italy (Albertazzi and Marchetti (2010)).
To test for this, we add to equation (6) a triple interaction term given by the product between the annual change in short-term rate ( ijtr ), the dummy Low rate ijt
and a dummy Low quality ijt that takes the value of 1 if a bank’s loan quality ratio (defined as bad loans over total assets) is in the last quartile of the distribution. The results reported in the second column remain qualitatively very similar.
WP612 Monetary policy and bank lending in a low interest rate environment 17
As a final check, we also considered the impact of changes in the entire interest rate structure on the net interest income ratio. The impact of changes in net income on lending could be induced not only by changes in the short-term interest rate but
Identifying loan supply shifts due to a “net interest income channel” Table 5
Explanatory variables
Dependent variable: Growth rate of lending
Controlling for NIM effect
(I)
Banks with low-quality
loan portfolio (II)
Controlling also for impact of changes in the slope on the
NIM ratio (III)
Lagged dependent variable 0.1733*** 0.1735*** 0.1724***
(0.0497) (0.0509) (0.0495)
(Short-term rate) k,t –3.6876*** –3.6190*** –3.5264***
(1.2704) (1.2958) (1.0551)
(Short-term rate) k,t*Low rate k,t (1) 3.7830** 4.4394*** 3.5854**
(1.5382) (1.5964) (1.5204)
(Short-term rate) k,t*Crisis k,t (1) (2) –0.2827 0.0825 –0.3240
(0.9668) (0.9672) (0.9473)
(Short-term rate) k,t*LowCap k,t (1) (3) –1.5937 –1.5558 –1.7479*
(0.9887) (1.0007) (0.9443)
Net interest income channel (only short-term rate effect) (1) (4) 2.8977** 2.9864**
(1.2778) (1.3256)
(Short-term rate) k,t*Low rate k,t*Low quality k,t (1) (5) –1.3369
(1.0105)
Net interest income channel (interest rate structure effect) (1) (6) 3.3129***
(1.2422)
Long-run effect –2.5291*** –2.3884*** –2.0561**
(0.8301) (0.8170) (0.7218)
Long-run effect in low interest rate environment 2.464 3.4144 2.7547
(1.853) (2.2603) (1.8553)
Bank and time fixed effects yes yes yes
Macro controls (7) yes yes yes
Bank-specific characteristics (8) yes yes yes
Observations 1,746 1,746 1,746
Serial correlation test (9) 0.235 0.226 0.223
Hansen Test (10) 0.434 0.438 0.469
The sample comprises annual data from 108 international banks operating in 14 advanced economies over the period 1995–2014. Robust standard errors in parentheses. The model is estimated using the dynamic Generalised Method of Moments (GMM) panel methodology. We include in all specifications also a rescue dummy (that takes the value of 1 if the bank has benefited of some form of government intervention and 0 elsewhere) and an IFRS dummy (that takes the value of 1 once a bank has adopted International Financial Reporting Standards (IFRS) and 0 elsewhere). *** p<0.01, ** p<0.05, * p<0.1. GDP growth in real terms andhouse price growth are weighted according the location of banks’ ultimate borrowers; the short-term rate and the slope of the yield curve (10-year government bond yield minus the three-month interbank rate) are a weighted average across the jurisdictions in which each bank obtains funding.(1) The dummy low rate takes the value of 1 if the three-month interbank rate is in the first quartile of the distribution and 0 elsewhere. (2) The crisis dummy takes the value of 1 if the country in which the bank is headquartered is in a financial crisis. (3) Dummy variable that takes the value of 1 if a bank is capital-constrained and 0 otherwise. (4) Impact on net interest income of changes in the three-month interbank rate. The impact is calculated in the following way: [(NIM)k,t/rk,t*(Short-term rate)k,t]*NIMk,t–1. The value of (NII)k,t/rk,t is bank-specific and calculated following Borio et al (2017). (5) The dummy value for bank risk takes the value of 1 if the bank has a bad loans-to-total assets ratio in the last quartile of the distribution and 0 elsewhere. (6) Impact on net interest margin of changes in the interest rate structure (ie the three-month interbank rate and the slope of the yield curve). The impact is calculated in the following way:[(NIM)k,t/rk,t*(Short-term rate)k,t+(NIM)k,t/slopek,t]*NIMk,t–1. The values of (NIM)k,t/rk,t and (NIM)k,t/slopek,t are bank-specific and calculated following Borio et al (2017). (7) Include real GDP growth, CPI Inflation, house price growth and slope of the yield curve. (8) Include cost of debt funding, leverage ratio, liquidity ratio and diversification ratio. (9) Reports p-values for the null hypothesis that the errors in the first difference regression exhibit no second-order serial correlation. (10) Reports p-values of the null hypothesis that the instruments used are not correlated with the residuals.

18 WP612 Monetary policy and bank lending in a low interest rate environment
also by those in the yield curve slope. As indicated by Borio et al (2017), the impact of the yield curve slope on bank profits is in general also positive and decreasing in the steepness of the slope: a steeper yield curve initially boosts net interest income but the impact declines and tends to become not statistically different from 0 when the slope exceeds 2.5 percentage points. For example, an increase in the slope from –2 percentage points to –1 percentage point boosts the net interest income-to-total assets ratio by 0.2 percentage points over one year, but by only 0.07 percentage points if the slope increases from 1 percentage point to 2 percentage points. To evaluate the overall impact of changes in the interest rate structure on the NII, we have calculated the “net interest income channel” as: [ ∗ ijtr + ∗
ijtslope ] ∗ . Thus, this measure considers the impact of the whole interest
rate structure on net interest income. Also in this case, the results, reported in the third column of Table 5, are qualitatively very similar.
Abstracting from macroeconomic effects, our findings could shed some light on the impact of monetary policy on bank lending post-crisis. Taking our results at face value, we can quantify the impact of the net interest income channel. The blue area in Graph 4 represents the average annual growth rate of nominal lending (excluding interbank) in the period 1995–2014 The red area represents the contribution of the net interest income effect. This has been calculated by multiplying 2.8977 – the coefficient associated with the net interest income variable ( ∗ ijtr ∗ ) in
the first column of Table 5 – by the actual value of the corresponding variable. The black line indicates the average short-term interest rate in the sample.
The graph indicates that the impact of the net interest income on loan growth, on balance, was negative not only in the years of the crisis (2007–09) but also in its aftermath (2010–14). In particular, taken at face value, the results suggest that the net interest income channel explains some one third of the evolution of bank loans in the
Bank lending growth and the net interest income effect
In per cent Graph 4
1 The blue area represents the average annual growth rate of nominal lending (excluding interbank) in the period 1995–2014 The red area represents the contribution of the net interest income effect to the growth rate. This has been calculated by multiplying 2.8977 – the coefficient associated with the net interest income variable ( ∗
ijtr ∗ ) in the first column of Table 5 – by the actual value of the
corresponding variable. The black line indicates the average short-term interest rate in the sample.
Sources: BankScope; authors’ calculations.
–7.5
–5.0
–2.5
0.0
2.5
5.0
7.5
10.0
0
1
2
3
4
5
6
7
1996 1998 2000 2002 2004 2006 2008 2010 2012 2014
Lending growthLhs:
Net interest income effect Short term interest rateRhs:
WP612 Monetary policy and bank lending in a low interest rate environment 19
period 2010–14: lending would have been 1.4% higher had the “net interest income channel” not been at work. The takeaway is that the impact can be material and worth considering.
Conclusion
Our analysis suggests that, at very low interest rates, further reductions in short-term rates may be less effective in boosting lending. This result holds after controlling for business and financial cycle conditions and different bank-specific characteristics, such as liquidity, capitalisation, funding costs, risk and income diversification. Importantly, it does not appear to reflect exclusively the impact of a financial crisis on banks or weakness in loan demand. This indicates that other mechanisms may be at work. We have suggested that a plausible one may be the impact of such low rates on the profitability of banks’ lending business, as low rates sap net interest margins. A simple back-of-the-envelope calculation indicates that the impact can be material.
These results have implications for policy. They point to another possible channel through which monetary policy may become less effective at very low rates, ie to another version of the pushing-on-a-string argument. In this case, the channel operates through the impact of low rates on the profitability of banks’ lending business and hence on their incentive or ability to supply loans.
20 WP612 Monetary policy and bank lending in a low interest rate environment
References
Adrian, T and H S Shin (2010): “Financial intermediaries and monetary economics”, in B Friedman and M Woodford (eds), Handbook of Monetary Economics, 3, Amsterdam: Elsevier.
Albertazzi, U and D Marchetti (2010): “Credit supply, flight to quality and evergreening: an analysis of bank-firm relationships after Lehman”, Bank of Italy, Temi di discussione, no 756.
Altunbas, Y, L Gambacorta and D Marqués (2014): “Does monetary policy affect bank risk?”, International Journal of Central Banking, vol 10, no 1, pp 95–135.
Amador, J and A Nagengast (2015): “The effect of bank shocks on firm-level and aggregate investment”, Bank of Portugal, Working Papers, no 153.
Andrés, J, O Arce and C Thomas (2014): “Structural reforms in a debt overhang”, Bank of Spain, Working Papers, no 1421.
Arellano, M, and S Bond (1991): “Some Tests of Specification for Panel Data: Monte Carlo Evidence and An Application to Employment Equations”, Review of Economic Studies, vol 58, pp. 277-97.
Barseghyan, L (2010): “Non-performing loans, prospective bailouts, and Japan’s slowdown”, Journal of Monetary Economics, vol 47, pp 873–90.
Baumol, W (1959): Business behavior, value and growth, New York: Macmillan.
Barth, J, G Caprio and R Levine (2013): “Bank regulation and supervision in 180 countries from 1999 to 2011”, Journal of Financial Economic Policy, vol 5, no 2, pp 111–219.
Bech, M, L Gambacorta and E Kharroubi (2014): “Monetary policy in a downturn: are financial crises special?”, International Finance, vol 17, no 1, pp 99–119.
Bech, M and A Malkhozov (2016): “How have central banks implemented negative policy rates?”, BIS Quarterly Review, March, pp 31–44.
Blundell, R and S Bond (1998): “Initial conditions and moment restrictions in dynamic panel data models”, Journal of Econometrics, vol 87, no 2, pp 115–43.
Borio, C and M Drehmann (2009): “Assessing the risk of banking crises – revisited”, BIS Quarterly Review, March, pp 29–46.
Borio, C and W Fritz (1995): “The response of short-term bank lending rates to policy rates: a cross-country perspective”, BIS Working Papers, no 27, May.
Borio, C, L Gambacorta and B Hofmann (2017): “The effects of monetary policy on bank profitability”, International Finance, forthcoming. Also available as BIS Working Papers, no 514, October 2015.
Borio, C, E Kharroubi, C Upper and F Zampolli (2016): “Labour reallocation and productivity dynamics: financial causes, real consequences”, BIS Working Papers, no 534, January.
Borio, C and H Zhu (2012): “Capital regulation, risk-taking and monetary policy: a missing link in the transmission mechanism?”, Journal of Financial Stability, vol 8, no 4, pp 236–51.

WP612 Monetary policy and bank lending in a low interest rate environment 21
Brei, M and L Gambacorta (2016): "Are bank capital ratios pro-cyclical? New evidence and perspectives" Economic Policy, vol 31, no 86, pp 357-453.
Brunnermeier, M and Y Koby (2016): “The ‘reversal interest rate’: an effective lower bound on monetary policy”, Princeton, mimeo.
Busch, R and C Memmel (2015): “Banks’ net interest margin and the level of interest rates”, Deutsche Bundesbank, Research Centre, Discussion Papers, no 16.
Caballero, R, T Hoshi and A Kashyap (2008): “Zombie lending and depressed restructuring in Japan”, American Economic Review, vol 98, pp 1943–77.
Claessens, S, N Coleman and M Donnelly (2016): “’Low-for-long’ interest rates and net interest margins of banks in advanced foreign economies”, IFDP Notes, April.
De Long, J and L Summers (1988): “How does macroeconomic policy affect output”, Brooking Papers on Economic Activity, vol 2, pp 433–80.
Deutsche Bank (2013): “Ultra-low interest rate: how Japanese banks have coped”, June.
Deutsche Bundesbank (2015): Financial Stability Review, September.
DeYoung, R and K Roland (2001): “Product mix and earnings volatility at commercial banks: evidence from a degree of leverage model”, Journal of Financial Intermediation, vol 10, pp 54–84.
Driscoll, J and A Kraay (1998): “Consistent covariance matrix estimation with spatially dependent panel data”, Review of Economics and Statistics, vol 80, pp 549–60.
English, W, S van den Heuvel and E Zakrajsek (2012): “Interest rate risk and bank equity valuations”, Board of Governors of the Federal Reserve System, Finance and Economics Discussion Series, 2012–26.
Freixas, X and J-C Rochet (1997): Microeconomics of banking, Cambridge, MIT Press.
Gambacorta, L and S Iannotti (2007): “Are there asymmetries in the response of bank interest rates to monetary shocks?”, Applied Economics, vol 39, no 19, pp 2503–17.
Gambacorta, L and D Marqués-Ibáñez (2011): “The bank lending channel: lessons from the crisis”, Economic Policy, April.
Gambacorta, L and C Rossi (2010): “Modelling bank lending in the euro area: a nonlinear approach”, Applied Financial Economics, vol 20, pp 1099–112.
Gambacorta, L and H S Shin (2016): “Why bank capital matters for monetary policy”, BIS Working Papers, no 588, October.
Genay, H and R Podjasek (2014): “What is the impact of a low interest rate environment on bank profitability?”, Chicago Fed Letter, no 324, July.
Giannone, D, M Lenza, H Pill, and L Reichlin (2012): “The ECB and the interbank market”, Economic Journal, vol 122, November, pp 467–486.
Goodhart, C and D Schoenmaker (2009): “Fiscal burden sharing in cross-border banking crises”, International Journal of Central Banking, vol 5, no 1, pp 141–65.
Hannan, T and A Berger (1991): “The rigidity of prices: evidence from banking industry”, American Economic Review, vol 81, no 4, pp 938–45.
Hutchison, D (1995): “Retail bank deposit pricing: an intertemporal asset pricing approach”, Journal of Money Credit and Banking, vol 27, no 1, pp 217–31.
22 WP612 Monetary policy and bank lending in a low interest rate environment
Ioannidou, V, S Ongena and J Peydró (2015): “Monetary policy, risk-taking, and pricing: evidence from a quasi-natural experiment”, Review of Finance, vol 19, no 1, pp 95–144.
Jiménez, G, S Ongena, J Peydró and J Saurina (2014): “Hazardous times for monetary policy: what do twenty-three million bank loans say about the effects of monetary policy on credit risk-taking?”, Econometrica, vol 82, no 2, pp 463–505.
Karras, G (1996): “Why are the effects of money supply shocks asymmetric? Convex aggregate supply or ‘pushing on a string’?”, Journal of Macroeconomics, vol 18, pp 605–19.
Laeven, L and F Valencia (2012): “Systemic banking crises: an update”, IMF Working Papers, no 163.
Lenza, M, H Pill, and L Reichlin (2010): “Monetary policy in exceptional times”, Economic Policy, vol 62, pp 295–339.
Longford, N (2010): “Small sample inference about variance and its transformations”, SORT, 34.
McCauley, R, P McGuire and G von Peter (2012): “After the global financial crisis: from international to multinational banking?”, Journal of Economics and Business, vol 64, no 1, pp 7–23.
McGuire, P and G von Peter (2009): “The US dollar shortage in global banking and the international policy response”, BIS Working Papers, no 291, October.
Neumark, D and S Sharpe (1992): “Market structure and the nature of price rigidity: evidence from the market for consumer deposits”, Quarterly Journal of Economics, vol 107, no 2, pp 657–80.
Rao, C (1973): Linear statistical inference and its applications, second edition, Wiley, New York.
Reinhart, C and K Rogoff (2009): This time is different: eight centuries of financial folly, Princeton University Press.
Rosen, R (2002): “What goes up must come down? Asymmetries and persistence in bank deposit rates”, Journal of Financial Service Research, vol 21, no 3, pp 173–93.
Rostagno, M, U Bindseil, A Kamps, W Lemke, T Sugo and T Vlassopoulos (2016): “Breaking through the zero line: the ECB’s negative interest rate policy”, Brookings Institution, Washington DC, 6 June.
Stiglitz J (2008): A leadership deficit lies at the heart of the financial storm, The Guardian, April 8, https://www.theguardian.com/business/2008/apr/08/useconomy .globaleconomy.
Turk R A (2016): “Negative Interest Rates: How Big a Challenge for Large Danish and Swedish Banks?”, IMF Working Papers, no 198.
WP612 Monetary policy and bank lending in a low interest rate environment 23
Annex A: Using the overnight rate instead of the three-month interbank rate
Explanatory variables
Dependent variable: Growth rate of lending
Baseline model(I)
Low interest rate environment
(II)
Global Financial Crisis (III)
Capital- constrained banks
(IV)
Different low rate dummy definition
(VI)
Lagged dependent variable 0.1234** 0.1361** 0.1363** 0.1449*** 0.1344**
(0.0548) (0.0545) (0.0536) (0.0543) (0.0556)
(Short-term rate) k,t –1.3116** –1.5745** –1.5173*** –1.3233** –1.1949**
(0.6095) (0.6241) (0.5710) (0.5803) (0.6022)
(Short-term rate) k,t*Low rate k,t (1) 2.7908** 2.9789* 2.9843* 1.9737
(1.3967) (1.7109) (1.7163) (1.3459)
(Short-term rate) k,t*Crisis k,t (1) (2) –0.1979 –0.1498 1.4629
(1.0557) (1.0376) (1.0423)
(Short-term rate) k,t*LowCap k,t (1) (3) –1.7018* –1.6891*
(0.8979) (0.9496)
Real GDP growth k,t 0.6376* 0.4103 0.4000 0.5061 0.6818**
(0.3779) (0.3475) (0.3454) (0.3418) (0.3479)
CPI inflation k,t –0.5313 –0.3832 –0.3990 –0.3681 –0.4544
(0.4262) (0.4084) (0.4067) (0.4019) (0.4188)
House price growth k,t 0.2649** 0.2414** 0.2459** 0.2346** 0.2201**
(0.1093) (0.1094) (0.1080) (0.1082) (0.1113)
Slope of the yield curve k,t –0.5054 –0.4729 –0.4789 –0.3792 –0.0601
(0.5406) (0.5491) (0.5492) (0.5688) (0.5611)
Cost of debt funding k,t–1 –0.4539 –0.5629 –0.5523 –0.5248 –0.3537
(0.5115) (0.4919) (0.4903) (0.4990) (0.5193)
Leverage ratio k,t–1 0.4763*** 0.4330*** 0.4338*** 0.4254*** 0.4807***
(0.1625) (0.1642) (0.1636) (0.1591) (0.1631)
Liquidity ratio k,t–1 0.0281 0.0262 0.0267 0.0237 0.0279
(0.0612) (0.0609) (0.0615) (0.0621) (0.0618)
Diversification ratio k,t–1 –0.0549 –0.0535 –0.0535 –0.0510 –0.0547
(0.0479) (0.0474) (0.0481) (0.0493) (0.0487)
Long-run effect –1.4963** –1.8225*** –1.7566*** –1.5475** –1.3804**
(0.6877) (0.6993) (0.6621) (0.6767) (0.6920)
Long-run effect in low interest rate environment 1.4079 1.6922 1.9424 0.8997
(1.5650 (1.9893) (2.0134) (1.6934)
Bank and time fixed effects yes yes yes yes yes
Observations 1,746 1,746 1,746 1,746 1,746
Serial correlation test (4) 0.413 0.323 0.321 0.299 0..311
Hansen Test (5) 0.262 0.259 0.259 0.275 0.252
The sample comprises annual data from 108 international banks operating in 14 advanced economies over the period 1995–2014. Robust standard errors in parentheses. The model is estimated using the dynamic Generalised Method of Moments (GMM) panel methodology. We include in all specifications also a rescue dummy (that takes the value of 1 if the bank has benefited of some form of government intervention and 0 elsewhere) and an IFRS dummy (that takes the value of 1 once a bank has adopted International Financial Reporting Standards (IFRS) and 0 elsewhere). *** p<0.01, ** p<0.05, * p<0.1. GDP growth in real terms and house price growth are weighted according to the location of banks’ ultimate borrowers; the short-term rate and the slope of the yield curve (10-year government bond yield minus the three-month interbank rate) are a weighted average across the jurisdictions in which each bank obtains funding. (1) The dummy low rate takes the value of 1 if the overnight rate is in the first quartile of the distribution and 0 elsewhere. (2) The crisis dummy takes the value of 1 if the country in which the bank is headquartered is in a financial crisis.
(3) Dummy variable that takes the value of 1 if a bank is capital-constrained and 0 otherwise. (4) Reports p-values for the null hypothesis that the errors in the first difference regression exhibit no second-order serial correlation. (5) Reports p-values of the null hypothesis that the instruments used are not correlated with the residuals.
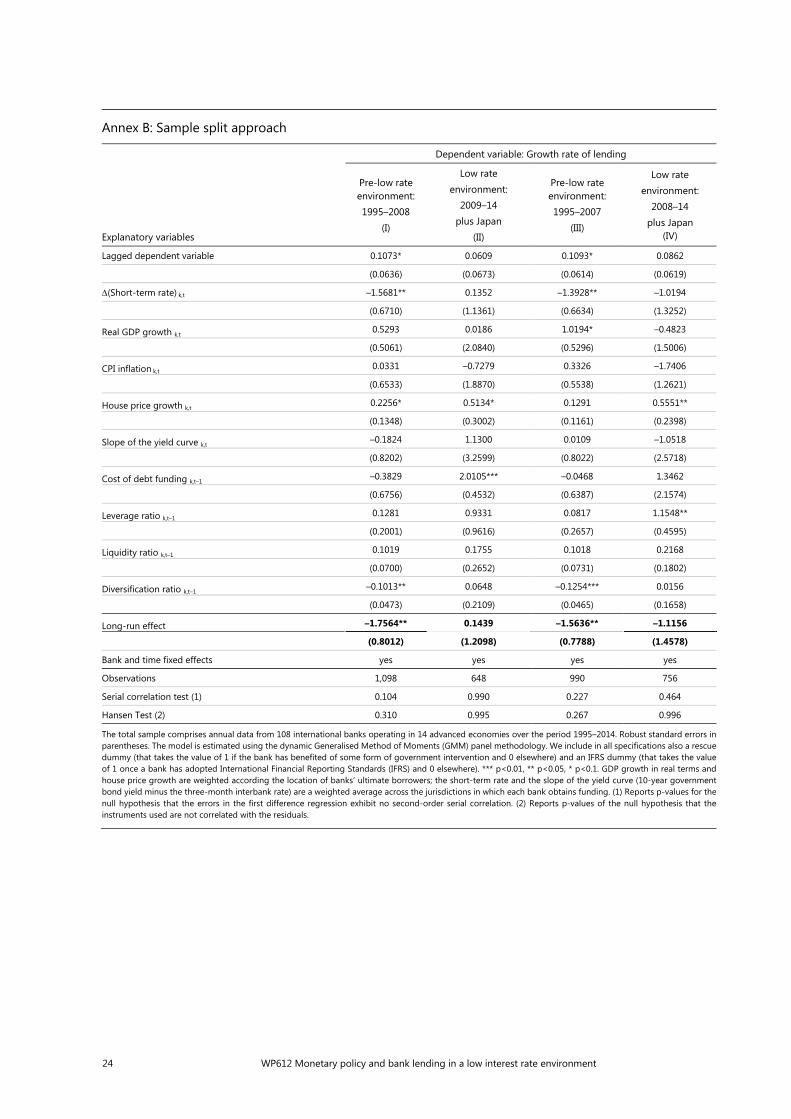
24 WP612 Monetary policy and bank lending in a low interest rate environment
Annex B: Sample split approach
Explanatory variables
Dependent variable: Growth rate of lending
Pre-low rate environment: 1995–2008
(I)
Low rate environment:
2009–14 plus Japan
(II)
Pre-low rate environment: 1995–2007
(III)
Low rate environment:
2008–14 plus Japan
(IV)
Lagged dependent variable 0.1073* 0.0609 0.1093* 0.0862
(0.0636) (0.0673) (0.0614) (0.0619)
(Short-term rate) k,t –1.5681** 0.1352 –1.3928** –1.0194
(0.6710) (1.1361) (0.6634) (1.3252)
Real GDP growth k,t 0.5293 0.0186 1.0194* –0.4823
(0.5061) (2.0840) (0.5296) (1.5006)
CPI inflation k,t 0.0331 –0.7279 0.3326 –1.7406
(0.6533) (1.8870) (0.5538) (1.2621)
House price growth k,t 0.2256* 0.5134* 0.1291 0.5551**
(0.1348) (0.3002) (0.1161) (0.2398)
Slope of the yield curve k,t –0.1824 1.1300 0.0109 –1.0518
(0.8202) (3.2599) (0.8022) (2.5718)
Cost of debt funding k,t–1 –0.3829 2.0105*** –0.0468 1.3462
(0.6756) (0.4532) (0.6387) (2.1574)
Leverage ratio k,t–1 0.1281 0.9331 0.0817 1.1548**
(0.2001) (0.9616) (0.2657) (0.4595)
Liquidity ratio k,t–1 0.1019 0.1755 0.1018 0.2168
(0.0700) (0.2652) (0.0731) (0.1802)
Diversification ratio k,t–1 –0.1013** 0.0648 –0.1254*** 0.0156
(0.0473) (0.2109) (0.0465) (0.1658)
Long-run effect –1.7564** 0.1439 –1.5636** –1.1156
(0.8012) (1.2098) (0.7788) (1.4578)
Bank and time fixed effects yes yes yes yes
Observations 1,098 648 990 756
Serial correlation test (1) 0.104 0.990 0.227 0.464
Hansen Test (2) 0.310 0.995 0.267 0.996
The total sample comprises annual data from 108 international banks operating in 14 advanced economies over the period 1995–2014. Robust standard errors in parentheses. The model is estimated using the dynamic Generalised Method of Moments (GMM) panel methodology. We include in all specifications also a rescue dummy (that takes the value of 1 if the bank has benefited of some form of government intervention and 0 elsewhere) and an IFRS dummy (that takes the value of 1 once a bank has adopted International Financial Reporting Standards (IFRS) and 0 elsewhere). *** p<0.01, ** p<0.05, * p<0.1. GDP growth in real terms andhouse price growth are weighted according the location of banks’ ultimate borrowers; the short-term rate and the slope of the yield curve (10-year government bond yield minus the three-month interbank rate) are a weighted average across the jurisdictions in which each bank obtains funding. (1) Reports p-values for the null hypothesis that the errors in the first difference regression exhibit no second-order serial correlation. (2) Reports p-values of the null hypothesis that the instruments used are not correlated with the residuals.
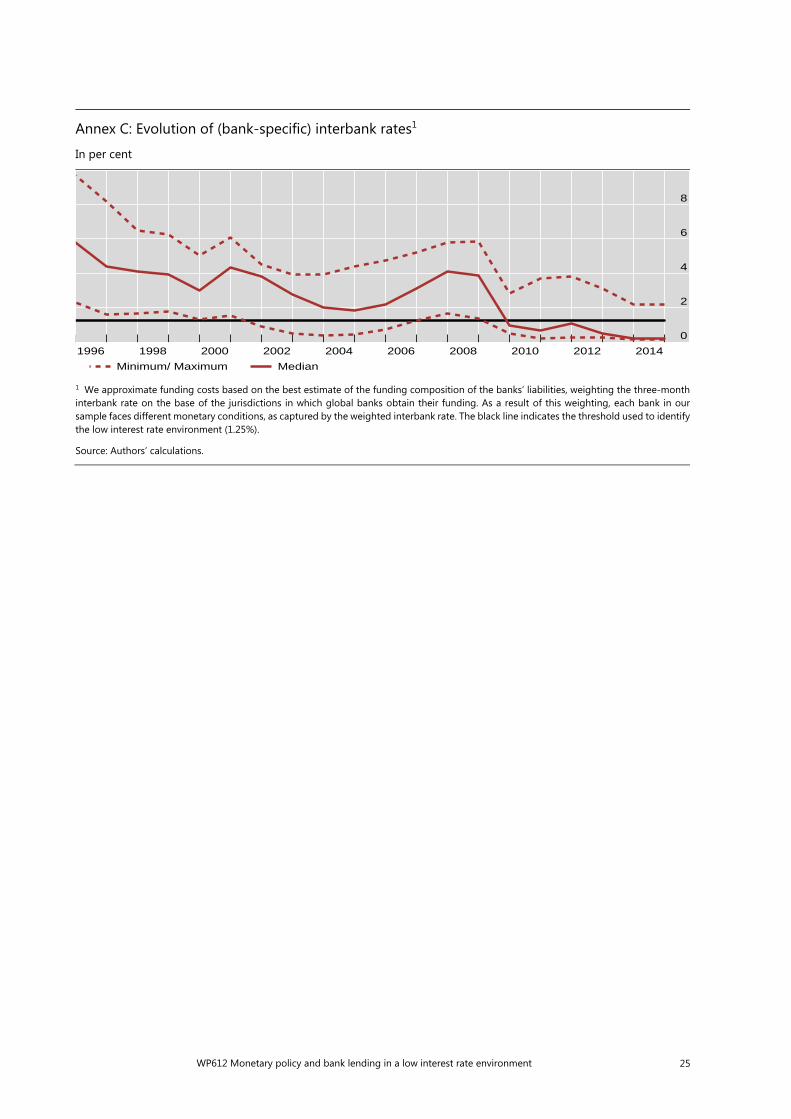
WP612 Monetary policy and bank lending in a low interest rate environment 25
Annex C: Evolution of (bank-specific) interbank rates1
In per cent
1 We approximate funding costs based on the best estimate of the funding composition of the banks’ liabilities, weighting the three-month interbank rate on the base of the jurisdictions in which global banks obtain their funding. As a result of this weighting, each bank in our sample faces different monetary conditions, as captured by the weighted interbank rate. The black line indicates the threshold used to identifythe low interest rate environment (1.25%).
Source: Authors’ calculations.
0
2
4
6
8
1996 1998 2000 2002 2004 2006 2008 2010 2012 2014
Minimum/ Maximum Median
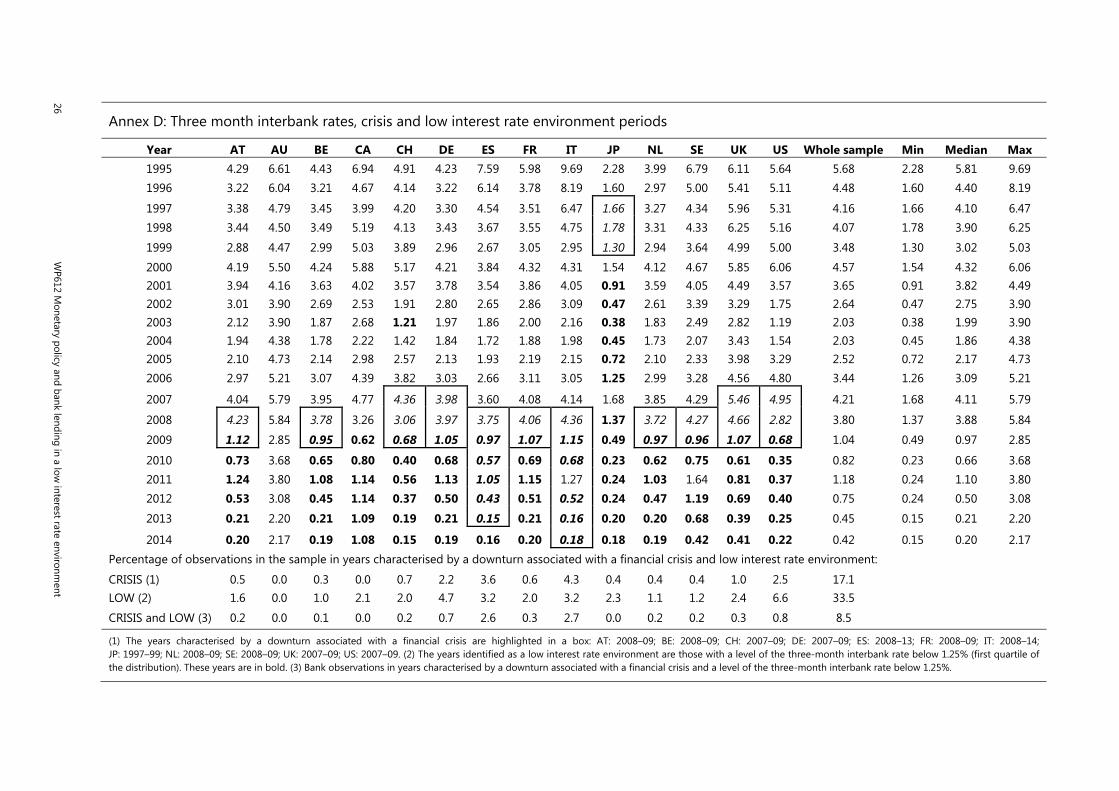
26 W
P612 Monetary policy and bank lending in a low
interest rate environment
Annex D: Three month interbank rates, crisis and low interest rate environment periods
Year AT AU BE CA CH DE ES FR IT JP NL SE UK US Whole sample Min Median Max 1995 4.29 6.61 4.43 6.94 4.91 4.23 7.59 5.98 9.69 2.28 3.99 6.79 6.11 5.64 5.68 2.28 5.81 9.69 1996 3.22 6.04 3.21 4.67 4.14 3.22 6.14 3.78 8.19 1.60 2.97 5.00 5.41 5.11 4.48 1.60 4.40 8.19
1997 3.38 4.79 3.45 3.99 4.20 3.30 4.54 3.51 6.47 1.66 3.27 4.34 5.96 5.31 4.16 1.66 4.10 6.47 1998 3.44 4.50 3.49 5.19 4.13 3.43 3.67 3.55 4.75 1.78 3.31 4.33 6.25 5.16 4.07 1.78 3.90 6.25
1999 2.88 4.47 2.99 5.03 3.89 2.96 2.67 3.05 2.95 1.30 2.94 3.64 4.99 5.00 3.48 1.30 3.02 5.03
2000 4.19 5.50 4.24 5.88 5.17 4.21 3.84 4.32 4.31 1.54 4.12 4.67 5.85 6.06 4.57 1.54 4.32 6.06 2001 3.94 4.16 3.63 4.02 3.57 3.78 3.54 3.86 4.05 0.91 3.59 4.05 4.49 3.57 3.65 0.91 3.82 4.49 2002 3.01 3.90 2.69 2.53 1.91 2.80 2.65 2.86 3.09 0.47 2.61 3.39 3.29 1.75 2.64 0.47 2.75 3.90 2003 2.12 3.90 1.87 2.68 1.21 1.97 1.86 2.00 2.16 0.38 1.83 2.49 2.82 1.19 2.03 0.38 1.99 3.90 2004 1.94 4.38 1.78 2.22 1.42 1.84 1.72 1.88 1.98 0.45 1.73 2.07 3.43 1.54 2.03 0.45 1.86 4.38 2005 2.10 4.73 2.14 2.98 2.57 2.13 1.93 2.19 2.15 0.72 2.10 2.33 3.98 3.29 2.52 0.72 2.17 4.73 2006 2.97 5.21 3.07 4.39 3.82 3.03 2.66 3.11 3.05 1.25 2.99 3.28 4.56 4.80 3.44 1.26 3.09 5.21
2007 4.04 5.79 3.95 4.77 4.36 3.98 3.60 4.08 4.14 1.68 3.85 4.29 5.46 4.95 4.21 1.68 4.11 5.79
2008 4.23 5.84 3.78 3.26 3.06 3.97 3.75 4.06 4.36 1.37 3.72 4.27 4.66 2.82 3.80 1.37 3.88 5.84
2009 1.12 2.85 0.95 0.62 0.68 1.05 0.97 1.07 1.15 0.49 0.97 0.96 1.07 0.68 1.04 0.49 0.97 2.85
2010 0.73 3.68 0.65 0.80 0.40 0.68 0.57 0.69 0.68 0.23 0.62 0.75 0.61 0.35 0.82 0.23 0.66 3.68 2011 1.24 3.80 1.08 1.14 0.56 1.13 1.05 1.15 1.27 0.24 1.03 1.64 0.81 0.37 1.18 0.24 1.10 3.80 2012 0.53 3.08 0.45 1.14 0.37 0.50 0.43 0.51 0.52 0.24 0.47 1.19 0.69 0.40 0.75 0.24 0.50 3.08
2013 0.21 2.20 0.21 1.09 0.19 0.21 0.15 0.21 0.16 0.20 0.20 0.68 0.39 0.25 0.45 0.15 0.21 2.20
2014 0.20 2.17 0.19 1.08 0.15 0.19 0.16 0.20 0.18 0.18 0.19 0.42 0.41 0.22 0.42 0.15 0.20 2.17 Percentage of observations in the sample in years characterised by a downturn associated with a financial crisis and low interest rate environment:
CRISIS (1) 0.5 0.0 0.3 0.0 0.7 2.2 3.6 0.6 4.3 0.4 0.4 0.4 1.0 2.5 17.1 LOW (2) 1.6 0.0 1.0 2.1 2.0 4.7 3.2 2.0 3.2 2.3 1.1 1.2 2.4 6.6 33.5 CRISIS and LOW (3) 0.2 0.0 0.1 0.0 0.2 0.7 2.6 0.3 2.7 0.0 0.2 0.2 0.3 0.8 8.5 (1) The years characterised by a downturn associated with a financial crisis are highlighted in a box: AT: 2008–09; BE: 2008–09; CH: 2007–09; DE: 2007–09; ES: 2008–13; FR: 2008–09; IT: 2008–14; JP: 1997–99; NL: 2008–09; SE: 2008–09; UK: 2007–09; US: 2007–09. (2) The years identified as a low interest rate environment are those with a level of the three-month interbank rate below 1.25% (first quartile of the distribution). These years are in bold. (3) Bank observations in years characterised by a downturn associated with a financial crisis and a level of the three-month interbank rate below 1.25%.
WP612 Monetary policy and bank lending in a low interest rate environment 27
Previous volumes in this series
No Title Author
611 February 2017
The effects of tax on bank liability structure Leonardo Gambacorta, Giacomo Ricotti, Suresh Sundaresan and Zhenyu Wang
610 February 2017
Global impact of US and euro area unconventional monetary policies: a comparison
Qianying Chen, Marco Lombardi, Alex Ross and Feng Zhu
609 February 2017
Revisiting the commodity curse: a financial perspective
Enrique Alberola and Gianluca Benigno
608 January 2017
Redemption risk and cash hoarding by asset managers
Stephen Morris, Ilhyock Shim and Hyun Song Shin
607 January 2017
The real effects of household debt in the short and long run
Marco Lombardi, Madhusudan Mohanty and Ilhyock Shim
606 January 2017
Market volatility, monetary policy and the term premium
Sushanta K Mallick, M S Mohanty and Fabrizio Zampolli
605 January 2017
Wage and price setting: new evidence from Uruguayan firms
Fernando Borraz, Gerardo Licandro and Daniela Sola
604 January 2017
Endogenous wage indexation and aggregate shocks
Julio A Carrillo, Gert Peersman and Joris Wauters
603 January 2017
Multiplex interbank networks and systemic importance – An application to European data
Iñaki Aldasoro, Iván Alves
602 January 2017
The globalisation of inflation: the growing importance of global value chains
Raphael Auer, Claudio Borio and Andrew Filardo
601 January 2017
Asymmetric information and the securitization of SME loans
Ugo Albertazzi, Margherita Bottero, Leonardo Gambacorta and Steven Ongena
600 December 2016
The currency dimension of the bank lending channel in international monetary transmission
Előd Takáts and Judit Temesvary
599 December 2016
Banking Industry Dynamics and Size-Dependent Capital Regulation
Tirupam Goel
598 December 2016
Did the founding of the Federal Reserve affect the vulnerability of the interbank system to contagion risk?
Mark Carlson and David C Wheelock
597 December 2016
Bank Networks: Contagion, Systemic Risk and Prudential Policy
Iñaki Aldasoro, Domenico Delli Gatti, Ester Faia
596 December 2016
Macroeconomics of bank capital and liquidity regulations
Frédéric Boissay and Fabrice Collard
595 December 2016
Bank lending and loan quality: the case of India
Pallavi Chavan and Leonardo Gambacorta
All volumes are available on our website www.bis.org.
Related Documents


