BIS Quarterly Review June 2012 International banking and financial market developments

Welcome message from author
This document is posted to help you gain knowledge. Please leave a comment to let me know what you think about it! Share it to your friends and learn new things together.
Transcript
BIS Quarterly Review June 2012
International banking and financial market developments

BIS Quarterly Review Monetary and Economic Department Editorial Committee:
Claudio Borio Dietrich Domanski Christian Upper Stephen Cecchetti Philip Turner General queries concerning this commentary should be addressed to Christian Upper (tel +41 61 280 8416, e-mail: [email protected]), queries concerning specific parts to the authors, whose details appear at the head of each section, and queries concerning the statistics to Philip Wooldridge (tel +41 61 280 8006, e-mail: [email protected]).
This publication is available on the BIS website (www.bis.org).
© Bank for International Settlements 2012. All rights reserved. Brief excerpts may be reproduced or translated provided the source is cited.
ISSN 1683-0121 (print)
ISSN 1683-013X (online)

BIS Quarterly Review, June 2012 iii
BIS Quarterly Review
June 2012
International banking and financial market developments
Optimism evaporates ......................................................................................... 1 Short-lived optimism about the recovery ............................................... 1 Euro area uncertainties return .............................................................. 5 Emerging market inflows weaken as growth moderates ........................ 8
Highlights of the BIS international statistics ....................................................... 11 The international banking market in the fourth quarter of 2011 ............. 12 Box 1: International debt security issuance in the first quarter
of 2012 ...................................................................................... 20 Over-the-counter derivatives in the second half of 2011 ....................... 21 Box 2: Uncovered counterparty exposures in global OTC derivatives
markets ..................................................................................... 23
Special features
Countercyclical policies in emerging markets ..................................................... 25 Előd Takáts
Measuring countercyclicality ................................................................ 26 Estimation ............................................................................................ 27 Results ................................................................................................ 28 Some caveats ...................................................................................... 29 Conclusion ........................................................................................... 30
Eurodollar banking and currency internationalisation ......................................... 33 Dong He and Robert McCauley
Typology of the eurodollar banking market ........................................... 35 The eurodollar market experience ........................................................ 37 Lessons for renminbi offshore banking ................................................. 42 Conclusions ......................................................................................... 44
The expansion of central bank balance sheets in emerging Asia: what are the risks? .......................................................................................................... 47 Andrew Filardo and James Yetman
The expansion of central bank balance sheets in emerging Asia .......... 47 Risks .................................................................................................. 53 Additional policy challenges ahead ...................................................... 57 Conclusions ......................................................................................... 59

iv BIS Quarterly Review, June 2012
Statistical Annex ........................................................................................ A1
Special features in the BIS Quarterly Review ................................ B1
List of recent BIS publications .............................................................. B2
Notations used in this Review
e estimated
lhs, rhs left-hand scale, right-hand scale
billion thousand million
… not available
. not applicable
– nil
0 negligible
$ US dollar unless specified otherwise
Differences in totals are due to rounding.
The term “country” as used in this publication also covers territorial entities that are not
states as understood by international law and practice but for which data are separately
and independently maintained.
BIS Quarterly Review, June 2012 1
Optimism evaporates1
Hopes for the global economic recovery and concerns about the euro area
were the two main competing themes in the marketplace in the period from
March to May. These two themes interacted throughout and were broadly
reflected across financial markets.
Early in the period, following the ECB’s longer-term refinancing
operations, investor sentiment improved substantially. With bank funding
strains reduced, the focus shifted to the strength of the global economy.
Positive US economic news and the continued resilience of emerging market
growth helped raise hopes of a steady economic recovery. The renewed
optimism was particularly visible in equity and commodity markets. Fixed
income markets saw a compression in credit spreads, especially for banks and
selected euro area sovereigns. It also resulted in a spurt of capital inflows to
emerging markets.
But by the middle of May, doubts had returned: doubts about euro area
growth; doubts about the financial health of euro area sovereigns; doubts about
banks; doubts about the impact of fiscal consolidation on growth; and finally,
doubts about political stability inside the euro area. All of this, combined with
early signs of more fragile US and Chinese growth, made investors more
cautious and drove up global financial market volatility.
Short-lived optimism about the recovery
The ECB’s special longer-term refinancing operations (LTROs) successfully
reduced the perceived risk of a severe banking crisis in Europe. By early
March, the scale of the combined liquidity injection in the two operations had
produced a noticeable impact across financial markets. Concerns about severe
downside risks of market participants faded and investors’ risk appetite
generally picked up.
The temporary improvement in risk sentiment was also clearly reflected in
the implied volatility of equity options. After having been elevated during the
1 Questions related to this article should be addressed to Jacob Gyntelberg
([email protected]) and Andreas Schrimpf ([email protected]). Questions about data and graphs should be addressed to Magdalena Erdem ([email protected]) and Garry Tang ([email protected]).

2 BIS Quarterly Review, June 2012
latter part of 2011, the VIX reached its lowest level since June 2007 (Graph 1,
left-hand panel) on 19 March.
Funding conditions for euro area banks improved significantly as they
benefited from the second instalment of the ECB’s longer-term operations on
29 February. With a take-up of €530 billion for three years at the average policy
rate over the duration of the loans (currently 1%), the LTRO funds helped
financial institutions with funding difficulties cover maturing debt. As risk
perceptions eased, European and US bank credit spreads fell, at least
temporarily. The decline in spreads was most pronounced for lower-rated
banks (Graph 1, centre panel). The successful easing of funding stress was
highly visible in money markets, where Libor-OIS spreads tightened by around
60 basis points in the euro market and by around 20 basis points in the US
dollar market (Graph 1, right-hand panel).
The improvement was also visible in the primary market for long-term
unsecured bank bonds, which reopened temporarily at the beginning of the
year. This funding channel had been closed for a large number of euro area
banks in the second half of 2011. Many banks from the euro area periphery,
however, continued to rely heavily on covered bonds and government-
guaranteed bonds for funding (see the box on page 20). The overall benign
market conditions in March also helped ensure a smooth completion of the
€200 billion Greek debt swap. This took place in the second week of March
with very limited impact on other European sovereign bond and credit default
swap (CDS) markets. The debt swap triggered payouts on a moderate amount
of outstanding CDS written on Greek government bonds. These were settled
without difficulty, thus removing earlier investor concerns about the
ineffectiveness of hedging sovereign risk via CDS contracts.
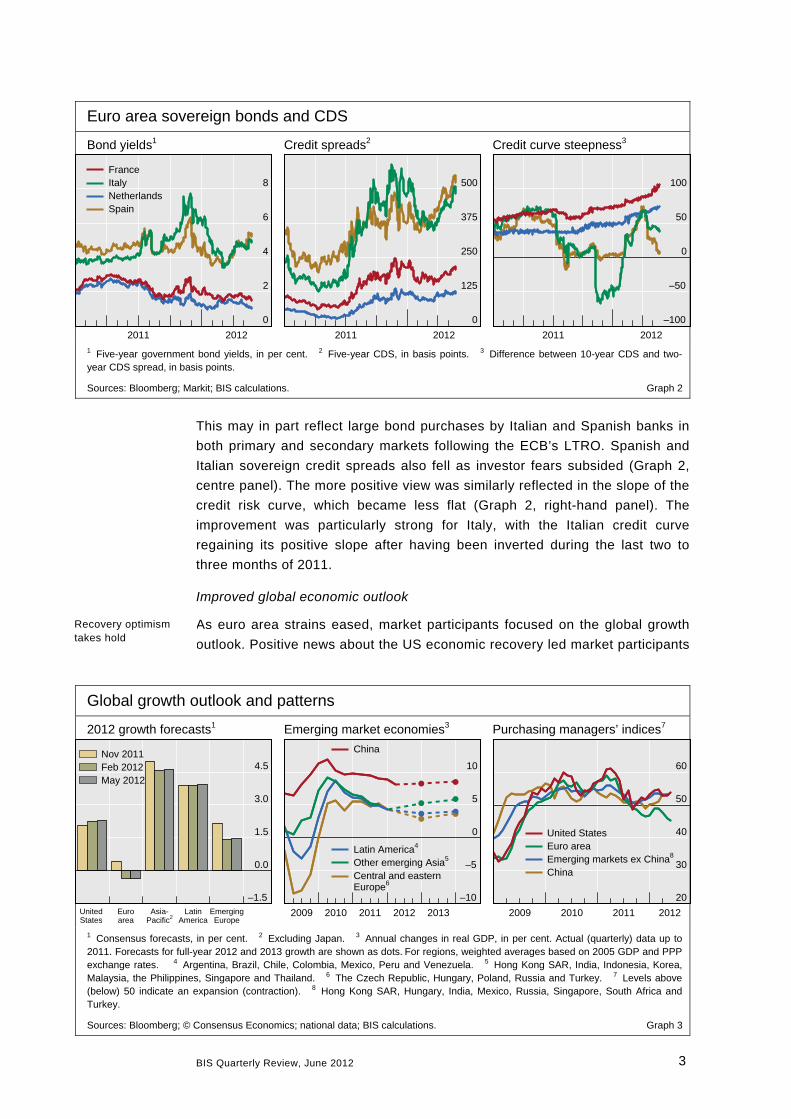
The spurt of euro area optimism driven by policy actions and growth
expectations provided temporary relief for policymakers and investors
concerned about the outlook for euro area sovereigns. Yields on both Spanish
and Italian government bonds declined significantly (Graph 2, left-hand panel).
Asset prices in global markets
Equity implied volatilities1 Credit spreads for financial institutions2, 3
Three-month Libor-OIS spreads2
0
15
30
45
2010 2011 2012
VIX (S&P 500)
VSTOXX (DJ EURO STOXX)
0
200
400
600
2010 2011 2012
AA-ratedA-ratedBBB-rated
0
25
50
75
2010 2011 2012
US dollarEuroPound sterling
1 Volatility implied by the price of at-the-money call option contracts on stock market indices, in per cent. 2 In basis points. 3 Option-adjusted spread on Merrill Lynch Global Broad Market Financials index.
Sources: Bank of America Merrill Lynch; Bloomberg; Datastream. Graph 1
Italian and Spanish spreads fall
… and ease bank funding conditions
Policy actions spur optimism …
BIS Quarterly Review, June 2012 3
This may in part reflect large bond purchases by Italian and Spanish banks in
both primary and secondary markets following the ECB’s LTRO. Spanish and
Italian sovereign credit spreads also fell as investor fears subsided (Graph 2,
centre panel). The more positive view was similarly reflected in the slope of the
credit risk curve, which became less flat (Graph 2, right-hand panel). The
improvement was particularly strong for Italy, with the Italian credit curve
regaining its positive slope after having been inverted during the last two to
three months of 2011.
Improved global economic outlook
As euro area strains eased, market participants focused on the global growth
outlook. Positive news about the US economic recovery led market participants
Global growth outlook and patterns
2012 growth forecasts1 Emerging market economies3 Purchasing managers’ indices7
–1.5
0.0
1.5
3.0
4.5
United Euro Asia- Latin EmergingStates area Pacific2 America Europe
Nov 2011Feb 2012May 2012
–10
–5
0
5
10
2009 2010 2011 2012 2013
Latin America4
Other emerging Asia5
Central and easternEurope6
China
20
30
40
50
60
2009 2010 2011 2012
United StatesEuro areaEmerging markets ex China8
China
1 Consensus forecasts, in per cent. 2 Excluding Japan. 3 Annual changes in real GDP, in per cent. Actual (quarterly) data up to 2011. Forecasts for full-year 2012 and 2013 growth are shown as dots. For regions, weighted averages based on 2005 GDP and PPP exchange rates. 4 Argentina, Brazil, Chile, Colombia, Mexico, Peru and Venezuela. 5 Hong Kong SAR, India, Indonesia, Korea, Malaysia, the Philippines, Singapore and Thailand. 6 The Czech Republic, Hungary, Poland, Russia and Turkey. 7 Levels above (below) 50 indicate an expansion (contraction). 8 Hong Kong SAR, Hungary, India, Mexico, Russia, Singapore, South Africa and Turkey.
Sources: Bloomberg; © Consensus Economics; national data; BIS calculations. Graph 3
Euro area sovereign bonds and CDS
Bond yields1 Credit spreads2 Credit curve steepness3
0
2
4
6
8
2011 2012
FranceItalyNetherlandsSpain
0
125
250
375
500
2011 2012
–100
–50
0
50
100
2011 2012
1 Five-year government bond yields, in per cent. 2 Five-year CDS, in basis points. 3 Difference between 10-year CDS and two-year CDS spread, in basis points.
Sources: Bloomberg; Markit; BIS calculations. Graph 2
Recovery optimism takes hold

4 BIS Quarterly Review, June 2012
to revise upwards their US growth expectations (Graph 3, left-hand panel).
Labour market figures for the US economy, partly reflecting benign weather
conditions, also showed signs of improvement. Output growth in Japan
recovered moderately, owing to post-earthquake reconstruction. The resilience
of growth in major emerging economies (particularly in Asia) likewise supported
a more optimistic outlook for the global economy (Graph 3, centre panel).
Driven by higher risk appetite and improved growth expectations, equities
and other growth- and risk-sensitive assets performed strongly until the end of
March. US and Asian equity markets firmed the most, in line with the better
macroeconomic outlook for these regions (Graph 4, left-hand panel). The
S&P 500 gained about 12% in the first quarter, the largest one-quarter increase
for a decade, despite a slowdown in projected earnings increases. Valuation
ratios for equity markets in advanced and emerging economies also picked up,
recovering from the lows seen in late 2011 (Graph 4, right-hand panel). The
discrepancy between changes in valuations and expected earnings suggests
that the former were driven mostly by increased investor willingness to take on
risk (Graph 4, centre panel). Price/earnings ratios for the US and European
markets, however, remained below historical averages, whereas emerging
market valuations continued to be close to historical averages.
Optimism about the recovery also had a visible influence on commodity
markets, with both energy and industrial metal prices seeing continued upward
pressure (Graph 5, left-hand panel). This was primarily due to tight demand
and supply constellations, although in the case of oil concerns about potential
further supply disruptions and geopolitical risks added to the pressure, and
crude oil traded above $100 per barrel for a large part of the period. The
positive outlook and expected higher prices also led financial investors to
increase their net long positions in commodities futures for both oil and metals
(Graph 5, centre panel). For oil in particular, there was clearly a long-run
expectation of continued consumption growth, as demand from China and
other emerging economies is expected to remain strong (Graph 5, right-hand
Equity market indicators
Equity indices1 Equity market risk tolerance3 Price/earnings ratios4
70
85
100
115
130
2010 2011 2012
S&P 500DJ EURO STOXXTOPIXEmerging Asia2
Latin America2
96
97
98
99
100
2005 2007 2009 2011
S&P 500DAXFTSE
5
10
15
20
25
2005 2007 2009 2011
United StatesEuro areaEmerging markets
1 4 January 2010 = 100. 2 MSCI indices, in US dollar terms. 3 Derived from the differences between the left tails of two distributions of returns, one implied by option prices, the other based on actual returns estimated from historical data. An upward movement indicates an increase in risk tolerance; January 2005 = 100. 4 For Datastream equity market indices.
Sources: Bloomberg; Datastream; BIS calculations. Graph 4
Equities and commodities rise as sentiment improves

BIS Quarterly Review, June 2012 5
panel). In contrast to energy and metals, agriculture price increases were
limited due to better expected harvests, particularly for wheat. This should,
however, be seen in the context of the historically extremely difficult global
weather conditions in previous years.
Euro area uncertainties return
Optimism in financial markets began to evaporate in the second half of March
on the back of renewed concerns about euro area growth, especially in Spain
and Italy. The mood shifted as it became increasingly clear that monetary
policy actions alone would not be sufficient to resolve underlying euro area
economic problems. A trickle of weaker than expected economic data cast
further doubts on the strength of the global growth recovery.
Fading LTRO market impact, worries about a possible negative short-term
growth impact of fiscal consolidation in Spain and the slow pace of labour
market and other structural reforms in Italy were reflected in rising sovereign
bond yields. Between mid-March and early April, Spanish and Italian yields
edged up significantly (Graph 2, left-hand panel). Sovereign spreads against
German bunds widened considerably over this period. Early releases of weak
euro area purchasing managers’ indices (Graph 3, right-hand panel) and less
positive business climate surveys also contributed to a somewhat less positive
growth picture for France and Germany.
Investors also retreated when Standard & Poor’s downgraded Spain and
several of the country’s biggest financial institutions on 26 April. The sovereign
rating was lowered two notches to BBB+. This was clearly reflected at a
€2.5 billion bond auction on 2 May, with yields surging by around 140 basis
points for shorter-term bonds. The change to a more negative outlook for the
euro area was also reflected in the early May statement by the ECB, which no
longer contained references to inflationary upside risks and described longer-
term risks to inflation as broadly balanced.
Commodity prices and oil consumption
Commodity prices1 Net positions of non-commercial futures2
Oil consumption3
25
100
175
250
2007 2008 2009 2010 2011 2012
AgricultureEnergyIndustrial metals
–100
0
100
200
2007 2008 2009 2010 2011 2012
WheatSoybeanCopperCrude oil
0
80
160
240
1987 1997 2007 2017
Emerging markets4
Advanced economies5
World
1 S&P GSCI commodity indices, 1 January 2007 = 100. 2 Number of contracts, in thousands. 3 Expressed in quadrillions of BTUs. Dashed lines show oil consumption assuming constant oil intensity based on 2010 figures and GDP forecasts for 2011–17. 4 Brazil, China, India and Korea. 5 Germany, Japan, the United Kingdom and the United States.
Sources: IMF, World Economic Outlook; US Energy Information Administration; Barclays Capital; Bloomberg; BIS calculations. Graph 5
… as worries intensify
Spanish and Italian yields rise …
6 BIS Quarterly Review, June 2012
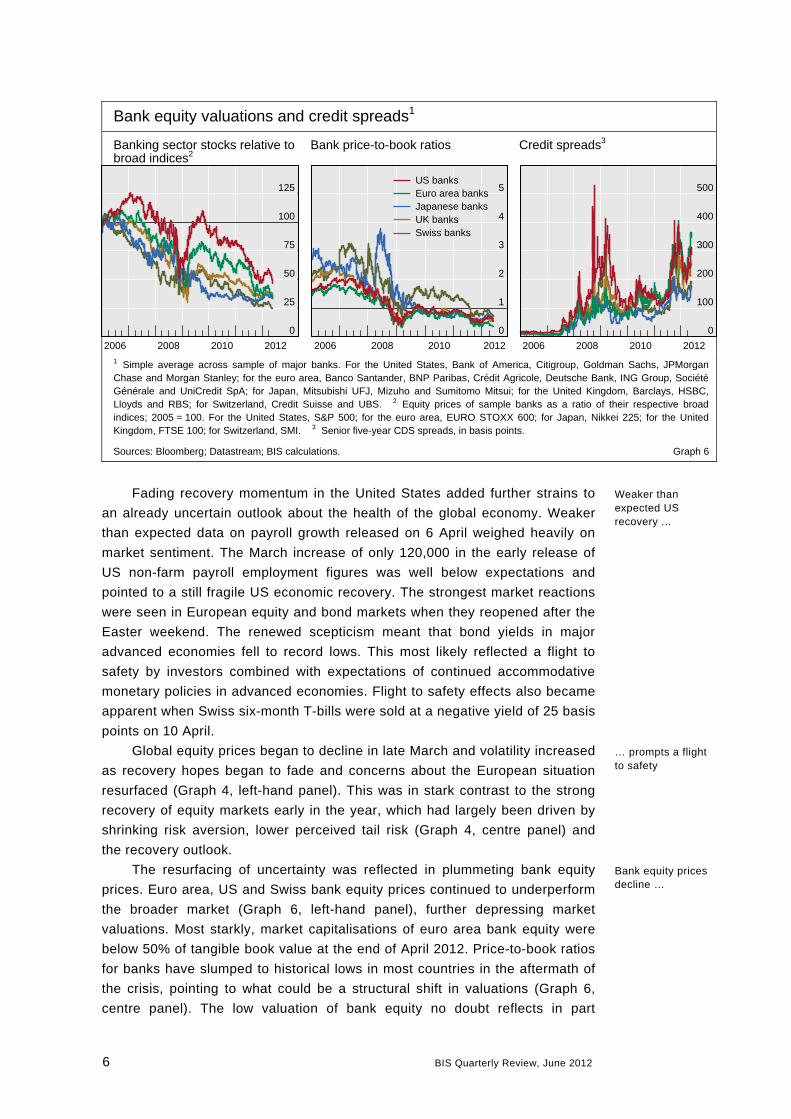
Bank equity valuations and credit spreads1
Banking sector stocks relative to broad indices2
Bank price-to-book ratios Credit spreads3
0
25
50
75
100
125
2006 2008 2010 2012
0
1
2
3
4
5
2006 2008 2010 2012
US banksEuro area banksJapanese banksUK banksSwiss banks
0
100
200
300
400
500
2006 2008 2010 2012
1 Simple average across sample of major banks. For the United States, Bank of America, Citigroup, Goldman Sachs, JPMorgan Chase and Morgan Stanley; for the euro area, Banco Santander, BNP Paribas, Crédit Agricole, Deutsche Bank, ING Group, Société Générale and UniCredit SpA; for Japan, Mitsubishi UFJ, Mizuho and Sumitomo Mitsui; for the United Kingdom, Barclays, HSBC, Lloyds and RBS; for Switzerland, Credit Suisse and UBS. 2 Equity prices of sample banks as a ratio of their respective broad indices; 2005 = 100. For the United States, S&P 500; for the euro area, EURO STOXX 600; for Japan, Nikkei 225; for the United Kingdom, FTSE 100; for Switzerland, SMI. 3 Senior five-year CDS spreads, in basis points.
Sources: Bloomberg; Datastream; BIS calculations. Graph 6
Fading recovery momentum in the United States added further strains to
an already uncertain outlook about the health of the global economy. Weaker
than expected data on payroll growth released on 6 April weighed heavily on
market sentiment. The March increase of only 120,000 in the early release of
US non-farm payroll employment figures was well below expectations and
pointed to a still fragile US economic recovery. The strongest market reactions
were seen in European equity and bond markets when they reopened after the
Easter weekend. The renewed scepticism meant that bond yields in major
advanced economies fell to record lows. This most likely reflected a flight to
safety by investors combined with expectations of continued accommodative
monetary policies in advanced economies. Flight to safety effects also became
apparent when Swiss six-month T-bills were sold at a negative yield of 25 basis
points on 10 April.
Global equity prices began to decline in late March and volatility increased
as recovery hopes began to fade and concerns about the European situation
resurfaced (Graph 4, left-hand panel). This was in stark contrast to the strong
recovery of equity markets early in the year, which had largely been driven by
shrinking risk aversion, lower perceived tail risk (Graph 4, centre panel) and
the recovery outlook.
The resurfacing of uncertainty was reflected in plummeting bank equity
prices. Euro area, US and Swiss bank equity prices continued to underperform
the broader market (Graph 6, left-hand panel), further depressing market
valuations. Most starkly, market capitalisations of euro area bank equity were
below 50% of tangible book value at the end of April 2012. Price-to-book ratios
for banks have slumped to historical lows in most countries in the aftermath of
the crisis, pointing to what could be a structural shift in valuations (Graph 6,
centre panel). The low valuation of bank equity no doubt reflects in part
Bank equity prices decline …
… prompts a flight to safety
Weaker than expected US recovery ...
BIS Quarterly Review, June 2012 7
assessments of growth opportunities and earnings potential, which investors
consider to be fairly bleak for most banks. There are several additional possible
explanations for the significant decline in bank equity valuations. Investor
concerns about opaque balance sheets as well as the continued lack of loss
recognition and the possible impact of further bank rating downgrades are
adding to investor uncertainty, thereby raising risk premia on bank equity.
Higher uncertainty and risk perceptions were also reflected in banks’ CDS
premia, which remained highly elevated for euro area, UK and US banks
(Graph 6, right-hand panel).
European banks’ issuance of unsecured long-term debt remained positive,
but began to taper off again during April. Market conditions nevertheless
remained difficult for a number of banks from the euro area periphery which
found it difficult to place unsecured debt with investors. Market participants,
however, regarded this as less worrisome than during the second half of 2011,
most likely in light of the buffers built up by the high bond issuance in the first
quarter and the ample longer-term funds provided by the ECB’s LTROs. Survey
data for the euro area, however, indicated a continued tightening of lending
standards and weak demand for bank credit.
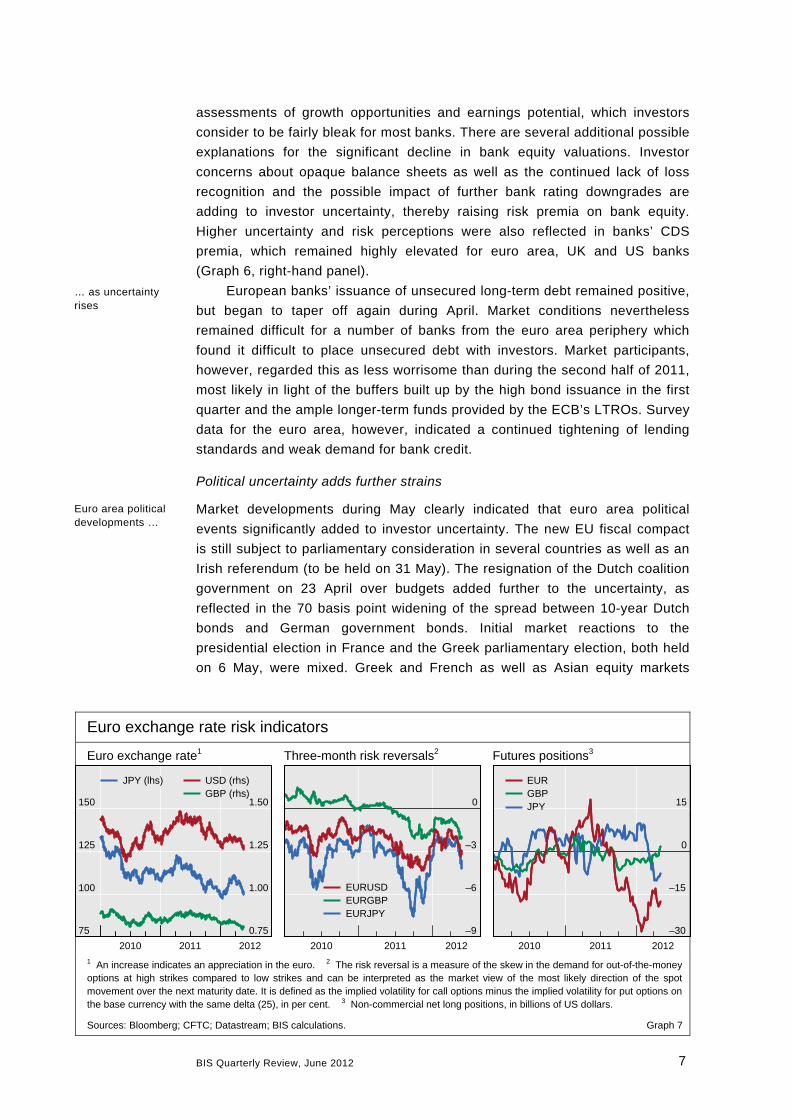
Political uncertainty adds further strains
Market developments during May clearly indicated that euro area political
events significantly added to investor uncertainty. The new EU fiscal compact
is still subject to parliamentary consideration in several countries as well as an
Irish referendum (to be held on 31 May). The resignation of the Dutch coalition
government on 23 April over budgets added further to the uncertainty, as
reflected in the 70 basis point widening of the spread between 10-year Dutch
bonds and German government bonds. Initial market reactions to the
presidential election in France and the Greek parliamentary election, both held
on 6 May, were mixed. Greek and French as well as Asian equity markets
Euro exchange rate risk indicators
Euro exchange rate1 Three-month risk reversals2 Futures positions3
75
100
125
150
0.75
1.00
1.25
1.50
2010 2011 2012
USD (rhs)GBP (rhs)
JPY (lhs)
–9
–6
–3
0
2010 2011 2012
EURUSDEURGBPEURJPY
–30
–15
0
15
2010 2011 2012
EURGBPJPY
1 An increase indicates an appreciation in the euro. 2 The risk reversal is a measure of the skew in the demand for out-of-the-money options at high strikes compared to low strikes and can be interpreted as the market view of the most likely direction of the spot movement over the next maturity date. It is defined as the implied volatility for call options minus the implied volatility for put options on the base currency with the same delta (25), in per cent. 3 Non-commercial net long positions, in billions of US dollars.
Sources: Bloomberg; CFTC; Datastream; BIS calculations. Graph 7
Euro area political developments …
… as uncertainty rises

8 BIS Quarterly Review, June 2012
declined. Yields on Greek bonds initially rose by nearly 2 percentage points
and other southern European government bonds also experienced yield
increases. Equity markets in the rest of Europe and the United States,
however, quickly recovered, and an auction of French short-term government
bonds went smoothly. In the days that followed, post-election political deadlock
in Greece and concerns about Spanish banks added to the uncertain outlook
for the euro area. In this challenging environment, investor worries about a
possible Greek exit from the euro and potential wider impact intensified.
The most visible initial market reaction was in foreign exchange markets,
where the euro started to depreciate against the US dollar (Graph 7, left-hand
panel). At the same time, option prices pointed to a sharp increase in perceived
depreciation risk for the euro against other major currencies (Graph 7, centre
panel). That said, the levels are still quite moderate compared to those in the
second half of 2011. At the same time, data on outstanding futures contracts
continue to point towards financial investors expecting the euro to weaken
(Graph 7, right-hand panel). Positioning data pointed to sterling being used as
a hedge against negative euro surprises. Sterling may also have benefited from
shifts in currency allocations of sovereign foreign exchange reserves.
Emerging market inflows weaken as growth moderates
Concerns about the growth outlook for the advanced economies also prompted
investors to reconsider the resilience of emerging market growth.
In China, economic indicators confirmed that growth is gradually slowing
as a result of last year’s policy tightening and lower external demand.
Economic data for April on industrial production, trade, investment, and real
estate prices and investment confirmed that the economy decelerated along a
manageable path. The combination of slower growth, lower inflation and
continued declines in house prices in most Chinese cities prompted the
Chinese central bank to quickly lower banks’ reserve requirement ratio on
12 May, citing the need to achieve a stable increase in economic growth. The
move prompted expectations of further monetary policy easing. Consistent with
this, one-year non-deliverable renminbi/US dollar forwards began to price in a
mild depreciation of the renminbi against the US dollar during the first half of
May.
Economic indicators also pointed to a growth slowdown in Latin America
and eastern Europe. Responding to slower growth and easing inflationary
pressures, the Central Bank of Brazil cut its policy rate by 75 basis points to
9% in April. This meant that the policy rate is now 300 basis points lower than
its recent peak in 2011. This put further downward pressure on the Brazilian
real, which depreciated significantly against the US dollar in April (Graph 8,
right-hand panel).
After a brief spell of strong capital inflows in the first two months of the
year, inflows into emerging market economies slowed down starting in March
(Graph 8, left-hand panel). The lower capital inflows were reflected in the
returns on emerging market bonds, which declined sharply towards the end of
the period, particularly compared to the high returns earlier in the year
Emerging market inflows moderate …
Chinese growth moderates
… add downside risk

BIS Quarterly Review, June 2012 9
(Graph 8, centre panel). A similar pattern had prevailed during the latter part of
2011.
Inflows to emerging market bond funds increased significantly during the
first weeks of May as euro area uncertainties returned. In contrast, funds
focused on western European bonds saw outflows. Meanwhile, emerging
market equity funds were more clearly affected by the less favourable growth
outlook, and began to experience outflows during April. Emerging market
exchange rates also reflected the change in mood during April and May, with a
large number of currencies giving up all their earlier gains relative to the US
dollar (Graph 8, right-hand panel).
Capital flows and asset prices in emerging markets
Capital inflows1 Bond returns3 Exchange rates4
–20
–10
0
10
20
2007 2008 2009 2010 2011 2012
EquityBondMoving average2
–30
–20
–10
0
10
2007 2008 2009 2010 2011 2012
AsiaEuropeLatin America
70
80
90
100
110
2011 2012
BRLCNYINRRUB
KRWMXNTRY
BRL = Brazilian real; CNY = Chinese yuan; INR = Indian rupee; KRW = Korean won; MXN = Mexican peso; RUB = Russian rouble; TRY = Turkish lira.
1 Sum of weekly data until 23 May 2012; for China, Chinese Taipei, Hong Kong SAR, India, Indonesia, Korea, Malaysia, the Philippines, Singapore, Thailand, Argentina, Brazil, Chile, Colombia, Mexico, Peru, Venezuela, the Czech Republic, Hungary, Poland, Russia, South Africa and Turkey, in billions of US dollars. 2 Six-week moving average. 3 JPMorgan GBI-EM Traded Indices, total return QTD, in US dollar terms. 4 31 December 2010 = 100; an increase indicates an appreciation against the US dollar.
Sources: Datastream; EPFR; JPMorgan Chase; BIS calculations. Graph 8
… but increase again as uncertainty intensifies


BIS Quarterly Review, June 2012 11
Highlights of the BIS international statistics1
The BIS, in cooperation with central banks and monetary authorities worldwide, compiles and disseminates several data sets on activity in international financial markets. This chapter summarises the latest data for the international banking market (available up to the fourth quarter of 2011) and for the over-the-counter (OTC) derivatives market (available up to the second half of 2011). One box discusses activity in international debt securities markets in the first quarter of 2012, and a second discusses the calculation of uncovered counterparty exposures in global OTC derivatives markets.
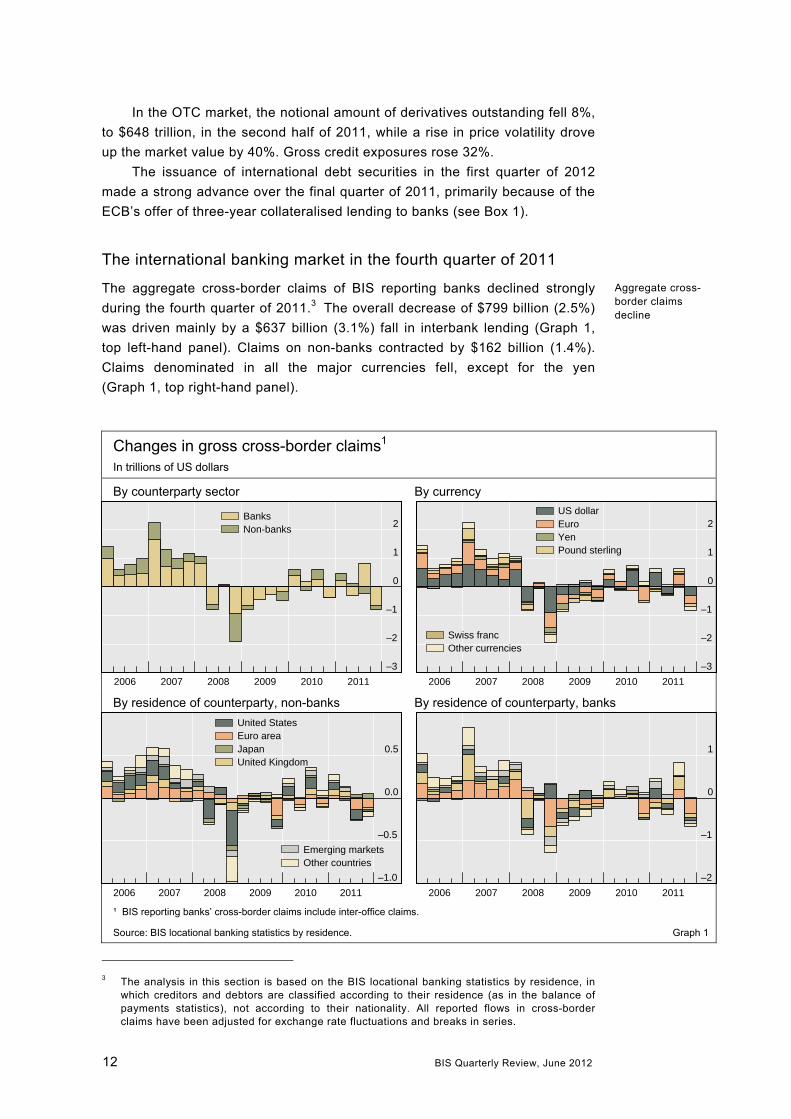
During the fourth quarter of 2011, BIS reporting banks recorded their largest
decline in aggregate cross-border claims since the drop in the fourth quarter of
2008, which followed the collapse of Lehman Brothers. The latest decline was
worldwide but largely driven by banks headquartered in the euro area facing
pressures to reduce their leverage. Overall, cross-border lending to non-banks
decreased; but the decline of claims on banks was sharper – and the largest in
almost three years.
In developed countries as a whole, total cross-border lending to banks and
non-banks contracted by $630 billion; the most notable exceptions were Japan
and Switzerland, where it increased by $71 billion and $13 billion, respectively.
The decline was led by a significant drop in interbank lending arising from the
spillover of the euro area sovereign debt crisis to bank funding markets. The
reduction was especially marked for cross-border claims on residents of the
euro area and was mostly attributable to euro area banks.
In emerging market economies,2 cross-border claims of BIS reporting
banks fell in most regions, overall by $75 billion. The decline was concentrated
on Asia-Pacific in general and on banks in China in particular. For China, this
was the first overall decrease since the opening quarter of 2009. Among all
developing countries, only those in Latin America and the Caribbean saw an
increase in cross-border claims.
1 This article was prepared by Adrian van Rixtel ([email protected]) for banking statistics
and Nicholas Vause ([email protected]) for OTC derivatives. Statistical support was provided by Stephan Binder, Serge Grouchko, Branimir Gruić, Carlos Mallo and Denis Pêtre.
2 “Developing countries” in the Statistical Annex tables.
12 BIS Quarterly Review, June 2012
In the OTC market, the notional amount of derivatives outstanding fell 8%,
to $648 trillion, in the second half of 2011, while a rise in price volatility drove
up the market value by 40%. Gross credit exposures rose 32%.
The issuance of international debt securities in the first quarter of 2012
made a strong advance over the final quarter of 2011, primarily because of the
ECB’s offer of three-year collateralised lending to banks (see Box 1).
The international banking market in the fourth quarter of 2011
The aggregate cross-border claims of BIS reporting banks declined strongly
during the fourth quarter of 2011.3 The overall decrease of $799 billion (2.5%)
was driven mainly by a $637 billion (3.1%) fall in interbank lending (Graph 1,
top left-hand panel). Claims on non-banks contracted by $162 billion (1.4%).
Claims denominated in all the major currencies fell, except for the yen
(Graph 1, top right-hand panel).
3 The analysis in this section is based on the BIS locational banking statistics by residence, in
which creditors and debtors are classified according to their residence (as in the balance of payments statistics), not according to their nationality. All reported flows in cross-border claims have been adjusted for exchange rate fluctuations and breaks in series.
Changes in gross cross-border claims1 In trillions of US dollars
By counterparty sector By currency
–3
–2
–1
0
1
2
2006 2007 2008 2009 2010 2011
BanksNon-banks
–3
–2
–1
0
1
2
2006 2007 2008 2009 2010 2011
US dollarEuroYenPound sterling
Swiss francOther currencies
By residence of counterparty, non-banks By residence of counterparty, banks
–1.0
–0.5
0.0
0.5
2006 2007 2008 2009 2010 2011
United StatesEuro areaJapanUnited Kingdom
Emerging marketsOther countries
–2
–1
0
1
2006 2007 2008 2009 2010 2011
¹ BIS reporting banks’ cross-border claims include inter-office claims.
Source: BIS locational banking statistics by residence. Graph 1
Aggregate cross-border claims decline
BIS Quarterly Review, June 2012 13
Decline in claims on non-banks
Cross-border claims on non-banks (ie entities other than banks) declined in
most of the major developed countries (Graph 1, bottom left-hand panel). As in
the previous quarter, the bulk of the decrease at non-banks was in the euro
area ($110 billion or 3%). Residents of France accounted for $42 billion of this
decrease, followed by those of Belgium ($20 billion), the Netherlands
($17 billion), Italy ($12 billion) and Spain ($8 billion). Claims on non-banks also
fell considerably in the United Kingdom ($26 billion or 2.4%) and in the United
States ($14 billion or 0.6%). In line with the previous quarter, the only major
economy with a significant increase in cross-border claims on its non-banks
was Japan ($51 billion or 20%).
Sharp drop in cross-border interbank lending
Three features characterise the sharp decline in cross-border claims on banks
in the fourth quarter. First and foremost, internationally active banks reduced
their cross-border lending to banks in the euro area. Second, they also reduced
cross-border interbank lending in several other developed countries, albeit by a
lesser amount. Third, they cut interbank loans much more than other
instruments.4
Cross-border claims on banks located in the euro area fell by $364 billion
(5.9%), which is equivalent to 57% of the decline in global cross-border
interbank lending during the quarter. It was the largest contraction in cross-
border claims on euro area banks, in both absolute and relative terms, since
the fourth quarter of 2008. Cross-border lending to banks located on the euro
area periphery continued to fall significantly. Lending to banks in Italy and
Spain shrank, by $57 billion (9.8%) and $46 billion (8.7%), respectively, while
claims on banks in Greece, Ireland and Portugal also contracted sharply.
Nonetheless, exposures to these five countries accounted for only 39% of the
reduction in cross-border interbank lending to the euro area. BIS reporters also
reduced their cross-border claims on banks in Germany ($104 billion or 8.7%)
and France ($55 billion or 4.2%).
Cross-border interbank lending to most other major economies also fell
during the period but generally to a lesser extent – to banks located in the
United States by $80 billion (2.7%); to those in the United Kingdom by
$84 billion (2.1%) (Graph 1, bottom right-hand panel); and to those in Australia
by $32 billion (11%). Such lending to banks located in offshore centres fell by
$54 billion (2.1%).
The strong contraction in cross-border claims on banks was concentrated
in interbank loans. These declined by $524 billion (3.2%), accounting for 82%
of the total global decrease. Other assets accounted for 11% of the decline,
4 BIS locational banking statistics by residence divide the international claims of reporting
banks into three instrument categories: loans and deposits, debt securities and other assets. The last category includes equity, participations, derivative instruments, working capital supplied by head offices to branches and residual on-balance sheet claims. For further details, see Guidelines to the international locational banking statistics, www.bis.org/statistics/locbankstatsguide.pdf.
Cross-border claims on banks decline in almost all euro area countries …
Sharp decline in interbank loans drives reduction in interbank claims
… and the United States and United Kingdom
14 BIS Quarterly Review, June 2012
and debt securities for 7%. In contrast, in the previous quarter, other assets
was the leading instrument category, possibly because of changes in the
market value of derivatives positions. The fall in interbank loans was more
pronounced in the euro area (at 6.3%). This development may be seen as part
of the marked spillover effects from the euro area sovereign debt crisis to bank
funding markets, including short-term interbank markets, in the fourth quarter of
2011. During that quarter, the three-month Libor-OIS spread increased to high
levels on the back of higher risk premia and the growing reluctance of market
participants to engage in interbank loan transactions. This spread also
increased for US dollar and sterling interbank loans, although to a lesser
extent. Interbank loans declined significantly for banks in the United States
($81 billion or 3.1%) and the United Kingdom ($63 billion or 2%).
In contrast, the cross-border interbank market generated modest amounts
of new funds, mainly for banks in Japan (Graph 1, bottom right-hand panel)
and Switzerland. Claims on banks in Japan rose by $21 billion (3.5%), and
claims on those in Switzerland by $14 billion (2.9%); again, in each case, the
increase in claims came mainly from the rise in interbank loans – $23 billion
(4.0%) and $20 billion (4.7%), respectively.
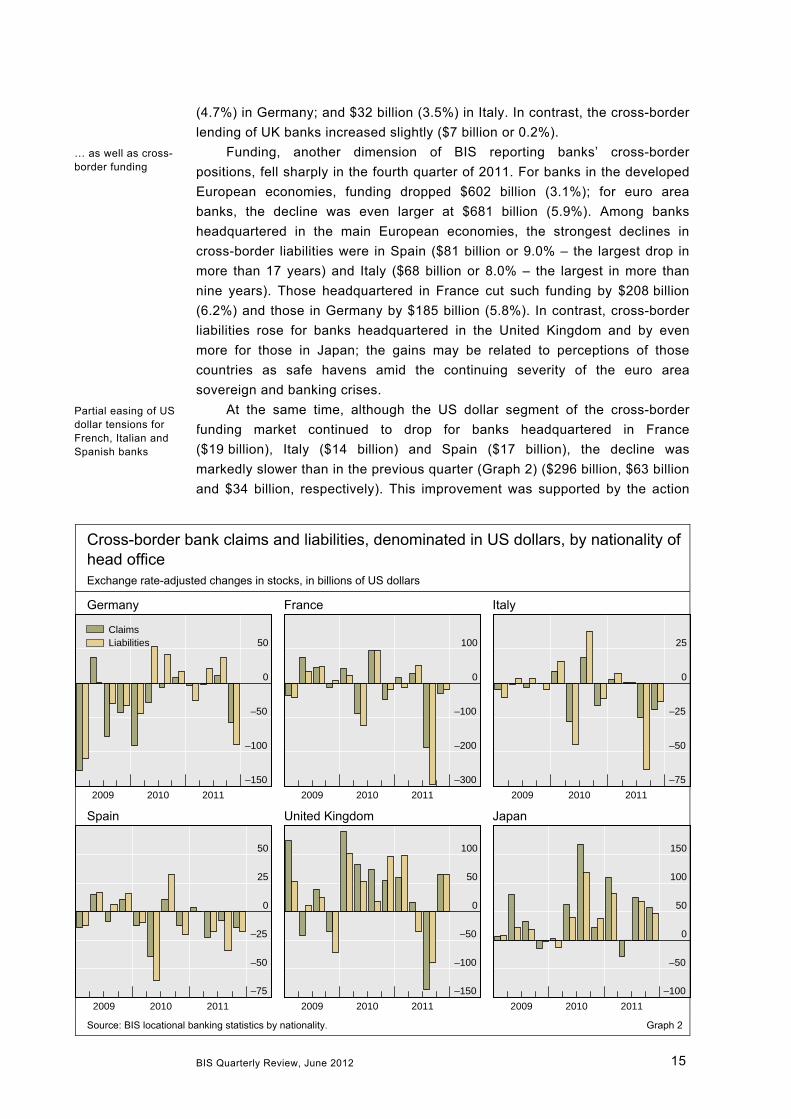
Deleveraging European banks reduce cross-border positions5
In the fourth quarter of 2011, the strains of the euro area sovereign debt crisis
started to spread from bank wholesale funding markets to the assets side of
the institutions’ balance sheets.6 This raised interest among market observers
as to how banks from individual countries were being affected, including their
cross-border positions denominated in various currencies. Both dimensions –
nationality and currency denomination – may be assessed through the BIS
locational banking statistics by nationality.7 Banks headquartered in developed
European economies reduced their cross-border assets by $466 billion (2.3%),
the second largest decline in both absolute and relative terms since the fourth
quarter of 2008.
This cutback was more marked for euro area banks, at $584 billion
(4.7%). Banks with head offices in France lowered their cross-border assets by
$197 billion (5.3%), mostly by reducing positions denominated in the euro –
after the 7.1% drop in the previous quarter, it was the second largest for
French banks in at least 12 years. The cross-border lending of banks in some
other major European economies declined significantly as well: ranked by
percentage point change, the drop was $35 billion (5.3%) in Spain; $181 billion
5 The analysis in this section is based on the BIS locational banking statistics by nationality.
6 See “European bank funding and deleveraging”, BIS Quarterly Review, March 2012, pp 1–12.
7 The BIS statistics by nationality cover activity according to the country of incorporation or the country in which the ultimate parent/company is chartered. The organising principle is thus the nationality of the controlling interest rather than the residence of the operating unit. These statistics also allow for currency breakdowns of international positions, which is not possible with the consolidated banking statistics (which are also organised according to the nationality of reporting banks). For more details, see Guidelines to the international locational banking statistics, www.bis.org/statistics/locbankstatsguide.pdf.
Cross-border claims on banks in Japan and Switzerland expand
European banks slash cross-border lending …
Cross-border claims on banks in Japan and Switzerland expand
BIS Quarterly Review, June 2012 15
(4.7%) in Germany; and $32 billion (3.5%) in Italy. In contrast, the cross-border
lending of UK banks increased slightly ($7 billion or 0.2%).
Funding, another dimension of BIS reporting banks’ cross-border
positions, fell sharply in the fourth quarter of 2011. For banks in the developed
European economies, funding dropped $602 billion (3.1%); for euro area
banks, the decline was even larger at $681 billion (5.9%). Among banks
headquartered in the main European economies, the strongest declines in
cross-border liabilities were in Spain ($81 billion or 9.0% – the largest drop in
more than 17 years) and Italy ($68 billion or 8.0% – the largest in more than
nine years). Those headquartered in France cut such funding by $208 billion
(6.2%) and those in Germany by $185 billion (5.8%). In contrast, cross-border
liabilities rose for banks headquartered in the United Kingdom and by even
more for those in Japan; the gains may be related to perceptions of those
countries as safe havens amid the continuing severity of the euro area
sovereign and banking crises.
At the same time, although the US dollar segment of the cross-border
funding market continued to drop for banks headquartered in France
($19 billion), Italy ($14 billion) and Spain ($17 billion), the decline was
markedly slower than in the previous quarter (Graph 2) ($296 billion, $63 billion
and $34 billion, respectively). This improvement was supported by the action
Cross-border bank claims and liabilities, denominated in US dollars, by nationality of head office Exchange rate-adjusted changes in stocks, in billions of US dollars
Germany France Italy
–150
–100
–50
0
50
2009 2010 2011
ClaimsLiabilities
–300
–200
–100
0
100
2009 2010 2011
–75
–50
–25
0
25
2009 2010 2011
Spain United Kingdom Japan
–75
–50
–25
0
25
50
2009 2010 2011
–150
–100
–50
0
50
100
2009 2010 2011
–100
–50
0
50
100
150
2009 2010 2011
Source: BIS locational banking statistics by nationality. Graph 2
Partial easing of US dollar tensions for French, Italian and Spanish banks
… as well as cross-border funding
16 BIS Quarterly Review, June 2012
coordinated by the Federal Reserve with several other main central banks on
30 November to lower the price of dollar funding through US dollar swap
arrangements. Federal Reserve data show a strong increase in US dollar
swaps with other central banks in December 2011.8
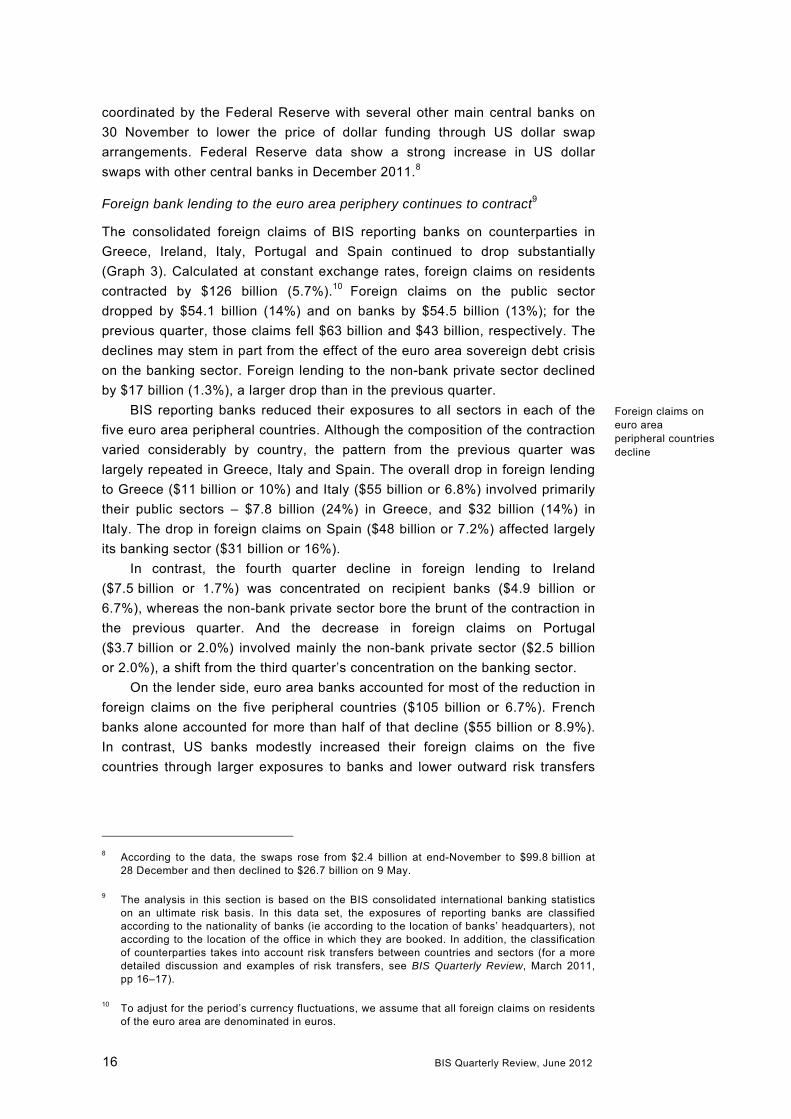
Foreign bank lending to the euro area periphery continues to contract9
The consolidated foreign claims of BIS reporting banks on counterparties in
Greece, Ireland, Italy, Portugal and Spain continued to drop substantially
(Graph 3). Calculated at constant exchange rates, foreign claims on residents
contracted by $126 billion (5.7%).10 Foreign claims on the public sector
dropped by $54.1 billion (14%) and on banks by $54.5 billion (13%); for the
previous quarter, those claims fell $63 billion and $43 billion, respectively. The
declines may stem in part from the effect of the euro area sovereign debt crisis
on the banking sector. Foreign lending to the non-bank private sector declined
by $17 billion (1.3%), a larger drop than in the previous quarter.
BIS reporting banks reduced their exposures to all sectors in each of the
five euro area peripheral countries. Although the composition of the contraction
varied considerably by country, the pattern from the previous quarter was
largely repeated in Greece, Italy and Spain. The overall drop in foreign lending
to Greece ($11 billion or 10%) and Italy ($55 billion or 6.8%) involved primarily
their public sectors – $7.8 billion (24%) in Greece, and $32 billion (14%) in
Italy. The drop in foreign claims on Spain ($48 billion or 7.2%) affected largely
its banking sector ($31 billion or 16%).
In contrast, the fourth quarter decline in foreign lending to Ireland
($7.5 billion or 1.7%) was concentrated on recipient banks ($4.9 billion or
6.7%), whereas the non-bank private sector bore the brunt of the contraction in
the previous quarter. And the decrease in foreign claims on Portugal
($3.7 billion or 2.0%) involved mainly the non-bank private sector ($2.5 billion
or 2.0%), a shift from the third quarter’s concentration on the banking sector.
On the lender side, euro area banks accounted for most of the reduction in
foreign claims on the five peripheral countries ($105 billion or 6.7%). French
banks alone accounted for more than half of that decline ($55 billion or 8.9%).
In contrast, US banks modestly increased their foreign claims on the five
countries through larger exposures to banks and lower outward risk transfers
8 According to the data, the swaps rose from $2.4 billion at end-November to $99.8 billion at
28 December and then declined to $26.7 billion on 9 May.
9 The analysis in this section is based on the BIS consolidated international banking statistics on an ultimate risk basis. In this data set, the exposures of reporting banks are classified according to the nationality of banks (ie according to the location of banks’ headquarters), not according to the location of the office in which they are booked. In addition, the classification of counterparties takes into account risk transfers between countries and sectors (for a more detailed discussion and examples of risk transfers, see BIS Quarterly Review, March 2011, pp 16–17).
10 To adjust for the period’s currency fluctuations, we assume that all foreign claims on residents of the euro area are denominated in euros.
Foreign claims on euro area peripheral countries decline
BIS Quarterly Review, June 2012 17
Estimated changes in foreign claims1 on selected countries, Q4 2011 By bank nationality at constant end-2011 exchange rates,2 in billions of US dollars
Foreign claims on Austria Foreign claims on Belgium Foreign claims on Finland
–12
–8
–4
0
4
8
ALL DE3ES FR IT OEA CH GB JP US ROW
Total foreign claims
Claims on banksClaims on public sector
–27
–18
–9
0
9
18
ALL DE3ES FR IT OEA CH GB JP US ROW
Claims on non-bank private sectorUnallocated by sector
–27
–18
–9
0
9
18
ALL DE3ES FR IT OEA CH GB JP US ROW
Foreign claims on France Foreign claims on Germany Foreign claims on Greece
–120
–80
–40
0
40
80
ALL DE3ES FR IT OEA CH GB JP US ROW
–150
–100
–50
0
50
100
ALL DE3ES FR IT OEA CH GB JP US ROW
–12
–8
–4
0
4
8
ALL DE3ES FR IT OEACH GB JP US ROW
Foreign claims on Ireland Foreign claims on Italy Foreign claims on Luxembourg
–9
–6
–3
0
3
6
ALL DE3 ES FR IT OEA CH GB JP US ROW
–60
–40
–20
0
20
40
ALL DE3ES FR IT OEA CH GB JP US ROW
–36
–24
–12
0
12
24
ALL DE3ES FR IT OEA CH GB JP US ROW
Foreign claims on Netherlands Foreign claims on Portugal Foreign claims on Spain
–30
–20
–10
0
10
20
ALL DE3ES FR IT OEA CH GB JP US ROW
–4.5
–3.0
–1.5
0.0
1.5
3.0
ALL DE3ES FR IT OEA CH GB JP US ROW
–54
–36
–18
0
18
36
ALL DE3ES FR IT OEA CH GB JP US ROW
ALL = all BIS reporting banks; CH = Switzerland; DE = Germany; ES = Spain; FR = France; GB = United Kingdom; IT = Italy; JP = Japan; OEA = other euro area; ROW = rest of the world; US = United States.
1 Foreign claims consist of cross-border claims and of local claims of foreign affiliates; claims of locally headquartered banks are not included, as these are not foreign claims. 2 All claims are assumed to be denominated in euros. 3 Claims of German banks are on an immediate borrower basis, except for their claims on the Greek public sector, which are on an ultimate risk basis.
Source: BIS consolidated banking statistics (ultimate risk basis). Graph 3
(in particular, reduced third-party guarantees on US banks’ foreign claims on
Ireland), and despite a decline in US bank claims on each of these countries’
public sectors.

18 BIS Quarterly Review, June 2012
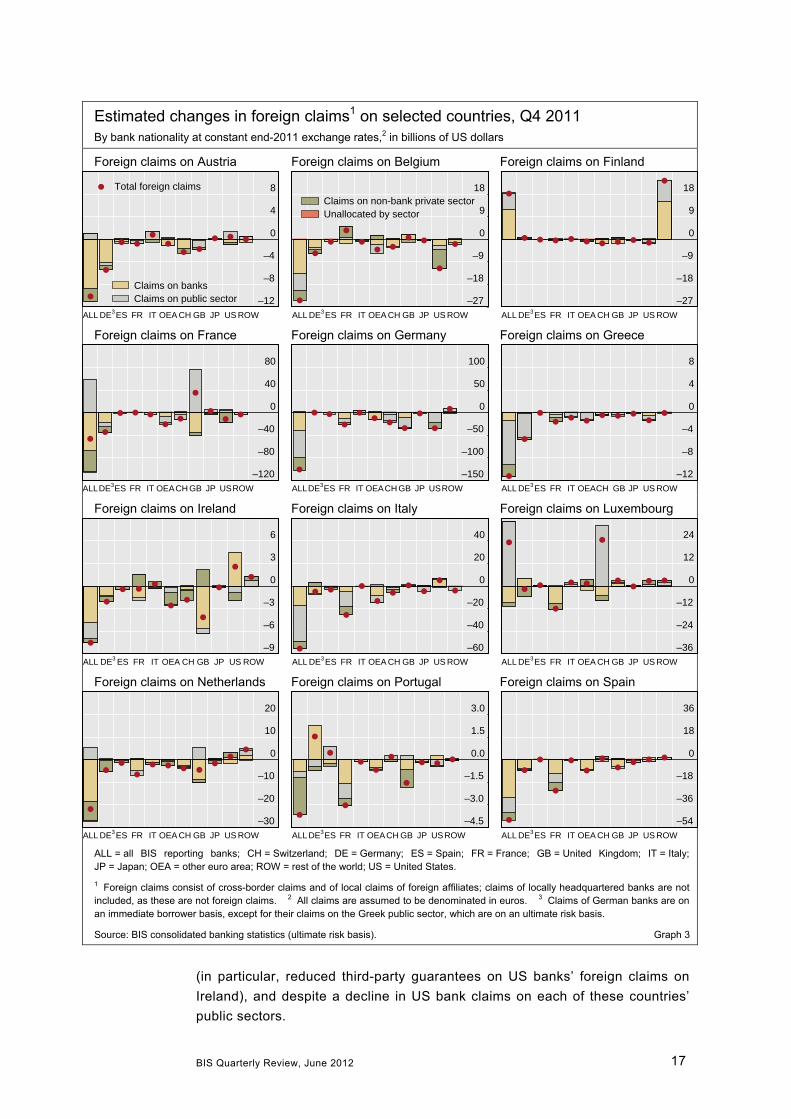
Cross-border claims on emerging market economies decline11
Claims on the residents of emerging market economies from banks located in
other countries contracted by $75 billion (2.4%), following a decline of
$17 billion (0.5%) in the previous quarter. As it was only the second decline in
almost three years, the drop in claims highlighted the scope of the
deleveraging in cross-border business activities during the period. The
reductions in these claims by banks in the euro area, Asian offshore centres
and Japan were especially large and were only modestly offset by slight
increases in cross-border lending from other areas, mostly the United Kingdom
and the United States.
The contraction was mainly driven by a sharp reduction in interbank claims
of $64 billion (3.8%), more than half of which was focused on China. Cross-
border claims on non-banks declined by $10 billion (0.7%). Claims on residents
in the Asia-Pacific region, emerging Europe, and Africa and the Middle East all
fell. The only region with an increase was Latin America and the Caribbean.
The largest decline in cross-border credit in developing areas was in the
Asia-Pacific region, accounting for 91% of the total reduction for developing
countries (Graph 4, top left-hand panel). In fact, it was the first decrease in
cross-border claims on the region since the first quarter of 2009. The
$68 billion (5.1%) overall decline was due to a $70 billion (7.9%) drop in
interbank claims, while lending to non-banks increased modestly by $1.6 billion
(0.3%). The decline in cross-border claims in the region originated for the most
part from banks in Asian offshore centres, eg in Hong Kong SAR and
Singapore, followed by banks in France, Japan and the United Kingdom.
A large drop in cross-border lending to China of $31 billion (6.1%) – the
first decline there since the first quarter of 2009 – was the main factor behind
the contraction of cross-border claims in the Asia-Pacific region. The
contraction for Chinese banks was $37 billion (9.9%), whereas cross-border
claims on the Chinese non-bank sector increased by $5.9 billion (4.4%).
Cross-border credit also declined significantly in Chinese Taipei
($8.8 billion or 8.9%), Korea ($7.4 billion or 3.5%), Thailand ($7.2 billion or
14.7%) and India ($7.1 billion or 3.4%); in all these cases, the change was
mainly driven by often sharp decreases in interbank claims.
Also, cross-border lending to emerging Europe and to Africa and the
Middle East declined (Graph 4, bottom panels). Claims on the former fell by
$14 billion (1.9%), mainly because of a significant decline in cross-border
interbank lending ($11 billion or 2.6%). The contraction in cross-border claims
on emerging Europe mostly affected Hungary ($6.9 billion or 9.9%) and Poland
($5.1 billion or 4.0%), and the source of the reduction was in largest part banks
in Austria, France and the Netherlands. In contrast, Russia experienced an
$8.0 billion (5.4%) increase in cross-border credit evenly split between its bank
and non-bank sectors. Africa and the Middle East recorded a decline of
11 The analysis in this section is based on the BIS locational banking statistics by residence. See
footnote 3 for a description of this data set.
Cross-border lending to Asia-Pacific declines …
… and also to emerging Europe, and Africa and the Middle East …
BIS Quarterly Review, June 2012 19
$4.1 billion (0.8%) that was concentrated in South Africa, Israel and Saudi
Arabia. Cross-border lending to Qatar rose.
In Latin America and the Caribbean, the rise in cross-border lending
($11 billion or 2%) was driven by a $10 billion (4.3%) gain in interbank lending.
The main recipient countries were Mexico ($3.0 billion or 2.4%) and Chile
($2.5 billion or 4.7%); the gain in Mexico was more than accounted for by a
$4.0 billion or 13% increase in interbank credit. Banks in the United States and
Canada were mainly responsible for the growth in cross-border claims on Latin
America and the Caribbean, while Japanese banks reduced their exposure.
Growth rates of cross-border claims on residents of emerging markets1 By residence of counterparty, in per cent
Asia-Pacific Latin America and Caribbean
–30
–15
0
15
30
2006 2007 2008 2009 2010 2011
Asia-PacificChinaChinese Taipei
IndiaIndonesiaKorea
–30
–15
0
15
30
2006 2007 2008 2009 2010 2011
Latin America and CaribbeanBrazilMexico
ChilePeruColombia
Emerging Europe Africa and Middle East
–30
–15
0
15
30
2006 2007 2008 2009 2010 2011
Emerging EuropeTurkeyRussiaPolandHungaryRomania
–30
–15
0
15
30
2006 2007 2008 2009 2010 2011
Africa and Middle EastUnited Arab EmiratesSaudi ArabiaQatar
South AfricaEgypt
¹ Quarterly growth rates of BIS reporting banks’ cross-border claims (including inter-office claims) in all currencies.
Source: BIS locational banking statistics by residence. Graph 4
… while cross-border lending to Latin America and the Caribbean increases
20 BIS Quarterly Review, June 2012
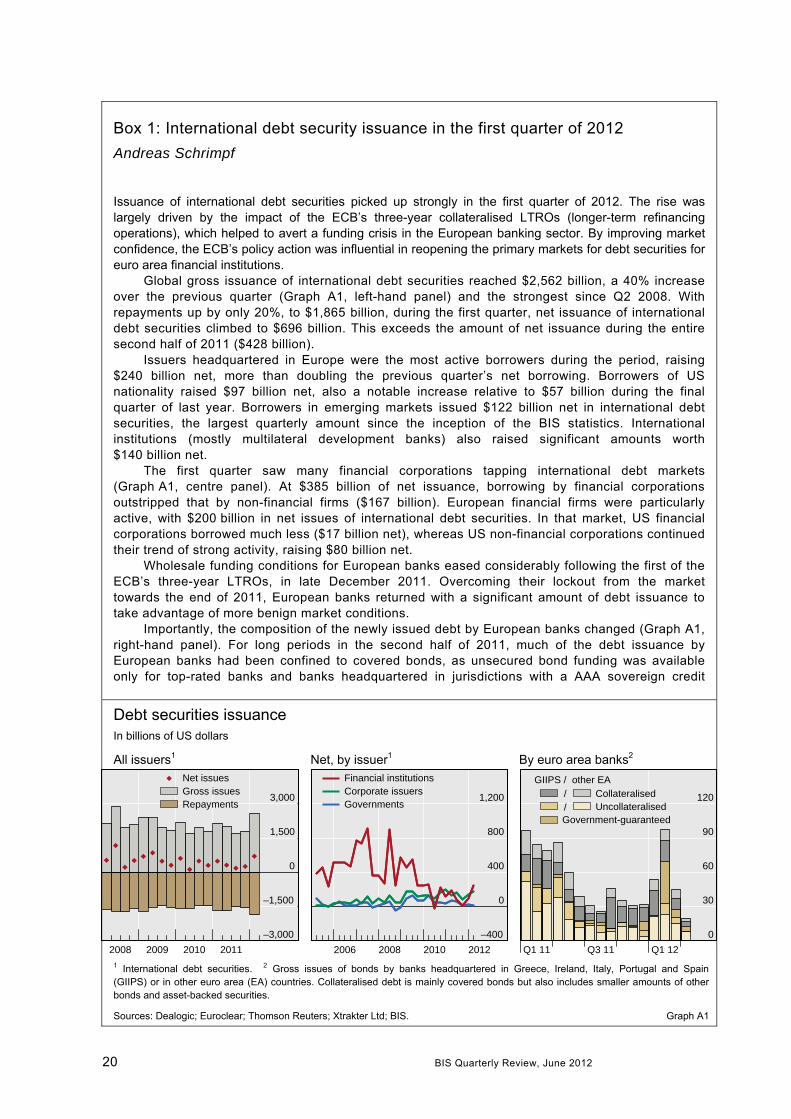
Box 1: International debt security issuance in the first quarter of 2012
Andreas Schrimpf
Issuance of international debt securities picked up strongly in the first quarter of 2012. The rise was largely driven by the impact of the ECB’s three-year collateralised LTROs (longer-term refinancing operations), which helped to avert a funding crisis in the European banking sector. By improving market confidence, the ECB’s policy action was influential in reopening the primary markets for debt securities for euro area financial institutions.
Global gross issuance of international debt securities reached $2,562 billion, a 40% increase over the previous quarter (Graph A1, left-hand panel) and the strongest since Q2 2008. With repayments up by only 20%, to $1,865 billion, during the first quarter, net issuance of international debt securities climbed to $696 billion. This exceeds the amount of net issuance during the entire second half of 2011 ($428 billion).
Issuers headquartered in Europe were the most active borrowers during the period, raising $240 billion net, more than doubling the previous quarter’s net borrowing. Borrowers of US nationality raised $97 billion net, also a notable increase relative to $57 billion during the final quarter of last year. Borrowers in emerging markets issued $122 billion net in international debt securities, the largest quarterly amount since the inception of the BIS statistics. International institutions (mostly multilateral development banks) also raised significant amounts worth $140 billion net.
The first quarter saw many financial corporations tapping international debt markets (Graph A1, centre panel). At $385 billion of net issuance, borrowing by financial corporations outstripped that by non-financial firms ($167 billion). European financial firms were particularly active, with $200 billion in net issues of international debt securities. In that market, US financial corporations borrowed much less ($17 billion net), whereas US non-financial corporations continued their trend of strong activity, raising $80 billion net.
Wholesale funding conditions for European banks eased considerably following the first of the ECB’s three-year LTROs, in late December 2011. Overcoming their lockout from the market towards the end of 2011, European banks returned with a significant amount of debt issuance to take advantage of more benign market conditions.
Importantly, the composition of the newly issued debt by European banks changed (Graph A1, right-hand panel). For long periods in the second half of 2011, much of the debt issuance by European banks had been confined to covered bonds, as unsecured bond funding was available only for top-rated banks and banks headquartered in jurisdictions with a AAA sovereign credit
Debt securities issuance In billions of US dollars
All issuers1 Net, by issuer1 By euro area banks2
–3,000
–1,500
0
1,500
3,000
2008 2009 2010 2011
Net issuesGross issuesRepayments
–400
0
400
800
1,200
2006 2008 2010 2012
Financial institutionsCorporate issuersGovernments
0
30
60
90
120
Q1 11 Q3 11 Q1 12
GIIPS / other EA//Government-guaranteed
CollateralisedUncollateralised
1 International debt securities. 2 Gross issues of bonds by banks headquartered in Greece, Ireland, Italy, Portugal and Spain (GIIPS) or in other euro area (EA) countries. Collateralised debt is mainly covered bonds but also includes smaller amounts of other bonds and asset-backed securities.
Sources: Dealogic; Euroclear; Thomson Reuters; Xtrakter Ltd; BIS. Graph A1

BIS Quarterly Review, June 2012 21
rating. It was primarily high-rated European banks (such as ABN AMRO, Rabobank, Nordea and SEB) that reopened the market for senior unsecured bonds at the beginning of January. Lower-tier names and banks headquartered in peripheral countries followed suit and began to issue senior unsecured bonds.
Nevertheless, issuance in the senior unsecured segment was still fairly concentrated in banks from core euro area countries. Debt issuance by banks in non-core countries to a large extent still consisted of covered bonds and government-guaranteed bonds.
As investors demanded lower risk compensation and as sentiment improved after the ECB’s first three-year refinancing operation, issuance activity in the high-yield bond market segment again picked up to satisfy investors’ increased risk appetite (Graph B1, left-hand panel). Spreads in the high-yield segment had moved up towards the end of 2011 in the face of the uncertainty around the euro area sovereign debt woes, but they came down somewhat as sentiment improved at the beginning of the year (Graph B1, centre panel). Activity in the high-yield bond market was dominated by US corporations, which issued high-yield debt securities worth $44 billion after repayments, most of it in February and March.
Emerging market borrowing was also very strong (Graph B1, right-hand panel). Borrowers from Asia and the Pacific tapped international debt markets with $58 billion of net issues, most of it attributable to borrowers in China ($33 billion) and Korea ($9 billion). Borrowing from issuers headquartered in Latin America also rose, to $39 billion of net issues, mostly because of activity by entities from Brazil ($28 billion) and Mexico ($7 billion).
International debt securities
High-yield issuance1 Average spreads,2 in basis points Emerging markets3
–10
0
10
20
30
2008 2009 2010 2011 2012
United StatesDeveloped EuropeOther developed
0
300
600
900
1,200
2008 2009 2010 2011 2012
AAAAA, A or BBBBB and less
–50
0
50
100
0
250
500
750
2008 2009 2010 2011 2012
Lhs: Spreads (rhs)
Asia-PacificLatin AmericaEuropeAfrica & Middle East
1 Net issues by non-financial corporations headquartered in developed countries, in billions of US dollars. 2 Weighted average, rating at issue. 3 Net issues, in billions of US dollars. Spreads are based on the Quarterly JPMorgan EMBI Global Composite index, in basis points.
Sources: Dealogic; Euroclear; Thomson Reuters; Xtrakter Ltd; BIS. Graph B1
Over-the-counter derivatives in the second half of 2011
The notional amount of outstanding over-the-counter (OTC) derivatives fell by
8%, to $648 trillion, in the second half of 2011. But with an increase in price
volatility, their market value rose by 40% (Graph 5, left-hand and centre
panels).12 Gross credit exposures also increased significantly, by 32%.
12 The reporting population increased in the middle of 2011 to include derivatives dealers in
Australia and Spain. Excluding those dealers, reported outstanding notional amounts fell to $635 trillion at the end of 2011, and gross market values increased to $26.6 trillion rather than $27.3 trillion. Reported positions with counterparty groups changed more significantly, as positions with the additional dealers moved from being positions with “other financial institutions” (or “banks and security firms” in the case of the credit derivatives statistics) to positions with “reporting dealers”.
OTC derivatives positions declined, yet rose in value
22 BIS Quarterly Review, June 2012
Over-the-counter derivatives in 20111 In trillions of US dollars
Notional amounts outstanding Gross market values (GMVs) GMVs of interest rate derivatives
0
150
300
450
600
0
15
30
45
60
H1 H2 H1 H2 H1 H2 H1 H2 H1 H2
Int2 Credit FX Equity Com3
Lhs Rhs Forwards and swapsOptions
0
6
12
18
24
0.0
0.6
1.2
1.8
2.4
H1 H2 H1 H2 H1 H2 H1 H2 H1 H2
Int2 Credit FX Equity Com3
Lhs Rhs
0
6
12
18
24
0.0
0.6
1.2
1.8
2.4
H1 H2 H1 H2 H1 H2 H1 H2 H1 H2
USD EUR JPY GBP CHF
Lhs Rhs
1 As of the end of the indicated periods. Note that Australia and Spain joined the reporting population between end-H1 and end-H2 2011. 2 Interest rate contracts. 3 Commodity contracts.
Sources: Central banks of the G10 countries, Australia and Spain; BIS. Graph 5
The bulk of these changes were in the interest rate market segment. Here,
notional amounts outstanding declined by 9%, to $504 trillion. This
corresponded closely to cuts to positions in dollar, euro and sterling contracts
and to positions with residual maturities of one year or less. Market participants
may have perceived little near-term risk of changes in short-term interest rates
in these currencies and therefore elected not to replace maturing short-dated
contracts. Such a perception would be consistent with the declines in
probabilities of near-term increases in policy rates implied by market prices and
the proximity of these rates to zero, which limited the scope for cuts. The
increase in the market value of outstanding interest rate derivatives was also
concentrated in dollar, euro and sterling contracts, for which replacement
values increased by 39%, 67% and 71%, respectively (Graph 5, right-hand
panel). For each of these currencies, swap rates of all maturities fell to low
levels by historical standards. This suggests that swap rates moved further
away from those prevailing when many outstanding contracts were signed, thus
raising their cost of replacement.
The pattern of lower outstanding notional amounts but higher market
values was also visible in the credit derivatives market segment. The volume of
outstanding positions, which fell by 12%, to $29 trillion, resumed the downward
trend that began at the end of 2007. The trend largely reflects the application of
portfolio compression services to both bilateral and centrally cleared trades.
Even after such compression, outstanding positions with central counterparties
(CCPs) still increased from 9% to 11% of the market.13 The market value of
outstanding positions increased by 18%, as credit default swap premia
increased for many sovereigns and other reference entities.
13 After halving the volume of contracts with CCPs, since central clearing replaces original
contracts between two counterparties with two contracts, one between the first original counterparty and the CCP and another between the CCP and the second original counterparty.
… and credit derivatives
This was reflected in interest rate derivatives …

BIS Quarterly Review, June 2012 23
Box 2: Uncovered counterparty exposures in global OTC derivatives markets
Jacob Gyntelberg and Nicholas Vause
Uncovered credit exposures between counterparties to bilateral trades in the over-the-counter (OTC) derivatives market were at least $2.1 trillion at end-2011 (Graph A2). While this is lower than the estimated $3.0 trillion at the end of 2008, just after the peak of the financial crisis, the volume of uncovered positions appears to have increased in both 2010 and 2011.
We estimate the uncovered credit exposures by subtracting the volume of collateral posted in the OTC derivatives market from the counterparty credit exposures as indicated by the BIS Semiannual Survey. Counterparty credit exposures, in turn, refer to the sum of all positive market values of bilateral positions between market participants after netting offsetting trades covered by netting agreements. These “gross credit exposures” increased from $3.5 trillion to $3.9 trillion during 2011. They were $5.0 trillion at the end of 2008.
Collateral posted against counterparty credit exposures was no more than $1.8 trillion at end-2011, $1.5 trillion at end-2010 and $2.0 trillion at end-2008. We derive these estimates from the amount of “collateral in circulation” reported in the 2012 Margin Survey of the International Swaps and Derivatives Association (ISDA), which was $3.6 trillion at the end of 2011. However, we adjust this figure to account for the fact that it counts each unit of outstanding collateral at least twice: it is the sum of collateral posted and received by market participants (see Appendix 2 of the ISDA survey), and it counts the same unit of collateral multiple times if counterparties post it against different credit exposures. The result of the multiple counting is an overstatement of the counterparty exposures effectively backed by collateral.
Uncovered counterparty exposures in global OTC derivatives markets In trillions of US dollars
0.5
1.0
1.5
2.0
2.5
3.0
2000 2001 2002 2003 2004 2005 2006 2007 2008 2009 2010 2011
Sources: ISDA; BIS semiannual OTC derivatives statistics. Graph A2
In contrast, the outstanding volume of foreign exchange derivatives
changed little, although their market value also increased notably. The gross
market value increased by 9%, largely as a result of changes in the values of
contracts between the G3 currencies, with the euro depreciating by 5% against
the dollar and 8% against the yen in the second half of 2011. In a smaller
segment of the market, the gross market value of contracts referencing the
Swiss franc fell by 30%, reflecting the Swiss National Bank’s decision to try to
cap the value of the franc against the euro. This caused the franc to depreciate
sharply to just below the cap, reversing a strong appreciation over the
preceding several months. Hence, current and expected future values of the
exchange rate probably moved back towards the fixed rates locked into many
outstanding contracts, thus reducing their cost of replacement. The outstanding
volume of foreign exchange contracts referencing the Swiss franc also fell
Market values of foreign exchange derivatives also increased …
24 BIS Quarterly Review, June 2012
notably, by 16%, perhaps as some market participants who would have
incurred losses if the franc appreciated against the euro decided to no longer
hedge this risk.
In the smaller equity and commodity segments of the OTC derivatives
market, outstanding notional amounts fell somewhat, while market values
changed little. The outstanding volume of equity derivatives fell by 13%,
reflecting similar proportionate declines in both options and forward and swap
positions. The overall decline in commodity derivatives positions was 3%, again
with similar proportionate reductions in options and forward and swap
positions.
… but were little changed for equity and commodity derivatives
BIS Quarterly Review, June 2012 25
Előd Takáts
Countercyclical policies in emerging markets1
Emerging market economies (EMEs) have historically faced challenges in implementing countercyclical policies. However, the policy environment has changed. This paper finds evidence that EMEs were able to conduct countercyclical monetary and fiscal policies over the past decade. Indeed, the EMEs that have leaned more heavily against the business cycle have generally used both monetary and fiscal tools to do so.
Keywords: Countercyclical monetary and fiscal policies, Taylor rule, emerging markets.
JEL classification: E30, E43, E63.
Can emerging market economies (EMEs) successfully pursue countercyclical
monetary and fiscal policies? In the past, EMEs often found it difficult to do so.
This was particularly the case for central banks. Monetary policy was frequently
subordinated to the requirements of an expansionary fiscal policy, a condition
described by Sargent and Wallace (1981) as fiscal dominance. And fiscal
expansion during economic upturns left little scope for countercyclical policies
during downturns. However, the era of fiscal dominance appears to have ended
in most EMEs.
This study finds that many EMEs have implemented policies that are
almost as countercyclical as those of many advanced economies, even if the
individual outcomes have varied. Furthermore, the results indicate that the
EMEs that leaned more heavily against the business cycle generally relied on
both monetary and fiscal policy to do so.
That EMEs are able to pursue countercyclical monetary and fiscal policies
is a welcome development. Such policies have certainly benefited EMEs, by
reducing their output volatility, and may quite possibly have helped to stabilise
the global economy. However, these findings should not be allowed to induce a
sense of complacency. A policy that is countercyclical is not always
sustainable, as recent experience in the euro area shows. It remains crucial to
closely monitor fiscal sustainability and financial imbalances.
1 The analysis was first prepared for the Meeting of Emerging Market Deputy Governors (Basel,
16–17 February 2012). The author thanks meeting participants, Claudio Borio, Stephen Cecchetti, Andrew Filardo, Enisse Kharroubi, Zsolt Kuti, Madhusudan Mohanty, Philip Turner, and Christian Upper for useful comments and discussions. Emese Kuruc provided excellent research assistance. The views expressed are those of the author and do not necessarily reflect those of the BIS.

26 BIS Quarterly Review, June 2012
This special feature is organised as follows. The first section outlines how
the countercyclicality of monetary and fiscal policies can be measured. The
second introduces the empirical estimation strategy and the third presents the
results. The fourth highlights some caveats and the final one concludes.
Measuring countercyclicality
Monetary and fiscal policies can stabilise the business cycle by reining in
economic activity during booms and bolstering it during downturns. For
monetary policy, this means increasing the real policy rate during booms and
lowering it in recessions; for fiscal policy, this means adjusting expenditures
and taxes beyond the range that automatic stabilisers would achieve, with the
aim of cutting government deficits during booms and increasing them in
recessions.
One way to measure how far monetary policy is countercyclical is to
estimate the correlation between the business cycle and the real policy interest
rate, controlling for other relevant factors. The Taylor (1993) rule offers a
straightforward way to do so. The policy rate is modelled as responding to
several variables:
( *) ( *) *i y y r (1)
where i is the nominal policy interest rate, is the rate of inflation, * is the
(explicit or implicit) inflation target, y–y* is the output gap, r* is the “equilibrium”
real interest rate, and and are parameters that represent the degree to
which a central bank responds to output and inflation developments,
respectively. The intuition behind the Taylor rule is straightforward: a monetary
authority should adjust the policy rate one-for-one for changes in inflation ()
and should respond positively to business cycle fluctuations (y–y*) and the
deviation of inflation from the inflation target (–*). In particular, a larger
captures a more countercyclical monetary policy, while a negative value would
imply a procyclical monetary policy.2
For fiscal policy, Taylor (2000) provides an analogous approach. The
fiscal balance, measured as a percentage of GDP, is split into structural and
cyclical factors:
* ( *)b b y y (2)
where b denotes the general government budget balance as a percentage of
GDP, b* the cyclically adjusted deficit, y–y* the output gap, and the degree
of sensitivity of budget balance to the output gap. The coefficient can be
used to measure for the degree of countercyclicality; the larger becomes, the
more countercyclical is fiscal policy. Similarly, as in the case of monetary
policy, a negative would imply procyclical fiscal policies.
2 Furthermore, a larger might also signal that monetary policy is more countercyclical in
responding to output deviations to the extent that these output deviations also appear in the inflation rate (via, for instance, the relationships captured in the Phillips curve).
... and a similar approach captures that of fiscal policy
The Taylor rule captures the countercyclicality of monetary policy ...
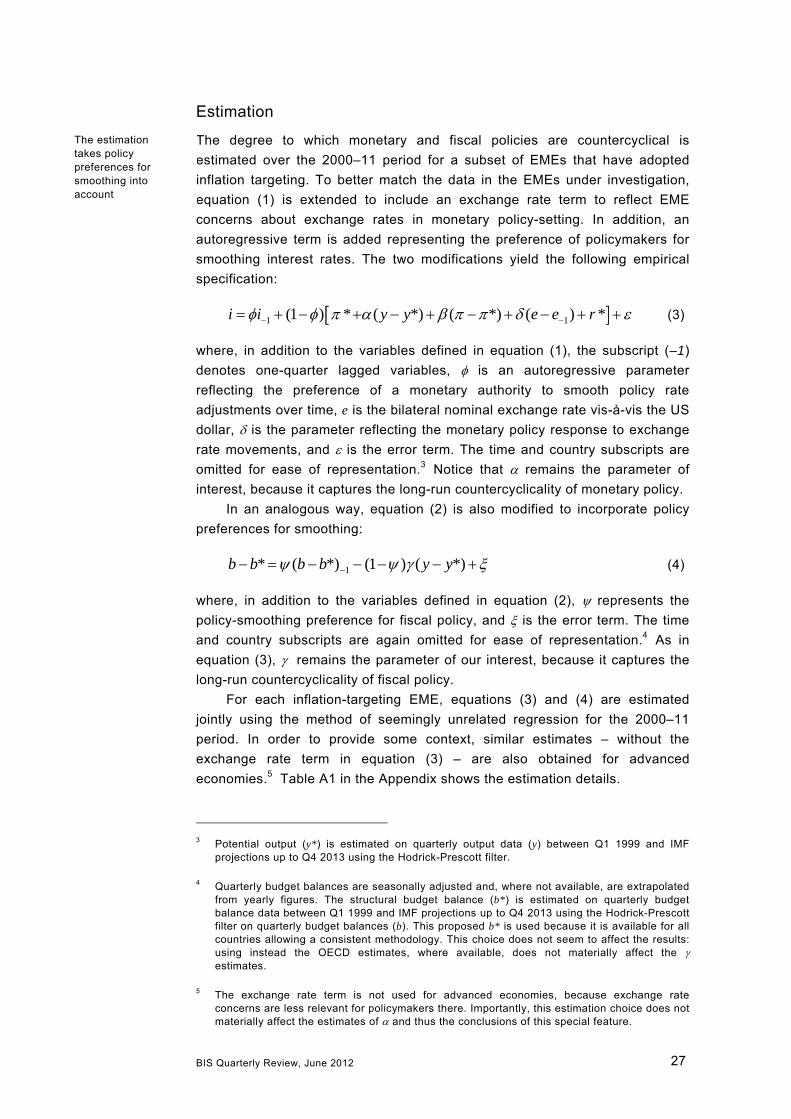
BIS Quarterly Review, June 2012 27
Estimation
The degree to which monetary and fiscal policies are countercyclical is
estimated over the 2000–11 period for a subset of EMEs that have adopted
inflation targeting. To better match the data in the EMEs under investigation,
equation (1) is extended to include an exchange rate term to reflect EME
concerns about exchange rates in monetary policy-setting. In addition, an
autoregressive term is added representing the preference of policymakers for
smoothing interest rates. The two modifications yield the following empirical
specification:
1 1(1 ) * ( *) ( *) ( ) *i i y y e e r (3)
where, in addition to the variables defined in equation (1), the subscript (–1)
denotes one-quarter lagged variables, is an autoregressive parameter
reflecting the preference of a monetary authority to smooth policy rate
adjustments over time, e is the bilateral nominal exchange rate vis-à-vis the US
dollar, is the parameter reflecting the monetary policy response to exchange
rate movements, and is the error term. The time and country subscripts are
omitted for ease of representation.3 Notice that remains the parameter of
interest, because it captures the long-run countercyclicality of monetary policy.
In an analogous way, equation (2) is also modified to incorporate policy
preferences for smoothing:
1* ( *) (1 ) ( *)b b b b y y (4)
where, in addition to the variables defined in equation (2), represents the
policy-smoothing preference for fiscal policy, and is the error term. The time
and country subscripts are again omitted for ease of representation.4 As in
equation (3), remains the parameter of our interest, because it captures the
long-run countercyclicality of fiscal policy.
For each inflation-targeting EME, equations (3) and (4) are estimated
jointly using the method of seemingly unrelated regression for the 2000–11
period. In order to provide some context, similar estimates – without the
exchange rate term in equation (3) – are also obtained for advanced
economies.5 Table A1 in the Appendix shows the estimation details.
3 Potential output (y*) is estimated on quarterly output data (y) between Q1 1999 and IMF
projections up to Q4 2013 using the Hodrick-Prescott filter.
4 Quarterly budget balances are seasonally adjusted and, where not available, are extrapolated from yearly figures. The structural budget balance (b*) is estimated on quarterly budget balance data between Q1 1999 and IMF projections up to Q4 2013 using the Hodrick-Prescott filter on quarterly budget balances (b). This proposed b* is used because it is available for all countries allowing a consistent methodology. This choice does not seem to affect the results: using instead the OECD estimates, where available, does not materially affect the estimates.
5 The exchange rate term is not used for advanced economies, because exchange rate concerns are less relevant for policymakers there. Importantly, this estimation choice does not materially affect the estimates of and thus the conclusions of this special feature.
The estimation takes policy preferences for smoothing into account
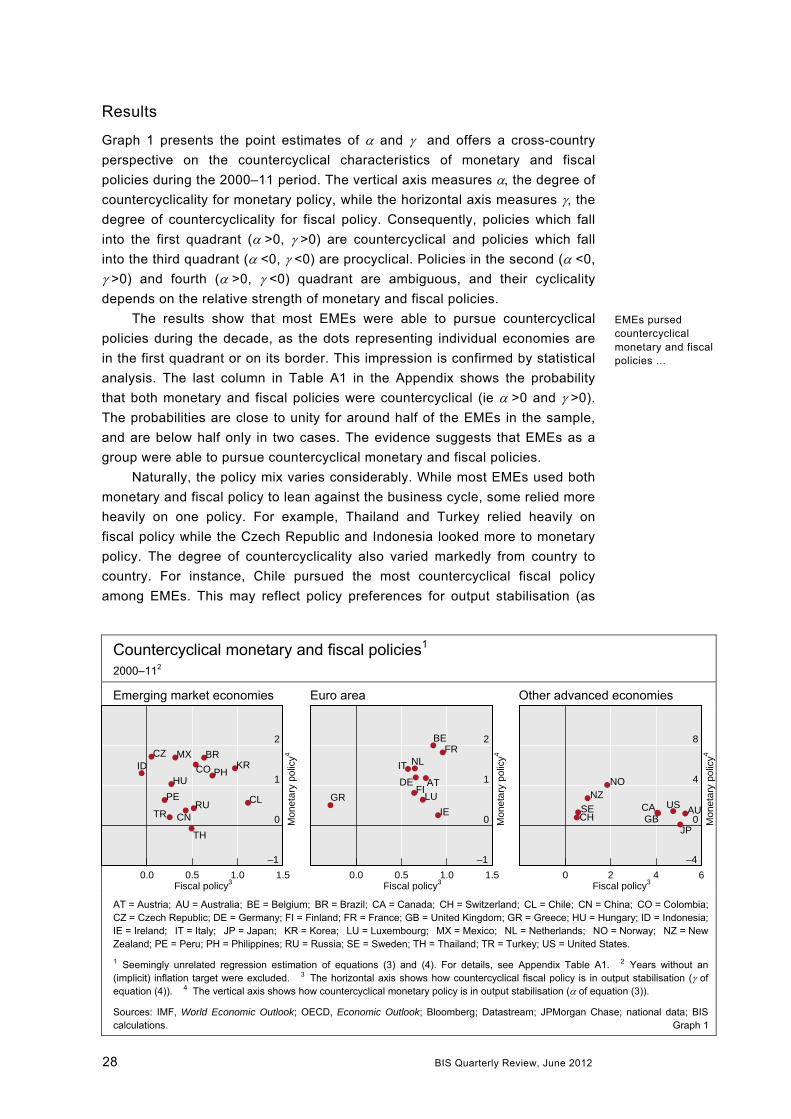
28 BIS Quarterly Review, June 2012
Results
Graph 1 presents the point estimates of and and offers a cross-country
perspective on the countercyclical characteristics of monetary and fiscal
policies during the 2000–11 period. The vertical axis measures the degree of
countercyclicality for monetary policy, while the horizontal axis measures , the
degree of countercyclicality for fiscal policy. Consequently, policies which fall
into the first quadrant (>0, >0) are countercyclical and policies which fall
into the third quadrant (<0, <0) are procyclical. Policies in the second (<0,
>0) and fourth (>0, <0) quadrant are ambiguous, and their cyclicality
depends on the relative strength of monetary and fiscal policies.
The results show that most EMEs were able to pursue countercyclical
policies during the decade, as the dots representing individual economies are
in the first quadrant or on its border. This impression is confirmed by statistical
analysis. The last column in Table A1 in the Appendix shows the probability
that both monetary and fiscal policies were countercyclical (ie >0 and >0).
The probabilities are close to unity for around half of the EMEs in the sample,
and are below half only in two cases. The evidence suggests that EMEs as a
group were able to pursue countercyclical monetary and fiscal policies.
Naturally, the policy mix varies considerably. While most EMEs used both
monetary and fiscal policy to lean against the business cycle, some relied more
heavily on one policy. For example, Thailand and Turkey relied heavily on
fiscal policy while the Czech Republic and Indonesia looked more to monetary
policy. The degree of countercyclicality also varied markedly from country to
country. For instance, Chile pursued the most countercyclical fiscal policy
among EMEs. This may reflect policy preferences for output stabilisation (as
Countercyclical monetary and fiscal policies1
2000–112
Emerging market economies Euro area Other advanced economies
BR
CL
CO
MX
PE
ID KRPH
TH
CZ
HU
TR CNRU
–1
0
1
2
0.0 0.5 1.0 1.5Fiscal policy3
Mon
etar
y po
licy4
AT
BE
DEFI
FR
GR
IE
IT
LU
NL
–1
0
1
2
0.0 0.5 1.0 1.5Fiscal policy3
Mon
etar
y po
licy4
AUCAGB
NONZ
SECH
JP
US
–4
0
4
8
0 2 4 6Fiscal policy3
Mon
etar
y po
licy4
AT = Austria; AU = Australia; BE = Belgium; BR = Brazil; CA = Canada; CH = Switzerland; CL = Chile; CN = China; CO = Colombia; CZ = Czech Republic; DE = Germany; FI = Finland; FR = France; GB = United Kingdom; GR = Greece; HU = Hungary; ID = Indonesia; IE = Ireland; IT = Italy; JP = Japan; KR = Korea; LU = Luxembourg; MX = Mexico; NL = Netherlands; NO = Norway; NZ = New Zealand; PE = Peru; PH = Philippines; RU = Russia; SE = Sweden; TH = Thailand; TR = Turkey; US = United States.
1 Seemingly unrelated regression estimation of equations (3) and (4). For details, see Appendix Table A1. 2 Years without an (implicit) inflation target were excluded. 3 The horizontal axis shows how countercyclical fiscal policy is in output stabilisation ( of equation (4)). 4 The vertical axis shows how countercyclical monetary policy is in output stabilisation ( of equation (3)).
Sources: IMF, World Economic Outlook; OECD, Economic Outlook; Bloomberg; Datastream; JPMorgan Chase; national data; BIS calculations. Graph 1
EMEs pursed countercyclical monetary and fiscal policies ...

BIS Quarterly Review, June 2012 29
laid down by Chile’s fiscal responsibility law) and also the need to stabilise
output in the face of volatile copper prices. Yet fiscal policy is not necessarily
dictated by commodity prices: Russia pursued a less countercyclical fiscal
policy despite its exposure to oil prices. It seems that policy preferences as
well as economic and institutional frameworks have all shaped the policy mix
adopted by EMEs over the past decade.
To put the EME results into perspective, the centre and the right-hand
panels show the results for advanced economies. The centre panel confirms
that policies were also countercyclical in the euro area. Not only did the
common monetary policy turn out to be countercyclical for all countries for
which estimates were possible, but fiscal policy was also countercyclical in all
countries except Greece. Interestingly, the estimates show that, on average,
countercyclicality in the euro area was similar to that of the EMEs, although
slightly stronger. Unfortunately, the further interpretation of the euro area
results is not straightforward, as euro area countries are not independent in
their monetary policy.
Policies among other advanced economies were so much more
countercyclical that the scales needed to be recalibrated in the right-hand
panel. In particular, Japan and some English-speaking economies (Australia,
Canada, the United Kingdom and the United States) stand out for their
markedly countercyclical fiscal policies. For most of these countries, the
phenomenon seems to be explained by the huge scale of the fiscal packages
adopted after the Lehman failure. In any case, policy, especially fiscal policy,
seems to be substantially more countercyclical in most of these economies
than in EMEs.
In sum, both monetary and fiscal policy were countercyclical in most EMEs
over the past decade. Although the estimates vary from country to country, the
degree of countercyclicality compares with that in many advanced economies.
Some caveats
As one EME can be very different from another, there are concerns whether
the results can reflect the full complexity of policy-setting. For instance, the use
of non-interest rate monetary policy measures (such as reserve requirements
or quantitative measures) might have added noise to the estimates.
More concretely, there are concerns that the estimates might under- or
overestimate countercyclicality. On the one hand, the reliance of these
estimates on the 2000–11 average might have caused countercyclicality to be
underestimated. Evidence from central banks suggests that policies became
steadily more countercyclical in a number of EMEs over the past decade.
Hence, past averages might show less countercyclicality than current policies.
On the other hand, very low advanced economy interest rates during the
global financial crisis might have allowed EME central banks to cut their policy
rates more sharply than they could have done otherwise. Thus, the estimates
might overstate the degree to which EME monetary policy is countercyclical in
the long run. Furthermore, while low advanced economy interest rates helped
... and other advanced economies
... as did euro area countries ...
30 BIS Quarterly Review, June 2012
countercyclical easing in the current downturn, their prolongation would
complicate countercyclical monetary tightening in the future.
Conclusion
Based on data from the past decade, this special feature finds that fiscal and
monetary policies have been broadly countercyclical in EMEs that target
inflation. Furthermore, the EMEs that leaned more heavily against the business
cycle generally relied on both monetary and fiscal policy to do so. In fact, the
degree of countercyclicality is only slightly below that seen in most euro area
countries, suggesting that EME policy frameworks have matured substantially –
although it must be noted that EMEs vary considerably in their policy
preferences, economic issues and institutional frameworks.
These countercyclical policies lay the groundwork for EMEs to stabilise
their output and thereby contribute to the stability of the global economy. This
represents a major advance and a welcome departure from the era of fiscal
dominance. That said, this is no time for complacency. Countercyclicality is a
necessary but not a sufficient condition for sound macroeconomic policy. The
example of some euro area countries – which pursued countercyclical policies
over the past decade yet are nonetheless facing a crisis today – underlines the
importance of continuously monitoring financial imbalances and the
sustainability of fiscal policies.
Finally, there is ample space for future research on the countercyclicality
of EME economic policies. For example, it would be useful to examine the
effectiveness of non-interest rate measures in monetary policy and also to
make an explicit assessment of sustainability in fiscal policy. This special
feature hopes to pave the way for such research – and, more generally, for
better understanding of economic policies in EMEs.
References
Blanchard, O (2005): “Fiscal dominance and inflation targeting: lessons from
Brazil”, in F Giavazzi, I Goldfajn and S Herrera (eds), Inflation targeting, debt, and the Brazilian experience, 1999 to 2003, MIT Press, pp 49–84.
Cecchetti, S (2011): “Fiscal policy and its implications for monetary and
financial stability”, June, www.bis.org/events/conf110623/cecchetti.pdf.
Sargent, T and N Wallace (1981): “Some unpleasant monetarist arithmetic”,
Federal Reserve Bank of Minneapolis Quarterly Review, vol 5, no 3, pp 1–17.
Taylor, J (1993): “Discretion versus policy rules in practice”, Carnegie-Rochester Conference Series on Public Policy, 39, pp 195–214.
——— (1995) “Monetary policy implications of greater fiscal discipline”, in
Budget deficits and debt: issues and options, Federal Reserve Bank of Kansas
City, 1995, pp 151–70.
——— (2000): “Reassessing discretionary fiscal policy”, Journal of Economic Perspectives, vol 14, no 3, pp 21–36.
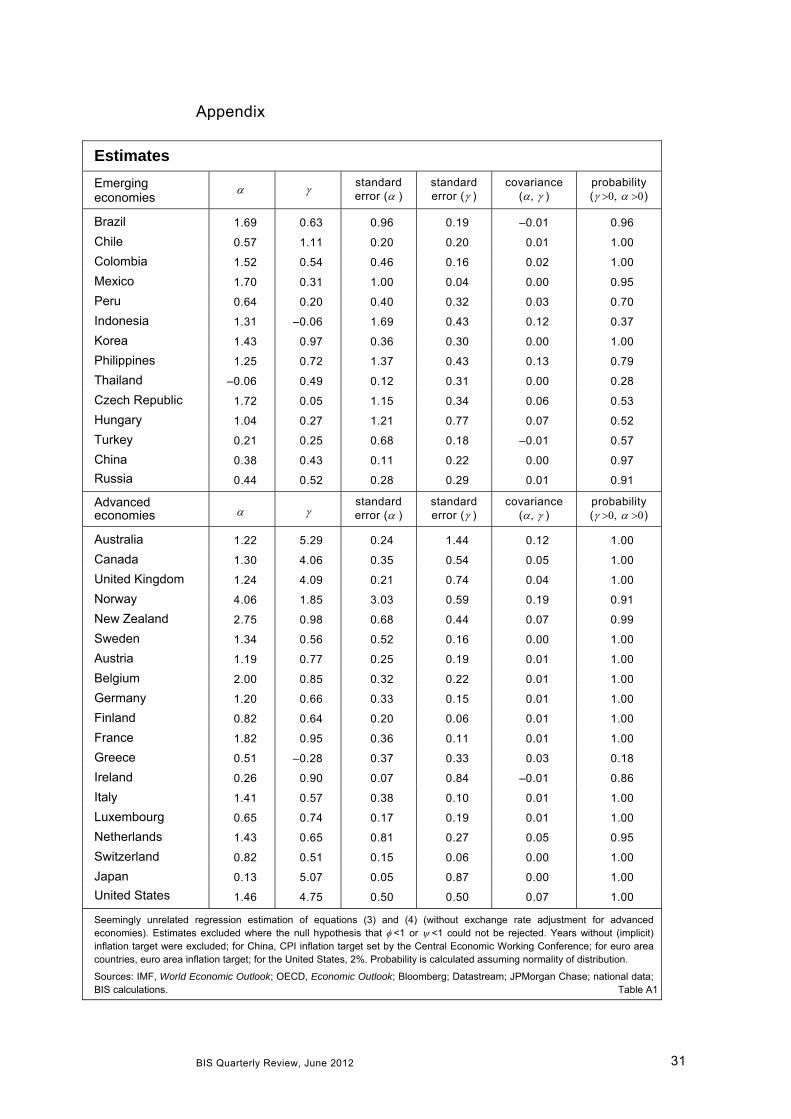
BIS Quarterly Review, June 2012 31
Appendix
Estimates Emerging economies
standard error ()
standard error ()
covariance (, )
probability ()
Brazil 1.69 0.63 0.96 0.19 –0.01 0.96
Chile 0.57 1.11 0.20 0.20 0.01 1.00
Colombia 1.52 0.54 0.46 0.16 0.02 1.00
Mexico 1.70 0.31 1.00 0.04 0.00 0.95
Peru 0.64 0.20 0.40 0.32 0.03 0.70
Indonesia 1.31 –0.06 1.69 0.43 0.12 0.37
Korea 1.43 0.97 0.36 0.30 0.00 1.00
Philippines 1.25 0.72 1.37 0.43 0.13 0.79
Thailand –0.06 0.49 0.12 0.31 0.00 0.28
Czech Republic 1.72 0.05 1.15 0.34 0.06 0.53
Hungary 1.04 0.27 1.21 0.77 0.07 0.52
Turkey 0.21 0.25 0.68 0.18 –0.01 0.57
China 0.38 0.43 0.11 0.22 0.00 0.97
Russia 0.44 0.52 0.28 0.29 0.01 0.91
Advanced economies
standard error ()
standard error ()
covariance (, )
probability ()
Australia 1.22 5.29 0.24 1.44 0.12 1.00
Canada 1.30 4.06 0.35 0.54 0.05 1.00
United Kingdom 1.24 4.09 0.21 0.74 0.04 1.00
Norway 4.06 1.85 3.03 0.59 0.19 0.91
New Zealand 2.75 0.98 0.68 0.44 0.07 0.99
Sweden 1.34 0.56 0.52 0.16 0.00 1.00
Austria 1.19 0.77 0.25 0.19 0.01 1.00
Belgium 2.00 0.85 0.32 0.22 0.01 1.00
Germany 1.20 0.66 0.33 0.15 0.01 1.00
Finland 0.82 0.64 0.20 0.06 0.01 1.00
France 1.82 0.95 0.36 0.11 0.01 1.00
Greece 0.51 –0.28 0.37 0.33 0.03 0.18
Ireland 0.26 0.90 0.07 0.84 –0.01 0.86
Italy 1.41 0.57 0.38 0.10 0.01 1.00
Luxembourg 0.65 0.74 0.17 0.19 0.01 1.00
Netherlands 1.43 0.65 0.81 0.27 0.05 0.95
Switzerland 0.82 0.51 0.15 0.06 0.00 1.00
Japan 0.13 5.07 0.05 0.87 0.00 1.00
United States 1.46 4.75 0.50 0.50 0.07 1.00
Seemingly unrelated regression estimation of equations (3) and (4) (without exchange rate adjustment for advanced economies). Estimates excluded where the null hypothesis that <1 or <1 could not be rejected. Years without (implicit) inflation target were excluded; for China, CPI inflation target set by the Central Economic Working Conference; for euro area countries, euro area inflation target; for the United States, 2%. Probability is calculated assuming normality of distribution.
Sources: IMF, World Economic Outlook; OECD, Economic Outlook; Bloomberg; Datastream; JPMorgan Chase; national data; BIS calculations. Table A1


BIS Quarterly Review, June 2012 33
Dong He
Robert McCauley
Eurodollar banking and currency internationalisation1
It is widely held that currencies of surplus countries, such as China, cannot enjoy wide international use. We argue that the eurodollar market has had little to do with the direction of net capital flows or the US current account balance. It has played different roles over the past 38 years, most of all intermediation among non-US residents. Looking at the eurodollar market could help predict the evolution of the offshore renminbi market. Even if it now mainly serves as a conduit of funds to mainland China from abroad, in the future this market, too, could mainly intermediate between non-Chinese residents.
JEL classification: E4, E5, F3, F4, G15.
Wider international use of emerging market currencies, in particular the
Chinese renminbi, has revived interest in the role of offshore markets (He and
McCauley (2010), Maziad et al (2011), Frankel (2011) and BIS (2011)). In this
special feature, we review the patterns of international flows of funds in the
eurodollar market, focusing on the importance of residents and non-residents in
offshore activity and the market’s role as a conduit for capital flows.
Distinguishing gross flows from net flows, we find that most eurodollar
flows do not finance the US current account (Borio and Disyatat (2011),
Shin (2011)). This finding puts into doubt assertions that international use of
the renminbi requires China to run a current account deficit. It also suggests
that one-way speculative positioning, taken by some critics (Yu (2011)) as the
main impetus for international use of the renminbi, will prove to be temporary.
Rather, we expect that the offshore renminbi market will play the usual
role of intermediating between non-residents, especially as non-Chinese
become willing renminbi borrowers. As He and McCauley (2010) have argued,
offshore markets perform essential economic functions, including separation of
currency and country risks and the diversification of operational risks.
1 The authors are from the Hong Kong Monetary Authority (HKMA) and the Bank for
International Settlements (BIS), respectively. They thank Pablo García-Luna and Karsten von Kleist for research assistance and Claudio Borio, Stephen Cecchetti, Patrick McGuire and Christian Upper for discussion. The views expressed are those of the authors and not necessarily those of the HKMA or the BIS.

34 BIS Quarterly Review, June 2012
Eurodollar banking transactions
Pure offshore transactions
Pure round-trip transactions
International lending – outflow
International lending – inflow
Source: Authors’ adaptation of Dufey and Giddy (1978, p 165; 1994, p 292). Graph 1
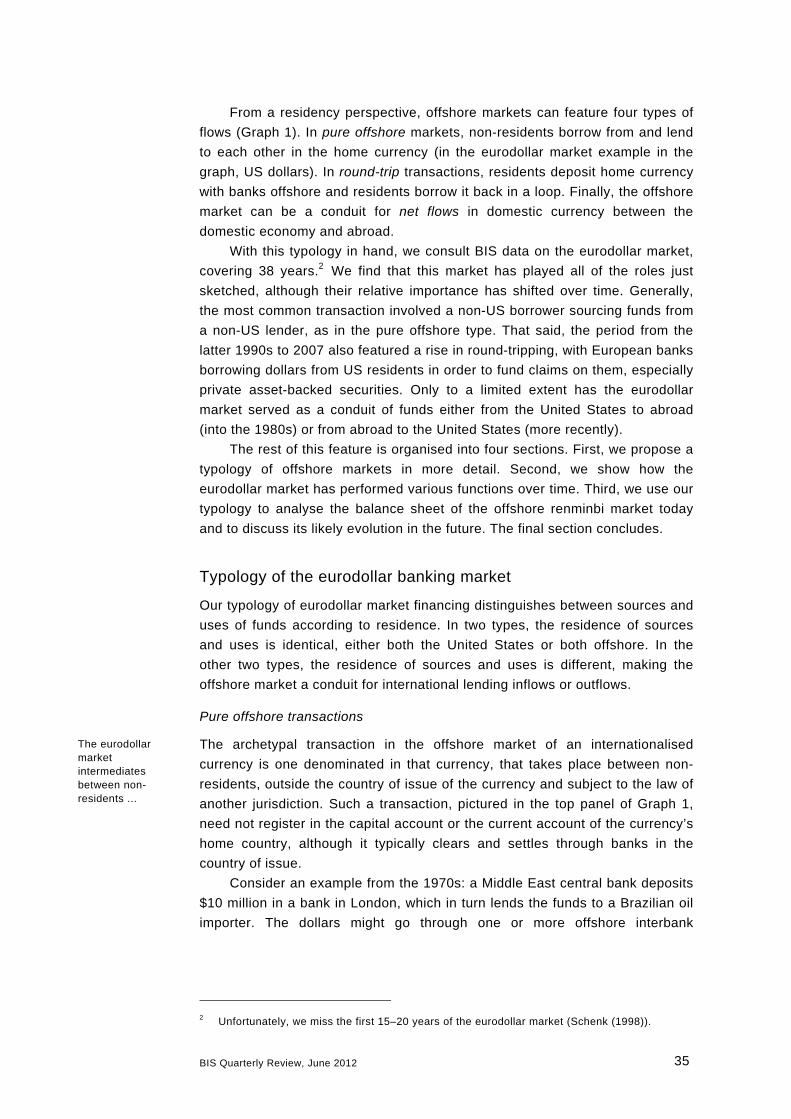
BIS Quarterly Review, June 2012 35
From a residency perspective, offshore markets can feature four types of
flows (Graph 1). In pure offshore markets, non-residents borrow from and lend
to each other in the home currency (in the eurodollar market example in the
graph, US dollars). In round-trip transactions, residents deposit home currency
with banks offshore and residents borrow it back in a loop. Finally, the offshore
market can be a conduit for net flows in domestic currency between the
domestic economy and abroad.
With this typology in hand, we consult BIS data on the eurodollar market,
covering 38 years.2 We find that this market has played all of the roles just
sketched, although their relative importance has shifted over time. Generally,
the most common transaction involved a non-US borrower sourcing funds from
a non-US lender, as in the pure offshore type. That said, the period from the
latter 1990s to 2007 also featured a rise in round-tripping, with European banks
borrowing dollars from US residents in order to fund claims on them, especially
private asset-backed securities. Only to a limited extent has the eurodollar
market served as a conduit of funds either from the United States to abroad
(into the 1980s) or from abroad to the United States (more recently).
The rest of this feature is organised into four sections. First, we propose a
typology of offshore markets in more detail. Second, we show how the
eurodollar market has performed various functions over time. Third, we use our
typology to analyse the balance sheet of the offshore renminbi market today
and to discuss its likely evolution in the future. The final section concludes.
Typology of the eurodollar banking market
Our typology of eurodollar market financing distinguishes between sources and
uses of funds according to residence. In two types, the residence of sources
and uses is identical, either both the United States or both offshore. In the
other two types, the residence of sources and uses is different, making the
offshore market a conduit for international lending inflows or outflows.
Pure offshore transactions
The archetypal transaction in the offshore market of an internationalised
currency is one denominated in that currency, that takes place between non-
residents, outside the country of issue of the currency and subject to the law of
another jurisdiction. Such a transaction, pictured in the top panel of Graph 1,
need not register in the capital account or the current account of the currency’s
home country, although it typically clears and settles through banks in the
country of issue.
Consider an example from the 1970s: a Middle East central bank deposits
$10 million in a bank in London, which in turn lends the funds to a Brazilian oil
importer. The dollars might go through one or more offshore interbank
2 Unfortunately, we miss the first 15–20 years of the eurodollar market (Schenk (1998)).
The eurodollar market intermediates between non-residents ...
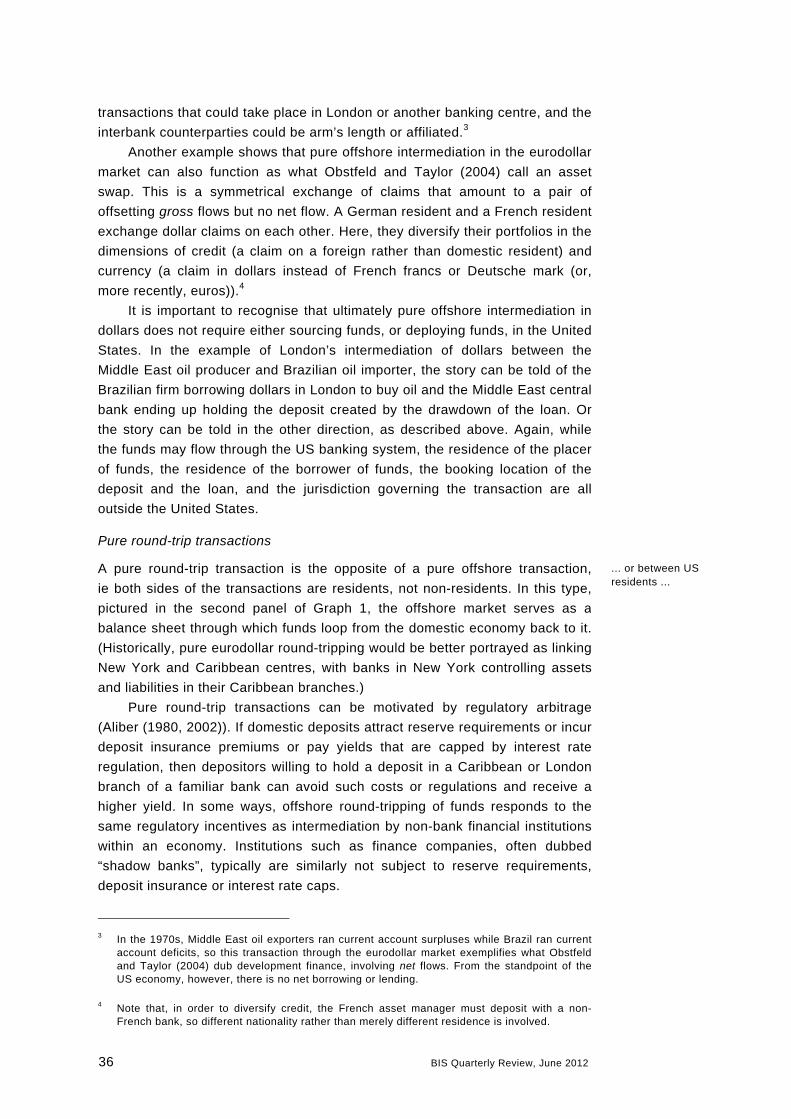
36 BIS Quarterly Review, June 2012
transactions that could take place in London or another banking centre, and the
interbank counterparties could be arm’s length or affiliated.3
Another example shows that pure offshore intermediation in the eurodollar
market can also function as what Obstfeld and Taylor (2004) call an asset
swap. This is a symmetrical exchange of claims that amount to a pair of
offsetting gross flows but no net flow. A German resident and a French resident
exchange dollar claims on each other. Here, they diversify their portfolios in the
dimensions of credit (a claim on a foreign rather than domestic resident) and
currency (a claim in dollars instead of French francs or Deutsche mark (or,
more recently, euros)).4
It is important to recognise that ultimately pure offshore intermediation in
dollars does not require either sourcing funds, or deploying funds, in the United
States. In the example of London’s intermediation of dollars between the
Middle East oil producer and Brazilian oil importer, the story can be told of the
Brazilian firm borrowing dollars in London to buy oil and the Middle East central
bank ending up holding the deposit created by the drawdown of the loan. Or
the story can be told in the other direction, as described above. Again, while
the funds may flow through the US banking system, the residence of the placer
of funds, the residence of the borrower of funds, the booking location of the
deposit and the loan, and the jurisdiction governing the transaction are all
outside the United States.
Pure round-trip transactions
A pure round-trip transaction is the opposite of a pure offshore transaction,
ie both sides of the transactions are residents, not non-residents. In this type,
pictured in the second panel of Graph 1, the offshore market serves as a
balance sheet through which funds loop from the domestic economy back to it.
(Historically, pure eurodollar round-tripping would be better portrayed as linking
New York and Caribbean centres, with banks in New York controlling assets
and liabilities in their Caribbean branches.)
Pure round-trip transactions can be motivated by regulatory arbitrage
(Aliber (1980, 2002)). If domestic deposits attract reserve requirements or incur
deposit insurance premiums or pay yields that are capped by interest rate
regulation, then depositors willing to hold a deposit in a Caribbean or London
branch of a familiar bank can avoid such costs or regulations and receive a
higher yield. In some ways, offshore round-tripping of funds responds to the
same regulatory incentives as intermediation by non-bank financial institutions
within an economy. Institutions such as finance companies, often dubbed
“shadow banks”, typically are similarly not subject to reserve requirements,
deposit insurance or interest rate caps.
3 In the 1970s, Middle East oil exporters ran current account surpluses while Brazil ran current
account deficits, so this transaction through the eurodollar market exemplifies what Obstfeld and Taylor (2004) dub development finance, involving net flows. From the standpoint of the US economy, however, there is no net borrowing or lending.
4 Note that, in order to diversify credit, the French asset manager must deposit with a non-French bank, so different nationality rather than merely different residence is involved.
... or between US residents ...
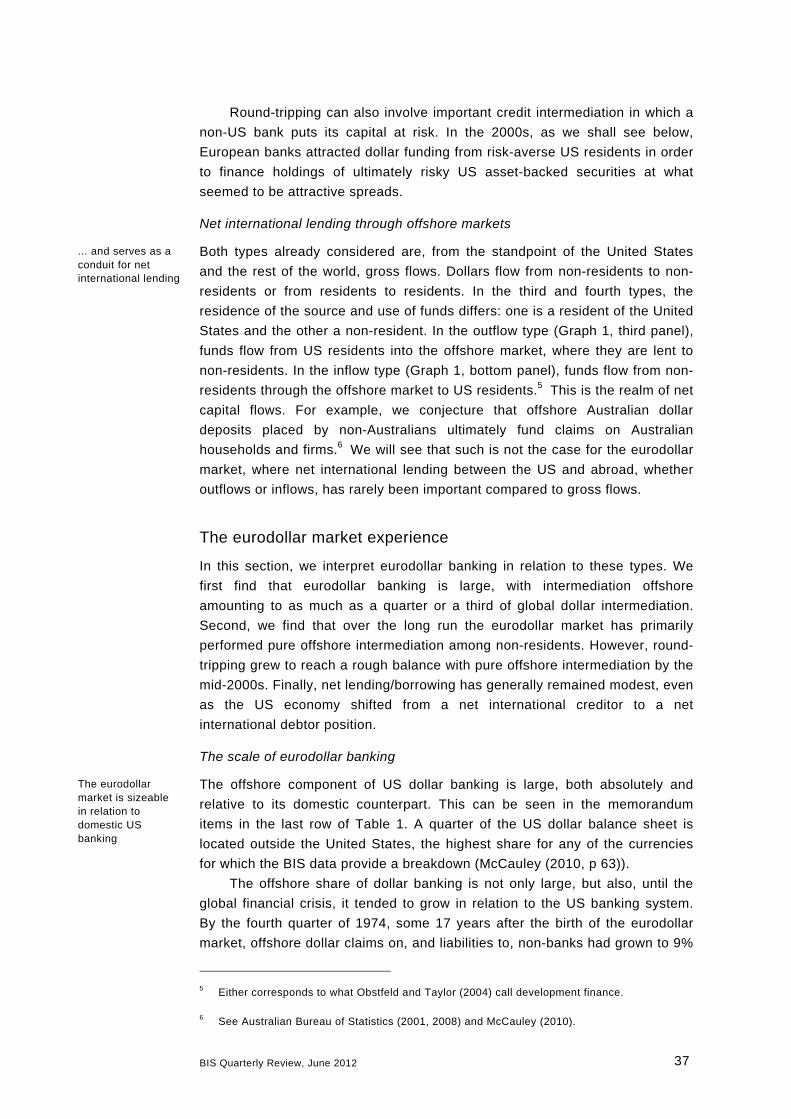
BIS Quarterly Review, June 2012 37
Round-tripping can also involve important credit intermediation in which a
non-US bank puts its capital at risk. In the 2000s, as we shall see below,
European banks attracted dollar funding from risk-averse US residents in order
to finance holdings of ultimately risky US asset-backed securities at what
seemed to be attractive spreads.
Net international lending through offshore markets
Both types already considered are, from the standpoint of the United States
and the rest of the world, gross flows. Dollars flow from non-residents to non-
residents or from residents to residents. In the third and fourth types, the
residence of the source and use of funds differs: one is a resident of the United
States and the other a non-resident. In the outflow type (Graph 1, third panel),
funds flow from US residents into the offshore market, where they are lent to
non-residents. In the inflow type (Graph 1, bottom panel), funds flow from non-
residents through the offshore market to US residents.5 This is the realm of net
capital flows. For example, we conjecture that offshore Australian dollar
deposits placed by non-Australians ultimately fund claims on Australian
households and firms.6 We will see that such is not the case for the eurodollar
market, where net international lending between the US and abroad, whether
outflows or inflows, has rarely been important compared to gross flows.
The eurodollar market experience
In this section, we interpret eurodollar banking in relation to these types. We
first find that eurodollar banking is large, with intermediation offshore
amounting to as much as a quarter or a third of global dollar intermediation.
Second, we find that over the long run the eurodollar market has primarily
performed pure offshore intermediation among non-residents. However, round-
tripping grew to reach a rough balance with pure offshore intermediation by the
mid-2000s. Finally, net lending/borrowing has generally remained modest, even
as the US economy shifted from a net international creditor to a net
international debtor position.
The scale of eurodollar banking
The offshore component of US dollar banking is large, both absolutely and
relative to its domestic counterpart. This can be seen in the memorandum
items in the last row of Table 1. A quarter of the US dollar balance sheet is
located outside the United States, the highest share for any of the currencies
for which the BIS data provide a breakdown (McCauley (2010, p 63)).
The offshore share of dollar banking is not only large, but also, until the
global financial crisis, it tended to grow in relation to the US banking system.
By the fourth quarter of 1974, some 17 years after the birth of the eurodollar
market, offshore dollar claims on, and liabilities to, non-banks had grown to 9%
5 Either corresponds to what Obstfeld and Taylor (2004) call development finance.
6 See Australian Bureau of Statistics (2001, 2008) and McCauley (2010).
The eurodollar market is sizeable in relation to domestic US banking
... and serves as a conduit for net international lending
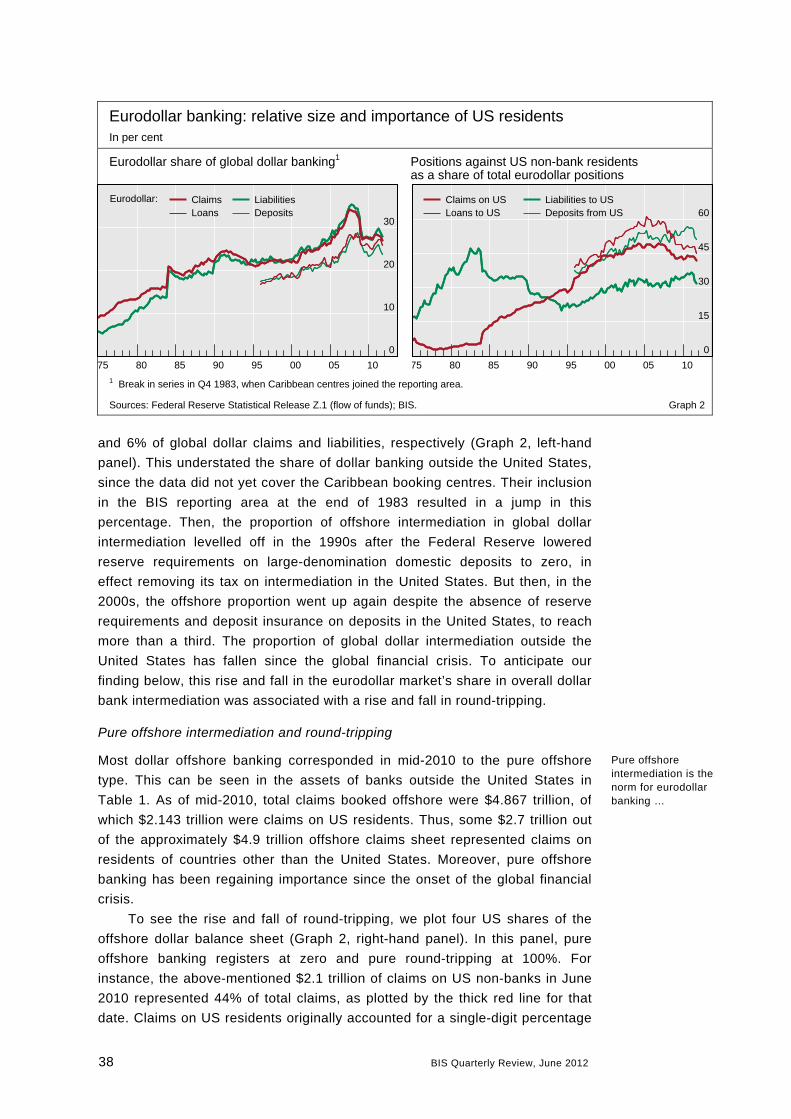
38 BIS Quarterly Review, June 2012
and 6% of global dollar claims and liabilities, respectively (Graph 2, left-hand
panel). This understated the share of dollar banking outside the United States,
since the data did not yet cover the Caribbean booking centres. Their inclusion
in the BIS reporting area at the end of 1983 resulted in a jump in this
percentage. Then, the proportion of offshore intermediation in global dollar
intermediation levelled off in the 1990s after the Federal Reserve lowered
reserve requirements on large-denomination domestic deposits to zero, in
effect removing its tax on intermediation in the United States. But then, in the
2000s, the offshore proportion went up again despite the absence of reserve
requirements and deposit insurance on deposits in the United States, to reach
more than a third. The proportion of global dollar intermediation outside the
United States has fallen since the global financial crisis. To anticipate our
finding below, this rise and fall in the eurodollar market’s share in overall dollar
bank intermediation was associated with a rise and fall in round-tripping.
Pure offshore intermediation and round-tripping
Most dollar offshore banking corresponded in mid-2010 to the pure offshore
type. This can be seen in the assets of banks outside the United States in
Table 1. As of mid-2010, total claims booked offshore were $4.867 trillion, of
which $2.143 trillion were claims on US residents. Thus, some $2.7 trillion out
of the approximately $4.9 trillion offshore claims sheet represented claims on
residents of countries other than the United States. Moreover, pure offshore
banking has been regaining importance since the onset of the global financial
crisis.
To see the rise and fall of round-tripping, we plot four US shares of the
offshore dollar balance sheet (Graph 2, right-hand panel). In this panel, pure
offshore banking registers at zero and pure round-tripping at 100%. For
instance, the above-mentioned $2.1 trillion of claims on US non-banks in June
2010 represented 44% of total claims, as plotted by the thick red line for that
date. Claims on US residents originally accounted for a single-digit percentage
Eurodollar banking: relative size and importance of US residents In per cent
Eurodollar share of global dollar banking1 Positions against US non-bank residents as a share of total eurodollar positions
0
10
20
30
75 80 85 90 95 00 05 10
Eurodollar: ClaimsLoans
LiabilitiesDeposits
0
15
30
45
60
75 80 85 90 95 00 05 10
Claims on USLoans to US
Liabilities to USDeposits from US
1 Break in series in Q4 1983, when Caribbean centres joined the reporting area.
Sources: Federal Reserve Statistical Release Z.1 (flow of funds); BIS. Graph 2
Pure offshore intermediation is the norm for eurodollar banking …
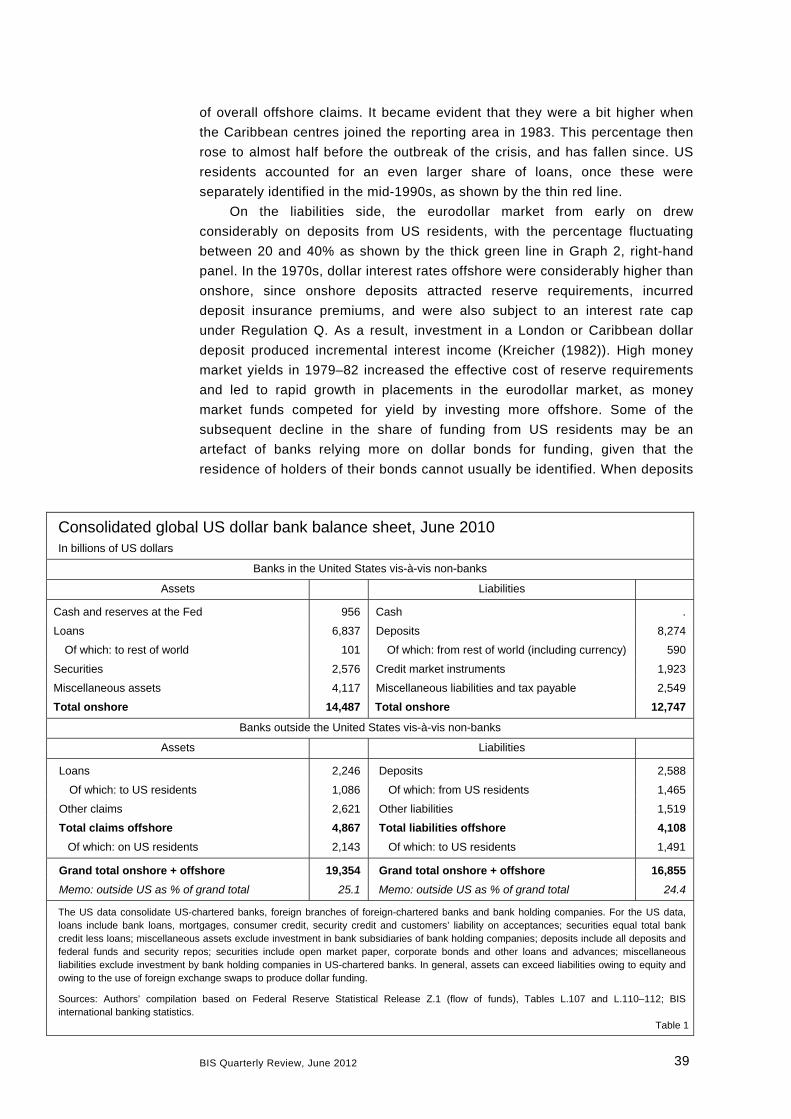
BIS Quarterly Review, June 2012 39
of overall offshore claims. It became evident that they were a bit higher when
the Caribbean centres joined the reporting area in 1983. This percentage then
rose to almost half before the outbreak of the crisis, and has fallen since. US
residents accounted for an even larger share of loans, once these were
separately identified in the mid-1990s, as shown by the thin red line.
On the liabilities side, the eurodollar market from early on drew
considerably on deposits from US residents, with the percentage fluctuating
between 20 and 40% as shown by the thick green line in Graph 2, right-hand
panel. In the 1970s, dollar interest rates offshore were considerably higher than
onshore, since onshore deposits attracted reserve requirements, incurred
deposit insurance premiums, and were also subject to an interest rate cap
under Regulation Q. As a result, investment in a London or Caribbean dollar
deposit produced incremental interest income (Kreicher (1982)). High money
market yields in 1979–82 increased the effective cost of reserve requirements
and led to rapid growth in placements in the eurodollar market, as money
market funds competed for yield by investing more offshore. Some of the
subsequent decline in the share of funding from US residents may be an
artefact of banks relying more on dollar bonds for funding, given that the
residence of holders of their bonds cannot usually be identified. When deposits
Consolidated global US dollar bank balance sheet, June 2010 In billions of US dollars
Banks in the United States vis-à-vis non-banks
Assets Liabilities
Cash and reserves at the Fed 956 Cash .
Loans 6,837 Deposits 8,274
Of which: to rest of world 101 Of which: from rest of world (including currency) 590
Securities 2,576 Credit market instruments 1,923
Miscellaneous assets 4,117 Miscellaneous liabilities and tax payable 2,549
Total onshore 14,487 Total onshore 12,747
Banks outside the United States vis-à-vis non-banks
Assets Liabilities
Loans 2,246 Deposits 2,588
Of which: to US residents 1,086 Of which: from US residents 1,465
Other claims 2,621 Other liabilities 1,519
Total claims offshore 4,867 Total liabilities offshore 4,108 Of which: on US residents 2,143 Of which: to US residents 1,491
Grand total onshore + offshore 19,354 Grand total onshore + offshore 16,855 Memo: outside US as % of grand total 25.1 Memo: outside US as % of grand total 24.4
The US data consolidate US-chartered banks, foreign branches of foreign-chartered banks and bank holding companies. For the US data, loans include bank loans, mortgages, consumer credit, security credit and customers’ liability on acceptances; securities equal total bank credit less loans; miscellaneous assets exclude investment in bank subsidiaries of bank holding companies; deposits include all deposits and federal funds and security repos; securities include open market paper, corporate bonds and other loans and advances; miscellaneous liabilities exclude investment by bank holding companies in US-chartered banks. In general, assets can exceed liabilities owing to equity and owing to the use of foreign exchange swaps to produce dollar funding.
Sources: Authors’ compilation based on Federal Reserve Statistical Release Z.1 (flow of funds), Tables L.107 and L.110–112; BIS international banking statistics. Table 1
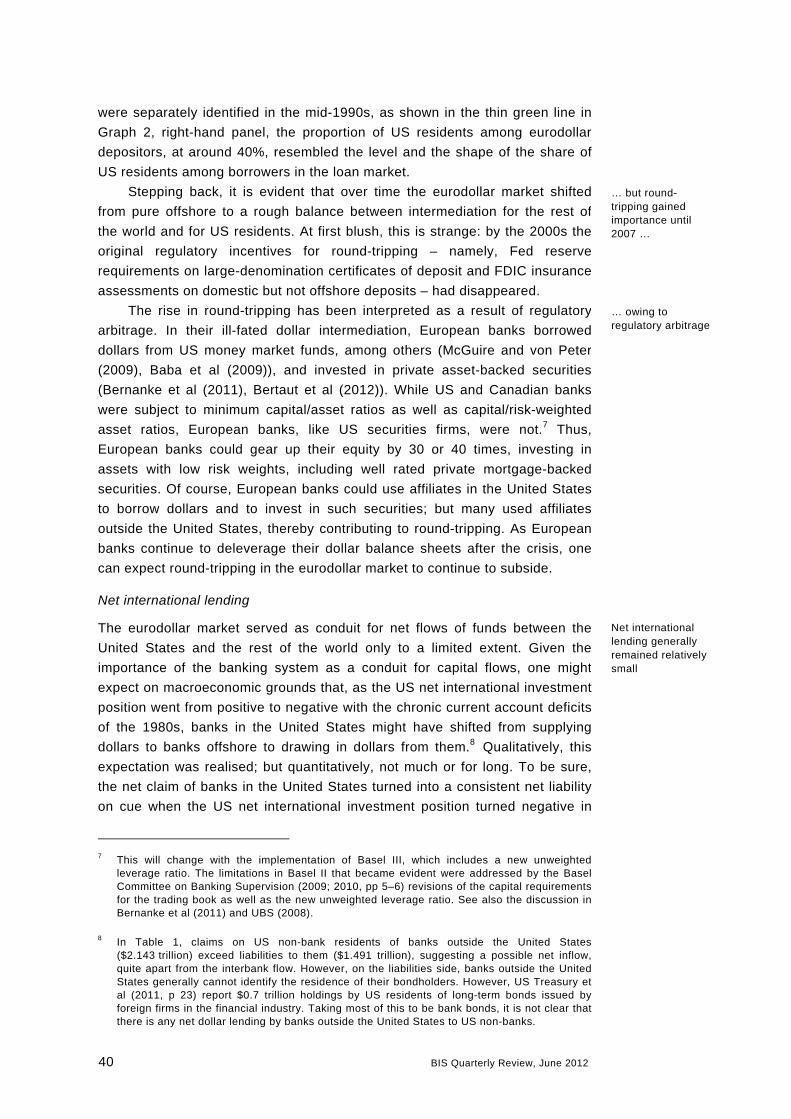
40 BIS Quarterly Review, June 2012
were separately identified in the mid-1990s, as shown in the thin green line in
Graph 2, right-hand panel, the proportion of US residents among eurodollar
depositors, at around 40%, resembled the level and the shape of the share of
US residents among borrowers in the loan market.
Stepping back, it is evident that over time the eurodollar market shifted
from pure offshore to a rough balance between intermediation for the rest of
the world and for US residents. At first blush, this is strange: by the 2000s the
original regulatory incentives for round-tripping – namely, Fed reserve
requirements on large-denomination certificates of deposit and FDIC insurance
assessments on domestic but not offshore deposits – had disappeared.
The rise in round-tripping has been interpreted as a result of regulatory
arbitrage. In their ill-fated dollar intermediation, European banks borrowed
dollars from US money market funds, among others (McGuire and von Peter
(2009), Baba et al (2009)), and invested in private asset-backed securities
(Bernanke et al (2011), Bertaut et al (2012)). While US and Canadian banks
were subject to minimum capital/asset ratios as well as capital/risk-weighted
asset ratios, European banks, like US securities firms, were not.7 Thus,
European banks could gear up their equity by 30 or 40 times, investing in
assets with low risk weights, including well rated private mortgage-backed
securities. Of course, European banks could use affiliates in the United States
to borrow dollars and to invest in such securities; but many used affiliates
outside the United States, thereby contributing to round-tripping. As European
banks continue to deleverage their dollar balance sheets after the crisis, one
can expect round-tripping in the eurodollar market to continue to subside.
Net international lending
The eurodollar market served as conduit for net flows of funds between the
United States and the rest of the world only to a limited extent. Given the
importance of the banking system as a conduit for capital flows, one might
expect on macroeconomic grounds that, as the US net international investment
position went from positive to negative with the chronic current account deficits
of the 1980s, banks in the United States might have shifted from supplying
dollars to banks offshore to drawing in dollars from them.8 Qualitatively, this
expectation was realised; but quantitatively, not much or for long. To be sure,
the net claim of banks in the United States turned into a consistent net liability
on cue when the US net international investment position turned negative in
7 This will change with the implementation of Basel III, which includes a new unweighted
leverage ratio. The limitations in Basel II that became evident were addressed by the Basel Committee on Banking Supervision (2009; 2010, pp 5–6) revisions of the capital requirements for the trading book as well as the new unweighted leverage ratio. See also the discussion in Bernanke et al (2011) and UBS (2008).
8 In Table 1, claims on US non-bank residents of banks outside the United States ($2.143 trillion) exceed liabilities to them ($1.491 trillion), suggesting a possible net inflow, quite apart from the interbank flow. However, on the liabilities side, banks outside the United States generally cannot identify the residence of their bondholders. However, US Treasury et al (2011, p 23) report $0.7 trillion holdings by US residents of long-term bonds issued by foreign firms in the financial industry. Taking most of this to be bank bonds, it is not clear that there is any net dollar lending by banks outside the United States to US non-banks.
Net international lending generally remained relatively small
… owing to regulatory arbitrage
… but round-tripping gained importance until 2007 …
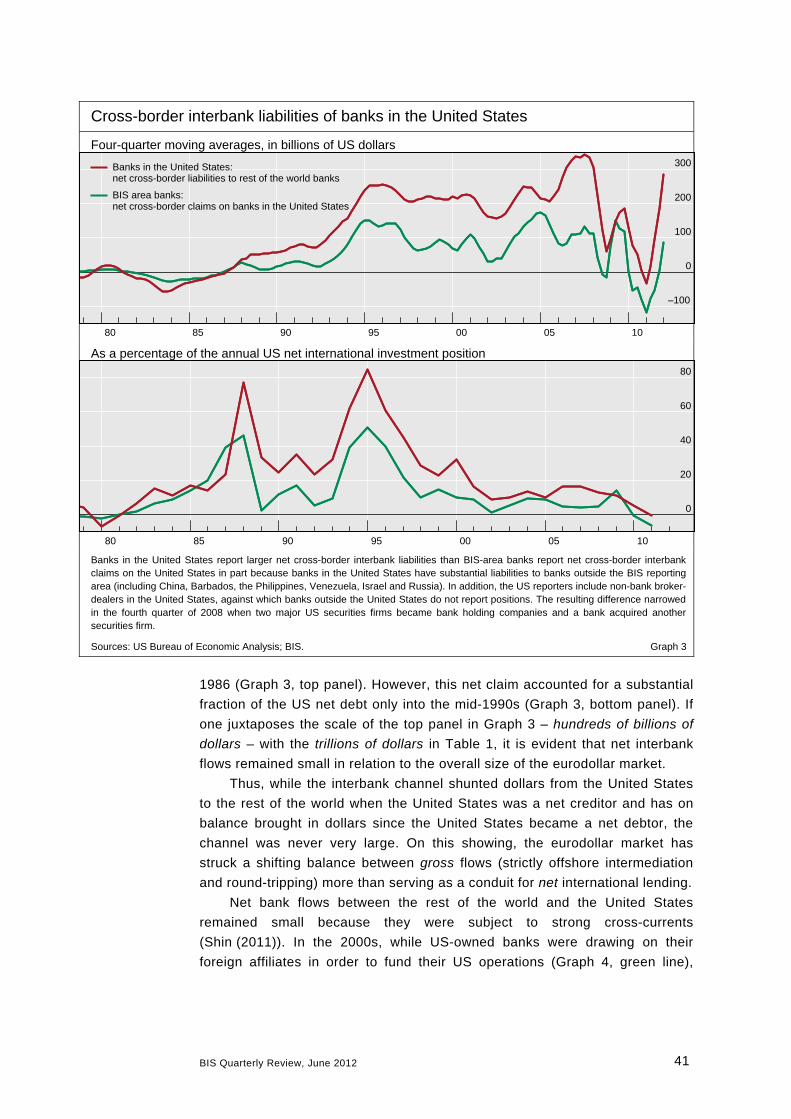
BIS Quarterly Review, June 2012 41
1986 (Graph 3, top panel). However, this net claim accounted for a substantial
fraction of the US net debt only into the mid-1990s (Graph 3, bottom panel). If
one juxtaposes the scale of the top panel in Graph 3 – hundreds of billions of dollars – with the trillions of dollars in Table 1, it is evident that net interbank
flows remained small in relation to the overall size of the eurodollar market.
Thus, while the interbank channel shunted dollars from the United States
to the rest of the world when the United States was a net creditor and has on
balance brought in dollars since the United States became a net debtor, the
channel was never very large. On this showing, the eurodollar market has
struck a shifting balance between gross flows (strictly offshore intermediation
and round-tripping) more than serving as a conduit for net international lending.
Net bank flows between the rest of the world and the United States
remained small because they were subject to strong cross-currents
(Shin (2011)). In the 2000s, while US-owned banks were drawing on their
foreign affiliates in order to fund their US operations (Graph 4, green line),
Cross-border interbank liabilities of banks in the United States
Four-quarter moving averages, in billions of US dollars
–100
0
100
200
300
80 85 90 95 00 05 10
Banks in the United States: net cross-border liabilities to rest of the world banks
BIS area banks: net cross-border claims on banks in the United States
As a percentage of the annual US net international investment position
0
20
40
60
80
80 85 90 95 00 05 10
Banks in the United States report larger net cross-border interbank liabilities than BIS-area banks report net cross-border interbank claims on the United States in part because banks in the United States have substantial liabilities to banks outside the BIS reporting area (including China, Barbados, the Philippines, Venezuela, Israel and Russia). In addition, the US reporters include non-bank broker-dealers in the United States, against which banks outside the United States do not report positions. The resulting difference narrowed in the fourth quarter of 2008 when two major US securities firms became bank holding companies and a bank acquired another securities firm.
Sources: US Bureau of Economic Analysis; BIS. Graph 3
42 BIS Quarterly Review, June 2012
foreign-owned banks borrowed in the United States and forwarded the
proceeds to their offices abroad (Graph 4, blue line).9
In summary, the eurodollar banking market has played various roles in
international finance over time. Most characteristically, it has served as an
intermediary between non-US placers of dollars and non-US borrowers of
dollars. The element of round-tripping between US depositors and US
borrowers grew over time and peaked at close to half the market in 2007. Net
interbank flows have remained modest, even as the US economy shifted from a
net international asset position to a net international liability position. The
eurodollar market has intermediated funds mainly between borrowers and
lenders outside the United States and to a lesser extent between borrowers
and lenders within the United States, but hardly at all between borrowers in the
United States and lenders abroad. This experience provides useful perspective
on the current role of the offshore renminbi market.
Lessons for renminbi offshore banking
At present, the renminbi balance sheet of banks in Hong Kong SAR serves as
a conduit for net renminbi lending from the rest of the world to the mainland.
Through it, non-residents stake renminbi claims on mainland China. Deposits in
renminbi by residents of Hong Kong and the rest of the world outside the
mainland comprise the main source of funds. On the uses side, banks have
claims on entities on the mainland, including the central bank, and some
interbank claims and investments in government and corporate bonds.
Renminbi bonds issued by non-banks and held outside the banking
system, which are not captured in Table 2, tend also to result in a net renminbi
claim of the rest of the world on China. The government, government agencies,
9 Recently, these positions have fallen in absolute value under the combined influence of Dodd-
Frank’s change in the assessment base for FDIC insurance and the Federal Reserve’s second round of US Treasury purchases (Kreicher et al (2012)).
Net cross-border interbank liabilities of banks in the United States In billions of US dollars
–600
–400
–200
0
200
400
600
76 78 80 82 84 86 88 90 92 94 96 98 00 02 04 06 08 10
TotalUS-chartered banksBranches of foreign banks
US-chartered banks include subsidiaries of foreign banks; flow of funds data treat international banking facilities as outside the United States. The vertical lines denote August 2007 (interbank strains), September 2008 (Lehman failure), July 2010 (Dodd-Frank) and end-March 2011 (FDIC assessment on non-deposit liabilities).
Source: Federal Reserve Statistical Release Z.1 (flow of funds). Graph 4

BIS Quarterly Review, June 2012 43
banks and firms resident on the mainland probably account for the majority of
the ultimate renminbi obligations associated with $40 billion equivalent of
renminbi bonds issued by others than banks resident in Hong Kong.10
As things stand, pure offshore intermediation in the renminbi offshore
market accounts for a minority of activity there. At the end of 2011, loans and
advances in renminbi booked by banks in Hong Kong were only CNY 31 billion,
about 3% of total assets, and in addition a good part of the CNY 222 billion in
negotiable debt instruments comprised trade claims on non-banks resident
outside the mainland. Their sum, which can be taken as the upper limit of pure
offshore intermediation, remains well below the CNY 588 billion in deposits
(Table 2).11 If the renminbi offshore market were to follow the eurodollar
market, this pure offshore intermediation would rise. Indeed, loans and
advances in renminbi booked by Hong Kong banks grew rapidly in the first
quarter of 2012.
For its part, pure round-tripping accounts for little, if any, activity in the
renminbi offshore market. As the offshore yields on renminbi deposits and
bonds have been significantly lower than onshore, there is little incentive for
mainland residents to invest in offshore renminbi assets. Rather, their interest
lies in issuing renminbi liabilities offshore.
This structure of bank balance sheets and bond issuance and holdings,
however, reflects factors that are likely to prove temporary. In particular, the
mainland Chinese authorities have only started to open the domestic capital
market to participation by non-residents, and have retained significant
10 According to BIS international securities data, three quarters of renminbi offshore bonds are
sold by issuers of Chinese nationality, including issuers incorporated outside China but with beneficial ownership by Chinese entities.
11 Note that offshore renminbi deposits are still tiny compared to onshore deposits. Onshore deposits amounted to CNY 78 trillion at the end of 2011. In other words, offshore renminbi deposits were less than 1% of onshore deposits.
Renminbi balance sheet of banks in Hong Kong SAR, end-2011 In billions of renminbi
Assets Liabilities
Due from banks 665.4 Deposits 588.5
Of which: due from overseas banks 121.7 Personal 174.0
Loans and advances 31.0 Corporate 414.5
Negotiable debt instruments 222.3 Negotiable debt instruments 78.5
Other assets 62.6 Due to banks 184.2
Of which: due to overseas banks 116.4
Other liabilities 130.4
Total 981.6 Total 981.6
Memo: US dollar equivalent 151.8
“Overseas banks” means banks from areas outside Hong Kong SAR and mainland China. Other assets/other liabilities include items such as amount receivable/payable under reverse repos/repos, unrealised mark-to-market gains/loss of derivatives and the amount to balance a single currency balance sheet, which is a subset of the balance sheet of all currencies. The end-2011 renminbi/dollar rate was 6.463, according to the Federal Reserve G.5A release.
Source: Hong Kong Monetary Authority. Table 2
Pure offshore intermediation is a minority of offshore renminbi market activity…
… reflecting current policy
44 BIS Quarterly Review, June 2012
restrictions on capital flows, particularly on outflows (McCauley (2011)).
Expectations of a sharp renminbi appreciation have also dampened the
willingness of non-residents to borrow in renminbi.
Looking forward, the offshore renminbi market could evolve to play
different roles. Capital flows can be expected to become two-way and more
balanced with capital account liberalisation (He et al (2012)).12 The expected
path of the renminbi exchange rate shows much less consistent appreciation,
even as the Chinese current account surplus has narrowed. Thus, non-resident
borrowing in the renminbi looks to be less discouraged by one-way
expectations on the exchange rate.13 In this case, the renminbi offshore market
in Hong Kong (and in other financial centres) can be expected to evolve along
the paths of the other types of offshore markets.
Conclusions
The eurodollar market has played different roles over the last 38 years.
Originally, although US residents held net dollar claims on the rest of the world
through it and round-tripped dollar funds through it, it mostly intermediated
between non-US residents. The eurodollar market reached its maximum size
relative to domestic US intermediation before the recent global financial crisis
on the strength of round-tripping, as European banks sold US investors low-risk
placements and bought risky US debts. As European banks deleverage, this
round-tripping is shrinking as a share of eurodollar banking, restoring
intermediation between non-US residents as the increasingly characteristic
eurodollar banking transaction.
An inference is that the current role of the offshore renminbi market as a
conduit of funds from the rest of the world to the mainland may not be its last
role. Over time, the renminbi offshore market is likely to play above all the role
of intermediary between non-mainland borrowers and lenders.
12 High levels of required reserves on deposits in mainland banks could with more openness
encourage round-tripping, but the central bank’s practice of remunerating required reserves would limit the incentive to round-trip. See Ma et al (2011)).
13 Cheung et al (2011) argue that a payoff to China from renminbi internationalisation would come from non-residents borrowing renminbi and thereby sharing China’s short renminbi, long foreign currency position and its associated risk.
BIS Quarterly Review, June 2012 45
References
Aliber, R (1980): “The integration of the offshore and domestic banking
system”, Journal of Monetary Economics, vol 6, no 4, October, pp 509–26.
——— (2002): The new international money game, 6th edition, Chicago:
University of Chicago Press.
Australian Bureau of Statistics (2001): “Measuring Australia’s foreign currency
exposure”, Balance of payments and international investment position,
Australia, December.
——— (2008): Balance of payments and international investment position, June 2008, 1 September.
Baba, N, R McCauley and S Ramaswamy (2009): “US dollar money market
funds and non-US banks”, BIS Quarterly Review, March, pp 65–81.
Bank for International Settlements (2011): “Currency internationalisation:
lessons from the global financial crisis and prospects for the future in Asia and
the Pacific”, BIS Papers, no 61, December.
Basel Committee on Banking Supervision (2009): Revisions to the Basel II market risk framework, July.
——— (2010): The Basel Committee’s response to the financial crisis: report to the G20, October.
Bernanke, B, C Bertaut, L DeMarco and S Kamin (2011): “International capital
flows and the returns to safe assets in the United States, 2003–2007”,
International Finance Discussion Papers, no 1014, February.
Bertaut, C, L DeMarco, S Kamin and R Tryon (2012): “ABS inflows to the
United States and global financial crisis”, working paper.
Borio, C and P Disyatat (2011): “Global imbalances and the financial crisis: link
or no link?”, BIS Working Papers, no 346, May.
Cheung, Y W, G Ma and R McCauley (2011): “Why does China attempt to
internationalise the renminbi?”, in J Golley and L Song (eds), China rising: Global challenges and opportunities, Canberra: Australian National University
Press and Social Sciences Research Press (China), pp 45–68.
Dufey, G and I Giddy (1978, 1994): The international money market, 1st and
2nd editions, Englewood Cliffs, New Jersey: Prentice-Hall.
Frankel, J (2011): “Historical precedents for internationalization of the RMB”,
paper presented to the Council on Foreign Relations / China Development
Research Foundation symposium on the internationalisation of the renminbi,
31 October–1 November 2011, Beijing.
He, D and R McCauley (2010): “Offshore markets for the domestic currency:
monetary and financial stability issues”, BIS Working Papers, no 320,
September, also forthcoming in Yin-Wong Cheung and Jakob de Haan (eds),
The evolving role of China in the global economy, Cambridge: MIT Press.
46 BIS Quarterly Review, June 2012
He, D, L Cheung, W Zhang and T Wu (2012): “How would capital account
liberalisation affect China’s capital flows and the renminbi real exchange
rates?”, HKIMR Working Paper, no 9/2012.
Kreicher, L (1982): “Eurodollar arbitrage”, Federal Reserve Bank of New York Quarterly Review, Summer, pp 10–22.
Kreicher, L, R McCauley and P McGuire (2012): “Excess Fed reserves, Dodd-
Frank and global dollar arbitrage”, working paper, forthcoming.
Ma, G, Yan Xiandong and Liu Xi (2011): “China’s reserve requirements:
practices, effects and implications”, BIS Working Papers, no 360, November.
Maziad, S, P Farahmand, S Wang, S Segal and F Ahmed (2011):
“Internationalization of emerging market currencies: a balance between risks
and rewards”, IMF Staff Discussion Note, SDN/11/17, 19 October.
McCauley, R (2010): “Internationalising the Australian dollar”, in C Shu and
W Peng (eds), Currency internationalization: international experiences and implications for the renminbi, Palgrave Macmillan, Basingstoke, pp 56–77.
——— (2011): “Renminbi internationalisation and China’s financial
development”, BIS Quarterly Review, December, pp 41–56.
McGuire, P and G von Peter (2009): “The US dollar shortage in global
banking”, BIS Quarterly Review, March, pp 47–63.
Obstfeld, M and A Taylor (2004): Global capital markets: integration, crisis, and growth, Cambridge University Press.
Schenk, C (1998): “The origins of the eurodollar market in London:
1955–1963”, Explorations in Economic History, vol 35, pp 221–38.
Shin, H (2011): “Global banking glut and loan risk premium”, Mundell-Fleming
Lecture, IMF, 6 November.
UBS (2008): Shareholder report on UBS's write-downs, 18 April.
Yu, Yongding (2011): “The renminbi’s journey to the world”, Research Centre
for International Finance Policy Brief No. 2011.034, Chinese Academy of Social
Sciences. Available at www.project-syndicate.org.
US Treasury, Federal Reserve Bank of New York and Board of Governors of
the Federal Reserve (2011): Report on U.S. portfolio holdings of foreign securities as of December 31, 2010, October.
BIS Quarterly Review, June 2012 47
Andrew Filardo
James Yetman
The expansion of central bank balance sheets in emerging Asia: what are the risks?1
Central bank balance sheets in emerging Asia expanded rapidly over the past decade because of the unprecedented rise in foreign reserve assets. The corresponding expansion of the central banks’ liabilities has created dangers – risks of inflation and financial instability and financial market distortions – that require attention.
JEL classification: E58, E61.
What risks arise from the rapid expansion of central bank balance sheets in
emerging Asia? This question has been attracting great interest in recent years
because of the past decade’s rapid increase of balance sheets to record levels.
Most of the balance sheet growth has been in foreign exchange reserve assets,
which to some extent reflects efforts to bolster such reserves in the aftermath of
the late 1990s Asian financial crisis. Increasingly, however, the foreign reserve
accumulation has been the by-product of resistance to appreciation of the
domestic currency. Central banks have funded this asset accumulation in a
variety of ways, including the extensive use of required reserves and
remunerated excess reserves and the issuance of central bank paper.
This special feature explores whether the expansion of central bank
balance sheets may contribute to risks of inflation and financial instability and to
financial market distortions. The first section highlights the salient trends in
central bank assets and liabilities in emerging Asia. The second discusses some
of the policy risks that the expansion of central bank balance sheets may pose
for the region. The third considers the policy challenges ahead.
The expansion of central bank balance sheets in emerging Asia
The size of central bank balance sheets in emerging Asia has reached
historically high levels over the past decade (Graph 1). For the nine Asian
1 This article draws heavily on the presentations at the Bank of Thailand-BIS Research
Conference entitled “Central bank balance sheets in Asia and the Pacific: the policy challenges ahead”, held in Chiang Mai, Thailand, on 12–13 December 2011 (see www.bis.org/events/cbbsap.htm and BIS Papers, no 66 (2012)). The views expressed in this article are those of the authors and do not necessarily reflect those of the BIS. We are grateful to Claudio Borio, Stephen Cecchetti, Dietrich Domanski, Robert McCauley, Philip Turner and Christian Upper for comments and to Lillie Lam for research assistance.
Central bank balance sheets have grown rapidly
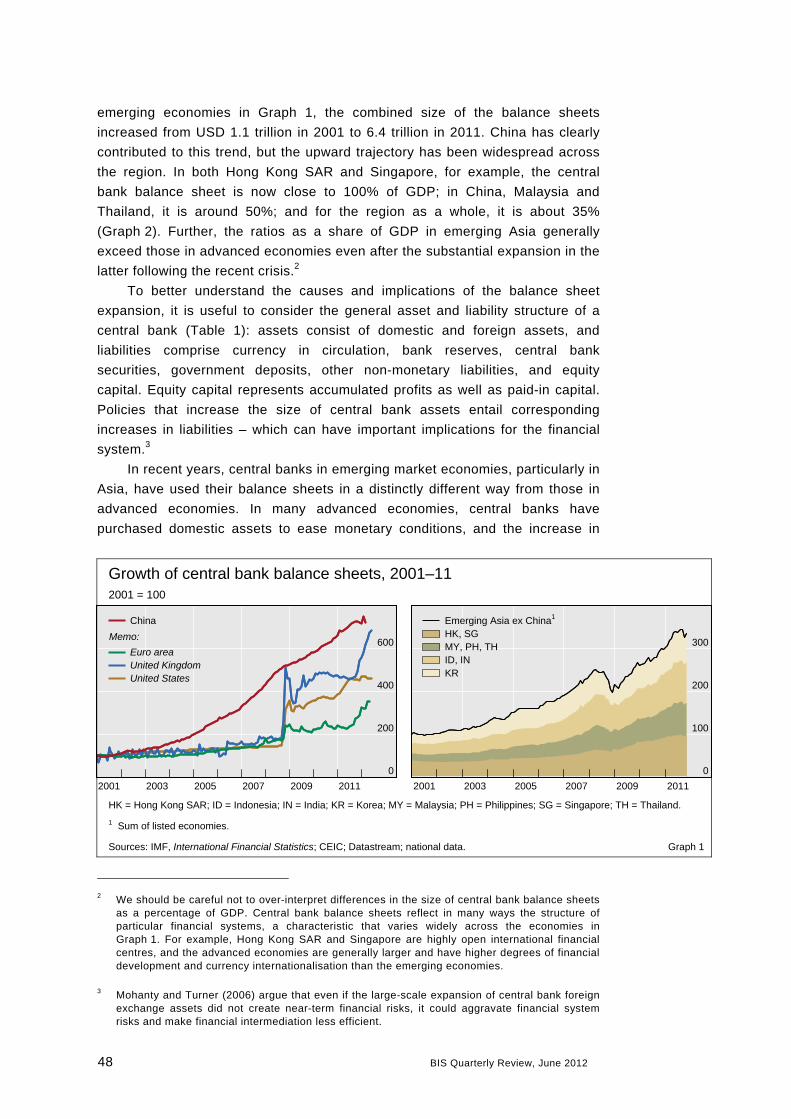
48 BIS Quarterly Review, June 2012
emerging economies in Graph 1, the combined size of the balance sheets
increased from USD 1.1 trillion in 2001 to 6.4 trillion in 2011. China has clearly
contributed to this trend, but the upward trajectory has been widespread across
the region. In both Hong Kong SAR and Singapore, for example, the central
bank balance sheet is now close to 100% of GDP; in China, Malaysia and
Thailand, it is around 50%; and for the region as a whole, it is about 35%
(Graph 2). Further, the ratios as a share of GDP in emerging Asia generally
exceed those in advanced economies even after the substantial expansion in the
latter following the recent crisis.2
To better understand the causes and implications of the balance sheet
expansion, it is useful to consider the general asset and liability structure of a
central bank (Table 1): assets consist of domestic and foreign assets, and
liabilities comprise currency in circulation, bank reserves, central bank
securities, government deposits, other non-monetary liabilities, and equity
capital. Equity capital represents accumulated profits as well as paid-in capital.
Policies that increase the size of central bank assets entail corresponding
increases in liabilities – which can have important implications for the financial
system.3
In recent years, central banks in emerging market economies, particularly in
Asia, have used their balance sheets in a distinctly different way from those in
advanced economies. In many advanced economies, central banks have
purchased domestic assets to ease monetary conditions, and the increase in
2 We should be careful not to over-interpret differences in the size of central bank balance sheets
as a percentage of GDP. Central bank balance sheets reflect in many ways the structure of particular financial systems, a characteristic that varies widely across the economies in Graph 1. For example, Hong Kong SAR and Singapore are highly open international financial centres, and the advanced economies are generally larger and have higher degrees of financial development and currency internationalisation than the emerging economies.
3 Mohanty and Turner (2006) argue that even if the large-scale expansion of central bank foreign exchange assets did not create near-term financial risks, it could aggravate financial system risks and make financial intermediation less efficient.
Growth of central bank balance sheets, 2001–11 2001 = 100
0
200
400
600
2001 2003 2005 2007 2009 2011
Memo:
Euro areaUnited KingdomUnited States
China
0
100
200
300
2001 2003 2005 2007 2009 2011
Emerging Asia ex China1
HK, SGMY, PH, THID, INKR
HK = Hong Kong SAR; ID = Indonesia; IN = India; KR = Korea; MY = Malaysia; PH = Philippines; SG = Singapore; TH = Thailand.
1 Sum of listed economies.
Sources: IMF, International Financial Statistics; CEIC; Datastream; national data. Graph 1
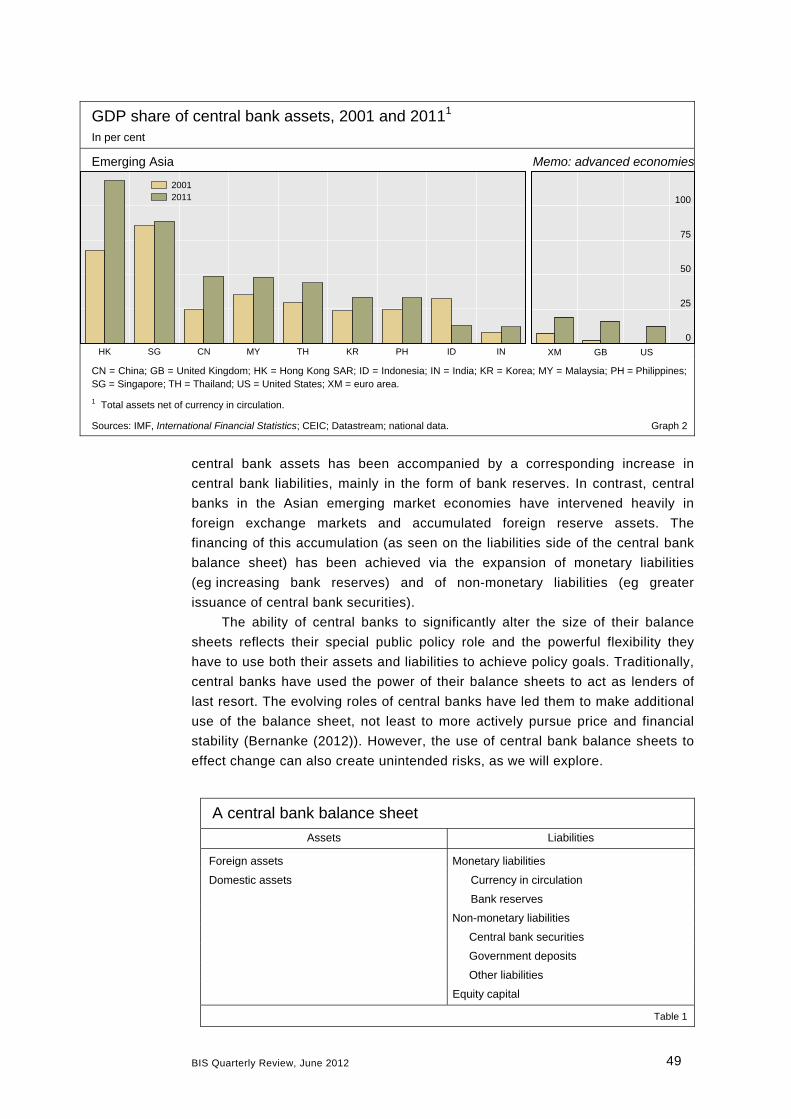
BIS Quarterly Review, June 2012 49
central bank assets has been accompanied by a corresponding increase in
central bank liabilities, mainly in the form of bank reserves. In contrast, central
banks in the Asian emerging market economies have intervened heavily in
foreign exchange markets and accumulated foreign reserve assets. The
financing of this accumulation (as seen on the liabilities side of the central bank
balance sheet) has been achieved via the expansion of monetary liabilities
(eg increasing bank reserves) and of non-monetary liabilities (eg greater
issuance of central bank securities).
The ability of central banks to significantly alter the size of their balance
sheets reflects their special public policy role and the powerful flexibility they
have to use both their assets and liabilities to achieve policy goals. Traditionally,
central banks have used the power of their balance sheets to act as lenders of
last resort. The evolving roles of central banks have led them to make additional
use of the balance sheet, not least to more actively pursue price and financial
stability (Bernanke (2012)). However, the use of central bank balance sheets to
effect change can also create unintended risks, as we will explore.
GDP share of central bank assets, 2001 and 20111 In per cent
Emerging Asia Memo: advanced economies
HK SG CN MY TH KR PH ID IN
20012011
0
25
50
75
100
XM GB US
CN = China; GB = United Kingdom; HK = Hong Kong SAR; ID = Indonesia; IN = India; KR = Korea; MY = Malaysia; PH = Philippines; SG = Singapore; TH = Thailand; US = United States; XM = euro area.
1 Total assets net of currency in circulation.
Sources: IMF, International Financial Statistics; CEIC; Datastream; national data. Graph 2
A central bank balance sheet
Assets Liabilities
Foreign assets Monetary liabilities
Domestic assets Currency in circulation
Bank reserves
Non-monetary liabilities
Central bank securities
Government deposits
Other liabilities
Equity capital
Table 1

50 BIS Quarterly Review, June 2012
The remainder of this section further examines recent changes in central
bank balance sheets in emerging Asia.
Assets
The remarkable increase in emerging Asia central bank assets has been
dominated by the growth in foreign exchange reserve assets (Graph 3), mostly
denominated in US dollars.4 But the main policy factors driving the growth of
foreign exchange assets have changed over time.
In the aftermath of the 1997–98 Asian financial crisis, policymakers took to
heart the importance of having large foreign exchange reserves that could be
used in the event of a run on their currencies. By helping to reassure markets
that the exchange rate regime was sound and resilient, the reserve buffers
lowered the likelihood of a run. And ample reserves remain a key factor
determining an economy’s credit rating and thus its borrowing costs. By the
second half of the 2000s, central banks in the region boosted reserves to a level
that generally exceeded conventional import and external debt metrics of reserve
adequacy.
Since the mid-2000s, the accumulation of foreign exchange reserve assets
has been primarily a by-product of a policy that has resisted the currency
appreciation pressures generated by trade and capital flows in the region.
Central banks have tended to intervene in currency spot markets, buying foreign
assets (predominantly US dollar-denominated) to ease the pressures.
In this regard as well, economic history in the region weighed on the minds
of policymakers. One of the central lessons of the Asian financial crisis was that
fixed exchange rates are hard to defend in the face of large and volatile capital
flows and substantial changes in sentiment. Authorities also understood from
4 In contrast, the expansion of central bank balance sheets in the major advanced economies has
largely consisted of the expansion of domestic currency assets, as Graph 3 indicates. See Table A1 in the Appendix for more detail.
Change in the composition of central bank assets in emerging Asia, 2002–11 As a percentage of change in total assets
Emerging Asia Memo: Advanced economies
CN HK ID IN KR MY PH SG TH
Foreign assetsClaims on government and public enterprisesClaims on private sector
Claims on banksClaims on other financial sector entities
0
50
100
GB US XM
CN = China; GB = United Kingdom; HK = Hong Kong SAR; ID = Indonesia; IN = India; KR = Korea; MY = Malaysia; PH = Philippines; SG = Singapore; TH = Thailand; US = United States; XM = euro area.
Source: IMF, International Financial Statistics. Graph 3
Accumulation of foreign exchange reserves accounts for the bulk of the asset expansion
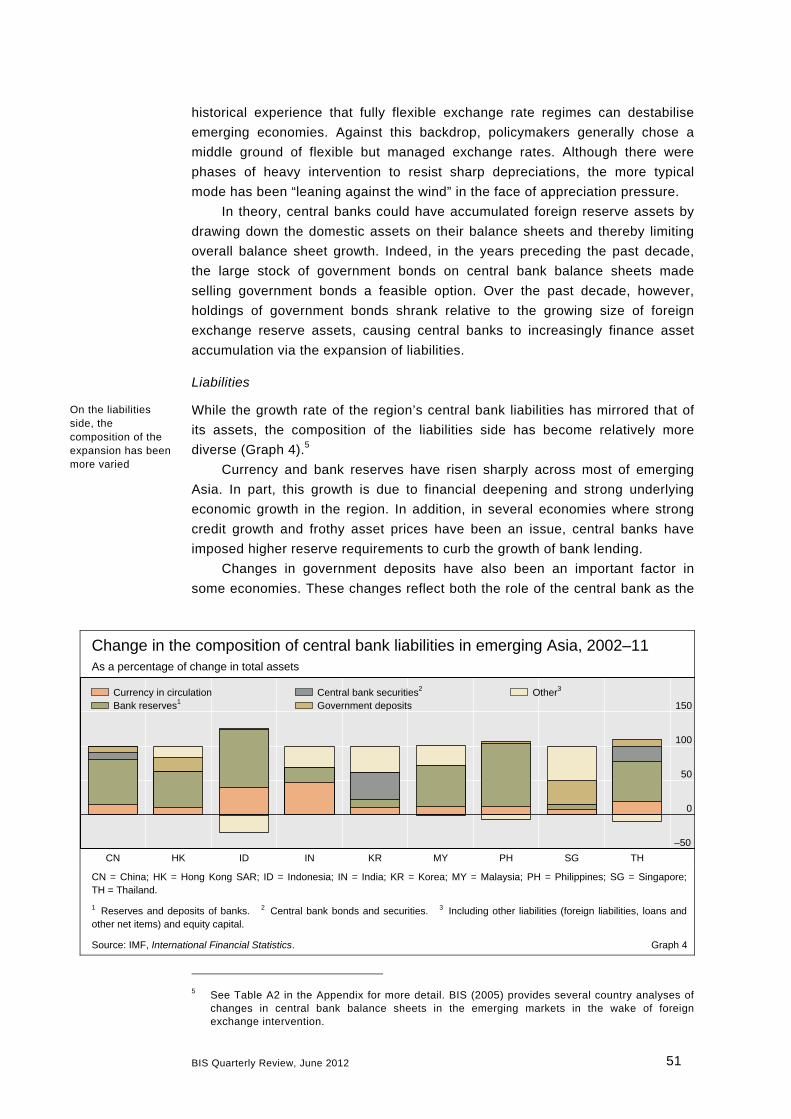
BIS Quarterly Review, June 2012 51
historical experience that fully flexible exchange rate regimes can destabilise
emerging economies. Against this backdrop, policymakers generally chose a
middle ground of flexible but managed exchange rates. Although there were
phases of heavy intervention to resist sharp depreciations, the more typical
mode has been “leaning against the wind” in the face of appreciation pressure.
In theory, central banks could have accumulated foreign reserve assets by
drawing down the domestic assets on their balance sheets and thereby limiting
overall balance sheet growth. Indeed, in the years preceding the past decade,
the large stock of government bonds on central bank balance sheets made
selling government bonds a feasible option. Over the past decade, however,
holdings of government bonds shrank relative to the growing size of foreign
exchange reserve assets, causing central banks to increasingly finance asset
accumulation via the expansion of liabilities.
Liabilities
While the growth rate of the region’s central bank liabilities has mirrored that of
its assets, the composition of the liabilities side has become relatively more
diverse (Graph 4).5
Currency and bank reserves have risen sharply across most of emerging
Asia. In part, this growth is due to financial deepening and strong underlying
economic growth in the region. In addition, in several economies where strong
credit growth and frothy asset prices have been an issue, central banks have
imposed higher reserve requirements to curb the growth of bank lending.
Changes in government deposits have also been an important factor in
some economies. These changes reflect both the role of the central bank as the
5 See Table A2 in the Appendix for more detail. BIS (2005) provides several country analyses of
changes in central bank balance sheets in the emerging markets in the wake of foreign exchange intervention.
Change in the composition of central bank liabilities in emerging Asia, 2002–11 As a percentage of change in total assets
–50
0
50
100
150
CN HK ID IN KR MY PH SG TH
Currency in circulationBank reserves1
Central bank securities2
Government depositsOther3
CN = China; HK = Hong Kong SAR; ID = Indonesia; IN = India; KR = Korea; MY = Malaysia; PH = Philippines; SG = Singapore; TH = Thailand.
1 Reserves and deposits of banks. 2 Central bank bonds and securities. 3 Including other liabilities (foreign liabilities, loans and other net items) and equity capital.
Source: IMF, International Financial Statistics. Graph 4
On the liabilities side, the composition of the expansion has been more varied
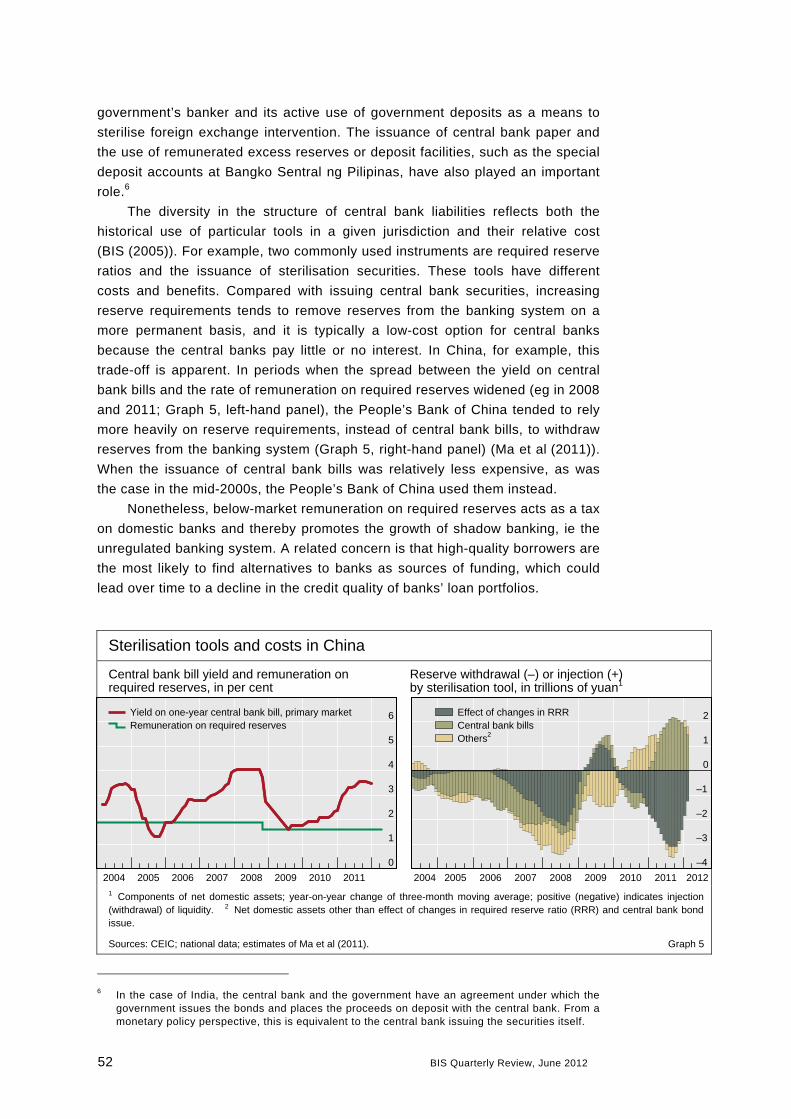
52 BIS Quarterly Review, June 2012
government’s banker and its active use of government deposits as a means to
sterilise foreign exchange intervention. The issuance of central bank paper and
the use of remunerated excess reserves or deposit facilities, such as the special
deposit accounts at Bangko Sentral ng Pilipinas, have also played an important
role.6
The diversity in the structure of central bank liabilities reflects both the
historical use of particular tools in a given jurisdiction and their relative cost
(BIS (2005)). For example, two commonly used instruments are required reserve
ratios and the issuance of sterilisation securities. These tools have different
costs and benefits. Compared with issuing central bank securities, increasing
reserve requirements tends to remove reserves from the banking system on a
more permanent basis, and it is typically a low-cost option for central banks
because the central banks pay little or no interest. In China, for example, this
trade-off is apparent. In periods when the spread between the yield on central
bank bills and the rate of remuneration on required reserves widened (eg in 2008
and 2011; Graph 5, left-hand panel), the People’s Bank of China tended to rely
more heavily on reserve requirements, instead of central bank bills, to withdraw
reserves from the banking system (Graph 5, right-hand panel) (Ma et al (2011)).
When the issuance of central bank bills was relatively less expensive, as was
the case in the mid-2000s, the People’s Bank of China used them instead.
Nonetheless, below-market remuneration on required reserves acts as a tax
on domestic banks and thereby promotes the growth of shadow banking, ie the
unregulated banking system. A related concern is that high-quality borrowers are
the most likely to find alternatives to banks as sources of funding, which could
lead over time to a decline in the credit quality of banks’ loan portfolios.
6 In the case of India, the central bank and the government have an agreement under which the
government issues the bonds and places the proceeds on deposit with the central bank. From a monetary policy perspective, this is equivalent to the central bank issuing the securities itself.
Sterilisation tools and costs in China
Central bank bill yield and remuneration on required reserves, in per cent
Reserve withdrawal (–) or injection (+) by sterilisation tool, in trillions of yuan1
0
1
2
3
4
5
6
2004 2005 2006 2007 2008 2009 2010 2011
Yield on one-year central bank bill, primary marketRemuneration on required reserves
–4
–3
–2
–1
0
1
2
2004 2005 2006 2007 2008 2009 2010 2011 2012
Effect of changes in RRRCentral bank billsOthers2
1 Components of net domestic assets; year-on-year change of three-month moving average; positive (negative) indicates injection (withdrawal) of liquidity. 2 Net domestic assets other than effect of changes in required reserve ratio (RRR) and central bank bond issue.
Sources: CEIC; national data; estimates of Ma et al (2011). Graph 5

BIS Quarterly Review, June 2012 53
Risks
The size and structure of central bank balance sheets can create a number of
policy risks and, in his keynote address at the recent Bank of Thailand-BIS
conference, the General Manager of the BIS identified a number of them
(Caruana (2011)). He argued, however, that because the materialisation of such
risks is not inevitable, prudence dictates caution and vigilance. We provide some
historical evidence to assess the growing threats in Asia from three sources:
inflation risks, financial instability risks and the dangers arising from financial
market distortions.
Inflation
Traditionally, the rapid expansion of central bank balance sheets has been
viewed as leading to growth in the monetary aggregates and, eventually, to
higher inflation. In this view, however, the problem is not the size of the balance
sheet per se; rather, it is the rate of increase in its size that matters. A high rate
of increase can push the expansion of monetary liabilities beyond the ability of
the financial system to absorb them in a manner consistent with balanced
growth; at that point, inflationary pressures will be generated. Central banks
may, however, be able to offset the effect on monetary liabilities by relying on
the expansion of the non-monetary liabilities of the central bank.
In fact, the data suggest that the expansion of central bank balance sheets
in emerging Asia does not pose an imminent risk of higher inflation. Central bank
accumulations of foreign exchange reserves have reduced inflation pressures by
sterilising the foreign exchange purchases via non-monetary liabilities and higher
required bank reserves. The combination of this sterilisation and active monetary
policy preserved price stability over the past decade and avoided excessive
growth of base money despite the rapid accumulation of foreign exchange
reserve assets. The effect can be seen by comparing the change in central bank
assets with inflation from 2001 to 2011 (Graph 6), which indicates no statistical
relationship between the two. The strong reputation for price stability built up
over the past two decades by the region’s central banks has also helped by
keeping inflation expectations well anchored. Thus, inflation risks have been
contained even in periods when the growth of broad money and credit
accompanied the accumulation of foreign exchange assets.7
Moreover, the near-term inflation risks posed by expanding central bank
balance sheets are generally hard to assess because of the well known long and
variable lags in the effects of monetary policy. But two considerations point to
the need for continued vigilance. First, the near-term unpredictability
notwithstanding, a stable, positive longer-term correlation between central bank
monetary liabilities and inflation still appears to hold.8 Second, the recent good
performance of the region’s central banks does not guarantee their future
7 This is consistent with the analysis of Borio and Disyatat (2010).
8 See Friedman and Schwartz (1982) for historical examples. BIS (2007, Graph IV.12, p 75) demonstrates that while correlations between money, credit and prices may be weak over short time horizons, it may be too soon to dismiss the relationships over long horizons.
… inflation …
The size and structure of central bank balance sheets generate worrisome dangers, including …
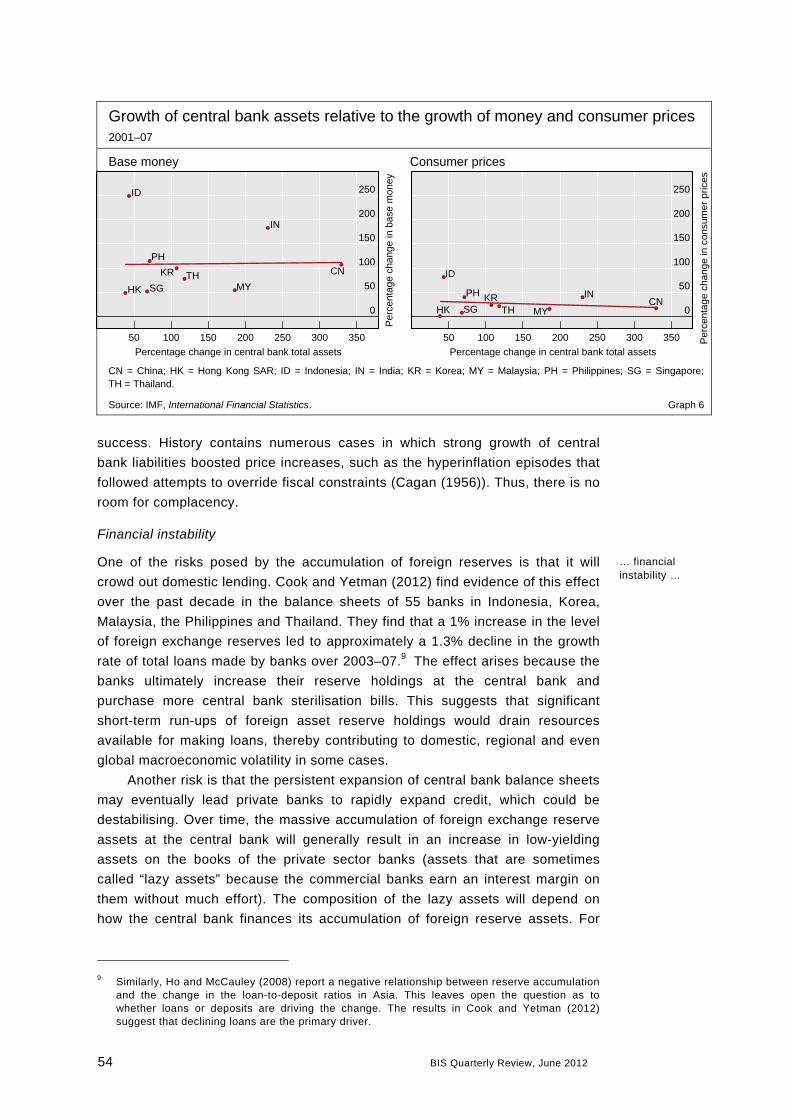
54 BIS Quarterly Review, June 2012
success. History contains numerous cases in which strong growth of central
bank liabilities boosted price increases, such as the hyperinflation episodes that
followed attempts to override fiscal constraints (Cagan (1956)). Thus, there is no
room for complacency.
Financial instability
One of the risks posed by the accumulation of foreign reserves is that it will
crowd out domestic lending. Cook and Yetman (2012) find evidence of this effect
over the past decade in the balance sheets of 55 banks in Indonesia, Korea,
Malaysia, the Philippines and Thailand. They find that a 1% increase in the level
of foreign exchange reserves led to approximately a 1.3% decline in the growth
rate of total loans made by banks over 2003–07.9 The effect arises because the
banks ultimately increase their reserve holdings at the central bank and
purchase more central bank sterilisation bills. This suggests that significant
short-term run-ups of foreign asset reserve holdings would drain resources
available for making loans, thereby contributing to domestic, regional and even
global macroeconomic volatility in some cases.
Another risk is that the persistent expansion of central bank balance sheets
may eventually lead private banks to rapidly expand credit, which could be
destabilising. Over time, the massive accumulation of foreign exchange reserve
assets at the central bank will generally result in an increase in low-yielding
assets on the books of the private sector banks (assets that are sometimes
called “lazy assets” because the commercial banks earn an interest margin on
them without much effort). The composition of the lazy assets will depend on
how the central bank finances its accumulation of foreign reserve assets. For
9 Similarly, Ho and McCauley (2008) report a negative relationship between reserve accumulation
and the change in the loan-to-deposit ratios in Asia. This leaves open the question as to whether loans or deposits are driving the change. The results in Cook and Yetman (2012) suggest that declining loans are the primary driver.
Growth of central bank assets relative to the growth of money and consumer prices 2001–07
Base money Consumer prices
CN
HK
ID
IN
KR
MY
PH
SGTH
0
50
100
150
200
250
50 100 150 200 250 300 350
Percentage change in central bank total assets
Per
cent
age
chan
ge in
bas
e m
oney
CNHK
ID
INKRMY
PH
SG TH 0
50
100
150
200
250
50 100 150 200 250 300 350
Percentage change in central bank total assets
Per
cent
age
chan
ge in
con
sum
er p
rices
CN = China; HK = Hong Kong SAR; ID = Indonesia; IN = India; KR = Korea; MY = Malaysia; PH = Philippines; SG = Singapore; TH = Thailand.
Source: IMF, International Financial Statistics. Graph 6
… financial instability …

BIS Quarterly Review, June 2012 55
example, central bank bills in emerging markets typically wind up on the balance
sheets of the private sector banks.
The willingness of banks to hold these central bank securities will vary
according to the macroeconomic and financial environment. When risk aversion
is high, as it has been in emerging Asia for some time now, banks may find
themselves being quite content to sit on these lazy assets. But as economic and
financial conditions change, so will the willingness of banks to keep low-yielding
assets on their balance sheets. The concern is that, at the time that the global
recovery begins to gain traction and global risk aversion falls, these emerging
market banks will attempt to either sell low-yielding assets to increase more
profitable bank loans or leverage up to increase their return on equity. This
search for yield would tend to amplify the boom phase of the recovery and
eventually raise concerns of unsustainable lending and asset price growth.
Some evidence on credit growth from the region may be consistent with
such dynamics: the rate of credit growth has been rapid in several economies
where foreign reserves have also grown rapidly, particularly China and India
(Graph 7, left-hand panel).10
The US dollar exposures of emerging Asian banks also display a worrisome
trend consistent with a credit boom. These banks have been very active in
extending US dollar loans without a corresponding increase in US dollar deposits
in recent years (Graph 7, right-hand panel).11 The willingness of central banks to
resist currency appreciation appears to have encouraged private banks to take
10 Given the evidence in Graph 7, the causality between credit growth and foreign reserve asset
accumulation could go either way. Rapid domestic credit growth leading to increased asset price returns would tend to draw increased capital inflows and hence foreign exchange reserve accumulation if authorities resist currency appreciation.
11 See also Borio et al (2011) for further evidence on cross-border lending behaviour in Asia.
Credit boom in emerging Asia: total credit and US dollar lending by Asian emerging market banks, 2001–11
Total credit and foreign reserves US dollar loans net of deposits1
CN
HK
ID IN
KR
MY
PHSG TH
5
10
15
20
10 15 20 25 30 35Annualised % change in foreign reserves
Ann
ualis
ed %
cha
nge
in to
tal c
redi
t
–100
–50
0
50
100
150
01 02 03 04 05 06 07 08 09 10 11
All economiesAsiaUnited StatesEuropeOther
CN = China; HK = Hong Kong SAR; ID = Indonesia; IN = India; KR = Korea; MY = Malaysia; PH = Philippines; SG = Singapore; TH = Thailand.
1 US dollar loans net of deposits by BIS reporting banks in Hong Kong, India, Korea, Malaysia and Singapore vis-à-vis all countries; in billions of US dollars.
Sources: IMF, International Financial Statistics; BIS locational banking statistics. Graph 7

56 BIS Quarterly Review, June 2012
on additional foreign exchange rate risks (in the form of either currency
mismatch risks or – if the banks swap out the foreign exchange rate risk in
financial markets – counterparty risks).
To mitigate this risk of excessive credit growth, central banks could always
rely on their domestic policy tools. To date, however, the stance of monetary
policy in emerging Asia has remained distinctly accommodative: real policy
interest rates are very low, and in some cases negative, despite shrinking output
gaps. Moreover, the policy response may prove to be too cautious
(Hannoun (2012)), in which case central banks may find themselves behind the
curve. This is more likely to be the case if central banks find themselves
focusing too much on the short-run costs of tightening monetary policy and too
little on the risks associated with burgeoning balance sheets. For example,
raising yields on sterilisation bills would increase the cost to central banks of
sterilising the impact of past foreign reserve asset purchases. And a rapid
increase in policy interest rates may be seen as disproportionately affecting the
interest-sensitive sectors of the economy. History contains many instances of
central banks struggling to limit bank credit expansion when the balance sheets
of private sector banks are unusually liquid. Too rapid an expansion would have
well known negative consequences for economic and financial instability.12
Financial market distortions
Another concern relates to distortions in financial markets. When an emerging
market central bank finances its accumulation of foreign exchange assets with
local currency assets traded in markets that are relatively thin, it tends to
become the dominant player in the market.13 In those cases, distortions can
arise from various sources.
First, in pricing securities, central banks can have objectives that differ from
those of the private sector, so their operations may distort interest rates and
impair the efficient allocation of savings.14 Second, market participants may
underweight private signals, so prices will tend to respond primarily to the
expected moves of the central bank rather than to economic developments.
Third, the sheer size of some central bank operations may displace the private
12 Note also that the massive expansion of central bank balance sheets in the western advanced
economies, conducted as part of their response to the international financial crisis, may be contributing to financial stability risks in emerging Asia. Chen et al (2012) find evidence that large-scale asset purchases by the US Federal Reserve lowered yield curves in Asia as well as in the United States. The lower interest rates have driven up credit and asset prices in a number of Asian economies. For a further discussion of the issues associated with the transmission of central bank balance sheet expansions, see Iwata and Takenaka (2012), who emphasise the exchange rate and terms of trade channels. For a more positive perspective on the role of central bank balance sheet policies, see Chadha et al (2012).
13 Mehrotra (2012) notes that the outstanding stock of central bank paper in some Asian economies now exceeds 10% of GDP. But it is also true that, because central bank operations in local currency assets help banks manage their reserves more effectively, the operations over time should encourage the deepening of domestic financial markets.
14 Sometimes, however, central banks want to use balance sheet expansions to directly influence private sector incentives. For example, quantitative easing in the advanced economies is explicitly intended to alter the yield curve and hence the allocation of savings from what would otherwise be the case.
… and financial market distortions

BIS Quarterly Review, June 2012 57
sector in financial intermediation. Finally, heavy reliance on the central bank in
the financial intermediation process can stifle financial market development,
especially in emerging market economies.15
One interesting example of distortion is currently playing out in the
Philippines. The aggregate size of the central bank’s special deposit accounts
(SDAs),16 introduced to withdraw excess liquidity from the market, has
skyrocketed since 2007 (Graph 8, left-hand panel); they are now approximately
twice as large as the total required reserves of depository institutions. One result
has been the convergence of the overnight interest rate to the SDA rate, which
runs slightly above the floor of the policy rate corridor (Graph 8, right-hand
panel). The expansion of the SDAs has been associated with greater reliance on
the SDA rate, rather than the short-term Treasury bill rate, as a benchmark for
pricing fixed income instruments; the three-month Treasury bill rate has been
quite volatile since late 2010.
Additional policy challenges ahead
Large balance sheets pose a number of other ongoing challenges for monetary
policy.
Central bank finances, independence and credibility
Large balance sheets leave central banks vulnerable to large financial losses
(Filardo and Grenville (2012)). These potential losses can mount in a variety of
ways. First, the central bank’s return on its foreign assets is typically less than
15 Monetary policy operations can also play a positive role in certain circumstances.
McCauley (2008) discusses how monetary policy operations can contribute to financial market development and Durré and Pill (2012) emphasise how operations can help overcome market distortions during crisis periods.
16 SDAs are fixed-term investment deposits available to banks and trust entities of financial institutions supervised by the Philippine central bank, which in turn uses the accounts to manage the reserves of the banking system.
Special deposit accounts and interest rates of the Philippines
SDAs, in billions of Philippine pesos Interest rates, in per cent
0
400
800
1,200
1,600
99 00 01 02 03 04 05 06 07 08 09 10 11 12
Special deposit accounts
0.0
2.5
5.0
7.5
10.0
2007 2008 2009 2010 2011 2012
Seven-day special deposit account ratePolicy rate corridor1
Overnight interbank rateThree-month Treasury bill rate
1 Repo rate and reverse repo rate.
Sources: Bloomberg; CEIC; Datastream. Graph 8
Large balance sheets are weakening central bank finances in Asia
58 BIS Quarterly Review, June 2012
the running cost of financing these foreign assets. That is, the assets may yield
less than the costs of central bank bills and the interest rate paid on excess
reserves. Second, the central bank incurs losses on the domestic value of its
foreign exchange reserve assets when its domestic currency appreciates. Third,
the assets on the balance sheets of central banks may be subject to mark-to-
market losses as creditworthiness deteriorates and market interest rates rise. In
some cases, losses could also be realised because of a credit event.
Admittedly, such losses can affect the profit and loss statement of a central
bank and reduce its capital without directly threatening its ability to achieve
policy goals; indeed, the losses may be fully consistent with those goals. But the
accumulation of losses can have indirect effects. A particular concern is the
reporting of large losses; the news could raise questions about the reputation of
the central bank, and if a central bank has to go cap in hand to the treasury or
legislature for an injection of capital, it may find its independence at risk. A
recent BIS report analyses the implications of financial risks for central bank
governance arrangements.17
Exit strategies
The three risks outlined above – inflation, financial instability and market
distortions – need to be carefully managed and thus merit further analysis.
Serious consideration should also be given to capping and then shrinking the
size of central bank balance sheets. Indeed, the central banks of India, Korea
and Malaysia reduced their holdings of foreign assets during the international
financial crisis (Graph 9) in response to extreme exchange rate volatility and
capital outflows. Other central banks, including those of the Philippines and
Thailand, were reluctant to allow their long positions to decrease during the
crisis because of concerns about the potential for credit rating downgrades and
their knock-on effects. In recent months, outright and net forward positions have
declined somewhat further in some regional economies.
Limiting the expansion of central bank balance sheets may be easier said
than done. After all, the massive expansion in Asia in recent years was often the
by-product of exchange rate regimes that resisted exchange rate pressures.
Greater tolerance of currency appreciation over time could be a key element of a
framework to limit further accumulation of foreign assets.18 The economics that
would guide the pullback and the central bank operations to achieve it are both
fairly straightforward, but the political economy issues are more complex.
17 BIS (2011, pp 45–7). See also Trairatvorakul (2012) for a discussion of the various economic
and political costs associated with the build-up of foreign reserves.
18 In addition, Gagnon (2012) argues that the large accumulation of foreign exchange assets at central banks has driven a substantial portion of global current account imbalances. Hence, exiting would contribute significantly to the global economic recovery.
Exit strategies entail difficult policy choices

BIS Quarterly Review, June 2012 59
Foreign exchange reserves1 and net forward positions2 In billions of US dollars
China3 Hong Kong SAR India
0
1,000
2,000
3,000
05 06 07 08 09 10 11 12
Foreign exchange reserves
0
100
200
300
05 06 07 08 09 10 11 12
Net forward positions
0
100
200
300
05 06 07 08 09 10 11 12
Indonesia Korea Malaysia
0
25
50
75
100
05 06 07 08 09 10 11 12
0
75
150
225
300
05 06 07 08 09 10 11 12
0
40
80
120
160
05 06 07 08 09 10 11 12
Philippines Singapore Thailand
0
20
40
60
80
05 06 07 08 09 10 11 12
0
100
200
300
400
05 06 07 08 09 10 11 12
0
50
100
150
200
05 06 07 08 09 10 11 12
1 Official reserves excluding gold. Includes SDR and reserve positions in the IMF. 2 Long positions in forwards and futures in foreign currencies vis-à-vis the domestic currency, minus short positions. 3 Data of net forward positions are not available for China.
Sources: IMF, International Financial Statistics and International Reserves and Foreign Currency Liquidity; national data. Graph 9
Conclusions
The rapid expansion of central bank balance sheets arising from many years of
foreign exchange reserve accumulation in emerging Asia is raising concerns
about inflation, financial instability and financial market distortions. Serious
deterioration in these areas has not yet materialised, but analysis highlights the
need for a further careful assessment of both the historical record and current
institutional arrangements. The recent Bank of Thailand-BIS conference made
some progress in clarifying the implications of these developments. Further
60 BIS Quarterly Review, June 2012
analysis is needed. Financial stability risks can take many forms and must not be
underestimated. Credit developments in emerging Asia might be more worrying
in light of the soaring central bank balance sheets. At the operational level, the
management of ballooning central bank balance sheets raises concerns about
distortions in financial markets and implications of central bank losses.
The temptation to look only at the size and composition of central bank
balance sheets should be tempered by the fact that they are a by-product of
underlying public policies and the choice of instruments to implement those
policies. To improve the health of the balance sheets, central banks and
governments would have to reflect on how they should alter such policies. The
approach to exchange rate management by countries in emerging Asia is a
critical factor, and various reform efforts are currently being considered.
Although such efforts are largely driven by the implications of exchange rate
management for global imbalances and growth, the risks associated with the
size and structure of central bank balance sheets should not be overlooked.

BIS Quarterly Review, June 2012 61
References
Bank for International Settlements (2005): “Foreign exchange market
intervention in emerging markets: motives, techniques and implications”, BIS Papers, no 24.
——— (2007): 77th Annual Report, June.
——— (2011): “Central bank governance and financial stability: a report by a
study group”, May, www.bis.org/publ/othp14.htm.
Bernanke, B (2012): “The Federal Reserve and its role in today’s economy”,
March, www.federalreserve.gov/newsevents/lectures/about.htm.
Borio, C and P Disyatat (2010): “Unconventional monetary policies: an
appraisal”, Manchester School, no 78, s1, pp 53–89.
Borio, C, R McCauley and P McGuire (2011): “Global credit and domestic credit
booms”, BIS Quarterly Review, September, pp 43–57.
Cagan, P (1956): “The monetary dynamics of hyperinflation", in M Friedman
(ed), Studies in the quantity theory of money, University of Chicago Press.
Caruana, J (2011): “Why central bank balance sheets matter”, keynote address
at the Bank of Thailand-BIS Research Conference entitled “Central bank
balance sheets in Asia and the Pacific: the policy challenges ahead”, Chiang
Mai, Thailand, 12–13 December, www.bis.org/speeches/sp111216.pdf.
Chadha J, L Corrado and J Meaning (2012): “Reserves, liquidity and money: an
assessment of balance sheet policies”, BIS Papers, no 66, forthcoming.
Chen, Q, A Filardo, D He, and F Zhu (2012): “International spillovers of central
bank balance sheet policies”, BIS Papers, no 66, forthcoming.
Cook, D and J Yetman (2012): “Expanding central bank balance sheets in
emerging Asia: a compendium of risks and some evidence”, BIS Papers, no 66,
forthcoming.
Durré, A and H Pill (2012): “Central bank balance sheets as policy tools”, BIS Papers, no 66, forthcoming.
Filardo, A and S Grenville (2012): “Central bank balance sheets and foreign
exchange rate regimes: understanding the nexus in Asia”, BIS Papers, no 66,
forthcoming.
Friedman, M and A Schwartz (1982): Monetary trends in the United States and the United Kingdom: their relation to income, prices, and interest rates, 1867–1975, University of Chicago Press.
Gagnon, J (2012): “Global imbalances and foreign asset expansion by
developing-economy central banks”, BIS Papers, no 66, forthcoming.
Hannoun, H (2012): “Monetary policy in the crisis: testing the limits of monetary
policy”, speech at the 47th SEACEN Governors’ Conference, Seoul, Korea,
13–14 February.
62 BIS Quarterly Review, June 2012
Ho, C and R McCauley (2008): “The domestic financial consequences of
reserve accumulation: some evidence from Asia”, in R Rajan, S Thangavelu
and R Parinduri (eds), Exchange rate, monetary and financial issues and policies in Asia, World Scientific, Singapore.
Iwata, K and S Takenaka (2012): “Central bank balance sheets expansion:
Japan’s experience”, BIS Papers, no 66, forthcoming.
Ma, G, X Yan and X Liu (2011): “China’s evolving reserve requirements”, BIS Working Papers, no 360.
McCauley, R (2008): “Developing financial markets and operating monetary
policy in Asia”, BIS Papers, no 39, April.
Mehrotra, A (2012): “On the use of sterilisation bonds in emerging Asia”, BIS Papers, no 66, forthcoming.
Mohanty, M and P Turner (2006): “Foreign exchange reserve accumulation in
emerging markets: what are the domestic implications?”, BIS Quarterly Review,
September, pp 39–52.
Trairatvorakul, P (2012): “Regional challenges ahead – dealing with capital
flows, prolonged exchange rate intervention and their consequences in Asia
and the Pacific”, BIS Papers, no 66, forthcoming.

BIS Quarterly Review, June 2012 63
Appendix: Composition of central bank assets and liabilities in Asian emerging economies
Assets In billions of US dollars
Foreign assets Claims on financial sector
Claims on public sector
Other claims
2002 2011 2002 2011 2002 2011 2002 2011
China 280.80 3,775.62 235.92 331.56 34.60 244.40 2.50 0.40
Hong Kong SAR 106.81 280.47 … … … … … …
India 70.36 285.67 2.25 1.73 24.78 84.84
Indonesia 32.86 110.37 1.89 0.49 34.32 36.39 4.11 1.33
Korea 130.97 308.61 5.77 3.50 8.29 13.98 … …
Malaysia 34.58 133.29 1.66 11.34 0.16 0.63 6.28 3.47
Philippines 16.42 75.77 0.61 0.67 3.96 6.77 1.08 1.83
Singapore 82.19 237.20 … … 3.34 5.24 … …
Thailand 39.29 176.89 1.93 … 2.50 8.84 10.14 …
Source: IMF, International Financial Statistics. Table A1
Liabilities In billions of US dollars
Currency in circulation
Bank reserves1 Central bank securities2
Government deposits
Other liabilities
2002 2011 2002 2011 2002 2011 2002 2011 2002 2011
China 208.74 805.42 336.59 2,774.24 17.97 370.37 37.28 360.80 –49.41 37.68
Hong Kong SAR 14.49 31.94 17.07 106.62 … … 38.69 85.44 –5.40 –16.67
India 54.34 183.63 17.25 78.14 … … 0.03 0.03 24.39 109.17
Indonesia 11.01 41.13 17.82 83.20 … 1.03 12.85 9.88 17.97 4.61
Korea 16.75 36.19 15.29 33.36 88.46 153.59 9.42 6.39 3.15 93.78
Malaysia 7.14 19.48 24.31 84.31 … … 1.96 6.31 1.31 27.94
Philippines 5.12 12.79 4.78 59.72 … … 1.49 3.68 6.24 …
Singapore 7.12 18.98 4.38 15.95 … … 54.36 110.80 19.67 96.72
Thailand 12.96 39.40 5.85 80.28 2.60 29.88 1.55 12.55 –6.81 5.01
1 Reserves and deposits of banks. 2 Including central bank bonds.
Source: IMF, International Financial Statistics. Table A2
Related Documents