Birth Size and Breast Cancer Risk: Re-analysis of Individual Participant Data from 32 Studies Isabel dos Santos Silva [* , Bianca De Stavola [ , Valerie McCormack, Collaborative Group on Pre-Natal Risk Factors and Subsequent Risk of Breast Cancer Department of Epidemiology and Population Health, London School of Hygiene & Tropical Medicine, London, United Kingdom Funding: Funding was obtained from Cancer Research UK (CR-UK) programme grant (C150/A5660) to IdSS. CR-UK Training Fellowship (C14292/A5609) to VM. The funder had no role in study design, data collection and analysis, decision to publish, or preparation of the manuscript. Competing Interests: See section at end of manuscript. Academic Editor: Hans-Olov Adami, Institutionen for Medicinsk Epidemiologi och Biostatistik (MEB), Sweden Citation: dos Santos Silva I, De Stavola B, McCormack V, Collaborative Group on Pre-Natal Risk Factors and Subsequent Risk of Breast Cancer (2008) Birth size and breast cancer risk: Re-analysis of individual participant data from 32 studies. PLoS Med 5(9): e193. doi:10. 1371/journal.pmed.0050193 Received: March 19, 2008 Accepted: August 14, 2008 Published: September 30, 2008 Copyright: Ó 2008 dos Santos Silva et al. This is an open-access article distributed under the terms of the Creative Commons Attribution License, which permits unrestricted use, distribution, and reproduction in any medium, provided the original author and source are credited. Abbreviations: BMI, body mass index; CI, confidence interval; PI, ponderal index; RR, relative risk; SD, standard deviation; SES, socioeconomic status * To whom correspondence should be addressed. E-mail: isabel.silva@ lshtm.ac.uk [ These authors contributed equally to this work. ABSTRACT Background Birth size, perhaps a proxy for prenatal environment, might be a correlate of subsequent breast cancer risk, but findings from epidemiological studies have been inconsistent. We re- analysed individual participant data from published and unpublished studies to obtain more precise estimates of the magnitude and shape of the birth size–breast cancer association. Methods and Findings Studies were identified through computer-assisted and manual searches, and personal communication with investigators. Individual participant data from 32 studies, comprising 22,058 breast cancer cases, were obtained. Random effect models were used, if appropriate, to combine study-specific estimates of effect. Birth weight was positively associated with breast cancer risk in studies based on birth records (pooled relative risk [RR] per one standard deviation [SD] [ ¼ 0.5 kg] increment in birth weight: 1.06; 95% confidence interval [CI] 1.02–1.09) and parental recall when the participants were children (1.02; 95% CI 0.99–1.05), but not in those based on adult self-reports, or maternal recall during the woman’s adulthood (0.98; 95% CI 0.95–1.01) (p for heterogeneity between data sources ¼ 0.003). Relative to women who weighed 3.000–3.499 kg, the risk was 0.96 (CI 0.80–1.16) in those who weighed , 2.500 kg, and 1.12 (95% CI 1.00–1.25) in those who weighed 4.000 kg (p for linear trend ¼ 0.001) in birth record data. Birth length and head circumference from birth records were also positively associated with breast cancer risk (pooled RR per one SD increment: 1.06 [95% CI 1.03–1.10] and 1.09 [95% CI 1.03–1.15], respectively). Simultaneous adjustment for these three birth size variables showed that length was the strongest independent predictor of risk. The birth size effects did not appear to be confounded or mediated by established breast cancer risk factors and were not modified by age or menopausal status. The cumulative incidence of breast cancer per 100 women by age 80 y in the study populations was estimated to be 10.0, 10.0, 10.4, and 11.5 in those who were, respectively, in the bottom, second, third, and top fourths of the birth length distribution. Conclusions This pooled analysis of individual participant data is consistent with birth size, and in particular birth length, being an independent correlate of breast cancer risk in adulthood. The Editors’ Summary of this article follows the references. PLoS Medicine | www.plosmedicine.org September 2008 | Volume 5 | Issue 9 | e193 1372 P L o S MEDICINE

Welcome message from author
This document is posted to help you gain knowledge. Please leave a comment to let me know what you think about it! Share it to your friends and learn new things together.
Transcript
Birth Size and Breast Cancer Risk: Re-analysisof Individual Participant Data from 32 StudiesIsabel dos Santos Silva
[*, Bianca De Stavola
[, Valerie McCormack, Collaborative Group on Pre-Natal Risk Factors and
Subsequent Risk of Breast Cancer
Department of Epidemiology and Population Health, London School of Hygiene & Tropical Medicine, London, United Kingdom
Funding: Funding was obtainedfrom Cancer Research UK (CR-UK)programme grant (C150/A5660) toIdSS. CR-UK Training Fellowship(C14292/A5609) to VM. The funderhad no role in study design, datacollection and analysis, decision topublish, or preparation of themanuscript.
Competing Interests: See section atend of manuscript.
Academic Editor: Hans-Olov Adami,Institutionen for MedicinskEpidemiologi och Biostatistik (MEB),Sweden
Citation: dos Santos Silva I, DeStavola B, McCormack V,Collaborative Group on Pre-NatalRisk Factors and Subsequent Risk ofBreast Cancer (2008) Birth size andbreast cancer risk: Re-analysis ofindividual participant data from 32studies. PLoS Med 5(9): e193. doi:10.1371/journal.pmed.0050193
Received: March 19, 2008Accepted: August 14, 2008Published: September 30, 2008
Copyright: � 2008 dos Santos Silvaet al. This is an open-access articledistributed under the terms of theCreative Commons AttributionLicense, which permits unrestricteduse, distribution, and reproductionin any medium, provided theoriginal author and source arecredited.
Abbreviations: BMI, body massindex; CI, confidence interval; PI,ponderal index; RR, relative risk; SD,standard deviation; SES,socioeconomic status
* To whom correspondence shouldbe addressed. E-mail: [email protected]
[ These authors contributed equallyto this work.
A B S T R A C T
Background
Birth size, perhaps a proxy for prenatal environment, might be a correlate of subsequentbreast cancer risk, but findings from epidemiological studies have been inconsistent. We re-analysed individual participant data from published and unpublished studies to obtain moreprecise estimates of the magnitude and shape of the birth size–breast cancer association.
Methods and Findings
Studies were identified through computer-assisted and manual searches, and personalcommunication with investigators. Individual participant data from 32 studies, comprising22,058 breast cancer cases, were obtained. Random effect models were used, if appropriate, tocombine study-specific estimates of effect. Birth weight was positively associated with breastcancer risk in studies based on birth records (pooled relative risk [RR] per one standarddeviation [SD] [¼0.5 kg] increment in birth weight: 1.06; 95% confidence interval [CI] 1.02–1.09)and parental recall when the participants were children (1.02; 95% CI 0.99–1.05), but not inthose based on adult self-reports, or maternal recall during the woman’s adulthood (0.98; 95%CI 0.95–1.01) (p for heterogeneity between data sources ¼ 0.003). Relative to women whoweighed 3.000–3.499 kg, the risk was 0.96 (CI 0.80–1.16) in those who weighed , 2.500 kg, and1.12 (95% CI 1.00–1.25) in those who weighed � 4.000 kg (p for linear trend¼ 0.001) in birthrecord data. Birth length and head circumference from birth records were also positivelyassociated with breast cancer risk (pooled RR per one SD increment: 1.06 [95% CI 1.03–1.10]and 1.09 [95% CI 1.03–1.15], respectively). Simultaneous adjustment for these three birth sizevariables showed that length was the strongest independent predictor of risk. The birth sizeeffects did not appear to be confounded or mediated by established breast cancer risk factorsand were not modified by age or menopausal status. The cumulative incidence of breast cancerper 100 women by age 80 y in the study populations was estimated to be 10.0, 10.0, 10.4, and11.5 in those who were, respectively, in the bottom, second, third, and top fourths of the birthlength distribution.
Conclusions
This pooled analysis of individual participant data is consistent with birth size, and inparticular birth length, being an independent correlate of breast cancer risk in adulthood.
The Editors’ Summary of this article follows the references.
PLoS Medicine | www.plosmedicine.org September 2008 | Volume 5 | Issue 9 | e1931372
PLoSMEDICINE
Introduction
In 1990 Trichopoulos [1] suggested that prenatal exposureto high levels of pregnancy oestrogens might affect the risk ofbreast cancer. This hypothesis, which has since evolved toinclude other in utero hormonal and biological factors [2],sparked a considerable amount of research on the prenatalorigins of breast cancer, relying mainly on birth size measuresas indirect markers of the in utero environment. Publishedestimates of the strength of the association between birth sizeand breast cancer, however, have been far from consistent [3–33], and several unanswered questions remain, includinguncertainty regarding the magnitude and shape of theassociation as well as the extent to which it may be mediated,confounded, and/or modified by known breast cancer riskfactors.
We set up a collaborative group to bring together and re-analyse the original individual participant data from pub-lished and unpublished studies on pre- and perinatal factorsand subsequent risk of breast cancer. This paper reports onthe birth size–breast cancer association. This re-analysisprovides several scientific advantages over previously pub-lished overviews [34–36]. First, it is large and comprehensive,comprising published and unpublished information on over22,000 breast cancer cases from 32 studies, many of whichhave been enlarged since their original publications. Second,the availability of primary data from each individualparticipant provided a unique opportunity to estimatestudy-specific effects using similar definitions and adjust-ments across studies. Third, it allowed a detailed investigationof between-study heterogeneity and its possible sources.Fourth, study-specific data could be combined, if appropri-ate, to produce far more precise estimates of the associationof birth size with breast cancer risk than those obtained fromany single study.
Methods
Identification of Studies and Data ExtractionWe attempted to identify studies that collected informa-
tion on at least one measure of birth size and were based onincident breast cancer cases. Studies were identified bycomputer-assisted searches (including PubMed and Embase)up to the end of June 2007, manual searches of reference lists,personal communication with investigators, and publicityregarding our collaboration in international conferences.The search strategy used the term ‘‘breast cancer’’ incombination with ‘‘birth weight,’’ ‘‘birth size,’’ ‘‘birth length,’’‘‘head circumference,’’ ‘‘ponderal index [PI],’’ and ‘‘gesta-tional age’’ (details of search strategy available on request). Atotal of 27 published and seven unpublished cohort and case-control studies [3–33] were identified, including two twinstudies [10,11] and a cohort of premature or very low birthweight babies [9,21]. One study [32] was excluded becausemost of its participants contributed to a larger unpublishedstudy (Swedish Young Female Breast Cancer [SYFBC], TableS1) and another [33] because its original individual partic-ipant data could not be retrieved. The included studies referto independent study populations, with the exception of two(Seattle Breast Cancer in Young Women [BCYW] [4] andSeattle Perinatal Factors and Breast Cancer [PFBC] [7], TableS1) that were conducted in the same population but used
different sources of birth size information. Data from thesmallest one (Seattle PFBC; 442 cases and 393 non-cases) wereexcluded from the analyses whenever appropriate (asindicated in Figures 1, 2, S1, and S2). Each participatingstudy had previously obtained all relevant ethics approvals;only nonidentifiable data were sent to the London School ofHygiene & Tropical Medicine (LSHTM).Data on individual participants were obtained in a stand-
ardised format. They included measures of birth size (i.e.,weight, length, and head circumference) and, if available, dataon potential confounding factors, mediators, and effectmodifiers (Tables 1, S1–S3). These individual-level data werecentrally collated and crosschecked at LSHTM, with dataquality queries clarified by the principal investigators. As thebirth size distributions were very different in the twin studies[10,11] and in the cohort study of premature/low birth weightbabies [9,21] (Tables S4–S6), these were examined separately.Analyses were restricted to singletons in the remainingstudies and will hereafter be referred to as singleton studies.Participants were further excluded from all studies if theyhad a known history of cancer other than nonmelanoma skincancer at entry into the study (i.e., at recruitment/start offollow-up), and if all birth size data were missing. For the twoNurses Health Studies [31], only nested case-control datawere provided for the pooled analyses. Because of theseexclusions and updated follow-up/recruitment in somestudies [22,23,27,31], study sizes may differ from thosereported in the original study-specific publications.
Statistical MethodsThe primary exposure of interest was birth size as
measured by weight (kg), length (cm), head circumference(cm), and PI (defined as weight [kg]/height [m]3) at birth.These measures were examined as quantitative (for incre-ments of approximately one standard deviation [SD], i.e., 0.5kg for weight, 2 cm for length, 1.5 cm for head circumference,and 2.5 kg/m3 for PI) and as categorical variables. In theanalyses of singleton studies, birth weight was categorisedaccording to commonly used categories (,2.500, 2.500–2.999,3.000–3.499 [baseline], 3.500–3.999, and �4.000 kg); for fourstudies [29–31] birth weight data were only available aspredefined categories equivalent to these except in one study[30] in which the three middle categories were collapsed intoa single one (Table S4). Categories for birth length, headcircumference, and PI were defined by quartiles of theiroverall distributions among all participants in cohort studiesand non-cases in case-control studies. Study-specific quartilesfor birth weight, length, and PI (no data were available forhead circumference) were similarly generated in each twinstudy [10,11] and in the cohort of premature/low birth weightbabies [21].Assessment of birth size–breast cancer associations was
performed primarily using a two-stage approach [37,38].Study-specific effects were first estimated and, if appropriate,pooled using a random effects model under the assumptionthat individual studies estimate different exposure effectsbecause of potential heterogeneities in populations and dataquality, but with the interest focused on their mean value.These pooled effects will hereafter be referred to as ‘‘two-stage,’’ with the standard errors calculated from the inverse ofthe sum of the adjusted weights [38]. Study-specific effectswere estimated as rate ratios in cohort studies and odds ratios
PLoS Medicine | www.plosmedicine.org September 2008 | Volume 5 | Issue 9 | e1931373
Birth Size and Breast Cancer Risk
in case-control studies (hereafter referred to as relative risks[RRs]) using models appropriate for each study design (i.e.,Cox proportional hazard or Poisson regression for cohortstudies; conditional logistic regression for nested [all basedon risk-set sampling] and individually matched case-controlstudies; and logistic regression for frequency-matched case-control studies) [39].
The analytical time scale for cohort studies was age, withthe beginning of the follow-up defined as the age atrecruitment into the study or the age when outcomeascertainment became possible (e.g., through linkage tocancer registries). Follow-up ended at the age of breastcancer diagnosis, death, emigration, or last follow-up,whichever occurred earlier. RRs for cohort studies were thusadjusted for age at diagnosis. The proportional hazardsassumption was checked in Cox models graphically, bycomparing stratum-specific cumulative incidence curvesbefore fitting the models, and formally via the test ofproportionality based on Schoenfeld residuals [40]. InPoisson models the assumption of time-constant effects (i.e.,proportionality) was assessed by testing the significance ofinteractions between birth size measures and age. RRs forcohort studies were additionally adjusted for calendar year bystratification. The matching variables specified for each case-control study (e.g., year of birth, calendar period, recruitment
centre, area of residence, or ethnicity) were accounted for inthe estimation of RRs either through matched analyses (forindividually matched studies) or adjustment (for frequency-matched studies). The RRs quoted in the text refer to theseminimally adjusted RRs unless otherwise specified. Thestatistical significance of each birth size–breast cancerassociation, and of quadratic departures from the assumptionof linearity of effects, were assessed within each study bylikelihood ratio tests and for pooled estimates by Wald tests.Possible sources of between-study heterogeneity were inves-tigated and formally tested using the Cochran Q statistic andthe I2 quantity based on standard cut-off points [41,42]. Two-stage pooled estimates of groups of RRs were only calculatedif there was no statistically significant evidence of systematicheterogeneity. The influence of individual studies wasassessed by sequentially dropping each one before poolingstudy-specific estimates.To increase statistical precision, one-stage pooled analyses,
in which overall pooled estimates are derived from a singlemodel, were also conducted on the subset of cohort studies ofsingleton women with birth records information. Randomeffects multivariable Cox regression (frailty) models [43],which account for within study clustering, were fitted toassess exposure-response relationships for each birth sizevariable and to estimate their joint associations with breast
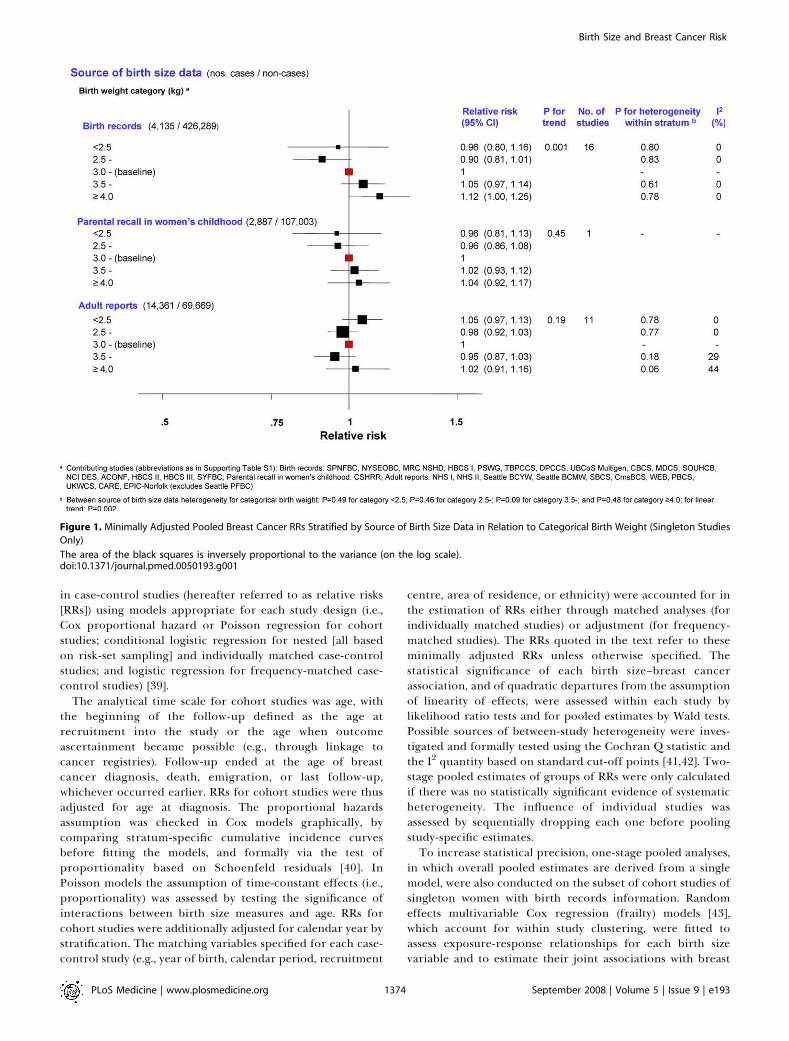
Figure 1. Minimally Adjusted Pooled Breast Cancer RRs Stratified by Source of Birth Size Data in Relation to Categorical Birth Weight (Singleton Studies
Only)
The area of the black squares is inversely proportional to the variance (on the log scale).doi:10.1371/journal.pmed.0050193.g001
PLoS Medicine | www.plosmedicine.org September 2008 | Volume 5 | Issue 9 | e1931374
Birth Size and Breast Cancer Risk
cancer risk. These models were also used to estimate thebreast cancer cumulative incidence curve corresponding tothe baseline birth length category (i.e., 49.0–49.9 cm).Cumulative incidence curves for the other birth lengthcategories were obtained by multiplying the baseline curveby the corresponding category-specific RRs. A similarapproach was used to calculate cumulative incidence curvesfor the five birth weight categories (taking the 3.000–3.999 kgcategory as the baseline).
As the availability and classification of potential confound-ers varied from study to study, adjustment for confoundingwas performed separately for each variable, or group ofvariables, within each study and then pooled using the two-stage procedure. Consequently, the number of cases and non-cases involved in each analysis varied accordingly. To assesswhether the birth size associations were modified by age,analyses were stratified by age at breast cancer diagnosis (,45y; 45–54 y, �55 y) for case-control studies and by a time-changing indicator of current age for cohort studies. Analyseswere similarly stratified by menopausal status at diagnosis inthe subset of studies with this information.
Two-stage and one-stage pooled analyses were repeatedafter excluding extreme birth size observations (i.e., values
outside the singleton/twins/premature-specific means 6 4SDs). Small study bias was assessed via the Egger funnel plotasymmetry test [44] and other forms of publication bias bymeta-regression. All statistical analyses were performed inStata [45]. All tests of significance are two-sided.
Results
Characteristics of the Study ParticipantsA total of 32 studies contributed to these analyses, including
22,058 women with newly diagnosed invasive or in situ breastcancer and 604,854 non-cases. The characteristics of theparticipating studies are summarised in Table 1 (furtherdetails in Tables S1–S3). Information on birth weight wasbased on birth records, parental recall when the women were6–7 y old, mother’s recall during the woman’s adulthood, andon self-reports in adulthood. In analyses by source of birthweight data, the two last categories produced similar effectestimates and thus were combined into one single category ofadult reports. Data on categorical birth weight were availablefor all 32 studies, whereas data on continuous birth weight andon other measures of birth size were available for a smallernumber of studies (Tables 1 and S2).
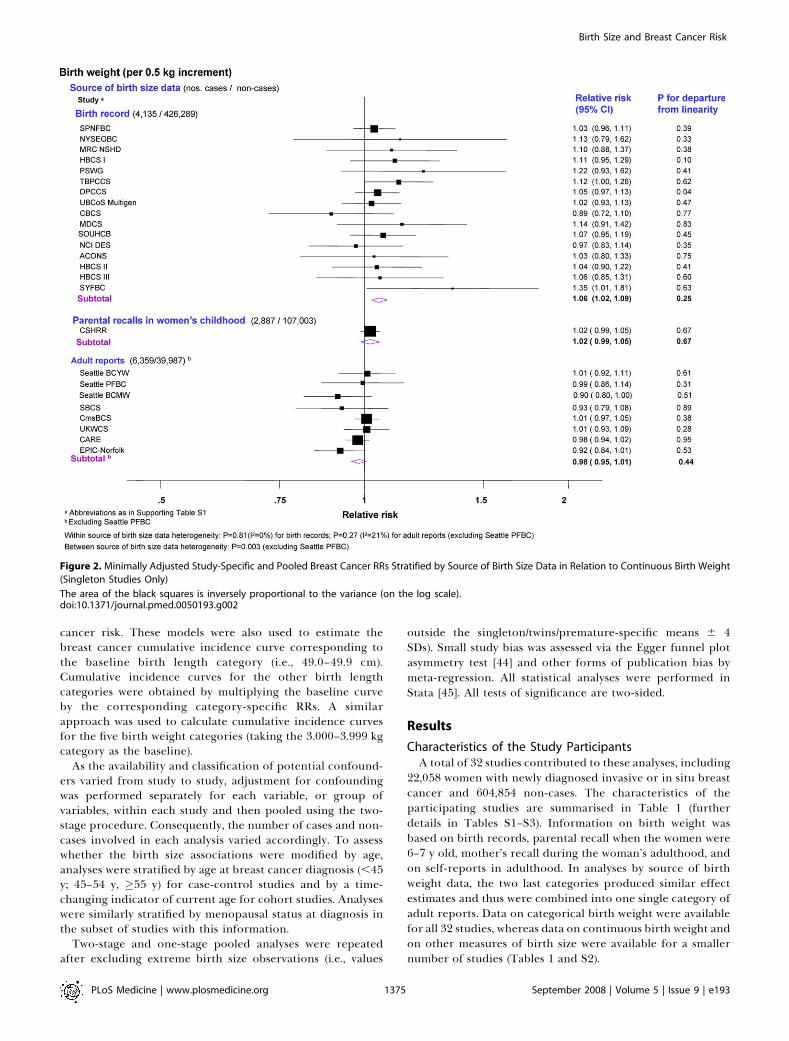
Figure 2. Minimally Adjusted Study-Specific and Pooled Breast Cancer RRs Stratified by Source of Birth Size Data in Relation to Continuous Birth Weight
(Singleton Studies Only)
The area of the black squares is inversely proportional to the variance (on the log scale).doi:10.1371/journal.pmed.0050193.g002
PLoS Medicine | www.plosmedicine.org September 2008 | Volume 5 | Issue 9 | e1931375
Birth Size and Breast Cancer Risk
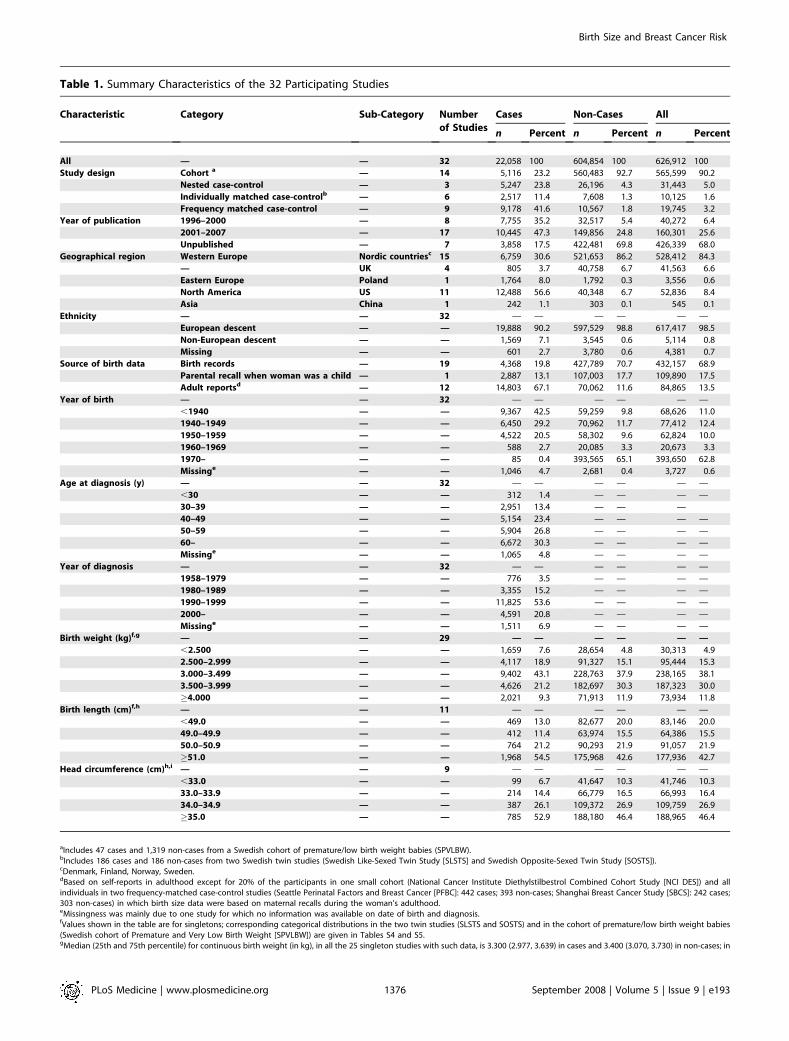
Table 1. Summary Characteristics of the 32 Participating Studies
Characteristic Category Sub-Category Number
of Studies
Cases Non-Cases All
n Percent n Percent n Percent
All — — 32 22,058 100 604,854 100 626,912 100
Study design Cohort a — 14 5,116 23.2 560,483 92.7 565,599 90.2
Nested case-control — 3 5,247 23.8 26,196 4.3 31,443 5.0
Individually matched case-controlb — 6 2,517 11.4 7,608 1.3 10,125 1.6
Frequency matched case-control — 9 9,178 41.6 10,567 1.8 19,745 3.2
Year of publication 1996–2000 — 8 7,755 35.2 32,517 5.4 40,272 6.4
2001–2007 — 17 10,445 47.3 149,856 24.8 160,301 25.6
Unpublished — 7 3,858 17.5 422,481 69.8 426,339 68.0
Geographical region Western Europe Nordic countriesc 15 6,759 30.6 521,653 86.2 528,412 84.3
— UK 4 805 3.7 40,758 6.7 41,563 6.6
Eastern Europe Poland 1 1,764 8.0 1,792 0.3 3,556 0.6
North America US 11 12,488 56.6 40,348 6.7 52,836 8.4
Asia China 1 242 1.1 303 0.1 545 0.1
Ethnicity — — 32 — — — — — —
European descent — — 19,888 90.2 597,529 98.8 617,417 98.5
Non-European descent — — 1,569 7.1 3,545 0.6 5,114 0.8
Missing — — 601 2.7 3,780 0.6 4,381 0.7
Source of birth data Birth records — 19 4,368 19.8 427,789 70.7 432,157 68.9
Parental recall when woman was a child — 1 2,887 13.1 107,003 17.7 109,890 17.5
Adult reportsd — 12 14,803 67.1 70,062 11.6 84,865 13.5
Year of birth — — 32 — — — — — —
,1940 — — 9,367 42.5 59,259 9.8 68,626 11.0
1940–1949 — — 6,450 29.2 70,962 11.7 77,412 12.4
1950–1959 — — 4,522 20.5 58,302 9.6 62,824 10.0
1960–1969 — — 588 2.7 20,085 3.3 20,673 3.3
1970– — — 85 0.4 393,565 65.1 393,650 62.8
Missinge — — 1,046 4.7 2,681 0.4 3,727 0.6
Age at diagnosis (y) — — 32 — — — — — —
,30 — — 312 1.4 — — — —
30–39 — — 2,951 13.4 — — —
40–49 — — 5,154 23.4 — — — —
50–59 — — 5,904 26.8 — — — —
60– — — 6,672 30.3 — — — —
Missinge — — 1,065 4.8 — — — —
Year of diagnosis — — 32 — — — — — —
1958–1979 — — 776 3.5 — — — —
1980–1989 — — 3,355 15.2 — — — —
1990–1999 — — 11,825 53.6 — — — —
2000– — — 4,591 20.8 — — — —
Missinge — — 1,511 6.9 — — — —
Birth weight (kg)f,g — — 29 — — — — — —
,2.500 — — 1,659 7.6 28,654 4.8 30,313 4.9
2.500–2.999 — — 4,117 18.9 91,327 15.1 95,444 15.3
3.000–3.499 — — 9,402 43.1 228,763 37.9 238,165 38.1
3.500–3.999 — — 4,626 21.2 182,697 30.3 187,323 30.0
�4.000 — — 2,021 9.3 71,913 11.9 73,934 11.8
Birth length (cm)f,h — — 11 — — — — — —
,49.0 — — 469 13.0 82,677 20.0 83,146 20.0
49.0–49.9 — — 412 11.4 63,974 15.5 64,386 15.5
50.0–50.9 — — 764 21.2 90,293 21.9 91,057 21.9
�51.0 — — 1,968 54.5 175,968 42.6 177,936 42.7
Head circumference (cm)h,i — — 9 — — — — — —
,33.0 — — 99 6.7 41,647 10.3 41,746 10.3
33.0–33.9 — — 214 14.4 66,779 16.5 66,993 16.4
34.0–34.9 — — 387 26.1 109,372 26.9 109,759 26.9
�35.0 — — 785 52.9 188,180 46.4 188,965 46.4
aIncludes 47 cases and 1,319 non-cases from a Swedish cohort of premature/low birth weight babies (SPVLBW).bIncludes 186 cases and 186 non-cases from two Swedish twin studies (Swedish Like-Sexed Twin Study [SLSTS] and Swedish Opposite-Sexed Twin Study [SOSTS]).cDenmark, Finland, Norway, Sweden.dBased on self-reports in adulthood except for 20% of the participants in one small cohort (National Cancer Institute Diethylstilbestrol Combined Cohort Study [NCI DES]) and allindividuals in two frequency-matched case-control studies (Seattle Perinatal Factors and Breast Cancer [PFBC]: 442 cases; 393 non-cases; Shanghai Breast Cancer Study [SBCS]: 242 cases;303 non-cases) in which birth size data were based on maternal recalls during the woman’s adulthood.eMissingness was mainly due to one study for which no information was available on date of birth and diagnosis.fValues shown in the table are for singletons; corresponding categorical distributions in the two twin studies (SLSTS and SOSTS) and in the cohort of premature/low birth weight babies(Swedish cohort of Premature and Very Low Birth Weight [SPVLBW]) are given in Tables S4 and S5.gMedian (25th and 75th percentile) for continuous birth weight (in kg), in all the 25 singleton studies with such data, is 3.300 (2.977, 3.639) in cases and 3.400 (3.070, 3.730) in non-cases; in
PLoS Medicine | www.plosmedicine.org September 2008 | Volume 5 | Issue 9 | e1931376
Birth Size and Breast Cancer Risk
Birth Size and Breast Cancer RiskTwo-stage pooled analyses of RRs, stratified by source of
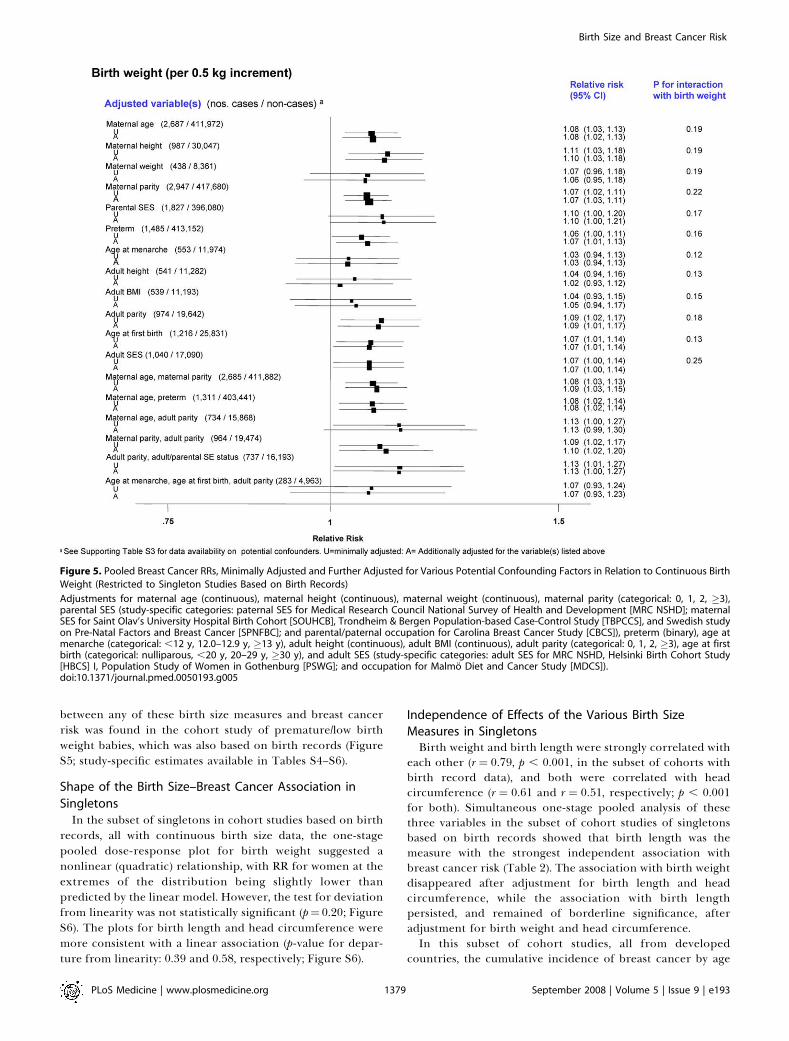
birth size information, showed that the risk of breast cancerin singletons increased with increasing birth weight catego-ries in studies based on birth records or on parental recalls inchildhood (although significant only for the first, p for lineartrend (pt) ¼ 0.001), but not in those based on adult reports(Figure 1; study-specific estimates available in Table S4).Continuous analysis of birth weight (restricted to 25 studies;Figure 2) revealed a similar pattern. A 0.5-kg increment(about one SD) in birth weight was associated with astatistically significant increase in risk in studies based onbirth records (pooled RR¼ 1.06 [95% confidence interval (CI)1.02–1.09]; p¼ 0.002) and a borderline significant increase inthose based on parental recalls when the women werechildren, but not in studies based on adult reports, withstatistical evidence of heterogeneity between birth weightdata sources (p¼ 0.003). Categorical and continuous analysesof birth weight stratified by study design revealed a positivetrend in risk with increasing birth weight categories in data
from cohort, nested case-control, and individually matchedcase-control studies (albeit only statistically significantly forthe latter), but not in data from frequency-matched case-control studies (Figures S1 and S2). There was evidence ofbetween study-design heterogeneity of the continuous birthweight effect (p ¼ 0.03), but it was accounted for bydifferences in birth data sources when examined via meta-regression of the birth weight RRs on both study design andbirth data sources (p-value for study-type heterogeneity ¼0.67; for adult reports versus other sources ¼ 0.08).Data on birth length and head circumference were
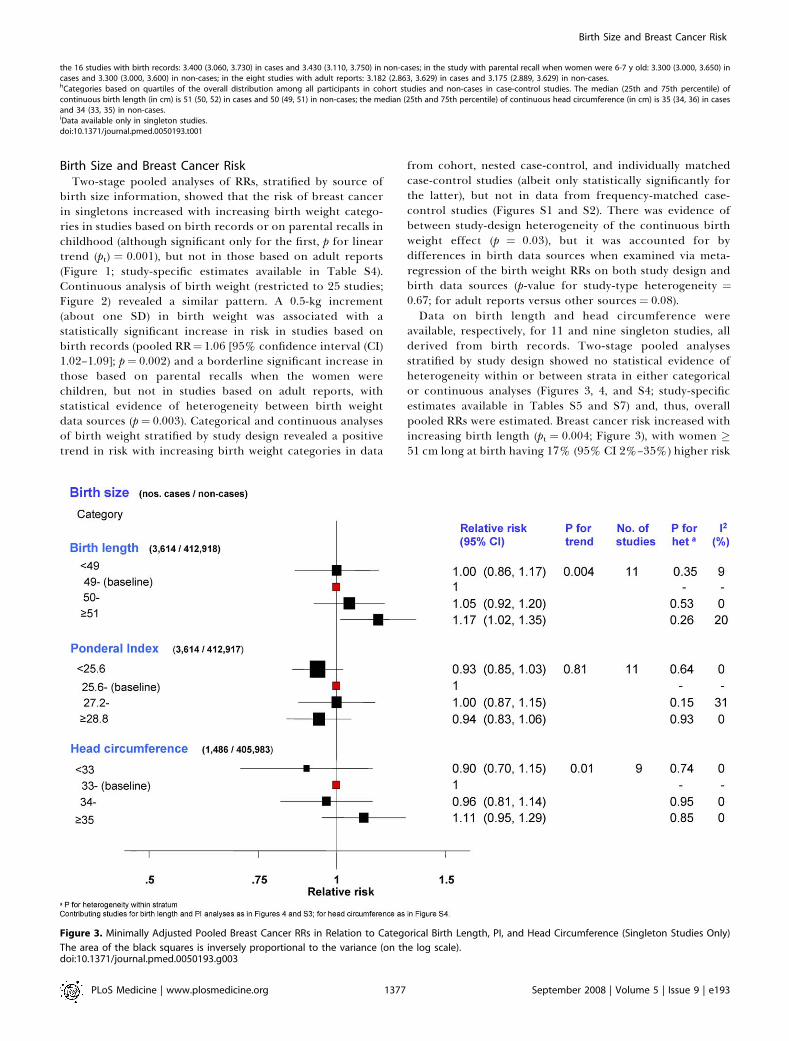
available, respectively, for 11 and nine singleton studies, allderived from birth records. Two-stage pooled analysesstratified by study design showed no statistical evidence ofheterogeneity within or between strata in either categoricalor continuous analyses (Figures 3, 4, and S4; study-specificestimates available in Tables S5 and S7) and, thus, overallpooled RRs were estimated. Breast cancer risk increased withincreasing birth length (pt ¼ 0.004; Figure 3), with women �51 cm long at birth having 17% (95% CI 2%–35%) higher risk
Figure 3. Minimally Adjusted Pooled Breast Cancer RRs in Relation to Categorical Birth Length, PI, and Head Circumference (Singleton Studies Only)
The area of the black squares is inversely proportional to the variance (on the log scale).doi:10.1371/journal.pmed.0050193.g003
the 16 studies with birth records: 3.400 (3.060, 3.730) in cases and 3.430 (3.110, 3.750) in non-cases; in the study with parental recall when women were 6-7 y old: 3.300 (3.000, 3.650) incases and 3.300 (3.000, 3.600) in non-cases; in the eight studies with adult reports: 3.182 (2.863, 3.629) in cases and 3.175 (2.889, 3.629) in non-cases.hCategories based on quartiles of the overall distribution among all participants in cohort studies and non-cases in case-control studies. The median (25th and 75th percentile) ofcontinuous birth length (in cm) is 51 (50, 52) in cases and 50 (49, 51) in non-cases; the median (25th and 75th percentile) of continuous head circumference (in cm) is 35 (34, 36) in casesand 34 (33, 35) in non-cases.iData available only in singleton studies.doi:10.1371/journal.pmed.0050193.t001
PLoS Medicine | www.plosmedicine.org September 2008 | Volume 5 | Issue 9 | e1931377
Birth Size and Breast Cancer Risk
of developing breast cancer relative to those in the baselinecategory. Women with a head circumference �35 cm had an11% increase (95% CI �5% to 29%) in risk relative to thosein the baseline category, whereas those with a head circum-ference ,33 cm had a 10% decrease (95% CI�30% to 15%)(pt¼ 0.01) (Figure 3). These estimates corresponded to pooledRRs of 1.06 (95% CI 1.03–1.10) per one SD (¼2 cm) incrementin birth length (Figure 4) and 1.09 (1.03–1.15) per one SD (¼1.5 cm) increment in head circumference (Figure S4). Incontrast, there was no association with categorical (Figure 3)
or continuous PI (pooled RR per 2.5 kg/m3 increment¼ 1.01;0.97–1.04; Figure S3; study-specific estimates available inTable S6).The two twin case-control studies, both based on birth
records, showed stronger associations of breast cancer riskwith continuous birth weight (pooled RR per one SDincrement ¼ 1.57; 95% CI 1.20–2.07) and continuous birthlength (1.23; 1.01–1.49) than those found among singletonstudies, and a positive association with PI (1.36; 1.06–1.75)that was not observed in the latter (Figure S5). No association
Figure 4. Minimally Adjusted Study-Specific and Pooled Breast Cancer RRs in Relation to Continuous Birth Length (Singleton Studies Only)
The area of the black squares is inversely proportional to the variance (on the log scale).doi:10.1371/journal.pmed.0050193.g004
Table 2. Separate (Univariable) and Mutually Adjusted (Multivariable) Breast Cancer Incidence Rate Ratios for Continuous Weight,Length, and Head Circumference at Birth in Singletons
Variable Univariable Multivariable
Rate Ratioa (95% CI) Rate Ratioa (95% CI)
Birth weight (per 0.5 kg increment) 1.07 (1.01–1.14) 0.98 (0.89–1.08)
Birth length (per 2 cm increment) 1.10 (1.03–1.16) 1.09 (1.00–1.19)
Head circumference (per 1.5 cm increment) 1.07 (1.01–1.14) 1.03 (0.96–1.12)
aEstimated using random effects Cox proportional hazards models fitted on the age timescale on seven cohort studies (1,210 cases/404,970 non-cases) with continuous birth size datafrom birth records (Population Study of Women in Gothenburg [PSWG], Helsinki Birth Cohort Study [HBCS] I, II, and III, Uppsala Birth Cohort Multigenerational Study [UBCoS Multigen],Saint Olav’s University Hospital Birth Cohort [SOUHBC], and The Swedish Young Female Breast Cancer Study [SYFBC]).doi:10.1371/journal.pmed.0050193.t002
PLoS Medicine | www.plosmedicine.org September 2008 | Volume 5 | Issue 9 | e1931378
Birth Size and Breast Cancer Risk
between any of these birth size measures and breast cancerrisk was found in the cohort study of premature/low birthweight babies, which was also based on birth records (FigureS5; study-specific estimates available in Tables S4–S6).
Shape of the Birth Size–Breast Cancer Association in
SingletonsIn the subset of singletons in cohort studies based on birth
records, all with continuous birth size data, the one-stagepooled dose-response plot for birth weight suggested anonlinear (quadratic) relationship, with RR for women at theextremes of the distribution being slightly lower thanpredicted by the linear model. However, the test for deviationfrom linearity was not statistically significant (p¼ 0.20; FigureS6). The plots for birth length and head circumference weremore consistent with a linear association (p-value for depar-ture from linearity: 0.39 and 0.58, respectively; Figure S6).
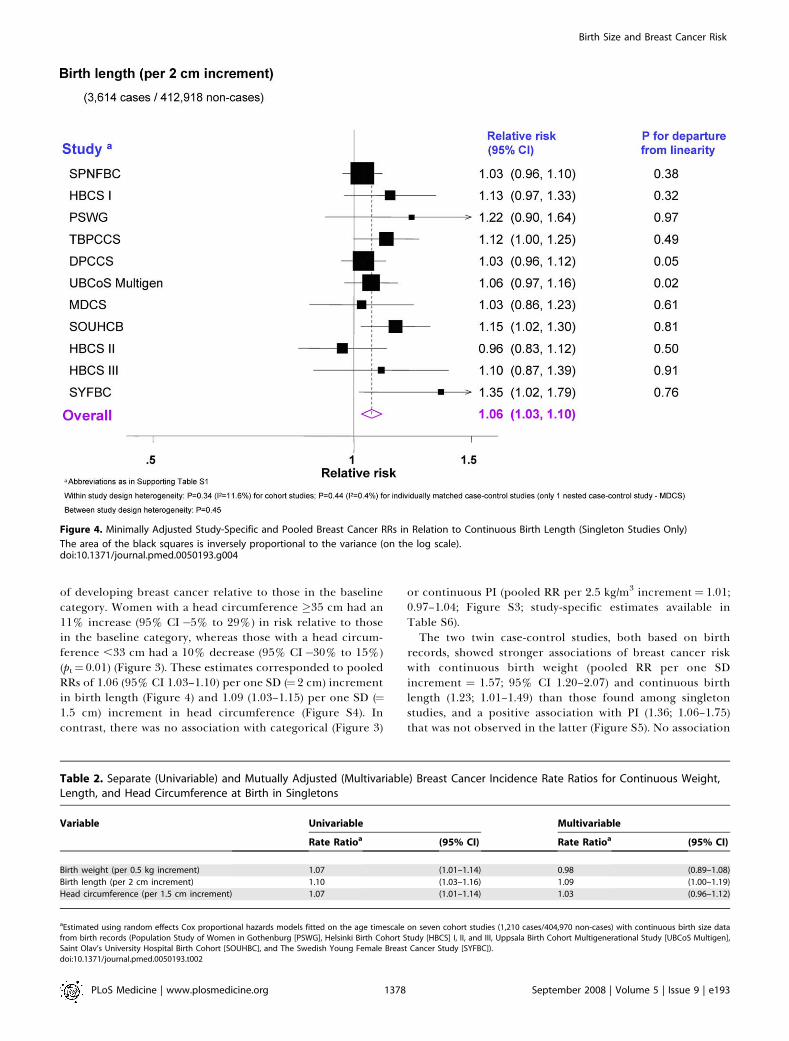
Independence of Effects of the Various Birth Size
Measures in SingletonsBirth weight and birth length were strongly correlated with
each other (r ¼ 0.79, p , 0.001, in the subset of cohorts withbirth record data), and both were correlated with headcircumference (r ¼ 0.61 and r ¼ 0.51, respectively; p , 0.001for both). Simultaneous one-stage pooled analysis of thesethree variables in the subset of cohort studies of singletonsbased on birth records showed that birth length was themeasure with the strongest independent association withbreast cancer risk (Table 2). The association with birth weightdisappeared after adjustment for birth length and headcircumference, while the association with birth lengthpersisted, and remained of borderline significance, afteradjustment for birth weight and head circumference.In this subset of cohort studies, all from developed
countries, the cumulative incidence of breast cancer by age
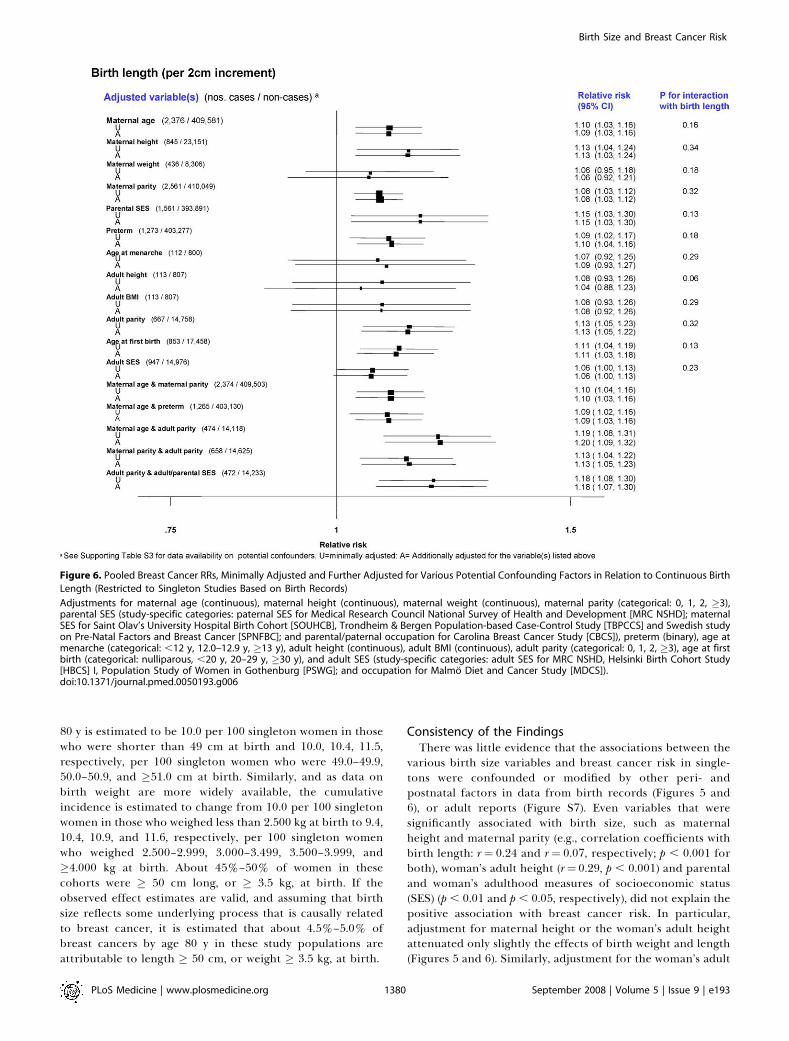
Figure 5. Pooled Breast Cancer RRs, Minimally Adjusted and Further Adjusted for Various Potential Confounding Factors in Relation to Continuous Birth
Weight (Restricted to Singleton Studies Based on Birth Records)
Adjustments for maternal age (continuous), maternal height (continuous), maternal weight (continuous), maternal parity (categorical: 0, 1, 2, �3),parental SES (study-specific categories: paternal SES for Medical Research Council National Survey of Health and Development [MRC NSHD]; maternalSES for Saint Olav’s University Hospital Birth Cohort [SOUHCB], Trondheim & Bergen Population-based Case-Control Study [TBPCCS], and Swedish studyon Pre-Natal Factors and Breast Cancer [SPNFBC]; and parental/paternal occupation for Carolina Breast Cancer Study [CBCS]), preterm (binary), age atmenarche (categorical: ,12 y, 12.0–12.9 y, �13 y), adult height (continuous), adult BMI (continuous), adult parity (categorical: 0, 1, 2, �3), age at firstbirth (categorical: nulliparous, ,20 y, 20–29 y, �30 y), and adult SES (study-specific categories: adult SES for MRC NSHD, Helsinki Birth Cohort Study[HBCS] I, Population Study of Women in Gothenburg [PSWG]; and occupation for Malmo Diet and Cancer Study [MDCS]).doi:10.1371/journal.pmed.0050193.g005
PLoS Medicine | www.plosmedicine.org September 2008 | Volume 5 | Issue 9 | e1931379
Birth Size and Breast Cancer Risk
80 y is estimated to be 10.0 per 100 singleton women in thosewho were shorter than 49 cm at birth and 10.0, 10.4, 11.5,respectively, per 100 singleton women who were 49.0–49.9,50.0–50.9, and �51.0 cm at birth. Similarly, and as data onbirth weight are more widely available, the cumulativeincidence is estimated to change from 10.0 per 100 singletonwomen in those who weighed less than 2.500 kg at birth to 9.4,10.4, 10.9, and 11.6, respectively, per 100 singleton womenwho weighed 2.500–2.999, 3.000–3.499, 3.500–3.999, and�4.000 kg at birth. About 45%–50% of women in thesecohorts were � 50 cm long, or � 3.5 kg, at birth. If theobserved effect estimates are valid, and assuming that birthsize reflects some underlying process that is causally relatedto breast cancer, it is estimated that about 4.5%–5.0% ofbreast cancers by age 80 y in these study populations areattributable to length � 50 cm, or weight � 3.5 kg, at birth.
Consistency of the FindingsThere was little evidence that the associations between the
various birth size variables and breast cancer risk in single-tons were confounded or modified by other peri- andpostnatal factors in data from birth records (Figures 5 and6), or adult reports (Figure S7). Even variables that weresignificantly associated with birth size, such as maternalheight and maternal parity (e.g., correlation coefficients withbirth length: r¼ 0.24 and r¼ 0.07, respectively; p , 0.001 forboth), woman’s adult height (r¼ 0.29, p , 0.001) and parentaland woman’s adulthood measures of socioeconomic status(SES) (p , 0.01 and p , 0.05, respectively), did not explain thepositive association with breast cancer risk. In particular,adjustment for maternal height or the woman’s adult heightattenuated only slightly the effects of birth weight and length(Figures 5 and 6). Similarly, adjustment for the woman’s adult
Figure 6. Pooled Breast Cancer RRs, Minimally Adjusted and Further Adjusted for Various Potential Confounding Factors in Relation to Continuous Birth
Length (Restricted to Singleton Studies Based on Birth Records)
Adjustments for maternal age (continuous), maternal height (continuous), maternal weight (continuous), maternal parity (categorical: 0, 1, 2, �3),parental SES (study-specific categories: paternal SES for Medical Research Council National Survey of Health and Development [MRC NSHD]; maternalSES for Saint Olav’s University Hospital Birth Cohort [SOUHCB], Trondheim & Bergen Population-based Case-Control Study [TBPCCS] and Swedish studyon Pre-Natal Factors and Breast Cancer [SPNFBC]; and parental/paternal occupation for Carolina Breast Cancer Study [CBCS]), preterm (binary), age atmenarche (categorical: ,12 y, 12.0–12.9 y, �13 y), adult height (continuous), adult BMI (continuous), adult parity (categorical: 0, 1, 2, �3), age at firstbirth (categorical: nulliparous, ,20 y, 20–29 y, �30 y), and adult SES (study-specific categories: adult SES for MRC NSHD, Helsinki Birth Cohort Study[HBCS] I, Population Study of Women in Gothenburg [PSWG]; and occupation for Malmo Diet and Cancer Study [MDCS]).doi:10.1371/journal.pmed.0050193.g006
PLoS Medicine | www.plosmedicine.org September 2008 | Volume 5 | Issue 9 | e1931380
Birth Size and Breast Cancer Risk
body mass index (BMI) did not affect the birth size effects(Figures 5 and 6). Neither continuous gestational age (pooledRR per 1 wk increment ¼ 0.99; 95% CI 0.96–1.03) or beingpreterm (unpublished data) was associated with breast cancerrisk. Few studies collected data on the woman’s use of oralcontraceptives (OC) or hormone replacement therapy (HRT)(Table S3), but their findings indicate that the birth size–breast cancer associations reported here are unlikely to havebeen confounded by ever use of these exogenous hormones(minimally adjusted and OC-adjusted pooled RRs per 2 cmincrement in birth length: 1.14 (95% CI 0.82–1.61) and 1.14(0.82–1.61), respectively; similarly, minimally adjusted andHRT-adjusted pooled RRs: 1.08 (0.92–1.25) and 1.07 (0.86–1.34), respectively).
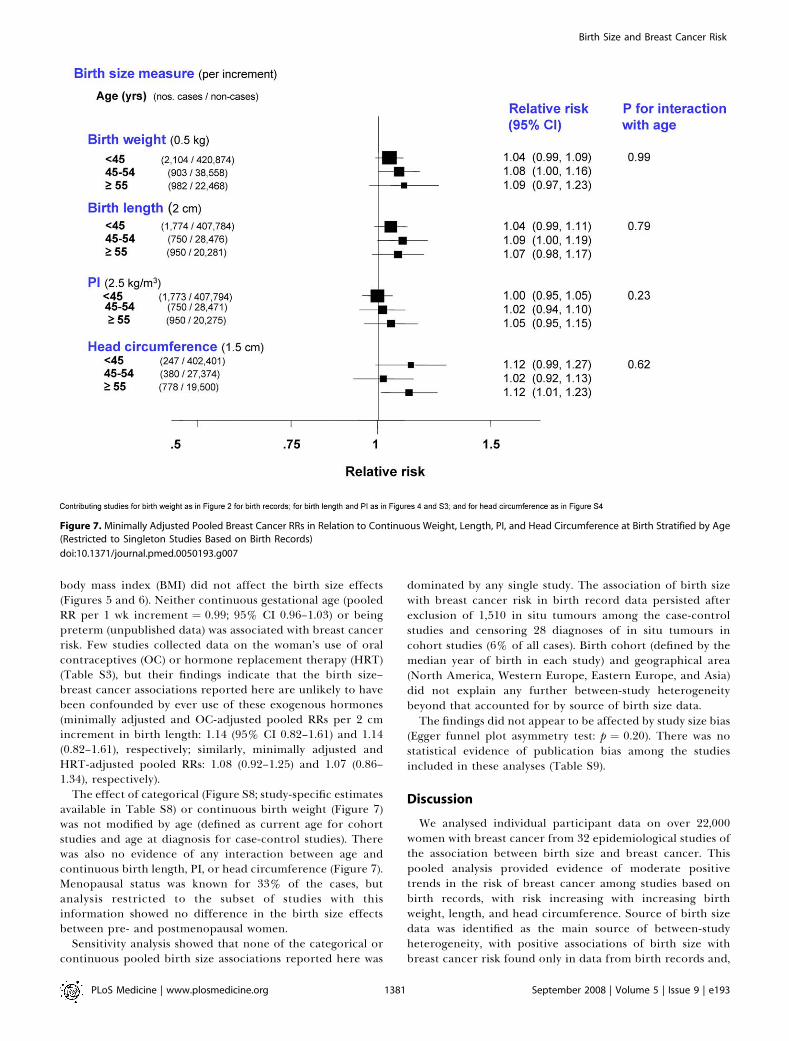
The effect of categorical (Figure S8; study-specific estimatesavailable in Table S8) or continuous birth weight (Figure 7)was not modified by age (defined as current age for cohortstudies and age at diagnosis for case-control studies). Therewas also no evidence of any interaction between age andcontinuous birth length, PI, or head circumference (Figure 7).Menopausal status was known for 33% of the cases, butanalysis restricted to the subset of studies with thisinformation showed no difference in the birth size effectsbetween pre- and postmenopausal women.
Sensitivity analysis showed that none of the categorical orcontinuous pooled birth size associations reported here was
dominated by any single study. The association of birth sizewith breast cancer risk in birth record data persisted afterexclusion of 1,510 in situ tumours among the case-controlstudies and censoring 28 diagnoses of in situ tumours incohort studies (6% of all cases). Birth cohort (defined by themedian year of birth in each study) and geographical area(North America, Western Europe, Eastern Europe, and Asia)did not explain any further between-study heterogeneitybeyond that accounted for by source of birth size data.The findings did not appear to be affected by study size bias
(Egger funnel plot asymmetry test: p ¼ 0.20). There was nostatistical evidence of publication bias among the studiesincluded in these analyses (Table S9).
Discussion
We analysed individual participant data on over 22,000women with breast cancer from 32 epidemiological studies ofthe association between birth size and breast cancer. Thispooled analysis provided evidence of moderate positivetrends in the risk of breast cancer among studies based onbirth records, with risk increasing with increasing birthweight, length, and head circumference. Source of birth sizedata was identified as the main source of between-studyheterogeneity, with positive associations of birth size withbreast cancer risk found only in data from birth records and,
Figure 7. Minimally Adjusted Pooled Breast Cancer RRs in Relation to Continuous Weight, Length, PI, and Head Circumference at Birth Stratified by Age
(Restricted to Singleton Studies Based on Birth Records)
doi:10.1371/journal.pmed.0050193.g007
PLoS Medicine | www.plosmedicine.org September 2008 | Volume 5 | Issue 9 | e1931381
Birth Size and Breast Cancer Risk
to a lesser extent, in data from parental recalls when thewomen were aged 6–7 y, but not in data from self-reports ormaternal recalls when the women were adults.
Simultaneous adjustment for weight, length and headcircumference at birth showed that length, perhaps as ameasure of linear growth, was the strongest predictor of riskdespite the fact that the latter tends to be more poorlymeasured than weight or head circumference [46,47]. Suchfinding should not however be overinterpreted because of thestrong collinearities among these variables.
The birth size effect did not appear to be confounded ormodified by known breast cancer risk factors. In particular,and contrary to previous reports [18,23,31], there was noevidence that the birth size effect was stronger for premeno-pausal breast cancer. The association between birth size andbreast cancer risk was observed consistently in women bornover a period of several decades, and in different geo-graphical areas.
Strengths and LimitationsBecause of its large size this pooled analysis provided
greater statistical power than any of the contributingindividual studies and, therefore, more precise estimatesthan those previously published. It was also possible tostandardise the way in which the exposure and confoundingvariables were defined and coded, the choice of whichvariables to control for, and the type of analysis conducted,thereby removing these potential sources of heterogeneityacross studies. The possible influence of bias needs to beconsidered. Publication bias is a general problem for pooledanalyses. Because inclusion in this pooled analysis was notdependent on publication, this re-analysis is likely to havebeen less affected by publication bias than meta-analyses ofthe published literature. The two nonparticipating studies[32,33] showed no association between birth weight andbreast cancer, but they were based on small numbers of cases(12 and 74, respectively). We found no evidence of publica-tion bias when examining the effect of study size, or year andtype of publication.
Bias within studies, such as information or selection bias,might also have influenced the results. Exposure measure-ment error could have been a problem as we found evidenceof statistical heterogeneity of effects by source of birth sizedata. Reports of birth weight by the participants themselvesin adulthood, or by their mothers when the participants wereadults, are likely to be more prone to measurement errorthan those based on birth records or on parental recall whenthe participants were children. This remark is consistent withthe clear digit preference patterns found in the birth weightdata reported by the women themselves, or their parents, butnot in those from birth records (unpublished data). Theseerrors are, however, likely to be mainly nondifferential and solikely to impose an attenuating bias in univariable analysesthat use these sources of data as exposure measurements.Although differential misclassification is possible in studies inwhich exposure information was collected after diagnosis, itis unlikely that participants would have been aware of apossible link of birth size with breast cancer risk. Thus, thevariability in results across the various sources of birth weightdata might simply reflect different degrees of attenuation ofthe true birth weight effect due to different levels of randomexposure misclassification. Selection bias could have been a
problem, particularly in case-control studies. Although allcase-control studies in this re-analysis were population-based,selection bias might still have occurred in studies withrelatively low participation. We did not find evidence thatstudies with low participation levels provided systematicallydiscrepant results (p for heterogeneity ¼ 0.88). Bias due toincomplete follow-up is unlikely because all cohorts had highdegrees of completeness.Finally, the impact of potential confounding factors was
evaluated by comparing effect estimates unadjusted andadjusted for single or multiple potential confounders. Theresults showed little variation. The availability of informationon many potential confounding variables is a major strengthof our pooled analysis. One drawback is that information formany of them was restricted to a few studies and therefore wecould only assess the impact of each potential confounderseparately, or only of groups with few of them at a time, whenpooling data. Moreover, some of these factors were probablymeasured with some error. Thus, we cannot exclude residualor unmeasured confounding by these or other factors.
Biological Plausibility and New PerspectivesThese results provide no direct evidence about possible
mechanisms underlying the birth size–breast cancer associa-tion. Trichopoulos’s initial assumption [1] was that birth sizewas a correlate of foetal oestrogen exposure. Oestriolrepresents 90% of the oestrogens produced during preg-nancy [48]. Birth size indicators have been found to becorrelated with maternal oestriol levels [49] but, not withfoetal levels [50]. Maternal and/or foetal levels of other growthfactors, such as insulin-like growth factors [51,52], leptin andadiponectin [53–55], and alpha-phetoprotein [56] have alsobeen reported to be associated with birth size. The maternaland/or foetal hormonal environment associated with largebirth size may alter programming of the breast, making itmore susceptible to cancer initiation by endogenous hor-mone levels and other carcinogens later in life [57]. Thisaltered programming may involve epigenetic changes in theexpression of genes linked to cell proliferation, survival, anddifferentiation; these changes are likely to occur in the foetalmammary stem cells that give rise to all mammary epithelialstructures and/or in cells that influence stem cell self-renewaland fate [58]. If pregnancy hormones are the real exposure ofinterest the use of a surrogate measure, such as birth size, maylead to considerable exposure misclassification with likelyattenuation of the true effect. A moderate correlation ofbirth size with pregnancy hormone levels of about r¼ 0.35, asfound with maternal oestriol [49,59], implies that theobserved RR of 1.06 per one SD increment in birth weightwould correspond to a RR as large as 1.17 for one SD increasein the underlying true exposure (although the corresponding95% CI would be wider). If, however, the in utero origins ofbreast cancer result from a complex interplay of severalhormonal and nonhormonal processes [60], birth size may, infact, be a better cumulative summary measure of all relevantexposures than measured levels of any single hormone.Foetal growth is a predictor of a woman’s growth and
development during childhood and early adult life, and bothage at menarche and adult height [61] are associated withbreast cancer risk. Thus, the observed association betweenfoetal growth and breast cancer may be partly mediatedthrough postnatal growth. This pathway would be consistent
PLoS Medicine | www.plosmedicine.org September 2008 | Volume 5 | Issue 9 | e1931382
Birth Size and Breast Cancer Risk
with our finding of a stronger association of breast cancerwith birth length than birth weight, as birth length forgestational age has been shown to be a stronger predictor ofadult height than birth weight for gestational age [62,63].However the magnitude of the birth size effect was onlyslightly reduced after adjustment for adulthood height (buton the basis of a small number of cases, Figures 5 and 6),suggesting that the effect of birth size on risk may be onlypartly mediated through childhood growth [22,23]. Similarly,the woman’s BMI in adulthood did not confound the birthsize–breast cancer associations. This was true even atpremenopausal ages when adult BMI was inversely associatedwith breast cancer risk and thus any potential confounding bythis variable would have lead to an underestimation of thetrue birth size effects.
ConclusionsThis pooled analysis of individual participant data provides
a comprehensive and detailed description of the associationbetween birth size and breast cancer risk. Its findings areconsistent with positive associations at both pre- andpostmenopausal ages, and are largely independent of post-natal risk factors including adult body size. This study is animportant addition to previous meta-analyses of publishedresults [34–36] as it offers a comprehensive assessment ofpossible sources of between-study heterogeneity, and itclarifies the role of several potential confounders, mediators,and effect modifiers. The magnitude of the observed effect,although modest, is similar to those reported for other moreestablished breast cancer risk factors. The RR per one SDincrement in birth length of 9% is of similar magnitude tothat associated with one SD increase in adult height in ourdata, and similar to an increase of about 7% for eachadditional 10 g of alcohol consumed on a daily basis [64].Assuming causality, we estimated that about 5% of all breastcancers in developed countries could be attributable to highbirth size (length � 50 cm or weight � 3.5 kg). The prevalenceof high birth weight has been increasing in many countries[65,66], consequent to rises in maternal prepregnancy BMIand maternal weight gain during pregnancy [67–69], but asthis increase appears to reflect mainly rises in PI rather thanbirth length [70] it may not necessarily translate into anincrease in the population attributable fraction. Even if real,the positive association of birth size with breast cancer wouldhave to be interpreted in the context of U-shaped inverseassociations of birth size with all-cause mortality [71],particularly mortality from circulatory diseases [71]. Never-theless, continued investigation of the pathways throughwhich prenatal factors may affect breast cancer risk, and theextent to which their effects may be mediated or modified bylater life risk factors, may identify new targets for preventionof this disease in the future.
Supporting Information
Alternative Language Abstract S1. Italian Translation of the Abstractby Bianca De Stavola
Found at doi:10.1371/journal.pmed.0050193.sd001 (25 KB DOC).
Alternative Language Abstract S2. Portuguese Translation of theAbstract by Isabel dos Santos Silva
Found at doi:10.1371/journal.pmed.0050193.sd002 (27 KB DOC).
Figure S1. Minimally Adjusted Pooled Breast Cancer RRs Stratified
by Study Type in Relation to Categorical Birth Weight (SingletonStudies Only)
The area of the black squares is inversely proportional to the variance(on the log scale).
Found at doi:10.1371/journal.pmed.0050193.sg001 (51 KB PDF).
Figure S2. Minimally Adjusted Study-Specific and Pooled BreastCancer RRs Stratified by Study Type in Relation to Continuous BirthWeight (Singleton Studies Only)
The area of the black squares is inversely proportional to the variance(on the log scale).
Found at doi:10.1371/journal.pmed.0050193.sg002 (15 KB PDF).
Figure S3. Minimally Adjusted Study-Specific and Pooled BreastCancer RRs for Continuous PI (Singleton Studies Only)
The area of the black squares is inversely proportional to the variance(on the log scale).
Found at doi:10.1371/journal.pmed.0050193.sg003 (13 KB PDF).
Figure S4. Minimally Adjusted Study-Specific and Pooled BreastCancer RRs for Continuous Head Circumference (Singleton StudiesOnly)
The area of the black squares is inversely proportional to the variance(on the log scale).
Found at doi:10.1371/journal.pmed.0050193.sg004 (13 KB PDF).
Figure S5. Minimally Adjusted Breast Cancer RRs in Relation toBirth Size Variables in the Two Twin Studies and in the Cohort ofPremature/Low Birth Weight Babies
Found at doi:10.1371/journal.pmed.0050193.sg005 (12 KB PDF).
Figure S6. Dose-Response Curves of Breast Cancer Risk in Relationto: (a) Birth Weight; (b) Birth Length; and (c) Head Circumference
Analyses restricted to the subset of cohort studies with birth recorddata: 1,210 cases / 404,970 non-cases (see Table 2). Small circle,estimated category-specific minimally adjusted RRs (reference cat-egory: 3.000–3.499 kg for birth weight; 49.0–49.9 cm for birth length;and 33.0–33.9 cm for head circumference); whiskers: 95% CIs forcategory-specific RRs. Continuous line, estimated linear effectcentred on reference category; dotted line, estimated quadraticeffect centred on reference category.
Found at doi:10.1371/journal.pmed.0050193.sg006 (32 KB PDF).
Figure S7. Breast Cancer RRs in Relation to Continuous BirthWeight: Minimally Adjusted and Further Adjusted for VariousPotential Confounding Factors (Restricted to Singleton Studies Basedon Adult Reports)
Adjustments for maternal age (continuous); maternal parity (catego-rical: 0, 1, 2, �3); age at menarche (categorical: ,12 y, 12.0–12.9 y, �13y); adult height (continuous); adult BMI (continuous); adult parity(categorical: 0, 1, 2, �3); age at first birth (categorical: nulliparous,,20 y, 20–29 y, �30 y); adult SES (study-specific categories: adult SESfor European Prospective Investigation of Cancer [EPIC]-Norfolk,Nurses’ Health Study [NHS] I and II, and Seattle Breast Cancer inYoung Women [BCYW], Seattle Breast Cancer in Middle-AgedWomen [BCMW], and Seattle Perinatal Factors and Breast Cancer[PFBC]; occupation for Shanghai Breast Cancer Study [SBCS]; andeducation for UK Women’s Cohort Study [UKWCS] and Women’sContraceptive and Reproductive Experiences [CARE] study); oralcontraceptive use (categorical: ever, never); and hormone replace-ment therapy use (categorical: ever, never).
Found at doi:10.1371/journal.pmed.0050193.sg007 (15 KB PDF).
Figure S8. Minimally Adjusted Pooled Breast Cancer RRs in Relationto Categorical Birth Weight, Stratified by Source of Birth Size Dataand Age (Singleton Studies Only)
Found at doi:10.1371/journal.pmed.0050193.sg008 (51 KB PDF).
Table S1. Study-Specific Details of the 32 Participating Studies
Found at doi:10.1371/journal.pmed.0050193.st001 (164 KB DOC).
Table S2. Number of Studies (Number of Breast Cancer Cases/Non-Cases) with Information on the Various Birth Size Measures, by StudyDesign and Birth Size Data Source
Found at doi:10.1371/journal.pmed.0050193.st002 (64 KB DOC).
Table S3. Number of Studies (Number of Breast Cancer Cases/Non-
PLoS Medicine | www.plosmedicine.org September 2008 | Volume 5 | Issue 9 | e1931383
Birth Size and Breast Cancer Risk
Cases) with Continuous Birth Weight and Information on VariousPotential Confounders, Mediators, and Effect Modifiers, by StudyDesign and Birth Size Data Source (Singleton Studies Only)
Found at doi:10.1371/journal.pmed.0050193.st003 (96 KB DOC).
Table S4. Study-Specific Breast Cancer RRs by Categories of BirthWeight
Found at doi:10.1371/journal.pmed.0050193.st004 (249 KB DOC).
Table S5. Study-Specific Breast Cancer RRs by Fourths of BirthLength
Found at doi:10.1371/journal.pmed.0050193.st005 (97 KB DOC).
Table S6. Study-Specific Breast Cancer RRs by Fourths of PI
Found at doi:10.1371/journal.pmed.0050193.st006 (97 KB DOC).
Table S7. Study Specific RRs of Breast Cancer by Fourths of HeadCircumference
Found at doi:10.1371/journal.pmed.0050193.st007 (68 KB DOC).
Table S8. Study-Specific Breast Cancer RRs by Categories of Age andBirth Weight (Singleton Studies Only)
Found at doi:10.1371/journal.pmed.0050193.st008 (454 KB DOC).
Table S9. Assessment of Publication Bias
Found at doi:10.1371/journal.pmed.0050193.st009 (125 KB DOC).
Acknowledgments
We would like to thank the following colleagues and institutions: A.L.Herbst (University of Chicago, US), K. Noller (New England MedicalCenter, US), R. Kaufman (Obstetrics and Gynecology PhysiciansOrganization, Houston Methodist Hospital, US), and R.N. Hoover(Division of Epidemiology and Genetics, National Cancer Institute,US) for their contribution to the National Cancer InstituteDiethylstilbestrol Combined Cohort Study (NCI DES); K. Corsanofor her help with data extraction for the Nurses’ Health Studies(NHS) I and II; B. Peplonska and N. Szeszenia-Dabrowska (NoferInstitute of Occupational Medicine, Poland), W. Zatonski (Depart-ment of Cancer Control and Epidemiology Cancer Center and M.Sklodowska-Curie Institute of Oncology, Poland) and M. Sherman(National Cancer Institute, US) for their contribution to the PolishBreast Cancer Study (PBCS), which was supported in part byIntramural Funds of the National Cancer Institute, NationalInstitutes of Health (US); R. Mohsen for data management andextraction for the Uppsala Birth Cohort Multigenerational Study(UBCoS Multigen), which is supported by the Swedish ResearchCouncil and the Swedish Council for Working Life and SocialResearch; T. Byers (Department of Preventive Medicine andBiometrics, University of Colorado Comprehensive Cancer Center,US) for his contribution to New York Study of Early Onset BreastCancer (NYSEOBC); M. de Silva and C. Abello (Cancer Research UKEpidemiology and Genetics Group, Department of Epidemiology andPopulation Health, London School of Hygiene & Tropical Medicine,UK) for clerical and administrative support.
Writing Committee: Isabel dos Santos Silva, Bianca De Stavola,Valerie McCormack. (Department of Epidemiology and PopulationHealth, London School of Hygiene & Tropical Medicine, UK).
Aberdeen Children of the 1950s (ACONF): D. Leon (Department ofEpidemiology and Population Health, London School of Hygiene &Tropical Medicine, UK), S. Macintyre (Medical Research Council[MRC] Social and Public Health Sciences Unit, University of Glasgow,UK); Carolina Breast Cancer Study (CBCS): M.E. Hodgson (Depart-ment of Epidemiology, School of Public Health, University of NorthCarolina at Chapel Hill, US), B. Newman (School of Public Health,Queensland University of Technology, Australia); CopenhagenSchool Health Record Register (CSHRR): T.I.A. Sorensen, L.W. Olsen,J.L. Baker (Institute of Preventive Medicine, Copenhagen UniversityHospital, Centre for Health and Society, Denmark); Collaborativemulti-state Breast Cancer Study (CmsBCS): J.A. Baron (DartmouthMedical School, US), P.A. Newcomb (Cancer Prevention Program,Fred Hutchinson Cancer Research Center, US), L. Titus-Ernstoff(Dartmouth Medical School, US), K.M. Egan (Moffitt Cancer Center &Research Institute, US), A. Trentham-Dietz (University of WisconsinDepartment of Population Health Sciences and Paul P. CarboneComprehensive Cancer Center, US); Danish Population-Based Case-Control Study (DPCCS): L. Mellemkjaer (Institute of CancerEpidemiology, Danish Cancer Society, Copenhagen, Denmark), H.T.
Sørensen (Department of Clinical Epidemiology, Aarhus UniversityHospital, Denmark and Department of Epidemiology, BostonUniversity, US); European Prospective Investigation of Cancer(EPIC)-Norfolk: M.S. Sandhu (Department of Public Health andPrimary Care, Institute of Public Health, University of Cambridge,UK), S. Bingham (MRC Dunn Human Nutrition Unit, UK), K. Tee-Khan (Department of Public Health and Primary Care, University ofCambridge, UK); Helsinki Birth Cohort Study I, II, and III (HBCS I, II,III): L. Hilakivi-Clarke (Lombardi Cancer Center, GeorgetownUniversity, US), J. Eriksson (Department of Epidemiology and HealthPromotion, National Public Health Institute, Finland), C. Osmond(University of Southampton, Southampton General Hospital, UK);Malmo Diet and Cancer Study (MDCS)-EPIC Sweden: P.H. Lahmann(School of Population Health, University of Queensland, Australiaand Department of Clinical Sciences, Lund University, MalmoUniversity Hospital, Sweden), G. Berglund (Department of ClinicalSciences, Lund University, Malmo University Hospital, Sweden);Medical Research Council National Survey of Health and Develop-ment (MRC NSHD): D. Kuh, R. Hardy, G. Mishra (Department ofEpidemiology and Public Health, Royal Free and University CollegeMedical School, UK); National Cancer Institute DiethylstilbestrolCombined Cohort Study (NCI DES): R. Troisi (Division of CancerEpidemiology and Genetics, National Cancer Institute, US), L. Titus-Ernstoff (Department of Community and Family Medicine, Dart-mouth Medical School, US), J. Palmer (Slone Epidemiology Center,Boston University, US), E.E. Hatch (Department of Epidemiology andStatistics, School of Public Health, Boston University, US); New YorkStudy of Early Onset Breast Cancer (NYSEOBC): K. Innes (Center forthe Study of Complementary and Alternative Therapies, University ofVirginia Health System, US); Nurses’ Health Study I, II (NHS I, II):K.B. Michels (Obstetrics and Gynecology Epidemiology Center,Department of Obstetrics, Gynecology and Reproductive Biology,Brigham and Women’s Hospital, Harvard Medical School; ChanningLaboratory, Department of Medicine, Brigham and Women’sHospital, Harvard Medical School; and Department of Epidemiology,Harvard School of Public Health, US); Polish Breast Cancer Study(PBCS): S.K. Park (Seoul National University College of Medicine,Korea), L.A. Brinton, M. Garcia-Closas (Division of Cancer Epidemi-ology and Genetics, National Cancer Institute, US), J. Lissowska(Department of Cancer Control and Epidemiology Cancer Centerand M. Sklodowska-Curie Institute of Oncology, Poland); PopulationStudy of Women in Gothenburg (PSWG): L. Lissner (Department ofPublic Health and Community Medicine, Gothenburg University,Sweden), L. Hulthen (Department of Clinical Nutrition, GothenburgUniversity, Sweden); Seattle Breast Cancer in Young Women (BCYW)study: M. Sanderson (Department of Obstetrics and Gynecology,Meharry Medical College, US), K. Malone, J. Daling (Fred HutchinsonCancer Research Center, US); Seattle Perinatal Factors and BreastCancer (PFBC) study: M. Sanderson (Department of Obstetrics andGynecology, Meharry Medical College, US); Seattle Breast Cancer inMiddle-Aged Women (BCMW) study: M. Sanderson (Department ofObstetrics and Gynecology, Meharry Medical College, US), J. Stanford(Fred Hutchinson Cancer Research Center, US); Shanghai BreastCancer Study (SBCS): W. Zheng, X.O. Shu (Vanderbilt EpidemiologyCenter, Institute of Medicine & Public Health, Vanderbilt UniversityMedical Center, US); Saint Olav’s University Hospital Birth Cohort(SOUHBC): L.J. Vatten, T.I.L. Nilsen (Department of Public Healthand General Practice, Norwegian University of Science and Tech-nology, Norway); Swedish study on Pre-Natal Factors and BreastCancer (SPNFBC): A. Ekbom (Unit of Clinical Epidemiology, Depart-ment of Medicine, Karolinska Institute, Sweden); Swedish cohort ofPremature and Very Low Birth Weight (SPVLBW) babies: M. Kaijser(Clinical Epidemiology Unit, Department of Medicine, KarolinskaHospital, Sweden); Swedish Like-Sexed Twin Study (SLSTS): S.Cnattingius (Department of Medical Epidemiology and Biostatistics,Karolinska Institute, Sweden); Swedish Opposite-Sexed Twin Study(SOSTS): M. Kaijser (Clinical Epidemiology Unit, Department ofMedicine, Karolinska Hospital, Sweden); Swedish Young FemaleBreast Cancer (SYFBC) study: F. Rasmussen (Department of PublicHealth Sciences, Karolinska Institute, Sweden); Trondheim & BergenPopulation-based Case-Control (TBPCCS) study: L.J. Vatten, T.I.L.Nilsen (Department of Public Health and General Practice, Norwe-gian University of Science and Technology, Norway); UK Women’sCohort Study (UKWCS): J.E. Cade, V.J. Burley, D.C. Greenwood(Centre for Epidemiology and Biostatistics, University of Leeds, UK);Uppsala Birth Cohort Multigenerational Study (UBCoS Multigen): I.Koupil (Centre for Health Equity Studies [CHESS], StockholmUniversity/Karolinska Institute, Sweden); Western New York Expo-sures and Breast cancer (WEB) study: J.L. Freudenheim, J. Nie(Department of Social and Preventive Medicine, School of Public
PLoS Medicine | www.plosmedicine.org September 2008 | Volume 5 | Issue 9 | e1931384
Birth Size and Breast Cancer Risk
Health and Health Professions, University at Buffalo, US), M. Barba(Department of Epidemiology, Regina Elena Cancer Institute, Italy);Women’s Contraceptive and Reproductive Experiences (CARE) study:J.M. Liff, D. Christensen (Rollins School of Public Health at EmoryUniversity, US)
Author contributions. IdSS, BDS, and VM designed the study. Allmembers of the Collaborative Group contributed to data acquisition,with final data checking and standardisation by BDS and VM. BDSperformed statistical analysis of data. IdSS, BDS, VM, and allmembers of the Collaborative Group interpreted the findings. IdSSand BDS had full access to all the data in the study and takeresponsibility for the integrity of the data and the accuracy of thedata analysis. IdSS prepared the first draft of the manuscript. Allauthors provided comments in writing the paper.
References1. Trichopoulos D (1990) Hypothesis: does breast cancer originate in utero?
Lancet 335: 939–940.2. Trichopoulos D (2003) Intrauterine environment, mammary gland mass
and breast cancer risk. Br Cancer Res 5: 42–44.3. Ekbom A, Trichopoulos D, Adami H-O, Hsieh C-C, Lan S-J (1992) Evidence
of prenatal influences on breast cancer risk. Lancet 340: 1015–1018.4. Sanderson M, Williams MA, Malone KE, Stanford JL, Emanuel I, et al. (1996)
Perinatal factors and risk of breast cancer. Epidemiology 7: 34–37.5. Michels KB, Trichopoulos D, Robins JM, Rosner BA, Manson JAE, et al.
(1996) Birth weight as a risk factor for breast cancer. Lancet 348: 1542–1546.
6. Ekbom A, Hsieh C-C, Lipworth L, Adami H-O, Trichopoulos D (1997)Intrauterine environment and breast cancer risk in women: a population-based study. J Natl Cancer Inst 88: 71–76.
7. Sanderson M, Williams MA, Daling JR, Malone KE, Stanford JL, et al. (1998)Maternal factors and breast cancer risk among young women. PediatrPerinat Epidemiol 12: 397–407.
8. Innes K, Byers T, Schymura M (2000) Birth characteristics and subsequentrisk for breast cancer in very young women. Am J Epidemiol 152: 1121–1128.
9. Ekbom A, Erlandsson G, Hsieh C-C, Trichopoulos D, Adami H-O, et al.(2000) Risk of breast cancer in prematurely born women. J Natl Cancer Inst92: 840–841.
10. Hubinette A, Lichtenstein P, Ekbom A, Cnattingius S (2001) Birthcharacteristics and breast cancer risk: a study among like-sexed twins. IntJ Cancer 91: 248–251.
11. Kaijser M, Lichtenstein P, Granath F, Erlandsson G, Cnattingius S, et al.(2001) In utero exposures and breast cancer: a study of opposite-sexed twins.J Natl Cancer Inst 93: 60–62.
12. Sanderson M, Shu XO, Jin F, Dai Q, Ruan Z, et al. (2002) Weight at birth andadolescence and premenopausal breast cancer risk in a low-risk popula-tion. Br J Cancer 86: 84–88.
13. Vatten LJ, Mæhle BO, Lund Nilsen TI, Tretli S, Hsieh C-c, et al. (2002) Birthweight as a predictor of breast cancer: a case-control study in Norway. Br JCancer 86: 89–91.
14. De Stavola BL, Hardy R, Kuh D, dos Santos Silva I, Wadsworth M, et al.(2000) Birthweight, childhood growth and risk of breast cancer in a Britishcohort. Br J Cancer 83: 964–968.
15. Andersson SW, Bengtsson C, Hallberg L, Lapidus L, Niklasson A, et al.(2001) Cancer risk in Swedish women: the relation to size at birth. Br JCancer 84: 1193–1198.
16. Hilakivi-Clarke L, Forsen T, Eriksson JG, Luoto R, Tuomilehto J, et al.(2001) Tallness and overweight during childhood have opposing effects onbreast cancer risk. Br J Cancer 85: 1680–1684.
17. Titus-Ernstoff L, Egan KM, Newcomb PA, Ding J, Trentheim-Dietz A, et al.(2002) Early life factors in relation to breast cancer risk in postmenopausalwomen. Cancer Epidemiol Biomark Prev 11: 207–210.
18. McCormack VA, dos Santos Silva I, De Stavola BL, Mohsen R, Leon DA, etal. (2003) Foetal growth and subsequent risk of breast cancer: results fromlong-term follow-up of Swedish cohort. Br Med J 326: 248–251.
19. Mellemkjær L, Olsen ML, Sørensen HT, Thulstrup AM, Olsen J, et al. (2003)Birth weight and risk of early-onset breast cancer (Denmark). CancerCauses Control 14: 61–64.
20. Ahlgren M, Sørensen TIA, Wohlfahrt J, Haflidadottir A, Holst C, et al.(2003) Birth weight and risk of breast cancer in a cohort of 106,504 women.Int J Cancer 107: 997–1000.
21. Kaijser M, Akre O, Cnattingius S, Ekbom A (2003) Preterm birth, birthweight, and subsequent risk of female breast cancer. Br J Cancer 89: 1664–1666.
22. Ahlgren M, Melbye M, Wohlfahrt J, Sørensen TIA (2004) Growth patternsand the risk of breast cancer. New Engl J Med 351: 1619–1626.
23. dos Santos Silva I, De Stavola BL, Hardy RJ, Kuh DJ, McCormack VA, et al.(2004) Is the association of birth weight with premenopausal breast cancermediated through childhood growth? Br J Cancer 91: 519–524.
24. Lahmann PH, Gullberg B, Olsson H, Boeing H, Berglund G, et al. (2004)Birth weight is associated with postmenopausal breast cancer risk inSwedish women. Br J Cancer 91: 1666–1668.
25. Hodgson ME, Newman B, Millikan RC (2004) Birthweight, parental age,birth order and breast cancer risk in African-American and white women: apopulation-based case-control study. Breast Cancer Res 6: R656–R667.
26. Vatten LJ, Lund Nilsen TI, Tretli S, Trichopoulos D, Romundstad PR (2005)Size at birth and risk of breast cancer: prospective population-based study.Int J Cancer 114: 461–464.
27. McCormack VA, dos Santos Silva I, Koupil I, Leon DA, Lithell HO (2005)Birth characteristics and adult cancer incidence: Swedish cohort of 11,000men and women. Int J Cancer 115: 611–617.
28. Troisi R, Hatch EE, Titus-Ernstoff L, Palmer JR, Hyer M, et al. (2006) Birthweight and breast cancer risk. Br J Cancer 94: 1734–1737.
29. Barba M, McCann SE, Nie J, Vito D, Stranges S, et al. (2006) Perinatalexposures and breast cancer risk in the Western New York exposures andbreast cancer (WEB) study. Cancer Causes Control 17: 395–401.
30. Park SK, Garcia-Closas M, Lissowska J, Sherman ME, McGlynn KA, et al.(2006) Intrauterine environment and breast cancer risk in a population-based case-control study in Poland. Int J Cancer 119: 2136–2141.
31. Michels KB, Xue F, Terry KL, Willett WC (2006) Longitudinal study ofbirthweight and the incidence of breast cancer in adulthood. Carcino-genesis 27: 2464–2468.
32. Mogren I, Damber L, Tavelin B, Hogberg U (1999) Characteristics ofpregnancy and birth and malignancy of the offspring (Sweden). CancerCauses Control 10: 85–94.
33. Le Marchand L, Kolonel LN, Myers BC, Mi M-P (1988) Birth characteristicsof pre-menopausal women with breast cancer. Br J Cancer 57: 437–439.
34. Michels KB, Xue F (2006) Role of birthweight in the etiology of breastcancer. Int J Cancer 119: 2007–2025.
35. Xue F, Michels KB (2007). Intrauterine factors and risk of breast cancer: asystematic review and meta-analyses of current evidence. Lancet Oncol 8:1088–1100.
36. Park SK, Kang D, McGlynn KA, Garcia-Closas M, Kim Y, et al. (2008)Intrauterine environments and breast cancer risk: meta-analysis andsystematic review. Breast Cancer Res 10: R8.
37. Stukel TA, Demidenko E, Dykes J, Karagas MR (2001) Two-stage methodsfor the analysis of pooled data. Stat Med 20: 2115–2130
38. Smith-Warner S, Spiegelman D, Ritz J, Albanes D, Beeson WL, et al. (2006)Methods for pooling results of epidemiologic studies: The Pooling Projectof Prospective Studies of Diet and Cancer. Am J Epidemiol 163: 1053–1064.
39. Clayton D, Hills M (1993) Statistical models in epidemiology. Oxford:Oxford University Press.
40. Marubini E, Valsecchi MG (1995) Analysing survival data from clinical trialsand observational studies. Chichester: John Wiley.
41. Cochrane WG (1954) The combination of estimates from differentexperiments. Biometrics 10: 10129.
42. Higgins JPT, Thompson SG, Deeks JJ, Altman DG (2003) Measuringinconsistency in meta-analyses. Br Med J 327: 557–560.
43. Klein JP (1992) Semiparametric estimation of random effects using the Coxmodel based on the EM algorithm. Biometrics 48: 795–806.
44. Sutton AJ (2000) Methods for meta-analysis in medical research. WileySeries in Probability and Statistics. New York: Wiley.
45. Stata (2005) Software version 9.2. College Station (Texas): Stata Corpo-ration.
46. Johnson TS, Engstrom JL, Gelhar DK (1997) Intra- and interexaminerreliability of anthropometric measurements of term infants. J PediatrGastroenterol Nutr 24: 497–505.
47. Johnson TS, Engstrom JL, Haney SL, Mulcrone SL (1999) Reliability of threelength measurement techniques in term infants. Pediatr Nur 25: 13–17.
48. Johnson MH, Everitt BJ (2000) Essential reproduction. Oxford: BlackwellScience. 199–200.
49. Kaijser M, Granath F, Jacobsen G, Cnattingius S, Ekbom A (2000) Maternalpregnancy estriol levels in relation to anamnestic and fetal anthropometricdata. Epidemiology 11: 315–319.
50. Troisi R, Potischman N, Roberts J, Siiteri P, Daftary A, et al. (2003)Associations of maternal and umbilical cord hormone concentrations withmaternal, gestational and neonatal factors (United States). Cancer CausesControl 14: 347–355.
51. Skalkidou A, Petridou E, Papathoma E, Salvanos H, Kedikoglou S, et al.(2003) Determinants and consequences of major insulin-like growth factorcomponents among full-term healthy neonates. Cancer Epidemiol BiomarkPrev 12: 860–865.
52. Vatten LJ, Nilsen ST, Ødegard RA, Romundstad PR, Austgulen R (2002)Insulin-like growth factor I and leptin in umbilical cord plasma and infantbirth size at term. Paediatrics 109: 1131–1135.
53. Harigaya A, Nagashima K, Nako Y, Morikawa A (1997) Relationshipbetween concentration of serum leptin and fetal growth. J Clin EndocrinolMetab 82: 3281–3284.
54. Sivan E, Mazaki-Tovi S, Pariente C, Efraty Y, Schiff E, et al. (2003)Adiponectin in human cord blood: relation to foetal birth weight andgender. J Clin Endocrinol Metab 88: 5656–5660.
55. Ong KKL, Ahmed ML, Sherriff A, Woods KA, Watts A, et al. (1999) Cordblood leptin is associated with size at birth and predicts infancy weight inhumans. J Clin Endocrinol Metab 84: 1145–1148.
56. Nagata C, Iwasa S, Shiraki M, Shimizu H (2006) Estrogen and alpha-fetoprotein levels in maternal and umbilical cord blood samples in relationto birth weight. Cancer Epidemiol Biomarkers Prev 15: 1469–1472.
PLoS Medicine | www.plosmedicine.org September 2008 | Volume 5 | Issue 9 | e1931385
Birth Size and Breast Cancer Risk
57. Hilakivi-Clarke L, de Assis S (2006) Fetal origins of breast cancer. TrendsEndocrinol Metab 17: 340–348.
58. Savarese TM, Strohsnitter WC, Low HP, Liu Q, Baik I, et al. (2007)Correlation of umbilical cord blood hormones and growth factors withstem cell potential: implications for the prenatal origin of breast cancerhypothesis. Breast Cancer Res 9: R29.
59. Peck JF, Hulka BS, Savitz DA, Baird D, Poole C, et al. (2003) Accuracy offetal growth indicators as surrogate measures of steroid levels duringpregnancy. Am J Epidemiol 157: 258–266.
60. Trichopoulos D, Adami H-O, Ekbom A, Hsieh C-C, Lagiou P (2008) Earlylife events and conditions and breast cancer risk: from epidemiology toetiology. Int J Cancer 122: 481–485.
61. van den Brandt PA, Spiegelman D, Yaun SS, Adami H-O, Beeson L, et al.(2000) Pooled analysis of prospective cohort studies on height, weight, andbreast cancer risk. Am J Epidemiol 152: 514–527.
62. Sørensen HT, Sabroe S, Rothman KJ, Gillman M, Steffensen FH, et al.(1999) Birth weight and length as predictors for adult height. Am JEpidemiol 149: 726–729.
63. Tuvemo T, Cnattingius S, Jonsson B (1999) Prediction of male adult statureusing anthropometric data at birth: a nationwide population-based study.Pediatric Res 46: 491–495.
64. Collaborative Group on Hormonal Factors in Breast Cancer (2002)Alcohol, tobacco and breast cancer – collaborative reanalysis of individual
data from 53 epidemiological studies, including 58,515 women with breastcancer and 95,067 women without the disease. Br J Cancer 87: 1234–1245.
65. Anath CV, Wen SW (2002) Trends in fetal growth among singletongestations in the United States and Canada, 1985 through 1998. SeminPerinatol 26: 260–267.
66. Orskou J, Kesmodel U, Henriksen TB, Secher NJ (2001) An increasingproportion of infants weigh more than 4000 grams at birth. Acta ObstetGynecol Scand 80: 931–936.
67. Ricart W, Lopez J, Mozas J, Pericot J, Sancho A, et al. (2005) Body massindex has a greater impact on pregnancy outcomes than gestationalhyperglycaemia. Diabetologia 48: 1736–1742.
68. Stotland NE, Hopkins LM, Caughey AB (2004) Gestational weight gain,macrosomia, and risk of caesarean birth in nondiabetic nulliparas. ObstetGynecol 104: 671–677.
69. Surkan PJ, Hsieh CC, Johansson AL, Dickman PW, Cnattingius S (2004)Reasons for increasing trends in large for gestational age births. ObstetGynecol 104: 720–726.
70. Schack-Nielsen L, Mølgaard C, Sørensen TIA, Greisen G, Michaelsen KF(2006) Secular change in size at birth from 1973 to 2003: national data fromDenmark. Obesity 14: 1257–1263.
71. Baker JL, Olsen LW, Sørensen TIA (2008) Weight at birth and all-causemortality in adulthood. Epidemiology 19: 197–203.
Editors’ Summary
Background. Last year, more than one million women discovered thatthey had breast cancer. In the US, nearly 200,000 women will face thesame diagnosis this year and 40,000 will die because of breast cancer.Put another way, about one in eight US women will have breast cancerduring her lifetime. Like all cancers, breast cancer begins when cellsacquire genetic changes that allow them to divide uncontrollably and tomove around the body (metastasize). This uncontrolled division leads tothe formation of a lump that can be detected by mammography (abreast X-ray) or by manual examination of the breasts. Breast cancer istreated by surgical removal of the lump or, if the cancer has started tospread, by removal of the whole breast (mastectomy). Surgery is usuallyfollowed by radiotherapy, chemotherapy, and other treatments designedto kill any remaining cancer cells. Unlike some cancers, the outlook forwomen with breast cancer is good. In the US, for example, nearly 90% ofaffected women are still alive five years after their diagnosis.
Why Was This Study Done? Scientists have identified several factorsthat increase a woman’s risk of developing breast cancer by comparingthe characteristics of populations of women with and without breastcancer. Well-established risk factors include increasing age, not havingchildren, and having a late menopause, but another potential risk factorfor breast cancer is birth size. A baby’s weight, length, and headcircumference at birth (three related measures of birth size) depend onthe levels of hormones (including estrogen, a hormone that often affectsbreast cancer growth) and other biological factors to which the baby isexposed during pregnancy—its prenatal environment. The idea thatprenatal environment might also affect breast cancer risk in later life wasfirst proposed in 1990, but the findings of studies that have tried toinvestigate this possibility have been inconsistent. Here, the researchersre-analyze individual participant data from a large number of studies intowomen’s health conducted in Europe, Northern America, and China toget more precise information about the association between birth sizeand breast cancer risk.
What Did the Researchers Do and Find? The researchers identified 32published and unpublished studies that had collected information onbirth size and on the occurrence of breast cancer. They then obtainedthe individual participant data from these studies, which involved morethan 22,000 women who had developed breast cancer and more than600,000 women who had not. Their analyses of these data show thatbirth weight was positively associated with breast cancer risk in those
studies where this measurement was recorded at birth or based onparental recall during the study participant’s childhood (but not in thosestudies in which birth weight was self-reported or maternally recalledduring the participant’s adulthood). For example, women with recordedbirth weights of more than 4 kg or more had a 12% higher chance ofdeveloping breast cancer than women who weighed 3–3.5 kg at birth.Birth length and head circumference were also positively associated withbreast cancer risk, but birth length was the strongest single predictor ofrisk. Finally, the amount by which birth size affected breast cancer riskwas not affected by allowing for other established risk factors.
What Do These Findings Mean? These findings provide strongevidence that birth size—in particular, birth length—is a marker of awoman’s breast cancer risk in adulthood although the mechanismsunderlying this association are unclear. The researchers note that theobserved effect of birth size on breast cancer risk is of a similarmagnitude to that of other more established risk factors and estimatethat 5% of all breast cancers in developed countries could be caused by ahigh birth size. Because practically all the studies included in this pooledanalysis were done in developed countries, these findings may not holdfor developing countries. Further investigations into how the prenatalenvironment may affect breast cancer risk might identify new ways toprevent this increasingly common cancer.
Additional Information. Please access these Web sites via the onlineversion of this summary at http://dx.doi.org/10.1371/journal.pmed.0050193.
� This study is further discussed in a PLoS Medicine Perspective byTrichopoulos and Lagiou� The US National Cancer Institute provides detailed information for
patients and health professionals on all aspects of breast cancer,including information on risk factors for breast cancer (in English andSpanish)� The MedlinePlus Encyclopedia provides information for patients about
breast cancer; Medline Plus also provides links to many other breastcancer resources (in English and Spanish)� The UK charity Cancerbackup also provides detailed information about
breast cancer� Cancer Research UK is the UK’s leading charity dedicated to cancer
research
PLoS Medicine | www.plosmedicine.org September 2008 | Volume 5 | Issue 9 | e1931386
Birth Size and Breast Cancer Risk
Related Documents


![[Date] [Participant Name Participant Address1 …Date] [Participant Name Participant Address1 Participant City ST Zip] Dear Participant: RE: Request for Hardship Distribution under](https://static.cupdf.com/doc/110x72/5b002b357f8b9af1148c48bc/date-participant-name-participant-address1-date-participant-name-participant.jpg)