Welcome message from author
This document is posted to help you gain knowledge. Please leave a comment to let me know what you think about it! Share it to your friends and learn new things together.
Transcript


This is sample from Biostatistics for Epidemiology and Public Health Using RVisit This Book’s Web Page / Buy Now / Request an Exam/Review
© Springer Publishing Company
Biostatistics for Epidemiology and Public Health Using R

This is sample from Biostatistics for Epidemiology and Public Health Using RVisit This Book’s Web Page / Buy Now / Request an Exam/Review
© Springer Publishing Company
Bertram K. C. Chan, PhD, PE, completed his secondary education in Sydney, Australia, having passed the New South Wales State Leaving Certifi cate (univer-sity matriculation) with excellent results in mathematics and in honors physics and honors chemistry. He then completed both a bachelor of science in chemical engineering, with fi rst class honors (summa cum laude), and a master’s in engi-neering science in nuclear engineering at the University of New South Wales, and a PhD in engineering at the University of Sydney. This was followed by 2 years of research work at the Australian Atomic Energy Commission Research Establish-ment, and 2 years of a Canadian Atomic Energy Commission postdoctoral fellow-ship at the University of Waterloo, Canada.
He undertook additional graduate studies at the University of New South Wales, at the American University of Beirut, and at Stanford University, in sta-tistics, computer science, and pure and applied mathematics (abstract algebra, automata theory, numerical analysis, etc.), and in electronics, and electromagnetic engineering.
His professional career includes over 10 years of university-level teaching and research experience in several institutions, including research associate in bio-medical and statistical analysis, Perinatal Biology Section, ObGyn Department, University of Southern California Medical School, Middle East University, and San Jose State University, and industrial research positions at Lockheed Missile & Space, Apple, Hewlett-Packard, and a start-up company (Foundry Networks) in the manufacture of Internet hardware and software: gigahertz switches and rout-ers. In recent years, he supported the biostatistical work of the Adventist Health Studies II research program at the Loma Linda University (LLU) School of Med-icine, California, and consulted as a forum lecturer for several years in the LLU School of Public Health (biostatistics, epidemiology, and population medicine). The LLU lectures formed part of this textbook. In these lectures, Dr. Chan intro-duced the use of the programming language R and designed these lectures for the biostatistical elements for courses in the MPH, MsPH, DrPH, and PhD programs, with special reference to epidemiology in particular and public health and popu-lation medicine in general.
Dr. Chan has three U.S. patents and has published over 30 research papers and authored 10 books in educational mathematics. He is a registered professional engineer (PE) in the State of California.

This is sample from Biostatistics for Epidemiology and Public Health Using RVisit This Book’s Web Page / Buy Now / Request an Exam/Review
© Springer Publishing Company
Biostatistics for Epidemiology and Public Health Using R
Bertram K. C. Chan, PhD, PE

This is sample from Biostatistics for Epidemiology and Public Health Using RVisit This Book’s Web Page / Buy Now / Request an Exam/Review
© Springer Publishing Company
Copyright © 2016 Springer Publishing Company, LLC
All rights reserved.
No part of this publication may be reproduced, stored in a retrieval system, or transmitted in any form or by any means, electronic, mechanical, photocopying, recording, or otherwise, without the prior permission of Springer Pub-lishing Company, LLC, or authorization through payment of the appropriate fees to the Copyright Clearance Center, Inc., 222 Rosewood Drive, Danvers, MA 01923, 978-750-8400, fax 978-646-8600, [email protected] or on the Web at www.copyright.com.
Springer Publishing Company, LLC11 West 42nd StreetNew York, NY 10036www.springerpub.com
Acquisitions Editor: Nancy S. HaleComposition: Exeter Premedia Services Private Ltd.
ISBN: 978-0-8261-1025-1e-book ISBN: 978-0-8261-1026-8
Instructor’s Manual ISBN: 978-0-8261-3279-6. Qualifi ed instructors may request supplements by emailing [email protected]
Student Materials: A Student Study Guide (ISBN: 978-0-8261-3278-9) andSupplemental Chapter: Research-Level Applications of R (ISBN: 978-0-8261-3249-9) are available at springerpub.com/chan-biostatistics
15 16 17 18 / 5 4 3 2 1
The author and the publisher of this Work have made every effort to use sources believed to be reliable to provide information that is accurate and compatible with the standards generally accepted at the time of publication. The author and publisher shall not be liable for any special, consequential, or exemplary damages resulting, in whole or in part, from the readers’ use of, or reliance on, the information contained in this book. The publisher has no responsibility for the persistence or accuracy of URLs for external or third-party Internet websites referred to in this publication and does not guarantee that any content on such websites is, or will remain, accurate or appropriate.
Library of Congress Cataloging-in-Publication Data
Chan, B. K. C. (Bertram Kim-Cheong), author. Biostatistics for epidemiology and public health using R / Bertram K.C. Chan. p. ; cm. Includes bibliographical references and index. ISBN 978-0-8261-1025-1 — ISBN 978-0-8261-1026-8 (e-book) I. Title. [DNLM: 1. Biostatistics—methods. 2. Epidemiology. 3. Programming Languages.4. Public Health. WA 950] R853.S7 610.1'5195—dc23 2015024102
Special discounts on bulk quantities of our books are available to corporations, professional associations, phar-maceutical companies, health care organizations, and other qualifying groups. If you are interested in a custom book, including chapters from more than one of our titles, we can provide that service as well.
For details, please contact:Special Sales Department, Springer Publishing Company, LLC11 West 42nd Street, 15th Floor, New York, NY 10036-8002Phone: 877-687-7476 or 212-431-4370; Fax: 212-941-7842E-mail: [email protected]
Printed in the United States of America by Bradford & Bigelow.

This is sample from Biostatistics for Epidemiology and Public Health Using RVisit This Book’s Web Page / Buy Now / Request an Exam/Review
© Springer Publishing Company
Preface xi
1. INTRODUCTION 11.1 Medicine, Preventive Medicine, Public Health, and Epidemiology 1
Medicine 1Preventive Medicine and Public Health 1Public Health and Epidemiology 2Review Questions for Section 1.1 2
1.2 Personal Health and Public Health 3Personal Health Versus Public Health 4Review Questions for Section 1.2 5
1.3 Research and Measurements in EPDM and PH 6EPDM: The Basic Science of PH 7Main Epidemiologic Functions 9The Cause of Diseases 14Exposure Measurement in Epidemiology 19Additional Issues 20Review Questions for Section 1.3 20
1.4 BIOS and EPDM 21Review Questions for Section 1.4 23
References 23
2. RESEARCH AND DESIGN IN EPIDEMIOLOGY AND PUBLIC HEALTH 25Introduction 252.1 Causation and Association in Epidemiology and Public Health 26
The Bradford-Hill Criteria for Causation and Association in Epidemiology 26Legal Interpretation Using Epidemiology 28Disease Occurrence 29Review Questions for Section 2.1 32
2.2 Causation and Inference in Epidemiology and Public Health 33Rothman’s Diagrams for Suffi cient Causation of Diseases 33Causal Inferences 37Using the Causal Criteria 38Judging Scientifi c Evidence 38Review Questions for Section 2.2 39
2.3 Biostatistical Basis of Inference 40Modes of Inference 40Levels of Measurement 40Frequentist BIOS in EPDM 41Confi dence Intervals in Epidemiology and Public Health 42Bayesian Credible Interval 48Review Questions for Section 2.3 49
2.4 BIOS in EPDM and PH 50Applications of BIOS 50BIOS in EPDM and PH 51
Contents

This is sample from Biostatistics for Epidemiology and Public Health Using RVisit This Book’s Web Page / Buy Now / Request an Exam/Review
© Springer Publishing Company
vi Contents
Processing and Analyzing Basic Epidemiologic Data 52Analyzing Epidemiologic Data 56Using R 67Evaluating a Single Measure of Occurrence 67Poisson Count (Incidence) and Rate Data 68Binomial Risk and Prevalence Data 68Evaluating Two Measures of Occurrence—Comparison of Risk: Risk Ratio
and Attributable Risk 69Comparing Two Rate Estimates: Rate Ratio rr 70Comparing Two Risk Estimates: Risk Ratio RR and Disease (Morbidity)
Odds Ratio DOR 70Comparing Two Odds Estimates From Case–Control: The Salk Polio Vaccine
Epidemiologic Study 72Review Questions for Section 2.4 72
Exercises for Chapter 2 73Using Probability Theory 73Disease Symptoms in Clinical Drug Trials 73Risks and Odds in Epidemiology 74Case–Control Epidemiologic Study 74Mortality, Morbidity, and Fertility Rates 74Incidence Rates in Case-Cohort Survival Analysis 75Prevalence 75Mortality Rates 75Estimating Sample Sizes 76
References 77Appendix 78
3. DATA ANALYSIS USING R PROGRAMMING 81Introduction 813.1 Data and Data Processing 82
Data Coding 83Data Capture 84Data Editing 84Imputations 85Data Quality 85Producing Results 87Review Questions for Section 3.1 87
3.2 Beginning R 87R and Biostatistics 88A First Session Using R 90The R Environment 97Review Questions for Section 3.2 98
3.3 R as a Calculator 99Mathematical Operations Using R 99Assignment of Values in R and Computations
Using Vectors and Matrices 100Computations in Vectors and Simple Graphics 101Use of Factors in R Programming 101Simple Graphics 103x as Vectors and Matrices in Biostatistics 107Some Special Functions That Create Vectors 108Arrays and Matrices 108Use of the Dimension Function dim in R 109Use of the Matrix Function matrix in R 109

This is sample from Biostatistics for Epidemiology and Public Health Using RVisit This Book’s Web Page / Buy Now / Request an Exam/Review
© Springer Publishing Company
Contents vii
Some Useful Functions Operating on Matrices in R 110NA: “Not Available” for Missing Values in Datasets 111Special Functions That Create Vectors 111Review Questions for Section 3.3 112Exercises for Section 3.3 114
3.4 Using R in Data Analysis in BIOS 115Entering Data at the R Command Prompt 116The Function list() and the Making of data.frame() in R 127Review Questions for Section 3.4 130Exercises for Section 3.4 130
3.5 Univariate, Bivariate, and Multivariate Data Analysis 133Univariate Data Analysis 133Bivariate and Multivariate Data Analysis 136Multivariate Data Analysis 138Analysis of Variance (ANOVA) 140Review Questions for Section 3.5 147Exercises for Section 3.5 147
References 150Appendix: Documentation for the plot function 151
Generic X–Y Plotting 151
4. GRAPHICS USING R 155Introduction 155
Choice of System 156Packages 156
4.1 Base (or Traditional) Graphics 157High-Level Functions 157Low-Level Plotting Functions 161Interacting with Graphics 165Using Graphics Parameters 165Parameters List for Graphics 166Device Drivers 168Review Questions for Section 4.1 170Exercises for Section 4.1 171
4.2 Grid Graphics 183The lattice Package: Trellis Graphics 183The Grid Model for R Graphics 189Grid Graphics Objects 192Applications to Biostatistical and Epidemiologic Investigations 194Review Questions for Section 4.2 207Exercises for Section 4.2 207
References 210
5. PROBABILITY AND STATISTICS IN BIOSTATISTICS 211Introduction 2115.1 Theories of Probability 212
What Is Probability? 212Basic Properties of Probability 213Probability Computations Using R 223Applications of Probability Theory to Health Sciences 227Typical Summary Statistics in Biostatistics: Confi dence Intervals, Signifi cance Tests,
and Goodness of Fit 232Review Questions for Section 5.1 257Exercises for Section 5.1 258

This is sample from Biostatistics for Epidemiology and Public Health Using RVisit This Book’s Web Page / Buy Now / Request an Exam/Review
© Springer Publishing Company
viii Contents
5.2 Typical Statistical Inference in Biostatistics: Bayesian Biostatistics 268What Is Bayesian Biostatistics? 268Bayes’s Theorem in Probability Theory 268Bayesian Methodology and Survival Analysis (Time-to-Event) Models for Biostatistics
in Epidemiology and Preventive Medicine 268The Inverse Bayes Formula 288Modeling in Biostatistics 298Review Questions for Section 5.2 304Exercises for Section 5.2 305
References 321
6. CASE–CONTROL STUDIES AND COHORT STUDIES IN EPIDEMIOLOGY 323Introduction 3236.1 Theory and Analysis of Case–Control Studies 324
Advantages and Limitations of Case–Control Studies 324Analysis of Case–Control Studies 325Review Questions for Section 6.1 327Exercises for Section 6.1 328
6.2 Theory and Analysis of Cohort Studies 328An Important Application of Cohort Studies 329Clinical Trials 329Randomized Controlled Trials 329Cohort Studies for Diseases of Choice and Noncommunicable Diseases 330Cohort Studies and the Lexis Diagram in the Biostatistics of Demography 336Review Questions for Section 6.2 338Exercises for Section 6.2 339
References 344
7. RANDOMIZED TRIALS, PHASE DEVELOPMENT, CONFOUNDING IN SURVIVAL ANALYSIS, AND LOGISTIC REGRESSIONS 3457.1 Randomized Trials 345
Classifi cations of RTs by Study Design 345Randomization 346Biostatistical Analysis of Data from RTs 348Biostatistics for RTs in the R Environment 348Review Questions for Section 7.1 350Exercises for Section 7.1 350
7.2 Phase Development 361Phase 0 or Preclinical Phase 361Phase I 363Phase II 363Phase III 363Pharmacoepidemiology: A Branch of Epidemiology 363Some Basic Tests in Epidemiologic Phase Development 364Review Questions for Section 7.2 369Exercises for Section 7.2 369
7.3 Confounding in Survival Analysis 375Biostatistical Approaches for Controlling Confounding 376Using Regression Modeling for Controlling Confounding 385Confounding and Collinearity 386Review Questions for Section 7.3 389Exercises for Section 7.3 389

This is sample from Biostatistics for Epidemiology and Public Health Using RVisit This Book’s Web Page / Buy Now / Request an Exam/Review
© Springer Publishing Company
Contents ix
7.4 Logistic Regressions 412Inappropriateness of the Simple Linear Regression When y Is a
Categorical Dependent Variable 413The Logistic Regression Model 413The Logit 414Logistic Regression Analysis 414Generalized Linear Models in R 415Review Questions for Section 7.4 419Exercises for Section 7.4 420
References 437
Index 439

This is sample from Biostatistics for Epidemiology and Public Health Using RVisit This Book’s Web Page / Buy Now / Request an Exam/Review
© Springer Publishing Company

This is sample from Biostatistics for Epidemiology and Public Health Using RVisit This Book’s Web Page / Buy Now / Request an Exam/Review
© Springer Publishing Company
Preface
A national network television newscast aired the following fi ve stories in 20061:
■ A report on the use of nontraditional, nonmainstream medicine, such as tradi-tional Chinese medicine (TCM), to help people who have type 1 diabetes
■ A neighborhood’s concern about a sharp rise in the number of children with asthma and autism living in a western U.S. state
■ A report on the latest Centers for Disease Control and Prevention (CDC) rec-ommendations regarding who should receive the fl u vaccine and when
■ A discussion of the extensive infectious disease monitoring strategy being im-plemented in a coastal city in the southern United States that was recently hit by a massive hurricane
■ A report on a study, published in a leading medical journal, of a likely associa-tion between an increased risk of cancer and workers’ exposure to a particular chemical
Each of these news stories included interviews with public health offi cials or investigators who called themselves epidemiologists.
Who are these epidemiologists, and what do they do? What is epidemiology? This book is intended to answer these questions. In doing so, it describes what epidemi-ology is, how it has evolved, how it is used today, and what some of its key methods and concepts are. The focus is on epidemiology in public health practice—that is, the kind of epidemiology that is done at local, state, and national health departments.
Data analysis—the processing of information collected by observation or exper-imentation—is a very important part of epidemiologic investigations. Hence, the state of the art in epidemiologic studies is being steadily advanced as the capabili-ties and capacity of computing facilities and the computing environment in general move ahead. Today, epidemiologists around the world can choose from many com-mercially available and widely used biostatistical software packages.
A relatively new software package called R, developed in 1993 and freely available via the Internet, is the most promising. R has many advanced regression modeling functions, such as multilinear regression, logistic regression, survival analysis, and multilevel modeling. Supported as it is by leading biostatistical experts worldwide, R is now ubiquitous and provides everything that an epidemiologic data analyst needs.
The purpose of this book is to make R readily accessible, on a hands-on level, to all future epidemiologists for research, data processing, and presentation. This book is essentially about learning R with an emphasis on applications to epidemiology, public health, and preventive medicine. To make the best use of this text, readers
1U.S. Department of Health and Human Services, Centers for Disease Control and Prevention (CDC), Offi ce of Workforce and Career Development. (2006). Principles of epidemiology in public health practice: An introduction to applied epidemiology and biostatistics (Self-Study Course SS1000, 3rd ed.). Atlanta, GA: Author.
This is sample from Biostatistics for Epidemiology and Public Health Using RVisit This Book’s Web Page / Buy Now / Request an Exam/Review
© Springer Publishing Company
xii Preface
should have some background in basic computer usage. With R and the supplied datasets, users should be able to work through each section, learning the techniques of data management, related biostatistical theories, and the practice of data analysis and graphical presentations. The book is systematically organized into seven chap-ters, each with a number of main sections covering the spectrum of applicable R codes for biostatistical applications in epidemiology and public health.
Chapters 1 and 2 introduce interactional relationships among medicine, preven-tive medicine, public health, epidemiology, and biostatistics in general, as well as special concepts that have been (and are being) developed to address quantitative problems in epidemiology and public health in particular. A review of the basic elements in the theory of probability is presented to introduce or reinforce readers’ ability to handle this important basic concept.
Chapter 3 covers simple data handling using R programming, while Chapter 4 presents the graphics capabilities available in R. Following these initial forays into R, Chapter 5 gives an overview of the theory of probability and mathematical sta-tistics, which is necessary because both of these areas have become integral parts of biostatistical applications in epidemiology.
Chapter 6 shows how R may be effectively used to handle classical problems in case–control studies and cohort investigations in epidemiology. Similarly, survival analysis, the backbone of much epidemiologic research, fi nds excellent support in the R environment, as outlined in Chapter 7.
To assist and challenge readers, a set of “review questions” appears at the end of each main section. These will help readers to recall and note the salient concepts dis-cussed in the body of the text. Because it is primarily a quantitative subject, biosta-tistics may best be appreciated by undertaking appropriate, specifi c, and hands-on exercises involving the concepts introduced in the text. The exercises that appear at the end of most sections will guide readers through applications of these ideas to the world of real epidemiology and public health in the course of practicing their skills in computation using R. The online Student Study Guide leads students through solutions to the exercises in the book and is available at www. springerpub.com/chan-biostatistics. Also on www.springerpub.com/chan- biostatistics is a Supple-mental Chapter entitled Research-Level Applications of R. An Instructor’s Man-ual is also available by emailing [email protected].
On November 6, 2011, Professor Tomás Aragon, MD, DrPH, of the University of California-Berkeley, in the preface to his online manual Applied Epidemiology Using R, made the following comment:
We like to think of R as a set of extensible tools to implement one’s analysis plan, regardless of simplicity or complexity. . . . Our hope is that more and more epidemiologists will embrace R for epidemiological applications, or at least include it in their toolbox.
The author hopes that this book will meet this need by helping to introduce R, a high-level computing language and an environment for biostatistical computing and graphical presentations, to epidemiologists and data analysts in public health and preventive medicine who are actively conducting epidemiologic investigations.
Bertram K. C. Chan, PhD, PE
This is sample from Biostatistics for Epidemiology and Public Health Using RVisit This Book’s Web Page / Buy Now / Request an Exam/Review
© Springer Publishing Company
Introduction
1.1 MEDICINE, PREVENTIVE MEDICINE, PUBLIC HEALTH, AND EPIDEMIOLOGY
Medicine
The word medicine is derived from the Latin phrase ars medicina, meaning “the heal-ing art.” Thus, medicine refers to the art and science of healing, which uses a variety of practices evolved or developed to maintain and restore health by the treatment and prevention of diseases and injuries.
Today’s medicine applies health sciences, biomedical research, and technol-ogy to diagnose and treat injury and diseases, typically through drug/medication or surgical interventions, but also through therapies as diverse as psychotherapy, prostheses (e.g., artifi cial limbs), and physical therapy, to name a few. Given this vast array of possible approaches and techniques, it is only natural that various specialties would arise within the medical profession as practitioners concentrated their talents and efforts on certain problems and therapies. The development of a specialty, including the specialty of preventive medicine, is often driven by new technology.
Preventive Medicine and Public Health
In the United States (as well as in the United Kingdom and many other parts of the world), preventive medicine is one of 24 medical specialties recognized by the American Board of Medical Specialties (ABMS). It comprises three areas of subspe-cialization:
1. General preventive medicine and public health (PH)2. Aerospace medicine3. Occupational medicine
To become board-certifi ed in one of the preventive medicine areas of specializa-tion, a licensed U.S. physician must successfully complete a preventive medicine medical residency program following a 1-year internship. Thereafter, the physi-cian must complete a year of practice in that specialty area and pass the preventive medicine board examination. The residency program, which is at least 2 years in
ONE

This is sample from Biostatistics for Epidemiology and Public Health Using RVisit This Book’s Web Page / Buy Now / Request an Exam/Review
© Springer Publishing Company
2 1. INTRODUCTION
duration, includes completion of a master of public health (MPH) degree or the equivalent. (The present text is primarily directed toward the achievement of this last milestone.)
For example, in the United States, the Loma Linda University (LLU), California, offers a Family and Preventive Medicine Residency program that combines training in family medicine and preventive medicine, thus helping to fulfi ll LLU’s mission: “To Make Man Whole.” This special program includes primary care training through the LLU Family Medicine Residency program, as well as work in population-based care and health care systems through the LLU Preventive Medicine Residency pro-gram. During their 4 years in the program, all successful residents earn an MPH degree through the LLU School of Public Health and have an opportunity for unique exposure to LLU’s two areas of strength: lifestyle medicine and global health.
Public Health and Epidemiology
In a major study conducted by the U.S. National Academy of Science’s Institute of Medicine, the Committee for the Study of the Future of Public Health defi ned the mission of public health as “the fulfi llment of society’s interest in assuring the conditions in which people can be healthy” (see Centers for Disease Control and Prevention [CDC] 2006). That same study defi ned the substance of public health as “organized community efforts aimed at the prevention of disease and the promo-tion of health. [Public health] links many disciplines and rests upon the scientifi c core of epidemiology.”
Epidemiology (EPDM), basically, is the study of the demographics of disease processes, including but not limited to the study of epidemics. The U.S. Department of Health and Human Services (DHHS), through the CDC, provides the following defi nition of epidemiology:
The word epidemiology comes from the Greek words epi, meaning on or upon, demos, meaning people, and logos, meaning the study of. Thus, the word epide-miology has its roots in the study of what befalls a population. Many defi nitions have been proposed, but the following defi nition captures the underlying prin-ciples and public health spirit of epidemiology:
Epidemiology is the study of the distribution and determinants of health- related states or events in specifi ed populations, and the application of this study to the control of health problems. (CDC, 2006)
Review Questions for Section 1.1
1. Using Internet sources, name five medical specialties (besides preventive medi-cine) in the United States that are officially recognized by the ABMS.
2. (a) Do you know of any physicians practicing only preventive medicine?(b) If you were a physician, would you choose to practice only preventive medi-
cine? Why or why not?3. Health research and policy (HRP): The Stanford University School of Medicine
(Stanford, California) teaches preventive medicine within its department of HRP. This program has four areas: biostatistics (BIOS), data coordination, EPDM, and
This is sample from Biostatistics for Epidemiology and Public Health Using RVisit This Book’s Web Page / Buy Now / Request an Exam/Review
© Springer Publishing Company
1.2 Personal Health and Public Health 3
health services research (HSR). The last area, HSR, focuses on analyzing and comparing the costs, risks, and benefits of strategies for medical care, especially medical interventions. Discuss the possible benefits to preventive medicine of work in the areas of HRP.
4. Fluoridation of drinking water: In the United States, fluoridation of drinking water has been the subject of many court cases in which political activists have sued local governments, alleging that their rights to informed consent for medical treatment and to due process are violated by compulsory fluoridation. Individuals have sued municipalities for sicknesses that they thought were caused by the fluoridation of a town’s water supply. In most of these cases, the courts have held in favor of the de-fendant cities or governmental entities, finding no or only a tenuous connection be-tween health problems and widespread water fluoridation. To date, no federal court or state supreme court has found water fluoridation to be unlawful. If you were a PH provider, would you support the fluoridation of drinking water? Why or why not?
1.2 PERSONAL HEALTH AND PUBLIC HEALTH (PH)
Today, mainstream medicine is moving toward a standard of evidence-based prac-tice, using data gathered mostly from PH research and especially from epidemio-logic surveys. These data reveal trends, identify issues, and allow the evaluation of the effectiveness of various approaches for certain populations. The advantages of evidence-based health care seem obvious, in that it increases health care providers’ ability to offer effective and safe treatments for any given condition.
PH data also underlie recommendations regarding personal health. According to experts, all personal health plans may be summarized simply as follows:
■ Eat well and rest adequately. ■ Exercise vigorously and regularly.
However, serious challenges may arise when PH generalizations are applied to an individual’s personal situation.
Here is an example. Observational PH epidemiology of lifestyle has shown that eating whole-grain foods is better than eating processed foods from which many naturally occurring nutrients, vitamins, and fi ber have been removed. Knowing this, one might apply these fi ndings to one’s own personal situation. A person might launch a campaign of eating only 100% whole-wheat bread, pastas, and even pizzas. This could benefi t the person’s nutritional status, as he or she would con-sume a lot more fi ber and B vitamins, which are generally good for health.
But what if this person is intolerant of wheat and related products?What if this person has the problem of gluten intolerance (gluten is found in
foods containing wheat, rye, and barley)?What if this person has an allergy to wheat?If a person has any of these conditions, eating whole-wheat foods will make
that individual ill in several possible ways. Allergic reactions can be life-threaten-ing; celiac disease would cause serious gastrointestinal problems; wheat intolerance could cause poor absorption and assimilation of the very nutrients that were

This is sample from Biostatistics for Epidemiology and Public Health Using RVisit This Book’s Web Page / Buy Now / Request an Exam/Review
© Springer Publishing Company
4 1. INTRODUCTION
intended to be benefi cial. In the latter cases, eating whole-grain rice, for example, might be the best way to get the health benefi ts of a “whole-grain” approach with-out stirring up food intolerances or allergies.
This is a simple but common example in which general PH recommendations that may benefi t the population at large may not necessarily benefi t certain indi-viduals personally and specifi cally. Each individual should decide what is right for him or her when creating an effective individualized program of health care.
Such personal health conditions and issues must be considered whenever a PH policy is being proposed or accepted. Thus, legislators considering PH care poli-cies often face the diffi cult task of deciding what to do with “expert” advice based on observations and conclusions drawn from epidemiologic research and surveys. They must decide what weight to give the research fi ndings and conclusions, the appropriateness of basing general public policy on those fi ndings, and the utility and safety of any wide-scale PH mandates.
What happens if the evidence indicates that people generally (or even a sub-group of people who have a specifi c diagnosis such as diabetes) fare better or worse on a particular therapy? One may fi nd it diffi cult and confusing to decide the best program: selecting a more familiar or accessible treatment for a specifi c health prob-lem, rather than treatments that are less familiar and more diffi cult to accomplish, could keep a person from maximizing the benefi ts. For many people with chronic illnesses, for example, adding supplements of vitamins, minerals, and herbs to food is a way to start, but it is usually not enough. Achieving true health and healing is a complex but rewarding undertaking. A larger perspective may well clarify the path by which to reach one’s objectives.
Personal Health Versus Public Health
As discussed earlier in this section, there are times when personal health and PH may confl ict. In many instances, this merely means that individuals will make per-sonal choices that deviate from general recommendations. Unfortunately, it is also quite possible for PH to be used (either as a reason or a camoufl age) to enforce the will and policy of the state and override citizens’ rights. PH initiatives and man-dates are, in many instances, determined and administered by or under a branch of government with an objective that promotes both governmental policies and politi-cal agendas.1 Personal interests, aspirations, individual choices, freedom, and ideals can be severely restricted by government “public health” laws and policies. Some of the numerous examples of this include:
■ The one-child-only-per-married-couple policy in the People’s Republic of China ■ Prohibition in the United States between 1920 and 1933, which attempted
(unsuccessfully) to ban alcohol, a powerful psychoactive drug that today is cheaply and widely available. Although PH data clearly show that the damage done by this drug is huge, the government legislation making its use illegal was eventually overturned.
1 https://en.wikipedia.org/wiki/Public_health

This is sample from Biostatistics for Epidemiology and Public Health Using RVisit This Book’s Web Page / Buy Now / Request an Exam/Review
© Springer Publishing Company
1.2 Personal Health and Public Health 5
■ The mandatory quarantining of a person suffering from a potentially fatal infectious disease.
■ Mandatory immunizations that involve pain, inconvenience, and risk of side effects for the entire population so that a disease may be prevented in a mi-nority. This may be justifi able—for example, the vaccinations that led to the eradication of smallpox and polio in the United States—but there is a large, ethically gray area surrounding vaccines for which there is considerable uncer-tainty as to the balance of benefi ts versus harms.
■ An ongoing issue in the United States today is the concerns of many parents that vaccination may cause autism in children. Should these citizens have the right to refuse vaccination on behalf of their children? Similar issues exist where a person’s religious beliefs forbid blood transfusions; such persons have refused blood transfusions for themselves and their depen-dent children, even in life-threatening medical emergencies. Although the constitutional right to freedom of religion and religious exercise has usually overridden the government’s contentions in these cases, in some instances governmental authorities may declare a person a “ward of the court” and thereby take complete responsibility for both personal and public health issues.
Review Questions for Section 1.2
1. Where does personal health end and PH begin?2. Does the Venn diagram in Figure 1.1 accurately represent personal health and
PH?List some issues that are:(a) Exclusively personal health matters(b) Exclusively PH matters(c) Both personal and public health mattersGive reasons supporting your identifications.
Personalhealth
Publichealth
FIGURE 1.1 Personal health and PH.

This is sample from Biostatistics for Epidemiology and Public Health Using RVisit This Book’s Web Page / Buy Now / Request an Exam/Review
© Springer Publishing Company
6 1. INTRODUCTION
1.3 RESEARCH AND MEASUREMENTS IN EPDM AND PH
As discussed in Section 1.1, the word epidemiology literally means “the study of what happens to a population.” Over the years, many defi nitions have been proposed, but the following defi nition captures the underlying principles and PH spirit of EPDM:
Epidemiology is the study of the distribution and determinants of health- related states or events in specifi ed populations, and the application of this study to the control of health problems (Broadbent, 2009).
The critical terms in this defi nition (in bold type here) refl ect some of the import-ant principles of EPDM:
1. Study. EPDM is a scientifi c discipline that employs established methods of scientifi c inquiry. It is data driven and depends on a systematic and unbiased approach to the collection, analysis, and interpretation of data. Epidemiologic methods depend on observation and use of valid comparison groups to assess whether what was observed (such as the number of cases of a disease in a cer-tain area during a particular time period or the frequency of exposure among persons with disease) differs from what might be expected. EPDM also uses methods from other scientifi c fi elds, including BIOS and informatics, and other biologic, economic, social, and behavioral sciences. This book deals mainly with the special contribution of BIOS to EPDM.
2. Distribution. EPDM relates the frequency and pattern of health events and out-comes in a population of interest:
■ Frequency refers to the number of health events, such as the number of cases of cholera or diabetes in a population, and to the relationship of that number to the size of the population. The resulting rate allows epidemiolo-gists to compare disease occurrence across different populations.
■ Pattern refers to the occurrence of health-related events by person, time, and place. Time patterns are those found in particular periods of time infl uencing the occurrences of injury or disease, such as annual, seasonal, weekly, daily, hourly, weekday versus weekend, and so on. Place patterns include geographic variations, urban versus rural differences, and location of work sites or schools. Personal characteristic patterns include demo-graphic factors that are or may be related to the risk of illness, injury, or disability, such as age, gender, marital status, and socioeconomic status, as well as behaviors and environmental exposures.
3. Determinants. Determinants are factors—whether events, characteristics, or other things—that bring about a change in health conditions or other defi ned characteristics. In this area of investigation, the causes of diseases are closely studied, identifi ed, and correlated with expected and measured health out-comes. This critical aspect of EPDM is discussed in more detail later in this sec-tion.
4. Health-related states or events. Originally, EPDM was concerned only with epidemics of communicable diseases (such as cholera). Subsequently, however, the fi eld of inquiry was expanded to address endemic (restricted or peculiar
This is sample from Biostatistics for Epidemiology and Public Health Using RVisit This Book’s Web Page / Buy Now / Request an Exam/Review
© Springer Publishing Company
1.3 Research and Measurements in EPDM and PH 7
to a locality or region) communicable diseases and noncommunicable infec-tious diseases. By the middle of the 20th century, additional epidemiologic methods had been developed and applied to injuries, chronic diseases, mater-nal–child health and birth defects, environmental health, and occupational health. Now epidemiologists also investigate behaviors related to health and well-being, such as lifestyle issues like the amount of exercise undertaken, and safety issues like car seat-belt use. Furthermore, with the development of bio-molecular methods and the sequencing of the human genome, epidemiologists have begun examining genetic markers of diseases and disease risk factors. As a result, the term health-related events or states may be used generally to refer to any issue that affects the well-being of a population. However, in modern EPDM, the term disease represents the wide range of health-related states and events that are studied.
5. Specifi ed populations. Even though both physicians and epidemiologists are concerned with the occurrence and control of diseases, they differ in how they view the “patient.” The physician and other health care providers are primarily concerned about the health of an individual; the epidemiologist is concerned about the collective health of the people who make up a community or popula-tion. Thus, the physician and the epidemiologist have different responsibilities regarding a person who has an illness. For example, when a patient presents with diarrheal disease, both medical professionals are interested in establishing the correct diagnosis. However, the physician focuses on treating the disease and caring for the patient as an individual; the epidemiologist focuses on identifying the source or the type of exposure that caused the disease, the number of other persons who may have been similarly exposed, the potential for further spread in the community, and interventions to prevent additional cases or recurrences.
6. Application. EPDM is involved both in studying health in a population and in applying the knowledge gained from those studies to community-based prac-tice. Like the practice of medicine, the practice of EPDM is both a science and an art. To make the proper diagnosis and prescribe appropriate treatment for a patient, the physician combines evidence-based scientifi c medical knowledge with experience, clinical judgment, and understanding of the patient. Simi-larly, the epidemiologist uses the scientifi c methods of descriptive and analytic EPDM, as well as experience, epidemiologic judgment, and understanding of local conditions, to “diagnose” the health of a community and propose appro-priate, practical, and acceptable PH interventions to control and prevent disease in the community.
EPDM: The Basic Science of PH
EPDM is the basic science of PH for the following reasons:
1. EPDM is a quantitative study relying on a working knowledge of probability, BIOS, and scientifi c research methods.
2. EPDM is a discipline of causal reasoning in which hypotheses from various sci-entifi c fi elds, such as biological sciences, behavioral sciences, physical sciences, and ergonomics, are developed and tested to yield health-related results.

This is sample from Biostatistics for Epidemiology and Public Health Using RVisit This Book’s Web Page / Buy Now / Request an Exam/Review
© Springer Publishing Company
8 1. INTRODUCTION
Moreover, EPDM is not only a research discipline in itself, but also a com-ponent of PH, providing the foundation for and directing appropriate, practical PH action based on scientifi c, cause-and-effect reasoning. Thus, the discipline of EPDM may be described in terms of two approaches: descriptive EPDM and ana-lytical EPDM.
DESCRIPTIVE EPDM
Descriptive EPDM covers time, place, and person. This approach is critically important because:
■ Upon scrutinizing the data, the epidemiologist becomes familiar with its lim-itations based on the known variables. For example, epidemiologists often deal with large numbers of records that are missing data for each important vari-able. This led to the development and application of the theory of missing-data analysis, which allows researchers to deal with data eccentricities (for example, all cases range in age from 3 months to 4 years, plus one 19-year-old).
■ The epidemiologist learns the extent and pattern of the PH problem being studied; for example, which months/neighborhoods/groups of people have the most and least cases of the phenomenon of interest.
■ The epidemiologist creates a detailed description of the health of a population that can be readily communicated with graphs, tables, and maps.
■ The epidemiologist can identify patterns (a diffi cult task, even with comput-ers), such as areas or groups within the population that have abnormally high rates of disease. This information in turn provides clues to the causes of the disease, which inform the development of verifi able hypotheses and applica-ble theories.
Descriptive EPDM may be summarized in terms of the “fi ve Ws”:
■ What = health issue of concern ■ Who = person ■ Where = place ■ When = time ■ Why/how = causes, risk factors, and transmission modes
ANALYTIC EPDM
Descriptive EPDM observes and identifi es patterns among cases and in populations according to time, location, and person. From these observations, researchers may develop hypotheses about the causes of these patterns and about the factors that increase the risk of disease. Thus, epidemiologists use descriptive EPDM to generate hypotheses—but only rarely to test their hypotheses. For the latter, epidemiologists turn to analytic EPDM, which is characterized by the use of comparison groups.
As an illustration (White, Armstrong, & Saracci, 2008), consider the large out-break of hepatitis A that occurred in the state of Pennsylvania in 2003. The epidemi-ologists found that almost all of the case patients had eaten at a particular restaurant during the previous 2 to 6 weeks (the typical incubation period for hepatitis A) before the onset of their illness.
This is sample from Biostatistics for Epidemiology and Public Health Using RVisit This Book’s Web Page / Buy Now / Request an Exam/Review
© Springer Publishing Company
1.3 Research and Measurements in EPDM and PH 9
Although the researchers were able to narrow their focus to the one restaurant and were able to exclude the food preparers and servers as the source, they did not know which particular food had been contaminated. They asked the case patients which of the restaurant’s foods they had eaten, but that only indicated which foods were popular. The researchers then also enrolled and interviewed a control group: a group of persons who had eaten at the restaurant during the same period but who had not gotten sick. Of 133 items on the restaurant’s menu, the most striking differ-ence between the case and control groups was the proportion that ate salsa (94% of case patients ate salsa, compared with only 39% of the controls).
Further investigation of the ingredients in the salsa implicated green onions as the source of infection. Shortly thereafter, the Food and Drug Administration (FDA) issued a warning to the public about green onions and the risk of hepatitis A. This action was in direct response to the convincing results of the analytic EPDM, generated by comparison of the exposure history of case patients with that of an appropriate comparison group.
When it is discovered that case patients with a particular characteristic are more likely than those without the characteristic to contract a disease, that particular characteristic is said to be associated with the disease. The characteristic may be a:
■ Demographic factor, such as place of residence, age, race, or gender ■ Constitutional factor, such as blood type or immune status ■ Behavior or action, such as smoking or having eaten salsa ■ Circumstance, such as living near contaminated soils or a toxic waste site or
using contaminated water
Identifying the factors associated with a disease can help health offi cials to focus on PH control and prevention, as well as furthering research into the causes of the disease.
Main Epidemiologic Functions
Six major tasks of EPDM in PH practice have been identifi ed:
1. PH surveillance2. Field investigation3. Analytic studies4. Evaluation5. Linkages6. Policy development
Some of these tasks are refl ected in the discussion, in Section 1.1, of the Stanford University School of Medicine’s HRP departmental concentration on BIOS, data coordination, EPDM, and HSR.
Analytic EPDM concentrates on PH prevention and control activities. It also guides additional research into the causes of disease. Thus, analytic EPDM is con-cerned with the search for causes and effects, or the why and the how. It seeks to quantify the association between exposures and outcomes and to test hypotheses about causal relationships. Perhaps EPDM by itself can never prove that a particular

This is sample from Biostatistics for Epidemiology and Public Health Using RVisit This Book’s Web Page / Buy Now / Request an Exam/Review
© Springer Publishing Company
10 1. INTRODUCTION
exposure caused a particular outcome, but EPDM nevertheless provides suffi cient evidence for the development and implementation of appropriate control and pre-vention measures.
Epidemiologic studies may be classifi ed into two categories: experimental and observational.
EXPERIMENTAL EPDM STUDIES
In an experimental study, the investigator determines through a controlled process the exposure for each individual (in a clinical trial) or community (in a community trial), and then tracks the individuals or communities over time to detect the con-tinuing effects of the exposure. The following are examples of typical experimental studies:
1. In a clinical trial of a new vaccine, the researcher usually randomly assigns some of the participants to receive the new vaccine, while others receive a pla-cebo. (A placebo is an inert or innocuous substance, used especially in con-trolled experiments testing the effi cacy of another substance as a treatment.) The researcher then tracks all participants, observing who develops the disease that the new vaccine is intended to prevent, and compares the two groups (new vaccine versus placebo) to see whether the vaccine group has a lower rate of disease.
2. In a trial to prevent the onset of diabetes among high-risk individuals, the researchers randomly assign subjects to one of three groups:
■ An antidiabetes drug ■ A placebo ■ Lifestyle intervention
At the end of the trial period, the researchers look for the lowest incidence of diabetes and fi nd that the lowest incidence occurred in the lifestyle intervention group, the next-lowest incidence was in the antidiabetic drug group, and the highest incidence occurred in the placebo group
OBSERVATIONAL EPDM STUDIES
In observational EPDM studies, the researcher just observes the exposure and dis-ease status of each study participant. The classic example of an observational study is Dr. John Snow’s investigation of an 1854 cholera epidemic in London.
THE CHOLERA STORY.2 A waterborne disease known as cholera has proven to be one of the most virulent killers in history. It was through the investigation of cholera epidemics that epidemiologists discovered the link between sanitation and PH—a discovery that led to the development of the world’s modern water and sewage systems.
It is now known that cholera is caused by ingesting water, food, or other material contaminated by the feces of a cholera patient or host. For example, casual contact
2 Biographical information on Dr. John Snow, the “father” of fi eld EPDM, and his work is available at http://www.ph.ucla.edu/epi/snow.html
This is sample from Biostatistics for Epidemiology and Public Health Using RVisit This Book’s Web Page / Buy Now / Request an Exam/Review
© Springer Publishing Company
1.3 Research and Measurements in EPDM and PH 11
with a contaminated chamber pot, soiled clothing or bedding, or even an unwashed hand might be all that is required to contract cholera. The disease can be transmitted easily and acts quickly. It strikes so suddenly that a person can be in good health in the morning and be dead by the evening. From the onset of symptoms—diarrhea, muscle cramps, vomiting, and fever—death may occur within 48 hours or less. So much fl uid is lost that the blood appears thick, and about 50% of patients will die, mainly of dehydration. In various parts of the world (including Europe and Asia), tens of thousands have died of this epidemic disease.
THE FATHER OF FIELD EPDM. In the mid-1800s, an anesthesiologist named Dr. John Snow conducted a series of studies in London that led to him being called the “father of fi eld epidemiology.” Dr. Snow investigated cholera outbreaks, both to discover the cause of the disease and to prevent its recurrence. His work illustrates the classic sequence from descriptive EPDM to hypothesis generation to hypothesis testing (analytic EPDM) to application:
■ In 1854, Dr. Snow conducted one of his studies when an epidemic of cholera suddenly started in the Golden Square of London. He began by determining where, in this particular area, persons with cholera lived and worked. He marked each residence on a map of the area, as shown in Figure 1.2. This type of map, showing the geographic distribution of cases, is called a spot map.
■ Because Dr. Snow believed that water was a carrier source of infection for chol-era, he also marked the location of water pumps on the spot map, and then looked for a relationship between the distribution of households with cases of cholera and the location of the water pumps. He noticed that more case house-holds clustered around Pump A, the Broad Street pump, than around Pump B or C. When he questioned residents who lived in the Golden Square area, he was told that they avoided Pump B because it was grossly contaminated, and that Pump C was located too inconveniently for most of them.
■ From this information, Dr. Snow concluded that the Broad Street pump (Pump A) was the primary source of water and the most likely source of infection for most persons with cholera in the Golden Square area.
■ He also noted that no cases of cholera had occurred in a two-block area just to the east of the Broad Street pump. Upon investigating, Snow found a brewery located there, with a deep well on the premises. Brewery workers obtained their water from this well, and also received a daily portion of malt liquor. Access to these uncontaminated rations (water and liquor) could explain why none of the brewery’s employees contracted cholera.
■ To confi rm that the Broad Street pump was the source of the epidemic, Dr. Snow gathered information on where persons with cholera had obtained their supply of water. Consumption of water from the Broad Street pump was the one common factor among the cholera patients.
■ After Dr. Snow presented his fi ndings to municipal offi cials, the handle of the pump was removed—and the outbreak ended! (The site of the pump is now marked by a plaque mounted on the wall outside the appropriately named John Snow Pub.)

This is sample from Biostatistics for Epidemiology and Public Health Using RVisit This Book’s Web Page / Buy Now / Request an Exam/Review
© Springer Publishing Company
12 1. INTRODUCTION
E
S
N
W
PUMPPUMP C
GR
EAT
PU
LTE
NE
Y S
TR
EE
T
X
X
X
X
X
PUMP
PUMP B
PUMP A
CA
RN
AB
Y S
TR
EE
T
WORKHOUSE
PO
LAN
D S
TR
EE
T
BROAD STREETB
ER
WIC
K S
TR
EE
T
SILVER STREET
RE
GE
NT
ST
RE
ET
GOLDENSQUARE
MA
RS
HA
LL ST
RE
ET
FIGURE 1.2 Spot map of deaths from cholera in the Golden Square area, London, 1854 (redrawn from original).Source: Humphrey Milford, Dr. John Snow on Cholera. London: Oxford University Press, 1936.
TYPES OF OBSERVATIONAL EPDM STUDIES
The two most common types of observational studies are cohort studies and case–control studies; the third type is cross-sectional studies.
COHORT STUDIES. In a cohort study, whether each study participant is exposed or not:
1. The epidemiologist records and then tracks each participant to see if he or she develops the disease of interest. (This differs from an experimental study because, in a cohort study, the epidemiologist observes rather than determines the participant’s exposure status.)
2. After a period of time, the epidemiologist compares the disease rate in the exposed group with the disease rate in the unexposed group.
3. The unexposed group serves as the comparison group, providing an estimate of the baseline or expected amount of disease occurrence in the community.
4. If the disease rate is substantively different in the exposed group compared to the unexposed group, the exposure is said to be associated with illness.
This is sample from Biostatistics for Epidemiology and Public Health Using RVisit This Book’s Web Page / Buy Now / Request an Exam/Review
© Springer Publishing Company
1.3 Research and Measurements in EPDM and PH 13
The length of follow-up varies considerably. To respond quickly to a PH con-cern, such as an outbreak of cholera or bird fl u, PH departments tend to conduct relatively brief studies. Research and academic organizations are more likely to con-duct studies of cancer, cardiovascular disease, and other chronic diseases, in efforts that may last for years and even decades. For example:
■ The Framingham Health Study is a cohort study that has followed more than 5,000 residents of Framingham, Massachusetts, since the early 1950s to estab-lish the risk factors for cardiovascular diseases.
■ The Nurses Health Study and the Nurses Health Study II are cohort stud-ies established in 1976 and 1989, respectively, that have followed more than 100,000 nurses each and have provided useful information on oral contracep-tives, diet, and lifestyle risk factors.
The Adventist Health Studies: Study 1. The Adventist Health Study 1 (AHS-1),3 a cohort investigation that began in 1974, had some very basic differences from ear-lier mortality studies. It was designed to elucidate which components of the Sev-enth-Day Adventist (SDA) lifestyle give protection against diseases. This study compared the rates of disease or mortality between SDAs and non-SDAs. Also, data were collected on nonfatal, as well as fatal, disease events. This study also added a more detailed investigation of diet. In the beginning, the AHS-1 was primarily a cancer investigation. In 1981, a cardiovascular component was added. The rate of return for the annual follow-up SDA questionnaires, which asked about hos-pitalizations and were critical to the entire research process, was in excess of 90% and usually above 95%. The fi nal and most critical mailing saw an incredible 99.5% response.
The Adventist Health Studies: Study 2.3 The current study, which began in 2002 and set a goal of 125,000 SDAs participating, continues to explore the links between life-style, diet, and disease among the broader base of Adventists in the United States and Canada. As of May 2006, Adventist Health Study-2 (AHS-2) had an enrollment of 96,741 persons. Dr. Gary E. Fraser, with a team of researchers from the School of Public Health at LLU, is conducting the study, which is funded by the U.S. National Cancer Institute. In July 2011, the National Institutes of Health (NIH) awarded AHS-2 a substantial 5-year grant to continue the study.
Cohort Study Types. The AHS-1 and AHS-2 studies are sometimes called follow-up or prospective cohort studies, because participants are enrolled when the study begins and are then followed prospectively over time to identify occurrence of the outcomes of interest.
An alternative type is a retrospective cohort study. In this kind of study, both the exposure and the outcomes have already occurred. Just as in a prospec-tive cohort study, the investigator calculates and compares rates of disease in the exposed and unexposed groups. Retrospective cohort studies are commonly used
3 AHS-1 and AHS-2 are available at http://publichealth.llu.edu and http://www.llu.edu/public-health/health/index.page
This is sample from Biostatistics for Epidemiology and Public Health Using RVisit This Book’s Web Page / Buy Now / Request an Exam/Review
© Springer Publishing Company
14 1. INTRODUCTION
in investigations of disease in groups of easily identifi ed people, such as workers at a particular factory or attendees at a wedding. For example, a retrospective cohort study was used to determine the source of infection of cyclosporiasis, a parasitic disease that broke out among members of a residential facility in Pennsylvania in 2004. The investigation implicated consumption of snow peas as the vehicle of the cyclosporiasis outbreak.
Other types of studies include case–control studies and cross-sectional studies.
CASE–CONTROL STUDIES. In a case–control study, investigators start by enrolling a group of people with disease (sometimes called case patients rather than cases, because case refers to an occurrence of disease, not a person). As a comparison group, the investigator then enrolls a group of people without disease (controls).
Investigators then compare previous exposures between the two groups. The control group provides an estimate of the baseline or expected amount of exposure in that population. If the amount of exposure among the case group is substantially higher than the amount that one would expect based on the control group, then illness is said to be associated with that exposure.
The key in a case–control study is to identify an appropriate control group—one that is comparable to the case group in most respects—to provide a reasonable esti-mate of the baseline or expected exposure.
CROSS-SECTIONAL STUDIES. In the cross-sectional type of observational study, a sample of persons from a population is enrolled and their exposures and health outcomes are measured simultaneously. The cross-sectional study tends to assess the presence of the health outcome at a particular point in time without regard to duration.
For example, in a cross-sectional study of diabetes, some of the enrollees with diabetes may have lived with their diabetes for many years, while others may have been recently diagnosed. From an analytic viewpoint, the cross-sectional study is weaker than either a cohort or a case–control study because a cross-sectional study usually cannot separate risk factors for occurrence of disease (incidence) from risk factors for survival with the disease.
The Cause of Diseases
“What is the cause of this disease?” is not an easy question to answer. On the cause of diseases, epidemiologists generally are of the opinion that “Nature loads the gun, but nurture pulls the trigger!” (Nurture is the sum of the environmental factors infl uencing the traits and behavior expressed by an organism.)
At this time in mainstream medicine, EPDM is facing at least two critical ques-tions about disease causation (Broadbent, 2009):
1. How should EPDM handle certain diseases that appear to be etiologically more complex than the infections and defi ciencies that EPDM has traditionally handled?
Currently, chronic noncommunicable diseases (CNCDs) account for a larger proportion of deaths, at least in the industrialized world, than they did 100 years ago, and they attract more epidemiologic attention. Yet these diseases do
This is sample from Biostatistics for Epidemiology and Public Health Using RVisit This Book’s Web Page / Buy Now / Request an Exam/Review
© Springer Publishing Company
1.3 Research and Measurements in EPDM and PH 15
not seem susceptible to defi nition in terms of any one causative agent. In other words, their etiology is complex. (Etiology is a branch of medical science con-cerned with the causes and origins of diseases.)
2. How should EPDM respond to newly identifi ed causes of disease?Although EPDM continues to discover increasingly complex and surprising
environmental causes of disease, the fi eld must now deal with the new category of causes: genetics. The depth and complexity of knowledge required to deal with both genetic and environmental determinants of health places pressure on aspects of the conceptual framework of EPDM with regard to disease causation.
MODELS OF CAUSATION
A good scientifi c causal model may be summarized as follows:The requisite cause of disease D is the event E if, and only if:
(i) An E-event is a cause of every case of D;(ii) Given certain circumstances, an E-event is not a cause of any non-D-event (i.e.,
other diseases or good health).
Historically, several models of disease have been proposed and used: the mono-causal model, the multifactorial model, and the contrastive model are the primary ones.
The Monocausal Model. This model says that every disease has a single cause that is necessary, and sometimes suffi cient. This model is well suited to infectious diseases such as tuberculosis (TB) and cholera, along with parasitic infestations and diseases of defi ciency.
However, it is unfi t for CNCDs such as lung cancer or diabetes. It is possible that diabetes does have a single necessary and, in some circumstances, suffi cient cause, which has not yet been discovered. But it is also a theoretical possibility that there is no cause for diabetes satisfying that description. And even if there is, it is not clear how insisting that there must be such a cause helps to achieve PH or any clinical goals, if one does not know what that cause is. What we have been able to identify so far are merely causal risk factors, and these are neither necessary nor suf-fi cient. Thus, important objections may be raised regarding the monocausal model.
The Multifactorial Model. This model now dominates EPDM, but this is also not an entirely satisfactory situation because the multifactorial model fails to acknowledge what looks like a real etiological difference between diseases like chol-era and conditions like lung cancer. The monocausal model has had some striking successes in the history of EPDM, and these successes are left unexplained by the mere assertion that disease causation is multifactorial. Unless one can explain the successes of the monocausal model in terms of modern multifactorial thinking, this approach is equally unsatisfactory.
The Contrastive Model. This model is defensible on the ground that it links the notions of disease and of general explanation, while avoiding the philosophical naiveties and practical diffi culties of the monocausal model. For person p to have disease D, it is necessary that:
SYMPTOMS: p suffers from some of a set of symptoms of ill health S, which are differences between p and a contrast class X.
This is sample from Biostatistics for Epidemiology and Public Health Using RVisit This Book’s Web Page / Buy Now / Request an Exam/Review
© Springer Publishing Company
16 1. INTRODUCTION
CAUSES: Among the causes of p’s symptoms are events of kinds C1, …, Cn, at least some of which are not causes of the absence of the symptoms S from each member of X.
The assumptions of the contrastive model are as follows:
1. To have a disease, p must have some symptoms of poor health. These symp-toms are considered part of the defi nition of the disease. Not all the symptoms associated with that particular disease need be present, but p must have at least one.
A symptom of ill health is an observable difference between the case subject and a contrast class, which is a just a certain set of people, some of whom may be merely hypothetical. The contrast class need not be unique (i.e., the same for everyone). The contrast class for a 59-year-old man might include some bald members, whereas the relevant contrast class for a 6-year-old child might not. This allows the analysis to cover diseases that are specifi c to age, gender, and other characteristics (including having another disease).
2. Having a disease requires that p’s symptoms be caused by a certain cause or causes, which must not be causes of the absence of symptoms from the contrast class. These causes are also part of the defi nition of the disease. For example, to have cholera, one must exhibit some symptoms of poor health that a certain con-trast class does not have (e.g., diarrhea); and those symptoms must be caused by a certain specifi ed cause [viz., the active presence of Vibrio cholerae (V. cholerae) in p’s small intestine].
NOTE: Having causes is not an epistemological requirement: One does not have to know about V. cholerae in order to count cholera as a disease. Rather, by count-ing cholera as a disease, one commits to the existence of something satisfying the CAUSES defi nition/requirements.
The next step is to fi nd out what that cause is, thus making the model method-ologically useful.
Some investigators also consider the concept of illness, or mere ill health or poor health that falls short of qualifying as a disease. For a disease, a cause or causes of certain symptoms are specifi ed, whereas for an illness, they are not specifi ed.
AN EXAMPLE FOR THE CONTRASTIVE MODEL
A recent example in which the contrastive model might have been useful is the dis-covery of the role of the bacterium Helicobacter pylori (H. pylori) in duodenal ulcers. This discovery brought tensions between the monocausal and multifactorial ways of thinking into high contrast.
Many discussions of ulcer assume that, since the discovery and implication of H. pylori in ulcer formation, both acid and stress or psychosomatic factors have been made etiologically irrelevant. Some simply considered H. pylori “the cause of ulcers,” although epidemiologically better-informed treatments, such as a report by the NIH maintained a different stance. Critics argued that “the NIH’s emphasis on multiple factors in pathogenesis refl ects the extent to which multicausality is a staple of biomedical and epidemiological discourse.”
This is sample from Biostatistics for Epidemiology and Public Health Using RVisit This Book’s Web Page / Buy Now / Request an Exam/Review
© Springer Publishing Company
1.3 Research and Measurements in EPDM and PH 17
However, the etiological reality clearly favors the multifactorial treat-ment. H. pylori is neither necessary nor suffi cient for duodenal ulcer, nor is its elimination from a patient either necessary or suffi cient for the curing of an ulcer. In effect, monocausal model thinking becomes wishful thinking, a consequence of the desire for treatments that work on each and every case of disease. Unfor-tunately, desire is not a good guide to reality. In this case, multifactorialism does not have the resources to express what the etiological reality might be, and the monocausal model is simply incorrect. In contrast, the contrastive model is help-ful here.
Within the contrastive model, duodenal ulcers satisfy symptoms, and H. pylori can be made to satisfy causes. Cases in which duodenal ulcer is present without H. pylori can be handled in one of two ways: Either they are cases of a different disease with the same symptoms, or one can defi ne the disease in terms of H. pylori and another cause, such as excessive hydrochloric acid in the stomach. Note that H. pylori infection occurs without symptoms in many cases. In the contrastive model, these instances are an invitation to further investigation. One can thus add precision to the claim that H. pylori causes stomach ulcers and acknowledge the importance of the discovery by reclassifying some cases of stomach ulcer as a dis-tinct disease.
One should note that the contrastive model leaves a crucial component unspec-ifi ed: It does not directly indicate anything about the contrast class, and especially about the concept of health.
THE BLACK SWAN STORY
We will put the discussion of the concept and defi nition of causation of diseases aside for a moment to consider an interesting historical incident regarding biologi-cal defi nitions.
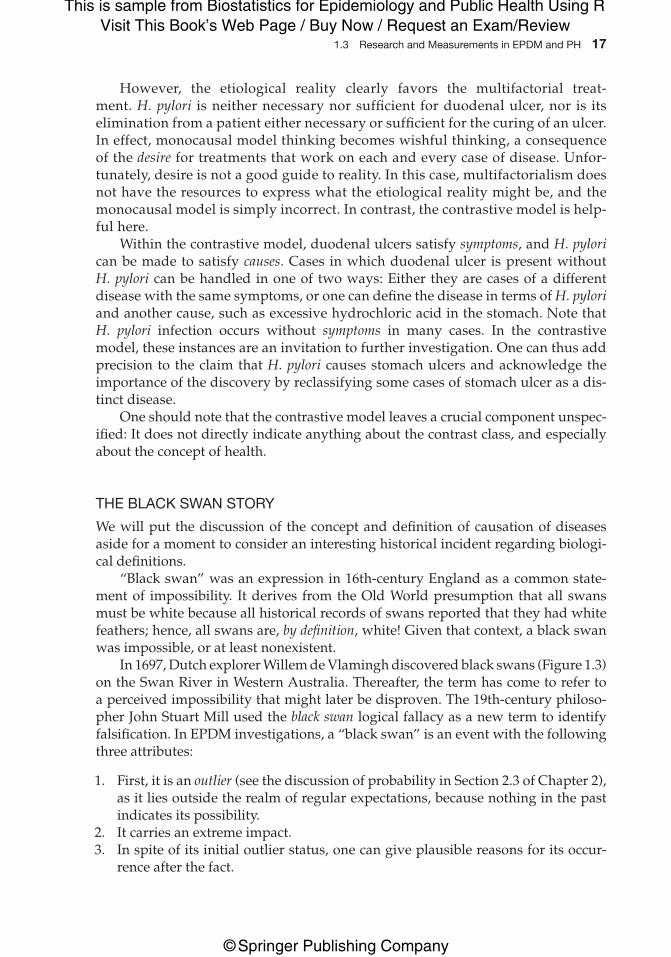
“Black swan” was an expression in 16th-century England as a common state-ment of impossibility. It derives from the Old World presumption that all swans must be white because all historical records of swans reported that they had white feathers; hence, all swans are, by defi nition, white! Given that context, a black swan was impossible, or at least nonexistent.
In 1697, Dutch explorer Willem de Vlamingh discovered black swans (Figure 1.3) on the Swan River in Western Australia. Thereafter, the term has come to refer to a perceived impossibility that might later be disproven. The 19th-century philoso-pher John Stuart Mill used the black swan logical fallacy as a new term to identify falsifi cation. In EPDM investigations, a “black swan” is an event with the following three attributes:
1. First, it is an outlier (see the discussion of probability in Section 2.3 of Chapter 2), as it lies outside the realm of regular expectations, because nothing in the past indicates its possibility.
2. It carries an extreme impact.3. In spite of its initial outlier status, one can give plausible reasons for its occur-
rence after the fact.

This is sample from Biostatistics for Epidemiology and Public Health Using RVisit This Book’s Web Page / Buy Now / Request an Exam/Review
© Springer Publishing Company
18 1. INTRODUCTION
NATURE VERSUS NURTURE IN EPDM: REVERSING TYPE 1 DIABETES? (EDELMAN, OLSEN, DUDLEY, HARRIS, & ODDONE, 2004)
THE HEMOGLOBIN A1c (HBA1c) TEST FOR DIABETES MELLITUS.4 Hemoglobin is a sub-stance within red blood cells that carries oxygen throughout the body. In a person with poorly controlled diabetes, sugar builds up in the blood, either because the person’s body does not produce suffi cient insulin to transfer the sugar into the cells, or because insulin resistance hampers that transfer. The sugar in the blood, there-fore, combines with hemoglobin: the hemoglobin becomes “glycated.” HbA1c, or simply A1c, is the main fraction of glycosylated hemoglobin (glycohemoglobin; i.e., hemoglobin) to which glucose is bound. The glucose stays bound to hemoglobin for the life of the red blood cell (normally about 120 days), so the level of HbA1c refl ects the average blood glucose level over the past 4 months. Thus, HbA1c is tested to monitor the long-term control of diabetes mellitus.
■ The normal level for HbA1c is less than 7%. Diabetics rarely achieve such lev-els, but tight control aims to come close to it.
■ Levels above 9% show poor control. ■ Levels above 12% show very poor control.
It is commonly recommended that HbA1c be measured every 3 to 6 months in diabetics.
The Diabetes Control and Complications Trial (DCCT; Nathan, 2014) showed that diabetics who keep their HbA1c levels close to 7% have a much better chance of delaying or preventing diabetes complications that affect the eyes, kidneys, and nerves than people with levels at 8% or higher. A change in treatment is almost always needed if the level is over 8%. Lowering the level of HbA1c by any amount improves a person’s chances of staying healthy.
4 The HbA1c test for diabetes; retrieved from http://diabetes.webmd.com/guide/glycated-hemoglobin-test-hba1c
FIGURE 1.3 A black swan (Cygnus atratus), which remained undocumented in the West until the 18th century.

This is sample from Biostatistics for Epidemiology and Public Health Using RVisit This Book’s Web Page / Buy Now / Request an Exam/Review
© Springer Publishing Company
1.3 Research and Measurements in EPDM and PH 19
TYPE 1 DIABETES. In type 1 diabetes, the patient’s pancreas no longer produces the insulin that the person needs to survive, so the patient must replace the missing insulin from other (external) sources. This is why type 1 diabetes is also known as insulin-dependent diabetes; because the condition occurs primarily in children, it also used to be known as juvenile diabetes (actually a misnomer, as adult-onset cases are not unheard of).
A diagnosis of type 1 diabetes in a child can be overwhelming at fi rst. Sud-denly, the parents and the affected child must learn how to give insulin injections, count carbohydrates, and monitor blood sugar—and the child must do so for life. Although diabetes in children requires consistent care, advances in blood sugar monitoring and insulin delivery have improved the daily management of this condition.
CASE SUBJECT: A CHILD WITH TYPE 1 DIABETES. The case subject was a 14-year-old child who was clinically diagnosed as suffering from type 1 diabetes some 2 years previously. The subject was enrolled in a test in which the child orally took a pre-scribed medication for a period of 3 months. Interestingly, the medication was a traditional Chinese medicine (TCM; Liu et al., 2014) formulation of herbal origin.
During this period, A1c blood tests were taken to monitor the subject’s progress. The progressive A1c test results were as follows:
9+ → 8.4 → 7.8 → 7.45 → 6.7 (%)
Question: Did the TCM treatment infl uence the subject’s pancreas to restart the production of the beta cells that make insulin? (Insulin processes and controls the blood glucose level.)
The following tests may be considered:
■ Perhaps concomitant changes in the beta-cell level of the case subject should be measured; such a test might shed further light on the subject.
■ Perhaps the case subject could be taken off the prescribed TCM medication, and the A1c levels closely checked thereafter to see if the trend is reversed or reversible.
How does this result affect the accepted medical position that type 1 diabetes is permanently irreversible? Can EPDM research help? Clearly, much EPDM investi-gation is called for in this situation.
Actually, a clinical trial in which the same TCM treatment was given to more than 10,000 case subjects resulted in a positive response (namely, improved stability of blood glucose control without insulin) in about 30% of the test population. Such results are strong justifi cation for further EPDM investigations in this area!
Exposure Measurement in Epidemiology
Epidemiologic studies in PH research relate exposure to causal agents to the occur-rence of a particular disease. A study may not fully explain how the disease occurred, but, by and large, it records under what circumstances one may expect the disease to occur. The accurate measurement of exposure to putative causes of a disease (that is, the commonly accepted causes of the disease) is essential to the validity of epidemiologic
This is sample from Biostatistics for Epidemiology and Public Health Using RVisit This Book’s Web Page / Buy Now / Request an Exam/Review
© Springer Publishing Company
20 1. INTRODUCTION
research. There are theories, principles, and techniques that may be applied to mea-suring a wide range of exposures, including scientifi c, medical, genetic, demographic, behavioral, psychological, sociological, and environmental factors.
Techniques in epidemiologic research include:
■ Use of questionnaires (often designed by the researcher) ■ Personal interviews ■ Abstracting information from medical records ■ Use of proxy respondents ■ Making biological and environmental measurements
The research may include one or more of the following:
1. A comprehensive account of measurement error and the estimation of its effects2. The design, analysis, and interpretation of the validity and reliability of the
studies3. The ways in which validity of the measurements can be improved4. Techniques to maximize the participation of subjects in future studies5. Revelation of ethical issues relevant to exposure measurement6. Some more-or-less comprehensive guidance on minimizing measurement error
Exposure measurement thus employs the methods and quality control approaches for the most commonly used data collection methods in EPDM.
Additional Issues
To achieve maximum participation of relevant subjects in an epidemiologic research, special techniques should be used. Also, consideration should be given to the eth-ical issues inherent in exposure measurement; in this regard, the following issues are important:
1. In reliability and validity studies that record the degree of measurement error for a specifi c exposure, one must establish the methods to design, interpret, and analyze the collected data. This is critical because such supporting studies are needed to understand the effects of exposure measurements on the overall epi-demiologic study.
2. Methods should be chosen to maximize response rates. In this way, selection bias may be reduced. Such an approach is essential to the success of the data collection phase of the study.
3. Ethical issues in conducting the epidemiologic research overall should be con-sidered; the benefi ts will be similar to those described in items 1 and 2.
Review Questions for Section 1.3
1. What are the “five Ws” of descriptive EPDM?2. In Dr. John Snow’s successful observational EPDM investigation of cholera,
(a) What underlying assumptions did he make that led him to reach the correct conclusion regarding the cause of cholera?
(b) Did Dr. John Snow rely on a model for diseases? Which model?
This is sample from Biostatistics for Epidemiology and Public Health Using RVisit This Book’s Web Page / Buy Now / Request an Exam/Review
© Springer Publishing Company
1.4 BIOS and EPDM 21
3. From the black swan story, is it reasonable to suggest that there might be red/ orange/yellow/green/blue/indigo/violet swans too? Why or why not?
4. (a) Given the three models for diseases, can there be overlapping areas where any two, or all three, models may fit?
(b) Draw a Venn diagram to show the possibility (if any) of overlapping of these three models. Suggest some examples.
5. (a) What is a case-cohort health study in EPDM?(b) Name two U.S. health studies that enrolled more than 50,000 case subjects.(c) Why is such a large pool of subjects needed?
6. (a) Which factor is more important in the cause of diseases: nature or nurture? Why?
(b) Of these two factors, which one is more readily treatable/manageable? Why?7. (a) How can differences in genetic factors, and environmental factors be taken into
account in EPDM investigations?(b) Of these two factors—genetic and environmental—which is more important?
Why?8. If a certain alternative or unorthodox disease management approach (such as
TCM, ayurveda, acupuncture, etc.) appears to be effective in the management of certain diseases (e.g., type 1 diabetes, chronic headaches), can EPDM investiga-tions be used to relate the “unorthodox” approach to mainstream, evidence-based medicine? Why or why not?
1.4 BIOS AND EPDM
Biostatistics—a combination word derived from biology and statistics, and also sometimes called biometry or biometrics—is the application of statistics to a topic in biology. BIOS includes the design of biological experiments, especially in medicine and health sciences; the collection and analysis of data from those experiments; and the interpretation of the results.
To understand the application of BIOS, let us use the example of a hypo-thetical community in the United States, in which an epidemiologist attempts to quantify the effect of a specifi c disease, such as swine fl u (the common name used for the H1N1 virus, a new strain of infl uenza A, to distinguish it from the seasonal fl u), to study the distribution of the disease among various regions. The goals are:
1. To determine the magnitude of the population affected by the disease2. To ascertain potential causes
One should fi rst determine the prevalence of the disease, defi ned as the frac-tion of subjects affected by that disease. First, one may consider the estimate of the population’s prevalence under the commonly assumed condition: sampling in which one considers a randomized sample of N subjects, obtaining X cases. Also, to understand the randomness of the disease occurrence in the population, a research biostatistician often starts analyzing the data in terms of a probabilistic model. A good example of an elementary probabilistic model is the binomial model,
This is sample from Biostatistics for Epidemiology and Public Health Using RVisit This Book’s Web Page / Buy Now / Request an Exam/Review
© Springer Publishing Company
22 1. INTRODUCTION
which is characterized by trials that end in one of two ways: either success or fail-ure. (Bi = two; hence the “binomial” name referring to the two possible outcomes of success or failure.)
Thus, to determine the prevalence of disease-infected subjects, one may take a random sample of
N = 500 subjects in a specifi c community, and obtainX = 4 subjects with positive results from an antibody test
With these results, the biostatistician has in hand the following model:
1. A binomial model of distribution of the disease2. A sample mean of p = (X/N) = (4/500) = 1/125 = 0.008, from which biostatistical
predictions may be made using the well-known binomial distribution model.
(More is discussed about different probabilistic models in Chapter 5 on probability theory and inferential biostatistics.)
Thus, for a large population (under the same condition of distribution) of n = 1,000,000, one would use the same model (assumed to be reasonably applicable) to get the expected number of disease cases. In this example, this is given by the expected value E[X] of the binomial distribution model:
E[X] = np = (1,000,000) (0.008) = 8,000.
Clearly, major assumptions have been made. For example, it was assumed that (a) the binomial distribution model was applicable; and (b) only one sampling pop-ulation was used.
In the foregoing simple example, the epidemiologic approach consisted of:
First—Hypothesizing a probability distribution for the population; in this case, the simple binomial distribution
Next—Conducting a sampling of the population and obtaining sampling parame-ter(s) for the population
Finally—Using the assumed probabilistic model to make predictions regarding the whole population.
These are the classic “1–2–3” steps in the application of inferential biostatistics, to draw conclusions by the inference approach. Of course, more appropriate biosta-tistical models may be used and additional sampling may have to be done, leading to more representational models and more refi ned biostatistical models. It is clear that concomitant to the development and use of better models are more involved computational procedures.
To support such computations, the open-source, free software R will be used in this journey of medicine, preventive medicine, public health, EPDM, and BIOS.
In addition to inferential biostatistics, an alternate and simpler approach, called descriptive biostatistics, is often used in epidemiologic research. The objective of descriptive biostatistics is simply to describe a dataset by summarizing all its perti-nent characteristics. Both methods are fully described in Chapter 2.

This is sample from Biostatistics for Epidemiology and Public Health Using RVisit This Book’s Web Page / Buy Now / Request an Exam/Review
© Springer Publishing Company
References 23
Review Questions for Section 1.4
1. In EPDM investigations, quantitative sampling is taken from a target population. Does this approach call for methodologies taken from BIOS? Why or why not?
2. (a) What is the binomial distribution model in BIOS?(b) How does this model help in analysis of data collected in an EPDM investigation?
3. (a) Is the expected value same as the average value?(b) Why or why not?
4. What are the “1–2–3” steps in the application of inferential biostatistics?5. (a) What is descriptive biostatistics?
(b) How does descriptive biostatistics help in EPDM investigations?
REFERENCES
Broadbent,
Centers
Charlton,
Edelman,
Liu,
Nathan,
White,
A. (2009). Causation and models of disease in epidemiology. Studies in the History and Philosophy of the Biological and Biomedical Sciences, 40, 302–311. Retrieved from http://www.hps.cam.ac.uk/people/broadbent/models_of_disease.pdf
for Disease Control and Prevention. (2006). Principles of epidemiology in public health practice: An introduction to applied epidemiology and biostatistics (3rd ed.). Atlanta, GA: US Department of Health and Human Services [Self-Study Course SS1000].
B. G. (2001). Personal freedom or public health? In M. Marinker (Ed.), Medicine and humanity (pp. 55–69). London: King’s Fund. Retrieved from http://www.hedweb.com/bgcharlton/healthfreed.html
D., Olsen, M. K., Dudley, T. K., Harris, A. C., & Oddone, E. Z. (2004). Utility of hemo-globin A1c in predicting diabetes risk. Journal of General Internal Medicine (JGIM), 19(12), 1175–1180.X., Liu, L., Chen, P., Zhou, L., Zhang, Y., Wu, Y., . . . Yi, D. (2014). Clinical trials of traditional Chinese medicine in the treatment of diabetes nephrology—A systematic review based on a subgroup analysis. Journal of Ethnopharmacology, 151(2), 810–819.
D. M. (2014). The Diabetes Control and Complications Trial/Epidemiology of Diabetes Interventions and Complications Study at 30 years: Overview. Retrieved from http://care.diabe-tesjournals.org/
E., Armstrong, B. K., & Saracci, R. (2008). Principles of exposure measurement in epidemiol-ogy: Collecting, evaluating, and improving measures of disease risk factors (2nd ed.). Oxford, UK: Oxford University Press.
Related Documents