Biosorption of heavy metal ions from the aqueous solutions using porous Sargassum Wightii (SW) brown algae: batch adsorption, kinetic and thermodynamic studies V Yogeshwaran ( [email protected] ) Sri Krishna College of Engineering and Technology A.K Priya KPR Institute of Engineering and Technology Research Article Keywords: Heavy metals, Adsorption, Sargassum Wightii, Thermodynamic studies, Kinetic studies Posted Date: August 1st, 2022 DOI: https://doi.org/10.21203/rs.3.rs-1802122/v2 License: This work is licensed under a Creative Commons Attribution 4.0 International License. Read Full License

Welcome message from author
This document is posted to help you gain knowledge. Please leave a comment to let me know what you think about it! Share it to your friends and learn new things together.
Transcript

Biosorption of heavy metal ions from the aqueoussolutions using porous Sargassum Wightii (SW)brown algae: batch adsorption, kinetic andthermodynamic studiesV Yogeshwaran ( [email protected] )
Sri Krishna College of Engineering and TechnologyA.K Priya
KPR Institute of Engineering and Technology
Research Article
Keywords: Heavy metals, Adsorption, Sargassum Wightii, Thermodynamic studies, Kinetic studies
Posted Date: August 1st, 2022
DOI: https://doi.org/10.21203/rs.3.rs-1802122/v2
License: This work is licensed under a Creative Commons Attribution 4.0 International License. Read Full License

1
Biosorption of heavy metal ions from the aqueous solutions using 1
porous Sargassum Wightii (SW) brown algae: batch adsorption, 2
kinetic and thermodynamic studies 3
V. Yogeshwaran1*, A.K. Priya2 4
1*Assistant Professor, Department of Civil Engineering, Sri Krishna College of Engineering and 5
Technology, Coimbatore -641008, India. [email protected] 6
2Associate Professor, Department of Civil Engineering, KPR Institute of Engineering and 7
Technology, Coimbatore – 641027, India. [email protected] 8
9
10
11
12
ABSTRACT 13
The removal of heavy metal ions (Cr, Pb and Zn) present in aqueous solutions has been 14
examined utilizing Sargassum Wightii (SW) - brown algae – as an organic adsorbent. The 15
functional groups of SW were determined by FTIR analysis before and after heavy metal ion 16
adsorption. Because of the strong Van der Walls forces, the SEM/EDX picture reveals the 17
presence of heavy metal ions on the surface of the SW. The influence of adsorption was studied 18
in different settings by adjusting the parameters of pH, SW dosage, metal ion concentration, time 19
of contact and temperature. In addition, the thermodynamic and isotherm investigations were 20
carried out in order to determine the adsorption process and its connection. It was found that by 21
adding 0.3 N H2SO4, the maximal desorption rate was achieved. 22
23
Keywords: Heavy metals, Adsorption, Sargassum Wightii, Thermodynamic studies, Kinetic 24
studies. 25
2
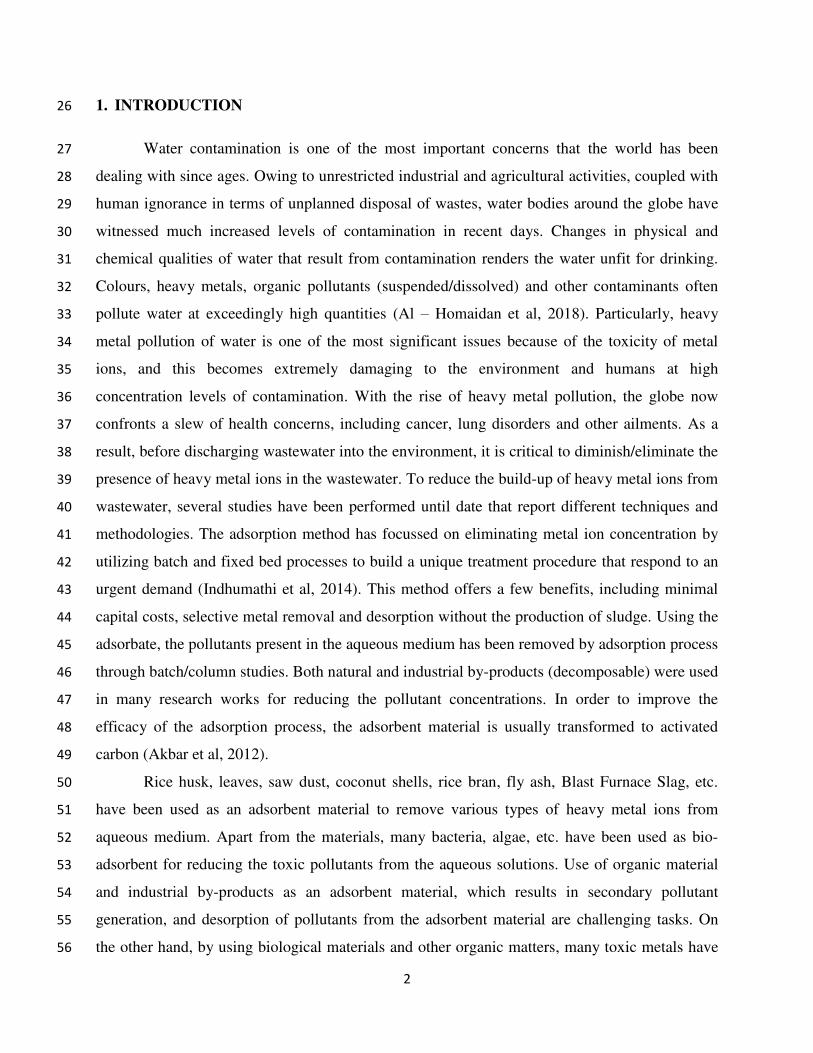
1. INTRODUCTION 26
Water contamination is one of the most important concerns that the world has been 27
dealing with since ages. Owing to unrestricted industrial and agricultural activities, coupled with 28
human ignorance in terms of unplanned disposal of wastes, water bodies around the globe have 29
witnessed much increased levels of contamination in recent days. Changes in physical and 30
chemical qualities of water that result from contamination renders the water unfit for drinking. 31
Colours, heavy metals, organic pollutants (suspended/dissolved) and other contaminants often 32
pollute water at exceedingly high quantities (Al – Homaidan et al, 2018). Particularly, heavy 33
metal pollution of water is one of the most significant issues because of the toxicity of metal 34
ions, and this becomes extremely damaging to the environment and humans at high 35
concentration levels of contamination. With the rise of heavy metal pollution, the globe now 36
confronts a slew of health concerns, including cancer, lung disorders and other ailments. As a 37
result, before discharging wastewater into the environment, it is critical to diminish/eliminate the 38
presence of heavy metal ions in the wastewater. To reduce the build-up of heavy metal ions from 39
wastewater, several studies have been performed until date that report different techniques and 40
methodologies. The adsorption method has focussed on eliminating metal ion concentration by 41
utilizing batch and fixed bed processes to build a unique treatment procedure that respond to an 42
urgent demand (Indhumathi et al, 2014). This method offers a few benefits, including minimal 43
capital costs, selective metal removal and desorption without the production of sludge. Using the 44
adsorbate, the pollutants present in the aqueous medium has been removed by adsorption process 45
through batch/column studies. Both natural and industrial by-products (decomposable) were used 46
in many research works for reducing the pollutant concentrations. In order to improve the 47
efficacy of the adsorption process, the adsorbent material is usually transformed to activated 48
carbon (Akbar et al, 2012). 49
Rice husk, leaves, saw dust, coconut shells, rice bran, fly ash, Blast Furnace Slag, etc. 50
have been used as an adsorbent material to remove various types of heavy metal ions from 51
aqueous medium. Apart from the materials, many bacteria, algae, etc. have been used as bio-52
adsorbent for reducing the toxic pollutants from the aqueous solutions. Use of organic material 53
and industrial by-products as an adsorbent material, which results in secondary pollutant 54
generation, and desorption of pollutants from the adsorbent material are challenging tasks. On 55
the other hand, by using biological materials and other organic matters, many toxic metals have 56
3
been removed from the polluted sources without formation of secondary pollutants, and 57
removing the accumulated pollutant from the adsorbent has been done by many easy ways (Yang 58
et al, 2019). Within the domain of micro-organisms, algae – that involve photosynthesis for their 59
growth – are available in marine and fresh waters. Due to their food and fuel production ability, 60
algae are considered as fast-growing beings; and they possess the ability to produce biomass 61
from nutrients using atmospheric CO2 (Molazadeh et al, 2015). In this experimental work, the 62
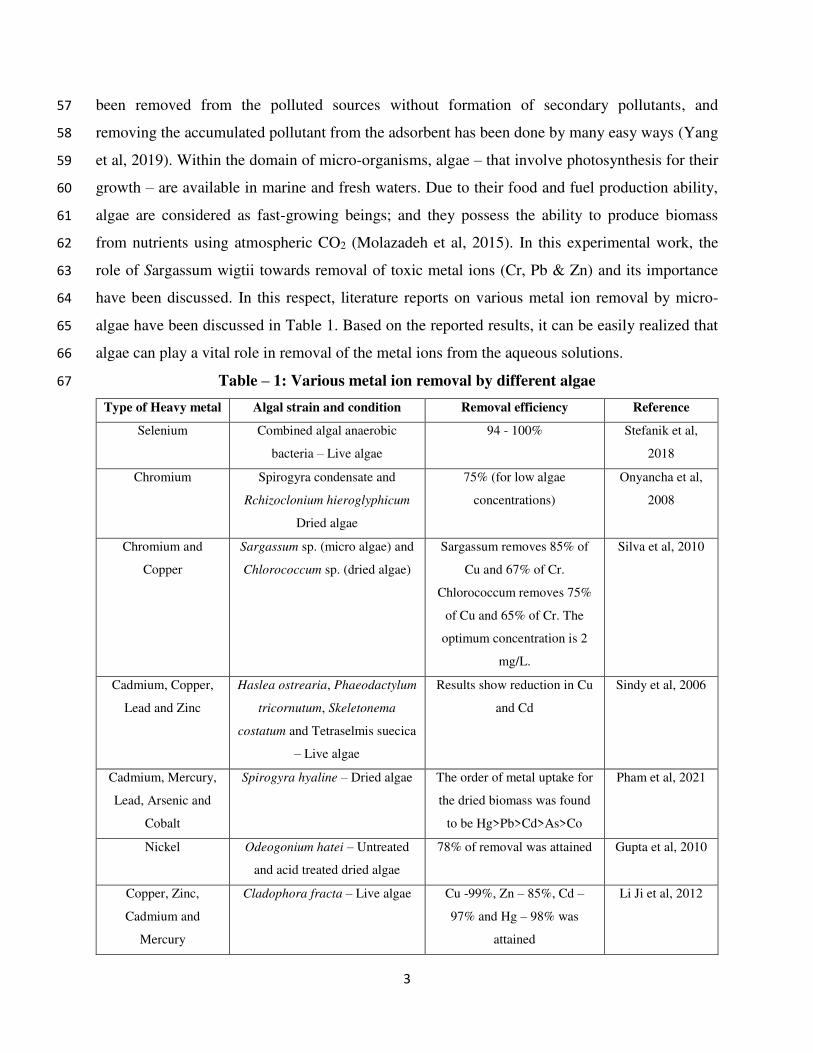
role of Sargassum wigtii towards removal of toxic metal ions (Cr, Pb & Zn) and its importance 63
have been discussed. In this respect, literature reports on various metal ion removal by micro-64
algae have been discussed in Table 1. Based on the reported results, it can be easily realized that 65
algae can play a vital role in removal of the metal ions from the aqueous solutions. 66
Table – 1: Various metal ion removal by different algae 67
Type of Heavy metal Algal strain and condition Removal efficiency Reference
Selenium Combined algal anaerobic
bacteria – Live algae
94 - 100% Stefanik et al,
2018
Chromium Spirogyra condensate and
Rchizoclonium hieroglyphicum
Dried algae
75% (for low algae
concentrations)
Onyancha et al,
2008
Chromium and
Copper
Sargassum sp. (micro algae) and
Chlorococcum sp. (dried algae)
Sargassum removes 85% of
Cu and 67% of Cr.
Chlorococcum removes 75%
of Cu and 65% of Cr. The
optimum concentration is 2
mg/L.
Silva et al, 2010
Cadmium, Copper,
Lead and Zinc
Haslea ostrearia, Phaeodactylum
tricornutum, Skeletonema
costatum and Tetraselmis suecica
– Live algae
Results show reduction in Cu
and Cd
Sindy et al, 2006
Cadmium, Mercury,
Lead, Arsenic and
Cobalt
Spirogyra hyaline – Dried algae The order of metal uptake for
the dried biomass was found
to be Hg>Pb>Cd>As>Co
Pham et al, 2021
Nickel Odeogonium hatei – Untreated
and acid treated dried algae
78% of removal was attained Gupta et al, 2010
Copper, Zinc,
Cadmium and
Mercury
Cladophora fracta – Live algae Cu -99%, Zn – 85%, Cd –
97% and Hg – 98% was
attained
Li Ji et al, 2012
4
2. MATERIALS AND METHODS 68
2.1 Preparation of adsorbent & Stock solution – The brown algae adsorbent, SW, was 69
collected from Nagapattinam district, Tamil Nadu, India, and was washed several times to 70
remove the impurities by using double distilled water. Then the collected SW was dried in 71
sunlight for 10 days, cut into small pieces, and crushed several times with a domestic mixer (1 72
HP Micro active, India) to obtain a range of particle size between 150 and 175 µm for porous 73
material preparation. The crushed SW was then kept in an oven at 60C for 24 hours to further 74
remove impurities. For the stock solution preparation, 50 mg of K2Cr2O7, ZnCl2 & PbSO4 were 75
taken and mixed with 500 mL of double distilled water, and the solution was kept in room 76
temperature. The double distilled water dilution was done to obtain the designed concentrations 77
at various levels. The pH of the solution was adjusted by adding 0.1 M of H2SO4. 78
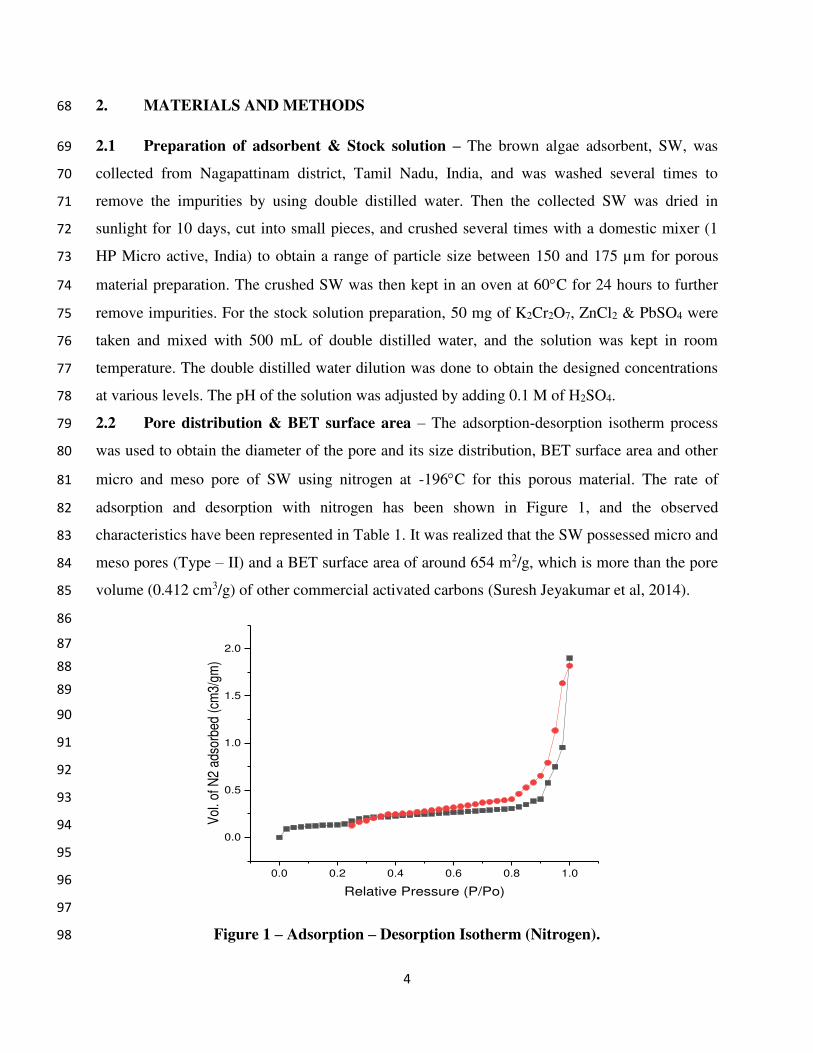
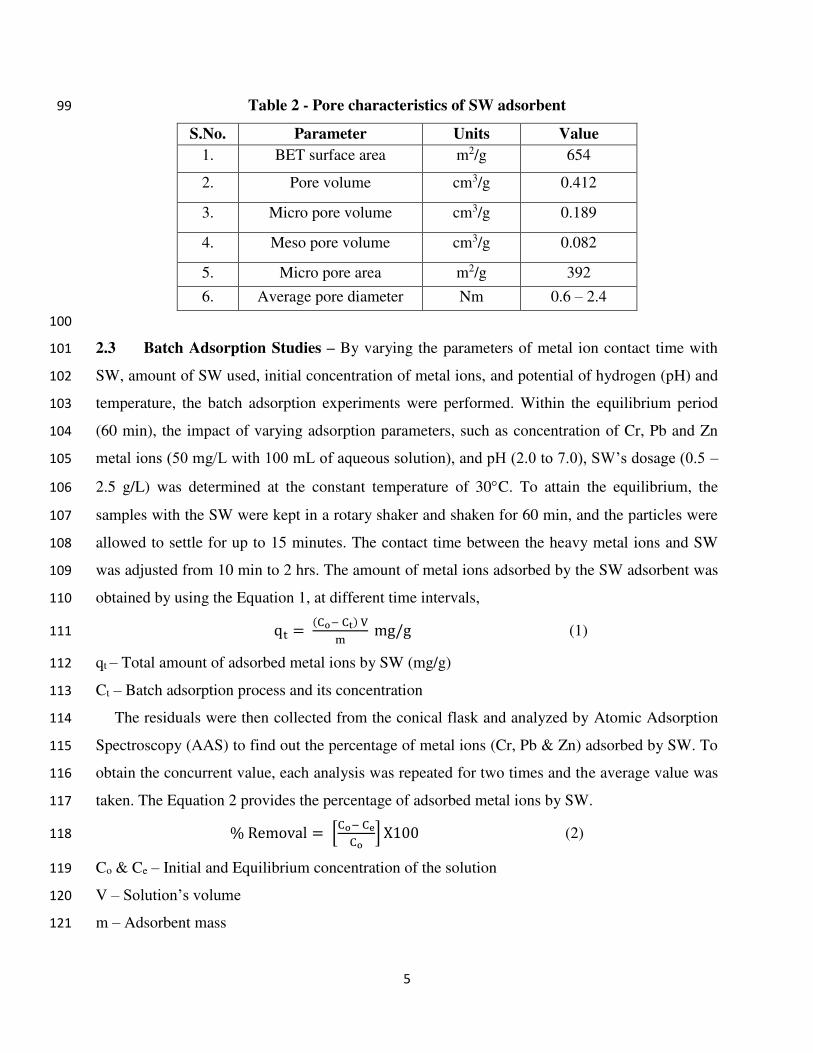
2.2 Pore distribution & BET surface area – The adsorption-desorption isotherm process 79
was used to obtain the diameter of the pore and its size distribution, BET surface area and other 80
micro and meso pore of SW using nitrogen at -196C for this porous material. The rate of 81
adsorption and desorption with nitrogen has been shown in Figure 1, and the observed 82
characteristics have been represented in Table 1. It was realized that the SW possessed micro and 83
meso pores (Type – II) and a BET surface area of around 654 m2/g, which is more than the pore 84
volume (0.412 cm3/g) of other commercial activated carbons (Suresh Jeyakumar et al, 2014). 85
86
87
88
89
90
91
92
93
94
95
96
97
Figure 1 – Adsorption – Desorption Isotherm (Nitrogen). 98
0.0 0.2 0.4 0.6 0.8 1.0
0.0
0.5
1.0
1.5
2.0
Vol
. of N
2 ad
sorb
ed (
cm3/
gm)
Relative Pressure (P/Po)
5
Table 2 - Pore characteristics of SW adsorbent 99
S.No. Parameter Units Value
1. BET surface area m2/g 654
2. Pore volume cm3/g 0.412
3. Micro pore volume cm3/g 0.189
4. Meso pore volume cm3/g 0.082
5. Micro pore area m2/g 392
6. Average pore diameter Nm 0.6 – 2.4
100
2.3 Batch Adsorption Studies – By varying the parameters of metal ion contact time with 101
SW, amount of SW used, initial concentration of metal ions, and potential of hydrogen (pH) and 102
temperature, the batch adsorption experiments were performed. Within the equilibrium period 103
(60 min), the impact of varying adsorption parameters, such as concentration of Cr, Pb and Zn 104
metal ions (50 mg/L with 100 mL of aqueous solution), and pH (2.0 to 7.0), SW’s dosage (0.5 – 105
2.5 g/L) was determined at the constant temperature of 30C. To attain the equilibrium, the 106
samples with the SW were kept in a rotary shaker and shaken for 60 min, and the particles were 107
allowed to settle for up to 15 minutes. The contact time between the heavy metal ions and SW 108
was adjusted from 10 min to 2 hrs. The amount of metal ions adsorbed by the SW adsorbent was 109
obtained by using the Equation 1, at different time intervals, 110 qt = (Co− Ct) Vm mg/g (1) 111
qt – Total amount of adsorbed metal ions by SW (mg/g) 112
Ct – Batch adsorption process and its concentration 113
The residuals were then collected from the conical flask and analyzed by Atomic Adsorption 114
Spectroscopy (AAS) to find out the percentage of metal ions (Cr, Pb & Zn) adsorbed by SW. To 115
obtain the concurrent value, each analysis was repeated for two times and the average value was 116
taken. The Equation 2 provides the percentage of adsorbed metal ions by SW. 117 % Removal = [Co− CeCo ] X100 (2) 118
Co & Ce – Initial and Equilibrium concentration of the solution 119
V – Solution’s volume 120
m – Adsorbent mass 121
6
2.4 Kinetic Studies – By varying the heavy metal ions and their concentrations (25 – 150 122
mg/L), the equilibrium studies were carried out at the pH level of 2.0 and 2 g/L of SW in 100 mL 123
solution. The solution was subjected to a rotary shaker for a period of 60 minutes at 120 rpm 124
speed by adopting 30C of temperature, followed by filtration using a Whattman filter paper. The 125
amount of metal ions adsorbed by SW in the equilibrium condition were calculated by using the 126
Equation 3. 127 qe = (Co− Ce) Vm mg/g (3) 128
C0 & Ce – Initial & equilibrium metal ion concentrations respectively (mg/L) 129
V – Volume of the metal ion solution 130
m – Mass of the adsorbent used 131
The following adsorption active models were utilized to examine the obtained data with 132
respect to the adsorption proficiency and the achievability of the scale up tasks. 133
2.4.1 Pseudo – First order kinetic model - Based on solid adsorption capacity, this 134
model, also known as the Lagergren kinetic rate model, was developed for the adsorption of 135
solid and liquid systems (Hammud et al, 2014). This represents the researchers' sole kinetic 136
model for solute adsorption from a liquid solution. According to the author's conclusion, the 137
driving force is exactly proportional to the total adsorption rate, i.e., the difference between the 138
initial and equilibrium adsorbate concentrations (qe − q). Equation 4 was used to express the 139
pseudo first order kinetic model: 140 𝑑𝑞𝑒𝑑𝑞𝑡 = 𝑘 (𝑞𝑒 − 𝑞𝑡) (4) 141
At the equilibrium, the total amount of metal ions adsorbed at time (t) was obtained by 142
calculating qe & qt, where K is the rate constant. Using the boundary layer conditions, the 143
Equation 4 can be rearranged as Equation 5. 144
log(𝑞𝑒 − 𝑞) = 𝑙𝑜𝑔𝑞𝑒 − 𝑘2.303 𝑡 (5) 145
2.4.2 Pseudo – Second order kinetic model - This kinetic analysis uses the second order 146
chemical adsorption process, with the assumption that the rate of adsorption is proportional to 147
the square of the number of empty sites (Prasanna Kumar et al, 2007). Equation 6 expresses the 148
pseudo second order kinetic equation. 149
7
𝑑𝑞𝑑𝑡 = 𝑘(𝑞𝑒 − 𝑞)2 (6) 150
By applying boundary conditions (t = 0 to t > 0, and q = 0 to q > 0), the Equation 6 can be 151
rearranged as Equation 7. 152
𝑡𝑞 = 1ℎ + 1𝑞𝑒 𝑡 (7) 153
where, h = kqe2 – Initial adsorption rate, and k – rate constant. A plot of t/qt vs. time at various 154
adsorption parameters provides a linear relationship, allowing the determination of 'qe', 'k' and 'h'. 155
2.4.3 Boyd kinetic model – The information found in the Boyd kinetic plot was utilized 156
to analyze the slowest step of adsorption process by the adsorbent (Sheika et al, 2007). The Boyd 157
kinetic equation is presented as Equation 8. 158
𝑞𝑡𝑞𝑒 = 1 − 6𝛱2 exp(−𝐵𝑡) = 𝐹 (8) 159
qt & qe – Total quantity of heavy metal ions adsorbed at time ‘t’ in the equilibrium (mg/g) 160
F – Fraction of metals adsorbed at any time ‘t’ 161
B – Mathematical function 162
Taking natural logarithm in Equation 8, it can be rearranged as Equation 9. 163 𝐵𝑡 = −0.4977 − ln(1 − 𝐹) (9) 164
To access the linearity of experimental data, the plot (Bt vs. t) was used. The Bt values were 165
used to calculate the effective diffusion coefficient, Di (m2/s), using the Equation 10. 166
𝐵 = 𝛱2 𝐷𝑖𝑟2 (10) 167
The effective diffusion coefficient (Di) & the radius of the adsorbent (r) were found using the 168
Equation 10. Moreover, based on the assumptions in sieve analysis, the radius of the adsorbent 169
particles was calculated. 170
2.5 Isotherm Studies - Adsorption isotherms provide a better knowledge of the connection 171
between the adsorbate and the adsorbent, which is vital for optimal adsorbent use. To optimize 172
the adsorption mechanism, accurate inferences must be drawn from the equilibrium plot (Olal et 173
al, 2016). The adsorption isotherm created as a result gives critical data for assessing production 174
in a large-scale industrial system. 175

8
2.5.1 Temkin isotherm study - According to this adsorption isotherm, the adsorption 176
strength of all molecules in the layer decreases linearly with distance due to indirect adsorbate / 177
adsorbent contact (Lucai et al, 2020). 178
The Equation 11 expresses the isotherm equation derived from Temkin studies. 179
𝑞𝑒𝑞 = 𝑅𝑇𝑏 ln 𝐾𝑇 + 𝑅𝑇𝑏 ln 𝐶𝑒 (11) 180
The binding constant at the equilibrium (KT), temperature (T), universal gas constant (R) and 181
adsorption heat constant (b) were used to find out the adsorbate equilibrium concentration (Ceq) 182
by Temkin isotherm studies. 183
2.5.2 D-R isotherm study – The homogeneity or potential sorption of the adsorption 184
process is not assumed, and the D-R (Dubinin – Radushkevich) equation is more analogous 185
compared to other isotherm studies. Equation 12 expresses the D-R character of the adsorption 186
process equation. 187 ln qe = ln xm − β €2 (12) 188
qe – Quantity of metal ions adsorbed in the equilibrium time 189
xm – Capacity of the adsorption in mg/g 190
2.5.3 Sips isotherm study - The Langmuir & Freundlich isotherm models were 191
combined to predict the process of adsorption in the heterogeneous sips isotherm system. The 192
sips model forecasts monolayer adsorption when the concentration of the solution is very high. 193
Also, the solution’s attention is completely avoided and follows the Langmuir model. The 194
expression for the sips isotherm model can be expressed in equation 13. 195
1𝑞𝑒 = 1𝑄𝑚𝑎𝑥𝐾𝑠 ( 1𝐶𝑒)1𝑛 + 1𝑄𝑚𝑎𝑥 (13) 196
Qmax & Ks – Adsorption capacity and equilibrium constant obtained from the slope and intercept 197
in linear plots & n - factor of heterogeneity lies between 0 to 1 198
3. RESULTS AND DISCUSSION 199
3.1 SEM/EDX Analysis 200
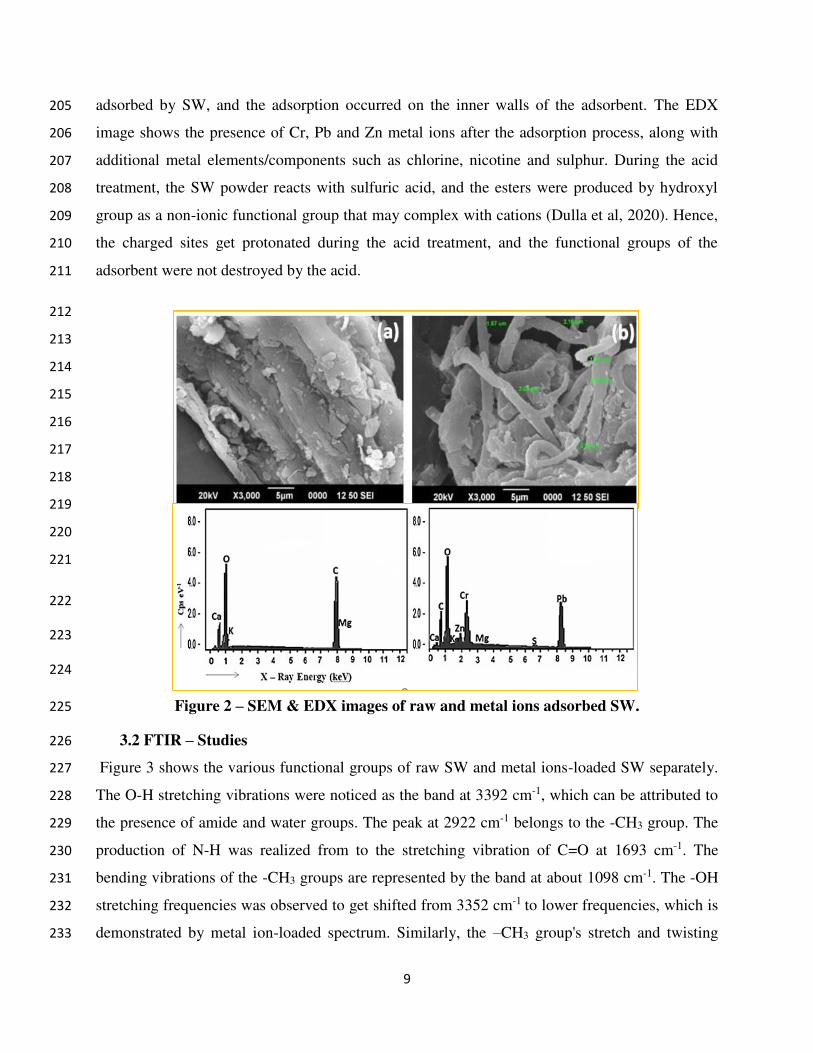
The surface of SW, before and after the adsorption of heavy metal ions (Cr, Pb and Zn), is shown 201
in Figure 2. Figure 2 (a) & (b) shows the presence of uneven holes on the surface of adsorbent, 202
and this was due to the sulfuric acid treatment that saturated the porous material surfaces on the 203
adsorbent. Figure 2 further shows that the chromium, lead and zinc ions are preferentially 204
9
adsorbed by SW, and the adsorption occurred on the inner walls of the adsorbent. The EDX 205
image shows the presence of Cr, Pb and Zn metal ions after the adsorption process, along with 206
additional metal elements/components such as chlorine, nicotine and sulphur. During the acid 207
treatment, the SW powder reacts with sulfuric acid, and the esters were produced by hydroxyl 208
group as a non-ionic functional group that may complex with cations (Dulla et al, 2020). Hence, 209
the charged sites get protonated during the acid treatment, and the functional groups of the 210
adsorbent were not destroyed by the acid. 211
212
213
214
215
216
217
218
219
220
221
222
223
224
Figure 2 – SEM & EDX images of raw and metal ions adsorbed SW. 225
3.2 FTIR – Studies 226
Figure 3 shows the various functional groups of raw SW and metal ions-loaded SW separately. 227
The O-H stretching vibrations were noticed as the band at 3392 cm-1, which can be attributed to 228
the presence of amide and water groups. The peak at 2922 cm-1 belongs to the -CH3 group. The 229
production of N-H was realized from to the stretching vibration of C=O at 1693 cm-1. The 230
bending vibrations of the -CH3 groups are represented by the band at about 1098 cm-1. The -OH 231
stretching frequencies was observed to get shifted from 3352 cm-1 to lower frequencies, which is 232
demonstrated by metal ion-loaded spectrum. Similarly, the –CH3 group's stretch and twisting 233

10
vibrations got moved to a lower frequency. This demonstrates metal ion binding onto the binding 234
sites of SW (Lahari et al, 2011). 235
236
237
238
239
240
241
242
243
244
245
Figure 3 – FT-IR image of (a) Raw and (b), (c) & (d) metal ions (Cr, Pb & Zn) loaded SW. 246
3.3 Effect of pH on metals adsorption - Adsorption tests were carried out at various pH levels 247
(2.0 to 7.0). Figure 4 shows that when the pH of the solution increased from 2.0 to 7.0, the 248
quantity of metal ion adsorption dropped from 99.6 to 63.4 % for Cr, 94.43 to 75.21 % for Pb, 249
and 91.2 to 82.63% for Zn. Due to the properties of protonation, the metal ion adsorption was 250
increased in the lower pH values. When the hydrogen ion concentration is high (at lower pH), the 251
negative charge of the internal pore surface was neutralized, and there arose the possibility of 252
development of new adsorption sites with positive charges that adsorbed the anionic complexes 253
(Cr, Pb and Zn) on the surface (Ghoneim et al, 2014). Furthermore, the starting pH of the 254
solution was always lower than the final pH. This supports the neutralization of negatively 255
charged ions that get drawn to the surface by the H+ ions, and the production of additional H+ 256
ions in the positively charged surface. As a result, the pH of the solution got increased, while and 257
the concentration of H+ ions in the solution got reduced. 258

11
3.4 Effect of SW concentration on metals adsorption - Figure 5 depicts the effect of SW’s 259
dosage on the adsorption of Cr, Pb and Zn metal ions. At an SW dosage of 1 g/L, the maximum 260
percentage removal of metal ions was determined to be 90.12 % for Cr, 96.01 % for Pb, and 261
81.53 % for Zn, and it was found to stay practically constant after thereafter. This occurring may 262
be attributed to a decrease in the aqueous solution's concentration gradient. The rise in 263
percentage adsorption with increasing adsorbent dosage may be attributed to an increase in free 264
surface accessibility, which produced an increase in the number of adsorbate molecules (Kumar 265
et al, 2019). The optimal SWs dosage was determined to be 1 g/L and was used in the subsequent 266
experiments. 267
2 3 4 5 6 7
60
65
70
75
80
85
90
95
100
% A
dso
rptio
n
pH
Cr (VI)
Pb (II)
Zn (II)
268
Figure 4 – Changes in metal ion adsorption by varying the pH. 269
0.5 1.0 1.5 2.0 2.5 3.0
40
50
60
70
80
90
100
% A
dso
rptio
n
Adsorbent Dose (mg/L)
Cr (VI)
Pb (II)
Zn (II)
270
Figure 5 - Changes in metal ion adsorption by varying the SW’s dose. 271

12
3.5 Effect of solution concentration on metal ions adsorption – Initially, the adsorption tests 272
were conducted by fixing the metal ion concentration at 25 mg/L, followed by an increase up to 273
150 mg/L. Figure 6 shows the gradual decrement in the efficiency of adsorption when the 274
concentration of metal ions was increased. The amount of metal ion adsorption was increased 275
from 64.26 to 98.63 % for Cr, 68.92 to 89.27 % for Pb, and 68.82 to 82.39 % for Zn, with a 276
decrease in the primary concentrations of the heavy metal ions. The percentage removal 277
efficiency was found to rise consistently when the adsorbate concentration was decreased, 278
showing that the adsorbent material did not achieve saturation (Bhagyalakshmi et al, 2016). 279
20 40 60 80 100 120 140 160
60
65
70
75
80
85
90
95
100
% A
dso
rptio
n
Adsorbate Concentration (mg/L)
Cr (VI)
Pb (II)
Zn (II)
280
Figure 6 - Changes in metal ion adsorption by varying the metal ion concentrations. 281
3.6 Effect of contact time on metals adsorption – The contact time in between the SW 282
adsorbent and heavy metal ions was adjusted from 10 min to 2 hrs., and the effects were studied 283
and represented in Figure 7. During the initial stages, the metal ion elimination was highly rapid, 284
while at later stages there were no significant changes. After 60 minutes, the metal ion uptake 285
reached the constant rate and there was no improvement in Cr, Pb and Zn metal adsorption. This 286
was because the adsorbate molecules faced saturation of their solid surfaces, leading to decrease 287
in the metal ion uptake after 60 min due to repulsive forces. Also, the passage of time resulted in 288
decrease in mass transfer between the solid and liquid phases, as the heavy metal ions need to 289
travel very long distances through the pores with very high concentration (Alguacil et al, 2020). 290
3.7 Effect of temperature on metals adsorption – Taking the concentration of heavy metal 291
ions as 50 mg/L, with 2.5 g/L of SW’s concentration, the impact of temperature was analyzed up 292
13
to 60 minutes. Initially, the percentage of adsorption rose up to 30C before gradually 293
decreasing. As a result, the optimal adsorption occurred at 30°C. The drop in percentage 294
adsorption at 45°C might be attributed to a rise in the desorption rate (Esameili et al, 2012). 295
Figure 8 shows the adsorption effectiveness of the adsorbents at various temperatures ranging 296
from 15 to 60 C. 297
3.8 Kinetic studies 298
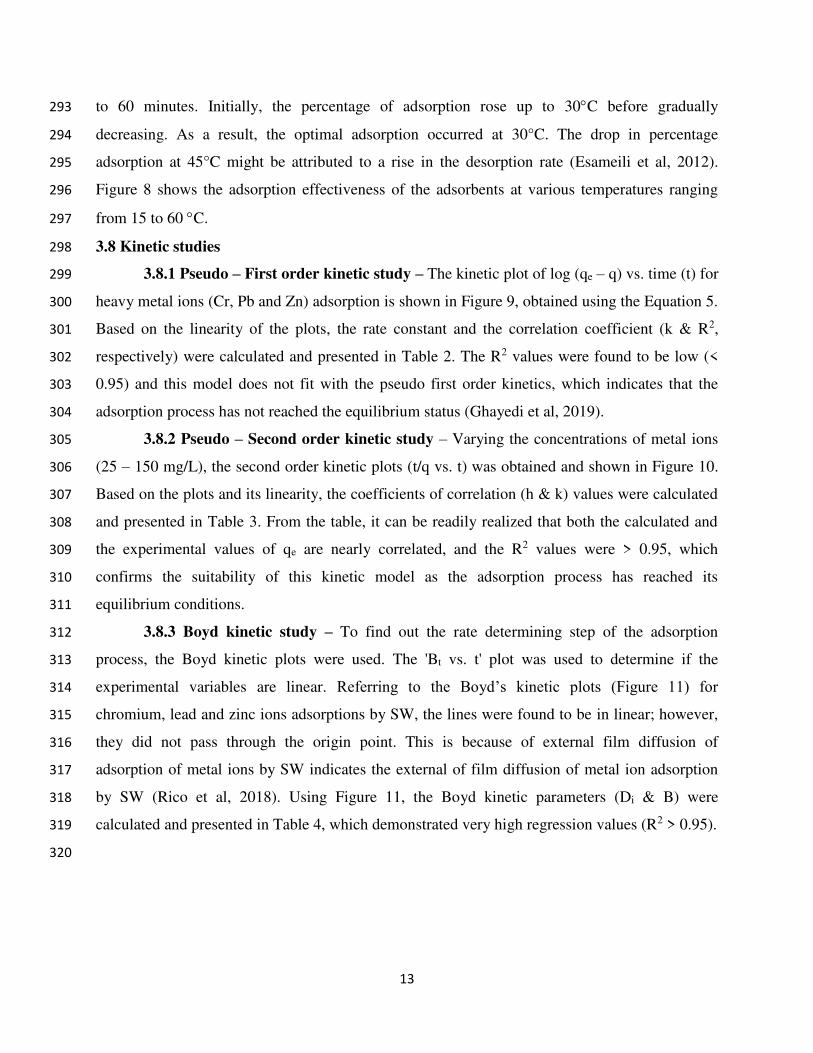
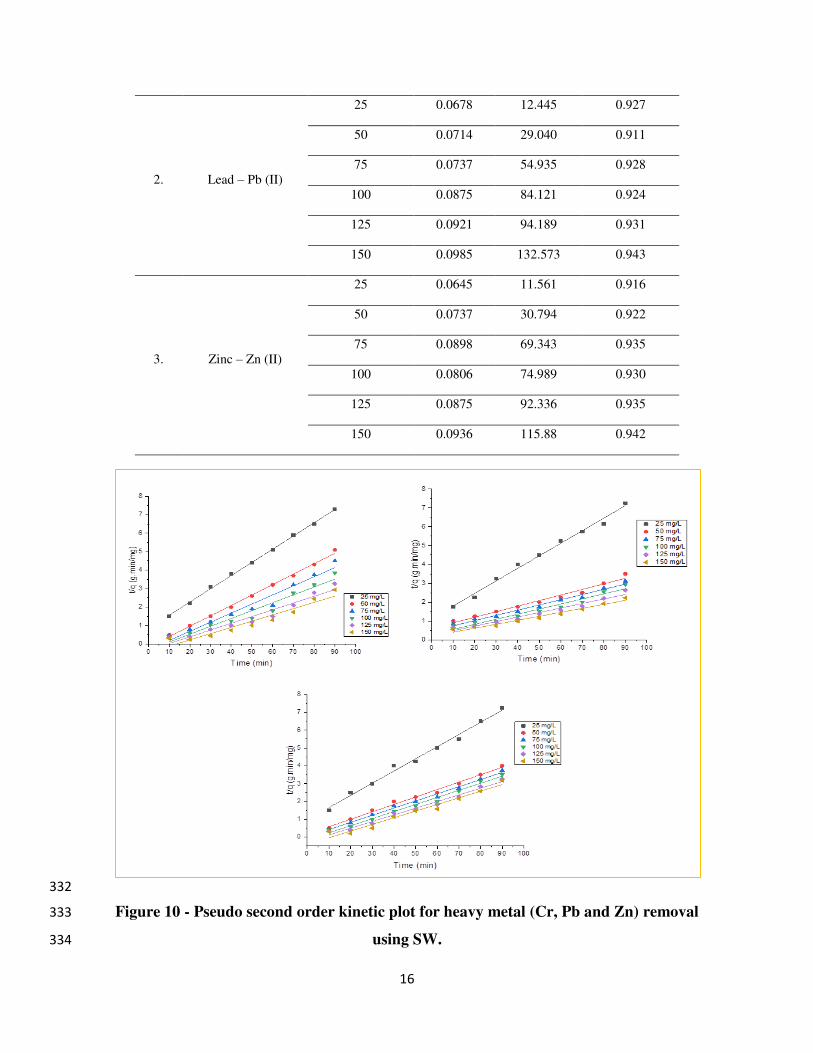
3.8.1 Pseudo – First order kinetic study – The kinetic plot of log (qe – q) vs. time (t) for 299
heavy metal ions (Cr, Pb and Zn) adsorption is shown in Figure 9, obtained using the Equation 5. 300
Based on the linearity of the plots, the rate constant and the correlation coefficient (k & R2, 301
respectively) were calculated and presented in Table 2. The R2 values were found to be low (< 302
0.95) and this model does not fit with the pseudo first order kinetics, which indicates that the 303
adsorption process has not reached the equilibrium status (Ghayedi et al, 2019). 304
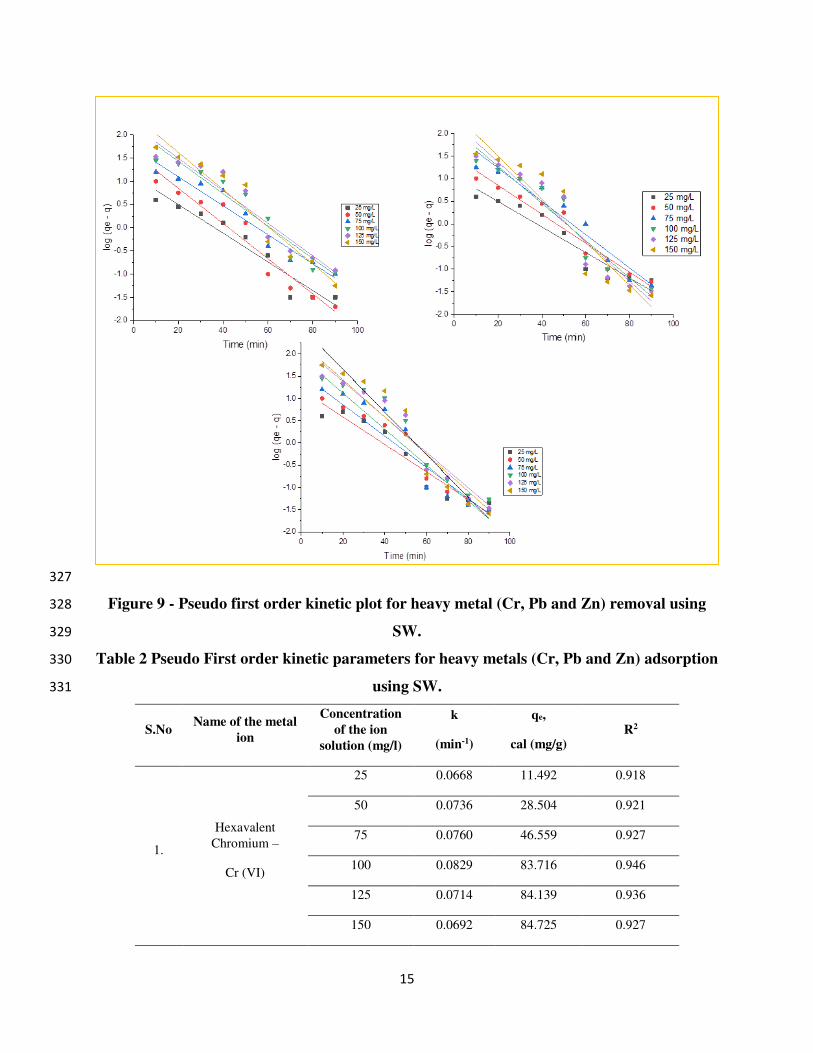
3.8.2 Pseudo – Second order kinetic study – Varying the concentrations of metal ions 305
(25 – 150 mg/L), the second order kinetic plots (t/q vs. t) was obtained and shown in Figure 10. 306
Based on the plots and its linearity, the coefficients of correlation (h & k) values were calculated 307
and presented in Table 3. From the table, it can be readily realized that both the calculated and 308
the experimental values of qe are nearly correlated, and the R2 values were > 0.95, which 309
confirms the suitability of this kinetic model as the adsorption process has reached its 310
equilibrium conditions. 311
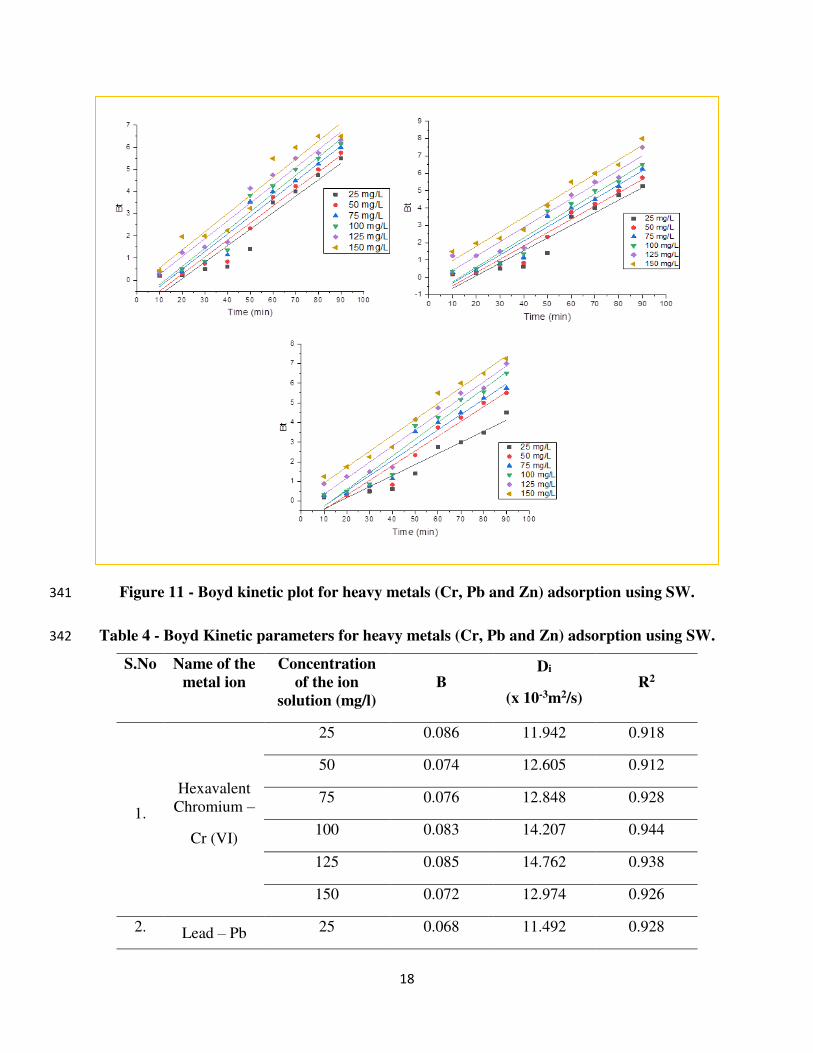
3.8.3 Boyd kinetic study – To find out the rate determining step of the adsorption 312
process, the Boyd kinetic plots were used. The 'Bt vs. t' plot was used to determine if the 313
experimental variables are linear. Referring to the Boyd’s kinetic plots (Figure 11) for 314
chromium, lead and zinc ions adsorptions by SW, the lines were found to be in linear; however, 315
they did not pass through the origin point. This is because of external film diffusion of 316
adsorption of metal ions by SW indicates the external of film diffusion of metal ion adsorption 317
by SW (Rico et al, 2018). Using Figure 11, the Boyd kinetic parameters (Di & B) were 318
calculated and presented in Table 4, which demonstrated very high regression values (R2 > 0.95). 319
320

14
321 322
Figure 7 - Changes in metal ion adsorption by varying the contact time. 323
324
10 20 30 40 50 60
70
75
80
85
90
% A
dso
rptio
n
Temperature
Cr (VI)
Pb (II)
Zn (II)
325
Figure 8 - Changes in metal ion adsorption by varying the temperature. 326
15
327
Figure 9 - Pseudo first order kinetic plot for heavy metal (Cr, Pb and Zn) removal using 328
SW. 329
Table 2 Pseudo First order kinetic parameters for heavy metals (Cr, Pb and Zn) adsorption 330
using SW. 331
S.No Name of the metal
ion
Concentration
of the ion
solution (mg/l)
k
(min-1)
qe,
cal (mg/g) R2
1.
Hexavalent
Chromium –
Cr (VI)
25 0.0668 11.492 0.918
50 0.0736 28.504 0.921
75 0.0760 46.559 0.927
100 0.0829 83.716 0.946
125 0.0714 84.139 0.936
150 0.0692 84.725 0.927
16
2. Lead – Pb (II)
25 0.0678 12.445 0.927
50 0.0714 29.040 0.911
75 0.0737 54.935 0.928
100 0.0875 84.121 0.924
125 0.0921 94.189 0.931
150 0.0985 132.573 0.943
3. Zinc – Zn (II)
25 0.0645 11.561 0.916
50 0.0737 30.794 0.922
75 0.0898 69.343 0.935
100 0.0806 74.989 0.930
125 0.0875 92.336 0.935
150 0.0936 115.88 0.942
332
Figure 10 - Pseudo second order kinetic plot for heavy metal (Cr, Pb and Zn) removal 333
using SW. 334

17
Table 3 - Pseudo – Second order kinetic parameters for heavy metals (Cr, Pb and Zn) 335
adsorption using SW. 336
S.No Name of the
metal ion
Concentration
of the ion
solution
(mg/L)
K
(g/mg.min)
X 10-3
qe,
cal
(mg/g)
h
(mg/g.min)
qe, exp
(mg/g)
R2
1.
Hexavalent
Chromium –
Cr (VI)
25 8.980 13.988 1.751 12.983 0.997
50 4.722 26.878 3.607 25.126 0.997
75 2.826 41.766 3.986 38.214 0.996
100 1.969 56.552 4.552 50.873 0.995
125 1.353 66.763 4.793 59.129 0.994
150 1.114 72.361 5.216 68.427 0.994
2. Lead – Pb (II)
25 7.763 13.968 1.522 12.840 0.997
50 3.600 26.513 2.778 24.450 0.997
75 2.870 38.642 3.623 36.892 0.979
100 1.530 51.235 4.617 48.711 0.969
125 0.949 62.458 4.655 59.122 0.994
150 0.782 72.357 4.925 68.458 0.994
3. Zinc – Zn (II)
25 8.186 13.514 1.495 12.631 0.975
50 4.250 25.641 2.466 24.221 0.976
75 2.522 37.307 3.640 35.015 0.964
100 1.478 52.363 4.908 47,234 0.965
125 1.258 66.672 5.392 59.286 0.972
150 1.009 73.314 4.484 67.194 0.964
337
338
339
340
18
Figure 11 - Boyd kinetic plot for heavy metals (Cr, Pb and Zn) adsorption using SW. 341
Table 4 - Boyd Kinetic parameters for heavy metals (Cr, Pb and Zn) adsorption using SW. 342
S.No Name of the
metal ion
Concentration
of the ion
solution (mg/l)
B Di
(x 10-3m2/s) R2
1.
Hexavalent
Chromium –
Cr (VI)
25 0.086 11.942 0.918
50 0.074 12.605 0.912
75 0.076 12.848 0.928
100 0.083 14.207 0.944
125 0.085 14.762 0.938
150 0.072 12.974 0.926
2. Lead – Pb 25 0.068 11.492 0.928
19
(II) 50 0.072 12.373 0.914
75 0.086 14.354 0.925
100 0.088 14.730 0.927
125 0.093 15.177 0.931
150 0.096 15.673 0.918
3. Zinc – Zn
(II)
25 0.066 10.895 0.912
50 0.072 12.605 0.922
75 0.090 15.120 0.936
100 0.083 14.782 0.930
125 0.088 13.520 0.935
150 0.094 12.834 0.918
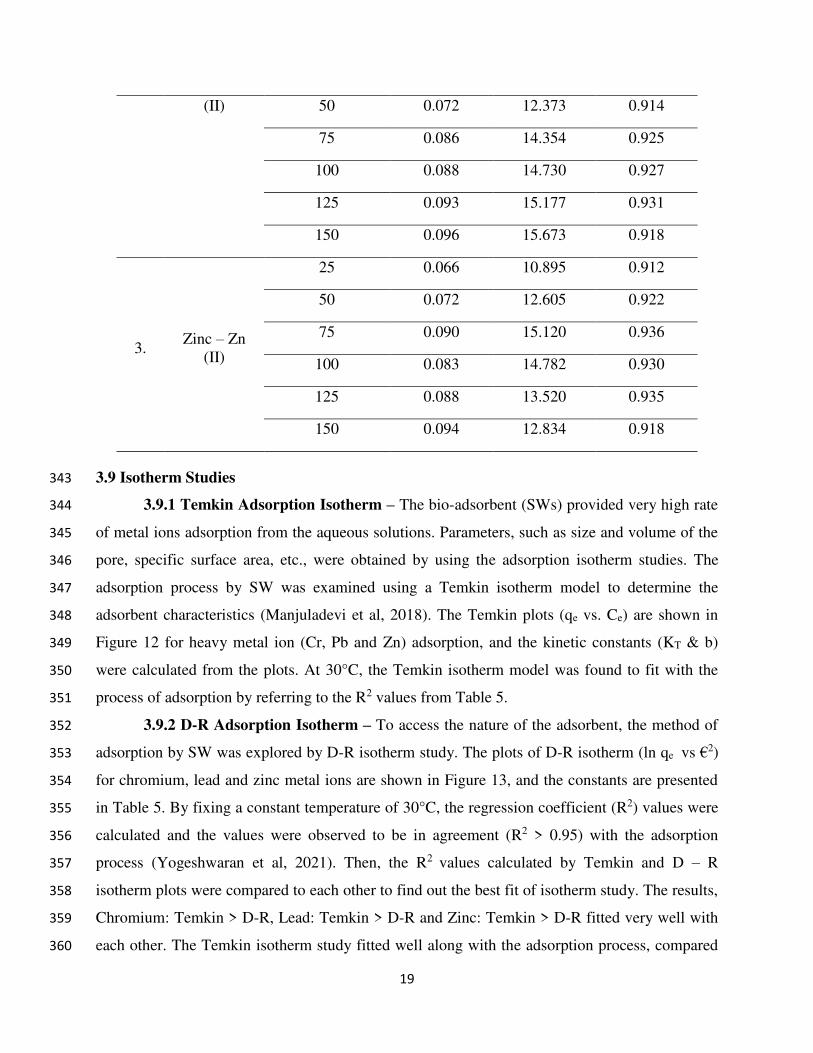
3.9 Isotherm Studies 343
3.9.1 Temkin Adsorption Isotherm – The bio-adsorbent (SWs) provided very high rate 344
of metal ions adsorption from the aqueous solutions. Parameters, such as size and volume of the 345
pore, specific surface area, etc., were obtained by using the adsorption isotherm studies. The 346
adsorption process by SW was examined using a Temkin isotherm model to determine the 347
adsorbent characteristics (Manjuladevi et al, 2018). The Temkin plots (qe vs. Ce) are shown in 348
Figure 12 for heavy metal ion (Cr, Pb and Zn) adsorption, and the kinetic constants (KT & b) 349
were calculated from the plots. At 30°C, the Temkin isotherm model was found to fit with the 350
process of adsorption by referring to the R2 values from Table 5. 351
3.9.2 D-R Adsorption Isotherm – To access the nature of the adsorbent, the method of 352
adsorption by SW was explored by D-R isotherm study. The plots of D-R isotherm (ln qe vs €2) 353
for chromium, lead and zinc metal ions are shown in Figure 13, and the constants are presented 354
in Table 5. By fixing a constant temperature of 30°C, the regression coefficient (R2) values were 355
calculated and the values were observed to be in agreement (R2 > 0.95) with the adsorption 356
process (Yogeshwaran et al, 2021). Then, the R2 values calculated by Temkin and D – R 357
isotherm plots were compared to each other to find out the best fit of isotherm study. The results, 358
Chromium: Temkin > D-R, Lead: Temkin > D-R and Zinc: Temkin > D-R fitted very well with 359
each other. The Temkin isotherm study fitted well along with the adsorption process, compared 360

20
to the D-R model, based on the obtained R2 values that indicated monolayer adsorption on the 361
SW surface. Nevertheless, the R2 values were in agreement with both the isotherms, which 362
followed monolayer & heterogeneous adsorption process (Pholosi et al, 2019). 363
364
Figure 12 - Temkin plot for the adsorption for heavy metals (Cr, Pb and Zn) using SW. 365
366
Figure 13 - D – R plot for the adsorption for heavy metals (Cr, Pb and Zn) using SW. 367
y = 0.3648x - 0.2348
R² = 0.9897
y = 0.4908x - 0.6172
R² = 0.9502
y = 0.4508x - 0.4672
R² = 0.9762
-0.4
-0.2
0
0.2
0.4
0.6
0.8
1
1.2
1.4
1.6
0 0.5 1 1.5 2 2.5 3 3.5 4 4.5
qe
(m
g g
-1)
ln Ce
Cr (VI) Pb (II) Zn (II)
y = 0.001x + 4.8212
R² = 0.9895
y = 0.0016x + 4.1747
R² = 0.9983
y = 0.0033x + 4.5574
R² = 0.993
0
5
10
15
20
25
0 1000 2000 3000 4000 5000 6000
ln q
e(m
g g
-1)
€2 (J2 mol-2)
Cr (VI) Pb (II) Zn (II)

21
3.9.3 Sips isotherm – The constants of the Sips model Qmax & Ks were obtained by taking slope 368
and deflection values from the kinetic linear plots of this model (Figure 14). The values of 369
constants and regression standards are represented in Table 5. The coefficient of regression (R2) 370
value is more than 0.95, which indicates the fitting process of dye adsorption. Based on the 371
heterogeneity factor (n) value, the model describes the nature of fitting, and the value of n lies 372
between 0 to 1. If the n value reaches 1, this equation reduces to the Langmuir equation, and it 373
infers the adsorption process in homogeneous nature. 374
375
Figure 14 - Sips plot for the adsorption for heavy metals (Cr, Pb and Zn) using SW. 376
Table 5 Isotherm constants for metal ion adsorption. 377
Type of
study
Metal ions
Parameters Units Cr Pb Zn
Temkin
KT (L mol-1) L/Mol 1.27 X 10⁷ 1.05 X 10⁵ 1.88 X 104
b x 10-6 J g mol-2 25.6 12.1 23.8
R2 - 0.989 0.965 0.956
Xm x 10-3 (mol/g) 4.15 4.65 3.76
y = 1.0532x - 3.8503
R² = 0.991
y = 1.3193x - 4.792
R² = 0.9599
y = 1.5729x - 5.114
R² = 0.9182
-8
-6
-4
-2
0
2
4
6
-1 0 1 2 3 4 5 6 7
ln [
qe
/(q
m -
qe
)]
ln Ce
Cr (VI) Pb (II) Zn (II)

22
D-R € KJ/mol 11.75 10.62 10.31
R2 - 0.989 0.950 0.976
Sips
KS bar-1 12.8689 6.13959 3.7113
βS mmol g-1 1.25346 1.54742 1.6536
aS - 0.47347 0.24345 0.1544
R2 - 0.9182 0.9599 0.9991
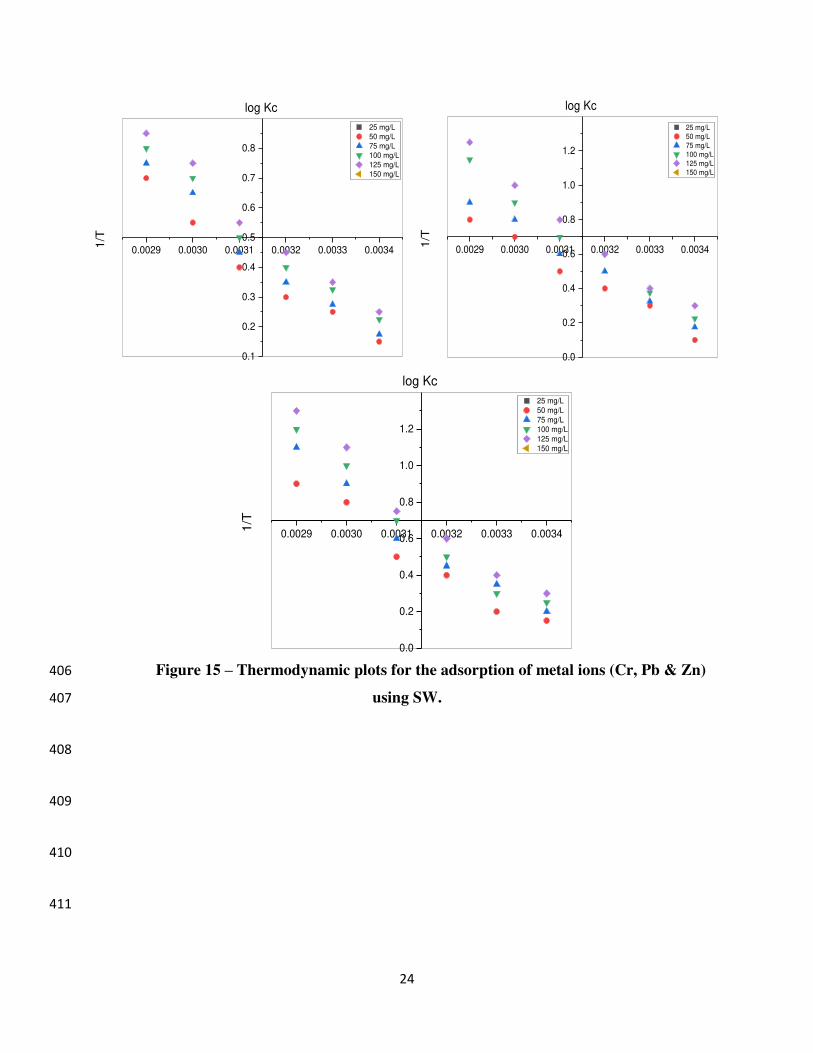
3.10 Thermodynamic studies on metal ion adsorption by SW 378
The removal efficiency of heavy metal ions by SW adsorbent was investigated under 379
different temperature conditions (15 to 60 °C). Referring to Figure 14, it was observed that the 380
metal ion adsorption and its efficiency were highly dependent on the temperature. The highest 381
metal ion adsorption by the adsorbent was recorded at 20°C, beyond that a sharp decrease in 382
adsorption efficiency was noticed. Due to the reduction of surface activity, the metal ion 383
adsorbent reached the exothermic state (Yang et al, 2018). The thermodynamic plots (log Kc vs. 384
1/T) of metal ion adsorption process are shown in Figure 15, and the slope & intercept values 385
(∆H° & ΔS°) were calculated and presented in Table 6 under different concentrations (25 - 150 386
mg/L) of metal ions. Due to the spontaneous nature of the adsorption process, the negative ΔH° 387
values with negative ΔG° values indicated the exothermic nature of the adsorption process 388
(Feszterová et al, 2021). Also, the ΔS° values suggested the increases in uncertainty during the 389
metal ion adsorption by SW in aqueous solutions. 390
3.11 Batch desorption study 391
The ability of the spent adsorbent (SWs) towards desorption of metal ions is directly 392
proportional to the desorption process (Momina et al, 2019). The batch desorption study was 393
carried out by varying the sulfuric acid concentrations from 0.1 to 0.4 N, and its impact on the 394
recovery of heavy metal ions is represented in Table 7. The maximum amount of recovery of 395
metal ions was determined by increasing the concentration of sulfuric acid. In this work, the total 396
amount of heavy metal ions and its recovery was achieved by adding 0.3 N of H2SO4, and 397
thereafter the metal ion recovery attained a constant rate. Further increase in the concentration of 398
H2SO4 was not found to increase the metal ion recovery from the spent SW. As a result, at 0.3 N 399

23
of H2SO4, the optimal level of desorption of metal ions from waste SW was achieved. 400
Furthermore, the SW was recovered and utilised as an adsorbent in subsequent adsorption tests. 401
Figure 14 – Impact of temperature of metal ions (Cr, Pb & Zn) adsorption using 402
SW. 403
404
405
20 30 40 50 60
75
80
85
90
95
% Cr (VI) Removal
Tem
pera
ture
25 mg/L
50 mg/L
75 mg/L
100 mg/L
125 mg/L
150 mg/L
20 30 40 50 60
80
82
84
86
88
90
92
94
96
98
% Pb (II) Removal
Tem
pe
ratu
re
25 mg/L
50 mg/L
75 mg/L
100 mg/L
125 mg/L
150 mg/L
20 30 40 50 60
75
80
85
90
95
% Zn (II) Removal
Tem
pera
ture
25 mg/L
50 mg/L
75 mg/L
100 mg/L
125 mg/L
150 mg/L
24
Figure 15 – Thermodynamic plots for the adsorption of metal ions (Cr, Pb & Zn) 406
using SW. 407
408
409
410
411
0.0029 0.0030 0.0031 0.0032 0.0033 0.0034
0.1
0.2
0.3
0.4
0.5
0.6
0.7
0.8
log Kc1/T
25 mg/L
50 mg/L
75 mg/L
100 mg/L
125 mg/L
150 mg/L
0.0029 0.0030 0.0031 0.0032 0.0033 0.0034
0.0
0.2
0.4
0.6
0.8
1.0
1.2
log Kc
1/T
25 mg/L
50 mg/L
75 mg/L
100 mg/L
125 mg/L
150 mg/L
0.0029 0.0030 0.0031 0.0032 0.0033 0.0034
0.0
0.2
0.4
0.6
0.8
1.0
1.2
log Kc
1/T
25 mg/L
50 mg/L
75 mg/L
100 mg/L
125 mg/L
150 mg/L

25
Table 6 Thermodynamic constants of the metal ion adsorption by SW. 412
Cr ion
(Initial Conc.)
∆H0
(KJ/mol)
∆S0
(J/mol/
∆Go (kJ/mol)
15C 30C 45C 60C
25 -83.38 222.52 -15.90 -10.82 -9.24 -8.24
50 -42.73 96.87 -11.31 -8.98 -7.45 -7.32
75 -26.45 61.28 -8.60 -7.45 -6.58 -6.15
100 -19.64 41.29 -6.69 -6.72 -6.19 -5.93
125 -16.82 32.35 -6.24 -6.12 -5.68 -5.28
150 -13.76 24.28 -5.45 -5.84 -5.12 -4.98
Pb ion
(Initial Conc.)
25 -56.24 143.77 -13.30 -11.15 -8.93 -8.13
50 -31.69 72.86 -9.02 -8.80 -7.47 -6.69
75 -26.44 56.98 -8.12 -6.90 -6.64 -5.51
100 -19.89 39.31 -7.62 -6.09 -5.38 -5.20
125 -15.49 21.83 -6.63 -5.44 -4.92 -4.69
150 -11.27 15.98 -5.57 -4.84 -4.52 -4.09
Zn ion
(Initial Conc.)
25 -40.02 99.09 -11.16 -9.29 -8.54 -7.31
50 -25.45 51.27 -9.01 -7.89 -7.02 -6.02
75 -19.92 40.51 -7.69 -6.32 -5.93 -5.29
100 -15.56 31.48 -6.24 -5.89 -5.05 -4.78
125 -13.29 28.92 -5.92 -5.02 -4.58 -4.22
150 -11.92 25.59 -5.01 -4.32 -4.10 -4.00
413
414

26
Table 7 Desorption of metal ions from the spent SW. 415
416
Initial
concentration
(25 mg/L)
Efficiency
of metal ion
removal
(%)
Concentration of H2SO4
0.10 N 0.20 N 0.30 N 0.40 N
% Desorption of metal ions
Cr 99.60 89.26 93.57 93.82 91.31
Pb 89.27 80.93 83.25 83.94 81.84
Zn 82.37 71.73 74.58 75.23 73.83
4. CONCLUSION 417
The removal efficiency of Chromium, Lead and Zinc metal ions present in aqueous 418
solutions was examined by utilizing Sargassum Wightii as an adsorbent. At a pH of 2.0, the 419
highest removal efficiency of 99.6 % (Cr), 89.27 % (Pb) and 82.39% (Zn) was achieved by using 420
the batch adsorption study. The ideal condition was found to be at an adsorbent dose level of 2.0 421
g/L, a contact period of 60 minutes, an initial adsorbate concentration of 25 mg/L and a 422
temperature of 30°C. The Temkin and D-R isotherm models suited the isotherm investigations 423
well, and the process followed the pseudo-second order and Boyd kinetic models. As a result, the 424
reported research infers Sargassum Wigtii's capacity to eliminate harmful metal ions from an 425
aqueous medium. 426
427
Author Contributions - All authors contributed to the experimental analysis, study conception. 428
Material preparation, analysis of data and content writing were performed by V. Yogeshwaran. 429
Draft preparation, corrections, validation of test results were performed by A.K. Priya. The two 430
authors read and approved the final manuscript. 431
Funding – Not Applicable 432
Data availability - The datasets generated during and/or analyzed during the current study are 433
available from the corresponding author on reasonable request. 434
Conflicts of Interests - The authors have no conflicts of interest to declare that are relevant to 435
the content of this article. 436
Ethics Approval – Not applicable 437
Consent to Participate/Publication – Not applicable 438

27
REFERENCES 439
A.K. Silva, L.G.L. Vaz, M.T. Veit, M.R. Fagundes-Klen, E.S. Cossich, C.R.G. Tavares, L. 440
Cardozo-Filho and R. Guirardello (2010). Biosorption of Chromium (III) and Copper (II) 441
Ions onto Marine Alga Sargassum sp. in a Fixed-bed Column, Adsorption Science and 442
Technology, 28 (5), 449 – 464. http://dx.doi.org/10.1260/0263-6174.28.5.449 443
Agnes Pholosi, Eliazar B. Naidoo and Augustine E. Ofomaja (2019). Intraparticle diffusion 444
of Cr (VI) through biomass and magnetite coated biomass: A comparative kinetic and 445
diffusion study, South African journal of chemical engineering, 32 -39 – 55. Doi: 446
https://doi.org/10.1016/j.sajce.2020.01.005. 447
Akbar Esameili, Betsabe Saremnia and Mona Kalantari (2015). Removal of mercury (II) 448
from aqueous solutions by biosorption on the biomass of sargassum glaucescens and 449
gracilaria corticata, Arabian Journal of Chemistry, 8 (4), 506 – 511. 450
https://doi.org/10.1016/j.arabjc.2012.01.008 451
Ali. A. Al – Homaidan, Hussein A. Al – Qahtani, Abdullah A. Al- Ghanayem, Fuad Ameen 452
and Ibraheem B.M. Ibraheem (2018). Potential use of green algae as a biosorbent for 453
hexavalent chromium removal from aqueous solutions, Saudi Journal of Biological Sciences, 454
25 (8), 1733 – 1738. https://doi.org/10.1016/j.sjbs.2018.07.011 455
Alina Roxana Lucai, Dumitru Bulgariu, Maria-Christina Popescu and Laura Bulgariu (2020). 456
Adsorption of Cu (II) ions on adsorbent materials obtained from marine red algae 457
callithamnion corymbosum sp. Water, 12 (372). http://dx.doi.org/10.3390/w12020372 458
Bich Ngoc Pham, Jin-Kyu Kang, Chang-Gu Lee and Seong-Jik Park (2021). Removal of 459
Heavy Metals (Cd2+, Cu2+, Ni2+, Pb2+) from Aqueous Solution Using Hizikia fusiformis 460
as an Algae-Based Bioadsorbent, Applied Sciences, 11, 8604. 461
https://doi.org/10.3390/app11188604 462
D. Sheika, I. Ashour and F.A. Abu Al-Rub (2007). Biosorption of zinc on immobilized green 463
algae: Equilibrium and thermodynamic studies, The Journal of Engineering Research, 5 (1), 464
20 – 29. https://journals.squ.edu.om/index.php/tjer/article/download/36/36/71 465
28
Dongxiao Ouyang, Yuting Zhuo, Liang Hu, Qiang Zeng, Yuehua Hu and Zhiguo He (2019). 466
Research on the adsorption behaviour of heavy metal ions by porous material prepared with 467
silicate tailings, Minerals, 9:291. 10.3390/min9050291 468
Douglus Onyancha, Ward Mavura, Catherine Ngila, Peter Ongoma and Joseph Chacha 469
(2008). Studies of chromium removal from tannery wastewaters by algae biosorbents, 470
Spirogyra condensata and Rhizoclonium hieroglyphicum, Journal of Hazardous Materials, 471
158 (2 – 3), 605 – 614. https://doi.org/10.1016/j.jhazmat.2008.02.043 472
Esmaeili Akbar, Ghasemi Samira and Zamani Fariba (2012). Investigation of chromium (VI) 473
adsorption by dried brown algae sargassum sp. and its activated carbon, Iranian Journal of 474
Chemistry and Chemical Engineering, 31 (4), 11 – 19. 475
https://www.ijcce.ac.ir/article_5915_f68d39256809ba632173faef4925c884.pdf 476
Francis Ongachi Olal (2016). Biosorption of selected heavy metals using green algae sp. 477
Journal of Natural Sciences Research, 6 (14), 22 – 34. 478
https://core.ac.uk/download/pdf/223128528.pdf 479
Francisco J. Alguacil and Felix A. Lopez (2020). Adsorption processing for the removal of 480
toxic Hg (II) from liquid effluents: Advances in the 2019 year, Metals, 10 (3). 481
https://doi.org/10.3390/met10030412 482
Hasan H. Hammud, Ali El-Shaar, Essam Khamis and El-Sayed Mansour (2014). Adsorption 483
studies of lead by enteromorpha algae and its silicates bonded material, Advances in 484
Chemistry, 2014, 205459. http://dx.doi.org/10.1155/2014/205459 485
Jakub Stefanik, Abhishek Dutta, Bram Verbinnen, Manisha Shakya and Eldon R. Rane 486
(2018). Selenium removal from mining and process wastewater. A systematic review of 487
available technologies, 67 (8), 903 – 918. https://doi.org/10.2166/aqua.2018.109 488
Jinyue Yang, Baohong Hou, Jing Wang, Beiqian Tian, Jingtao Bi, Na wang and Xin Li, Xin 489
Huang (2018). Nanomaterials for the removal of heavy metals from wastewater. 490
Nanomaterials, 9:424. https://www.mdpi.com/2079-4991/9/3/424 491

29
John Babu Dulla, Mohan Rao Tamana, Sumalatha Boddu, King Pulipati and Krupanidhi 492
Srirama (2020). Biosorption of copper (II) onto spent biomass of Gelidiella acerosa (brown 493
marine algae): optimization and kinetic studies, Applied Water Science, 10 (56). 494
https://doi.org/10.1007/s13201-019-1125-3 495
Li Ji, Shulian Xie, Jia Feng, Yanhui Li and Le Chen (2012). Heavy metal uptake capacities 496
by the common freshwater green alga Cladophora fracta, Journal of Applied Psychology, 24, 497
979 – 983. https://doi.org/10.1007/s10811-011-9721-0 498
M.G. Bhagyalakshmi and P.N. Sarma (2016). Biosorption of cadmium from aqueous 499
solutions using blue green algae, Nature Environment and Pollution Technology, 15 (2), 641 500
– 645. https://neptjournal.com/upload-images/NL-56-42-(42)B-3226.pdf 501
Mahendra Kumar, Alak Kumar Singh, Mohammad Sikardhar (2019). Biosorption of Hg (II) 502
from aqueous solution using algal biomass: Kinetics and isotherm studies, Heliyon, 6 (1), 503
e03321. https://doi.org/10.1016/j.heliyon.2020.e03321 504
Manjuladevi M, Anitha R and Manonmani S (2018). Kinetic study on adsorption of Cr (VI), 505
Ni (II), Cd (II) and Pb (II) ions from aqueous solutions using activated carbon prepared from 506
cucumis melo peel. Applied water science, 8 (36) (2018). https://doi.org/10.1007/s13201-507
018-0674-1. 508
Melánia Feszterová, Lýdia Porubcová and Anna Tirpáková (2021). The Monitoring of 509
Selected Heavy Metals Content and Bioavailability in the Soil-Plant System and Its Impact 510
on Sustainability in Agribusiness Food Chains, Sustainability, 13, 7021. 511
https://doi.org/10.3390/su13137021 512
Mohamed M. Ghoneim, Hanaa S. El – Dekosy, Khalid M. El-Moshelhy, Adel Amer, Emad 513
H. Abou El-Naga, Lamiaa I. Mohamedein and Ahmed E. Al-Prob (2014). Removal of 514
cadmium from aqueous solution using marine green algae- Ulva lactuca, The Egyptian 515
Journal of Aquatic Research, 40 (3), 235 – 242. https://doi.org/10.1016/j.ejar.2014.08.005 516
Momina, Mohd Rafatullah, Suzylawati Ismail and Anees Ahmed (2019). Optimization Study 517
for the Desorption of Methylene Blue Dye from Clay Based Adsorbent Coating, Water, 11, 518
1304. http://dx.doi.org/10.3390/w11061304 519

30
Narjes Ghayedi, Jaleh Mohajeri Borazjani and Dariush Jafari (2019). Biosorption of arsenic 520
ions from the aqueous solutions using chlorella vulgaris micro algae, Desalination and Water 521
Treatment, 165, 188 – 196. doi:10.5004/dwt.2019.24445 522
P. Indhumathi, P.S. Syed Shabudeen, U.S. Shoba and C.P. Saraswathy (2014). The removal 523
of chromium from aqueous solution by using green micro algae, Journal of Chemical and 524
Pharmaceutical Research, 6 (6), 799 – 808. https://www.jocpr.com/articles/the-removal-of-525
chromium-from-aqueous-solution-by-using-green-micro-algae.pdf 526
Parvin Molazadeh, Narges Khanjani, Mohammad Reza Rahmini and Alireza Nasiri (2015). 527
Adsorption of lead by micro algae chaetoceros sp. and chlorella sp. from aqueous solution, 528
Journal of Community Health Research, 4 (2), 114 – 127. 529
https://www.researchgate.net/publication/309154946_Adsorption_of_Lead_by_Microalgae_530
Chaetoceros_Sp_and_Chlorella_Sp_from_Aqueous_Solution 531
R.P. Suresh Jeyakumar and V. Chandrasekaran (2014). Adsorption of lead (II) ions by 532
activated carbons prepared from marine green algae: equilibrium and kinetic studies, 533
International Journal of Industrial Chemistry, 5 (10). https://doi.org/10.1007/s40090-014-534
0010-z 535
Rico I.L.R, Carrazana R.J.C and Karna N.K (2018). Modeling the mass transfer in 536
biosorption of Cr (VI) y Ni (II) by natural sugarcane bagasse. Applied Water Science, 8 (55). 537
https://doi.org/10.1007/s13201-018-0692-z 538
S. Beena Lahari, P. King and V.S.R.K. Prasad (2011). Biosorption of copper from aqueous 539
solution by chaetomorpha antennia algae biomass, Iranian Journal of Environmental Health 540
Science and Engineering, 8 (4), 353 – 362. 541
http://applications.emro.who.int/imemrf/Iran_J_Environ_Health_Sci_Eng/Iran_J_Environ_H542
ealth_Sci_Eng_2011_8_4_383_392.pdf 543
Sindy Gagneux-Moreaux, Richard P. Cosson, Paco Bustamante and Christophe Moreau 544
(2006). Growth and metal uptake of microalgae produced using salt groundwaters from the 545
Bay of Bourgneuf, Aquatic Living Resources, 19 (30), 247 – 255. 546
https://doi.org/10.1051/alr:2006025 547

31
V. Yogeshwaran and A.K. Priya (2021). Experimental studies on the removal of heavy metal 548
ion concentration using sugarcane bagasse in batch adsorption process, Desalination and 549
Water Treatment, 224, 256 – 272. 10.5004/dwt.2021.27160 550
Vinod K. Gupta, Arshi Rastogi and Arunima Nayak (2010). Biosorption of nickel onto 551
treated alga (Oedogonium hatei): Application of isotherm and kinetic models, Journal of 552
Colloid and Interface Science, 342 (2), 533 – 539. https://doi.org/10.1016/j.jcis.2009.10.074 553
Y. Prasanna Kumar, P. King and V.S.R.K. Prasad (2007). Adsorption of zinc from aqueous 554
solution using marine green algae – Ulva fasciata sp, Chemical Engineering Journal, 129 (1-555
3), 161 – 166. https://doi.org/10.1016/j.cej.2006.10.023 556
Related Documents