1821 wileyonlinelibrary.com © 2013 Wiley-VCH Verlag GmbH & Co. KGaA, Weinheim Biosensing Approaches for Rapid Genotoxicity and Cytotoxicity Assays upon Nanomaterial Exposure Xuena Zhu, Evangelia Hondroulis, Wenjun Liu, and Chen-zhong Li* 1. Introduction Significant progress in nanotechnology has promoted the development of industrial technology greatly in recent years. While on the other hand, the increased utilization of nano- materials could affect human health and the environment due to increased exposure. [1–3] For instance, metallic nanopar- ticles (NPs) are used increasingly in medicine and industry, as well as in various consumer products including personal care products, plastic paints, textiles, sunscreens, cosmetics, and food products. [4] Consequently, occupational or non- occupational exposure to metal NPs is growing. The current DOI: 10.1002/smll.201201593 The increased utilization of nanomaterials could affect human health and the environment due to increased exposure. Several mechanisms regarding the negative effects of nanomaterials have been proposed, one of the most discussed being oxidative stress. Many studies have shown that some metal oxide nanoparticles can enhance reactive oxygen species generation, inducing oxidative stress, DNA damage, and unregulated cell signaling, and eventually leading to changes in cell motility, apoptosis, and even carcinogenesis. 8-Hydroxy-2′-deoxyguanosine (8-OHdG) is one of the predominant forms of oxidative DNA damage, and has therefore been widely used as a biomarker for oxidative stress and carcinogenesis. Ther are two major objectives to this study. Firstly, the development of a novel lateral flow immunoassay (LFIA) is presented to measure the concentration of 8-OHdG in cells and thus reveal the nanotoxicity on the genomic level. The feasibility of this new method is validated by comparison with two other established methods: Alamar Blue assay and a recently developed electrical impedance sensing (EIS) system on the level of cell proliferation/ viability. Secondly, the toxicological effects of three metallic nanoparticles (CuO, CdO, and TiO 2 ) are investigated and compared using these three methods with completely different mechanisms. The results show that there is a high variation among different nanoparticles concerning their ability to cause toxic effects. CuO nanoparticles are the most potent regarding cytotoxicity and DNA damage. CdO shows a fallen cell viability as well as DNA damage, however, to a lesser extent than CuO nanoparticles. TiO 2 particles only cause very limited cytotoxicity, and there is no obvious increase in 8-OHdG levels. In conclusion, LFIA as well as the EIS system are useful methods for quantitative or qualitative nanotoxicity assessments with high sensitivity, specificity, speed of performance, and simplicity. Biosensors X. Zhu, E. Hondroulis, Prof. C.-z. Li Nanobioengineering/Bioelectronics Lab Department of Biomedical Engineering Florida International University 10555 West Flagler Street, Miami, FL 33174, USA E-mail: licz@fiu.edu Tel: (305) 348 0120 Fax: (305) 348 6954 W. Liu Department of Biochemistry and Molecular Biology University of Miami 1011 NW 15st, Miami, FL 33136, USA small 2013, 9, No. 9–10, 1821–1830

Welcome message from author
This document is posted to help you gain knowledge. Please leave a comment to let me know what you think about it! Share it to your friends and learn new things together.
Transcript
Biosensors
Biosensing Approaches for Rapid Genotoxicity and Cytotoxicity Assays upon Nanomaterial Exposure
Xuena Zhu , Evangelia Hondroulis , Wenjun Liu , and Chen-zhong Li *
© 2013 Wiley-VCH Verlag Gmb
DOI: 10.1002/smll.201201593
The increased utilization of nanomaterials could affect human health and the environment due to increased exposure. Several mechanisms regarding the negative effects of nanomaterials have been proposed, one of the most discussed being oxidative stress. Many studies have shown that some metal oxide nanoparticles can enhance reactive oxygen species generation, inducing oxidative stress, DNA damage, and unregulated cell signaling, and eventually leading to changes in cell motility, apoptosis, and even carcinogenesis. 8-Hydroxy-2′-deoxyguanosine (8-OHdG) is one of the predominant forms of oxidative DNA damage, and has therefore been widely used as a biomarker for oxidative stress and carcinogenesis. Ther are two major objectives to this study. Firstly, the development of a novel lateral fl ow immunoassay (LFIA) is presented to measure the concentration of 8-OHdG in cells and thus reveal the nanotoxicity on the genomic level. The feasibility of this new method is validated by comparison with two other established methods: Alamar Blue assay and a recently developed electrical impedance sensing (EIS) system on the level of cell proliferation/viability. Secondly, the toxicological effects of three metallic nanoparticles (CuO, CdO, and TiO 2 ) are investigated and compared using these three methods with completely different mechanisms. The results show that there is a high variation among different nanoparticles concerning their ability to cause toxic effects. CuO nanoparticles are the most potent regarding cytotoxicity and DNA damage. CdO shows a fallen cell viability as well as DNA damage, however, to a lesser extent than CuO nanoparticles. TiO 2 particles only cause very limited cytotoxicity, and there is no obvious increase in 8-OHdG levels. In conclusion, LFIA as well as the EIS system are useful methods for quantitative or qualitative nanotoxicity assessments with high sensitivity, specifi city, speed of performance, and simplicity.
X. Zhu, E. Hondroulis, Prof. C.-z. LiNanobioengineering/Bioelectronics LabDepartment of Biomedical EngineeringFlorida International University10555 West Flagler Street, Miami, FL 33174, USA E-mail: licz@fi u.eduTel: (305) 348 0120 Fax: (305) 348 6954
W. LiuDepartment of Biochemistry and Molecular BiologyUniversity of Miami1011 NW 15st, Miami, FL 33136, USA
small 2013, 9, No. 9–10, 1821–1830
1. Introduction
Signifi cant progress in nanotechnology has promoted the
development of industrial technology greatly in recent years.
While on the other hand, the increased utilization of nano-
materials could affect human health and the environment
due to increased exposure. [ 1–3 ] For instance, metallic nanopar-
ticles (NPs) are used increasingly in medicine and industry,
as well as in various consumer products including personal
care products, plastic paints, textiles, sunscreens, cosmetics,
and food products. [ 4 ] Consequently, occupational or non-
occupational exposure to metal NPs is growing. The current
1821wileyonlinelibrary.comH & Co. KGaA, Weinheim
X. Zhu et al.
182
full papers
knowledge is limited to the potential health effects caused bynanomaterials; however, it shows that they may cause adverse
effects at the routes of exposure such as skin, gastrointestinal
tract, and lung. [ 1 , 4 , 5 ] Furthermore, some nanomaterials made
of certain metals may have genotoxic or carcinogenic effects.
One of the mostly discussed mechanisms behind the health
effects induced by some metal oxide NPs is their ability to
enhance reactive oxygen species (ROS) generation causing
oxidative stress, DNA damage, [ 6–15 ] and unregulated cell sign-
aling, which eventually leads to change in cell motility, apop-
tosis, carcinogenesis etc. [ 16–18 ]
Therefore, characterization and reliable toxicity screening
tools are required for new and existing nanomaterials,
ensuring their compatibility for medical applications and
for the safety of the environment. There are a number of
different approaches that can be taken to assess the toxic
effects of NPs, which can be categorized into three classes
based on their objects of measurement. 1) Cell prolifera-
tion/viability assay, which is also called cytotoxicity measure-
ment in other publications, includes Trypan Blue assay, [ 8 , 19–22 ]
Alamar Blue assay, [ 8 , 20 , 23 ] Neutral Red assay, [ 24 , 25 ] lactate
dehydrogenase (LDH) assay, [ 8 , 19 , 20 , 26–29 ] Formazan-based
assays (MTT, MTS, WST), [ 8 , 19 , 20 , 24–26 , 28 , 29 ] and clonogenic
assay. [ 8 , 19 , 20 ] 2) Direct or indirect intracellular ROS meas-
urement, such as lipid peroxidation measurement, [ 8 , 19 , 20 , 23 , 30 ]
glutathione (GSH) assay, [ 8 , 20 , 23–25 , 28 , 31 ] electroparamagnetic
resonance (EPR) assay, [ 20 , 21 ] and 2,7-dichlorofl uorescin
(DCFH) assay. [ 8 , 20–25 , 28 , 31 ] 3) Assays on the genomic level, like
Comet assay, [ 8 , 19–22 , 25 , 27 , 29 , 32 ] and DNA damage biomarker
assay. [ 19 , 21 , 33 ] It is well-known that excessive generation of
ROS can oxidize cellular biomolecules. [ 7 ] Free radicals also
lead to oxidative modifi cations in DNA, including strand
breaks and base oxidation. Among oxidative DNA damage
products, 8-hydroxyguanine and its nucleoside 8-hydroxy-2′-deoxyguanosine (8-OHdG) are probably the most studied
due to their relative ease of measurement and pre-mutagenic
potential. [ 6 , 7 , 35 , 36 ] Evidence shows that 8-OHdG can give
rise to G-to-T transversion mutations in key genes known
to be involved in the development of cancer, [ 37 ] so elevated
8-OHdG levels have been noted in numerous tumors [ 7 , 35 ]
and thus is widely used as a biomarker for oxidative stress
and carcinogenesis. [ 38 ] Until now, the traditional methods for
8-OHdG quantitative analysis are high-performance liquid
chromatography (HPLC) with electrochemical detection
(ECD), [ 39 , 40 ] gas chromatography-mass spectrometry (GC-
MS), [ 41 ] HPLC tandem mass spectrometry, [ 42 , 43 ] and Enzyme-
linked Immunosorbent Assay (ELISA). [ 44 ] However, most of
the approaches mentioned above are time-consuming, expen-
sive, and require special techniques and equipments. There-
fore, there is an urgent need to develop simple, scalable,
inexpensive, and high throughput analytical tools capable of
mass screening in nanotoxicological investigations.
Herein, in this paper, we present two novel analytical
methods developed by our lab to investigate and compare
three well-studied particles (CuO, TiO 2 , CdO), regarding
their overall cytotoxicity and ability to cause DNA damage
on mouse epithelial cells (CCL-149). The toxicological effects
were measured by an electrical impedance sensing (EIS)
system, whose mechanism has been described by one of our
2 www.small-journal.com © 2013 Wiley-VCH Verlag Gm
previous studies. [ 34 ] The system measures the resistance pro-
duced by growing cell monolayers over electrodes and can
detect changes in resistance that may occur with changes in
the cell layer after NPs exposure, which is used for prolifera-
tion/viability assessment. Meanwhile, we demonstrate a novel
lateral fl ow immunoassay (LFIA) to measure the concentra-
tion of DNA damage biomarker (8-OHdG) and thus reveal
the nanotoxicity on the genomic level. LFIA, also known as
Immunochromatographic test strip, have been widely used as
in-fi eld and point-of-care diagnostic tools for testing cancer
biomarkers, [ 45–50 ] proteins, [ 51 ] drugs, [ 52–54 ] hormones, [ 55 ] and
metabolites in biomedical, [ 51 , 56–58 ] food and environmental
settings. The results show that different NPs with the similar
size and concentration present different toxic effects. EIS
system and LFIA strip provide useful methods for nanotox-
icity assessment with high sensitivity, simplicity and speed of
performance.
2. Results and Discussion
2.1. Characterization of NPs
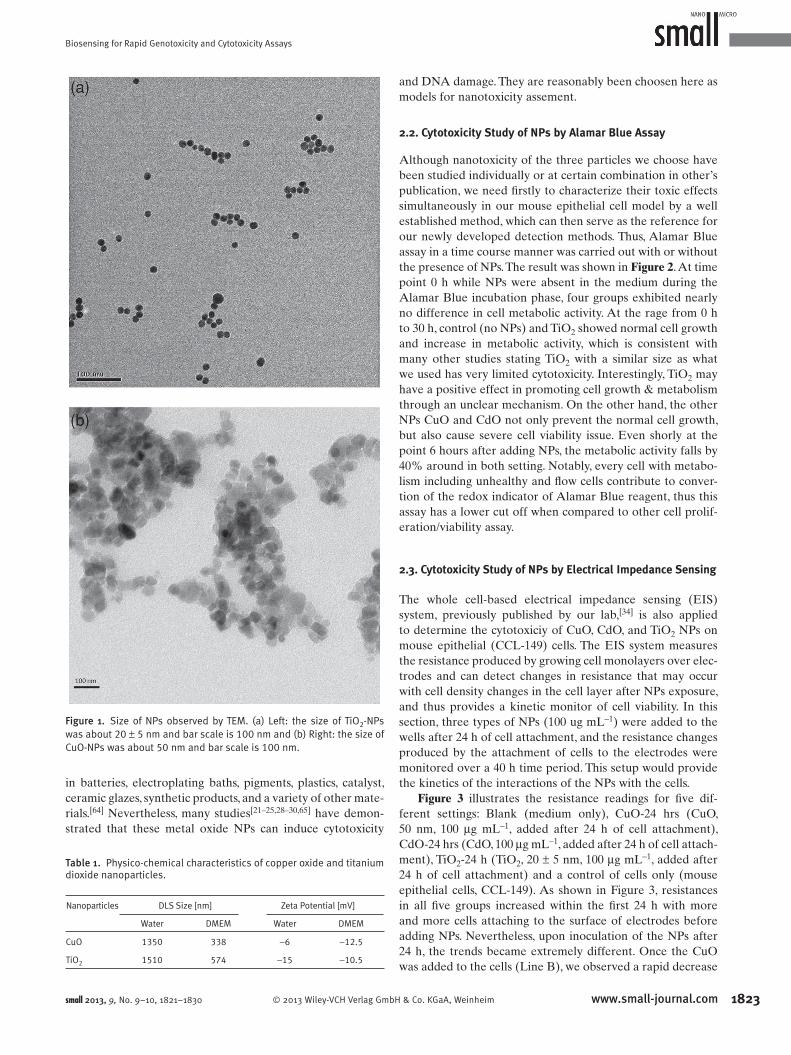
The primary sizes of the NPs were determined using Trans-
mission electron microscopy (TEM). As shown in Figure 1 ,
the size of nano-TiO 2 was about 20 ± 5 nm (panel a). The
nano-CuO had the size of about 50 nm (panel b). The size
was consistent with the data specifi ed by the manufacturer.
Furthermore, dynamic light scattering (DLS) was used to
characterize the behavior of the NPs, and the hydrodynamic
sizes and surface charges were measured using a Zetasizer in
a biological environment (i.e., DMEM cell culture medium).
The NPs were suspended in deionized water or DMEM for
analysis of their agglomerate sizes and zeta potential. The
size and surface charge characteristics of the NPs are sum-
marized in Table 1 . Zeta potential measurements revealed
that TiO 2 -NP had the surface charge ranging from −10.5 mV
(in medium) to -15 mV (in water), and the average particle
hydrodynamic diameter ranged from 574 nm (in medium) to
1510 nm (in water). CuO-NPs demonstrated mean agglom-
erate sizes ranging from 338 nm (in medium) to 1350 nm
(in water), and the surface charge ranged from −12.5 mV
(in medium) to −6 mV (in water). These differences in zeta
potential of TiO 2 and CuO-NPs can infl uence the particle
uptake as well as toxicological parameters like ROS genera-
tion and genomic damage. Particle size observed by DLS did
not coincide with the results obtained from the TEM. The
larger size of the NPs in the hydrodynamic state compared to
the size obtained by the TEM might be due to the tendency
of the NPs to aggregate in aqueous state. This fi nding is sup-
ported by other investigators. [ 28 , 59 , 60 ]
The three metal oxides used in this study are relevant NPs
types and are in widespread use in a number of consumer
products. CuO NPs are utilized in various applications such
as industrial catalysts, semiconductor devices, antimicrobial
preparations, heat transfer fl uids, and cosmetics. [ 23 , 61–63 ] TiO 2
NPs have excellent optical performance and electrical prop-
erties and are produced for applications in paints and coat-
ings and also in cosmetics as UV-absorbers. CdO can be used
bH & Co. KGaA, Weinheim small 2013, 9, No. 9–10, 1821–1830
Biosensing for Rapid Genotoxicity and Cytotoxicity Assays
Figure 1 . Size of NPs observed by TEM. (a) Left: the size of TiO 2 -NPs was about 20 ± 5 nm and bar scale is 100 nm and (b) Right: the size of CuO-NPs was about 50 nm and bar scale is 100 nm.
in batteries, electroplating baths, pigments, plastics, catalyst,
ceramic glazes, synthetic products, and a variety of other mate-
rials. [ 64 ] Nevertheless, many studies [ 21–25 , 28–30 , 65 ] have demon-
strated that these metal oxide NPs can induce cytotoxicity
© 2013 Wiley-VCH Verlag Gm
Table 1. Physico-chemical characteristics of copper oxide and titanium dioxide nanoparticles .
Nanoparticles DLS Size [nm] Zeta Potential [mV]
Water DMEM Water DMEM
CuO 1350 338 −6 −12.5
TiO 2 1510 574 −15 −10.5
small 2013, 9, No. 9–10, 1821–1830
and DNA damage. They are reasonably been choosen here as
models for nanotoxicity assement.
2.2. Cytotoxicity Study of NPs by Alamar Blue Assay
Although nanotoxicity of the three particles we choose have
been studied individually or at certain combination in other’s
publication, we need fi rstly to characterize their toxic effects
simultaneously in our mouse epithelial cell model by a well
established method, which can then serve as the reference for
our newly developed detection methods. Thus, Alamar Blue
assay in a time course manner was carried out with or without
the presence of NPs. The result was shown in Figure 2 . At time
point 0 h while NPs were absent in the medium during the
Alamar Blue incubation phase, four groups exhibited nearly
no difference in cell metabolic activity. At the rage from 0 h
to 30 h, control (no NPs) and TiO 2 showed normal cell growth
and increase in metabolic activity, which is consistent with
many other studies stating TiO 2 with a similar size as what
we used has very limited cytotoxicity. Interestingly, TiO 2 may
have a positive effect in promoting cell growth & metabolism
through an unclear mechanism. On the other hand, the other
NPs CuO and CdO not only prevent the normal cell growth,
but also cause severe cell viability issue. Even shorly at the
point 6 hours after adding NPs, the metabolic activity falls by
40% around in both setting. Notably, every cell with metabo-
lism including unhealthy and fl ow cells contribute to conver-
tion of the redox indicator of Alamar Blue reagent, thus this
assay has a lower cut off when compared to other cell prolif-
eration/viability assay.
2.3. Cytotoxicity Study of NPs by Electrical Impedance Sensing
The whole cell-based electrical impedance sensing (EIS)
system, previously published by our lab, [ 34 ] is also applied
to determine the cytotoxiciy of CuO, CdO, and TiO 2 NPs on
mouse epithelial (CCL-149) cells. The EIS system measures
the resistance produced by growing cell monolayers over elec-
trodes and can detect changes in resistance that may occur
with cell density changes in the cell layer after NPs exposure,
and thus provides a kinetic monitor of cell viability. In this
section, three types of NPs (100 ug mL − 1 ) were added to the
wells after 24 h of cell attachment, and the resistance changes
produced by the attachment of cells to the electrodes were
monitored over a 40 h time period. This setup would provide
the kinetics of the interactions of the NPs with the cells.
Figure 3 illustrates the resistance readings for fi ve dif-
ferent settings: Blank (medium only), CuO-24 hrs (CuO,
50 nm, 100 μ g mL − 1 , added after 24 h of cell attachment),
CdO-24 hrs (CdO, 100 μ g mL − 1 , added after 24 h of cell attach-
ment), TiO 2 -24 h (TiO 2 , 20 ± 5 nm, 100 μ g mL − 1 , added after
24 h of cell attachment) and a control of cells only (mouse
epithelial cells, CCL-149). As shown in Figure 3 , resistances
in all fi ve groups increased within the fi rst 24 h with more
and more cells attaching to the surface of electrodes before
adding NPs. Nevertheless, upon inoculation of the NPs after
24 h, the trends became extremely different. Once the CuO
was added to the cells (Line B), we observed a rapid decrease
1823www.small-journal.combH & Co. KGaA, Weinheim

X. Zhu et al.
1824 www.small-journal.com
full papers
© 2013 Wiley-VCH Verlag GmbH & Co. KGaA, Weinhe
Figure 2 . Alamar Blue assay for CuO, CdO, and TiO 2 on CCL-149. Lines A represent the Cells only (cells with medium only). CuO (line B), CdO (line C), and TiO 2 (line D) are added at the initial time point.
0.00
0.50
1.00
1.50
2.00
2.50
0 6 12 30
Re
lati
ve
me
tab
olic
ac
itiv
ty
Time points when measurements are taken/hour
No NPs (Line A) CuO (Line B)
CdO (Line C) TiO2 (Line D)
Scheme 1 . Mechanism of competitive lateral fl ow immunoassay for 8-OHdG testing.
Figure 3 . Resistance readings for CuO, CdO and TiO 2 on CCL-149. Lines A and E represent the cells only (cells with medium only) and Blank (medium only) resistance readings. CuO (line B), CdO (line C), and TiO 2 (line D) are added after 24 h of cell attachment.
1000
2000
3000
4000
5000
6000
0 5 10 15 20 25 30 35 40
Re
sis
tan
ce [
oh
ms
]
Time [hrs]
Cells only (Line A)CuO-24 hrs (Line B)CdO-24 hrs (Line C)TiO2-24 hrsl (Line D)
in the resistance values measured, eventu-
ally returning to readings similar to the
blank (Line E), indicating cell detachment
and the harsh cytotoxic effect of CuO
towards the CCL-149, and being consistant
with the results onbtained by Alamar
Blue assay. The cytotoxic measurements
of TiO 2 NPs towards the CCL-149 (Line
D) showed slight difference in resistance
values to those observed for the control
(Line A). From this observation, it is evi-
dent that TiO 2 NPs (25 nm) have fewer
cytotoxic effects on the cells compared to
the CuO NPs (50 nm) with the same con-
centration (100 ug mL − 1 ) and similar size,
which is also comparable with the results
got from Alamar Blue assay. When cells
were exposed to CdO, noticeable changes
in resistance (Line C) were observed com-
pared to the control (Line A), which is
consistent with the fact that it is extremely
toxic and affects the growth mechanism of
the cells given by Alamar Blue assay. CdO
was used here as a negative control and
employed to demonstrate the ability of the
EIS system. Cadmium is a toxic material
that has been shown to cause lysosomal
damage and DNA breakage in mamma-
lian cells and disrupt mitochondrial func-
tion and promote apoptosis. [ 65 ] However,
the value decreased slowly compared to
the CuO NPs (Line B), indicating a slower
detachment rate of the cells. The observed
phenomena may be attributed to the fact
that the smaller NPs (CuO, 50 nm) can
enter the cell and damage the cells more
easily.
2.4. Genotoxicity Assessment by Oxidative DNA Damage Biomarker
2.4.1. Principle of the Genotoxicity Assessment by Lateral Flow Strip
The principle of the immuno strip based
on the specifi c immunoreactions occur-
ring between the antibodies and the DNA
damage biomarker (8-OHdG) has been
illustrated in Scheme 1 . Generally, there
are two types of formats for strip testing,
named non-competitive and competi-
tive. The competitive format is used when
testing small molecules with single anti-
genic determinants, which cannot bind
to two antibodies simultaneously. If this
format is chosen, the analytes in the sample
will compete with the antigen immobilized
on the test line for the antibody from
im small 2013, 9, No. 9–10, 1821–1830
Biosensing for Rapid Genotoxicity and Cytotoxicity Assays
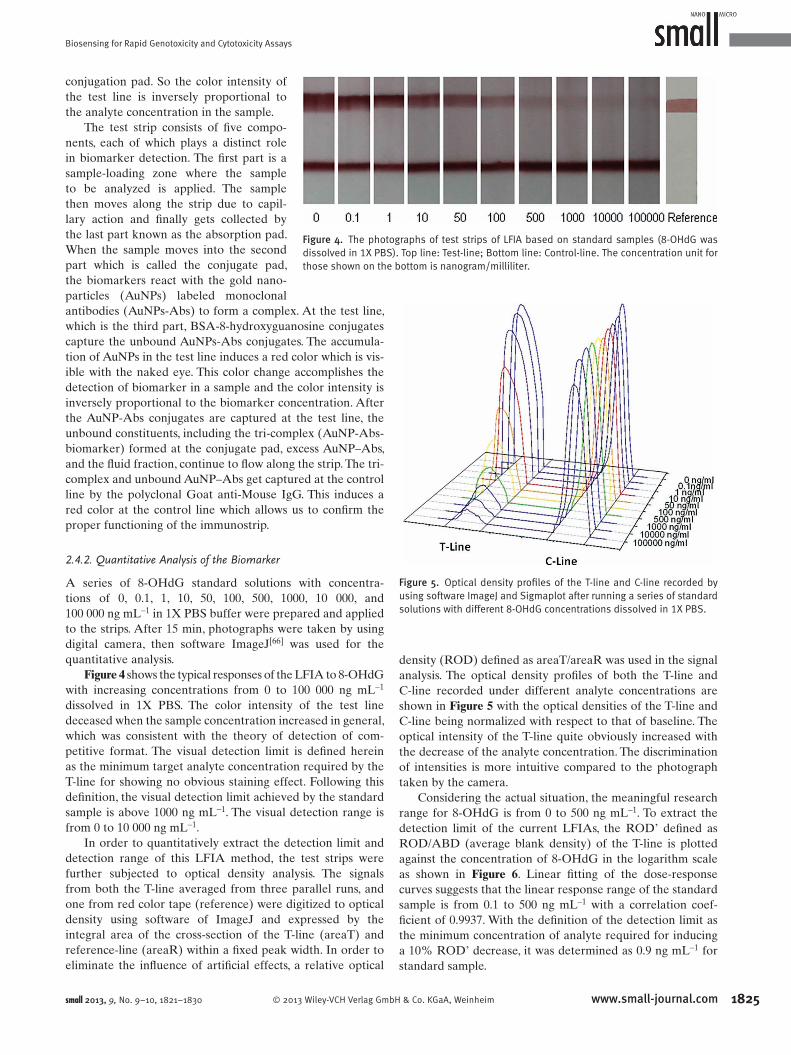
Figure 4 . The photographs of test strips of LFIA based on standard samples (8-OHdG was dissolved in 1X PBS). Top line: Test-line; Bottom line: Control-line. The concentration unit for those shown on the bottom is nanogram/milliliter.
conjugation pad. So the color intensity of
the test line is inversely proportional to
the analyte concentration in the sample.
The test strip consists of fi ve compo-
nents, each of which plays a distinct role
in biomarker detection. The fi rst part is a
sample-loading zone where the sample
to be analyzed is applied. The sample
then moves along the strip due to capil-
lary action and fi nally gets collected by
the last part known as the absorption pad.
When the sample moves into the second
part which is called the conjugate pad,
the biomarkers react with the gold nano-
particles (AuNPs) labeled monoclonal
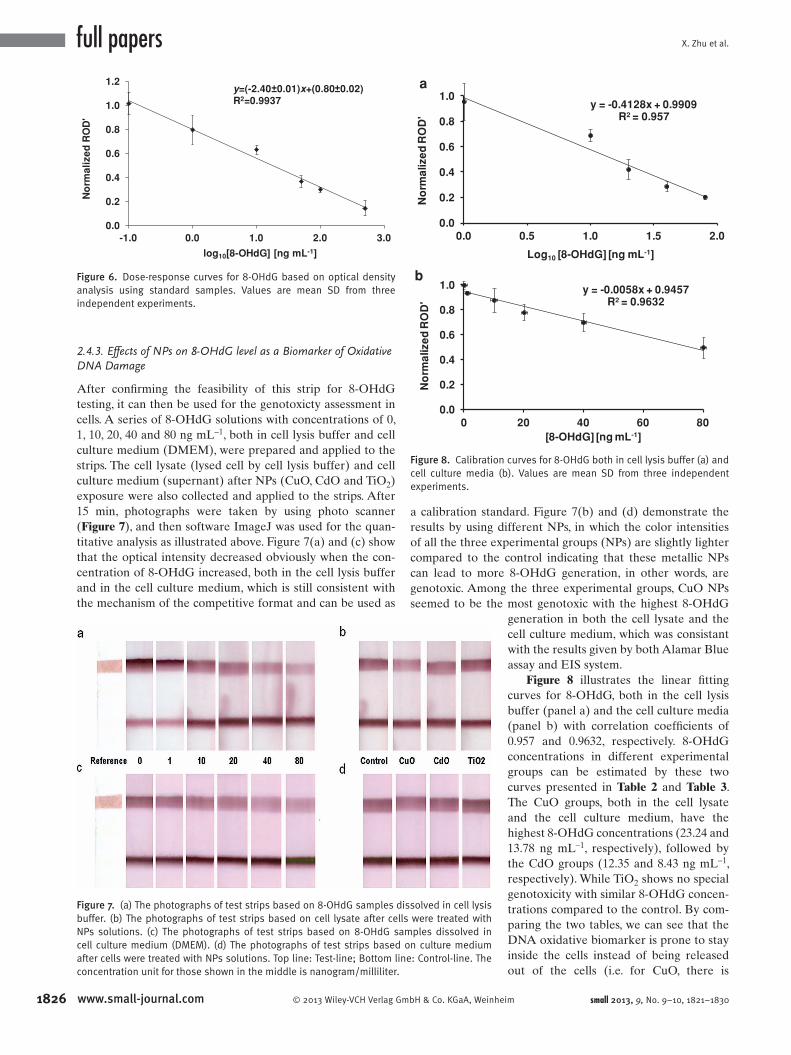
Figure 5 . Optical density profi les of the T-line and C-line recorded by using software ImageJ and Sigmaplot after running a series of standard solutions with different 8-OHdG concentrations dissolved in 1X PBS.
antibodies (AuNPs-Abs) to form a complex. At the test line,
which is the third part, BSA-8-hydroxyguanosine conjugates
capture the unbound AuNPs-Abs conjugates. The accumula-
tion of AuNPs in the test line induces a red color which is vis-
ible with the naked eye. This color change accomplishes the
detection of biomarker in a sample and the color intensity is
inversely proportional to the biomarker concentration. After
the AuNP-Abs conjugates are captured at the test line, the
unbound constituents, including the tri-complex (AuNP-Abs-
biomarker) formed at the conjugate pad, excess AuNP–Abs,
and the fl uid fraction, continue to fl ow along the strip. The tri-
complex and unbound AuNP–Abs get captured at the control
line by the polyclonal Goat anti-Mouse IgG. This induces a
red color at the control line which allows us to confi rm the
proper functioning of the immunostrip.
2.4.2. Quantitative Analysis of the Biomarker
A series of 8-OHdG standard solutions with concentra-
tions of 0, 0.1, 1, 10, 50, 100, 500, 1000, 10 000, and
100 000 ng mL − 1 in 1X PBS buffer were prepared and applied
to the strips. After 15 min, photographs were taken by using
digital camera, then software ImageJ [ 66 ] was used for the
quantitative analysis.
Figure 4 shows the typical responses of the LFIA to 8-OHdG
with increasing concentrations from 0 to 100 000 ng mL − 1
dissolved in 1X PBS. The color intensity of the test line
deceased when the sample concentration increased in general,
which was consistent with the theory of detection of com-
petitive format. The visual detection limit is defi ned herein
as the minimum target analyte concentration required by the
T-line for showing no obvious staining effect. Following this
defi nition, the visual detection limit achieved by the standard
sample is above 1000 ng mL − 1 . The visual detection range is
from 0 to 10 000 ng mL − 1 .
In order to quantitatively extract the detection limit and
detection range of this LFIA method, the test strips were
further subjected to optical density analysis. The signals
from both the T-line averaged from three parallel runs, and
one from red color tape (reference) were digitized to optical
density using software of ImageJ and expressed by the
integral area of the cross-section of the T-line (areaT) and
reference-line (areaR) within a fi xed peak width. In order to
eliminate the infl uence of artifi cial effects, a relative optical
© 2013 Wiley-VCH Verlag Gmbsmall 2013, 9, No. 9–10, 1821–1830
density (ROD) defi ned as areaT/areaR was used in the signal
analysis. The optical density profi les of both the T-line and
C-line recorded under different analyte concentrations are
shown in Figure 5 with the optical densities of the T-line and
C-line being normalized with respect to that of baseline. The
optical intensity of the T-line quite obviously increased with
the decrease of the analyte concentration. The discrimination
of intensities is more intuitive compared to the photograph
taken by the camera.
Considering the actual situation, the meaningful research
range for 8-OHdG is from 0 to 500 ng mL − 1 . To extract the
detection limit of the current LFIAs, the ROD’ defi ned as
ROD/ABD (average blank density) of the T-line is plotted
against the concentration of 8-OHdG in the logarithm scale
as shown in Figure 6 . Linear fi tting of the dose-response
curves suggests that the linear response range of the standard
sample is from 0.1 to 500 ng mL − 1 with a correlation coef-
fi cient of 0.9937. With the defi nition of the detection limit as
the minimum concentration of analyte required for inducing
a 10% ROD’ decrease, it was determined as 0.9 ng mL − 1 for
standard sample.
1825www.small-journal.comH & Co. KGaA, Weinheim
X. Zhu et al.
1826
full papers
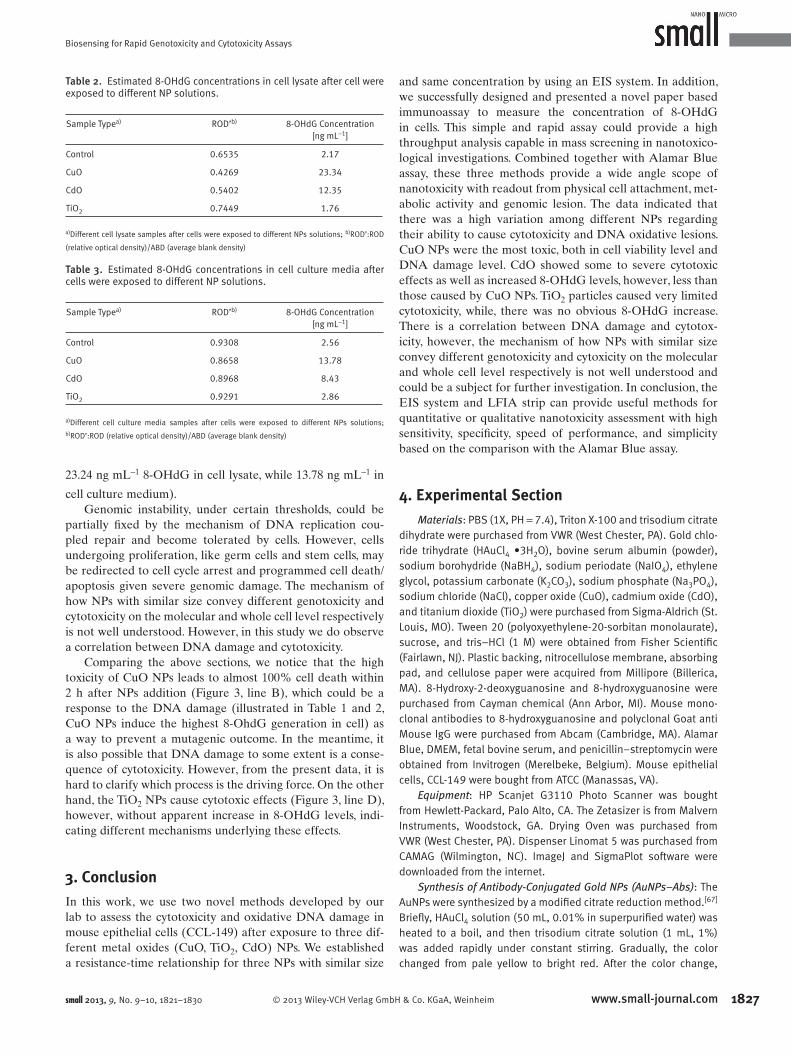
Figure 6 . Dose-response curves for 8-OHdG based on optical density analysis using standard samples. Values are mean SD from three independent experiments.
0.0
0.2
0.4
0.6
0.8
1.0
1.2
-1.0 0.0 1.0 2.0 3.0
log10[8-OHdG] [ng mL-1]
No
rma
lize
d R
OD
'y=(-2.40±0.01)x+(0.80±0.02)R2=0.9937
Figure 8 . Calibration curves for 8-OHdG both in cell lysis buffer (a) and cell culture media (b). Values are mean SD from three independent experiments.
y = -0.4128x + 0.9909R² = 0.957
0.0
0.2
0.4
0.6
0.8
1.0
0.0 0.5 1.0 1.5 2.0
No
rma
lize
d R
OD
'
Log10 [8-OHdG] [ng mL-1]
a
y = -0.0058x + 0.9457R² = 0.9632
0.0
0.2
0.4
0.6
0.8
1.0
0 20 40 60 80N
orm
alize
d R
OD
'
[8-OHdG] [ng mL-1]
b
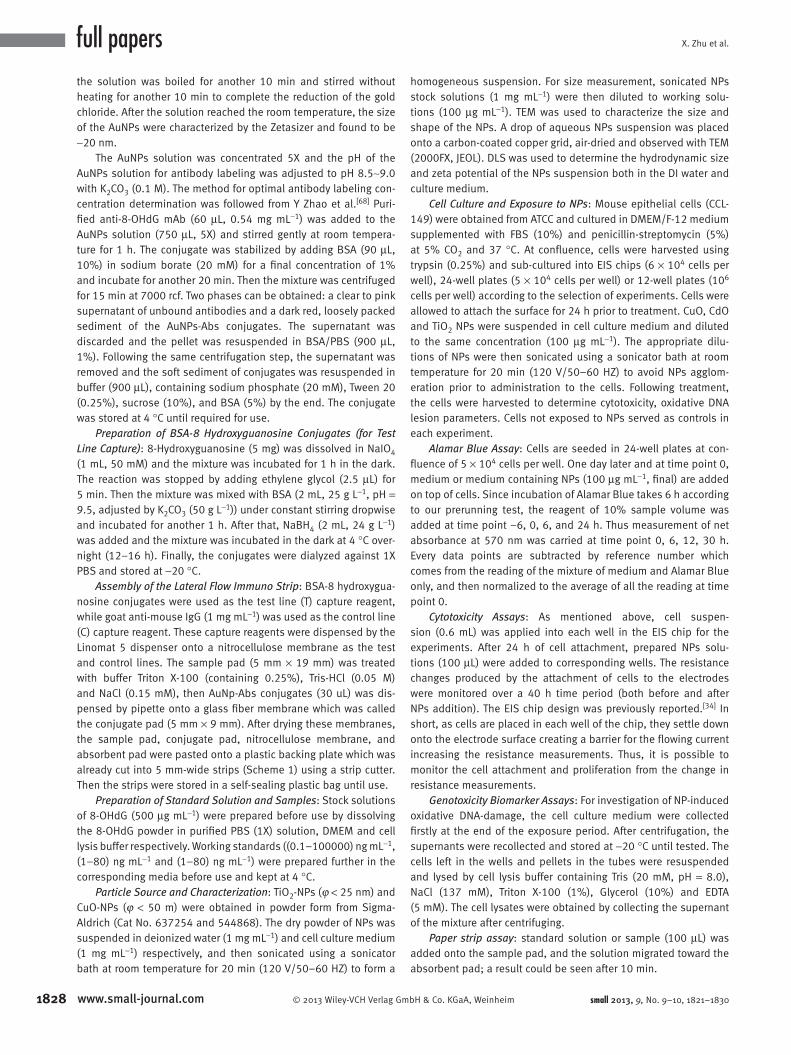
2.4.3. Effects of NPs on 8-OHdG level as a Biomarker of Oxidative DNA Damage
After confi rming the feasibility of this strip for 8-OHdG
testing, it can then be used for the genotoxicty assessment in
cells. A series of 8-OHdG solutions with concentrations of 0,
1, 10, 20, 40 and 80 ng mL − 1 , both in cell lysis buffer and cell
culture medium (DMEM), were prepared and applied to the
strips. The cell lysate (lysed cell by cell lysis buffer) and cell
culture medium (supernant) after NPs (CuO, CdO and TiO 2 )
exposure were also collected and applied to the strips. After
15 min, photographs were taken by using photo scanner
( Figure 7 ), and then software ImageJ was used for the quan-
titative analysis as illustrated above. Figure 7 (a) and (c) show
that the optical intensity decreased obviously when the con-
centration of 8-OHdG increased, both in the cell lysis buffer
and in the cell culture medium, which is still consistent with
the mechanism of the competitive format and can be used as
www.small-journal.com © 2013 Wiley-VCH Verlag Gm
Figure 7 . (a) The photographs of test strips based on 8-OHdG samples disbuffer. (b) The photographs of test strips based on cell lysate after cellsNPs solutions. (c) The photographs of test strips based on 8-OHdG samcell culture medium (DMEM). (d) The photographs of test strips based oafter cells were treated with NPs solutions. Top line: Test-line; Bottom lineconcentration unit for those shown in the middle is nanogram/milliliter.
a calibration standard. Figure 7 (b) and (d) demonstrate the
results by using different NPs, in which the color intensities
of all the three experimental groups (NPs) are slightly lighter
compared to the control indicating that these metallic NPs
can lead to more 8-OHdG generation, in other words, are
genotoxic. Among the three experimental groups, CuO NPs
seemed to be the most genotoxic with the highest 8-OHdG
bH & Co. KGaA, Weinh
solved in cell lysis were treated with ples dissolved in
n culture medium : Control-line. The
generation in both the cell lysate and the
cell culture medium, which was consistant
with the results given by both Alamar Blue
assay and EIS system.
Figure 8 illustrates the linear fi tting
curves for 8-OHdG, both in the cell lysis
buffer (panel a) and the cell culture media
(panel b) with correlation coeffi cients of
0.957 and 0.9632, respectively. 8-OHdG
concentrations in different experimental
groups can be estimated by these two
curves presented in Table 2 and Table 3 .
The CuO groups, both in the cell lysate
and the cell culture medium, have the
highest 8-OHdG concentrations (23.24 and
13.78 ng mL − 1 , respectively), followed by
the CdO groups (12.35 and 8.43 ng mL − 1 ,
respectively). While TiO 2 shows no special
genotoxicity with similar 8-OHdG concen-
trations compared to the control. By com-
paring the two tables, we can see that the
DNA oxidative biomarker is prone to stay
inside the cells instead of being released
out of the cells (i.e. for CuO, there is
eim small 2013, 9, No. 9–10, 1821–1830
Biosensing for Rapid Genotoxicity and Cytotoxicity Assays
Table 2 . Estimated 8-OHdG concentrations in cell lysate after cell were exposed to different NP solutions.
Sample Type a) ROD’ b) 8-OHdG Concentration [ng mL − 1 ]
Control 0.6535 2.17
CuO 0.4269 23.34
CdO 0.5402 12.35
TiO 2 0.7449 1.76
a) Different cell lysate samples after cells were exposed to different NPs solutions; b) ROD’:ROD
(relative optical density)/ABD (average blank density)
Table 3. Estimated 8-OHdG concentrations in cell culture media after cells were exposed to different NP solutions.
Sample Type a) ROD’ b) 8-OHdG Concentration [ng mL − 1 ]
Control 0.9308 2.56
CuO 0.8658 13.78
CdO 0.8968 8.43
TiO 2 0.9291 2.86
a) Different cell culture media samples after cells were exposed to different NPs solutions;
b) ROD’:ROD (relative optical density)/ABD (average blank density)
23.24 ng mL − 1 8-OHdG in cell lysate, while 13.78 ng mL − 1 in
cell culture medium). Genomic instability, under certain thresholds, could be
partially fi xed by the mechanism of DNA replication cou-
pled repair and become tolerated by cells. However, cells
undergoing proliferation, like germ cells and stem cells, may
be redirected to cell cycle arrest and programmed cell death/
apoptosis given severe genomic damage. The mechanism of
how NPs with similar size convey different genotoxicity and
cytotoxicity on the molecular and whole cell level respectively
is not well understood. However, in this study we do observe
a correlation between DNA damage and cytotoxicity.
Comparing the above sections, we notice that the high
toxicity of CuO NPs leads to almost 100% cell death within
2 h after NPs addition (Figure 3 , line B), which could be a
response to the DNA damage (illustrated in Table 1 and 2 ,
CuO NPs induce the highest 8-OhdG generation in cell) as
a way to prevent a mutagenic outcome. In the meantime, it
is also possible that DNA damage to some extent is a conse-
quence of cytotoxicity. However, from the present data, it is
hard to clarify which process is the driving force. On the other
hand, the TiO 2 NPs cause cytotoxic effects (Figure 3 , line D),
however, without apparent increase in 8-OHdG levels, indi-
cating different mechanisms underlying these effects.
3. Conclusion
In this work, we use two novel methods developed by our
lab to assess the cytotoxicity and oxidative DNA damage in
mouse epithelial cells (CCL-149) after exposure to three dif-
ferent metal oxides (CuO, TiO 2 , CdO) NPs. We established
a resistance-time relationship for three NPs with similar size
© 2013 Wiley-VCH Verlag Gmbsmall 2013, 9, No. 9–10, 1821–1830
and same concentration by using an EIS system. In addition,
we successfully designed and presented a novel paper based
immunoassay to measure the concentration of 8-OHdG
in cells. This simple and rapid assay could provide a high
throughput analysis capable in mass screening in nanotoxico-
logical investigations. Combined together with Alamar Blue
assay, these three methods provide a wide angle scope of
nanotoxicity with readout from physical cell attachment, met-
abolic activity and genomic lesion. The data indicated that
there was a high variation among different NPs regarding
their ability to cause cytotoxicity and DNA oxidative lesions.
CuO NPs were the most toxic, both in cell viability level and
DNA damage level. CdO showed some to severe cytotoxic
effects as well as increased 8-OHdG levels, however, less than
those caused by CuO NPs. TiO 2 particles caused very limited
cytotoxicity, while, there was no obvious 8-OHdG increase.
There is a correlation between DNA damage and cytotox-
icity, however, the mechanism of how NPs with similar size
convey different genotoxicity and cytoxicity on the molecular
and whole cell level respectively is not well understood and
could be a subject for further investigation. In conclusion, the
EIS system and LFIA strip can provide useful methods for
quantitative or qualitative nanotoxicity assessment with high
sensitivity, specifi city, speed of performance, and simplicity
based on the comparison with the Alamar Blue assay.
4. Experimental Section
Materials : PBS (1X, PH = 7.4), Triton X-100 and trisodium citrate dihydrate were purchased from VWR (West Chester, PA). Gold chlo-ride trihydrate (HAuCl 4 •3H 2 O), bovine serum albumin (powder), sodium borohydride (NaBH 4 ), sodium periodate (NaIO 4 ), ethylene glycol, potassium carbonate (K 2 CO 3 ), sodium phosphate (Na 3 PO 4 ), sodium chloride (NaCl), copper oxide (CuO), cadmium oxide (CdO), and titanium dioxide (TiO 2 ) were purchased from Sigma-Aldrich (St. Louis, MO). Tween 20 (polyoxyethylene-20-sorbitan monolaurate), sucrose, and tris–HCl (1 M) were obtained from Fisher Scientifi c (Fairlawn, NJ). Plastic backing, nitrocellulose membrane, absorbing pad, and cellulose paper were acquired from Millipore (Billerica, MA). 8-Hydroxy-2-deoxyguanosine and 8-hydroxyguanosine were purchased from Cayman chemical (Ann Arbor, MI). Mouse mono-clonal antibodies to 8-hydroxyguanosine and polyclonal Goat anti Mouse IgG were purchased from Abcam (Cambridge, MA). Alamar Blue, DMEM, fetal bovine serum, and penicillin–streptomycin were obtained from Invitrogen (Merelbeke, Belgium). Mouse epithelial cells, CCL-149 were bought from ATCC (Manassas, VA).
Equipment : HP Scanjet G3110 Photo Scanner was bought from Hewlett-Packard, Palo Alto, CA. The Zetasizer is from Malvern Instruments, Woodstock, GA. Drying Oven was purchased from VWR (West Chester, PA). Dispenser Linomat 5 was purchased from CAMAG (Wilmington, NC). ImageJ and SigmaPlot software were downloaded from the internet.
Synthesis of Antibody-Conjugated Gold NPs (AuNPs–Abs) : The AuNPs were synthesized by a modifi ed citrate reduction method. [ 67 ] Briefl y, HAuCl 4 solution (50 mL, 0.01% in superpurifi ed water) was heated to a boil, and then trisodium citrate solution (1 mL, 1%) was added rapidly under constant stirring. Gradually, the color changed from pale yellow to bright red. After the color change,
1827www.small-journal.comH & Co. KGaA, Weinheim
X. Zhu et al.
1
full papers
the solution was boiled for another 10 min and stirred without heating for another 10 min to complete the reduction of the gold chloride. After the solution reached the room temperature, the size of the AuNPs were characterized by the Zetasizer and found to be ∼ 20 nm.The AuNPs solution was concentrated 5X and the pH of the AuNPs solution for antibody labeling was adjusted to pH 8.5 ∼ 9.0 with K 2 CO 3 (0.1 M). The method for optimal antibody labeling con-centration determination was followed from Y Zhao et al. [ 68 ] Puri-fi ed anti-8-OHdG mAb (60 μ L, 0.54 mg mL − 1 ) was added to the AuNPs solution (750 μ L, 5X) and stirred gently at room tempera-ture for 1 h. The conjugate was stabilized by adding BSA (90 μ L, 10%) in sodium borate (20 mM) for a fi nal concentration of 1% and incubate for another 20 min. Then the mixture was centrifuged for 15 min at 7000 rcf. Two phases can be obtained: a clear to pink supernatant of unbound antibodies and a dark red, loosely packed sediment of the AuNPs-Abs conjugates. The supernatant was discarded and the pellet was resuspended in BSA/PBS (900 μ L, 1%). Following the same centrifugation step, the supernatant was removed and the soft sediment of conjugates was resuspended in buffer (900 μ L), containing sodium phosphate (20 mM), Tween 20 (0.25%), sucrose (10%), and BSA (5%) by the end. The conjugate was stored at 4 ° C until required for use.
Preparation of BSA-8 Hydroxyguanosine Conjugates (for Test Line Capture) : 8-Hydroxyguanosine (5 mg) was dissolved in NaIO 4 (1 mL, 50 mM) and the mixture was incubated for 1 h in the dark. The reaction was stopped by adding ethylene glycol (2.5 μ L) for 5 min. Then the mixture was mixed with BSA (2 mL, 25 g L − 1 , pH = 9.5, adjusted by K 2 CO 3 (50 g L − 1 )) under constant stirring dropwise and incubated for another 1 h. After that, NaBH 4 (2 mL, 24 g L − 1 ) was added and the mixture was incubated in the dark at 4 ° C over-night (12–16 h). Finally, the conjugates were dialyzed against 1X PBS and stored at −20 ° C.
Assembly of the Lateral Flow Immuno Strip : BSA-8 hydroxygua-nosine conjugates were used as the test line (T) capture reagent, while goat anti-mouse IgG (1 mg mL − 1 ) was used as the control line (C) capture reagent. These capture reagents were dispensed by the Linomat 5 dispenser onto a nitrocellulose membrane as the test and control lines. The sample pad (5 mm × 19 mm) was treated with buffer Triton X-100 (containing 0.25%), Tris-HCl (0.05 M) and NaCl (0.15 mM), then AuNp-Abs conjugates (30 uL) was dis-pensed by pipette onto a glass fi ber membrane which was called the conjugate pad (5 mm × 9 mm). After drying these membranes, the sample pad, conjugate pad, nitrocellulose membrane, and absorbent pad were pasted onto a plastic backing plate which was already cut into 5 mm-wide strips (Scheme 1 ) using a strip cutter. Then the strips were stored in a self-sealing plastic bag until use.
Preparation of Standard Solution and Samples : Stock solutions of 8-OHdG (500 μ g mL − 1 ) were prepared before use by dissolving the 8-OHdG powder in purifi ed PBS (1X) solution, DMEM and cell lysis buffer respectively. Working standards ((0.1–100000) ng mL − 1 , (1–80) ng mL − 1 and (1–80) ng mL − 1 ) were prepared further in the corresponding media before use and kept at 4 ° C.
Particle Source and Characterization : TiO 2 -NPs ( ϕ < 25 nm) and CuO-NPs ( ϕ < 50 m) were obtained in powder form from Sigma-Aldrich (Cat No. 637254 and 544868). The dry powder of NPs was suspended in deionized water (1 mg mL − 1 ) and cell culture medium (1 mg mL − 1 ) respectively, and then sonicated using a sonicator bath at room temperature for 20 min (120 V/50–60 HZ) to form a
828 www.small-journal.com © 2013 Wiley-VCH Verlag G
homogeneous suspension. For size measurement, sonicated NPs stock solutions (1 mg mL − 1 ) were then diluted to working solu-tions (100 μ g mL − 1 ). TEM was used to characterize the size and shape of the NPs. A drop of aqueous NPs suspension was placed onto a carbon-coated copper grid, air-dried and observed with TEM (2000FX, JEOL). DLS was used to determine the hydrodynamic size and zeta potential of the NPs suspension both in the DI water and culture medium.
Cell Culture and Exposure to NPs : Mouse epithelial cells (CCL-149) were obtained from ATCC and cultured in DMEM/F-12 medium supplemented with FBS (10%) and penicillin-streptomycin (5%) at 5% CO 2 and 37 ° C. At confl uence, cells were harvested using trypsin (0.25%) and sub-cultured into EIS chips (6 × 10 4 cells per well), 24-well plates (5 × 10 4 cells per well) or 12-well plates (10 6 cells per well) according to the selection of experiments. Cells were allowed to attach the surface for 24 h prior to treatment. CuO, CdO and TiO 2 NPs were suspended in cell culture medium and diluted to the same concentration (100 μ g mL − 1 ). The appropriate dilu-tions of NPs were then sonicated using a sonicator bath at room temperature for 20 min (120 V/50–60 HZ) to avoid NPs agglom-eration prior to administration to the cells. Following treatment, the cells were harvested to determine cytotoxicity, oxidative DNA lesion parameters. Cells not exposed to NPs served as controls in each experiment.
Alamar Blue Assay : Cells are seeded in 24-well plates at con-fl uence of 5 × 10 4 cells per well. One day later and at time point 0, medium or medium containing NPs (100 μ g mL − 1 , fi nal) are added on top of cells. Since incubation of Alamar Blue takes 6 h according to our prerunning test, the reagent of 10% sample volume was added at time point –6, 0, 6, and 24 h. Thus measurement of net absorbance at 570 nm was carried at time point 0, 6, 12, 30 h. Every data points are subtracted by reference number which comes from the reading of the mixture of medium and Alamar Blue only, and then normalized to the average of all the reading at time point 0.
Cytotoxicity Assays : As mentioned above, cell suspen-sion (0.6 mL) was applied into each well in the EIS chip for the experiments. After 24 h of cell attachment, prepared NPs solu-tions (100 μ L) were added to corresponding wells. The resistance changes produced by the attachment of cells to the electrodes were monitored over a 40 h time period (both before and after NPs addition). The EIS chip design was previously reported. [ 34 ] In short, as cells are placed in each well of the chip, they settle down onto the electrode surface creating a barrier for the fl owing current increasing the resistance measurements. Thus, it is possible to monitor the cell attachment and proliferation from the change in resistance measurements.
Genotoxicity Biomarker Assays : For investigation of NP-induced oxidative DNA-damage, the cell culture medium were collected fi rstly at the end of the exposure period. After centrifugation, the supernants were recollected and stored at −20 ° C until tested. The cells left in the wells and pellets in the tubes were resuspended and lysed by cell lysis buffer containing Tris (20 mM, pH = 8.0), NaCl (137 mM), Triton X-100 (1%), Glycerol (10%) and EDTA (5 mM). The cell lysates were obtained by collecting the supernant of the mixture after centrifuging.
Paper strip assay : standard solution or sample (100 μ L) was added onto the sample pad, and the solution migrated toward the absorbent pad; a result could be seen after 10 min.
mbH & Co. KGaA, Weinheim small 2013, 9, No. 9–10, 1821–1830
Biosensing for Rapid Genotoxicity and Cytotoxicity Assays
[ 1 ] J. C. Chow , J. G. Watson , N. Savage , C. J. Solomon , Y. S. Cheng , P. H. McMurry , L. M. Corey , G. M. Bruce , R. C. Pleus , P. Biswas , C. Y. Wu , J. Air Waste Manag. Assoc. 2005 , 55 , 1411 .
[ 2 ] V. L. Colvin , Nat. Biotechnol. 2003 , 21 , 1166 . [ 3 ] R. Owen , M. Depledge , Mar. Pollut. Bull 2005 , 50 , 609 . [ 4 ] E. O. Günter Oberdörster , Jan Oberdörster , Environmental Health
Perspectives 2005 , 113 , 823 . [ 5 ] T. Xia , N. Li , A. E. Nel , Annu. Rev. Public Health 2009 , 30 , 137 . [ 6 ] M. Valko , H. Morris , M. T. Cronin , Curr. Med. Chem. 2005 , 12 ,
1161 . [ 7 ] M. Valko , C. J. Rhodes , J. Moncol , M. Izakovic , M. Mazur , Chem.
Biol. Interact. 2006 , 160 , 1 . [ 8 ] C. F. Jones , D. W. Grainger , Adv. Drug Deliv. Rev. 2009 , 61 , 438 . [ 9 ] R. Landsiedel , M. D. Kapp , M. Schulz , K. Wiench , F. Oesch , Mutat.
Res. 2009 , 681 , 241 . [ 10 ] P. Moller , N. R. Jacobsen , J. K. Folkmann , P. H. Danielsen ,
L. Mikkelsen , J. G. Hemmingsen , L. K. Vesterdal , L. Forchhammer , H. Wallin , S. Loft , Free Radic. Res. 2010 , 44 , 1 .
[ 11 ] G. Oberdörster , Stone Vicki , Donaldson Ken , Nanotoxicology 2007 , 1 , 2 .
[ 12 ] N. Singh , B. Manshian , G. J. Jenkins , S. M. Griffi ths , P. M. Williams , T. G. Maffeis , C. J. Wright , S. H. Doak , Biomaterials 2009 , 30 , 3891 .
[ 13 ] W. MacNee , K. Donaldson , Eur. Respir. J. Suppl. 2003 , 40 , 47s . [ 14 ] H. Y. Jia , Y. Liu , X. J. Zhang , L. Han , L. B. Du , Q. Tian , Y. C. Xu , J. Am.
Chem. Soc. 2009 , 131 , 40 . [ 15 ] S. Durocher , A. Rezaee , C. Hamm , C. Rangan , S. Mittler , B. Mutus ,
J. Am. Chem. Soc. 2009 , 131 , 2475 . [ 16 ] H. Kasai , Free Radic Biol. Med. 2002 , 33 , 450 . [ 17 ] H. Kasai , N. Iwamoto-Tanaka , T. Miyamoto , K. Kawanami ,
S. Kawanami , R. Kido , M. Ikeda , Jpn. J. Cancer Res. 2001 , 92 , 9 . [ 18 ] H. Kasai , K. Kawai , Antioxid. Redox. Signal 2006 , 8 , 981 . [ 19 ] J. M. Hillegass , A. Shukla , S. A. Lathrop , M. B. MacPherson ,
N. K. Fukagawa , B. T. Mossman , Wiley Interdiscip. Rev. Nanomed. Nanobiotechnol. 2010 , 2 , 219 .
[ 20 ] S. M. Poonam Takhar , Arch. Appl. Sci. Res. 2011 , 3 , 389 . [ 21 ] K. Bhattacharya , M. Davoren , J. Boertz , R. P. Schins , E. Hoffmann ,
E. Dopp , Part Fibre Toxicol. 2009 , 6 , 17 . [ 22 ] H. L. Karlsson , P. Cronholm , J. Gustafsson , L. Moller , Chem. Res.
Toxicol. 2008 , 21 , 1726 . [ 23 ] B. Fahmy , S. A. Cormier , Toxicol. In Vitro 2009 , 23 , 1365 . [ 24 ] I. Pujalte , I. Passagne , B. Brouillaud , M. Treguer , E. Durand ,
C. Ohayon-Courtes , B. L’Azou , Part. Fibre Toxicol. 2011 , 8 , 10 . [ 25 ] Q. Saquib , A. A. Al-Khedhairy , M. A. Siddiqui , F. M. Abou-Tarboush ,
A. Azam , J. Musarrat , Toxicology in Vitro 2012 , 26 , 351 . [ 26 ] D. Napierska , L. C. Thomassen , V. Rabolli , D. Lison , L. Gonzalez ,
M. Kirsch-Volders , J. A. Martens , P. H. Hoet , Small 2009 , 5 , 846 .
Statistical analysis : Results are expressed as means ± SEM of three experiments and data were analyzed quantitatively by using ImageJ and SigmaPlot software.
Acknowledgements
This research and development project was supported by This research and development project was supported by the grant NIH R15 ES021079-01 and the grant W81XWH-10-1-0732 by US Army Medical Research & Materiel Command (USAMRMC) and the Tele-medicine & Advanced Technology Research Center (TATRC).
© 2013 Wiley-VCH Verlag Gmbsmall 2013, 9, No. 9–10, 1821–1830
[ 27 ] R. M. Mroz , R. P. Schins , H. Li , L. A. Jimenez , E. M. Drost , A. Holownia , W. MacNee , K. Donaldson , Eur. Respir. J. 2008 , 31 , 241 .
[ 28 ] M. J. Akhtar , M. Ahamed , M. Fareed , S. A. Alrokayan , S. Kumar , J. Toxicol. Sci. 2012 , 37 , 139 – 48 .
[ 29 ] J. C. Lai , M. B. Lai , S. Jandhyam , V. V. Dukhande , A. Bhushan , C. K. Daniels , S. W. Leung , Int. J. Nanomedicine 2008 , 3 , 533 .
[ 30 ] S. Q. Li , R. R. Zhu , H. Zhu , M. Xue , X. Y. Sun , S. D. Yao , S. L. Wang , Food Chem. Toxicol. 2008 , 46 , 3626 .
[ 31 ] Y. Pan , A. Leifert , D. Ruau , S. Neuss , J. Bornemann , G. Schmid , W. Brandau , U. Simon , W. Jahnen-Dechent , Small 2009 , 5 , 2067 .
[ 32 ] N. Mei , Y. Zhang , Y. Chen , X. Guo , W. Ding , S. F. Ali , A. S. Biris , P. Rice , M. M. Moore , T. Chen , Environ. Mol. Mutagen. 2012 , 53 , 409 .
[ 33 ] M. F. Song , Y. S. Li , H. Kasai , K. Kawai , J. Clin. Biochem. Nutr. 2012 , 50 , 211 .
[ 34 ] E. Hondroulis , C. Liu , C. Z. Li , Nanotechnology 2010 , 21 , 315103 .
[ 35 ] L. Risom , P. Moller , S. Loft , Mutat. Res. 2005 , 592 , 119 . [ 36 ] M. D. Pulido , A. R. Parrish , Mutat. Res. 2003 , 533 , 227 . [ 37 ] J. E. Rundhaug , S. M. Fischer , Cancers 2010 , 2 , 436 . [ 38 ] A. Valavanidis , T. Vlachogianni , C. Fiotakis , J. Environ Sci. Health
C. Environ. Carcinog. Ecotoxicol. Rev. 2009 , 27 , 120 . [ 39 ] S. Koide , Y. Kinoshita , N. Ito , J. Kimura , K. Yokoyama , I. Karube ,
J. Chromatogr B. Analyt. Technol. Biomed. Life Sci. 2010 , 878 , 2163 .
[ 40 ] A. M. Domijan , M. Peraica , Arh. Hig. Rada. Toksikol. 2008 , 59 , 277 .
[ 41 ] H. S. Lin , A. M. Jenner , C. N. Ong , S. H. Huang , M. Whiteman , B. Halliwell , Biochem. J. 2004 , 380 , 541 .
[ 42 ] M. Harri , H. Kasai , T. Mori , J. Tornaeus , K. Savela , K. Peltonen , J. Chromatogr B. Analyt. Technol. Biomed. Life Sci. 2007 , 853 , 242 .
[ 43 ] A. Weimann , D. Belling , H. E. Poulsen , Free Radic. Biol. Med. 2001 , 30 , 757 .
[ 44 ] M. S. Cooke , R. Singh , G. K. Hall , V. Mistry , T. L. Duarte , P. B. Farmer , M. D. Evans , Free Radic. Biol. Med. 2006 , 41 , 1829 .
[ 45 ] G. Liu , X. Mao , J. A. Phillips , H. Xu , W. Tan , L. Zeng , Anal. Chem. 2009 , 81 , 10013 .
[ 46 ] Q. H. Yang , X. Q. Gong , T. Song , J. M. Yang , S. J. Zhu , Y. H. Li , Y. Cui , Y. X. Li , B. B. Zhang , J. Chang , Biosens: Bioelectron. 2011 , 30 , 145 .
[ 47 ] Y. Y. Lin , J. Wang , G. D. Liu , H. Wu , C. M. Wai , Y. H. Lin , Biosens. Bioelectron. 2008 , 23 , 1659 .
[ 48 ] Q. Zeng , X. Mao , H. Xu , S. Wang , G. D. Liu , Am. J. Biomed. Sci. 2009 , 10 , 70 .
[ 49 ] A.-N. Kawde , X. Mao , H. Xu , Q. Zeng , Y. He , G. D. Liu , Am. J. Biomed. Sci. 2010 , 10 , 23 .
[ 50 ] S. W. Oh , Y. M. Kim , H. J. Kim , S. J. Kim , J. S. Cho , E. Y. Choi , Clin. Chim. Acta 2009 , 406 , 18 .
[ 51 ] X. Mao , M. Baloda , A. S. Gurung , Y. H. Lin , G. D. Liu , Electrochem. Commun. 2008 , 10 , 1636 .
[ 52 ] L. Wang , W. Ma , W. Chen , L. Liu , Y. Zhu , L. Xu , H. Kuang , C. Xu , Biosens. Bioelectron. 2011 , 26 , 3059 .
[ 53 ] D. Tang , J. C. Sauceda , Z. Lin , S. Ott , E. Basova , I. Goryacheva , S. Biselli , J. Lin , R. Niessner , D. Knopp , Biosens. Bioelectron. 2009 , 25 , 514 .
[ 54 ] M. Pattarawarapan , S. Nangola , T. R. Cressey , C. Tayapiwatana , Talanta 2007 , 71 , 462 .
[ 55 ] F. Lu , K. H. Wang , Y. H. Lin , Analyst 2005 , 130 , 1513 . [ 56 ] G. Liu , J. Wang , R. Barry , C. Petersen , C. Timchalk , P. L. Gassman ,
Y. Lin , Chemistry 2008 , 14 , 9951 . [ 57 ] W. Dungchai , O. Chailapakul , C. S. Henry , Analyt. Chim. Acta
2010 , 674 , 227 . [ 58 ] X. Mao , Y. Q. Ma , A. G. Zhang , L. R. Zhang , L. W. Zeng , G. D. Liu ,
Analyt. Chem. 2009 , 81 , 1660 .
1829www.small-journal.comH & Co. KGaA, Weinheim
X. Zhu et al.
183
full papers
[ 59 ] V. Sharma , R. K. Shukla , N. Saxena , D. Parmar , M. Das , A. Dhawan ,Toxicol. Lett. 2009 , 185 , 211 . [ 60 ] Z. Z. Wei Bai , W. Tian , X. He , Y. Ma , Y. Zhao , Z. Chai , J. Nanopart.
Res. 2010 , 12 , 1645 . [ 61 ] E. Burello , A. P. Worth , Nanotoxicology 2011 , 5 , 228 . [ 62 ] C. S. J. H. Chang , C. H. Lo , T. T. Tsung , M. J. Kao , H. M. Lin , Rev.
Adv. Mater. Sci. 2005 , 10 , 128 . [ 63 ] R. W. Kebin Zhou , Boqing Xu , Yadong Li , Nanotechnology 2006 ,
17 , 3939 . [ 64 ] R. J. Lewis Snr , Hawley’s Condensed Chemical Dictionary , 13th
ed, Wiley-Interscience , Germany 1997 , p.189 .
0 www.small-journal.com © 2013 Wiley-VCH Verlag Gm
[ 65 ] F. Tian , D. Cui , H. Schwarz , G. G. Estrada , H. Kobayashi , Toxicol. In Vitro 2006 , 20 , 1202 .
[ 66 ] C. Liu , Q. Jia , C. Yang , R. Qiao , L. Jing , L. Wang , C. Xu , M. Gao , Anal. Chem. 2011 , 83 , 6778 .
[ 67 ] K. C. Grabar , R. G. Freeman , M. B. Hommer , M. J. Natan , Analyt. Chem. 1995 , 67 , 735 .
[ 68 ] Y. Zhao , G. Zhang , Q. Liu , M. Teng , J. Yang , J. Wang , J. Agric. Food Chem. 2008 , 56 , 12138 .
Received: July 7, 2012 Revised: August 28, 2012 Published online: February 18, 2013
bH & Co. KGaA, Weinheim small 2013, 9, No. 9–10, 1821–1830
Related Documents