BIOSCREEN-AT Natural Attenuation Decision Support System M.Karanovic (Jul 2007) Data Input Instructions: S.S. Papadopulos & Associates, Inc. Version 1.43 115 1. Enter value directly....or 2. Calculate by filling in grey 1. HYDROGEOLOGY 5. GENERAL 0.02 cells below. (To restore Seepage Velocity* Vs 37.274 (ft/yr) Modeled Area Length* 1450 (ft) formulas, hit button below). or Modeled Area Width* 320 (ft) Variable* Data used directly in model. Hydraulic Conductivity K 8.1E-03 (cm/sec) Simulation Time* 5.00 (yr) 20 Value calculated by model. Hydraulic Gradient i 0.048 (ft/ft) (Don't enter any data). Porosity n 0.25 (-) 6. SOURCE DATA Source Thickness 10 (ft) 2. DISPERSION Longitudinal Dispersivialpha x 9.843 (ft) Transverse Dispersivityalpha y 0.984 (ft) Source Vertical Dispersivity* alpha z 0.000 (ft) Width (ft) Conc.(mg/L) or 100 9 Estimated Plume Length Lp 1450 (ft) Exponentialy Decaying Conc. 3. ADSORPTION Retardation Factor* R 1.0 (-) View of Plume Looking Down or Soil Bulk Density rho 1.7 (kg/l) Observed Centerline Concentrations at Monitoring Wells Partition Coefficient Koc 38 (L/kg) If No Data Leave Blank or Enter "0" FractionOrganicCarbon foc 8.0E-4 (-) 7. FIELD DATA FOR COMPARISON Concentration (mg/L) 9.0 8.0 1.0 .02 .005 4. BIODEGRADATION Dist. from Source (f 0 150 300 450 600 750 900 1050 1200 1350 1500 1st Order Decay Coeff* lambda 0.0E+0 (per yr) or 8. CHOOSE TYPE OF OUTPUT TO SEE: Solute Half-Life t-half 0.10 (year) or Instantaneous Reaction Model Delta Oxygen* DO 5.78 (mg/L) Delta Nitrate* NO3 17 (mg/L) Observed Ferrous Iron* Fe2+ 11.3 (mg/L) Delta Sulfate* SO4 100 (mg/L) Observed Methane* CH4 0.414 (mg/L) View Plume View Centerline Restore Formulas for Vs, Dispersivities, R, lambda, other RUN CENTERLINE RUN PLUME Recalculate This Sheet L W or or or or or or View BIOSCREEN Paste Dataset from BIOSCREEN Paste Example Dataset

Bioscreen at 1.43
Oct 26, 2014
Welcome message from author
This document is posted to help you gain knowledge. Please leave a comment to let me know what you think about it! Share it to your friends and learn new things together.
Transcript
BIOSCREEN-AT Natural Attenuation Decision Support System M.Karanovic (Jul 2007) Data Input Instructions:S.S. Papadopulos & Associates, Inc. Version 1.43 115 1. Enter value directly....or
2. Calculate by filling in grey 1. HYDROGEOLOGY 5. GENERAL 0.02 cells below. (To restore Seepage Velocity* Vs 37.274 (ft/yr) Modeled Area Length* 1450 (ft) formulas, hit button below).
or Modeled Area Width* 320 (ft) Variable* Data used directly in model. Hydraulic Conductivity K 8.1E-03 (cm/sec) Simulation Time* 5.00 (yr) 20 Value calculated by model.Hydraulic Gradient i 0.048 (ft/ft) (Don't enter any data).Porosity n 0.25 (-) 6. SOURCE DATA
Source Thickness 10 (ft)2. DISPERSION Longitudinal Dispersivity* alpha x 9.843 (ft)Transverse Dispersivity* alpha y 0.984 (ft) SourceVertical Dispersivity* alpha z 0.000 (ft) Width (ft) Conc.(mg/L)
or 100 9Estimated Plume Length Lp 1450 (ft)
Exponentialy Decaying Conc. 3. ADSORPTION Retardation Factor* R 1.0 (-) View of Plume Looking Down
orSoil Bulk Density rho 1.7 (kg/l) Observed Centerline Concentrations at Monitoring Wells Partition Coefficient Koc 38 (L/kg) If No Data Leave Blank or Enter "0"FractionOrganicCarbon foc 8.0E-4 (-) 7. FIELD DATA FOR COMPARISON
Concentration (mg/L) 9.0 8.0 1.0 .02 .0054. BIODEGRADATION Dist. from Source (ft) 0 150 300 450 600 750 900 1050 1200 1350 15001st Order Decay Coeff* lambda 0.0E+0 (per yr)
or 8. CHOOSE TYPE OF OUTPUT TO SEE:Solute Half-Life t-half 0.10 (year)or Instantaneous Reaction ModelDelta Oxygen* DO 5.78 (mg/L)Delta Nitrate* NO3 17 (mg/L)Observed Ferrous Iron* Fe2+ 11.3 (mg/L)Delta Sulfate* SO4 100 (mg/L)Observed Methane* CH4 0.414 (mg/L)
View PlumeView Centerline Restore Formulas for Vs, Dispersivities,
R, lambda, other
RUN CENTERLINE RUN
PLUME
Recalculate This Sheet
L
W
or
oror
or
or
or
View BIOSCREEN
Paste Dataset from BIOSCREEN
Paste Example Dataset

BIOSCREEN Natural Attenuation Decision Support System Keesler AFB Data Input Instructions:Air Force Center for Environmental Excellence Version 1.4 SWMU 66 115 1. Enter value directly....or
Run Name 2. Calculate by filling in grey 1. HYDROGEOLOGY 5. GENERAL 0.02 cells below. (To restore Seepage Velocity* Vs 37.274 (ft/yr) Modeled Area Length* 1450 (ft) formulas, hit button below).
or Modeled Area Width* 320 (ft) Variable* Data used directly in model. Hydraulic Conductivity K 8.1E-03 (cm/sec) Simulation Time* 5.00 (yr) 20 Value calculated by model.Hydraulic Gradient i 0.048 (ft/ft) (Don't enter any data).Porosity n 0.25 (-) 6. SOURCE DATA
Source Thickness in Sat.Zone* 10 (ft)2. DISPERSION Source Zones:Longitudinal Dispersivity* alpha x 9.843 (ft) Width* (ft) Conc. (mg/L)*Transverse Dispersivity* alpha y 0.984 (ft) 50 0.07 1Vertical Dispersivity* alpha z 0.000 (ft) 25 2.8
or 100 9Estimated Plume Length Lp 1450 (ft) 25 2.8
50 0.073. ADSORPTION Source Halflife (see Help):Retardation Factor* R 1.0 (-) Infinite Infinite (yr) View of Plume Looking Down
or Inst. React. 1st OrderSoil Bulk Density rho 1.7 (kg/l) Soluble Mass Infinite (Kg) Observed Centerline Concentrations at Monitoring Wells Partition Coefficient Koc 38 (L/kg) In Source NAPL, Soil If No Data Leave Blank or Enter "0"FractionOrganicCarbon foc 8.0E-4 (-) 7. FIELD DATA FOR COMPARISON
Concentration (mg/L) 9.0 8.0 1.0 .02 .0054. BIODEGRADATION Dist. from Source (ft) 0 150 300 450 600 750 900 1050 1200 1350 15001st Order Decay Coeff* lambda 0.0E+0 (per yr)
or 8. CHOOSE TYPE OF OUTPUT TO SEE:Solute Half-Life t-half 0.10 (year)or Instantaneous Reaction ModelDelta Oxygen* DO 5.78 (mg/L)Delta Nitrate* NO3 17 (mg/L)Observed Ferrous Iron* Fe2+ 11.3 (mg/L)Delta Sulfate* SO4 100 (mg/L)Observed Methane* CH4 0.414 (mg/L)
Vertical Plane Source: Look at Plume Cross-Section and Input Concentrations & Widthsfor Zones 1, 2, and 3
View Output Paste Example Dataset
View Output Restore Formulas for Vs, Dispersivities,
R, lambda, other
RUN CENTERLINE RUN ARRAYHelp Recalculate This
Sheet
L
W
or
oror
or
12345
or
or
View BIOSCREEN-AT
DISSOLVED HYDROCARBON CONCENTRATIONS IN PLUME (mg/L at Z=0)
0 0 145 290 435 580 725No Degradation 9.000 7.261 0.493 0.000 0.000 0.0001st Order Decay 9.000 7.261 0.493 0.000 0.000 0.000Field Data from Site 9.000 -10.000 8.000 -10.000 -10.000 -10.000
# of TimeSteps 20 Displayed Time=5 years
0
0 145 290 435 580 725 870 1015 1160 1305 1450
0.0
1.0
2.0
3.0
4.0
5.0
6.0
7.0
8.0
9.0
10.0 1st Order Decay No Degradation Field Data from Site
Distance From Source (ft)
Co
nce
ntr
atio
n (
mg
/L)
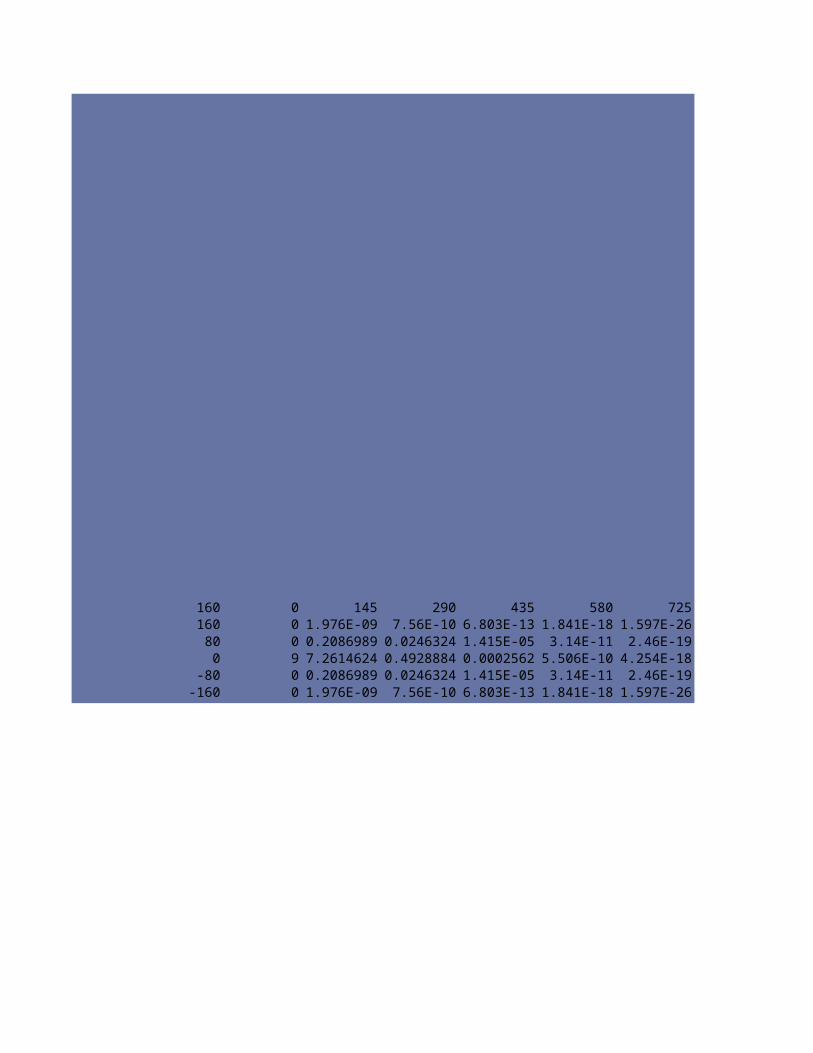
160 0 145 290 435 580 725160 0 1.9761E-09 7.5595E-10 6.8026E-13 1.8406E-18 1.5969E-26
80 0 0.2086989 0.0246324 1.4155E-05 3.1396E-11 2.4595E-190 9 7.2614624 0.4928884 0.0002562 5.5058E-10 4.2536E-18
-80 0 0.2086989 0.0246324 1.4155E-05 3.1396E-11 2.4595E-19-160 0 1.9761E-09 7.5595E-10 6.8026E-13 1.8406E-18 1.5969E-26

DISSOLVED HYDROCARBON CONCENTRATIONS IN PLUME (mg/L at Z=0)
Distance from Source (ft)
870 1015 1160 1305 14500.000 0.000 0.000 0.000 0.0000.000 0.000 0.000 0.000 0.000
-10.000 1.000 -10.000 0.020 0.005
0 145 290 435 580 725 870 1015 1160 1305 1450
0.0
1.0
2.0
3.0
4.0
5.0
6.0
7.0
8.0
9.0
10.0 1st Order Decay No Degradation Field Data from Site
Distance From Source (ft)
Co
nce
ntr
atio
n (
mg
/L)
Return to Input View Plume Output

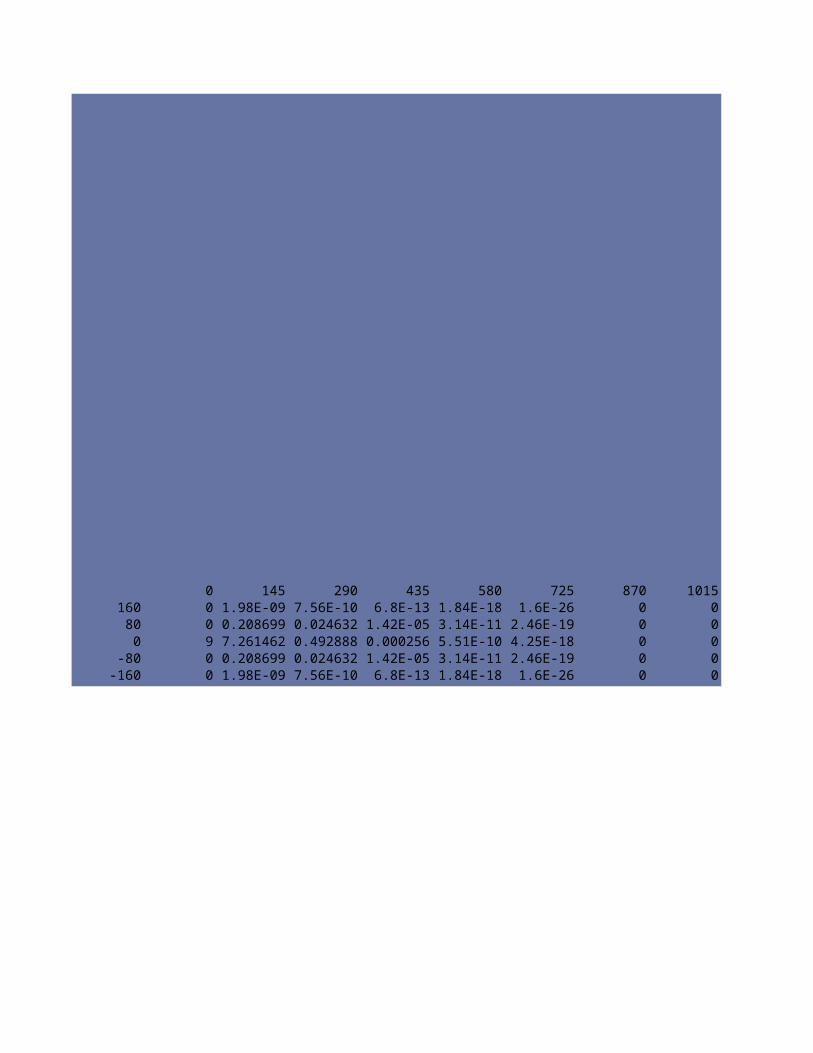
870 1015 1160 1305 1450 160 00 0 0 0 0 160 00 0 0 0 0 80 00 0 0 0 0 0 90 0 0 0 0 -80 00 0 0 0 0 -160 0
10
0.250.5
0.751
1.251.5
1.752
2.252.5
2.753
3.253.5
3.754
4.254.5
4.755

145 290 435 580 725 870 1015 11601.976E-09 7.56E-10 6.803E-13 1.841E-18 1.597E-26 0 0 00.208699 0.024632 1.415E-05 3.14E-11 2.46E-19 0 0 07.261462 0.492888 0.000256 5.506E-10 4.254E-18 0 0 00.208699 0.024632 1.415E-05 3.14E-11 2.46E-19 0 0 0
1.976E-09 7.56E-10 6.803E-13 1.841E-18 1.597E-26 0 0 0
1305 14500 00 00 00 00 0

DISSOLVED HYDROCARBON CONCENTRATION ALONG PLUME CENTERLINE (mg/L at Z=0)
Distance from Source (ft)
TYPE OF MODEL 0 145 290 435 580 725 870 1015 1160 1305 1450
No Degradation #VALUE! #VALUE! #VALUE! #VALUE! #VALUE! #VALUE! #VALUE! #VALUE! #VALUE! #VALUE! #VALUE!
1st Order Decay 9.000 #VALUE! #VALUE! #VALUE! #VALUE! #VALUE! #VALUE! #VALUE! #VALUE! #VALUE! #VALUE!
Inst. Reaction #VALUE! #VALUE! #VALUE! #VALUE! #VALUE! #VALUE! #VALUE! #VALUE! #VALUE! #VALUE! #VALUE!
Field Data from Site 9.000 8.000 1.000 0.020 0.005
Time:
5.00 YearsNext Timestep
Prev Timestep
CalculateAnimation Recalculate This Sheet
0 200 400 600 800 1000 1200 1400 1600
0.00
1.00
2.00
3.00
4.00
5.00
6.00
7.00
8.00
9.00
10.001st Order Decay Instantaneous Reaction No Degradation Field Data from Site
Distance From Source (ft)
Co
nc
en
tra
tio
n
(mg
/L)
Return to Input
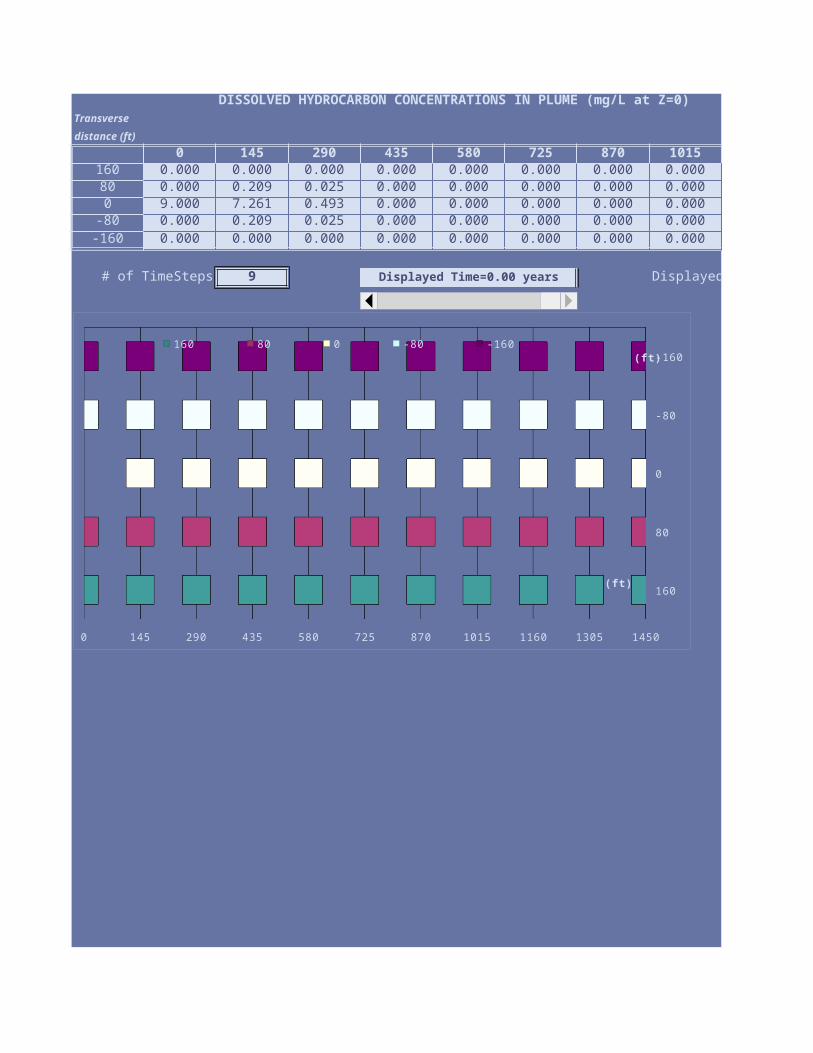
DISSOLVED HYDROCARBON CONCENTRATIONS IN PLUME (mg/L at Z=0)Transverse
distance (ft)
1 0 145 290 435 580 725 870160 0.000 0.000 0.000 0.000 0.000 0.000 0.00080 0.000 0.209 0.025 0.000 0.000 0.000 0.0000 9.000 7.261 0.493 0.000 0.000 0.000 0.000
-80 0.000 0.209 0.025 0.000 0.000 0.000 0.000-160 0.000 0.000 0.000 0.000 0.000 0.000 0.000
# of TimeSteps 9 Displayed Time=0.00 years
1
0 145 290 435 580 725 870 1015 1160 1305 1450
160
80
0
-80
-160
160 80 0 -80 -160
(ft)
(ft)
0 145 290 435 580 725 870160 0 1.976E-09 7.56E-10 6.803E-13 1.841E-18 1.597E-26 0
80 0 0.208699 0.024632 1.415E-05 3.14E-11 2.46E-19 00 9 7.261462 0.492888 0.000256 5.506E-10 4.254E-18 0
-80 0 0.208699 0.024632 1.415E-05 3.14E-11 2.46E-19 0-160 0 1.976E-09 7.56E-10 6.803E-13 1.841E-18 1.597E-26 0

DISSOLVED HYDROCARBON CONCENTRATIONS IN PLUME (mg/L at Z=0) Model to Display:
Distance from Source (ft)
1015 1160 1305 14500.000 0.000 0.000 0.0000.000 0.000 0.000 0.0000.000 0.000 0.000 0.0000.000 0.000 0.000 0.0000.000 0.000 0.000 0.000
Displayed Model: No Degradation
0 145 290 435 580 725 870 1015 1160 1305 1450
160
80
0
-80
-160
160 80 0 -80 -160
(ft)
(ft)
Return to Input
Show '1st order Decay' Model
View Centerline Output
Show 3D Surface

1015 1160 1305 1450 0 1450 0 0 0 160 0 1.976E-090 0 0 0 80 0 0.2086990 0 0 0 0 9 7.2614620 0 0 0 -80 0 0.2086990 0 0 0 -160 0 1.976E-09
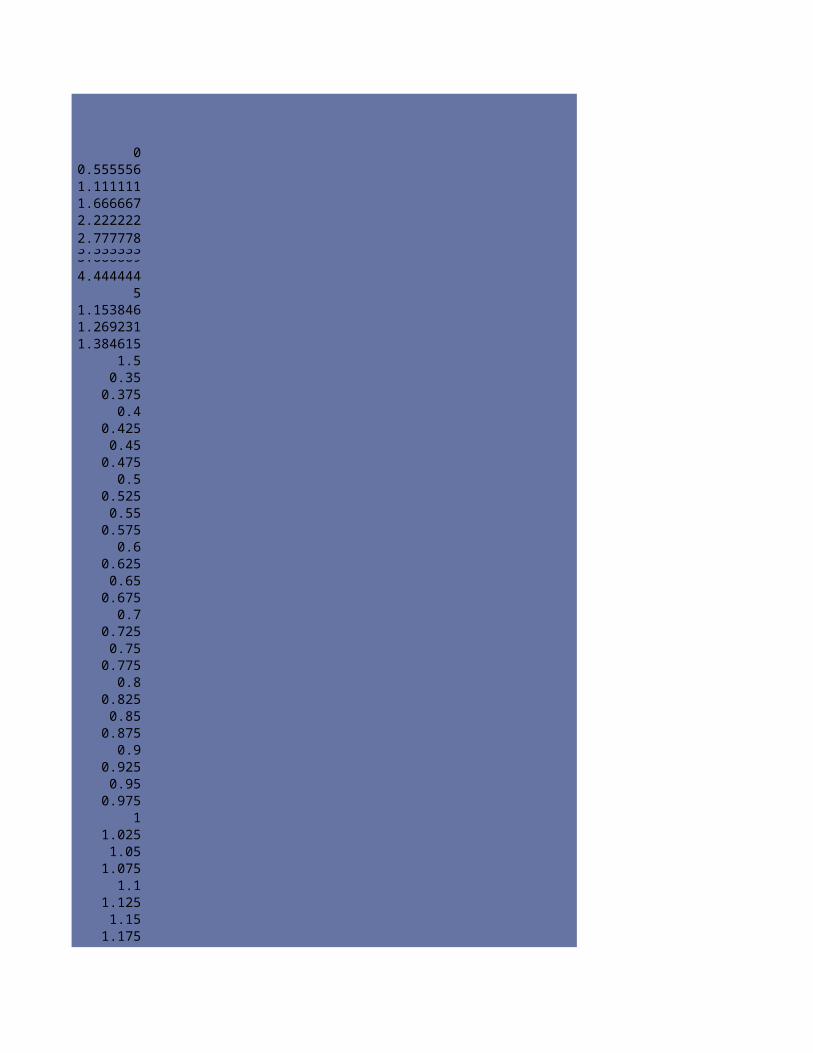
00.5555561.1111111.6666672.2222222.7777783.3333333.8888894.444444
51.1538461.2692311.384615
1.50.35
0.3750.4
0.4250.45
0.4750.5
0.5250.55
0.5750.6
0.6250.65
0.6750.7
0.7250.75
0.7750.8
0.8250.85
0.8750.9
0.9250.95
0.9751
1.0251.05
1.0751.1
1.1251.15
1.175
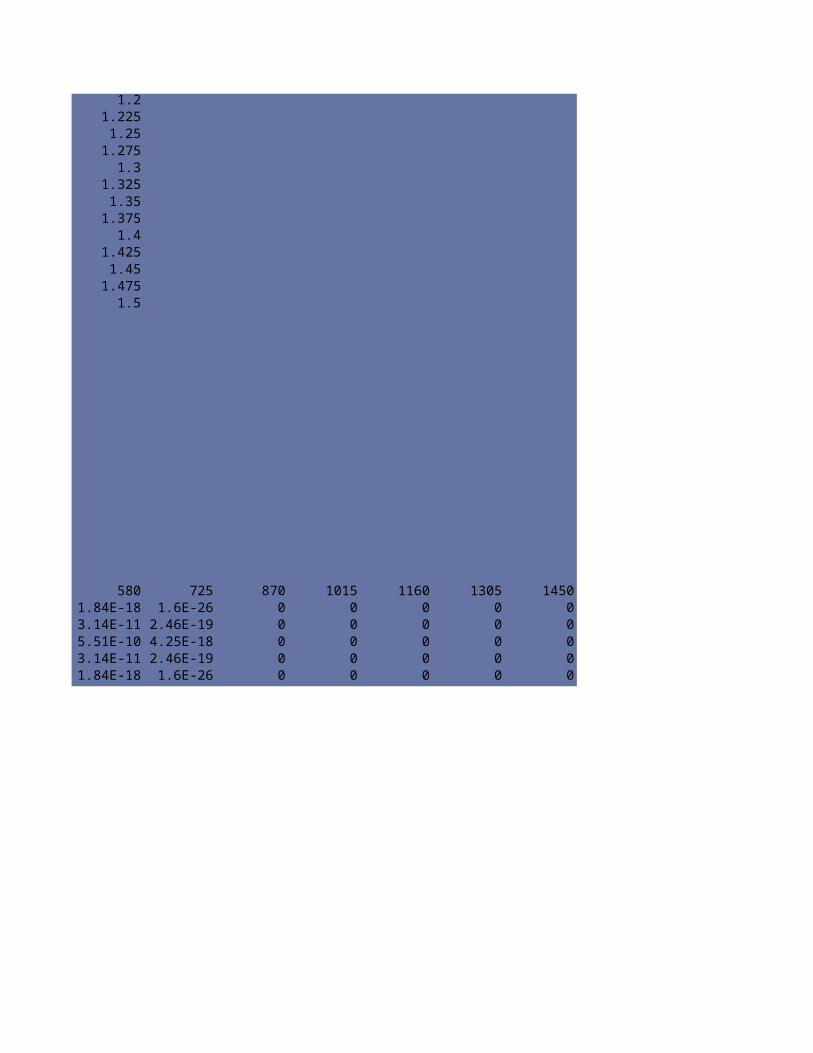
1.21.225
1.251.275
1.31.325
1.351.375
1.41.425
1.451.475
1.5
290 435 580 725 870 1015 1160 13057.56E-10 6.803E-13 1.841E-18 1.597E-26 0 0 0 00.024632 1.415E-05 3.14E-11 2.46E-19 0 0 0 00.492888 0.000256 5.506E-10 4.254E-18 0 0 0 00.024632 1.415E-05 3.14E-11 2.46E-19 0 0 0 07.56E-10 6.803E-13 1.841E-18 1.597E-26 0 0 0 0
145000000

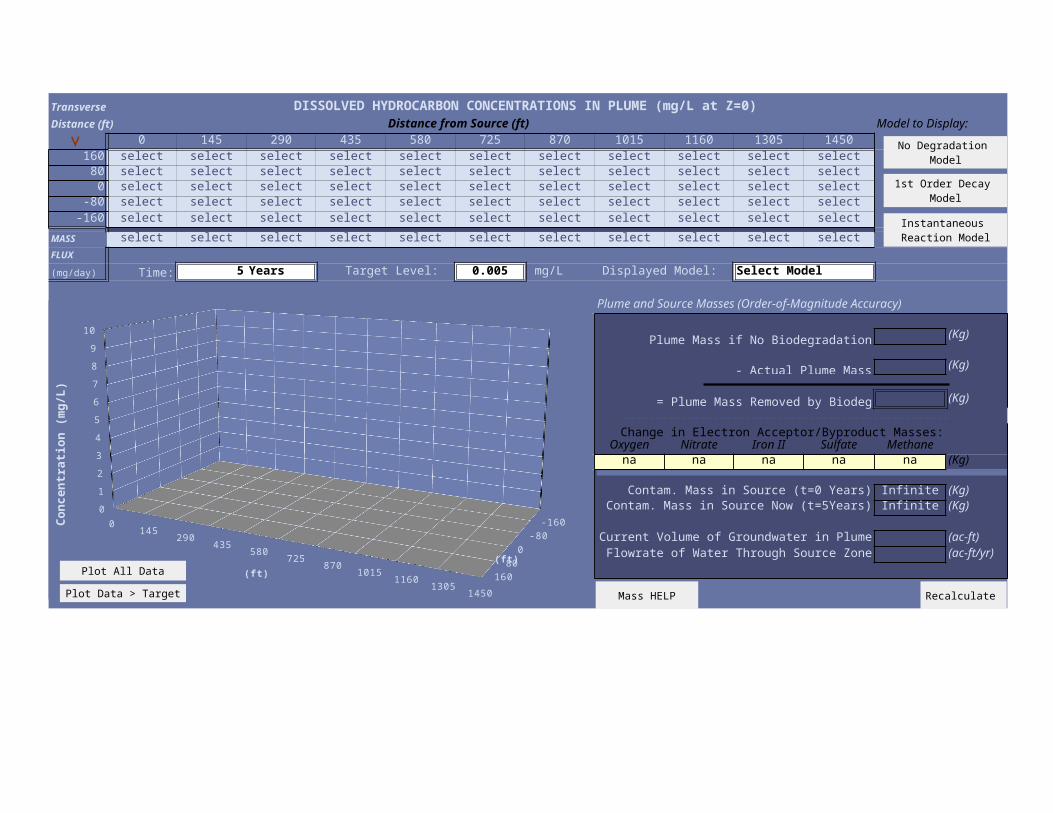
Transverse DISSOLVED HYDROCARBON CONCENTRATIONS IN PLUME (mg/L at Z=0)Distance (ft) Distance from Source (ft) Model to Display:
0 145 290 435 580 725 870 1015 1160 1305 1450160 select select select select select select select select select select select
80 select select select select select select select select select select select0 select select select select select select select select select select select
-80 select select select select select select select select select select select-160 select select select select select select select select select select select
MASS select select select select select select select select select select select
FLUX
(mg/day) Time: 5 Years Target Level: 0.005 mg/L Displayed Model: Select Model
Plume and Source Masses (Order-of-Magnitude Accuracy)
Plume Mass if No Biodegradation (Kg)
- Actual Plume Mass (Kg)
= Plume Mass Removed by Biodeg (Kg)
Change in Electron Acceptor/Byproduct Masses:Oxygen Nitrate Iron II Sulfate Methane
na na na na na (Kg)
Contam. Mass in Source (t=0 Years) Infinite (Kg)Contam. Mass in Source Now (t=5Years) Infinite (Kg)
Current Volume of Groundwater in Plume (ac-ft) Flowrate of Water Through Source Zone (ac-ft/yr)
0145
290435
580725
8701015
11601305
1450
0
1
2
3
4
5
6
7
8
9
10
16080
0-80
-160
(ft)
Co
nce
ntr
atio
n (
mg
/L)
(ft)
Recalculate
No Degradation Model
1st Order Decay Model
Instantaneous Reaction Model
Plot All Data
Plot Data > Target Mass HELP

dlgDensity
Page 19
Input Contaminant Density
OK
Cancel
g/mL
Select primary contaminant in listbox on left. Typical density appears in text box to right.If you have another density value, enter that into the text box at right.
Constituent Density
Related Documents