COLLEGE PHYSICS Chapter # Chapter Title PowerPoint Image Slideshow PSYCHOLOGY Chapter 3 BIOPSYCHOLOGY PowerPoint Image Slideshow

Biopsychology_OSch03_imageslideshow
Aug 12, 2015
Welcome message from author
This document is posted to help you gain knowledge. Please leave a comment to let me know what you think about it! Share it to your friends and learn new things together.
Transcript

PSYCHOLOGYChapter 3 BIOPSYCHOLOGY
PowerPoint Image Slideshow

FIGURE 3.1
Different brain imaging techniques provide scientists with insight into different aspects of how the human brain functions. Left to right, PET scan (positron emission tomography), CT scan (computed tomography), and fMRI (functional magnetic resonance imaging) are three types of scans. (credit “left”: modification of work by Health and Human Services Department, National Institutes of Health; credit “center”: modification of work by “Aceofhearts1968”/Wikimedia Commons; credit “right”: modification of work by Kim J, Matthews NL, Park S.)

FIGURE 3.2
Normal blood cells travel freely through the blood vessels, while sickle-shaped cells form blockages preventing blood flow.
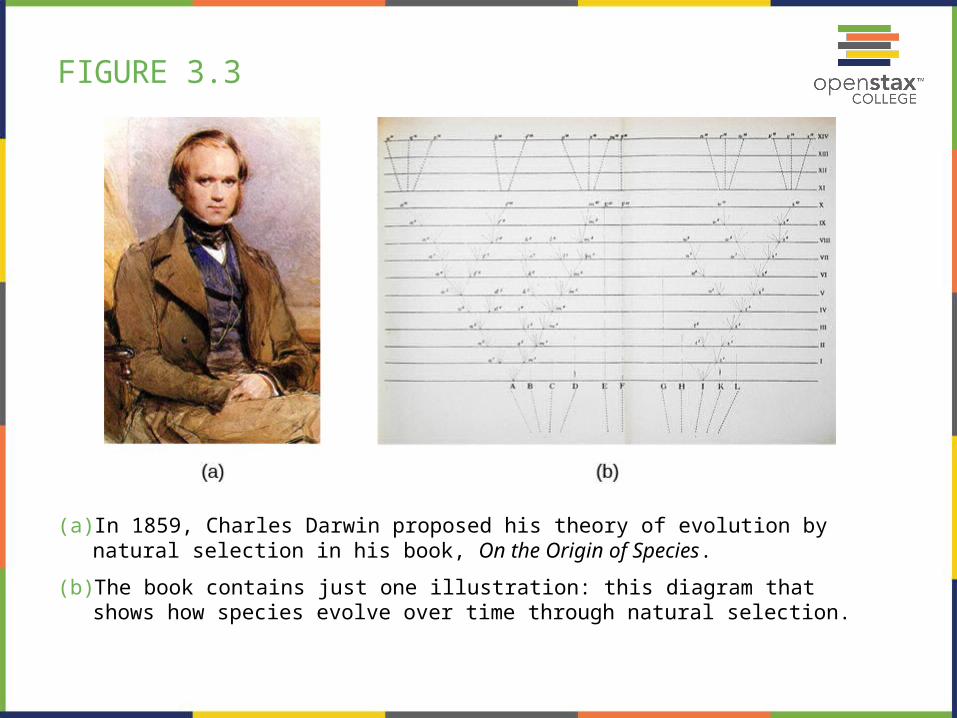
FIGURE 3.3
(a) In 1859, Charles Darwin proposed his theory of evolution by natural selection in his book, On the Origin of Species.
(b) The book contains just one illustration: this diagram that shows how species evolve over time through natural selection.

FIGURE 3.4
(a) Genotype refers to the genetic makeup of an individual based on the genetic material (DNA) inherited from one’s parents.
(b) Phenotype describes an individual’s observable characteristics, such as hair color, skin color, height, and build. (credit a: modification of work by Caroline Davis; credit b: modification of work by Cory Zanker)

FIGURE 3.5
(a) A Punnett square is a tool used to predict how genes will interact in the production of offspring. The capital B represents the dominant allele, and the lowercase b represents the recessive allele. In the example of the cleft chin, where B is cleft chin (dominant allele), wherever a pair contains the dominant allele, B, you can expect a cleft chin phenotype. You can expect a smooth chin phenotype only when there are two copies of the recessive allele, bb.
(b) A cleft chin, shown here, is an inherited trait.
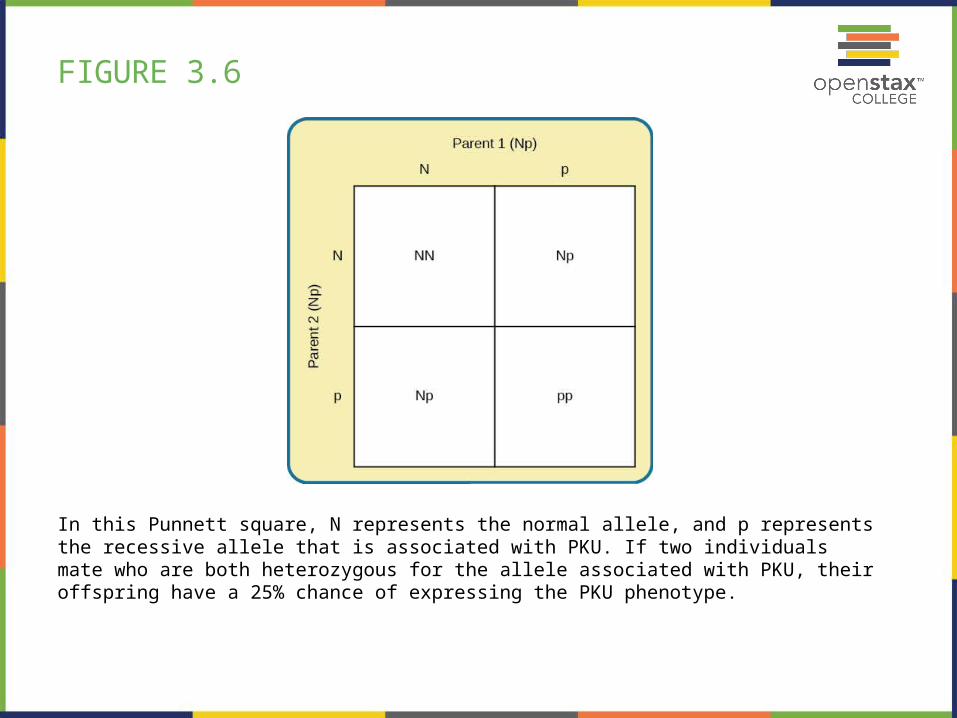
FIGURE 3.6
In this Punnett square, N represents the normal allele, and p represents the recessive allele that is associated with PKU. If two individuals mate who are both heterozygous for the allele associated with PKU, their offspring have a 25% chance of expressing the PKU phenotype.

FIGURE 3.7
Nature and nurture work together like complex pieces of a human puzzle. The interaction of our environment and genes makes us the individuals we are. (credit “puzzle”: modification of work by Cory Zanker; credit “houses”: modification of work by Ben Salter; credit “DNA”: modification of work by NHGRI)

FIGURE 3.8
This illustration shows a prototypical neuron, which is being myelinated.
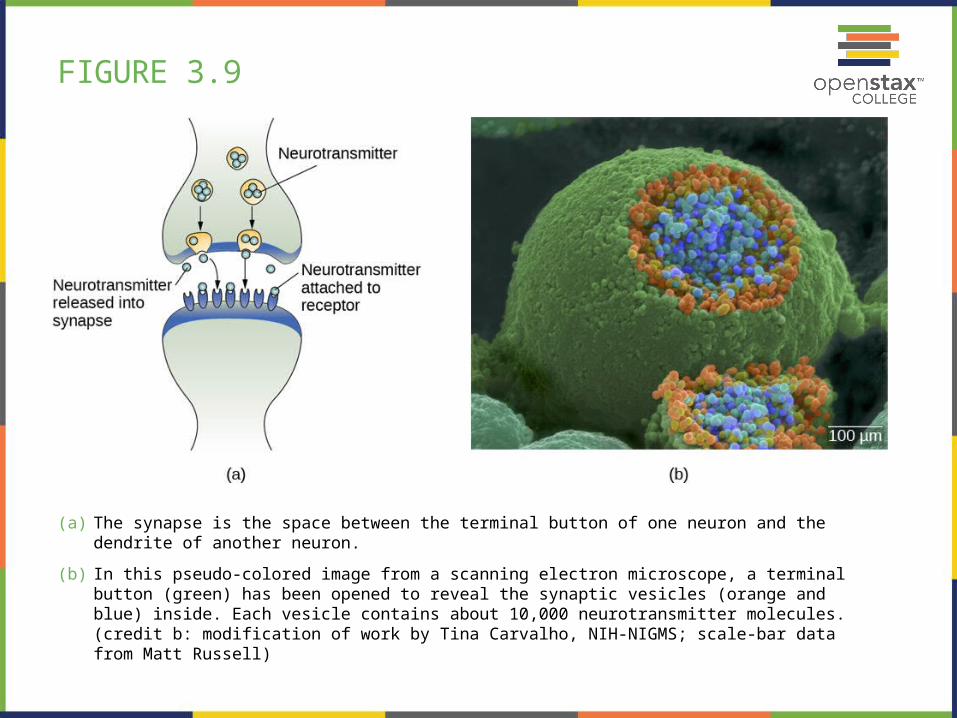
FIGURE 3.9
(a) The synapse is the space between the terminal button of one neuron and the dendrite of another neuron.
(b) In this pseudo-colored image from a scanning electron microscope, a terminal button (green) has been opened to reveal the synaptic vesicles (orange and blue) inside. Each vesicle contains about 10,000 neurotransmitter molecules. (credit b: modification of work by Tina Carvalho, NIH-NIGMS; scale-bar data from Matt Russell)
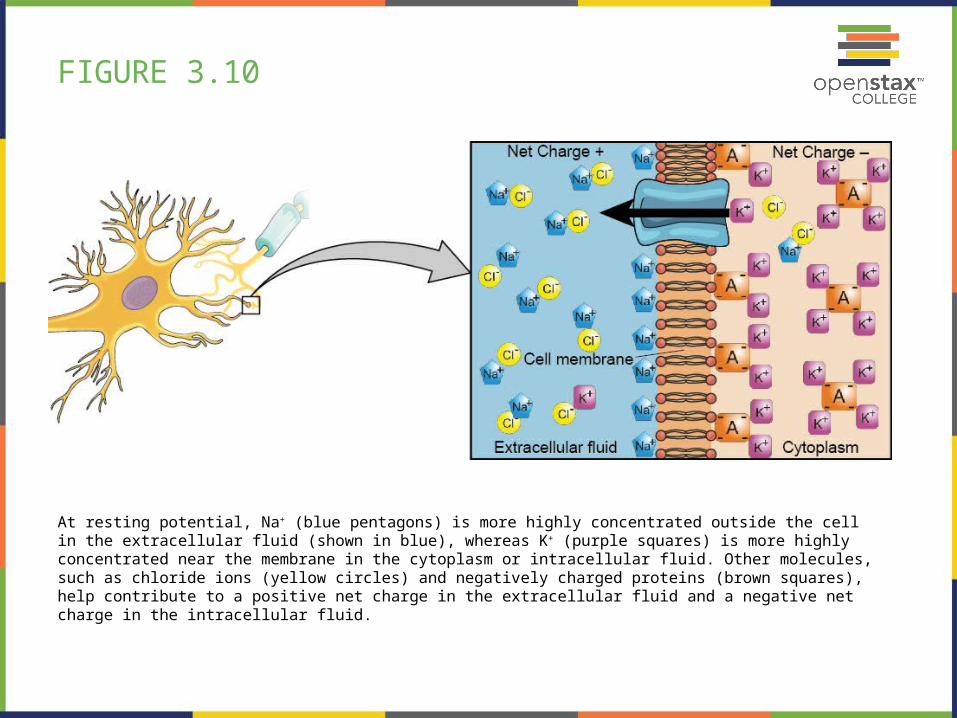
FIGURE 3.10
At resting potential, Na+ (blue pentagons) is more highly concentrated outside the cell in the extracellular fluid (shown in blue), whereas K+ (purple squares) is more highly concentrated near the membrane in the cytoplasm or intracellular fluid. Other molecules, such as chloride ions (yellow circles) and negatively charged proteins (brown squares), help contribute to a positive net charge in the extracellular fluid and a negative net charge in the intracellular fluid.

FIGURE 3.11
During the action potential, the electrical charge across the membrane changes dramatically.

FIGURE 3.12
Reuptake involves moving a neurotransmitter from the synapse back into the axon terminal from which it was released.

FIGURE 3.13
The nervous system is divided into two major parts:
(a) the Central Nervous System and
(b) the Peripheral Nervous System.

FIGURE 3.14
The sympathetic and parasympathetic divisions of the autonomic nervous system have the opposite effects on various systems.

FIGURE 3.15
The surface of the brain is covered with gyri and sulci. A deep sulcus is called a fissure, such as the longitudinal fissure that divides the brain into left and right hemispheres. (credit: modification of work by Bruce Blaus)

FIGURE 3.16
(a, b) The corpus callosum connects the left and right hemispheres of the brain. (c) A scientist spreads this dissected sheep brain apart to show the corpus callosum between the hemispheres. (credit c: modification of work by Aaron Bornstein)
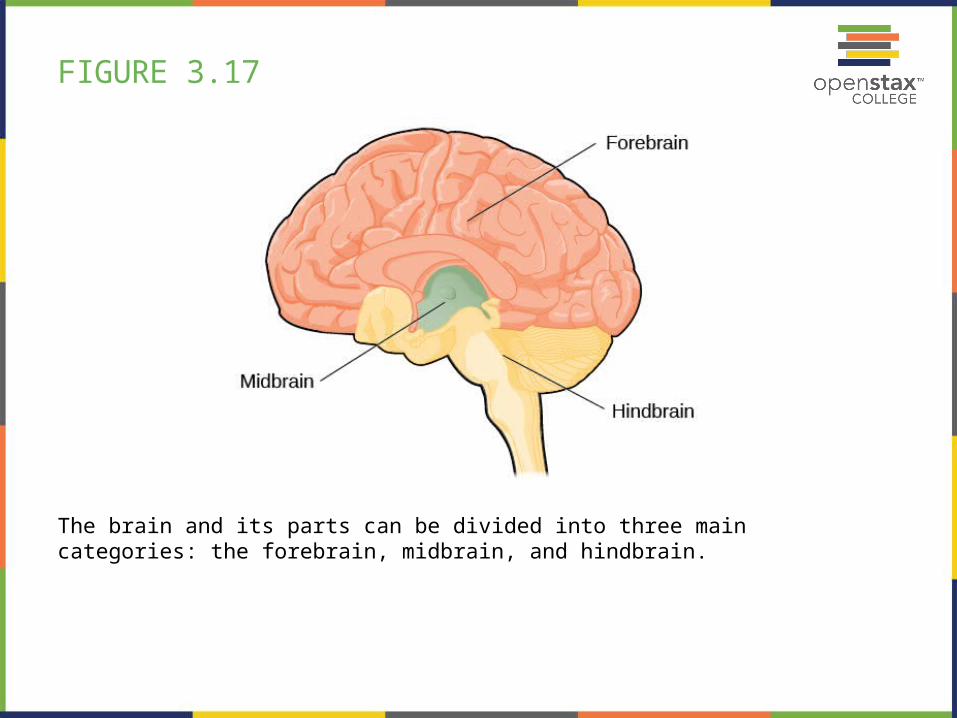
FIGURE 3.17
The brain and its parts can be divided into three main categories: the forebrain, midbrain, and hindbrain.

FIGURE 3.18
The lobes of the brain are shown.
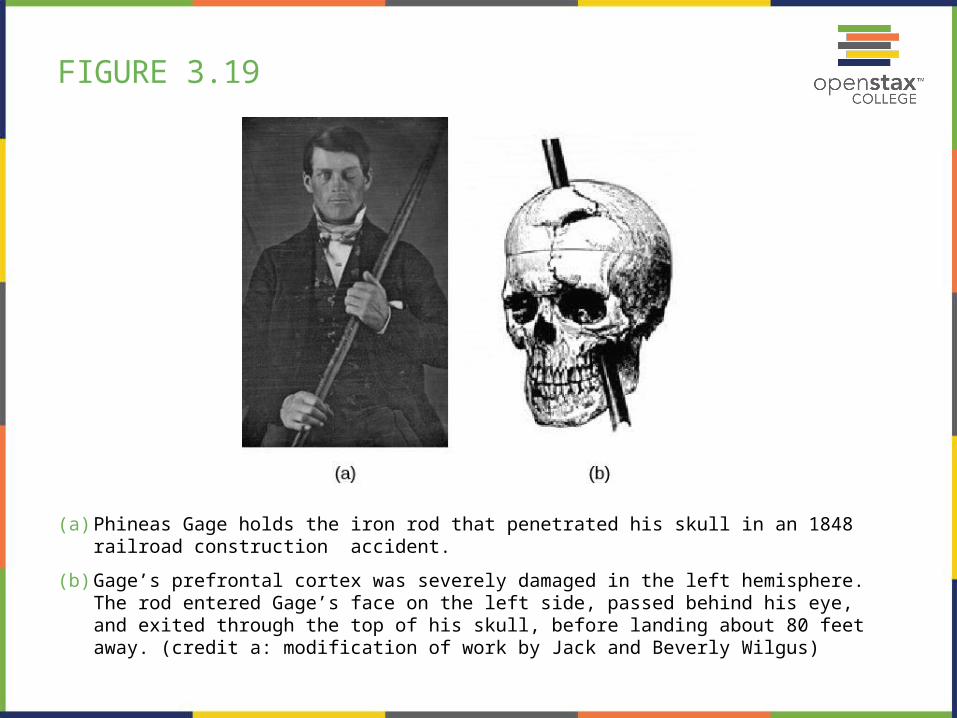
FIGURE 3.19
(a) Phineas Gage holds the iron rod that penetrated his skull in an 1848 railroad construction accident.
(b) Gage’s prefrontal cortex was severely damaged in the left hemisphere. The rod entered Gage’s face on the left side, passed behind his eye, and exited through the top of his skull, before landing about 80 feet away. (credit a: modification of work by Jack and Beverly Wilgus)
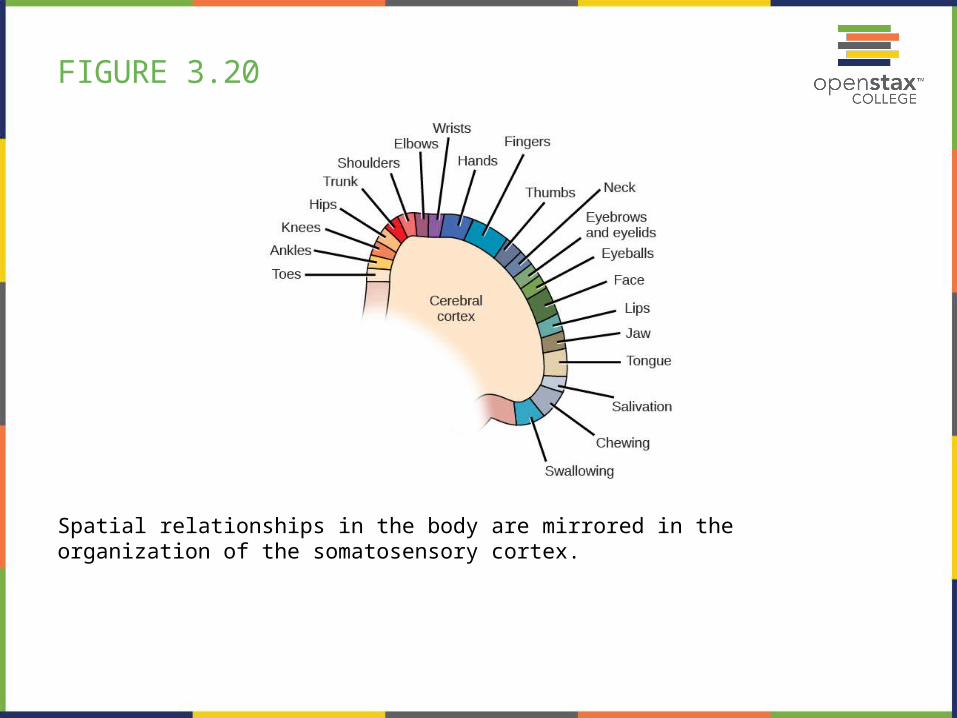
FIGURE 3.20
Spatial relationships in the body are mirrored in the organization of the somatosensory cortex.

FIGURE 3.21
Damage to either Broca’s area or Wernicke’s area can result in language deficits. The types of deficits are very different, however, depending on which area is affected.

FIGURE 3.22
The thalamus serves as the relay center of the brain where most senses are routed for processing.

FIGURE 3.23
The limbic system is involved in mediating emotional response and memory.
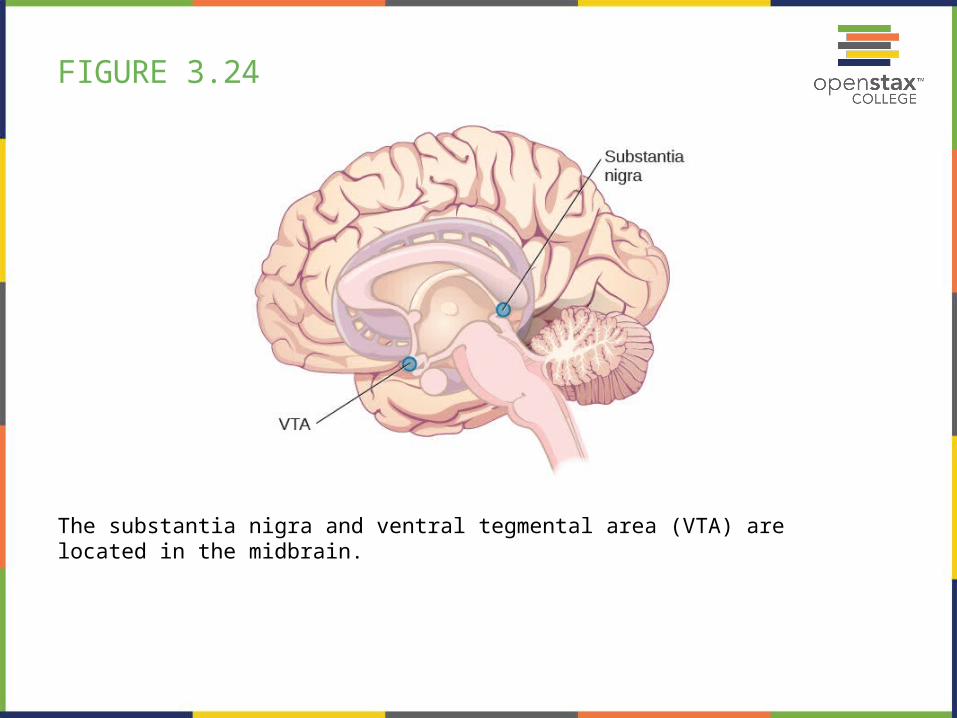
FIGURE 3.24
The substantia nigra and ventral tegmental area (VTA) are located in the midbrain.

FIGURE 3.25
The pons, medulla, and cerebellum make up the hindbrain.

FIGURE 3.26
A CT scan can be used to show brain tumors. (a) The image on the left shows a healthy brain, whereas (b) the image on the right indicates a brain tumor in the left frontal lobe. (credit a: modification of work by “Aceofhearts1968”/Wikimedia Commons; credit b: modification of work by Roland Schmitt et al)

FIGURE 3.27
A PET scan is helpful for showing activity in different parts of the brain. (credit: Health and Human Services Department, National Institutes of Health)
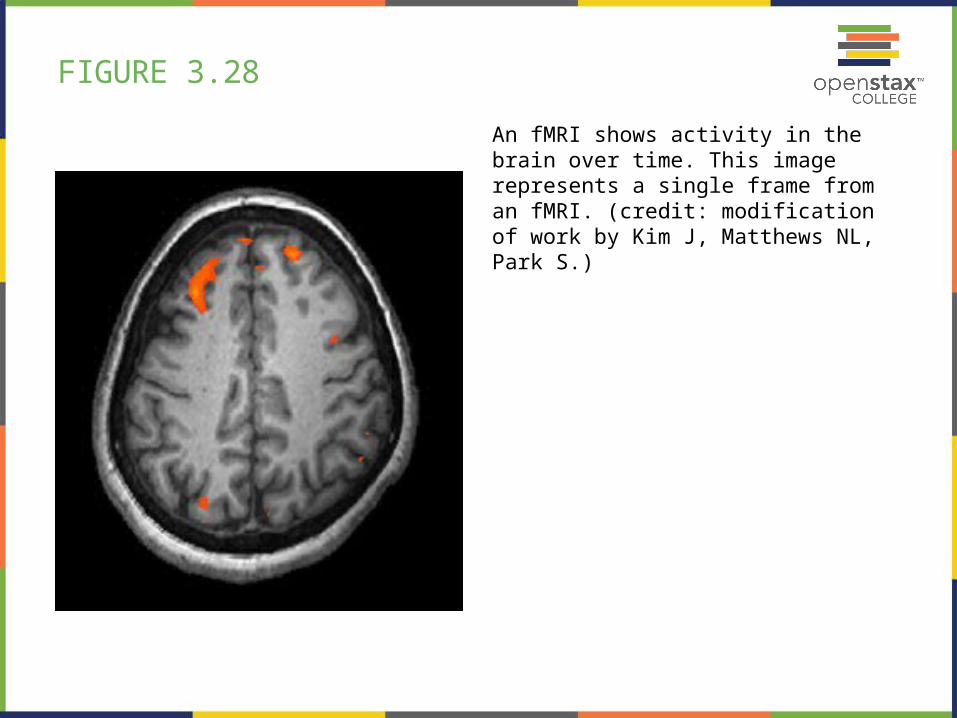
FIGURE 3.28
An fMRI shows activity in the brain over time. This image represents a single frame from an fMRI. (credit: modification of work by Kim J, Matthews NL, Park S.)
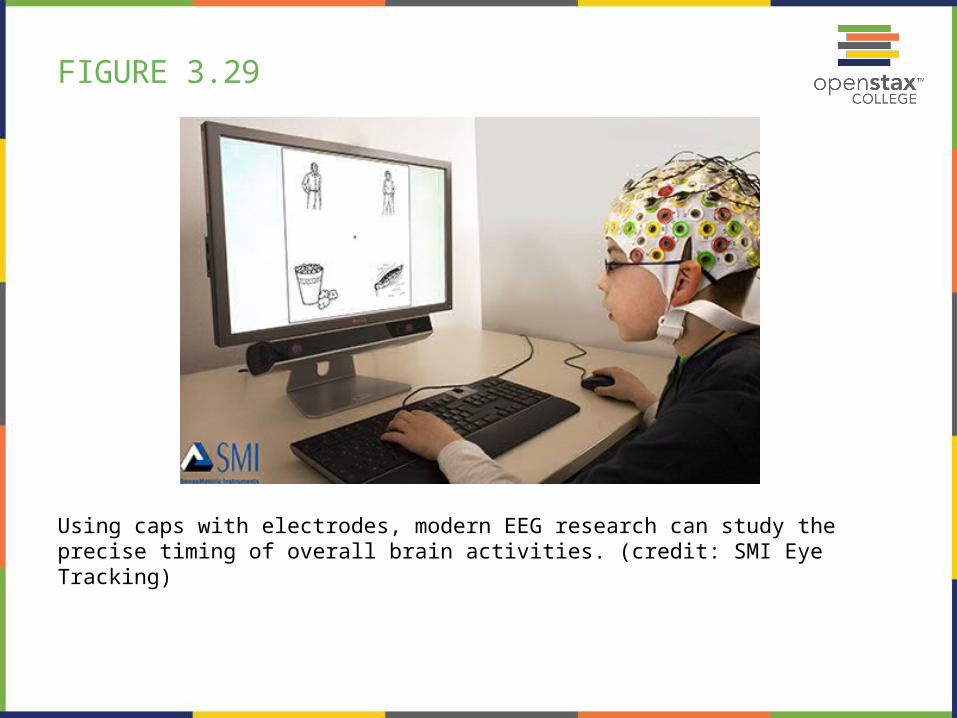
FIGURE 3.29
Using caps with electrodes, modern EEG research can study the precise timing of overall brain activities. (credit: SMI Eye Tracking)

FIGURE 3.30
The major glands of the endocrine system are shown.