Biophysical response to the 1997-98 And 2009-10 El Niño events in the equatorial Pacific Ocean Michelle M. Gierach 1 , Tong Lee 1 , Daniela Turk 2,3 , and Michael McPhaden 4 1 Jet Propulsion Laboratory / California Institute of Technology 2 Dalhousie University 3 Lamont-Doherty Earth Observatory, Earth Institute at Columbia University 4 NOAA Pacific Marine Environmental Laboratory PO.DAAC Physical Oceanography Data Active Archive Center Gierach, M.M., T. Lee, D. Turk, and M.J. McPhaden, 2012: Biological response to the 1997-98 and 2009-10 El Niño events in the equatorial Pacific Ocean. Geophys. Res. Lett., 39, L10602, doi: 10.10.29/2012GL051103.

Welcome message from author
This document is posted to help you gain knowledge. Please leave a comment to let me know what you think about it! Share it to your friends and learn new things together.
Transcript
Biophysical response to the 1997-98 And 2009-10 El Niño events in the equatorial Pacific Ocean
Michelle M. Gierach1, Tong Lee1, Daniela Turk2,3, and Michael McPhaden4
1Jet Propulsion Laboratory / California Institute of Technology
2Dalhousie University 3Lamont-Doherty Earth Observatory, Earth Institute at Columbia University
4NOAA Pacific Marine Environmental Laboratory
PO.DAAC Physical Oceanography
Data Active Archive Center
Gierach, M.M., T. Lee, D. Turk, and M.J. McPhaden, 2012: Biological response to the 1997-98 and 2009-10 El Niño events in the equatorial Pacific Ocean. Geophys. Res. Lett., 39, L10602, doi:10.10.29/2012GL051103.

MA03CH09-Chavez ARI 8 November 2010 9:37
Picoplankton1 µm
m
50–1,000 µm
Diatoms5–50 µm
Nutrients
b Open ocean
a Coastal
Micro!agellates3–10 µm
Nutrients
mm
~15 cm
~15 cm
mm
Figure 2A conceptual model of (a) coastal and (b) open ocean pelagic ecosystems. Near coasts where nutrients areabundant, dense, colonial, centric diatom blooms form. Biomass accumulates because diatoms outgrow theirmacrozooplanktonic predators and primary production can be transferred rapidly to small plentiful fish. Thefood chain is short and efficient but leaky in that a large fraction of production is exported from the coastalupper layer. In the open ocean, under low nutrient input, photosynthetic picoplanktonic organismsdominate. The consumers of picoplankton are also very small and have growth rates similar to their prey.Scarce nutrients are recycled and retained in the upper layer. Modified from Chavez et al. (2002).
indicator of phytoplankton abundance, even though its relation to phytoplankton carbon changessignificantly with light intensity, nutrient availability, and species composition (Geider 1987).
A conceptual model of pelagic ecosystems envisions two general types: eutrophic coastal andoligotrophic open ocean (Chavez et al. 2002) (Figure 2). Near coasts where nutrients are abundant,dense and often transient blooms of colonial centric diatoms develop. Biomass accumulates becausediatoms outgrow their microbial competitors and macrozooplanktonic predators. In this coastalecosystem, biomass can be transferred rapidly from diatoms to small, plentiful fish (Ryther 1969).Although the coastal food chain is short and thus efficient, it is also leaky in the sense that a relativelylarge fraction of production is often exported (Muller-Karger et al. 2005) either by sinking, wherethe exported production can support a rich benthic fauna or, alternately, result in anoxia (Margalef1978), or by horizontal advection away from the coast (Olivieri & Chavez 2000, Pennington et al.2010). In contrast, in the oligotrophic open ocean, small, photosynthetic picoplankton dominate.The grazers of picoplankton are also small and have growth rates similar to their prey. This smallpredator–prey community comprises the so-called microbial food web, characterized as a complex,low-nutrient input system that exports little of its production (e.g., nonleaky) (Azam et al. 1983,Pomeroy 1974) (Figure 2). Much fewer higher-trophic-level or fisheries resources are supportedby picoplankton ecosystems because of low nutrient input, efficient internal recycling of nutrients,and the need for multiple trophic transfers to transform picoplankton production to living marineresources.
www.annualreviews.org • Marine Primary Production and Climate 231
Ann
u. R
ev. M
arin
e. S
ci. 2
011.
3:22
7-26
0. D
ownl
oade
d fr
om w
ww
.ann
ualre
view
s.org
by W
este
rn M
ichi
gan
Uni
vers
ity o
n 05
/31/
11. F
or p
erso
nal u
se o
nly.
Food Web
Nature © Macmillan Publishers Ltd 1997
letters to nature
NATURE | VOL 389 | 16 OCTOBER 1997 717
warm pool with good accuracy5, and could improve the forecast inthe location of the convergence. The lead time of prediction offavourable fishing grounds could therefore probably be increased bythe use of these models. Such forecasts could result in improvedcatches and considerable reductions in searching time and costs forthe fishing fleet.
The warm pool is characterized by low primary productivity(coastal waters excepted), which contrasts strongly with theenriched water masses of the adjacent central and eastern Pacificequatorial upwelling1,21. Given the very high energetic requirementsof skipjack22, and the short trophic linkage between their diet ofepipelagic zooplankton and micronekton23–25 and the primaryproductivity of the surface layer, it is initially counter-intuitivethat the world’s largest tuna stock occurs in the oligotrophic westernPacific warm pool. Our results indicate that the presence of a largefront of oceanic convergence is probably important for maintainingthe skipjack stock in the warm pool. However, mechanisms thatprovide the necessary biomass of forage for the skipjack tuna stockhave not yet been identified. A plausible explanation could involvethe zonal transport of planktonic communities originating in thePacific equatorial upwelling by the westwards-flowing south equa-torial current. Such zonal equatorial advection can produce west-ward displacement of planktonic communities of 1,800–2,500 km(refs 26, 27). During this westward transport, the planktoniccommunity would mature for up to several months, consistentwith the residence time of 3–4 months of drifting buoys in the 58 N–58 S equatorial divergence zone27. Westward transport would termi-nate on exiting the westward flow, through lateral drift or encoun-
tering the convergence zone at the eastern edge of the warm pool.The increasing mobility of the organisms through the upper trophiclevels28 and the large ENSO-related zonal movements of the con-vergence zone are likely to increase the patchiness of the spatialdistribution of the secondary and tertiary production in a largezonal band associated with the physical front. The location of highabundance of skipjack tuna, centred on the longitudinal gravitycentre of CPUE and extending about 148 in longitude (�onestandard deviation), may reflect this zone of enrichment in second-ary and tertiary production. Unfortunately, direct observation ofzooplankton and micronekton distributions on a spatial andtemporal scale that would be required to test the mechanismdescribed above remains problematic. Recently developed physi-cal–biological coupled models29 (P.L., unpublished data) are apromising means of investigating potential causal mechanismsassociated with the strong relationship we have observed betweenskipjack tuna abundance, the water mass convergence at the easternedge of the warm pool, and their drastic zonal displacementsassociated with ENSO. Because the signal is strong and the correla-tion high, the relationship could be a useful test of these models. Theprediction of ENSO and, as a consequence, the location of thehighest abundance of skipjack tuna, has important implications forthe commercial tuna fishing industry. It may also allow fisheriesmanagement authorities to distinguish between changes in local fishabundance caused by movement to other areas, and changesresulting from the impacts of fishing. M. . . . . . . . . . . . . . . . . . . . . . . . . . . . . . . . . . . . . . . . . . . . . . . . . . . . . . . . . . . . . . . . . . . . . . . . . . . . . . . . . . . . . . . . . . . . . . . . . . . . . . . . . . . . . . . . . . . . . . . . .
Methods
Gravity centre of CPUE. CPUE as an index of fish stock abundance will bemost reliable when the sampling units (fishing vessels) are as homogeneous intheir characteristics and operating behaviour as possible16. We used only UnitedStates purse seine CPUE data because: this highly mobile fleet consists ofsimilar vessels using similar fishing techniques; unlike other purse seine fleets,this fleet has had virtually unrestricted access since 1988 to the exclusiveeconomic zones of Pacific Island countries under the South Pacific Tuna Treaty,as well as adjacent high seas; and catch and effort data quality and coverage forlog books submitted by the fleet is high. The time–longitude section ofmonthly skipjack catch (in tonnes) and effort (in days fishing) was producedby aggregating the data in the area 58 N–58 S, 1208 E–1208 W by months and 18of longitude. The longitudinal gravity centre of CPUE in month j (Gj) is thendefined as: Gj ¼ �i LiðCij=EijÞ= �iðCij=EijÞ, where Li denotes the longitudinalmid-point of the ith area of 18 longitude width between 58 N and 58 S, Cij is theskipjack catch in area i in month j, and Eij is the number of fishing days in area iin month j.
Received 3 June; accepted 14 August 1997.
1. Longhurst, A., Sathyendranath, S., Platt, T. & Caverhill, C. An estimate of global primary productionin the ocean from satellite radiometer data. J. Plankton Res. 17, 1245–1271 (1995).
2. Kleiber, P., Argue, A. W. & Kearney, R. E. Assessment of Pacific skipjack tuna (Katsuwonus pelamis)resources by estimating standing stock and components of population turnover from tagging data.Can. J. Fish. Aquat. Sci. 44, 1122–1134 (1987).
3. McPhaden, M. J. & Picaut, J. El Nino-Southern Oscillation displacements of the Western EquatorialPacific warm pool. Science 50, 1385–1388 (1990).
4. Jin, F. F. Tropical ocean–atmosphere interaction, the Pacific cold tongue, and the El Nino–SouthernOscillation. Science 274, 76–78 (1996).
5. Picaut, J., Ioualalen, M., Menkes, C., Delcroix, T. & McPhaden, M. J. Mechanism of the zonaldisplacement of the Pacific warm pool: implications for ENSO. Science 274, 1486–1489 (1996).
6. Picaut, J. & Delcroix, T. Equatorial wave sequence associated with warm pool displacement during the1986–1989 El Nino–La Nina. J. Geophys. Res. 100, 18393–18408 (1995).
7. Kuroda, Y. & McPhaden, M. J. Variability in the Western Equatorial Pacific Ocean during JapanesePacific climate study cruises in 1989 and 1990. J. Geophys. Res. 98, 4747–4759 (1993).
8. Eldin, G., Rodier, M. & Radenac, M.-H. Physical and nutrient variability in the upper equatorialPacific associated with westerly wind forcing and wave activity in October 1994. Deep Sea Res. (in thepress).
9. Legeckis, R. Long waves in the eastern equatorial Pacific ocean: a view from a geostationary satellite.Science 197, 1179–1181 (1977).
10. Yamamoto, T. & Nishizawa, S. Small-scale zooplankton aggregations at the front of a Kuroshio warm-core ring. Deep Sea Res. 33, 1729–1740 (1986).
11. Yoder, J. A., Ackleson, S. G., Barber, R. T., Flament, P. & Balch, W. M. A line in the sea. Nature 371,689–692 (1994).
12. Power, J. H. Simulations of the effect of advective–diffusive processes on observations of planktonabundance and population rates. J. Plankton Res. 18, 1881–1896 (1996).
13. Flament, P., Kennan, S. C., Knox, R. A., Niiler, P. P. & Bernstein, R. L. The three-dimensional structureof an upper ocean vortex in the tropical Pacific ocean. Nature 383, 610–613 (1996).
14. Laurs, R. M., Fiedler, P. C. & Montgomery, D. R. Albacore tuna catch distributions relative toenvironmental features observed from satellites. Deep Sea Res. 31, 1085–1099 (1984).
Figure 3 Displacements of tagged skipjack tuna. a, Tuna released April 1991,
recaptured before February 1992. b, Tuna released May 1991, recaptured before
February 1992. c, Tuna released March 1992, recaptured before October 1992. For
clarity, only tagged fish recaptured in the zone 108 N–108 S and more than 108 of
longitude east or west of their release location are plotted. Tagging data were
compiled from records of a large-scale tagging programme carried out by the
South Pacific Commission during 1990 to 1992 (ref. 30). Thick arrows indicate the
directionandmagnitude of displacement of the skipjackCPUE gravitycentre (see
Methods) during the tag recapture periods.
Why is this important?
[Image from Chavez et al., 2011] 2

3 [Image from Chavez et al., 1999]
What is known? Fig. 1. Advanced VeryHigh Resolution Radi-ometer (AVHRR) SSTand SeaWiFS chlo-rophyll comparisonsfor January and July1998. SST anomalies inJanuary 1998 wereclose to the highestobserved during the ElNino. There is little orno evidence of theequatorial cold tongue(A) or of enhancedchlorophyll along theequator (B). In sharpcontrast, by July 1998,a dramatic recoveryhad taken place. Thereis a well-developedcold tongue (C) and adramatic bloom ofphytoplankton (D)along the equator.High chlorophyll con-centrations (!1 "g li-ter#1) had not previ-ously been observedover such a large area.The filled circles at 0°,155°W; 2°S, 170°W;and 2°N, 110°W markthe locations of TAOmoorings instrumentedwith biochemical sen-sors. The white linesrepresent the sectionsoccupied by ships thatservice the TAO array,from which data arepresented in this paper.
Zonal Wind (m s-1) 20°C Depth (m) SST (°C) Chlorophyll (µg l-1)
1997
1998
140°E 180° 140°W 100°W 140°E 180° 140°W 100°W 140°E 180° 140°W 100°W 140°E 180° 140°W 100°W
Fig. 2. Time-longitudesections of anomaliesin (A) surface zonalwinds (in meters persecond), (B) 20°Cisotherm depth (inmeters), (C) SST (indegrees Celsius), and(D) SeaWiFS chloro-phyll (in microgramsper liter) for 24months ending in No-vember 1998. Analysisis based on 5-day av-erages between 2°Nand 2°S of mooredtime series data fromthe TAO array and on8-day SeaWiFS com-posites. Anomalies arerelative to monthly cli-matologies fitted witha cubic spline to 5-dayintervals for TAO array data and relative to the full record for SeaWiFS.Squares on the abscissas indicate longitudes where TAO data were available.Major anomalies in the western Pacific wind field occurred on a 30- to60-day cycle (7) beginning in December 1996. Bursts of westerlies generatedKelvin waves that propagated across the Pacific at over 200 km day#1, asevident in the depth of the 20°C isotherm. The zonal wind anomaliesmigrated across the Pacific and reached the eastern Pacific early in 1998. The20°C anomalies reached their peak in the eastern Pacific in late 1997 and
began recovery in the central Pacific early in 1998, well before the SST. TheSST anomalies lagged the subsurface perturbations early in the event,became notable after April 1997, reached their peak in late 1997 and early1998, and recovered dramatically in late May 1998 when the trade windsresumed. Chlorophyll was low in the central and eastern Pacific and high inthe western Pacific in late 1997 and early 1998. High chlorophyll ($1 "gliter#1) appeared in the central Pacific in July and August 1998 and propa-gated eastward at 1.2 m s#1.
R E S E A R C H A R T I C L E S
www.sciencemag.org SCIENCE VOL 286 10 DECEMBER 1999 2127
on
Augu
st 5
, 201
1w
ww
.sci
ence
mag
.org
Dow
nloa
ded
from
El Niño El Niño
Neutral/La Niña Neutral/La Niña
• El Niño has a significant impact on biology and ecosystem in the tropical Pacific
• Previous studies focused on the biological response to the classic eastern Pacific (EP) El Niño

subject of the paper by Yeh et al.3 that appears on page 511 of this issue.
Normal conditions in the tropical Pacific are shown in Figure 1, and El Niño conditions in Figure 2a. But since the late 1970s, events with increased sea surface temperatures (SSTs) in the central Pacific, sandwiched by anoma-lous cooling in the east and west, have been observed4. These are not like the conventional El Niño: rather, the maximum SST anomaly persists in the central Pacific from the boreal summer through to the winter, modifying the atmospheric circulation and resulting in distinctly different global impacts4–10. This phenomenon has been viewed as a different ‘flavour’ of El Niño5, with warming around the Date Line rather than farther east6. In other studies4,9,10 it has been classified as a new type of tropical Pacific phenomenon, and named El Niño Modoki, or Pseudo El Niño, to stress the differences from the conventional El Niño. Other names, such as Central El Niño11 and Warm Pool El Niño12, have been proposed. But all of these refer to the same basic phe-nomenon, shown in Figure 2b, as viewed from slightly different standpoints.
What has caused this recent increased occur-rence of the new-flavour of El Niño, with its distinct impact on the northern Pacific SST, compared with the normal form? Some analy-ses of observational data attribute it to con-sequences of the prominent global warming4 since the late 1970s — which include changes in the zonal tilt of the thermocline4,12, the dis-tinctive subsurface oceanic boundary between warmer and colder water, and weakened low-level easterly winds in the equatorial region. Yeh et al.3 have investigated these possibili-ties further by taking the data set of observed SSTs since the 1850s, and other climate data since the 1950s, and subjecting all this infor-mation to detailed analysis in computer models
of ocean–atmosphere behaviour.Specifically, the authors compare the out-
comes of the models used by the Program for Climate Model Diagnosis and Intercomparison (PCMDI). The model outcomes derive from two types of simulation data run through 11 ocean–atmosphere climate models. The con-trol run represents twentieth-century climate change with anthropogenic and natural forcing up to 2000. The other run is from 100 years of a climate-change simulation based on the so-called global-warming SRES A1B scenario, in which levels of carbon dioxide are maintained at about 700 parts per million.
Yeh et al. call the canonical El Niño the Eastern Pacific (EP) El Niño, and the new phe-nomenon the Central Pacific (CP) El Niño. To define the EP events, they use a well-known measure, the NINO3 index, which is SST anomalies averaged over the area 5° N–5° S, 150° W–90° W. To define the CP events, they use a combination of the NINO3 and NINO4 indices, the latter an average of SST anomalies over 5° N–5° S, 160° E–150° W. They analyse the results from the individual model simulations as well as those aggregated by a multi-model, multi-ensemble method, a technique that is applied in operational dynamical seasonal prediction.
Through standardized error analysis, Yeh
et al. find that, in 8 models out of the 11 con-sidered, the occurrence ratio of the CP-El Niño to the EP-El Niño increases in the global-warming scenario as compared to the corres-ponding twentieth-century climate simulation. The ratio is significantly higher at 95% confi-dence level in the global-warming simulations of 4 models out of a subset of 6 with more accurate simulations of the currently observed occurrence ratio. Furthermore, the observed remote impacts on SSTs in the Northern Hemisphere are qualitatively evident in the aggregated atmospheric simulations from 9 models. We must take into account that almost all coupled models are biased in repre-senting ocean–atmosphere climatology and the El Niño SST pattern, intensity and frequency. Nonetheless, all these findings support the hypotheses that the increasing frequency of a new type of El Niño — Modoki, CP-El Niño, call it what you will — is due to global warm-ing, and that, as anthropogenic global warming intensifies, we may see more of these events at the expense of the conventional El Niño.
Much more investigation is needed of course. Only four of the models provide statistically significant support, and the cou-pled models in the PCMDI have flaws in the realistic simulation of basin-wide structure (see Fig. 4 of the authors’ Supplementary
Figure 1 | Normal conditions in the tropical Pacific.!Warm surface water and air are pushed to the west by prevailing winds. A consequence is upwelling of cold water on the eastern side, and a shallow thermocline (a subsurface boundary that marks a sharp contrast between warm upper waters and colder deeper waters). Opposite oceanographic conditions prevail on the western side. In the atmosphere, the west is warmer and wetter. Here and in Figure 2, redder colours denote warmer waters, bluer colours denote cooler waters.
120!E160!E
160!W120!W
80!W
20!S
20!N0!
Thermocline
120!E160!E
160!W120!W
80!W
20!S
20!N
0!
El Niño
La Niña La Niña Modoki
El Niño Modokia b
c d
Figure 2 | Anomalous conditions in the tropical Pacific.!a, An El Niño event is produced when the easterly winds weaken; sometimes, in the west, westerlies prevail. This condition is categorized by warmer than normal sea surface temperatures (SSTs) in the east of the ocean, and is associated with alterations in the thermocline and in the atmospheric circulation that make the east wetter and the west drier. b, An El Niño Modoki event is an anomalous condition of a distinctly different kind. The warmest SSTs occur in the central Pacific, flanked by colder waters to the east and west, and are associated with distinct patterns of atmospheric convection. c, d, The opposite (La Niña) phases of the El Niño and El Niño Modoki respectively. Yeh et al.3 argue that the increasing frequency of the Modoki condition is due to anthropogenic warming, and that these events in the central Pacific will occur more frequently if global warming increases.
483
NATURE|Vol 461|24 September 2009 NEWS & VIEWS
!"#$!%%&'()*&+,-&./()*&01&234/,--&&&!%:!"#$!%%&'()*&+,-&./()*&01&234/,--&&&!%: 667#78#&&&5%95"9!8667#78#&&&5%95"9!8
El Niño Modoki, CP-El Niño, warm-pool El Niño, or dateline El Niño
4
A New Flavor of El Niño : Central Pacific (CP) El Niño
[Image from Ashok and Yamagata, 2009]

El Niño amplitudes in CP (Niño4) & EP (Niño3) regions
• More frequent occurrence of CP-El Niño
• Increasing amplitude of El Niño in the CP region (Lee & McPhaden 2010) How does the biological response differ between CP- and EP-El Niño events?
5 [Image from Lee and McPhaden, 2010]

1997-98 EP-El Niño 2009-10 CP-El Niño Chlorophyll-a Anomaly
6
170E 170W 150W 130W 110W 90W!0.14
!0.12
!0.1
!0.08
!0.06
!0.04
!0.02
0
0.02
Longitude
Chl!a
Ano
maly
(mg
m!3 )
NDJ 1997!98NDJ 2009!10
(a) (b)
(h)(g)
(f)(e)
(d)(c)
Biological state associated with the two El Niño events
• Maximum chlorophyll-a (chl-a) reduction occurs in the EP region during the 1997 EP-El Niño and CP region during the 2009-10 CP-El Niño
[Gierach et al., 2012]

1997-98 EP-El Niño 2009-10 CP-El Niño
Zonal (Eastward) Surface Current Anomaly
Zonal (Eastward) Surface Wind Anomaly
• The extent and magnitude of physical responses between the two types of El Niño is governed by westerly wind anomalies, wherein responses are confined to the CP region during CP-El Niño and EP region during EP-El Niño
Physical state associated with the two El Niño events
[Gierach et al., 2012]
7

8
Using ECCO to investigate physical processes that cause difference in biological responses
• An adjoint passive tracer tool based on ECCO state estimation was used to assess the relative contributions of horizontal and vertical processes (Fukumori et al., 2004; Wang et al. 2004)
[Gierach et al., 2012]
• A uniform tracer was initialized in Dec. 1997 & 2009 in the top 50 m of the EP & CP regions
• The tracer was integrated backwards in time to trace water mass (nutrient supply) origin
http://ecco.jpl.nasa.gov/external/ http://ecco.jpl.nasa.gov/tracer/

EP region: adjoint tracer distribution in October (3 months after the backward tracing)
Main difference: The 1997 event had a significant reduction in nutrient influx due to weakened wind-driven upwelling and vertical mixing (vertical processes)
X-Z distribution: integrated from 5S-5N
X-Y distribution: integrated from 0-160m
9
Longitude
Dept
h (m
)
130E 160E 170W!200
!180
!160
!140
!120
!100
!80
!60
!40
!20
0
0
0.1
0.2
0.3
0.4
0.5
0.6
Longitude
Dept
h (m
)
130E 160E 170W!200
!180
!160
!140
!120
!100
!80
!60
!40
!20
0
0
0.1
0.2
0.3
0.4
0.5
0.6
Longitude
Dept
h (m
)
170W 140W 110W 80W!200
!180
!160
!140
!120
!100
!80
!60
!40
!20
0
0
0.1
0.2
0.3
0.4
0.5
0.6
Longitude
Dept
h (m
)
170W 140W 110W 80W!200
!180
!160
!140
!120
!100
!80
!60
!40
!20
0
0
0.1
0.2
0.3
0.4
0.5
0.6
1997 Central Equatorial Pacific
(c)
(e)
(g)
(a)
Eastern Equatorial Pacific1997
2009
(d)
(c)
(f)
(h)
(b)2009
EP-El Niño CP-El Niño
[Gierach et al., 2012]
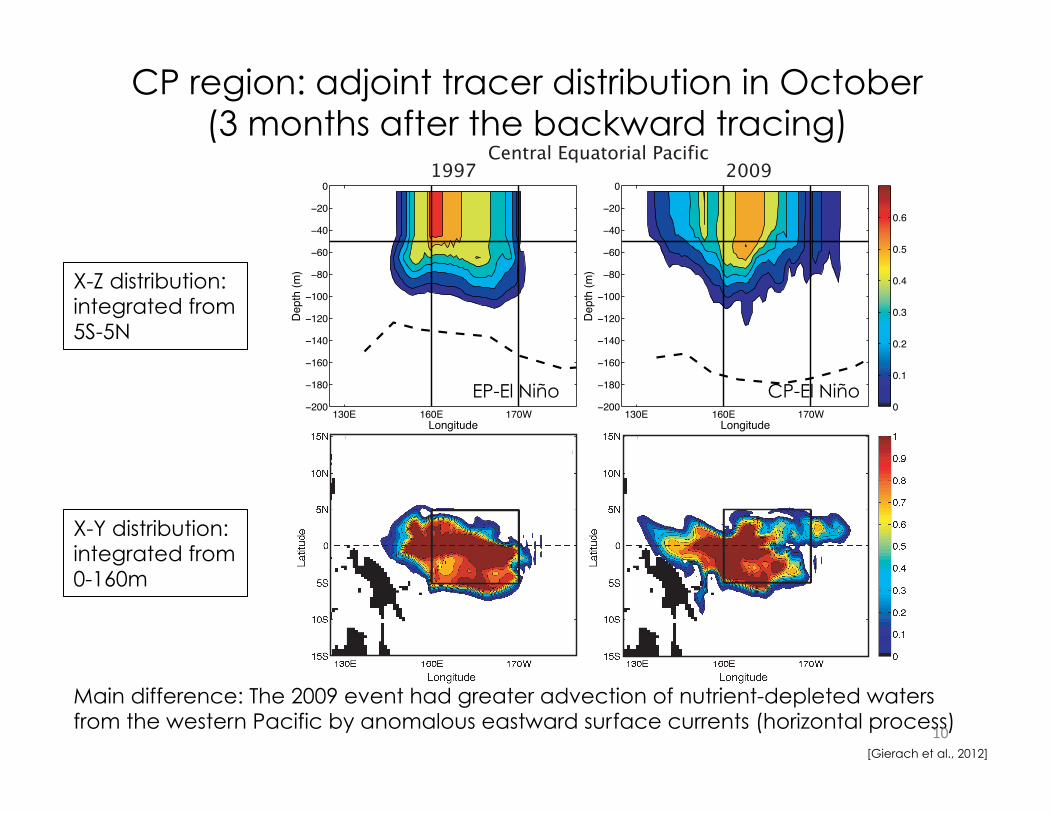
CP region: adjoint tracer distribution in October (3 months after the backward tracing)
Main difference: The 2009 event had greater advection of nutrient-depleted waters from the western Pacific by anomalous eastward surface currents (horizontal process) 10
X-Z distribution: integrated from 5S-5N
X-Y distribution: integrated from 0-160m
Longitude
Dept
h (m
)
130E 160E 170W!200
!180
!160
!140
!120
!100
!80
!60
!40
!20
0
0
0.1
0.2
0.3
0.4
0.5
0.6
Longitude
Dept
h (m
)
130E 160E 170W!200
!180
!160
!140
!120
!100
!80
!60
!40
!20
0
0
0.1
0.2
0.3
0.4
0.5
0.6
Longitude
Dept
h (m
)
170W 140W 110W 80W!200
!180
!160
!140
!120
!100
!80
!60
!40
!20
0
0
0.1
0.2
0.3
0.4
0.5
0.6
Longitude
Dept
h (m
)
170W 140W 110W 80W!200
!180
!160
!140
!120
!100
!80
!60
!40
!20
0
0
0.1
0.2
0.3
0.4
0.5
0.6
1997 Central Equatorial Pacific
(c)
(e)
(g)
(a)
Eastern Equatorial Pacific1997
2009
(d)
(c)
(f)
(h)
(b)2009
CP-El Niño EP-El Niño
[Gierach et al., 2012]
[Gierach et al., 2012]
11
Summary
• Chl-a reduction was large in the EP region during the 1997 EP-El Niño because of decreased wind-driven upwelling & vertical mixing that inhibited the subsurface nutrient supply
• Chl-a reduction was large and confined to the CP region during the 2009 CP-El Niño because of strong advection of nutrient-depleted water by anomalous eastward surface currents
• Realistic vertical and horizontal processes of the physical state, in particular, property conservation, is important to the interpretation of biological response

Ques0ons…
12
12
Related Documents