32 Dissolution Technologies | FEBRUARY 2014 Biopharmaceutical Relevance of Dissolution Profile Comparison: Proposal of a Combined Approach María Esperanza Ruiz* and María Guillermina Volonté Quality Control of Medications, Department of Biological Sciences, Faculty of Exact Sciences, University of La Plata (UNLP), 47 & 115, B1900AJI, La Plata, Buenos Aires, Argentina ABSTRACT The aims of the present study were to evaluate the performance of the main methods proposed for the comparison of percentage dissolved versus time curves and to recommend a more biorelevant combined approach for the comparison of dissolution profiles of multisource drug products. In vitro dissolution tests of four brands of oxcarbazepine (OxCBZ) tablets were performed, and the resulting profiles were compared by model-independent, model-dependent, and ANOVA-based statistical methods. After a careful analysis of the results, some methods were chosen and applied to the comparison of dis- solution profiles of four brands of carbamazepine (CBZ) tablets and two brands of phenytoin (PHT) capsules. Finally, these in vitro results were qualitatively correlated with the corresponding in vivo results previously obtained with the same CBZ and PHT products assayed in healthy volunteers. The analysis of the dissolution data obtained with OxCBZ tablets allowed discarding the ANOVA-based statistical methods since in all cases they were over-discriminating from a biopharmaceutical point of view. The remaining comparison methods were applied to in vitro profiles of CBZ and PHT products and the results correlated with in vivo data. The most suitable methods for the biopharmaceutical comparison of in vitro dissolution profiles were the model-independent ones, and among them, the best correlations were the f 2 similarity factor along with a measure of the dissolution extent (e.g., area under the curve). This combined approach gives a robust and informative result with the most biopharmaceutical relevance. KEYWORDS: Biopharmaceutical, dissolution profile, dissolution rate, in vitro–in vivo correlation; similarity factor. INTRODUCTION E valuation of dissolution has approximately a century of development. However, in recent decades it has attracted more interest for its application to the study of solid drug products. Active ingredients included in a pharmaceutical form must be released and dissolved prior to absorption. Thus, dissolution studies may be related to the bioavailability of the drugs in the body. The rate at which poorly water-soluble drugs are dissolved in the gastrointestinal tract from the dosage form is corre- lated with the rate of systemic absorption (1). Therefore, the in vitro dissolution test has become the most suitable tool to predict the way that a drug product will behave in vivo (at least for highly permeable drugs). Over time, dissolution studies have expanded beyond tablets and capsules to encompass modified-release products, transdermal products, and oral suspensions, among others. The relevance of in vitro dissolution stud- ies of pharmaceuticals has been increasing over time, and these studies even replace in vivo studies in certain circumstances (2). On the other hand, the discussion about what methods should be used to compare dissolu- tion data and what similarity criteria should be applied has also grown. Since the 1990s, many proposals of methods useful for the comparison of dissolution profiles began to appear in the scientific literature (3–10). New methods (11–15) continued to emerge even after drug regulatory agen- cies recommended the similarity factor (f 2 ) developed by Moore and Flanner (4) as the preferred method for dis- solution profile comparison (16–18). Most of the proposed methods fall into one of three categories: Model-independent methods: These methods com- pare dissolution profiles without fitting the data to an equation that represents them. This category includes mathematical methods like the difference/similarity fac- tors f 1 and f 2 (4) or the Rescigno indexes ξ i (19), along with the statistical comparisons of parameters obtained from the profiles, such as the area under the curve (AUC) and dissolution efficiency (DE). ANOVA-based statistical methods: These methods treat the percentage dissolved as a random variable to perform the analysis of variance, consider the formula- tion as a single class variable (one-way ANOVA) and thus perform time-to-time comparisons, or consider both the formulation and the time as class variables (two-way ANOVA) under the null hypothesis of similarity. However, its application is not strictly correct because it does not fulfill the assumption of independent variables due to the correlation between the percentage dissolved and time (20). Model-dependent methods: These methods include different forms for profile comparison that rely on a previ- ous stage of fitting dissolution data to an equation that *Corresponding author. e-mail: [email protected] dx.doi.org/10.14227/DT210114P32

Welcome message from author
This document is posted to help you gain knowledge. Please leave a comment to let me know what you think about it! Share it to your friends and learn new things together.
Transcript

32 Dissolution Technologies | FEBRUARY 2014
Biopharmaceutical Relevance of Dissolution Profile Comparison: Proposal of a Combined Approach
María Esperanza Ruiz* and María Guillermina VolontéQuality Control of Medications, Department of Biological Sciences, Faculty of Exact
Sciences, University of La Plata (UNLP), 47 & 115, B1900AJI, La Plata, Buenos Aires, Argentina
ABSTRACTThe aims of the present study were to evaluate the performance of the main methods proposed for the comparison of
percentage dissolved versus time curves and to recommend a more biorelevant combined approach for the comparison of dissolution profiles of multisource drug products. In vitro dissolution tests of four brands of oxcarbazepine (OxCBZ) tablets were performed, and the resulting profiles were compared by model-independent, model-dependent, and ANOVA-based statistical methods. After a careful analysis of the results, some methods were chosen and applied to the comparison of dis-solution profiles of four brands of carbamazepine (CBZ) tablets and two brands of phenytoin (PHT) capsules. Finally, these in vitro results were qualitatively correlated with the corresponding in vivo results previously obtained with the same CBZ and PHT products assayed in healthy volunteers. The analysis of the dissolution data obtained with OxCBZ tablets allowed discarding the ANOVA-based statistical methods since in all cases they were over-discriminating from a biopharmaceutical point of view. The remaining comparison methods were applied to in vitro profiles of CBZ and PHT products and the results correlated with in vivo data. The most suitable methods for the biopharmaceutical comparison of in vitro dissolution profiles were the model-independent ones, and among them, the best correlations were the f2 similarity factor along with a measure of the dissolution extent (e.g., area under the curve). This combined approach gives a robust and informative result with the most biopharmaceutical relevance.
KEYWORDS: Biopharmaceutical, dissolution profile, dissolution rate, in vitro–in vivo correlation; similarity factor.
INTRODUCTION
Evaluation of dissolution has approximately a century of development. However, in recent decades it has attracted more interest for its application to the
study of solid drug products. Active ingredients included in a pharmaceutical form must be released and dissolved prior to absorption. Thus, dissolution studies may be related to the bioavailability of the drugs in the body. The rate at which poorly water-soluble drugs are dissolved in the gastrointestinal tract from the dosage form is corre-lated with the rate of systemic absorption (1). Therefore, the in vitro dissolution test has become the most suitable tool to predict the way that a drug product will behave in vivo (at least for highly permeable drugs).
Over time, dissolution studies have expanded beyond tablets and capsules to encompass modified-release products, transdermal products, and oral suspensions, among others. The relevance of in vitro dissolution stud-ies of pharmaceuticals has been increasing over time, and these studies even replace in vivo studies in certain circumstances (2). On the other hand, the discussion about what methods should be used to compare dissolu-tion data and what similarity criteria should be applied has also grown.
Since the 1990s, many proposals of methods useful for the comparison of dissolution profiles began to appear
in the scientific literature (3–10). New methods (11–15) continued to emerge even after drug regulatory agen-cies recommended the similarity factor (f2) developed by Moore and Flanner (4) as the preferred method for dis-solution profile comparison (16–18). Most of the proposed methods fall into one of three categories:
Model-independent methods: These methods com-pare dissolution profiles without fitting the data to an equation that represents them. This category includes mathematical methods like the difference/similarity fac-tors f1 and f2 (4) or the Rescigno indexes ξi (19), along with the statistical comparisons of parameters obtained from the profiles, such as the area under the curve (AUC) and dissolution efficiency (DE).
ANOVA-based statistical methods: These methods treat the percentage dissolved as a random variable to perform the analysis of variance, consider the formula-tion as a single class variable (one-way ANOVA) and thus perform time-to-time comparisons, or consider both the formulation and the time as class variables (two-way ANOVA) under the null hypothesis of similarity. However, its application is not strictly correct because it does not fulfill the assumption of independent variables due to the correlation between the percentage dissolved and time (20).
Model-dependent methods: These methods include different forms for profile comparison that rely on a previ-ous stage of fitting dissolution data to an equation that *Corresponding author.
e-mail: [email protected]
dx.doi.org/10.14227/DT210114P32

Dissolution Technologies | FEBRUARY 2014 33
describe its temporal evolution. After the data have been fit, they can be compared with several statistical methods, such as Hotelling’s T2 test (21) and the “Regions of Similar-ity” method (5).
In the present work, the suitability of several methods proposed for the comparison of dissolution profiles from a biopharmaceutical approach was assessed. The results obtained were compared to evaluate their cor-respondence, applications, advantages, and limitations. Moreover, the biopharmaceutical relevance of the results was addressed by means of their correlation with in vivo results previously obtained, with the aim of proposing a more biorelevant combined approach for the compari-son of in vitro dissolution profiles of multisource drug products.
MATERIALS AND METHODSEquipment and Materials
Dissolution tests were conducted in a Sotax AT 7 appa-ratus (Sotax AG, Basel, Switzerland). The amount dissolved was determined spectrophotometrically in a Thermo spectrophotometer, Helios-Beta model (Thermo Fisher Scientific, Waltham, MA, USA). Drugs and reagents were weighed on a Mettler Toledo AG 204 balance (Mettler, Greinfensee, Switzerland).
All medications (oxcarbazepine and carbamazepine tablets, and phenytoin capsules) were purchased at a local drugstore. Reference standards of all four drugs were pur-chased from the Argentinean National Institute of Medica-tions (Buenos Aires, Argentina). All other chemicals used were of analytical grade.
Dissolution StudiesDissolution profiles were obtained for the following
medications: oxcarbazepine 600- and 300-mg tablets (3 brands and 1 brand, respectively), carbamazepine 200-mg tablets (4 brands), and sodium phenytoin 100-mg cap-sules (2 brands).
All dissolution tests were conducted according to USP 34 (22). In the case of oxcarbazepine products, which are not included in any pharmacopeia, the conditions speci-fied for CBZ were applied: USP Apparatus 2 (paddle) at 75 rpm with 900 mL of 1% sodium lauryl sulfate (LSNa) as dissolution medium. The dissolution test conditions of sodium phenytoin capsules were USP Apparatus 1 (bas-ket) at 50 rpm with 900 mL of distilled water as dissolution medium.
In all cases, media were deaerated and filtered with a 0.45-µm nylon filter prior to use. Bath temperature was set at 37 ± 0.5 °C. Samples (5-mL) were drawn at each sampling time and immediately centrifuged at 3500 rpm. Trials were performed with twelve tablets or capsules, and the mean values were used for data analysis.
A short validation program was performed for the three different spectrophotometric methods employed for the determination of the percentage dissolved. Linearity,
precision, and specificity were assessed for each medium–wavelength combination: 1% LSNa at 285 and 256 nm for CBZ and OxCBZ, respectively, and distilled water at 258 nm for PHT.
Data AnalysisThe dissolution profiles of OxCBZ products were ana-
lyzed by the following methods.
Model-Independent MethodsThe similarity (f2) and difference (f1) factors (4) were
calculated for all possible pairs of products considered. The f2 value was computed with the points of the dis-solution profile up to the moment in which the product acting as reference in such comparison dissolved 85% or more. Both products in each pair were taken as reference in a comparison; therefore, two f2 values were computed for each pair. Rescigno indexes (ξi) were not applied since there is no decision criterion about the cutoff value to establish similarity between the profiles being com-pared. Equation 1 describes how to calculate f2, while f1 is shown in eq 2 (Rt and Tt are the average percentages dissolved at time t of the reference and test products, respectively).
(1)
(2)
The profiles were considered similar if f2 was greater than or equal to 50 and f1 less than 15 (16).
In another model-independent method, the values of area under the curve (AUC) were obtained, calculated by the method of trapezoids, and the dissolution efficiency (DE) calculated according to eq 3:
(3)
where %Dt is the percentage dissolved at time t, %Dmax is the maximum dissolved at the final time T, and AUC0-T is the area under the curve from zero to T. After AUC and DE for each individual tablet of each formulation were obtained, they were statistically compared by calculating the ANOVA and the 90% confidence interval (90% CI) for the ratio of the means.

34 Dissolution Technologies | FEBRUARY 2014
ANOVA-Based MethodsFor all possible pairs of products, two-way ANOVA
was performed considering the percentage dissolved as the random variable, and Formulation and Time as class variables (factors). Due to the existence of replicates (individual tablets), the effect of the Formulation*Time interaction was evaluated. A one-way ANOVA (single factor: Formulation) was also performed by comparing the percentage dissolved between formulations at each time point.
Model-Dependent MethodsAs mentioned in the introduction, this classification in-
cludes different methods of statistical comparisons (mul-tivariate in most cases) that require fitting the dissolution curves to equations or models that represent them. Table 1 presents the nonlinear mathematical models tested for fitting the experimental data.
Although other mathematical models have been postu-lated for fitting the percent dissolved versus time data (13, 23), the four equations presented in Table 1 are the most frequently used due to their good fit to immediate-release solid form dissolution data. In general, there is no universal model to fit all dissolution profiles, and there are no established criteria to select the proper mathemat-ical model.
To choose the best-fitting equation, average data (n = 12) obtained for each product were fit with two statis-tical software packages, Systat v.12 and Infostat v.2011e. In all cases, the %Dmax parameter was fixed at 100 since the equations had to be biparametric for the subsequent statistical comparison, and the same weight was assigned to all points. After each fitting was performed, it was veri-fied that both programs yielded matching results, which was true in all cases.
The parameter values obtained for each product with each equation were recorded as well as the coefficient of determination (R2) and the AIC (Akaike’s Information Criterion). The AIC is widely used as a criterion for select-ing the model that better fits a particular set of data,
especially when the models considered do not contain the same number of parameters, as in this case. Given a set of models, the best fit is the one with the lowest AIC value (24).
The R2 and AIC obtained as described above allowed a first discard of some of the assayed equations. To decide among the remaining ones, the statistical test of “lack of fit” (25) was performed on the dissolution data fit to the equations to statistically assess whether the adjustment was acceptable in all cases (i.e., if the model was ap-plicable to the dissolution data of all the assayed prod-ucts). Once the mathematical method was selected, the equation parameters of each tablet were recorded and statistically compared between products by means of the following tests:
Hotelling T2 statistic: This distribution was developed by Harold Hotelling as a generalization of the t-distribu-tion, to be applied to multivariate analysis (26). The T2 sta-tistic can be calculated by the following expression (eq 4):
(4)
Differences between the mean sample vectors are first recorded, and then the variance–covariance matrix (Sp) is calculated and multiplied by the sum of the inverses of the sample sizes (1/n1 + 1/n2). The resulting matrix is inverted and multiplied by the calculated average differ-ence. For large samples, the statistic will follow a chi-square distribution with p degrees of freedom (where p is the number of variables). However, this approach does not take into account the variation due to the estimation of the variance–covariance matrix. Therefore, it transforms into an F-statistic according to eq 5:
(5)
Comparison by similarity regions: This method, proposed by Sathe et al. (5), involves defining similarity regions for the model parameters based on the results obtained for the reference. As in this work, three regions were considered: ±σ, ±2σ, and ±3σ, with σ being the standard deviation obtained for the reference product for a given parameter. These regions are rectangles; in one direction are plotted the deviations of the one parameter and in the other, those of the other parameter (of the reference product). Then, to compare each pair, the differ-ences of parameters a and b (ln-transformed) and the 90% confidence intervals of these differences are calculated and then verified whether they were inside or outside the previously defined regions. A schematic example of this method is presented in Figure 1.
Table 1. Mathematical Models and Respective Equations Used for Fitting the Dissolution Data
Model Equation
First Order
Gompertz
Logistic
Weibull
%Dt: percentage dissolved at time t; %Dmax: maximum dissolved at the final time; K, a, and b: parameters of the equations.

Dissolution Technologies | FEBRUARY 2014 35
RESULTSOxCBZ Tablets
Figure 2 presents the dissolution profiles in 1% LSNa of OxCBZ products: 600-mg tablets (products J*, K, and L; the asterisk indicates the reference) and 300-mg tablets (product M). The results of fitting the four proposed equa-tions (first-order, Gompertz, Weibull, and Logistic) to those profiles are summarized in Table 2.
As shown in Table 2, the R2 coefficient is higher than 0.995 and the AIC values are comparable in all cases. Moreover, there are no systematic trends in the residual plots (not shown).
The first-order equation was discarded because it yielded the lowest R2 values, and in most cases, the result-ing AIC values were higher than those of other methods (lower AIC values are expected for a first-order equation
Figure 1. Regions of similarity defined according to the variability in the equation parameters for the reference product (white rectangles). The gray rectangles represent the regions of 90% confidence interval for the difference in the parameters between two given products, not similar (light gray) or similar (dark gray).
Figure 2. Dissolution profiles in 1% LSNa of OxCBZ tablets: J *, K and L of 600 mg, product M of 300 mg. The asterisk denotes the reference product.
Table 2. Results of Fitting the Four Mathematical Models to the OxCBZ Dissolution Profiles
Product First Order Gompertz Logistic Weibull
OxCBZ-J*
k = 0.1223 a = 31.88 a = -4.616 a = 0.0382
b = 5.030 b = 5.952 b = 1.556
R2 = 0.9985 R2 = 0.99997 R2 = 0.99996 R2 = 0.99992
AIC = 30.10 AIC = 5.25 AIC = 4.82 AIC = 13.10
OxCBZ-K
k = 0.0875 a = 11.19 a = -3.580 a = 0.0775
b = 3.271 b = 4.041 b = 1.051
R2 = 0.9994 R2 = 0.99997 R2 = 0.99993 R2 = 0.9994
AIC = 21.87 AIC = 23.44 AIC = 19.03 AIC = 24.66
OxCBZ-L
k = 0.0440 a = 22.98 a = -6.208 a = 0.0132
b = 4.656 b = 5.042 b = 1.371
R2 = 0.9971 R2 = 0.9955 R2 = 0.9980 R2 = 0.9995
AIC = 34.93 AIC = 41.67 AIC = 36.41 AIC = 24.00
OxCBZ-M
k = 0.0551 a = 39.78 a = -6.276 a = 0.0127
b = 3.699 b = 5.492 b = 1.498
R2 = 0.9968 R2 = 0.9971 R2 = 0.9990 R2 = 0.9998
AIC = 36.14 AIC = 40.98 AIC = 32.03 AIC = 17.51
* reference productR2: coefficient of determination; AIC: Akaike’s Information Criterion; k, a, b: parameters of the equations.

36 Dissolution Technologies | FEBRUARY 2014
since it has only one parameter, k). The Gompertz equa-tion fit well to the first two products data (J* and K) but not to OxCBZ-L and M, for which the AIC values were too high. Further analysis showed that this lack of fit was due to fixing the %Dmax value to 100, since when making the adjustment with the triparametric equation, both pro-grams estimated a %Dmax value close to 110 to achieve convergence (for products L and M).
Elements to decide between the Logistic and Weibull equations do not arise from the data presented in Table 2. While the first seems to fit best to the J* and K products, the second corresponds to L and M products. A lack-of-fit statistical analysis (25) was performed to decide between both equations, and the results are shown in Table 3.
By this assay, two null hypotheses were simultaneously tested: the non-correlation, which should be rejected in favor of the correlation between the time and percentage dissolved, and the fitting to the selected equation, which must be accepted to assert that the model chosen is cor-rect. While the non-correlation was rejected in all cases, the fit hypothesis could not be accepted in two cases: the Logistic equation assayed in products L and M (p < 0.001).
Therefore, dissolution profiles of each individual tablet of the four OxCBZ products were then fitted to the Weibull equation to obtain a mean value (n = 12) of the param-eters a and b for each product. With these values (ln-trans-formed), the Hotelling’s T2 test and the comparison by similarity regions methods were performed as described in Materials and Methods—Data Analysis section.
Tables 3–6 present the results and conclusions of all the applied methods, grouped by pairs of product compared. Although there are six different possible pairs for four products (J *, K, L, and M), only four tables are presented. The two remaining ones (corresponding to J*-L and K-L pairs) are omitted since consistent results (not similarity) were obtained among all the applied methods.
In first place, each table presents the values obtained for the calculated mathematical indexes and the conclu-sion of similarity or not according to the correspondent specifications. When the similar/not similar conclusion depended on what product was considered as reference, “not determined” (ND) was placed. In the case of DE and AUC comparisons, the value of the ratio between the two considered products for each of these parameters, the 90% confidence interval for this ratio (90% CI), and the p value are shown. Since the null hypothesis established that there were no significant differences between two given parameters, the profiles were considered similar if p > 0.05.
In the second place, the results of the ANOVA-based statistical methods are presented, and in the third place are the results of the model-dependent comparisons. The difference in ln-transformed parameters of the Weibull equation (a and b) between products with its correspond-ing 90% CI are presented. According to the region-of-similarity method (5), profiles were considered similar
if the 90% CI of a and b were simultaneously included within a given region previously defined as a function of the standard deviation of the reference product (σ). In this case, these regions were:
Considering ±1σ: [-0.520, +0.520] for a and [-0.107, +0.107] for b
Considering ±2σ: [-1.040, +1.040] for a and [-0.214, +0.214] for b
Considering ±3σ: [-1.560, +1.560] for a and [-0.321, +0.321] for b
The results of the Hotelling’s statistical test are also presented (the F value, calculated according to eq 5), fol-lowed by the corresponding critical F. The null hypothesis of similarity (H0: µ1 = µ2) is rejected if the calculated F is greater than the critical one (i.e., p < 0.001).
CBZ TabletsFigure 3 shows the dissolution profiles of the four 200-
mg CBZ products in 1% LSNa. These products were the same assayed in vivo in a relative bioavailability study performed in healthy volunteers (27).
When the mathematical models already described for OxCBZ were fitted to the CBZ dissolution profiles, none of the four equations had clear advantages over others according to the R2 and AIC criteria, so that the four were subjected to the lack-of-fit test (25) to decide between them.
As shown in Table 7, it was not possible to fit a single model to the data of all four products (CBZ-B dissolution profile does not fit any equation). Furthermore, results obtained for OxCBZ suggest that both model-dependent and ANOVA-based statistical methods are so discriminat-ing that the differences usually found in products from different origins, although biopharmaceutically irrelevant, do not confirm similarity.
Hence, the comparisons of CBZ product dissolution pro-files were performed only by model-independent meth-ods, and the same similarity criteria described earlier for OxCBZ were applied. The results are presented in Table 8.
PHT CapsulesThe dissolution profiles in water of the two PHT 100-mg
capsules assayed are shown in Figure 4. These products were the same assayed in vivo in a relative bioavailability study performed in healthy volunteers (28). Table 9 pres-ents the results of the dissolution profile comparison.
DISCUSSIONIn this work, dissolution profiles were compared by
different methods belonging to one of three main classes: model-dependent, ANOVA-based statistical methods, and model-independent methods. Within the first category,
Dissolution Technologies | FEBRUARY 2014 37
Table 3. Summary of the Results Obtained with the Comparison Methods Applied to the Dissolution Profiles of Products J* and K of OxCBZ Tablets
Model-independent methods
K (T) vs J* (Ref) J* (T) vs K (Ref) Conclusion
f2 49.18 51.68 ND
f1 11.82 10.53 similar
ratio p 90% CI for the ratio
DE 0.9719 0.0601 95.55–98.86 similar
AUC 0.9772 0.2110 94.63–100.92 similar
ANOVA-based statistical methods
Two-factor p value One-factor p value
Formulation (F) <0.01 <0.01* not similar
Time (T) <0.01* Significant differences were found at 15. 30 and 45 minutes
not similar
FxT <0.01 not similar
Model-dependent methods
difference 90% CI for the difference
Weibull parametersa -0.935 -1.553 to -0.317
not similarb 0.466 0.284–0.649
calculated F critical F (95%) p
Hotelling’s T2 56.60 4.06 <0.001 not similar
DE: dissolution efficiency; AUC: area under the curve; CI: confidence interval; ND: not determined
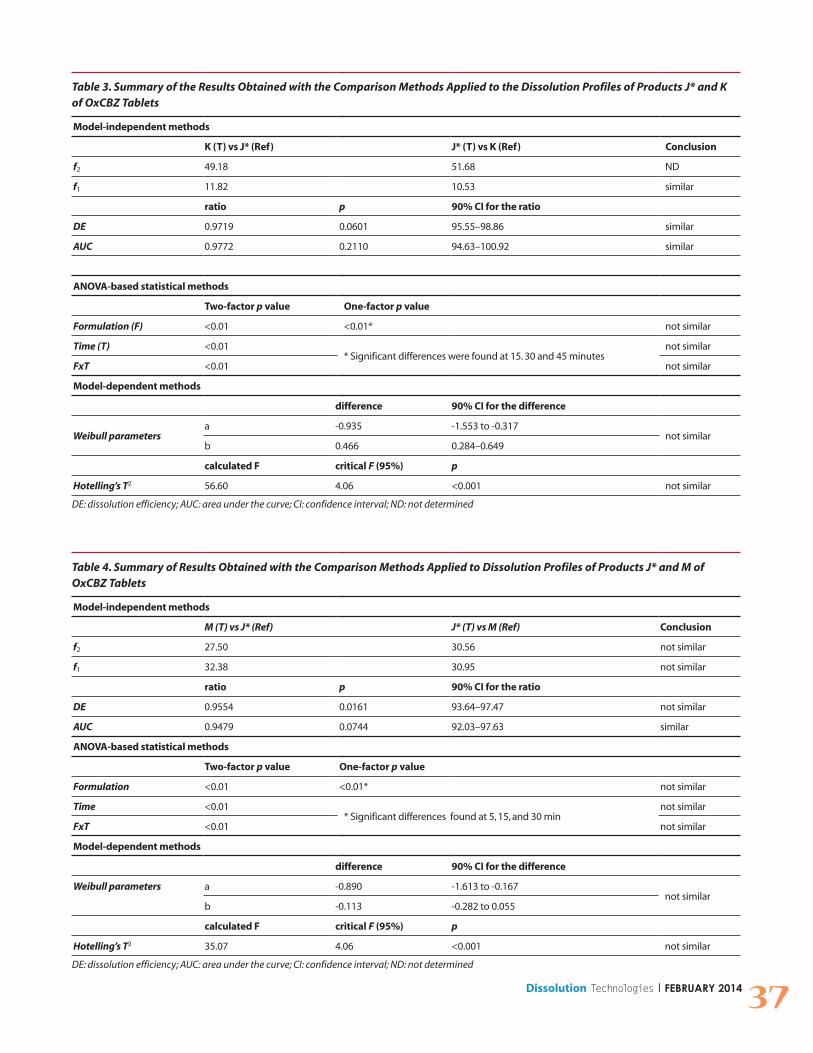
Table 4. Summary of Results Obtained with the Comparison Methods Applied to Dissolution Profiles of Products J* and M of OxCBZ Tablets
Model-independent methods
M (T) vs J* (Ref) J* (T) vs M (Ref) Conclusion
f2 27.50 30.56 not similar
f1 32.38 30.95 not similar
ratio p 90% CI for the ratio
DE 0.9554 0.0161 93.64–97.47 not similar
AUC 0.9479 0.0744 92.03–97.63 similar
ANOVA-based statistical methods
Two-factor p value One-factor p value
Formulation <0.01 <0.01* not similar
Time <0.01* Significant differences found at 5, 15, and 30 min
not similar
FxT <0.01 not similar
Model-dependent methods
difference 90% CI for the difference
Weibull parameters a -0.890 -1.613 to -0.167not similar
b -0.113 -0.282 to 0.055
calculated F critical F (95%) p
Hotelling’s T2 35.07 4.06 <0.001 not similar
DE: dissolution efficiency; AUC: area under the curve; CI: confidence interval; ND: not determined

38 Dissolution Technologies | FEBRUARY 2014
Table 5. Summary of the Obtained Results with the Comparison Methods Applied to the Dissolution Profiles of Products K and M of OxCBZ Tablets
Model-independent methods
M (T) vs K (Ref) K (T) vs M (Ref) Conclusion
f2 39.82 39.82 not similar
f1 19.02 16.05 not similar
ratio p 90% CI for the ratio
DE 0.9830 0.0351 97.10–99.50 similar
AUC 0.9699 0.1879 93.12–101.03 similar
ANOVA-based statistical methods
Two-factor p value One-factor p value
Formulation <0.01 <0.01* not similar
Time <0.01* Significant differences were found at 5 and 15 minutes
not similar
FxT <0.01 not similar
Model-dependent methods
difference 90% CI for the difference
Weibull parameters a -1.825 -2.335 to -1.315not similar
b 0.353 0.168–0.538
calculated F critical F (95%) p
Hotelling’s T2 82.10 4.06 <0.001 not similar
DE: dissolution efficiency; AUC: area under the curve; CI: confidence interval; ND: not determined.
Table 6. Summary of the Results Obtained with the Comparison Methods Applied to the Dissolution Profiles of OxCBZ Tablets L and M
Model-independent methods
M (T) vs L (Ref) L (T) vs M (Ref) Conclusion
f2 53.04 50.65 similar
f1 8.82 11.18 similar
ratio p 90% CI for ratio
DE 0.9778 0.0632 96.17–99.41 similar
AUC 0.9709 0.1058 94.21–100.07 similar
ANOVA-based statistical methods
Two-factor p value One-factor p value
Formulation <0.01 <0.01* not similar
Time <0.01 * Significant differences were found at 15 and 30 minutes
not similar
FxT <0.01 not similar
Model-dependent methods
difference 90% CI for the difference
Weibull parameters a 0.012 -0.706 to 0.729similar
b -0.081 -0.238 to 0.077
calculated F critical F (95%) pnot similar
Hotelling’s T2 17.46 4.06 <0.001
DE: dissolution efficiency; AUC: area under the curve; CI: confidence interval; ND: not determined.

Dissolution Technologies | FEBRUARY 2014 39
comparisons were made in two ways: by the regions-of-similarity method (5) and by Hottelling’s T2 test (26). Other methods have been proposed for these kinds of comparisons (11, 13, 14), but these two were chosen as representative of methods based on confidence regions and on hypothesis testing, respectively, while being easy to calculate and interpret.
Table 6 shows that the only OxCBZ products that were similar by a model-dependent method were OxCBZ-L and M, both products of the same brand in different doses (600 and 300 mg, respectively). The method was very discriminating; products L and M were similar only when the similarity region corresponding to ±3σ of the reference product (OxCBZ-J*) was considered. Moreover,
since the reference product was the one with the highest parameter dispersion, the similarity would not have been established if that region was based on the dispersion of any other product. Methods based on confidence regions have additional disadvantages: the criterion to define the region of similarity is uncertain, it is difficult to interpret this region, and the production of more variable reference batches is encouraged to increase the chances of conclud-ing similarity.
On the other hand, no pair of OxCBZ products could be considered similar according to the hypothesis test based on Hotelling’s T2 statistic. The mean parameters compared (a and b in this case) arise from fitting the model to each individual tablet. The dispersions normally found among
Figure 3. Dissolution profiles in 1% LSNa of four brands of 200-mg CBZ tab-lets products. The asterisk denotes the reference product.
Figure 4. Dissolution profiles in distilled water of two brands of 100-mg PHT capsules.
Table 7. Values of Parameters (k, a, b) Obtained by Fitting the Four Mathematical Models Described to the Dissolution Data of the CBZ 200-mg Products
Product First Order Gompertz Logistic Weibull
CBZ-A*
k = 0.0416 a = 13.98 a = -3.734 a = 0.0837
b = 2.587 b = 3.178 b = 0.7764
p < 0.01 p < 0.01 p < 0.01 p > 0.05
CBZ-B
k = 0.0291 a = 18.36 a = -4.365 a = 0.0451
b = 2.533 b = 3.293 b = 0.8740
p < 0.01 p < 0.01 p < 0.01 p < 0.01
CBZ-C
k = 0.0774 a = 87.22 a = -5.866 a = 0.0215
b = 4.739 b = 5.740 b = 1.4782
p < 0.01 p < 0.01 p > 0.05 p > 0.05
CBZ-D
k = 0.1221 a = 5.164 a = -1.999 a = 0.4122
b = 2.838 b = 3.048 b = 0.5284
p < 0.01 p < 0.01 p > 0.05 p > 0.05
p < 0.01 (bolded) indicates lack of fit.

40 Dissolution Technologies | FEBRUARY 2014
different tablets of a single batch yield a large variability in the estimates of these parameters, which results in a higher value of the T2 statistic, thereby increasing the requirement for establishing similarity. Another disadvan-tage of hypothesis testing is that it only accepts or rejects the similarity between the data sets being compared, while dissolution analysis is more relevant to determine if the difference between two profiles is within acceptable limits, rather than determining whether or not they are different.
However, the possibility of evaluating the parameters separately that these methods allow is interesting, while
considering the variances and covariances of the data. For example, for products K and M, both equation parameters were quite different; for the pair M-J*, parameter b was within the similarity region, while for J*-K, the same was true for parameter a. That is, the method is capable of detecting differences and similarities in shape (parameter b) and scale (parameter a) between dissolution profiles.
Meanwhile, ANOVA-based statistical methods proved unacceptable for use in the dissolution profile compari-son analysis. In the two-way analysis, the large number of degrees of freedom because of the replicates (individ-ual tablets) caused a large decrease in the residual term
Table 8. Results of the Dissolution Profile Comparison of Four CBZ 200-mg Products Assayed
CBZ-Aa vs CBZ-B Conclusion
f2 52.40 (A)b 54.27 (B) similar
f1 11.86 (A) 10.72 (B) similar
Ratio (p) 90% CI for ratio
DE 0.9419 (0.0031) 91.54–96.92 not similar
AUC 0.9478 (0.0043) 92.27–97.37 not similar
CBZ-Aa vs CBZ-C
f2 37.98 (A) 34.47 (C) not similar
f1 22.52 (A) 24.76 (C) not similar
DE 1.1081 (<0.001) 108.22–113.46 not similar
AUC 1.1074 (<0.001) 108.01–113.55 not similar
CBZ-Aa vs CBZ-D
f2 32.32 (A) 27.50 (D) not similar
f1 28.04 31.82 not similar
DE 1.1258 (<0.001) 106.04–119.52 not similar
AUC 1.1162 (<0.001) 106.28–117.23 not similar
CBZ-B vs CBZ-C
f2 31.09 (B) 25.59 (C) not similar
f1 30.86 38.31 not similar
DE 1.1765 (<0.001) 115.76–119.57 not similar
AUC 1.1684 (<0.001) 114.14–119.60 not similar
CBZ-B vs CBZ-D
f2 27.26 (B) 20.76 (D) not similar
f1 35.59 44.10 not similar
DE 1.1744 (<0.001) 115.02–119.92 not similar
AUC 1.1656 (<0.001) 113.80–119.38 not similar
CBZ-C vs CBZ-D
f2 40.58 (C) 40.58 (D) not similar
f1 14.44 13.08 similar
DE 1.0064 (0.4824) 98.83–102.49 similar
AUC 1.0045 (0.8525) 98.63–102.30 similar
a Actual reference product.b Letter in parentheses indicates product taken as the reference.DE: dissolution efficiency; AUC: area under the curve; CI: confidence interval.

Dissolution Technologies | FEBRUARY 2014 41
and in the critical value (F), resulting in a higher demand for the establishment of similarity. Therefore, this test identifies statistical instead of pharmaceutical differenc-es among dissolution profiles. When only the factor “for-mulation” was considered and comparisons were made time to time, the method was inefficient because the type I error was greater than the nominal value of 5%, besides being tedious and the interpretation ambiguous. In this work, no pair of products was similar according to these methods.
Hence, the model-independent method was the most suitable for assessing equivalence in dissolution behavior between multisource products. However, OxCBZ data presented in Tables 3–6 show that the results of the AUC and DE comparison were not always coincident with the f indexes.
Analysis of CBZ results shows that the profiles of CBZ-A* and CBZ-B products (the two curves below the others in Figure 3) were similar according to the f1 and f2 factors, but not with respect to AUC and DE (p < 0.005). The pair of products CBZ-C and CBZ-D represent the opposite situa-tion; they were similar according to AUC and DE but not to the f2 criterion.
These situations clearly illustrate the nature of both types of comparisons. The f2 factor accounts for the differ-ences in the percentage dissolved by measuring vertical distances regardless of its position in the time axis (i.e., does not consider the spacing between points). This makes f2 very sensitive to the differences in the first time points, which may not affect the area or the final shape of the profile. Figure 3 shows that the CBZ-C dissolution pro-file is not too different from the CBZ-D profile, except in the first two time points sampled where it remains below. This had a major impact on f2, which was calculated with only the first three time points, since the products were rapidly dissolving (i.e., up to 85% before 30 min). However, the AUC (and the DE) did not differ significantly between the two products.
The aforementioned is the foundation of our proposal: a combined approach between the f2 index (a rate or shape indicator) and the result of the AUC or DE comparison (as amount parameters). This approach yields a more biorel-evant measure able to detect if the two given profiles are
similar in speed and amount dissolved, or in only one of them.
The results obtained in vivo when these four CBZ prod-ucts were assayed in healthy volunteers (27) showed that:
• Product B was equivalent to A* in terms of rate (the Cmax/ABC0-t and Tmax parameters were bioequivalent) but not in amount absorbed (AUC0-t, AUC0-∞, and Cmax were not bioequivalent).
• Products C and D were equivalent in amount absorbed (AUC0-t and Cmax were bioequivalent) and almost in ab-sorption rate (the 90% confidence interval for the Cmax/AUC0-t parameter was 78.2–122.9%).
These results support our previous analysis that whereas the f2 factor is related to the in vivo absorption rate, the AUC and DE parameters are related to the in vivo absorbed amount.
The results obtained for PHT illustrate another aspect of these comparison methods. The two products tested (PHT-F and G) were bioequivalent in vivo even according to the individual bioequivalence methodology applied (28), but their dissolution profiles were only equivalent in terms of their AUC and DE (p > 0.05 ), with f2 < 50 (Table 9).
We do not believe that these results disagree with the previous ones, but instead further support the proposal of the combined report of the f2 index with the AUC or DE comparison result. However, bioequivalence between F and G means similar rates and amounts absorbed in vivo and could probably be established due to the high in vitro dissolution rate found for both products. Although PHT belongs to BCS Class 2 (29), the tested capsules demon-strated rapid dissolution in water (>85% in 30 min). That is, the differences detected by f2 were not biorelevant due to the rapid dissolution of the products in water, the comparison of AUC and DE being more suitable.
Finally, by simultaneously reporting two comparison results, more evidence is available to determine the simi-larity of dissolution profiles, particularly in those situations where f2 is near the specification (50) or when it is greater or less than 50 depending on which product is taken as the reference for the calculation. For example, OxCBZ-J* and K products (Table 3) have an f2 of 51.68 or 49.18 depending on which of them is used as the reference. The result of the AUC and DE comparison could then become the biopharmaceutical support of the dissolution profile similarity decision.
CONCLUSIONThere are many reasons for the comparison of dissolu-
tion profiles: to evaluate the dissolution performance of a new product during the preformulation stage as a part of stability studies, to assess the impact of scale-up and post-approval changes, or to compare the biopharmaceutical in vitro performance of multisource products to ensure similar in vivo product performance (16). Biowaivers (2) are
Table 9. Results of the Dissolution Profile Comparison of the PHT 100-mg Products
PHT-F vs PHT-G Conclusion
f2 39.05 (F)a 35.94 (G) not similar
f1 17.06 (F) 20.79 (G) similar
Ratio (p) 90% CI for ratio
DE 1.0178 (0.0671) 100.30–103.27 similar
AUC 1.0228 (0.2224) 99.11–105.36 similar
a Letter in parentheses indicates product taken as the reference.DE: dissolution efficiency; AUC: area under the curve; CI: confidence interval.
42 Dissolution Technologies | FEBRUARY 2014
an example of the latter (i.e., products for which the classic in vivo bioequivalence studies are replaced by in vitro dis-solution studies).
Our results show that for such situations, model-indepen-dent methods are the most suitable for profile comparison. ANOVA-based statistical methods do not meet the funda-mental hypothesis of independence between observations when applied to percentage dissolved, and therefore the data processing is not appropriate. On the other hand, model-dependent methods are over discriminating and not easy to calculate, as they require model selection, fitting of the model to dissolution data of each individual tablet (these two steps present few difficulties with the right soft-ware, but are time-consuming), and then calculation of the statistical comparison, which requires training in the spe-cific statistical software. However, the major disadvantage of these methods is that by requiring that the data fit some descriptive equation, they fail when applied to the compari-son of multisource products that hardly fit the same model, as occurred with CBZ results. The same authors who de-veloped the similarity-region method (5) stated that it was primarily intended for application in the analysis of changes in product dissolution behavior produced by scaling or changes subsequent to the product approval (scale-up and post-approval changes).
When the biopharmaceutical quality of multisource drug products is compared through in vitro dissolution studies, the current recommended method (similarity factor, f2) is suitable, although in certain situations may be insufficient or have ambiguous interpretation. A recent study by Duan et al. (30) analyzed the correspondence between the f2 and in vivo results obtained by simulations, and concluded that although the results were consistent in most cases, care should be taken when the completeness of the dissolution profiles differ more than 10% or when the shapes of the dissolution profiles are significantly different.
To address these and other inherent limitations of the f2 factor, we proposed a combined approach: to report f2 along with the result of the AUC or DE comparison as quantity indicators. Thereby a more robust and reliable result that provides more information for the interpreta-tion of the comparison is obtained. The proposed method is simple, fast, and easy to calculate and interpret, requir-ing no sophisticated software.
Finally, this approach provides extra arguments when deciding if two profiles are similar, as it allows a bet-ter description of the dissolution process (i.e., rate and amount dissolved) and thus a better prediction of in vivo performance, which is the ultimate goal when comparing multisource, and potentially therapeutically equivalent, products.
REFERENCES1. Shargel, L.; Yu, A. B. C. Applied Biopharmaceutics and
Pharmacokinetics, 3rd ed.; Prentice-Hall International: London, 1993.
2. Waiver of In Vivo Bioavailability and Bioequivalence Studies for Immediate-Release Solid Oral Dosage Forms Based on a Biopharmaceutics Classification System; Guidance for Industry; U.S. Department of Health and Human Services, Food and Drug Administration, Center for Drug Evaluation and Research (CDER), U.S. Government Printing Office: Washington, DC, 2000.
3. Chow, S.-C.; Ki, F. Y. C. Statistical comparison between dissolution profiles of drug prod-ucts. J. Biopharm. Stat. 1997, 7 (2), 241–258. DOI: 10.1080/10543409708835184.
4. Moore, J. W.; Flanner, H. H. Mathematical comparison of curves with an emphasis on in-vitro dissolution pro-files. Pharm. Technol. 1996, 20 (6), 64–75.
5. Sathe, P. M.; Tsong, Y.; Shah, V. P. In-Vitro Dissolution Profile Comparison: Statistics and Analysis, Model Dependent Approach. Pharm. Res. 1996, 13 (12), 1799–1803. DOI: 10.1023/A:1016020822093.
6. Shah, V. P.; Yacobi, A.; Barr, W. H.; Benet, L. Z.; Breimer, D.; Dobrinska, M. R.; Endrenyi, L.; Fairweather, W.; Gillespie, W.; Gonzalez, M. A.; Hooper, J.; Jackson, A.; Lesko, L. J.; Midha, K. K.; Noonan, P. K.; Patnaik, R.; Williams, R. L. Evaluation of Orally Administered Highly Variable Drugs and Drug Formulations. Pharm. Res. 1996, 13 (11), 1590–1594. DOI: 10.1023/A:1016468018478.
7. Tsong, Y.; Hammerstrom, T.; Sathe, P.; Shah, V. P. Statistical assessment of mean differences between two dissolution data sets. Drug Inf. J. 1996, 30 (4), 1105–1112.
8. Crowder, M. J. Keep Timing the Tablets: Statistical Analysis of Pill Dissolution Rates. Appl. Stat. 1996, 45 (3), 323–334. DOI: 10.2307/2986091.
9. Mauger, J. W.; Chilko, D.; Howard, S. On the Analysis of Dissolution Data. Drug Dev. Ind. Pharm. 1986, 12 (7), 969–992. DOI: 10.3109/03639048609048052.
10. Polli, J. E.; Rekhi, G. S.; Shah, V. P. Methods to compare dissolution profiles. Drug. Inf. J. 1996, 30, 1113–1120.
11. Adams, E.; De Maesschalck, R.; De Spiegeleer, B.; Vander Heyden, Y.; Smeyers-Verbeke, J.; Massart, D. L. Evaluation of dissolution profiles using principal component analysis. Int. J. Pharm. 2001, 212 (1), 41–53. DOI: 10.1016/S0378-5173(00)00581-0.
12. Bartoszynski, R.; Powers, J. D.; Herderick, E. E.; Pultz, J. A. Statistical Comparison of Dissolution Curves. Pharmacol. Res. 2001, 43 (4), 369–387. DOI: 10.1006/phrs.2001.0796.
13. Berry, M. R.; Likar, M. D. Statistical assessment of disso-lution and drug release profile similarity using a mod-el-dependent approach. J. Pharm. Biomed. Anal. 2007, 45 (2), 194–200. DOI: 10.1016/j.jpba.2007.05.021.
14. Maggio, R. M.; Castellano, P. M.; Kaufman, T. S. A new principal component analysis-based approach for testing “similarity” of drug dissolution profiles. Eur. J. Pharm. Sci. 2008, 34 (1), 66–77. DOI: 10.1016/j.ejps.2008.02.009.

Dissolution Technologies | FEBRUARY 2014 43
15. Korhonen, O.; Matero, S.; Poso, A.; Ketolainen, J. Partial least square projections to latent structures analysis (PLS) in evaluating and predicting drug release from starch acetate matrix tablets. J. Pharm. Sci. 2005, 94 (12), 2716–2730. DOI: 10.1002/jps.20485.
16. Dissolution Testing of Immediate Release Solid Oral Dosage Forms; Guidance for Industry; U.S. Department of Health and Human Services, Food and Drug Administration, Center for Drug Evaluation and Research (CDER), U.S. Government Printing Office: Washington, DC, 1997.
17. Criterios de Bioexención de Estudios de Bioequivalencia para medicamentos sólidos orales de liberación inme-diata, Disposición 758/09; Administración Nacional Medicamentos, Alimentos y Tecnología Médica (ANMAT): Buenos Aires, 2009.
18. Guideline on the Investigation of Bioequivalence; PMP/EWP/QWP/1401/98 Rev. 1; Committee for Proprietary Medicinal Products (CPMP), European Medicines Agency: London, 2008.
19. Rescigno, A. Bioequivalence. Pharm. Res. 1992, 9 (7), 925–928. DOI: 10.1023/A:1015809201503.
20. O’Hara, T.; Dunne, A.; Butler, J.; Devane, J. A review of methods used to compare dissolution profile data. Pharm. Sci. Technol. Today 1998, 1 (5), 214–223. DOI: 10.1016/S1461-5347(98)00053-4.
21. Saranadasa, H. Defining similarity of dissolution pro-files through Hotteling’s T2 statistic. Pharm. Technol. 2001, 25 (2), 46–54.
22. The United States Pharmacopeia and National Formulary USP 31–NF 26; The United States Pharmacopeial Convention, Inc.: Rockville, MD, 2008.
23. Costa, P.; Sousa Lobo, J. M. Modeling and comparison of dissolution profiles. Eur. J. Pharm. Sci. 2001, 13 (2), 123–133. DOI: 10.1016/S0928-0987(01)00095-1.
24. Burnham, K. P.; Anderson, D. R. Multimodel Inference: Understanding AIC and BIC in Model Selection. Sociol. Method. Res. 2004, 33 (2), 261–304. DOI: 10.1177/0049124104268644.
25. Box, G. E. P.; Hunter, W. G.; Hunter, J. S. Estadística para investigadores: introducción al diseño de experimentos, análisis de datos y construcción de modelos; Reverté: Barcelona, 2005.
26. Hotelling, H. The Generalization of Student’s Ratio. Ann. Math. Stat. 1931, 2 (3), 360–378. DOI: 10.1214/aoms/1177732979.
27. Ruiz, M. E.; Conforti, P.; Fagiolino, P.; Volonté, M. G. The use of saliva as a biological fluid in relative bio-availability studies: comparison and correlation with plasma results. Biopharm. Drug Dispos. 2010, 31 (8–9), 476–485. DOI: 10.1002/bdd.728.
28. Ruiz, M. E.; Fagiolino, P.; de Buschiazzo, P. M.; Volonté, M. G. Is saliva suitable as a biological fluid in relative bioavailability studies? Analysis of its performance in a 4 × 2 replicate crossover design. Eur. J. Drug Metab. Pharmacokinet. 2011, 36 (4), 229–236. DOI: 10.1007/s13318-011-0051-z.
29. Lindenberg, M.; Kopp, S.; Dressman, J. B. Classification of orally administered drugs on the World Health Organization Model list of Essential Medicines accord-ing to the biopharmaceutics classification system. Eur. J. Pharm. Biopharm. 2004, 58 (2), 265–278. DOI: 10.1016/j.ejpb.2004.03.001.
30. Duan, J. Z.; Riviere, K.; Marroum, P. In Vivo Bioequivalence and In Vitro Similarity Factor (f2) for Dissolution Profile Comparisons of Extended Release Formulations: How and When Do They Match? Pharm. Res. 2011, 28 (5), 1144–1156. DOI: 10.1007/s11095-011-0377-x.
Related Documents