© BIOPAC Systems, Inc. 2005 Physiology Lessons for use with the Biopac Science Lab MP40 PC running Windows ® XP or Mac OS ® X 10.3-10.4 Lesson 2 EMG 2 Electromyography: Mechanical Work Lesson Revision 5.23.2006 BIOPAC Systems, Inc. 42 Aero Camino, Goleta, CA 93117 (805) 685-0066, Fax (805) 685-0067 [email protected] www.biopac.com

Welcome message from author
This document is posted to help you gain knowledge. Please leave a comment to let me know what you think about it! Share it to your friends and learn new things together.
Transcript

© BIOPAC Systems, Inc. 2005
Physiology Lessons
for use with the Biopac Science Lab MP40
PC running Windows® XP or Mac OS® X 10.3-10.4
Lesson 2 EMG 2 Electromyography: Mechanical Work
Lesson Revision 5.23.2006
BIOPAC Systems, Inc. 42 Aero Camino, Goleta, CA 93117 (805) 685-0066, Fax (805) 685-0067

Page 2 Biopac Science Lab Lesson 2 Electromyography 2 Mechanical Work
I.
The amount of force a muscle develops when it shortens is graded, that is, it is directly proportional to the workload placed on the muscle. Thus, twice as much force, or a much stronger muscle contraction, is required to lift 10 kg to a height of 30 cm than is required to lift 5 kg the same distance, and twice as much mechanical work is done.
II.
SCIENTIFIC PRINCIPLES
Mechanical work = (5 kg)(30 cm) = 150 kg.cm Fig. 2.1
Skeletal muscle performs mechanical work when the muscle contracts and an object is moved, as in lifting a weight. To lift a weight, your muscles must exert a force great enough to overcome the force of gravity acting on the weight. If you exert less force, the weight does not move. The amount of mechanical work performed can be calculated by multiplying the force generated by the contracting muscles (which is equal to the weight lifted) by the distance the weight was lifted. For example, the amount of work performed by muscles in the arm when a 5 kg weight is lifted 30 cm is 150 kg.cm (Fig. 2.1).
The strength of muscle contraction necessary to perform a task involving mechanical work can be attained through motor unit recruitment (see Lesson 1). For example, when lifting a bucket of water from the ground, the brain first activates several motor units in requisite skeletal muscles. If sensory information returning from stretch receptors in the muscles, associated joint capsules, ligaments, and tendons indicates the muscles are contracting but not developing sufficient strength to lift the bucket, the brain activates additional motor units until the sensory information indicates the bucket is being lifted. The sequential activation of motor units to perform a designated task is called motor unit recruitment.
The circulatory system blood brings nutrients to skeletal muscles. The muscles use those nutrients to form adenosine triphosphate (ATP), the energy source for contraction. During contraction, ATP is consumed, and chemical wastes (metabolites) are produced and removed by the blood. Failure of the circulatory system to supply nutrients at a rate adequate to meet the muscle’s demand for ATP, and failure to adequately remove metabolites, can lead to muscle fatigue.
Fatigue is defined as a decrease in the muscle’s ability to generate force. Skeletal muscles performing continuous maximal work over a short period of time, or continuous submaximal work over a longer period of time will eventually fatigue. Fatigue is caused by a reversible depletion of the muscle’s ATP and a temporary buildup of metabolic waste. Some of the accumulated metabolites interfere with the contractile process, and some stimulate pain receptors in surrounding connective tissue, inducing cramping of skeletal muscle, a general sign of inadequate blood flow to the muscle. Long-term training of skeletal muscles through repetitive exercises stimulates the growth of blood vessels in the muscles, increasing blood flow, thereby delaying the onset of fatigue.
In this lesson, you will use electromyography to examine motor unit recruitment and skeletal muscle fatigue. The detection, amplification, and recording of changes in skin voltage produced by underlying skeletal muscle contraction is called electromyography, and the recording thus obtained is called an electromyogram (EMG). The software also calculates and displays Integrated EMG, an alternative view of the EMG signal that clearly shows the pattern of muscle activity. The mean of the raw EMG will always be zero, but the mean of the Integrated EMG will always be positive, so Integrated EMG can be used to measure the mean value over a selected burst of EMG data.
EXPERIMENTAL OBJECTIVES
1) To record EMG response to increased weights lifted by dominant and non-dominant arms. 2) To compare differences between male and female students. 3) To observe, record, and correlate motor unit recruitment with increased mechanical work by skeletal muscle. 4) To record EMG and Integrated EMG when inducing fatigue.

Lesson 2: EMG 2 Page 3
© BIOPAC Systems, Inc. 2005
III.
IV.
MATERIALS
Biopac Science Lab system (MP40 and software) on computer running Windows XP or Mac OS X Electrode lead set (40EL lead set) Disposable vinyl electrodes (EL503), six electrodes per subject Weight set (i.e., 5-10-15-20 kg dumbbells)—Subjects must lift the same weights for valid comparisons String to standardize distance lifted Ruler to measure distance lifted Optional: Headphones (40HP) to listen to the EMG signal
EXPERIMENTAL METHODS
A. Set Up
Equipment
Fig. 2.2 MP40 with 40EL connected
Subject
Place electrodes on each arm:
white lead – over top of Biceps brachii
red lead – over bottom of Biceps brachii
black lead (ground) – inside wrist
Fig. 2.3 Electrode connections for each arm
FAST TRACK Details
1. Turn the computer ON.
2. Set the MP40 dial to OFF.
3. Plug the equipment in as follows:
Electrode leads (40EL) MP40
Optional: Headphones (40HP) computer
Connect the headphones (40HP) to the computer to prepare for the optional Listening to EMG segment.
4. Attach six electrodes per Fig. 2.3.
5. Connect the electrode leads (40EL) to the electrodes on the Subject’s dominant arm, matching lead color to electrode position.
IMPORTANT Clip each electrode lead color to its
specified electrode position.
Attach three electrodes to each arm and wrist (Fig. 2.3.)
For the first recording segment, connect the leads to the Subject’s dominant arm (generally the right arm if the Subject is right-handed or the left arm if the Subject is left-handed); this will be Arm 1.
Use the Subject’s non-dominant arm for the second recording segment, labeled Arm 2.
6. Cut string to standardize the lift distance of 45 degrees (from Subject’s finger to table).
7. Start the Biopac Science Lab software.
To standardize the lift distance, tie a string around the Subject’s finger and have the Subject lift the weight to 45 degrees. Cut the string where it rests on the table. Director can hold the string to the table while Subject lifts the weight until the string is taut.
8. Choose lesson L02-EMG-2 and click OK.
9. Type in a unique file name.
10. Click OK.
No two people can have the same file name, so use a unique identifier, such as the Subject’s nickname or student ID#.
This ends the Set Up procedure.

Page 4 Biopac Science Lab B. Check
FAST TRACK Details
MP40 Check
1. Set the MP40 dial to EMG (high).
2. Press and hold the Check pad on the MP40.
3. Click when the light is flashing.
4. Wait for the MP40 check to stop.
5. Let go of the Check pad.
6. Click Continue.
Continue to hold the pad until prompted to let go.
The MP40 check will last five seconds.
The light should stop flashing when you let go of the Check pad.
When the light stops flashing, click Continue.
Signal Check
7. Click Check Signal.
8. Click OK or watch the Lesson Video.
9. After two seconds, lift the maximum weight to 45 degrees, hold for two seconds, and return.
10. Wait for the Signal Check to stop.
Subject must lift the maximum weight during the Signal Check.
Click Check Signal. Click OK. After two seconds, lift weight to 45 degrees, hold for two seconds, and return weight to table.
11. Review the data.
If correct, go to the Record section.
If incorrect, click .
The eight-second Signal Check recording should resemble Fig. 2.4.
Fig. 2.4 If the recording does not show a burst of activity for the weight lift, click Redo Signal Check.
Lesson 2: EMG 2 Page 5
© BIOPAC Systems, Inc. 2005
C. Record
FAST TRACK Details
1. Prepare for the recording.
2. Set the lift distance and note it in the Data Report. The Subject must lift the same distance every time.
A
Tip Use string to standardize the lift distance.
Watch the Help menu videos to prepare for the recording. You will record two segments on each arm:
Segments 1 and 3: motor unit activity associated with performance of increased mechanical work
Segments 2 and 4: fatigue
In order to work efficiently, read this entire section so you will know what to do before recording.
Stop each recording segment as soon as possible so you don’t waste recording time (time is memory).
Tip To standardize the lift distance, tie a string around the Subject’s finger and have the Subject lift the weight to 45 degrees; then, cut the string where it rests on the table. While recording, the Director can hold the string to the table while Subject lifts the weight until the string is taut.
SEGMENT 1
3. Release all weight/tension on the arm.
4. Click .
After you click Record, data will be recorded and you can visually review the EMG.
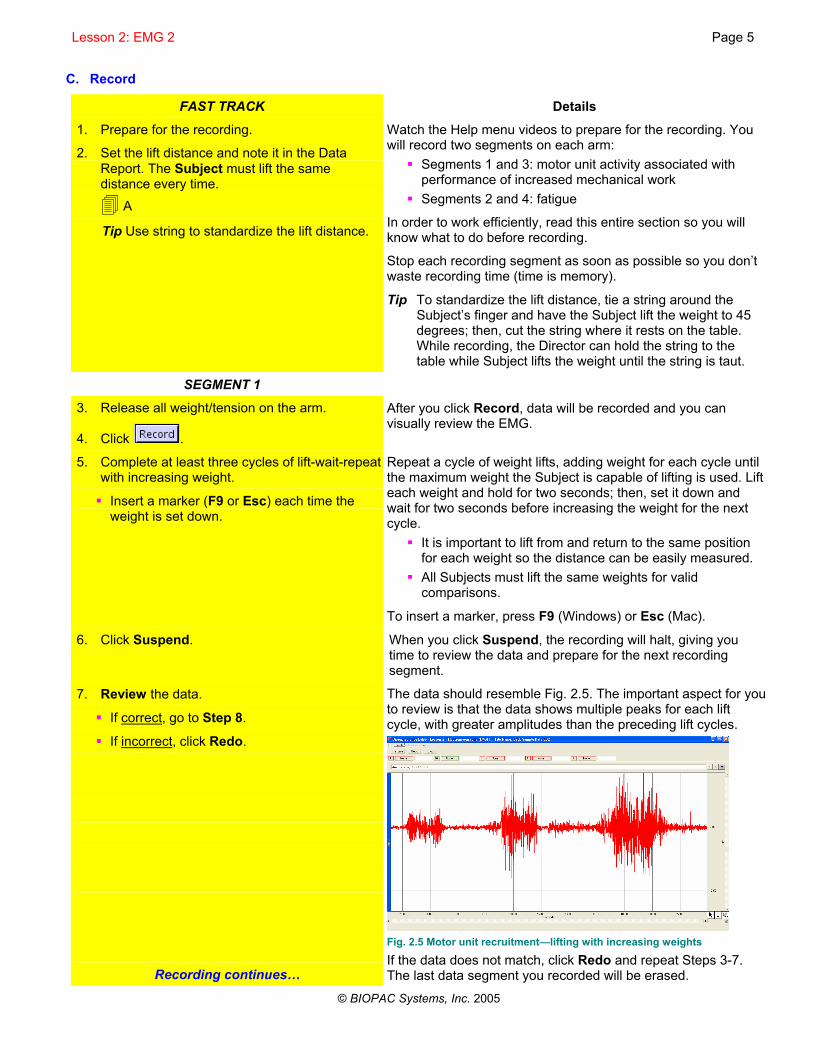
5. Complete at least three cycles of lift-wait-repeat with increasing weight.
Insert a marker (F9 or Esc) each time the weight is set down.
Repeat a cycle of weight lifts, adding weight for each cycle until the maximum weight the Subject is capable of lifting is used. Lift each weight and hold for two seconds; then, set it down and wait for two seconds before increasing the weight for the next cycle.
It is important to lift from and return to the same position for each weight so the distance can be easily measured.
All Subjects must lift the same weights for valid comparisons.
To insert a marker, press F9 (Windows) or Esc (Mac).
6. Click Suspend. When you click Suspend, the recording will halt, giving you time to review the data and prepare for the next recording segment.
7. Review the data.
If correct, go to Step 8.
If incorrect, click Redo.
Recording continues…
The data should resemble Fig. 2.5. The important aspect for you to review is that the data shows multiple peaks for each lift cycle, with greater amplitudes than the preceding lift cycles.
Fig. 2.5 Motor unit recruitment—lifting with increasing weights
If the data does not match, click Redo and repeat Steps 3-7. The last data segment you recorded will be erased.

Page 6 Biopac Science Lab
SEGMENT 2
8. Click Resume. A marker labeled Arm 1 - Fatigue will automatically be inserted when you click Resume, and the recording will continue from the point it left off.
9. Lift the maximum weight to 45 degrees and hold it until the onset of fatigue.
Subject should announce onset of fatigue.
The Subject should hold the weight until the arm begins to fatigue and then state this condition change so a marker can be inserted.
10. When the subject announces the onset of fatigue, insert a marker (F9 or Esc).
11. After 10 more seconds, click Suspend.
To insert a marker, press F9 (Windows) or Esc (Mac).
The time to fatigue will vary greatly among individuals.
When you click Suspend, the recording will halt, giving you time to review the data and prepare for the next recording segment.
12. Review the data.
If correct, go to Step 13.
If incorrect, rest the arm, and click Redo.
The data should resemble Fig. 2.6.
Fig. 2.6 Continuous lift with max weight until onset of fatigue
Note that the peak found immediately following the start of Segment 2 represents the maximal weight lifted.
Fig. 2.6 shows the point of fatigue captured on the same screen, but the data may scroll out of view. Use the horizontal (time) scroll bar at the bottom of the display to move through the entire recording.
If you redo this segment, have the Subject rest so the arm muscles recover and the data will be meaningful. When ready, click Redo and repeat Steps 8-12; the last data segment you recorded will be erased.
SEGMENT 3
13. To record Arm 2, switch the leads to the non-dominant arm (per Set Up Steps 4 and 5).
14. Release all weight/tension on the arm.
15. Click Resume.
16. Click OK to confirm leads were switched.
Recording continues…
Connect the leads to the electrodes on the Subject’s non-dominant arm, paying close attention to lead color and position.
A marker labeled Arm 2 - Lifting will automatically be inserted when you click Resume, and the recording will continue from the point it left off.

Lesson 2: EMG 2 Page 7
© BIOPAC Systems, Inc. 2005
17. Complete at least three cycles of lift-wait-repeat with increasing weight.
Insert a marker (F9 or Esc) each time the weight is set down.
Repeat a cycle of weight lifts, adding weight for each cycle until the maximum weight the Subject is capable of lifting is used. Lift each weight and hold for two seconds; then, set it down and wait for two seconds before increasing the weight for the next cycle.
It is important to lift from and return to the same position for each weight so the distance can be easily measured.
All Subjects must lift the same weights for valid comparisons.
To insert a marker, press F9 (Windows) or Esc (Mac).
18. Click Suspend. When you click Suspend, the recording will halt, giving you time to review the data and prepare for the next recording segment.
19. Review the data.
If correct, go to Step 20.
If incorrect, click Redo.
The data should resemble Fig. 2.5. The important aspect for you to review is that the data shows multiple peaks for each lift cycle, with greater amplitudes than the preceding lift cycles.
If the data does not match, click Redo and repeat Steps 14-19; the last data segment you recorded will be erased.
SEGMENT 4
20. Click Resume. A marker labeled Arm 2 - Fatigue will automatically be inserted when you click Resume, and the recording will continue from the point it left off.
21. Lift the maximum weight to 45 degrees and hold it until the onset of fatigue.
Subject should announce onset of fatigue.
Subject should hold the weight until the arm begins to fatigue and then state this condition change so a marker can be inserted.
22. When the Subject announces the onset of fatigue, insert a marker (F9 or Esc).
23. After 10 more seconds, click Suspend.
To insert a marker, press F9 (Windows) or Esc (Mac).
The time to fatigue will vary greatly among individuals.
When you click Suspend, the recording will halt, giving you time to review the data and prepare for the next recording segment.
24. Review the data.
If correct, go Step 25.
If incorrect, rest the arm and click Redo.
The data should resemble Fig. 2.6.
If you need to redo this segment, have the Subject rest so the arm muscles recover and the time-to-fatigue data will be meaningful. When ready, click Redo and repeat Steps 20-24; the last data segment you recorded will be erased.
25. Optional: Click Resume to record additional segments.
Optional: You can record additional segments by clicking Resume instead of Stop. A time marker will be inserted at the start of each added segment.
26. Click Stop.
27. Click Yes.
Recording continues…
A pop-up window with options will appear. Click Yes (or No if you want to redo the last segment).

Page 8 Biopac Science Lab
SEGMENT 5 — Listening to EMG
28. If you want to listen to the EMG signal
Put on the headphones.
Click Listen.
or
To end the recording, go to Step 32.
Listening to the EMG is optional.
Listening to the EMG can be a valuable tool in detecting muscle abnormalities, and is performed here for general interest.
Note When the Listen button is clicked, the volume through the headphones may be very loud due to system feedback. The volume cannot be adjusted, so you may have to position the headphones slightly off the ear to reduce the sound.
29. Subject must lift the maximum weight to optimize the signal for the listening segment and then set it down.
30. As anyone listens, Subject should lift weights and sustain lifts.
Watch how the data changes.
Listen to the sound variation.
31. Click Stop to end the listening segment.
You will hear the EMG signal through the headphones as it is being displayed on the screen. The screen will display two channels: CH1 EMG, and CH40 Integrated EMG. The data on the screen will not be saved. The signal will run until you click Stop. If others in your lab group would like to hear the EMG signal, pass the headphones around and click Redo.
32. Click Done to end the lesson.
33. Choose an option and click OK.
When you click Done, a dialog with options will be generated. Make your choice, and click OK.
If you choose Analyze current data file, go to the Analyze section for directions.
34. Remove the electrodes
END OF RECORDING
Unclip the electrode lead connectors and peel off the electrodes. Throw out the electrodes.
Lesson 2: EMG 2 Page 9
© BIOPAC Systems, Inc. 2005
V. ANALYZE
FAST TRACK Details
1. Enter the Review Saved Data mode and choose the correct file.
To review saved data, choose Analyze current data file from the Done dialog after recording data, or choose Review Saved Data from the Lessons menu and browse to the required file.
Note Channel Number (CH) designations:
Channel Displays
CH1 EMG (raw signal)
CH40 Integrated EMG
Fig. 2.7
2. Set up the measurement boxes as follows: Channel Measurement CH1 P-P CH40 Mean CH40 Delta T
The measurement boxes are above the marker region in the data window. Each measurement has three sections: channel number, measurement type, and result. The first two sections are pull-down menus that are activated when you click them.
P-P: Peak-to-Peak shows the difference between the maximum amplitude value in the selected range and the minimum amplitude value in the selected range.
Mean: displays the average value in the selected area.
Delta T: displays the amount of time in the selected segment (the difference in time between the endpoints of the selected area).
Note The “selected area” is the area selected by the I-Beam tool (including the endpoints).
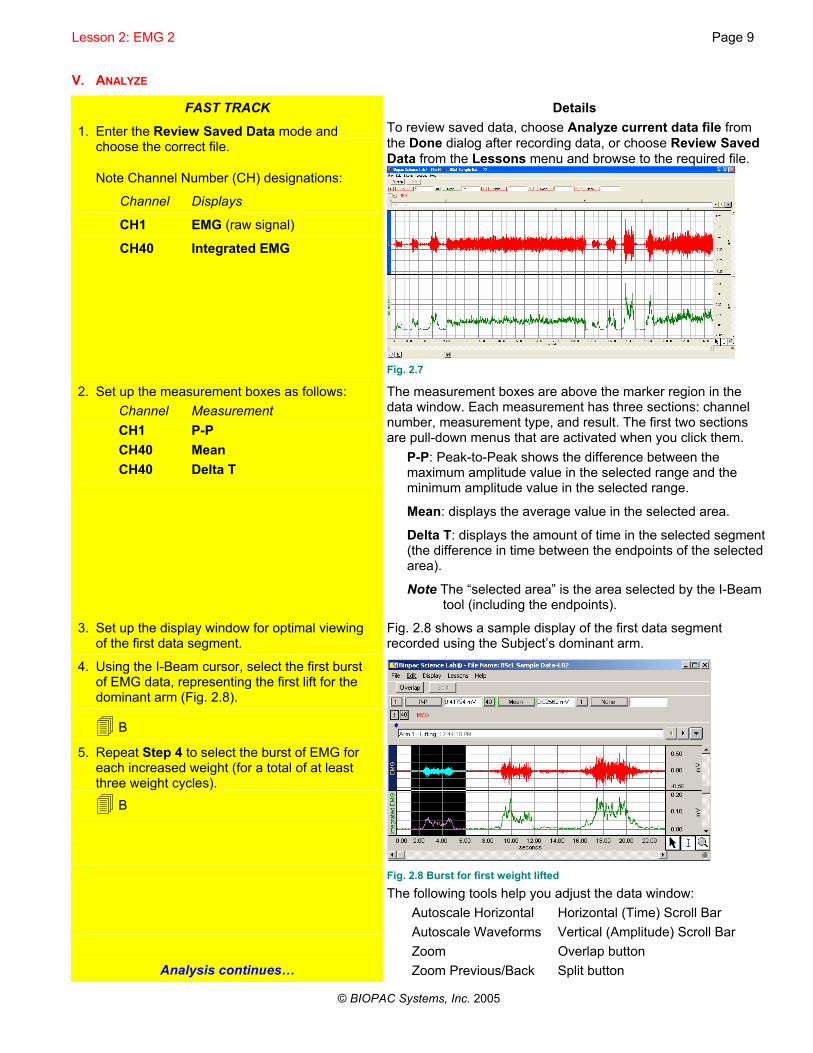
3. Set up the display window for optimal viewing of the first data segment.
4. Using the I-Beam cursor, select the first burst of EMG data, representing the first lift for the dominant arm (Fig. 2.8).
B
5. Repeat Step 4 to select the burst of EMG for each increased weight (for a total of at least three weight cycles).
B
Analysis continues…
Fig. 2.8 shows a sample display of the first data segment recorded using the Subject’s dominant arm.
Fig. 2.8 Burst for first weight lifted
The following tools help you adjust the data window: Autoscale Horizontal Horizontal (Time) Scroll Bar Autoscale Waveforms Vertical (Amplitude) Scroll Bar Zoom Overlap button Zoom Previous/Back Split button

Page 10 Biopac Science Lab 6. Scroll to the second recording segment (Arm 1
- Fatigue). The second recording segment begins at the marker labeled Arm 1 – Fatigue and represents the sustained lift with maximal weight using the Subject’s dominant arm (Fig. 2.9).
Fig. 2.9 Max weight lift to onset of fatigue
7. Using the I-Beam cursor, select the area from the peak for maximal weight to the marker for onset of fatigue.
C Note the CH40 Delta T result for time to fatigue.
The markers selected should represent the maximal weight lift at the start of Segment 2 (continuous maximal lift) and the point where the Subject announced fatigue.
Click at the point of the max marker (cursor will flash). Hold down the mouse button and drag to the right until the point of the fatigue marker, then release the mouse button (Fig. 2.9).
8. Scroll to the third recording segment (Arm 2 - Lifting).
9. Using the I-Beam cursor, select the first burst of EMG data, representing the first lift for the non-dominant arm.
B
10. Repeat Step 4 to select the burst of EMG for each increased weight (for a total of at least three weight cycles).
B
The third recording segment begins at the marker labeled Arm 2 – Lifting and represents lift cycles with increasing weights using the Subject’s non-dominant arm.
11. Scroll to the fourth recording segment (Arm 2 - Fatigue).
The fourth recording segment begins at the marker labeled Arm 2 – Fatigue and represents the sustained lift with maximal weight using the Subject’s non-dominant arm.
12. Using the I-Beam cursor, select the area from the peak for maximal weight to the marker for onset of fatigue.
C Note the CH40 Delta T result for time to fatigue.
The markers selected should represent the maximal weight lift at the start of Segment 4 (continuous maximal lift) and the point where the Subject announced fatigue.
Click at the point of the max marker (cursor will flash) and then hold down the mouse button and drag to the right until you reach the point of the fatigue marker, then release the mouse button.
13. Save or print the data file. You may save the data, save notes that are in the journal, or print the data file.
14. Exit the program.
15. Set the MP40 dial to Off.
END OF LESSON 2
Complete the Lesson 2 Data Report that follows.
Lesson 2: EMG 2 Page 11
© BIOPAC Systems, Inc. 2005
These are sample questions. You should amend, add, or delete questions to support your curriculum objectives.
Lesson 2 ELECTROMYOGRAPHY 2 Mechanical Work
DATA REPORT
Student’s Name:
Lab Section:
Date:
I. Data and Calculations Subject Profile
Name Age Gender: Male / Female Height Dominant arm: Right / Left Weight
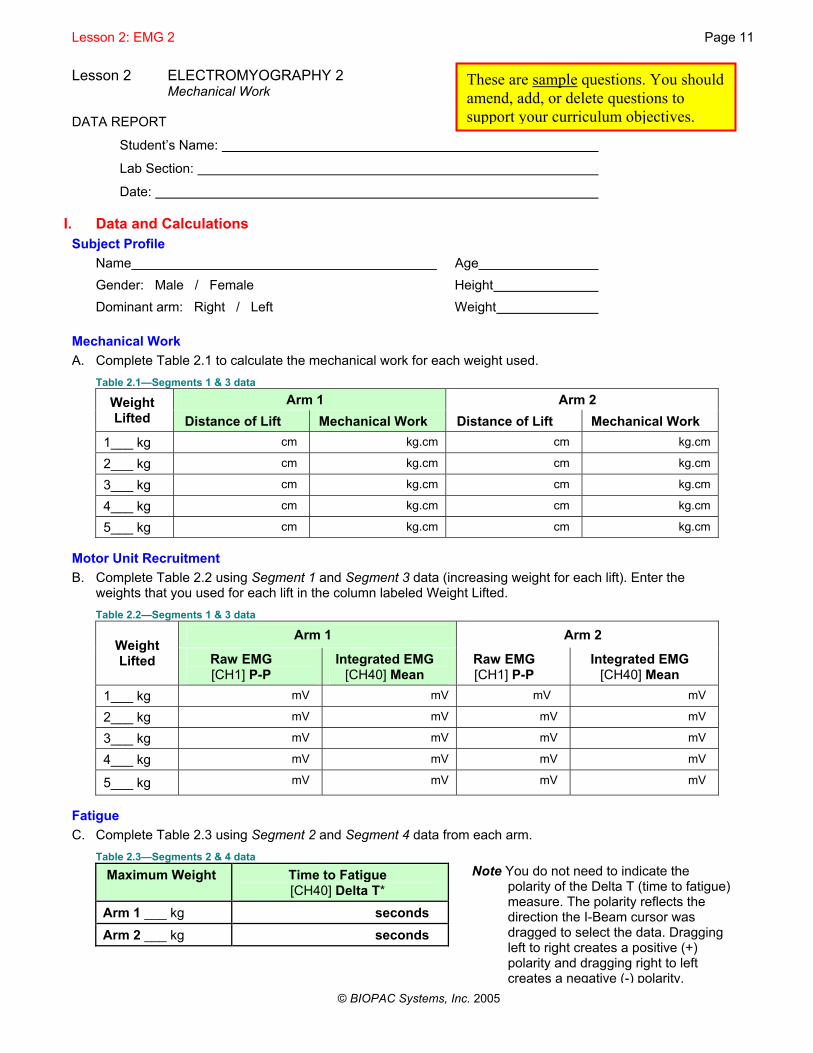
Mechanical Work A. Complete Table 2.1 to calculate the mechanical work for each weight used.
Table 2.1—Segments 1 & 3 data Arm 1 Arm 2 Weight
Lifted Distance of Lift Mechanical Work Distance of Lift Mechanical Work 1___ kg cm kg.cm cm kg.cm
2___ kg cm kg.cm cm kg.cm
3___ kg cm kg.cm cm kg.cm
4___ kg cm kg.cm cm kg.cm
5___ kg cm kg.cm cm kg.cm
Motor Unit Recruitment B. Complete Table 2.2 using Segment 1 and Segment 3 data (increasing weight for each lift). Enter the
weights that you used for each lift in the column labeled Weight Lifted. Table 2.2—Segments 1 & 3 data
Arm 1 Arm 2 Weight Lifted Raw EMG
[CH1] P-P Integrated EMG
[CH40] Mean Raw EMG [CH1] P-P
Integrated EMG [CH40] Mean
1___ kg mV mV mV mV
2___ kg mV mV mV mV
3___ kg mV mV mV mV
4___ kg mV mV mV mV
5___ kg mV mV mV mV
Fatigue C. Complete Table 2.3 using Segment 2 and Segment 4 data from each arm.
Table 2.3—Segments 2 & 4 data
Maximum Weight Time to Fatigue [CH40] Delta T*
Arm 1 ___ kg seconds Arm 2 ___ kg seconds
Note You do not need to indicate the polarity of the Delta T (time to fatigue) measure. The polarity reflects the direction the I-Beam cursor was dragged to select the data. Dragging left to right creates a positive (+) polarity and dragging right to left creates a negative (-) polarity.

Page 12 Biopac Science Lab II. Data Summary and Questions D. Is the strength of your dominant arm different than your non-dominant arm? Yes No
E. Is there a difference in the absolute values of weight lifted by males and females in your class?
Yes No
What might explain any difference?
F. When holding an object, does the number of motor units remain the same? Yes No
Are the same motor units used for the duration of holding the object?
G. Define mechanical work.
H. Define fatigue.
I. The primary energy source for skeletal muscle contraction is
J. Name two causes of skeletal muscle fatigue:
a) b)
K. What are the effects of long-term training relative to skeletal muscle fatigue?
L. Jocelyn lifts 8 kg a distance of 25 cm and William lifts 10 kg a distance of 20 cm. Does Jocelyn or William perform more mechanical work? Explain your answer.
End of Biopac Science Lab Lesson 2 Data Report

VI. ACTIVE LEARNING LAB
Design a new experiment to test or verify the scientific principle(s) you learned in the Biopac Science Lab recording and analysis segments.
For this lesson, you might examine how different weights, positions, or muscle groups influence max weight and time to fatigue.
Design Your Experiment
Use a separate sheet to detail your experiment design, and be sure to address these main points:
A. Hypothesis
Describe the scientific principle to be tested or verified.
B. Materials
List the materials will you use to complete your investigation.
C. Method
Describe the experimental procedure—be sure to number each step to make it easy to follow during recording.
Electrode placement is generally over the muscle for positive and negative leads, with the ground in a close/convenient location.
Run Your Experiment
D. Set Up
Set up the equipment and prepare the subject for your experiment.
E. Record
Use the Record, Resume, and Suspend buttons in the Biopac Science Lab program to record as many segments as necessary for your experiment.
Click Done when you have completed all of the segments required for your experiment.
Analyze Your Experiment
F. Set measurements relevant to your experiment and record the results in a Data Report.
© BIOPAC Systems, Inc. 2005
Related Documents