Replication Paper 23 Akinwande Atanda Information and Communications Technology Biometric Smartcards and payment disbursement A replication study of a state capacity-building experiment in India March 2019

Welcome message from author
This document is posted to help you gain knowledge. Please leave a comment to let me know what you think about it! Share it to your friends and learn new things together.
Transcript

Replication Paper 23
Akinwande Atanda
Information and Communications Technology
Biometric Smartcards and payment disbursement A replication study of a state capacity-building experiment in India
March 2019

About 3ie
The International Initiative for Impact Evaluation (3ie) is an international grant-making NGO promoting evidence-informed development policies and programs. We are the global leader in funding, producing and synthesizing high-quality evidence of what works, for whom, how, why and at what cost. We believe that using better and policy-relevant evidence helps to make development more effective and improve people’s lives.
3ie Replication Paper Series
The 3ie Replication Paper Series is designed to be a publication and dissemination outlet for internal replication studies of development impact evaluations. Internal replication studies are those that reanalyze the data from an original paper in order to validate the results. The series seeks to publish replication studies with findings that reinforce or challenge the results of an original paper. To be eligible for submission, a replication study needs to be of a paper in 3ie’s online Impact Evaluation Repository and needs to include a pure replication. 3ie invites formal replies from the original authors. These are published on the 3ie website together with the replication study.
The 3ie Replication Program also includes grant-making windows to fund replication studies of papers identified on our candidate studies list. Requests for proposals are issued one to two times a year. The candidate studies list includes published studies that are considered influential, innovative or counterintuitive. The list is periodically updated based on 3ie staff input and outside suggestions. The aim of the 3ie Replication Program is to improve the quality of evidence from development impact evaluations for use in policymaking and program design.
About this report
The Bill & Melinda Gates Foundation helped fund this report. All content, errors and omissions are the sole responsibility of the author and do not represent the opinions of 3ie, its donors or its Board of Commissioners. Please direct any comments or queries to the corresponding author, Akinwande A Atanda, at [email protected].
Suggested citation: Atanda, AA 2018. Biometric Smartcards and payment disbursement: a replication study of a state capacity-building experiment in India, 3ie Replication Paper 23. Washington, DC: International Initiative for Impact Evaluation (3ie). Available at: https://doi.org/10.23846/RPS0023
3ie Replication Paper Series executive editor: Marie Gaarder Co-managing editor: Anna Heard Production manager: Brigid Monaghan Copy editor: Jaime L Jarvis Proof reader: Yvette Charboneau Cover design: Akarsh Gupta © International Initiative for Impact Evaluation (3ie), 2018

Biometric Smartcards and payment disbursement: a replication study of a state capacity-building experiment in India
Akinwande A Atanda University of Canterbury
Replication Paper 23
March 2019

i
Acknowledgments
The author gratefully acknowledges Professor W Robert Reed (University of Canterbury, New Zealand), Benjamin DK Wood, and Scott Neilitz for their valuable suggestions.
ii
Summary
Most low- and middle-income countries lack the infrastructure to efficiently process and deliver payments to beneficiaries of welfare programs. As a result, many poor people are financially excluded or receive only a portion of the funds intended for them. There are few empirical studies for policy reference to identify and justify potential returns of public investment in building technology-based infrastructure. This study replicates a recent experimental study that fills this empirical gap by examining the effect of biometrically authenticated payments, “Smartcards,” on India’s two largest welfare programs (a work-for-payment scheme and a national pension program). We evaluate the original study’s findings and obtain comparable outcomes – that Smartcards decrease the time lag for recipients to receive funds, reduce leakages of benefits and increase enrollment rates in the two programs. We also examine the robustness of the original study to outliers, alternative model specifications, changes in estimation methods and treatment effects heterogeneity bias.

iii
Contents
Acknowledgments.......................................................................................................... i Summary ........................................................................................................................ ii Appendix tables ........................................................................................................... iv Abbreviations and acronyms ....................................................................................... v 1. Introduction ............................................................................................................... 1 2. Push-button replication ............................................................................................ 3 3. Pure replication ......................................................................................................... 3
3.1 Data ...................................................................................................................... 4 3.2 Brief description of the field experiment and method ............................................. 4 3.3 Replication results ................................................................................................. 5
4. Measurement and estimation analyses ................................................................... 8 4.1 MEA I: How does the estimated effect differ as one moves from ITT to TOT?....... 8 4.2 MEA II: Are the original results robust to outliers? ................................................. 9 4.3 MEA III: Are the original results robust to alternative specification?..................... 10 4.4 MEA IV: are the original results robust to alternative estimation procedures? ..... 11
5. Theory of change analysis: can we identify moderating factors that contribute to the heterogeneous effects? ................................................................................... 11
6. Conclusions ............................................................................................................. 13 Appendix A: Pure replication results ......................................................................... 15 Appendix B: Measurement and estimation analyses ............................................... 26 Appendix C: Theory of change analysis .................................................................... 45 References ................................................................................................................... 48

iv
Appendix tables
Table A1: Official and self-reported use of Smartcards .................................................. 15 Table A2: Access to payments ...................................................................................... 16 Table A3: Official and survey reports of program benefits ............................................. 17 Table A4: Illustrating channels of leakage reduction ...................................................... 18 Table A5: Access to programs ...................................................................................... 19 Table A6: Beneficiary opinions of Smartcards ............................................................... 20 Table A7: Nonexperimental decomposition of treatment effects by carded status ......... 21 Table A8: Number of participants across surveyed districts for the NREGS program .... 22 Table A9: Number of participants across surveyed districts for the SSP program ......... 24 Table B1: MEA I – nonexperimental decomposition of treatment effects by carded status
within treatment group ................................................................................... 26 Table B2: MEA II – official and self-reported use of Smartcards .................................... 27 Table B3: MEA II – access to payments ........................................................................ 27 Table B4: MEA II – official and survey reports of program benefits ................................ 28 Table B5: MEA II – illustrating channels of leakage reduction ....................................... 29 Table B6: MEA II – access to programs ........................................................................ 29 Table B7: MEA II – nonexperimental decomposition of treatment effects by carded status
...................................................................................................................... 30 Table B8: MEA III – official and self-reported use of Smartcards ................................... 31 Table B9: MEA III – access to payments ....................................................................... 32 Table B10: MEA III – official and survey reports of program benefits ............................. 33 Table B11: MEA III – illustrating channels of leakage reduction .................................... 34 Table B12: MEA III – access to programs ..................................................................... 35 Table B13: MEA III – nonexperimental decomposition of treatment effects by carded
status ............................................................................................................ 36 Table B14: MEA IV – official and self-reported use of Smartcards ................................. 38 Table B15: MEA IV – access to payments ..................................................................... 39 Table B16: MEA IV – official and survey reports of program benefits ............................ 40 Table B17: MEA IV – illustrating channels of leakage reduction .................................... 41 Table B18: MEA IV – access to programs ..................................................................... 42 Table B19: MEA IV – nonexperimental decomposition of treatment effects by carded
status ............................................................................................................ 43 Table B20: MEA IV – nonexperimental decomposition of treatment effects by carded
status ............................................................................................................ 44 Table C1: Theory of change analysis – official and self-reported use of Smartcards ..... 45 Table C2: Theory of change analysis – access to payments ......................................... 45 Table C3: Theory of change analysis – official and survey reports of program benefits . 46 Table C4: Theory of change analysis – illustrating channels of leakage reduction ......... 46 Table C5: Theory of change analysis – access to programs .......................................... 47 Table C6: Theory of change analysis – nonexperimental decomposition of treatment
effects by carded status ................................................................................. 47

v
Abbreviations and acronyms
BL Base line
FE Fixed effect
GLMM Generalized linear mixed model
GP Gram panchayat
ITT Intent to treat
LNG Liquefied Natural Gas
MEA Measurement and estimation analysis
NREGS National Rural Employment Guarantee Scheme
OLS FE Ordinary least square fixed effect
PC Principal component
RE Random effect
SSP Social security pensions
TOT Treatment on the treated

1
1. Introduction
Lack of efficient and adequate technology-enabled infrastructure, high poverty rates and corruption constitute a few of the major economic problems hindering inclusive growth (de Mello and Dutz 2012), optimal delivery of public services and distribution of public transfers in low- and middle-income countries. India, the world’s second most populated nation, has achieved significant success in improving welfare in most cities where there is technological advancement, but more effort is required in rural areas to reduce poverty, provide access to efficient payment infrastructure and facilitate the disbursement of funds to the poorest of the poor without leakages. Estimates from the World Bank (2016) reveal that more than half of the population in India is living on less than US$3.90 (Rs 206.3)1 a day and only 32.6 percent of rural residents can withdraw or receive remittances through formal financial institutions. The Internet and Mobile Association of India (Pandey 2018) has reported that only 16 percent of the rural dwellers use the Internet to verify and process remittances from government or family and friends, compared to 44 percent in the urban areas. The lack of adequate and widespread technology-based infrastructure and formalized institutions are hindering government efforts to successfully deliver public services, target the poor and disburse payments effectively to achieve better welfare outcomes.
These problems are not prevalent only in India; similar issues confront other low- and middle-income countries, in varying degrees. One pathway to ameliorate such welfare issues is to invest and develop appropriate (and empirically verified) modern technological infrastructure for disbursing money to targeted beneficiaries and improving public service delivery. The technology must align with the needs of the poor, serve as an audit tool for reducing corruption (leakages) and facilitate state capacity development. As Afridi and Iversen (2014) note, audit tools can improve government service delivery through employment generation and reduction in leakages if efficiently implemented in a country such as India, where officials are constantly looking for rent-seeking loopholes.
The highlighted welfare issues and associated public service delivery inefficiencies with a lack of technology-enabled infrastructure motivates us to validate the evidence-based policy options reported in Muralidharan and colleagues (2016) for addressing those issues. We validate by replicating their study, Building State Capacity: Evidence from Biometric Smartcards in India. The goal of validating the study is to provide more credibility in support of public investments in technology-based infrastructure to enhance the efficiency of public service delivery and reduce corruption. Muralidharan and colleagues investigate the impact of biometrically authenticated payment infrastructure (Smartcards) on beneficiaries of the two largest employment programs in the Indian state of Andhra Pradesh – the National Rural Employment Guarantee Scheme (NREGS) and Social Security Pension (SSP).
1 The exchange rate used in this paper is US$1 to 66.5580 rupees (Rs). This is the prevailing rate as at 17 October 2016, sourced from https://www.oanda.com/currency/converter/.

2
The aim of introducing fingerprint scanning2 as an authentication process (i.e. verification and audit system) for payments in the two largest welfare programs (NREGS and SSP) in India is to specifically target those in need of welfare packages and promote effective public disbursement of payments to the poor in the selected districts of Andhra Pradesh. The Smartcard project is a key part of India’s digital reforms, which have registered more than 1.1 billion people through the biometric authentication scheme (Gelb et al. 2018). The Andhra Pradesh biometric authentication technology has enabled the establishment and operation of several employment, consumption and income programs to target poor people. Similarly, it facilitates unrestricted access to an anti-poverty program that enhances government technical capacity to enable prompt payment transfers (Pritchett 2009), guard against corruption, which often leads to the leakage – i.e. theft of money meant for the poor by government officials (Niehaus and Sukhtankar 2013; Muralidharan et al. 2014), improve public social service delivery (Afridi and Iversen 2014) and reform India’s complex system of subsidies, benefits and transfers, which accounts for more than US$60 billion in annual spending (Gelb et al. 2017).
Muralidharan and colleagues’ large-scale randomized experiment provides well-established and non-theoretical evidence on the benefits of investing in state capacity building (e.g. secure payment infrastructure) for improving development and social welfare. The original study contributes to the growing and conflicting literature on the effect of technology on corruption in low- and middle-income countries. The authors reveal that large-scale institutional supports for building capacity can increase the impact of technological solutions on household earnings, participation in employment programs (i.e. public service delivery), reduction of funds leakages and other forms of corruption.
The evidence of welfare improvement and reported gains from the use of Smartcards reported in the original paper can further contribute to the achievement of 9 of the 17 Sustainable Development Goals3 set by the United Nations Development Programme, especially for low-income countries such as India. This constitutes another justification for this replication study to validate Muralidharan and colleagues’ findings and provide additional evidence to support the use of Smartcards in other low- and middle-income countries. The outcomes of this replication will help those low- and middle-income countries determine how to use the evidence to effectively target the most vulnerable people in need of welfare packages and distribute payments and improve government service delivery.
2 As described in Muralidharan and colleagues (2016, p.2903), the Smartcard holds the beneficiary’s biometric data (all 10 fingerprints), digital photograph and bank account details. The card is used as a form of identification through matching the scanned fingerprints at the point-of-service collection with a unique biometric record in the database. The matching process is random and can be unreliable in authenticating transactions for multiple reasons, including technical issues and nonmatching of fingerprints. Other associated and evolving issues are extensively discussed in Afridi and colleagues (2017) and Drèze and Khera (2018). 3 The related goals to Muralidharan and colleagues’ study are No Poverty (Goal 1), Zero Hunger (Goal 2); Good Health and Well-being (Goal 3); Gender Equality (Goal 5); Decent Work and Economic Growth (Goal 8); Reduced Inequalities (Goal 10); Responsible Consumption and Production (Goal 12); Strong Institutions (Goal 16); and Global Partnerships for the Goals (Goal 17). The full list of the Sustainable Development Goals is available at: https://www.undp.org/content/dam/undp/library/corporate/brochure/SDGs_Booklet_Web_En.pdf

3
Our replication study confirms Muralidharan and colleagues’ findings, which provide evidence to justify the potential marginal benefits of public investment in building technology-based state capacity (e.g. a biometric payments system) to enhance public service delivery systems, improve access to transfer payments for the poor, alleviate poverty and reduce leakages (i.e. corruption). In the absence of such capacity, Olken (2006) describes that leakages of funds from their intended use due to corruption in the public system can create lack of incentives for policymakers to continue financing existing or future programs capable of improving the lives of the poor. Similarly, this replication study provides insights on additional benefits of biometric technology, such as efficiency (Gelb and Clark 2013), quality improvement, transparency and accountability (Lewis-Faupel et al. 2014) in the financing and allocation of money to participants enrolled in any welfare program.
Muralidharan and colleagues report that Smartcards in converted villages help participants earn more money, reduce leakages of funds, increase employment rates and facilitate prompt access to payment. These can complement government social and welfare efforts in India to achieve reductions in poverty, hunger and gender inequality, and improve good health and well-being, decent employment and productivity, income equality and domestic consumption. The Smartcards’ ability to reduce corruption and improve transparency and accountability in the disbursement of money to the poor can also strengthen strong institutions and global partnership with international donors such as the Bill & Melinda Gates Foundation.
To verify and validate the welfare returns from investing in technology-based state infrastructure such as Smartcards, we extensively evaluate the original study. The remainder of this paper is divided in five sections. Section 2 is the push-button replication, in which we check whether the estimation codes can be executed “as is,” without any modification. Section 3, the pure replication, confirms the consistency of the original results and checks whether the estimates from the replication exercise and the original study are the same. The robustness of the original results are examined in Section 4 under the measurement and estimation analysis (MEA). Section 5 is the theory of change analysis, in which new causal relationships are established. Section 6 concludes the replication study.
2. Push-button replication
We initially performed a push-button replication exercise, in which the original results are reproduced by running the codes “as is” without making any adjustments or reading through the estimation procedures and assumptions in the paper. The goal of the push-button replication as the first step is to assess the replicability of the original study without consulting the authors. The push-button replication exercise was successful, as we were able to reproduce the findings of Muralidharan and colleagues using the original data, methodology, code and statistical software without any modification.
3. Pure replication
The objective of a pure replication is to confirm the consistency of the original results. Instead of re-coding the entire findings using a different statistical application, such as R, we carefully audited the Stata do files, line by line, for data cleaning, transformation of
4
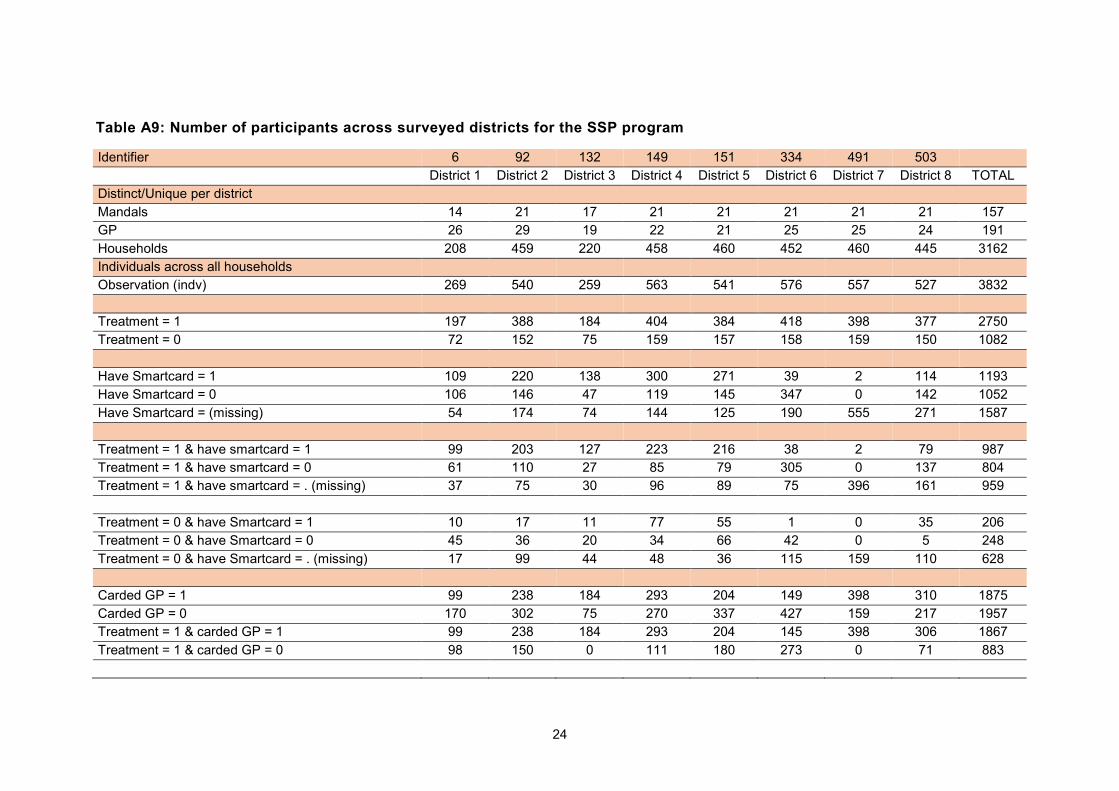
variables and model estimations. During the code audit, we found that Muralidharan and colleagues had replaced missing values with zeros for some variables4 in Section B of the NREGS and SPP survey data files. However, the changes do not influence the results. Also, while checking the number of observations in each surveyed district across different dimensions, we observed that there were some participants with Smartcards in the non-carded villages in the control group (Tables A8 and A9 in Appendix A). Instead of characterizing those cases as outliers, we realized that those recorded observations for the use of Smartcards in the non-carded villages were inevitable and could be regarded as a minor non-compliance issue with the randomization protocol.
3.1 Data
Muralidharan and colleagues have a publicly available replication folder on the American Economic Review website (Muralidharan et al. 2016), which we used for the pure replication. The folder contains other sub-folders, such as “analysis code,” “data” and “utilities.” The analysis code folder contains 35 Stata do files and 2 R program files. The data folder consists of 62 Stata data files for the baseline and endline surveys in 2010 and 2012. Some sections of the survey questionnaire are in separate data files. This includes household characteristics, census data, official records and leakage data. A comprehensive description of each of the data files is in a printable document file (ReadME.pdf) that comes with the replication folder. The utility directory contains Stata programs written by the original authors to automate part of the analyses and produce a better visualization. Replicating most of the reported findings requires combined use of different data files and some utility programs.
A master do file is used to connect all the folders, data and code files together to reproduce the original results, as presented in Section 3.3.
3.2 Brief description of the field experiment and method
Muralidharan and colleagues use a large-scale field experiment to randomize5 the rollout of Smartcards, with the goal of identifying and understanding the gains from the use of biometric technology for authenticating beneficiaries’ identities before the disbursement of payments. As documented in the literature (Pritchett 2009 Niehaus and Sukhtankar 2013; Muralidharan et al. 2014; Banerjee et al. 2016; Gelb et al. 2018), such technology helps government deliver more efficient services and reduces the complexities associated with subsidies, transfers and benefits systems. The biometric authentication technology also has a spillover effect of reducing leakages of funds resulting from over-reporting the amount of work done or creating “ghost” households.
In the original study, the authors report randomizing the rollout of the Smartcards across eight districts6 in the Indian state of Andhra Pradesh between 2010 and 2012. From the 4 These are variables measuring the use of Smartcards by participants in the treatment group, labeled as “b17_useSmartcard” and “b26_1_swipeFingerprints”. 5 The randomization was stratified by districts and socioeconomic characteristics of surveyed households. See Section B of Muralidharan and colleagues (2016, pp.2,907–2,909) for a full description of data collection procedures. 6 Adilabad, Ananthapur, Kadapa, Khammam, Kurnool, Nalgonda, Nellore and Vizianagaram.

5
districts, 296 mandals (sub-districts) were selected from a total of 405 and randomized into treatment (112 mandals, 37.8%), control (45 mandals, 15.2%) and buffer (139 mandals, 47%) groups.7 The buffer mandals were excluded from the analysis.8 In each mandal, a fixed number of villages, known as gram panchayats (GPs), were selected, producing a total of 880 GPs. In each GP, 10 households were selected to participate in the survey.
In the original paper, the survey data were analyzed by estimating the following model:
𝑌𝑌 = 𝛼𝛼 + 𝛽𝛽𝛽𝛽𝛽𝛽𝛽𝛽𝛽𝛽𝛽𝛽𝛽𝛽𝛽𝛽 + 𝐷𝐷𝐷𝐷𝐷𝐷𝛽𝛽𝛽𝛽𝐷𝐷𝐷𝐷𝛽𝛽 𝐹𝐹𝐹𝐹𝐷𝐷 + 𝛾𝛾𝛾𝛾𝛾𝛾 + 𝛿𝛿𝑌𝑌�0 + 𝛽𝛽𝛽𝛽𝛽𝛽𝑒𝑒𝛽𝛽 (1)
where 𝑌𝑌�0 is the GP-level mean of the dependent variable at the time of the baseline and PC is the principal component (PC) variable that was used to stratify the mandals. The key variable here is Treated, which takes a non-zero value if the individual or household belonged to a mandal that had been selected for treatment.
The study employed individual and household beneficiary-level observations for NREGS and SSP programs to conduct intent-to-treat (ITT) analysis, which compares the average outcomes in treatment and control areas. The ITT estimates yield the policy parameter of interest. The implementation of the Smartcard-enabled payment system was assessed on three key policy parameters (𝑌𝑌): payment logistics (i.e. timeliness and ease of access), prevention of leakages and program access.
3.3 Replication results
All replication results are presented in the appendix. The results (Tables A1–A7) from the pure replication exercise are the same as the push-button replication. In addition to the presented replicated findings in the appendix, we report p-values for each estimated coefficient, and they are highlighted in grey in each table. The first table we replicated presents findings on the use of Smartcards for NREGS and SSP programs using the official9 and survey10 data. The other results (either original or replicated estimates 7 The key difference between the treatment and control group is the system of payments for NREGS and SSP programs. In the treatment group mandals, payments were made through the “Bank Technology Service Provider (TSP) Customer Service Provider (CSP) Worker” Smartcard-enabled channel. The control group payment system channel is from “State District Mandal Gram Panchayat Worker.” 8The lag between the deployment of Smartcards in the treatment and control groups was more than two years. Muralidharan and colleagues created the buffer group to avoid contamination of the control group before the mandals in the group were converted to the new payment system and to ensure they had sufficient time to conduct the endline surveys. Through the process, enrollment was allowed to take place in the buffer group without affecting the control mandals. 9 Muralidharan and colleagues extracted the official records on beneficiary lists and benefits paid from the official disbursement data to determine the official number of Smartcards rolled out and the proportion used to conduct transactions and the amounts disbursed, and to estimate leakages of funds. Leakage is estimated as the difference between the official payment disbursed and the reported actual payment received by the beneficiary during survey. 10 The survey data are the combination of the baseline and endline household surveys of samples of enrolled beneficiaries in the treatment and control groups. The data include questions on the payment received, participation experience in the NREGS and SSP programs and general socioeconomic information such as income, employment, assets and consumption.

6
directly associated with Tables A2–A7) use the endline survey data. Tables A2, A3 and A4 reproduce findings on access to payments (i.e. average time taken to collect a payment using the Smartcards), program benefits (effect on leakage) and channels of leakage reduction, respectively. Table A5 reproduces findings on access to programs proxied by participation rates in the NREGS and SSP schemes. The negative and positive effects of the Smartcard implementation, based on opinions of the surveyed beneficiaries, are shown in the reproduction of Muralidharan and colleagues’ Table A6. The results of Smartcard implementation by carded and non-carded status are presented in Table A7.
Our replication results are exactly the same as the findings in the original paper. We summarize each of the results presented in the appendix, with additional comments where necessary, in the following sections.
3.3.1 Table A1: official and self-reported use of smartcards The original results (Table A1) are reasonable and not unexpected, but there is a possibility that the large differences between the official and self-reported use of Smartcards is influenced by the actions of corrupt officials to facilitate leakages of funds. There are more financial incentives for government officials to inflate the records by introducing “ghost” beneficiaries (i.e. workers and pensioners) to divert payments into their personal accounts. Corruption of this nature might keep evolving amid government audit systems, as officials continue to look for ways to manipulate official records to benefit their interests (Afridi and Iversen 2014; Gelb et al. 2018).
When randomization is successful, one expects that there will be no converted villages in the control sample and that all (most) of the villages convert in the treated sample. The official data for NREGS (SSP) payments indicate that 0.5% (0%) of GPs in the non-treatment group have been converted to the Smartcard-based payment system and 0.2% (0%) of the issued cards have been used for transaction by the beneficiaries in those villages. On the other hand, we found more contamination11 of the treatment group for both programs using the survey data and conduct further investigation in Section 4.
3.3.2 Table A2: access to payments The results presented in Table A2 are the same as in the original paper, which provides justification of the hypothesis that Smartcards reduce the time for beneficiaries to collect payment for work done or from a pension.
The time gained from the use of Smartcards may be attributed to (i) the new payment delivery mode, which eliminates the use of post offices for payment disbursements, as done in the control group and (ii) the speed of authenticating beneficiaries’ identities. Also, the use of Smartcard-enabled payments may have spillover effects through transparency and accountability in reducing the processing time and potential leakages through the post-office payment delivery route if the use of post offices coexists with the biometric system in a mandal to facilitate payments for those without Smartcards in the treatment group. But, if the payment process through the post offices lags behind in terms of efficiency, transparency and accountability over time, then it would encourage more people to enroll to use the biometric cards to benefit from the time savings.
11 As Table A8 and A9 show, we further inspect the imbalances in Section 4 (MEA) as outliers.
7
3.3.3 Table A3: effects on payment amounts and leakages Muralidharan and colleagues’ results presented in Table A3 reveal that the use of Smartcards helps beneficiaries collects more money and reduces incidence of payment leakages. But, we argue that the significant outcomes (i.e. increased payments and reduced leakages) might have been due to transparency and careful verification of the identity of the beneficiaries by the customer service providers in each district. Similarly, the increased earnings could be the result of households’ working more days than before, or an NREGS expenditure composition effect, with more of the program resources spent on labor than materials in the surveyed villages.
3.3.4 Table A4: channels of leakage reduction The results presented in Table A4 reveal that the use of Smartcards reduces the three considered channels of leakages: (i) ghost households (all beneficiaries in the households who were confirmed not to exist or had permanently migrated before the study period started), (ii) over-reporting (job cards that had positive official payments reported but zero survey payments, excluding ghosts) and (iii) bribes to collect or underpayment (bribes paid in order to receive payments).
Muralidharan and colleagues find the effect on the incidence of over-reporting to be the most statistically significant and account for the largest source of leakages. However, we argue that the over-reporting form of leakages could have been possible due to loopholes in the payment delivery route known by the officials and the channeling of money through multiple hands without transparency and accountability, as well as the easy access by corrupt officials to create multiple bank accounts using ghost beneficiaries’ names. Such accounts are accessible only by the officials. Afridi and Iversen (2014) describe these types of corruption dynamism as constantly evolving, as officials never stop looking for loopholes in the system for rent-seeking.
3.3.5 Table A5: effects on program access Muralidharan and colleagues assess the potential effect of leakage reduction driven by the use of Smartcards on beneficiaries’ participation rate in the NREGS and SSP programs. The results in the original paper for the program access is the same as our replications results and presented in Table A5.
In all, we agree that the evidence points to the fact that Smartcards does not hinder access to either program in the converted mandals. Also, it is worth noting that the increase in participation could have been driven by increase in demand for workers in the NREGS program, participants’ expectation of prompt payments and the incentive officials could gain by enrolling more participants without Smartcards in the same treated areas.
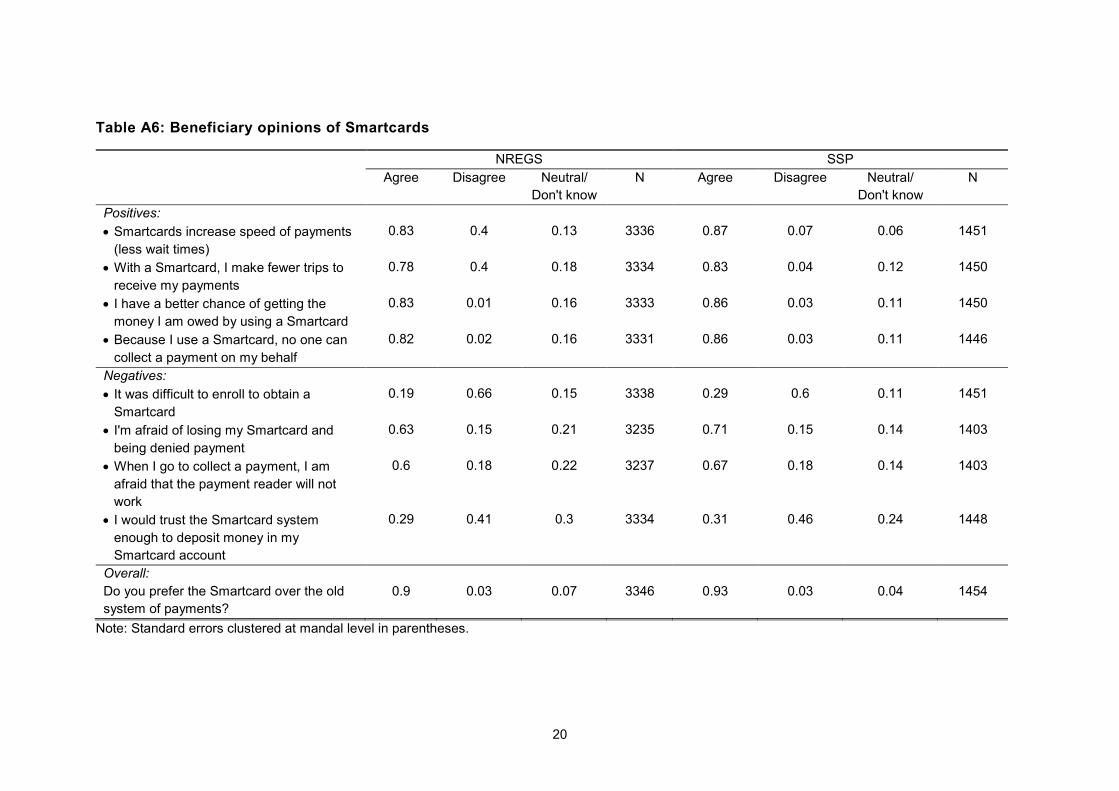
3.3.6 Table A6: beneficiary perceptions of the intervention Table A6, which is the same as the original results, presents the aggregate opinions of beneficiaries in the converted mandals who had received payments using the old system prior to the introduction of Smartcard-based payments. In addition to the pros and cons of the use of Smartcards highlighted in Table A6, it is clear that the payment authentication system still faces a good deal of criticism and challenges not limited to the high cost of implementation, administrative and political bottlenecks, failure to

8
authenticate genuine beneficiaries after the first attempt and data privacy breaches (Mukhopadhyay et al. 2013; Gelb et al. 2017).
3.3.7 Table A7: Decomposition of treatment effects by carded status In the treatment mandals where the new payment system has been introduced, there are “carded” GPs (villages that have moved to Smartcard-based payment) and “not carded” GPs (villages that have not yet been converted to the use of Smartcards). In the treated mandals (those that have moved to the biometrically authentication system), there is uneven distribution of Smartcards to beneficiaries in the carded villages.12 Muralidharan and colleagues examine the effect of Smartcard decomposition based on carded and not carded villages in the treated mandals on payments logistics, leakages and access. The replication results presented in Table A7 are the same as the original results and reveal that there are more gains for beneficiaries with Smartcards in the converted villages than those without Smartcards.
4. Measurement and estimation analyses
This section examines the robustness of the comparable replicated results to changes in model specifications, outliers and alternative estimation method. Of the entire MEA-reported findings, the following subsections discuss only the estimates that differ significantly from the original estimates; the full results are shown in Appendix B.
4.1 MEA I: How does the estimated effect differ as one moves from ITT to TOT?
Muralidharan and colleagues conducted ITT analyses for reasons stated in the last paragraph of Section 2.2. The ITT is used to compare the average outcomes in treatment and control groups. But, they also report “non-experimental decomposition” results in Table A7 by comparing the outcomes within the treatment group where the villages had moved to Smartcard-based payments (“carded GP”) and not yet moved to the new payment system (“not carded GP”). Then, we further decomposed using individual beneficiaries’ Smartcard status (“have Smartcard, carded GP” or “no Smartcard, carded GP”). The estimated effects at this level can be thought of as estimating the effect of treatment on the treated (TOT), with the caveat that the selection into a treatment group (“Smartcards”) was not random. Even though selection into treatment is not random, these estimates are still of interest because they help to establish an upper bound on the benefits of Smartcards.
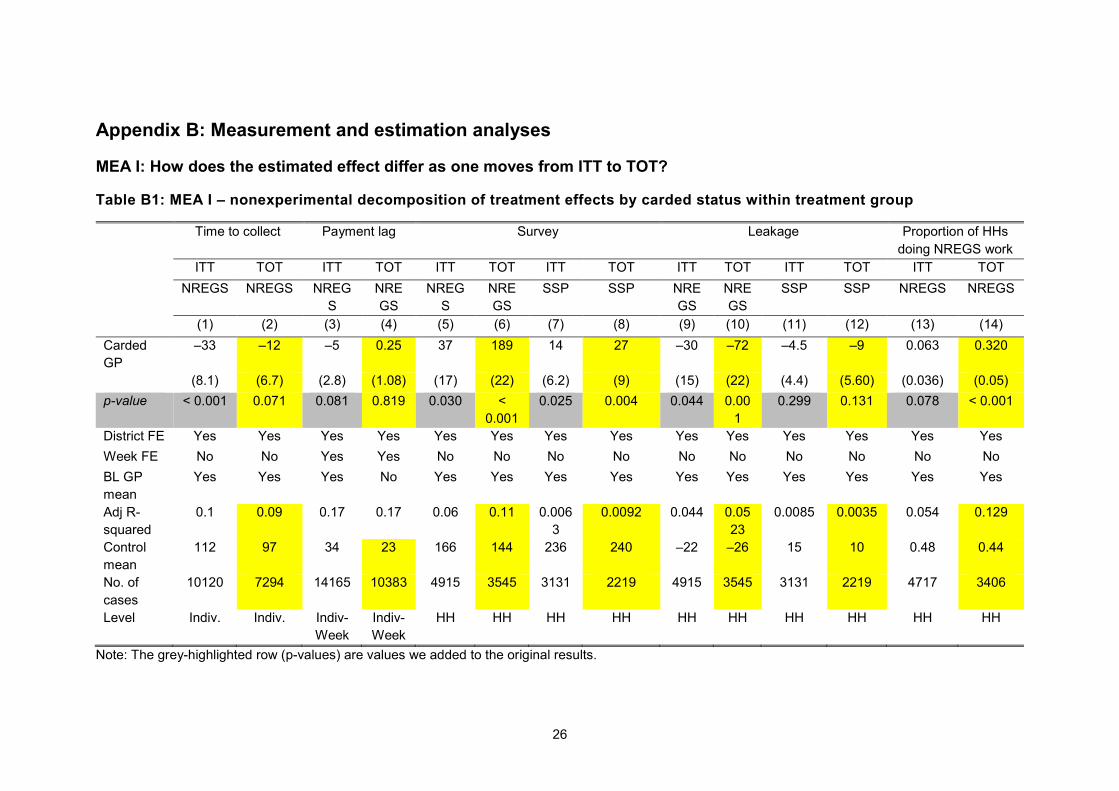
However, we further explore the TOT analysis by comparing “have Smartcard” to “does not have Smartcard” within carded GPs, as reported in Table B1. This helps understand the benefits of having Smartcards within carded GPs (TOT columns in Table B1) relative to the benefits of converting villages to the Smartcard payments system (ITT columns in Table B1). We used the ordinary least square fixed effect (OLS FE) approach identical to Muralidharan and colleagues’ approach for the comparison.
12 See Tables A8 and A9 for the distribution of Smartcards across districts for the NREGS and SSP programs, respectively.

9
The reported results in Table B1 show that beneficiaries with Smartcards in carded GPs significantly (i) spend less time to collect payments,13 (ii) receive more money, (iii) gain reduction in leakage of funds and (iv) experience more access to work, compared to household or individuals without Smartcards in the same carded villages. However, we found no significant difference in the payment lag. These findings, excluding “time to collect,” are consistent with the outcomes from Muralidharan and colleagues’ test of equality between “have Smartcard” and “no Smartcard” in Table A7.
One plausible reason for households with Smartcards having more access to work than those without Smartcards in the same carded villages could be attributed to (i) favoritism (i.e. from close relatives who are among the officials that allocate jobs), (ii) strong local political connections and/or (iii) dissatisfaction and lack of motivation experienced by non-Smartcard holders. For instance, job cardholders without Smartcards can voluntarily demand less work to minimize their loss of earnings due to leakages as an opportunity cost of not using the new payment system.
Our MEA I confirms the robustness of Muralidharan and colleagues’ non-experimental decomposition results (even columns in Table A7) to changes in the decomposition structure as TOT (in Table B1). Unlike the original authors, we provide the average treatment effects by comparing the benefits between having Smartcards and not having Smartcards within the carded GPs, instead of the comparison with the original control group.
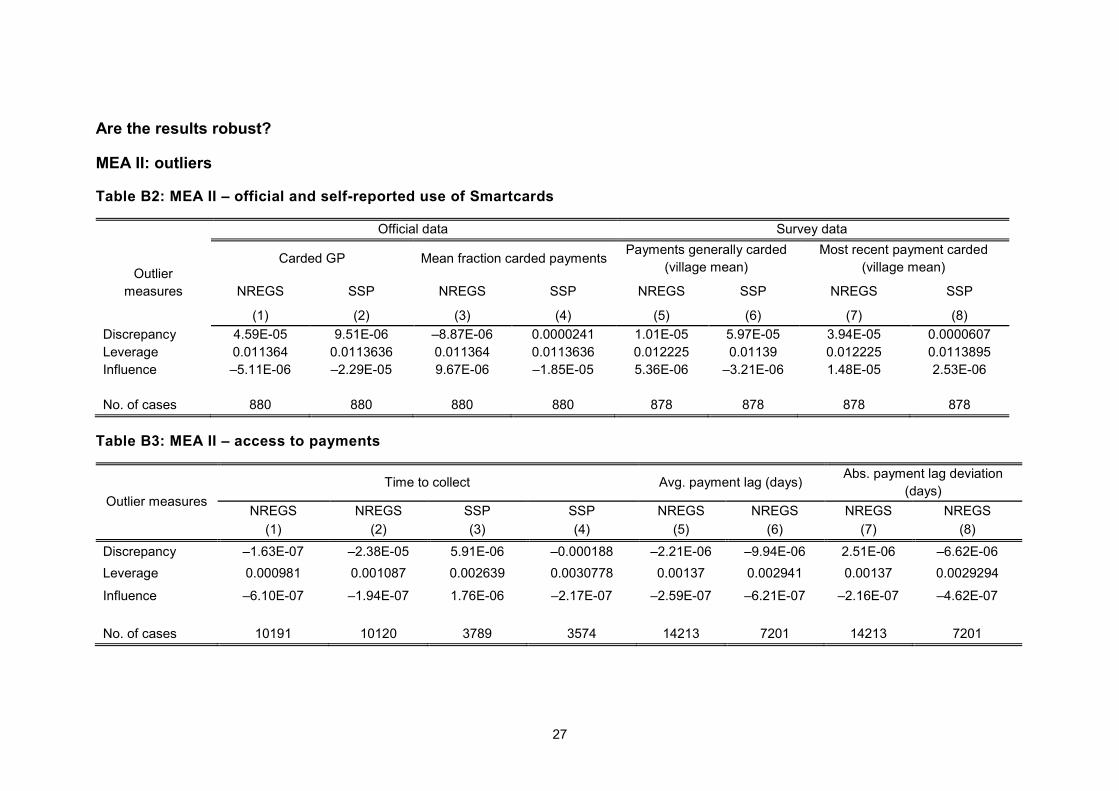
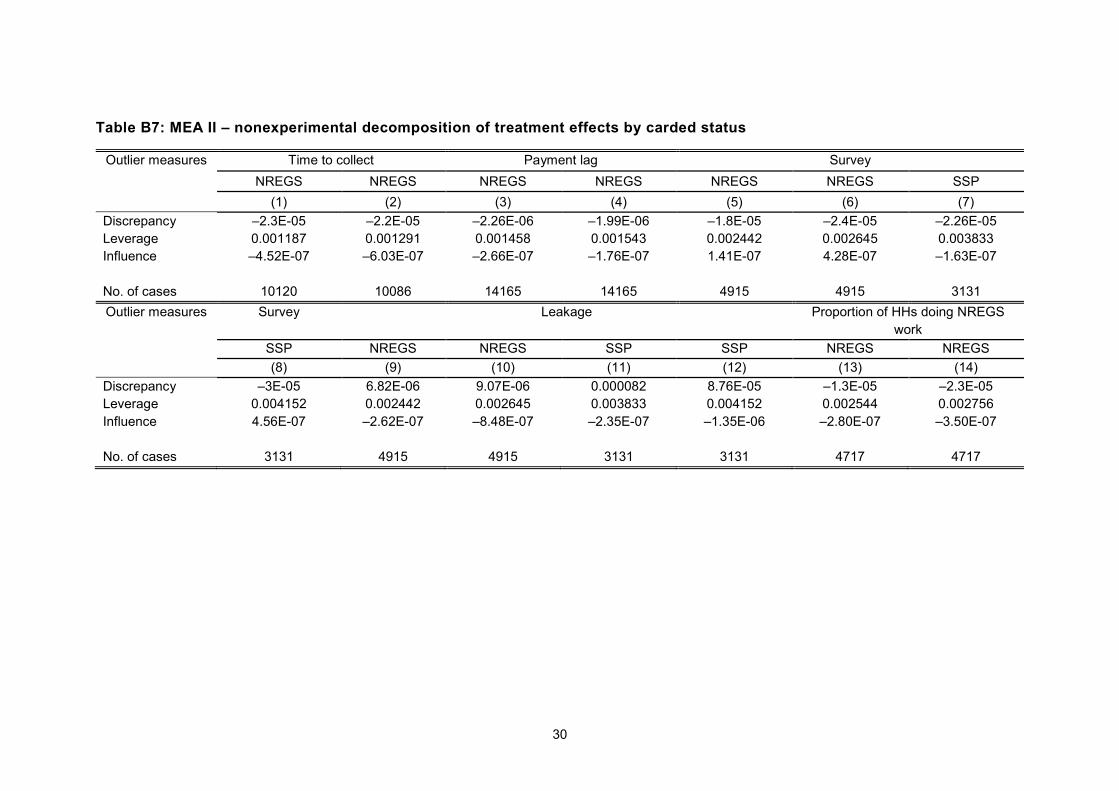
4.2 MEA II: Are the original results robust to outliers?
The presence of outliers such as extreme values, if not addressed, can significantly influence and distort the estimated average treatment effects reported in Muralidharan and colleagues (2016). This motivated us to test for outliers and if detected, to test how significantly the outliers influenced the original estimates. Otherwise, the reported results are robust to any form of outliers present in the data set. We use three of the residual-based measures available in Stata for detecting outliers such as (i) discrepancy, which measures the difference between actual and predicted/estimated treatment effects [i.e. 𝑌𝑌 − 𝑌𝑌�]; the closer it is to zero, the more robust are the estimates to outliers; (ii) leverage, which identifies points in the data set where observations on the predictors have multiple extreme values, and their effect on the estimated model; a leverage level with measure greater than 2 K/N will have more effect on the treatment effects compared to low leverage; and (iii) influence, which measures the joint effect of discrepancy and leverage levels of the extreme values on estimated effect; for cases where the outlying values on any of the variables shift the estimated effect by at least 2/√𝑁𝑁 or 1, then the outliers have a high chance of distorting the regression coefficients.
From Tables B2–B7 for corresponding Tables A1–A7 in the original paper (excluding Table A6), none of the outlier measures is found to be above the benchmark values. This indicates that there is no presence of outliers that could distort the estimated average treatment effects in the replicated results (Tables A1–A7). It also implies that the original results are robust to outliers. 13 This robustness result contradicts Muralidharan and colleagues’ findings. They report in their Table A7, using test of equality, that there is no significant difference in the time taken to collect payment between beneficiaries who have a Smartcard and those without a Smartcard.

10
4.3 MEA III: Are the original results robust to alternative specification?
The randomizations of the biometrically authenticated payment system across mandals were based on household socioeconomic characteristics. Muralidharan and colleagues control for the variation in socioeconomic characteristics at the mandal level in the estimated regression model (1) by incorporating their first PC as an additional predictor to account for differences in outcomes across each district. PC is a reduced form of a large subset of variables (e.g. socioeconomic characteristics indicators such as income, education and consumption) that are highly correlated and, if simultaneously incorporated in a regression model, might render the estimates biased. The use of PC can help to improve the robustness of a model. On the other hand, there is contention in the literature that PC offers no additional efficiency gain and does not matter if included in a model, compared to when it is excluded. We test this argument to determine whether Muralidharan and colleagues’ original results are robust to different variations in the use of a PC variable in the original model.
The authors’ descriptive analysis conducted on the baseline household survey data establishes evidence of high multicollinearity. We therefore investigated whether the use of the first PC is more efficient and robust than dropping the PC in modeling the welfare effect of the use of Smartcards. We thus tested the robustness of the PC variable used in the original paper by:
(i) excluding the PC from equation (1) and estimate:
𝑌𝑌 = 𝛼𝛼 + 𝛽𝛽𝛽𝛽𝛽𝛽𝛽𝛽𝛽𝛽𝛽𝛽𝛽𝛽𝛽𝛽 + 𝛿𝛿𝑌𝑌�0 + 𝐷𝐷𝐷𝐷𝐷𝐷𝛽𝛽𝛽𝛽𝐷𝐷𝐷𝐷𝛽𝛽 𝐹𝐹𝐹𝐹𝐷𝐷 + 𝛽𝛽𝛽𝛽𝛽𝛽𝑒𝑒𝛽𝛽 (2)
The robustness check is to assess the potential weakness associated with PC analysis in the context of this replication study and investigate the robustness of the original results to a different specification of the model without a PC variable, as discussed in the following sub-section.
4.3.1 Exclusion of principal component variable In Tables B8–B13, the results clearly show that when the PC variable is excluded from the model, the average treatment effects are the same as the original estimates reported in the original paper (Tables A1–A7) for most cases. However, only some estimates (highlighted in yellow) differ very slightly in magnitude from the original average treatment effects by a variation within a range of ± 2. The signs and statistical significance of the estimated effects are consistent with the original estimates. This implies that the model (1) in the original paper will yield the same policy outcomes if the PC variable is excluded.
Thus, the test for exclusion of the PC variable clearly indicates that there is no potential bias if the original authors decided not to include the first PC series as an additional regressor.
However, these findings (Sections 4.3.1) hindered our attempt to identify household-level characteristics that might contribute to the heterogeneity effect of Smartcards on welfare across surveyed districts. This prompted us to test for heterogeneity as additional robustness checks (Section 5).

11
4.4 MEA IV: are the original results robust to alternative estimation procedures?
In addition to the specification robustness checks discussed in Section 4.3, we further attempted to test the sensitivity of the original estimates to changes in estimation method. In the original paper, OLS FE was used to estimate each of the policy models. For the purpose of this robustness check, we estimated model (1) using a generalized linear mixed model (GLMM) that accounts for district fixed and random effects, as well as other issues discussed in the replication proposal (Atanda and Reed 2017). The goal was to ascertain the bias that might have been created by linear fixed effect model when the response variables were correlated across clusters (either at the district or mandal level). In other words, we used the GLMM modeling framework to assess the robustness of the estimation method used by Muralidharan and colleagues by controlling for random changes in district- or mandal-specific characteristics. We present the results of this robustness check in Tables B14–B19.
The results reveal that in most of the reported cases estimating the impact of Smartcards on welfare outcomes (e.g. leakages, time taken to collect payments, ease of access to payments), the GLMM estimates are highly comparable and consistent in signs and magnitudes with treatment effects from the original paper, where OLS FE is used. In Tables B14–B18, there are very few exceptional cases (highlighted in yellow) of slight variation in average treatment effects, but the estimates become more significant (e.g. Table B15, columns 5–6; Table B16, Panel B, columns 1–2; Table B17, Panel B, columns 9–10, 11–12); there is slight variation in average treatment effects and the estimates turn out to be insignificant (e.g. Table B16, Panel A, columns 9–10, 11–12; Table B16, Panel B, columns 3–4; Table B17, Panel A, columns 9–10, 11–12; Table B18, columns 13–14, 15–16); and there are different patterns of variations, but the significance of the estimates is comparable in most cases in Table B19.
On the basis of the highlighted differences and comparable estimates, this robustness analysis reveals that Muralidharan and colleagues’ original results are less sensitive to the inclusion of random district effects in the model and when estimated with GLMM. In comparison with the OLS FE method, the GLMM produced more significant estimates, but the magnitude of the coefficients were lower in cases where there was slight variation. Therefore, changes in estimation method do not significantly bias the original estimates in Muralidharan and colleagues’ paper, giving more credibility to the outcomes from the study in estimating the impact of biometrically authenticated Smartcards payment system in India.
5. Theory of change analysis: can we identify moderating factors that contribute to the heterogeneous effects?
This replication study has clearly verified Muralidharan and colleagues’ findings, using the same data set, that biometric authentication technology can improve payment processing time and reduce leakages of funds. The implementation gain from such investment in technology-enabled infrastructure is to improve government service delivery in low- and middle-income countries such as India. Other benefits include improved government efficiency, capability to target the right sets of beneficiaries to
12
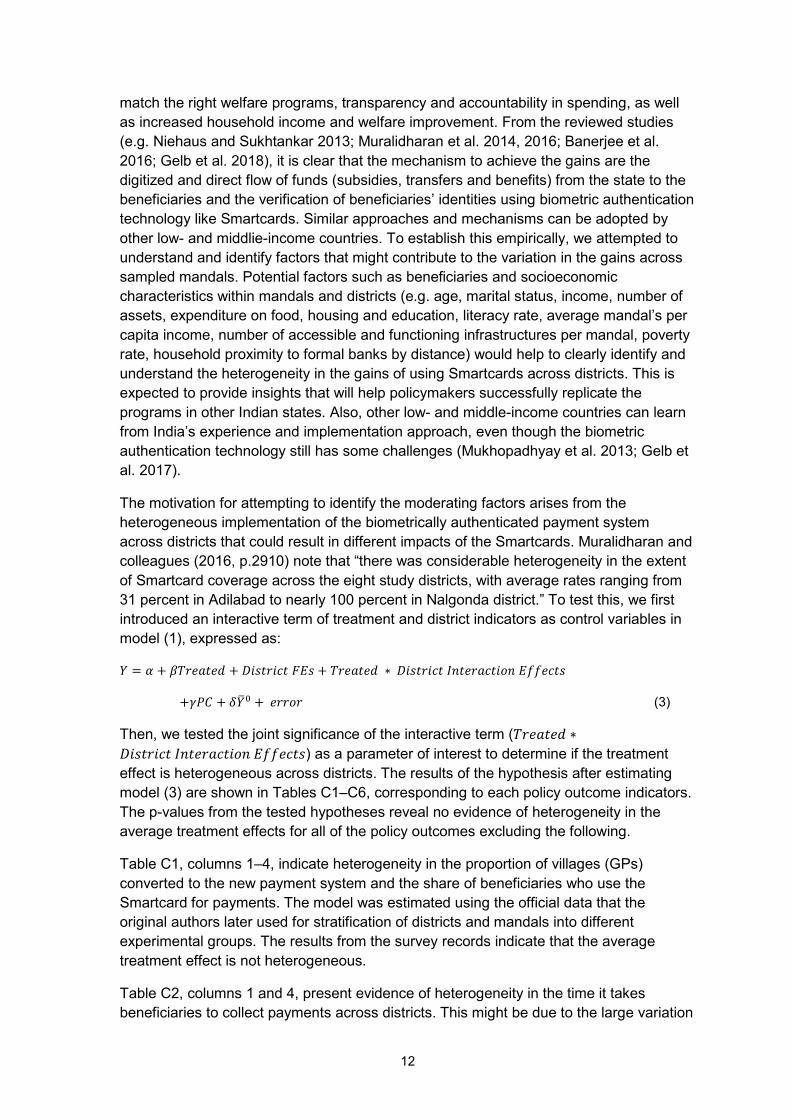
match the right welfare programs, transparency and accountability in spending, as well as increased household income and welfare improvement. From the reviewed studies (e.g. Niehaus and Sukhtankar 2013; Muralidharan et al. 2014, 2016; Banerjee et al. 2016; Gelb et al. 2018), it is clear that the mechanism to achieve the gains are the digitized and direct flow of funds (subsidies, transfers and benefits) from the state to the beneficiaries and the verification of beneficiaries’ identities using biometric authentication technology like Smartcards. Similar approaches and mechanisms can be adopted by other low- and middlie-income countries. To establish this empirically, we attempted to understand and identify factors that might contribute to the variation in the gains across sampled mandals. Potential factors such as beneficiaries and socioeconomic characteristics within mandals and districts (e.g. age, marital status, income, number of assets, expenditure on food, housing and education, literacy rate, average mandal’s per capita income, number of accessible and functioning infrastructures per mandal, poverty rate, household proximity to formal banks by distance) would help to clearly identify and understand the heterogeneity in the gains of using Smartcards across districts. This is expected to provide insights that will help policymakers successfully replicate the programs in other Indian states. Also, other low- and middle-income countries can learn from India’s experience and implementation approach, even though the biometric authentication technology still has some challenges (Mukhopadhyay et al. 2013; Gelb et al. 2017).
The motivation for attempting to identify the moderating factors arises from the heterogeneous implementation of the biometrically authenticated payment system across districts that could result in different impacts of the Smartcards. Muralidharan and colleagues (2016, p.2910) note that “there was considerable heterogeneity in the extent of Smartcard coverage across the eight study districts, with average rates ranging from 31 percent in Adilabad to nearly 100 percent in Nalgonda district.” To test this, we first introduced an interactive term of treatment and district indicators as control variables in model (1), expressed as:
𝑌𝑌 = 𝛼𝛼 + 𝛽𝛽𝛽𝛽𝛽𝛽𝛽𝛽𝛽𝛽𝛽𝛽𝛽𝛽𝛽𝛽 + 𝐷𝐷𝐷𝐷𝐷𝐷𝛽𝛽𝛽𝛽𝐷𝐷𝐷𝐷𝛽𝛽 𝐹𝐹𝐹𝐹𝐷𝐷 + 𝛽𝛽𝛽𝛽𝛽𝛽𝛽𝛽𝛽𝛽𝛽𝛽𝛽𝛽 ∗ 𝐷𝐷𝐷𝐷𝐷𝐷𝛽𝛽𝛽𝛽𝐷𝐷𝐷𝐷𝛽𝛽 𝐼𝐼𝐼𝐼𝛽𝛽𝛽𝛽𝛽𝛽𝛽𝛽𝐷𝐷𝛽𝛽𝐷𝐷𝑒𝑒𝐼𝐼 𝐹𝐹𝐸𝐸𝐸𝐸𝛽𝛽𝐷𝐷𝛽𝛽𝐷𝐷
+𝛾𝛾𝛾𝛾𝛾𝛾 + 𝛿𝛿𝑌𝑌�0 + 𝛽𝛽𝛽𝛽𝛽𝛽𝑒𝑒𝛽𝛽 (3)
Then, we tested the joint significance of the interactive term (𝛽𝛽𝛽𝛽𝛽𝛽𝛽𝛽𝛽𝛽𝛽𝛽𝛽𝛽 ∗𝐷𝐷𝐷𝐷𝐷𝐷𝛽𝛽𝛽𝛽𝐷𝐷𝐷𝐷𝛽𝛽 𝐼𝐼𝐼𝐼𝛽𝛽𝛽𝛽𝛽𝛽𝛽𝛽𝐷𝐷𝛽𝛽𝐷𝐷𝑒𝑒𝐼𝐼 𝐹𝐹𝐸𝐸𝐸𝐸𝛽𝛽𝐷𝐷𝛽𝛽𝐷𝐷) as a parameter of interest to determine if the treatment effect is heterogeneous across districts. The results of the hypothesis after estimating model (3) are shown in Tables C1–C6, corresponding to each policy outcome indicators. The p-values from the tested hypotheses reveal no evidence of heterogeneity in the average treatment effects for all of the policy outcomes excluding the following.
Table C1, columns 1–4, indicate heterogeneity in the proportion of villages (GPs) converted to the new payment system and the share of beneficiaries who use the Smartcard for payments. The model was estimated using the official data that the original authors later used for stratification of districts and mandals into different experimental groups. The results from the survey records indicate that the average treatment effect is not heterogeneous.
Table C2, columns 1 and 4, present evidence of heterogeneity in the time it takes beneficiaries to collect payments across districts. This might be due to the large variation

13
in the distance between sampled villages and assigned payment collection centers and the differences in population size. We could not attribute the heterogeneity to socioeconomic factors because the PC estimate in model (3) is not significant in each case.
Table C4, columns 4–6, reveal heterogeneity in the impact of Smartcards on over-reporting and underpayment as channels of leakages for the NREGS program. Similarly, there is insufficient data in the scope of this replication study to directly link the heterogeneity to household socioeconomic factors. Heterogeneous leakages of funds are most likely to be driven by the size of the household and village as a whole. Corrupt officials are more likely to underpay large households and over-report money received by small households in remote villages far from the local council or city. These factors are outside the consideration of this replication study due to unavailable data.
Therefore, we could not identify any moderating factor because of the non-heterogeneity of the treatment effects (in more than 95% of the cases14) and the endogeneous nature of the socioeconomic characteristics (identified in Muralidharan et al. 2017). The theory of change analysis reveals that factors which might have contributed to the heterogeneity in payment collection time and leakages of funds in the NREGS program are outside the scope of this replication study and not available from the data set provided by the authors. In cases where they are available, there are multiple missing observations that could have rendered the estimation of heterogeneous effects biased; this supports our argument for the use of the PC variable because of its robustness to missing data.
6. Conclusions
Our replication is exactly comparable to the findings of Muralidharan and colleagues (2016). Using the same large experimental data set and method implemented with “audited codes” in Stata version 14.1 (instead of Stata 10 used by the original authors), we are able to confirm the original findings. This provides strong empirical credibility for the original study for policy inference on the welfare returns of state capacity building (e.g. biometric authentication payment infrastructure) in low- and middle-income countries. This replication study found that Smartcards significantly reduced the time taken to collect payment, reduced leakages of funds and improved the enrollment rate in two welfare programs (employment and pension scheme).
The evidence from our robustness checks as part of the MEA reveals that the original results are comparable in 90 percent of the cases and robust to (i) changes in the non-experimental data structure in estimating the TOT effects, (ii) outliers, (iii) exclusion of PC variable from the estimated model and (iv) inclusion of district random effect and changes to the estimation method. The average treatment effects from OLS FE and GLMM estimation are comparable, but there are a few cases in which GLMM produces estimates that are more significant, while treatment effects from the original method remain insignificant.
14 In the other cases where heterogeneity exists, the PC variable in model (4) was insignificant.
14
Despite the comparable results and robustness of the original estimates from this replication, we couldn’t perform a further test that involves replacing the PC variable with selected household socioeconomic characteristics because of the endogeneity nature of the variables (see Muralidharan et al. 2017 for more details) and lots of missing observations in the socioeconomic data set. Also, the hypotheses that test the heterogeneity in treatment effects across districts are rejected for nearly all the policy outcomes that measure the importance of Smartcards on welfare. Therefore, the biases created by the non-heterogeneity of the treatment effects limit our attempt to identify the moderating factors that might have contributed to differences in average treatment effects across districts.
We thus conclude that the original results are comparable to the replicated findings and robust to different model specifications and estimation method. In addition to the verification exercise, this replication study has established that the effect of Smartcards on welfare outcomes (e.g. leakages, time taken to collect payments, ease of access to payments) across the eight surveyed districts in the Indian state of Andhra Pradesh is not statistically heterogeneous. However, the rollout of the biometrically authenticated payment system across all the districts is heterogeneous – i.e. heterogeneity in Smartcard implementation does not equate to heterogeneity of its impact on welfare across the surveyed districts.
However, this replication study has provided sufficient verifiable evidence that could be useful for policymakers in other low- and middle-income countries to justify and consider the use of Smartcards for the distribution of funds (benefits, transfers and subsidies) to reduce poverty, target beneficiaries and improve government service delivery. The key policy implications from this study are in threefold. First, Smartcards can help policymakers and donors directly reach targeted beneficiaries in a timely manner and without intermediaries, who might be corrupt and cause leakages of funds. Second, lessons from the implementation of the Smartcard-based payments infrastructure can help policymakers design efficient and validated blueprints for achieving some of the Sustainable Development Goals, such as No Poverty (Goal 1), Zero Hunger (Goal 2), Gender Equality (Goal 5), Decent Work and Economic Growth (Goal 8), Reduced Inequalities (Goal 10), Strong Institutions (Goal 16) and Global Partnerships for the Goals (Goal 17). Finally, policymakers can maximize returns on such technology by using it to authenticate the identity of genuine beneficiaries for non-financial welfare packages, such as liquefied natural gas cylinders, food (Gelb et al. 2017) and potable water in regions experiencing severe drought, malnutrition and resource crises.

15
Appendix A: Pure replication results
Table A1: Official and self-reported use of Smartcards
Official data Survey data Carded GP Mean fraction
carded payments
Payments generally carded (village mean)
Most recent payment carded (village mean)
(1) (2) (3) (4) Panel A: NREGS
Treatment 0.67 0.45 0.38 0.38 (0.045) (0.041) (0.043) (0.042)
p-value < 0.001 < 0.001 < 0.001 < 0.001 District FE Yes Yes Yes Yes Adj R-squared 0.45 0.48 0.36 0.36 Control mean 0.0046 0.0017 0.039 0.013 No. of cases 880 880 818 818 Level GP GP GP GP Panel B: SSP Treatment 0.79 0.59 0.45 0.45
(0.042) (0.038) (0.052) (0.049) p-value < 0.001 < 0.001 < 0.001 < 0.001 District FE Yes Yes Yes Yes Adj R-squared 0.57 0.57 0.38 0.38 Control mean 0 0 0.069 0.044 No. of cases 880 880 878 878 Level GP GP GP GP
Note: Standard errors clustered at mandal level in parentheses; the grey-highlighted rows (p-values) are values we added to the original results.

16
Table A2: Access to payments
Time to collect Avg. payment lag (days)
Abs. payment lag deviation (days)
(1) (2) (3) (4) (5) (6) (7) (8) Treatment –22 –22 –6.1 –3.5 –5.8 –10 –2.5 –4.7
(9.2) (8.7) (5.2) (5.4) (3.5) (3.5) (0.99) (1.6) p-value 0.019 0.014 0.24
4 0.521 0.094 0.005 0.014 0.004
BL GP mean 0.079 0.23 0.013 0.042 (0.041) (0.07) (0.08) (0.053)
p-value 0.057 0.001 0.869 0.429 District FE Yes Yes Yes Yes Yes Yes Yes Yes Week FE No No No No Yes Yes Yes Yes Adj R-squared
0.06 0.08 0.07 0.11 0.17 0.33 0.08 0.17
Control mean 112 112 77 77 34 34 12 12 No. of cases 10191 10120 3789 3574 14213 7201 14213 7201 Level Indiv. Indiv. Indiv. Indiv. Indiv-
Week Indiv-Week
Indiv-Week
Indiv-Week
Survey NREGS NREGS SSP SSP NREGS NREGS NREGS NREGS Note: BL – Base line; Standard errors clustered at mandal level in parentheses; the grey-highlighted rows (p-values) are values we added to the original results.

17
Table A3: Official and survey reports of program benefits
Official Survey Leakage (1) (2) (3) (4) (5) (6)
Panel A: NREGS Treatment 11 9.6 35 35 –24 –25
(12) (12) (16) (16) (13) (13) p-value 0.347 0.425 0.026 0.025 0.067 0.054 BL GP mean 0.13
(0.027) (0.037) (0.038) p-value < 0.001 0.003 0.014 District FE Yes Yes Yes Yes Yes Yes Adjusted R-squared
0.03 0.05 0.05 0.06 0.04 0.04
Control mean 127 127 146 146 –20 –20 N. of cases 5143 5107 5143 5107 5143 5107
Panel B: SSP Treatment 4.3 5.1 12 12 –7.5 7
(5.3) (5.4) (5.9) (6.1) (3.9) (3.9) p-value 0.415 0.35 0.045 0.052 0.053 0.079 BL GP mean 0.16 0.0074 –0.022
(0.092) (0.022) (0.026) p-value 0.088 0.733 0.413 District FE Yes Yes Yes Yes Yes Yes Adjusted R-squared
0 0.01 0.01 0.01 0.01 0.01
Control mean 251 251 236 236 15 15 No. of cases 3330 3135 3330 3135 3330 3135
Note: Standard errors clustered at mandal level in parentheses; the grey-highlighted rows (p-values) are values we added to the original results.

18
Table A4: Illustrating channels of leakage reduction
Ghost households (%) Other over-reporting (%) Bribe to collect (%) (1) (2) (3) (4) (5) (6)
Panel A: NREGS
Treatment –0.0095 –0.0091 –0.082 –0.084 –0.0035 –0.0036 (0.02) (0.021) (0.033) (0.036) (0.0085) (0.0085)
p-value 0.645 0.665 0.014 0.02 0.678 0.669 BL GP mean –0.017 0.016 0.000041
(0.067) (0.044) (0.000041) p-value 0.798 0.721 0.325 District FE Yes Yes Yes Yes Yes Yes Adjusted R-squared
0.02 0.02 0.05 0.04 0.01 0.01
Control mean 0.11 0.11 0.26 0.26 0.021 0.021 No. of cases 5278 5242 3953 3672 10375 10304 Level HH HH HH HH Indiv. Indiv.
Panel B: SSP Treatment –2.9 –2.4 –2.7 –3.1 –2.3 –2.4
(2.7) (2.7) (2.9) (3) (1.9) (2) p-value 0.278 0.376 0.358 0.293 0.224 0.235 BL GP mean 0.19 0.024 –0.02
(0.16) (0.01) (0.045) p-value 0.233 0.022 0.657 District FE Yes Yes Yes Yes Yes Yes Adjusted R-squared
0.01 0.01 0.01 0.01 0.01 0.01
Control mean 11 11 1.7 1.7 2.5 2.5 No. of cases 3330 3135 3165 2986 3165 2986
Note: Standard errors clustered at mandal level in parentheses; the grey-highlighted rows (p-values) are values we added to the original results.

19
Table A5: Access to programs
Proportion of HH doing NREGS work
Was any HH member unable to
get NREGS work in
Is NREGS work available when anyone wants it?
Did you have to pay anything to get this
NREGS work?
Did you have to pay anything to start
receiving this pension?
Study period Study period May January All Months All months NREGS NREGS SSP SSP (1) (2) (3) (4) (5) (6) (7) (8) (9) (10)
Treatment 0.072 0.071 –0.023 –0.027 0.027 0.024 –0.0003 –0.00054 –0.046 –0.055 (0.033) (0.033) (0.027) (0.033) (0.015) (0.015) (0.0015) (0.0015) (0.031) (0.039)
p-value 0.03 0.034 0.398 0.41 0.079 0.119 0.84 0.719 0.137 0.159 BL GP mean 0.14 –0.023 –0.0064 0.025
(0.038) (0.027) (0.0031) (0.046) p-value < 0.001 0.407 0.043 0.585 District FE Yes Yes Yes Yes Yes Yes Yes Yes Yes Yes Adj. R-squared 0.05 0.06 0.1 0.11 0.02 0.02 0 0 0.05 0.05 Control mean 0.42 0.42 0.2 0.42 0.035 0.035 0.0022 0.0022 0.075 0.075 No. of cases 4943 4909 4748 4496 4755 4715 7185 6861 581 352 Level HH HH HH HH HH HH Indiv. Indiv. Indiv. Indiv.
Note: Standard errors clustered at mandal level in parentheses; the grey-highlighted rows (p-values) are values we added to the original results.
20
Table A6: Beneficiary opinions of Smartcards
NREGS SSP Agree Disagree Neutral/
Don't know N Agree Disagree Neutral/
Don't know N
Positives: • Smartcards increase speed of payments
(less wait times) 0.83 0.4 0.13 3336 0.87 0.07 0.06 1451
• With a Smartcard, I make fewer trips to receive my payments
0.78 0.4 0.18 3334 0.83 0.04 0.12 1450
• I have a better chance of getting the money I am owed by using a Smartcard
0.83 0.01 0.16 3333 0.86 0.03 0.11 1450
• Because I use a Smartcard, no one can collect a payment on my behalf
0.82 0.02 0.16 3331 0.86 0.03 0.11 1446
Negatives: • It was difficult to enroll to obtain a
Smartcard 0.19 0.66 0.15 3338 0.29 0.6 0.11 1451
• I'm afraid of losing my Smartcard and being denied payment
0.63 0.15 0.21 3235 0.71 0.15 0.14 1403
• When I go to collect a payment, I am afraid that the payment reader will not work
0.6 0.18 0.22 3237 0.67 0.18 0.14 1403
• I would trust the Smartcard system enough to deposit money in my Smartcard account
0.29 0.41 0.3 3334 0.31 0.46 0.24 1448
Overall: Do you prefer the Smartcard over the old system of payments?
0.9 0.03 0.07 3346 0.93 0.03 0.04 1454
Note: Standard errors clustered at mandal level in parentheses.

21
Table A7: Nonexperimental decomposition of treatment effects by carded status
Time to collect Payment lag Survey Leakage Proportion of HHs doing NREGS work
NREGS NREGS NREGS NREGS NREGS NREGS SSP SSP NREGS NREGS SSP SSP NREGS NREGS (1) (2) (3) (4) (5) (6) (7) (8) (9) (10) (11) (12) (13) (14)
Carded GP –33 –5 37 14 –30 –4.5 0.063 (8.1) (2.8) (17) (6.2) (15) (4.4) (0.036)
p-value < 0.001 0.081 0.030 0.025 0.044 0.299 0.078 Have Scard, carded GP –33 –4.4 152 24 –71 –12 0.25
(8.4) (3) (24) (7.1) (23) (4.7) (0.043) p-value < 0.001 0.146 0.000 0.001 0.002 0.014 0.000 No Scard, carded GP –33 –5.9 –55 –2.2 3.1 7.1 –0.12
(8.6) (2.8) (17) (9.9) (14) (6.2) (0.044) p-value < 0.001 0.040 0.001 0.820 0.820 0.255 0.008 Not carded GP 4.9 4.9 –7.4 –7.5 22 19 8.3 7.7 –13 –12 –12 –12 0.064 0.056
(13) (13) (5) (5) (26) (26) (9.6) (9.6) (21) (21) (5.8) (5.8) (0.044) (0.047) p-value 0.704 0.708 0.136 0.131 0.385 0.454 0.386 0.426 0.540 0.576 0.036 0.044 0.149 0.231 District FE Yes Yes Yes Yes Yes Yes Yes Yes Yes Yes Yes Yes Yes Yes Week FE No No Yes Yes No No No No No No No No No No BL GP mean Yes Yes No No Yes Yes Yes Yes Yes Yes Yes Yes Yes Yes p-values (test of equality): Carded GP = not carded GP
< 0.001 0.45 0.5 0.54 0.38 0.21 0.98
Have SC = No SC 0.88 0.37 < 0.001 0.017 < 0.001 0.0028 < 0.001 Adj R-squared 0.1 0.1 0.17 0.17 0.06 0.11 0.006
3 0.009
3 0.044 0.052 0.008
5 0.013 0.054 0.11
Control mean 112 112 34 34 166 166 236 236 –22 –22 15 15 0.48 0.48 No. of cases 10120 10086 14165 14165 4915 4915 3131 3131 4915 4915 3131 3131 4717 4717 Level Indiv. Indiv. Indiv-
Week Indiv-Week
HH HH HH HH HH HH HH HH HH HH
Note: Standard errors clustered at mandal level in parentheses; the grey-highlighted rows (p-values) are values we added to the original results.

22
Table A8: Number of participants across surveyed districts for the NREGS program
Identifier 6 92 132 149 151 334 491 503 District 1 District 2 District 3 District 4 District 5 District 6 District 7 District 8 TOTAL Distinct/Unique per district Mandals 14 21 17 21 21 21 21 21 157 GP 26 29 19 22 21 25 25 24 191 Job cardholders: NREGS 301 669 336 660 650 705 698 698 4717 Households 301 669 336 660 650 705 698 698 4717 Individuals across all HHs Observation (indv) 671 1449 708 1659 1510 1580 1425 1445 10447 Treatment = 1 457 1063 516 1207 1119 1119 1037 1001 7519 Treatment = 0 214 386 192 452 391 461 388 444 2928 Have Smartcard = 1 258 275 368 784 584 29 0 209 2507 Have Smartcard = 0 332 460 164 357 523 767 0 267 2870 Have Smartcard = (missing) 81 714 176 518 403 784 1425 969 5070 Treatment = 1 & have Smartcard = 1 228 241 305 586 488 29 0 137 2014 Treatment = 1 & have Smartcard = 0 173 380 109 280 334 622 0 254 2152 Treatment = 1 & have Smartcard = . (missing) 56 442 102 341 297 468 1037 610 3353 Treatment = 0 & have Smartcard = 1 30 34 63 198 96 0 0 72 493 Treatment = 0 & have Smartcard = 0 159 80 55 77 189 145 0 13 718 Treatment = 0 & have Smartcard = . (missing) 25 272 74 177 106 316 388 359 1717 Carded GP = 1 230 660 503 934 619 402 1037 825 5210 Carded GP = 0 441 789 205 725 891 1178 388 620 5237 Treatment = 1 & carded GP = 1 230 660 503 934 619 385 1037 810 5178 Treatment = 1 & carded GP = 0 227 403 13 273 500 734 0 191 2341

23
Identifier 6 92 132 149 151 334 491 503 District 1 District 2 District 3 District 4 District 5 District 6 District 7 District 8 TOTAL Treatment = 0 & carded GP = 1 0 0 0 0 0 17 0 15 32 Treatment = 0 & carded GP = 0 214 386 192 452 391 444 388 429 2896 Treated, have Smartcard, carded GP 173 176 305 556 362 24 0 128 1724 Treated, have Smartcard, uncarded GP 55 65 0 30 126 5 0 9 290 Treated, no Smartcard, carded GP 42 220 109 210 158 228 0 214 1181 Treated, no Smartcard, uncarded GP 131 160 0 70 176 394 0 40 971 Untreated, have Smartcard, carded GP 0 0 0 0 0 0 0 14 14 Untreated, have Smartcard, uncarded GP 30 34 63 198 96 0 0 58 479 Untreated, no Smartcard, carded GP 0 0 0 0 0 6 0 0 6 Untreated, no Smartcard, uncarded GP 159 80 55 77 189 139 0 13 712 Treated, Smartcard (missing obs.), carded GP 15 264 89 168 99 133 1037 468 2273 Treated, Smartcard (missing obs.), uncarded GP 41 178 13 173 198 335 0 142 1080 Untreated, Smartcard (missing obs.), carded GP 0 0 0 0 0 11 0 1 12 Untreated, Smartcard (missing obs.), uncarded GP 25 272 74 177 106 305 388 358 1705
24
Table A9: Number of participants across surveyed districts for the SSP program
Identifier 6 92 132 149 151 334 491 503 District 1 District 2 District 3 District 4 District 5 District 6 District 7 District 8 TOTAL Distinct/Unique per district Mandals 14 21 17 21 21 21 21 21 157 GP 26 29 19 22 21 25 25 24 191 Households 208 459 220 458 460 452 460 445 3162 Individuals across all households Observation (indv) 269 540 259 563 541 576 557 527 3832 Treatment = 1 197 388 184 404 384 418 398 377 2750 Treatment = 0 72 152 75 159 157 158 159 150 1082 Have Smartcard = 1 109 220 138 300 271 39 2 114 1193 Have Smartcard = 0 106 146 47 119 145 347 0 142 1052 Have Smartcard = (missing) 54 174 74 144 125 190 555 271 1587 Treatment = 1 & have smartcard = 1 99 203 127 223 216 38 2 79 987 Treatment = 1 & have smartcard = 0 61 110 27 85 79 305 0 137 804 Treatment = 1 & have smartcard = . (missing) 37 75 30 96 89 75 396 161 959 Treatment = 0 & have Smartcard = 1 10 17 11 77 55 1 0 35 206 Treatment = 0 & have Smartcard = 0 45 36 20 34 66 42 0 5 248 Treatment = 0 & have Smartcard = . (missing) 17 99 44 48 36 115 159 110 628 Carded GP = 1 99 238 184 293 204 149 398 310 1875 Carded GP = 0 170 302 75 270 337 427 159 217 1957 Treatment = 1 & carded GP = 1 99 238 184 293 204 145 398 306 1867 Treatment = 1 & carded GP = 0 98 150 0 111 180 273 0 71 883

25
Identifier 6 92 132 149 151 334 491 503 District 1 District 2 District 3 District 4 District 5 District 6 District 7 District 8 TOTAL Treatment = 0 & carded GP = 1 0 0 0 0 0 4 0 4 8 Treatment = 0 & carded GP = 0 72 152 75 159 157 154 159 146 1074 Treated, have Smartcard, carded GP 75 135 127 204 144 23 2 64 774 Treated, have Smartcard, uncarded GP 24 68 0 19 72 15 0 15 213 Treated, no Smartcard, carded GP 20 60 27 58 34 99 0 113 411 Treated, no Smartcard, uncarded GP 41 50 0 27 45 206 0 24 393 Untreated, have Smartcard, carded GP 0 0 0 0 0 0 0 4 4 Untreated, have Smartcard, uncarded GP 10 17 11 77 55 1 0 31 202 Untreated, no Smartcard, carded GP 0 0 0 0 0 1 0 0 1 Untreated, no Smartcard, uncarded GP 45 36 20 34 66 41 0 5 247 Treated, Smartcard (missing obs.), carded GP 4 43 30 31 26 23 396 129 682 Treated, Smartcard (missing obs.), uncarded GP 33 32 0 65 63 52 0 32 277 Untreated, Smartcard (missing obs.), carded GP 0 0 0 0 0 3 0 0 3 Untreated, Smartcard (missing obs.), uncarded GP 17 99 44 48 36 112 159 110 625
26
Appendix B: Measurement and estimation analyses
MEA I: How does the estimated effect differ as one moves from ITT to TOT?
Table B1: MEA I – nonexperimental decomposition of treatment effects by carded status within treatment group
Time to collect Payment lag Survey Leakage Proportion of HHs doing NREGS work
ITT TOT ITT TOT ITT TOT ITT TOT ITT TOT ITT TOT ITT TOT NREGS NREGS NREG
S NREGS
NREGS
NREGS
SSP SSP NREGS
NREGS
SSP SSP NREGS NREGS
(1) (2) (3) (4) (5) (6) (7) (8) (9) (10) (11) (12) (13) (14) Carded GP
–33 –12 –5 0.25 37 189 14 27 –30 –72 –4.5 –9 0.063 0.320
(8.1) (6.7) (2.8) (1.08) (17) (22) (6.2) (9) (15) (22) (4.4) (5.60) (0.036) (0.05) p-value < 0.001 0.071 0.081 0.819 0.030 <
0.001 0.025 0.004 0.044 0.00
1 0.299 0.131 0.078 < 0.001
District FE Yes Yes Yes Yes Yes Yes Yes Yes Yes Yes Yes Yes Yes Yes Week FE No No Yes Yes No No No No No No No No No No BL GP mean
Yes Yes Yes No Yes Yes Yes Yes Yes Yes Yes Yes Yes Yes
Adj R-squared
0.1 0.09 0.17 0.17 0.06 0.11 0.0063
0.0092 0.044 0.0523
0.0085 0.0035 0.054 0.129
Control mean
112 97 34 23 166 144 236 240 –22 –26 15 10 0.48 0.44
No. of cases
10120 7294 14165 10383 4915 3545 3131 2219 4915 3545 3131 2219 4717 3406
Level Indiv. Indiv. Indiv-Week
Indiv-Week
HH HH HH HH HH HH HH HH HH HH
Note: The grey-highlighted row (p-values) are values we added to the original results.
27
Are the results robust?
MEA II: outliers
Table B2: MEA II – official and self-reported use of Smartcards
Official data Survey data
Outlier measures
Carded GP Mean fraction carded payments Payments generally carded (village mean)
Most recent payment carded (village mean)
NREGS SSP NREGS SSP NREGS SSP NREGS SSP
(1) (2) (3) (4) (5) (6) (7) (8) Discrepancy 4.59E-05 9.51E-06 –8.87E-06 0.0000241 1.01E-05 5.97E-05 3.94E-05 0.0000607 Leverage 0.011364 0.0113636 0.011364 0.0113636 0.012225 0.01139 0.012225 0.0113895 Influence –5.11E-06 –2.29E-05 9.67E-06 –1.85E-05 5.36E-06 –3.21E-06 1.48E-05 2.53E-06 No. of cases 880 880 880 880 878 878 878 878
Table B3: MEA II – access to payments
Outlier measures Time to collect Avg. payment lag (days) Abs. payment lag deviation
(days) NREGS NREGS SSP SSP NREGS NREGS NREGS NREGS
(1) (2) (3) (4) (5) (6) (7) (8) Discrepancy –1.63E-07 –2.38E-05 5.91E-06 –0.000188 –2.21E-06 –9.94E-06 2.51E-06 –6.62E-06 Leverage 0.000981 0.001087 0.002639 0.0030778 0.00137 0.002941 0.00137 0.0029294
Influence –6.10E-07 –1.94E-07 1.76E-06 –2.17E-07 –2.59E-07 –6.21E-07 –2.16E-07 –4.62E-07
No. of cases 10191 10120 3789 3574 14213 7201 14213 7201

28
Table B4: MEA II – official and survey reports of program benefits
Outlier measures Official Survey Leakage
(1) (2) (3) (4) (5) (6) Panel A: NREGS
Discrepancy –4.69E-07 –9.41E-07 –5.77E-06 –2E-05 5.63E-06 5.43E-06 Leverage 0.001944 0.002154 0.001944 0.002154 0.001944 0.002154 Influence 1.23E-07 1.40E-07 –1.40E-08 4.00E-07 –2.98E-07 –4.77E-08
N. of cases 5143 5107 5143 5107 5143 5107 Panel B: SSP Discrepancy –9.76E-07 –7.35E-06 1.76E-06 –2.4E-05 –4.69E-06 8.38E-05 Leverage 0.003003 0.003509 0.003003 0.003509 0.003003 0.003509 Influence 4.07E-07 1.96E-07 4.78E-07 –5.35E-07 –3.06E-06 8.12E-09
No. of cases 3330 3135 3330 3135 3330 3135

29
Table B5: MEA II – illustrating channels of leakage reduction
Outlier measures Ghost households (%) Other over-reporting (%) Bribe to collect (%) (1) (2) (3) (4) (5) (6)
Panel A: NREGS Discrepancy –2.76E-06 –3.54E-06 1.57E-05 9.66E-06 1.00E-06 –1.72E-06 Leverage 0.001895 0.002098 0.002547 0.003024 0.000964 0.001067 Influence –2.49E-07 –9.52E-08 8.02E-07 5.85E-07 –3.30E-08 –5.84E-08
N. of cases 5278 5242 3953 3672 10375 10304
Panel B: SSP Discrepancy –2.85E-06 –2.14E-05 –2.68E-06 2.56E-05 –5.43E-06 2.36E-06 Leverage 0.003003 0.003509 0.003164 0.003705 0.003164 0.003672 Influence –2.72E-06 –2.86E-06 –4.50E-07 –2.26E-06 –7.63E-04 –8.02E-04
No. of cases 3330 3135 3165 2986 3165 2986
Table B6: MEA II – access to programs
Outlier measures
Proportion of HHs doing NREGS work
Was any HH member unable to get NREGS
work in
Is NREGS work available when anyone wants it?
Did you have to pay anything to get this
NREGS work?
Did you have to pay anything to start
receiving this pension?
Study period Study period May January All months All
months NREGS NREGS SSP SSP
(1) (2) (3) (4) (5) (6) (7) (8) (9) (10) Discrepancy –7.74E-06 –1.3E-05 6.63E-06 1.22E-06 1.38E-06 5.29E-06 –1.92E-06 –7.27E-08 –9.7E-05 –0.0002 Leverage 0.002023 0.002241 0.002111 0.002229 0.002108 0.002339 0.001401 0.00158 0.01826 0.033157 Influence –3.08E-07 –2.60E-07 5.36E-08 4.27E-07 2.04E-07 1.59E-07 2.35E-06 2.07E-06 –3.1E-05 –7.6E-05
No. of cases 4943 4909 4748 4496 4755 4715 7185 6861 581 352
30
Table B7: MEA II – nonexperimental decomposition of treatment effects by carded status
Outlier measures Time to collect Payment lag Survey NREGS NREGS NREGS NREGS NREGS NREGS SSP
(1) (2) (3) (4) (5) (6) (7) Discrepancy –2.3E-05 –2.2E-05 –2.26E-06 –1.99E-06 –1.8E-05 –2.4E-05 –2.26E-05 Leverage 0.001187 0.001291 0.001458 0.001543 0.002442 0.002645 0.003833 Influence –4.52E-07 –6.03E-07 –2.66E-07 –1.76E-07 1.41E-07 4.28E-07 –1.63E-07
No. of cases 10120 10086 14165 14165 4915 4915 3131 Outlier measures Survey Leakage Proportion of HHs doing NREGS
work SSP NREGS NREGS SSP SSP NREGS NREGS (8) (9) (10) (11) (12) (13) (14)
Discrepancy –3E-05 6.82E-06 9.07E-06 0.000082 8.76E-05 –1.3E-05 –2.3E-05 Leverage 0.004152 0.002442 0.002645 0.003833 0.004152 0.002544 0.002756 Influence 4.56E-07 –2.62E-07 –8.48E-07 –2.35E-07 –1.35E-06 –2.80E-07 –3.50E-07
No. of cases 3131 4915 4915 3131 3131 4717 4717

31
MEA III: alternative specifications
Table B8: MEA III – official and self-reported use of Smartcards
Official data Survey data
Carded GP Mean fraction carded payments
Payments generally carded (village mean)
Most recent payment carded (village mean)
With PC No PC With PC No PC With PC No PC With PC No PC (1) (2) (3) (4) (5) (6) (7) (8)
Panel A: NREGS
Treatment 0.67 0.67 0.45 0.45 0.38 0.37 0.38 0.37 (0.045) (0.045) (0.041) (0.041) (0.043) (0.043) (0.042) (0.042)
p-value < 0.001 < 0.001 < 0.001 < 0.001 < 0.001 < 0.001 < 0.001 < 0.001 District FE Yes Yes Yes Yes Yes Yes Yes Yes Adj R-squared 0.45 0.45 0.48 0.49 0.36 0.37 0.36 0.36 Control mean 0.0046 0.0046 0.0017 0.0017 0.039 0.039 0.013 0.013 No. of cases 880 880 880 880 818 818 818 818 Level GP GP GP GP GP GP GP GP
Panel B: SSP Treatment 0.79 0.79 0.59 0.59 0.45 0.45 0.45 0.45
(0.042) (0.041) (0.038) (0.037) (0.052) (0.052) (0.049) (0.049) p-value < 0.001 < 0.001 < 0.001 < 0.001 < 0.001 < 0.001 < 0.001 < 0.001 District FE Yes Yes Yes Yes Yes Yes Yes Yes Adj R-squared 0.57 0.58 0.57 0.57 0.38 0.39 0.38 0.39 Control mean 0 0 0 0 0.069 0.069 0.044 0.044 No. of cases 880 880 880 880 878 878 878 878 Level GP GP GP GP GP GP GP GP
Note: The grey-highlighted rows (p-values) are values we added to the original results.
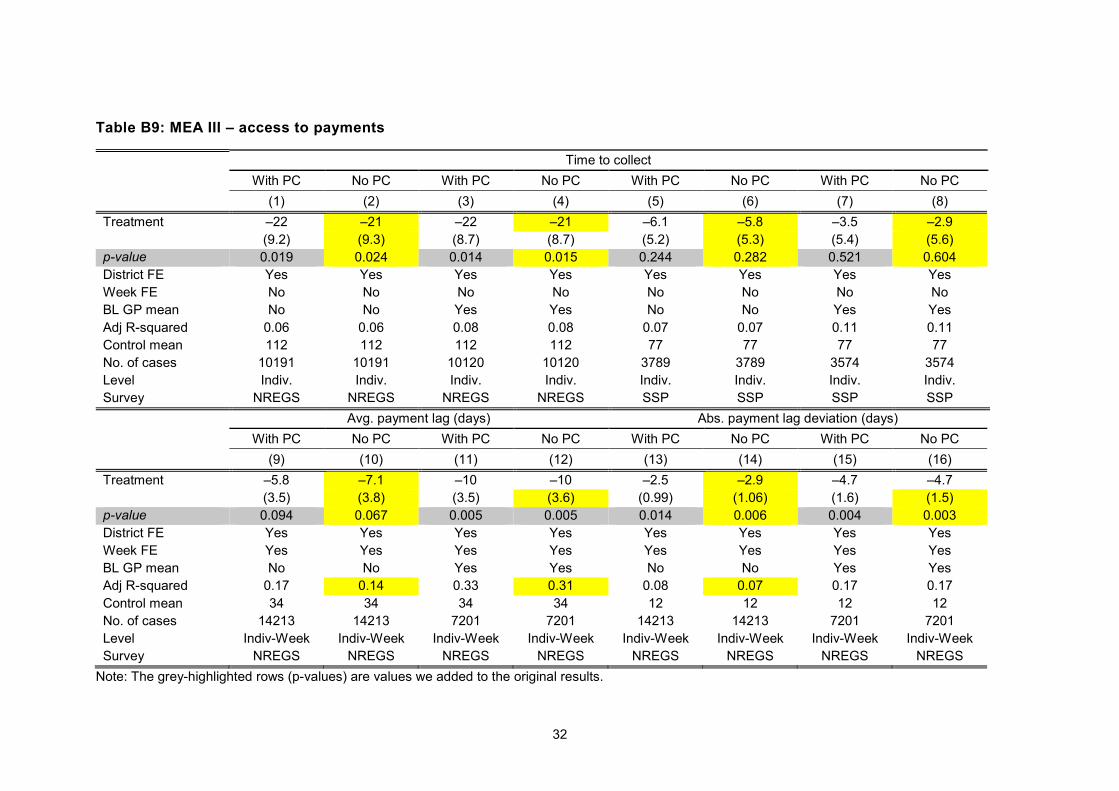
32
Table B9: MEA III – access to payments
Time to collect
With PC No PC With PC No PC With PC No PC With PC No PC (1) (2) (3) (4) (5) (6) (7) (8)
Treatment –22 –21 –22 –21 –6.1 –5.8 –3.5 –2.9 (9.2) (9.3) (8.7) (8.7) (5.2) (5.3) (5.4) (5.6)
p-value 0.019 0.024 0.014 0.015 0.244 0.282 0.521 0.604 District FE Yes Yes Yes Yes Yes Yes Yes Yes Week FE No No No No No No No No BL GP mean No No Yes Yes No No Yes Yes Adj R-squared 0.06 0.06 0.08 0.08 0.07 0.07 0.11 0.11 Control mean 112 112 112 112 77 77 77 77 No. of cases 10191 10191 10120 10120 3789 3789 3574 3574 Level Indiv. Indiv. Indiv. Indiv. Indiv. Indiv. Indiv. Indiv. Survey NREGS NREGS NREGS NREGS SSP SSP SSP SSP
Avg. payment lag (days) Abs. payment lag deviation (days) With PC No PC With PC No PC With PC No PC With PC No PC
(9) (10) (11) (12) (13) (14) (15) (16) Treatment –5.8 –7.1 –10 –10 –2.5 –2.9 –4.7 –4.7
(3.5) (3.8) (3.5) (3.6) (0.99) (1.06) (1.6) (1.5) p-value 0.094 0.067 0.005 0.005 0.014 0.006 0.004 0.003 District FE Yes Yes Yes Yes Yes Yes Yes Yes Week FE Yes Yes Yes Yes Yes Yes Yes Yes BL GP mean No No Yes Yes No No Yes Yes Adj R-squared 0.17 0.14 0.33 0.31 0.08 0.07 0.17 0.17 Control mean 34 34 34 34 12 12 12 12 No. of cases 14213 14213 7201 7201 14213 14213 7201 7201 Level Indiv-Week Indiv-Week Indiv-Week Indiv-Week Indiv-Week Indiv-Week Indiv-Week Indiv-Week Survey NREGS NREGS NREGS NREGS NREGS NREGS NREGS NREGS
Note: The grey-highlighted rows (p-values) are values we added to the original results.
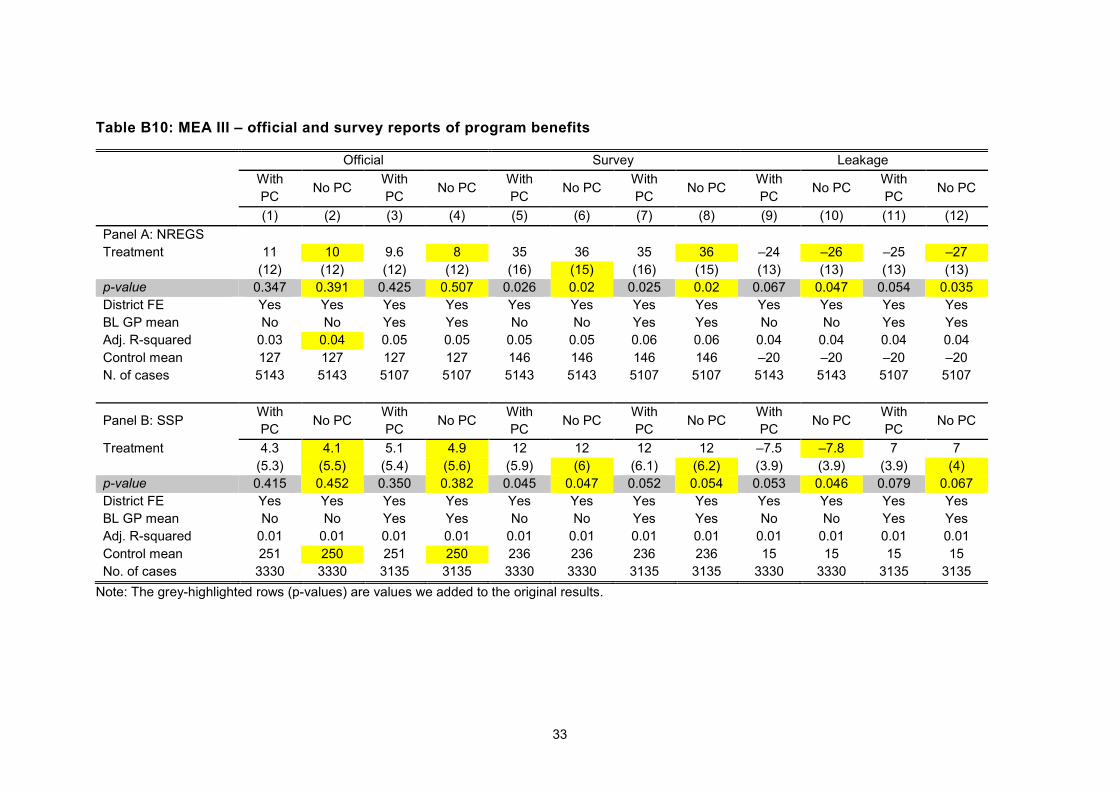
33
Table B10: MEA III – official and survey reports of program benefits
Official Survey Leakage
With PC No PC With
PC No PC With PC No PC With
PC No PC With PC No PC With
PC No PC
(1) (2) (3) (4) (5) (6) (7) (8) (9) (10) (11) (12) Panel A: NREGS Treatment 11 10 9.6 8 35 36 35 36 –24 –26 –25 –27
(12) (12) (12) (12) (16) (15) (16) (15) (13) (13) (13) (13) p-value 0.347 0.391 0.425 0.507 0.026 0.02 0.025 0.02 0.067 0.047 0.054 0.035 District FE Yes Yes Yes Yes Yes Yes Yes Yes Yes Yes Yes Yes BL GP mean No No Yes Yes No No Yes Yes No No Yes Yes Adj. R-squared 0.03 0.04 0.05 0.05 0.05 0.05 0.06 0.06 0.04 0.04 0.04 0.04 Control mean 127 127 127 127 146 146 146 146 –20 –20 –20 –20 N. of cases 5143 5143 5107 5107 5143 5143 5107 5107 5143 5143 5107 5107
Panel B: SSP With PC No PC With
PC No PC With PC No PC With
PC No PC With PC No PC With
PC No PC
Treatment 4.3 4.1 5.1 4.9 12 12 12 12 –7.5 –7.8 7 7 (5.3) (5.5) (5.4) (5.6) (5.9) (6) (6.1) (6.2) (3.9) (3.9) (3.9) (4)
p-value 0.415 0.452 0.350 0.382 0.045 0.047 0.052 0.054 0.053 0.046 0.079 0.067 District FE Yes Yes Yes Yes Yes Yes Yes Yes Yes Yes Yes Yes BL GP mean No No Yes Yes No No Yes Yes No No Yes Yes Adj. R-squared 0.01 0.01 0.01 0.01 0.01 0.01 0.01 0.01 0.01 0.01 0.01 0.01 Control mean 251 250 251 250 236 236 236 236 15 15 15 15 No. of cases 3330 3330 3135 3135 3330 3330 3135 3135 3330 3330 3135 3135
Note: The grey-highlighted rows (p-values) are values we added to the original results.

34
Table B11: MEA III – illustrating channels of leakage reduction
Ghost households (%) Other over-reporting (%) Bribe to collect (%) With PC No PC With PC No PC With
PC No PC With PC No PC With PC No PC With PC No PC
(1) (2) (3) (4) (5) (6) (7) (8) (9) (10) (11) (12) Panel A: NREGS Treatment –0.0095 –0.0112 –0.0091 –0.0118 –0.082 –0.082 –0.084 –0.082 –0.0035 –0.0021 –0.0036 –0.0021
(0.020) (0.020) (0.021) (0.021) (0.033) (0.033) (0.036) (0.036) (0.0085) (0.0088) –0.0085 (0.0088) p-value 0.645 0.559 0.665 0.568 0.014 0.014 0.020 0.023 0.678 0.678 0.669 0.808 District FE Yes Yes Yes Yes Yes Yes Yes Yes Yes Yes Yes Yes BL GP mean No No Yes Yes No No Yes Yes No No Yes Yes Adj. R-squared 0.02 0.02 0.02 0.02 0.05 0.05 0.04 0.05 0.01 0.01 0.01 0.01 Control mean 0.11 0.11 0.11 0.11 0.26 0.26 0.26 0.26 0.021 0.021 0.021 0.021 No. of cases 5278 5278 5242 5242 3953 3953 3672 3672 10375 10375 10304 10304 Level HH HH HH HH HH HH HH HH Indiv. Indiv. Indiv. Indiv. Panel B: SSP Treatment –2.9 –2.7 –2.4 –2.1 –2.7 –3.2 –3.1 –3.7 –2.3 –2.3 –2.4 –2.4
(2.7) (2.6) (2.7) (2.7) (2.9) (3.1) (3.0) (3.2) (1.9) (1.9) (2.0) (2.0) p-value 0.278 0.314 0.376 0.421 0.358 0.304 0.293 0.247 0.224 0.224 0.235 0.234 District FE Yes Yes Yes Yes Yes Yes Yes Yes Yes Yes Yes Yes BL GP mean No No Yes Yes No No Yes Yes No No Yes Yes Adj. R-squared 0.01 0.01 0.01 0.01 0.01 0.01 0.01 0.01 0.01 0.01 0.01 0.01 Control mean 11 11 11 11 1.7 1.7 1.7 1.7 2.5 2.5 2.5 2.5 No. of cases 3330 3330 3135 3135 3165 3165 2986 2986 3165 3165 2986 2986
Note: The grey-highlighted rows (p-values) are values we added to the original results.

35
Table B12: MEA III – access to programs
Proportion of HHs doing NREGS work Was any HH member unable to get NREGS work in Is NREGS work available when anyone wants it?
Study period
Study period Study period
Study period
May May January January All months All months
With PC No PC With PC No PC With PC No PC With PC No PC With PC No PC
(1) (2) (3) (4) (5) (6) (7) (8) (9) (10) Treatment 0.072 0.076 0.071 0.075 –0.023 –0.025 –0.027 –0.033 0.027 0.026
(0.033) (0.033) (0.033 (0.033) (0.027) (0.027) (0.033) (0.033) (0.015) (0.015) p-value 0.03 0.02 0.034 0.025 0.398 0.366 0.41 0.41 0.079 0.081 District FE Yes Yes Yes Yes Yes Yes Yes Yes Yes Yes BL GP mean No No Yes Yes No No Yes Yes No No Adj. R-squared 0.05 0.05 0.06 0.06 0.1 0.1 0.11 0.11 0.02 0.02 Control mean 0.42 0.42 0.42 0.42 0.20 0.27 0.42 0.42 0.035 0.035 No. of cases 4943 4943 4909 4909 4748 4748 4496 4496 4755 4755 Level HH HH HH HH HH HH HH HH HH HH
Is NREGS work available when anyone wants it?
Did you have to pay anything to get this NREGS work? Did you have to pay anything to start receiving this pension?
All months All months NREGS NREGS NREGS NREGS SSP SSP SSP SSP With PC No PC With PC No PC With PC No PC With PC No PC With PC No PC
(11) (12) (13) (14) (15) (16) (17) (18) (19) (20) Treatment 0.024 0.024 –0.0003 –0.0001 –0.00054 –0.00037 –0.046 –0.046 –0.055 –0.055
(0.015) (0.015) (0.0015) (0.0015) (0.0015) (0.0015) (0.031) (0.031) (0.039) (0.039) p-value 0.119 0.112 0.840 0.918 0.719 0.806 0.137 0.139 0.159 0.160 District FE Yes Yes Yes Yes Yes Yes Yes Yes Yes Yes BL GP mean Yes Yes No No Yes Yes No No Yes Yes Adj. R-squared 0.02 0.02 0.002 0.002 0.001 0.001 0.05 0.06 0.05 0.08 Control mean 0.035 0.035 0.0022 0.0022 0.0022 0.0022 0.075 0.075 0.075 0.075 No. of cases 4715 4715 7185 7185 6861 6861 581 581 352 352 Level HH HH Indiv. Indiv. Indiv. Indiv. Indiv. Indiv. Indiv. Indiv.
Note: The grey-highlighted rows (p-values) are values we added to the original results.

36
Table B13: MEA III – nonexperimental decomposition of treatment effects by carded status
Time to collect Payment lag Survey NREGS NREGS NREGS NREGS NREGS NREGS NREGS NREGS NREGS NREGS NREGS NREGS SSP SSP With PC No PC With PC No PC With PC No PC With PC No PC With PC No PC With PC No PC With
PC No PC
(1) (2) (3) (4) (5) (6) (7) (8) (9) (10) (11) (12) (13) (14) Carded GP –33 –32 –5 –7 37 38 14 14
(8.1) (8.1) (2.8) (3.2) (17) (17) (6.2) (6.2) p-value < 0.001 < 0.001 0.081 0.081 0.03 0.03 0.025 0.025 Have Scard, carded GP –33 –33 –4.4 –6 152 152 (8.4) (8.5) (3) (3) (24) (24) p-value < 0.001 < 0.001 0.146 0.073 < 0.001 < 0.001 No Scard, carded GP –33 –32 –5.9 –7.8 –55 –55 (8.6) (8.6) (2.8) (3.2) (17) (17) p-value < 0.001 < 0.001 0.04 0.017 0.001 0.002 Not carded GP 4.9 5.1 4.9 5 –7.4 –7.9 –7.5 –8 22 22 19 20 8.3 8.4
(13) (13) (13) (13) (5) (5) (5) (5) (26) (26) (26) (26) (9.6) (9.8) p-value 0.704 0.697 0.708 0.702 0.136 0.148 0.131 0.131 0.385 0.380 0.454 0.450 0.386 0.390 District FE Yes Yes Yes Yes Yes Yes Yes Yes Yes Yes Yes Yes Yes Yes Week FE No No No No Yes Yes Yes Yes No No No No No No BL GP mean Yes Yes Yes Yes No No No No Yes Yes Yes Yes Yes Yes p-values (test of equality): Carded GP = not carded GP
< 0.001 < 0.001 0.45 0.72 0.5 0.5 0.54 0.54
Have SC = no SC 0.88 0.88 0.37 0.33 < 0.001 < 0.001 Adj R-squared 0.1 0.1 0.1 0.1 0.17 0.14 0.17 0.14 0.06 0.06 0.11 0.11 0.0063 0.0098 Control mean 112 112 112 112 34 34 34 34 166 166 166 166 236 236 No. of cases 10120 10120 10086 10086 14165 14165 14165 14165 4915 4915 4915 4915 3131 3131 Level Indiv. Indiv. Indiv. Indiv. Indiv-
Week Indiv-Week
Indiv-Week
Indiv-Week
HH HH HH HH HH HH
Note: The grey-highlighted rows (p-values) are values we added to the original results.

37
Table B13: MEA III – nonexperimental decomposition of treatment effects by carded status
Survey Leakage Proportion of HHs doing NREGS work SSP SSP NREGS NREGS NREGS NREGS SSP SSP SSP SSP NREGS NREGS NREGS NREGS With PC
No PC
With PC
No PC
With PC
No PC
With PC
No PC
With PC
No PC
With PC
No PC
With PC
No PC
(15) (16) (17) (18) (19) (20) (21) (22) (23) (24) (25) (26) (27) (28) Carded GP –30 –33 –4.5 –5.0 0.063 0.066
(15) (15) (4.4) (4.3) (0.036) (0.036) p-value 0.044 0.028 0.299 0.247 0.078 0.065 Have Scard, carded GP
24 24 –71 –75 –12 –12 0.25 0.25
(7.1) (7.1) (23) (23) (4.7) (4.6) –0.043 (0.042) p-value 0.001 0.001 0.002 0.002 0.014 0.011 < 0.001 < 0.001 No Scard, carded GP –2.2 –2.0 3.1 0.2 7.1 6.2 –0.12 –0.11
(9.9) (10) (14) (14) (6.2) (6.2) (0.044) (0.044) p-value 0.820 0.843 0.820 0.988 0.255 0.319 0.008 0.010 Not carded GP 7.7 7.8 –13 –14 –12 –13 –12 –13 –12 –12 0.064 0.066 0.056 0.057
(9.6) (9.7) (21) (21) (21) (21) (5.8) (6.1) (5.8) (6.1) (0.044) (0.044) (0.047) (0.046) p-value 0.426 0.423 0.54 0.501 0.576 0.537 0.036 0.038 0.044 0.045 0.149 0.136 0.231 0.213 District FE Yes Yes Yes Yes Yes Yes Yes Yes Yes Yes Yes Yes Yes Yes Week FE No No No No No No No No No No No No No No BL GP mean Yes Yes Yes Yes Yes Yes Yes Yes Yes Yes Yes Yes Yes Yes p-values (test of equality): Carded GP = not carded GP 0.38 0.35 0.21 0.21 0.98 0.99 Have SC = no SC 0.017 0.019 < 0.001 0.001 0.0028 0.0043 < 0.001 < 0.001 Adj R-squared 0.0093 0.0095 0.044 0.041 0.052 0.049 0.0085 0.0078 0.013 0.012 0.054 0.053 0.11 0.11 Control mean 236 236 –22 –22 –22 –22 15 15 15 15 0.48 0.48 0.48 0.48 No. of cases 3131 3131 4915 4915 4915 4915 3131 3131 3131 3131 4717 4717 4717 4717 Level HH HH HH HH HH HH HH HH HH HH HH HH HH HH
Note: The grey-highlighted rows (p-values) are values we added to the original results.

38
MEA IV: alternative estimation procedures
Table B14: MEA IV – official and self-reported use of Smartcards
Official data Survey data Carded GP Mean fraction carded payments Payments generally carded
(village mean) Most recent payment carded
(village mean) OLS FE GLMM OLS FE GLMM OLS FE GLMM OLS FE GLMM (1) (2) (3) (4) (5) (6) (7) (8)
Panel A: NREGS Treatment 0.67 0.67 0.45 0.45 0.38 0.38 0.38 0.38
(0.045) (0.089) (0.041) (0.110) (0.043) (0.108) (0.042) (0.101) p-value < 0.001 < 0.001 < 0.001 < 0.001 < 0.001 0.001 < 0.001 < 0.001 District FE Yes Yes Yes Yes Yes Yes Yes Yes District RE No Yes No Yes No Yes No Yes Control mean 0.0046 0.0046 0.0017 0.0017 0.039 0.039 0.013 0.013 No. of cases 880 880 880 880 818 818 818 818 Level GP GP GP GP GP GP GP GP
Panel B: SSP Treatment 0.79 0.79 0.59 0.59 0.45 0.45 0.45 0.45
(0.042) (0.071) (0.038) (0.086) (0.052) (0.092) (0.049) (0.080) p-value < 0.001 < 0.001 < 0.001 < 0.001 < 0.001 < 0.001 < 0.001 < 0.001 District FE Yes Yes Yes Yes Yes Yes Yes Yes District RE No Yes No Yes No Yes No Yes Control mean 0 0 0 0 0.069 0.069 0.044 0.044 No. of cases 880 880 880 880 878 878 878 878 Level GP GP GP GP GP GP GP GP
Note: The grey-highlighted rows (p-values) are values we added to the original results; RE – Random Effect; FE – Fixed Effect

39
Table B15: MEA IV – access to payments
Time to Collect OLS FE GLMM OLS FE GLMM OLS FE GLMM OLS FE GLMM
(1) (2) (3) (4) (5) (6) (7) (8) Treatment –22 –19 –22 –18 –6.1 –4.6 –3.5 –2.9
(9.2) (1.7) (8.7) (1.7) (5.2) (2.3) (5.4) (2.3) p-value 0.019 < 0.001 0.014 < 0.001 0.244 0.043 0.521 0.200 District FE Yes Yes Yes Yes Yes Yes Yes Yes District RE No Yes No Yes No Yes No Yes Week FE No No No No No No No No BL GP mean No No Yes Yes No No Yes Yes Control mean 112 112 112 112 77 77 77 77 No. of cases 10191 10191 10120 10120 3789 3789 3574 3574 Level Indiv. Indiv. Indiv. Indiv. Indiv. Indiv. Indiv. Indiv. Survey NREGS NREGS NREGS NREGS SSP SSP SSP SSP
Avg. payment lag (days) Abs. payment lag deviation (days) OLS FE GLMM OLS FE GLMM OLS FE GLMM OLS FE GLMM
(9) (10) (11) (12) (13) (14) (15) (16) Treatment –5.8 –2.7 –10 –4.7 –2.5 –1.6 –4.7 –2.8
(3.5) (4.1) (3.5) (0.45) (0.99) (0.20) (1.6) (0.28) p-value 0.094 < 0.001 0.005 < 0.001 0.014 < 0.001 0.004 < 0.001 District FE Yes Yes Yes Yes Yes Yes Yes Yes District RE No Yes No Yes No Yes No Yes Week FE Yes Yes Yes Yes Yes Yes Yes Yes BL GP mean No No Yes Yes No No Yes Yes Control mean 34 34 34 34 12 12 12 12 No. of cases 14213 14213 7201 7201 14213 14213 7201 7201 Level Indiv-Week Indiv-Week Indiv-Week Indiv-Week Indiv-Week Indiv-Week Indiv-Week Indiv-Week Survey NREGS NREGS NREGS NREGS NREGS NREGS NREGS NREGS
Note: The grey-highlighted rows (p-values) are values we added to the original results.
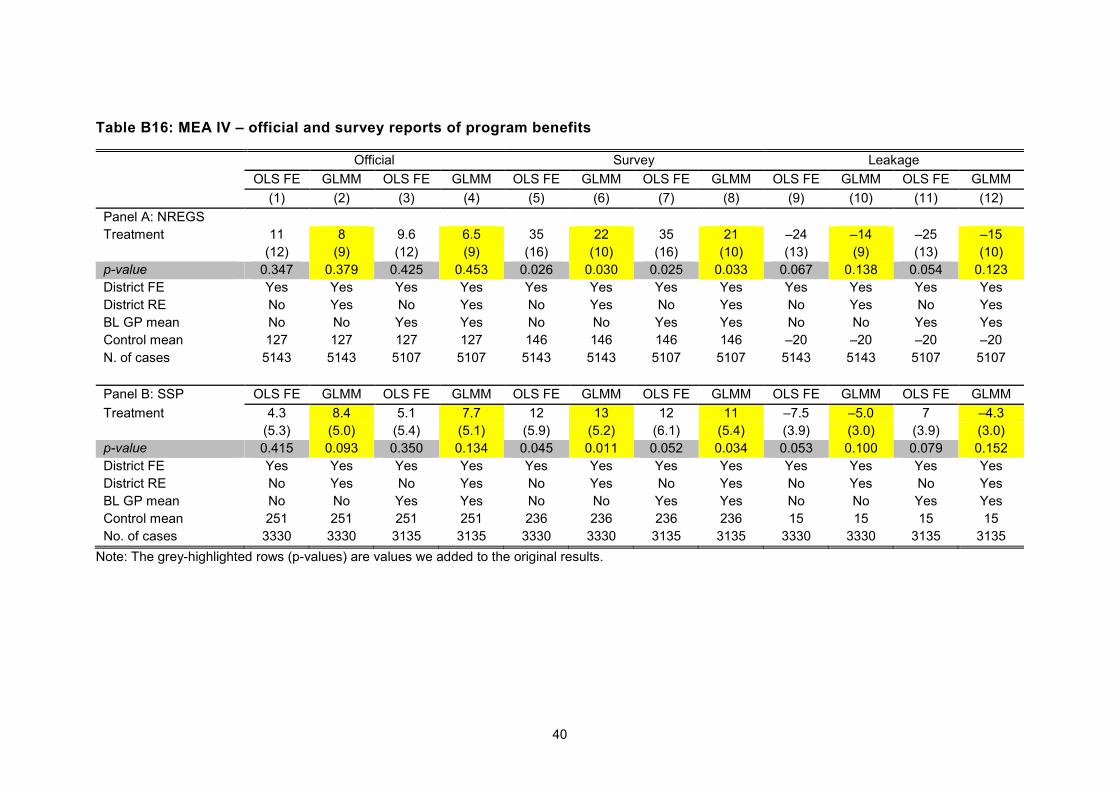
40
Table B16: MEA IV – official and survey reports of program benefits
Official Survey Leakage OLS FE GLMM OLS FE GLMM OLS FE GLMM OLS FE GLMM OLS FE GLMM OLS FE GLMM
(1) (2) (3) (4) (5) (6) (7) (8) (9) (10) (11) (12) Panel A: NREGS Treatment 11 8 9.6 6.5 35 22 35 21 –24 –14 –25 –15
(12) (9) (12) (9) (16) (10) (16) (10) (13) (9) (13) (10) p-value 0.347 0.379 0.425 0.453 0.026 0.030 0.025 0.033 0.067 0.138 0.054 0.123 District FE Yes Yes Yes Yes Yes Yes Yes Yes Yes Yes Yes Yes District RE No Yes No Yes No Yes No Yes No Yes No Yes BL GP mean No No Yes Yes No No Yes Yes No No Yes Yes Control mean 127 127 127 127 146 146 146 146 –20 –20 –20 –20 N. of cases 5143 5143 5107 5107 5143 5143 5107 5107 5143 5143 5107 5107 Panel B: SSP OLS FE GLMM OLS FE GLMM OLS FE GLMM OLS FE GLMM OLS FE GLMM OLS FE GLMM Treatment 4.3 8.4 5.1 7.7 12 13 12 11 –7.5 –5.0 7 –4.3
(5.3) (5.0) (5.4) (5.1) (5.9) (5.2) (6.1) (5.4) (3.9) (3.0) (3.9) (3.0) p-value 0.415 0.093 0.350 0.134 0.045 0.011 0.052 0.034 0.053 0.100 0.079 0.152 District FE Yes Yes Yes Yes Yes Yes Yes Yes Yes Yes Yes Yes District RE No Yes No Yes No Yes No Yes No Yes No Yes BL GP mean No No Yes Yes No No Yes Yes No No Yes Yes Control mean 251 251 251 251 236 236 236 236 15 15 15 15 No. of cases 3330 3330 3135 3135 3330 3330 3135 3135 3330 3330 3135 3135
Note: The grey-highlighted rows (p-values) are values we added to the original results.

41
Table B17: MEA IV – illustrating channels of leakage reduction
Ghost households (%) Other over-reporting (%) Bribe to collect (%) OLS FE GLMM OLS FE GLMM OLS FE GLMM OLS FE GLMM OLS FE GLMM OLS FE GLMM
(1) (2) (3) (4) (5) (6) (7) (8) (9) (10) (11) (12) Panel A: NREGS Treatment –0.0095 –0.0095 –0.0091 –0.0091 –0.082 –0.082 –0.084 –0.084 –0.0035 –0.0008 –0.0036 –0.0010
(0.020) (0.016) (0.021) (0.016) (0.033) (0.022) (0.036) (0.033) (0.0085) (0.0031) –0.0085 (0.0031) p-value 0.645 0.561 0.665 0.577 0.014 < 0.001 0.020 0.011 0.678 0.798 0.669 0.749 District FE Yes Yes Yes Yes Yes Yes Yes Yes Yes Yes Yes Yes District RE No Yes No Yes No Yes No Yes No Yes No Yes BL GP mean No No Yes Yes No No Yes Yes No No Yes Yes Control mean 0.11 0.11 0.11 0.11 0.26 0.26 0.26 0.26 0.021 0.021 0.021 0.021 No. of cases 5278 5278 5242 5242 3953 3953 3672 3672 10375 10375 10304 10304 Level HH HH HH HH HH HH HH HH Indiv. Indiv. Indiv. Indiv. Panel B: SSP Treatment –2.9 –3.1 –2.4 –2.1 –2.7 –0.6 –3.1 –1.2 –2.3 –1.4 –2.4 –1.4
(2.7) (1.7) (2.7) (1.7) (2.9) (2.5) (3.0) (2.5) (1.9) (0.75) (2.0) (0.80) p-value 0.278 0.069 0.376 0.205 0.358 0.814 0.293 0.628 0.224 0.056 0.235 0.071 District FE Yes Yes Yes Yes Yes Yes Yes Yes Yes Yes Yes Yes District RE No Yes No Yes No Yes No Yes No Yes No Yes BL GP mean No No Yes Yes No No Yes Yes No No Yes Yes Control mean 11 11 11 11 1.7 1.7 1.7 1.7 2.5 2.5 2.5 2.5 No. of cases 3330 3330 3135 3135 3165 3165 2986 2986 3165 3165 2986 2986
Note: The grey-highlighted rows (p-values) are values we added to the original results.
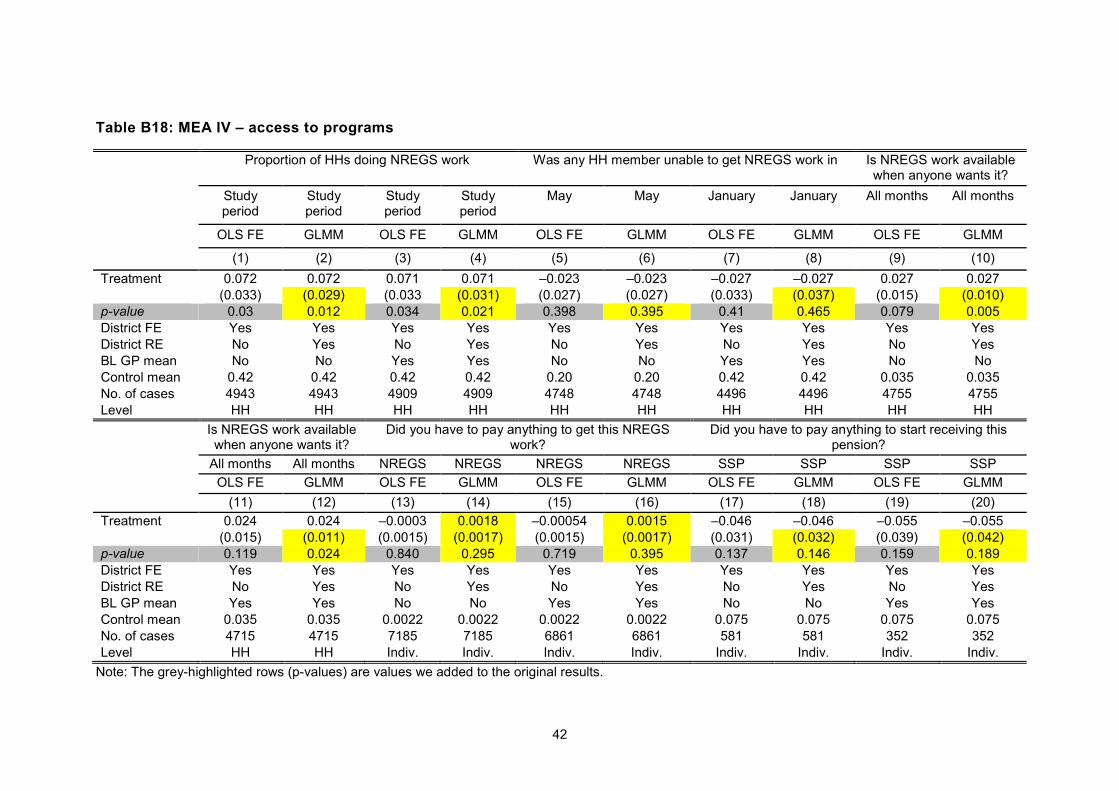
42
Table B18: MEA IV – access to programs
Proportion of HHs doing NREGS work Was any HH member unable to get NREGS work in Is NREGS work available when anyone wants it?
Study period
Study period
Study period
Study period
May May January January All months All months
OLS FE GLMM OLS FE GLMM OLS FE GLMM OLS FE GLMM OLS FE GLMM
(1) (2) (3) (4) (5) (6) (7) (8) (9) (10) Treatment 0.072 0.072 0.071 0.071 –0.023 –0.023 –0.027 –0.027 0.027 0.027
(0.033) (0.029) (0.033 (0.031) (0.027) (0.027) (0.033) (0.037) (0.015) (0.010) p-value 0.03 0.012 0.034 0.021 0.398 0.395 0.41 0.465 0.079 0.005 District FE Yes Yes Yes Yes Yes Yes Yes Yes Yes Yes District RE No Yes No Yes No Yes No Yes No Yes BL GP mean No No Yes Yes No No Yes Yes No No Control mean 0.42 0.42 0.42 0.42 0.20 0.20 0.42 0.42 0.035 0.035 No. of cases 4943 4943 4909 4909 4748 4748 4496 4496 4755 4755 Level HH HH HH HH HH HH HH HH HH HH
Is NREGS work available when anyone wants it?
Did you have to pay anything to get this NREGS work?
Did you have to pay anything to start receiving this pension?
All months All months NREGS NREGS NREGS NREGS SSP SSP SSP SSP OLS FE GLMM OLS FE GLMM OLS FE GLMM OLS FE GLMM OLS FE GLMM
(11) (12) (13) (14) (15) (16) (17) (18) (19) (20) Treatment 0.024 0.024 –0.0003 0.0018 –0.00054 0.0015 –0.046 –0.046 –0.055 –0.055
(0.015) (0.011) (0.0015) (0.0017) (0.0015) (0.0017) (0.031) (0.032) (0.039) (0.042) p-value 0.119 0.024 0.840 0.295 0.719 0.395 0.137 0.146 0.159 0.189 District FE Yes Yes Yes Yes Yes Yes Yes Yes Yes Yes District RE No Yes No Yes No Yes No Yes No Yes BL GP mean Yes Yes No No Yes Yes No No Yes Yes Control mean 0.035 0.035 0.0022 0.0022 0.0022 0.0022 0.075 0.075 0.075 0.075 No. of cases 4715 4715 7185 7185 6861 6861 581 581 352 352 Level HH HH Indiv. Indiv. Indiv. Indiv. Indiv. Indiv. Indiv. Indiv.
Note: The grey-highlighted rows (p-values) are values we added to the original results.
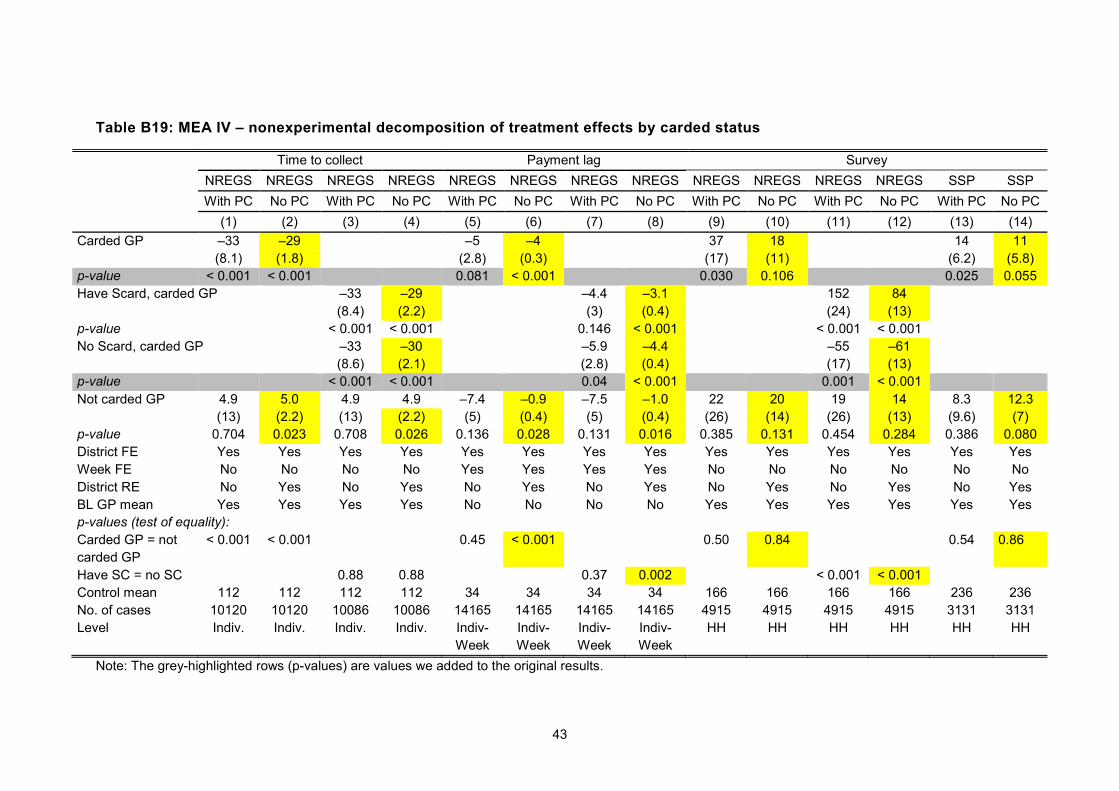
43
Table B19: MEA IV – nonexperimental decomposition of treatment effects by carded status
Time to collect Payment lag Survey NREGS NREGS NREGS NREGS NREGS NREGS NREGS NREGS NREGS NREGS NREGS NREGS SSP SSP With PC No PC With PC No PC With PC No PC With PC No PC With PC No PC With PC No PC With PC No PC
(1) (2) (3) (4) (5) (6) (7) (8) (9) (10) (11) (12) (13) (14) Carded GP –33 –29 –5 –4 37 18 14 11
(8.1) (1.8) (2.8) (0.3) (17) (11) (6.2) (5.8) p-value < 0.001 < 0.001 0.081 < 0.001 0.030 0.106 0.025 0.055 Have Scard, carded GP –33 –29 –4.4 –3.1 152 84 (8.4) (2.2) (3) (0.4) (24) (13) p-value < 0.001 < 0.001 0.146 < 0.001 < 0.001 < 0.001 No Scard, carded GP –33 –30 –5.9 –4.4 –55 –61 (8.6) (2.1) (2.8) (0.4) (17) (13) p-value < 0.001 < 0.001 0.04 < 0.001 0.001 < 0.001 Not carded GP 4.9 5.0 4.9 4.9 –7.4 –0.9 –7.5 –1.0 22 20 19 14 8.3 12.3
(13) (2.2) (13) (2.2) (5) (0.4) (5) (0.4) (26) (14) (26) (13) (9.6) (7) p-value 0.704 0.023 0.708 0.026 0.136 0.028 0.131 0.016 0.385 0.131 0.454 0.284 0.386 0.080 District FE Yes Yes Yes Yes Yes Yes Yes Yes Yes Yes Yes Yes Yes Yes Week FE No No No No Yes Yes Yes Yes No No No No No No District RE No Yes No Yes No Yes No Yes No Yes No Yes No Yes BL GP mean Yes Yes Yes Yes No No No No Yes Yes Yes Yes Yes Yes p-values (test of equality): Carded GP = not carded GP
< 0.001 < 0.001 0.45 < 0.001 0.50 0.84 0.54 0.86
Have SC = no SC 0.88 0.88 0.37 0.002 < 0.001 < 0.001 Control mean 112 112 112 112 34 34 34 34 166 166 166 166 236 236 No. of cases 10120 10120 10086 10086 14165 14165 14165 14165 4915 4915 4915 4915 3131 3131 Level Indiv. Indiv. Indiv. Indiv. Indiv-
Week Indiv-Week
Indiv-Week
Indiv-Week
HH HH HH HH HH HH
Note: The grey-highlighted rows (p-values) are values we added to the original results.

44
Table B20: MEA IV – nonexperimental decomposition of treatment effects by carded status
Survey Leakage Proportion of HHs doing NREGS work SSP SSP NREGS NREGS NREGS NREGS SSP SSP SSP SSP NREGS NREGS NREGS NREGS
With PC No PC With PC No PC With PC No PC With PC No PC With PC No PC With PC No PC With PC No PC (15) (16) (17) (18) (19) (20) (21) (22) (23) (24) (25) (26) (27) (28)
Carded GP –30 –19 –4.5 –2.0 0.063 0.085 (15) (11) (4.4) (3.2) (0.036) (0.016)
p-value 0.044 0.070 0.299 0.531 0.078 < 0.001 Have Scard, Carded GP
24 22 –71 –47 –12 –7 0.25 0.17
(7.1) (6.4) (23) (12) (4.7) (3.6) –0.043 (0.018) p-value 0.001 < 0.001 0.002 < 0.001 0.014 0.044 < 0.001 < 0.001 No Scard, carded GP
–2.2 –6.3 3.1 14 7.1 6.7 –0.12 –0.024
(9.9) (7.4) (14) (13) (6.2) (4.1) (0.044) (0.020) p-value 0.820 0.398 0.820 0.296 0.255 0.104 0.008 0.216 Not carded GP 7.7 11.7 –13 –5 –12 –2 –12 –9 –12 –9.2 0.064 0.078 0.056 0.070
(9.6) (7.0) (21) (13) (21) (13) (5.8) (3.9) (5.8) (3.9) (0.044) (0.019) (0.047) (0.019) p-value 0.426 0.094 0.54 0.726 0.576 0.879 0.036 0.028 0.044 0.017 0.149 < 0.001 0.231 < 0.001 District FE Yes Yes Yes Yes Yes Yes Yes Yes Yes Yes Yes Yes Yes Yes Week FE No No No No No No No No No No No No No No District RE No Yes No Yes No Yes No Yes No Yes No Yes No Yes BL GP mean Yes Yes Yes Yes Yes Yes Yes Yes Yes Yes Yes Yes Yes Yes p-values (test of equality): Carded GP = not carded GP 0.38 0.23 0.21 0.08 0.98 0.70 Have SC = no SC 0.017 < 0.001 < 0.001 < 0.001 0.0028 < 0.001 < 0.001 < 0.001 Control mean 236 236 –22 –22 –22 –22 15 15 15 15 0.48 0.48 0.48 0.48 No. of cases 3131 3131 4915 4915 4915 4915 3131 3131 3131 3131 4717 4717 4717 4717 Level HH HH HH HH HH HH HH HH HH HH HH HH HH HH
Note: The grey-highlighted rows (p-values) are values we added to the original results.

45
Appendix C: Theory of change analysis
Can we identify moderating factors that contribute to the heterogeneous effects?
Table C1: Theory of change analysis – official and self-reported use of Smartcards
Official data Survey data Test of
treatment heterogeneity
Carded GP Mean fraction carded payments
Payments generally carded (village mean)
Most recent payment carded (village mean)
NREGS SSP NREGS SSP NREGS SSP NREGS SSP (1) (2) (3) (4) (5) (6) (7) (8)
F-Stat 5.06 4.15 6.31 35.39 1.72 2.23 2.28 1.04 p-value 0.0259 0.0434 0.0130 < 0.001 0.1915 0.1378 0.1330 0.3083 No. of cases 880 880 880 880 818 878 818 878
Table C2: Theory of change analysis – access to payments
Test of treatment
heterogeneity
Time to collect Avg. payment lag (days) Abs. payment lag deviation (days)
NREGS NREGS SSP SSP NREGS NREGS NREGS NREGS (1) (2) (3) (4) (5) (6) (7) (8)
F-Stat 3.03 1.76 1.67 3.26 0.68 0.01 0.03 0.71 p-value 0.0837 0.1865 0.1986 0.0728 0.4124 0.9157 0.8519 0.4022 No. of cases 10191 10120 3789 3574 14213 7201 14213 7201

46
Table C3: Theory of change analysis – official and survey reports of program benefits
Test of treatment heterogeneity
Official Survey Leakage (1) (2) (3) (4) (5) (6)
Panel A: NREGS F-Stat 0.97 1.02 1.03 1.33 0.03 0.05 p-value 0.3257 0.3133 0.3120 0.2508 0.8595 0.8166
N. of cases 5143 5107 5143 5107 5143 5107 Panel B: SSP F-Stat 0.41 0.63 0.00 0.01 1.00 1.08 p-value 0.5222 0.4280 0.9976 0.9429 0.3189 0.3013
No. of cases 3330 3135 3330 3135 3330 3135
Table C4: Theory of change analysis – illustrating channels of leakage reduction
Test of treatment heterogeneity
Ghost households (%) Other over-reporting (%) Bribe to collect (%) (1) (2) (3) (4) (5) (6)
Panel A: NREGS F-Stat 0.02 0.02 1.78 3.69 4.86 5.39 p-value 0.8803 0.8927 0.1840 0.0564 0.0290 0.0216
N. of cases 5278 5242 3953 3672 10375 10304 Panel B: SSP F-Stat 0.18 0.30 0.11 0.14 1.51 1.47 p-value 0.6756 0.5846 0.7462 0.7061 0.2211 0.2274
No. of cases 3330 3135 3165 2986 3165 2986
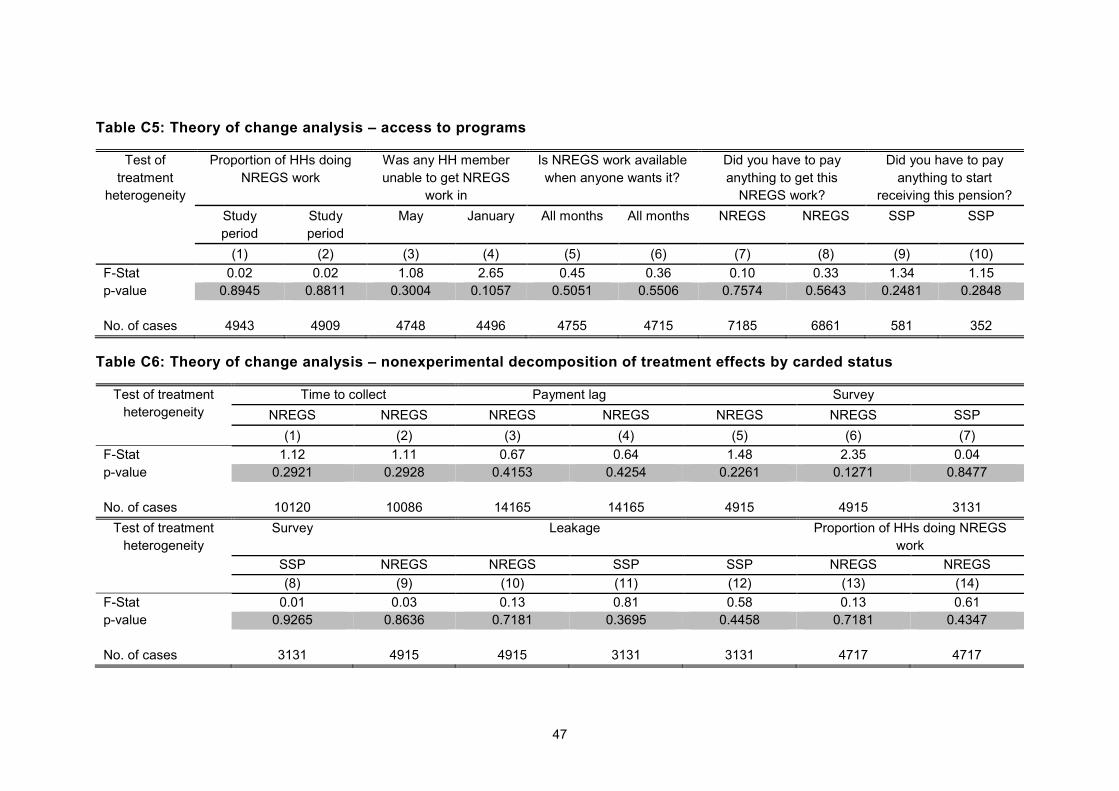
47
Table C5: Theory of change analysis – access to programs
Test of treatment
heterogeneity
Proportion of HHs doing NREGS work
Was any HH member unable to get NREGS
work in
Is NREGS work available when anyone wants it?
Did you have to pay anything to get this
NREGS work?
Did you have to pay anything to start
receiving this pension? Study period
Study period
May January All months All months NREGS NREGS SSP SSP
(1) (2) (3) (4) (5) (6) (7) (8) (9) (10) F-Stat 0.02 0.02 1.08 2.65 0.45 0.36 0.10 0.33 1.34 1.15 p-value 0.8945 0.8811 0.3004 0.1057 0.5051 0.5506 0.7574 0.5643 0.2481 0.2848
No. of cases 4943 4909 4748 4496 4755 4715 7185 6861 581 352
Table C6: Theory of change analysis – nonexperimental decomposition of treatment effects by carded status
Test of treatment heterogeneity
Time to collect Payment lag Survey NREGS NREGS NREGS NREGS NREGS NREGS SSP
(1) (2) (3) (4) (5) (6) (7) F-Stat 1.12 1.11 0.67 0.64 1.48 2.35 0.04 p-value 0.2921 0.2928 0.4153 0.4254 0.2261 0.1271 0.8477
No. of cases 10120 10086 14165 14165 4915 4915 3131
Test of treatment heterogeneity
Survey Leakage Proportion of HHs doing NREGS work
SSP NREGS NREGS SSP SSP NREGS NREGS (8) (9) (10) (11) (12) (13) (14)
F-Stat 0.01 0.03 0.13 0.81 0.58 0.13 0.61 p-value 0.9265 0.8636 0.7181 0.3695 0.4458 0.7181 0.4347 No. of cases 3131 4915 4915 3131 3131 4717 4717
48
References
Afridi, F and Iversen, V, 2014. Social audits and MGNREGA delivery: Lessons from Andhra Pradesh. India Policy Forum, 10(1), pp.297–341.
Afridi, F, Iversen, V and Sharan, MR, 2017. Women political leaders, corruption, and learning: evidence from a large public program in India. Economic Development and Cultural Change, 66(1), pp.1–30.
Atanda, AA and Reed, WR, 2017. A Replication Plan for: “Building State Capacity: Evidence from Biometric Smartcards in India. Available at: <http://www.3ieimpact.org/media/filer_public/2017/06/30/atanda_revised_replication_plan.pdf> [Accessed 12 December 2018].
Banerjee, A, Esther, D, Clement, I, Santhosh, M and Rohini, P, 2016. E-governance, accountability, and leakage in public programs: experimental evidence from a financial management reform in India. No. w22803. National Bureau of Economic Research.
de Mello, L and Dutz, MA, 2012. Promoting inclusive growth: challenges and policies. Paris: OECD and the World Bank.
Dray S and Josse, J, 2015. Principal component analysis with missing values: a comparative survey of methods. Plant Ecology, 216(5), pp.657–667.
Drèze, J and Khera, R, 2018. Aadhaar’s $11-billion question. Economic Times. Available at: <https://blogs.economictimes.indiatimes.com/et-commentary/aadhaars-11-bn-question/> [Accessed 10 July 2018].
Gelb, A, Mukherjee, A and Navis, K, 2018. Digital Governance in Developing Countries: Beneficiary Experience and Perceptions of System Reform in Rajasthan, India. Working Paper 489. Center for Global Development (CGD).
Gelb, A, Mukherjee, A, Navis, K, Thapliyal, M and Giri, A, 2017. What a new survey of Aadhaar users can tell us about digital reforms: initial insights from Rajasthan. Center for Global Development (CGD) Notes. Available at: <https://www.cgdev.org/publication/what-a-new-survey-aadhaar-users-can-tell-us-about-digital-reforms-initial-insights?utm_&&&> [Accessed 6 August 2018].
Gelb, A and Clark, J, 2013. Identification for development: the biometrics revolution. Center for Global Development (CGD) Working Paper 315.
Lewis-Faupel, S, Neggers, Y, Olken, BA and Pande, R, 2014. Can electronic procurement improve infrastructure provision? Evidence from public works in India and Indonesia (No. w20344). National Bureau of Economic Research.
Mukhopadhyay, P, Muralidharan, K, Niehaus, P and Sukhtankar, S, 2013. Implementing a biometric payment system: the Andhra Pradesh experience. UC San Diego Policy Report. La Jolla: University of California at San Diego (UCSD).

49
Muralidharan, K, Niehaus, N and Sukhtankar, S, 2014. Payments infrastructure and the performance of public programs: Evidence from biometric smartcards in India. National Bureau of Economic Research.
Muralidharan, K, Niehaus, N and Sukhtankar, S, 2016. Building State Capacity: Evidence from Biometric Smartcards in India. American Economic Review, 106(10), pp.2,895–2,929.
Muralidharan, K, Niehaus, N and Sukhtankar, S, 2017. General Equilibrium Effects of (Improving) Public Employment Programs: Experimental Evidence from India. National Bureau of Economic Research, No. w23838.
Niehaus, P and Sukhtankar, S, 2013. The marginal rate of corruption in public programs: evidence from India. Journal of Public Economics, 104, pp.52–64.
Olken, BA, 2006. Corruption and the Costs of Redistribution: Micro Evidence from Indonesia. Journal of Public Economics, 90(4–5), pp.853–870.
Pandey, N, 2018. Only 16% of rural users access Internet for digital payments: report. Live Mint. Available at: <https://www.livemint.com/Politics/PhY0kTxoJqq6U9GISIpSaK/Only-16-of-rural-users-access-Internet-for-digital-payments.html> [Accessed 12 December 2018].
Pritchett, L, 2009. Is India a Flailing State? Detours on the Four Lane Highway to Modernization, No. HKS Faculty Research Working Paper Series RWP09-013, John F Kennedy School of Government, Harvard University.
World Bank, 2014. India-Global Financial Inclusion (Global Findex) Database 2014. Available at: <http://microdata.worldbank.org/index.php/catalog/2433> [Accessed 12 December 2018].
World Bank, 2016. World Development Indicators. Washington, DC: The World Bank Group.

50
Other publications in the 3ie Replication Paper Series The following papers are available from http://3ieimpact.org/evidence-hub/publications/replication-papers
Risk sharing and transaction costs: a replication study of evidence from Kenya’s mobile money revolution, 3ie Replication Paper 22. Alinaghi, N, 2018.
Cash and change: a replication study of a cash transfer experiment in Malawi, 3ie Replication Paper 21. Reimão, ME, 2018.
Impact of unconditional cash transfers: a replication study of the short-term effects in Kenya. 3ie Replication Paper 20. Wang, H, Qui, Fang, Q and Luo, J, 2018.
Mobile money and its impact on improving living conditions in Niger: a replication study. 3ie Replication Paper 19. Meneses, JP, Ventura, E, Elorreaga, O, Huaroto, C, Aguilar, G, and Beteta, E, 2018.
Savings revisited: a replication study of a savings intervention in Malawi, 3ie Replication Paper 18. Stage, J and Thangavelu, T 2018.
Thou shalt be given…but how? A replication study of a randomized experiment on food assistance in northern Ecuador, 3ie Replication Paper 17. Lhachimi, SK and Seuring, T, 2018.
Preventing HIV and HSV-2 through improving knowledge and attitudes: a replication study of a multicomponent intervention in Zimbabwe. 3ie Replication Paper 16. Hein, NA, Bagenda, DS and Yu, F, 2018.
PEPFAR and adult mortality: a replication study of HIV development assistance effects in Sub-Saharan African countries. 3ie Replication Paper 15. Hein, NA, Bagenda, DS and Luo, J, 2018.
When to start ART? A replication study of timing of antiretroviral therapy for HIV-1-associated Tuberculosis. 3ie Replication Paper 14. Djimeu, EW, 2018.
STRETCHing HIV treatment: a replication study of task shifting in South Africa. 3ie Replication Paper 13. Chen, B and Alam, M, 2017.
Cash transfers and HIV/HSV-2 prevalence: a replication of a cluster randomized trial in Malawi. 3ie Replication Paper 12. Smith, LM, Hein, NA and Bagenda, DS, 2017.
Power to the people?: a replication study of a community-based monitoring programme in Uganda, 3ie Replication Paper 11. Donato, K and Garcia Mosqueira, A, 2016.
Fighting corruption does improve schooling: a replication study of a newspaper campaign in Uganda, 3ie Replication Paper 10. Kuecken, M, and Valfort, MA, 2016.
The effects of land titling on the urban poor: a replication of property rights, 3ie Replication Paper 9. Cameron, Drew B, Whitney, Edward M and Winters, Paul C, 2015.

51
Male circumcision and HIV acquisition reinvestigating the evidence from young men in Kisumu, Kenya, 3ie Replication Paper 8. Djimeu, EW, Korte, JE and Calvo, FA, 2015.
Walking on solid ground: a replication study on Piso Firme’s impact, 3ie Replication Paper 7. Basurto, MP, Burga, R, Toro, JLF and Huaroto, C, 2015.
The impact of India’s JSY conditional cash transfer programme: A replication study, 3ie Replication Paper 6. Carvalho, N and Rokicki, S, 2015.
Recalling extra data: A replication study of finding missing markets, 3ie Replication Paper 5. Wood, BDK and Dong, M, 2015.
The long and short of returns to public investments in fifteen Ethiopian villages, 3ie Replication Paper 4. Bowser, WH, 2015.
Reanalysis of health and educational impacts of a school-based deworming program in western Kenya Part 2: Alternative analyses, 3ie Replication Paper 3, part 2. Aiken, AM, Davey, C, Hayes, RJ and Hargreaves, JR, 2014.
Reanalysis of health and educational impacts of a school-based deworming program in western Kenya Part 1: A pure replication, 3ie Replication Paper 3, part 1. Aiken, AM, Davey, C, Hargreaves, JR and Hayes, RJ, 2014.
TV, female empowerment and demographic change in rural India, 3ie Replication Paper 2. Iversen, V and Palmer-Jones, R, 2014.
Quality evidence for policymaking: I’ll believe it when I see the replication, 3ie Replication Paper 1. Brown, AN, Cameron, DB and Wood, BDK, 2014.

�
Replication Paper Series
International Initiative for Impact Evaluation 1029 Vermont Avenue, NW Suite 1000 Washington, DC 20005 USA
[email protected] Tel: +1 202 629 3939
www.3ieimpact.org
Related Documents


![Report on Smartcards- Final Draft 31October2012[1]](https://static.cupdf.com/doc/110x72/577ce4ae1a28abf1038ee992/report-on-smartcards-final-draft-31october20121.jpg)