University of Mississippi eGrove Electronic eses and Dissertations Graduate School 2014 Biomechanics Of Slips In Alternative Footwear Harish Chander University of Mississippi Follow this and additional works at: hps://egrove.olemiss.edu/etd Part of the Biomechanics Commons is Dissertation is brought to you for free and open access by the Graduate School at eGrove. It has been accepted for inclusion in Electronic eses and Dissertations by an authorized administrator of eGrove. For more information, please contact [email protected]. Recommended Citation Chander, Harish, "Biomechanics Of Slips In Alternative Footwear" (2014). Electronic eses and Dissertations. 1026. hps://egrove.olemiss.edu/etd/1026

Welcome message from author
This document is posted to help you gain knowledge. Please leave a comment to let me know what you think about it! Share it to your friends and learn new things together.
Transcript

University of MississippieGrove
Electronic Theses and Dissertations Graduate School
2014
Biomechanics Of Slips In Alternative FootwearHarish ChanderUniversity of Mississippi
Follow this and additional works at: https://egrove.olemiss.edu/etd
Part of the Biomechanics Commons
This Dissertation is brought to you for free and open access by the Graduate School at eGrove. It has been accepted for inclusion in Electronic Thesesand Dissertations by an authorized administrator of eGrove. For more information, please contact [email protected].
Recommended CitationChander, Harish, "Biomechanics Of Slips In Alternative Footwear" (2014). Electronic Theses and Dissertations. 1026.https://egrove.olemiss.edu/etd/1026

BIOMECHANICS OF SLIPS IN ALTERNATIVE FOOTWEAR
A Dissertation
presented in partial fulfillment of requirements for the degree of
Doctor of Philosophy
in the Department of Health, Exercise Science and Recreation Management
The University of Mississippi
by
HARISH CHANDER
August 2014

Copyright © Harish Chander 2014
ALL RIGHTS RESERVED

ii
ABSTRACT
Injuries in the workplace pose a significant burden to the health of human beings as well
as financial or economic losses to occupational organizations. Slips, trips and an induced loss of
balance have been identified as the major causative factor for workplace injuries involving falls
(Courtney et al, 2001; Redfern et al, 2001). The Bureau of Labor Statistics reported 15% of a
total of 4,693 workplace fatalities and a total of 299,090 cases of non-fatal workplace injuries
that were due to slips, trips and falls (BLS, 2011). The purpose of the study was to analyze the
biomechanics of human locomotion under normal dry flooring conditions and under slippery
flooring conditions with three commonly used alternative casual footwear [thong style flip-flops
(FF), crocs with clogs (CC) and slip resistant low-top shoe (LT)]. The study will follow a within-
subjects repeated measures design with each participant exposed to all three footwear using a
counter balanced design. Eighteen healthy male participants with no orthopedic, cardiovascular
or neurological abnormalities completed the study. Participants were required to come in for
three testing sessions separated by at least 24 hours of rest interval and an initial familirization
day. On each testing day, participants were provided with an alternative footwear based on a
counterbalanced selection and were tested for maximal voluntary contraction for lower extremity
muscles and were exposed to a series of walking trails that included a Normal Dry Surface Non
Slip Gait Trial (NS); Unexpected Slip (US), Alert Slip (AS) and Expected Slip (ES). A 3 X 4 [3
(FF, CC, LT) X 4 (NS, US, AS, ES)] within-subjects repeated measures ANOVA was used to
analyze the dependent slip parameters (heel slip distance and mean heel slip velocity), kinematic
and kinetic gait variables (mean and peak vertical ground reaction forces and lower extremity

iii
joint angles) and muscle activity (mean, peak and % maximal voluntary contraction in lower
extremity muscles). Significant interactions between the footwear and gait trials were found for
the slip parameters, gait parameters and muscle activity variables (p<0.05). Significant
interactions were followed up with post-hoc multiple comparisons using a sidak bonferroni
correction. Based on the results from the study the alternative footwear (CC & FF) had greater
slip parameters, reduced ground reaction forces and a plantar flexed foot position at heel strike
compared to the LT. The US and AS had greater incidence of slips than NG and ES and
moreover with the a priori knowledge of the slippery flooring conditions (ES), the individuals
were able to modify the gait kinematic and kinetic parameters rather than lower extremity muscle
activity to reduce the potential for a slip. Overall, the most hazardous slips were seen with
alternative footwear and during the unexpected slips followed by the alert slips. The LT had
lower incidence of slips and maintained a normal gait pattern during all gait trial conditions and
demonstrates to be the choice of footwear for maneuvering slippery flooring conditions that exist
in both occupational and public places.

iv
ACKNOWLEDGMENTS
This Dissertation would not have been possible without the guidance and the help of
several influential and important individuals who in one way or another contributed and
extended their valuable assistance in the preparation and completion of this study. My sincere
thanks to each one of my committee members Dr. John C. Garner, Dr. Chip Wade, Dr. Yang-
Chieh Fu and Dr. John Bentley. I could not have completed my doctorate without the support
and encouragement from all of these prominent people. First and foremost, my utmost and
deepest gratitude to my dissertation chair, my advisor, my teacher, my mentor and a great
inspiration, Dr. John C. Garner. Without him, this dissertation wouldn’t have been possible.
Thank you for your unselfish and unfailing support and guidance throughout my career and I am
forever grateful. I express my deepest appreciation to my research advisor, Dr. Chip Wade, who
has been always on my side providing me with extremely valuable insights to this study and in
the ergonomics area of research. I am extremely thankful to Dr. John Bentley, who has been a
very influential and inspirational person not only to this dissertation but also to my academic
career as well. I thank Dr. Yang-Chieh Fu for his guidance in data analysis in this study. Special
thanks to Dr. Mark Loftin for his constant support to my research and academics over the past
years. My sincere acknowledgements to all faculty and staff from the Department of Health,
Exercise Science & Recreation Management. I am truly indebted to all my colleagues, my fellow
grad students, my undergraduate honors thesis and practicum students for their help and support
throughout this dissertation. And finally my deepest appreciation to all loved ones, my parents,
my family, my friends and to my wife for always standing beside me with an everlasting support.

v
TABLE OF CONTENTS
ABSTRACT ------------------------------------------------------------------------------------------------- ii
ACKNOWLEDGMENTS ------------------------------------------------------------------------------- iv
INTRODUCTION ------------------------------------------------------------------------------------------ 1
i. Purpose ---------------------------------------------------------------------------- 5
ii. Hypotheses ------------------------------------------------------------------------ 6
iii. Operational Definitions -------------------------------------------------------- 9
REVIEW OF LITERATURE --------------------------------------------------------------------------- 14
i. BIOMECHANICS OF HUMAN GAIT ----------------------------------- 16
1. Kinematics of Human Gait ----------------------------------------- 16
2. Kinetics of Human Gait --------------------------------------------- 18
3. Muscle Activity of Human Gait ------------------------------------ 20
ii. BIOMECHANICS OF SLIPS ----------------------------------------------- 22
1. Kinematics of Human Gait during Slips ------------------------- 23
2. Kinetics of Human Gait during Slips ----------------------------- 25
3. Muscle Activity of Human Gait during Slips -------------------- 29
iii. EXTRINSIC FACTORS PREDICTING SLIP PROPENSITY ------ 31
iv. INTRINSIC FACTORS PREDICTING SLIP PROPENSITY ------- 35
v. COMPARISON OF ALTERNATIVE FOOTWEAR TO SHOD
CONDITIONS IN GAIT AND SLIP PARAMETERS ----------------- 39
vi. REFERNCES ------------------------------------------------------------------- 43
MANUSCRIPTS ------------------------------------------------------------------------------------------ 53
MANUSCRIPT I ---------------------------------------------------------------------------- 54
REFERNCES -------------------------------------------------------------------------------- 79
MANUSCRIPT II --------------------------------------------------------------------------- 86
REFERENCES ----------------------------------------------------------------------------- 108
MANUSCRIPT III ------------------------------------------------------------------------- 112
REFERENCES ----------------------------------------------------------------------------- 142
APPENDICES -------------------------------------------------------------------------------------------- 147
VITA-------------------------------------------------------------------------------------------------------- 167

1
CHAPTER I
INTRODUCTION

2
Injuries in the workplace pose a significant burden to the health of human beings as well
as financial or economic losses to occupational organizations. Slips, trips and an induced loss of
balance have been identified as the major causative factor for workplace injuries involving falls
(Courtney et al, 2001; Redfern et al, 2001). The Bureau of Labor Statistics reported 15% of a
total of 4,693 workplace fatalities and a total of 299,090 cases of non-fatal workplace injuries
that were due to slips, trips and falls (BLS, 2011). The annual cost of workplace injuries due to
slips, trips and falls in the United States was estimated to be over 6 billion US dollars with an
expected cost of $43.8 billion by 2020 (Courtney et al, 2001).
Falls in the workplace are not always from an elevation. While 64% of work related falls
were attributable to slips, trips and an induced loss of balance, 43% of the same level falls were
found to be triggered by slips (Courtney et al, 2001). Pedestrian accidents in the walkway have
been identified as the second largest generator of unintentional workplace fatalities (Leamon &
Murphy, 1995). Proper postural control and balance in both static and dynamic conditions are
essential in workplace settings and pedestrian walkway settings in order to prevent falls and,
thus, injuries. Increased probability of falls have been related to decrements in balance control
and these falls are often a primary causative factor for injuries and disabilities in the general
population as well as in the contemporary industrial population where postural stability is
challenged with unfavorable and unfamiliar environment (Lin, Seol, Nussbaum & Madigan,
2008).In an occupational setting, postural instability can be hazardous due to an increased risk of
falls, slips, trips and other accidents (Kincl et al, 2002). In addition to acute fall related injuries,
overexertion injuries have very high incidences for slip induced falls and makes the effort of
recovering from an induced slip very demanding (Courtney & Webster, 2001).

3
Slips, trips and falls occur as a result of failure of normal locomotion and failure of
attempts at equilibrium recovery following an induced imbalance (Davis, 1983; Gauchard,
2001). These slips, trips and falls can be induced by environmental factors or external factors or
by failure of the human factors or internal factors. Among the environmental or external factors
are the physical characteristics of the floor or ground surface such as the type, smoothness or
roughness of the surface, compliance of the surface and the presence and absence of
contaminants or obstacles (Redfern et al, 2001). The human factors or the internal factors
constitute the human postural control system which is a complex sensorimotor function with
afferent information from the visual, somatosensory and vestibular system along with central
integration of these afferent stimulus and specific motor responses (Gauchard, 2001; Redfern et
al, 2001; Hanson, Redfern & Mazumdar, 1999).
Preventing and reducing slip and fall accidents have been an important aspect of
ergonomics research and have focused on slip-resistant properties of the floor-shoe interface.
The focus of ergonomics research in slip, trip and falls has grown from a tribological perspective
which deals with the interactions between the physical properties such as the friction, lubrication,
viscoelasticity of the floor and the shoe to a more recent biomechanical perspective that includes
the human factors associated with a fall. The biomechanical perspective includes analysis of gait
parameters and ground reaction forces during walking and slipping under varying environmental
conditions, which provides a greater insight to the human factors involved in the event of slip
and a fall. Research has also focused on balance recovery from perturbations and slips which
includes analysis of anatomical anthropometric factors, physiological factors and motor control
factors (Redfern et al, 2001).

4
The outcome of recovering from a slip is invariably dependent upon the external
environmental factors and the internal human factors. The type of the footwear and the type of
flooring conditions and the interaction between them by means of the footwear-floor interface
constitutes the external factors in determining the outcome of a slip. The internal human factors
constituting the postural control system is affected by aging, fatigue, anthropometric features and
with any abnormalities or degradation caused by disorders and diseases of the human postural
control system and musculoskeletal system.
Thus, a number of influential parameters due to extrinsic and intrinsic factors contribute
to slip propensity and also the outcome of a slip with either a recovery or failure to recover from
the slip and ultimately leading to a fall. Future research on the biomechanics and physiology of
slips is recommended including different extrinsic and intrinsic factors with the inclusion of
tribology of material science. A very simple modification in an attempt to prevent slips is to
modify the footwear in occupational and pedestrian environments. Although, there is
considerable amount of literature discussing slips in occupational mandated footwear, the impact
of alternative and casual footwear such as flip-flops and crocs which are commonly used among
pedestrians and few of the occupational environments such as a hospital setting have not been
analyzed yet. Specific occupations such as doctors and nursing staff in the hospitals wear these
alternative footwear throughout the work day, stressing the importance of this research.
Furthermore, usage of flip-flops and crocs in and around the workplace as an alternative
footwear has grown in the recent years, further emphasizing the need to address the effect of
these footwear on slip events.
An important distinguishing factor that might predict the outcome of a slip event is the
design feature of these alternative footwear. These alternative footwear do not secure themselves

5
completely over the entire foot, and the heel almost always, is not attached to the footwear. The
primary point of contact or the link between the footwear and the foot, and subsequently the
primary area of somatosensory feedback, comes from the forefoot segment. Previous gait
kinematics studies suing different footwear make an assumption that the foot and the footwear as
one rigid body and make interpretations of gait analysis based on the movement of that rigid
segment. However, the same assumption could not be made about the use of these alternative
footwear, in which the hind-foot is detached from the footwear. This is crucially important in
biomechanics of slip studies, since the heel movement is analyzed to identify the type and the
severity of the slip. Hence, with the increased use of these alternative footwear in occupational
and non-occupational environments, the need for understanding its effect on human gait and slips
is extremely important in the prevention of fall and fall related injuries.
Purpose of the Study
Balance and gait mechanisms during normal locomotion and under slippery conditions
have been studied extensively (Winter, 1991; Winter, 1995; Redfern et al, 2001) and
consequently, there have been several studies that focus on the biomechanics of slips, trips and
falls which are the primary causative factors for fall and fall related injuries in pedestrian
population and especially in occupational environments, where there is a greater incidence of
slips due to the environmental occupational hazards (Redfern et al, 2001; McGorry et al, 2010;
Cham & Redfern, 2002a; Cham and Redfern, 2002b; Hanson et al, 1999; Perkins, 1978;
Standberg & Lanshammar, 1981). The effect of different footwear, different flooring conditions
and the footwear-floor interactions on the biomechanics of gait and balance have also been
identified (Li, Wu and Lin, 2006; Shroyer& Weimer, 2010; Perry, Radtke & Goodwin, 2007,

6
Menant, Perry, Steele, Menz, Munro & Lord, 2008, Divert, Mornieux, Baur, Mayer & Belli,
2005, Bohm & Hosl, 2010).
While extensive literature exists on biomechanics of balance, gait and slips and the
influence of footwear on these, there is still dearth of literature on the effect of much commonly
used alternative footwear on the biomechanics of gait and slips. Hence, the purpose of the study
was to analyze the effects of alternative footwear [thong style flip-flops (FF), crocs with clogs
(CC) and slip resistant low-top shoe (LT)] on the biomechanics of gait and slips. Specifically, the
slip parameters, the kinematic and kinetic variables and muscle activity during gait under normal
dry and slippery floor conditions will be analyzed with these alternative footwear. By addressing
these findings, the strategies involved during slip events may be explained and recommendations
for effective footwear design can be made. These inferences and recommendations may further
help limit fall and fall related injuries in an occupational and recreational setting. The long-term
goal of this proposed research would be to determine and understand how commonly used
alternative footwear behave under slippery conditions.
Hypotheses
Slip Hypothesis - Specific Aim 1:
To investigate the effect of alternative footwear (FF, CC & LT) on slip parameters during
an unexpected slip, alert slip and an expected slip in comparison to normal dry surface gait.
H01: Individual’s slip parameters will not be altered when exposed to an unexpected, alert
and an expected slip while wearing alternative footwear.
HA1: Individual’s slip parameters will be altered while be altered when exposed to an
unexpected, alert and an expected slip while wearing alternative footwear.

7
Different types of footwear affect gait and posture kinematics adversely. Footwear
characteristics such as the boot shaft height, mass, mid-sole hardness and thickness, elevated
heels, type of material of the footwear and especially the tread sole pattern influence gait and
ultimately the slip propensity when exposed to slippery conditions. The differences in the
coefficient of friction between the footwear type and surface type have been reported as a prime
factor in slip and trip induced falls. Slip characteristics have been shown to be altered based on
the perception of the slipperiness of the floor of an unexpected slip in comparison to an alert or
expected slip. Proactive strategies are implemented with a priori knowledge of an impending
slip. Hence, the null hypothesis that the slip parameters will be not be altered when exposed to
different slip events while walking with different alternative footwear is expected to be rejected.
Gait Kinematics and Kinetics Hypothesis - Specific Aim 2:
To investigate the effect of alternative footwear (FF, CC & LT) on kinematic and kinetic
gait variables during normal dry and slippery flooring conditions.
H02: Individual’s kinematic and kinetic gait variables will not be altered when exposed to
normal dry and slippery flooring conditions while wearing alternative footwear.
HA2: Individual’s kinematic and kinetic gait variables will be altered when exposed to
normal dry and slippery flooring conditions while wearing alternative footwear.
Unlike other shod conditions, these alternative footwear do not secure the hind foot, heel
and the ankle joint of the lower extremity. The movement of the entire foot and the footwear as
one rigid segment seen in close fitting athletic shod conditions is not present in alternative
footwear. As a result the interlinked point of contact of these alternative footwear and foot is
accomplished only by the toes for flip flops and the forefoot for crocs. Hence, gait kinematics are

8
negatively affected by these modifications in the footwear-foot interface. A reduced gait speed,
decreased step and stride length, lowered double support time and over all reduced stance phase
was seen in flip-flops compared to close fitting athletic shoes. Hence, the null hypothesis that the
kinematic and kinetic gait variables will not be altered when exposed to normal dry and slippery
conditions while walking with different alternative footwear is expected to be rejected.
Muscle Activity Hypothesis - Specific Aim 3:
To investigate the effect of alternative footwear (FF, CC & LT) on lower extremity
muscle activity during normal dry and slippery flooring conditions.
H03: Individual’s lower extremity muscle activity will not be altered when exposed to
normal dry and slippery flooring conditions while wearing alternative footwear.
HA3: Individual’s lower extremity muscle activity will be altered when exposed to
normal dry and slippery flooring conditions while wearing alternative footwear.
Lower extremity muscular activity under go either a reactive or proactive strategy in the
event of an unexpected slip and expected slip respectively, creating corrective moments to
prevent from falling down. The muscles of the knee have been shown to produce the majority of
the corrective responses through flexion-extension moments, while the musculature at the hip are
predominantly utilized for stabilization of the body during a slip. Knowledge or perception of the
slippery surface has been to shown to produce greater activation and co-contraction of the
agonist / antagonist pairs of lower extremity musculature in an attempt to reduce the probability
of slip events. Moreover, it is hypothesized that the alternative footwear, because of its design
feature which does not attach to the entire foot, would increase the ankle musculature activation
in an attempt to secure these footwear. Hence, the null hypothesis that the lower extremity

9
muscle activity will not be altered when exposed to normal dry and slippery flooring conditions
while walking with different alternative footwear is expected to be rejected.
Operational Definitions
Posture:
Posture is essentially the relative position of the various parts of the body with respect to
one another (the egocentric coordinate system) and to the environment (the exocentric coordinate
system). A third frame of reference is that of the gravitational field (the geocentric coordinate
system). The orientation of the body part can be described in terms of each of these frameworks
(Kandel, Schwartz &Jessell, 2000).
Postural Equilibrium:
Regulation of posture with respect to gravity is important in maintaining postural
equilibrium, which may be defined as the state in which all forces acting on the body are
balanced so that the body rests in an intended position (static equilibrium) or is able to progress
through an intended movement without losing balance (dynamic equilibrium) (Kandel, Schwartz
&Jessell, 2000).
Balance:
The ability to maintain the vertical projection of the center of mass within the base of
support can be defined as Balance. Balance and postural stability are often used synonymously.
Postural stability depends on the intentional action, the choice of movement strategy and the
under lying neuromotor process (Levangie&Norkin, 2006). The maintenance of the center of
gravity within the limits of the base of support, which is determined by foot position (Kincl et al.,

10
2002); the ability to maintain the center of mass over the base of support in order to sustain
equilibrium in a gravitational field (Horak, 1987).
Friction:
Friction is the force resisting the relative motion of objects against each other. Types
include, dry friction, fluid friction, lubricated friction, skin friction and internal friction.
Coefficient of Friction:
The coefficient of friction (COF, µ) is a dimensionless scalar quantity which is the ratio
of the force of friction between two objects and the normal force, which is perpendicular to the
moving surface.
Tribology:
Tribology is the science and engineering of interacting surfaces in relative motion.
Electromyography (EMG):
Electromyography (EMG) is a clinical technique for evaluating and recording
physiologic properties of the muscles at rest and while producing force. EMG is performed using
an instrument called an electromyograph, to produce a record called an electromyogram. An
EMG represents the spatial and temporal summation of all motor unit action potentials in the
proximity of the recording electrode. It is indicative of the level of muscle activity via the motor
unit recruitment and rate coding (Basmaijan, 1985).
Center of Mass (COM):
COM is defined as the point on a body that moves in the same way that a particle subject
to the same external forces would move. It is also the point where the 3 mid-cardinal planes of

11
the body meet. The center of mass is not necessarily located in the body (Rodgers & Cavanagh,
1984).
Center of Gravity (COG):
COG is defined as the point at which a single force of magnitude mg (the weight of the
body or system) should be applied to a rigid body or system to balance exactly the translational
and rotational effects of gravitational forces acting on the components of the body or system. In
other words, the point at which the weight of the body or system can be considered to act
(Rodgers & Cavanagh, 1984).
The center of gravity and the center of mass are coincident, although in strict physical
terms, there is an infinitesimal difference between the two. The center of gravity of the human
body is not fixed at an anatomical location. Its location varies according to the position of the
body segments (Rodgers & Cavanagh, 1984).
Line of Gravity (LOG):
LOG is defined as the perpendicular line towards the ground from the center of gravity
(COG) of that particular body (Levangie&Norkin, 2006).
Base of Support (BOS):
The human species’ base of support (BOS), is defined by the area bounded posteriorly by the tips
of the heels and anteriorly by a line joining the tips of the toes, and is considerably smaller than
the quadruped BOS (Levangie&Norkin, 2006).

12
Center of Pressure (COP):
COP is defined as a quantity, available from a force platform describing the centroid of
the pressure distribution. It can be thought of as (and is sometimes called) the point of
application of the force (Rodgers & Cavanagh, 1984).
Ground reaction Force (GRF):
The forces that act on the body as a result of interaction with the ground that is based on
Newton’s third law of motion, which implies that the GRFs are equal in magnitude and opposite
in direction to the force that the body is applying to the ground (Rodgers & Cavanagh, 1984).
Proprioceptive System:
The body system which promotes body position awareness and contributes to the
maintenance of balance; includes input from the muscles, tendons, and joints; sensory receptors
involved include those in muscle spindles, skeletal muscles, and Golgi tendon organs, which
supply information on muscle length and tension, muscle force, and velocity (Sturnieks and
Lord, 2008).
Somatosensory System:
The body system which includes the tactile and proprioceptive systems; includes input
from Meissner’s corpuscles, Pacinian corpuscles, Merkel’s disks, and Ruffini endings, which all
are touch inputs to the central nervous system (Hijmans et al., 2007).

13
Vestibular System:
The body system responsible for information including head position and motion relative
to gravity, head posture, and body and eye movements; the structures of the vestibular system are
in the inner ear (Sturnieks and Lord, 2008).
Visual System:
The body system which provides environmental information via the eyes as well as input
about movements and position of the body; very important in posture in balance in that
information from this system is used to regulate postural sway (Sturnieks and Lord, 2008)

14
CHAPTER II
REVIEW OF LITERATURE

15
The purpose of this investigation is to assess the effects of alternative footwear on gait
and slip trials. This chapter will provide an insight to previous literature on the biomechanics of
human gait under normal dry flooring conditions and under slippery conditions. This chapter is
divided into five major sections as listed below. The first section titled biomechanics of human
gait includes discussions about biomechanics behind normal walking, the systems involved,
strategies implemented and assessment parameters. This is followed by the second section,
which explains the biomechanics of human gait during slip events. The third and the fourth
sections explain the extrinsic parameters including footwear characteristics and intrinsic
parameters including the perception of slipperiness involved during a slip event. And finally, the
fifth section comprises of a description of the alternative footwear and their comparison with
other commonly used footwear during gait and slip events.
1. BIOMECHANICS OF HUMAN GAIT
i. Kinematics of Human Gait
ii. Kinetics of Human Gait
iii. Muscle Activity of Human Gait
2. BIOMECHANICS OF SLIPS
i. Kinematics of Human Gait during Slips
ii. Kinetics of Human Gait during Slips
iii. Muscle Activity of Human Gait during Slips
3. EXTRINSIC FACTORS PREDICTING SLIP PROPENSITY
i. Footwear Characteristics in Prediction of Slip Propensity
4. INTRINSIC FACTORS PREDICTING SLIP PROPENSITY
i. Perception of Slipperiness
5. COMPARISON OF ALTERNATIVE FOOTWEAR TO SHOD CONDITIONS IN
GAIT AND SLIP PARAMETERS

16
BIOMECHANICS OF HUMAN GAIT
In order to analyze the biomechanics of slips, it is crucial to understand the biomechanics
behind normal dry surface walking. Human bipedal walking is considered as a challenging
neuromuscular task to the central nervous system, with coordinated repetitive sequence of limb
movements to safely advance the human body with efficient energy expenditure (Winter, 1995).
Human balance in static conditions is viewed as an inverted pendulum model where the center of
gravity (COG) of the human body is required to be within the base of support (BOS)and human
balance during dynamic conditions or steady state gait, is viewed as a series of controlled falling
where the COG is always outside the BOS (Winter, 1995). The series of controlled falling is
initiated with a voluntary forward acceleration of the body’s COG outside the BOS (Winter,
1995) and implementing the stepping strategy to reestablish the BOS and thereby regaining
balance. The coordinated repetition of this sequence gives rise to human bipedal gait.
i. Kinematics of Human Gait:
A gait cycle consists of two successive events of the same lower extremity, usually initial
contact of one heel to the contact of the same heel again, and during a normal walking, is divided
into a stance phase consisting of 60% of the gait cycle and swing phase consisting 40% of the
gait cycle (Levangie & Norkin, 2006; Lamoreaux, 1971; Enoka, 2008). The Rancho Los Amigos
(RLA) terminology classifies the stance phase into heel strike, loading response, midstance,
terminal stance and preswing, and the swing phase into initial swing, mid swing and terminal
swing (Levangie & Norkin, 2006). The temporal and spatial parameters of the gait cycle provide
a kinematic description of the human locomotion. The temporal parameters include stance time,
single-limb time and double support time, swing time, stride and step time, cadence and speed of
walking. The spatial parameters include stride length, step length and width, and degree of toe-

17
out (Levangie & Norkin, 2006). Stance time is the time spent by one extremity during the stance
phase, while swing time is during swing phase. Single support time is time during the gait cycle
where only one extremity is in contact with the ground, while double support time is when both
extremity are in contact with the ground. Stride length is the linear distance between two
successive events of the gait cycle, while step length is the linear distance between two
successive points of contact of the opposite extremities (Levangie & Norkin, 2006; Enoka,
2008). Cadence is the number of steps per minute and walking velocity is the rate of linear
forward motion of the body, which is derived from the product of the cadence and step length
(Levangie & Norkin, 2006; Enoka, 2008). While all the above mentioned gait parameters are
measured in the sagittal place, step width or the width of walking base and degree of toe out or
the angle of foot placement in relation to the line of progression are measured in the frontal plane
(Levangie & Norkin, 2006).
The movement of the heel during the initial period of the heel strike phase during normal
dry surface gait has a characteristic pattern, where the heel rapidly negatively accelerates just
prior to heel strike following which the heel moves slightly forward (Perkins, 1978; Strandberg
& Lanshammar, 1981; Redfern et al, 2001, Cham & Redfern, 2001a). At heel strike, the heel has
been shown to have an instantaneous velocity in the forward direction (Perkins, 1978; Strandberg
& Lanshammar, 1981) and some instances in a rearward direction (Cham & Redfern, 2001a),
after which the heel reaches a minimum velocity and comes to a stop, over which the rest of the
foot rolls over completing the midstance.
Joint angles from the ankle, knee and the hip joints are assessed to determine the required
amount of the range of motion (ROM) during normal dry surface locomotion (Winter, 1995;
Cham and Redfern, 2001a; Redfern & DiPasquale, 1997). The ankle is maintained at slight

18
dorsiflexion during heel strike and immediately rolls to peak plantar flexion at about 10% of
stance phase. There is a forward rotation of the lower leg brought about by knee flexion at 30%
stance phase, that moves the ankle to dorsiflexion and finally back to plantar flexion with the
beginning of the push off period at about 80% of stance phase (Redfern et al, 2001; Levangie &
Norkin, 2006). Following the initial increase in knee flexion at 30% stance phase, knee flexion
angle increases again at 80% stance during push off period and to prepare for the heel strike of
the opposite lower extremity (Redfern et al, 2001; Levangie & Norkin, 2006). The hip remains in
an extended position for most of the stance phase to accommodate for the continuous forward
movement of the body, while moving to an increased flexion position to prepare for the swing
phase of the gait cycle (Redfern, et al, 2001).
ii. Kinetics of Human Gait:
Ground reaction forces are the foot forces during gait derived from interactions between
the shoe and the floor (Levangie & Norkin, 2006; Enoka, 2008) and considered as one of the
most critical gait parameters for assessment of the slips and falls (Redfern et al, 2001). The
footwear serves to spread the load of the body weight over a wide area of the plantar surface of
the foot and also serves to increase the contact times during the stance phase of the gait (Soames
et al, 1985). The vertical normal force during a gait cycle is typically characterized by two peaks.
This first peak occurs at the end of the loading response (25% into stance phase of the gait cycle)
and the second peak occurs during the end of the stance phase at the beginning of the toe-off
phase (Perkins, 1978; Lanshammar and Strandberg, 1981; Redfern, 2001). The anterior-posterior
shear force during a normal gait cycle also exhibit a symmetrical biphasic peaks, where the first
peak in the forward direction is due to the loading response and the second rearward directed
peak is due to the pushing back of the toes during the push off phase of the gait cycle (Perkins,

19
1978; Lanshammar and Strandberg, 1981; Redfern, 2001) (Figure 1). The single point on the
surface of the foot at which the resultant surface pressure acts, called as the center of pressure
(COP), (Enoka, 2008) has a distinct characteristic pattern during walking. The COP starts at the
postero-lateral edge of the heel at heel strike, moving towards mid-foot yet lateral to the midline
during midstance and finally towards the ball of the foot during toe-off phase of the gait cycle
(Redfern, 2001; Levangie & Norkin, 2006; Enoka, 2008).
Figure.1: From Biomechanics of Slips, Redfern et al, 2001.

20
Moments about the ankle, knee and hip have been included in kinetic analysis during
normal gait (Redfern et al, 2001; Winter, 1991; Redfern & DiPasquale, 1997). The net moments
about the lower extremity are responsible for helping to maintenance of balance and for
generating power during gait. The ankle moment is characterized by an increasing plantar flexion
moment as the stance phase progresses and the knee moment is characterized by a biphasic
flexion-extension moment. The hip joint predominantly has an extension moment through most
of the stance phase with an initial flexion moment in early stance (Winter, 1991; Redfern &
DiPasquale, 1997).
iii. Muscle Activity of Human Gait:
Along with the kinematic and kinetic analysis, electromyography (EMG) has been used
to assess muscle activity during human locomotion. Two major contributions from the muscles
during a gait cycle are to provide a stable support moment during the stance phase and provide a
propulsion moment to generate energy to move during the end of the stance and throughout the
swing phase (Levangie & Norkin, 2006). Muscle activity during a gait cycle is very precise and
has in phase coordination of the lower extremity muscle actions, which progressively become
primarily isometric or eccentric rather than concentric, with the progression of the gait cycle
(Boakes & Rab, 2006). An extensor moment from the hip extensors and an eccentric muscle
action of the tibialis anterior is seen during the initial period of the stance phase followed by an
extensor moment from the knee extensors which help during the loading response phase of the
gait cycle (Boakes & Rab, 2006; Levangie & Norkin, 2006; Winter, 1991). The gluteus medius
also undergoes an isometric muscle action during the loading response phase to stabilize the
pelvis. Following this, an eccentric muscle action of the soleus muscle allows the forefoot to be
pressed against the floor and the knee extended without the activity of the knee extensors

21
(Boakes & Rab, 2006). The hip and the knee move towards flexion during late stance with the
ankle plantar flexors starting to produce a concentric muscle action that accelerates the body
forward during push off (Boakes & Rab, 2006; Levangie & Norkin, 2006; Winter, 1991).
The pre-swing and the initial swing is characterized with concentric muscle actions from
the hip flexors and the knee extensors followed by the passive pendulum action of the lower leg
during mid-swing that further advances the body during gait. And, finally the eccentric action of
knee flexors especially the hamstrings serves to slow the hip flexion and knee extension as the
knee extensors and ankle dorsi flexors act to prepare the lower leg to accept weight during heel
strike (Boakes & Rab, 2006; Levangie & Norkin, 2006; Winter, 1991). Due to the increased
variability in the phasic EMG data of individual muscles, it is suggested that an average of
multiple gait trials need to be performed to obtain a characteristic representation of the muscle
activity during human gait (Boakes & Rab, 2006). Thus, muscle activity during normal human
locomotion consists predominantly of isometric or eccentric muscle action of the lower extremity
muscles that allows efficient storage and transfer of energy between limb segments with brief
periods of high energy concentric muscle actions that help in forward motion of the body
(Boakes & Rab, 2006).

22
BIOMECHANICS OF SLIPS
Human gait is invariably affected by the coefficient of friction (COF) that exist with
when two surfaces come in contact, such as the sole of the shoe and floor that is being walked
on, especially with different levels of COFs (high, medium & low). For a proper gait without any
events of slips or loss of balance, a medium coefficient of friction is necessary. A very low
coefficient of friction will provide a very low resistance for the foot to move and will cause the
foot to slide excessively and may predispose to fall. Whereas, a very high coefficient of friction
will provide an increased resistance for the foot to move and may even hinder normal foot
motion in gait, in which case it may still predispose to fall by means of a trip, rather than a slip.
Hence, a medium or normal coefficient of friction is necessary to allow smooth transitions of the
foot one over the other and accomplish gait with the least energy expenditure as possible,
especially in work place settings. The utilized coefficient of friction under normal walking
conditions and normal walking speeds ranged from 0.17 to 0.20 (Redfern et al, 2001; McGorry et
al, 2010). And when the utilized coefficient of friction exceeds the available at the footwear-floor
interface, the slip propensity increases (Cham and Redfern, 2002b; Hanson et al, 1999; McGorry
et al, 2010). During walking at a greater speed than normal walking, the step / stride length is
longer and the angle θ, at which the lower leg makes contact with the ground is also greater, thus
increasing the required coefficient of friction (Figure 3).
The biomechanical analysis of slips helps in evaluation of both the interaction of the
footwear-floor interface and the description of motion of the body segments during the event of a
slip (Li, 1991). Different terminologies exist for the classification of slips based on the severity
of the slip outcome, by means of slip distances and perception of the slipping. Microslips and

23
macroslips have been used to differentiate slip severity using slip distance from the heel motion
as a classifying parameter (Perkins, 1978). Slip perception and recovery was used as a
classifying parameter to categorize slip-sticks into, mini-slips during which the subjects did not
detect the slipping motion; midi-slip during which slips are recovered without major gait
disturbances; and maxi-slip during which the slip recovery involves large corrective responses
and that are close to a fall (Standberg & Lanshammar, 1981; Redfern et al 2001).
i. Kinematics of Human Gait during Slips:
Gait kinematics are influenced by the available coefficient of friction and the slipperiness
of the floor. A few kinematic variables are very commonly used as outcome variables to interpret
the slip research. The most commonly reported are the slip parameters such as the heel slip
distance, heel velocity and the foot-floor angle; joint angles of the ankle and the knee joints
along with temporal-spatial parameters of gait including stride/step lengths, width of walking
base, stride/step time and cadence (Perkins, 1978; Strandberg & Lanshammar, 1981). In the case
of very low coefficient of friction surfaces, the slip parameters are analyzed to determine if the
slips are hazardous.
Step length has a direct relationship with the shear force, and with a greater step length, a
greater shear force is exerted during the initial heel strike phase and the chances of a slip are
increased (Redfern et al, 2001). The distance and velocity of the heel motion following heel
strike in a gait cycle have been used to characterize slip types (Redfern et al, 2001). Micro-slips
are characterized by heel slip distance of 1cm-3cm and are not perceived by the individuals and
easily compensated for by the automatic postural system. Macro-slips are characterized by the
slip distances between 3cm-10cm, which will result in a loss of balance may or not result in fall,
while slip distances greater than 10cm are most likely to result a fall due to the failure of the

24
automatic postural system (Perkins 1978, Stranberg and Lanshammar, 1981, Redfern et al, 2001;
Redfern and Cham, 2001a).
The differences in the temporal-spatial kinematic parameters of gait include a decreased
step/stride length, to minimize the center of gravity (COG) excursions outside of the base of
support thereby creating a greater stability during walking (Cooper & Glassow, 1963; Steindler,
1977; Lockhart, 2007). By decreasing the step/stride length, the step/stride time is increased and
hence, automatically the amount of time in stance phase is increased which decreases the swing
phase time. The opposite could be true for an increased COF, where the step/stride length could
be increased with an increased step/stride time thereby increase the swing phase of the gait and
avoiding time spent on stance in an extremely rough surface that prevents normal walking
motion. Because of these modifications, the cadence or the walking velocity will become less or
decreased in slippery conditions with a low COF.
The movement of the heel during the initial period of the heel strike phase during normal
dry surface gait has a characteristic pattern, where the heel rapidly decelerates just prior to heel
strike following which the heel moves slightly forward (Perkins, 1978; Strandberg &
Lanshammar, 1981; Redfern et al, 2001, Cham & Redfern, 2001a). At heel strike, the heel has
been shown to have an instantaneous velocity in the forward direction (Perkins, 1978; Strandberg
& Lanshammar, 1981) and some instances in a rearward direction (Cham & Redfern, 2001a),
after which the heel reaches a minimum velocity and comes to a stop, over which the rest of the
foot rolls over completing the midstance. The most hazardous slips often occur shortly after heel
strike (<70-120ms) (Lockhart & Kim, 2006). Heel velocity of 0.5m/s or higher have been shown
to have an increased potential for a slip (Redfern et al, 2001). The time period during heel strike
and 25ms immediately post heel strike have been shown to be more crucial to development of an

25
unrecoverable slip propensity rather than the conditions during heel strike (McGorry et al, 2010).
The relationship between the heel slip distance and peak heel slip velocity was investigated by
Moyer et al, and concluded that peak slip velocities less than 1.0m/s and slip distance less than
100mm were considered to be non-hazardous slips. Whereas, any other situations with a peak
heel velocity of higher than 1.0m/s and slip distance greater than 100mm were considered to be
hazardous in nature (Moyer et al, 2006). The first period of double support during a gait cycle is
considered as a critical time for regaining stability following a slip, and movement of whole
body center of mass relative to the base of support during the period has been shown to have
smaller excursions and a faster velocity to help prevent slip induced falls (You et al, 2001).
ii. Kinetics of Human Gait during Slips:
The ground reaction forces occurring immediately post heel strike is vital in the
prediction of the slips and falls. The first peak in the shear force which occurs at about 19% of
the gait cycle (90-150ms post heel strike) is the crucial time period during which most slips
occur (Redfern, 2001). The highest shear forces occur during the heel contact and push-off
phases of the gait cycle and considered as the points during which the highest incidence for a slip
exists (Redferen, 2001; Redfern & DiPasquale, 1997; Hanson et al, 1999).
26
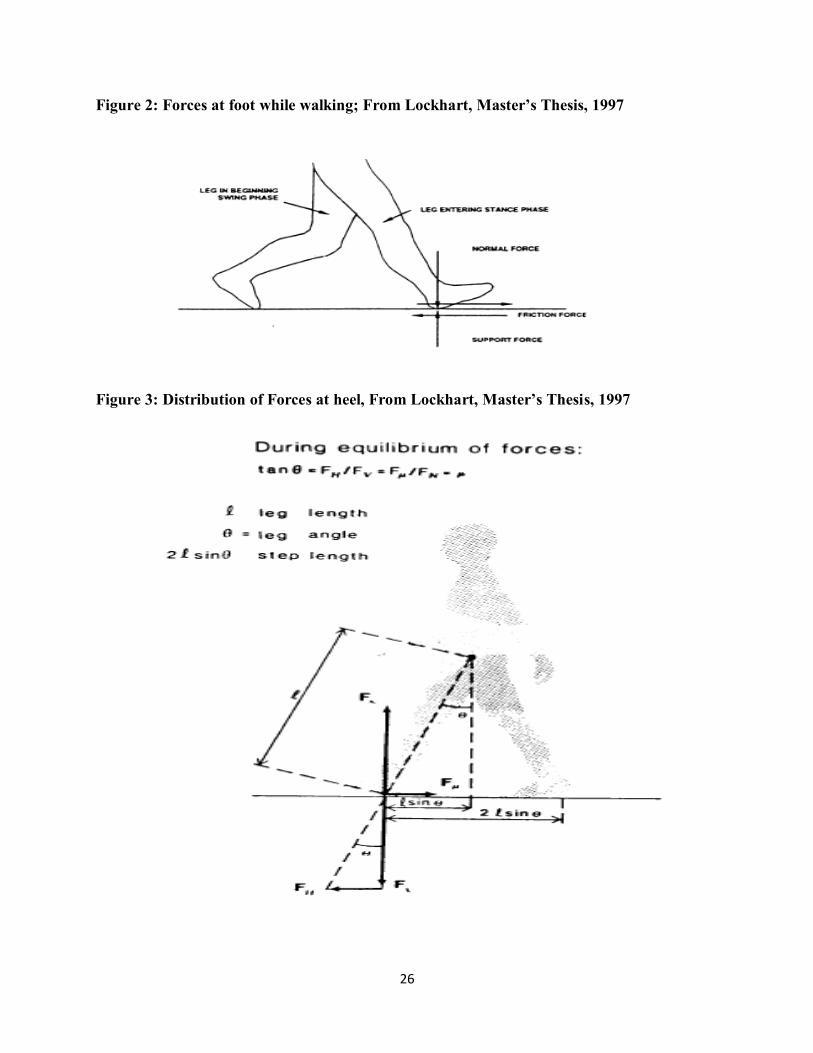
Figure 2: Forces at foot while walking; From Lockhart, Master’s Thesis, 1997
Figure 3: Distribution of Forces at heel, From Lockhart, Master’s Thesis, 1997

27
The ratio of the shear force to the normal force during gait on dry surfaces is termed as
the required coefficient of friction (RCOF) and during locomotion on slippery surfaces; the ratio
of the shear force to the normal force that is available compared to the non-slippery surface is
termed as the available coefficient of friction (ACOF). Hence, slip propensity in an occupational
setting can be determined by comparing the RCOF and ACOF for a particular surface type and a
particular footwear type. If the ACOF is greater than the RCOF, the individual should not slip,
whereas, if the ACOF is lesser than the RCOF, the chances of a slip are increased (Redfern et al.
2001). Six peak forces are identified during a normal gait cycle under dry conditions using the
ratio of the horizontal (FH) to the vertical (FV) ground reaction forces (Perkins, 1978;
Lanshammar and Strandberg, 1981; Redfern, 2001) (Figure 4). The first peak is a forward force
due to the impact of the heel while the second peak is a backward force exerted on the heel after
contact during the early landing phase. The third and the fourth peaks are forward forces which
retards the motion of the foot. And finally the fifth and the sixth peaks are in the backward
direction due to the push-off phase of the gait cycle (Perkins, 1978, Redfern, 2001).
The third and the fourth peaks which are directed forwards (occurring during heel contact
phase) and the fifth and sixth peaks which are directed backwards (occurring during the push-off
phase) are usually assessed for slip propensity with the 3rd and 4th peaks considered more
hazardous than the 5th and 6th, as the forward momentum of the body will continue to apply the
body weight on the slipping foot (Lockhart, 1997; Redfern, 2001) (Figure 4).

28
Figure.4: From Biomechanics of Slips, Redfern et al, 2001.
Recovery from a slip will depend upon the moments generated from the lower extremity
joints in an attempt to bring back the COG within the BOS and thereby prevent a slip induced
fall. Redfern et al., describes that during this protective stepping strategy in response to a slip, the
steady gait pattern is interrupted at the onset of a slip and the protective stepping strategy is left
to attempt and regain balance and equilibrium. Due to this interruption in steady gait and the
protective stepping strategy, large moment deviations are present in comparison to what is
observed during normal dry gait (Redfern et al, 2001). The dominant response seen during a slip
event is an increased knee flexion moment during 25-45% of the stance phase. While the hip
generates an extension moment during the slip, the ankle acts as a passive joint with
uncompleted transfer of body weight to the leading foot.

29
iii. Muscle Activity of Human Gait during Slips:
Reactive and proactive strategies are often described as the balance control mechanisms
of an individual that are required during and for an impending slip event. The former is defined
as the primary corrective response brought about by muscular forces and corrective moments to
re-establish dynamic balance following a slip, while the latter is defined as the balance control
mechanisms that occur prior to an impending slip (Chambers & Cham, 2007).
Muscle activity under slippery conditions have been reported for lower extremity muscles
such as the quadriceps, hamstrings and gastrocnemius-soleus (Lockhart, 2007; Parijat &
Lockhart, 2008; Chambers & Cham, 2007). A longer hamstring activity and a lower quadriceps
activity during the stance phase and longer hamstring activity and decreased quadriceps mean
activity during the swing phase was reported by Lockhart (Lockhart, 2007). Furthermore, lower
mean and peak swing leg gastrocnemius activity was also reported during slippery conditions
(Lockhart, 2007). Similar muscular responses were also seen under slip events when compared
with young and old aged individuals, with a delayed latency from vastus lateralis activity in
severe slips (Chamber & Cham, 2007). An increase in the frictional demand, heel contact
velocity and a reduction in the transitional acceleration of the center of mass of the whole body
has been reported under slippery conditions especially with induced fatigue of the lower
extremity muscles (Parijat & Lockhart, 2008). The muscles of the knee joint are responsible for
producing large moments to help recover from a slip, whereas the muscles of the hip joint play
an important role in stabilization (Parijat & Lockhart, 2008) and during lower extremity fatigue
trials a decreased peak knee moment was reported (Parijat & Lockhart, 2008). All these findings
suggested that slip propensity could increase with fatiguing conditions of the lower extremity
while affecting gait parameters.

30
Muscular activity during an alert or an expected slip resulted in a greater activation of the
lower extremity musculature with the greatest increase in activity reported in the hamstrings and
also with an early activation of the gastrocnemius muscle (Chambers & Cham, 2007). Greater
muscle co-contraction analyzed with the co-contraction index (CCI) using the agonist /
antagonist pairs of the ankle (tibialis anterior and medial gastrocnemius) and at the knee (vastus
lateralis and medial hamstrings) were reported when anticipating a slippery surface and
individuals who walked with a greater co-contraction were predisposed to experience less severe
slips (Chambers & Cham, 2007).

31
EXTRINSIC FACTORS IN THE PREDICTION OF SLIP PROPENSITY
In the event of an impending slip, the gait parameters are adjusted in an attempt to avoid
slipping. However, the extrinsic factors such as the environment, footwear and intrinsic factors
like age, fatigue, obesity can affect the outcome of the slip. During a slip, there is an external
perturbation from the extrinsic factors to the intrinsic postural control systems to recover and
maintain equilibrium. Any failure of the intrinsic system to compensate for the perturbation from
the extrinsic system may potentially lead to a fall. Extrinsic factors contributing to the slips and
trips include a defective support surface which has been shown to cause more than 50% of these
falls (Gauchard, 2001). The wear on the floor, the presence of an obstacle, the presence of a
contaminant or extremes of natural causes such as excessive rain, snow or ice and artificial
causes such as poor lighting, inadequate warning signs also include to the extrinsic factor list
that contribute to falls. Such changes in the ground or the support surface can potentially
destabilize the human postural system, potentially leading to a failure of the postural control
system and ultimately to a fall.
Injuries from slips, trips and falls are the leading cause of absence from work in
occupational settings. Hence, to prevent these injuries and protect their employees, the health and
safety administration for occupational safety (OSHA) and American National Standards Institute
(ANSI) has developed recommendations to provide slip resistant walking surface in the
workplace. OHSA’s general requirements for walking and working surfaces recommend a
coefficient of friction of at least 0.5, to provide a reasonable slip resistance to walking, although
certain activities, such as carrying items, pushing or pulling objects, or walking up on down-
inclined surfaces may require a higher coefficient of friction. In order to achieve this COF

32
irrespective of the type of footwear used, the OSHA suggests modifying the flooring material to
change the COF rather than changing the material itself, especially in wet, oily or dirty work
areas. This is accomplished by creating the slip resistant floors of the same material but with,
serrated, punched or textured to add to its roughness which may increase the COF that is
available in wet, oily slippery occupational working surfaces. There are many ways to test the
slipperiness of the floor which is very commonly done in workplace settings and to make future
recommendations for designing an occupationally safe environment and working surfaces. A few
equipments that help us to do this are, the slip meter - a roller coaster type tribometer, Sigler
pendulum tester, the tortus digital tribometer, the ASTM F609 horizontal pull slip meter and the
ASTM F1678 portable inclinable articulated strut tribomter.
i. Footwear Characteristics in the Prediction of Slip Propensity:
Another vital extrinsic factor; the footwear which forms the interface between the foot
and the ground have been studied extensively in occupational and recreational populations. The
footwear modifications in occupational and alternative footwear have been shown to affect
postural stability and balance (Chander et al, 2013). Different types of footwear affect gait and
posture kinematics adversely. Improper alignment of the foot altered by different footwear leads
to an increased metabolic cost, which in turn leads to a faster rate of development of muscular
fatigue. Many literature and researches have analyzed gait and balance with different gait speeds,
changing terrain, shoe types and in bare foot condition (Perry, Radtke& Goodwin, 2007, Menant
et al, 2008, Divert et al, 2005, Bohm & Hosl, 2010).
Footwear characteristics such as the boot shaft height, mass, mid-sole hardness and
thickness, elevated heels and type of material of the footwear influence balance and gait and

33
ultimately the slip propensity in a slippery condition. Especially, the effect of the shoe sole tread
patterns on slip propensity (Li, Wu and Lin, 2006; Li & Chen, 2005) and the effect of heel height
on slip propensity have been studied previously (Blanchette, Braut & Powers, 2011). The
differences in the coefficient of friction between the footwear type and surface type have been
reported as a prime factor in slip and trip induced falls. Li, Wu and Lin found that the average
coefficient of friction gain per tread groove depth increase in millimeter under slippery
conditions ranged from 0.018 to 0.108 (Li, Wu and Lin, 2006). In addition to this, the same
researchers in a subsequent paper reported that the orientation of the tread groove and its width
also affect the COF significantly. Modifications on the occupational footwear even help prevent
slips and trips in workplace settings by increasing the COF of friction between the sole of the
occupational footwear and the working surface. As such, different materials of the sole of the
footwear and different flooring types have their own advantages and disadvantages.
A majority of the soles of the footwear are made up of rubber to have a high COF safe
enough to prevent slips and low enough to prevent trips. Even when the flooring type is the
same, such as asphalt, it can differ in COF depending upon if the asphalt is dry or wet. Hence,
with a common rubber sole of an occupational footwear, the dynamic or kinetic coefficient of
friction decreases from 0.5-0.8 for dry asphalt to 0.25-0.75 for the same asphalt in wet
conditions. Similar decrements in dynamic COF is seen in dry concrete (rubber on dry concrete =
0.6-0.85) to concrete floors when wet (rubber on wet concrete = 0.45-0.75). Rubber on vinyl
floors are designed to have a minimum of 0.8 dynamic COF to have a safe working surface.
The tread patterns of the shoes affect friction especially under liquid contaminated
surfaces. These new research based design in the tread groove depth, tread groove width and
pattern help in prevention of fall in liquid collected walking surfaces. Li, Wu and Lin found that

34
the average coefficient of friction gain per tread groove depth increase in millimeter under
slippery conditions ranged from 0.018 to 0.108 (Li, Wu and Lin, 2006). In addition to this, the
same researchers in a subsequent paper reported that the orientation of the tread groove and its
width also affect the COF significantly. They reported that wider grooved footwear pads resulted
in a higher COF and the footwear pads with tread grooves perpendicular to the friction
measurement direction had higher COF (Li & Chen, 2005). High heeled shoes have been shown
to use a greater utilized coefficient of friction thereby increasing the friction demand during
walking which were related to an increase in the resultant shear force and a decrease in the
vertical force and thereby increasing the probability of a slip (Blanchette, Braut & Powers,
2011).
Anti-slip footwear is recommended by OSHA and ANSI to prevent slips and falls in
workplace settings, but it is not the sole of the footwear alone that play a role in helping prevent
slips. The comfort and fit or the footwear, the mass of the footwear, other design features such as
shaft height of the footwear and more importantly the relative age and wear of the footwear help
prevent slips in occupational settings. Comparison of similar old versus new boots in fisherman
who work in watery surfaces have been done, with the new boots offering a much better grip to
the fishermen at work. This was performed as a means of promoting and making the fishermen
aware to change their boots as soon as it is worn out.

35
INTRINSIC FACTORS IN THE PREDICTION OF SLIP PROPENSITY
Individual intrinsic factors such as dysfunctions or physiological deficits of the postural
control systems, themselves can contribute to falls. Dysfunction in the visual, vestibular,
somatosensory or the musculoskeletal system and any undue fatigue placed on these systems due
to excessive workload in the occupational environment can potentially lead to falls. The risk of
slips, trips and falls also increases with age, as there is physiological decline in function and
performance of these postural control systems and the ability to walk safely with the center of
mass (COM) within the base of support (BOS) decreases (Lockhart et al. 2005). While 32% of
falls in the young adults were attributable to slips and trips, 67% of falls in the elderly have been
reported due to slips (Lloyd and Stevenson, 1992). A decline in the muscular strength, vision,
vestibular functions, diminished somatosensory and proprioceptive feedback which occurs with
normal aging process and the added detrimental effect of diseases and disorders that affect these
systems make the elderly population a vulnerable target not only for slips, trips and falls but also
for the severity and recovery time of the injuries resulting from these falls. (Lockhart et al, 2002;
Lockhart et al, 2008). The inability to control slipping responses may be the result of sensory
degradation and muscle weakness that is attributable to aging (Lockhart, 2005) with an increased
adaption time to slippery surfaces which was evident in the elderly population (Lockhart et al,
2007) and due to incorrect perceptions of floor slipperiness with uncompensated slip parameters
(Lockhart et al, 2002).
Excessive body weight negatively affects balance, gait and slip parameters.
Biomechanical and physiological rationale for this negative effect include, greater forward
displacement of the center of pressure during dynamic standing activities and walking, an

36
increased forward pelvis tilt and lumbar lordosis, reduced muscle strength with excessive
adipose tissue and the inability to generate adequate muscle force to maintain stability during
static and dynamic conditions (Capodaglio et al, 2012). The impaired ability to maintain balance
during dynamic situations such as the initiation, detection and recovery in slip induced falls can
be attributed to the increased risk of fall associated with obesity (Liu, 2011). On the contrary,
few literatures have shown no differences in slip propensity of obese individuals compared to
normal weight individuals (Pollack &Cheskin, 2007; Wu, Lockhart &Yeoh, 2011) with a greater
step width in obese individual under slippery conditions (Wu, Lockhart &Yeoh, 2011).
Speed of walking and their effect on slip has been addressed previously (McGorry et al,
2010). McGorry found no significant differences in forward slip distance for walking speeds of
1.5 m/s (slow), 1.8m/s (medium) and 2.1m/s (fast) on marginally slippery floors with a COF
ranging from 0.12 to 0.21 (McGorry et al, 2010). But, reported significant differences in
instaneous forward horizontal heel velocity, 30ms after heel strike, with slow walking having
less heel velocity than fast walking (McGorry et al, 2010). Decreased walking speed with
increased stance phase and shorter step length was reported in the elderly under slippery
conditions when compared to the young (Lockhart et al, 2007). Subsequently, decreased
quadriceps activity was seen during slippery conditions in the elderly (Lockhart et al, 2007). The
adaptation to slippery floor conditions was greater in the young population, where they were able
to decrease the quadriceps mean muscle activity within one step, whereas, the older participant’s
activity remained the same for an entire gait cycle (Lockhart et al, 2007).

37
i. Perception of Slipperiness
Subjective perception of the floor slipperiness is based on visual perception and
proprioceptive recognition of maintenance of balance during slip events. External factors like
floor color, size, shape, texture gradient and individual internal factors like visual perception of
the slip hazard, lighting,attentiveness and mental workload can influence the outcome of
perceiving the slipperiness of surface (DiDomenico et al, 2007). Although small undetectable
slips have been shown to occur regularly even during normal gait, the macro slips is usually
perceivable to the individual (Hanson et al, 1999; Strandberg & Lanshammar, 1981). The
perception and anticipation of a slip have been shown to reduce the possibility of a slip with
biomechanical modifications to gait under slippery conditions (Chang et al, 2004; Cham &
Redfern, 2002a). Thus the visual feedback from the visual system and the proprioceptive
feedback from the somatosensory system are critical in determining the outcome of a slip.
However, subjective slipperiness ratings alone may not be sufficient to identify slippery
conditions. They have been used very cautiously as a measure of slipperiness, due to the
underestimation of the surface slipperiness and the variability in the perception of the slips
(DiDomenico et al, 2007). The inconsistencies in subjective responses could be due to the fact
that each slip trial required different postural adjustments and gait patterns based on the sensory
information available and used to accommodate for the slippery surface. Visual and auditory
cues have been shown to override tactile proprioceptive sensations (Cohen and Cohen, 1994;
DiDomenico et al, 2007). The changes in the gait variables in response to the perception of
slippery hazardous conditions include a shorter step / stride length, thereby producing low heel
velocities, smaller shear forces and lower required COF and lower GRFs during heel strike and
push-off phases to reduce the likelihood of a slip.
38
Anticipation of slippery walking trials in comparison to dry normal walking, produced
lower required coefficient of friction, reducing slip potential and failed to return to baseline
normal dry walking values (Cham & Redfern, 2002a). This reduction in the peak RCOFs were
brought about by postural changes and adaptations during the gait cycle, with decreased step
length, low impact GRFs and with significant changes in joint moments (Cham & Redfern,
2002a; Cohen and Cohen, 1994; DiDomenico et al, 2007). Muscular activity during an alert or an
expected slip resulted in a greater activation of the lower extremity musculature with the greatest
increase in activity reported in the hamstrings and also with an early activation of the
gastrocnemius muscle (Chambers & Cham, 2007). Greater muscle co-contraction analyzed with
the co-contraction index (CCI) using the agonist / antagonist pairs of the ankle (tibialis anterior
and medial gastrocnemius) and at the knee (vastus lateralis and medial hamstrings) were reported
when anticipating a slippery surface and individuals who walked with a greater co-contraction
were predisposed to experience less severe slips (Chambers & Cham, 2007).

39
COMPARISON OF ALTERNATIVE FOOTWEAR TO SHOD CONDITIONS IN GAIT
AND SLIP PARAMETERS
The human foot is the first point of contact between the body and the environment or
terrain which is vital in relaying the somatosenroy information to the CNS both during static and
dynamic balance tasks. Furthermore, footwear serves as the interface between the human body
and the supporting surface and can significantly affect the balance outcome measures (Menant et
al. 2008). Efficient transformation of the mechanical power output produced by the
musculoskeletal system through the footwear is responsible for a good performance in gait.
Hence, the design and type of the footwear becomes important in gait and posture (Bohm&Hosl,
2010). Walking bare foot has also been related to an elevated risk of falls. The different features
of the shoe design, such as the heel height, heel-collar height, sole hardness, heel and midsole
geometry and slip resistance of the outer sole have been known to have on the influence on
balance maintenance (Menant et al. 2008). Certain commonly worn footwear, such as slippers
were found to be hazardous as they slowed down reactions to perturbations and also had adverse
effects on posture reactions(Hosoda et al., 1997, Hosoda et al., 1998) even with barefoot walking
shown to lead to an increased risk of falling (Menant et al. 2008).
Different types of footwear affect gait and posture kinematics adversely. Improper
alignment of the foot altered by different footwear leads to an increased metabolic cost, which in
turn leads to a faster rate of development of muscular fatigue. Many literature and researches
have analyzed gait and balance with different gait speeds, changing terrain, shoe types and in
bare foot condition (Perry, Radtke& Goodwin, 2007, Menant, Perry, Steele, Menz,Munro &
Lord, 2008, Divert, Mornieux, Baur, Mayer & Belli, 2005, Bohm&Hosl, 2010).

40
The advent of flip-flops and crocs usage as alternative footwear has increased recently
and can be attributed to its lightweight, comfort and convenience. However, the extrinsic factor
such as the occupational hazardous environments and intrinsic factors such as age and obesity
have negative impacts on gait biomechanics with usage of such alternative footwear. Specifically
the response of these alternative footwear to slip propensity under slippery conditions have not
been fully dealt with yet. Flip-flops and crocs are open type footwear including a relatively flat
sole very loosely held on the foot by a “Y” shaped strap in the case of a flip flop and by an
encased covering on the entire fore foot in the case of a croc. The crocs have a few advantages
over the flip-flops, by having a base section that includes an upper and a sole. If the sole of these
crocs are made of high coefficient of friction materials with tread patterns, it may offer a reduced
risk for slips compared to flip flops which have flat and soft soles. The crocs also have the
advantage of being water proof and breathable footwear allowing for ventilation.
Unlike other shod conditions, these alternative footwear do not secure the hind foot, heel
and the ankle joint of the lower extremity. The movement of the entire foot and the footwear as
one rigid segment seen in close fitting athletic shod conditions is not present in alternative
footwear. As a result the interlinked point of contact of these alternative footwear and foot is
accomplished only by the toes for flip flops and the forefoot for crocs. Hence, gait kinematics are
negatively affected by these modifications in the footwear-foot interface. A reduced gait speed,
decreased step and stride length, lowered double support time and over all reduced stance phase
was seen in flip-flops compared to close fitting athletic shoes (McGinely et al, 2010). Although
there is an increased use of these alternative footwear for its comfort and convenience, a
decreased gait performance is evident when compared to close fitting shoes, and pose an
increased threat and risk for slips and falls.

41
Temporal and spatial parameters of gait are quite commonly reported for alternative
footwear in comparison with athletic shod conditions. A decreased stance phase-increase swing
phase, decreased step-stride lengths and decreased period of double support are seen with
alternative footwear (Shroyer& Weimer, 2010; Majumdar et al. 2006; McGinely et al. 2010).
Differences in ground reaction forces for flip flops are still debatable, while Zhang et al showed
no significant differences in ground reaction forces, Carl et al, showed increased forces
compared to athletic shoes explaining the decreased shock attenuating capabilities of the
alternative footwear, which could potentially lead to pathologic abnormalities in the foot (Zhang
et al, 2012; Carl et al. 2008).
Extensive literature on kinematic gait analyses of barefoot and shod conditions
during dry normal surface exists, which have focused on alternative open-toed footwear such as
the flip-flops and slip-on footwear in comparison to close-toed shod conditions such as the
athletic shoes or any shod condition that has a concealed foot with cushioning properties.
Significant differences in gait kinematics in the alternative footwear included a shorter step-
stride length (Shoryer et al. 2010a; Shoryer et al. 2010b; Carl et al. 2008; Majumdar et al. 2006)
and a lesser dorsiflexion/ more plantar flexion angle at heel strike and during swing phase
(Zhang et al. 2013; Menant et al. 2009). Flip flops and sandals have been shown to utilize a more
flatter foot at contact when there is minimal cushioning (Zhang et al. 2013) and also during
swing phase to hold the open-toed footwear in position during swing phase by gripping the
footwear using the toes (Shroyer et al. 2010), while close-toed shod conditions have a longer
step-stride lengths and greater dorsiflexion angles. Contrarily and more recently, increased
dorsiflexion angle have been reported at heel contact, suggesting a mechanism to retain the thong
flip flops during weight acceptance (Chard et al. 2013). Ground Reaction Forces (GRF) in

42
alternative footwear such as flip-flops, open-toed shoes and other shod conditions have been
debatable as well. Lower peak propulsive GRF and smaller loading rate of 1st peak vertical GRF
were reported in shoes compared to barefoot, sandals and flip-flops (Zhang et al. 2013) and
reduced peak vertical ground reaction force was reported in shoes compared to barefoot (Yan et
al. 2012). Contrarily, in another study, flip flops were found to have the highest GRFs compared
to barefoot walking (Shakoor et al. 2010). Subsequently, the muscle activity of the dorsi-flexors
and intrinsic muscles of the foot can be expected to be increased during the swing and stance
phases of the gait cycle. This increased muscle activity with alternative footwear can be
detrimental especially in slippery conditions. Moreover, the somatosensory feedback mechanism
might play an extremely important role in slip propensity. In the case of a shod condition which
attaches to the entire foot, there is increased somatosensory information from the entire sole of
the feet. However, in the case of a flip-flop, the only point of contact between the footwear and
the foot is the 1st web space between the great toe and the 2nd digit. Thus, the unique foot angle in
early stance, increased muscle activity, decreased stride lengths and the limited availability of
somatosensory feedback from the feet may potentially influence slip propensity in alternative
footwear.

43
LIST OF REFERENCES

44
1. Asaka, T., Saito, H., Yoshida, N., Urakami, D., Kamada, K., & Fukushima, J. (2002).
Relationship between the Required Coefficient of Friction and Gait Initiation in Young
Adults on a Low Friction Floor. Journal of Physical Therapy Science, 14(1), 33-39.
2. Aschan, C., Hirvonen, M., Rajamäki, E., &Mannelin, T. (2005). Slip resistance of oil
resistant and non-oil resistant footwear outsoles in winter conditions. Safety science,
43(7), 373-389.
3. Blanchette, M. G., Brault, J. R., & Powers, C. M. (2011). The influence of heel height on
utilized coefficient of friction during walking. Gait & Posture, 34(1), 107-110.
4. Boakes, J. L., & Rab, G. T. (2006). Muscle activity during walking. Human Walking.
Lippincott Williams and Wilkins, Baltimore.
5. Bohm, H, &Hosl, M. (2010). Effect of boot shaft stiffness on stability joint energy and
muscular co-contraction during walking on uneven surface. Journal of Biomechanics, 43
(2010), 2467–2472.
6. Brady, R. A., J Pavol, M., Owings, T. M., & Grabiner, M. D. (2000). Foot displacement
but not velocity predicts the outcome of a slip induced in young subjects while walking.
Journal of biomechanics, 33(7), 803-808.
7. Bureau of Labor Statistics, 2011. Incidence Rates of Nonfatal Occupational Injuries and
Illness by Industry and Case Types. US Department of Labor.
8. Capodaglio, P., Cimolin, V., Tacchini, E., Parisio, C., &Galli, M. (2012). Balance control
and balance recovery in obesity. Current Obesity Reports, 1(3), 166-173.
9. Carl, T. J., & Barrett, S. L. (2008). Computerized analysis of plantar pressure variation in
flip-flops, athletic shoes, and bare feet. Journal of the American Podiatric Medical
Association, 98(5), 374-378.

45
10. Chander, H, Garner JC & Wade, C. (2014). Impact on balance while walking in
occupational footwear. Footwear Science.
11. Cham, R., Redfern, M.S., (2002a). Changes in gait when anticipating slippery floors. Gait
Posture 15, 159–171.
12. Cham, R., Redfern, M.S., (2002b). Heel contact dynamics during slip events on level and
inclined surfaces. Safety Sci. 40, 559–576.
13. Chambers, A. J., & Cham, R. (2007). Slip-related muscle activation patterns in the stance
leg during walking. Gait & posture, 25(4), 565-572.
14. Chambers, A.J., Margerum, S., Redfern, M.S., Cham, R., 2002/2003. Kinematics of the
foot during slips. Occup. Ergon. 3, 225–234.
15. Chang, W.R., Li, K.W., Huang, Y.-H., Filiaggi, A., Courtney, T.K., (2004) .Assessing
floor slipperiness in fast-food restaurants in Taiwan using objective and subjective
measures. Appl. Ergon. 35, 401–408.
16. Cohen, H.H., Cohen, D.M., (1994a). Psychophysical assessment of theperceived
slipperiness of floor tile surfaces in a laboratory setting. J.Safety Res. 25 (1), 19–26.
17. Cohen, H.H., Cohen, D.M., (1994b). Perceptions of walking surface slipperiness under
realistic conditions, utilizing a slipperiness rating scale. J. Safety Res. 25 (1), 27–31.
18. Cooper, J. M., &Glassow, R.B., 1963, Kinesiology. New York: Mosby Company, 140-
175.
19. Courtney, T. K., Sorock, G. S., Manning, D. P., Collins, J. W. and Holbein-Jenny, M. A.
(2001a). Occupational slip, trip, and fall-related injuriescan the contribution of
slipperiness be isolated? Ergonomics, 44, 1118- 1137.

46
20. Courtney, T. K., & Webster, B. S. (2001b). Antecedent factors and disabling
occupational morbidity—insights from the new BLS data. AIHAJ-American Industrial
Hygiene Association, 62(5), 622-632.
21. Davis, P. R. (1983). Human factors contributing to slips, trips and falls. Ergonomics,
26(1), 51-59.
22. DiDomenico, A., McGorry, R. W., & Chang, C. C. (2007). Association of subjective
ratings of slipperiness to heel displacement following contact with the floor. Applied
ergonomics, 38(5), 533-539
23. Divert, C., Mornieux, G., Baur, H., Mayer, H., Belli, A. (2005). Mechanical Comparison
of Barefoot and Shod Running. International journal of Sports Medicine: 26, 593 – 598.
24. Dong, X. S., Wang, X., &Daw, C. (2012). Fatal falls among older construction workers.
Human Factors: The Journal of the Human Factors and Ergonomics Society, 54(3), 303-
315.
25. Dutil, M., Handrigan, G. A., Corbeil, P., Cantin, V., Simoneau, M., Teasdale, N., & Hue,
O. (2012). The impact of obesity on balance control in community-dwelling older
women. Age, 1-8.
26. Gauchard, G., Chau, N., Mur, J. M., & Perrin, P. (2001). Falls and working individuals:
role of extrinsic and intrinsic factors. Ergonomics, 44(14), 1330-1339.
27. Gronqvist, R., Abeysekera, J., Gard, G., Hsiang, S.M., Leamon, T.B., Newman, D.J.,
Gielo-Perczak, K., Lockhart, T.E., Pai, C.Y.-C., 2001. Human-centred approaches in
slipperiness measurement. Ergonomics. 44 (13), 1167–1199.

47
28. Hosoda M, Yoshimura O, Takayanagi K, Kobayashi R, Minematsu A, Nakayama A,
Ishibashi T, Wilson C (1997). The effect of various footwear types and materials, and of
fixing of the ankles by footwear on upright posture control. J phystherSci 9, 47-51.
29. Hosoda, M, Yoshimura O, Takayanagi, K, Kobayashi R, Minematsu, A, Sasaki, H,
Maejima, H, Matsuda, Y, Araki S, Nakayama, A, Ishibashi, T, Terazono, T (1998). The
effect of footwear on standing posture control. J. Phys. Ther. Sci, 10. 47-51.
30. Hanson, J. P., Redfern, M. S., &Mazumdar, M. (1999). Predicting slips and falls
considering required and available friction. Ergonomics, 42(12), 1619-1633.
31. Hitcho, E. B., Krauss, M. J., Birge, S., Claiborne Dunagan, W., Fischer, I., Johnson, S., &
Fraser, V. J. (2004). Characteristics and circumstances of falls in a hospital setting.
Journal of General Internal Medicine, 19(7), 732-739.
32. Jensen, O. C., &Laursen, L. H. (2011). Reduction of slips, trips and falls and better
comfort by using new anti-slipping boots in fishing. International journal of injury
control and safety promotion, 18(1), 85-87.
33. Kemmlert, K., &Lundholm, L. (1998). Slips, trips and falls in different work groups with
reference to age. Safety Science, 28(1), 59-75.
34. Kim, S., Lockhart, T., & Yoon, H. Y. (2005). Relationship between age-related gait
adaptations and required coefficient of friction. Safety science, 43(7), 425-436.
35. Kincl,L.D., Bhattacharya,A., Succop,P. A., and Clark, C. S. (2002). Postural Sway
Measurements: A Potential Safety Monitoring Technique for Workers Wearing Personal
Protective Equipment. Applied Occupational and Environmental Hygiene 17 (4), 256-
266.

48
36. Lanshammar, H and Strandberg, L. 1981, Horizontal floor reactions and heel
movementsduring the initial stance phase, Eighth International Congress of
Biomechanics, Nagoya, Japan.
37. Lamoreaux LW: Kinematic measurements in thestudy of human walking. Prosthet Res
69:3, 1971.
38. Leamon, T. B., & Murphy, P. L. (1995). Occupational slips and falls: more than a trivial
problem. Ergonomics, 38(3), 487-498.
39. Li, K.W. (1995). A biomechanical study of slipping accidents with load carriage, Ph. D.
Dissertation, Texas Tech University, Lubbock, Texas.
40. Li, K. W., & Chen, C. J. (2005). Effects of tread groove orientation and width of the
footwear pads on measured friction coefficients. Safety science, 43(7), 391-405.
41. Li, K.W., Chang, W.-R., Leamon, T., Chen, C.J., (2004). Floor slipperiness
measurement: friction coefficient, roughness of floors, and subjective perception under
spillage conditions. Safety Sci. 42, 547–565.
42. Li, K. W., Wu, H. H., & Lin, Y. C. (2006). The effect of shoe sole tread groove depth on
the friction coefficient with different tread groove widths, floors and contaminants.
Applied ergonomics, 37(6), 743-748.
43. Lin D, Seol H, Nussbaum M, Madigan M (2008). Reliability of COP- based postural
sway measures and age-related differences. Gait and posture 28, 337-342
44. Liu, J. (2010). Effect of Excessive Adiposity on Risk of Slipping and Postural Stability.
Research and Practice for Fall Injury Control in the Workplace, 81.

49
45. Lloyd, D.G. and Stevenson,M.G., 1992, Investigation of floor surface profile
characteristics that will reduce the incidence of slips and falls. Mechanical Engineering
Transactions Institution of Engineers – Australia, ME17, 99–105.
46. Lockhart, T. E. (1997). Biomechanics of slips and falls in the elderly. Master’s Thesis
submitted to the Texas Tech University.
47. Lockhart, T. E. (2008). An integrated approach towards identifying age-related
mechanisms of slip initiated falls. Journal of Electromyography and Kinesiology, 18(2),
205-217.
48. Lockhart, T. E., & Kim, S. (2006). Relationship between hamstring activation rate and
heel contact velocity: factors influencing age-related slip-induced falls. Gait & posture,
24(1), 23-34.
49. Lockhart, T. E., Smith, J. L., &Woldstad, J. C. (2005). Effects of aging on the
biomechanics of slips and falls. Human Factors: The Journal of the Human Factors and
Ergonomics Society, 47(4), 708-729.
50. Lockhart, T. E., Smith, J. L., Woldstad, J. C., & Li, P. (2000). Effects of musculoskeletal
and sensory degradation due to aging on the biomechanics of slips and falls. In
Proceedings of the Human Factors and Ergonomics Society Annual Meeting (Vol. 44,
No. 29, pp. 5-83). SAGE Publications.
51. Lockhart, T. E., Spaulding, J. M., & Park, S. H. (2007). Age-related slip avoidance
strategy while walking over a known slippery floor surface. Gait & posture, 26(1), 142-
149.

50
52. Lockhart, T. E., Woldstad, J. C., Smith, J. L., & Ramsey, J. D. (2002). Effects of age
related sensory degradation on perception of floor slipperiness and associated slip
parameters. Safety science, 40(7), 689-703.
53. Majumdar, Dhurjati., Banerjee, P. K., Majumdar, D., Pal, M., Kumar, R. A. K. E. S. H.,
&Selvamurthy, W. (2006). Temporal spatial parameters of gait with barefoot, bathroom
slippers and military boots. Indian journal of physiology and pharmacology, 50(1), 33.
54. Maki, B, Perry, S, Scovil, C, Peters, A, McKay, S, Lee, T, Corbeil, P, Fernie, G, McIlroy,
W (2008). Interventions to Promote More Effective Balance-Recovery Reactions in
Industrial Settings: New Perspectives on Footwear and Handrails. Industrial Health 2008,
46, 40–5.
55. McGorry, R. W., DiDomenico, A., & Chang, C. C. (2010). The anatomy of a slip:
Kinetic and kinematic characteristics of slip and non-slip matched trials. Applied
ergonomics, 41(1), 41-46.
56. Menant, J, Perry, S, Steele, J, Menz, H,Munro, B, Lord, S (2008). Effects of Shoe
Characteristics on Dynamic Stability When Walking on Even and Uneven Surfaces in
Young and Older People. Arch Phys Med Rehabil; 89, 1970-6.
57. Moyer, B. E., Chambers, A. J., Redfern, M. S., & Cham, R. (2006). Gait parameters as
predictors of slip severity in younger and older adults. Ergonomics, 49(4), 329-343.
58. Ng, H., McGinley, J. L., Jolley, D., Morris, M., Workman, B., & Srikanth, V. (2010).
Effects of footwear on gait and balance in people recovering from stroke. Age and
ageing, 39(4), 507-510.
59. Parijat, P., & Lockhart, T. E. (2008). Effects of quadriceps fatigue on the biomechanics
of gait and slip propensity. Gait & posture, 28(4), 568-573.

51
60. Perkins, P. J. 1978, Measurement of slip between the shoe and ground during walking, in
Walkway Surfaces: Measurement of Slip Resistance, ASTM STP 649, Philadelphia, PA.
61. Perry S, Radtke A, Goodwin C (2007). Influence of footwear midsole material hardness
on dynamic balance control during unexpected gait termination. Gait and posture 25, 94-
98.
62. Pollack, K. M., &Cheskin, L. J. (2007). Obesity and workplace traumatic injury: does the
science support the link?.Injury prevention, 13(5), 297-302.
63. Redfern, M. S., Cham, R., Gielo-Perczak, K., Grönqvist, R., Hirvonen, M., Lanshammar,
H.,& Powers, C. (2001). Biomechanics of slips. Ergonomics, 44(13), 1138-1166.
64. Redfern, M.S., &DiPasquale, J. (1997). Biomechanics of descending ramps. Gait &
Posture, 6(2), 119-125.
65. Shroyer JF, Shroyer JE, Sumner AM, Weimar WH: Effect of various thong flip-flops on
pronation and eversion during midstance. Med Sci Sport Exer. 2010, 42:270.
66. Shroyer, J. F., & Weimar, W. H. (2010). Comparative analysis of human gait while
wearing thong-style flip-flops versus sneakers. Journal of the American Podiatric
Medical Association, 100(4), 251-257.
67. Soames, R. W. (1985). Foot pressure patterns during gait. Journal of biomedical
engineering, 7(2), 120-126.
68. Strandberg, L., 1983. On accident analysis and slip-resistance measurement. Ergonomics
26 (1), 11–32.
69. Strandberg, L., 1985. The effect of conditions underfoot on falling and overexertion
accidents. Ergonomics 28 (1), 131–147.

52
70. Strandberg, L. and Lanshammar, H. (1981). The dynamics of slipping accidents, Journal
of Occupational Accidents, 3, 153-162.
71. Steindler, A., 1977, Kinesiology. Springfield, DL: Charles C. Thomas Publisher.
72. Tsai, Y. J., & Powers, C. M. (2008). The Influence of Footwear Sole Hardness on Slip
Initiation in Young Adults*. Journal of forensic sciences, 53(4), 884-888.
73. US Department of Labor, Bureau of Labor Statistics 2011, National Census of
FatalOccupational Injuries, 2011.
74. US Department of Labor, Bureau of Labor Statistics 2011, Lost-work time Injuries and
Illnesses: Characteristics and Resulting Time Away from Work, 2011.
75. Winter, D. A. (1991). Biomechanics and motor control of human gait: normal, elderly
and pathological.
76. Winter, D. A. (1995). Human balance and posture control during standing and walking.
Gait & posture, 3(4), 193-214.
77. Winter DA, Eng JJ, Isshac MG: A review of kinetic parameters in human walking. In
Craik RL, OtisCA (eds): Gait Analysis: Theory and Application.St. Louis, Mosby–Year
Book, 1994.
78. Wu, X., Lockhart, T. E., &Yeoh, H. T. (2012). Effects of obesity on slip-induced fall
risks among young male adults. Journal of biomechanics, 45(6), 1042-1047.
79. You, J. Y., Chou, Y. L., Lin, C. J., & Su, F. C. (2001). Effect of slip on movement of
body center of mass relative to base of support. Clinical Biomechanics, 16(2), 167-173.
80. Zhang X, Paquette MR & Zhang S: A comparison of gait biomechanics of flip-flops,
sandals, barefoot and shoes. Journal of Foot and Ankle Research. 2013, 6:45.

53
CHAPTER III
MANUSCRIPTS

54
MANUSCRIPT I
HEEL CONTACT DYNAMICS IN ALTERNATIVE FOOTWEAR
DURING SLIP EVENTS

55
1. Introduction:
Injuries in and around the workplace pose a significant burden to the health of human
beings as well as to the financial or economic losses to both the individual and the occupational
organizations. Slips, trips and an induced loss of balance have been identified as the major
causative factor for workplace injuries involving falls (Courtney et al, 2001a; Courtney et al.
2001b; Redfern et al, 2001) and pedestrian accidents in the walkway have been identified as the
second largest generator of unintentional workplace fatalities (Leamon & Murphy, 1995). The
Bureau of Labor Statistics reported 15% of a total of 4,693 workplace fatalities and a total of
299,090 cases of non-fatal workplace injuries that were due to slips, trips and falls (BLS, 2011).
The annual cost of workplace injuries due to slips, trips and falls in the United States was
estimated to be over 6 billion US dollars with an expected cost of $43.8 billion by 2020
(Courtney et al, 2001).
Slips, trips and falls occur as a result of failure of normal locomotion and failure of
attempts at equilibrium recovery following an induced imbalance (Davis, 1983; Gauchard,
2001). These slips, trips and falls can be induced by extrinsic-environmental factors or by failure
of the intrinsic-human factors. Included among the extrinsic-environmental factors are the
physical characteristics of the floor or ground surface such as the type, smoothness or roughness
of the surface, compliance of the surface and the presence and absence of contaminants or
obstacles (Redfern et al, 2001; Gauchard 2001). Another vital extrinsic factor in the prediction of
slips, is the type of footwear used and its interaction with the floor in the footwear-floor
interface. Footwear design features that have been shown to enhance sensory input or mechanical
stability of the foot and the ankle and thereby ultimately improving balance and gait mechanisms
include a hard sole, elevated boot-shaft or a high-collar (Chander et al. 2014; Perry, Radtke &

56
Goodwin 2007). However, footwear design features that include soft soles and elevated heels
have been shown to have lowered balance and gait performance (Menant et al. 2008; Divert et al.
2005; Bohm & Hosl, 2010). And, footwear with greater tread grooves have been shown to be
slip-resistant and prevent slips and slip induced falls under slippery flooring conditions (Li &
Chen 2005; Li, Wu & Lin 2006). The intrinsic or human factors constitute the human postural
control system which is a complex sensorimotor function with afferent information from the
visual, somatosensory and vestibular system along with central integration of these afferent
stimulus and specific motor responses (Gauchard, 2001; Redfern et al, 2001; Hanson, Redfern &
Mazumdar, 1999) which are also affected by aging, anthropometric features, gait speed,
muscular fatigue and disorders of the musculoskeletal system. A crucial intrinsic factor in the
prediction of slips, is the subjective perception and prior knowledge of the slippery flooring
conditions. Anticipation of the slippery conditions, including attentiveness or alertness and
mental workload can influence the outcome of slip events (DiDomenico et al, 2007). The
perception and anticipation of a slip have been shown to reduce the possibility of slips and slip
induced falls with biomechanical modifications to gait under slippery conditions (Chang et al,
2004; Cham & Redfern, 2002a).
Human gait is invariably affected by the coefficient of friction (COF) that exist when two
surfaces come in contact, such as the sole of the footwear and floor at the footwear-floor
interface. If the available COF at the footwear-floor interface is greater than the required COF
for normal safe walking, the individual should not slip. However, if the available COF is lower
than the required COF for normal safe walking, the slip propensity increases. The movement of
the heel during the initial period of the heel strike phase has been analyzed and used as predictors
of slip events. During normal dry surface gait, the heel movement has a characteristic pattern,

57
where the heel rapidly decelerates just prior to heel strike following which the heel moves
slightly forward (Perkins, 1978; Strandberg & Lanshammar, 1981; Redfern et al, 2001, Cham &
Redfern, 2001a). At heel strike, the heel has been shown to have an instantaneous velocity in the
forward direction (Perkins, 1978; Strandberg & Lanshammar, 1981) and some instances in a
rearward direction (Cham & Redfern, 2001a), after which the heel reaches a minimum velocity
and comes to a stop, over which the rest of the foot rolls over completing the midstance. The
time period during heel strike and 25ms immediately post heel strike have been shown to be
more crucial to development of an unrecoverable slip (McGorry et al, 2010) and the most
hazardous slips often occur shortly after heel strike (<70-120ms) (Lockhart & Kim, 2006).
The heel slip distance and heel slip velocity of the heel motion following heel strike in a
gait cycle have been used to characterize slip types (Redfern et al, 2001). Micro-slips are
characterized by heel slip distance of 1cm-3cm and are not perceived by the individuals and
easily compensated for by the automatic postural system. Macro-slips are characterized by the
slip distances between 3cm-10cm, which will result in a loss of balance may or not result in fall,
while slip distances greater than 10cm are most likely to result a fall due to the failure of the
automatic postural system (Perkins 1978, Stranberg and Lanshammar, 1981, Redfern et al, 2001;
Redfern and Cham, 2001a) and heel velocities of 0.5 m/s or higher have been shown to have an
increased potential for a slip (Redfern et al, 2001). However, other research suggests that these
values maybe too conservative (Brady et al. 2000), and only even greater slip distances and slip
velocities are more likely to result in slip induced falls (Lockhart et al. 2006; Moyer et al. 2006).
In other studies, Cham & Redfern demonstrated slip induced falls when the slip distances were
equal or greater than 10 cm and when slip velocities were equal or greater than 0.8 m/s (Cham &

58
Redfern, 2002b) and Moyer et al. demonstrated slip induced falls with slip distances greater than
10 cm and slip velocities greater than 1 m/s (Moyer et al. 2006).
Preventing and reducing slips and slip induced fall accidents have been an important
aspect of ergonomics research and have focused on slip-resistant properties of the footwear-floor
interface. Footwear modifications including slip resistant soles have been mandated in
occupational footwear by the Occupational Safety and Health Administration (OSHA)
regulations and American National Standards Instruments (ANSI). However, the impact of
alternative or casual footwear such as flip-flops and crocs which are commonly used among
pedestrians and few of the occupational environments such as a hospital settings, under slippery
conditions have not been analyzed yet. Furthermore, usage of flip-flops and crocs in and around
the workplace as an alternative footwear due to its comfort and easy donning has grown in the
recent years, further emphasizing the need to address the effect of these footwear on slip events.
Balance and gait mechanisms during normal locomotion and under slippery conditions
have been studied extensively (Winter, 1991; Winter, 1995; Redfern et al, 2001) and
consequently, there have been several studies that focus on the biomechanics of slips, trips and
falls which are the primary causative factors for fall and fall related injuries in pedestrian
population and especially in occupational environments, where there is a greater incidence of
slips due to the environmental occupational hazards (Redfern et al, 2001; McGorry et al, 2010;
Cham & Redfern, 2002a; Cham and Redfern, 2002b; Hanson et al, 1999; Perkins, 1978;
Standberg & Lanshammar, 1981). The effect of different footwear, different flooring conditions
and the footwear-floor interactions on the biomechanics of gait and balance have also been
identified (Li, Wu and Lin, 2006; Shroyer & Weimer, 2010; Perry, Radtke & Goodwin, 2007,
Menant, et al. 2008, Divert et al. 2005, Bohm & Hosl, 2010). While extensive literature exists on

59
biomechanics of balance, gait and slips and the influence of footwear on these, there is still dearth
of literature on the effect of much commonly used alternative footwear on the biomechanics of
gait and slips. Hence, the purpose of the study is to analyze the effects of alternative footwear
[crocs with clogs (CC), thong style flip-flops (FF) and slip resistant low-top shoe (LT)] on the slip
parameters of heel slip distance and heel slip velocity during dry normal gait (NG), unexpected
slip (US), alert slip (AS) and expected slip (ES). We hypothesized that the kinematic slip
parameters will be greater in alternative footwear crocs and flip flops (CC & FF) compared to an
industry standard low top slip resistant shoe (LT), leading to a greater potential for slips and slip
induced falls. We also hypothesized that the slip parameters will be greater during an unexpected
slip event compared to normal dry surface gait, alert and expected slip.
2. Methodology:
The purpose of the study was to examine the heel dynamics using kinematic measures
during the stance phase of the gait cycle, more specifically during the first 120 ms following heel
strike, which has been shown to be the time period during which the most hazardous slips occur.
The heel contact dynamics was compared with three alternative footwear [Crocs with clogs (CC),
Flip-Flops (FF) & Low Top Slip Resistant Shoe (LT)] under four gait conditions [(Normal Dry
Gait (NG), Unexpected Slip (US), Alert Slip (AS) & Expected Slip (ES)] using a within subjects
repeated measures design.
2.1. Participants:
Eighteen healthy male participants [Age: 22.28 ± 2.2 years; Height: 177.66 ± 6.9 cm;
Mass: 79.27 ± 7.6 kg] completed the study. Participants who had any history of musculoskeletal
injuries, cardio-vascular abnormalities, neurological disorders, vestibular disorders, under
medications or any inability to walk and stand without support were excluded from the study. All

60
participants were recruited through flyers approved by the University’s Institutional Review
Board (IRB). All participants read and signed the informed consent and also filled out the
physical activity readiness questionnaire (PAR-Q) to rule out any of the above mentioned health
complications and cleared for participation in the study.
2.2. Instrumentation:
2.2.1. 3D Motion Capture:
Vicon Nexus (Oxford, UK) 3D motion capture system with 12 infra-red T-series cameras
was used to collect and analyze kinematic gait data. A lower body plug-in gait model from the
Helen-Hayes marker system was used as for the participant configuration model. The motion
capture system was calibrated every day prior to data collection and the kinematic data was
sampled at 100Hz and collected using the Vicon Nexus software. Of the 12 infra-red cameras,
eight were mounted on the walls to create a larger capture volume and the remaining four
cameras were placed on tripods and positioned in close proximity to the walking pathway
focusing on the lower extremity and foot segment.
2.2.2. Fall Arrest System:
A uni-track fall arrest system from Rigid Lines (Millington, TN); a lightweight horizontal
rigid fall arrest track capable of supporting up to 900lb and installed with an inverted-U steel
frame fixed to the laboratory floor was used as the safety fall arrest system to prevent any
undesired falls. Participants were attached to the fall arrest track with the help of a back pack
type harness system attaching to a moveable trolley inside the fall arrest track. The trolley was
capable of locking itself without moving if there was greater than 50lb force imparted on the
harness line. The fall arrest track and the harness along with the trolley were connected by a
pulley system that allowed the investigators to move the trolley on top of the walking participant

61
so that, the participants were not leading the trolley now was the trolley leading the participant.
This was done to take away the closed kinematic chain between the participant and the fall arrest
system and to minimize the impact of the harness and fall arrest system on the outcome of the
slip events.
2.2.3. Slippery Agent or Contaminant:
Industrial vegetable based glycerol mixed with water in the ratio of 75% glycerol and
25% water was used as the slippery agent. The 75%-25% ratio was chosen for the study based on
previous literature and with initial practice sessions in the laboratory prior to starting data
collection. During the slip gait trials or slip events, glycerol was applied and evenly distributed
on the Bertec force plate, on which the left leg of all participants, irrespective of their dominant
extremity, would make contact during the gait trials. The application of the slippery agent was
always performed by the primary investigator using the same measured and calibrated container
to minimize the errors due to inter and intra rater reliability.
2.3. Experimental Procedures:
All participants visited the Applied Biomechanics Laboratory four times, separated by a
minimum of 24 hours. A description of the experimental procedures for each visit is provided
below.
2.3.1. Day 1:
The first visit was treated as a familiarization day, where all participants were exposed to
the testing measures for gait trials and muscle activity. Informed consent was obtained from all
participants following which they completed a physical activity readiness questionnaire (PAR-Q)
and screened for any complications that might hinder them from completing the study.
Anthropometric measurements such as height, weight, leg length, knee width, ankle width and

62
foot/shoe size. Following this, participants were briefed on the walking gait conditions and were
allowed to practice walking at their self-selected pace across the lab walkway. Participants were
encouraged to walk at the same pace for every trial and their starting points were adjusted by the
investigators to make sure there is clean contact with the dual force plates positioned in the
middle of the walkway across the lab floor. Next the participants were positioned and strapped
inside the harness connecting to the trolley and ultimately to the fall arrest track. Participants also
performed the same practice gait trials with the harness while the investigators moved the trolley
in-sequence along with the participant. A number of practice gait trials were performed until the
subjects walked normally and with the same speed. Finally, the participants were assured of the
fall arrest system catching them in the case of an undue fall, initiated by the slip. Participants
were also asked to let go of their body weight and drop down on the harness system to further
ensure that the fall arrest system would support their entire body weight and catch them
preventing them hitting the floor, in the case of a slip. All participants were also asked to refrain
from any physical workload especially to their lower extremities in terms of resistance or aerobic
training and were also asked to avoid any pain medications until all their testing days were
completed.
2.3.2. Day 2, Day 3 and Day 4:
Visits 2, 3 and 4 were again separated by a minimum of 24 hours and treated as
experimental testing days. These experimental testing days followed the same testing protocol
except with different alternative footwear (CC, FF & LT) which were chosen and provided to the
participant using a counter balance design to remove order effects.

63
2.3.2.1. Participant Preparation:
Each visit will start the experimental testing day with a counter balanced allotment of the
either the CC, FF or LT to the participants. Participants were also be provided black spandex
shorts and t-shirts. Reflective markers were placed on the participant’s lower extremity and on
the footwear following a lower body plug-in gait model from the Helen-Hayes system.
2.3.2.2. Experimental Testing:
The experimental testing session began with the participant wearing the footwear given to
them and had a series of practice gait trials across the vinyl floored testing surface under dry non
slip conditions to get accustomed with the gait trials and the testing environment at a self-
selected speed of walking. These practice gait trials were also used to make sure that the
participants strike the center of the force plate with both their feet, unintentionally at their normal
walking pattern and pace and to avoid any intentional modification of their step lengths during
the data collection procedure.
Following the initial practice gait trials, the participants were strapped in the harness
system to the fall arrest track and a static capture of the lower body plug-in model was
performed. With the completion of the static capture, the participants again started a series of
practice gait trials with the harness fall arrest system and the trolley being moved in-sequence
with the participant. Practice trials were performed until the participants walked with ease in a
similar pattern and with similar walking speed. Dynamic capture was done for 5 normal dry gait
trials with no breaks or stops between the gait trials with the instruction “walk as normally as
possible with the same speed”. With the completion of the 5th normal dry gait trial, participants
still walked with the same pattern and speed, but at the end of all further gait trials, the
participants took 30-45 second breaks facing away from the walking surface and listened to

64
music played on a noise-cancellation headphones, which would take away the knowledge of the
potential slip trial, again with the same walking instructions.
Following a repeated number of gait trials under normal dry conditions, one particular
trial was chosen randomly to be the unexpected slip (US) trial and the contaminant was applied
to the force plate without the participant’s knowledge. Participants were still given the same
walking instruction to ensure that the walking trial will be treated as an unexpected slip event.
On completion of the US, participants were allowed to rest briefly and the footwear removed for
cleaning the contaminant. The force plate was also cleaned with a dry-wet vacuum and soap
water and dried completely and made ready for the next gait trials. Participants then performed
multiple normal dry gait trials with the same 30-45 second breaks and once a normal gait pattern
resumed, participants were given the instruction that all of the following trials “may or may not
be slippery”. Multiple gait trials with the same protocol and instructions were performed in
succession and one trial was randomly chosen to be the alert slip (AS) trial, where the
contaminant was applied again without the knowledge of the participant, but differed from the
US in terms of the instruction given to the participant. Finally, with the completion of NG, US
and AS, participants visually saw the application of the contaminant on the force plate for one
last walking trial and were given the instruction that the following trial “will be slippery” and
treated as an expected slip (ES) trial.
2.4. Data Analysis:
The slip parameter dependent variables included the Heel Slip Distance (HSD) (mm) and
the Mean Heel Slip Velocity (MHSV) (mm/s) during the first 120 ms following heel strike of the
left leg. The left heel marker was used to determine HSD and MHSV and Vicon Nexus software
was used to determine the moment of heel strike of the left leg during the gait trials. The raw

65
data was cleaned removing unlabeled markers, filled gaps in the markers using a spline fill and
edited to have two gait cycles starting with the right leg. The raw data was filtered using a
Butterworth fourth order filter with zero lag and exported as excel files for further analyses. HSD
which is the horizontal distance traveled by the left heel marker after the foot strikes the floor
was calculated as the linear displacement of the left heel marker in the horizontal x-direction
from the moment of heel strike to 120 ms into the gait cycle. MHSV which is the average of the
horizontal velocity of the left heel marker after the foot strikes the floor and until 120 ms into the
gait cycle, was calculated from the instantaneous heel contact velocity in the one-dimensional
horizontal x-direction velocity.
2.5. Statistical Analysis:
A Within-Subjects Repeated Measures of Analysis of Variance (Repeated Measures
ANOVA) was performed to compare the three alternative footwear across the gait trials. Hence,
a 3 x 4 [3 Footwear (CC, FF, LT) x 4 Gait Trials (NG, US, AS, ES)] Repeated Measures
ANOVA was used to analyze the dependent slip parameters of HSD and MHSV individually for
footwear x gait trial interaction and main effect significance. A Greenhouse Geisser correction
was used if the Mauchly’s test of sphericity was significant and if the assumption of sphericity
was violated. The dependent variables were tested initially for the footwear x gait trial
interaction, and if a significant interaction existed, the main effects of footwear and gait trials
were ignored and pairwise comparisons of the simple main effects for the existing significant
interaction was performed using the Sidak Bonferroni multiple comparisons correction. This was
done for the both the independent variables individually to identify how the simple main effects
of one factor differ over the levels of the other factor. For all analyses, alpha level was set a

66
priori at p = 0.05 and all statistical analyses was performed using the SPSS 21 statistical software
package.
3. Results:
The repeated measures ANOVA revealed significant interactions between footwear and
gait trials for both HSD and MHSV. Significant interaction between footwear and gait trials
existed for HSD at F (2.732, 46.438) = 5.453, p = 0.003, ηp2 = 0.284 (Fig.1). Pairwise
comparisons using the Sidak Bonferroni correction was performed to analyze the simple main
effects across both factors of footwear and gait trials for HSD. Pairwise comparisons for simple
main effects for footwear revealed significant differences for CC and FF between NG and US at p
= 0.04 and p = 0.002 respectively, with significantly greater HSD for US compared to NG; and
for FF between US and AS at p = 0.048 with significantly greater HSD for US compared to AS.
No significant differences existed for LT across all gait trials. Pairwise comparisons for simple
main effects for gait trials revealed significant differences for NG between CC and FF at p =
0.0005 with significantly greater HSD for CC compared to FF; for US between CC and LT at p =
0.016 and between FF and LT at p = 0.002, with significantly greater HSD for CC and FF
compared to LT. No significant differences existed for AS and ES across all footwear.
Significant interaction between footwear and gait trails existed for MHSV at F (2.840,
48.288) = 4.923, p = 0.005, ηp2 = 0.225 (Fig.2). Pairwise comparisons using the Sidak Bonferroni
correction was performed to analyze the simple main effects across both factors of footwear and
gait trials for MHSV. Pairwise comparisons for simple main effects for footwear revealed
significant differences for FF between NG and US at p = 0.002 with significantly greater MHSV
for US compared to NG. No significant differences existed for CC and LT across all gait trials.
Pairwise comparisons for simple main effects for gait trials revealed significant differences for

67
NG between CC and FF at p = 0.0005 and between LT and FF at p = 0.027 with significantly
greater MHSV for CC and LT compared to FF; for US between CC and LT at p = 0.047 and
between FF and LT at p = 0.005 with significantly greater MHSV for CC and FF compared to LT.
No significant differences existed for AS and ES across all footwear.
4. Discussion:
The purpose of this study was to analyze the effect of alternative footwear, [Crocs with
Clogs (CC), Flip-Flops (FF) and Low Top Slip Resistant Shoe (LT)] on the heel contact
dynamics during normal gait trials [Normal Dry Gait (NG), Unexpected Slip (US), Alert Slip
(AS) and Expected Slip (ES)]. The findings from this study demonstrate significant differences
in the slip parameters for both Heel Slip Distance (HSD) and Mean Heel Slip Velocity (MHSV)
between CC, FF and LT and across gait trials. Based on the magnitude of the slip, a greater or
an increased HSD and MHSV have been shown to contribute or lead to a slip induced fall
(Perkins, 1978; Strandberg & Lanshammar, 1981; Redfern et al, 2001, Cham & Redfern, 2001;
Lockhart & Kim, 2006; McGorry et al, 2010; Moyer et al, 2006; Brady et al. 2000). On average,
greater slip parameters (HSD and MHSV) were found in the unexpected slips and alert slips
compared to normal dry gait and expected slips, more specifically in alternative footwear for
crocs and flip flops. Recently, it has also been shown that once a slip is initiated, slip distance,
rather than the slip velocity would be the variable that best describes the potential outcome of the
slip event (Brady et al. 2000). However, a combination of the two slip parameters could be used
to have a more precise representation of the outcome of the slip events.
Significant interactions between footwear and gait trials existed for both HSD and
MHSV, suggesting the influence of both footwear and gait trial condition in the outcome of the
slip parameters. The type of footwear worn during both the dry and slippery gait conditions were

68
seen to impact the dependent slip parameters. For CC, significantly greater HSD was seen in US
compared to NG and for FF, in US compared to NG and AS, while no significant differences
were seen between NG and ES for both CC and FF. Similarly, for FF, significantly greater
MHSV was seen in the US compared to NG, while no significant differences were seen between
NG, AS and ES for both CC and FF. Hence, the significantly greater HSD and MHSV for the
alternative footwear (CC & FF) existed only when there was no knowledge of the impending
slippery flooring condition, but with the knowledge of the slippery flooring condition, the HSD
and MHSV were closer to the NG. Contrary to the behavior of the alternative footwear (CC &
FF), the LT had no significant differences in both HSD and MHSV across all gait trials,
behaving the same way irrespective of the walking condition being dry non-slippery or slippery
with the contaminant and with or without the knowledge of the slippery flooring conditions.
Although there is a considerable amount of literature on the gait kinematics of such alternative
footwear, the impact of these alternative footwear on slippery gait conditions have not been fully
identified yet. The CC and FF demonstrate significantly greater slip parameters contributing to
the increased incidence of slip induced falls compared to the LT which is being used in the
industrial market as a slip-resistant shoe in slip prone occupational working conditions.
Data from the current study supported findings from previous researches by
demonstrating significant differences when the participants transitioned from a normal gait
condition on a dry floor surface (NG) to slippery gait conditions on a contaminated floor surface
(US, AS & ES). The gait trial conditions during, either dry non-slippery or slippery flooring
conditions had an impact on the outcome of the dependent slip parameters, based on the type of
footwear worn. Significant differences in the dependent slip parameters were found even during
NG with significantly lower HSD and MHSV for FF compared to CC and LT. Walking in flip-

69
flops have been shown repeatedly to have lower step length, lower stride length and an overall
decreased preferred walking speed including a different heel strike pattern compared to other
shod conditions (Shroyer et al, 2010; Zhang et al. 2013; Majumdar et al. 2006), which might
have contributed to the lower HSD and MHSV seen under the dry non-slip flooring conditions.
However, during unexpected slips, significantly greater HSD and MHSV were found for both
CC and FF compared to the LT, demonstrating greater potential for slip induced falls in
alternative footwear (CC & FF). Both HSD and MHSV had no significant differences during AS
and ES across all footwear. When transitioning from normal dry gait to an unexpected slippery
flooring condition, the alternative footwear demonstrated significantly greater slip parameters
leading to slip induced falls; however, all participants irrespective of the footwear worn,
potentially reduced frictional demands which might be related to adjusted gait kinematics
(Lockhart et al. 2007) during the AS and ES and lowering the HSD and MHSV, thereby
preventing hazardous slip induced falls. Previous researches have shown gait modifications of
both stance leg and swing leg, kinetically by increasing muscle activity and frictional utilization
and kinematically, by reducing step length, stride length and heel contact velocity (Lockhart et
al. 2007).
Extrinsic Factors - Footwear design characteristics as predictors of slips:
The footwear’s geometrical design characteristics have been shown to affect human
balance and gait (Chander et al. 2014; Perry, Radtke & Goodwin 2007; Menant et al. 2008;
Menant et al. 2009; Divert et al. 2005; Bohm & Hosl 2010) and especially the sole design
parameters such as the depth, width and orientation of the tread groove have been demonstrated
as important factors affecting the coefficient of friction between the footwear-floor interface (Li
& Chen, 2005; Li, Wu and Lin, 2006). Certain commonly worn alternative footwear, such as

70
slippers and flip flops were found to be hazardous as they slowed down reactions to
perturbations and also had adverse effects on postural reaction (Hosoda et al., 1997, Hosoda et
al., 1998) and leading to an increased risk of falling. These alternative footwear combined with
slippery environmental conditions could be very dangerous and lead to a greater incidence of
slips and slip induced falls. Unlike other shod conditions, these alternative footwear of flip flops
and crocs, do not secure the hind foot, the heel and the ankle joint, leading to changes in the joint
kinematics.
Previous research has demonstrated that the average coefficient of friction gain per tread
groove depth increase in millimeter under slippery conditions ranged from 0.018 to 0.108 (Li,
Wu and Lin, 2006) and that wider grooved footwear pads resulted in a higher COF and the
footwear pads with tread grooves perpendicular to the friction measurement direction had higher
COF (Li & Chen, 2005). The tread patterns on the LT follow Occupational Health and Safety
Administration (OSHA) and American National Standards Instrumentation (ANSI) which
provides slip resistant and anti-slip “treadsafe” soles with hexagon shaped tread marks that are
perpendicular to the direction of walking. Although, the tread patterns in the CC and FF are
perpendicular to the direction of motion, the depth of these tread marks were lower in
comparison to the LT. Moreover, the number of grooves in the surface area of the sole of the foot
were higher in the LT compared to the CC and FF. All these factors contributed to the better
anti-slip performance in LT while walking over slippery flooring conditions.
The age and the wear and tear on a footwear have also been shown to contribute to slip
induced falls. A higher proportion of slip induced falls were seen in old slip resistant boots
compared to new ones (Jensen & Laursen, 2010). The current study used all new footwear with
no prior wear and tear, and the alternative footwear (CC & FF) had a greater proportion of falls

71
compared to LT even when its new, suggesting that with age and wear and tear from repeated
use, the alternative footwear could be potentially more dangerous in precipitating larger slip
distances and velocities and leading to more slip induced falls. Although, few literature has
shown gait modifications in alternative footwear, its behavior under slippery conditions haven’t
been fully analyzed yet. Based on the results from the current study, it appears that the
alternative footwear which do not secure the hind foot and the ankle joint had a greater slip
distances and slip velocities compared to LT in which the footwear and the foot move together as
one rigid segment.
Intrinsic Factors - Perception and Anticipation as predictors of slips:
An intrinsic human factor as a predictor of slip events includes perception of a slip hazard
which can be an interaction of various factors such as the prior knowledge of a slip prone
environment, ability to use visual perception in the presence or absence of adequate lighting,
arousal / alertness levels and mental workload while encountering a slip (Cohen & Cohen,
1994a; Cohen & Cohen, 1994b). Although, small forward heel displacements which have been
shown to occur in regularly in normal gait, are often undetectable to the individual (Strandberg &
Lanshammar, 1981; Hanson et al. 1999; Leamon & Murphy, 1995) for which the human postural
control system is sufficient to adapt to these small magnitude slips (Redfern et al. 2001) and
continue a normal gait pattern; previous studies have concluded that individuals are capable of
differentiating the slipperiness of the floor while walking on dry or contaminated surfaces
(Strandberg, 1983; Strandberg, 1985; Groqvist et al. 1993) using the tactile sliding resistance
cues to determine slipperiness of the walking surface.
However, prior knowledge and anticipation of a slippery floor allows the individuals to
reduce the potential slips by making adaptations to the biomechanics of gait (Cham & Redfern,

72
2002a; Lockhart et al. 2007). Subjective measures of slipperiness have been related to the
coefficient of friction of the walking surface which have been shown to be effective with
exposure to the contaminated walking surface (Chang et al. 2004), making use of the most
sensitive tactile somatosensory information, however a mere observation of the walking surface
have been shown to be poor predictors of slips (Li et al. 2004). Although, the subjective
assessment of slipperiness is often considered an easy method for identifying potential slip
hazardous situations, the use of such subjective assessment has been warranted with caution due
to its weak associations with slip distances (DiDomenico et al. 2007). In the current study, the
AS and ES demonstrated significantly lower HSD and MHSV compared to US. Even though the
ES was the only gait trial condition in which the participants were visually allowed to see the
slippery contaminant on the floor before walking across it, the AS also had similar slip parameter
values with no significant differences between AS and ES. Cham and Redfern showed a 14-19%
reduction in heel velocity during anticipation trials which were still dry trial with no contaminant
(Cham & Redfern, 2002a), in which participants were given the same instruction as our study for
AS (may or may not be slippery) from baseline dry condition in which all participants were
assured that the walking surface was non-slippery. The anticipation trials (dry trials) in the Cham
and Redfern study, still demonstrated a decreased heel velocity, suggesting that the heel contact
kinematics were changed when there is a potential risk of slipping, even though the subjects were
asked to walk as normally as possible. Chambers et al. also showed significantly higher slip
distances and velocities in unexpected slips and significantly lower slip distance and velocities
for alert and known slippery gait conditions (Chamber et al. 2003). The results from our study
support previous literature, where the knowledge and the anticipation of the flooring surface
which may or may not be slippery was crucial in bringing about kinematic heel contact

73
adaptations governed by the human anticipatory postural control system, thereby preventing slips
and slip induced falls.
Heel Slip Distance and Heel Slip Velocity Relationship:
The data from the current study was consistent with previous studies which looked at heel
slip distances and heel slip velocities as predictors of slip outcomes. Heel slip distances of less
than 30 mm were seen as micro-slips, with distances between 30 mm - 100 mm as midi-slips or
slides and slip distances beyond 100 mm as macros-slips that lead to a slip induced fall
(Strandberg & Lanshammar, 1981; Perkins, 1978; Redfern et al 2001; Cham & Redfern, 2001a;
DiDomenico et al. 2007). Similarly, heel velocities less than 500 mm/s were seen as micro slips,
with velocities between 500 mm/s - 1000 mm/s as midi-slips and heel velocities above 1000
mm/s as macro slips that lead to a slip induced fall (Redfern et al. 2001; Moyer et al. 2006). The
data points from all participants in three footwear conditions are presented in figures (Fig.3,
Fig.4, Fig.5 and Fig.6) for NG, US, AS and ES respectively.
Based on the slip distance and slip velocity, Moyer et al. classified the slip outcomes into
(i) non-hazardous slips which had shorter slipping distance and slower slipper velocity and were
unlikely leading to falls and (ii) hazardous slips which had greater slipping distances and faster
slipping velocity and were more likely to lead to falls (Moyer et al. 2006). The concept of using
hazardous and non-hazardous slips instead of falls and recoveries was suggested by Moyer et al.
to further benefit studies investigating human locomotion under slippery conditions (Moyer et al.
2006). The current study utilizes this concept to demonstrate the interactions of the alternative
footwear and slippery gait conditions and further suggesting three zones of the outcome of slip
events. The zone below 30 mm of slip distance and 500 mm/s of slip velocity could be
considered as the safe zone or the non-hazardous zone, in which the slips are often perceived by

74
the postural control system and there is not often a need to have corrective postural responses.
The zone encompassed within 30 mm - 100 mm slip distance and within 500 mm/s - 1000 mm/s
could be considered as the potentially hazardous zone, in which the slip perturbations would
require a corrective postural responses to prevent a slip induced fall, but not always lead to a fall.
The zone beyond 100 mm of slip distance and 1000 mm/s slip velocity could be considered as
the hazardous done, which requires a greater corrective postural response and is very likely to
lead to a slip induced fall. During normal gait dry conditions, the slip parameters were
predominantly in the safe zone irrespective of the type of footwear used. During unexpected
slips, the alternative footwear had greater slip distances and velocities and were predominantly
potentially hazardous or hazardous slips in comparison to LT, but decreased the slip parameters
with the anticipation of a potential or known slippery condition, in AS and ES. The LT had gait
trials predominantly in the safe zone, irrespective of the slippery conditions, leading to better
performance and preventing slips.
5. Conclusion:
Based on the results from the current study, the interaction between the type of footwear
and the gait trial conditions, contributed in determining if the outcome of the slip events were
either non-hazardous, potentially hazardous or hazardous slips. It appears that the alternative
footwear had greater instances where the gait trial was either potentially hazardous or hazardous
in comparison to LT. However, with the knowledge and anticipation of the slippery conditions,
the slip distances and velocities were minimized with potential gait modifications and thereby
preventing any slips or slip induced falls. But, under all slippery conditions, the LT had better
performance in preventing slips and given the conditions, the low top slip resistant shoe proves
to be the choice of footwear for maneuvering slippery flooring conditions. Even though the

75
alternative footwear serves for comfort and easy donning, it might not be the choice of footwear
to prevent slips and slip induced falls. Future research should focus on the interactions of these
alternative footwear and slippery conditions with physical workload, which is a common
occurrence in occupational environments over the course of the work day.

76
Fig.1: Heel Slip Distance (mm) during 120ms post heel strike for Crocs, Flip-Flops and Low Top Slip Resistant Shoe during normal dry gait (NG), unexpected slip (US), alert slip (AS) and expected slip (ES) events.
Fig.2: Mean Heel Slip Velocity (mm/s) during 120ms post heel strike for Crocs, Flip-Flops and Low Top Slip Resistant Shoe during normal dry gait (NG), unexpected slip (US), alert slip (AS) and expected slip (ES) events.
§ denotes significant interaction; * denotes significant difference for footwear across gait trials and # denotes significant difference for gait trials across footwear. All differences were significant at alpha level p=0.05.
0
20
40
60
80
100
120
140
N G U S A S E S
SLIP
DIS
TAN
CE
(MM
)
GAIT TRIALS
HEEL SLIP DISTANCE
Crocs Flip Flop Low Top
0
100
200
300
400
500
600
700
800
900
1000
N G U S A S E S
HEE
L V
ELO
CIT
Y (M
M/S
)
GAIT TRIALS
MEAN HEEL SLIP VELOCITY
Crocs Flip Flop Low Top
*
#
#
#
*
*
§
#
#
# #
*
§

77
Fig.3: Relationship between Heel Slip Distance (mm) and Mean Heel Slip Velocity (mm/s) during 120ms post heel strike during normal dry gait events.
Fig.4: Relationship between Heel Slip Distance (mm) and Mean Heel Slip Velocity (mm/s) during 120ms post heel strike during unexpected slip events.
0
500
1000
1500
2000
2500
0 50 100 150 200 250 300
MEA
N H
EEL
SLIP
VEL
OC
ITY
(MM
/S)
HEEL SLIP DISTANCE (MM)
NORMAL DRY GAIT EVENTS
Crocs Flip Flop Low Top
0
500
1000
1500
2000
2500
0 50 100 150 200 250 300
MEA
N H
EEL
SLIP
VEL
OC
ITY
(MM
/S)
HEEL SLIP DISTANCE (MM)
UNEXPECTED SLIP EVENTS
Crocs Flip Flops Low Top Shoe

78
Fig. 5: Relationship between Heel Slip Distance (mm) and Mean Heel Slip Velocity (mm/s) during 120ms post heel strike during alert slip events.
Fig. 6: Relationship between Heel Slip Distance (mm) and Mean Heel Slip Velocity (mm/s) during 120ms post heel strike during expected slip events.
0
500
1000
1500
2000
2500
0 50 100 150 200 250 300
MEA
N H
EEL
SLIP
VEL
OC
ITY
(MM
/S)
HEEL SLIP DISTANCE (MM)
ALERT SLIP EVENTS
Crocs Flip Flop Low Top
0
500
1000
1500
2000
2500
0 50 100 150 200 250 300
MEA
N H
EEL
SLIP
VEL
OC
ITY
(MM
/S)
HEEL SLIP DISTANCE (MM)
EXPECTED SLIP EVENTS
Crocs Flip Flop Low Top

79
LIST OF REFERENCES

80
1. Bohm, H, &Hosl, M. (2010). Effect of boot shaft stiffness on stability joint energy and
muscular co-contraction during walking on uneven surface. Journal of Biomechanics, 43
(2010), 2467–2472.
2. Brady, R. A., J Pavol, M., Owings, T. M., & Grabiner, M. D. (2000). Foot displacement
but not velocity predicts the outcome of a slip induced in young subjects while walking.
Journal of biomechanics, 33(7), 803-808.
3. Chander, H, Garner JC & Wade, C. (2014). Impact on balance while walking in
occupational footwear. Footwear Science.
4. Cham, R., Redfern, M.S., (2002a). Changes in gait when anticipating slippery floors. Gait
Posture 15, 159–171.
5. Cham, R., Redfern, M.S., (2002b). Heel contact dynamics during slip events on level and
inclined surfaces. Safety Sci. 40, 559–576.
6. Chambers, A. J., & Cham, R. (2007). Slip-related muscle activation patterns in the stance
leg during walking. Gait & posture, 25(4), 565-572.
7. Chambers, A.J., Margerum, S., Redfern, M.S., Cham, R., 2002/2003. Kinematics of the
foot during slips. Occup. Ergon. 3, 225–234.
8. Chang, W.R., Li, K.W., Huang, Y.-H., Filiaggi, A., Courtney, T.K., (2004) .Assessing
floor slipperiness in fast-food restaurants in Taiwan using objective and subjective
measures. Appl. Ergon. 35, 401–408.
9. Cohen, H.H., Cohen, D.M., (1994a). Psychophysical assessment of the perceived
slipperiness of floor tile surfaces in a laboratory setting. J. Safety Res. 25 (1), 19–26.
10. Cohen, H.H., Cohen, D.M., (1994b). Perceptions of walking surface slipperiness under
realistic conditions, utilizing a slipperiness rating scale. J. Safety Res. 25 (1), 27–31.

81
11. Courtney, T. K., Sorock, G. S., Manning, D. P., Collins, J. W. and Holbein-Jenny, M. A.
(2001a). Occupational slip, trip, and fall-related injuriescan the contribution of
slipperiness be isolated? Ergonomics, 44, 1118- 1137.
12. Courtney, T. K., & Webster, B. S. (2001b). Antecedent factors and disabling
occupational morbidity—insights from the new BLS data. AIHAJ-American Industrial
Hygiene Association, 62(5), 622-632.
13. Davis, P. R. (1983). Human factors contributing to slips, trips and falls. Ergonomics,
26(1), 51-59.
14. DiDomenico, A., McGorry, R. W., & Chang, C. C. (2007). Association of subjective
ratings of slipperiness to heel displacement following contact with the floor. Applied
ergonomics, 38(5), 533-539
15. Divert, C., Mornieux, G., Baur, H., Mayer, H., Belli, A. (2005). Mechanical Comparison
of Barefoot and Shod Running. International journal of Sports Medicine: 26, 593 – 598.
16. Gauchard, G., Chau, N., Mur, J. M., & Perrin, P. (2001). Falls and working individuals:
role of extrinsic and intrinsic factors. Ergonomics, 44(14), 1330-1339.
17. Gronqvist, R., Abeysekera, J., Gard, G., Hsiang, S.M., Leamon, T.B., Newman, D.J.,
Gielo-Perczak, K., Lockhart, T.E., Pai, C.Y.-C., 2001. Human-centred approaches in
slipperiness measurement. Ergonomics. 44 (13), 1167–1199.
18. Hosoda M, Yoshimura O, Takayanagi K, Kobayashi R, Minematsu A, Nakayama A,
Ishibashi T, Wilson C (1997). The effect of various footwear types and materials, and of
fixing of the ankles by footwear on upright posture control. J phystherSci 9, 47-51.

82
19. Hosoda, M, Yoshimura O, Takayanagi, K, Kobayashi R, Minematsu, A, Sasaki, H,
Maejima, H, Matsuda, Y, Araki S, Nakayama, A, Ishibashi, T, Terazono, T (1998). The
effect of footwear on standing posture control. J. Phys. Ther. Sci, 10. 47-51.
20. Hanson, J. P., Redfern, M. S., &Mazumdar, M. (1999). Predicting slips and falls
considering required and available friction. Ergonomics, 42(12), 1619-1633.
21. Hitcho, E. B., Krauss, M. J., Birge, S., Claiborne Dunagan, W., Fischer, I., Johnson, S., &
Fraser, V. J. (2004). Characteristics and circumstances of falls in a hospital setting.
Journal of General Internal Medicine, 19(7), 732-739.
22. Jensen, O. C., &Laursen, L. H. (2011). Reduction of slips, trips and falls and better
comfort by using new anti-slipping boots in fishing. International journal of injury
control and safety promotion, 18(1), 85-87.
23. Lanshammar, H and Strandberg, L. 1981, Horizontal floor reactions and heel
movementsduring the initial stance phase, Eighth International Congress of
Biomechanics, Nagoya, Japan.
24. Leamon, T. B., & Murphy, P. L. (1995). Occupational slips and falls: more than a trivial
problem. Ergonomics, 38(3), 487-498.
25. Li, K. W., & Chen, C. J. (2005). Effects of tread groove orientation and width of the
footwear pads on measured friction coefficients. Safety science, 43(7), 391-405.
26. Li, K.W., Chang, W.-R., Leamon, T., Chen, C.J., (2004). Floor slipperiness
measurement: friction coefficient, roughness of floors, and subjective perception under
spillage conditions. Safety Sci. 42, 547–565.

83
27. Li, K. W., Wu, H. H., & Lin, Y. C. (2006). The effect of shoe sole tread groove depth on
the friction coefficient with different tread groove widths, floors and contaminants.
Applied ergonomics, 37(6), 743-748.
28. Lockhart, T. E., & Kim, S. (2006). Relationship between hamstring activation rate and
heel contact velocity: factors influencing age-related slip-induced falls. Gait & posture,
24(1), 23-34.
29. Lockhart, T. E., Spaulding, J. M., & Park, S. H. (2007). Age-related slip avoidance
strategy while walking over a known slippery floor surface. Gait & posture, 26(1), 142-
149.
30. Majumdar, Dhurjati., Banerjee, P. K., Majumdar, D., Pal, M., Kumar, R. A. K. E. S. H.,
&Selvamurthy, W. (2006). Temporal spatial parameters of gait with barefoot, bathroom
slippers and military boots. Indian journal of physiology and pharmacology, 50(1), 33.
31. McGorry, R. W., DiDomenico, A., & Chang, C. C. (2010). The anatomy of a slip:
Kinetic and kinematic characteristics of slip and non-slip matched trials. Applied
ergonomics, 41(1), 41-46.
32. Menant, J, Perry, S, Steele, J, Menz, H,Munro, B, Lord, S (2008). Effects of Shoe
Characteristics on Dynamic Stability When Walking on Even and Uneven Surfaces in
Young and Older People. Arch Phys Med Rehabil; 89, 1970-6.
33. Moyer, B. E., Chambers, A. J., Redfern, M. S., & Cham, R. (2006). Gait parameters as
predictors of slip severity in younger and older adults. Ergonomics, 49(4), 329-343.
34. Perkins, P. J. 1978, Measurement of slip between the shoe and ground during walking, in
Walkway Surfaces: Measurement of Slip Resistance, ASTM STP 649, Philadelphia, PA.

84
35. Perry S, Radtke A, Goodwin C (2007). Influence of footwear midsole material hardness
on dynamic balance control during unexpected gait termination. Gait and posture 25, 94-
98.
36. Redfern, M. S., Cham, R., Gielo-Perczak, K., Grönqvist, R., Hirvonen, M., Lanshammar,
H.,& Powers, C. (2001). Biomechanics of slips. Ergonomics, 44(13), 1138-1166.
37. Shroyer JF, Shroyer JE, Sumner AM, Weimar WH: Effect of various thong flip-flops on
pronation and eversion during midstance. Med Sci Sport Exer. 2010, 42:270.
38. Shroyer, J. F., & Weimar, W. H. (2010). Comparative analysis of human gait while
wearing thong-style flip-flops versus sneakers. Journal of the American Podiatric
Medical Association, 100(4), 251-257.
39. Strandberg, L., 1983. On accident analysis and slip-resistance measurement. Ergonomics
26 (1), 11–32.
40. Strandberg, L., 1985. The effect of conditions underfoot on falling and overexertion
accidents. Ergonomics 28 (1), 131–147.
41. Strandberg, L. and Lanshammar, H. (1981). The dynamics of slipping accidents, Journal
of Occupational Accidents, 3, 153-162.
42. US Department of Labor, Bureau of Labor Statistics 2011, National Census of Fatal
Occupational Injuries, 2011.
43. US Department of Labor, Bureau of Labor Statistics 2011, Lost-work time Injuries and
Illnesses: Characteristics and Resulting Time Away from Work, 2011.
44. Winter, D. A. (1991). Biomechanics and motor control of human gait: normal, elderly
and pathological.

85
45. Winter, D. A. (1995). Human balance and posture control during standing and walking.
Gait & posture, 3(4), 193-214.
46. Zhang X, Paquette MR & Zhang S: A comparison of gait biomechanics of flip-flops,
sandals, barefoot and shoes. Journal of Foot and Ankle Research. 2013, 6:45.

86
MANUSCRIPT II
IMPACT OF ALTERNATIVE FOOTWEAR ON LOWER EXTREMITY JOINT
ANGLES AND GROUND REACTION FORCES DURING SLIP EVENTS

87
1. Introduction:
Increased probability of falls have been related to decrements in balance control and
these falls are often a primary causative factor for injuries and disabilities in the general
population as well as in the contemporary industrial population where postural stability is
challenged with unfavorable and unfamiliar environment (Lin, Seol, Nussbaum & Madigan,
2008). These falls are not always from an elevation, and about 43% of the same level falls have
been found to be triggered by slips (Courtney et al. 2001). Slips, trips and falls occur as a result
of failure of normal locomotion and failure of attempts at equilibrium recovery following an
induced imbalance (Davis, 1983; Gauchard, 2001). The coefficient of friction at the footwear-
floor interface have been used as an applied approach in the prediction of outcome of slips.
Under normal walking conditions the required or the utilized coefficient of friction have been
shown to range from 0.17 to 0.20 (Redfern et al. 2001). When the utilized coefficient of friction
exceeds the available coefficient of friction at the footwear-floor interface, the slip propensity
increases (Redfern et al. 2001; Cham and Redfern, 2002b; Hanson et al, 1999; McGorry et al,
2010).
Gait kinematics are influenced by the available coefficient of friction and the slipperiness
of the floor. A few kinematic variables are very commonly used as outcome variables to interpret
the slip research. The most commonly reported are the slip parameters such as the heel slip
distance, heel velocity and the foot-floor angle; joint angles of the ankle and the knee joints
along with temporal-spatial parameters of gait including stride/step lengths, width of walking
base, stride/step time and cadence (Perkins, 1978; Strandberg & Lanshammar, 1981). Joint
angles have been investigated previously in normal walking on a dry surface (Winter, 1995) and
under slippery conditions (Redfern et al. 2001; Lockhart et al. 2007; Brady et al. 2000; Moyer et

88
al. 2006). During normal dry surface gait, at heel contact, the ankle is either in neutral or slight
dorsiflexion and rapidly rolls into plantar flexion, over which the lower leg moves forward into
midstance (Winter, 1995) and the hip joint is at its maximum flexion angle at heel contact and
continues to move into extension throughout the stance phase of the gait cycle (Winter, 1995).
However, under slippery conditions, the normal gait cycle pattern is disturbed due to the
perturbation from the slip. The ankle joint have been shown to be in increased plantar flexion
during slips and a greater foot floor angle contributing to a greater incidence of slips (Cham &
Redfern, 2002a; Brady et al. 2000). A greater hip flexion angle at heel contact have, due to a
bigger stride length have been shown to contribute to slips (Lockhart, 1997). However, during
the slip, the hip movement is minimized, with increasing knee flexion as corrective movements,
in an attempt to keep the center of mass within the base of support to prevent slip induced falls
(Redfern et al. 2001).
The ground reaction forces occurring immediately post heel strike is vital in the
prediction of the slips and falls. The first peak in the shear force which occurs at about 19% of
the gait cycle (90-150ms post heel strike) is the crucial time period during which most slips
occur (Redfern et al. 2001). The highest shear forces occur during the heel contact and push-off
phases of the gait cycle and considered as the points during which the highest incidence for a slip
exists (Redferen et al. 2001; Redfern & DiPasquale, 1997; Hanson et al, 1999). The general
characteristics seen with ground reaction forces during slips are a reduction in the shear and
normal forces, as the transfer of body weight to the supporting leg is not completed (Redfern et
al. 2001).
The changes in the gait variables in response to the perception of slippery hazardous
conditions include a shorter step / stride length, thereby producing low heel velocities, smaller

89
shear forces and lower required COF and lower GRFs during heel strike and push-off phases to
reduce the likelihood of a slip. Ankle joint angles are modified to have a flatter foot strike, when
there is anticipation of slippery flooring conditions (Cham &Redfern, 2002b). Anticipation of
slippery walking trials in comparison to dry normal walking, produced lower required coefficient
of friction, reducing slip potential and failed to return to baseline normal dry walking values
(Cham & Redfern, 2002a). This reduction in the peak RCOFs were brought about by postural
changes and adaptations during the gait cycle, with decreased step length, low impact GRFs and
with significant changes in joint moments (Cham & Redfern, 2002a; Cohen and Cohen, 1994b;
DiDomenico et al, 2007).
Both extrinsic factors such as the type of footwear (Li & Chen, 2005; Li, Wu & lin, 2006)
and intrinsic factors such as the knowledge or anticipation of a slip (Cham & Redfern, 2002a;
Lockhart et al. 2007) have been shown to affect the outcome of a slip event. Extensive literature
on kinematic gait analyses of barefoot and shod conditions during dry normal surface exists,
which have focused on alternative open-toed footwear such as the flip-flops and slip-on footwear
in comparison to close-toed shod conditions such as the athletic shoes or any shod condition that
has a concealed foot with cushioning properties. Significant differences in gait kinematics in the
alternative footwear included a shorter step-stride length (Shoryer et al. 2010a; Shoryer et al.
2010b; Carl et al. 2008; Majumdar et al. 2006) and a lesser dorsiflexion/ more plantar flexion
angle at heel strike and during swing phase (Zhang et al. 2013; Menant et al. 2009). Flip flops
and sandals have been shown to utilize a more flatter foot at contact when there is minimal
cushioning (Zhang et al. 2013) and also during swing phase to hold the open-toed footwear in
position during swing phase by gripping the footwear using the toes (Shroyer et al. 2010), while
close-toed shod conditions have a longer step-stride lengths and greater dorsiflexion angles.

90
Contrarily and more recently, increased dorsiflexion angle have been reported at heel contact,
suggesting a mechanism to retain the thong flip flops during weight acceptance (Chard et al.
2013). Ground Reaction Forces (GRF) in alternative footwear such as flip-flops, open-toed shoes
and other shod conditions have been analyzed previously. Lower peak propulsive GRF and
smaller loading rate of 1st peak vertical GRF were reported in shoes compared to barefoot,
sandals and flip-flops (Zhang et al. 2013) and reduced peak vertical ground reaction force was
reported in shoes compared to barefoot (Yan et al. 2012). Similarly, in another study, flip flops
were found to have the highest GRFs compared to barefoot walking (Shakoor et al. 2010).
Although considerable amount of literature exists, analyzing the gait kinematics and
kinetics in different footwear and shod conditions, the impact of these alternative footwear under
slippery conditions haven’t been fully addressed yet. The specific purpose of this paper is to
analyze the impact of alternative footwear [Crocs with clogs (CC), Flip-Flops (FF) and Low Top
Slip Resistant Shoe (LT)] under multiple gait conditions [Dry normal surface (NG); Unexpected
Slip (US), Alert Slip (AS) and Expected Slip (ES)] on lower extremity joint angles (Ankle Angle
and Hip Angle) and ground reaction forces (Mean Z-GRF and Peak Z-GRF). Based on previous
literature, we hypothesized that the alternative footwear (CC & FF) will demonstrate greater
plantar flexion ankle angle and lesser hip flexion angle at heel strike compared to LT, during dry
gait and slip trials. We also hypothesized that the vertical ground reaction forces (Z-GRF) will be
greater for alternative footwear (CC & FF) and minimized for during slip trials.
2. Methodology:
The purpose of the study was to examine the ground reaction forces during the stance
phase of the gait cycle and to analyze the joint angles at heel strike. The Z-GRFs and ankle and
hip joint angles were compared across the three alternative footwear [Crocs with clogs (CC),

91
Flip-Flops (FF) & Low Top Slip Resistant Shoe (LT)] under four gait conditions [(Normal Dry
Gait (NG), Unexpected Slip (US), Alert Slip (AS) & Expected Slip (ES)] using a within subjects
repeated measures design.
2.1. Participants:
Eighteen healthy male participants [Age: 22.28 ± 2.2 years; Height: 177.66 ± 6.9 cm;
Mass: 79.27 ± 7.6 kg] completed the study. Participants who had any history of musculoskeletal
injuries, cardio-vascular abnormalities, neurological disorders, vestibular disorders, under
medications or any inability to walk and stand without support were excluded from the study. All
participants were recruited through flyers approved by the University’s Institutional Review
Board (IRB). All participants read and signed the informed consent and also filled out the
physical activity readiness questionnaire (PAR-Q) to rule out any of the above mentioned health
complications and cleared for participation in the study.
2.2. Instrumentation:
2.2.1. 3D Motion Capture:
Vicon Nexus (Oxford, UK) 3D motion capture system with 12 infra-red T-series cameras
was used to collect and analyze kinematic gait data. A lower body plug-in gait model from the
Helen-Hayes marker system was used as for the participant configuration model. The motion
capture system was calibrated every day prior to data collection and the kinematic data was
sampled at 100Hz and collected using the Vicon Nexus software. Of the 12 infra-red cameras,
eight were mounted on the walls to create a larger capture volume and the remaining four
cameras were placed on tripods and positioned in close proximity to the walking pathway
focusing on the lower extremity and foot segment.

92
2.2.2. Force Plate:
Two force plates Bertec (Bertec Corporation, Columbus, OH) and AMTI (AMTI Force
and Motion, Watertown, MA) embedded in the vinyl floored surface of the Applied
Biomechanics Lab will be used to collect ground reaction forces. The force plates are positioned
and set up in such a way that, during gait trials across the walkway, the right leg will strike the
AMTI force plate and the left leg will strike the Bertec force plate. The force plate data is
collected through the Vicon Nexus system as an analog device and sampled at 1000Hz.
2.2.3. Fall Arrest System:
A uni-track fall arrest system from Rigid Lines (Millington, TN); a lightweight horizontal
rigid fall arrest track capable of supporting up to 900lb and installed with an inverted-U steel
frame fixed to the laboratory floor was used as the safety fall arrest system to prevent any
undesired falls. Participants were attached to the fall arrest track with the help of a back pack
type harness system attaching to a moveable trolley inside the fall arrest track. The trolley was
capable of locking itself without moving if there was greater than 50lb force imparted on the
harness line. The fall arrest track and the harness along with the trolley were connected by a
pulley system that allowed the investigators to move the trolley on top of the walking participant
so that, the participants were not leading the trolley now was the trolley leading the participant.
This was done to take away the closed kinematic chain between the participant and the fall arrest
system and to minimize the impact of the harness and fall arrest system on the outcome of the
slip events.

93
2.2.4. Slippery Agent or Contaminant:
Industrial vegetable based glycerol mixed with water in the ratio of 75% glycerol and
25% water was used as the slippery agent. The 75%-25% ratio was chosen for the study based on
previous literature and with initial practice sessions in the laboratory prior to starting data
collection. During the slip gait trials or slip events, glycerol was applied and evenly distributed
on the Bertec force plate, on which the left leg of all participants, irrespective of their dominant
extremity, would make contact during the gait trials. The application of the slippery agent was
always performed by the primary investigator using the same measured and calibrated container
to minimize the errors due to inter and intra rater reliability.
2.3. Experimental Procedures:
All participants visited the Applied Biomechanics Laboratory four times, separated by a
minimum of 24 hours. A description of the experimental procedures for each visit is provided
below.
2.3.1. Day 1:
The first visit was treated as a familiarization day, where all participants were exposed to
the testing measures for gait trials and muscle activity. Informed consent was obtained from all
participants following which they completed a physical activity readiness questionnaire (PAR-Q)
and screened for any complications that might hinder them from completing the study.
Anthropometric measurements such as height, weight, leg length, knee width, ankle width and
foot/shoe size. Following this, participants were briefed on the walking gait conditions and were
allowed to practice walking at their self-selected pace across the lab walkway. Participants were
encouraged to walk at the same pace for every trial and their starting points were adjusted by the
investigators to make sure there is clean contact with the dual force plates positioned in the
94
middle of the walkway across the lab floor. Next the participants were positioned and strapped
inside the harness connecting to the trolley and ultimately to the fall arrest track. Participants also
performed the same practice gait trials with the harness while the investigators moved the trolley
in-sequence along with the participant. A number of practice gait trials were performed until the
subjects walked normally and with the same speed. Finally, the participants were assured of the
fall arrest system catching them in the case of an undue fall, initiated by the slip. Participants
were also asked to let go of their body weight and drop down on the harness system to further
ensure that the fall arrest system would support their entire body weight and catch them
preventing them hitting the floor, in the case of a slip. All participants were also asked to refrain
from any physical workload especially to their lower extremities in terms of resistance or aerobic
training and were also asked to avoid any pain medications until all their testing days were
completed.
2.3.2. Day 2, Day 3 and Day 4:
Visits 2, 3 and 4 were again separated by a minimum of 24 hours and treated as
experimental testing days. These experimental testing days followed the same testing protocol
except with different alternative footwear (CC, FF & LT) which were chosen and provided to the
participant using a counter balance design to remove order effects.
2.3.2.1. Participant Preparation:
Each visit will start the experimental testing day with a counter balanced allotment of the
either the CC, FF or LT to the participants. Participants were also be provided black spandex
shorts and t-shirts. Reflective markers were placed on the participant’s lower extremity and on
the footwear following a lower body plug-in gait model from the Helen-Hayes system.

95
2.3.2.2. Experimental Testing:
The experimental testing session began with the participant wearing the footwear given to
them and had a series of practice gait trials across the vinyl floored testing surface under dry non
slip conditions to get accustomed with the gait trials and the testing environment at a self-
selected speed of walking. These practice gait trials were also used to make sure that the
participants strike the center of the force plate with both their feet, unintentionally at their normal
walking pattern and pace and to avoid any intentional modification of their step lengths during
the data collection procedure.
Following the initial practice gait trials, the participants were strapped in the harness
system to the fall arrest track and a static capture of the lower body plug-in model was
performed. With the completion of the static capture, the participants again started a series of
practice gait trials with the harness fall arrest system and the trolley being moved in-sequence
with the participant. Practice trials were performed until the participants walked with ease in a
similar pattern and with similar walking speed. Dynamic capture was done for 5 normal dry gait
trials with no breaks or stops between the gait trials with the instruction “walk as normally as
possible with the same speed”. With the completion of the 5th normal dry gait trial, participants
still walked with the same pattern and speed, but at the end of all further gait trials, the
participants took 30-45 second breaks facing away from the walking surface and listened to
music played on a noise-cancellation headphones, which would take away the knowledge of the
potential slip trial, again with the same walking instructions.
Following a repeated number of gait trials under normal dry conditions, one particular
trial was chosen randomly to be the unexpected slip (US) trial and the contaminant was applied
to the force plate without the participant’s knowledge. Participants were still given the same

96
walking instruction to ensure that the walking trial will be treated as an unexpected slip event.
On completion of the US, participants were allowed to rest briefly and the footwear removed for
cleaning the contaminant. The force plate was also cleaned with a dry-wet vacuum and soap
water and dried completely and made ready for the next gait trials. Participants then performed
multiple normal dry gait trials with the same 30-45 second breaks and once a normal gait pattern
resumed, participants were given the instruction that all of the following trials “may or may not
be slippery”. Multiple gait trials with the same protocol and instructions were performed in
succession and one trial was randomly chosen to be the alert slip (AS) trial, where the
contaminant was applied again without the knowledge of the participant, but differed from the
US in terms of the instruction given to the participant. Finally, with the completion of NG, US
and AS, participants visually saw the application of the contaminant on the force plate for one
last walking trial and were given the instruction that the following trial “will be slippery” and
treated as an expected slip (ES) trial.
2.4. Data Analysis:
The analog kinetic force plate measures and kinematic joint angles were analyzed using
the Vicon Nexus software. The raw data was cleaned removing unlabeled markers, filled gaps in
the markers using a spline fill and edited to have two gait cycles starting with the right leg. The
raw data was filtered using a Butterworth fourth order filter with zero lag and exported as excel
files for further analyses. Vicon Nexus software was used to determine the moment of heel strike
and toe off phase of the left leg during the gait trials to determine the stance phase beginning and
ending of the stance phase. The Ground Reaction Force in the Z direction (Z-GRF) from the
Bertec force plate with left leg’s stance phase was used for the kinetic measure. Mean Z-GRF
and Peak Z-GRF were calculated from the exported excel files. The kinematic data was used to

97
calculate relative joint angles for the ankle joint (dorsi-flexion/plantar flexion) angles (Ankle
Angle) and for the hip joint (flexion/extension) angles (HipAngle) at heel strike. For the ankle
angle, the foot vector is projected into the foot sagittal plane. The angle between the foot vector
and the sagittal axis of the shank is the foot dorsi/plantar flexion. A positive number corresponds
to dorsiflexion. Hip flexion is calculated about an axis parallel to the pelvic transverse axis
which passes through the hip joint center. The sagittal thigh axis is projected onto the plane
perpendicular to the hip flexion axis. Hip flexion is then the angle between the projected sagittal
thigh axis and the sagittal pelvic axis. A positive (Flexion) angle value corresponds to the
situation in which the knee is in front of the body.
2.5. Statistical Analysis:
A Within-Subjects Repeated Measures of Analysis of Variance (Repeated Measures
ANOVA) was performed to compare the three alternative footwear across the gait trials. Hence,
a 3 x 4 [3 Footwear (CC, FF, LT) x 4 Gait Trials (NG, US, AS, ES)] Repeated Measures
ANOVA was used to analyze the dependent kinetic variables of Mean Z-GRF and Peak Z-GRF;
and the Ankle Angle and Hip Angle at heel strike individually for footwear x gait trial interaction
and main effect significance. A Greenhouse Geisser correction was used if the Mauchly’s test of
sphericity was significant and if the assumption of sphericity was violated. The dependent
variables were tested initially for the footwear x gait trial interaction, and if a significant
interaction existed, the main effects of footwear and gait trials were ignored and pairwise
comparisons of the simple main effects for the existing significant interaction was performed
using the Sidak Bonferroni multiple comparisons correction. This was done for the both the
independent variables individually to identify how the simple main effects of one factor differ

98
over the levels of the other factor. For all analyses, alpha level was set a priori at p = 0.05 and all
statistical analyses was performed using the SPSS 21 statistical software package.
3. Results:
The repeated measures ANOVA revealed significant interactions between footwear and
gait trials for Mean Z-GRF and Ankle Angle. Significant interaction between footwear and gait
trials existed for Mean Z-GRF at F (3.163, 53.766) = 4.236, p = 0.008, ηp2 = 0.199 (Fig.1).
Pairwise comparisons using the Sidak Bonferroni correction was performed to analyze the
simple main effects across both factors of footwear and gait trials for Mean Z-GRF. Pairwise
comparisons for simple main effects for footwear revealed significant differences for CC
between NG and US at p = 0.019; between NG and AS p = 0.015; and between NG and ES at p
= 0.0005, with significantly greater Mean Z-GRF for NG compared to US, AS and ES; and for
FF between NG and US at p = 0.001; between NG and AS p = 0.011; and between NG and ES at
p = 0.0005, with significantly greater Mean Z-GRF for NG compared to US, AS and ES; for LT
between NG and ES at p = 0.018, with significantly greater Mean Z-GRF for NG compared to
ES. Pairwise comparisons for simple main effects for gait trials revealed significant differences
for NG between CC and LT at p = 0.008, with significantly greater Mean Z-GRF for CC
compared to LT; for US between CC and FF at p = 0.02 with significantly greater Mean Z-GRF
for CC compared to FF; for AS between FF and LT at p = 0.014, with significantly greater Mean
Z-GRF for LT compared to FF.
No significant differences existed for ES across all footwear. No significant footwear x
gait trials interaction existed for Peak Z-GRF and for main effect in footwear. However, there
was a significant difference in main effect for gait trials at F (3, 51) = 7.240, p = 0.0005, ηp2 =
0.299 (Fig.2). Pairwise comparisons using a Bonferroni correction revealed significant

99
differences between NG and AS p = 0.001 and between NG and ES at p = 0.0005, with
significantly greater Peak Z-GRF for NG compared to AS and ES.
Significant interaction between footwear and gait trails existed for Ankle Angle at F
(5.237, 89.034) = 2.403, p = 0.041, ηp2 = 0.124 (Fig.3). Pairwise comparisons using the Sidak
Bonferroni correction was performed to analyze the simple main effects across both factors of
footwear and gait trials for Ankle Angle. Pairwise comparisons for simple main effects for
footwear revealed significant differences for CC between NG and US at p = 0.030, between NG
and AS at p = 0.0005 and between NG and ES at p = 0.004, with significantly greater dorsi-
flexion angle in NG compared to US, AS and ES; for FF between NG and AS at p = 0.010 and
between NG and ES at p = 0.003, with significantly greater dorsi-flexion angle in NG compared
to AS and ES. No significant differences existed for LT across all gait trials. Pairwise
comparisons for simple main effects for gait trials revealed significant differences for NG
between LT and CC at p = 0.0005 and between LT and FF at p = 0.0005, with significantly
greater dorsiflexion angle in LT compared to both CC and FF; for US between LT and CC at p =
0.0005 and between LT and FF at p = 0.0005, with significantly greater dorsi-flexion angle in LT
compared to both CC and FF; for AS between LT and CC at p = 0.0005 and between LT and FF
at p = 0.0005, with significantly greater dorsi-flexion angle in LT compared to both CC and FF;
for ES between LT and CC at p = 0.0005 and between LT and FF at p = 0.0005, with
significantly greater dorsi-flexion angle in LT compared to both CC and FF. No significant
differences existed between CC and FF for all gait trials. No significant footwear x gait trial
interaction or significant difference for main effect footwear and main effect gait trials were
found with Hip Angle (Fig.4).

100
4. Discussion:
The purpose of this study was to analyze the effect of alternative footwear, [Crocs with
Clogs (CC), Flip-Flops (FF) and Low Top Slip Resistant Shoe (LT)] on lower extremity joint
angles (Ankle Angle and Hip Angle) and ground reaction forces (Mean Z-GRF and Peak Z-
GRF) during non-slip and slip gait trials [Normal Dry Gait (NG), Unexpected Slip (US), Alert
Slip (AS) and Expected Slip (ES)]. The findings from the study demonstrate significant
differences in both mean and peak vertical ground reaction forces during the stance phase and
also in ankle angles at heel strike. On average, lower ground reaction forces were seen in all slip
trials compared to normal dry surface gait. However, footwear differences were varied and were
dependent upon the gait trial being either slippery or non-slippery. The LT appeared to maintain
a normal dorsiflexion (close to neutral) ankle joint angle across all gait trials and alternative
footwear exhibited a plantar flexed foot position across all gait trials with significantly greater
plantar flexion in slip trials. The specific purpose of this paper is to analyze the impact of
alternative footwear on lower extremity joint angles and ground reaction forces during slip
events. The incidence of the slips and slip induced falls across different slip trials and across
types of footwear are reported elsewhere, with significantly greater incidence of slips in
alternative footwear (CC & FF) compared to LT and with significantly greater magnitude of slips
in US followed by AS and ES compared to NG.
Significant interactions between footwear and gait trials existed for Mean Z-GRF and
Ankle Angle at heel strike, suggesting the influence of both footwear and gait trial conditions in
the outcome of lower extremity joint angles and ground reaction forces. Data from the current
study demonstrated significantly lower mean and peak ground reaction forces for all slip trials
(US, AS, ES) compared to the dry normal gait (NG) for all footwear, which explains the

101
incomplete transfer of weight to the stance/support extremity during slips and slip induced falls.
Individual footwear variations in each of the gait trial were varied where greater mean GRF was
seen in CC compared to LT in NG and compared to FF in US. AS exhibited greater mean GRF
in LT compared to FF, while no significant differences existed for ES, where slips were minimal
irrespective of the footwear used and subsequently ground reaction forces were similar across all
footwear during ES. Modifications in lower extremity gait kinematics appeared to be present
only in the more distal ankle joint angles, while the more proximal hip joint angles showed no
significant differences. Ankle angle at heel strike exhibited significant differences across all gait
trials, where the LT had greater or more dorsi-flexion angle while both alternative footwear had
more plantar flexion angle suggesting a flatter foot placement which may be attributed to a
different “touch down geometry” associated with these alternative footwear (De Wit et al. 2000;
Shroyer et al. 2010). The alternative footwear (CC & FF) also demonstrated greater plantar
flexion angle at heel strike in the slip trials compared to the dry normal gait trial (NG) in an
attempt to make contact with a more flatter foot position, and having a greater surface area of the
foot and a lesser foot floor angle, thereby preventing slips and slip induced falls, while the LT,
with lower incidence of slips, exhibited no differences across all gait trials. It also appeared that
gait modifications due to nature of the slippery trial and footwear design characteristics were
limited to the ankle joint, as the hip joint angles exhibited no significant differences across all
footwear and all gait trials.
Extrinsic Factors – Impact of footwear design characteristics:
The footwear’s geometrical design characteristics have been shown to affect human
balance and gait (Chander et al. 2014; Perry, Radtke & Goodwin 2007; Menant et al. 2008;
Menant et al. 2009; Divert et al. 2005; Bohm & Hosl 2010) and especially with the growing
102
usage of alternative footwear such as the thong-styled flip flops and open-toed sandals, several
studies have focused on their impact on the biomechanics of human gait (Zhang et al. 2013;
Shroyer et al. 2010). The impact of flip flops on ground reaction forces reported from previous
studies have shown an increased peak vertical ground reaction force in flip flops (Shakoor et al.
2010; Zhang et al. 2013) compared to other shod conditions and have attributed their findings to
the reduced shock attenuation capabilities of the flip flops. The current study exhibited greater
Mean Z-GRF in CC compared to LT, which again may be attributed to the lower shock
attenuation capabilities of the crocs and the absence of a cushion type sole. Although the CC and
FF had similar Mean Z-GRFs, significant differences were found only between CC and LT, but
not between FF and LT. These findings were solely under dry normal gait conditions. The
impact of these alternative footwear under slippery conditions is still unknown. The current study
demonstrated significantly lower Mean Z-GRF for FF compared to CC in US and LT in AS,
which may be attributed to the greater incidence of slips in FF with incomplete transfer of body
weight to the lower extremity undergoing slips (Redfern et al. 2001), while individuals during
the ES were able to minimize the slips and did not have significant differences between
footwear. Across gait trials, both Mean and Peak Z-GRF were significantly lower in all slip trials
compared to normal dry gait trial in all footwear conditions. The lower GRFs in slippery
conditions can be related to the greater incidence of slips and due to the body weight not being
completely transferred to the slipping extremity (Redfern et al. 2001) rather than to the design or
geometric features of the footwear.
Existing literature on the ankle angle with alternative footwear is debatable with
inconsistent findings (Zhang et al. 2013; Shroyer et al. 2010, Chard et al. 2013). Previous
literature supporting an increased dorsiflexion angle at heel contact with alternative footwear

103
have suggested it, as a mechanism to retain the flip flops during weight acceptance phase of the
gait cycle (Chard et al. 2013), while studies supporting a greater plantar flexed angle or a more
flatter foot placement with alternative footwear have suggested it, as a mechanism to grip the
footwear using the toes (Shroyer et al. 2010; Zhang et al. 2013). Our results support Shroyer and
Zhang’s findings in demonstrating a greater plantar flexed angle or a more flat foot position at
heel strike for normal dry surface gait and also for all slippery trials compared to LT shod
condition.
Intrinsic Factors – Impact of perception and anticipation of slips:
The perception and anticipation of a slippery environment has been shown as a vital
intrinsic factor in predicting the outcome of a slip event. The prior knowledge and anticipation of
a slippery floor allows the individuals to reduce the potential slips by making adaptations to the
biomechanics of gait (Cham & Redfern, 2002a; Lockhart et al. 2007). These gait adaptations
which attempt to minimize the incidence of slips and slip induced falls include a shorter step
length, a reduced foot floor angle and creating a more flat foot placement at heel strike and
subsequently reducing the heel contact velocity, and also minimize the normal and shear forces
during stance phase and thereby also lowering the required coefficient of friction when
maneuvering slippery flooring conditions (Lockhart et al. 2007; Redfern et al. 2001; Cham and
Redfern, 2002a; Moyer et al. 2006; Cham & Redfern, 2001). Based on the results from our
study, the reduction in the ground reaction forces during the expected slip (ES) across all
footwear can be attributed to these gait modifications that occur under slippery conditions. This
was also evident by least number of slip incidences in the ES. However, the reduced Mean and
Peak Z-GRF during the US cannot be treated as gait modifications. During these unexpected
slippery gait trials the individuals had either no knowledge of the slippery flooring conditions

104
and the highest incidence of slips. Hence, the reductions in the GRFs during US could only be
attributed to the incomplete transfer of the body weight on to the supporting and slipping lower
extremity (Redfern et al. 2001). The AS gait condition, provided the individuals with a warning
of a slippery floor, but they were still unaware of which trial would be slippery. AS exhibited
second highest incidence of slips followed by US. Hence, the reduction in the GRFs may be
attributed to either one or both of the above mentioned reasons.
Previous studies have shown that a larger or a greater foot floor angle is directly related
with slips and slip induced falls (Strandberg & Lanshammar, 1981; Moyer et al. 2006) and a
reduced foot floor angle or a more flat foot position is utilized in the event of an anticipated slip
(Cham & Redfern, 2002a). This was supported in our study, in which individuals utilized
increasingly greater plantar flexion angle from US compared to AS compared to ES, in an
attempt to minimize slips. Although, the design features and the touch down geometry were
responsible for the alternative footwear to have greater plantar flexed joint angle during NG (De
Wit et al. 2000), the increasing plantar flexion angle could be attributed to the gait modifications
in an attempt to reduce slips. Decreasing the dorsiflexion angle and increasing the plantar flexion
angle at heel contact increases the footwear-floor contact area at landing and attempt to minimize
center of mass excursions outside the base of support and reducing the frictional requirements
needed to prevent a slip (Gronqvist et al. 2001; Moyer et al. 2006). Contrary to the alternative
footwear (CC & FF), the LT, just like other shod conditions which cover the complete foot and
move as ne rigid segment, maintained similar dorsiflexion to neutral ankle angles at heel strike
across all gait trials, as there was minimal need for gait modifications due to the slippery flooring
conditions and subsequently, the LT had the almost minimal to no slip incidents across all gait
trials.

105
5. Conclusion:
Based on the results from the current study, the interaction between the type of footwear
and the gait trial conditions, contributed in determining the modifications in gait biomechanics
during normal dry gait conditions due to the footwear design features and touch down geometry
and during slippery flooring conditions, either during a slip or anticipating a slip. The GRFs
during slip trials were lower compared to normal dry gait conditions across all footwear due to
incomplete weight transfer on the slipping foot and in an attempt to minimize the required
coefficient of friction and prevent slips, with anticipation of slips. It also appears that both
alternative footwear (CC & FF) had plantar flexed, flat foot position angle at heel strike
compared to LT both during normal dry gait and even greater plantar flexion angles in slip trials.
The LT had better performance in preventing slips and given the conditions, the low top slip
resistant shoe proves to be the choice of footwear for maneuvering slippery flooring conditions.
Even though the alternative footwear serves for comfort and easy donning, it might not be the
choice of footwear to prevent slips and slip induced falls. Future research should focus on the
interactions of these alternative footwear and slippery conditions with physical workload, which
is a common occurrence in occupational environments over the course of the work day.

106
Fig.1: Mean Z-Ground Reaction Force (N) during stance phase for Crocs, Flip-Flops and Low Top Slip Resistant Shoe
during normal gait (NG), unexpected slip (US), alert slip (AS) and expected slip (ES) events.
Fig.2: Peak Z-Ground Reaction Force (N) during stance phase for Crocs, Flip-Flops and Low Top Slip Resistant Shoe
during normal gait (NG), unexpected slip (US), alert slip (AS) and expected slip (ES) events.
§ denotes significant interaction; * denotes significant difference for footwear across gait trials and # denotes
significant difference for gait trials across footwear. All differences were significant at alpha level p=0.05.
400
450
500
550
600
650
700
N G U S A S E S
Z-G
RF
(N)
GAIT TRIALS
MEAN Z-GRF - STANCE PHASE
Crocs Flip Flop Low Top
750
800
850
900
950
1000
1050
N G U S A S E S
Z-G
RF
(N)
GAIT TRIALS
PEAK Z-GRF - STANCE PHASE
Crocs Flip Flop Low Top
* *
*
*
*
*
*
# #
#
§
#
# #
#

107
Fig.3: Ankle angle (degrees) at heel strike for Crocs, Flip-Flops and Low Top Slip Resistant Shoe during normal dry
gait (NG), unexpected slip (US), alert slip (AS) and expected slip (ES) events.
Fig.4: Hip Angle (degrees) at heel strike for Crocs, Flip-Flops and Low Top Slip Resistant Shoe during normal dry gait
(NG), unexpected slip (US), alert slip (AS) and expected slip (ES) events.
§ denotes significant interaction; * denotes significant difference for footwear across gait trials and # denotes significant difference for gait trials across footwear. All differences were significant at alpha level p=0.05.
-10
-8
-6
-4
-2
0
2
4
6
N G U S A S E S
AN
GLE
(DEG
REE
S)
GAIT TRIALS
ANKLE ANGLE AT HEEL STRIKE
Crocs Flip Flop Low Top
0
5
10
15
20
25
30
35
N G U S A S E S
AN
GLE
(DEG
REE
S)
GAIT TRIALS
HIP ANGLE AT HEEL STRIKE
Crocs Flip Flop Low Top
§ *
* * *
* *
# # # # # # # #

108
LIST OF REFERENCES

109
1. Bohm, H, &Hosl, M. (2010). Effect of boot shaft stiffness on stability joint energy and
muscular co-contraction during walking on uneven surface. Journal of Biomechanics, 43
(2010), 2467–2472.
2. Brady, R. A., J Pavol, M., Owings, T. M., & Grabiner, M. D. (2000). Foot displacement
but not velocity predicts the outcome of a slip induced in young subjects while walking.
Journal of biomechanics, 33(7), 803-808.
3. Carl, T. J., & Barrett, S. L. (2008). Computerized analysis of plantar pressure variation in
flip-flops, athletic shoes, and bare feet. Journal of the American Podiatric Medical
Association, 98(5), 374-378.
4. Chander, H, Garner JC & Wade, C. (2014). Impact on balance while walking in
occupational footwear. Footwear Science.
5. Cham, R., Redfern, M.S., (2002a). Changes in gait when anticipating slippery floors. Gait
Posture 15, 159–171.
6. Cham, R., Redfern, M.S., (2002b). Heel contact dynamics during slip events on level and
inclined surfaces. Safety Sci. 40, 559–576.
7. Chard, A., Greene, A., Hunt, A., Vanwanseele, B., & Smith, R. (2013). Effect of thong
style flip-flops on children’s barefoot walking and jogging kinematics.Journal of foot and
ankle research, 6(1), 1-9.
8. Cohen, H.H., Cohen, D.M., (1994a). Psychophysical assessment of theperceived
slipperiness of floor tile surfaces in a laboratory setting. J.Safety Res. 25 (1), 19–26.
9. Cohen, H.H., Cohen, D.M., (1994b). Perceptions of walking surface slipperiness under
realistic conditions, utilizing a slipperiness rating scale. J. Safety Res. 25 (1), 27–31.

110
10. Courtney, T. K., Sorock, G. S., Manning, D. P., Collins, J. W. and Holbein-Jenny, M. A.
(2001a). Occupational slip, trip, and fall-related injuries can the contribution of
slipperiness be isolated? Ergonomics, 44, 1118- 1137.
11. Davis, P. R. (1983). Human factors contributing to slips, trips and falls. Ergonomics,
26(1), 51-59.
12. De Wit, B., De Clercq, D., & Aerts, P. (2000). Biomechanical analysis of the stance
phase during barefoot and shod running. Journal of biomechanics, 33(3), 269-278.
13. DiDomenico, A., McGorry, R. W., & Chang, C. C. (2007). Association of subjective
ratings of slipperiness to heel displacement following contact with the floor. Applied
ergonomics, 38(5), 533-539
14. Divert, C., Mornieux, G., Baur, H., Mayer, H., Belli, A. (2005). Mechanical Comparison
of Barefoot and Shod Running. International journal of Sports Medicine: 26, 593 – 598.
15. Gauchard, G., Chau, N., Mur, J. M., & Perrin, P. (2001). Falls and working individuals:
role of extrinsic and intrinsic factors. Ergonomics, 44(14), 1330-1339.
16. Gronqvist, R., Abeysekera, J., Gard, G., Hsiang, S.M., Leamon, T.B., Newman, D.J.,
Gielo-Perczak, K., Lockhart, T.E., Pai, C.Y.-C., 2001. Human-centred approaches in
slipperiness measurement. Ergonomics. 44 (13), 1167–1199.
17. Hanson, J. P., Redfern, M. S., &Mazumdar, M. (1999). Predicting slips and falls
considering required and available friction. Ergonomics, 42(12), 1619-1633.
18. Lin D, Seol H, Nussbaum M, Madigan M (2008). Reliability of COP- based postural
sway measures and age-related differences. Gait and posture 28, 337-342
19. Lockhart, T. E. (1997). Biomechanics of slips and falls in the elderly. Master’s Thesis
submitted to the Texas Tech University.

111
20. Lockhart, T. E., Spaulding, J. M., & Park, S. H. (2007). Age-related slip avoidance
strategy while walking over a known slippery floor surface. Gait & posture, 26(1), 142-
149.
21. Majumdar, Dhurjati., Banerjee, P. K., Majumdar, D., Pal, M., Kumar, R. A. K. E. S. H.,
&Selvamurthy, W. (2006). Temporal spatial parameters of gait with barefoot, bathroom
slippers and military boots. Indian journal of physiology and pharmacology, 50(1), 33.
22. McGorry, R. W., DiDomenico, A., & Chang, C. C. (2010). The anatomy of a slip:
Kinetic and kinematic characteristics of slip and non-slip matched trials. Applied
ergonomics, 41(1), 41-46.
23. Menant, J, Perry, S, Steele, J, Menz, H,Munro, B, Lord, S (2008). Effects of Shoe
Characteristics on Dynamic Stability When Walking on Even and Uneven Surfaces in
Young and Older People. Arch Phys Med Rehabil; 89, 1970-6.
24. Moyer, B. E., Chambers, A. J., Redfern, M. S., & Cham, R. (2006). Gait parameters as
predictors of slip severity in younger and older adults. Ergonomics, 49(4), 329-343.
25. Perkins, P. J. 1978, Measurement of slip between the shoe and ground during walking, in
Walkway Surfaces: Measurement of Slip Resistance, ASTM STP 649, Philadelphia, PA.
26. Perry S, Radtke A, Goodwin C (2007). Influence of footwear midsole material hardness
on dynamic balance control during unexpected gait termination. Gait and posture 25, 94-
98.
27. Redfern, M. S., Cham, R., Gielo-Perczak, K., Grönqvist, R., Hirvonen, M., Lanshammar,
H.,& Powers, C. (2001). Biomechanics of slips. Ergonomics, 44(13), 1138-1166.
28. Redfern, M.S., &DiPasquale, J. (1997). Biomechanics of descending ramps. Gait &
Posture, 6(2), 119-125.

112
29. Shakoor, N., Sengupta, M., Foucher, K. C., Wimmer, M. A., Fogg, L. F., & Block, J. A.
(2010). Effects of common footwear on joint loading in osteoarthritis of the
knee. Arthritis care & research, 62(7), 917-923.
30. Shroyer JF, Shroyer JE, Sumner AM, Weimar WH: Effect of various thong flip-flops on
pronation and eversion during midstance. Med Sci Sport Exer. 2010, 42:270.
31. Shroyer, J. F., & Weimar, W. H. (2010). Comparative analysis of human gait while
wearing thong-style flip-flops versus sneakers. Journal of the American Podiatric
Medical Association, 100(4), 251-257.
32. Strandberg, L. and Lanshammar, H. (1981). The dynamics of slipping accidents, Journal
of Occupational Accidents, 3, 153-162.
33. Winter, D. A. (1995). Human balance and posture control during standing and walking.
Gait & posture, 3(4), 193-214.
34. Fong Yan, A., Sinclair, P. J., Hiller, C., Wegener, C., & Smith, R. M. (2013). Impact
attenuation during weight bearing activities in barefoot vs. shod conditions: a systematic
review. Gait & posture, 38(2), 175-186.
35. Zhang X, Paquette MR & Zhang S: A comparison of gait biomechanics of flip-flops,
sandals, barefoot and shoes. Journal of Foot and Ankle Research. 2013, 6:45.

113
MANUSCRIPT III
SLIP RELATED LOWER EXTREMITY MUSCLE ACTIVATION
IN ALTERNATIVE FOOTWEAR

114
1. Introduction:
Slips, trips and falls occur as a result of failure of normal locomotion and failure of
attempts at equilibrium recovery following an induced imbalance (Davis, 1983; Gauchard,
2001). The Bureau of Labor Statistics reported 15% of a total of 4,693 workplace fatalities and a
total of 299,090 cases of non-fatal workplace injuries that were due to slips, trips and falls (BLS,
2011). The annual cost of workplace injuries due to slips, trips and falls in the United States was
estimated to be over 6 billion US dollars with an expected cost of $43.8 billion by 2020
(Courtney et al, 2001a). In an occupational setting, postural instability can be hazardous due to
an increased risk of falls, slips, trips and other accidents (Kincl et al, 2002). In addition to acute
fall related injuries, overexertion injuries have very high incidences for slip induced falls and
makes the effort of recovering from an induced slip very demanding (Courtney & Webster,
2001b).
Electromyography (EMG) analysis have been used to analyze neuromuscular
mechanisms in human balance and gait. Muscle activity during normal human locomotion
consists predominantly of isometric or eccentric muscle action of the lower extremity muscles
that allows efficient storage and transfer of energy between limb segments with brief periods of
high energy concentric muscle actions that help in forward motion of the body (Boakes & Rab,
2006). During unanticipated slips reactive strategies emerge which are defined as the primary
corrective response brought about by muscular forces and corrective moments to re-establish
dynamic balance following a slip. However, during an anticipated slip, proactive strategies are
employed which are best described as the balance control mechanisms that occur prior to an
impending slip (Chambers & Cham, 2007). Muscle activity from the lower extremity that are

115
accountable for the reactive and proactive lower extremity moments are crucial factors in the
human postural control system that are required both during a slip and for an impending slip.
EMG muscle activity under slippery conditions have been reported for lower extremity
muscles such as the quadriceps, hamstrings and gastrocnemius-soleus (Lockhart, 2007; Parijat &
Lockhart, 2008; Chambers & Cham, 2007). During slips, muscle activity from the lower
extremity have been shown to be higher in magnitude and have longer activation periods (Tang
et al. 1998; Tang et al. 1999; Ferber et al. 2002). A longer hamstring activity and a lower
quadriceps activity during the stance phase and longer hamstring activity and decreased
quadriceps mean activity during the swing phase was reported by Lockhart (Lockhart, 2007).
Furthermore, lower mean and peak swing leg gastrocnemius activity was also reported during
slippery conditions (Lockhart, 2007). Similar muscular responses were also seen under slip
events when compared with young and old aged individuals, with a delayed latency from vastus
lateralis activity in severe slips (Chamber & Cham, 2007). More commonly, corrective muscular
responses have been shown to arise from the knee joint by producing large moments to help
recover from a slip, whereas the hip joint seems to play a crucial role in stabilization (Parijat &
Lockhart, 2007). Muscular activity during an alert or an expected slip resulted in a greater
activation of the lower extremity musculature with the greatest increase in activity reported in the
hamstrings and also with an early activation of the gastrocnemius muscle (Chambers & Cham,
2007). Greater muscle co-contraction analyzed with the co-contraction index (CCI) using the
agonist / antagonist pairs of the ankle (tibialis anterior and medial gastrocnemius) and at the knee
(vastus lateralis and medial hamstrings) were reported when anticipating a slippery surface and
individuals who walked with a greater co-contraction were predisposed to experience less severe
slips (Chambers & Cham, 2007).

116
Furthermore, different types of footwear have shown to impact normal balance and gait
mechanisms (Chander et al. 2014; Perry, Radtke & Goodwin 2007; Menant et al. 2008; Menant
et al. 2009; Divert et al. 2005; Bohm & Hosl 2010) and improper alignment of the foot due to the
geometrical design characteristics of the footwear can lead to an increased metabolic cost,
thereby potentially leading to a faster rate of development of muscular fatigue. More efficient
walking patterns could possibly delay the onset of fatigue as physical activity progresses
(Hanson et al. 2011). Certain commonly worn footwear, such as slippers were found to be
hazardous as they slowed down reactions to perturbations and also had adverse effects on posture
reactions (Hosoda et al., 1997). It is also suggested that wearing alternative footwear such as flip
flops, sandals and crocs, which do not secure the hind foot and does not move with the foot as
one rigid segment, decreases an individual’s movement ability (Robinson et al. 2011) and may
increase the required muscle activity from the lower extremity.
Although there is an increasing amount of literature assessing the impact of different
types of footwear, including alternative footwear on human locomotion, there is still dearth of
literature on the impact of these footwear on slippery conditions. Moreover the existing literature
on alternative footwear have focused on the gait kinematics and kinetics. The specific purpose of
this study was to analyze the impact of alternative footwear [Crocs with clogs (CC), Flip-Flops
(FF) and Low Top Slip Resistant Shoe (LT)] under multiple gait conditions [Dry normal surface
(NG); Unexpected Slip (US), Alert Slip (AS) and Expected Slip (ES)] on lower extremity muscle
activity [Vastus Medialis (VM), Medial Hamstrings (MH), Tibialis Anterior (TA) and Medial
Gastrocnemius (MG)]. Based on previous literature, we hypothesized that the alternative
footwear (CC & FF) would demonstrate greater muscle activity compared to LT both during
normal dry gait conditions and slippery gait conditions. We also hypothesized that the slippery

117
conditions (US, AS & ES) will demonstrate greater muscle activity compared to the normal dry
gait condition (NG).
2. Methodology:
The purpose of the study was to examine muscle activity during the stance phase of the
gait cycle and also to analyze the maximal voluntary isometric contraction. Muscle activity from
four lower extremity muscles were compared across the three alternative footwear [Crocs with
clogs (CC), Flip-Flops (FF) & Low Top Slip Resistant Shoe (LT)] under four gait conditions
[(Normal Dry Gait (NG), Unexpected Slip (US), Alert Slip (AS) & Expected Slip (ES)] using a
within subjects repeated measures design.
2.1. Participants:
Eighteen healthy male participants [Age: 22.28 ± 2.2 years; Height: 177.66 ± 6.9 cm;
Mass: 79.27 ± 7.6 kg] completed the study. Participants who had any history of musculoskeletal
injuries, cardio-vascular abnormalities, neurological disorders, vestibular disorders, under
medications or any inability to walk and stand without support were excluded from the study. All
participants were recruited through flyers approved by the University’s Institutional Review
Board (IRB). All participants read and signed the informed consent and also filled out the
physical activity readiness questionnaire (PAR-Q) to rule out any of the above mentioned health
complications and cleared for participation in the study.
2.2. Instrumentation:
2.2.1. Electromyography:
Electromyography (EMG) data was collected using the NoraxonTelemyo DTS 900
system (Scottsdale, AZ) through the Vicon (Oxford, UK) Nexus software. The data was sampled
at 1000Hz and an EMG pipeline was used to analyze the raw data. Vicon Nexus (Oxford, UK)

118
3D motion capture system with 12 infra-red T-series cameras was used to collect and analyze
kinematic gait data using the lower body plug-in gait model from the Helen-Hayes marker
system along with the analog EMG data. The motion capture system was calibrated every day
prior to data collection and the kinematic data was sampled at 100Hz and collected using the
Vicon Nexus software.
2.2.2. Fall Arrest System:
A uni-track fall arrest system from Rigid Lines (Millington, TN); a lightweight horizontal
rigid fall arrest track capable of supporting up to 900lb and installed with an inverted-U steel
frame fixed to the laboratory floor was used as the safety fall arrest system to prevent any
undesired falls. Participants were attached to the fall arrest track with the help of a back pack
type harness system attaching to a moveable trolley inside the fall arrest track. The trolley was
capable of locking itself without moving if there was greater than 50lb force imparted on the
harness line. The fall arrest track and the harness along with the trolley were connected by a
pulley system that allowed the investigators to move the trolley on top of the walking participant
so that, the participants were not leading the trolley now was the trolley leading the participant.
This was done to take away the closed kinematic chain between the participant and the fall arrest
system and to minimize the impact of the harness and fall arrest system on the outcome of the
slip events.
2.2.3. Slippery Agent or Contaminant:
Industrial vegetable based glycerol mixed with water in the ratio of 75% glycerol and
25% water was used as the slippery agent. The 75%-25% ratio was chosen for the study based on
previous literature and with initial practice sessions in the laboratory prior to starting data
collection. During the slip gait trials or slip events, glycerol was applied and evenly distributed

119
on the Bertec force plate, on which the left leg of all participants, irrespective of their dominant
extremity, would make contact during the gait trials. The application of the slippery agent was
always performed by the primary investigator using the same measured and calibrated container
to minimize the errors due to inter and intra rater reliability.
2.3.Experimental Procedures:
All participants visited the Applied Biomechanics Laboratory four times, separated by a
minimum of 24 hours. A description of the experimental procedures for each visit is provided
below.
2.3.1. Day 1:
The first visit was treated as a familiarization day, where all participants were exposed to
the testing measures for gait trials and muscle activity. Informed consent was obtained from all
participants following which they completed a physical activity readiness questionnaire (PAR-Q)
and screened for any complications that might hinder them from completing the study.
Anthropometric measurements such as height, weight, leg length, knee width, ankle width and
foot/shoe size. Following this, participants were briefed on the walking gait conditions and were
allowed to practice walking at their self-selected pace across the lab walkway. Participants were
encouraged to walk at the same pace for every trial and their starting points were adjusted by the
investigators to make sure there is clean contact with the dual force plates positioned in the
middle of the walkway across the lab floor. Next the participants were positioned and strapped
inside the harness connecting to the trolley and ultimately to the fall arrest track. Participants also
performed the same practice gait trials with the harness while the investigators moved the trolley
in-sequence along with the participant. A number of practice gait trials were performed until the
subjects walked normally and with the same speed. Finally, the participants were assured of the

120
fall arrest system catching them in the case of an undue fall, initiated by the slip. Participants
were also asked to let go of their body weight and drop down on the harness system to further
ensure that the fall arrest system would support their entire body weight and catch them
preventing them hitting the floor, in the case of a slip. All participants were also asked to refrain
from any physical workload especially to their lower extremities in terms of resistance or aerobic
training and were also asked to avoid any pain medications until all their testing days were
completed.
2.3.2. Day 2, Day 3 and Day 4:
Visits 2, 3 and 4 were again separated by a minimum of 24 hours and treated as
experimental testing days. These experimental testing days followed the same testing protocol
except with different alternative footwear (CC, FF & LT) which were chosen and provided to the
participant using a counter balance design to remove order effects.
2.3.2.1.Participant Preparation:
Each visit will start the experimental testing day with a counter balanced allotment of the
either the CC, FF or LT to the participants. Participants were also provided black spandex shorts
and t-shirts. EMG bipolar electrodes were placed with an inter-electrode distance of 2cm on the
muscle belly of VastusMedialis (VM), Medial Hamstrings (MH), Tibialis Anterior (TA) and
Medial Gastrocnemius (MG) with a ground electrode on the tibial tuberosity on the left leg. The
electrode placement surface area was prepped adequately to minimize skin resistance by shaving
hairy surfaces and scrubbing with alcohol rubs. In addition, reflective markers were placed on
the participant’s lower extremity and on the footwear following a lower body plug-in gait model
from the Helen-Hayes system.

121
2.3.2.2.Experimental Testing:
The experimental testing session began with the participant wearing the footwear given to
them and had a series ofpractice gait trials across the vinyl floored testing surface under dry non-
slip conditions to get accustomed with the gait trials and the testing environment at a self-
selected speed of walking. These practice gait trials were also used to make sure that the
participants strike the center of the force plate with both their feet, unintentionally at their normal
walking pattern and pace and to avoid any intentional modification of their step lengths during
the data collection procedure. Isometric Maximal Voluntary Contractions (MVCs) of VM, MH,
TA and MG were collected for 3 trails of 5 second isometric contractions performed in the
middle range of motion of the ankle and knee joints. The participants were asked to rest for 5
minutes after the MVC protocol to avoid undue lower extremity muscular fatigue.
Following the initial practice gait trials, the participants were strapped in the harness
system to the fall arrest track and a static capture of the lower body plug-in model was
performed. With the completion of the static capture, the participants again started a series of
practice gait trials with the harness fall arrest system and the trolley being moved in-sequence
with the participant. Practice trials were performed until the participants walked with ease in a
similar pattern and with similar walking speed. Dynamic capture was done for 5 normal dry gait
trials with no breaks or stops between the gait trials with the instruction “walk as normally as
possible with the same speed”. With the completion of the 5th normal dry gait trial, participants
still walked with the same pattern and speed, but at the end of all further gait trials, the
participants took 30-45 second breaks facing away from the walking surface and listened to
music played on a noise-cancellation headphones, which would take away the knowledge of the
potential slip trial, again with the same walking instructions.

122
Following a repeated number of gait trials under normal dry conditions, one particular
trial was chosen randomly to be the unexpected slip (US) trial and the contaminant was applied
to the force plate without the participant’s knowledge. Participants were still given the same
walking instruction to ensure that the walking trial will be treated as an unexpected slip event.
On completion of the US, participants were allowed to rest briefly and the footwear removed for
cleaning the contaminant. The force plate was also cleaned with a dry-wet vacuum and soap
water and dried completely and made ready for the next gait trials. Participants then performed
multiple normal dry gait trials with the same 30-45 second breaks and once a normal gait pattern
resumed, participants were given the instruction that all of the following trials “may or may not
be slippery”. Multiple gait trials with the same protocol and instructions were performed in
succession and one trial was randomly chosen to be the alert slip (AS) trial, where the
contaminant was applied again without the knowledge of the participant, but differed from the
US in terms of the instruction given to the participant. Finally, with the completion of NG, US
and AS, participants visually saw the application of the contaminant on the force plate for one
last walking trial and were given the instruction that the following trial “will be slippery” and
treated as an expected slip (ES) trial.
2.4.Data Analysis:
The analog EMG measures were analyzed using the Vicon Nexus software. The raw data
was cleaned removing unlabeled markers, filled gaps in the markers using a spline fill and edited
to have two gait cycles starting with the right leg. The raw data was filtered using a Butterworth
fourth order filter with zero lag with cut off frequency of 300Hz and exported as excel files for
further analyses. Vicon Nexus software was used to determine the moment of heel strike and toe
off phase of the left leg during the gait trials to determine the stance phase beginning and ending

123
of the stance phase. The raw muscle activity data from the four left lower extremity muscles
(VM, MH, TA and MG) were rectified and used to calculate Mean Muscle Activity during
MVCs(mV) (VM MVC, MH MVC, TA MVC and MG MVC) , Mean Muscle Activity (mV)
(Mean VM, Mean MH, Mean TA and Mean MG), Peak Muscle Activity (mV)(Peak VM, Peak
MH, Peak TA and Peak MG) and %MVC (%MVC VM, %MVC MH, % MVC TA and %MVC
MG) during the stance phase of the gait cycle.
2.5. Statistical Analysis:
A Within-Subjects Repeated Measures of Analysis of Variance (Repeated Measures
ANOVA) was performed to compare the three alternative footwear across the gait trials. Hence,
a 3 x 4 [3 Footwear (CC, FF, LT) x 4 Gait Trials (NG, US, AS, ES)] Repeated Measures
ANOVA was used to analyze the dependent EMG variablesof Mean Muscle Activity (Mean
VM, Mean MH, Mean TA and Mean MG), Peak Muscle Activity (Peak VM, Peak MH, Peak TA
and Peak MG) and %MVC (%MVC VM, %MVC MH, % MVC TA and %MVC MG)
individually for footwear x gait trial interaction and main effect significance. A 1 x 4 [1 Time x 3
Footwear (CC, FF, LT)] Repeated Measures of ANOVA was performed to compare MVCs of
four muscles (VM, MH, TA, MG) across all three footwear. A Greenhouse Geisser correction
was used if the Mauchly’s test of sphericity was significant and if the assumption of sphericity
was violated. The dependent variables were tested initially for the footwear x gait trial
interaction, and if a significant interaction existed, the main effects of footwear and gait trials
were ignored and pairwise comparisons of the simple main effects for the existing significant
interaction was performed using the BonferroniSidak multiple comparisons correction. This was
done for the both the independent variables individually to identify how the simple main effects
of one factor differ over the levels of the other factor. For all analyses, alpha level was set a

124
priori at p = 0.05 and all statistical analyses was performed using the SPSS 21 statistical software
package.
3. Results:
The 3x4 within subjects repeated measures ANOVA revealed significant interactions
between footwear and gait trials for Mean Muscle activity (Mean VM, Mean MH & Mean TA).
Significant interaction between footwear and gait trials existed for Mean VM at F (3.598, 61.171)
= 5.662, p = 0.001, ηp2= 0.250 (Fig.1). Pairwise comparisons using the BonferroniSidak
correction was performed to analyze the simple main effects across both factors of footwear and
gait trials for Mean VM. Pairwise comparisons for simple main effects for footwear revealed
significant differences for CC between NG and US at p = 0.001 and between NG and ES p =
0.031, with significantly lower Mean VM during NG compared to US and ES;and between US
and ES at p = 0.028, with significantly lower Mean VM during ES compared to US; for
FFbetween NG and US at p = 0.0005 and between NG and AS p = 0.015, with significantly lower
Mean VM during NG compared to both US and AS;and between US and ES at p = 0.015, with
significantly lowerMean VM duringES compared to US.No significant differences existed for LT
across all gait trials. Pairwise comparisons for simple main effects for gait trials revealed
significant differences for US between CC and LT at p = 0.012, and between FF and LT at p =
0.001, with significantly lower Mean VM for LT compared to CC and FF; for AS between FF and
LT at p = 0.001, with significantly lower Mean VM for LT compared to FF. No significant
differences existed for NG and ES across all footwear.
Significant interaction between footwear and gait trials existed for Mean MH at F (4.381,
74.476) = 2.661, p = 0.035, ηp2= 0.135 (Fig.2). Pairwise comparisons using the Sidak Bonferroni
correction was performed to analyze the simple main effects across both factors of footwear and

125
gait trials for Mean MH. Pairwise comparisons for simple main effects for footwear revealed
significant differences for CC between NG and US at p = 0.006 and between NG and ES at p =
0.001, with significantly lower Mean MH during NG compared to US and ES; for FFbetween NG
and US at p = 0.0005, between NG and AS p = 0.001 and between NG and ES at p = 0.028, with
significantly lower Mean MH during NG compared to US, AS and ES; for LT between NG and
US at p = 0.015, with significantly lower Mean MH during NG compared to US. No significant
differences existed for LT between NG, AS and ES. Pairwise comparisons for simple main effects
for gait trials revealed significant differences for US between FF and LT at p = 0.0005, with
significantly lower Mean MH in LT compared to FF; for AS between FF and LT at p = 0.024,
with significantly lower Mean MH for LT compared to FF. No significant differences existed for
NG and ES across all footwear.
Significant interaction between footwear and gait trials existed for Mean TA at F (2.451,
41.667) = 3.876, p = 0.022, ηp2= 0.186 (Fig.3). Pairwise comparisons using the Sidak Bonferroni
correction was performed to analyze the simple main effects across both factors of footwear and
gait trials for Mean TA. Pairwise comparisons for simple main effects for footwear revealed
significant differences for FFbetween NG and US at p = 0.0005 and between NG and AS p =
0.005, with significantly lower Mean MH during NG compared to US and AS; and between US
and ES at p = 0.002, with significantly lower Mean MH during ES compared to US. No
significant differences existed for CC and LT across all gait trials. Pairwise comparisons for
simple main effects for gait trials revealed significant differences for US between FF and LT at
p= 0.001, with significantly lower Mean TA in LT compared to FF; for AS between FF and LT at
p = 0.006, with significantly lower Mean TA for LT compared to FF. No significant differences
existed for NG and ES across all footwear. No significant footwear x gait trials interaction existed

126
for Mean MG and no main effect for gait trials was found. However, significant main effect for
footwear existed at F (2, 34) = 4.972, p = 0.013, ηp2= 0.226 (Fig.4). Pairwise comparisons with a
Bonferroni correction revealed significant differences between CC and FF at p = 0.006 and
between LT and FF at p = 0.038, with significantly lower Mean MG for CC and LT compared to
FF.
The 3x4 within subjects repeated measures ANOVA revealed significant interactions
between footwear and gait trials for Peak Muscle Activity (Peak VM, Peak MH & Peak TA).
Significant interaction between footwear and gait trials existed for Peak VM at F (2.869, 48.766)
= 4.686, p = 0.0005, ηp2= 0.216 (Fig.5). Pairwise comparisons using the Sidak Bonferroni
correction was performed to analyze the simple main effects across both factors of footwear and
gait trials for Peak VM. Pairwise comparisons for simple main effects for footwear revealed
significant differences for CC between NG and US at p = 0.035; for FF between NG and US at p
= 0.006 and between US and ES at p = 0.020, with significantly lower Peak VM during NG and
ES compared to both US. No significant differences existed for LT across all gait trials. Pairwise
comparisons for simple main effects for gait trials revealed significant differences for US between
CC and LT at p = 0.040, and between FF and LT at p = 0.002, with significantly lower Peak VM
for LT compared to CC and FF; for AS between FF and LT at p = 0.028, with significantly lower
Peak VM for LT compared to FF. No significant differences existed for NG and ES across all
footwear.
Significant interaction between footwear and gait trials existed for Peak MH at F (3.362,
57.157) = 3.020, p = 0.035, ηp2= 0.151 (Fig.6). Pairwise comparisons using the Sidak Bonferroni
correction was performed to analyze the simple main effects across both factors of footwear and
gait trials for Peak MH. Pairwise comparisons for simple main effects for footwear revealed

127
significant differences for CC between NG and US at p = 0.005, between NG and AS at p =
0.022, between NG and ES at p = 0.020 with significantly lower Peak MH during NG compared
to US, AS and ES; for FF between NG and US at p = 0.0005, between NG and AS p = 0.003 and
between NG and ES at p = 0.033, with significantly lower Peak MH during NG compared to US,
AS and ES. No significant differences existed for LT across all gait trials. Pairwise comparisons
for simple main effects for gait trials revealed significant differences for US between FF and LT
at p = 0.001, with significantly lower Peak MH in LT compared to FF; for AS between FF and LT
at p = 0.009, with significantly lower Peak MH for LT compared to FF. No significant differences
existed for NG and ES across all footwear.
Significant interaction between footwear and gait trials existed for Peak TA at F (3.400,
57.801) = 5.661, p = 0.001, ηp2= 0.250 (Fig.7). Pairwise comparisons using the Sidak Bonferroni
correction was performed to analyze the simple main effects across both factors of footwear and
gait trials for Peak TA. Pairwise comparisons for simple main effects for footwear revealed
significant differences for CC between NG and US at p = 0.047, and between US and AS p =
0.027, with significantly lower Peak TA during NG and ES compared to US; for FF between NG
and US at p = 0.0005 and between NG and AS at p = 0.003, with significantly lower Peak TA
during NG compared to both US and AS, and between US and ES at p = 0.013, with significantly
lower Peak TA during ES compared to US. No significant differences existed for LT across all
gait trials. Pairwise comparisons for simple main effects for gait trials revealed significant
differences for US between FF and LT at p= 0.005, with significantly lower Peak TA in LT
compared to FF; for AS between FF and LT at p = 0.032, with significantly lower Peak TA for
LT compared to FF. No significant differences existed for NG and ES across all footwear. No
significant footwear x gait trials interaction existed for Peak MG and no main effect for gait trials

128
was found. However, significant main effect for footwear existed at F (2, 34) = 6.847, p = 0.003,
ηp2= 0.287 (Fig.8). Pairwise comparisons with a Bonferroni correction revealed significant
differences between CC and FF at p = 0.006 and between LT and FF at p = 0.006, with
significantly lower Peak MG for CC and LT compared to FF.
The 3x4 within subjects repeated measures ANOVA revealed significant interactions
between footwear and gait trials for %MVC (%MVC VM and %MVC TA). Significant
interaction between footwear and gait trials existed for %MVC VM at F (2.346, 39.890) = 2.979,
p = 0.045, ηp2= 0.149 (Fig.9). Pairwise comparisons using the Sidak Bonferroni correction was
performed to analyze the simple main effects across both factors of footwear and gait trials for
%MVC VM. Pairwise comparisons for simple main effects for footwear revealed significant
differences for FF between NG and US at p = 0.041, with significantly lower %MVC VM during
NG compared to US. No significant differences existed for CC and LT across all gait trials.
Pairwise comparisons for simple main effects for gait trials revealed significant differences for
US between FF and LT at p = 0.041, with significantly lower %MVC VM for LT compared to
FF. No significant differences existed for NG, AS and ES across all footwear. No significant
footwear x gait trial interaction existed for %MVC MH and no significant difference existed for
main effect footwear. However, there was a significant difference for main effect gait trials at F
(2.061, 35.031) = 9.433, p = 0.0005, ηp2= 0.357 (Fig.10). Pairwise comparisons with a Bonferroni
correction revealed significant differences between NG and US at p = 0.002 and between NG and
AS at p = 0.0005, with NG significantly lower % MVC MH during NG compared to US and AS.
Significant interaction between footwear and gait trials existed for %MVC TA at F
(2.739, 46.565) = 4.710, p = 0.007, ηp2= 0.217 (Fig.11). Pairwise comparisons using the Sidak
Bonferroni correction was performed to analyze the simple main effects across both factors of

129
footwear and gait trials for %MVC TA. Pairwise comparisons for simple main effects for
footwear revealed significant differences for CC between NG and US at p = 0.039, with
significantly lower %MVC TA during NG compared to US; for FF between NG and US at p =
0.001 and between US and AS at p = 0.005, with significantly lower %MVC TA during NG and
ES compared to US. No significant differences existed for LT across all gait trials. Pairwise
comparisons for simple main effects for gait trials revealed significant differences for US between
FF and LT at p= 0.007, with significantly lower %MVC TA in LT compared to FF. No significant
differences existed for NG, AS and ES across all footwear. No significant footwear x gait trials
interaction existed for %MVC MG and no main effect for footwear was found. However,
significant main effect for gait trials existed at F (2.065, 35.099) = 4.140, p = 0.023, ηp2= 0.196
(Fig.12). Pairwise comparisons with a Bonferroni correction did not reveal significant differences
between footwear. The 1x4 within subjects repeated measures ANOVA revealed no significant
differences across CC, FF and LT for maximal voluntary contractions (MVCs) for all four lower
extremity muscles (MVC VM, MVC MH, MVC TA and MVC MG) (Fig.13).
4. Discussion:
The purpose of this study was to analyze the effect of alternative footwear, [Crocs with
Clogs (CC), Flip-Flops (FF) and Low Top Slip Resistant Shoe (LT)] on lower extremity muscle
activity [EMG Mean (Mean VM; Mean MH, Mean TA & Mean MG), Peak (Peak VM, Peak MH,
Peak TA & Peak MG) and % Maximal Voluntary Contraction (MVC) (%MVC VM, %MVC MH,
%MVC TA & %MVC MG)] during non-slip and slip trials [Normal Dry Gait (NG), Unexpected
Slip (US), Alert Slip (AS) and Expected Slip (ES)]. Significant interactions between footwear and
gait trials existed for Mean, Peak, %MVC for VM and TA, Mean and Peak for MH, suggesting
the influence of both footwear and gait trial conditions in the outcome of lower extremity muscle

130
activity. The knee extensors and flexors (VM and MH) and ankle dorsi flexor muscle (TA)
demonstrated very similar muscle activation patterns across footwear and across gait trials. Our
results indicated significant differences in mean and peak muscle activity and %MVC across all
gait trials for the alternative footwear (CC & FF), while the LT had no significant differences
across all gait trials either non-slip or slip trials, except for one variable (Mean MH). On average,
a greater magnitude of lower extremity muscle activity was seen in the slip trials, particularly the
US and AS. The ES demonstrated similar muscle activity as the NG with no significant
differences between them, suggesting that the individuals did not alter their muscle activity to
maneuver an expected slippery flooring condition.
The alternative footwear (CC & FF), particularly the FF, exhibited greater muscle activity
compared to the LT, during US and AS. The LT appeared to have the best performance in terms
of low levels of muscle activity, both during non-slip and slippery gait trials with no significant
differences across these gait trials. Main effect significance in footwear for Mean and Peak MH
and main effect significance in gait trials for %MVC MH also existed, indicating a greater
magnitude of muscle activation during US and AS, in an attempt to recover from an induced slip,
while LT and CC had similar and significantly lower muscle activation compared to FF which
may attributed to the footwear design features rather than the slip recovery, as they denote merely
a main effect significance for footwear. The specific purpose of this paper is to analyze the impact
of alternative footwear on lower extremity muscle activity during slip events. The incidence of the
slips and slip induced falls across different slip trials and across types of footwear are reported
elsewhere, with significantly greater incidence of slips in alternative footwear (CC & FF)
compared to LT and with significantly greater magnitude of slips in US followed by AS and ES
compared to NG. Furthermore, it has been previously reported that footwear with elevated boot

131
shafts that support the ankle may improve static balance performance (Chander et al. 2014) and
that it may restrict joint range of motion and may hinder muscle activity around the ankle joint
plantar flexors and dorsi-flexors (Chander et al. 2013). The MVCs from the four lower extremity
muscles demonstrated no significant differences, supporting previous literature, as the footwear
tested in this study did not have elevated boot shafts and did not hinder muscle activity.
Extrinsic Factors – Impact of footwear design characteristics:
The footwear’s geometrical design characteristics have been shown to affect human
balance and gait (Chander et al. 2014; Perry, Radtke & Goodwin 2007; Menant et al. 2008; Divert
et al. 2005; Bohm & Hosl 2010) and especially with the growing usage of alternative footwear
such as the thong-styled flip flops and open-toed sandals, several studies have focused on their
impact on the biomechanics of human gait (Zhang et al. 2013; Shroyer et al. 2010a; Shroyer et al.
2010b). Footwear serves as the interface between the human body and the supporting surface and
can affect human balance and gait adversely (Menant et al. 2008). Efficient transformation of the
mechanical power output produced by the musculoskeletal system through the footwear is
responsible for a good performance in gait. Hence, the design and type of the footwear becomes
important in gait and posture (Bohm & Hosl, 2010). Based on the results from the current study,
the footwear worn did not seem to affect any of the lower extremity muscles, during baseline dry
normal surface gait and expected slip conditions. No significant differences were seen during NG
and ES across all footwear. However, during US and AS conditions, footwear differences affected
the amount of muscle activity required to recover from slips. FF appeared to have the greatest
amount of muscle activity, followed by CC and finally the LT, requiring the least amount of
muscle activity, emphasizing its better performance with the lowest incidence of slips and being
efficient in requiring minimal muscle activity. The LT exhibited the least Mean, Peak and

132
%MVC for VM, MH, TA and MG compared to the both alternative footwear (CC & FF) and
across all gait trials. Although modifications in gait kinematics have been reported with use of
alternative footwear (Zhang et al. 2013; Shroyer et al. 2010, Chard et al. 2013), the current study
did not reveal differences in lower extremity stance phase during normal dry gait. However, the
alternative footwear exhibited greater muscle activity and were least efficient during US and AS,
while the LT proved to be the choice of footwear while maneuvering slippery flooring conditions.
Intrinsic Factors – Impact of perception and anticipation of slips:
Muscle activation during unexpected and anticipated slips have been studied previously
(Lockhart et al. 2007; Chambers & Cham, 2007). The results from the current study support
previous findings from Chambers & Cham, who reported a longer duration and great power
muscle activity during hazardous slips compared to non-hazardous slips. Mean and Peak muscle
activity from VM, MH and TA exhibited similar patterns of activation, with greater magnitude
muscle activity in stance phase during US and AS, which represent the gait trials with a greater
incidence of slips, compared to NG and ES. The recovery from a slip has been usually related
muscular response strategies from the knee and hip muscles with relatively less responses from
the ankle (Redfern et al. 2001; Chambers & Cham, 2007). The greater magnitude of the
knee/upper leg muscles (VM and MH) could be related to the required muscle activity to recover
from the slips during US. The increased activity in VM may be attributed to the need for moving
the body center of mass over the base of support and accelerate the limb loading rate while the
increased activity in MH may be attributed to the knee flexion moment that is often reported with
anticipation, during AS (Chamber & Cham, 2007). In addition, the greater activation of both the
knee flexors and extensors may suggest a co-contraction between the agonist-antagonist pair of
muscles. Contrastingly, the lower leg muscles (TA and MG) did not exhibit similar patterns as the

133
upper leg musculature. The TA exhibited greater muscle activity in stance phase of slippery gait
trials, while there were no differences in MG muscle activity across trials. The increased activity
in TA during early stance phase have been related to a delayed achievement of foot-flat, which
has been reported as an important aspect in slip recovery and gait continuation (Cham & Redfern,
2002a) while, a null ankle moment during severe slips were also reported (Cham & Redfern,
2001). In the current study, the increased activity in TA was seen only in US and AS, which may
be due to the reverse origin action of the TA to limit the forward movement of the foot and the leg
after the initiation of the slip. The MG did not show an increased muscle activity in stance phase,
for slip trials which may be attributed to the decreased stance phase push-off needed during a slip
event.
Alerting the participants of the possibility of a slippery surface (AS) also resulted in an
increased Mean, Peak and %MVC for VM, MH and TA, supporting previous literature
(Chambers & Cham, 2007). The anticipation of the slippery flooring condition during the ES
condition, exhibited similar muscle activity levels as the NG condition. The incidence of slips in
the ES was significantly lower and suggests no extra requirement of muscle activity from the NG.
Chambers & Cham, also reported greater levels of co-contraction between the agonist and
antagonist pairs of lower extremity flexors and extensors during an expected slip (Chambers &
Cham, 2007). Our study did not account for co-contractions in this paper, but reports mean, peak
and %MVC lower extremity muscle activity that were not different from the baseline dry normal
surface gait, suggesting modifications in the gait kinematics rather than modifications in lower
extremity muscle activity.

134
5. Conclusion:
In conclusion, greater lower extremity muscle activation in stance phase were seen in
unexpected and alert slip conditions compared to normal dry gait and expected slip. The results
also indicate that individuals did not use greater magnitude of lower extremity muscle activity
during an ES and did not rely on muscle activity in an attempt to reduce slips. Differences in gait
kinematics have been reported previously with alternative footwear, however, based on the
results from this study, during the normal dry conditions, muscle activity was not significantly
different across footwear. In addition, footwear differences were seen for the alternative footwear
(CC & FF) during US and AS, while the low top slip resistant shoe had no differences across all
gait trials, suggesting it as the most efficient footwear of choice especially when maneuvering
slippery flooring conditions, either with or without the knowledge of an impending slip. Even
though the alternative footwear serves for comfort and easy donning, it might not be the choice
of footwear to improve muscular efficiency and prevent slips and slip induced falls.

135
Fig.1: Mean Muscle activity (mV) for Vastus Medialis during stance phase for Crocs, Flip-Flops and Low Top Slip
Resistant Shoe during normal gait (NG), unexpected slip (US), alert slip (AS) and expected slip (ES) events.
Fig.2: Mean Muscle activity (mV) for Medial Hamstrings during stance phase for Crocs, Flip-Flops and Low Top Slip
Resistant Shoe during normal gait (NG), unexpected slip (US), alert slip (AS) and expected slip (ES) events.
§ denotes significant interaction; * denotes significant difference for footwear across gait trials and # denotes significant difference for gait trials across footwear. All differences were significant at alpha level p=0.05.
0
0.02
0.04
0.06
0.08
0.1
0.12
0.14
0.16
0.18
N G U S A S E S
MU
SCLE
AC
TIV
ITY
(MV
)
GAIT TRIALS
MEAN MUSCLE ACTIVITY IN STANCE PHASE VASTUS MEDIALIS
Crocs Flip Flop Low Top
0
0.05
0.1
0.15
0.2
0.25
N G U S A S E S
MU
SCLE
AC
TIV
ITY
(MV
)
GAIT TRIALS
MEAN MUSCLE ACTIVITY IN STANCE PHASE HAMSTRINGS
Crocs Flip Flop Low Top
#
# #
*
* *
*
*
* §
#
#
*
* *
* * §
*

136
Fig.3: Mean Muscle activity (mV) for Tibialis Anterior during stance phase for Crocs, Flip-Flops and Low Top Slip
Resistant Shoe during normal gait (NG), unexpected slip (US), alert slip (AS) and expected slip (ES) events.
Fig.4: Mean Muscle activity (mV) for Medial Gastrocnemius during stance phase for Crocs, Flip-Flops and Low Top
Slip Resistant Shoe during normal gait (NG), unexpected slip (US), alert slip (AS) and expected slip (ES) events.
§ denotes significant interaction; * denotes significant difference for footwear across gait trials and # denotes significant difference for gait trials across footwear. All differences were significant at alpha level p=0.05.
0
0.05
0.1
0.15
0.2
0.25
0.3
0.35
0.4
N G U S A S E S
MU
SCLE
AC
TIV
ITY
(MV
)
GAIT TRIALS
MEAN MUSCLE ACTIVITY IN STANCE PHASE TIBIALIS ANTERIOR
Crocs Flip Flop Low Top
0
0.05
0.1
0.15
0.2
0.25
N S U S A S E S
MU
SCLE
AC
TIV
ITY
(MV
)
GAIT TRIALS
MEAN MUSCLE ACTIVITY IN STANCE PHASE GASTROCNEMIUS
Crocs Flip Flop Low Top
#
#
* *
*
§
* *

137
Fig.5: Peak Muscle activity (mV) for Vastus Medialis during stance phase for Crocs, Flip-Flops and Low Top Slip
Resistant Shoe during normal gait (NG), unexpected slip (US), alert slip (AS) and expected slip (ES) events.
Fig.6: Peak Muscle activity (mV) for Medial Hamstrings during stance phase for Crocs, Flip-Flops and Low Top Slip
Resistant Shoe during normal gait (NG), unexpected slip (US), alert slip (AS) and expected slip (ES) events.
§ denotes significant interaction; * denotes significant difference for footwear across gait trials and # denotes significant difference for gait trials across footwear. All differences were significant at alpha level p=0.05.
0
0.2
0.4
0.6
0.8
1
1.2
1.4
1.6
1.8
2
N G U S A S E S
MU
SCLE
AC
TIV
ITY
(MV
)
GAIT TRIALS
PEAK MUSCLE ACTIVITY IN STANCE PHASE VASTUS MEDIALIS
Crocs Flip Flop Low Top
0
0.5
1
1.5
2
2.5
3
N G U S A S E S
MU
SCLE
AC
TIV
ITY
(MV
)
GAIT TRIALS
PEAK MUSCLE ACTIVITY IN STANCE PHASE HAMSTRINGS
Crocs Flip Flop Low Top
#
# #
* * *
§
#
#
*
*
*
*
* *
§

138
Fig.7: Peak Muscle activity (mV) for Tibialis Anterior during stance phase for Crocs, Flip-Flops and Low Top Slip
Resistant Shoe during normal gait (NG), unexpected slip (US), alert slip (AS) and expected slip (ES) events.
Fig.8: Peak Muscle activity (mV) for Medial Gastrocnemius during stance phase for Crocs, Flip-Flops and Low Top
Slip Resistant Shoe during normal gait (NG), unexpected slip (US), alert slip (AS) and expected slip (ES) events.
§ denotes significant interaction; * denotes significant difference for footwear across gait trials and # denotes significant difference for gait trials across footwear. All differences were significant at alpha level p=0.05.
0
0.5
1
1.5
2
2.5
3
3.5
4
N G U S A S E S
MU
SCLE
AC
TIV
ITY
(MV
)
GAIT TRIALS
PEAK MUSCLE ACTIVITY IN STANCE PHASE TIBIALIS ANTERIOR
Crocs Flip Flop Low Top
0
0.5
1
1.5
2
2.5
N G U S A S E S
MU
SCLE
AC
TIV
ITY
(MV
)
GAIT TRIALS
PEAK MUSCLE ACTIVITY IN STANCE PHASE GASTROCNEMIUS
Crocs Flip Flop Low Top
#
#
*
*
* *
§
* *

139
Fig.9: %MVC Muscle activity for Vastus Medialis during stance phase for Crocs, Flip-Flops and Low Top Slip
Resistant Shoe during normal gait (NG), unexpected slip (US), alert slip (AS) and expected slip (ES) events.
Fig.10: %MVC Muscle activity for Medial Hamstrings during stance phase for Crocs, Flip-Flops and Low Top Slip
Resistant Shoe during normal gait (NG), unexpected slip (US), alert slip (AS) and expected slip (ES) events.
§ denotes significant interaction; * denotes significant difference for footwear across gait trials and # denotes significant difference for gait trials across footwear. All differences were significant at alpha level p=0.05.
5
10
15
20
25
30
35
40
45
50
55
N G U S A S E S
%M
VC
GAIT TRIALS
%MVC IN STANCE PHASE VASTUS MEDIALIS
Crocs Flip Flop Low Top
5
10
15
20
25
30
35
40
N G U S A S E S
%M
VC
GAIT TRIALS
%MVC IN STANCE PHASE HAMSTRINGS Crocs Flip Flop Low Top
#
* §
#
#
#

140
Fig.11: %MVC Muscle activity for Tibialis Anterior during stance phase for Crocs, Flip-Flops and Low Top Slip
Resistant Shoe during normal gait (NG), unexpected slip (US), alert slip (AS) and expected slip (ES) events.
Fig.12: %MVC Muscle activity for Medial Gastrocnemius during stance phase for Crocs, Flip-Flops and Low Top Slip
Resistant Shoe during normal gait (NG), unexpected slip (US), alert slip (AS) and expected slip (ES) events.
§ denotes significant interaction; * denotes significant difference for footwear across gait trials and # denotes significant difference for gait trials across footwear. All differences were significant at alpha level p=0.05.
5
10
15
20
25
30
35
40
45
N G U S A S E S
%M
VC
GAIT TRIALS
%MVC IN STANCE PHASE TIBIALIS ANTERIOR
Crocs Flip Flop Low Top
5
15
25
35
45
55
65
N G U S A S E S
%M
VC
GAIT TRIALS
%MVC IN STANCE PHASE GASTROCNEMIUS
Crocs Flip Flop Low Top
#
* *
*
* §
#

141
Fig.13: Maximal Voluntary Contraction MVC Muscle activity (mV) for Vastus Meadialis (VM), Medial Hamstrings
(MH), Tibialis Anterior (TA) and Medial Gastrocnemius (MG) during 5 second maximal voluntary contraction for
Crocs, Flip-Flops and Low Top Slip Resistant Shoe
0
0.2
0.4
0.6
0.8
1
1.2
1.4
Crocs Flip Flop Low Top
Mu
scle
Act
ivit
y (m
V)
Footwear Types
Maximal Voluntary Contraction
VM MH TA MG

142
LIST OF REFERENCES

143
1. Boakes, J. L., & Rab, G. T. (2006). Muscle activity during walking. Human Walking.
Lippincott Williams and Wilkins, Baltimore.
2. Bohm, H, &Hosl, M. (2010). Effect of boot shaft stiffness on stability joint energy and
muscular co-contraction during walking on uneven surface. Journal of Biomechanics, 43
(2010), 2467–2472.
3. Bureau of Labor Statistics, 2011. Incidence Rates of Nonfatal Occupational Injuries and
Illness by Industry and Case Types. US Department of Labor.
4. Chander, H, Garner JC & Wade, C. (2014). Impact on balance while walking in
occupational footwear. Footwear Science.
5. Cham, R., Redfern, M.S., (2002a). Changes in gait when anticipating slippery floors. Gait
Posture 15, 159–171.
6. Cham, R., Redfern, M.S., (2002b). Heel contact dynamics during slip events on level and
inclined surfaces. Safety Sci. 40, 559–576.
7. Chambers, A. J., & Cham, R. (2007). Slip-related muscle activation patterns in the stance
leg during walking. Gait & posture, 25(4), 565-572.
8. Courtney, T. K., Sorock, G. S., Manning, D. P., Collins, J. W. and Holbein-Jenny, M. A.
(2001a). Occupational slip, trip, and fall-related injuries can the contribution of
slipperiness be isolated? Ergonomics, 44, 1118- 1137.
9. Courtney, T. K., & Webster, B. S. (2001b). Antecedent factors and disabling
occupational morbidity—insights from the new BLS data. AIHAJ-American Industrial
Hygiene Association, 62(5), 622-632.
10. Davis, P. R. (1983). Human factors contributing to slips, trips and falls. Ergonomics,
26(1), 51-59.

144
11. Divert, C., Mornieux, G., Baur, H., Mayer, H., Belli, A. (2005). Mechanical Comparison
of Barefoot and Shod Running. International journal of Sports Medicine: 26, 593 – 598.
12. Gauchard, G., Chau, N., Mur, J. M., & Perrin, P. (2001). Falls and working individuals:
role of extrinsic and intrinsic factors. Ergonomics, 44(14), 1330-1339.
13. Hosoda M, Yoshimura O, Takayanagi K, Kobayashi R, Minematsu A, Nakayama A,
Ishibashi T, Wilson C (1997). The effect of various footwear types and materials, and of
fixing of the ankles by footwear on upright posture control. J phystherSci 9, 47-51.
14. Kincl,L.D., Bhattacharya,A., Succop,P. A., and Clark, C. S. (2002). Postural Sway
Measurements: A Potential Safety Monitoring Technique for Workers Wearing Personal
Protective Equipment. Applied Occupational and Environmental Hygiene 17 (4), 256-
266.
15. Lockhart, T. E., Spaulding, J. M., & Park, S. H. (2007). Age-related slip avoidance
strategy while walking over a known slippery floor surface. Gait & posture, 26(1), 142-
149.
16. Majumdar, Dhurjati., Banerjee, P. K., Majumdar, D., Pal, M., Kumar, R. A. K. E. S. H.,
&Selvamurthy, W. (2006). Temporal spatial parameters of gait with barefoot, bathroom
slippers and military boots. Indian journal of physiology and pharmacology, 50(1), 33.
17. Menant, J, Perry, S, Steele, J, Menz, H,Munro, B, Lord, S (2008). Effects of Shoe
Characteristics on Dynamic Stability When Walking on Even and Uneven Surfaces in
Young and Older People. Arch Phys Med Rehabil; 89, 1970-6.
18. Parijat, P., & Lockhart, T. E. (2008). Effects of quadriceps fatigue on the biomechanics
of gait and slip propensity. Gait & posture, 28(4), 568-573.

145
19. Perry S, Radtke A, Goodwin C (2007). Influence of footwear midsole material hardness
on dynamic balance control during unexpected gait termination. Gait and posture 25, 94-
98.
20. Redfern, M. S., Cham, R., Gielo-Perczak, K., Grönqvist, R., Hirvonen, M., Lanshammar,
H., & Powers, C. (2001). Biomechanics of slips. Ergonomics, 44(13), 1138-1166.
21. Robinson, L. E., Rudisill, M. E., Weimar, W. H., Breslin, C. M., Shroyer, J. F., &
Morera, M. (2011). Footwear and locomotor skill performance in preschoolers 1,
2. Perceptual and motor skills, 113(2), 534-538.
22. Shroyer JF, Shroyer JE, Sumner AM, Weimar WH: Effect of various thong flip-flops on
pronation and eversion during midstance. Med Sci Sport Exer. 2010, 42:270.
23. Shroyer, J. F., & Weimar, W. H. (2010). Comparative analysis of human gait while
wearing thong-style flip-flops versus sneakers. Journal of the American Podiatric
Medical Association, 100(4), 251-257.
24. Tang, P. F., & Woollacott, M. H. (1998). Inefficient postural responses to unexpected
slips during walking in older adults. The Journals of Gerontology Series A: Biological
Sciences and Medical Sciences, 53(6), M471-M480.
25. Ferber R, Osternig LR, Woollacott MH, Wasielewski NJ, Lee JH. Reactive balance
adjustments to unexpected perturbations during human walking. Gait Posture
2002;16:238–48.
26. Tang PF, Woollacott MH. Phase-dependent modulation of proximal and distal postural
responses to slips in young and older adults. J. Gerontol Ser A Biol Sci Med Sci 1999;54:
M89–102.

146
27. US Department of Labor, Bureau of Labor Statistics 2011, National Census of Fatal
Occupational Injuries, 2011.
28. US Department of Labor, Bureau of Labor Statistics 2011, Lost-work time Injuries and
Illnesses: Characteristics and Resulting Time Away from Work, 2011.
29. Zhang X, Paquette MR & Zhang S: A comparison of gait biomechanics of flip-flops,
sandals, barefoot and shoes. Journal of Foot and Ankle Research. 2013, 6:45.

147
LIST OF APPENDICES

148
APPENDIX A: DESCRIPTIVE STATISTICS

149
Table 1: Heel Slip Distance for CC, FF and LT during NG, US, AS and ES:
Table 2: Mean Heel Slip Velocity for CC, FF and LT during NG, US, AS and ES:
Descriptive Statistics
Mean Std. Deviation N
CC_MHSV_NG 295.367055039683000 57.122398477634900 18
CC_MHSV_US 510.778988492064000 329.633869087038000 18
CC_MHSV_AS 536.903424369748000 625.428265998339000 18
CC_MHSV_ES 318.063285555556000 254.586842035121000 18
FF_MHSV_NG 205.706557142857000 39.445712188602000 18
FF_MHSV_US 781.550469327731000 560.556303470302000 18
FF_MHSV_AS 479.200681349206000 440.594219164638000 18
FF_MHSV_ES 423.891316071428000 479.105181464299000 18
LT_MHSV_NG 272.374055952381000 79.110310726389600 18
LT_MHSV_US 323.538519761905000 175.386928043799000 18
LT_MHSV_AS 274.381630277778000 121.432998464090000 18
LT_MHSV_ES 341.302983349206000 207.931394656081000 18
Descriptive Statistics
Mean Std. Deviation N
CC_HSD_NG 33.535531666666700 5.603208254703680 18
CC_HSD_US 63.778777777777800 44.534045252362600 18
CC_HSD_AS 64.523260000000000 79.613928705709200 18
CC_HSD_ES 35.174111111111100 30.753003644195000 18
FF_HSD_NG 23.411394444444400 4.616242716178730 18
FF_HSD_US 102.324365882353000 75.123449587197900 18
FF_HSD_AS 60.558727777777800 59.047384797254700 18
FF_HSD_ES 51.448261666666700 60.222868168432900 18
LT_HSD_NG 28.889355555555600 8.601234871617680 18
LT_HSD_US 34.235482222222200 21.070825513017800 18
LT_HSD_AS 28.568477777777800 13.005748198011000 18
LT_HSD_ES 36.308466666666700 24.927630691050700 18

150
Table 3: Mean Z-GRF for CC, FF and LT during NG, US, AS and ES:
Descriptive Statistics
Mean Std. Deviation N
CC_MeanZ_NG 659.742325102670000 60.800332614417700 18
CC_MeanZ_US 607.998257989949000 77.949791711017400 18
CC_MeanZ_AS 589.585140638354000 57.739847284873100 18
CC_MeanZ_ES 603.943540476129000 63.226688921341600 18
FF_MeanZ_NG 657.393056094623000 66.443515973980800 18
FF_MeanZ_US 495.592438654763000 145.633837615579000 18
FF_MeanZ_AS 565.658074196515000 79.897600514194100 18
FF_MeanZ_ES 576.808368599767000 80.948316206778400 18
LT_MeanZ_NG 642.931607533414000 59.595429212005200 18
LT_MeanZ_US 570.630643569808000 126.489246677102000 18
LT_MeanZ_AS 635.189041867925000 68.162544285045100 18
LT_MeanZ_ES 607.490620048573000 65.246973779240500 18
Table 4: Peak Z-GRF for CC, FF and LT during NG, US, AS and ES:
Descriptive Statistics
Mean Std. Deviation N
CC_PeakZ_NG 990.07172 130.692593 18
CC_PeakZ_US 940.65478 148.024359 18
CC_PeakZ_AS 907.72241176470600 142.374968703011000 18
CC_PeakZ_ES 884.54033 101.130382 18
FF_PeakZ_NG 981.54944 138.974945 18
FF_PeakZ_US 918.261647058824000 181.964670601980000 18
FF_PeakZ_AS 850.285689 219.1040982 18
FF_PeakZ_ES 858.71172 99.854259 18
LT_PeakZ_NG 965.97078 94.394215 18
LT_PeakZ_US 900.24261 100.363574 18
LT_PeakZ_AS 932.22550 118.674629 18
LT_PeakZ_ES 921.83861 100.116640 18

151
Table 5: Ankle Angle at Heel Strike for CC, FF and LT during NG, US, AS and ES:
Descriptive Statistics
Mean Std. Deviation N
CC_AnkAngle_NG -1.87006650 3.777563974 18
CC_AnkAngle_US -5.012412444 5.8583129644 18
CC_AnkAngle_AS -5.32672494 3.476818603 18
CC_AnkAngle_ES -6.52325644 6.184563237 18
FF_AnkAngle_NG -1.935019867 4.0439527741 18
FF_AnkAngle_US -4.540286812500 2.8844994681052 18
FF_AnkAngle_AS -5.5641954978 3.89589487199 18
FF_AnkAngle_ES -7.9091394 5.44260103 18
LT_AnkAngle_NG 4.44425467 3.212230114 18
LT_AnkAngle_US 2.61677417 4.249430044 18
LT_AnkAngle_AS 3.57990467 4.624557355 18
LT_AnkAngle_ES 2.81141794 5.772116715 18
Table 6: Hip Angle at Heel Strike for CC, FF and LT during NG, US, AS and ES:
Descriptive Statistics
Mean Std. Deviation N
CC_HipAngle_NG 26.525744 7.0943810 18
CC_HipAngle_US 26.829206 5.3557336 18
CC_HipAngle_AS 26.143428 4.8481773 18
CC_HipAngle_ES 27.358467 5.3237780 18
FF_HipAngle_NG 24.539552941176500 5.563019030655250 18
FF_HipAngle_US 24.7769562500 5.17283931591 18
FF_HipAngle_AS 25.616572 5.8678152 18
FF_HipAngle_ES 25.602994 5.4291069 18
LT_HipAngle_NG 27.749635294117600 5.571459621926230 18
LT_HipAngle_US 27.143039 5.8280101 18
LT_HipAngle_AS 27.016028 6.8790203 18
LT_HipAngle_ES 26.740644 6.9193436 18

152
Table 7: Mean VM activity in stance phase for CC, FF and LT during NG, US, AS and ES:
Descriptive Statistics
Mean Std. Deviation N
CC_StanceVM_NG .065063337507053 .027685748235291 18
CC_StanceVM_US .137325075482974 .083555007599550 18
CC_StanceVM_AS .105330670034302 .078026943617497 18
CC_StanceVM_ES .086330731893493 .047137742876206 18
FF_StanceVM_NG .062038424615409 .027193138830861 18
FF_StanceVM_US .160196987294758 .095623124559054 18
FF_StanceVM_AS .128005300949153 .092468497275801 18
FF_StanceVM_ES .099053095129026 .077499346648488 18
LT_StanceVM_NG .064469702091030 .026574373200715 18
LT_StanceVM_US .072711219031021 .033816431288226 18
LT_StanceVM_AS .068364185401433 .030571317589550 18
LT_StanceVM_ES .086817503764368 .083938164780775 18
Table 8: Mean MH activity in stance phase for CC, FF and LT during NG, US, AS and ES:
Descriptive Statistics
Mean Std. Deviation N
CC_StanceMH_NG .060193981841489 .024995413240942 18
CC_StanceMH_US .143034601081705 .100912732868054 18
CC_StanceMH_AS .141940138587489 .139842701151190 18
CC_StanceMH_ES .105850239187630 .039449176770369 18
FF_StanceMH_NG .064971914338811 .028923522031708 18
FF_StanceMH_US .184662821786631 .082193895201234 18
FF_StanceMH_AS .156788035862867 .099007616991638 18
FF_StanceMH_ES .150203934547718 .128574136841347 18
LT_StanceMH_NG .058726341989867 .019978079837579 18
LT_StanceMH_US .081376336242114 .035562213524876 18
LT_StanceMH_AS .079968495604586 .045773126305683 18
LT_StanceMH_ES .106716137335423 .105651054122313 18

153
Table 9: Mean TA activity in stance phase for CC, FF and LT during NG, US, AS and ES:
Descriptive Statistics
Mean Std. Deviation N
CC_StanceTA_NG .126294432135467 .046714280376010 18
CC_StanceTA_US .282829817580508 .291161061349213 18
CC_StanceTA_AS .202879437985464 .172370749321589 18
CC_StanceTA_ES .135557118775249 .062418826506153 18
FF_StanceTA_NG .122010050203077 .049654663923190 18
FF_StanceTA_US .329601651139684 .163282220606930 18
FF_StanceTA_AS .282582315147777 .181799898742145 18
FF_StanceTA_ES .188175666166406 .117232423492791 18
LT_StanceTA_NG .134098284891447 .045867472224685 18
LT_StanceTA_US .146303147327922 .069268617415020 18
LT_StanceTA_AS .129363498376262 .035157579633473 18
LT_StanceTA_ES .156197913119134 .111874145738929 18
Table 10: Mean MG activity in stance phase for CC, FF and LT during NG, US, AS and ES:
Descriptive Statistics
Mean Std. Deviation N
CC_StanceMG_NG .135751766915221 .059722557598133 18
CC_StanceMG_US .135438047205180 .048747724209540 18
CC_StanceMG_AS .137342407984399 .047520865446338 18
CC_StanceMG_ES .139783628583462 .046459045505680 18
FF_StanceMG_NG .151297105160060 .057819772510524 18
FF_StanceMG_US .180995145567853 .067976678067058 18
FF_StanceMG_AS .153502562421986 .048347153664234 18
FF_StanceMG_ES .158696647642651 .067605033852469 18
LT_StanceMG_NG .137103499380503 .068395348701656 18
LT_StanceMG_US .139493815624935 .056666800774196 18
LT_StanceMG_AS .137334453889501 .056792503914457 18
LT_StanceMG_ES .125442796412086 .055748864857423 18

154
Table 11: Peak VM activity in stance phase for CC, FF and LT during NG, US, AS and ES:
Descriptive Statistics
Mean Std. Deviation N
CC_StancePeakVM_NG .54279622 .288453598 18
CC_StancePeakVM_US 1.27665150 1.049617046 18
CC_StancePeakVM_AS .783046411764706 .597794234790953 18
CC_StancePeakVM_ES .63182906 .435358593 18
FF_StancePeakVM_NG .57889361 .434365707 18
FF_StancePeakVM_US 1.605138470588240 1.195181133363480 18
FF_StancePeakVM_AS 1.12087778 .947280395 18
FF_StancePeakVM_ES .75331322 .624098063 18
LT_StancePeakVM_NG .60308367 .433465261 18
LT_StancePeakVM_US .57372056 .325928615 18
LT_StancePeakVM_AS .60592617 .487662725 18
LT_StancePeakVM_ES .67536178 .489562800 18
Table 12: Peak MH activity in stance phase for CC, FF and LT during NG, US, AS and ES:
Descriptive Statistics
Mean Std. Deviation N
CC_StancePeakMH_NG .47127444 .351686025 18
CC_StancePeakMH_US 1.60363156 1.421752578 18
CC_StancePeakMH_AS 1.387976294117650 1.255976613555680 18
CC_StancePeakMH_ES 1.12316383 .783537298 18
FF_StancePeakMH_NG .49917072 .393610239 18
FF_StancePeakMH_US 2.252222235294120 1.307232382413120 18
FF_StancePeakMH_AS 1.81364383 1.342733529 18
FF_StancePeakMH_ES 1.515025756 1.5003933980 18
LT_StancePeakMH_NG .45507494 .248061131 18
LT_StancePeakMH_US .80201033 .550829663 18
LT_StancePeakMH_AS .682985911 .5262537804 18
LT_StancePeakMH_ES 1.00340067 1.198384257 18

155
Table 13: Peak TA activity in stance phase for CC, FF and LT during NG, US, AS and ES:
Descriptive Statistics
Mean Std. Deviation N
CC_StancePeakTA_NG 1.63034683 .748574680 18
CC_StancePeakTA_US 2.53630589 1.694104118 18
CC_StancePeakTA_AS 1.927337647058820 1.456668339068100 18
CC_StancePeakTA_ES 1.47966217 .987706099 18
FF_StancePeakTA_NG 1.34079372 .672048597 18
FF_StancePeakTA_US 3.394005117647060 1.664186733981000 18
FF_StancePeakTA_AS 2.77067128 1.730302072 18
FF_StancePeakTA_ES 1.98316717 1.250103133 18
LT_StancePeakTA_NG 1.91656828 1.077761937 18
LT_StancePeakTA_US 1.86970228 1.212509870 18
LT_StancePeakTA_AS 1.63075850 .713273586 18
LT_StancePeakTA_ES 1.66671478 .671538031 18
Table 14: Peak MG activity in stance phase for CC, FF and LT during NG, US, AS and ES:
Descriptive Statistics
Mean Std. Deviation N
CC_StancePeakMG_NG 1.10688400 .660438016 18
CC_StancePeakMG_US 1.15016311 .562756268 18
CC_StancePeakMG_AS 1.12795500 .484615555 18
CC_StancePeakMG_ES 1.06434672 .498663089 18
FF_StancePeakMG_NG 1.17482283 .529197938 18
FF_StancePeakMG_US 1.744386588235290 .945083654588876 18
FF_StancePeakMG_AS 1.35874789 .588846755 18
FF_StancePeakMG_ES 1.45272283 .901788510 18
LT_StancePeakMG_NG 1.08866083 .823181227 18
LT_StancePeakMG_US 1.14895467 .692317003 18
LT_StancePeakMG_AS 1.05672817 .693444421 18
LT_StancePeakMG_ES .91079989 .580543047 18

156
Table 15: %MVC VM activity in stance phase for CC, FF and LT during NG, US, AS and ES:
Descriptive Statistics
Mean Std. Deviation N
CC_MVCVM_NG 15.074790991051000 14.815340673124400 18
CC_MVCVM_US 36.212753865273800 54.162804085854800 18
CC_MVCVM_AS 23.420923475059200 27.422140374092200 18
CC_MVCVM_ES 19.435632912288800 18.432432544473300 18
FF_MVCVM_NG 12.580823574620100 9.582263545311520 18
FF_MVCVM_US 36.368047921341000 41.311923480770900 18
FF_MVCVM_AS 29.506643079782000 36.728976228678400 18
FF_MVCVM_ES 19.608075843056100 17.326260855207100 18
LT_MVCVM_NG 12.606681857628900 8.195634727467390 18
LT_MVCVM_US 14.413604257258300 9.665633648637790 18
LT_MVCVM_AS 13.673495552989100 9.331209686805690 18
LT_MVCVM_ES 17.305555846548500 16.632847783021100 18
Table 16: %MVC MH activity in stance phase for CC, FF and LT during NG, US, AS and ES:
Descriptive Statistics
Mean Std. Deviation N
CC_MVCMH_NG 14.415054453164900 21.453865051618000 18
CC_MVCMH_US 29.087327969083900 30.245396252788100 18
CC_MVCMH_AS 24.533513169842300 22.161886970304400 18
CC_MVCMH_ES 21.636456304979800 21.311978748286500 18
FF_MVCMH_NG 9.570432158086540 7.477918519942550 18
FF_MVCMH_US 27.184412408757100 19.545706969152700 18
FF_MVCMH_AS 22.589813696264200 20.319956402354000 18
FF_MVCMH_ES 21.350245523120000 23.291687621015900 18
LT_MVCMH_NG 14.556630302855900 24.981252344914500 18
LT_MVCMH_US 18.510232438752200 24.385030489480900 18
LT_MVCMH_AS 17.917368427202100 24.523933320776900 18
LT_MVCMH_ES 23.050232717252300 32.322464350972000 18

157
Table 17: %MVC TA activity in stance phase for CC, FF and LT during NG, US, AS and ES:
Descriptive Statistics
Mean Std. Deviation N
CC_MVCTA_NG 15.278293189701500 8.738319228463020 18
CC_MVCTA_US 31.009152403206600 27.307996787275700 18
CC_MVCTA_AS 24.072199016581300 21.284674045326200 18
CC_MVCTA_ES 15.988840266753500 9.151355095482000 18
FF_MVCTA_NG 12.847991991995500 6.698506680640940 18
FF_MVCTA_US 34.724780221827000 23.903144319073000 18
FF_MVCTA_AS 33.673412588971100 34.934557912050300 18
FF_MVCTA_ES 19.606483187525900 14.163091814131600 18
LT_MVCTA_NG 14.629479634273800 6.890121527584400 18
LT_MVCTA_US 15.616082625298700 7.576942707199430 18
LT_MVCTA_AS 14.238024497495500 6.244851862819590 18
LT_MVCTA_ES 17.313589094490700 13.011179306289200 18
Table 18: %MVC MG activity in stance phase for CC, FF and LT during NG, US, AS and ES:
Descriptive Statistics
Mean Std. Deviation N
CC_MVCMG_NG 35.257254270782400 9.472974527561270 18
CC_MVCMG_US 38.958448475340500 15.228040361932900 18
CC_MVCMG_AS 39.294517387633900 14.545203809810600 18
CC_MVCMG_ES 38.735860587087800 11.925838905252800 18
FF_MVCMG_NG 41.059278246119900 13.864942559580600 18
FF_MVCMG_US 50.524283276532600 21.795649340306700 18
FF_MVCMG_AS 44.491701554057800 18.260991707693200 18
FF_MVCMG_ES 44.570723262390700 21.053466138900500 18
LT_MVCMG_NG 39.152030071032100 15.659089921161200 18
LT_MVCMG_US 40.222868298784300 13.224043183409400 18
LT_MVCMG_AS 40.064769762405500 15.285113770432200 18
LT_MVCMG_ES 36.296901906682800 13.888763592696800 18

158
Table 19: MVC in CC, FF and LT:
Descriptive Statistics
Mean Std. Deviation N
CC_MVCVM 0.701874313 0.526135358 18
FF_MVCVM 0.739027196 0.514309362 18
LT_MVCVM 0.677864155 0.38087428 18
CC_MVCMH 0.721012135 0.377959659 18
FF_MVCMH 0.858316885 0.518780255 18
LT_MVCMH 0.790826559 0.422814401 18
CC_MVCTA 0.923196098 0.349524078 18
FF_MVCTA 1.066904881 0.450446242 18
LT_MVCTA 1.073221652 0.569208064 18
CC_MVCMG 0.429905345 0.297343056 18
FF_MVCMG 0.425030477 0.278308127 18
LT_MVCMG 0.418109987 0.34354589 18

159
APPENDIX B: INFORMED CONSENT

160
INFORMED CONSENT
Consent to participate in an experimental study
Title: Biomechanics of Slips in Alternative Footwear
Investigator
Harish Chander, BPT, MS, PhD Candidate
Applied Biomechanics Laboratory
Department of Health, Exercise Science, and Recreational Management
University of Mississippi – 240 Turner Center University, MS 38677
Tel: (662) 915-5595
Co-Investigator
John C. Garner, Ph.D., CSCS
Applied Biomechanics Laboratory
Department of Health, Exercise Science, and Recreational Management
University of Mississippi – 215 Turner Center University, MS 38677
Tel: (662) 915-7573
Description
You are being asked to participate in a research study for the purpose of investigating the effects
of wearing different types of casual alternative footwear such as the flip flops, crocs and low top
shoes on walking and slip trials. The long-term goal of this proposed research is to minimize the
risk of falling and injuries in individuals who wear these alternative footwear, and also to lead
towards implementing appropriate intervention strategies. The use of this knowledge might
improve injury prevention among the population such as the hospital staff who wear these
alternative footwear in working conditions that are very prone for slips. In this study, we will
focus on assessing walking during normal trials, slips trials and obstacle avoidance trials using
motion capture and also assess the muscle activity using electromyography during these trials.
Your participation is voluntary. If you decide to participate in the research study, three visits are
required to complete the testing that will last approximately 45 minutes for each visit. During
thatvisit, you will be briefed on the experimental procedure related to gait, slips and obstacle
avoidance with different footwear (explained below).
The “experimental procedures” are used to generate the measurements needed to achieve the
goals of this study. If the screening results indicate that you qualify to participate in this study,
then you would undergo the below mentioned experimental procedures. You will participate in
three testing sessions, with a similar experimental protocol and be exposed tothree different
footwear during those three sessions. The types of footwear are: flat sole-low top shoe
(restaurant type), flip-flops (casual alternative footwear) and crocs (hospital type).
Protocol 1) 3-4 Normal Walking Trials (Non-Slippery Conditions)
Protocol 3) EMG Muscle Activity Testing

161
Protocol 2) 3 Slip Trials (Unexpected, Alert, Expected)
Protocol 3) 1 Obstacle Avoidance Trial
In summary, you will be asked to walk on dry and slippery floors, while we measure the activity
of your muscles in your legs, your movement and forces exerted by your feet onto the ground.
Your body movements will be recorded using light reflective spherical markers that we will
attach to your body at various locations using 2-sided tape. The forces exerted by your feet onto
the ground will be measured when you walk across the force platform embedded into the ground.
The activity of your muscles will be recorded using self-adhesive electrodes attached onto your
body skin on the legs over the muscle groups of interest. You will be harnessed at all times
during testing to minimize injury from hitting the ground if you slip and loose balance.
More specifically, during the testing session, you will be asked to undergo the following steps:
1. Prior to walking experiments, you will wear the alternative footwear that we will
provide.
2. This experiment involves a risk of slipping. Thus, a safety harness will be put on you so
that if you lose your balance, we will catch you in the harness before you touch the floor.
3. During the experiment, you will be asked to walk several times across a walkway at a
comfortable pace. The flooring surface may be slippery. It is very important that you
walk naturally throughout the session.
4. For muscle testing you will be asked to sit in a chair with both feet placed flat on the
floor. EMG electrodes will be placed on your leg corresponding to a muscle. On
instruction the muscle being tested, you will be asked to contract that muscle. The
muscle consist of the ankle and knee muscles.
5. If the floor you just walked on had the slippery substance on it, you will be asked to wear
a clean pair of boots prior to continuing the experiment. At least two seated rest periods
will be allowed during the experiment. And, at least two qualified researchers will be in
the room should you need assistance.
6. During the obstacle avoidance walking trial, you will be asked to walk across the
walkway with normal curb height obstacles (4-8 inches high) that you will be required to
clear and finish walking across the walkway.
This complete cycle will occur for each of the 3 footwear on 3 different days. Your total time
will be 45 minutes for each session.
As part of the research study, we will record video of your movements while walking. These
images will consist of your face, body, and body movements while walking. The confidential
CD will be kept indefinitely. Your name will not be recorded in any way on the CD. Only your
subject number and date of testing will be written on the CD’s label. Unless you give separate
permission below, only the investigators associated with this study will have access to the CD.
The CD and any identifiable material will be stored in a locked filing cabinet within the Applied
Biomechanics Laboratory, in which only the investigators will have access. This recording will
be studied by the research team for use in the research project. We would also like you to
indicate below to what other uses of these digital recordings you are willing to consent. In each
of the uses listed below, images, such as your face and movements recorded on the CD will be
used for the purpose of describing the research procedures and in discussion of research findings.
If you are not willing to consent to other uses of the digital recordings, you are still eligible to

162
participate in the study. We will only use the CDs in the ways to which you agree. In any use of
these CDs, your name would not be identified; however, such use does present a risk for loss of
confidentiality because your image will not be altered to prevent your identification. These CDs
will be kept indefinitely.
1. The digital recordings can be shown to subjects in other experiments…______
Initials
2. The digital recordings can be used for scientific publications………… ______
Initials
3. The digital recordings can be shown at meetings of scientists………… ______
Initials
4. The digital recordings can be shown in classrooms to students………. ______
Initials
5. The digital recordings can be shown in public presentations to
Non-scientific groups……………………………………………………. ______
Initials
6. The digital recordings can be used on television……………………… ______
Initials
7. The digital recordings can be used on a public website maintained
by the research group………………………………………………..… ______
Initials
Risks and Benefits
There is a potential risk of falling due to slipping during the walking trials. This potential risk has
been minimized by the inclusion of a harness system that will catch you should you slip and
cannot recover balance on your own. With the proper functioning of the harness system, there is
no risk for falling to the floor. For each testing session and prior to any walking trials, the
rope/pulley system of the harness apparatus will be checked for malfunction. Therefore the
potential of hitting the floor after slipping is rare. You will wear the safety harness at all times
during walking trials on both dry and slippery floor conditions and also during the obstacle
avoidance trials to prevent such accidents.
There are other potential risks for injuries even if the subject does not fall onto the ground:
Muscle pull, muscle tear, skin abrasion, chafing, and sudden movement-related injuries (e.g.
being jerked), which may occur in the event of an equilibrium loss. At all times during balance
testing, the subject will wear a safety harness designed to eliminate the risk of falling during the
balance testing protocol. There are some risks for minor skin irritation and redness, associated
with the use of the 2-sided tape to attach markers and with the use of the EMG electrodes.
You will likely receive no direct benefit from taking part in this research study. Should the
testing procedures performed yield results that are abnormal, e.g. abnormal balance, abnormal
walking, you will be advised. If you decide to speak to your physician, it will be your
responsibility set up an appointment with him/her. The results will be available at no cost,
should you or your physician request them.

163
Confidentiality
Any information about you obtained from or for this research study will be kept as confidential
(private) as possible. The records identifying your name will be (1) stored in a locked file
cabinet and/or in a password-protected computer file, (2) kept separate from the rest of the
research records, and (3) be accessible to only the researchers listed on the first page of this form
and their staff. Your identity on the other research records will be indicated by a case number
rather than by your name. You will not be identified by name in any publication of the research
results unless you sign a separate form giving your permission (release).
Right to Withdraw
Your participation in this research study, to include the use and disclosure of your identifiable
information for the purposes described above, is completely voluntary. (Note, however, that if
you do not provide your consent for the use and disclosure of your identifiable information for
the purposes for the use of the recordings described above, you will still be allowedto participate
in the research study, and the recordings will not be used for anything other than analysis by the
staff.) Whether or not you provide your consent for participation in this research study will have
no affect on your current or future relationship with the University of Mississippi.
You may withdraw, at any time for any reason, your consent for participation in this research
study, to include the use and disclosure of your identifiable information for the purposes
described above. This voluntary withdraw can be for any reasons such as: physical discomfort of
any kind, emotional distress, feeling uneasy about the testing procedure, time constraints, and/or
lack of interests in participation. Any reason for which you feel as though you do not wish to
continue can be a means of discontinuing the study. Any and all identifiable research
information (CDs) recorded for, or resulting from, your participation in this research study prior
to the date that you formally withdrew your consent will be destroyed immediately.
If you start the study and decide that you do not want to finish, all you have to do is to tell Mr.
Harish Chander, Dr. John Garner or Dr. Chip Wadein person, by letter, or by telephone at the
Department of Health, Exercise Science, and Recreational Management, 215 Turner Center, The
University of Mississippi, University MS 38677, or 915-5561. Whether or not you choose to
participate or to withdraw will not affect your standing with the Department of Health, Exercise
Science, and Recreational Management, or with the University, and it will not cause you to lose
any benefits to which you are entitled.
IRB Approval
This study has been reviewed by The University of Mississippi’s Institutional Review Board
(IRB). The IRB has determined that this study fulfills the human research subject protections
obligations required by state and federal law and University policies. If you have any questions,
concerns or reports regarding your rights as a participant of research, please contact the IRB at
(662) 915-7482.

164
Statement of Consent
I have read the above information. I have been given a copy of this form. I have had an
opportunity to ask questions, and I have received answers. I consent to participate in the study.
Signature of Participant Date
Signature of Investigator Date
Statement of consentto be contacted for future studies
The staff of the Applied Biomechanics and Ergonomics Laboratory and/or Body Composition
Laboratory may be of interested in contacting you to participate in future studies. Signing below
allows us to contact you to contact you with information on future studies.
Signature of Participant Date
Signature of Investigator Date
NOTE TO PARTICIPANTS: DO NOT SIGN THIS FORM
IF THE IRB APPROVAL STAMP ON THE FIRST PAGE HAS EXPIRED.

165
APPENDIX C: RECRUITMENT SCRIPT

166
“RECRUITMENT SCRIPT” (verbal, in person)
(This should be a brief version of the consent document.)
My name is Mr. Harish Chander, Dr. Garner, Dr. Wade or Dr. Fu, a (graduate student, faculty
member) from the Department of HESRM at the University of Mississippi. I would like to invite
you to participate in my research study, the effect of alternative footwear such as the flip flops,
crocs and low top shoes on gait and slip trials.
You may participate if you do not have any musculoskeletal disorders or medical conditions that
may be aggravated by exercise. Please do not participate if you have any injury to the lower or
upper extremities, or balance disorders.
As a participant, you will be asked to walk across dry and slippery floor conditions and to clear
and walk across a normal curb height obstacle while wearing each of the three alternative casual
footwear.
This protocol may cause possible falls due to lack of balance under slippery flooring conditions.
However, injuries and falls are highly unlikely, and will be controlled for with the use of a
harness. Subjects are responsible for any and all medical costs that may result from injury during
or related to the study. To complete the study you will be required to attend three testing sessions
each lasting for about 45 minutes. Your decision whether or not to participate will not affect your
course credit or university standing.
If you are interested in participating, please place your name and email address on the sign-up
sheet that is being passed around. A member of the Biomechanics lab staff will be in contact to
set up testing times.
Do you have any questions now? If you have questions later, please contact me following class.

167
VITA
Harish Chander, BPT. MS
Doctoral Candidate (ABD) – PhD in Health & Kinesiology
Applied Biomechanics Laboratory
Department of Health, Exercise Science & Recreation Management
University of Mississippi
[email protected], [email protected]
662-202-7977
215 Turner Center, PO Box 1848, University, MS 38677
ACADEMIC RECORD:
Doctor of Philosophy University of Mississippi,
Department of Health, Exercise Science & Recreation
Management, University, MS
Major Area: Biomechanics / Neuromechanics
Minor Area: Exercise Physiology
Research Concentration: Ergonomics and Fall Prevention
Expected Graduation, May 2014
Doctoral Dissertation: Biomechanics of Slips in Alternative Footwear
Master of Science University of Mississippi,
Department of Health, Exercise Science & Recreation
Management, University, MS
Major Area: Neuromechanics
Minor Area: Exercise Physiology
Research Concentration: Ergonomics and Fall Prevention
May 2012
Masters’ Thesis: “Impact on Balance While Walking in Occupational Footwear”
Bachelor of Physical Therapy The Tamil Nadu Dr. MGR Medical University
Sree Balaji College of Physiotherapy
Major Area: Orthopedic and Pediatric Physical Therapy
Work Concentration: Neuro-Developmental Therapy and
Sports Injury Rehabilitation
May 2008
Under-Grad Dissertation: The Effects of Cryotherapy and Massage in the
Treatment of Delayed Onset of Muscle Soreness (DOMS)

168
EMPLOYMENT HISTORY:
2010 – Present Graduate Teaching Assistant
Department of Health, Exercise Science and Recreation
Management, University of Mississippi
Motor Control and Learning Instructor
Kinesiology Instructor and Teaching Assistant
Care and Prevention of Athletic Injuries Instructor
Biomechanics Laboratory Instructor
Exercise Physiology Instructor
Weight Training Instructor
Graduate Research Assistant
Applied Biomechanics Laboratory, University of
Mississippi
Undergraduate Practicum and Independent Study
Student Advisor
Equipment Management
Research Design, Evaluation and Implementation
Data Collection and Analysis
Programing and Coding for Data Analysis
2008 – 2009 Physical Therapist and Fitness Coordinator
Talwalkars Better Value Fitness Pvt. Ltd, Chennai, India
Exercise Prescription and Testing
Fitness Trainer
Administrative official for promoting health & fitness
2007 – 2008 Peadiatric Physical Therapist
Vinayaga Physio Point, Chennai, India
Pediatric Neuro-Development Therapy
Pain Relief of Musculoskeletal Injuries
Rehabilitation of Orthopedic and Neurological
Conditions

169
RESEARCH AND CLINICAL EXPERIENCE:
May 2012 – Present Graduate Student Director - Applied Biomechanics
Laboratory, University of Mississippi
2010 – Present Graduate Student Advisor - Honors Thesis Students -
Sally McDonnell Barksdale Honors College
2009 – Present Graduate Research Assistant - Applied Biomechanics
Laboratory, University of Mississippi
Research Experience
Biomechanics of gait and balance:
Biomechanics of Slips in Alternative Footwear (PI)
Biomechanics of Human Energy Expenditure, Balance
and Gait with Alternative Footwear (PI)
Kinematics and Kinetics of Slip Trials in Firefighters
(CO-I)
The Effect of Occupational Footwear on Dynamic
Balance (PI)
The Effect of Extended Durations of Walking in
Occupational Footwear on Balance (PI)
The Effect of Cold Suit on Balance Measures Among
the Young and Elderly (Data Analysis)
Pilot testing Kinematics of Walking on Ballast and
Non-Ballast Surfaces
The Acute Effect of Whole-Body Vibration on
Functional Stability Measures in Older Women.
Balance, Body Composition and Jumping Performance
in Collegiate Female Athletes
Sport performance and enhancement:
The Influence of Body Composition on Selected Jump
Performance Measures in Varsity Collegiate Female
Varsity Athletes
Three-Dimensional Examination of the Influence of
Differently Weighted Warm-up Bats on Swing
Kinematics
The Effects of Whole-Body Vibration on Rest Intervals
in Jumping Performance
The Effect of a TMJ Device on Athletic Performance
Measures

170
2004 – 2008 Sree Balaji College of Physiotherapy
Department of Physical Therapy
The Effect of Cryotherapy and Massage in the Treatment of
Delayed Onset of Muscle Soreness (PI)
Physical therapy outpatient department
Orthopedic, Cardio-respiratory and Neurological
Rehabilitation
Pediatric and Geriatric Rehabilitation
Exercise Therapy Rehabilitation
Electrotherapy Treatment Modalities
Manual Therapy
TEACHING CURRICULUM:
UM - ES 338 – Motor Control and Learning (Fall 2013; Spring 2014)
UM - ES 346 – Kinesiology (Spring 2012, Spring 2014)
UM - HP 303 – Prevention and Care of Athletic Injuries (Fall 2012; Spring 2013)
UM - ES 447 – Biomechanics Laboratory (Fall 2009, 2010; Spring 2010, 2011; Summer 2011,
2012)
UM - ES 349 – Exercise Physiology Laboratory (Summer 2013)
UM - HP 191 – Personal and Community Health (Summer 2012, 2012, 2013; Winter 2014)
UM - EL 151 – Resistance Training and Weight Lifting (Fall 2009, Spring 2010)
INVITED PRESENTATION / TALKS / LECTURES:
Ergonomics Assessment of Workplace Settings (Administrative Office), Ole Miss
Theatre, University of Mississippi, USA, 2013
Ergonomics Awareness and Workplace Safety (Slips, Trips and Fall Prevention) Schwing
Stetter India Pvt. Ltd, Chennai, India, 2013
Undergraduate Lectures:
UM 2013, ES 346 Kinesiology – Ankle and Foot Complex
UM 2013, ES 446 Biomechanics of Human Movement – Introduction to Biomechanics
UM 2013, ES 446 Biomechanics of Human Movement – Mechanical Levers in Humans
UM 2012, ES 446 Biomechanics of Human Movement – Gait
Graduate Lectures:
UM 2013, ES 632 Advanced Structural Kinesiology – Structure and Biomechanics of the
Foot and Ankle Complex
UM 2013, ES 632 Advanced Structural Kinesiology – Structure and Biomechanics of the
Hip Complex

171
UM 2013, ES 632 Advanced Structural Kinesiology – Structure and Biomechanics of the
Spine
UM 2012, ES 512 Foundations of Biomechanics – Biomechanics of Balance and Gait
UM 2011, ES 632 Advanced Structural Kinesiology – Spine Structural Kinesiology
UM 2011, ES 632 Advanced Structural Kinesiology – Gait
UM 2011, ES 632 Advanced Structural Kinesiology – Postural Control and Balance
UM 2011, ES 612 Instrumentation and Analysis in Biomechanics – Assessment of
Posture and Balance
PROFESSIONAL ORGANIZATIONS AND SERVICE:
2013 – Present Director – Academic and Professional
Development Committee - Graduate Student
Council - The University of Mississippi
2013 – Present Graduate Student Council Representative
Standing Committee - Office of the Chancellor;
Recreational Facilities
2012 – 2013 Chair – Academic Affairs Committee - Graduate
Student Council - The University of Mississippi
2012 – Present Senator - Graduate Student Council - The
University of Mississippi
2011 – Present Southeast Regional Chapter: American College of
Sports Medicine
Life Member Indian Association of Physiotherapists
CERTIFICATIONS:
Licensed Physical Therapist – Indian Association of Physiotherapists
Eligible to sit for US PT Licensure – National Physical Therapy Examination, USA
Certified Manual Therapist – Orthopedic Manipulative Rehabilitation
Certified Instructor for CPR/AED; Adult, Children & Infant, American Red Cross
RESEARCH FUNDING:
Chander, H
The effect of extended durations of walking in occupational footwear on postural control
University of Mississippi Graduate Student Council Research Grant 2011
Role: Primary Investigator
Funding Request: $500.00
Status: Funded

172
Chander, H
Biomechanical analysis of barefoot and shod conditions in human gait and balance
University of Mississippi Graduate Student Council Research Grant 2013
Role: Primary Investigator
Funding Request: $1000.00
Status: Not Funded
Cody Morris & Chander, H
Impact of Alternative Footwear on Human Energy Expenditure, Balance and Gait
University of Mississippi Graduate Student Council Research Grant 2013
Role: Co-Investigator
Funding Request: $1000.00
Status: Funded
Chander, H
Recipient of the UM Summer Thesis and Dissertation Scholarship, Summer 2012
AWARDS AND RECOGNITIONS:
Grand Prize Winner, University of Mississippi 3 Minute Thesis Competition -
Representing University of Mississippi at the South Council of Graduate Schools at San
Antonio in February 2014.
Winner of the Student of the Month, School of the Applied Sciences - October 2013
Winner of University of Mississippi - Annual Research Day and Symposium - 2nd Place;
2012
PEER-REVIEWED JOURNAL PUBLICATIONS:
1. Chander H, Garner JC, & Wade C. (2013). Impact on balance while walking in
occupational footwear. Footwear Science, (ahead-of-print), 1-8.
2. Garner JC, Wade C, Garten R, Chander H, & Acevedo E. (2013). The effect of boot
type on postural stability of professional firefighters. International Journal of Industrial
Ergonomic, 43(1), 77-81.
3. MacDonald CJ, Israetel M, Dabbs NC, Chander H, Allen CR, Lamont H, & Garner JC.
(2013) Influence of Body Composition on Selected Jump Performance Measures in
Collegiate Female Athletes. Journal of Trainology, 2: 33-37.
4. Chander H, MacDonald CJ, Dabbs NC, Lamont HS, & Garner JC. Balance Performance
in Varsity Collegiate Female Athletes. Sports Biomechanics (In review)

173
5. Chander H, Garner JC, & Wade C. The Effect of Occupational Footwear on Dynamic
Balance. Footwear Science (Awaiting final review for submission)
6. Wade C, Chander H, & Garner JC. The influence of boot type on slips in professional
firefighters. Fire Safety Journal (Awaiting final review for submission)
7. Chander H, Dabbs NC, Wade C. & Garner JC. Temporal and Spatial Parameters of Slip
Trials in Firefighters. (Manuscript in Preparation)
8. Chander H, Dabbs, NC, MacDonald CJ, Lamont HS, & Garner JC. The relationship of
anthropometrics and postural balance in female varsity athletes. International Journal of
Exercise Science (Manuscript in Preparation)
9. Chander H, Garner JC & Wade C. The effect of extended durations of walking in
occupational footwear on Muscle Activity. Footwear Science (Manuscript in Preparation)
10. Garner JC, Chander H, Dabbs NC, & Wade C. Joint Kinetics during Slip Trials in
Firefighters. Journal of Applied Biomechanics (Manuscript in Preparation)
PUBLISHED ABSTRACTS:
1. Chander H, Wade C, Allen CR, Cazas VL, Lundahl J & Garner JC. Muscle Activity
during Balance Perturbations in Occupational Footwear. Submitted to the World
Congress of Biomechanics 2014. Boston, MA, July 6-11, 2014.
2. Waddell DE, Chander H, Brewer CB. Exploring measures to better assess the effect of
cold on dynamic balance in a young and older female population. International Society
for Posture & Gait Research. 2014 ISPGR World Congress, Vancouver, Canada, June 29-
July 3, 2014.
3. Garner JC, Chander H, Wade C, Dabbs NC, Allen CR, Cazas VL, Lundahl J & Borland
CE. The Influence of Occupational Footwear on Lower Extremity Muscle Activity
During Balance Perturbations. ACSM 61st Annual Meeting, Orlando, FL, 2014.
4. Dabbs NC, Chander H, Cazas VL, Allen CR, Lundahl J, Terrell E & Castles C, Brown
LE & Garner JC. Effects of Whole Body Vibration on Vertical Jump Height and Power
Output Following Exercise Induced Muscle Soreness in Women. SWACSM 32nd Annual
SWACSM Meeting, Newport Beach, CA, October 18-19, 2013.
5. Chander H, Wade C, Dabbs NC, Allen CR, Cazas VL, Lundahl J, & Garner JC. The
Effect of Occupational Footwear on Dynamic Balance. Abstracted: Proceedings of the
American Society of Biomechanics Annual Meeting, Omaha, NE, Sept 4-7, 2013
6. Dabbs NC, Chander H, Allen CR, Lundahl J, Cazas VL, Hilton MS, Italia MA, &
Garner JC. The Effects of Whole-body Vibration on Ground Reaction Forces and
Rate of Force Development in College Aged Females. NSCA Annual Meeting, Las
Vegas, NV, July 11-13, 2013. Journal of Strength and Conditioning Research.
7. Allen CR, Lundahl J, Chander H, Zachay C, Dabbs NC, & Garner JC. The Acute
Effects of a Performance Mouthpiece on Whole Body Reaction Time to Balance
Perturbations. NSCA Annual Meeting, Las Vegas, NV, July 11-13, 2013. Journal of
Strength and Conditioning Research.

174
8. Cazas, VL, Brown, LE, Coburn, JW, Galpin AJ, Tufano JJ, Garner JC, Dabbs NC,
& Chander H. Influences of Rest Intervals Following Assisted Jumping on Peak
Velocity, Rate of Velocity Development & Rate of Force Development. NSCA Annual
Meeting, Las Vegas, NV, July 11-13, 2013. Journal of Strength and Conditioning
Research.
9. Garner JC, Chander H, Wade C, Dabbs NC, Waddell DE, & Lundahl J. Impacts of
Muscle Activity while Walking in Occupational Footwear. Abstracted: Medicine &
Science in Sports & Exercise, ACSM 60th Annual Meeting, Indianapolis, IN, 2013.
10. Dabbs NC, Chander H, Lundahl J, Allen CR & Garner JC. The Effects of Wholebody
Vibration on Vertical Jump Height and Peak Power. ACSM Annual Meeting,
Indianapolis, IN, May 28-June 1, 2013. Medicine and Science in Sports and
Exercise, 45(5S): S, 2013.
11. Chander H, Garner JC, Wade C, Dabbs NC, Waddell DE & Lundahl J. Impacts of
Muscle Activity while Walking in Occupational Footwear. SEACSM Regional
Meeting, Greenville, SC, Feb 14-16, 2013.
12. Dabbs NC, Chander H, Lundahl J, Allen CR & Garner JC. The Effects of Wholebody
Vibration on Vertical Jump Height and Peak Power. SEACSM Regional Meeting,
Greenville, SC, Feb 14-16, 2013.
13. Lundahl J, Allen CR, Dabbs NC, Chander H & Garner JC. The Acute Effects of a
performance Mouthpiece on Measures of strength and power. SEACSM Regional
Meeting, Greenville, SC, Feb 14-16, 2013.
14. Chander H, Garner JC, Wade C, Roche J, Dabbs NC & MacNeill RL. The Effect of
extended durations of walking in occupational footwear. Abstracted: Proceedings of the
American Society of Biomechanics, Gainesville, FL, 2012.
15. Dabbs NC, Garner JC, Ricks RC, Chander H, Wilkerson C, & Young J. The Influence
of different weighted warm-up bats on swinging performance. Abstracted: Medicine and
Science in Sports and Exercise 44(5), S401, 2012.
16. Garner JC, Chander H, Dabbs NC, Roche J & Wade C. The Influence of occupational
footwear on balance. Abstracted: Medicine & Science in Sports & Exercise 44(5), S336,
2012
17. Dabbs NC, Garner, JC, Chander, H, & Brown, LE. Preliminary Three-Dimensional
Examination of the Influence of Different Weighted Warm-up Bats on Swing Kinematics.
Journal of Strength and Conditioning Research 27(1s), 2012
18. Chander H, Wade, C, Garner, JC, Garten, R, & Acevedo, E. The Influence of
Firefighter Boot Type on Postural Measures. Abstracted: Proceedings of the American
Society of Biomechanics, Long Beach, CA, 2011
19. MacDonald CJ, Garner JC, Chander H, Gray H, Gentles J, Kavanaugh A, Israetel M,
Carter C, Mizuguchi S, & Hornsby W. Comparisons between Body Composition and
Power Production during Jumps in Collegiate Female Athletes. Abstracted: NSCA
Annual Meeting, Las Vegas, July 6 -9, 2011. Journal of Strength and Conditioning
Research.

175
RELEVANT GRADUATE COURSEWORK:
Neuromechanics:
UM ES 512 Foundations of Biomechanics
UM ES 609 Motor Control and Learning
UM ES 612 Instrumentation and Analysis in Biomechanics
UM ES 632 Advanced Structural Kinesiology
UM ES 644 Control of Voluntary Movement
UM ES 548 Biomechanics of Injury
UM ES 514 Applied EMG
Exercise Physiology:
UM ES 611 Exercise Physiology I - ES 611
UM ES 613 Health Aspects of Physical Activity - ES 613
UM ES 608 Methods and Procedures of GXT - ES 608
UM ES 614 Cardiovascular Physiology - ES 614
UM ES 618 Advanced Muscle Physiology - ES 618
Statistics and Research Methodology:
UM ES 625 Research Methodology, Design and Statistics
UM ES 620 Introduction to Statistics
UM PSY 604 Advanced Statistics
UM PHAD 680 General Linear Models
UM PHAD 681 Multivariate Analysis
UM HP 651 Effective Journal Writing
Supporting Course Work:
UM ES 651 Independent Study (Dr. Hugh Lamont - WBV & Vertical Jump)
UM ES 651 Independent Study (ENGR 312 Dr. Elizabeth Ervin - Mechanics of Materials)
UM ES 651 Independent Study (ENGR 309 Dr. Elizabeth Ervin – Statics and Dynamics)
UM ES 653 Independent Research (Dr. John C. Garner - Slip Parameters in Firefighters)
UM ES 653 Independent Research (Dr. John C. Garner - Occupational Footwear & Balance)
UM ES 620 (Dr. Dwight E. Waddell – Visual Basic & MATLAB Coding)
UM ES 650 Graduate Seminar (Dr. John C. Garner)
RFERENCES:
John C. Garner III, Ph.D., C.S.C.S
Interim Chair & Associate Professor of Exercise Science
Director: Applied Biomechanics Laboratory (ABL)
The University of Mississippi
Department of Health, Exercise Science, and Recreation Management
Turner Center 226, All American Drive
University, MS 38677
Email: [email protected], Phone: 662-915-5526

176
Chip Wade, Ph.D., CPE Assistant Professor, Risk Management, Insurance, & Financial Planning
Mississippi State University
Department of Finance and Economics
312M McCool Hall
Starkville, MS 39762
Email: [email protected], Phone: 662-325-7475
Mark Loftin, Ph.D., FACSM
Associate Dean, School of Applied Sciences and Professor of Exercise Science
The University of Mississippi
School of Applied Sciences, George Street University House
University, MS 38677
Email: [email protected], Phone: 662-915-7900
Chris Black, Ph.D.
University of Oklahoma
Department of Health and Exercise Science
1401 Asp Avenue
Huston Huffman Center, Room 104
Norman, OK 73019-6081
Email: [email protected], Phone: 405-325-5212
Nicole C. Dabbs, Ph.D.
Assistant Professor of Biomechanics
California State University, San Bernardino
Department of Kinesiology, HP 210
5500 University Parkway
San Bernardino, CA 92407
Email: [email protected], Phone: 714-337-0570
Related Documents


![Reviews [1991, Vol. 18, no. 1] - eGrove](https://static.cupdf.com/doc/110x72/6317d8add43a5363ca0341b3/reviews-1991-vol-18-no-1-egrove.jpg)


