Biomarker response of climate change induced ocean acidification and hypercapnia studies on brachyurian crab Portunus pelagicus R. Jeeva Priya, M. Anand*, M. Maruthupandy, A. Hameedha Beevi Department of Marine and Costal Studies, School of Energy Sciences, Madurai Kamaraj University, Madurai 625021, Tamilnadu, India Global J. Environ. Sci. Manage., 3(2): 165-176, Spring 2017 DOI: 10.22034/gjesm.2017.03.02.005 ORIGINAL RESEARCH PAPER Received 31 September 2016; revised 7 December 2016; accepted 20 December 2016; available online 1 March 2017 *Corresponding Author Email: [email protected] Tel.: +91 452 2459080 Fax: +91 452 2459080 Note: Discussion period for this manuscript open until June 1, 2017 on GJESM website at the “Show Article”. ABSTRACT: A laboratory level microcosm analysis of the impacts of ocean acidification on the environmental stress biomarkers in Portunus pelagicus (Linneaus 1758) exposed to a series of pH regimes expected in the year 2100 (pH 7.5 and 7.0) and leakage from a sub-seabed carbon dioxide storage site (pH 6.5 - 5.5) was carried out. Levels of the antioxidant enzyme catalase, the phase II detoxification enzyme, glutathione S. transferase, the lipid peroxidation biomarker, malondialdehyde, lipid peroxidase, acetylcholinesterase, reduced glutathione and were estimated in the tissues of the exposed animals to validate theses enzymes as biomarkers of Hypercapnia. The integrated biomarkers indicated a stress full environment in all animals except those exposed to the control seawater (pH 8.1). The reducing pH was also observed to be highly lethal to the animals exposed to lower pH levels which were obvious from the rate of mortality in a short term of exposure. The present study substantiates the role of biomarkers as early warning of ocean acidification at a sub-lethal level. KEYWORDS: Microcosm; CO 2 ; Hypercapnia; Portunus pelagicus; Sublethal. INTRODUCTION Oceans are a major global carbon sink, absorbing one-third of atmospheric CO 2 , thereby significantly mitigating global warming (Caldeira and Wickett, 2003; Royal Society, 2005; GACGC, 2006; Denman et al., 2007). The continuous influx of CO 2 into the oceans leads to a decline in the calcium carbonate (CaCO 3 ) saturation state of the seawater (Ω) in conjunction with decreasing pH, collectively termed as ocean acidification (Broecker et al., 1971; Bacastow and Keeling, 1973; Kleypas et al., 1999; Caldeira and Wickett, 2003; Andersson et al., 2005; Orr et al., 2005; Bandibas and Hilomen, 2016). The series of changes that accompanies this phenomenon of ocean acidification has serious repercussions on the carbon budget of the seawater, leading to 1% dissolved CO 2 which includes carbonic acid (H 2 CO 3 ) and that leaves 91% of bicarbonate (HCO 3 – ) and 8% carbonate (CO 3 2– ) in the carbonate system of the seawater (Portner, 2008). These changes lower the saturation state of CaCO 3 , with detrimental consequences for organisms that depend on CaCO 3 for the formation of shells and skeletons (Browman et al., 2008). Atkinson and Cuet (2008) defined the saturation state of CaCO 3 as its thermodynamic probability to either form or dissolve and is the product of the reacting ions divided by the product of the concentrations of those ions when the mineral is at equilibrium (Ksp), that is, when the mineral is neither forming nor dissolving. As provided in Eq.1 the value Ω > 1 thermodynamically favors the formation of CaCO 3 where as the value Ω < 1 indicates the thermodynamic favorability of the dissociation of CaCO 3 mineral.

Welcome message from author
This document is posted to help you gain knowledge. Please leave a comment to let me know what you think about it! Share it to your friends and learn new things together.
Transcript

Biomarker response of climate change induced ocean acidification and hypercapnia studies on brachyurian crab Portunus pelagicus
R. Jeeva Priya, M. Anand*, M. Maruthupandy, A. Hameedha Beevi
Department of Marine and Costal Studies, School of Energy Sciences, Madurai Kamaraj University, Madurai 625021, Tamilnadu, India
Global J. Environ. Sci. Manage., 3(2): 165-176, Spring 2017DOI: 10.22034/gjesm.2017.03.02.005
ORIGINAL RESEARCH PAPER
Received 31 September 2016; revised 7 December 2016; accepted 20 December 2016; available online 1 March 2017
*Corresponding Author Email: [email protected] Tel.: +91 452 2459080 Fax: +91 452 2459080Note: Discussion period for this manuscript open until June 1, 2017 on GJESM website at the “Show Article”.
ABSTRACT: A laboratory level microcosm analysis of the impacts of ocean acidification on the environmental stress biomarkers in Portunus pelagicus (Linneaus 1758) exposed to a series of pH regimes expected in the year 2100 (pH 7.5 and 7.0) and leakage from a sub-seabed carbon dioxide storage site (pH 6.5 - 5.5) was carried out. Levels of the antioxidant enzyme catalase, the phase II detoxification enzyme, glutathione S. transferase, the lipid peroxidation biomarker, malondialdehyde, lipid peroxidase, acetylcholinesterase, reduced glutathione and were estimated in the tissues of the exposed animals to validate theses enzymes as biomarkers of Hypercapnia. The integrated biomarkers indicated a stress full environment in all animals except those exposed to the control seawater (pH 8.1). The reducing pH was also observed to be highly lethal to the animals exposed to lower pH levels which were obvious from the rate of mortality in a short term of exposure. The present study substantiates the role of biomarkers as early warning of ocean acidification at a sub-lethal level.
KEYWORDS: Microcosm; CO2; Hypercapnia; Portunus pelagicus; Sublethal.
INTRODUCTIONOceans are a major global carbon sink, absorbing
one-third of atmospheric CO2, thereby significantly mitigating global warming (Caldeira and Wickett, 2003; Royal Society, 2005; GACGC, 2006; Denman et al., 2007). The continuous influx of CO2 into the oceans leads to a decline in the calcium carbonate (CaCO3) saturation state of the seawater (Ω) in conjunction with decreasing pH, collectively termed as ocean acidification (Broecker et al., 1971; Bacastow and Keeling, 1973; Kleypas et al., 1999; Caldeira and Wickett, 2003; Andersson et al., 2005; Orr et al., 2005; Bandibas and Hilomen, 2016). The series of changes that accompanies this phenomenon of ocean acidification has serious repercussions on the carbon
budget of the seawater, leading to 1% dissolved CO2 which includes carbonic acid (H2CO3) and that leaves 91% of bicarbonate (HCO3
–) and 8% carbonate (CO32–)
in the carbonate system of the seawater (Portner, 2008). These changes lower the saturation state of CaCO3, with detrimental consequences for organisms that depend on CaCO3 for the formation of shells and skeletons (Browman et al., 2008). Atkinson and Cuet (2008) defined the saturation state of CaCO3 as its thermodynamic probability to either form or dissolve and is the product of the reacting ions divided by the product of the concentrations of those ions when the mineral is at equilibrium (Ksp), that is, when the mineral is neither forming nor dissolving. As provided in Eq.1 the value Ω > 1 thermodynamically favors the formation of CaCO3 where as the value Ω < 1 indicates the thermodynamic favorability of the dissociation of CaCO3 mineral.

166
R. Jeeva Priya et al.
Ω =[Ca2+][CO3
2−]Ksp
(1)
The corrosive nature of the seawater induced by ocean acidification has the potential to decline Ω from the present day value of 3-3.5 to 2-2.5 in the tropics in another hundred years (Orr et al., 2005). This will have a serious impact on the rate of calcification CaCO3 in marine animals, inhibiting their ability to build and maintain shells and skeletons. Apart from affecting the rate of calcification, the increasing partial pressure of CO2 (pCO2) in seawater also disturbs the equilibrium in the concentration of CO2 between the seawater and the cells of the marine animals, which in turn disrupts the rate at which the cells remove excess CO2 formed within, thereby leading to respiratory acidosis (Rogelj et al., 2009). Respiratory acidosis negatively impacts metabolism and cellular functions. Though few animals are capable of overcoming the problem of respiratory acidosis the validity of adaptation for a longer term is under question.
The responses of calcifying organisms to increased CO2 and lower pH are often complex (Delille et al., 2005; Langer et al., 2006; Anthony et al., 2008; Ries et al., 2009; Erez et al., 2011; McCulloch et al., 2012;
Andersson & Gledhill, 2013; Venn et al., 2013) and can be difficult to evaluate with confidence (De’ath et al., 2009). However it is well understood that the overall process of ocean acidification induces hypoxia, oxidative stress by increased ROS and algal toxins all of which affects the marine calcifiers by their synergetic impacts (Mostafa et al., 2016). Hence the present study was designed with a goal to estimate the potential impacts of ocean acidification and hypercapnia on environmental stress biomarkers indicative of exposure to reactive oxygen species. Sensitive biochemical techniques were used to detect sub lethal impacts of ocean acidification combined with additional environmental stressors on adult brachyurian crab Portunus pelagicus (Linnaeus, 1758) in a microcosm experiment with a series hypercapnia levels expected in the year 2100 and leakage from a sub-seabed CO2 storage site (Widdicombe and Needham, 2007). This study was carried out in the Gulf of Mannar province during October and December 2015.
MATERIALS AND METHODSCollection and acclimation of test animals
Adult specimens of Portunus pelagicus, taxonomically identified after Turkey (2001) were
Fig. 1: The R-GIS image representation displaying the sampling universe in the Gulf of Mannar. SS1 sampling site near Hare island, SS2 sampling site near Manoli island and SS3 sampling site near Manoliputti island
Fig. 1: The R-GIS image representation displaying the sampling universe in the Gulf of Mannar. SS1 sampling site near Hare island, SS2 sampling site near Manoli island and SS3 sampling site near Manoliputti island
167
Global J. Environ. Sci. Manage., 3(2): 165-176, Spring 2017
collected from the coral reef ecosystem of three chosen islands viz. Hare island, Manoli island and Manoiputti island of the Gulf of Mannar province (9o12’8.5”N and 79o4’8.7”E (Fig 1). The collected animals were immediately transferred to the Marine Field Research Laboratory, Pudhumadam, Ramanathapuram and acclimated in filtered seawater for seven days at ambient conditions. The animals were fed twice a day with minced squid and 100% water exchange was carried out by siphoning every 24 hours to remove excess organic load. During the period of acclimation the water quality parameters viz. temperature (28±1oC), salinity (35 psu), dissolved oxygen (5±1 mg/L) and total alkalinity (2730 – 2735 µ equ/Kg) were monitored and maintained at ambient levels.
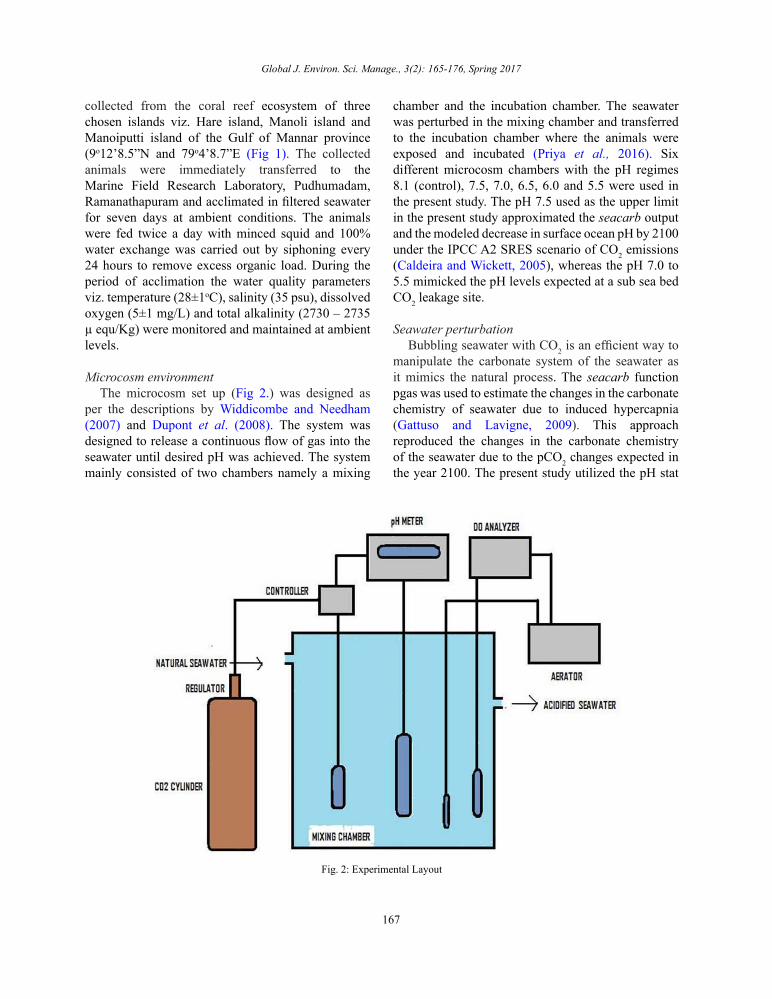
Microcosm environmentThe microcosm set up (Fig 2.) was designed as
per the descriptions by Widdicombe and Needham (2007) and Dupont et al. (2008). The system was designed to release a continuous flow of gas into the seawater until desired pH was achieved. The system mainly consisted of two chambers namely a mixing
chamber and the incubation chamber. The seawater was perturbed in the mixing chamber and transferred to the incubation chamber where the animals were exposed and incubated (Priya et al., 2016). Six different microcosm chambers with the pH regimes 8.1 (control), 7.5, 7.0, 6.5, 6.0 and 5.5 were used in the present study. The pH 7.5 used as the upper limit in the present study approximated the seacarb output and the modeled decrease in surface ocean pH by 2100 under the IPCC A2 SRES scenario of CO2 emissions (Caldeira and Wickett, 2005), whereas the pH 7.0 to 5.5 mimicked the pH levels expected at a sub sea bed CO2 leakage site.
Seawater perturbationBubbling seawater with CO2 is an efficient way to
manipulate the carbonate system of the seawater as it mimics the natural process. The seacarb function pgas was used to estimate the changes in the carbonate chemistry of seawater due to induced hypercapnia (Gattuso and Lavigne, 2009). This approach reproduced the changes in the carbonate chemistry of the seawater due to the pCO2 changes expected in the year 2100. The present study utilized the pH stat
Fig. 2: Experimental Layout
Fig. 2: Experimental Layout

168
Ocean acidification and hypercapnia studies on brachyurian crab
system for manipulation in which a mixture of air and pure CO2 was bubbled in seawater at the rate of 5 L/min until a desired pH value was obtained and the gas flow was cut off when the pH goes above or below the set value. All the calculations were carried out using the first and second dissociation constants of carbonic acid as described by Leuker et al. (2000).
Medium term exposure to stressorTwo healthy adult specimens were weighed and
randomly allocated in each incubation chamber irrespective of their sex. The chambers were then maintained at 12:12 hours Light: Dark regime to mimic the natural solar irradiation. Feeding was stopped and proper aeration was ensured throughout the experimental period of 15 days. Water was completely replaced by fresh perturbed seawater for every 24 hours to reduce excess ammonia load. The experiment was carried out in triplicate and repeated twice. The behavior of the exposed animals was closely monitored. Mortality was confirmed by permanent opening of the mouth and immovable limbs.
Physico-chemical status of perturbed seawaterThe seawater variables [pH, dissolved oxygen
(DO), temperature and total alkalinity (TA)] were closely monitored for every six hours throughout the period of exposure. The pH of the water was monitored using Oakton pH 700 bench top meter, where as Oakton waterproof DO 300 was used for measuring DO and Comark PDQ 400 high accuracy thermometer for temperature. 100 mL of subsamples were collected in every 24 hours and subjected to TA analysis with the procedure adopted from River Watch Network (1992).
Rate of mortalityThe exposed animals were carefully monitored and
any immobile animals were immediately removed and preserved at -40°C to prevent tissue degradation until further examination viz. protein and biomarker estimation.
Biomarker analysisAfter exposure, the animals were withdrawn and
subjected to dissection. The shells of the animals were carefully removed and the muscle tissue was dissected for further analysis. One gram of tissue was weighed washed in 0.85% saline and utilized for each of the following assays.
ProteinLevels of protein per gram tissue of the exposed animals were estimated by the method of Lowry et al. (1951) using a Bovine Serum Albumin (BSA) standard.
Catalase (CAT)The levels of CAT in the tissue of the exposed
animals were estimated as described by Sinha (1972). The CAT activity was measured by reading the absorbance of chromic acetate at 570 nm, which was formed as intermediate while heating dichromate acetic acid mixture in the presence of H2O2.
Lipid peroxidation (LPx)Methods of Okhawa et al. (1979) was followed
for estimation of lipid peroxidation in the tissues of the exposed animals. Malondialdehyde (MDA), a breakdown product of lipid peroxides, readily reacts with thiobarbituric acid (TBA) under acidic conditions to give a colored reaction product. The MDA-TBA reaction products were measured at 532 nm using a spectrophotometer.
Acetylcholinesterase (AChE)Ellman et al. (1961) was followed to assay the
activity of AChE. The reaction of thiocholine, formed from the substrate analogue acetyl choline iodide, with the chromogenic substrate 5-5’-dithiobis (2 nitro benzoic acid) (DTNB) leads to the formation of a yellow anion, nitrobenzoic acid, which absorbs strongly at 412 nm.
Reduced glutathione (GSH)The methods proposed by Moron et al. (1979) were
followed to assay GSH levels. GSH can be measured by its reaction with DTNB to give a compound that absorbs at 412 nm.
Glutathione S Transferase (GST)As per Habig et al. (1974) the GST activity
was assayed spectrophotometrically at 340 nm by measuring the rate of 1-chloro 2, 4-dinitro-benzene (CDNB) conjugation with reduced glutathione as a function of time.
Statistical analysisSince all data were normally distributed (P>0.05 as
per Shapiro wilk’s test) two way analysis of variance
169
Global J. Environ. Sci. Manage., 3(2): 165-176, Spring 2017
(ANOVA) was performed to estimate the significance of the microcosm performance and one way ANOVA was carried out to estimate the significance of the change in each biomarker at each nominal pH regime. A P value < 0.05 was considered significant and all the statistical analysis was carried out using SPSS version 17.
RESULTS AND DISCUSSIONChanges in CO2 microcosm environment
The scientific evidence so far in the field of climate change research proves 0.1 unit fall in the surface ocean pH since the industrial revolution and further 0.5 units decrease by 2100 (Caldeira and Wickett, 2005). Most of the studies on ocean acidification prefers short term acute exposure (hours to days) to extremely high pCO2 conditions (Hypercapnia) over medium or long
term exposure (weeks to months) to more relevant pCO2 conditions. Despite the conditions that are much higher than the levels projected for future climate change scenarios, these studies are invaluable because they provide a mechanistic basis for understanding differences in the sensitivity of marine invertebrate taxa to ocean acidification (Fabry et al., 2008, Pörtner 2008, Widdicombe and Spicer 2008, Melzner et al., 2009, Hale et al., 2011). The present study here in employs pH regimes expected in the year 2100 and from sub seabed CO2 leakage. The experiments conducted so far in this area have focused only on direct effects even though indirect effects are highly plausible (Guinotte and Fabry, 2008); therefore the present study was employed to estimate the sub lethal effects of ocean acidification on the environmental stress faced by the marine animals.
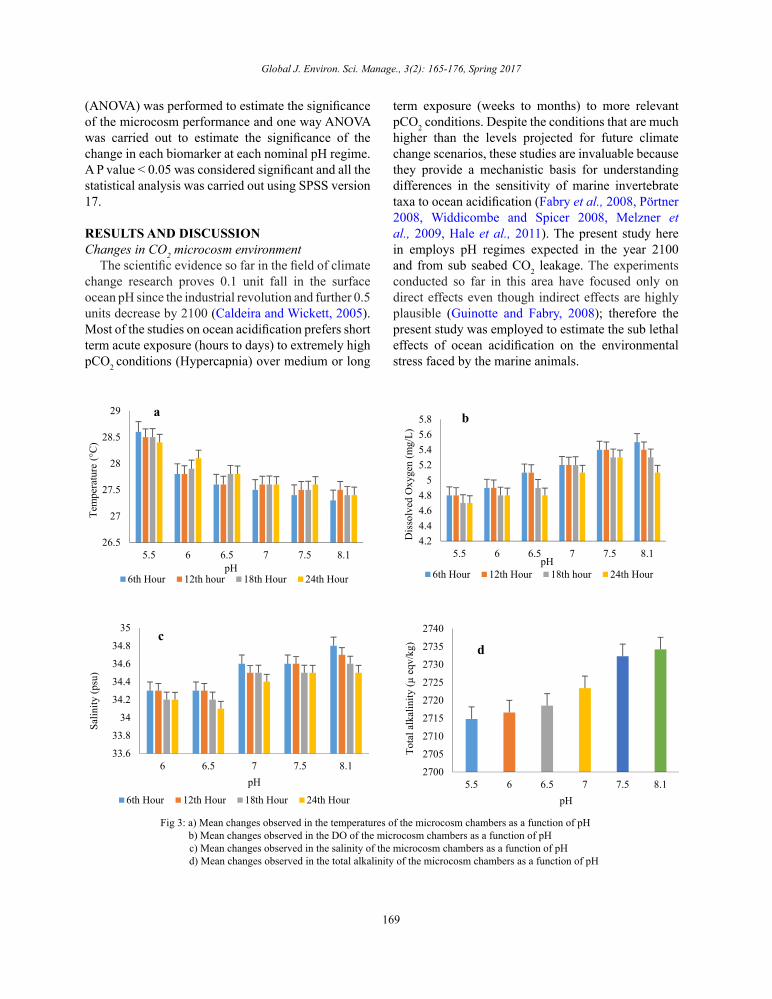
Fig 3: a) Mean changes observed in the temperatures of the microcosm chambers as a function of pH
b) Mean changes observed in the DO of the microcosm chambers as a function of pH c) Mean changes observed in the salinity of the microcosm chambers as a function of pH
d) Mean changes observed in the total alkalinity of the microcosm chambers as a function of pH
26.5
27
27.5
28
28.5
29
5.5 6 6.5 7 7.5 8.1
Tem
pera
ture
(°C)
pH6th Hour 12th hour 18th Hour 24th Hour
a
4.24.44.64.8
55.25.45.65.8
5.5 6 6.5 7 7.5 8.1
Dis
solv
ed O
xyge
n (m
g/L)
pH6th Hour 12th Hour 18th hour 24th Hour
b
33.6
33.8
34
34.2
34.4
34.6
34.8
35
6 6.5 7 7.5 8.1
Salin
ity (p
su)
pH6th Hour 12th Hour 18th Hour 24th Hour
c
2700
2705
2710
2715
2720
2725
2730
2735
2740
5.5 6 6.5 7 7.5 8.1
Tota
l alk
alin
ity (µ
eqv
/kg)
pH
d
Fig 3: a) Mean changes observed in the temperatures of the microcosm chambers as a function of pH b) Mean changes observed in the DO of the microcosm chambers as a function of pH c) Mean changes observed in the salinity of the microcosm chambers as a function of pH d) Mean changes observed in the total alkalinity of the microcosm chambers as a function of pH

170
R. Jeeva Priya et al.
Biomarkers are valuable inexpensive tools which can be detected even at sublethal concentration of any stressor thereby giving us an early warning on the degradation of environmental quality.
The observations of the physico - chemical parameters in the incubation chamber revealed significant changes that have been summarized in Fig. 3a-d. The pH of the seawater was remained constant and significant changes were observed in the remaining variables at each nominal pH. The highest mean (± SD) temperature (28.6⁰C ± 0.08) was observed in pH 5.5 and the lowest as 27.3⁰C ± 0.08 which was observed in pH 8.1. The level of DO gradually decreased with decreasing pH, the highest level as 5.5 ± 0.2 which was observed in pH 8.1 and the lowest as 4.7 ± 0.05 in pH 5.5. Unlike DO the salinity level increased with decreasing pH, with the highest salinity as 34.8 ± 0.1 psu being observed in pH 5.5 and the lowest as 34 ± 0.2 psu in pH 8.1. The alkalinity level in the seawater decreased gradually with the pH. The control seawater exhibited a total alkalinity level of 2734 µatm which was the highest and the pH 5.5 exhibited the lowest level of 2714 µatm.
Survival of the exposed animalsA visible sign of mortality was observed in all
the animals exposed to the hypercapnic conditions especially at pH 5.5, where as the animals in the control seawater was found to be healthy. Mortality was confirmed by the permanent opening of the mouth and immobile limbs. Complete mortality was observed in pH 5.5 within 72 hours of exposure whereas no mortality was observed in the remaining pH regimes.
Biomarker analysisBiomarkers are valuable inexpensive tools which
can be detected even at sublethal concentration of any stressor thereby giving us an early warning on the degradation of environmental quality. Most of the organisms have developed a complex antioxidative system with the intention to protect cellular membranes and organelles from the destructive effects of toxic retention of reactive oxygen species (ROS). Oxidative stress can have three levels of effect on an organism. The first effect is the antioxidant response to eliminate pro-oxidants and thus prevent oxidative damage. When this first response fails
an elevation of total antioxidant capacity in blood, altered activity of antioxidant enzymes occurs due to cell damage. Hence, for self defense, the organisms stimulate the activities of free radical scavenging biomarker enzymes like superoxide dismutase (SOD), CAT and GPx (Nagarani et al., 2011). The last level involves larger scale general physiological effects such as perturbation of growth, impaired ability to handle other stresses, and death. Increase in the CAT activity has been reported in various fish and invertebrate species (Di Giulio et al., 1993; Stephensen et al., 2000) whereas inhibition of CAT has been suggested as a transitory response to acute pollution (Regoli and Principato, 1995).
ProteinThe level of total protein gradually decreased
with decreasing pH. The animals exposed to the control seawater exhibited the highest level (4.24 mg/g tissue) where as the animals exposed to pH 6.0 had the lowest level (0.65 mg/g tissue). The detailed summary of the results is expressed in Fig 4a.
Catalase (CAT)CAT activity decreased with decreasing pH (Fig.
4b). Significant inter pH difference was observed in CAT activity. The highest activity (0.02 H2O2 consumed/min/mg protein) was observed in control whereas the lowest activity (0.017 H2O2 consumed/min/mg protein) was observed in pH 6.0. In the present study the CAT activity increased with decreasing pH. Previous study by Bebianno et al., 2005 inferred that CAT removes most of the H2O2 by increasing its activity however it ca not compete with excess presence of Fe which generate HO radicals via the Fenton reaction, thereby causing increased concentration of LP. The increased activity of both CAT and LP in the present study indicates that CAT activity in the muscles of Portunus pelagicus is not sufficient to eliminate H2O2 before the formation of hydroxyl radicals as it has been suggested above.
Lipid peroxidation (LPx)Significant differences in malonedialdehyde
levels were observed among the nominal pH levels. The activity was observed to be gradually decreasing with decreasing pH (Fig 4c). The animals exposed to control seawater exhibited highest activity (0.14 nanomoles of MDA per milligram of tissue protein)

171
Global J. Environ. Sci. Manage., 3(2): 165-176, Spring 2017
whereas the animals exposed to pH 6.0 exhibited lowest activity (0.06 nanomoles of MDA per milligram of tissue protein).
Acetylcholinesterase (AChE)Significant inter-pH differences were observed
among the treatment groups. Unlike CAT and LPx,
the activity of AChE increased with decreasing pH (Fig. 4d). Highest activity (0.02 µmol AChE min/mg protein) was observed in pH 6.0 and the control expressed lowest activity (0.0005 µmol AChE min/mg protein). Numerous studies demonstrated the effectiveness of AChE measurement as a biomarker of exposure to neurotoxic compounds in aquatic
Fig 4:
a) Effects of reduced pH on level of proteins in the tissue of the exposed Portunus pelagicus b) Effects of reduced pH on CAT levels in the tissue of the exposed Portunus pelagicus c) Effects of reduced pH on LPx levels in the tissue of the exposed Portunus pelagicus
d) Effects of reduced pH on AChE levels in the tissue of the exposed Portunus pelagicus e) Effects of reduced pH on GSH levels in the tissue of the exposed Portunus pelagicus f) Effects of reduced pH on GST levels in the tissue of the exposed Portunus pelagicus
y = 0.8313x - 0.1085R² = 0.9719
00.5
11.5
22.5
33.5
44.5
6 6.5 7 7.5 8.1
Prot
ein
(mg/
g)
pH
a
y = 0.0019ln(x) + 0.017R² = 0.9891
0.015
0.016
0.017
0.018
0.019
0.02
0.021
6 6.5 7 7.5 8.1
H2O
2co
nsum
ed/m
in/m
g pr
otei
npH
b
y = 0.0045x2 - 0.0066x + 0.0613R² = 0.9687
0
0.02
0.04
0.06
0.08
0.1
0.12
0.14
0.16
6 6.5 7 7.5 8.1
nano
mol
es o
f mal
ondi
alde
hyde
(m
g of
tiss
ue p
rote
in)
pH
cy = 0.0012x2 - 0.0108x + 0.0248
R² = 0.9997
00.0020.0040.0060.008
0.010.0120.0140.0160.018
6 6.5 7 7.5 8.1
µmol
ACT
I min
/mg/
prot
ein
pH6 6.5 7 7.5 8.1
d
y = 0.0422x2 - 0.1674x + 0.2607R² = 0.9841
0
0.1
0.2
0.3
0.4
0.5
0.6
6 6.5 7 7.5 8.1
RG/m
in/m
g pr
otei
n
pH
e y = 0.0039x2 - 0.0305x + 0.0599R² = 0.9673
0
0.01
0.02
0.03
0.04
6 6.5 7 7.5 8.1Mic
rom
oles
of G
SH &
CD
NB
conj
ugat
e for
med
/min
/mg/
pro
tein
pH6 6.5 7
f
Fig 4: a) Effects of reduced pH on level of proteins in the tissue of the exposed Portunus pelagicus b) Effects of reduced pH on CAT levels in the tissue of the exposed Portunus pelagicus c) Effects of reduced pH on LPx levels in the tissue of the exposed Portunus pelagicus d) Effects of reduced pH on AChE levels in the tissue of the exposed Portunus pelagicus e) Effects of reduced pH on GSH levels in the tissue of the exposed Portunus pelagicus f) Effects of reduced pH on GST levels in the tissue of the exposed Portunus pelagicus

172
Ocean acidification and hypercapnia studies on brachyurian crab
organisms (Cajaraville et al., 2000). In the present study significant variations in the AchE activity of Portuus pelagicus muscle tissues were recorded. However the increase in activity do not confirms the impact of neurotoxic compounds on animals due to decreasing pH. AChE-inhibiting neurotoxic compounds can cause serious dysfunction in aquatic organisms, e.g., behavioural changes, paralysis and death (Fulton and Key, 2001). As a consequence, AChE has been employed as a useful biomarker in biomonitoring studies (Escartı´n and Porte, 1997; Radenac et al., 1998; Mora et al., 1999; Dailianis et al., 2003).
Reduced glutathione (GSH)The level of GSH decreased with decreasing pH
(Fig. 4e). The changes in the activity were observed to be statistically significant between the treatment groups. Animals exposed to control pH exhibited the highest activity (0.49 min/mg protein) whereas the lowest activities were observed at pH 6.0 (0.12 min/mg protein). Glutathione is responsible for the regulation of intracellular levels of lipid peroxidation and also acts as a reactant in conjugation with electrophillic substances, therefore change in GSH levels may be a very important indicator of the detoxification ability of an organism (Vijayavel et al., 2004). The decrease in the level of glutathione observed in the preset study may be due to the enhanced oxidative damage caused by free radicals, which concur with the findings of Doyotte et al. (1997) in aquatic invertebrates exposed to trace metals. Glutathione S-transferase (GST) in conjunction with glutathione (GSH) detoxifies lipid hydroperoxides from the system (Saliu et al., 2012).
Glutathione S Transferase (GST)An increase in activity of GST was observed with
decreasing pH and the inter-pH differences were observed to be statistically significant (Fig. 4f). The highest activity (0.04 µmol of GSH and CDNB
conjugate formed/min/mg protein) was observed in animals exposed to pH 6.0 whereas the animals exposed to pH 8.1 expressed the lowest activity (0.003 µmol of GSH and CDNB conjugate formed/min/mg protein). Although GST induction has been widely demonstrated following exposure to some organic contaminants (Stephensen et al., 2000), its inhibition has also been reported as a non-specific response to chemical challenge (Regoli et al., 2003). However, the decrease in GSH content observed in the muscle tissues of Portunus pelagicus exposed to hypercapnia may be attributed to insufficient glutathione regeneration as proposed by Kurutaş et al. (2008).
Statistical AnalysisAll dependent variables have been expressed as
mean ± S.D. The P value was less than 0.05 for CO2 microcosm performance and the biomarker analysis. The value of R2 obtained for each biomarker analysis has been displayed in Table 1. All the biomarkers investigated in the present experiment exhibited a clear pattern of significant impact (p < 0.05). The activity of CAT, LPx and GSH exhibited positive correlation where as the activity of AChE and GST exhibited negative correlation. Each biomarker had a R2 value nearer to 1 there by exhibiting a perfect fit to their respective trend lines. While considering the changes in the seawater variables, highly significant changes (p < 0.05) were observed in all the parameters both within and between groups. However the variation in the temperature and salinity observed at each hour (between groups) was observed to be marginally significant and hence proving the serious inter relationship between the variables and the pCO2 induced hypercapnia.
CONCLUSIONIn the present study the cost effective and simple
biochemical tools were employed to monitor the climate change induced ocean acidification and
Table 1: Regression analysis of the effects of hypercapnia on biomarkers and protein
S. No Biomarker Regression R2 Trend
1 Lipid peroxidase 0.9687 Polynomial 2 Catalase 0.9891 Logarithmic 3 Reduced Glutathione 0.9841 Polynomial 4 Glutathione S Transferase 0.9673 Polynomial 5 Acetylcholinesterase 0.9997 Polynomial 6 Protein 0.9719 Linear
Table 1: Regression analysis of the effects of hypercapnia on biomarkers and protein

173
Global J. Environ. Sci. Manage., 3(2): 165-176, Spring 2017
hypercapnia impact on Portunus pelagicus. The study concluded that even a 0.5 unit fall in pH could be highly fatal to sensitive crustaceans like Portunus pelagicus which is obvious from the high rate of mortality even for a very short period of exposure. The study revealed that the biomarkers act as a promising tool for monitoring ocean acidification and Hypercapnia impacts on marine calcifying organism Portunus pelagicus.
ACKNOWLEDGEMENTThe authors are thankful of the Madurai Kamaraj
University Grants Commission for the first author as providing Basic Science Research fellowship and DST PURSE for the consumable support for completing the study.
CONFLICT OF INTERESTThe author declares that there is no conflict of
interests regarding the publication of this manuscript.
ABBREVIATIONSµatm Micro atmospheresµequ/Kg Micro equivalents per kilogramµmols min/mg Micro moles per minute per milligramAChE Acetyl choline esteraseANOVA Analysis of varianceBSA Bovine serum albumin°C Degree celsiusCa CalciumCAT CatalaseCDNB Chloro di nitro benzeneCO2 Carbon dioxideCO3 CarbonateDO Dissolved oxygenDTNB 5,5’-dithiobis-(2-nitrobenzoic acid)Fe IronGPx Glutathione peroxideGSH Reduced glutathioneGST Glutathione S transferaseH2CO3 Carbonic acidH2O2 Hydrogen peroxideHCO3 BicarbonateHO Hydroxide radicalsIPCC A2 SRES Intergovernmental panel on climate
change A2 special report on emission scenarioKsp Dissociation constantL/min Litres per minutes
LP Lipid peroxideLPx Lipid PeroxidationMDA Malone di aldehydeMg/g milligrams per gramMg/L milligrams per litremL milli litrenm Nano Meternmol Nano molespCO2 Partial pressure of carbon dioxidepsu Practical salinity unitP/p value Probability valueR2 Regression valueROS Reactive oxygen speciesSD Standard DeviationSOD Sulphur oxide dismutaseSPSS Statistical package for the social sciencesTA Total alkalinityTBA Thio barbituric acidΩAr Aragonite Saturation StateΩCa Calcite Saturation State
REFERENCESAndersson, A.J.; Mackenzie, F.T.; Lerman, A., (2005). Coastal
ocean and carbonate systems in the high CO2 world of the Anthropocene. Am. J. Sci., 305(9): 875–918 (44 pages).
Andersson, A.J.; Gledhill, D., (2013). Ocean acidification and coral reefs: effects on breakdown, dissolution, and net ecosystem calcification. Ann. Rev. Mar. Sci., 5: 321-348 (28 pages).
Anthony, K.R.; Kline, D.I.; Diaz-Pulido, G.; Dove, S.; Hoegh-Guldberg, O., (2008). Ocean acidification causes bleaching and productivity loss in coral reef builders. Proc. Natl. Acad. Sci., 105(45): 17442-17446 (5 pages).
Atkinson, M.J.; Cuet, P., (2008). Possible effects of ocean acidification on coral reef biogeochemistry: topics for research. Mar. Ecol. Prog. Serv., 373: 249-256 (8 pages).
Bacastow, R.O.; Keeling, C.D., (1973). Atmospheric carbon dioxide and radiocarbon in the natural carbon cycle: II. Changes from A.D. 1700 to 2070 as deduced from a geochemical model. In: Woodwell GM, Pecan EV (eds), Carbon and the biosphere. US Atomic Energy Commission, Washington DC, 86-135 (50 pages).
Bandibas, M.; Hilomen, V., (2016). Crab biodiversity under different management schemes of mangrove cosystems. Global J. Environ. Sci. Manage., 2(1): 19-30 (12 pages).
Bebianno, M.J.; Company, R.; Serafim, A.; Camus, L.; Cosson, R.P.; Fiala-Médoni, A., (2005). Antioxidant systems and lipid peroxidation in Bathymodiolus azoricus from Mid-Atlantic Ridge hydrothermal vent fields. Aquat. Toxicol., 75(4): 354-373 (19 pages).
Broecker, W.S.; Li, Y.H.; Peng, T.H., (1971). Carbon dioxide- man’s

174
R. Jeeva Priya et al.
unseen artifact. In: Hood DW (ed), Impingement of man on the oceans. John Wiley & Sons, New York, 287–324 (37 pages).
Browman, H.I.; Alain F.V.; Guldberg, O.H., (2008). Effects of Ocean Acidification on Marine Ecosystem. Mar. Ecol. Prog. Serv.., 373:199-201 (3 pages).
Cajaraville, M.P.; Bebianno, M.J.; Blasco, J.; Porte, C.; Sarasquete, C.; Viarengo, A., (2000). The use of biomarkers to assess the impact of pollution in coastal environments of the Iberian Peninsula: a practical approach. Sci. Total Environ., 247(2): 295-311 (16 pages).
Caldeira, K.; Wickett, M.E., (2003). Oceanography: anthropogenic carbon and ocean pH. Nature, 425(6956): 365 (1 page).
Caldeira, K.; Wickett, M.E., (2005). Ocean model predictions of chemistry changes from carbon dioxide emissions to the atmosphere and ocean. J. Geophys. Res. C: Oceans, 110: (C09S04).
Dailianis, S.; Domouhtsidou, G.P.; Raftopoulou, E.; Kaloyianni, M.; Dimitriadis, V.K., (2003). Evaluation of neutral red retention assay, micronucleus test, acetylcholinesterase activity and a signal transduction molecule (cAMP) in tissues of Mytilus galloprovincialis (L.), in pollution monitoring. Mar. Environ. Res., 56(4): 443-470 (27 pages).
De’ath, G.; Lough, J.M.; Fabricius, K.E., (2009). Declining coral calcification on the Great Barrier Reef. Science, 323(5910): 116-119 (4 pages).
Delille, B.; Harlay, J.; Zondervan, I.; Jacquet, S.; Chou, L.; Wollast, R.; Bellerby R.G.J., Frankignoulle, M.; Borges, A.V.; Riebesell, U.; Gattuso, J.P., (2005). Response of primary production and calcification to changes of pCO2 during experimental blooms of the coccolithophorid Emiliania huxleyi. Global Biogeochem. Cycles, 19(2).
Denman, K.L.; Brasseur, G.P.; Chidthaisong, A.; Ciais, P.; Cox, P.M.; Dickinson, R.E.; Hauglustaine, D.A.; Heinze, C.; Holland, E.A.; Jacob, D.J.; Lohmann, U.; Ramachandram, S.; da Silva Dias, P.L.; Wofsy, S.C.; Zhang X., (2007). Couplings between changes in the climate system and biogeochemistry. In: Climate change: The physical science basis (Eds.: Solomon, S.; Qin, D.; Manning, M.; Chen, Z.; Marquis, M.; Averyt, K.B.; Tignor, M.; Miller, H.L.) Contribution of working group I to the fourth assessment report of the Intergovernmental Panel on Climate Change. Cambridge University Press. 499-587 (88 pages).
Di Giulio, R. T.; Habig, C.; Gallagher, E. P., (1993). Effects of Black Rock Harbor sediments on indices of biotransformation, oxidative stress, and DNA integrity in channel catfish. Aquat. Toxicol., 26(1): 1- 2 (22 pages).
Doyotte, A.; Cossu, C.; Jacquin, M.C.; Babut, M.; Vasseur, P., (1997). Antioxidant enzymes, glutathione and lipid peroxidation as relevant biomarkers of experimental or field exposure in the gills and the digestive gland of the freshwater bivalve Unio tumidus. Aquat. Toxicol., 39(2): 93-110 (17 pages).
Dupont, S.; Havenhand, J.; Thorndyke, W.; Peck, L.; Thorndyke, M., (2008). Near-future level of CO2- driven ocean acidification radically affects larval survival and development in the brittlestar Ophiothrix fragilis. Mar. Ecol. Prog. Serv.., 373:285-294 (9 pages).
Ellman, G.L.; Courtney, K.D.; Andres, V.; Featherstone, R.M., (1961). A new and rapid colorimetric determination of acetylcholinesterase activity. Biochem. Pharmacol., 7(2): 88-95 (8 pages).
Erez, J.; Reynaud, S.; Silverman, J.; Schneider, K.; Allemand, D., (2011). Coral calcification under ocean acidification and global change. In Coral reefs: an ecosystem in transition (eds Dubinsky, Z., Stambler, N.,). Springer Netherlands. 151-176 (26 pages).
Escartin, E.; Porte, C., (1997). The use of cholinesterase and carboxylesterase activities from Mytilus galloprovincialis in pollution monitoring. Environ. Toxicol. Chem., 16(10): 2090-2095 (6 pages).
Fabry, V.J.; Seibel, B.A.; Feely, R.A.; Orr, J.C., (2008). Impacts of ocean acidification on marine fauna and ecosystem processes. ICES J. Mar. Sci., 65(3): 414-432 (19 pages).
Fulton, M.H.; Key, P.B., (2001). Acetylcholinesterase inhibition in estuarine fish and invertebrates as an indicator of organophosphorus insecticide exposure and effects. Environ. Toxicol. Chem., 20(1): 37-45 (9 pages).
Gattuso, J.P.; Lavigne, H., (2009). Technical note: approaches and software tools to investigate the impact of ocean acidification. Biogeosci., 6(10): 2121-2133 (13 pages).
German Advisory Council on Global Change., (2006). The Future Oceans: Warming Up, Rising High, Turning Sour. Berlin.
Guinotte, J.M.; Fabry, V.J., (2008). Ocean acidification and its potential effects on marine ecosystems. Ann. N.Y. Acad. Sci. , 1134(1): 320-342 (23 pages)
Habig, W.H.; Pabst, M.J.; Jakoby, W.B., (1974). Glutathione S-transferases the first enzymatic step in mercapturic acid formation. J. Biol. Chem., 249(22): 7130-7139 (10 pages).
Hale, R.; Calosi, P.; McNeill, L.; Mieszkowska, N.; Widdicombe, S., (2011). Predicted levels of future ocean acidification and temperature rise could alter community structure and biodiversity in marine benthic communities. Oikos, 120(5): 661-674 (14 pages).
Kleypas, J.A.; Buddemeier, R.W.; Archer, D.; Gattuso, J.P.; Langdon, C.; Opdyke, B.N., (1999). Geochemical consequences of increased atmospheric carbon dioxide on coral reefs. Science, 284(5411): 118-120 (3 pages).
Kurutaş, E.B.; Şahan, A.; Altun, T., (2009). Oxidative Stress Biomarkers in Liver and Gill Tissues of Spotted Barb (Capoeta Barroisi Lortet, 1894) Living in Ceyhan River, Adana-Turkey. Turk. J. Biol., 33(4): 275-282 (8 pages).
Langer, G.; Geisen, M.; Baumann, K.H.; Kläs, J.; Riebesell, U.; Thoms, S.; Young, J.R., (2006). Species‐specific responses of calcifying algae to changing seawater carbonate chemistry. Geochem. Geophys. Geosyst., 7(9).
Linnaeus C., (1758). Systema Naturae per Regna Tria Naturae, Secundum Classes, Ordines, Genera, Species, cum Characteribus, Differentiis, Synonymis, Locis., 10:(1): 1-824 (824 pages).
Lowry, O.H.; Rosebrough, N.J.; Farr, A.L.; Randall, R.J., (1951). Protein measurement with the Folin phenol reagent. J. Biol. Chem., 193(1): 265-275 (11 pages).
Lueker, T.J.; Dickson, A.G.; Keeling, C.D., (2000). Ocean pCO2 calculated from dissolved inorganic carbon, alkalinity, and

175
Global J. Environ. Sci. Manage., 3(2): 165-176, Spring 2017
equations for K1 and K2: validation based on laboratory measurements of CO2 in gas and seawater at equilibrium. Mar. Chem., 70(1): 105-119 (15 pages).
McCulloch, M.; Falter, J.; Trotter, J.; Montagna, P., (2012). Coral resilience to ocean acidification and global warming through pH up-regulation. Nat. Clim. Change., 2(8): 623-627 (5 pages).
Melzner, F.; Gutowska, M.A.; Langenbuch, M.; Dupont, S.; Lucassen, M.; Thorndyke, M.C.; Bleich M.; Pörtner, H.O., (2009). Physiological basis for high CO2 tolerance in marine ectothermic animals: pre- adaptation through lifestyle and ontogeny?. Biogeosci., 6(10): 2313-2331 (19 pages).
Mora, P.; Michel, X.; Narbonne, J.F., (1999). Cholinesterase activity as potential biomarker in two bivalves. Environ. Toxicol. Pharmacol., 7(4): 253-260 (8 pages).
Moron, M.S.; Depierre, J.W.; Mannervik, B., (1979). Levels of glutathione, glutathione reductase and glutathione S-transferase activities in rat lung and liver. Biochim. Biophys. Acta., 582(1): 67-78 (12 pages).
Mostafa, M.G.; Liu, C.Q.; Zhai, W.D.; Minella. M.; Vione, D.; Gao, K.; Minakata, D.; Arakaki, T.; Yoshioka, T.; Hayakawa, K.; Konohira, E., (2016). Reviews and Syntheses: Ocean acidification and its potential impacts on marine ecosystems. Biogeosci., 13:1767-1786 (20 pages).
Nagarani, N.; Devi, V.J.; Kumaraguru, A.K., (2011). Mercuric chloride induced proteotoxicity and structural destabilization in marine fish (Therapon jarbua). Toxicol. Environ. Chem., 93(2): 296-306 (11pages).
Ohkawa, H.; Ohishi, N.; Yagi, K., (1979). Assay for lipid peroxides in animal tissues by thiobarbituric acid reaction. Anal. Biochem., 95(2): 351-358 (8 pages).
Orr, J.C.; Fabry, V.J.; Aumont, O.; Bopp, L.; Doney, S.C.; Feely, R.A.; Gnanadesikan, A.; Gruber, N.; Ishida, A.; Joos, F.; Key, R.M., (2005). Anthropogenic ocean acidification over the twenty-first century and its impacts on calcifying organisms. Nature., 437(7059): 681-686 (6 pages).
Pörtner, H. O., (2008). Ecosystem effects of ocean acidification in times of ocean warming: a physiologist’s view. Mar. Ecol. Prog. Serv.., 373: 203-217 (15 pages).
Priya, R.J.; Muthusamy, A.; Maruthupandy, M., Beevi, A.H.; (2016). Biomarker response of ocean acidification induced hypercapnia on marine bivalve Donax cuneatus, Linnaeus 1758. J. Aquacult. Mar. Biol., 4(2): 00077 (8 pages).
Radenac, G.; Bocquene, D.; Fichet, P.; Miramand, G., (1998). Contamination of a dredged material disposal site La Rochelle Bay, France. The use of the acetylcholinesterase activity of Mytilus edulis L. as a biomarker of pesticides: the need for a critical approach. Biomarkers, 3(4-5): 305-315 (11 pages).
Regoli, F.; Principato, G., (1995). Glutathione, glutathione-dependent and antioxidant enzymes in mussel, Mytilus galloprovincialis, exposed to metals under field and laboratory
conditions: implications for the use of biochemical biomarkers. Aquat. Toxicol., 31(2): 143-164 (22 pages).
Regoli, F.; Winston, G.W.; Gorbi, S.; Frenzilli, G.; Nigro, M.; Corsi, I.; Focardi, S., (2003). Integrating enzymatic responses to organic chemical exposure with total oxyradical absorbing capacity and DNA damage in the European eel Anguilla anguilla. Environ. Toxicol. Chem., 22(9): 2120-2129 (10 pages).
Ries, J. B.; Cohen, A. L.; McCorkle, D.C., (2009). Marine calcifiers exhibit mixed responses to CO2- induced ocean acidification. Geology, 37(12): 1131-1134 (4 pages).
River Watch Network. (1992). Total alkalinity and pH field and laboratory procedures. Based on University of Massachusetts Acid Rain Monitoring Project.
Rogelj, J.; Hare, B.; Nabel, J.; Macey, K.; Schaeffer, M.; Markmann, K.; Meinshausen, M., (2009). Halfway to Copenhagen, no way to 2°C. Nat. Rep. Clim. Change., 3: 81-83 (3 pages)
Royal Society., (2005). Ocean acidification due to increasing atmospheric carbon dioxide. Policy Document 12/05, The Royal Society, London. Available at: www.royalsoc.ac.uk/ displaypagedoc.asp?id=13539. 1-68 (68 pages)
Saliu, J.K.; Bawa-Allah, K.A., (2012). Toxicological effects of lead and zinc on the antioxidant enzyme activities of post juvenile Clarias gariepinus. Resour. Environ., 2(1): 21-26 (6 pages).
Sinha, A. K., (1972). Colorimetric assay of catalase. Anal. Biochem., 47(2): 389-394 (6 pages)
Stephensen, E.; Svavarsson, J.; Sturve, J.; Ericson, G.; Adolfsson-Erici, M.; Förlin, L., (2000). Biochemical indicators of pollution exposure in shorthorn sculpin (Myoxocephalus scorpius), caught in four harbours on the southwest coast of Iceland. Aquat. Toxicol., 48(4):431-442 (11 pages)
Türkay, M., (2001). Decapoda, In: Costello, M.J., (Ed.). European register of marine species: a check-list of the marine species in Europe and a bibliography of guides to their identification. Patrim. Nat., 50: 284-292 (9 pages)
Venn, A.A.; Tambutté, E.; Holcomb, M.; Laurent, J.; Allemand, D.; Tambutté, S., (2013). Impact of seawater acidification on pH at the tissue-skeleton interface and calcification in reef corals. Proc. Natl. Acad. Sci., 110(5): 1634-1639 (6 pages).
Vijayavel, K.; Gomathi, R.D.; Durgabhavani, K.; Balasubramanian, M.P., (2004). Sublethal effect of naphthalene on lipid peroxidation and antioxidant status in the edible marine crab Scylla serrata. Mar. Pollut. Bull., 48(5): 429-433 (5 pages).
Widdicombe, S.; Needham, H.R., (2007). Impact of CO2-induced seawater acidification on the burrowing activity of Nereis virens and sediment nutrient flux. Mar. Ecol. Prog. Ser., 341: 111-122 (12 pages).
Widdicombe, S.; Spicer, J.I., (2008). Predicting the impact of ocean acidification on benthic biodiversity: what can animal physiology tell us?. J. Exp. Mar. Biol. Ecol., 366(1): 187-197 (11 pages).

176
Ocean acidification and hypercapnia studies on brachyurian crab
AUTHOR (S) BIOSKETCHESJeeva Priya, R., Ph.D. Candidate, Department of Marine and Costal Studies, School of Energy Sciences, Madurai Kamaraj University, Madurai -625021, Tamilnadu, India. Email: [email protected]
Anand, M., Ph.D., Assistant Professor, Department of Marine and Costal Studies, School of Energy Sciences, Madurai Kamaraj University, Madurai -625021, Tamilnadu, India. Email: [email protected]
Maruthupandy, M., Ph.D., Department of Marine and Costal Studies, School of Energy Sciences, Madurai Kamaraj University, Madurai -625021, Tamilnadu, India. Email: [email protected]
Hameedha Beevi, A., Ph.D., Department of Marine and Costal Studies, School of Energy Sciences, Madurai Kamaraj University, Madurai -625021, Tamilnadu, India. Email: [email protected]
COPYRIGHTSCopyright for this article is retained by the author(s), with publication rights granted to the GJESM Journal.This is an open-access article distributed under the terms and conditions of the Creative Commons AttributionLicense (http://creativecommons.org/licenses/by/4.0/).
HOW TO CITE THIS ARTICLEJeeva Priya, R.; Anand, M.; Maruthupandy, M.; Hameedha Beevi, A., (2017). Biomarker response of climate change induced ocean acidification and hypercapnia studies on brachyurian crab Portunus pelagicus. Global J. Environ. Sci. Manage., 3(2): 165-176.
DOI: 10.22034/gjesm.2017.03.02.005
url: http://gjesm.net/article_23070.html
Related Documents


![[PPT]Gentle Ventilation - Neonatal Research · Web viewGentle Ventilation We all want to do it… but what is it? Outline: Avoiding ventilator induced lung injury Permissive Hypercapnia](https://static.cupdf.com/doc/110x72/5b0504b37f8b9a6c0b8e9bdb/pptgentle-ventilation-neonatal-research-viewgentle-ventilation-we-all-want-to.jpg)


