ORIGINAL RESEARCH published: 11 March 2015 doi: 10.3389/fmicb.2015.00171 Frontiers in Microbiology | www.frontiersin.org 1 March 2015 | Volume 6 | Article 171 Edited by: Tunahan Cakir, Gebze Technical University, Turkey Reviewed by: Pinar Pir, Babraham Institute, UK Daniel Vis, Netherlands Cancer Institute, Netherlands *Correspondence: Jörg Linde, Leibniz Institute for Natural Product Research and Infection Biology – Hans-Knöll-Institute, Beutenbergstraße 11a, Jena 07745, Germany [email protected] Specialty section: This article was submitted to Infectious Diseases, a section of the journal Frontiers in Microbiology Received: 03 November 2014 Accepted: 15 February 2015 Published: 11 March 2015 Citation: Dix A, Hünniger K, Weber M, Guthke R, Kurzai O and Linde J (2015) Biomarker-based classification of bacterial and fungal whole-blood infections in a genome-wide expression study. Front. Microbiol. 6:171. doi: 10.3389/fmicb.2015.00171 Biomarker-based classification of bacterial and fungal whole-blood infections in a genome-wide expression study Andreas Dix 1 , Kerstin Hünniger 2 , Michael Weber 2 , Reinhard Guthke 1 , Oliver Kurzai 2 and Jörg Linde 1 * 1 Systems Biology/Bioinformatics, Leibniz Institute for Natural Product Research and Infection Biology – Hans-Knöll-Institute, Jena, Germany, 2 Septomics Research Centre, Friedrich Schiller University and Leibniz Institute for Natural Product Research and Infection Biology – Hans-Knöll-Institute, Jena, Germany Sepsis is a clinical syndrome that can be caused by bacteria or fungi. Early knowledge on the nature of the causative agent is a prerequisite for targeted anti-microbial therapy. Besides currently used detection methods like blood culture and PCR-based assays, the analysis of the transcriptional response of the host to infecting organisms holds great promise. In this study, we aim to examine the transcriptional footprint of infections caused by the bacterial pathogens Staphylococcus aureus and Escherichia coli and the fungal pathogens Candida albicans and Aspergillus fumigatus in a human whole-blood model. Moreover, we use the expression information to build a random forest classifier to classify if a sample contains a bacterial, fungal, or mock-infection. After normalizing the transcription intensities using stably expressed reference genes, we filtered the gene set for biomarkers of bacterial or fungal blood infections. This selection is based on differential expression and an additional gene relevance measure. In this way, we identified 38 biomarker genes, including IL6, SOCS3, and IRG1 which were already associated to sepsis by other studies. Using these genes, we trained the classifier and assessed its performance. It yielded a 96% accuracy (sensitivities >93%, specificities >97%) for a 10-fold stratified cross-validation and a 92% accuracy (sensitivities and specificities >83%) for an additional test dataset comprising Cryptococcus neoformans infections. Furthermore, the classifier is robust to Gaussian noise, indicating correct class predictions on datasets of new species. In conclusion, this genome-wide approach demonstrates an effective feature selection process in combination with the construction of a well-performing classification model. Further analyses of genes with pathogen-dependent expression patterns can provide insights into the systemic host responses, which may lead to new anti-microbial therapeutic advances. Keywords: immune response, microarray, feature selection, systems biology, decision tree based methods, fungal pathogens

Welcome message from author
This document is posted to help you gain knowledge. Please leave a comment to let me know what you think about it! Share it to your friends and learn new things together.
Transcript

ORIGINAL RESEARCHpublished: 11 March 2015
doi: 10.3389/fmicb.2015.00171
Frontiers in Microbiology | www.frontiersin.org 1 March 2015 | Volume 6 | Article 171
Edited by:
Tunahan Cakir,
Gebze Technical University, Turkey
Reviewed by:
Pinar Pir,
Babraham Institute, UK
Daniel Vis,
Netherlands Cancer Institute,
Netherlands
*Correspondence:
Jörg Linde, Leibniz Institute for Natural
Product Research and Infection
Biology – Hans-Knöll-Institute,
Beutenbergstraße 11a, Jena 07745,
Germany
Specialty section:
This article was submitted to
Infectious Diseases, a section of the
journal Frontiers in Microbiology
Received: 03 November 2014
Accepted: 15 February 2015
Published: 11 March 2015
Citation:
Dix A, Hünniger K, Weber M, Guthke
R, Kurzai O and Linde J (2015)
Biomarker-based classification of
bacterial and fungal whole-blood
infections in a genome-wide
expression study.
Front. Microbiol. 6:171.
doi: 10.3389/fmicb.2015.00171
Biomarker-based classification ofbacterial and fungal whole-bloodinfections in a genome-wideexpression studyAndreas Dix 1, Kerstin Hünniger 2, Michael Weber 2, Reinhard Guthke 1, Oliver Kurzai 2
and Jörg Linde 1*
1 Systems Biology/Bioinformatics, Leibniz Institute for Natural Product Research and Infection Biology – Hans-Knöll-Institute,
Jena, Germany, 2 Septomics Research Centre, Friedrich Schiller University and Leibniz Institute for Natural Product Research
and Infection Biology – Hans-Knöll-Institute, Jena, Germany
Sepsis is a clinical syndrome that can be caused by bacteria or fungi. Early knowledge
on the nature of the causative agent is a prerequisite for targeted anti-microbial
therapy. Besides currently used detection methods like blood culture and PCR-based
assays, the analysis of the transcriptional response of the host to infecting organisms
holds great promise. In this study, we aim to examine the transcriptional footprint of
infections caused by the bacterial pathogens Staphylococcus aureus and Escherichia
coli and the fungal pathogens Candida albicans and Aspergillus fumigatus in a human
whole-blood model. Moreover, we use the expression information to build a random
forest classifier to classify if a sample contains a bacterial, fungal, or mock-infection.
After normalizing the transcription intensities using stably expressed reference genes,
we filtered the gene set for biomarkers of bacterial or fungal blood infections.
This selection is based on differential expression and an additional gene relevance
measure. In this way, we identified 38 biomarker genes, including IL6, SOCS3, and
IRG1 which were already associated to sepsis by other studies. Using these genes,
we trained the classifier and assessed its performance. It yielded a 96% accuracy
(sensitivities>93%, specificities>97%) for a 10-fold stratified cross-validation and a 92%
accuracy (sensitivities and specificities >83%) for an additional test dataset comprising
Cryptococcus neoformans infections. Furthermore, the classifier is robust to Gaussian
noise, indicating correct class predictions on datasets of new species. In conclusion,
this genome-wide approach demonstrates an effective feature selection process in
combination with the construction of a well-performing classification model. Further
analyses of genes with pathogen-dependent expression patterns can provide insights
into the systemic host responses, which may lead to new anti-microbial therapeutic
advances.
Keywords: immune response, microarray, feature selection, systems biology, decision tree basedmethods, fungal
pathogens
Dix et al. Biomarker-based classification of whole-blood infections
1. Introduction
Sepsis is a critical medical condition with high mortality rates. Itis characterized by a dysregulation of the inflammatory responseof the host due to a microbial infection. The uncontrolled inflam-mation can lead to tissue and organ damage, eventually resultingin death of the patient (Rittirsch et al., 2008). The incidence ofsepsis has been increasing worldwide (Engel et al., 2007; Martin,2012). In fact, sepsis is the 10thmost common cause of death witha mortality rate of 20–50% in the US (Martin et al., 2003). Themost frequent causative pathogens are bacteria, most commonlystaphylococci and Enterobacteriaceae like E. coli (Martin, 2012).While the overall incidence of sepsis is increasing about 5–10%every year, the cases of sepsis caused by fungi have increased bymore than 200% in the US between 1979 and 2000 (Martin et al.,2003). Since both types of pathogens, bacteria and fungi, requirefundamentally different anti-microbial therapies, the early classi-fication is crucial. Furthermore, it has been shown that prompttreatment is a prerequisite for successful therapy, as each hour ofdelay reduces the chances of survival on average by 8% (Kumaret al., 2006). This direct relation emphasizes the necessity forquick and reliable classification methods.
Blood cultures (BCs) and PCR-based assays are currentlythe standard diagnosis techniques to detect causative pathogens.While BCs aim for the isolation, identification, and suscepti-bility tests of microorganisms (Westh et al., 2009), molecularpathogen detection by PCR solely enables identification of thepathogen (Schreiber et al., 2013). Numerous studies comparingboth methods conclude that the time BCs require to provide pos-itive results is too slow for guiding therapy (Westh et al., 2009;Bloos et al., 2010; Lehmann et al., 2010; Schreiber et al., 2013).Thus, PCR-based assays, which exhibit a turnaround time of sev-eral hours may be an important additive tool (Lehmann et al.,2010).
Both methods, BC and PCR, identify the microorganismsdirectly in the blood. However, at the time of diagnosis, thepathogen may have left the bloodstream, while it still triggersthe dysregulated response of the immune system of the host.Thus, another promising approach is to analyze the immuno-logical imprint of the pathogen and infer the pathogen typebased on the transcriptional response to the infection. Previ-ous studies have shown that genome-wide transcriptome anal-ysis facilitates the identification of genes with specific expres-sion signatures in sepsis data (Prucha et al., 2004; Shanley et al.,2007). As these genes quantify the state of acute sepsis, they canbe considered as biomarkers for this condition. Other researchgroups used biomarkers to distinguish the microorganisms caus-ing the infection, or to predict the survival chances of infectedpatients (Pachot et al., 2006; Pankla et al., 2009). Furthermore,septic shock patients have been successfully classified into sub-groups using whole-blood gene expression data frommicroarrays(Wong et al., 2010). Therefore, incorporation of host responsetranscription data holds great potential to get insights into thesystemic host reaction, thus leading to an improved pathogendetection and differentiation. Especially with respect to the rapidincrease in incidence of fungal induced sepsis cases, an earlydetection of fungal sepsis would be of great value.
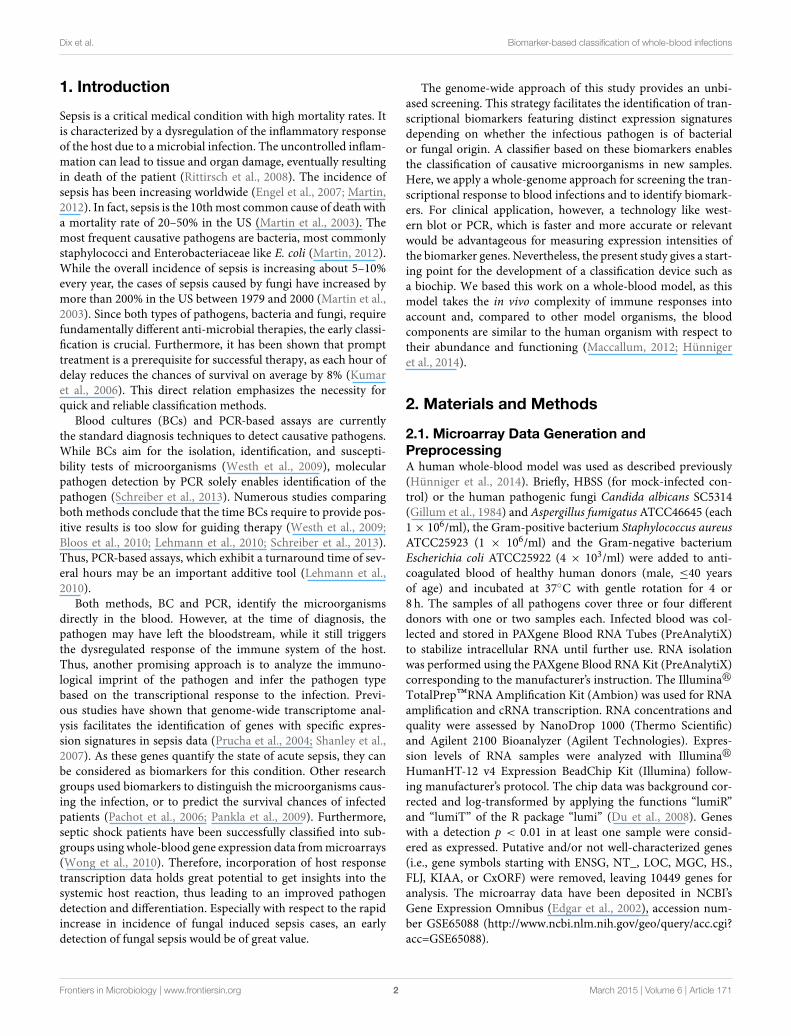
The genome-wide approach of this study provides an unbi-ased screening. This strategy facilitates the identification of tran-scriptional biomarkers featuring distinct expression signaturesdepending on whether the infectious pathogen is of bacterialor fungal origin. A classifier based on these biomarkers enablesthe classification of causative microorganisms in new samples.Here, we apply a whole-genome approach for screening the tran-scriptional response to blood infections and to identify biomark-ers. For clinical application, however, a technology like west-ern blot or PCR, which is faster and more accurate or relevantwould be advantageous for measuring expression intensities ofthe biomarker genes. Nevertheless, the present study gives a start-ing point for the development of a classification device such asa biochip. We based this work on a whole-blood model, as thismodel takes the in vivo complexity of immune responses intoaccount and, compared to other model organisms, the bloodcomponents are similar to the human organism with respect totheir abundance and functioning (Maccallum, 2012; Hünnigeret al., 2014).
2. Materials and Methods
2.1. Microarray Data Generation andPreprocessingA human whole-blood model was used as described previously(Hünniger et al., 2014). Briefly, HBSS (for mock-infected con-trol) or the human pathogenic fungi Candida albicans SC5314(Gillum et al., 1984) and Aspergillus fumigatus ATCC46645 (each1× 106/ml), the Gram-positive bacterium Staphylococcus aureusATCC25923 (1 × 10⁶/ml) and the Gram-negative bacteriumEscherichia coli ATCC25922 (4 × 10³/ml) were added to anti-coagulated blood of healthy human donors (male, ≤40 yearsof age) and incubated at 37◦C with gentle rotation for 4 or8 h. The samples of all pathogens cover three or four differentdonors with one or two samples each. Infected blood was col-lected and stored in PAXgene Blood RNA Tubes (PreAnalytiX)to stabilize intracellular RNA until further use. RNA isolationwas performed using the PAXgene Blood RNA Kit (PreAnalytiX)corresponding to the manufacturer’s instruction. The Illuminar
TotalPrep™RNA Amplification Kit (Ambion) was used for RNAamplification and cRNA transcription. RNA concentrations andquality were assessed by NanoDrop 1000 (Thermo Scientific)and Agilent 2100 Bioanalyzer (Agilent Technologies). Expres-sion levels of RNA samples were analyzed with Illuminar
HumanHT-12 v4 Expression BeadChip Kit (Illumina) follow-ing manufacturer’s protocol. The chip data was background cor-rected and log-transformed by applying the functions “lumiR”and “lumiT” of the R package “lumi” (Du et al., 2008). Geneswith a detection p < 0.01 in at least one sample were consid-ered as expressed. Putative and/or not well-characterized genes(i.e., gene symbols starting with ENSG, NT_, LOC, MGC, HS.,FLJ, KIAA, or CxORF) were removed, leaving 10449 genes foranalysis. The microarray data have been deposited in NCBI’sGene Expression Omnibus (Edgar et al., 2002), accession num-ber GSE65088 (http://www.ncbi.nlm.nih.gov/geo/query/acc.cgi?acc=GSE65088).
Frontiers in Microbiology | www.frontiersin.org 2 March 2015 | Volume 6 | Article 171

Dix et al. Biomarker-based classification of whole-blood infections
2.2. Reference Genes Based NormalizationThe normalization followed the approach of Vandesompele et al.(2002) which is based on non-normalized expression valuesof all samples. From a list of putative control genes coveringhousekeeping genes and reference genes suggested previouslyby Stamova et al. (2009) and Kwon et al. (2009), genes withmost stable expression were selected. First, the gene stabilitymeasure M as introduced by Vandesompele et al. was calcu-lated for each control gene as the average pairwise variationof a gene, i.e., the pairwise standard deviation of the ratios ofthe control gene to all other control genes. Thus, genes withlower M values are associated with a more stable expression.Iteratively, the gene with the largest M value was removedand the calculation was repeated. In this way, a ranking ofgenes was obtained, representing their stability. The geomet-ric mean of the expression values of the n best ranked geneswas then used as normalization factor (NFn)—as a vector for allsamples.
Initially, the three most stable genes (NF3) were used to deter-mine the optimal number of genes for NF calculation. Then,more genes were successively included (NF4, NF5, . . . ) as longas the inclusion leads to significant changes on the normaliza-tion factor. To quantify these changes, the pairwise variations ofeach two consecutive NFs were computed. As threshold, 0.15 wasused as recommended by Vandesompele et al. A value surpass-ing this threshold indicate that the inclusion of another gene intocalculation is necessary.
2.3. Selection of Differentially Expressed GenesDifferentially expressed genes were determined using the Bio-conductor package “limma” (Gentleman et al., 2004; Smyth,2005) of the statistical programming language R. Limma fitslinear models to the expression values of each gene and deter-mines differential expression using moderated t-statistics. P-values were adjusted according to the method of Benjaminiand Hochberg (1995). Genes with an adjusted p < 0.05 and alog2-fold change of at least ±1 were regarded as differentiallyexpressed.
2.4. The Random Forest ClassifierThe random forest classifier was built using the “randomFor-est” package (Liaw and Wiener, 2002) for the R programminglanguage. There are two main parameters which may influencethe performance of the classifier: ntree and mtry. While ntreedescribes the number of trees that are built by the random forestalgorithm,mtry represents the number of genes used at each splitwhen building a tree. Svetnik et al. (2004) and Díaz-Uriarte andAlvarez de Andrés (2006) showed that the random forest algo-rithm features high predictive performance, even without param-eter adjustment. Only the number of trees needs to be sufficientlylarge to get stable results. Therefore, the random forest classifierwas built growing 100,000 trees. A cross-validation examining theeffect of changingmtry and ntree showed that altering the param-eters has no effect on the classification accuracy (SupplementaryMaterial). Thus, we kept the parameter mtry on its default value,which is ⌊√g⌋, where g is the number of genes of the inputdataset.
For the selection of biomarker genes, the measure “meandecrease in accuracy” was used for determining the variableimportance values for each gene. The importance values werecomputed for each class (fungal, bacterial, and mock-infectedclass) by building random forests with 100,000 trees. The nor-malized dataset, which was reduced to the data of differentiallyexpressed genes, was used as input.
We scaled the certainty score to a range from 0 to 1. Beforescaling, the score represents the proportion of class predictionsfrom all trees of the random forest, which yield the same class asthe final classification by the classifier. Let p be this proportionand let N be the number of possible classes (in this study, N = 3,as we consider a fungal, a bacterial, and a mock-infected class),then the certainty score is calculated as
certainty score =p−
1
N
1−1
N
. (1)
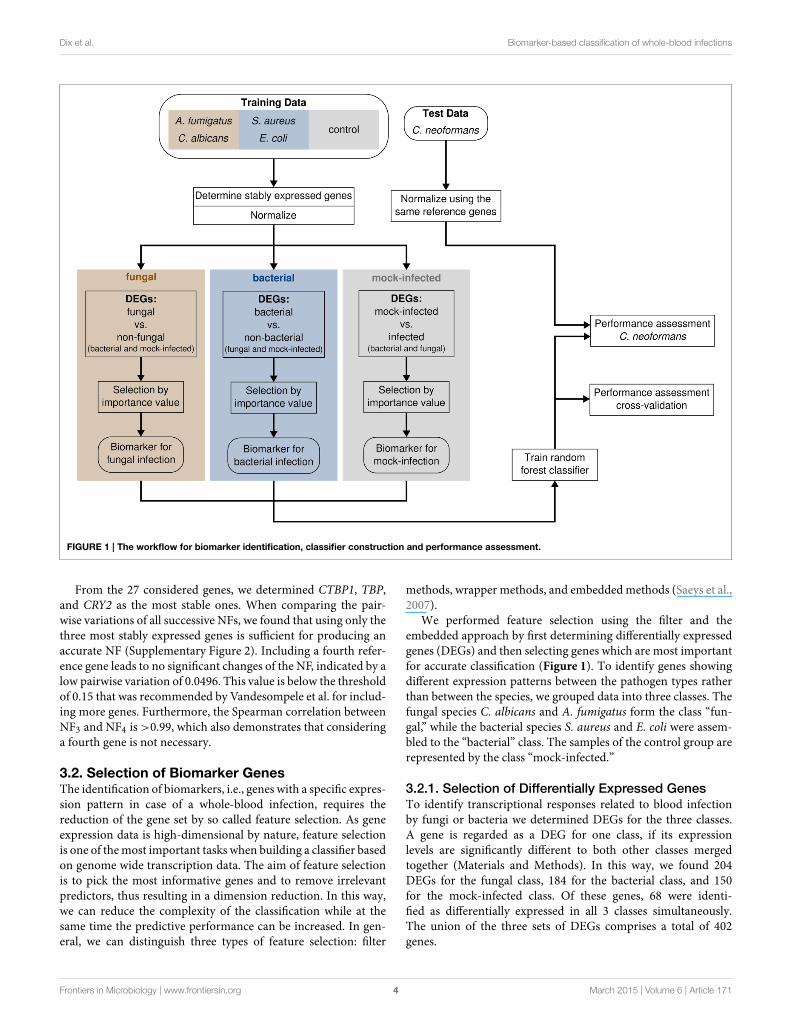
2.5. Performance AssessmentThe C. neoformans (strain H99, provided by Robin May, Uni-versity of Birmingham) dataset was generated identical to theother fungi data and quantified using the same chip technol-ogy. Expression levels were measured 4 h (3 donors) and 8 h(3 donors) post infection. Mock-infected control samples weresimultaneously produced. Before classification, the expressionintensities were normalized based on the reference genes whichwere determined previously without the C. neoformans data(Figure 1).
Multidimensional scaling (MDS) was performed using the“cmdscale” function of R. After determining the Spearman corre-lation of the samples of the normalizedC. neoformans dataset, theEuclidean distances between these samples were calculated basedon the correlation matrix and used as input for the MDS com-putation. In this way, samples with high correlations are close toeach other in the MDS plot.
3. Results
3.1. Reference Genes Based NormalizationOur first step in building a classifier which discriminates betweenbacterial and fungal infection is to normalize gene expression val-ues with help of reference genes (Figure 1). The motivation ofusing reference genes instead of the control samples for normal-ization is that our classifier should be able to be applied in clinicalsettings, i.e., for patients, where no control samples exist. To iden-tify reference genes, we used a knowledge driven and data drivenapproach. First, we considered 10 known housekeeping genes aswell as 17 reference genes which were previously suggested byKwon et al. (2009) and Stamova et al. (2009) (Table 1). Next,we checked which of those genes have a stable expression profilewithin our dataset. Therefore, we followed the method proposedby Vandesompele et al. (2002), where the stability of a gene isdetermined on the basis of ratios of raw gene expression values(Materials and Methods). The normalization factor (NF) is thencalculated as the geometric mean of the most stably expressedreference genes.
Frontiers in Microbiology | www.frontiersin.org 3 March 2015 | Volume 6 | Article 171
Dix et al. Biomarker-based classification of whole-blood infections
FIGURE 1 | The workflow for biomarker identification, classifier construction and performance assessment.
From the 27 considered genes, we determined CTBP1, TBP,and CRY2 as the most stable ones. When comparing the pair-wise variations of all successive NFs, we found that using only thethree most stably expressed genes is sufficient for producing anaccurate NF (Supplementary Figure 2). Including a fourth refer-ence gene leads to no significant changes of the NF, indicated by alow pairwise variation of 0.0496. This value is below the thresholdof 0.15 that was recommended by Vandesompele et al. for includ-ing more genes. Furthermore, the Spearman correlation betweenNF3 and NF4 is >0.99, which also demonstrates that consideringa fourth gene is not necessary.
3.2. Selection of Biomarker GenesThe identification of biomarkers, i.e., genes with a specific expres-sion pattern in case of a whole-blood infection, requires thereduction of the gene set by so called feature selection. As geneexpression data is high-dimensional by nature, feature selectionis one of themost important tasks when building a classifier basedon genome wide transcription data. The aim of feature selectionis to pick the most informative genes and to remove irrelevantpredictors, thus resulting in a dimension reduction. In this way,we can reduce the complexity of the classification while at thesame time the predictive performance can be increased. In gen-eral, we can distinguish three types of feature selection: filter
methods, wrapper methods, and embeddedmethods (Saeys et al.,2007).
We performed feature selection using the filter and theembedded approach by first determining differentially expressedgenes (DEGs) and then selecting genes which are most importantfor accurate classification (Figure 1). To identify genes showingdifferent expression patterns between the pathogen types ratherthan between the species, we grouped data into three classes. Thefungal species C. albicans and A. fumigatus form the class “fun-gal,” while the bacterial species S. aureus and E. coli were assem-bled to the “bacterial” class. The samples of the control group arerepresented by the class “mock-infected.”
3.2.1. Selection of Differentially Expressed GenesTo identify transcriptional responses related to blood infectionby fungi or bacteria we determined DEGs for the three classes.A gene is regarded as a DEG for one class, if its expressionlevels are significantly different to both other classes mergedtogether (Materials and Methods). In this way, we found 204DEGs for the fungal class, 184 for the bacterial class, and 150for the mock-infected class. Of these genes, 68 were identi-fied as differentially expressed in all 3 classes simultaneously.The union of the three sets of DEGs comprises a total of 402genes.
Frontiers in Microbiology | www.frontiersin.org 4 March 2015 | Volume 6 | Article 171
Dix et al. Biomarker-based classification of whole-blood infections
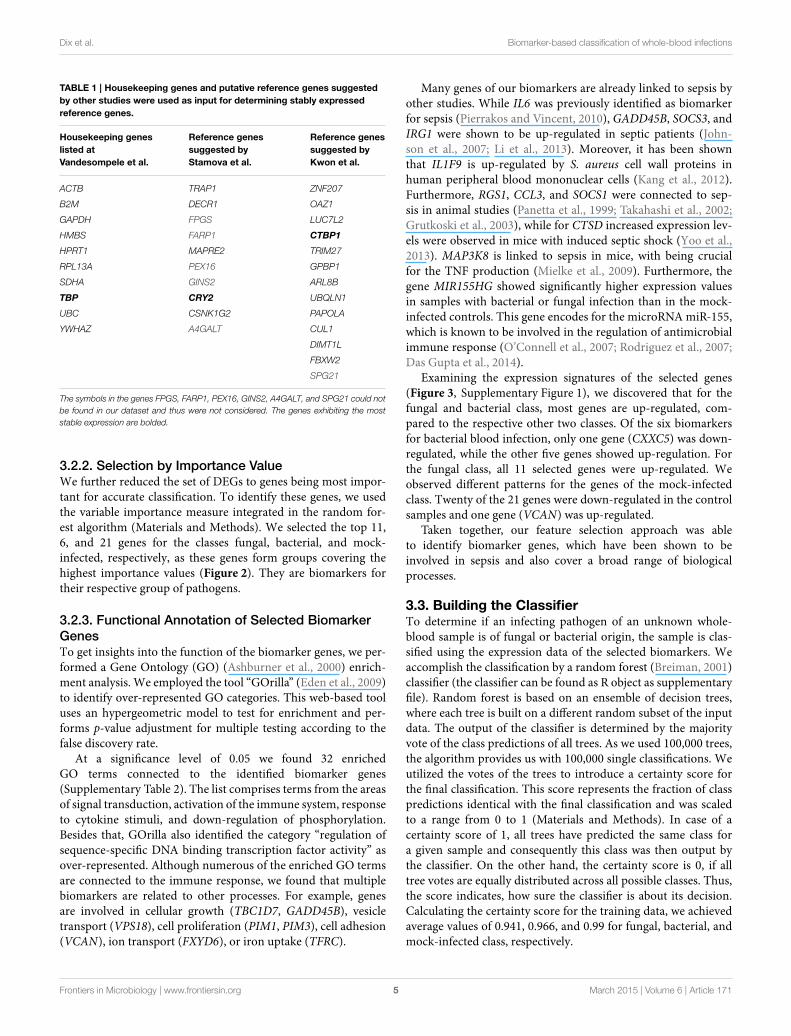
TABLE 1 | Housekeeping genes and putative reference genes suggested
by other studies were used as input for determining stably expressed
reference genes.
Housekeeping genes
listed at
Vandesompele et al.
Reference genes
suggested by
Stamova et al.
Reference genes
suggested by
Kwon et al.
ACTB TRAP1 ZNF207
B2M DECR1 OAZ1
GAPDH FPGS LUC7L2
HMBS FARP1 CTBP1
HPRT1 MAPRE2 TRIM27
RPL13A PEX16 GPBP1
SDHA GINS2 ARL8B
TBP CRY2 UBQLN1
UBC CSNK1G2 PAPOLA
YWHAZ A4GALT CUL1
DIMT1L
FBXW2
SPG21
The symbols in the genes FPGS, FARP1, PEX16, GINS2, A4GALT, and SPG21 could not
be found in our dataset and thus were not considered. The genes exhibiting the most
stable expression are bolded.
3.2.2. Selection by Importance ValueWe further reduced the set of DEGs to genes being most impor-tant for accurate classification. To identify these genes, we usedthe variable importance measure integrated in the random for-est algorithm (Materials and Methods). We selected the top 11,6, and 21 genes for the classes fungal, bacterial, and mock-infected, respectively, as these genes form groups covering thehighest importance values (Figure 2). They are biomarkers fortheir respective group of pathogens.
3.2.3. Functional Annotation of Selected Biomarker
GenesTo get insights into the function of the biomarker genes, we per-formed a Gene Ontology (GO) (Ashburner et al., 2000) enrich-ment analysis. We employed the tool “GOrilla” (Eden et al., 2009)to identify over-represented GO categories. This web-based tooluses an hypergeometric model to test for enrichment and per-forms p-value adjustment for multiple testing according to thefalse discovery rate.
At a significance level of 0.05 we found 32 enrichedGO terms connected to the identified biomarker genes(Supplementary Table 2). The list comprises terms from the areasof signal transduction, activation of the immune system, responseto cytokine stimuli, and down-regulation of phosphorylation.Besides that, GOrilla also identified the category “regulation ofsequence-specific DNA binding transcription factor activity” asover-represented. Although numerous of the enriched GO termsare connected to the immune response, we found that multiplebiomarkers are related to other processes. For example, genesare involved in cellular growth (TBC1D7, GADD45B), vesicletransport (VPS18), cell proliferation (PIM1, PIM3), cell adhesion(VCAN), ion transport (FXYD6), or iron uptake (TFRC).
Many genes of our biomarkers are already linked to sepsis byother studies. While IL6 was previously identified as biomarkerfor sepsis (Pierrakos and Vincent, 2010), GADD45B, SOCS3, andIRG1 were shown to be up-regulated in septic patients (John-son et al., 2007; Li et al., 2013). Moreover, it has been shownthat IL1F9 is up-regulated by S. aureus cell wall proteins inhuman peripheral blood mononuclear cells (Kang et al., 2012).Furthermore, RGS1, CCL3, and SOCS1 were connected to sep-sis in animal studies (Panetta et al., 1999; Takahashi et al., 2002;Grutkoski et al., 2003), while for CTSD increased expression lev-els were observed in mice with induced septic shock (Yoo et al.,2013). MAP3K8 is linked to sepsis in mice, with being crucialfor the TNF production (Mielke et al., 2009). Furthermore, thegene MIR155HG showed significantly higher expression valuesin samples with bacterial or fungal infection than in the mock-infected controls. This gene encodes for the microRNAmiR-155,which is known to be involved in the regulation of antimicrobialimmune response (O’Connell et al., 2007; Rodriguez et al., 2007;Das Gupta et al., 2014).
Examining the expression signatures of the selected genes(Figure 3, Supplementary Figure 1), we discovered that for thefungal and bacterial class, most genes are up-regulated, com-pared to the respective other two classes. Of the six biomarkersfor bacterial blood infection, only one gene (CXXC5) was down-regulated, while the other five genes showed up-regulation. Forthe fungal class, all 11 selected genes were up-regulated. Weobserved different patterns for the genes of the mock-infectedclass. Twenty of the 21 genes were down-regulated in the controlsamples and one gene (VCAN) was up-regulated.
Taken together, our feature selection approach was ableto identify biomarker genes, which have been shown to beinvolved in sepsis and also cover a broad range of biologicalprocesses.
3.3. Building the ClassifierTo determine if an infecting pathogen of an unknown whole-blood sample is of fungal or bacterial origin, the sample is clas-sified using the expression data of the selected biomarkers. Weaccomplish the classification by a random forest (Breiman, 2001)classifier (the classifier can be found as R object as supplementaryfile). Random forest is based on an ensemble of decision trees,where each tree is built on a different random subset of the inputdata. The output of the classifier is determined by the majorityvote of the class predictions of all trees. As we used 100,000 trees,the algorithm provides us with 100,000 single classifications. Weutilized the votes of the trees to introduce a certainty score forthe final classification. This score represents the fraction of classpredictions identical with the final classification and was scaledto a range from 0 to 1 (Materials and Methods). In case of acertainty score of 1, all trees have predicted the same class fora given sample and consequently this class was then output bythe classifier. On the other hand, the certainty score is 0, if alltree votes are equally distributed across all possible classes. Thus,the score indicates, how sure the classifier is about its decision.Calculating the certainty score for the training data, we achievedaverage values of 0.941, 0.966, and 0.99 for fungal, bacterial, andmock-infected class, respectively.
Frontiers in Microbiology | www.frontiersin.org 5 March 2015 | Volume 6 | Article 171

Dix et al. Biomarker-based classification of whole-blood infections
FIGURE 2 | The variable importance values were computed by the
random forest algorithm. A gene with larger values exhibits a higher
influence on the correct class predictions. The 50 highest importance
values of the measure “mean decrease in accuracy” are shown. Genes
above the dashed lines were selected as biomarkers for the
corresponding classes.
3.4. Performance AssessmentHaving built our classifier, we next studied its performance indistinguishing between fungal or bacterial blood infection. Ouraim was to accurately classify new samples by the given classifi-cation model. Therefore, the performance assessment methodshave to yield unbiased accuracy rates. To get unbiased esti-mates of accuracy, the samples for testing the classifier shouldbe independent from the samples for training the classifier. Wefulfilled this requirement with additionally independently cre-ated data comprising RNA expression measurements of humanwhole-blood samples infected with C. neoformans. An additionalapproach to assess a classifiers performance is cross-validation.Cross-validation emulates independent test sets in an iterativetechnique and in this way resolves the need for true test data.Furthermore, we evaluate the ability of the classifier to handlefluctuations in the expression values by classifying samples afteradding random noise to the data (Supplementary Material).
3.4.1. Test Data of C. neoformansTo assess the performance of the classifier on an independent testset, we created a new dataset of RNA expressionmeasurements ofhuman whole-blood infected with C. neoformans. The data com-prises 6 samples of fungal infection and 6 mock-infected controls(Materials andMethods). Being part of the phylum of Basidiomy-cota, C. neoformans is a phylogenetically and morphologicallyvery different fungus compared to C. albicans and A. fumigatus,both belonging to the phylum of Ascomycota (James et al., 2006).
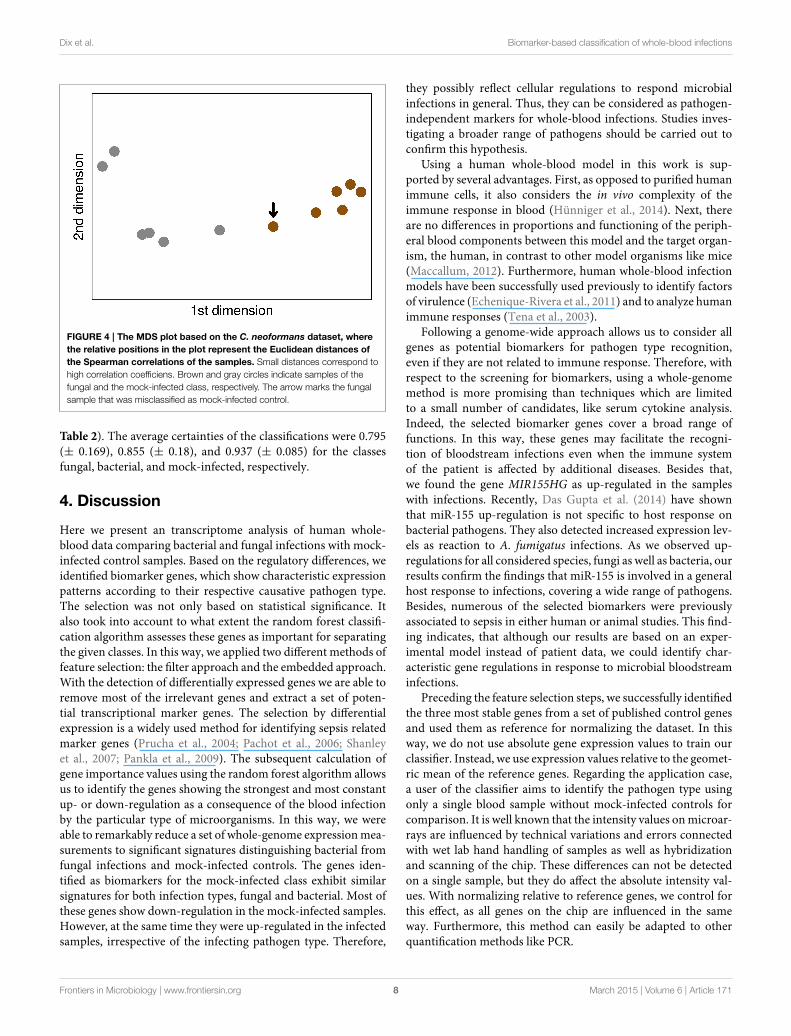
When assessing the classification performance using the newdata, our model correctly classified 5 of the 6 fungal samples(83.3%). One sample was wrongly classified as mock-infected. Allclassifications of the mock-infected samples were performed cor-rectly. In this way, we achieved an overall accuracy rate of 91.7%.The sensitivities are 83.3 and 100%, while the specificities are100 and 83.3% for fungal and mock-infected class, respectively(Table 2). We examined the misclassification in more detail bya correlation analysis using a multidimensional scaling (MDS)plot (Figure 4). MDS is a dimension reduction technique, pro-ducing an easy-to-visualize output showing relationships withinthe data. The plot revealed that the misclassified sample showsmore similarity to the data of mock-infected class than the otherC. neoformans samples.
The difference in the accuracy values between the two classesis also reflected in the certainty scores. We obtained an averagecertainty of 0.475 (± 0.190) for all fungal samples, whereas forthe mock-infected samples we achieved an average score of 0.810(± 0.165). When splitting the fungal specimen into falsely andcorrectly classified ones, the observed certainty value for the mis-classified sample is higher, 0.654, than for the right classifications,0.439.
3.4.2. Cross-ValidationWhen the sample size of a study is relatively small, it is pre-ferred to use all available samples in feature selection and train-ing. However, this leads to a lack of test data. Cross-validation
Frontiers in Microbiology | www.frontiersin.org 6 March 2015 | Volume 6 | Article 171
Dix et al. Biomarker-based classification of whole-blood infections
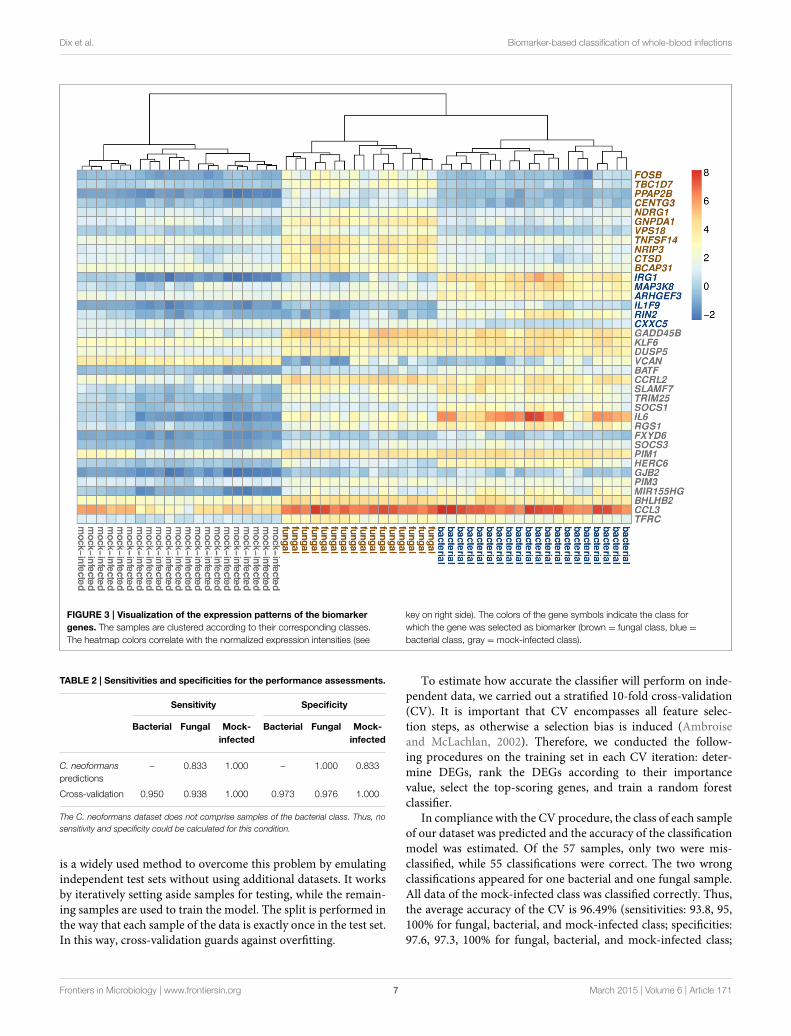
FIGURE 3 | Visualization of the expression patterns of the biomarker
genes. The samples are clustered according to their corresponding classes.
The heatmap colors correlate with the normalized expression intensities (see
key on right side). The colors of the gene symbols indicate the class for
which the gene was selected as biomarker (brown = fungal class, blue =bacterial class, gray = mock-infected class).
TABLE 2 | Sensitivities and specificities for the performance assessments.
Sensitivity Specificity
Bacterial Fungal Mock- Bacterial Fungal Mock-
infected infected
C. neoformans
predictions
– 0.833 1.000 – 1.000 0.833
Cross-validation 0.950 0.938 1.000 0.973 0.976 1.000
The C. neoformans dataset does not comprise samples of the bacterial class. Thus, no
sensitivity and specificity could be calculated for this condition.
is a widely used method to overcome this problem by emulatingindependent test sets without using additional datasets. It worksby iteratively setting aside samples for testing, while the remain-ing samples are used to train the model. The split is performed inthe way that each sample of the data is exactly once in the test set.In this way, cross-validation guards against overfitting.
To estimate how accurate the classifier will perform on inde-pendent data, we carried out a stratified 10-fold cross-validation(CV). It is important that CV encompasses all feature selec-tion steps, as otherwise a selection bias is induced (Ambroiseand McLachlan, 2002). Therefore, we conducted the follow-ing procedures on the training set in each CV iteration: deter-mine DEGs, rank the DEGs according to their importancevalue, select the top-scoring genes, and train a random forestclassifier.
In compliance with the CV procedure, the class of each sampleof our dataset was predicted and the accuracy of the classificationmodel was estimated. Of the 57 samples, only two were mis-classified, while 55 classifications were correct. The two wrongclassifications appeared for one bacterial and one fungal sample.All data of the mock-infected class was classified correctly. Thus,the average accuracy of the CV is 96.49% (sensitivities: 93.8, 95,100% for fungal, bacterial, and mock-infected class; specificities:97.6, 97.3, 100% for fungal, bacterial, and mock-infected class;
Frontiers in Microbiology | www.frontiersin.org 7 March 2015 | Volume 6 | Article 171
Dix et al. Biomarker-based classification of whole-blood infections
FIGURE 4 | The MDS plot based on the C. neoformans dataset, where
the relative positions in the plot represent the Euclidean distances of
the Spearman correlations of the samples. Small distances correspond to
high correlation coefficiens. Brown and gray circles indicate samples of the
fungal and the mock-infected class, respectively. The arrow marks the fungal
sample that was misclassified as mock-infected control.
Table 2). The average certainties of the classifications were 0.795(± 0.169), 0.855 (± 0.18), and 0.937 (± 0.085) for the classesfungal, bacterial, and mock-infected, respectively.
4. Discussion
Here we present an transcriptome analysis of human whole-blood data comparing bacterial and fungal infections with mock-infected control samples. Based on the regulatory differences, weidentified biomarker genes, which show characteristic expressionpatterns according to their respective causative pathogen type.The selection was not only based on statistical significance. Italso took into account to what extent the random forest classifi-cation algorithm assesses these genes as important for separatingthe given classes. In this way, we applied two different methods offeature selection: the filter approach and the embedded approach.With the detection of differentially expressed genes we are able toremove most of the irrelevant genes and extract a set of poten-tial transcriptional marker genes. The selection by differentialexpression is a widely used method for identifying sepsis relatedmarker genes (Prucha et al., 2004; Pachot et al., 2006; Shanleyet al., 2007; Pankla et al., 2009). The subsequent calculation ofgene importance values using the random forest algorithm allowsus to identify the genes showing the strongest and most constantup- or down-regulation as a consequence of the blood infectionby the particular type of microorganisms. In this way, we wereable to remarkably reduce a set of whole-genome expressionmea-surements to significant signatures distinguishing bacterial fromfungal infections and mock-infected controls. The genes iden-tified as biomarkers for the mock-infected class exhibit similarsignatures for both infection types, fungal and bacterial. Most ofthese genes show down-regulation in the mock-infected samples.However, at the same time they were up-regulated in the infectedsamples, irrespective of the infecting pathogen type. Therefore,
they possibly reflect cellular regulations to respond microbialinfections in general. Thus, they can be considered as pathogen-independent markers for whole-blood infections. Studies inves-tigating a broader range of pathogens should be carried out toconfirm this hypothesis.
Using a human whole-blood model in this work is sup-ported by several advantages. First, as opposed to purified humanimmune cells, it also considers the in vivo complexity of theimmune response in blood (Hünniger et al., 2014). Next, thereare no differences in proportions and functioning of the periph-eral blood components between this model and the target organ-ism, the human, in contrast to other model organisms like mice(Maccallum, 2012). Furthermore, human whole-blood infectionmodels have been successfully used previously to identify factorsof virulence (Echenique-Rivera et al., 2011) and to analyze humanimmune responses (Tena et al., 2003).
Following a genome-wide approach allows us to consider allgenes as potential biomarkers for pathogen type recognition,even if they are not related to immune response. Therefore, withrespect to the screening for biomarkers, using a whole-genomemethod is more promising than techniques which are limitedto a small number of candidates, like serum cytokine analysis.Indeed, the selected biomarker genes cover a broad range offunctions. In this way, these genes may facilitate the recogni-tion of bloodstream infections even when the immune systemof the patient is affected by additional diseases. Besides that,we found the gene MIR155HG as up-regulated in the sampleswith infections. Recently, Das Gupta et al. (2014) have shownthat miR-155 up-regulation is not specific to host response onbacterial pathogens. They also detected increased expression lev-els as reaction to A. fumigatus infections. As we observed up-regulations for all considered species, fungi as well as bacteria, ourresults confirm the findings that miR-155 is involved in a generalhost response to infections, covering a wide range of pathogens.Besides, numerous of the selected biomarkers were previouslyassociated to sepsis in either human or animal studies. This find-ing indicates, that although our results are based on an exper-imental model instead of patient data, we could identify char-acteristic gene regulations in response to microbial bloodstreaminfections.
Preceding the feature selection steps, we successfully identifiedthe three most stable genes from a set of published control genesand used them as reference for normalizing the dataset. In thisway, we do not use absolute gene expression values to train ourclassifier. Instead, we use expression values relative to the geomet-ric mean of the reference genes. Regarding the application case,a user of the classifier aims to identify the pathogen type usingonly a single blood sample without mock-infected controls forcomparison. It is well known that the intensity values onmicroar-rays are influenced by technical variations and errors connectedwith wet lab hand handling of samples as well as hybridizationand scanning of the chip. These differences can not be detectedon a single sample, but they do affect the absolute intensity val-ues. With normalizing relative to reference genes, we control forthis effect, as all genes on the chip are influenced in the sameway. Furthermore, this method can easily be adapted to otherquantification methods like PCR.
Frontiers in Microbiology | www.frontiersin.org 8 March 2015 | Volume 6 | Article 171

Dix et al. Biomarker-based classification of whole-blood infections
Using the biomarker genes, we trained a random forest clas-sifier to classify the pathogen type in whole-blood samples. Ran-dom forest provides several advantages making it suitable for thisstudy. It is fast in training and testing, supports multiclass clas-sifications and provides the variable importance for evaluatingthe input features. With this embedded measure, we were ableto select the best class-separating genes leading to a small set ofbiomarkers. There are further classification methods like supportvector machines or naïve Bayes classifiers, which were success-fully applied on microarray data in other studies (Kelemen et al.,2003; Howrylak et al., 2009). For comparison, we tested the clas-sification performance of these two techniques on both the C.neoformans dataset and the cross-validation, using the previouslyselected biomarkers (Supplementary Material). The support vec-tor machine as well as the naïve Bayes method yielded the sameclassifications of all samples as the random forest model. Thefact that the three classification methods are very different intheir functional principles and the results are unaffected by thechoice of the model indicates that the selected biomarker genesare robust.
The certainty score based on the votes of the trees providesan easy-to-compare measure for assessing the classification qual-ity. It directly reflects the ability of the classification model toproperly classify the input data. This means, a class predictionwith a high certainty score is more likely to be correct, than onewith a low score. One possible application case for this measureis the introduction of a threshold, followed by the removal oflow-scoring classifications.
We tested the classifier with an additional dataset compris-ing whole-blood samples of fungal infection and mock-infectedcontrols. The medically important fungus used for these addi-tional samples, C. neoformans, is phylogenetically very differentfrom C. albicans and A. fumigatus. These differences can leadto varieties in the transcriptional response of the host. How-ever, the accuracy value of about 92% indicate that the selectedbiomarker genes are largely unaffected. Therefore, these genesare general indicators for whole-blood infections caused by fungi.The MDS analysis revealed that the misclassified fungal sampleshows a greater similarity to the specimen of the mock-infectedclass than to the fungal cases. Although the divergence withthe other fungal samples is only small, the differences are suf-ficient for wrong classification. Consequently, the correct clas-sifications of the C. neoformans samples are possibly unsure.Indeed, the certainty values are much lower for the fungal class,compared to the mock-infected controls. Furthermore, we weresurprised to find the certainty score of the misclassified sam-ple being higher than the average score of the remaining fun-gal specimen. This observation confirms the assumption that theprediction of C. neoformans as fungal infected blood sample isa difficult task for the classifier, but still leads to mostly correctresults.
High accuracy values were not only achieved when validat-ing the classifier with the additional C. neoformans dataset, butalso when testing it with stratified 10-fold CV. This broadlyused performance assessment technique iteratively estimates theaccuracy of a prediction model without an independent dataset.The two misclassifications in this test appeared for fungal and
bacterial class. The predictions of the fungal and the bacte-rial class also exhibit the lowest values and the largest fluc-tuations of the certainty scores. However, it should be notedthat the average scores are still high, as 0.795 is the smallest ofthem.
In summary, the results of the assessments by using an addi-tional dataset of fungal infection, i.e., the external validation,as well as by performing a CV, i.e., the internal validation, arepromising. Most of the tested samples were correctly classified,although in some cases right classifications were accompanied bylow certainty scores.
We also performed a noise-robustness test to examinewhether the classifier can compansate fluctuations in the expres-sion data. The high accuracy rates indicate that the indentifiedbiomarkers are robust with respect to changes in their expressionintensities. This robustness is important for a potential clinicalapplication, where patients are of different age, sex, medication,and health condition and thus expression intensities of the samegenes will vary between these patients.
The experimental model of this work comprises the infec-tion of blood from healthy human donors with typical sepsiscausing microorganisms. Although we gained important insightsinto the transcriptional response on the pathogens, our find-ings possibly can not be directly utilized for clinical applica-tion. To achieve that, further analyses on gene expression datafrom septic patients as well as functional follow-up studies haveto be performed. Unfortunately, whole-genome expression datafrom septic patients where the causing pathogen is known is rarein publicly accessible databases. Especially, datasets comprisingthe transcriptional response to fungal induced sepsis are scarce.Thus, we lack the basis for more clinical relevant investigations,which is why it remains an open task for future research. Fur-thermore, it should be noted that the presented classifier can notbe used to identify the infecting species. Rather it is supposed toanswer the question if the pathogen is of bacterial or fungal ori-gin and whether or not it is necessary to administer antimycoticsinstead of antibiotics. To initiate a species dependent therapy,more requirements have to be fulfilled, e.g., in case of a bacte-rial infection, the appropriate antibiotic has to be determined byan antibiogram.
In this study we present an effective selection of genesshowing characteristic expression patterns depending on thetype of the infectious organism. The resulting small gene setwas used to train a fast and accurate random forest classifier,which performs well in predicting the class of the pathogen.Examining the transcriptional footprint of the sepsis caus-ing microorganism in the blood of the host is a promis-ing approach for quick pathogen identification. With the pre-sented classification model we meet the increasing challengeof fungal induced septic infections requiring novel detectionmethods.
Author Contributions
AD did the bioinformatic analysis and co-wrote the manuscript.KH performed the experiments, generated the data, and co-wrotethe manuscript. MW discussed the analysis and co-wrote the
Frontiers in Microbiology | www.frontiersin.org 9 March 2015 | Volume 6 | Article 171

Dix et al. Biomarker-based classification of whole-blood infections
manuscript. RG, OK, and JL designed the research and co-wrotethe manuscript.
Acknowledgments
This work was supported by the Deutsche Forschungs-gemeinschaft (DFG) in the Collaborative Research Cen-tre/Transregio 124 FungiNet (subprojects B3, INF, C3) as well
as German Ministry for Education and Science in the programUnternehmen Region (BMBF 03Z2JN21).
Supplementary Material
The Supplementary Material for this article can be foundonline at: http://www.frontiersin.org/journal/10.3389/fmicb.2015.00171/abstract
References
Ambroise, C., and McLachlan, G. (2002). Selection bias in gene extraction on
the basis of microarray gene-expression data. Proc. Natl. Acad. Sci. U.S.A. 99,
6562–6566. doi: 10.1073/pnas.102102699
Ashburner, M., Ball, C. A., Blake, J. A., Botstein, D., Butler, H., Cherry, J. M., et al.
(2000). Gene Ontology: tool for the unification of biology. Nat. Genet. 25,
25–29. doi: 10.1038/75556
Benjamini, Y., and Hochberg, Y. (1995). Controlling the false discovery rate: a
practical and powerful approach to multiple testing. J. R. Stat. Soci. Ser. B 57,
289–300.
Bloos, F., Hinder, F., Becker, K., Sachse, S., Mekontso Dessap, A., Straube, E.,
et al. (2010). A multicenter trial to compare blood culture with polymerase
chain reaction in severe human sepsis. Intensive Care Med. 36, 241–247. doi:
10.1007/s00134-009-1705-z
Breiman, L. (2001). Random forests. Mach. Learn. 45, 5–32. doi:
10.1023/A:1010933404324
Das Gupta, M., Fliesser, M., Springer, J., Breitschopf, T., Schlossnagel, H.,
Schmitt, A.-L., et al. (2014). Aspergillus fumigatus induces microRNA-132
in human monocytes and dendritic cells. Int. J. Med. Microbiol. 4, 2–6. doi:
10.1016/j.ijmm.2014.04.005
Díaz-Uriarte, R., and Alvarez de Andrés, S. (2006). Gene selection and classi-
fication of microarray data using random forest. BMC Bioinform. 7:3. doi:
10.1186/1471-2105-7-3
Du, P., Kibbe,W. A., and Lin, S. M. (2008). lumi: a pipeline for processing Illumina
microarray. Bioinformatics 24, 1547–1548. doi: 10.1093/bioinformatics/btn224
Echenique-Rivera, H., Muzzi, A., Del Tordello, E., Seib, K. L., Francois, P., Rap-
puoli, R., et al. (2011). Transcriptome analysis of Neisseria meningitidis in
human whole blood andmutagenesis studies identify virulence factors involved
in blood survival. PLoS Pathog. 7:e1002027. doi: 10.1371/journal.ppat.1002027
Eden, E., Navon, R., Steinfeld, I., Lipson, D., and Yakhini, Z. (2009). GOrilla: a tool
for discovery and visualization of enriched GO terms in ranked gene lists. BMC
Bioinform. 10:48. doi: 10.1186/1471-2105-10-48
Edgar, R., Domrachev, M., and Lash, A. E. (2002). Gene Expression Omnibus:
NCBI gene expression and hybridization array data repository. Nucleic Acids
Res. 30, 207–210. doi: 10.1093/nar/30.1.207
Engel, C., Brunkhorst, F. M., Bone, H.-G., Brunkhorst, R., Gerlach, H., Grond,
S., et al. (2007). Epidemiology of sepsis in Germany: results from a
national prospective multicenter study. Intensive Care Med. 33, 606–618. doi:
10.1007/s00134-006-0517-7
Gentleman, R. C., Carey, V. J., Bates, D. M., Bolstad, B., Dettling, M., Dudoit, S.,
et al. (2004). Bioconductor: open software development for computational biol-
ogy and bioinformatics. Genome Biol. 5:R80. doi: 10.1186/gb-2004-5-10-r80
Gillum, A. M., Tsay, E. Y. H., and Kirsch, D. R. (1984). Isolation of the Candida
albicans gene for orotidine-5’-phosphate decarboxylase by complementation of
S. cerevisiae ura3 and E. coli pyrF mutations. Mol. Gen. Genet. 198, 179–182.
doi: 10.1007/BF00328721
Grutkoski, P. S., Chen, Y., Chung, C. S., and Ayala, A. (2003). Sepsis-induced
SOCS-3 expressio n is immunologically restricted to phagocytes. J. Leukoc. Biol.
74, 916–922. doi: 10.1189/jlb.0303108
Howrylak, J. A., Dolinay, T., Lucht, L., Wang, Z., Christiani, D. C., Sethi, J. M.,
et al. (2009). Discovery of the gene signature for acute lung injury in
patients with sepsis. Physiol. Genomics 37, 133–139. doi: 10.1152/physiolge-
nomics.90275.2008
Hünniger, K., Lehnert, T., Bieber, K., Martin, R., Figge, M. T., and Kurzai, O.
(2014). A virtual infection model quantifies innate effector mechanisms
and Candida albicans immune escape in human blood. PLoS Comput. Biol.
10:e1003479. doi: 10.1371/journal.pcbi.1003479
James, T. Y., Kauff, F., Schoch, C. L., Matheny, P. B., Hofstetter, V., Cox, C. J., et al.
(2006). Reconstructing the early evolution of Fungi using a six-gene phylogeny.
Nature 443, 818–822. doi: 10.1038/nature05110
Johnson, S. B., Lissauer, M., Bochicchio, G. V., Moore, R., Cross, A. S., and Scalea,
T. M. (2007). Gene expression profiles differentiate between sterile SIRS and
early sepsis. Ann. Surg. 245, 611–621. doi: 10.1097/01.sla.0000251619.10648.32
Kang, S.-S., Kim, H. J., Jang, M. S., Moon, S., In Lee, S., Jeon, J. H., et al.
(2012). Gene expression profile of human peripheral blood mononuclear cells
induced by Staphylococcus aureus lipoteichoic acid. Int. Immunopharmacol. 13,
454–460. doi: 10.1016/j.intimp.2012.05.010
Kelemen, A., Zhou, H., Lawhead, P., and Liang, Y. (2003). “Naive Bayesian classi-
fier for microarray data,” in Proceedings of the International Joint Conference on
Neural Networks, 2003 (Portland, OR), 1769–1773.
Kumar, A., Roberts, D., Wood, K. E., Light, B., Parrillo, J. E., Sharma, S., et al.
(2006). Duration of hypotension before initiation of effective antimicrobial
therapy is the critical determinant of survival in human septic shock. Crit. Care
Med. 34, 1589–1596. doi: 10.1097/01.CCM.0000217961.75225.E9
Kwon, M. J., Oh, E., Lee, S., Roh, M. R., Kim, S. E., Lee, Y., et al. (2009). Identifi-
cation of novel reference genes using multiplatform expression data and their
validation for quantitative gene expression analysis. PloS ONE 4:e6162. doi:
10.1371/journal.pone.0006162
Lehmann, L. E., Hunfeld, K.-P., Steinbrucker, M., Brade, V., Book, M., Seifert, H.,
et al. (2010). Improved detection of blood stream pathogens by real-time PCR
in severe sepsis. Intensive CareMed. 36, 49–56. doi: 10.1007/s00134-009-1608-z
Li, Y., Zhang, P., Wang, C., Han, C., Meng, J., Liu, X., et al. (2013). Immune
responsive gene 1 (IRG1) promotes endotoxin tolerance by increasing A20
expression in macrophages through reactive oxygen species. J. Biol. Chem. 288,
16225–16234. doi: 10.1074/jbc.M113.454538
Liaw, A., and Wiener, M. (2002). Classification and regression by randomForest.
R. News 2, 18–22.
Maccallum, D. M. (2012). Hosting infection: experimental models to assay
Candida virulence. Int. J. Microbiol. 2012:363764. doi: 10.1155/2012/363764
Martin, G. S. (2012). Sepsis, severe sepsis and septic shock: changes in incidence,
pathogens and outcomes. Expert Rev. Anti Infect. Ther. 10, 701–706. doi:
10.1586/eri.12.50
Martin, G. S., Mannino, D. M., Eaton, S., and Moss, M. (2003). The epidemiology
of sepsis in the United States from 1979 through 2000. N. Engl. J. Medi. 348,
1546–1554. doi: 10.1056/NEJMoa022139
Mielke, L. A., Elkins, K. L., Wei, L., Starr, R., Tsichlis, P. N., O’Shea, J. J., et al.
(2009). Tumor progression locus 2 (Map3k8) is critical for host defense against
Listeria monocytogenes and IL-1 beta production. J. Immunol. 183, 7984–7993.
doi: 10.4049/jimmunol.0901336
O’Connell, R. M., Taganov, K. D., Boldin, M. P., Cheng, G., and Baltimore,
D. (2007). MicroRNA-155 is induced during the macrophage inflam-
matory response. Proc. Natl. Acad. Sci. U.S.A. 104, 1604–1609. doi:
10.1073/pnas.0610731104
Pachot, A., Lepape, A., Vey, S., Bienvenu, J., Mougin, B., and Monneret, G.
(2006). Systemic transcriptional analysis in survivor and non-survivor sep-
tic shock patients: a preliminary study. Immunol. Lett. 106, 63–71. doi:
10.1016/j.imlet.2006.04.010
Frontiers in Microbiology | www.frontiersin.org 10 March 2015 | Volume 6 | Article 171
Dix et al. Biomarker-based classification of whole-blood infections
Panetta, R., Guo, Y., Magder, S., and Greenwood, M. T. (1999). Regulators
of G-protein signaling (RGS) 1 and 16 are induced in response to bacterial
lipopolysaccharide and stimulate c-fos promoter expression. Biochem. Biophys.
Res. Commun. 259, 550–556. doi: 10.1006/bbrc.1999.0817
Pankla, R., Buddhisa, S., Berry,M., Blankenship, D.M., Bancroft, G. J., Banchereau,
J., et al. (2009). Genomic transcriptional profiling identifies a candidate blood
biomarker signature for the diagnosis of septicemic melioidosis. Genome Biol.
10:R127. doi: 10.1186/gb-2009-10-11-r127
Pierrakos, C., and Vincent, J.-L. (2010). Sepsis biomarkers: a review. Crit. Care
14:R15. doi: 10.1186/cc8872
Prucha, M., Ruryk, A., Boriss, H., Möller, E., Zazula, R., Herold, I., et al. (2004).
Expression profiling: toward an application in sepsis diagnostics. Shock 22,
29–33. doi: 10.1097/01.shk.0000129199.30965.02
Rittirsch, D., Flierl, M. A., andWard, P. A. (2008). Harmful molecular mechanisms
in sepsis. Nat. Rev. Immunol. 8, 776–787. doi: 10.1038/nri2402
Rodriguez, A., Vigorito, E., Clare, S., Warren, M. V., Couttet, P., Soond, D. R.,
et al. (2007). Requirement of bic/microRNA-155 for normal immune function.
Science 316, 608–611. doi: 10.1126/science.1139253
Saeys, Y., Inza, I. N., and Larrañaga, P. (2007). A review of feature selection
techniques in bioinformatics. Bioinformatics 23, 2507–2517. doi: 10.1093/bioin-
formatics/btm344
Schreiber, J., Nierhaus, A., Braune, S. A., deHeer, G., and Kluge, S. (2013). Compar-
ison of three different commercial PCR assays for the detection of pathogens in
critically ill sepsis patients. Med. Klin. Intensivmed. Notfallmed. 108, 311–318.
doi: 10.1007/s00063-013-0227-1
Shanley, T. P., Cvijanovich, N., Lin, R., Allen, G. L., Thomas, N. J., Doctor, A.,
et al. (2007). Genome-level longitudinal expression of signaling pathways
and gene networks in pediatric septic shock. Mol. Med. 13, 495–508. doi:
10.2119/2007-00065.Shanley
Smyth, G. (2005). “Limma: linear models for microarray data,” in Bioinformatics
and Computational Biology Solutions Using R and Bioconductor, eds R. Gentle-
man, V. Carey, S. Dudoit, R. Irizarry, andW. Huber (New York, NY: Springer),
397–420. doi: 10.1007/0-387-29362-0/23
Stamova, B. S., Apperson, M., Walker, W. L., Tian, Y., Xu, H., Adamczy, P., et al.
(2009). Identification and validation of suitable endogenous reference genes for
gene expression studies in human peripheral blood. BMCMed. Genomics 2:49.
doi: 10.1186/1755-8794-2-49
Svetnik, V., Liaw, A., Tong, C., and Wang, T. (2004). “Application of Breiman’s
random forest to modeling structure-activity relationships of pharmaceutical
molecules,” inMultiple Classifier Systems, eds F. Roli, J. Kittler, and T. Windeatt
(Berlin; Heidelberg: Springer), 334–343.
Takahashi, H., Tashiro, T., Miyazaki, M., Kobayashi, M., Pollard, R. B., and
Suzuki, F. (2002). An essential role of macrophage inflammatory protein
1α/CCL3 on the expression of host’s innate immunities against infectious
complications. J. Leukoc. Biol. 72, 1190–1197. doi: 10.4049/jimmunol.169.
8.4460
Tena, G. N., Young, D. B., Eley, B., Henderson, H., Nicol, M. P., Levin,
M., et al. (2003). Failure to control growth of mycobacteria in blood
from children infected with human immunodeficiency virus and its rela-
tionship to T cell function. J. Infect. Dis. 187, 1544–1551. doi: 10.1086/
374799
Vandesompele, J., De Preter, K., Pattyn, F., Poppe, B., Van Roy, N., De Paepe,
A., et al. (2002). Accurate normalization of real-time quantitative RT-PCR
data by geometric averaging of multiple internal control genes. Genome Biol.
3:RESEARCH0034. doi: 10.1186/gb-2002-3-7-research0034
Westh, H., Lisby, G., Breysse, F., Böddinghaus, B., Chomarat, M., Gant, V., et al.
(2009). Multiplex real-time PCR and blood culture for identification of blood-
stream pathogens in patients with suspected sepsis. Clin. Microbiol. Infect. 15,
544–551. doi: 10.1111/j.1469-0691.2009.02736.x
Wong, H. R., Wheeler, D. S., Tegtmeyer, K., Poynter, S. E., Kaplan, J. M., Chima,
R. S., et al. (2010). Toward a clinically feasible gene expression-based sub-
classification strategy for septic shock: proof of concept. Crit. Care Med. 38,
1955–1961. doi: 10.1097/CCM.0b013e3181eb924f
Yoo, H., Ahn, E.-R., Kim, S.-J., Lee, S.-H., Oh, S. H., and Kim, S.-Y. (2013).
Divergent results induced by different types of septic shock in transglutami-
nase 2 knockout mice. Amino Acids 44, 189–197. doi: 10.1007/s00726-012-
1412-x
Conflict of Interest Statement: The Associate Editor, Tunahan Cakir, declares
that, despite collaborating on the Frontiers Research Topic “Endothelial cell dys-
function in pathogen-induced hemorrhagic fevers” with the author Reinhard
Guthke, the review process was handled objectively and no conflict of interest
exists. The authors declare that the research was conducted in the absence of any
commercial or financial relationships that could be construed as a potential conflict
of interest.
Copyright © 2015 Dix, Hünniger, Weber, Guthke, Kurzai and Linde. This is an
open-access article distributed under the terms of the Creative Commons Attribution
License (CC BY). The use, distribution or reproduction in other forums is permitted,
provided the original author(s) or licensor are credited and that the original publica-
tion in this journal is cited, in accordance with accepted academic practice. No use,
distribution or reproduction is permitted which does not comply with these terms.
Frontiers in Microbiology | www.frontiersin.org 11 March 2015 | Volume 6 | Article 171
Related Documents