3-D cell culture using animal-free hydrogel Pages 13-15 18-colour human blood phenotyping made easy Pages 46-52 Establishing PCRs using advanced gradient cycler technology Page 83-85

Welcome message from author
This document is posted to help you gain knowledge. Please leave a comment to let me know what you think about it! Share it to your friends and learn new things together.
Transcript

3-D cell culture using animal-free hydrogel Pages 13-15
18-colour human blood phenotyping made easy Pages 46-52
Establishing PCRs using advanced gradient cycler technologyPage 83-85

When innovation hits the market, we make it accessible for you! In this magazine you will find technical articles about innovation, expertise and solutions that will help you to succeed in your life science challenges. To take full advantage of being digital, make sure you launch the flip version of the magazine so you can jump from the table of contents to your topic of interest and directly launch embedded video and website links.
Enjoy reading and exploring!Your VWR bioMarke Team
Welcome to bioMarke magazine
bioMarke - Focusing on Life Science | 2021 | vwr.com2

vwr.com | 2021 | bioMarke - Focusing on Life Science 3
Table of contents
01CELL TO THERAPY
Promise and potential: Cell therapies for paediatric patients Pages 6-10
Avantor® Seradigm FB EssencePage 12
Turning the world upside-down for improved culturing and imaging of respiratory cells within a human 3-D modelPages 13-15
Maximise performance with HyClone media and supplements Pages 17-19
Advantages of UpCell™ surface over trypsin for preserving cell viability and expression of cell surface antigens Pages 20-24
Are the extractables from Nalgene Rapid-Flow receiver bottles lower when compared to similar devices? Pages 26-27
Easy picking with the QPix™ 400 - multiple selection modalities, wide range of microorganismsPages 28-31
Tangential Flow Filtration (TFF) for desalting, buffer exchange and concentrationPages 32-35
Pall™ Laboratory AcroPrep™ 24-well filter plates with various pore size for ultrafiltration, microfiltration and macrofiltration / particle filtration Pages 36-37
Sartorius ultrafiltration products for the concentration and purification of viruses – a short review Pages 38-41
SenseAnywhere for monitoring COVID-19 vaccines across Europe Pages 44-45
18–colour human blood phenotyping made easy with flow cytometry Pages 46-52
Five microscopes in one to view and capture more publication quality data Pages 54-55
02SAMPLE TO SEQUENCE
Taking bio sampling to the next level Pages 58-62
Using Bead Mill MAX and peqGOLD kits for extracting DNA and RNA from the leaves of Ocimum basilicum Pages 64-65
Using Bead Mill MAX and peqGOLD Total RNA Kit for extracting RNA from murine tissues Pages 66-67
Transcriptomic analysis of cheese-ripening microbial communities with dual-RNA-SEQ Pages 68-69
DNA extraction from frozen tumour samples using the MINILYS® tissue homogeniser compared to the manual homogenisation methodPages 70-71
High throughput automated DNA extraction solution from whole blood samples using Omega Bio-tek’s reagents on the Tecan Fluent® 780 workstationPages 72-75
RNA clean-up and size selection using sparQ PureMag BeadsPages 76-78
Next generation sequencing, formalin-fixed, paraffin-embedded quality control with Agilent Pages 80-81
Establishing PCRs successfully - how advanced gradient thermal cycler technology will help to achieve efficient and robust amplification Pages 83-85
Highly concentrated Taq DNA Polymerase Glycerol Free for diagnostic applications Pages 87-88
Avantor’s Inventory Manager helps optimise your lab operations Page 90

01 Cell to therapy
4 bioMarke - Focusing on Life Science | 2021 | vwr.com

Whether for basic research or biopharmaceutical production, we have the right solutions for your entire workflow, allowing you to focus on innovation.
DISCOVERMORE AT
VWR.COM
vwr.com | 2021 | bioMarke - Focusing on Life Science 5

6 bioMarke - Focusing on Life Science | 2021 | vwr.com
Promise and potential: Cell therapies for paediatric patientsThe development and use of cell and gene therapies are rapidly expanding across the globe, offering powerful treatments to help address challenging diseases like childhood leukaemia and spinal muscular atrophy (SMA). In this interview with Prof. Dr. Peter Bader, Head of the Division for Stem Cell Transplantation, Immunology and Intensive Care Medicine in the Department for Children and Adolescents, University Hospital Frankfurt, Goethe University, we learn about both the potential of these therapies as well as the clinical challenges associated with such personalised forms of medicine.

Q: Cell and gene therapies are seen as the medicine of the future. What do you view as some of the greatest promises or patient outcomes for these therapies?
The first cell therapy was stem cell transplantation. Today, we have cell therapies that work specifically against leukaemia cells—this is an important difference from where we started two to three decades ago. The therapeutic cells given are genetically engineered to unerringly eliminate these malignant cells.
In contrast to cell therapy where cells are transferred to the patient, gene therapy involves transfer of genetic material into appropriate cells of the patient in order to achieve gene correction. This is a wide field that is still being defined, but there are gene therapies that are already in clinical use. These target disorders that are related to the blood and the immune system, such as congenital anaemia syndrome, thalassemia, adrenoleukodystrophy, metabolic disorders and so forth. In these, the correction of haematopoietic stem cells takes place by excision of genes or exchange of genes. After 30 years of intensive research, we’ve had clinical successes in these areas over the past 10 years.
Q: What significance do cell and gene therapies already have in practice in the patients you serve?
Cell therapy is starting to gain importance as a treatment for children, adolescents and young adults with acute leukaemia and anaemia syndromes. These therapies offer hope to patients with recurrent leukaemia, where conventional treatment is not successful. Administering and treating patients with these cell therapeutics is actually easier than performing a transplant, but we need long-term evidence to show that the therapies have the same effectiveness as a transplant.
Q: Your centre is included in a study group that is researching CAR-T, currently one of the best known cell therapies. Can you tell us how CAR-T treatment is applied in practice?
In Germany, we were the only centre that had the privilege to participate in the multi-centre phase II study (note: CCTL019B2202 study). Enrolled were paediatric patients with B-cell acute lymphoblastic leukaemia of the B precursors, children and adolescents up to the age of 25 who either relapsed for the second time, relapsed after transplantation or did not respond to therapy at all.
First the patient’s own white blood cells are removed by leukapheresis in an adequate number and T cells are isolated there from in the laboratory. These are genetically modified using an inactive viral vector to express a ‘so called’ chimeric antigen receptor (CAR) on their cell surface, which targets the antigen CD19. After binding of these CAR-T cells to the CD19-bearing leukaemic target cells, an immune response is activated and triggered resulting in destruction of the cancer cells.
During the manufacturing period of the patient’s CAR-T cells (about 6 weeks) a bridging therapy might be required to maintain disease control and prevent progression. Before receipt of the laboratory produced and augmented CAR-T cells, the patient receives a lymphodepletion chemotherapy in order to ensure good starting conditions for CAR-T cell expansion in the body.
In the acute phase of about 1 to 2 weeks after CAR-T cell administration, complications like cytokine-release syndrome (CRS) and immune effector cell associated neurotoxicity syndrome (ICANS) may occur. These can be severe, which is why treatment should be done in experienced centres. Of course, a careful long-term follow up is necessary for patients receiving CAR-T cell therapy.
Novartis Media Release: Novartis receives European Commission approval of its CAR-T cell therapy, Kymriah® (tisagenlecleucel) CAR-T cell therapy is a complex cell therapy procedure.
vwr.com | 2021 | bioMarke - Focusing on Life Science 7

Q: Research seems to indicate that about 90% of patients respond to CAR-T therapy. Is that correct?
Yes, these are the numbers for a response to therapy. This can be compared to the figures from the frontline treatment of a patient with cortisone, with 90 to 95% of patients responding to the therapy and after another 2 weeks, all are in remission. But the question is, does that last? A 90% response after 28 days is sensational for this high risk group, but retention of the remission lasting 2 to 3 years is the real goal.
One approach is to use the CAR-T therapy to achieve a remission long enough to then perform a transplant. Although that is not an approach we take, it is one that is used in other locations, including in the US. We assume that with this specific immunotherapy a temporary resistance of the cell is achieved, and thus an ultimate cure can be achieved
Right now, approximately 18 months after tumour removal and transplantation, if the patient remains in remission, then the likelihood that a patient has survived the disease is more than 95%. We can look back on 10 000 children with transplants in Europe in recent
years, and there are records of patients who were successfully treated back to 2012.
We don’t know that yet for CAR-T cell therapy, but it will be similar. For those who managed to stay in remission for 1 year after CAR-T cell treatment, it seems the probability will be similarly high for permanently staying in remission.
Q: Beyond the scientific literature and issues around manufacturing, what can you share with us about CAR-T in clinical use?
The first and most difficult question to ask is whether or not the patient would benefit from CAR-T. This must be carefully examined based on each patient’s condition. Getting lymphocytes from the patient, ideally T cells, is the next step. This is performed via cell apheresis, in which blood is usually withdrawn, a centrifuge filters out the cells and erythrocytes flow back. The extracted cells are typically frozen, quality assured and taken to the laboratory for genetic manipulation and transcription.
A challenge is that patients need to have enough T cells. If the number is too low, then it will not be possible to gain a sufficient number of cells. If you have a patient relapse after transplant, it will always take some time for the patient’s T cells to regenerate. If you have a patient with a newly diagnosed leukaemia, that patient will have many T cells and assuming the cells meet the laboratory qualitative prerequisites, the transcription process follows.
While these cells are in the production process, you still have to treat the patient. The leukaemia must be controlled at this time by maintenance chemotherapy. It’s been observed that if leukaemia responds to maintenance therapy, it is a good indication of the likelihood that CAR-T cells will work.
Worldwide studies like these are an incredible logistical effort and investment. In some of the first studies, cells were flown to the US where they were transcribed, quality checked and returned. The Fraunhofer Institute in Leipzig, Germany is affiliated with some major biopharmaceutical manufactures to perform this work today, and there are other laboratories also performing this work in Europe, Australia and Japan.
Q: How long is this production process? Usually, it takes about 6 weeks, and this is a risky time for the patient. Increasing bacterial, viral or fungal infections can occur because these patients have no
8 bioMarke - Focusing on Life Science | 2021 | vwr.com

immune defence. It could be that these infections have progressed so far that we lose the patient before the cell therapy can be given.
Q: Could the entire process take place in one centre to optimise the process chain, from collection to processing in a clinical lab?
The faster the manufacturing process works, the better it is for the patients. We can, and sometimes do, have all the processing in one location. However, cell therapeutics are subject to strict laws governing drugs. A physician can administer medication within the scope of the doctor’s privilege, and also produce it themselves, but only under limited conditions.
Even with new cell therapy technology, the treatment of patients with such acute life threatening diseases is always a major challenge that can be controlled to a limited extent by doctors. Also, this medicine is very expensive, and is not suitable for all patients equally.
Q: How well do young patients respond to therapy? In some patients, therapy is fantastically smooth. The cells are given and then it takes 5 to 6 days for the blood to regenerate. With the blood count, the T cells, platelets and leukaemia are controlled. Some patients get high fever and chills, referred to as cytokine release syndrome (CRS). These patients need support with catecholamines and tocilizumab. Other patients have seizures. Initially, about 60 to 70% of patients got seriously ill but as we’ve gained experience this reduced.
Q: Currently, every cell therapy is created from the patient’s own cell material. Are there visions of how this therapy or process could be scaled or simplified, such as working with donor cells? You could also take cells from a donor, but then you have the risk of inducing a graft versus host disease (GvHD). However, there is research into a type of method whereby the T-cell receptor is excised by a CRISPR-Cas technology and the cells are then unable to induce GvHD. These cells can then be used universally. However, this is a highly complicated procedure; there are many obstacles to overcome and patients usually must receive transplants afterwards.
It is difficult to say where the future will go, but as for now, the most effective results are through patient-specific therapy and this seems to be the most promising to me.
Q: There are alternative approaches to CAR-T therapy for leukaemia, such as using monoclonal antibodies or bispecific antibodies to activate an immune response. Is personalised medicine the biggest hope in the future of leukaemia therapy?
There are therapies based on highly specific antibodies, such as bispecific antibodies or antibodies directed against a surface antigen on a leukaemia cell and coupled to a cytostatic agent. An example of this is blinatumomab. Although it achieved remission in close to 80% of cases after 4 weeks, unfortunately too many relapses occurred. Now, these therapies are used in paediatrics just to bring leukaemia into remission and then transplant.
The therapeutic options, as well as all other antibodies, have not been investigated exhaustively. There are studies in paediatrics, whether the alternative therapies should be placed in an earlier stage in leukaemia recurrence treatment as well as initial treatment in patients with B-precursor ALL.
In adult patients over 50 to 60 years of age, the rate of side effects from conventional therapeutics and transplants is much higher than in children, including the rate of fatal complications.
vwr.com | 2021 | bioMarke - Focusing on Life Science 9

For these patients, the alternatives are useful because the therapeutic goal is not always to cure, but a longer life with good quality of life. In paediatrics, however, the approach is different, because the choice is a long life or a short one and that is the situation we are in. Therapies are competing side by side and we are all very happy to have these treatment options at our disposal.
Q: How could CAR-T therapy be used to treat other illnesses or conditions?
We’re focused on the ‘liquid tumours’ at the moment, the leukaemia and the lymphomas. For patients with solid tumours, there are treatments where success rates could be better. Treatments for breast cancer, sarcoma, prostate cancer, and even some brain tumours, where there are already clinical trials, are possible in the future. These tumours spread haematogenously at the stage of undetectable minimal residual disease (MRD). For me, the indication of ‘minimal residual disease’ of these cancers is where to intervene. There are also opportunities with multiple myeloma, a disease that certainly needs new therapeutic solutions.
The big question that we seek to answer is if CAR-T works for acute myeloid leukaemia (AML). AML is a bit more complicated with the antigens, but there are new technologies to produce these CAR-T cells with vectors, lentiviruses or electroporation. And there are attempts to combine them with antibodies. I think that’s why, hopefully, AML can be a CAR-T target and it’s something that we’re also working on in Frankfurt.
Q: Any final outlook on the future of cell and gene therapies?
Cell and gene therapies introduce a new therapeutic principle for patients. In that sense, this is clearly a new era, a revolution in treatment. It would be nice if a patient came to us for treatment of leukaemia and through the course of treatment, we could have the patient’s own immune system eliminate the disease. That is our dream, and I believe this therapy could have that potential. I have been in this field for 30 years. Working in the haematology ward in community service, I remember when just 30 to 40% of children we saw survived leukaemia. Today, it is very different. We will continue to make progress and reduce side effects, putting cell therapies in use when determined to be the best course of treatment for the patient. These treatments have much promise for adults, children and all of us as a society.
Your trusted partner for cell and gene therapyAvantor has the expertise, products and solutions to help biopharmaceutical researchers and manufacturers propel their cell and gene therapy research, scale-up and production forward. Contact your Avantor account representative to learn more about our offering for cell and gene therapy.
10 bioMarke - Focusing on Life Science | 2021 | vwr.com
Professor Dr. Peter Bader Head of the Division for Stem Cell Transplantation and Immunology, Department for Children and Adolescents, University Hospital Frankfurt, Goethe University, Germany.

Solutions that enable your processFrom breakthrough discovery, to agile delivery ofadvanced products and services around the globe,Avantor® helps biopharmaceutical companiesovercome regulatory challenges, boost processperformance, and improve ‘time to market’ for newtreatments that benefit the world.
Whether you are producing vaccines, monoclonalantibodies, recombinant proteins or cell and genetherapies, count on Avantor’s proven industryexpertise, and the logistics strength of our channelbrand, VWR, part of Avantor, to enable your success.
Visit vwr.com/bioprocessing for product details and purchasing information.
PB19
044
-EU
REQUEST YOUR SAMPLE
VWR.COM
12 bioMarke - Focusing on Life Science | 2021 | vwr.com
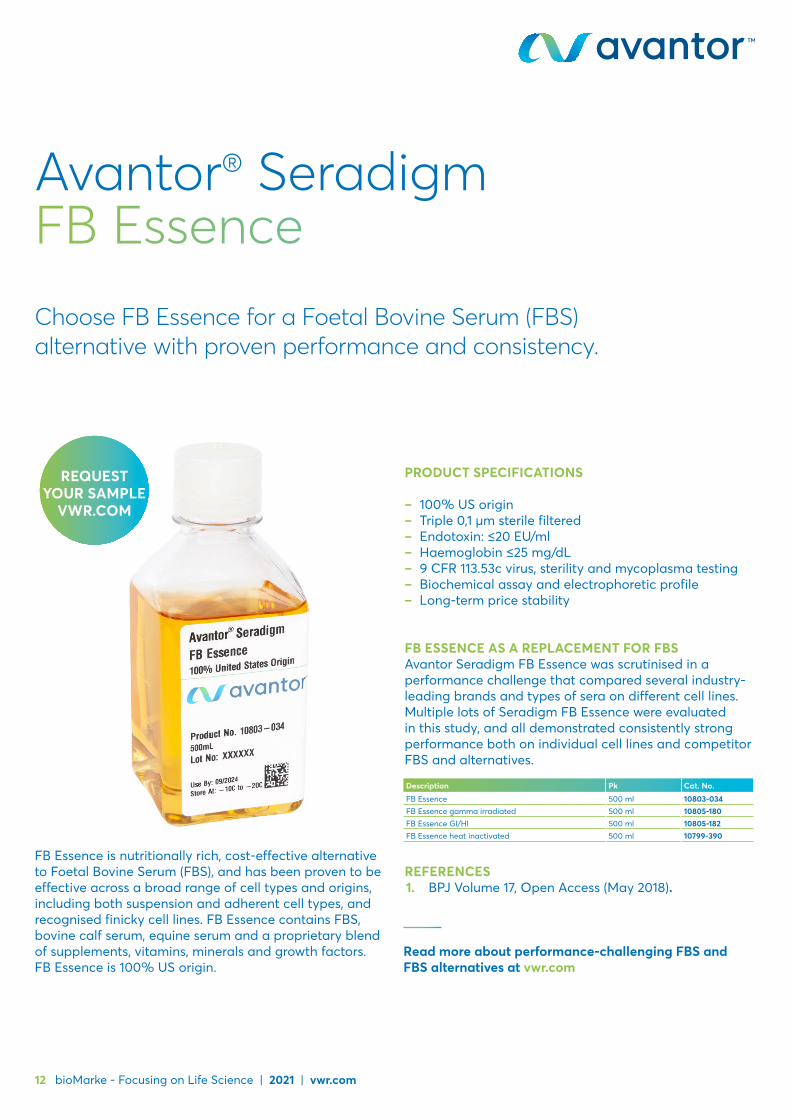
Avantor® Seradigm FB EssenceChoose FB Essence for a Foetal Bovine Serum (FBS) alternative with proven performance and consistency.
FB Essence is nutritionally rich, cost-effective alternative to Foetal Bovine Serum (FBS), and has been proven to be effective across a broad range of cell types and origins, including both suspension and adherent cell types, and recognised finicky cell lines. FB Essence contains FBS, bovine calf serum, equine serum and a proprietary blend of supplements, vitamins, minerals and growth factors. FB Essence is 100% US origin.
PRODUCT SPECIFICATIONS
– 100% US origin – Triple 0,1 µm sterile filtered – Endotoxin: ≤20 EU/ml – Haemoglobin ≤25 mg/dL – 9 CFR 113.53c virus, sterility and mycoplasma testing – Biochemical assay and electrophoretic profile – Long-term price stability
FB ESSENCE AS A REPLACEMENT FOR FBSAvantor Seradigm FB Essence was scrutinised in a performance challenge that compared several industry-leading brands and types of sera on different cell lines. Multiple lots of Seradigm FB Essence were evaluated in this study, and all demonstrated consistently strong performance both on individual cell lines and competitor FBS and alternatives.
REFERENCES1. BPJ Volume 17, Open Access (May 2018).
Description Pk Cat. No.
FB Essence 500 ml 10803-034FB Essence gamma irradiated 500 ml 10805-180FB Essence GI/HI 500 ml 10805-182FB Essence heat inactivated 500 ml 10799-390
Read more about performance-challenging FBS and FBS alternatives at vwr.com
vwr.com | 2021 | bioMarke - Focusing on Life Science 13
Turning the world upside-down for improved culturing and imaging of respiratory cells within a human 3-D modelViktoria Zaderer1, Martin Hermann2, Cornelia Lass-Flörl1, Wilfried Posch1 and Doris Wilflingseder1
1. Institute of Hygiene and Medical Microbiology, Medical University of Innsbruck, Austria 2. Department of Anesthesiology and Critical Care Medicine, Medical University of Innsbruck, Austria
INTRODUCTIONAdvanced in vitro cell models with polarised growth of respiratory epithelial cells are required for respiratory disease research, drug screening or host pathogen interaction studies. Three-dimensional (3-D) cell culture in hydrogels offers a promising platform for the development of these models, however, there are challenges with the materials and methods currently used. Namely, seeding the cells in collagen-based matrices on to the inside membrane of a Transwell insert makes it practically impossible for imaging. Additionally, harvesting cells with collagenase or dispase can seriously affect the cells, resulting in biased downstream analyses 1.
To overcome these challenges, we developed and optimised long-term culturing conditions for monitoring cell differentiation and repeated dose drug response in an advanced 3-D respiratory cell model 2. Specifically, Normal Human Bronchial Epithelial (NHBE) or Small Airway Epithelial (SAE) cells were seeded upside-down on to the underside membrane of Transwell inserts within the animal-free nanofibrillar cellulose hydrogel, GrowDex®. The cells were grown inverted under static conditions, and subsequently differentiated in an air-liquid interphase (ALI) over a period of 14 days and then maintained for up to 700 days, allowing this ‘upside-down’ cell culture model to be easily monitored by live cell imaging. This method of model orientation also enables the easy addition of immune components, such as dendritic cells (DCs), macrophages, and neutrophil to the inner chamber of the Transwell inserts, to monitor immune cell behaviour after respiratory challenge.
MATERIALS
– GrowDex® 1,5% (Cat. No. 100.103.005) – Human-derived respiratory epithelial primary cells:
– NHBE – SAEC
– Complete PneumaCult™-Ex Plus medium – Complete PneumaCult™-ALI Base medium – Complete PneumaCult™-ALI Maintenance medium
– Supplemented with Hydrocortisone stock solution and Heparin solution
– Animal component-free cell dissociation kit – WGA 488 (Cat. No. 29022-1) – Hoechst 33342 (Cat. No. ICNA0219030525) – Phalloidin-Alexa 555 – Mitotracker deep red – Costar® 6- and 24-well clear TC-treated multiple well
plates (Cat. No. 734-1599, 734-1605) – 6,5 mm Transwell® with 8,0 µm pore polycarbonate
membrane insert for 24-well plates (Cat. No. 734-1574) – Operetta CLS™ HCS system – Confocal microscope
METHODS
– GrowDex solution for membrane coating – Pre-warm Complete PneumaCult™ Ex Plus medium in a water bath at 37 °C. To seed NHBE or SAE cells upside-down in the Transwell inserts, a 0,5% GrowDex solution is used. Thus, for preparing 1 ml of 0,5% GrowDex, 333 µl of 1,5% stock solution is gently mixed with 567 µl of pre-warmed cell
14 bioMarke - Focusing on Life Science | 2021 | vwr.com
culture medium and 100 µl of cell suspension (1x10⁷ cells/ml)
– Mix components gently by pipetting up and down and try to avoid air bubbles
– Upside-down seeding of NHBE or SAE cells in GrowDex – 1x10⁵ cells are seeded per Transwell insert in 100 µl of 0,5% GrowDex
– Transwell inserts are secured in 6-well plates upside-down by taping the overlaying edge to the bottom of the plate. Do not touch the membranes facing upwards
– Add 100 µl of 0,5% GrowDex/cell mixture to the membranes (to the underside which is facing upwards)
– For the overnight incubation of upside-down seeded cells, cover cells with medium from the apical side. Avoid formation of air bubbles
– Then flip the Transwell insert with cells in GrowDex to the normal orientation, and place the insert into a single well of a 24-well plate and culture the cells for 3 days under submerged conditions
– Remove medium from the lower compartment to produce Air-Liquid Interface (ALI) and add 250 µl of ALI maintenance medium to the top of the membrane in the centre of the tissue culture insert
– Replace medium every other day – Live cell imaging
– For monitoring the viability and differentiation of the cells, perform live cell imaging by preparing a master mix with Hoechst 33342 (nuclei), WGA-488 (surface structures/cilia), and Mitotracker diluted in D-PBS
– Hoechst 33342 - 2 µg/ml – WGA-488 - 5 µg/ml – Mitotracker in far red - 100 to 500 µg/ml
– Add 50 to 100 µl of the master mix to the bottom of a glass bottom dish
– Transfer a Transwell insert with GrowDex culture directly to the master mix dish
– Imaging can be started immediately, but fluorescence intensities increase with time
– Transwell inserts can be transferred to imaging plates without cutting the membrane, and after microscopy they can be taken back into the culture without any harm to the cells
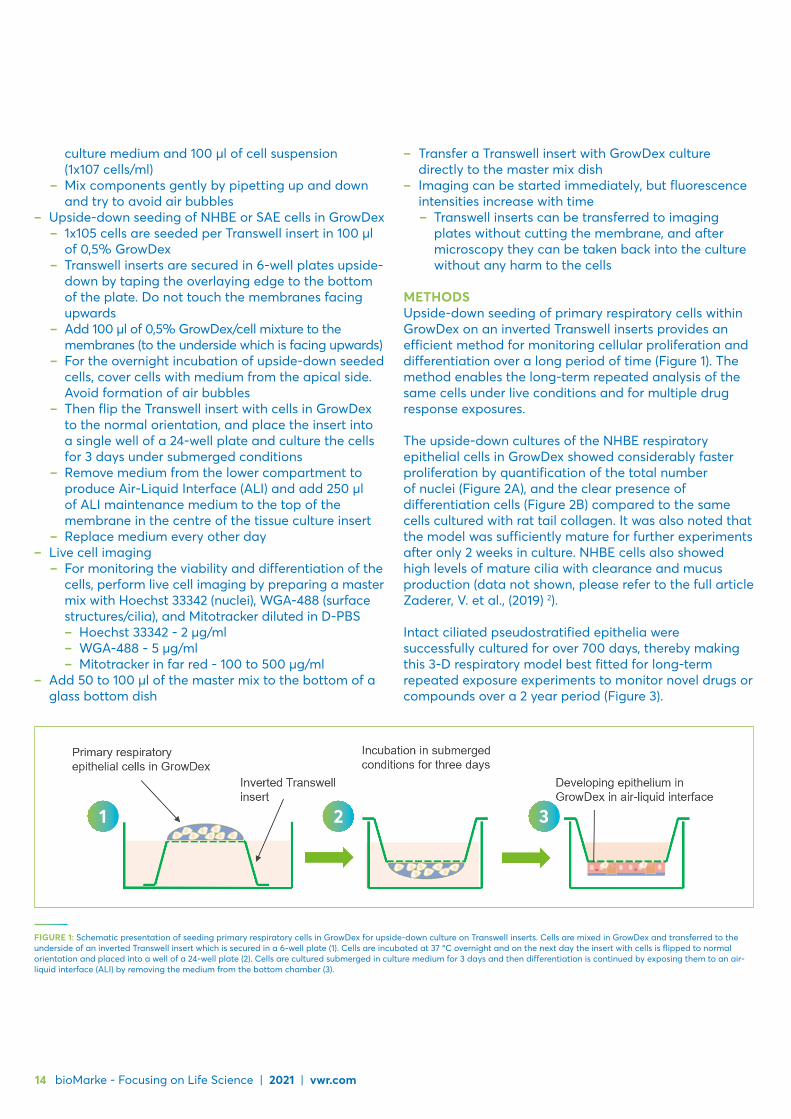
METHODSUpside-down seeding of primary respiratory cells within GrowDex on an inverted Transwell inserts provides an efficient method for monitoring cellular proliferation and differentiation over a long period of time (Figure 1). The method enables the long-term repeated analysis of the same cells under live conditions and for multiple drug response exposures.
The upside-down cultures of the NHBE respiratory epithelial cells in GrowDex showed considerably faster proliferation by quantification of the total number of nuclei (Figure 2A), and the clear presence of differentiation cells (Figure 2B) compared to the same cells cultured with rat tail collagen. It was also noted that the model was sufficiently mature for further experiments after only 2 weeks in culture. NHBE cells also showed high levels of mature cilia with clearance and mucus production (data not shown, please refer to the full article Zaderer, V. et al., (2019) 2).
Intact ciliated pseudostratified epithelia were successfully cultured for over 700 days, thereby making this 3-D respiratory model best fitted for long-term repeated exposure experiments to monitor novel drugs or compounds over a 2 year period (Figure 3).
FIGURE 1: Schematic presentation of seeding primary respiratory cells in GrowDex for upside-down culture on Transwell inserts. Cells are mixed in GrowDex and transferred to the underside of an inverted Transwell insert which is secured in a 6-well plate (1). Cells are incubated at 37 °C overnight and on the next day the insert with cells is flipped to normal orientation and placed into a well of a 24-well plate (2). Cells are cultured submerged in culture medium for 3 days and then differentiation is continued by exposing them to an air-liquid interface (ALI) by removing the medium from the bottom chamber (3).
1 2 3

vwr.com | 2021 | bioMarke - Focusing on Life Science 15
FIGURE 2: A) Quantitative analysis of cell nuclei in GrowDex and rat tail collagen on day 15 post-ALI. Differentiated cells revealed a significantly higher cell number in GrowDex. Analysis was performed on images taken from five independent regions of two Transwell inserts using Operetta CLS imaging system. B) SEM image of differentiating NHBE cells in GrowDex.
CONCLUSIONSThe protocol and data presented here shows the successful development of an advanced animal-free and optimised long-term 3-D respiratory cell model, where NHBE cells are cultured towards a polarised, fully differentiated epithelium, whilst culture conditions allow for monitoring cell differentiation and repeated dose drug responses. Such cultured 3-D models offer an excellent platform for host-pathogen interaction or drug efficacy studies. Without animal-derived materials in the system, unspecific or cross-species reactivity, and matrix batch related variations can be avoided. Furthermore, the system allows repeated analysis of the same cultures as the complete Transwell insert can be transferred for live cell imaging, and then returned to its original plate
for further cultivation. Additionally, it is possible to simply add any desired immune cells into the upper chamber of the insert whilst applying a stimulus directly into the lower chamber or glass bottom dish to monitor real time immune cell behaviour upon activation. Also, for more detailed downstream analysis of the cells e.g. with flow cytometry, it is important to be able harvest the cells from the culture matrix. GrowDex hydrogel can be easily digested by using cellulase enzyme - GrowDase, without affecting the cells.
In summary, culturing human-derived respiratory epithelial primary cells in GrowDex hydrogel in the presented upside-down set-up, not only enables the extended culture of the cells for over 700 days, but also facilitates live cell analyses of the same cells in repeated dose experiments with drug compounds, whilst allowing for the development of the model into a more complex system with the addition of relevant immune cells and subsequent experimental readouts. This system forms a robust platform for respiratory disease research, host-pathogen interaction studies, as well as for drug efficacy screens.
REFERENCES1. Autengruber, A., et al. (2012). "Impact of enzymatic
tissue disintegration on the level of surface molecule expression and immune cell function." European journal of microbiology & immunology 2(2): p. 112-120.
2. Zaderer, V., et al. (2019). "Turning the World Upside-Down in Cellulose for Improved Culturing and Imaging of Respiratory Challenges within a Human 3D Model." Cells 8(10): p. 1292.
FIGURE 3: Epithelial integrity of upside-down cultured NHBE cells in GrowDex after 700 d culture. Cilia of the cells were stained using WGA-488 (green), cytoskeleton using Phalloidin-Alexa555 (yellow), and nuclei using Höchst (blue).
A
B

DOWNLOAD YOUR COPYVWR.COM
Cell culture solutions from AvantorIncludes chapters covering plastics, reagents, filtration, liquid handling, cryopreservation and equipment
vwr.com | 2021 | bioMarke - Focusing on Life Science 17
Maximise performance with HyClone media and supplementsBoost performance, strengthen results
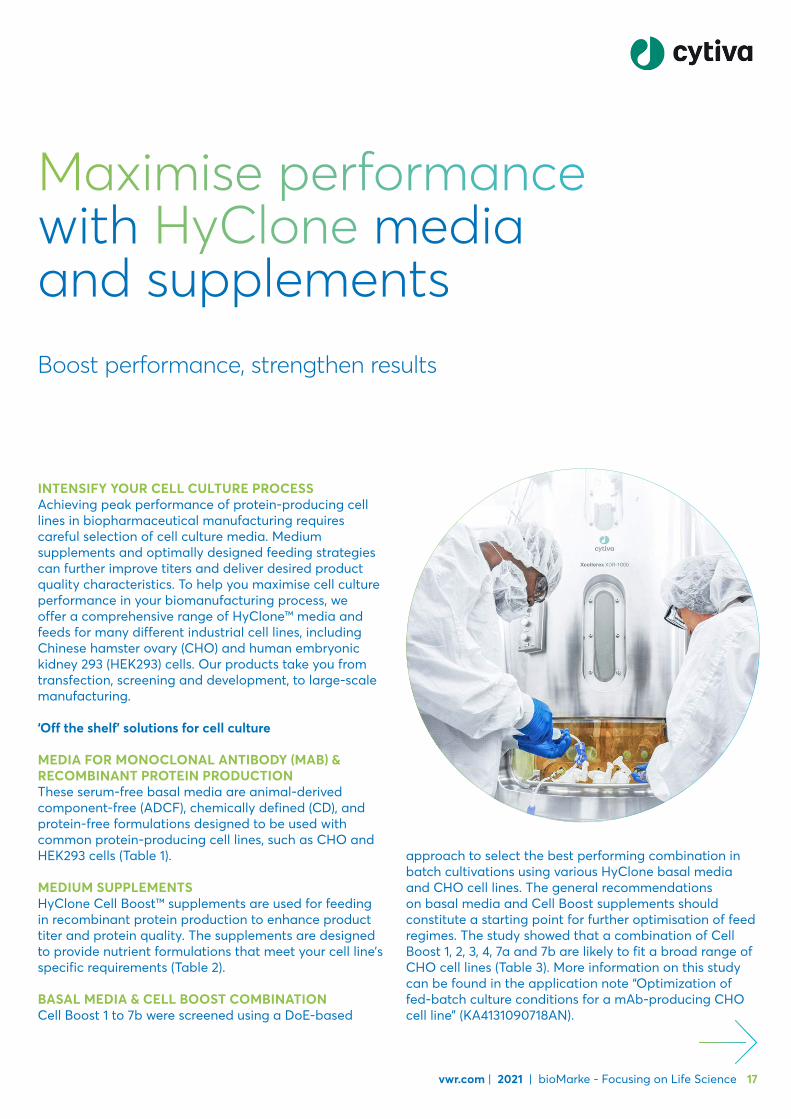
INTENSIFY YOUR CELL CULTURE PROCESSAchieving peak performance of protein-producing cell lines in biopharmaceutical manufacturing requires careful selection of cell culture media. Medium supplements and optimally designed feeding strategies can further improve titers and deliver desired product quality characteristics. To help you maximise cell culture performance in your biomanufacturing process, we offer a comprehensive range of HyClone™ media and feeds for many different industrial cell lines, including Chinese hamster ovary (CHO) and human embryonic kidney 293 (HEK293) cells. Our products take you from transfection, screening and development, to large-scale manufacturing.
‘Off the shelf’ solutions for cell culture
MEDIA FOR MONOCLONAL ANTIBODY (MAB) & RECOMBINANT PROTEIN PRODUCTIONThese serum-free basal media are animal-derived component-free (ADCF), chemically defined (CD), and protein-free formulations designed to be used with common protein-producing cell lines, such as CHO and HEK293 cells (Table 1).
MEDIUM SUPPLEMENTSHyClone Cell Boost™ supplements are used for feeding in recombinant protein production to enhance product titer and protein quality. The supplements are designed to provide nutrient formulations that meet your cell line’s specific requirements (Table 2).
BASAL MEDIA & CELL BOOST COMBINATIONCell Boost 1 to 7b were screened using a DoE-based
approach to select the best performing combination in batch cultivations using various HyClone basal media and CHO cell lines. The general recommendations on basal media and Cell Boost supplements should constitute a starting point for further optimisation of feed regimes. The study showed that a combination of Cell Boost 1, 2, 3, 4, 7a and 7b are likely to fit a broad range of CHO cell lines (Table 3). More information on this study can be found in the application note “Optimization of fed-batch culture conditions for a mAb-producing CHO cell line” (KA4131090718AN).

18 bioMarke - Focusing on Life Science | 2021 | vwr.com
Cell type SFM ADCF CD Protein-free**Recombinant protein
Growth factors (peptides) Hydrolysates
Hypoxanthine/thymidine
Lipids/cholesterol
Poloxamer 188
Cat. No. powder
Cat. No. liquid
CHO*ActiPro™ • • •
Powder and liquid SH31037 SH31039
ActiSM™ • • •Powder and liquid SH31038
CDM4CHO • • • • • Liquid SH30556SH30557/ SH30558
HyCell™ CHO • • • • • • Liquid SH30933 SH30934
SFM4CHO • • • • Liquid SH30518SH30549/ SH30548
SFM4CHO-Utility • • • Liquid SH30517 SH30516PF-CHO LS • • • • Liquid N/A SH30359PF-CHO MPS • • • • N/A SH30333 N/ACDM4NS0 • • • • • Liquid SH30578 SH30579CDM4PERMAb • • • • • • Liquid SH30872 SH30871
HEK293 CDM4HEK293 • • • • Liquid SH30859 SH30858Hybridoma/myeloma*** ADCF-MAb • • • • • Liquid SH30635
SH30349/ SH30547
CDM4MAb • • • • • Liquid SH30800SH30801/ SH30802
CDM4NS0 • • • • • Liquid SH30578 SH30579
SFM4MAb • • •Powder and liquid SH30535
SH30391/ SH30513
PF-MAb • • • N/A N/A SH30138PER.C6™ CDM4PERMAb • • • • • • Liquid SH30872 SH30871
TABLE 1: Composition of serum-free media (SFM) for mAb and recombinant protein production.
* CHO cell media are for CHO-K1, CHO-M, CHO-S, DG44, DUXB11, GS-CHO and other CHO-derived cell lines.** Hybridoma/myeloma media is for cell lines such as NS0, Sp2/0 and P3-derived hybridomas.*** Protein-free media do not contain any proteins of molecular weight >Mr 10 000.
Supplement Cell type Amino acids Vitamins Glucose Trace elementsGrowth factors (peptides)
Hypoxanthine/thymidine ADCF lipids
ADCF cholesterol Cat. No.
Cell Boost 1 CHO, HEK293 • • • SH30584Cell Boost 2 CHO, PER.C6 • • SH30596
Cell Boost 3Hybridoma, myeloma • • • • • SH30825
Cell Boost 4 CHO • • • • • • • SH30857
Cell Boost 5CHO, HEK293, Hybridoma, NS0 • • • • • • • • SH30865
Cell Boost 6
CHO, HEK293, Hybridoma, NS0, T-cells • • • • • • • • SH30866
Cell Boost 7a CHO • • • • SH31026Cell Boost 7b CHO • SH31027
TABLE 2: Composition of Cell Boost supplements.
Basal media Cell Boost 1 Cell Boost 2 Cell Boost 3 Cell Boost 4 Cell Boost 7a Cell Boost 7b
CHO-S (mAb 7) ActiPro* + +CDM4PERMAb + + + + +CDM4MAb + + +
DG44 (mAb 5) ActiPro + + +CDM4NSO + + + + +
CHO-M ActiPro + + + +CDM4NSO + + + +
TABLE 3: The suitability for use of selected Cell Boost supplements with various CHO cell lines.
+ Good performance.* No screening of Cell Boost 1 to 7b performed: recommendation on Cell Boost 7a and 7b for ActiPro is based on product description and previous studies.
vwr.com | 2021 | bioMarke - Focusing on Life Science 19
MEDIA FOR VACCINE & VIRAL VECTOR PRODUCTION
Cell type SFM ADCF CD Protein-free*Recombinant protein
Growth factors (peptides) Hydrolysates
Hypoxanthine/thymidine
Lipids/cholesterol
Poloxamer 188
Cat. No. powder
Cat. No. liquid
EB66 CDM4Avian • • • • Liquid SH31035 SH31036HEK293 CDM4HEK293 • • • • Liquid SH30859 SH30858
SFM4HEK293 • • • • • • Liquid SH30522 SH30521Sf9, Sf21,High Five™ SFM4Insect • • •
Powder and liquid SH30912 SH30913
SFX-Insect • • Liquid SH30350 SH30278TMN-FH • N/A N/A SH30280
PER.C6 CDM4PERMAb • • • • • • Liquid SH30872 SH30871CDM4Retino • • • • • • Liquid SH30519 SH30520
Vero, COS-7, MDCK, MDBK SFM4MegaVir • • • • • N/A SH30587 N/A
* Protein-free media does not contain any proteins of molecular weight >M 10 000.
TABLE 4: Composition of media for vaccines and viral vectors.
Cell type SFM ADCFRecombinant protein
Growth factors (peptides)
Hypoxanthine/thymidine Lipids/cholesterol Poloxamer 188 Cat. No. powder Cat. No. liquid
CHO HyCell TransFx-C* • • • • • N/A SH30942 SH30941HEK293 HyCell TransFx-H* • • • • • N/A SH30944 SH30939
SFM4Transfx-293** • • • Liquid SH30861 SH30860
* Developed for transient transfection and recombinant protein production.** Developed for stable transfection and transfection of lentiviral and adenoviral constructs and production of virus. your large-scale manufacturing needs, the media can be custom manufactured in lot sizes up to 10 000 L for liquid and 6500 kg for powder (density dependent). If you prefer a customised medium formulation, ask about our Fast Trak medium development and optimisation services.
TABLE 5: Composition of transfection media.
Cytiva is a global provider of biomanufacturing solutions. Our medium and supplement manufacturing operations are part of our holistic security of supply programme, based on the three pillars of supply chain sustainability, business continuity and communication.
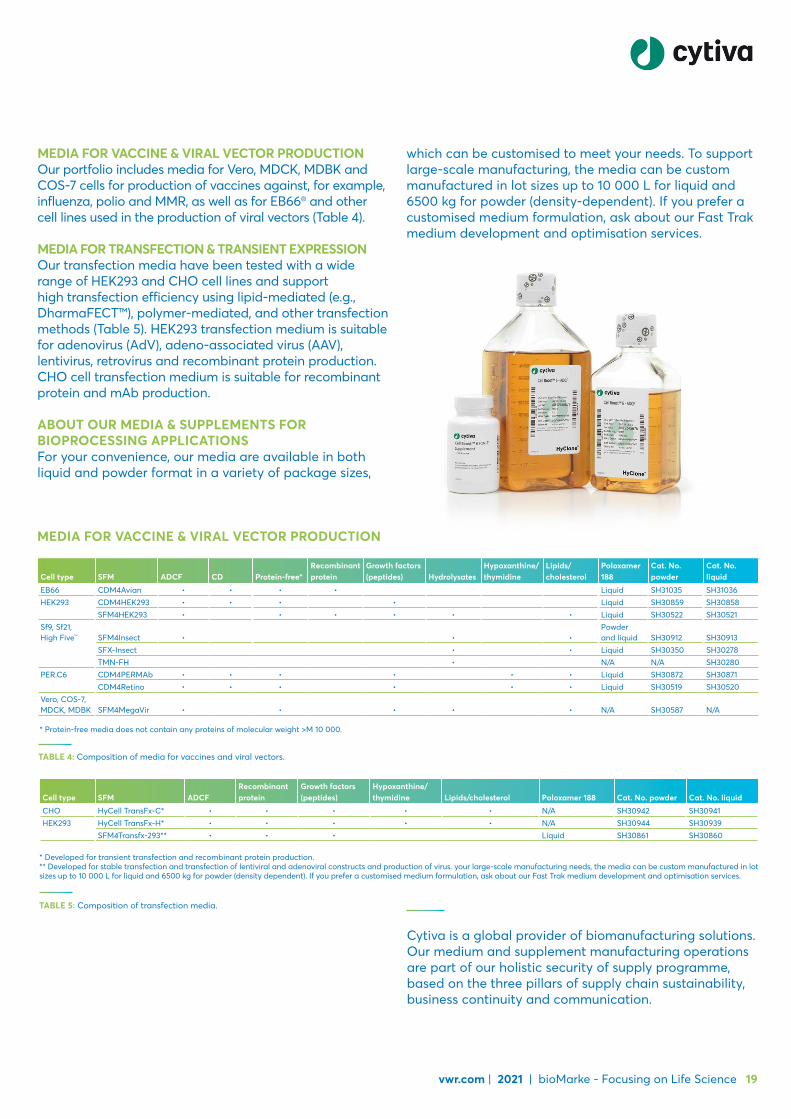
MEDIA FOR VACCINE & VIRAL VECTOR PRODUCTIONOur portfolio includes media for Vero, MDCK, MDBK and COS-7 cells for production of vaccines against, for example, influenza, polio and MMR, as well as for EB66® and other cell lines used in the production of viral vectors (Table 4).
MEDIA FOR TRANSFECTION & TRANSIENT EXPRESSIONOur transfection media have been tested with a wide range of HEK293 and CHO cell lines and support high transfection efficiency using lipid-mediated (e.g., DharmaFECT™), polymer-mediated, and other transfection methods (Table 5). HEK293 transfection medium is suitable for adenovirus (AdV), adeno-associated virus (AAV), lentivirus, retrovirus and recombinant protein production. CHO cell transfection medium is suitable for recombinant protein and mAb production.
ABOUT OUR MEDIA & SUPPLEMENTS FOR BIOPROCESSING APPLICATIONSFor your convenience, our media are available in both liquid and powder format in a variety of package sizes,
which can be customised to meet your needs. To support large-scale manufacturing, the media can be custom manufactured in lot sizes up to 10 000 L for liquid and 6500 kg for powder (density-dependent). If you prefer a customised medium formulation, ask about our Fast Trak medium development and optimisation services.

20 bioMarke - Focusing on Life Science | 2021 | vwr.com
Advantages of UpCell™ surface over trypsin for preserving cell viability and expression of cell surface antigens
In cell culture, the process of removing cells from a culture substrate, also known as dissociation, is most often accomplished by treatment with a proteolytic enzyme like trypsin. Treatment with trypsin, however, can impact the expression of proteins on the cell surface and may compromise cell health 1. To avoid such damage and to improve the quality of harvested cells, dissociation via trypsin can be eliminated by using Thermo Scientific™ Nunc™ dishes with UpCell surface. The UpCell surface, which transitions from hydrophobic to hydrophilic as temperature drops from 37 to below 32 °C, enables the harvest of adherent cells with high viability and intact surface proteins.
In this study, we examined the effect of dissociation using 0,25% trypsin-EDTA and the UpCell surface on the viability and expression of cell surface antigens in cultured mesenchymal stromal cells (MSCs), HT-29 colorectal. cancer cells, and RAW 264.7 macrophages.
MATERIALS & METHODSCell cultureAll cells types were cultured on Thermo Scientific™ Nunc™ EasYDish™ dishes with Nunclon Delta™ surface (Cat. No. 734-3255) or Nunc™ dishes with UpCell™ surface (Cat. No. 734-2383). Gibco™ StemPro™ bone marrow MSCs were cultured in Gibco™ MesenPRO RS™ medium with the included growth supplement. HT-29 cells were grown in Gibco™ McCoy’s 5A medium (Cat. No. 733-1705) with 10% Gibco™ Foetal Bovine Serum (Cat. No. 89510-198) and 1% Gibco™ Penicillin-Streptomycin (Cat. No. 516104-20), as recommended by ATCC. RAW 264.7 cells were grown in Gibco™ DMEM (Cat. No. 733-1726) with 10% Foetal Bovine Serum and 1% Penicillin-Streptomycin, as recommended by ATCC.
Harvest of cells from the Nunclon Delta surface using trypsinisationNon adherent cells were removed by washing the culture dishes with Gibco™ DPBS, no calcium, no magnesium (Cat. No. LONZ17-512F). Then, 2 ml of Gibco™ Trypsin-EDTA (0,25%, Cat. No. L0932-100) was added to the dishes followed by incubation at 37 °C. MesenPRO RS medium, McCoy’s 5A medium, or DMEM (5 ml) was added to the appropriate dishes to neutralise trypsin. Detachment time was noted, cells were harvested, and cell viability and density were determined using the Invitrogen™ Countess™ II Automated Cell Counter).
Harvest of cells from the UpCell surface using temperature reduction Medium was aspirated from the dishes, which were then washed once with DPBS, no calcium, no magnesium.MesenPRO RS medium, McCoy’s 5A medium, or DMEM (3 ml) was added to the appropriate dishes. Cultures were incubated at approximately 4 °C in a refrigerator, and time taken for cell detachment was noted. Cells were then collected, and cell viability and density were determined using the Countess II Automated Cell Counter.
Flow cytometry analysisCells harvested under different conditions were washed and resuspended in 1 ml of 1X Gibco™ PBS (Cat. No. 733-1644). Primary antibodies and corresponding isotype control antibodies were added at the recommended concentrations to the cells, followed by incubation at 4 °C for 30 minutes in the dark. Invitrogen™ eBioscience™ eFluor™ 450 Fixable Viability dye was added at 1:1000 dilution to the cell suspension as well. Cells were then washed using 1 ml 1X PBS and resuspended in 1 ml flow cytometry staining buffer followed by data acquisition.
Nunclon Delta surface UpCell surface
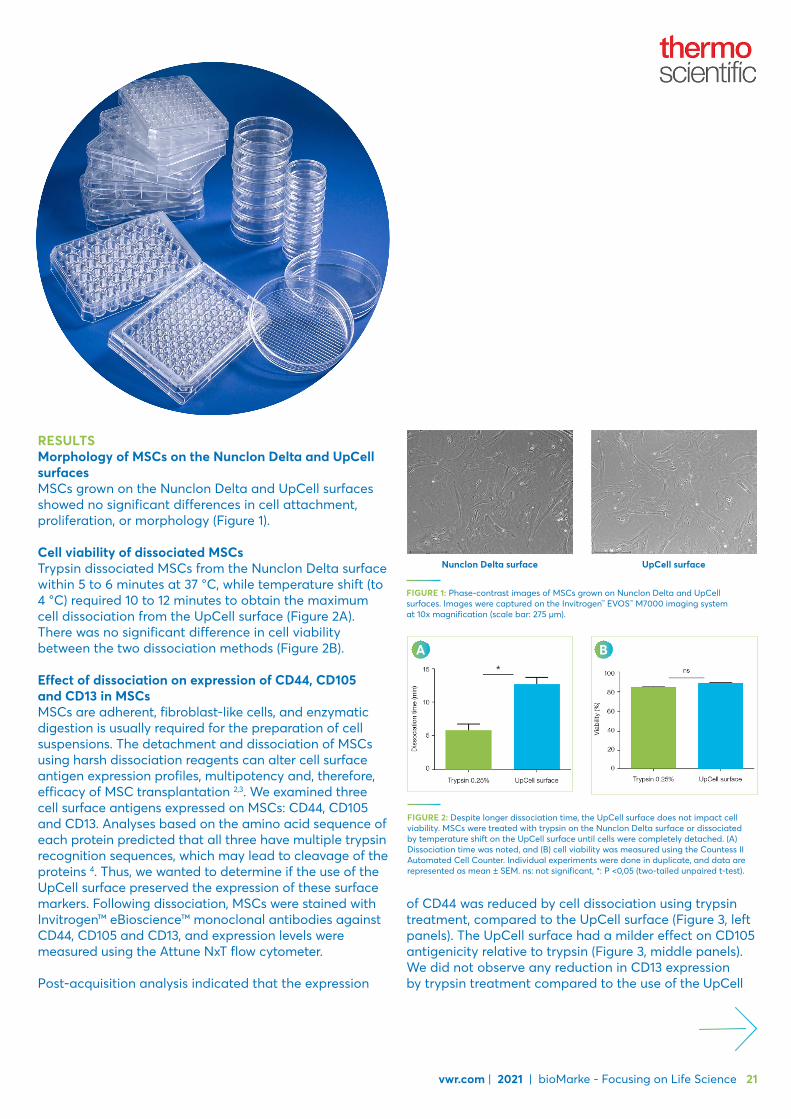
FIGURE 1: Phase-contrast images of MSCs grown on Nunclon Delta and UpCell surfaces. Images were captured on the Invitrogen™ EVOS™ M7000 imaging system at 10x magnification (scale bar: 275 µm).
A B
FIGURE 2: Despite longer dissociation time, the UpCell surface does not impact cell viability. MSCs were treated with trypsin on the Nunclon Delta surface or dissociated by temperature shift on the UpCell surface until cells were completely detached. (A) Dissociation time was noted, and (B) cell viability was measured using the Countess II Automated Cell Counter. Individual experiments were done in duplicate, and data are represented as mean ± SEM. ns: not significant, *: P <0,05 (two-tailed unpaired t-test).
vwr.com | 2021 | bioMarke - Focusing on Life Science 21
RESULTSMorphology of MSCs on the Nunclon Delta and UpCell surfacesMSCs grown on the Nunclon Delta and UpCell surfaces showed no significant differences in cell attachment, proliferation, or morphology (Figure 1).
Cell viability of dissociated MSCsTrypsin dissociated MSCs from the Nunclon Delta surface within 5 to 6 minutes at 37 °C, while temperature shift (to 4 °C) required 10 to 12 minutes to obtain the maximum cell dissociation from the UpCell surface (Figure 2A). There was no significant difference in cell viability between the two dissociation methods (Figure 2B).
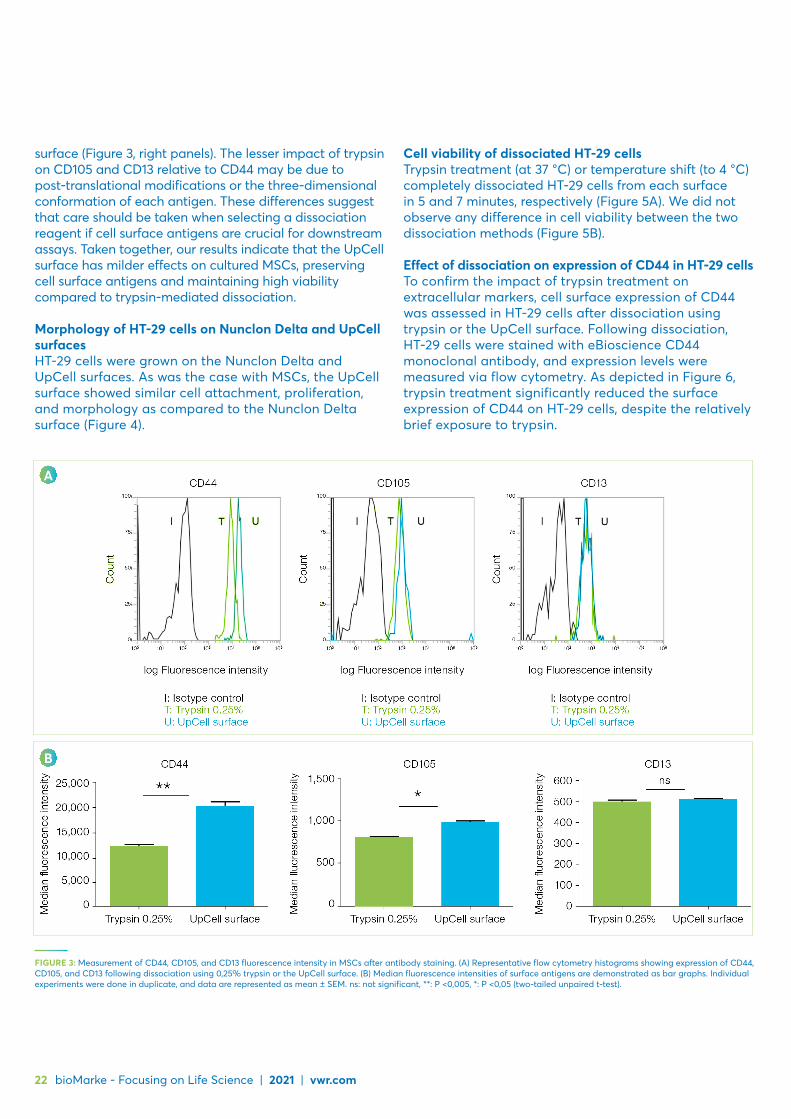
Effect of dissociation on expression of CD44, CD105 and CD13 in MSCsMSCs are adherent, fibroblast-like cells, and enzymatic digestion is usually required for the preparation of cell suspensions. The detachment and dissociation of MSCs using harsh dissociation reagents can alter cell surface antigen expression profiles, multipotency and, therefore, efficacy of MSC transplantation 2,3. We examined three cell surface antigens expressed on MSCs: CD44, CD105 and CD13. Analyses based on the amino acid sequence of each protein predicted that all three have multiple trypsin recognition sequences, which may lead to cleavage of the proteins 4. Thus, we wanted to determine if the use of the UpCell surface preserved the expression of these surface markers. Following dissociation, MSCs were stained with Invitrogen™ eBioscience™ monoclonal antibodies against CD44, CD105 and CD13, and expression levels were measured using the Attune NxT flow cytometer.
Post-acquisition analysis indicated that the expression
of CD44 was reduced by cell dissociation using trypsin treatment, compared to the UpCell surface (Figure 3, left panels). The UpCell surface had a milder effect on CD105 antigenicity relative to trypsin (Figure 3, middle panels). We did not observe any reduction in CD13 expression by trypsin treatment compared to the use of the UpCell
A
B
FIGURE 3: Measurement of CD44, CD105, and CD13 fluorescence intensity in MSCs after antibody staining. (A) Representative flow cytometry histograms showing expression of CD44, CD105, and CD13 following dissociation using 0,25% trypsin or the UpCell surface. (B) Median fluorescence intensities of surface antigens are demonstrated as bar graphs. Individual experiments were done in duplicate, and data are represented as mean ± SEM. ns: not significant, **: P <0,005, *: P <0,05 (two-tailed unpaired t-test).
22 bioMarke - Focusing on Life Science | 2021 | vwr.com
surface (Figure 3, right panels). The lesser impact of trypsin on CD105 and CD13 relative to CD44 may be due to post-translational modifications or the three-dimensional conformation of each antigen. These differences suggest that care should be taken when selecting a dissociation reagent if cell surface antigens are crucial for downstream assays. Taken together, our results indicate that the UpCell surface has milder effects on cultured MSCs, preserving cell surface antigens and maintaining high viability compared to trypsin-mediated dissociation.
Morphology of HT-29 cells on Nunclon Delta and UpCell surfacesHT-29 cells were grown on the Nunclon Delta and UpCell surfaces. As was the case with MSCs, the UpCell surface showed similar cell attachment, proliferation, and morphology as compared to the Nunclon Delta surface (Figure 4).
Cell viability of dissociated HT-29 cellsTrypsin treatment (at 37 °C) or temperature shift (to 4 °C) completely dissociated HT-29 cells from each surface in 5 and 7 minutes, respectively (Figure 5A). We did not observe any difference in cell viability between the two dissociation methods (Figure 5B).
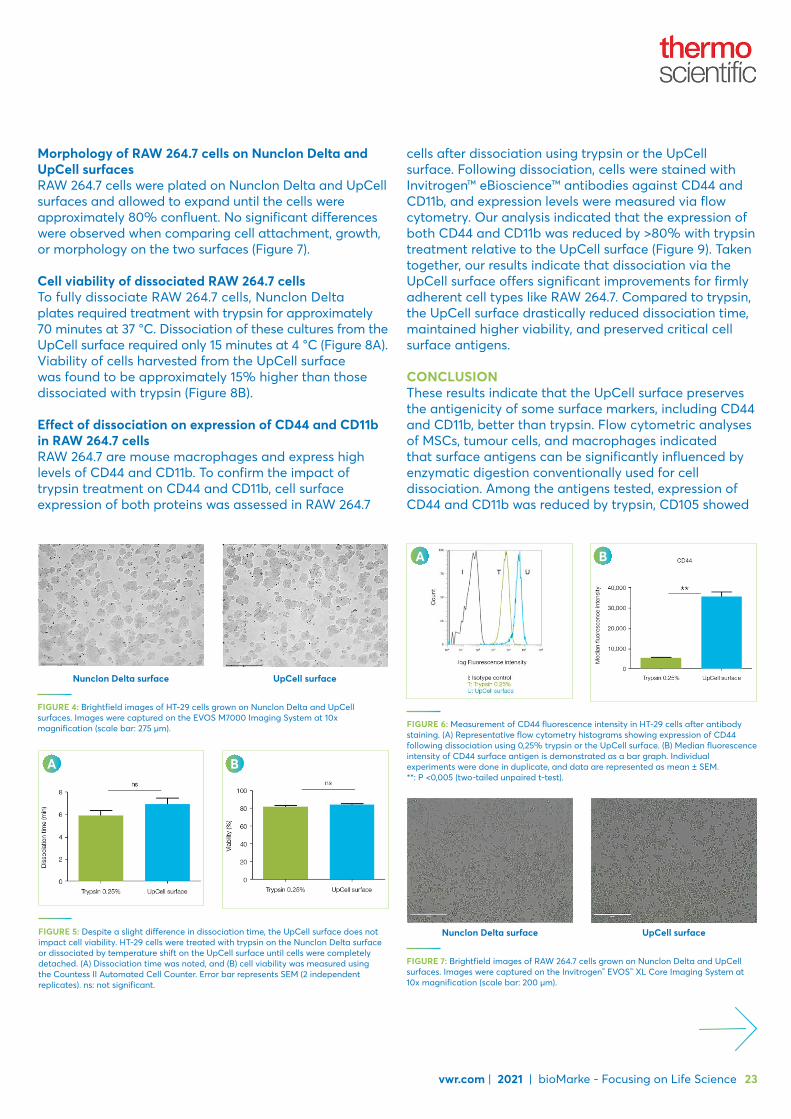
Effect of dissociation on expression of CD44 in HT-29 cellsTo confirm the impact of trypsin treatment on extracellular markers, cell surface expression of CD44 was assessed in HT-29 cells after dissociation using trypsin or the UpCell surface. Following dissociation, HT-29 cells were stained with eBioscience CD44 monoclonal antibody, and expression levels were measured via flow cytometry. As depicted in Figure 6, trypsin treatment significantly reduced the surface expression of CD44 on HT-29 cells, despite the relatively brief exposure to trypsin.
Nunclon Delta surface UpCell surface
FIGURE 4: Brightfield images of HT-29 cells grown on Nunclon Delta and UpCell surfaces. Images were captured on the EVOS M7000 Imaging System at 10x magnification (scale bar: 275 µm).
A B
FIGURE 5: Despite a slight difference in dissociation time, the UpCell surface does not impact cell viability. HT-29 cells were treated with trypsin on the Nunclon Delta surface or dissociated by temperature shift on the UpCell surface until cells were completely detached. (A) Dissociation time was noted, and (B) cell viability was measured using the Countess II Automated Cell Counter. Error bar represents SEM (2 independent replicates). ns: not significant.
Nunclon Delta surface UpCell surface
FIGURE 7: Brightfield images of RAW 264.7 cells grown on Nunclon Delta and UpCell surfaces. Images were captured on the Invitrogen™ EVOS™ XL Core Imaging System at 10x magnification (scale bar: 200 µm).
A B
FIGURE 6: Measurement of CD44 fluorescence intensity in HT-29 cells after antibody staining. (A) Representative flow cytometry histograms showing expression of CD44 following dissociation using 0,25% trypsin or the UpCell surface. (B) Median fluorescence intensity of CD44 surface antigen is demonstrated as a bar graph. Individual experiments were done in duplicate, and data are represented as mean ± SEM. **: P <0,005 (two-tailed unpaired t-test).
vwr.com | 2021 | bioMarke - Focusing on Life Science 23
Morphology of RAW 264.7 cells on Nunclon Delta and UpCell surfacesRAW 264.7 cells were plated on Nunclon Delta and UpCell surfaces and allowed to expand until the cells were approximately 80% confluent. No significant differences were observed when comparing cell attachment, growth, or morphology on the two surfaces (Figure 7).
Cell viability of dissociated RAW 264.7 cellsTo fully dissociate RAW 264.7 cells, Nunclon Delta plates required treatment with trypsin for approximately 70 minutes at 37 °C. Dissociation of these cultures from the UpCell surface required only 15 minutes at 4 °C (Figure 8A). Viability of cells harvested from the UpCell surface was found to be approximately 15% higher than those dissociated with trypsin (Figure 8B).
Effect of dissociation on expression of CD44 and CD11b in RAW 264.7 cellsRAW 264.7 are mouse macrophages and express high levels of CD44 and CD11b. To confirm the impact of trypsin treatment on CD44 and CD11b, cell surface expression of both proteins was assessed in RAW 264.7
cells after dissociation using trypsin or the UpCell surface. Following dissociation, cells were stained with Invitrogen™ eBioscience™ antibodies against CD44 and CD11b, and expression levels were measured via flow cytometry. Our analysis indicated that the expression of both CD44 and CD11b was reduced by >80% with trypsin treatment relative to the UpCell surface (Figure 9). Taken together, our results indicate that dissociation via the UpCell surface offers significant improvements for firmly adherent cell types like RAW 264.7. Compared to trypsin, the UpCell surface drastically reduced dissociation time, maintained higher viability, and preserved critical cell surface antigens.
CONCLUSIONThese results indicate that the UpCell surface preserves the antigenicity of some surface markers, including CD44 and CD11b, better than trypsin. Flow cytometric analyses of MSCs, tumour cells, and macrophages indicatedthat surface antigens can be significantly influenced by enzymatic digestion conventionally used for celldissociation. Among the antigens tested, expression of CD44 and CD11b was reduced by trypsin, CD105 showed
A B
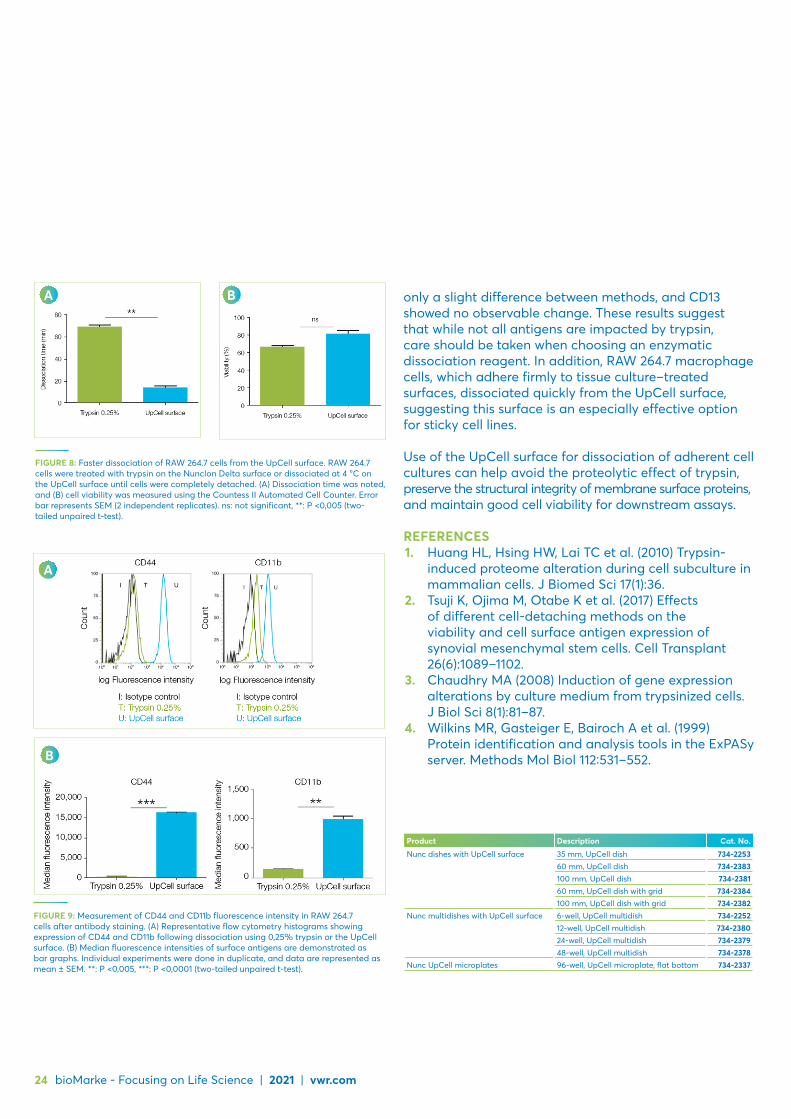
FIGURE 8: Faster dissociation of RAW 264.7 cells from the UpCell surface. RAW 264.7 cells were treated with trypsin on the Nunclon Delta surface or dissociated at 4 °C on the UpCell surface until cells were completely detached. (A) Dissociation time was noted, and (B) cell viability was measured using the Countess II Automated Cell Counter. Error bar represents SEM (2 independent replicates). ns: not significant, **: P <0,005 (two-tailed unpaired t-test).
FIGURE 9: Measurement of CD44 and CD11b fluorescence intensity in RAW 264.7 cells after antibody staining. (A) Representative flow cytometry histograms showing expression of CD44 and CD11b following dissociation using 0,25% trypsin or the UpCell surface. (B) Median fluorescence intensities of surface antigens are demonstrated as bar graphs. Individual experiments were done in duplicate, and data are represented as mean ± SEM. **: P <0,005, ***: P <0,0001 (two-tailed unpaired t-test).
A
B
24 bioMarke - Focusing on Life Science | 2021 | vwr.com
only a slight difference between methods, and CD13 showed no observable change. These results suggest that while not all antigens are impacted by trypsin, care should be taken when choosing an enzymatic dissociation reagent. In addition, RAW 264.7 macrophage cells, which adhere firmly to tissue culture–treated surfaces, dissociated quickly from the UpCell surface, suggesting this surface is an especially effective option for sticky cell lines.
Use of the UpCell surface for dissociation of adherent cell cultures can help avoid the proteolytic effect of trypsin, preserve the structural integrity of membrane surface proteins, and maintain good cell viability for downstream assays.
REFERENCES1. Huang HL, Hsing HW, Lai TC et al. (2010) Trypsin-
induced proteome alteration during cell subculture in mammalian cells. J Biomed Sci 17(1):36.
2. Tsuji K, Ojima M, Otabe K et al. (2017) Effects of different cell-detaching methods on the viability and cell surface antigen expression of synovial mesenchymal stem cells. Cell Transplant 26(6):1089–1102.
3. Chaudhry MA (2008) Induction of gene expression alterations by culture medium from trypsinized cells. J Biol Sci 8(1):81–87.
4. Wilkins MR, Gasteiger E, Bairoch A et al. (1999) Protein identification and analysis tools in the ExPASy server. Methods Mol Biol 112:531–552.
Product Description Cat. No.
Nunc dishes with UpCell surface 35 mm, UpCell dish 734-225360 mm, UpCell dish 734-2383100 mm, UpCell dish 734-238160 mm, UpCell dish with grid 734-2384100 mm, UpCell dish with grid 734-2382
Nunc multidishes with UpCell surface 6-well, UpCell multidish 734-225212-well, UpCell multidish 734-238024-well, UpCell multidish 734-237948-well, UpCell multidish 734-2378
Nunc UpCell microplates 96-well, UpCell microplate, flat bottom 734-2337

Discover and join our Life Science webinars
Not had the chance to join our latest Life Science webinars?
Not a problem!
You and your team can join the recorded webinars and replay them! Visit vwr.com/cms/webinar_lifescience
NO DETECTABLE
METALS
50 TO 70% LESS TOC
30 TO 40% LESS λMAX
ABSORBANCE AT 245 NM
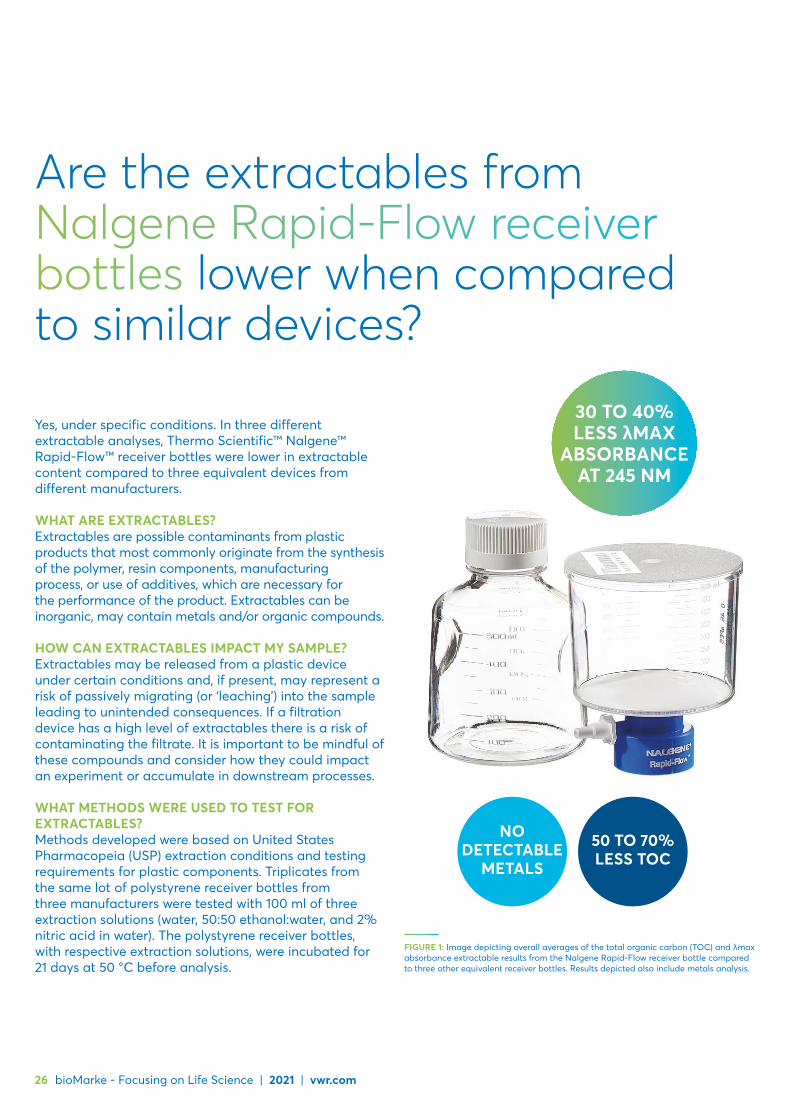
FIGURE 1: Image depicting overall averages of the total organic carbon (TOC) and λmax absorbance extractable results from the Nalgene Rapid-Flow receiver bottle compared to three other equivalent receiver bottles. Results depicted also include metals analysis.
26 bioMarke - Focusing on Life Science | 2021 | vwr.com
Are the extractables from Nalgene Rapid-Flow receiver bottles lower when compared to similar devices?
Yes, under specific conditions. In three different extractable analyses, Thermo Scientific™ Nalgene™ Rapid-Flow™ receiver bottles were lower in extractable content compared to three equivalent devices from different manufacturers.
WHAT ARE EXTRACTABLES?Extractables are possible contaminants from plastic products that most commonly originate from the synthesis of the polymer, resin components, manufacturing process, or use of additives, which are necessary for the performance of the product. Extractables can be inorganic, may contain metals and/or organic compounds.
HOW CAN EXTRACTABLES IMPACT MY SAMPLE?Extractables may be released from a plastic device under certain conditions and, if present, may represent a risk of passively migrating (or ‘leaching’) into the sample leading to unintended consequences. If a filtration device has a high level of extractables there is a risk of contaminating the filtrate. It is important to be mindful of these compounds and consider how they could impact an experiment or accumulate in downstream processes.
WHAT METHODS WERE USED TO TEST FOR EXTRACTABLES?Methods developed were based on United States Pharmacopeia (USP) extraction conditions and testing requirements for plastic components. Triplicates from the same lot of polystyrene receiver bottles from three manufacturers were tested with 100 ml of three extraction solutions (water, 50:50 ethanol:water, and 2% nitric acid in water). The polystyrene receiver bottles, with respective extraction solutions, were incubated for 21 days at 50 °C before analysis.
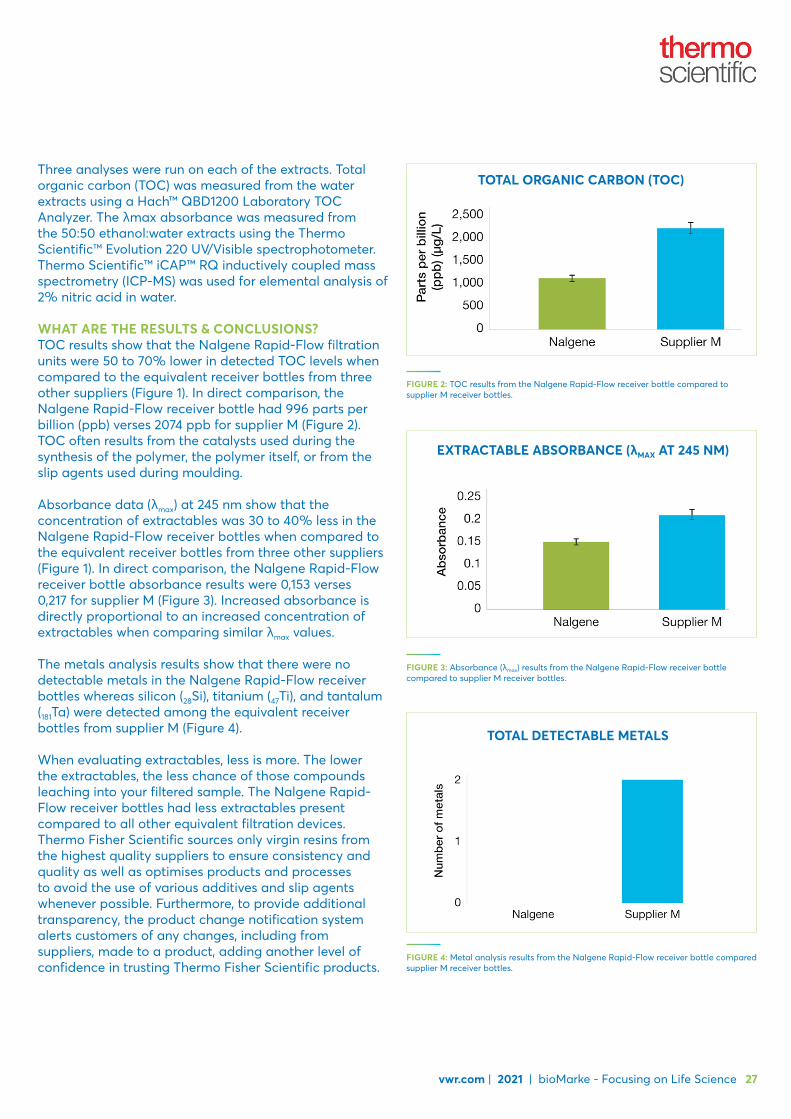
FIGURE 4: Metal analysis results from the Nalgene Rapid-Flow receiver bottle compared supplier M receiver bottles.
TOTAL DETECTABLE METALS
FIGURE 3: Absorbance (λmax) results from the Nalgene Rapid-Flow receiver bottle compared to supplier M receiver bottles.
EXTRACTABLE ABSORBANCE (λMAX AT 245 NM)
FIGURE 2: TOC results from the Nalgene Rapid-Flow receiver bottle compared to supplier M receiver bottles.
TOTAL ORGANIC CARBON (TOC)
vwr.com | 2021 | bioMarke - Focusing on Life Science 27
Three analyses were run on each of the extracts. Total organic carbon (TOC) was measured from the water extracts using a Hach™ QBD1200 Laboratory TOC Analyzer. The λmax absorbance was measured from the 50:50 ethanol:water extracts using the Thermo Scientific™ Evolution 220 UV/Visible spectrophotometer. Thermo Scientific™ iCAP™ RQ inductively coupled mass spectrometry (ICP-MS) was used for elemental analysis of 2% nitric acid in water.
WHAT ARE THE RESULTS & CONCLUSIONS?TOC results show that the Nalgene Rapid-Flow filtration units were 50 to 70% lower in detected TOC levels when compared to the equivalent receiver bottles from three other suppliers (Figure 1). In direct comparison, the Nalgene Rapid-Flow receiver bottle had 996 parts per billion (ppb) verses 2074 ppb for supplier M (Figure 2). TOC often results from the catalysts used during the synthesis of the polymer, the polymer itself, or from the slip agents used during moulding.
Absorbance data (λmax) at 245 nm show that the concentration of extractables was 30 to 40% less in the Nalgene Rapid-Flow receiver bottles when compared to the equivalent receiver bottles from three other suppliers (Figure 1). In direct comparison, the Nalgene Rapid-Flow receiver bottle absorbance results were 0,153 verses 0,217 for supplier M (Figure 3). Increased absorbance is directly proportional to an increased concentration of extractables when comparing similar λmax values.
The metals analysis results show that there were no detectable metals in the Nalgene Rapid-Flow receiver bottles whereas silicon (28Si), titanium (47Ti), and tantalum (181Ta) were detected among the equivalent receiver bottles from supplier M (Figure 4).
When evaluating extractables, less is more. The lower the extractables, the less chance of those compounds leaching into your filtered sample. The Nalgene Rapid-Flow receiver bottles had less extractables present compared to all other equivalent filtration devices. Thermo Fisher Scientific sources only virgin resins from the highest quality suppliers to ensure consistency and quality as well as optimises products and processes to avoid the use of various additives and slip agents whenever possible. Furthermore, to provide additional transparency, the product change notification system alerts customers of any changes, including from suppliers, made to a product, adding another level of confidence in trusting Thermo Fisher Scientific products.

FIGURE 1: S. venezuelae plated (left panel). The intelligent software module detects desired colonies based on user-defined criteria (middle and right panels, yellow outlined colonies), and rejects colonies that do not meet the selection metrics (middle and right panels, red outlined colonies).
28 bioMarke - Focusing on Life Science | 2021 | vwr.com
Easy picking with the QPix™ 400 - multiple selection modalities, wide range of microorganisms
Whether you’re trying to discover the next generation of antibiotics, selecting clones for sequencing, or turning micro algae into biofuel production factories, chances are you’ll need to screen thousands, maybe even millions of colonies to find the best ones again and again. And not just screen, but plate and replicate.
Automated colony pickers can simplify and speed these laborious processes, but what if you need to screen instead of select, choosing colonies based on morphology instead of just the ability to grow on restrictive media? What if you’re working with a microbe other than E. coli? With the QPix 400 series of microbial colony pickers, you can do all that—morphology-based colony picking, plating and plate replication of bacteria, fungi, algae, phage and yeast cells.
QPix 400 colony pickers support a wide variety of microorganisms and multiple selection modalities, including fluorescence intensity, blue/white selection, size and proximity and zone of inhibition—you set the selection parameters and the instrument does the work.
COLONY SELECTION WORKFLOW Whatever your selection modality, setting selection parameters for any QPix 400 colony picker follows the same general workflow—open the QPix software and define your colony selection parameters, such as size, compactness and other morphological features. For Zone of Inhibition detection, set your parameters in the Zone of Inhibition Detection Module. Colonies are detected by white light and, if desired, further selected using fluorescence intensity.
COLONY SELECTION IN WHITE LIGHTSelection of colonies visualised in white light is a typical
first step for most studies using the QPix colony picker. In this example, Streptomyces venezuelae was plated, incubated at 37 °C overnight, and colonies selected in white light. The intelligent software module analyses the images, and colonies that meet the user-defined selection criteria are outlined in yellow and then picked (Figure 1). Colonies that do not meet the selection criteria are highlighted in red.
COLONY SELECTION BY FLUORESCENCEWith fluorescence-based selection downstream processing time can be significantly reduced through earlier selection of high value targets (Figure 2). Using appropriate fluorescent markers, morphological and functional screens can be combined in the automated selection phase, saving time and resources by requiring fewer colonies to be further screened and characterised in a downstream functional assay.
An example of fluorescence-based functional selection can be seen in this experiment where Nile Red, a lipophilic fluorescent dye, was used to select high lipid-producing strains of Rhodococcus opacus PD630 for biofuel production. Colonies with higher lipid content show correspondingly higher fluorescence intensities.

FIGURE 2: Fluorescent selection saves screening time by focusing downstream assays and screening on high value targets.
FIGURE 3: Fluorescence-based quantification that is reflective of lipid accumulation enables objective colony selection on QPix 400 system..
FIGURE 4: Fluorescence reading of high lipid producing colonies and negative control group stained with BODIPY 505/515 lipophilic fluorescent dye on the SpectraMax M5 Multi-Mode microplate reader. High lipid producing colonies exhibited high fluorescence (RFU) values and in contrast the negative colonies exhibited a flat-line signal as depicted in red.
vwr.com | 2021 | bioMarke - Focusing on Life Science 29
For this experiment parameters such as size, diameter and compactness were tuned for optimal colony selection, and a mean fluorescence intensity threshold of greater than 50 000 was set to select (i.e. gate) colonies demonstrating high fluorescence as a result of high lipid accumulation (Figure 3).
Lipid accumulation levels were further confirmed post picking. Following overnight growth in liquid media, cultures were stained with a lipophilic bright green fluorescent dye, BODIPY 505/515 (Life Technologies), at a concentration of 0,5 μg/ml, and fluorescence measurements were recorded on the SpectraMax® M5 Multi-Mode microplate reader. A high degree of fluorescence was confirmed in high lipid-accumulating colonies that were originally selected and picked using the QPix 420 system, while background levels of fluorescence were exhibited by the negative control E. coli colonies (Figure 4, red curve).
COLONY SELECTION BY BLUE/WHITE COLOUR SCREENING Selecting colonies by blue or white colour enables the use of the widely used LacZ reporter system for selecting
recombinant/non recombinant clones. For this example, white light images taken on the QPix 420 System were analysed using the easy to use QPix Software 2.0. Blue (Figure 5A) or white (Figure 5B) colonies were automatically identified and selected separately using the built-in Auto Select feature (Figure 5C). By adjusting the histogram threshold and defining colony selection criteria such as compactness, axis ratio, diameter, and proximity, you can further optimise your selection.
SELECTION OF COLONIES SECRETING ZONES OF INHIBITION For a library-based approach to screening and selection of antibiotic producing organisms, the agar plate-based zone of inhibition or clearing zone detection assay is the method of choice. Colonies providing antimicrobial activity are distinguished from the rest of the population by secreting clearing zones where bacterial growth is inhibited due to secretion of antimicrobial compounds. The diameter of the clearing zone is typically proportional to the amount of antimicrobial compound produced. Thus, high value strains are those that generate the largest clearing zones.
With the Zone of Inhibition Detection module in QPix Software 2.0 or higher, the size of each antimicrobial-producing colony and the size of the clearing zone produced by that colony can both be reliably quantified. You can select colonies that produce the largest clearing zones (Figure 6).
To demonstrate the utility of automated zone of inhibition detection for library-based screening or adaptive evolution studies, QTrays spotted with a library of microbial cultures were screened and selected.

FIGURE 5: (A) Example of blue colonies selected with Auto Select Blue are indicated with blue arrows. (B) Example of white colonies selected with Auto Select White are indicated with white arrows. (C) Flexibility of the software allows manual adjustment of the intensity threshold to optimise results, such as to select for powered blue colonies.
FIGURE 6: The Zone of Inhibition Detection module in QPix Software 2.0 or higher can identify the size of each colony and corresponding clearing zones. Colonies producing clearing zones are selected based on user-defined selection criteria.
FIGURE 7: Library-based high throughput colony screening of zone of inhibition producers for antibiotics discovery. The Zone of Inhibition Detection module in QPix Software 2.0 or higher enables reliable detection and selection of colonies producing clearing zones. Selected colonies producing corresponding clearing zones are highlighted in yellow.
30 bioMarke - Focusing on Life Science | 2021 | vwr.com
From the 48 colonies grown on QTrays, three colonies producing zones of inhibition were reliably detected by the QPix software Zone of Inhibition Detection module (Figure 7), selected and picked.
This approach is amenable to high throughput implementation aimed to screen, identify and pick colonies producing clearing zones from a large microbial library.
PICKING MORE THAN E. COLIRepetitive failure of colony transfer can result in project delays, wasted biomaterials, or the loss of valuable clones. To ensure optimal colony transfer for a diverse range of microorganisms, Molecular Devices offers a unique portfolio of picking pins that come in a variety of shapes, sizes and textures. Each organism-specific pin is designed to meet the designated microbial colony’s shape, stickiness, viscosity, or other characteristic that can impact picking efficiency.
In addition, a proprietary agar height sensor automatically determines the optimal picking height ‘on the fly’, thus enabling optimal transfer and outgrowth of biological materials.
Together, proper pin selection and automated agar height-sensing, enhance microbial colony transfer efficiency by as much as 40% as shown in an example dataset (Figure 8).
The QPix software is also designed to support selection of a wide range of microbial species, as a colony detection algorithm optimised for E. coli may not work optimally when applied to yeast, algae, or other microorganisms with different phenotypic attributes.

FIGURE 8: Colony transfer efficiencies can vary widely according to the pairings between microorganisms and colony-picking pins. A representative dataset is shown for E. coli, Saccharomyces cerevisiae, and S. venezuelae.
FIGURE 9: Morphologically distinct colonies are identified by QPix colony detection algorithms based on user-defined parameters: compactness, axis ratio, size and proximity. Colonies surrounded by yellow border are selected for picking based on the user criteria, while colonies bordered with red fail to meet user-defined criteria and are excluded from picking.
The QPix® 400 Series Microbial Colony Pickers combine intelligent image analysis with precise automation for fast and efficient screening of large libraries. Capable of picking up to 3000 colonies per hour, it will streamline your workflow.
vwr.com | 2021 | bioMarke - Focusing on Life Science 31
The QPix software offers experimental flexibility by automatically identifying and selecting colonies produced from a wide range of microorganisms (Figure 9).
Furthermore, the ability to custom define parameters such as shape, size, and proximity to neighbouring objects, ensures efficient and tailored selection of any colony-forming microorganism, and microorganism-specific pins ensure efficient colony transfer.
SUMMARYThrough sophisticated algorithms, easy to use software with customisable selection criteria, and organism-specific algorithms and accessories, the QPix 400 series of colony pickers is a unique solution where automation is in synergy with life science needs. Colony picking precision and speed, hardware solutions optimised for different organisms, and robust software algorithms offer the flexibility and power to handle any number of screening projects. With the QPix 400, selecting the right colony is easy pickings.
BENEFITS – Fast - up to 30 000 colonies/day, >98% efficiency – Efficient transfer - agar level sensor for automated
picking pin height adjustment – Optimised - organism-specific pins – Target - quantitative, user-defined selection criteria – Smart - intelligent colony selection software
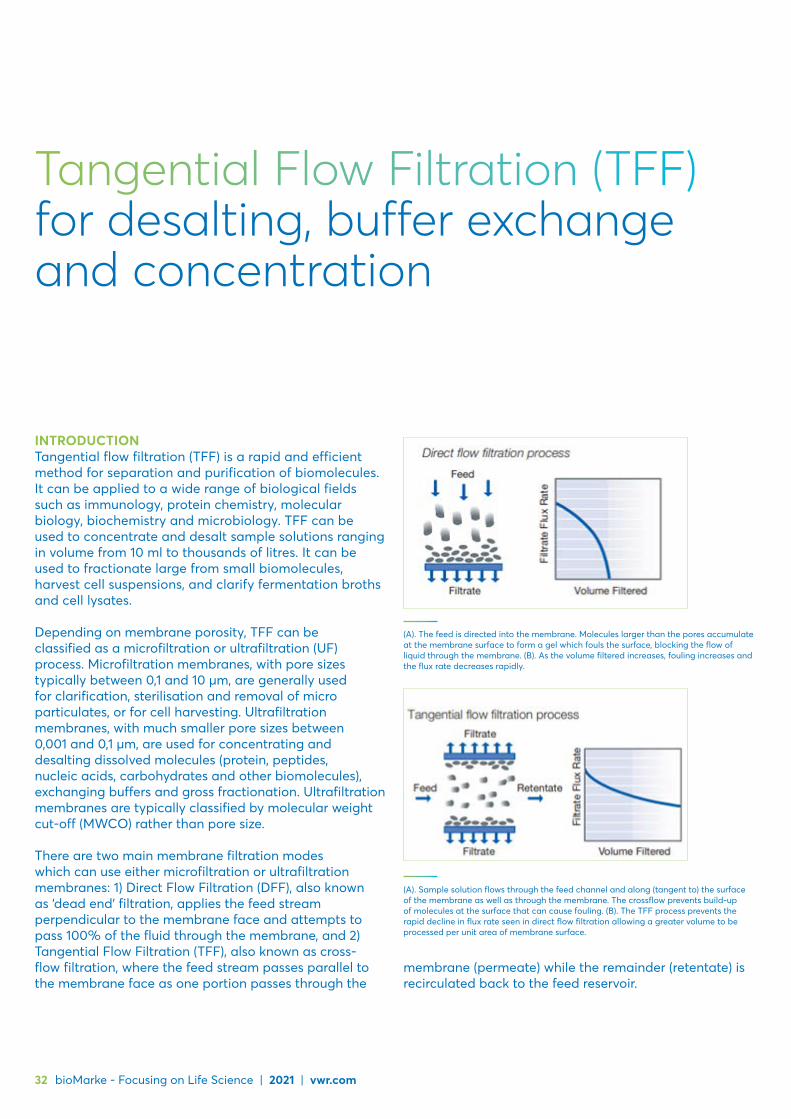
(A). The feed is directed into the membrane. Molecules larger than the pores accumulate at the membrane surface to form a gel which fouls the surface, blocking the flow of liquid through the membrane. (B). As the volume filtered increases, fouling increases and the flux rate decreases rapidly.
(A). Sample solution flows through the feed channel and along (tangent to) the surface of the membrane as well as through the membrane. The crossflow prevents build-up of molecules at the surface that can cause fouling. (B). The TFF process prevents the rapid decline in flux rate seen in direct flow filtration allowing a greater volume to be processed per unit area of membrane surface.
32 bioMarke - Focusing on Life Science | 2021 | vwr.com
Tangential Flow Filtration (TFF) for desalting, buffer exchange and concentration
INTRODUCTION Tangential flow filtration (TFF) is a rapid and efficient method for separation and purification of biomolecules. It can be applied to a wide range of biological fields such as immunology, protein chemistry, molecular biology, biochemistry and microbiology. TFF can be used to concentrate and desalt sample solutions ranging in volume from 10 ml to thousands of litres. It can be used to fractionate large from small biomolecules, harvest cell suspensions, and clarify fermentation broths and cell lysates.
Depending on membrane porosity, TFF can be classified as a microfiltration or ultrafiltration (UF) process. Microfiltration membranes, with pore sizes typically between 0,1 and 10 µm, are generally used for clarification, sterilisation and removal of micro particulates, or for cell harvesting. Ultrafiltration membranes, with much smaller pore sizes between 0,001 and 0,1 µm, are used for concentrating and desalting dissolved molecules (protein, peptides, nucleic acids, carbohydrates and other biomolecules), exchanging buffers and gross fractionation. Ultrafiltration membranes are typically classified by molecular weight cut-off (MWCO) rather than pore size.
There are two main membrane filtration modes which can use either microfiltration or ultrafiltration membranes: 1) Direct Flow Filtration (DFF), also known as ‘dead end’ filtration, applies the feed stream perpendicular to the membrane face and attempts to pass 100% of the fluid through the membrane, and 2) Tangential Flow Filtration (TFF), also known as cross-flow filtration, where the feed stream passes parallel to the membrane face as one portion passes through the
membrane (permeate) while the remainder (retentate) is recirculated back to the feed reservoir.
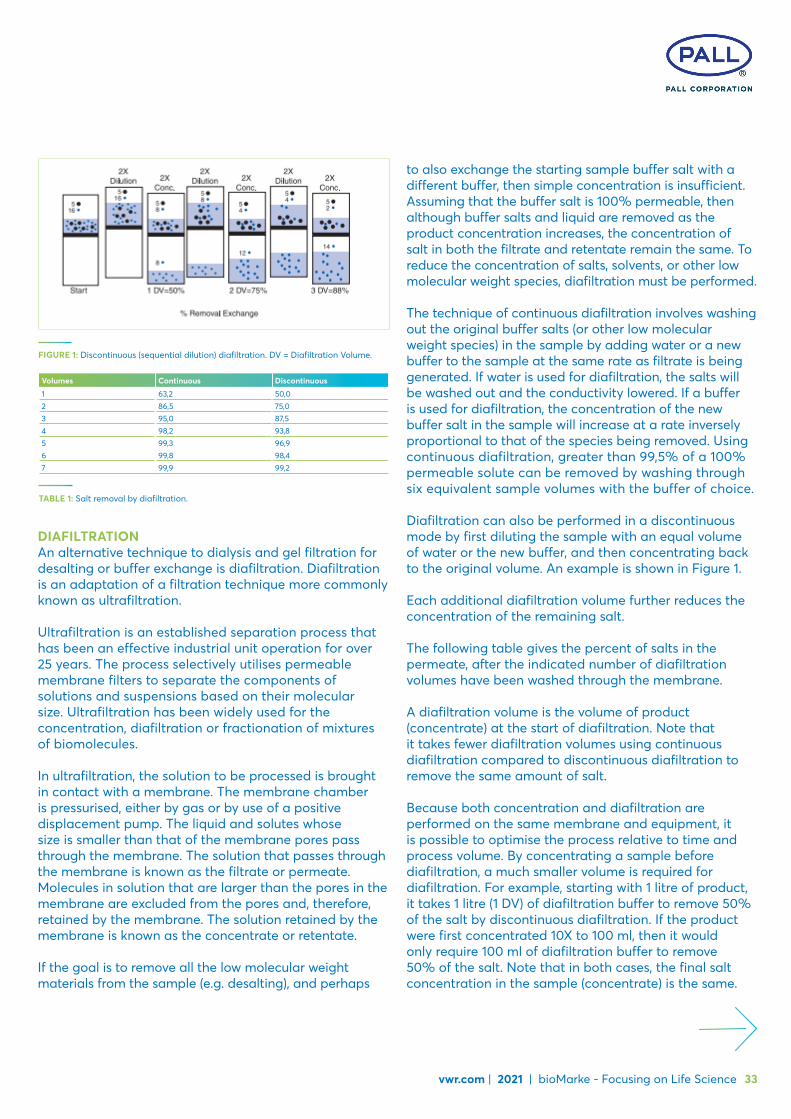
FIGURE 1: Discontinuous (sequential dilution) diafiltration. DV = Diafiltration Volume.
TABLE 1: Salt removal by diafiltration.
Volumes Continuous Discontinuous
1 63,2 50,02 86,5 75,03 95,0 87,54 98,2 93,85 99,3 96,96 99,8 98,47 99,9 99,2
vwr.com | 2021 | bioMarke - Focusing on Life Science 33
DIAFILTRATION An alternative technique to dialysis and gel filtration for desalting or buffer exchange is diafiltration. Diafiltration is an adaptation of a filtration technique more commonly known as ultrafiltration.
Ultrafiltration is an established separation process that has been an effective industrial unit operation for over 25 years. The process selectively utilises permeable membrane filters to separate the components of solutions and suspensions based on their molecular size. Ultrafiltration has been widely used for the concentration, diafiltration or fractionation of mixtures of biomolecules.
In ultrafiltration, the solution to be processed is brought in contact with a membrane. The membrane chamber is pressurised, either by gas or by use of a positive displacement pump. The liquid and solutes whose size is smaller than that of the membrane pores pass through the membrane. The solution that passes through the membrane is known as the filtrate or permeate. Molecules in solution that are larger than the pores in the membrane are excluded from the pores and, therefore, retained by the membrane. The solution retained by the membrane is known as the concentrate or retentate.
If the goal is to remove all the low molecular weight materials from the sample (e.g. desalting), and perhaps
to also exchange the starting sample buffer salt with a different buffer, then simple concentration is insufficient. Assuming that the buffer salt is 100% permeable, then although buffer salts and liquid are removed as the product concentration increases, the concentration of salt in both the filtrate and retentate remain the same. To reduce the concentration of salts, solvents, or other low molecular weight species, diafiltration must be performed.
The technique of continuous diafiltration involves washing out the original buffer salts (or other low molecular weight species) in the sample by adding water or a new buffer to the sample at the same rate as filtrate is being generated. If water is used for diafiltration, the salts will be washed out and the conductivity lowered. If a buffer is used for diafiltration, the concentration of the new buffer salt in the sample will increase at a rate inversely proportional to that of the species being removed. Using continuous diafiltration, greater than 99,5% of a 100% permeable solute can be removed by washing through six equivalent sample volumes with the buffer of choice.
Diafiltration can also be performed in a discontinuous mode by first diluting the sample with an equal volume of water or the new buffer, and then concentrating back to the original volume. An example is shown in Figure 1.
Each additional diafiltration volume further reduces the concentration of the remaining salt.
The following table gives the percent of salts in the permeate, after the indicated number of diafiltration volumes have been washed through the membrane.
A diafiltration volume is the volume of product (concentrate) at the start of diafiltration. Note that it takes fewer diafiltration volumes using continuous diafiltration compared to discontinuous diafiltration to remove the same amount of salt.
Because both concentration and diafiltration are performed on the same membrane and equipment, it is possible to optimise the process relative to time and process volume. By concentrating a sample before diafiltration, a much smaller volume is required for diafiltration. For example, starting with 1 litre of product, it takes 1 litre (1 DV) of diafiltration buffer to remove 50% of the salt by discontinuous diafiltration. If the product were first concentrated 10X to 100 ml, then it would only require 100 ml of diafiltration buffer to remove 50% of the salt. Note that in both cases, the final salt concentration in the sample (concentrate) is the same.
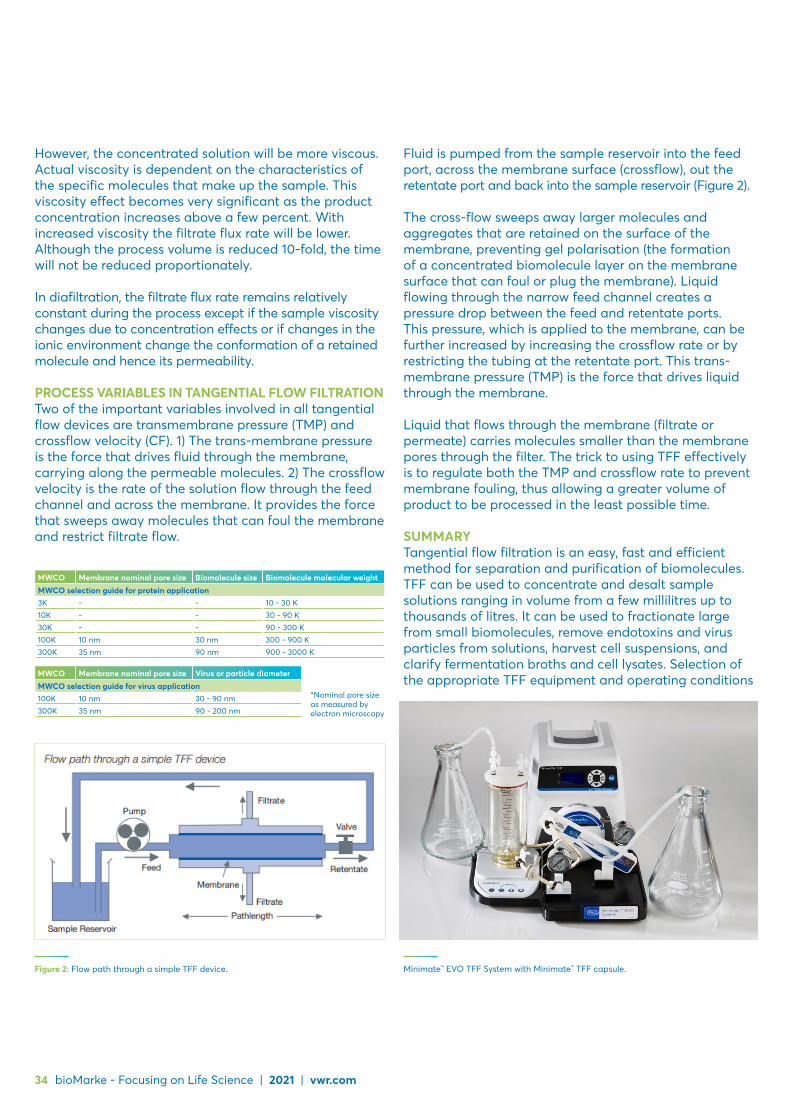
Figure 2: Flow path through a simple TFF device. Minimate™ EVO TFF System with Minimate™ TFF capsule.
MWCO Membrane nominal pore size Biomolecule size Biomolecule molecular weightMWCO selection guide for protein application3K - - 10 - 30 K10K - - 30 - 90 K30K - - 90 - 300 K100K 10 nm 30 nm 300 - 900 K300K 35 nm 90 nm 900 - 3000 K
MWCO Membrane nominal pore size Virus or particle diameterMWCO selection guide for virus application100K 10 nm 30 - 90 nm300K 35 nm 90 - 200 nm
*Nominal pore size as measured by electron microscopy
34 bioMarke - Focusing on Life Science | 2021 | vwr.com
However, the concentrated solution will be more viscous. Actual viscosity is dependent on the characteristics of the specific molecules that make up the sample. This viscosity effect becomes very significant as the product concentration increases above a few percent. With increased viscosity the filtrate flux rate will be lower. Although the process volume is reduced 10-fold, the time will not be reduced proportionately.
In diafiltration, the filtrate flux rate remains relatively constant during the process except if the sample viscosity changes due to concentration effects or if changes in the ionic environment change the conformation of a retained molecule and hence its permeability.
PROCESS VARIABLES IN TANGENTIAL FLOW FILTRATION Two of the important variables involved in all tangential flow devices are transmembrane pressure (TMP) and crossflow velocity (CF). 1) The trans-membrane pressure is the force that drives fluid through the membrane, carrying along the permeable molecules. 2) The crossflow velocity is the rate of the solution flow through the feed channel and across the membrane. It provides the force that sweeps away molecules that can foul the membrane and restrict filtrate flow.
Fluid is pumped from the sample reservoir into the feed port, across the membrane surface (crossflow), out the retentate port and back into the sample reservoir (Figure 2).
The cross-flow sweeps away larger molecules and aggregates that are retained on the surface of the membrane, preventing gel polarisation (the formation of a concentrated biomolecule layer on the membrane surface that can foul or plug the membrane). Liquid flowing through the narrow feed channel creates a pressure drop between the feed and retentate ports. This pressure, which is applied to the membrane, can be further increased by increasing the crossflow rate or by restricting the tubing at the retentate port. This trans-membrane pressure (TMP) is the force that drives liquid through the membrane.
Liquid that flows through the membrane (filtrate or permeate) carries molecules smaller than the membrane pores through the filter. The trick to using TFF effectively is to regulate both the TMP and crossflow rate to prevent membrane fouling, thus allowing a greater volume of product to be processed in the least possible time.
SUMMARY Tangential flow filtration is an easy, fast and efficient method for separation and purification of biomolecules. TFF can be used to concentrate and desalt sample solutions ranging in volume from a few millilitres up to thousands of litres. It can be used to fractionate large from small biomolecules, remove endotoxins and virus particles from solutions, harvest cell suspensions, and clarify fermentation broths and cell lysates. Selection of the appropriate TFF equipment and operating conditions
vwr.com | 2021 | bioMarke - Focusing on Life Science 35
WHY USE TANGENTIAL FLOW FILTRATION?01. TFF is easy to set up and use – simply connect the
TFF device to a pump and pressure gauge(s) with tubing and a few fittings, add your sample to the reservoir and you’re ready to go. An example set-up is shown below.
02. TFF is fast and efficient – it is easier to set up and much faster than dialysis. You can achieve higher concentrations in less time than with centrifugal devices or stirred cells.
03. Perform two steps with one system – you can concentrate and diafilter a sample on the same system, saving time and avoiding product loss.
04. TFF can be scaled-up or scaled-down – construction materials and cassette path length allow conditions established during pilot-scale trials to be applied to process-scale applications. TFF devices are available that can process sample volumes as small as 10 ml or as large as thousands of litres.
05. TFF is economical – TFF devices and cassettes can be cleaned and reused or disposed of after single-use. A simple integrity test can be performed to confirm that membrane and seals are intact.
requires a thorough understanding of the process requirements and parameters. Once established, a broad range of membranes, formats and equipment are available to handle almost any application.
REFERENCES 1. Alun J, Morgan W, and Pickup RW (1993). Activity
of microbial peptidases, oxidases, and esterases in lake waters of varying trophic status. Can J Microbiol 39(8):795-803.
2. Aranha-Creado H, and Fennington GJ Jr (1997). Cumulative viral titer reduction demonstrated by sequential challenge of a tangential flow membrane filtration system and a direct flow pleated filter cartridge. PDA J Pharm Sci Technol 51(5):208-212.
3. Aravindan GR, Mruk D, Lee WM, Cheng CY (1997). Identification, isolation, and characterization of a 41-kilodalton protein from rat germ cell-conditioned medium exhibiting concentration-dependent dual biological activities. Endocrinology 138(8):3259-68.
4. Federspiel G, McCullough KC, Kihm U (1991). Hybridoma antibody production in vitro in type II serum-free medium using Nutridoma-SP supplements. Comparisons with in vivo methods. J Immunol Methods 145(1-2):213-221.
5. Kahn DW, Butler MD, Cohen DL, Gordon M, Kahn JW, and Winkler ME (2000). Purification of plasmid
WHAT CAN TANGENTIAL FLOW FILTRATION DO? 01. Concentrate and desalt proteins 3, 6, 9 and peptides 02. Concentrate and desalt nucleic acids (DNA/RNA/
oligonucleotides 11). 03. Recover and purify antibodies 4, 7 or recombinant
proteins from cell culture media. 04. Recover and purify plasmid DNA from cell lysates 5
or chromosomal DNA from whole blood. 05. Fractionate dilute protein mixtures 9. 06. Clarify cell lysates or tissue homogenates. 07. Depyrogenate (remove endotoxin from) water, buffers
and media solutions 8. 08. Prepare samples prior to column chromatography 3, 7. 09. Harvest cells 1. 10. Recover or remove viruses 2, 10.
DNA by tangential flow filtration. Biotechnol Bioeng. 69(1):101-106.
6. Kawahara H, Mitsuda S, Kumazawa E, Takeshita Y (1994). High-density culture of FM-3A cells using a bioreactor with an external tangential-flow filtration device. Cytotechnology 14(1):61-66.
7. Prado SM, Vancetto MD, de Oliveira JM, Fratelli F, Higashi HG (1999). Development and validation study for the chromatographic purification process for tetanus anatoxin on Sephacryl S-200 High Resolution. Boll Chim Farm. 138(7):364-368.
8. Ronco C, Cappelli G, Ballestri M, Lusvarghi E, Frisone P, Milan M, Dell’Aquila R, Crepaldi C, Dissegna D, Gastaldon F, La Greca G. (1994). On-line filtration of dialysate: structural and functional features of an asymmetric polysulfone hollow fiber ultrafilter (Diaclean). Int J Artif Organs 17(10):515-520.
9. Strauss PR (1995). Use of Filtron Mini-Ultrasette™ tangential flow device and Filtron Microsep™ centrifugal concentrators in the early stages of purification of DNA polymerases. Biotechniques 18(1):158-160.
10. Demonstration of Parvovirus Clearance by a Tangential Flow Membrane Filtration System - Pall Filtron Omega 100 VR. Scientific and Technical Report. STR-FIL 01.
11. Desalting oligonucleotides using Pall Omega 1K membrane and tangential flow systems. LS000069.

36 bioMarke - Focusing on Life Science | 2021 | vwr.com
Pall™ Laboratory AcroPrep™ 24-well filter plates with various pore size for ultrafiltration, microfiltration and macrofiltration / particle filtration Pall Laboratory R&D, Portsmouth, UK.
SUMMARYMany techniques in life science research rely on efficient sample preparation methods. Concentration and purification of samples are key steps in the workflow that can greatly affect the outcome of the experimental results. Pall has increased the range of AcroPrep 24-well filter plates offered to help streamline membrane selection and provide effective solutions for multiple sample preparation needs. The new AcroPrep 24-well filter plates include membranes for ultrafiltration (molecular weight cut off ranging from 1 to 100 K), microfiltration (pore sizes ranging from 0,1 to 10 μm) and microfiltration / particle filtration (30 to 40 μm non woven media).
INTRODUCTIONFiltration is a standard process used in almost every lab for a wide variety of purposes. There are various types of filtration including ultrafiltration, microfiltration and particle-macrofiltration (Table 1). Which type of filtration you use is dependent upon the goal to be achieved.
The clarification, pre-filtration and sterilisation of samples remain an important function for a multitude of life sciences research applications. Microfiltration is a broad category of separation that ranges in pore size from 0,1 to 10 μm. There are two classic types of
microfiltration processes that can be utilised in the sample preparation process depending on application requirements: Depth filtration (remove particulates of varying sizes and high ‘dirt’ holding capacity), and membrane filtration (like sieves they retain all particles larger than the precisely controlled pore size on top of or within their structure).
The concentration of dilute biomolecule solutions is common practice in research laboratories. The concentration of biomolecules is commonly performed via ultrafiltration through a size exclusion mechanism typically rated by the molecular weight of the particles to remove, around 1000 to 1 000 000 molecular weight cut-off (MWCO). This attribute allows for >90% recovery of target molecules which minimises concern over non specific binding of the target molecule. The use of ultrafiltration membranes does not shear nucleic acids, alter enzymatic activity, or cause up/down regulation of the protein.
RESULTS & DISCUSSIONThe data showed that hold-up volume varies in a non linear way, according to the plate pore size and the filtration process used for the AcroPrep 24-well filter plates, with less than 63, 78 and 35 μl in centrifuge, vacuum and positive pressure, respectively.
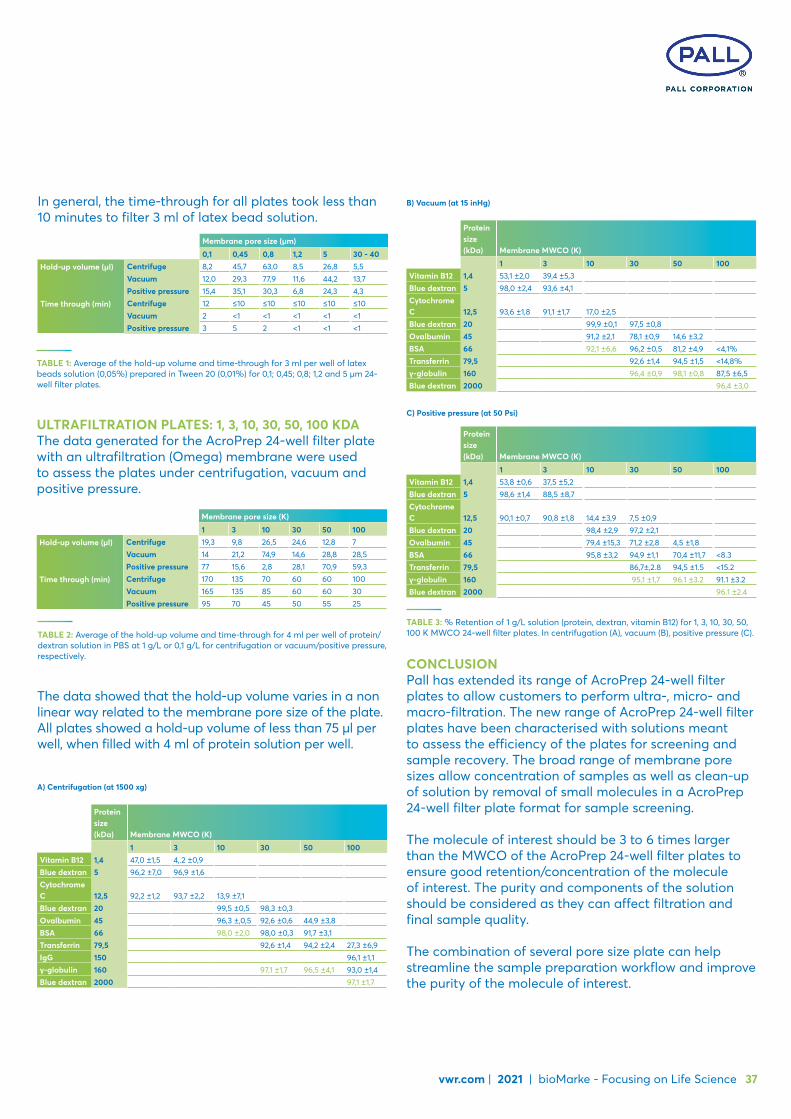
vwr.com | 2021 | bioMarke - Focusing on Life Science 37
In general, the time-through for all plates took less than 10 minutes to filter 3 ml of latex bead solution.
Membrane pore size (µm)
0,1 0,45 0,8 1,2 5 30 - 40Hold-up volume (µl) Centrifuge 8,2 45,7 63,0 8,5 26,8 5,5
Vacuum 12,0 29,3 77,9 11,6 44,2 13,7Positive pressure 15,4 35,1 30,3 6,8 24,3 4,3
Time through (min) Centrifuge 12 ≤10 ≤10 ≤10 ≤10 ≤10Vacuum 2 <1 <1 <1 <1 <1Positive pressure 3 5 2 <1 <1 <1
ULTRAFILTRATION PLATES: 1, 3, 10, 30, 50, 100 KDAThe data generated for the AcroPrep 24-well filter plate with an ultrafiltration (Omega) membrane were used to assess the plates under centrifugation, vacuum and positive pressure.
TABLE 1: Average of the hold-up volume and time-through for 3 ml per well of latex beads solution (0,05%) prepared in Tween 20 (0,01%) for 0,1; 0,45; 0,8; 1,2 and 5 µm 24-well filter plates.
Membrane pore size (K)
1 3 10 30 50 100Hold-up volume (µl) Centrifuge 19,3 9,8 26,5 24,6 12,8 7
Vacuum 14 21,2 74,9 14,6 28,8 28,5Positive pressure 77 15,6 2,8 28,1 70,9 59,3
Time through (min) Centrifuge 170 135 70 60 60 100 Vacuum 165 135 85 60 60 30Positive pressure 95 70 45 50 55 25
TABLE 2: Average of the hold-up volume and time-through for 4 ml per well of protein/dextran solution in PBS at 1 g/L or 0,1 g/L for centrifugation or vacuum/positive pressure, respectively.
The data showed that the hold-up volume varies in a non linear way related to the membrane pore size of the plate. All plates showed a hold-up volume of less than 75 µl per well, when filled with 4 ml of protein solution per well.
Protein size (kDa) Membrane MWCO (K)
1 3 10 30 50 100Vitamin B12 1,4 47,0 ±1,5 4,.2 ±0,9Blue dextran 5 96,2 ±7,0 96,9 ±1,6Cytochrome C 12,5 92,2 ±1,2 93,7 ±2,2 13,9 ±7,1Blue dextran 20 99,5 ±0,5 98,3 ±0,3Ovalbumin 45 96,3 ±,0,5 92,6 ±0,6 44,9 ±3,8BSA 66 98,0 ±2,0 98,0 ±0,3 91,7 ±3,1Transferrin 79,5 92,6 ±1,4 94,2 ±2,4 27,3 ±6,9IgG 150 96,1 ±1,1γ-globulin 160 97,1 ±1,7 96,5 ±4,1 93,0 ±1,4Blue dextran 2000 97,1 ±1,7
A) Centrifugation (at 1500 xg)
Protein size(kDa) Membrane MWCO (K)
1 3 10 30 50 100Vitamin B12 1,4 53,1 ±2,0 39,4 ±5,3Blue dextran 5 98,0 ±2,4 93,6 ±4,1Cytochrome C 12,5 93,6 ±1,8 91,1 ±1,7 17,0 ±2,5Blue dextran 20 99,9 ±0,1 97,5 ±0,8Ovalbumin 45 91,2 ±2,1 78,1 ±0,9 14,6 ±3,2BSA 66 92,1 ±6,6 96,2 ±0,5 81,2 ±4,9 <4,1%Transferrin 79,5 92,6 ±1,4 94,5 ±1,5 <14,8%γ-globulin 160 96,4 ±0,9 98,1 ±0,8 87,5 ±6,5Blue dextran 2000 96,4 ±3,0
B) Vacuum (at 15 inHg)
Protein size(kDa) Membrane MWCO (K)
1 3 10 30 50 100Vitamin B12 1,4 53,8 ±0,6 37,5 ±5,2Blue dextran 5 98,6 ±1,4 88,5 ±8,7Cytochrome C 12,5 90,1 ±0,7 90,8 ±1,8 14,4 ±3,9 7,5 ±0,9Blue dextran 20 98,4 ±2,9 97,2 ±2,1Ovalbumin 45 79,4 ±15,3 71,2 ±2,8 4,5 ±1,8BSA 66 95,8 ±3,2 94,9 ±1,1 70,4 ±11,7 <8.3Transferrin 79,5 86,7±,2.8 94,5 ±1.5 <15.2γ-globulin 160 95,1 ±1,7 96.1 ±3.2 91.1 ±3.2Blue dextran 2000 96.1 ±2.4
C) Positive pressure (at 50 Psi)
CONCLUSIONPall has extended its range of AcroPrep 24-well filter plates to allow customers to perform ultra-, micro- and macro-filtration. The new range of AcroPrep 24-well filter plates have been characterised with solutions meant to assess the efficiency of the plates for screening and sample recovery. The broad range of membrane pore sizes allow concentration of samples as well as clean-up of solution by removal of small molecules in a AcroPrep 24-well filter plate format for sample screening.
The molecule of interest should be 3 to 6 times larger than the MWCO of the AcroPrep 24-well filter plates to ensure good retention/concentration of the molecule of interest. The purity and components of the solution should be considered as they can affect filtration and final sample quality.
The combination of several pore size plate can help streamline the sample preparation workflow and improve the purity of the molecule of interest.
TABLE 3: % Retention of 1 g/L solution (protein, dextran, vitamin B12) for 1, 3, 10, 30, 50, 100 K MWCO 24-well filter plates. In centrifugation (A), vacuum (B), positive pressure (C).
38 bioMarke - Focusing on Life Science | 2021 | vwr.com
Sartorius ultrafiltration productsfor the concentration and purification of viruses – a short reviewHannes Landmann1*, Kristin Menzel2
1 Sartorius Lab Instruments GmbH & Co. KG, Otto-Brenner-Straße 20, 37079 Göttingen, Germany2 Sartorius Stedim Biotech GmbH, August-Spindler- Straße 11, 37079 Goettingen, Germany * Correspondence
ABSTRACTThis short review highlights concentration and purification steps of various viruses in the context of different research applications. The discussed methods find application in medical research, marine biology as well as in research concerning drinking water and food quality. You will find guidance for the selection of an ideal performing ultrafiltration device with the optimum molecular weight cut-off (MWCO) for typical concentration applications.
INTRODUCTIONEvolutionary, viruses develop various mechanisms to interact and manipulate the genetic material of their target cells. Based on this, modern molecular biology utilises viruses in a constantly growing number of applications1.They range from controlled genetic transfection of cells to a variety of different basic studies in medical science2. In medical studies the strategic focus is on recombinant vaccines, and on the development of potential vectors for gene therapy3,4.
Besides the great relevance of viruses for medical applications, the assessment of virus type and content is important for the risk assessment of food and drinking water.5 Also, the classification of virus content is often of high relevance for the quality control of aquatic biotopes6.
During the preparation, handling, or analysis of viruses or virus-like particles (VLPs), a concentration and/or purification step is frequently required5. Typical viruses have a size within the range of about 20 nm up to several hundred nanometres7.
Therefore, they are ideally suited for the retention on ultrafiltration membrane systems and such ultrafilters are widely used in basic virus research. The specifications of such ultrafiltration devices depend on the virus and the purpose of the subsequent application. This short review highlights methods for the purification of various mammalian viruses for basic medical research. Also, the concentration of pathogenic viruses from water and food samples and the purification of marine bacteriophages (virioplankton)are highlighted. It will also give guidance for the selection of an ideal performing device with the optimum molecular weight cut-off (MWCO) for the user-specified ultrafiltration process.
CONCENTRATION OF MAMMALIAN VIRUSES IN MEDICAL RESEARCHIn medical research, viruses and VLPs are of major interest, particularly for investigations on infectious viral diseases and for the development of vaccines or antiviral
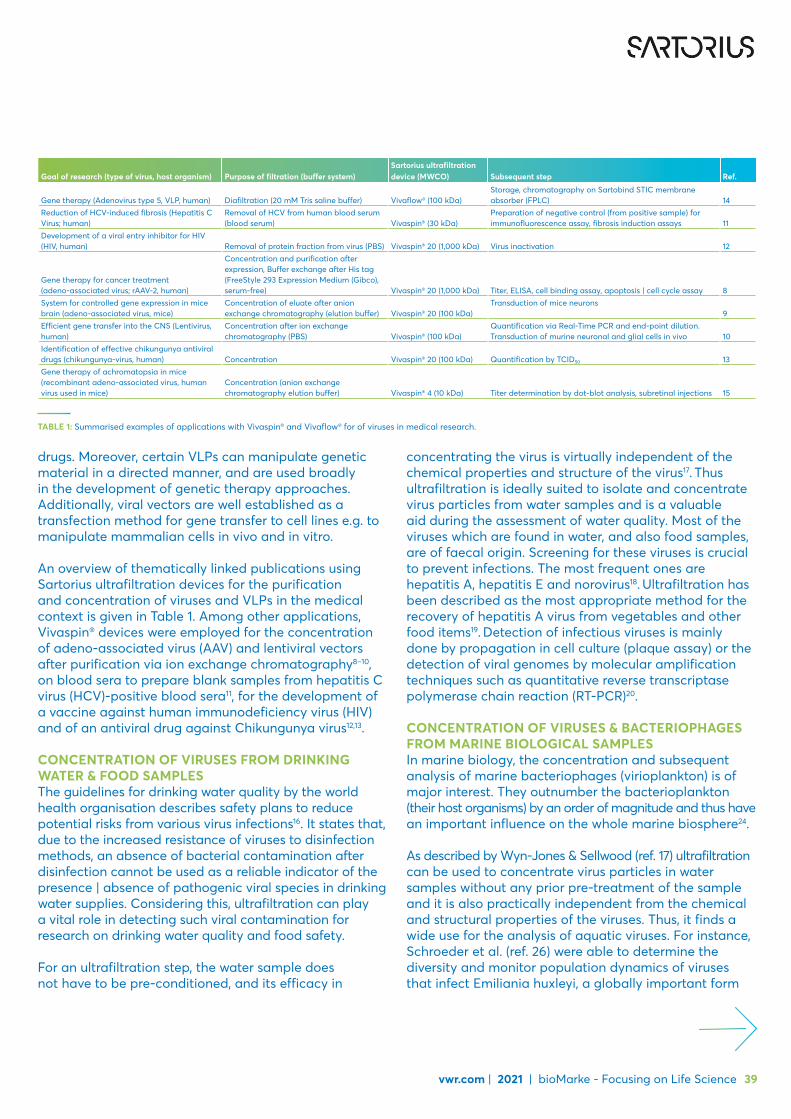
vwr.com | 2021 | bioMarke - Focusing on Life Science 39
drugs. Moreover, certain VLPs can manipulate genetic material in a directed manner, and are used broadly in the development of genetic therapy approaches. Additionally, viral vectors are well established as a transfection method for gene transfer to cell lines e.g. to manipulate mammalian cells in vivo and in vitro.
An overview of thematically linked publications using Sartorius ultrafiltration devices for the purification and concentration of viruses and VLPs in the medical context is given in Table 1. Among other applications, Vivaspin® devices were employed for the concentration of adeno-associated virus (AAV) and lentiviral vectors after purification via ion exchange chromatography8–10, on blood sera to prepare blank samples from hepatitis C virus (HCV)-positive blood sera11, for the development of a vaccine against human immunodeficiency virus (HIV) and of an antiviral drug against Chikungunya virus12,13.
CONCENTRATION OF VIRUSES FROM DRINKING WATER & FOOD SAMPLES The guidelines for drinking water quality by the world health organisation describes safety plans to reduce potential risks from various virus infections16. It states that, due to the increased resistance of viruses to disinfection methods, an absence of bacterial contamination after disinfection cannot be used as a reliable indicator of the presence | absence of pathogenic viral species in drinking water supplies. Considering this, ultrafiltration can play a vital role in detecting such viral contamination for research on drinking water quality and food safety.
For an ultrafiltration step, the water sample does not have to be pre-conditioned, and its efficacy in
Goal of research (type of virus, host organism) Purpose of filtration (buffer system)Sartorius ultrafiltration device (MWCO) Subsequent step Ref.
Gene therapy (Adenovirus type 5, VLP, human) Diafiltration (20 mM Tris saline buffer) Vivaflow® (100 kDa)Storage, chromatography on Sartobind STIC membrane absorber (FPLC) 14
Reduction of HCV-induced fibrosis (Hepatitis C Virus; human)
Removal of HCV from human blood serum (blood serum) Vivaspin® (30 kDa)
Preparation of negative control (from positive sample) for immunofluorescence assay, fibrosis induction assays 11
Development of a viral entry inhibitor for HIV (HIV, human) Removal of protein fraction from virus (PBS) Vivaspin® 20 (1,000 kDa) Virus inactivation 12
Gene therapy for cancer treatment (adeno-associated virus; rAAV-2, human)
Concentration and purification after expression, Buffer exchange after His tag (FreeStyle 293 Expression Medium (Gibco), serum-free) Vivaspin® 20 (1,000 kDa) Titer, ELISA, cell binding assay, apoptosis | cell cycle assay 8
System for controlled gene expression in mice brain (adeno-associated virus, mice)
Concentration of eluate after anion exchange chromatography (elution buffer) Vivaspin® 20 (100 kDa)
Transduction of mice neurons9
Efficient gene transfer into the CNS (Lentivirus, human)
Concentration after ion exchange chromatography (PBS) Vivaspin® (100 kDa)
Quantification via Real-Time PCR and end-point dilution. Transduction of murine neuronal and glial cells in vivo 10
Identification of effective chikungunya antiviral drugs (chikungunya-virus, human) Concentration Vivaspin® 20 (100 kDa) Quantification by TCID50 13Gene therapy of achromatopsia in mice (recombinant adeno-associated virus, human virus used in mice)
Concentration (anion exchange chromatography elution buffer) Vivaspin® 4 (10 kDa) Titer determination by dot-blot analysis, subretinal injections 15
TABLE 1: Summarised examples of applications with Vivaspin® and Vivaflow® for of viruses in medical research.
concentrating the virus is virtually independent of the chemical properties and structure of the virus17. Thus ultrafiltration is ideally suited to isolate and concentrate virus particles from water samples and is a valuable aid during the assessment of water quality. Most of the viruses which are found in water, and also food samples, are of faecal origin. Screening for these viruses is crucial to prevent infections. The most frequent ones are hepatitis A, hepatitis E and norovirus18. Ultrafiltration has been described as the most appropriate method for the recovery of hepatitis A virus from vegetables and other food items19. Detection of infectious viruses is mainly done by propagation in cell culture (plaque assay) or the detection of viral genomes by molecular amplification techniques such as quantitative reverse transcriptase polymerase chain reaction (RT-PCR)20.
CONCENTRATION OF VIRUSES & BACTERIOPHAGES FROM MARINE BIOLOGICAL SAMPLESIn marine biology, the concentration and subsequent analysis of marine bacteriophages (virioplankton) is of major interest. They outnumber the bacterioplankton (their host organisms) by an order of magnitude and thus have an important influence on the whole marine biosphere24.
As described by Wyn-Jones & Sellwood (ref. 17) ultrafiltration can be used to concentrate virus particles in water samples without any prior pre-treatment of the sample and it is also practically independent from the chemical and structural properties of the viruses. Thus, it finds a wide use for the analysis of aquatic viruses. For instance, Schroeder et al. (ref. 26) were able to determine the diversity and monitor population dynamics of viruses that infect Emiliania huxleyi, a globally important form
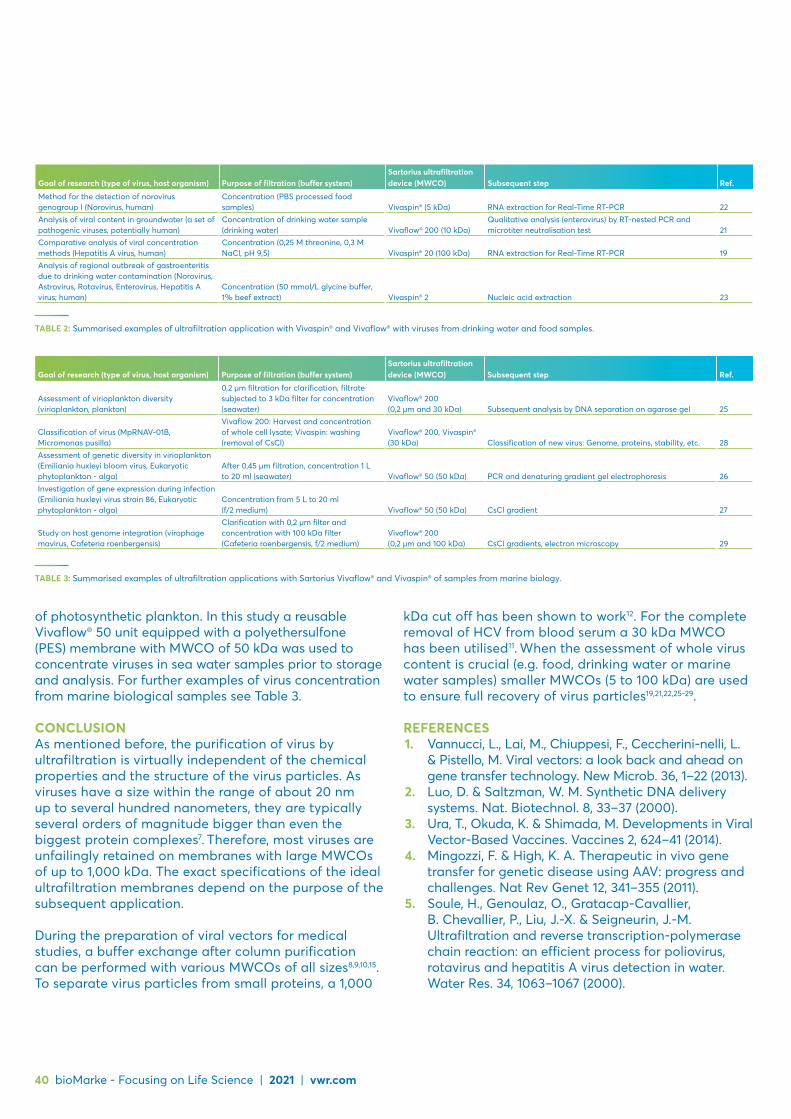
40 bioMarke - Focusing on Life Science | 2021 | vwr.com
of photosynthetic plankton. In this study a reusable Vivaflow® 50 unit equipped with a polyethersulfone (PES) membrane with MWCO of 50 kDa was used to concentrate viruses in sea water samples prior to storage and analysis. For further examples of virus concentration from marine biological samples see Table 3.
CONCLUSIONAs mentioned before, the purification of virus by ultrafiltration is virtually independent of the chemical properties and the structure of the virus particles. As viruses have a size within the range of about 20 nm up to several hundred nanometers, they are typically several orders of magnitude bigger than even the biggest protein complexes7. Therefore, most viruses are unfailingly retained on membranes with large MWCOs of up to 1,000 kDa. The exact specifications of the ideal ultrafiltration membranes depend on the purpose of the subsequent application.
During the preparation of viral vectors for medical studies, a buffer exchange after column purification can be performed with various MWCOs of all sizes8,9,10,15. To separate virus particles from small proteins, a 1,000
Goal of research (type of virus, host organism) Purpose of filtration (buffer system)Sartorius ultrafiltration device (MWCO) Subsequent step Ref.
Method for the detection of norovirus genogroup I (Norovirus, human)
Concentration (PBS processed food samples) Vivaspin® (5 kDa) RNA extraction for Real-Time RT-PCR 22
Analysis of viral content in groundwater (a set of pathogenic viruses, potentially human)
Concentration of drinking water sample (drinking water) Vivaflow® 200 (10 kDa)
Qualitative analysis (enterovirus) by RT-nested PCR and microtiter neutralisation test 21
Comparative analysis of viral concentration methods (Hepatitis A virus, human)
Concentration (0,25 M threonine, 0,3 M NaCl, pH 9,5) Vivaspin® 20 (100 kDa) RNA extraction for Real-Time RT-PCR 19
Analysis of regional outbreak of gastroenteritis due to drinking water contamination (Norovirus, Astrovirus, Rotavirus, Enterovirus, Hepatitis A virus; human)
Concentration (50 mmol/L glycine buffer, 1% beef extract) Vivaspin® 2 Nucleic acid extraction 23
TABLE 2: Summarised examples of ultrafiltration application with Vivaspin® and Vivaflow® with viruses from drinking water and food samples.
Goal of research (type of virus, host organism) Purpose of filtration (buffer system)Sartorius ultrafiltration device (MWCO) Subsequent step Ref.
Assessment of virioplankton diversity (virioplankton, plankton)
0,2 µm filtration for clarification, filtrate subjected to 3 kDa filter for concentration (seawater)
Vivaflow® 200 (0,2 µm and 30 kDa) Subsequent analysis by DNA separation on agarose gel 25
Classification of virus (MpRNAV-01B, Micromonas pusilla)
Vivaflow 200: Harvest and concentration of whole cell lysate; Vivaspin: washing (removal of CsCl)
Vivaflow® 200, Vivaspin® (30 kDa) Classification of new virus: Genome, proteins, stability, etc. 28
Assessment of genetic diversity in virioplankton (Emiliania huxleyi bloom virus, Eukaryotic phytoplankton - alga)
After 0,45 µm filtration, concentration 1 L to 20 ml (seawater) Vivaflow® 50 (50 kDa) PCR and denaturing gradient gel electrophoresis 26
Investigation of gene expression during infection (Emiliania huxleyi virus strain 86, Eukaryotic phytoplankton - alga)
Concentration from 5 L to 20 ml (f/2 medium) Vivaflow® 50 (50 kDa) CsCl gradient 27
Study on host genome integration (virophage mavirus, Cafeteria roenbergensis)
Clarification with 0,2 µm filter and concentration with 100 kDa filter (Cafeteria roenbergensis, f/2 medium)
Vivaflow® 200 (0,2 µm and 100 kDa) CsCl gradients, electron microscopy 29
TABLE 3: Summarised examples of ultrafiltration applications with Sartorius Vivaflow® and Vivaspin® of samples from marine biology.
kDa cut off has been shown to work12. For the complete removal of HCV from blood serum a 30 kDa MWCO has been utilised11. When the assessment of whole virus content is crucial (e.g. food, drinking water or marine water samples) smaller MWCOs (5 to 100 kDa) are used to ensure full recovery of virus particles19,21,22,25-29.
REFERENCES1. Vannucci, L., Lai, M., Chiuppesi, F., Ceccherini-nelli, L.
& Pistello, M. Viral vectors: a look back and ahead on gene transfer technology. New Microb. 36, 1–22 (2013).
2. Luo, D. & Saltzman, W. M. Synthetic DNA delivery systems. Nat. Biotechnol. 8, 33–37 (2000).
3. Ura, T., Okuda, K. & Shimada, M. Developments in Viral Vector-Based Vaccines. Vaccines 2, 624–41 (2014).
4. Mingozzi, F. & High, K. A. Therapeutic in vivo gene transfer for genetic disease using AAV: progress and challenges. Nat Rev Genet 12, 341–355 (2011).
5. Soule, H., Genoulaz, O., Gratacap-Cavallier, B. Chevallier, P., Liu, J.-X. & Seigneurin, J.-M. Ultrafiltration and reverse transcription-polymerase chain reaction: an efficient process for poliovirus, rotavirus and hepatitis A virus detection in water. Water Res. 34, 1063–1067 (2000).

vwr.com | 2021 | bioMarke - Focusing on Life Science 41
6. Bergh, O., BOrsheim, K. Y., Bratbak, G. & Heldal, M. High abundance of viruses found in aquatic environments. Nature 340, 467–468 (1989).
7. Hulo, C. et al. ViralZone: A knowledge resource to understand virus diversity. Nucleic Acids Res. 39, 576–582 (2011).
8. Hagen, S. et al. Modular adeno-associated virus (rAAV) vectors used for cellular virus-directed enzyme prodrug therapy. Sci. Rep. 4, 3759 (2014).
9. Schindler, S. E. et al. Photo-activatable Cre recombinase regulates gene expression in vivo. Sci. Rep. 5, 13627 (2015).
10. Scherr, M. et al. Efficient gene transfer into the CNS by lenti- viral vectors purified by anion exchange chromatography. Gene Ther. 9, 1708–1714 (2002).
11. Granato, M. et al. HCV derived from sera of HCV-infected patients induces pro-fibrotic effects in human primary fibroblasts by activating GLI2. Sci. Rep. 6, 30649 (2016).
12. Martin, L. et al. Rational design of a CD4 mimic that inhibits HIV-1 entry and exposes cryptic neutralization epitopes. Nat. Biotechnol. 21, 71–76 (2003).
13. Karlas, A. et al. A human genome-wide loss-of-function screen identifies effective chikungunya antiviral drugs. Nat. Commun. 7, 11320 (2016).
14. Nestola, P. et al. Rational development of two flowthrough purification strategies for adenovirus type 5 and retro virus-like particles. J. Chromatogr. A 1426, 91–101 (2015).
15. Carvalho, L. S. et al. Long-term and age-dependent restoration of visual function in a mouse model of CNGB3-associated achromatopsia following gene therapy. Hum. Mol. Genet. 20, 3161–3175 (2011).
16. Guidelines for drinking-water quality - 4th ed. World Health Organization 2011.
17. Wyn-Jones, a P. & Sellwood, J. Enteric viruses in the aquatic environment. J. Appl. Microbiol. 91, 945–962 (2001).
18. Botzenhart, K. Viren im Trinkwasser. Bundesgesundheitsblatt - Gesundheitsforsch. - Gesundheitsschutz 50, 296–301 (2007).
19. Lee, K. B., Lee, H., Ha, S. D., Cheon, D. S. & Choi, C. Comparative analysis of viral concentration methods for detecting the HAV genome using real-time RT-PCR amplification. Food Env. Virol. 4, 68–72 (2012).
20. Bosch, A. et al. Analytical Methods for Virus Detection in Water and Food. Food Anal. Methods 4, 4–12 (2011).
21. Masciopinto, C. et al. Unsafe tap water in households supplied from groundwater in the Salento Region of Southern Italy. J. Water Health 5, 129–148 (2007).
22. Dreier, J., Störmer, M., Mäde, D., Burkhardt, S. &
Kleesiek, K. Enhanced reverse transcription-PCR assay for detection of norovirus genogroup I. J. Clin. Microbiol. 44, 2714–2720 (2006).
23. Maunula, L. et al. Enteric Viruses in a Large Waterborne Outbreak of Acute Gastroenteritis in Finland. Food Environ. Virol. 1, 31–36 (2009).
24. Wommack, K. E. & Colwell, R. R. Virioplankton: viruses in aquatic ecosystems. Microbiol. Mol. Biol. Rev. 64, 69–114 (2000).
25. Parada, V., Baudoux, A.-C., Sintes, E., Weinbauer, M. G. & Herndl, G. J. Dynamics and diversity of newly produced virioplankton in the North Sea. ISME J. 2, 924–936 (2008).
26. Schroeder, D. C., Oke, J., Hall, M., Malin, G. & Wilson, W. H. Virus Succession Observed during an Emiliania huxleyi Bloom Virus. Appl. Environ. Microbiol. 69, 2484–2490 (2003).
27. Allen, M. J. et al. Locus-Specific Gene Expression Pattern Suggests a Unique Propagation Strategy for a Giant Algal Virus. J. Virol. 80, 7699–7705 (2006).
28. Brussaard, C. P. D., Noordeloos, A. A. M., Sandaa, R. A., Heldal, M. & Bratbak, G. Discovery of a dsRNA virus infecting the ma- rine photosynthetic protist Micromonas pusilla. Virology 319, 280–291 (2004).
29. Fischer, M. G. & Hackl, T. Host genome integration and giant virus-induced reactivation of the virophage mavirus. Nature 540, 288–291 (2016).
ABBREVIATIONS – AAV Adeno-associated virus – CNS Central nervous system – DNA Deoxyribonucleic acid – ELISA Enzyme-linked immunosorbent assay – FPLC Fast protein liquid chromatography – HCV Hepatitis C virus – HIV Human immunodeficiency virus kDa Kilodalton
(1000 g per mole) – M Molarity (mole per litre) – mol Mole – MWCO Molecular weight cut-off – PBS Phosphate buffered saline – PCR Polymerase chain reaction – PES Polyethersulfone – RNA Ribonucleic acid – RT-PCR Reverse transcriptase-polymerase chain reaction – TCID50 50% Tissue culture infective dose – VLP Virus-like particle

Providing a carefree equipment lifecycle with Avantor Services
— Installation — Preventive maintenance — Warranty and repair — Calibration — Qualification, validation and certification (IQ/OQ/PQ) — Equipment management — Training
Equipment ServicesKeep your laboratory in compliance and in operation
VWR.COM/EIS
Avantor Services
PB18028-EN

Protecting every sample, every day.
Over 100 million research assets stored, never failing to return even one. We don't just store, we take care.
avantorsciences.com/biorepository-archiving
At this purpose-built facility, Avantor does more than just store — we take care of your critical biologic and research assets. Strategically located, this state-of-the-art biorepository leverages our 40+ years of clinical trials expertise and standards of care to offer:
— Customised solutions that accommodate samples from -196 to +21 °C
— 24-hour sample monitoring, 365 days a year with back-up and full redundancy safeguards
— Real-time material asset management system to enable operational efficiencies
— Dedicated Facilities Management, Quality Assurance and Information Technology teams
— Direct service to 90+ major EU cities and 300+ international destinations
New Avantor® biorepository and archiving facility in Frankfurt, Germany, now open.

44 bioMarke - Focusing on Life Science | 2021 | vwr.com
SenseAnywhere for monitoring COVID-19 vaccines across EuropeSenseAnywhere already specialises in fully automated temperature monitoring for the pharmaceutical industry.
This year our AiroSensors, in combination with our PT100 smart probes, will be used to ensure safe distribution and storage of the long awaited COVID-19 vaccines across Europe.
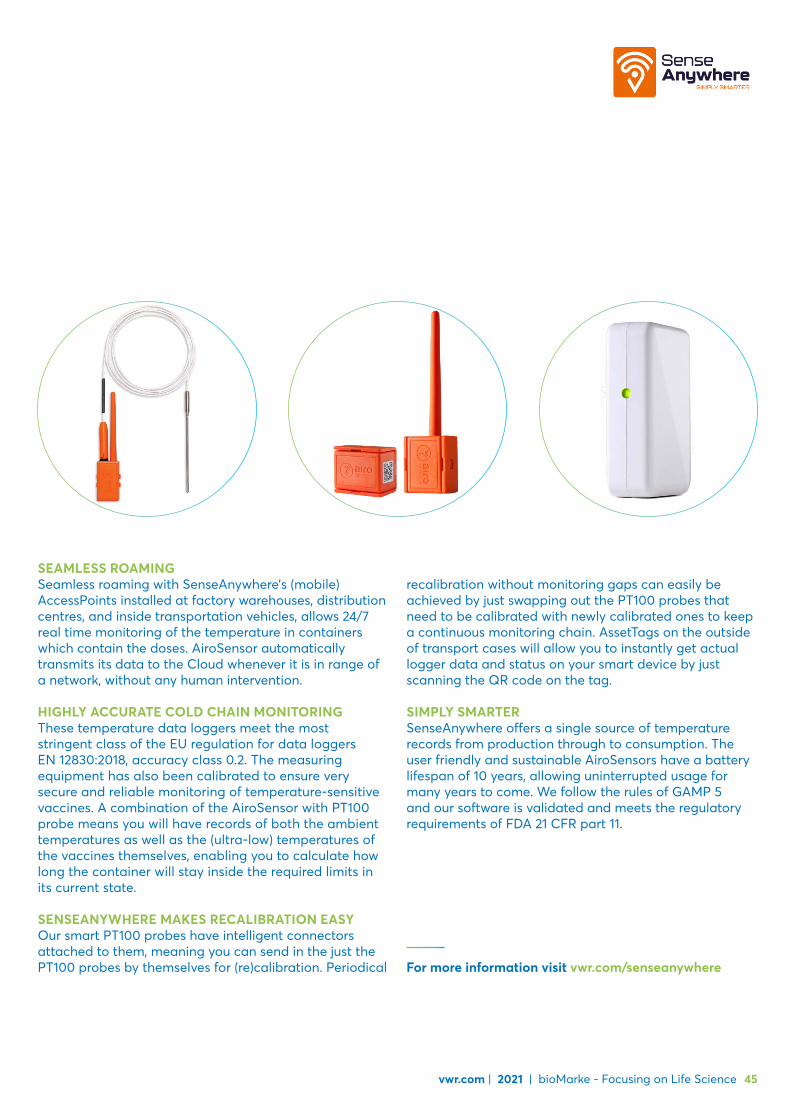
vwr.com | 2021 | bioMarke - Focusing on Life Science 45
SEAMLESS ROAMINGSeamless roaming with SenseAnywhere’s (mobile) AccessPoints installed at factory warehouses, distribution centres, and inside transportation vehicles, allows 24/7 real time monitoring of the temperature in containers which contain the doses. AiroSensor automatically transmits its data to the Cloud whenever it is in range of a network, without any human intervention.
HIGHLY ACCURATE COLD CHAIN MONITORINGThese temperature data loggers meet the most stringent class of the EU regulation for data loggers EN 12830:2018, accuracy class 0.2. The measuring equipment has also been calibrated to ensure very secure and reliable monitoring of temperature-sensitive vaccines. A combination of the AiroSensor with PT100 probe means you will have records of both the ambient temperatures as well as the (ultra-low) temperatures of the vaccines themselves, enabling you to calculate how long the container will stay inside the required limits in its current state.
SENSEANYWHERE MAKES RECALIBRATION EASYOur smart PT100 probes have intelligent connectors attached to them, meaning you can send in the just the PT100 probes by themselves for (re)calibration. Periodical
recalibration without monitoring gaps can easily be achieved by just swapping out the PT100 probes that need to be calibrated with newly calibrated ones to keep a continuous monitoring chain. AssetTags on the outside of transport cases will allow you to instantly get actual logger data and status on your smart device by just scanning the QR code on the tag.
SIMPLY SMARTERSenseAnywhere offers a single source of temperature records from production through to consumption. The user friendly and sustainable AiroSensors have a battery lifespan of 10 years, allowing uninterrupted usage for many years to come. We follow the rules of GAMP 5 and our software is validated and meets the regulatory requirements of FDA 21 CFR part 11.
For more information visit vwr.com/senseanywhere
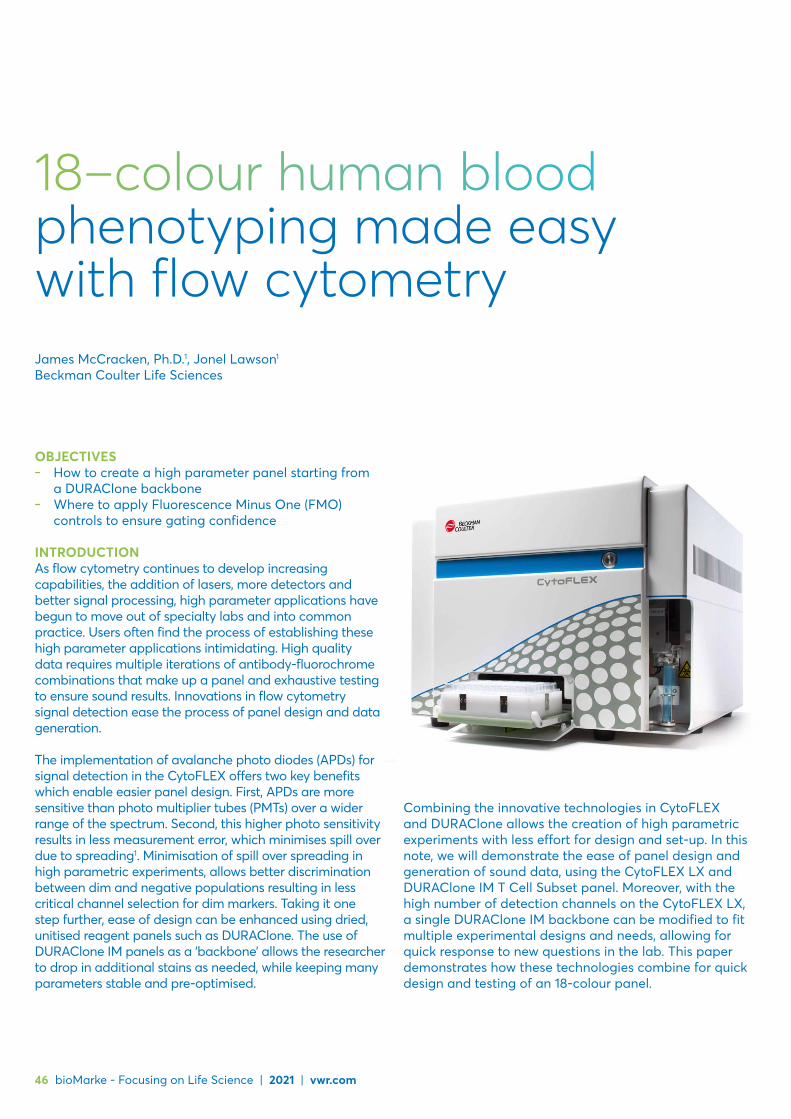
46 bioMarke - Focusing on Life Science | 2021 | vwr.com
18–colour human blood phenotyping made easywith flow cytometryJames McCracken, Ph.D.1, Jonel Lawson1 Beckman Coulter Life Sciences
OBJECTIVES – How to create a high parameter panel starting from
a DURAClone backbone – Where to apply Fluorescence Minus One (FMO)
controls to ensure gating confidence
INTRODUCTIONAs flow cytometry continues to develop increasing capabilities, the addition of lasers, more detectors and better signal processing, high parameter applications have begun to move out of specialty labs and into common practice. Users often find the process of establishing these high parameter applications intimidating. High quality data requires multiple iterations of antibody-fluorochrome combinations that make up a panel and exhaustive testing to ensure sound results. Innovations in flow cytometry signal detection ease the process of panel design and data generation.
The implementation of avalanche photo diodes (APDs) for signal detection in the CytoFLEX offers two key benefits which enable easier panel design. First, APDs are more sensitive than photo multiplier tubes (PMTs) over a wider range of the spectrum. Second, this higher photo sensitivity results in less measurement error, which minimises spill over due to spreading1. Minimisation of spill over spreading in high parametric experiments, allows better discrimination between dim and negative populations resulting in less critical channel selection for dim markers. Taking it one step further, ease of design can be enhanced using dried, unitised reagent panels such as DURAClone. The use of DURAClone IM panels as a ‘backbone’ allows the researcher to drop in additional stains as needed, while keeping many parameters stable and pre-optimised.
Combining the innovative technologies in CytoFLEX and DURAClone allows the creation of high parametric experiments with less effort for design and set-up. In this note, we will demonstrate the ease of panel design and generation of sound data, using the CytoFLEX LX and DURAClone IM T Cell Subset panel. Moreover, with the high number of detection channels on the CytoFLEX LX, a single DURAClone IM backbone can be modified to fit multiple experimental designs and needs, allowing for quick response to new questions in the lab. This paper demonstrates how these technologies combine for quick design and testing of an 18-colour panel.

vwr.com | 2021 | bioMarke - Focusing on Life Science 47
PC7-A
[A] [A]
FM
O (
PC
5.5)
Per
CP
-A
FM
O (
PC
5.5)
Per
CP
-A
CD4-PE CD4 PE-A
103
102
101
100
0
-0.5
103
102
101
100
0
0 100 101 102 103 0 100 101 102 103
Performance OK
Transfer assay
into lab
Selectantibody
clones
Selectdye
combination
Verifypanel
performance
Optimizepreparation
protocol
Create SOPfor cocktail
mixing & QC
Transfer assay
into lab
Performance failure revisit design process
Workflow using liquid single color antibodies
Workflow using DURAClone
+ Additional antibody
conjugatesPre-formulated DURAClone IM panels eliminate development workload
APD
PMT
wavelength (nm)
Qua
ntum
E
cien
cy
400
0.0
0.2
0.4
0.6
0.8
1.0
600 800 1000 1200
PC7-A
PC7-APC7-A
PC7-A
80
60
40
20
010-2 10-1 100 101 102 10310-3 10-2 10-1 100 101 102 10310-3
300
200
100
0
Co
unt
Co
unt
A
B
C
D
FIGURE 1: Comparison between PMT-based and APD-based systems. Panel A: Graph representing Quantum Efficiency (QE), i.e., photon-electron conversion yield, of APDs and PMTs over the spectral range. This higher photon-electron conversion yield reduces measurement error thus facilitating higher sensitivity and resolution. Graph adapted from “A Comparison of Avalanche Photodiode and Photomultiplier Tube Detectors for Flow Cytometry” by Paul Wallace et al, 2008, Proceedings of SPI, Vol 6859.2. Panel B: Comparison of Spherotech 8 peak beads on PMT (left) and APD (right) shows better resolution of the dimmest beads due to increased QE, especially for emission wavelengths greater than 650 nm.
Panel C: Higher QE also reduces data spreading into adjacent detectors in APD-based systems (right) compared to PMT-based systems (left). Panel D: Comparison of antibody panel design workflow with and without using DURAClone. DURAClone panels make building large panels less labour intensive by providing pre-optimised stable reagents for the backbone of the panel. Use DURAClone alone, or test and add more colours.
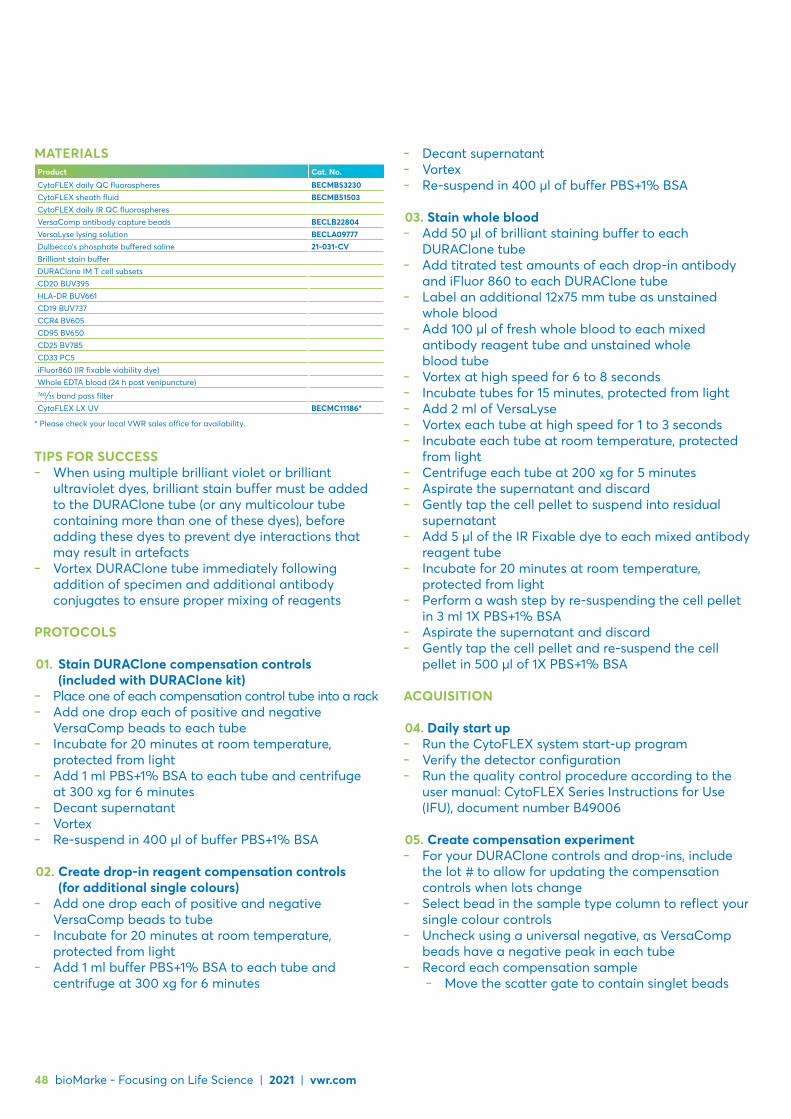
Product Cat. No.
CytoFLEX daily QC fluorospheres BECMB53230CytoFLEX sheath fluid BECMB51503 CytoFLEX daily IR QC fluorospheres VersaComp antibody capture beads BECLB22804 VersaLyse lysing solution BECLA09777Dulbecco’s phosphate buffered saline 21-031-CV Brilliant stain buffer DURAClone IM T cell subsets CD20 BUV395 HLA-DR BUV661 CD19 BUV737 CCR4 BV605 CD95 BV650 CD25 BV785 CD33 PC5 iFluor860 (IR fixable viability dye) Whole EDTA blood (24 h post venipuncture) 740/35 band pass filter CytoFLEX LX UV BECMC11186*
MATERIALS
* Please check your local VWR sales office for availability.
48 bioMarke - Focusing on Life Science | 2021 | vwr.com
TIPS FOR SUCCESS – When using multiple brilliant violet or brilliant
ultraviolet dyes, brilliant stain buffer must be added to the DURAClone tube (or any multicolour tube containing more than one of these dyes), before adding these dyes to prevent dye interactions that may result in artefacts
– Vortex DURAClone tube immediately following addition of specimen and additional antibody conjugates to ensure proper mixing of reagents
PROTOCOLS
01. Stain DURAClone compensation controls (included with DURAClone kit)
– Place one of each compensation control tube into a rack – Add one drop each of positive and negative
VersaComp beads to each tube – Incubate for 20 minutes at room temperature,
protected from light – Add 1 ml PBS+1% BSA to each tube and centrifuge
at 300 xg for 6 minutes – Decant supernatant – Vortex – Re-suspend in 400 µl of buffer PBS+1% BSA
02. Create drop-in reagent compensation controls (for additional single colours)
– Add one drop each of positive and negative VersaComp beads to tube
– Incubate for 20 minutes at room temperature, protected from light
– Add 1 ml buffer PBS+1% BSA to each tube and centrifuge at 300 xg for 6 minutes
– Decant supernatant – Vortex – Re-suspend in 400 µl of buffer PBS+1% BSA
03. Stain whole blood – Add 50 μl of brilliant staining buffer to each
DURAClone tube – Add titrated test amounts of each drop-in antibody
and iFluor 860 to each DURAClone tube – Label an additional 12x75 mm tube as unstained
whole blood – Add 100 μl of fresh whole blood to each mixed
antibody reagent tube and unstained whole blood tube
– Vortex at high speed for 6 to 8 seconds – Incubate tubes for 15 minutes, protected from light – Add 2 ml of VersaLyse – Vortex each tube at high speed for 1 to 3 seconds – Incubate each tube at room temperature, protected
from light – Centrifuge each tube at 200 xg for 5 minutes – Aspirate the supernatant and discard – Gently tap the cell pellet to suspend into residual
supernatant – Add 5 µl of the IR Fixable dye to each mixed antibody
reagent tube – Incubate for 20 minutes at room temperature,
protected from light – Perform a wash step by re-suspending the cell pellet
in 3 ml 1X PBS+1% BSA – Aspirate the supernatant and discard – Gently tap the cell pellet and re-suspend the cell
pellet in 500 μl of 1X PBS+1% BSA
ACQUISITION
04. Daily start up – Run the CytoFLEX system start-up program – Verify the detector configuration – Run the quality control procedure according to the
user manual: CytoFLEX Series Instructions for Use (IFU), document number B49006
05. Create compensation experiment – For your DURAClone controls and drop-ins, include
the lot # to allow for updating the compensation controls when lots change
– Select bead in the sample type column to reflect your single colour controls
– Uncheck using a universal negative, as VersaComp beads have a negative peak in each tube
– Record each compensation sample – Move the scatter gate to contain singlet beads
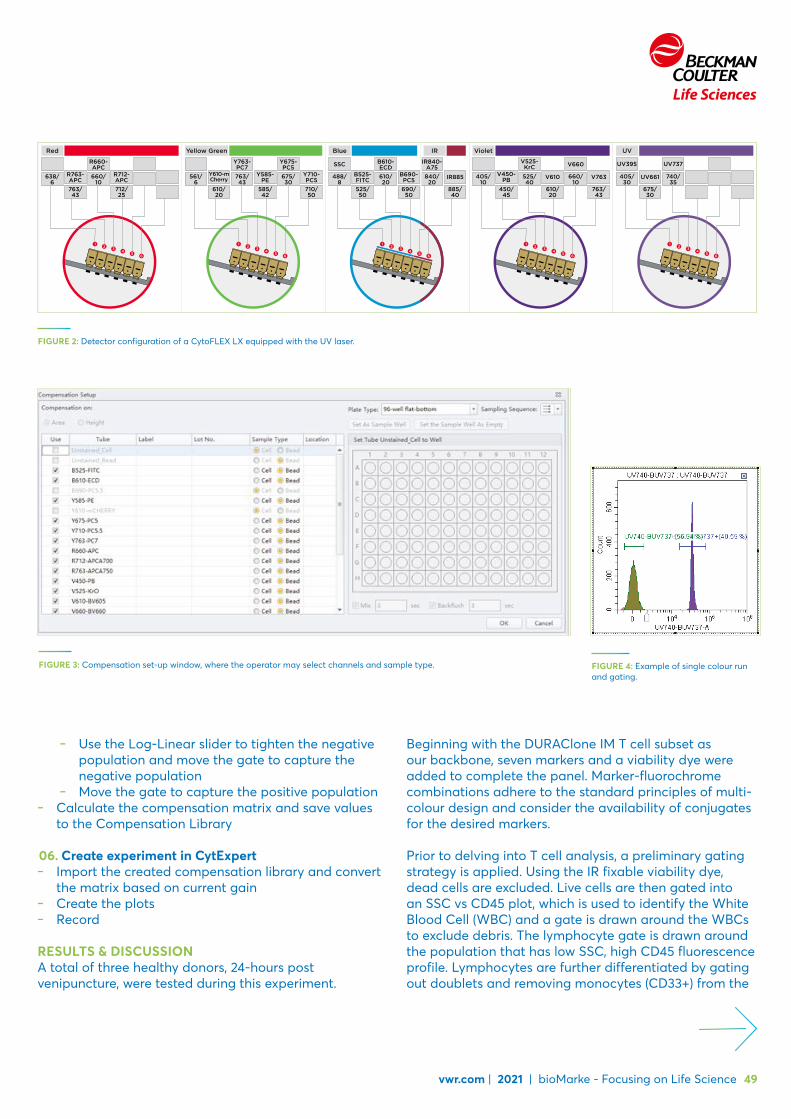
561/6
610/20
585/42
Y585-PE
710/50
Y710-PC5675/
30
Y675-PC5
763/43
Y763-PC7
Y610-mCherry638/
6763/43
712/25
R712-APC660/
10
R660-APC
R763-APC
Red
405/10
450/45
610/20
763/43
V610 V763525/40
660/10
V525-KrC V660
V450-PB
Violet
405/30
675/30
740/35
UV737UV395
UV661
UV
488/8
525/50
690/50
885/40
B690-PC5 IR885840/
20610/20
B610-ECD
IR840-A75SSC
B525-FITC
Blue IRYellow Green
vwr.com | 2021 | bioMarke - Focusing on Life Science 49
– Use the Log-Linear slider to tighten the negative population and move the gate to capture the negative population
– Move the gate to capture the positive population – Calculate the compensation matrix and save values
to the Compensation Library
06. Create experiment in CytExpert – Import the created compensation library and convert
the matrix based on current gain – Create the plots – Record
RESULTS & DISCUSSIONA total of three healthy donors, 24-hours post venipuncture, were tested during this experiment.
FIGURE 2: Detector configuration of a CytoFLEX LX equipped with the UV laser.
FIGURE 3: Compensation set-up window, where the operator may select channels and sample type. FIGURE 4: Example of single colour run and gating.
Beginning with the DURAClone IM T cell subset as our backbone, seven markers and a viability dye were added to complete the panel. Marker-fluorochrome combinations adhere to the standard principles of multi-colour design and consider the availability of conjugates for the desired markers.
Prior to delving into T cell analysis, a preliminary gating strategy is applied. Using the IR fixable viability dye, dead cells are excluded. Live cells are then gated into an SSC vs CD45 plot, which is used to identify the White Blood Cell (WBC) and a gate is drawn around the WBCs to exclude debris. The lymphocyte gate is drawn around the population that has low SSC, high CD45 fluorescence profile. Lymphocytes are further differentiated by gating out doublets and removing monocytes (CD33+) from the
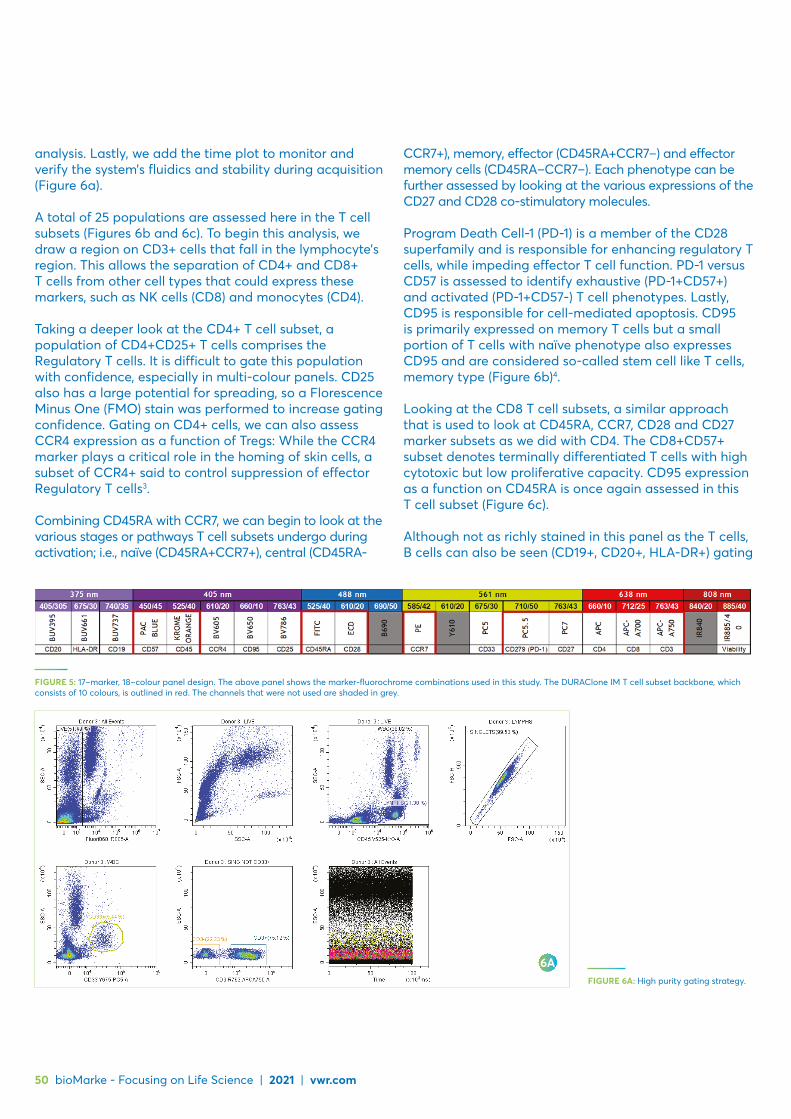
50 bioMarke - Focusing on Life Science | 2021 | vwr.com
analysis. Lastly, we add the time plot to monitor and verify the system’s fluidics and stability during acquisition (Figure 6a).
A total of 25 populations are assessed here in the T cell subsets (Figures 6b and 6c). To begin this analysis, we draw a region on CD3+ cells that fall in the lymphocyte’s region. This allows the separation of CD4+ and CD8+ T cells from other cell types that could express these markers, such as NK cells (CD8) and monocytes (CD4).
Taking a deeper look at the CD4+ T cell subset, a population of CD4+CD25+ T cells comprises the Regulatory T cells. It is difficult to gate this population with confidence, especially in multi-colour panels. CD25 also has a large potential for spreading, so a Florescence Minus One (FMO) stain was performed to increase gating confidence. Gating on CD4+ cells, we can also assess CCR4 expression as a function of Tregs: While the CCR4 marker plays a critical role in the homing of skin cells, a subset of CCR4+ said to control suppression of effector Regulatory T cells3.
Combining CD45RA with CCR7, we can begin to look at the various stages or pathways T cell subsets undergo during activation; i.e., naïve (CD45RA+CCR7+), central (CD45RA-
CCR7+), memory, effector (CD45RA+CCR7–) and effector memory cells (CD45RA–CCR7–). Each phenotype can be further assessed by looking at the various expressions of the CD27 and CD28 co-stimulatory molecules.
Program Death Cell-1 (PD-1) is a member of the CD28 superfamily and is responsible for enhancing regulatory T cells, while impeding effector T cell function. PD-1 versus CD57 is assessed to identify exhaustive (PD-1+CD57+) and activated (PD-1+CD57-) T cell phenotypes. Lastly, CD95 is responsible for cell-mediated apoptosis. CD95 is primarily expressed on memory T cells but a small portion of T cells with naïve phenotype also expresses CD95 and are considered so-called stem cell like T cells, memory type (Figure 6b)4.
Looking at the CD8 T cell subsets, a similar approach that is used to look at CD45RA, CCR7, CD28 and CD27 marker subsets as we did with CD4. The CD8+CD57+ subset denotes terminally differentiated T cells with high cytotoxic but low proliferative capacity. CD95 expression as a function on CD45RA is once again assessed in this T cell subset (Figure 6c).
Although not as richly stained in this panel as the T cells, B cells can also be seen (CD19+, CD20+, HLA-DR+) gating
FIGURE 5: 17–marker, 18–colour panel design. The above panel shows the marker-fluorochrome combinations used in this study. The DURAClone IM T cell subset backbone, which consists of 10 colours, is outlined in red. The channels that were not used are shaded in grey.
FIGURE 6A: High purity gating strategy.
6A
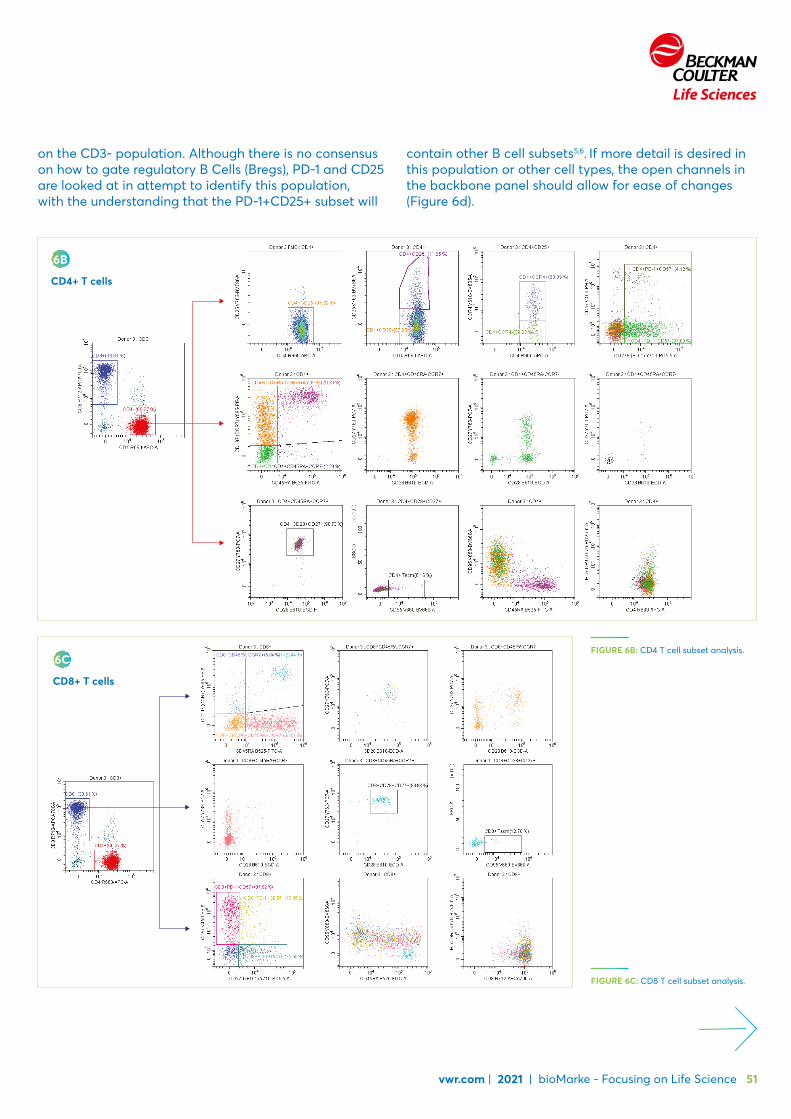
vwr.com | 2021 | bioMarke - Focusing on Life Science 51
on the CD3- population. Although there is no consensus on how to gate regulatory B Cells (Bregs), PD-1 and CD25 are looked at in attempt to identify this population, with the understanding that the PD-1+CD25+ subset will
contain other B cell subsets5,6. If more detail is desired in this population or other cell types, the open channels in the backbone panel should allow for ease of changes (Figure 6d).
FIGURE 6B: CD4 T cell subset analysis.
FIGURE 6C: CD8 T cell subset analysis.
CD4+ T cells
6B
CD8+ T cells
6C
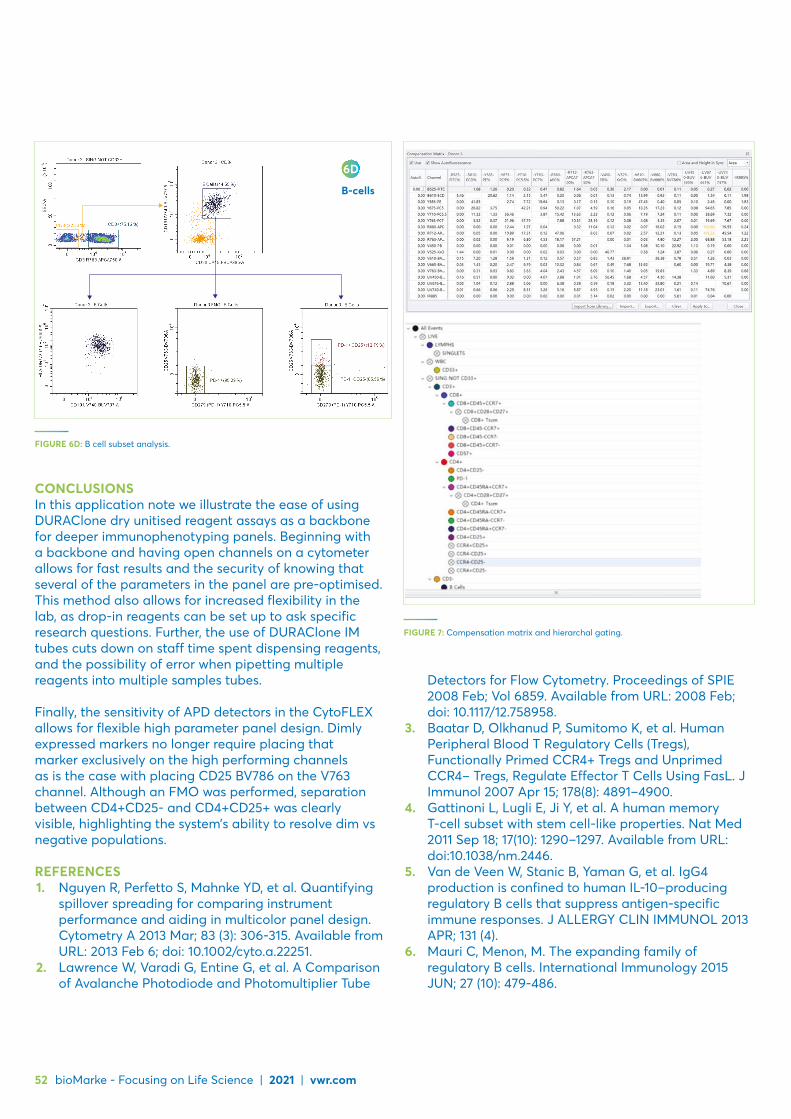
52 bioMarke - Focusing on Life Science | 2021 | vwr.com
CONCLUSIONSIn this application note we illustrate the ease of using DURAClone dry unitised reagent assays as a backbone for deeper immunophenotyping panels. Beginning with a backbone and having open channels on a cytometer allows for fast results and the security of knowing that several of the parameters in the panel are pre-optimised. This method also allows for increased flexibility in the lab, as drop-in reagents can be set up to ask specific research questions. Further, the use of DURAClone IM tubes cuts down on staff time spent dispensing reagents, and the possibility of error when pipetting multiple reagents into multiple samples tubes.
Finally, the sensitivity of APD detectors in the CytoFLEX allows for flexible high parameter panel design. Dimly expressed markers no longer require placing that marker exclusively on the high performing channels as is the case with placing CD25 BV786 on the V763 channel. Although an FMO was performed, separation between CD4+CD25- and CD4+CD25+ was clearly visible, highlighting the system’s ability to resolve dim vs negative populations.
REFERENCES1. Nguyen R, Perfetto S, Mahnke YD, et al. Quantifying
spillover spreading for comparing instrument performance and aiding in multicolor panel design. Cytometry A 2013 Mar; 83 (3): 306-315. Available from URL: 2013 Feb 6; doi: 10.1002/cyto.a.22251.
2. Lawrence W, Varadi G, Entine G, et al. A Comparison of Avalanche Photodiode and Photomultiplier Tube
Detectors for Flow Cytometry. Proceedings of SPIE 2008 Feb; Vol 6859. Available from URL: 2008 Feb; doi: 10.1117/12.758958.
3. Baatar D, Olkhanud P, Sumitomo K, et al. Human Peripheral Blood T Regulatory Cells (Tregs), Functionally Primed CCR4+ Tregs and Unprimed CCR4− Tregs, Regulate Effector T Cells Using FasL. J Immunol 2007 Apr 15; 178(8): 4891–4900.
4. Gattinoni L, Lugli E, Ji Y, et al. A human memory T-cell subset with stem cell-like properties. Nat Med 2011 Sep 18; 17(10): 1290–1297. Available from URL: doi:10.1038/nm.2446.
5. Van de Veen W, Stanic B, Yaman G, et al. IgG4 production is confined to human IL-10–producing regulatory B cells that suppress antigen-specific immune responses. J ALLERGY CLIN IMMUNOL 2013 APR; 131 (4).
6. Mauri C, Menon, M. The expanding family of regulatory B cells. International Immunology 2015 JUN; 27 (10): 479-486.
B-cells
6D
FIGURE 6D: B cell subset analysis.
FIGURE 7: Compensation matrix and hierarchal gating.

vwr.com | 2021 | bioMarke - Focusing on Life Science 53
IgGY Antibody SelectorSearch, Select, Simple.
Using the IgGy Antibody Selector makes searching for antibodies easier.
Avantor has brought together a multitude of antibody suppliers and manufacturers with hundreds of thousands of antibodies to meet your specific application needs.
With Avantor, IgGy offers:
— More than 500 000 antibodies — Brands you know and trust — Wide range of conjugations — Choices from multiple suppliers — Resource for all application areas — Compare option
vwr.com/antibody

54 bioMarke - Focusing on Life Science | 2021 | vwr.com
Five microscopes in one to view and capture more publication quality dataAUTOMATED | UPRIGHT | INVERTED | BRIGHTFIELD | FLUORESCENCE
Microscopes are very powerful tools, essential for research and discovery. However, most advanced systems on the market today are overly complicated and highly application-specific.
Revolution can accommodate a variety of core imaging techniques. Its unique, automated hybrid design provides you with more capability than any other widefield microscope on the market.

ADVANCED CAPABILITIES BUILT FOR DISCOVERY
Upright Inverted
vwr.com | 2021 | bioMarke - Focusing on Life Science 55
LIVE CELL IMAGINGView and capture live samples with automated time-lapse microscopy.
STAGE TOP INCUBATIONEnsures optimal conditions for maintaining cell viability.
MULTI-CHANNEL Capture and overlay multiple wavelengths in epi-fluorescence.
MULTI-POINTSet multiple acquisition points to view and revisit over time.
IMAGE STITCHINGCapture and stitch to form large FOV, high resolution images.
For more information and video of Revolution: discover-echo.com/revolution
For more information on cell analysis solutions: vwr.com/cms/featured_solutions_analysis
Z-STACKAcquire and stack images at multiple focal planes.
AUTO FOCUSAutomatically find and track best Z-plane(s) for focus.
HYPERSCANHigh speed continuous image stitching.

56 bioMarke - Focusing on Life Science | 2021 | vwr.com
02 Sample to sequence

DISCOVERMORE AT
VWR.COM
Increase your throughput and gain more insight while saving costs and time.
vwr.com | 2021 | bioMarke - Focusing on Life Science 57

58 bioMarke - Focusing on Life Science | 2021 | vwr.com
Taking bio sampling to the next levelAhlstrom-Munksjö GenSaver™ 2.0 collection cards, specifically developed for Dried Blood Spot, make collection and long-term storage of biological samples easy, efficient and cost-effective.
Dried Blood Spot (DBS) is a very simple and cost-effective solution for collecting and storing biological samples on filter paper. Although this technique has been used for almost 50 years, it has gained increasing interest in recent times as a sampling method that can be performed outside care facilities by capillary puncture, simply transported by mail and safely stored at ambient temperature.
The collection of biological samples, being blood, saliva or urine on filter paper provides various advantages compared to traditional sampling: DBS is a minimally invasive technique with minimal pain; and it requires only a few drops of blood or a small quantity of other biological fluids. Moreover, the process doesn’t need to be performed by skilled healthcare personnel, and samples can be collected in remote locations, a crucial benefit for allowing easy access to diagnosis even in challenging environments or settings lacking healthcare infrastructures. Finally, transport and storage at ambient temperature with minimal space required, make the technology cost effective compared to liquid sampling.The Dried Blood Spot technology finds ideal use in various end applications including infectious diseases screening, human identification, forensic sciences, therapeutic drug monitoring, wellness, clinical diagnostics and biobanking.
IMPROVING ACCESS TO INFECTIOUS DISEASE DIAGNOSIS WORLDWIDEDBS sampling is a clinically relevant tool to improve access to infectious disease diagnosis worldwide. Measuring HIV viral loads and monitoring the efficiency of antiretroviral treatments are rarely available in resource-limited countries because of the high cost
and stringent requirement for transport and storage of biological samples. The clinical utility of DBS sampling offers a sustainable alternative to the reference samples – plasma and serum – in situations with low technology settings, where there are no facilities or expertise to take venous whole blood specimens, or where transport of body fluids is difficult.
Thanks to the minimal volumes of whole blood needed, and ambient transport through conventional mail, DBS improves access to vulnerable patient groups living in non urban areas and ensures better therapy monitoring.
The benefits of this method for blood collection and transport has recently led the World Health Organisation to recommend DBS for HIV and hepatitis B and C diagnosis.

vwr.com | 2021 | bioMarke - Focusing on Life Science 59
DRIED BLOOD SPOT: AN EMERGING TECHNOLOGY FOR FORENSIC SCIENCES & HUMAN IDENTIFICATIONThe continuous progress of forensic investigation technologies requires the development of less invasive procedures for screening and sampling of small volumes. DBS technology has become the preferred method for DNA samples collection for human genetics and forensic DNA identification.
The reduced size of DBS allows easy storage of biological samples at ambient temperature, a key factor for forensic laboratories which typically handle a significant number of samples simultaneously. Moreover, the long-term ambient DNA preservation offered by chemically treated collection cards, such as Ahlstrom-Munksjö GenSaver™ 2.0, and customised kits doesn’t only impact the way samples are collected, transported and stored, but also allows analysis from samples that might otherwise remain untested.
AHLSTROM-MUNKSJÖ GENSAVER™ 2.0: SIMPLE COLLECTION, LONG-TERM PRESERVATION, HIGH QUALITY GENETIC PROFILESGenSaver™ 2.0 cards for the collection of biological samples are specifically developed to allow long-term preservation of DNA. These cards are treated with a proprietary stabilising chemistry intended to prevent environmentally-induced degradation, maintaining the quality of DNA intact over time and improving qualitative and quantitative DNA recovery.
Thanks to these features, the DNA preserved on GenSaver™ 2.0 can be used even after 22 years of storage of biological samples at ambient temperature to generate high quality next generation sequencing data. Reliability of the results is also provided by the manufacturing compliance to ISO 18385, the world’s first international standard for forensic consumables, minimising the risk of DNA contamination.
LONG-TERM PRESERVATION OF DNA ON GENSAVERTM 2.0 AND GENSAVERTM COLOR 2.0 COLLECTION CARDSThis study was designed to investigate the extraction yield and quality of human genomic DNA (hgDNA) from blood and saliva samples collected and stored at ambient temperature on Ahlstrom-Munksjö GenSaver™ 2.0 and GenSaver™ Color 2.0 collection cards. The results demonstrated a very good preservation of human genomic DNA stored 22 years at ambient temperature, highlighted by:
– Good extraction yield of DNA – High quality STR profiles – High quality of extracted DNA leading to relevant NGS data
MATERIALS & METHODSSamples collectionBuccal cells and whole human blood samples were collected from individuals on GenSaver™ 2.0 and on GenSaver™ Color 2.0 respectively based on the manufacturer’s recommendation. They were then air dried for 24 hours at ambient temperature.
Samples storageAfter drying, the samples were placed in air-permeable envelopes containing a desiccant and stored at ambient temperature protected from moisture and light for 5, 10, 15 and 22 years, using accelerated ageing testing conditions (56 °C, HR 10%).
Human genomic DNA extraction and amplificationA 6 mm punch was removed with a disposable punch device from the centre of the dried matrix spots and placed in a clean RNase-/DNase-free 1,5 ml tube. Extraction of hg DNA was done from the discs using the Crime Prep Adem from Ademtech, according to the manufacturer’s instructions. Crime Prep Adem-kit is specifically designed for forensic DNA laboratories for case work samples. The kit maximises quantity and quality of recovered DNA.
Real-time PCR was performed in 96-well plates on a 7500 Real Time PCR System using Quantifiler™ Trio DNA Quantitation.
The DNA quantitation assay used an internal PCR control (IPC) assay consisting of two primers for amplification of the IPC template DNA and one TaqMan MGB probe labelled with VIC™ dye for detecting the amplified IPC DNA. This IPC was used to assess the levels of amplification inhibition in the samples during PCR. Standard curves for DNA quantitation were prepared using control DNA supplied with the kit.
Short tandem repeat analysisSTR analyses were generated using extracted DNA. GlobalFiler™ Express PCR Amplification Kit from Applied Biosystems were used according to the manufacturer’s instructions.
Detection of amplified fragments was performed using the Applied Biosystems® 3500xL genetic analyser, and the analysis was performed with GeneMapper® ID-X software, version 1.4. Analysis was conducted using a threshold of 200 RFU, and data was evaluated for ‘first pass success rate’ (full profile obtained from one amplification and one CE injection) and Intra-locus balance.

60 bioMarke - Focusing on Life Science | 2021 | vwr.com
Next generation sequencingAfter DNA extraction, DNA amplification and creation of the amplicon library were performed using the Precision ID Library kit and Identity Panel (Life Technologies). Quantification of the libraries was performed using Ion Library TaqMan™ Quantitation and the analysis was performed on a 7500 Real Time PCR System. Sequencing of the amplicon libraries was carried out on an Ion 5S™ System from Applied Biosystems with kit Ion S5™ Precision ID Chef & Sequencing. SNPs data analysis was performed using HID SND Gentyper Plugin and Ion S5™ System – Torrent Suite™ software 5.2.2.
RESULTSSensitivity studyA total of 40 samples were tested with Ahlstrom-Munksjö specimen collection cards. Conditions and results are summarised in Table 1.
Several 27 cycles were selected as the optimum cycle number, as it produced an excellent first pass success rate while minimising partial profiles. Under this condition, all the samples collected on Ahlstrom-Munksjö cards and analysed with a peak amplitude threshold of 200 RFU, produced full profiles. No contamination was observed on any of the cards tested.
FIGURE 1: Amount of human genomic DNA extracted from dried blood spots stored on GenSaverTM 2.0 cards at ambient temperature.
FIGURE 2: Amount of human genomic DNA extracted from dried saliva spots stored on GenSaverTM Color 2.0 cards at ambient temperature.
Ahlstrom-Munksjö GenSaver™ cards
Number of samples
PCR cycles
Number of full profiles
First pass success rate
GenSaver™ 2.0 20 27 20/20 100%
GenSaver™ Color 2.0 20 27 20/20 100%
TABLE 1: Conditions and results.
Preservation of hgDNAExtraction of hgDNA yieldData in Figures 1 and 2 show reproducible high extraction yields of human genomic DNA from blood and saliva samples collected on GenSaver™ 2.0 and GenSaver™ Color 2.0 cards. Moreover, this data demonstrates a very good preservation of DNA for at least 22 years at ambient temperature.
Higher DNA yields were obtained from blood samples than from saliva samples, probably due to aggregation of cells on the fibre-based material, as regularly reported in the literature. No inhibition of the IPC of each sample was observed during qPCR.
High quality STR profilesShort Tandem Repeat analysisSTR data were generated to determine the accuracy of allele calls for genomic DNA extracted from blood samples and saliva samples collected on Ahlstrom-Munksjö collection cards and stored for 5, 10, 15 and 22 years at ambient temperature, protected from light. For each period of storage, STR analyses were run for three blood samples collected on GenSaver™ 2.0 cards, and three buccal cells samples collected on GenSaver™ Color 2.0 cards.
The data in Figures 3, 4, 5 and 6 show that extraction and purification of DNA from GenSaver™ 2.0 and GenSaver™ Color 2.0 cards provide DNA with sufficient quantity and high quality to support good allele calling accuracy. No sample required a re-injection for 100% accurate allele calls.
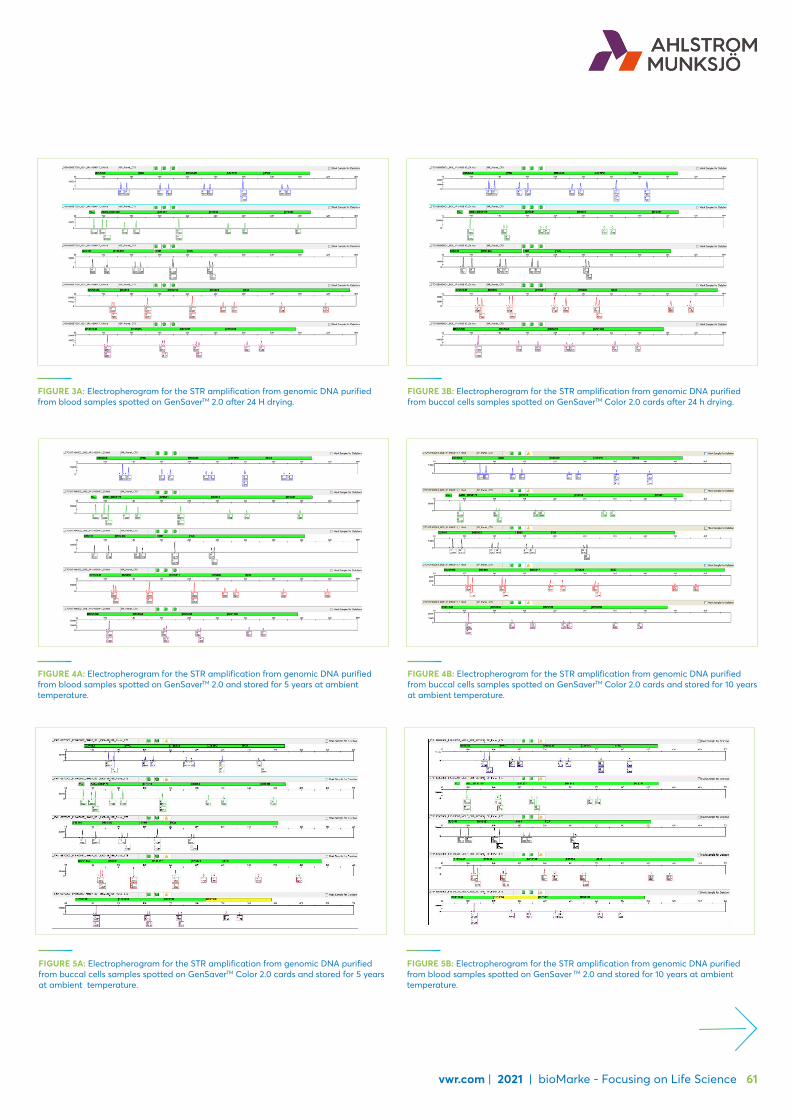
vwr.com | 2021 | bioMarke - Focusing on Life Science 61
FIGURE 3A: Electropherogram for the STR amplification from genomic DNA purified from blood samples spotted on GenSaverTM 2.0 after 24 H drying.
FIGURE 3B: Electropherogram for the STR amplification from genomic DNA purified from buccal cells samples spotted on GenSaverTM Color 2.0 cards after 24 h drying.
FIGURE 4A: Electropherogram for the STR amplification from genomic DNA purified from blood samples spotted on GenSaverTM 2.0 and stored for 5 years at ambient temperature.
FIGURE 4B: Electropherogram for the STR amplification from genomic DNA purified from buccal cells samples spotted on GenSaverTM Color 2.0 cards and stored for 10 years at ambient temperature.
FIGURE 5A: Electropherogram for the STR amplification from genomic DNA purified from buccal cells samples spotted on GenSaverTM Color 2.0 cards and stored for 5 years at ambient temperature.
FIGURE 5B: Electropherogram for the STR amplification from genomic DNA purified from blood samples spotted on GenSaver TM 2.0 and stored for 10 years at ambient temperature.
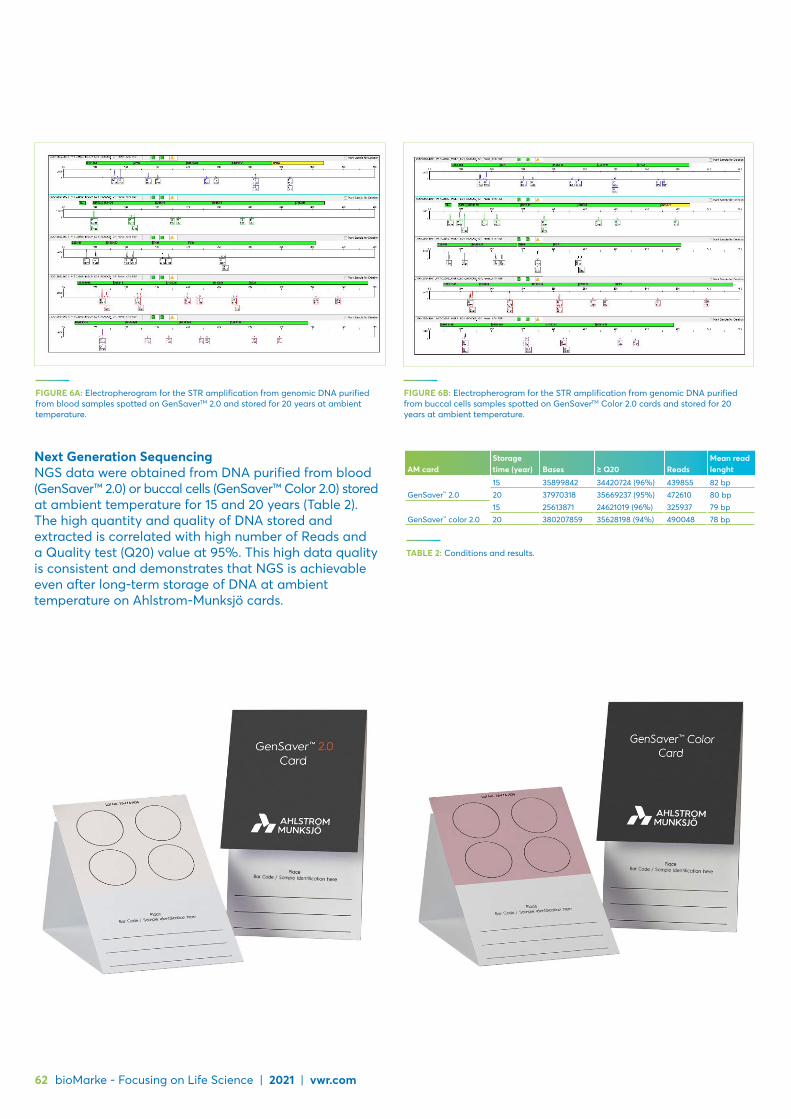
62 bioMarke - Focusing on Life Science | 2021 | vwr.com
Next Generation SequencingNGS data were obtained from DNA purified from blood (GenSaver™ 2.0) or buccal cells (GenSaver™ Color 2.0) stored at ambient temperature for 15 and 20 years (Table 2). The high quantity and quality of DNA stored and extracted is correlated with high number of Reads and a Quality test (Q20) value at 95%. This high data quality is consistent and demonstrates that NGS is achievable even after long-term storage of DNA at ambient temperature on Ahlstrom-Munksjö cards.
FIGURE 6A: Electropherogram for the STR amplification from genomic DNA purified from blood samples spotted on GenSaverTM 2.0 and stored for 20 years at ambient temperature.
FIGURE 6B: Electropherogram for the STR amplification from genomic DNA purified from buccal cells samples spotted on GenSaverTM Color 2.0 cards and stored for 20 years at ambient temperature.
AM cardStorage time (year) Bases ≥ Q20 Reads
Mean read lenght
GenSaver™ 2.015 35899842 34420724 (96%) 439855 82 bp20 37970318 35669237 (95%) 472610 80 bp
GenSaver™ color 2.015 25613871 24621019 (96%) 325937 79 bp20 380207859 35628198 (94%) 490048 78 bp
TABLE 2: Conditions and results.
vwr.com | 2021 | bioMarke - Focusing on Life Science 63
DOWNLOAD YOUR COPYVWR.COM
Solutions for nucleic acid preparationFeaturing tools needed along the entire workflow: Sample disruption and homogenisation, nucleic acid isolation, photometry, centrifugation and storage.
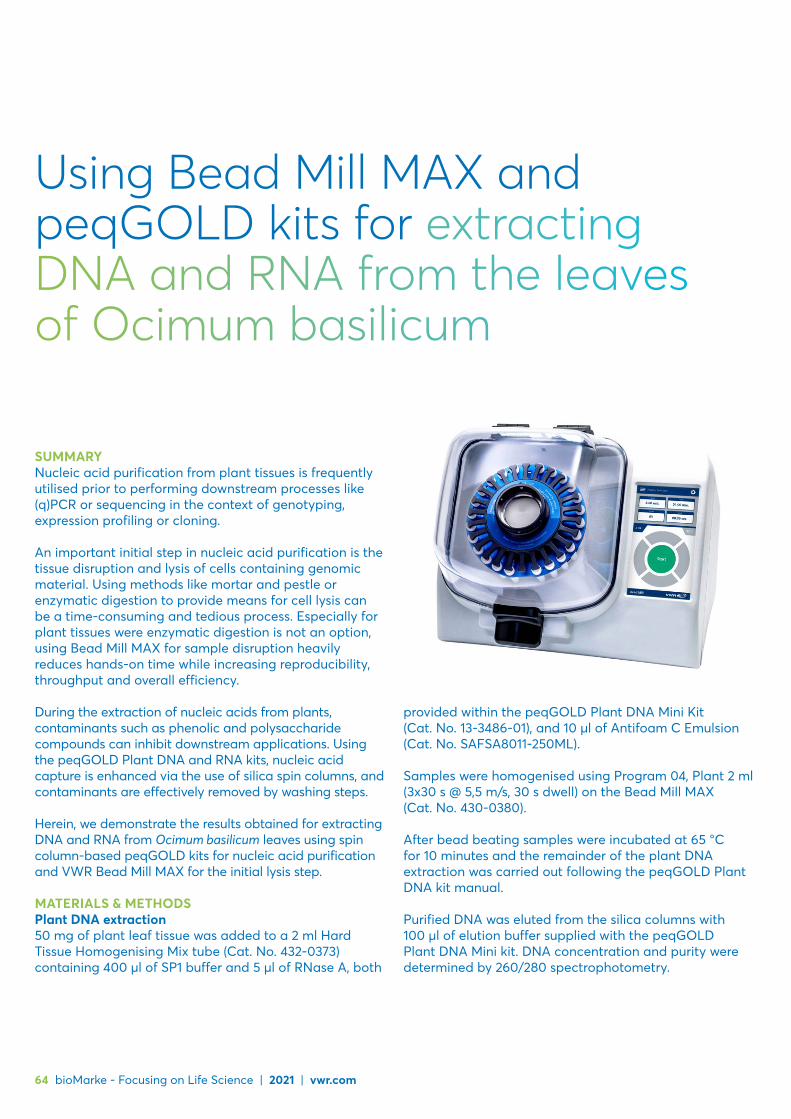
64 bioMarke - Focusing on Life Science | 2021 | vwr.com
Using Bead Mill MAX and peqGOLD kits for extracting DNA and RNA from the leaves of Ocimum basilicum
SUMMARYNucleic acid purification from plant tissues is frequently utilised prior to performing downstream processes like (q)PCR or sequencing in the context of genotyping, expression profiling or cloning.
An important initial step in nucleic acid purification is the tissue disruption and lysis of cells containing genomic material. Using methods like mortar and pestle or enzymatic digestion to provide means for cell lysis can be a time-consuming and tedious process. Especially for plant tissues were enzymatic digestion is not an option, using Bead Mill MAX for sample disruption heavily reduces hands-on time while increasing reproducibility, throughput and overall efficiency.
During the extraction of nucleic acids from plants, contaminants such as phenolic and polysaccharide compounds can inhibit downstream applications. Using the peqGOLD Plant DNA and RNA kits, nucleic acid capture is enhanced via the use of silica spin columns, and contaminants are effectively removed by washing steps.
Herein, we demonstrate the results obtained for extracting DNA and RNA from Ocimum basilicum leaves using spin column-based peqGOLD kits for nucleic acid purification and VWR Bead Mill MAX for the initial lysis step.
MATERIALS & METHODSPlant DNA extraction 50 mg of plant leaf tissue was added to a 2 ml Hard Tissue Homogenising Mix tube (Cat. No. 432-0373) containing 400 µl of SP1 buffer and 5 µl of RNase A, both
provided within the peqGOLD Plant DNA Mini Kit (Cat. No. 13-3486-01), and 10 µl of Antifoam C Emulsion (Cat. No. SAFSA8011-250ML).
Samples were homogenised using Program 04, Plant 2 ml (3x30 s @ 5,5 m/s, 30 s dwell) on the Bead Mill MAX (Cat. No. 430-0380).
After bead beating samples were incubated at 65 °C for 10 minutes and the remainder of the plant DNA extraction was carried out following the peqGOLD Plant DNA kit manual.
Purified DNA was eluted from the silica columns with 100 µl of elution buffer supplied with the peqGOLD Plant DNA Mini kit. DNA concentration and purity were determined by 260/280 spectrophotometry.

DL 1 2 RL 3 4
vwr.com | 2021 | bioMarke - Focusing on Life Science 65
For the determination of its integrity approximately 100 ng of eluted DNA was electrophoresed on a 2,0% agarose gel in TBE. After ethidium bromide staining, DNA bands were visualised on a gel documentation system following standard procedures.
Plant RNA extraction50 mg of plant leaf tissue was added to a 2 ml Hard Tissue Homogenising Mix tube (Cat. No. 432-0373) containing 500 µl of RB buffer (completed with 2-mercaptoethanol) supplied with the peqGOLD Plant RNA Kit (Cat. No. 13-6627-01) and 10 µl of Antifoam C Emulsion (Cat. No. SAFSA8011-250ML). Samples were homogenised using Program 04, Plant 2 ml (Figure 1) on the Bead Mill MAX (Cat. No. 430-0380). After sample lysis, the remainder of the plant RNA extraction was carried out following the peqGOLD Plant RNA kit manual.
Samples were eluted with 100 µl of nuclease-free water supplied with the peqGOLD Plant RNA kit. RNA concentration and purity were determined by 260/280 spectrophotometry.
For the determination of its integrity approximately 100 ng of eluted RNA was electrophoresed on a 2,0% agarose gel in TBE. After ethidium bromide staining, RNA bands were visualised on a gel documentation system following standard procedures.
RESULTS & CONCLUSIONSUsing Bead Mill MAX and peqGOLD kits, approximately 1 µg of DNA or 5 µg of RNA of reasonable purity could be extracted from 50 mg of fresh Ocimum basilicum leaves (Table 1 and 2). Gel electrophoresis revealed distinct bands for both DNA and RNA indicating good integrity and no relevant degradation took place during sample disruption, lysis and nucleic acid isolation.
Both the peqGOLD Plant DNA Mini Kit and peqGOLD Plant RNA Kit provide a quick and reproducible method for the extraction of high quality DNA and RNA from plant leaves. Through the addition of the Bead Mill MAX into
FIGURE 1: Bead Mill MAX program for plants.
the nucleic acid extraction protocol, the user can quickly and efficiently extract nucleic acid from up to 24 samples in parallel ensuring reproducibility and avoiding cross-contamination by using single-use bead beating tubes.
For applications involving different plant types than outlined in this application note, the same protocol can be followed. For specific parameters on different sample types or volumes/weights, see the technical document ‘’Recommendations for sample preparation via bead beating’’ on vwr.com/lifescience-applications.
Sample DNA concentration DNA yield A260/280
Basil 1 11 ng/µl 1,1 µg 1,9Basil 2 10 ng/µl 1,0 µg 1,8
TABLE 1: Photometric assessment of isolated DNA.
Sample RNA concentration RNA yield A260/280
Basil 3 41 ng/µl 4,1 µg 1,9Basil 4 52 ng/µl 5,2 µg 2,0
TABLE 2: Photometric assessment of isolated RNA.
FIGURES 2, 3: Agarose gel electrophoresis of isolated DNA (basil leaf samples 1 and 2, left) and RNA (basil leaf samples 3 and 4, right). DL = peqGOLD 100 bp DNA ladder, RL = RNA ladder.

66 bioMarke - Focusing on Life Science | 2021 | vwr.com
Using Bead Mill MAX and peqGOLD Total RNA Kit for extracting RNA from murine tissues
ABSTRACTThe extraction and isolation of RNA is an integral part of downstream analyses such as cDNA synthesis, RT-qPCR, RNA sequencing or Northern blotting. The importance of using pure, intact RNA for these processes is well documented. RNA is highly susceptible to RNase degradation following release of nucleases during the tissue disaggregation process. Therefore, proper sample handling and a quick yet effective tissue homogenisation process is crucial for any RNA-based assay.
Extracting total RNA from murine lung, liver and kidney samples using the peqGOLD Total RNA Kit we evaluated the impact of a) tissue disruption methodology (mortar and pestle vs. Bead Mill MAX bead beating), b) temperature (RT vs. 4 °C) and c) different velocities during bead beating.
The VWR Tissue RNA purification workflow produced higher RNA yields with acceptable RIN values when buffers were pre-chilled prior to sample handling and processing. The Bead Mill MAX with VWR peqGOLD Total RNA Kit reduced user time and manual intervention required in the RNA extraction process.
MATERIALS & METHODSMurine tissues (kidney, liver, and lung) were freshly harvested from CO2 euthanised BALB/c mice. 25 mg of each tissue was immediately placed in a 2 ml Hard Tissue Homogenizing tube (Cat. No. 432-0373). 500 μl of TRK lysis buffer, supplied with peqGOLD Total RNA Kit (Cat. No. 13-6834-01), containing 2-mercaptoethanol and pre-chilled on ice was added to each tube. Samples were
dissociated using the VWR Bead Mill MAX at various speeds (Table 1).
For comparison, 25 mg of each tissue was cryo-milled by hand using mortar/pestle and liquid nitrogen. The powdered tissue was transferred to a pre-chilled 1,5 ml microcentrifuge tube including 500 μl of chilled TRK lysis buffer containing 2-mercaptoethanol.
The VWR peqGOLD Total RNA Kit protocol was followed, with the following modifications: All steps were performed on ice, all centrifugation steps were performed at 4 °C, and an optional on-column DNase treatment step was performed using a total of 12 Units, at room temperature for 15 minutes. RNA was eluted in 100 μl DEPC water. For comparison, on one set of tissue samples, the protocol was carried out at room temperature using room temperature reagents.
For RNA quantification and integrity analysis 1 μl of purified RNA was analysed, in triplicate, on an Agilent 2100 Bioanalyzer in an RNA 6000 Nano kit chip, per the
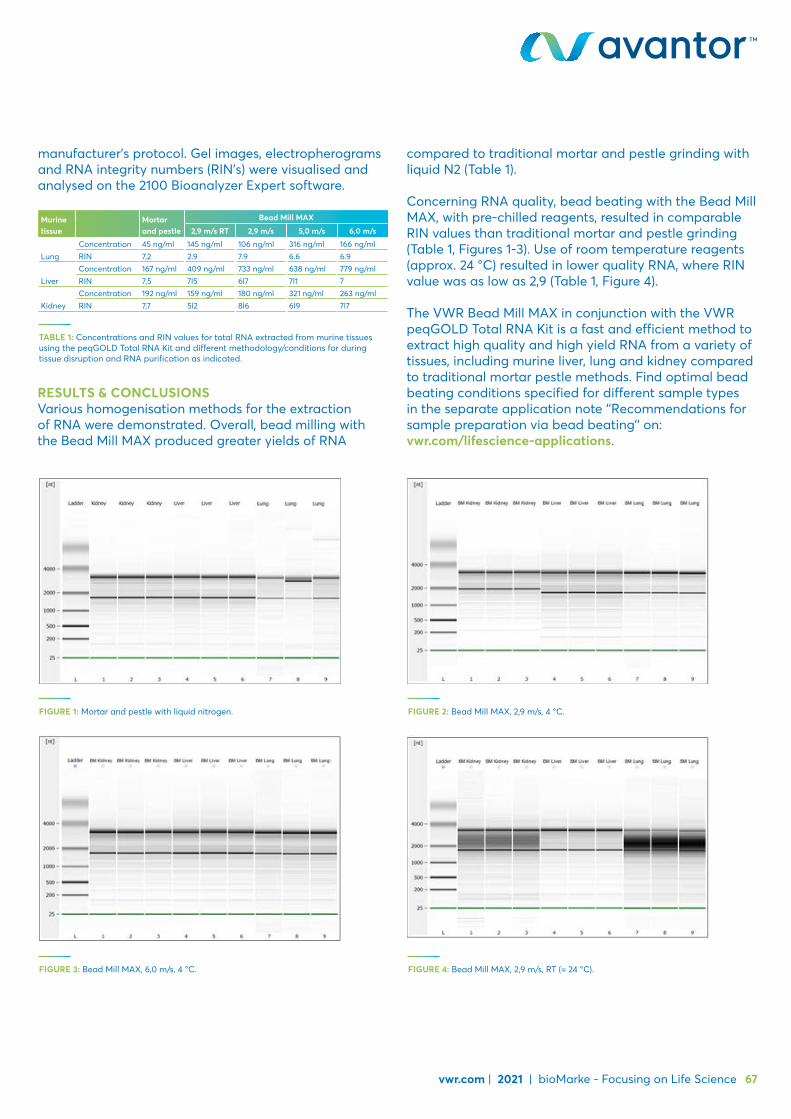
vwr.com | 2021 | bioMarke - Focusing on Life Science 67
manufacturer’s protocol. Gel images, electropherograms and RNA integrity numbers (RIN’s) were visualised and analysed on the 2100 Bioanalyzer Expert software.
Murine tissue
Mortar and pestle
Bead Mill MAX
2,9 m/s RT 2,9 m/s 5,0 m/s 6,0 m/s
LungConcentration 45 ng/ml 145 ng/ml 106 ng/ml 316 ng/ml 166 ng/mlRIN 7,2 2.9 7.9 6.6 6.9
LiverConcentration 167 ng/ml 409 ng/ml 733 ng/ml 638 ng/ml 779 ng/mlRIN 7,5 7l5 6l7 7l1 7
KidneyConcentration 192 ng/ml 159 ng/ml 180 ng/ml 321 ng/ml 263 ng/mlRIN 7,7 5l2 8l6 6l9 7l7
TABLE 1: Concentrations and RIN values for total RNA extracted from murine tissues using the peqGOLD Total RNA Kit and different methodology/conditions for during tissue disruption and RNA purification as indicated.
RESULTS & CONCLUSIONSVarious homogenisation methods for the extraction of RNA were demonstrated. Overall, bead milling with the Bead Mill MAX produced greater yields of RNA
compared to traditional mortar and pestle grinding with liquid N2 (Table 1).
Concerning RNA quality, bead beating with the Bead Mill MAX, with pre-chilled reagents, resulted in comparable RIN values than traditional mortar and pestle grinding (Table 1, Figures 1-3). Use of room temperature reagents (approx. 24 °C) resulted in lower quality RNA, where RIN value was as low as 2,9 (Table 1, Figure 4).
The VWR Bead Mill MAX in conjunction with the VWR peqGOLD Total RNA Kit is a fast and efficient method to extract high quality and high yield RNA from a variety of tissues, including murine liver, lung and kidney compared to traditional mortar pestle methods. Find optimal bead beating conditions specified for different sample types in the separate application note ‘’Recommendations for sample preparation via bead beating’’ on: vwr.com/lifescience-applications.
FIGURE 1: Mortar and pestle with liquid nitrogen. FIGURE 2: Bead Mill MAX, 2,9 m/s, 4 °C.
FIGURE 3: Bead Mill MAX, 6,0 m/s, 4 °C. FIGURE 4: Bead Mill MAX, 2,9 m/s, RT (= 24 °C).

68 bioMarke - Focusing on Life Science | 2021 | vwr.com
Transcriptomic analysis of cheese-ripening microbial communities with dual-RNA-SEQUniversité Paris-Saclay, INRAE, AgroParisTech, UMR SayFood, Thiverval-Grignon, France
CONTENTRipening cultures containing fungi and bacteria have a crucial role in the production of smear-ripened cheeses. Unfortunately, little is known about the biotic interactions within these microbial communities at the cheese surface, except for the positive impact of the pH increase initiated by fungi on the growth of several acid-sensitive bacteria such as Brevibacterium aurantiacum, and Hafnia alvei. In this work, the biotic interactions of a cheese ripening community composed of Debaryomyces hansenii, Brevibacterium aurantiacum, and Hafnia alvei, are explored thanks to a lab-scale mini cheese model which aims to reproduce cheese ripening conditions. The development of next generation sequencing techniques (NGS) over the past decade now allows researchers to analyse the transcriptome of multiple species present in the same sample simultaneously. Here, a relatively novel technique, dual-RNA-seq, was used to capture the transcriptome of D. hansenii, B. aurantiacum, and H. alvei and analyse the metabolic interactions between these species at the cheese surface.
MATERIALS & PROTOCOL
– Mini cheese production: Different mini cheeses were produced, with the complete community, with D. hansenii alone, with D. hansenii and H. alvei, and
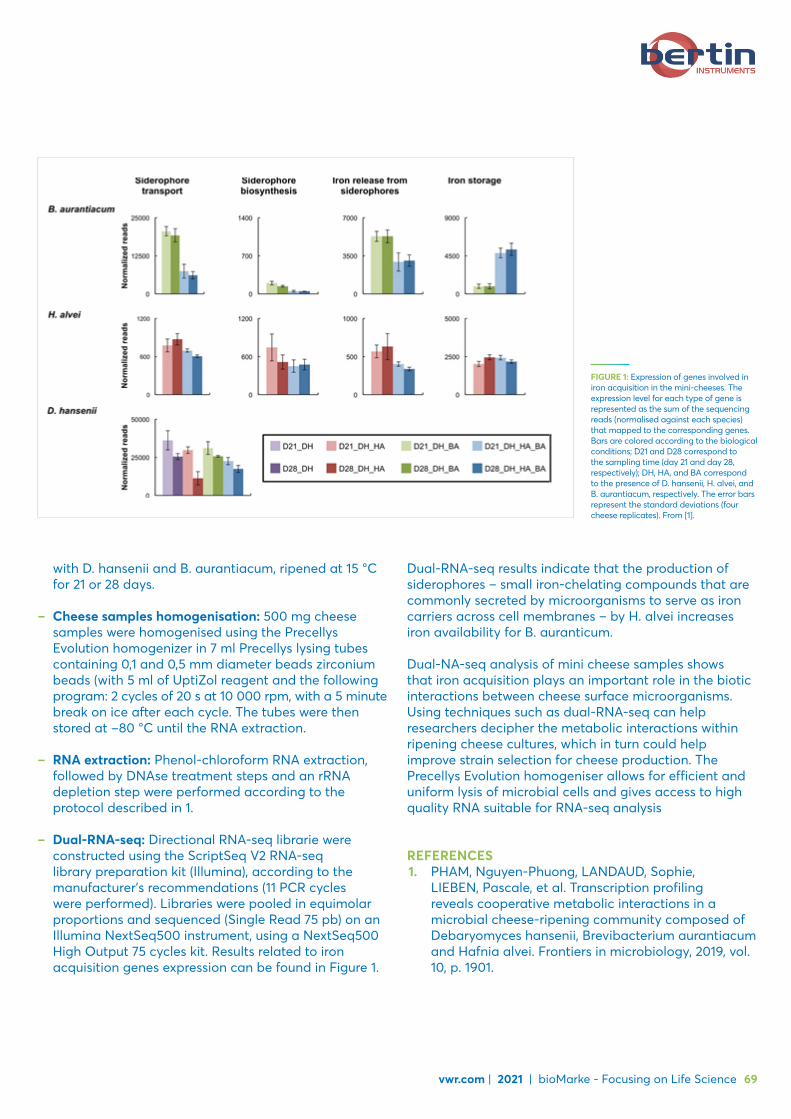
vwr.com | 2021 | bioMarke - Focusing on Life Science 69
with D. hansenii and B. aurantiacum, ripened at 15 °C for 21 or 28 days.
– Cheese samples homogenisation: 500 mg cheese samples were homogenised using the Precellys Evolution homogenizer in 7 ml Precellys lysing tubes containing 0,1 and 0,5 mm diameter beads zirconium beads (with 5 ml of UptiZol reagent and the following program: 2 cycles of 20 s at 10 000 rpm, with a 5 minute break on ice after each cycle. The tubes were then stored at −80 °C until the RNA extraction.
– RNA extraction: Phenol-chloroform RNA extraction, followed by DNAse treatment steps and an rRNA depletion step were performed according to the protocol described in 1.
– Dual-RNA-seq: Directional RNA-seq librarie were constructed using the ScriptSeq V2 RNA-seq library preparation kit (Illumina), according to the manufacturer’s recommendations (11 PCR cycles were performed). Libraries were pooled in equimolar proportions and sequenced (Single Read 75 pb) on an Illumina NextSeq500 instrument, using a NextSeq500 High Output 75 cycles kit. Results related to iron acquisition genes expression can be found in Figure 1.
Dual-RNA-seq results indicate that the production of siderophores – small iron-chelating compounds that are commonly secreted by microorganisms to serve as iron carriers across cell membranes – by H. alvei increases iron availability for B. auranticum.
Dual-NA-seq analysis of mini cheese samples shows that iron acquisition plays an important role in the biotic interactions between cheese surface microorganisms. Using techniques such as dual-RNA-seq can help researchers decipher the metabolic interactions within ripening cheese cultures, which in turn could help improve strain selection for cheese production. The Precellys Evolution homogeniser allows for efficient and uniform lysis of microbial cells and gives access to high quality RNA suitable for RNA-seq analysis
REFERENCES1. PHAM, Nguyen-Phuong, LANDAUD, Sophie,
LIEBEN, Pascale, et al. Transcription profiling reveals cooperative metabolic interactions in a microbial cheese-ripening community composed of Debaryomyces hansenii, Brevibacterium aurantiacum and Hafnia alvei. Frontiers in microbiology, 2019, vol. 10, p. 1901.
FIGURE 1: Expression of genes involved in iron acquisition in the mini-cheeses. The expression level for each type of gene is represented as the sum of the sequencing reads (normalised against each species) that mapped to the corresponding genes. Bars are colored according to the biological conditions; D21 and D28 correspond to the sampling time (day 21 and day 28, respectively); DH, HA, and BA correspond to the presence of D. hansenii, H. alvei, and B. aurantiacum, respectively. The error bars represent the standard deviations (four cheese replicates). From [1].
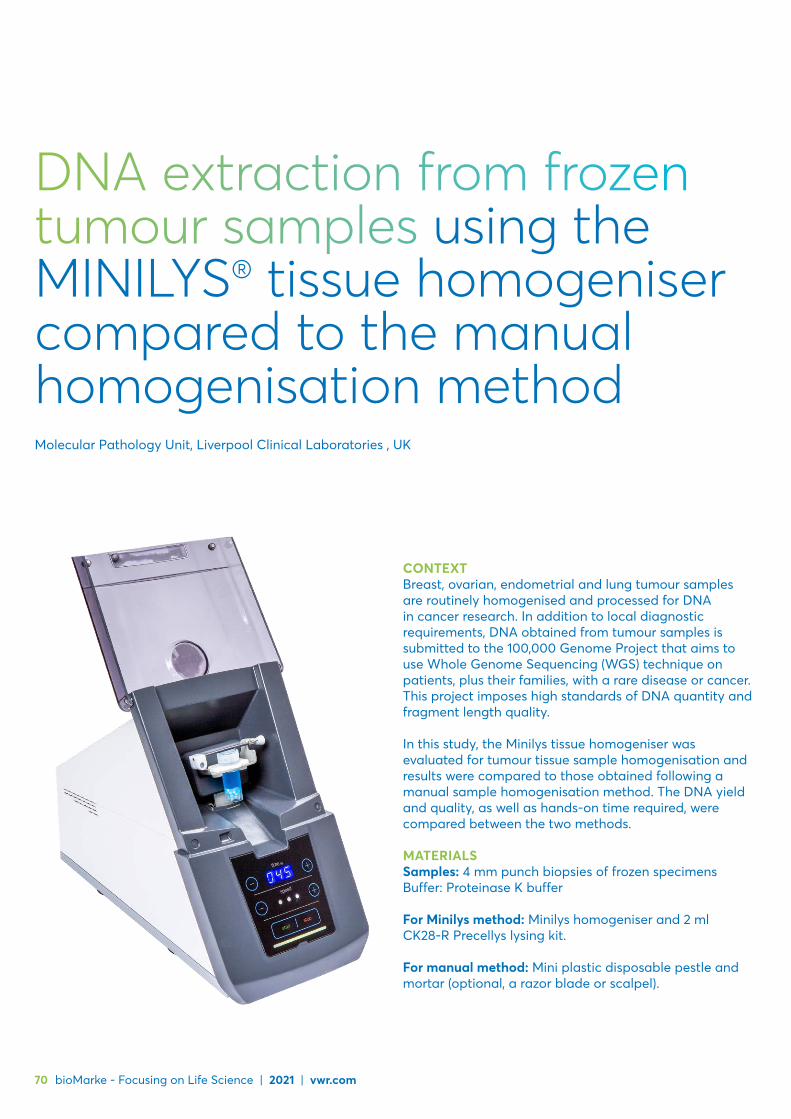
70 bioMarke - Focusing on Life Science | 2021 | vwr.com
DNA extraction from frozen tumour samples using the MINILYS® tissue homogeniser compared to the manual homogenisation methodMolecular Pathology Unit, Liverpool Clinical Laboratories , UK
CONTEXTBreast, ovarian, endometrial and lung tumour samples are routinely homogenised and processed for DNA in cancer research. In addition to local diagnostic requirements, DNA obtained from tumour samples is submitted to the 100,000 Genome Project that aims to use Whole Genome Sequencing (WGS) technique on patients, plus their families, with a rare disease or cancer. This project imposes high standards of DNA quantity and fragment length quality.
In this study, the Minilys tissue homogeniser was evaluated for tumour tissue sample homogenisation and results were compared to those obtained following a manual sample homogenisation method. The DNA yield and quality, as well as hands-on time required, were compared between the two methods.
MATERIALSSamples: 4 mm punch biopsies of frozen specimens Buffer: Proteinase K buffer
For Minilys method: Minilys homogeniser and 2 ml CK28-R Precellys lysing kit.
For manual method: Mini plastic disposable pestle and mortar (optional, a razor blade or scalpel).
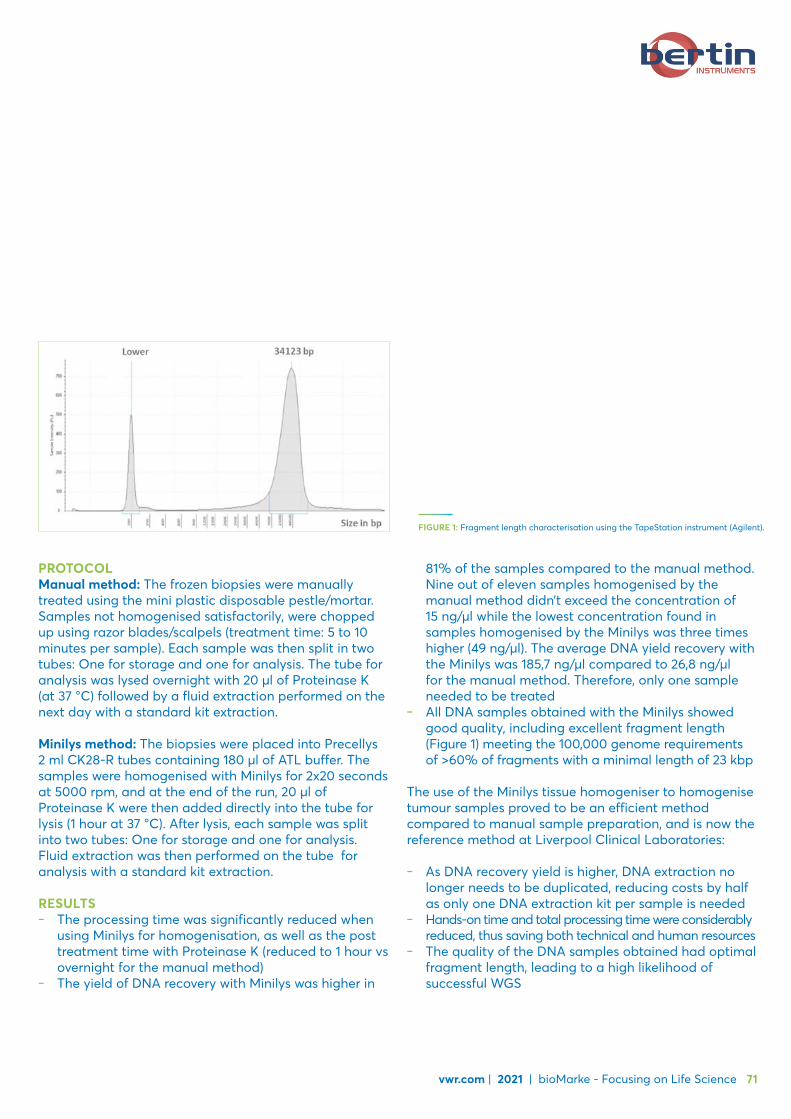
FIGURE 1: Fragment length characterisation using the TapeStation instrument (Agilent).
vwr.com | 2021 | bioMarke - Focusing on Life Science 71
PROTOCOLManual method: The frozen biopsies were manually treated using the mini plastic disposable pestle/mortar. Samples not homogenised satisfactorily, were chopped up using razor blades/scalpels (treatment time: 5 to 10 minutes per sample). Each sample was then split in two tubes: One for storage and one for analysis. The tube for analysis was lysed overnight with 20 µl of Proteinase K (at 37 °C) followed by a fluid extraction performed on the next day with a standard kit extraction.
Minilys method: The biopsies were placed into Precellys 2 ml CK28-R tubes containing 180 µl of ATL buffer. The samples were homogenised with Minilys for 2x20 seconds at 5000 rpm, and at the end of the run, 20 µl of Proteinase K were then added directly into the tube for lysis (1 hour at 37 °C). After lysis, each sample was split into two tubes: One for storage and one for analysis. Fluid extraction was then performed on the tube for analysis with a standard kit extraction.
RESULTS – The processing time was significantly reduced when
using Minilys for homogenisation, as well as the post treatment time with Proteinase K (reduced to 1 hour vs overnight for the manual method)
– The yield of DNA recovery with Minilys was higher in
81% of the samples compared to the manual method. Nine out of eleven samples homogenised by the manual method didn’t exceed the concentration of 15 ng/µl while the lowest concentration found in samples homogenised by the Minilys was three times higher (49 ng/µl). The average DNA yield recovery with the Minilys was 185,7 ng/µl compared to 26,8 ng/µl for the manual method. Therefore, only one sample needed to be treated
– All DNA samples obtained with the Minilys showed good quality, including excellent fragment length (Figure 1) meeting the 100,000 genome requirements of >60% of fragments with a minimal length of 23 kbp
The use of the Minilys tissue homogeniser to homogenise tumour samples proved to be an efficient method compared to manual sample preparation, and is now the reference method at Liverpool Clinical Laboratories:
– As DNA recovery yield is higher, DNA extraction no longer needs to be duplicated, reducing costs by half as only one DNA extraction kit per sample is needed
– Hands-on time and total processing time were considerably reduced, thus saving both technical and human resources
– The quality of the DNA samples obtained had optimal fragment length, leading to a high likelihood of successful WGS

72 bioMarke - Focusing on Life Science | 2021 | vwr.com
High throughput automated DNA extraction solution from whole blood samples using Omega Bio-tek’s reagents on the Tecan Fluent® 780 workstationKiranmai Durvasula1, Evan Wolfson1, Julie Baggs1, Travis Butts1 1Omega Bio-tek, Inc, Norcross GA 30071
INTRODUCTIONBlood is the most common biospecimen used to obtain genomic DNA for use in many genomic-based downstream analyses. For a successful downstream implementation, it is not only crucial to extract high quality, high yielding DNA, but also to meet the criteria of throughput, reliability and reproducibility. Omega Bio-tek has developed an automated solution using their Mag-Bind® Blood & Tissue DNA HDQ 96 Kit (M6399) on the Tecan Fluent 780 workstation to extract DNA from 250 µl blood in a high throughput fashion with minimal manual intervention. In this application note, we present the automated solution along with validation studies to demonstrate the performance of the system. The performance of the automated system was evaluated based on how closely it represents the manual approach in terms of yield, purity, and integrity of DNA extracted. Our results indicate that this automated workflow is capable of extracting high quality, high molecular weight DNA from 96x250 µl whole blood samples in less than 75 minutes.
MATERIALS & METHODSEight 250 µl aliquots from the same lot of human whole blood were transferred to a 96-well deep well plate and moved to the Tecan Fluent 780 workstation for DNA
purification. The Tecan instrument was programmed to perform various liquid handling and magnetic bead-based tasks as demanded by the Mag-Bind Blood & Tissue DNA HDQ 96 protocol for the extraction of genomic DNA. DNA was eluted in 100 µl of 10 mM Tris-HCl (pH 8,5). All consumables and carriers were placed onto the Tecan deck configured as shown in Figure 1. The extraction workflow was fully automated starting with the sample aliquot in the 96-well deep well plate to final eluted product. Manual extraction from the same lot of human blood was performed in parallel and compared to validate the automated purification methodology and instrument set-up.

vwr.com | 2021 | bioMarke - Focusing on Life Science 73
The purified DNA was quantified using Thermo Scientific’s NanoDrop™ 2000c system and absorbance measurements were made at the wavelengths of 230, 260 and 280 nm to assess the quality of the purified DNA and to probe if there was any contaminating RNA/protein or salt carryover. Promega’s QuantiFluor® dsDNA system was also employed to enable specific quantification of double-stranded DNA in the eluate without any interference from single-stranded DNA (ssDNA) and RNA. The size and integrity of the isolated genomic DNA was analysed on Agilent’s TapeStation® 2200 with a genomic DNA tape. The suitability of the extracted DNA for downstream applications was examined by performing Real-Time PCR using human-specific primers on 10-fold and 100-fold dilutions of the purified DNA. Agilent’s Brilliant III 2X SYBR® mix was used as the master mix following a standard amplification protocol on Agilent AriaMx.
RESULTS & DISCUSSIONThe DNA yields from the whole blood samples determined using the NanoDrop 2000c system as well as Promega’s QuantiFluor system are as shown in Figure 2. The average DNA yield from manual extraction was found to be comparable and not significantly different (Tukey’s post-hoc analysis; p>0,05) to the average DNA
yield obtained following automated protocol. These results validate the instrument set-up and automatedpurification protocol. DNA purity and quality were analysed looking at the A260/A280 and A260/A230 ratios obtained post spectrophotometric analysis (Figure 3). For both manual and automated protocols, the absorbance ratio of A260/A280 was consistently between 1,80 to1,84 indicating pure DNA free of contaminating RNA and proteins (Figure 3; data corresponding to the first five samples shown). The A260/A230 ratios were all greater than 2,0 (Figure 3) following either of the protocols implying low contamination carryover. Both the ratios indicate high quality DNA which is typically considered suitable for a variety of downstream applications. The purified DNA was also analysed on the TapeStation to derive information about the size and integrity of the genomic DNA extracted. DNA Integrity Number (DIN) was determined by the TapeStation 2200 analysis software, and typically DNA with a DIN of 10 was considered intact and of the highest integrity. Figure 4 shows the TapeStation analysis performed on DNA extracted from the first three samples using automated and manual protocols. The purified DNA following automated or manual protocol is of high molecular weight and migrated as a well defined band above the largest ladder peak (48,500 bp) with
FIGURE 1: Tecan Fluent 780 deck layout for extraction of 96 blood samples with an input volume of 250 µl each.
TECAN FLUENT 780 EXAMPLE DECK LAYOUT
01. 1000 and 200 µl DiTi storage (hanging or SBS)
02. Reagent troughs03. Standard 96-well elution
plate04. Alpaqua Magnum FLX plate
magnet05. NUNC 96 deep well sample
plate06. BioShake 3000-T elm heater/
shaker07. 500 µl MCA96 filtered DiTi08. 300 ml trough for liquid
waste09. 200 µl 8-stack nested
MCA96 DiTi10. EVA adapter
01
01
01
02
03
04
05
06
07
08
09
10
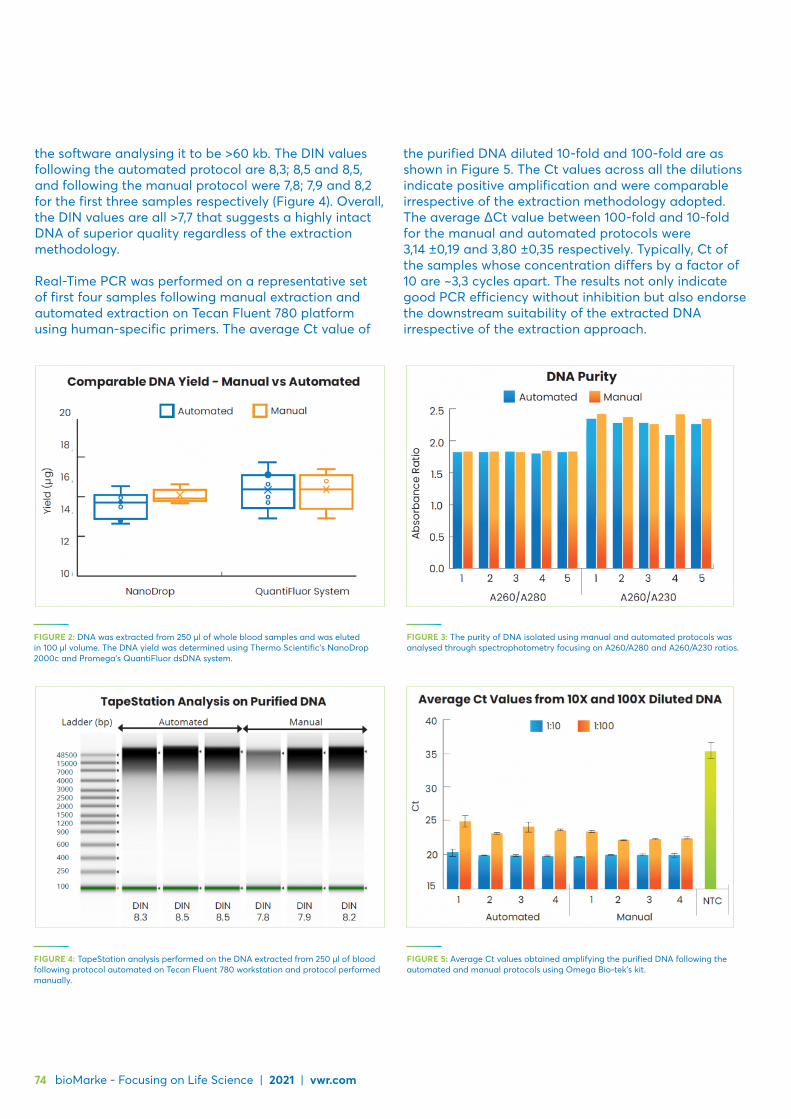
FIGURE 2: DNA was extracted from 250 µl of whole blood samples and was eluted in 100 µl volume. The DNA yield was determined using Thermo Scientific’s NanoDrop 2000c and Promega’s QuantiFluor dsDNA system.
FIGURE 3: The purity of DNA isolated using manual and automated protocols was analysed through spectrophotometry focusing on A260/A280 and A260/A230 ratios.
FIGURE 4: TapeStation analysis performed on the DNA extracted from 250 μl of blood following protocol automated on Tecan Fluent 780 workstation and protocol performed manually.
FIGURE 5: Average Ct values obtained amplifying the purified DNA following the automated and manual protocols using Omega Bio-tek’s kit.
74 bioMarke - Focusing on Life Science | 2021 | vwr.com
the software analysing it to be >60 kb. The DIN values following the automated protocol are 8,3; 8,5 and 8,5, and following the manual protocol were 7,8; 7,9 and 8,2 for the first three samples respectively (Figure 4). Overall, the DIN values are all >7,7 that suggests a highly intact DNA of superior quality regardless of the extraction methodology.
Real-Time PCR was performed on a representative set of first four samples following manual extraction and automated extraction on Tecan Fluent 780 platform using human-specific primers. The average Ct value of
the purified DNA diluted 10-fold and 100-fold are as shown in Figure 5. The Ct values across all the dilutions indicate positive amplification and were comparable irrespective of the extraction methodology adopted. The average ΔCt value between 100-fold and 10-fold for the manual and automated protocols were 3,14 ±0,19 and 3,80 ±0,35 respectively. Typically, Ct of the samples whose concentration differs by a factor of 10 are ~3,3 cycles apart. The results not only indicate good PCR efficiency without inhibition but also endorse the downstream suitability of the extracted DNA irrespective of the extraction approach.
Solutions for discovery
Instruments, reagents and accessories for:
‒ Nucleic acid electrophoresis ‒ Protein electrophoresis ‒ Blotting ‒ Bio imaging
VWR® electrophoresis
Explore more at vwr.com
vwr.com | 2021 | bioMarke - Focusing on Life Science 75
Description Cat. No.
Mag-Bind® Blood & Tissue DNA HDQ 96 Kit (1x96 preps) M6399-00Mag-Bind® Blood & Tissue DNA HDQ 96 Kit (4x96 preps) M6399-01
Ordering table
CONCLUSIONSOmega Bio-tek’s Mag-Bind Blood & Tissue DNA HDQ 96 Kit (M6399) integrated onto Tecan Fluent 780 workstation offers an automated, high throughput purification solution for gDNA purification from whole blood samples. The automated approach matches the quality parameters of the DNA extracted following manual extraction and using this workflow, 96x250 µl blood samples can be processed in less than 75 minutes. This deck configuration using this workflow has the capability to run four plates but can easily be adapted and scaled throughput wise to different fluent configurations
according to liquid handling arm availability and size. The high molecular weight and quality of the purified DNA substantiate its use in various downstream applications and make it particularly attractive for next generation sequencing technologies including those by Pacific Biosciences and Oxford Nanopore that require long single-molecule DNA fragments.
76 bioMarke - Focusing on Life Science | 2021 | vwr.com
RNA clean-up and size selection using sparQ PureMag Beads Keywords: sparQ PureMag Beads, clean-up, size selection, RNA, purification, RNase
ABSTRACT Nucleic acid purification is a necessary step in almost all molecular biology applications. In addition to DNA and cDNA, RNA clean-up is required in a growing number of applications, such as RNA-seq, purification of probes and in vitro transcription experiments. The reversible nucleic acid binding properties of magnetic beads has been optimised in sparQ PureMag Beads and is widely validated for DNA purification. In this application note, we demonstrate that sparQ PureMag Beads are also a highly efficient and reproducible method for RNA clean-up and size selection, further validating their flexibility and performance.
INTRODUCTION RNA purification is a key step in a wide variety of laboratory and clinical analysis. To provide relevant and reliable results, pure and intact molecules of RNA must be separated from a variety of mixtures. sparQ PureMag Beads use the reversible nucleic acid binding properties of magnetic beads for fast, efficient and flexible nucleic acid purification for multiple downstream applications. In particular, sparQ PureMag Beads can be used for the purification of RNA and cDNA from enzymatic reactions such as reverse transcription, in vitro transcription or during next generation sequencing (NGS) RNA-seq
workflows. An important consideration in such workflows is that reagents are free from RNases that could degrade the RNA sample. In this application note, we assessed the efficiency of ssRNA clean-up with sparQ PureMag Beads, using a low range ladder as the template to assess the capture of different RNA fragment lengths. We then tested the stability of RNA in the sparQ PureMag Bead solution, comparing results to a certified RNase-free, bead-based purification product (RNAClean™ XP, Beckman Coulter).
MATERIALS & METHODS RNA clean-up Low Range ssRNA Ladder was diluted 1:50 and mixed with sparQ PureMag Beads (Quantabio) or RNAClean XP (Beckman Coulter). The mixture was incubated at room temperature for 5 minutes then the beads pelleted on a magnet. The supernatant was discarded, and the bead-bound RNA washed twice with 200 μl 80% ethanol. The beads were air-dried then the RNA eluted in 20 μl RNase-free water.
Residual RNase testing (RNA stability) Low Range ssRNA Ladder was diluted 1:50 and mixed with 1X sparQ PureMag Beads or RNAClean XP. The mixtures were incubated for 0 or 4 hours (h) at room
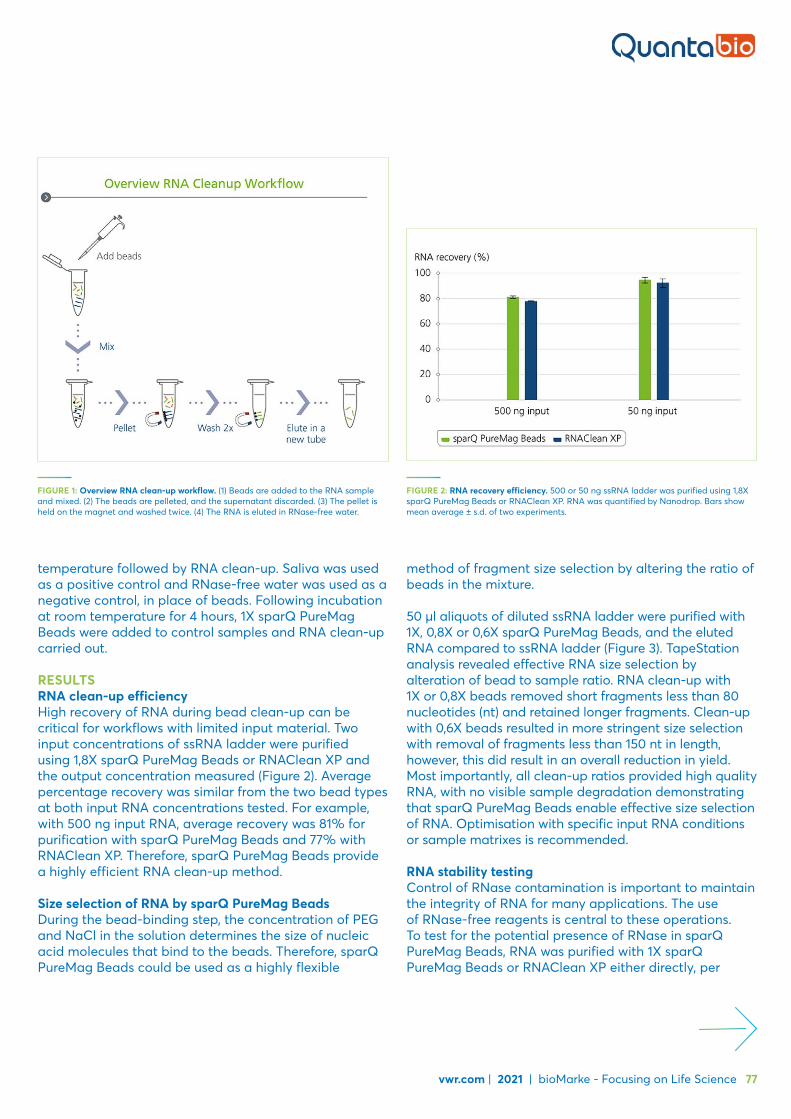
FIGURE 1: Overview RNA clean-up workflow. (1) Beads are added to the RNA sample and mixed. (2) The beads are pelleted, and the supernatant discarded. (3) The pellet is held on the magnet and washed twice. (4) The RNA is eluted in RNase-free water.
FIGURE 2: RNA recovery efficiency. 500 or 50 ng ssRNA ladder was purified using 1,8X sparQ PureMag Beads or RNAClean XP. RNA was quantified by Nanodrop. Bars show mean average ± s.d. of two experiments.
vwr.com | 2021 | bioMarke - Focusing on Life Science 77
temperature followed by RNA clean-up. Saliva was used as a positive control and RNase-free water was used as a negative control, in place of beads. Following incubation at room temperature for 4 hours, 1X sparQ PureMag Beads were added to control samples and RNA clean-up carried out.
RESULTSRNA clean-up efficiencyHigh recovery of RNA during bead clean-up can be critical for workflows with limited input material. Two input concentrations of ssRNA ladder were purified using 1,8X sparQ PureMag Beads or RNAClean XP and the output concentration measured (Figure 2). Average percentage recovery was similar from the two bead types at both input RNA concentrations tested. For example, with 500 ng input RNA, average recovery was 81% for purification with sparQ PureMag Beads and 77% with RNAClean XP. Therefore, sparQ PureMag Beads provide a highly efficient RNA clean-up method.
Size selection of RNA by sparQ PureMag BeadsDuring the bead-binding step, the concentration of PEG and NaCl in the solution determines the size of nucleic acid molecules that bind to the beads. Therefore, sparQ PureMag Beads could be used as a highly flexible
method of fragment size selection by altering the ratio of beads in the mixture.
50 μl aliquots of diluted ssRNA ladder were purified with 1X, 0,8X or 0,6X sparQ PureMag Beads, and the eluted RNA compared to ssRNA ladder (Figure 3). TapeStation analysis revealed effective RNA size selection by alteration of bead to sample ratio. RNA clean-up with 1X or 0,8X beads removed short fragments less than 80 nucleotides (nt) and retained longer fragments. Clean-up with 0,6X beads resulted in more stringent size selection with removal of fragments less than 150 nt in length, however, this did result in an overall reduction in yield. Most importantly, all clean-up ratios provided high quality RNA, with no visible sample degradation demonstrating that sparQ PureMag Beads enable effective size selection of RNA. Optimisation with specific input RNA conditions or sample matrixes is recommended.
RNA stability testingControl of RNase contamination is important to maintain the integrity of RNA for many applications. The use of RNase-free reagents is central to these operations. To test for the potential presence of RNase in sparQ PureMag Beads, RNA was purified with 1X sparQ PureMag Beads or RNAClean XP either directly, per

FIGURE 3: Size selection of RNA with sparQ PureMag Beads. ssRNA ladder was purified with 1X (yellow), 0,8X (green) or 0.6X (red). The eluted RNA, and a control sample of RNA ladder (blue), was diluted 10-fold and analysed on a TapeStation RNA High Sensitivity Screen Tape. An overlay of electropherograms for each sample is shown with labelled peaks.
FIGURE 4: RNA stability with sparQ PureMag Beads compared to RNAClean XP. ssRNA ladder was mixed with 1X sparQ PureMag Beads or RNAClean XP and either clean-up carried out immediately (0 hours) or the mixture incubated at room temperature for 4 hours before clean-up (4 hours). ssRNA was incubated for 4 hours with saliva as a positive control (+ve) or RNase-free water as a negative control (-ve). Combined digital gel images for TapeStation High Sensitivity tape analyses are shown.
78 bioMarke - Focusing on Life Science | 2021 | vwr.com
standard instructions, or after 4 hours incubation at room temperature. The quality of the eluted RNA was assessed by gel electrophoresis on a TapeStation RNA High Sensitivity Screen Tape. RNA purified by either sparQ PureMag Beads or RNAClean XP was comparable. For both products, after 4 hours incubation at room temperature, the bands of the ssRNA ladder were clearly visualised with no detectable smearing which would indicate RNA degradation These results demonstrate the absence of detectable RNase in sparQ PureMag Beads (Figure 4).
The negative control of ssRNA incubated with RNase-free water also produced clearly visible bands, confirming that the ladder itself did not contain RNase. In contrast, bands were not clearly visualised for the positive control of ssRNA incubated with saliva, indicating the presence of RNase and RNA degradation in this positive control.
DISCUSSION In this application note, we have demonstrated RNA purification with high recovery using sparQ PureMag Beads with up to 89% recovery with 1.8X bead clean-up. Additionally, by varying the bead to sample ratio, sparQ PureMag Beads can be used to select RNA fragments of a specific size ranges. Although, at very low bead to
sample ratios, there is a risk of reduced yield. We also conducted a test of RNA stability in the bead buffer solution. Preservation of RNA integrity following extended incubation at room temperature demonstrated that sparQ PureMag Beads were RNase-free. We compared these results to purification with RNAClean XP and found results to be equivalent to sparQ PureMag Beads.
In conclusion, sparQ PureMag Beads provide a fast, flexible and cost-effective alternative for RNA purification. sparQ PureMag Beads can easily be incorporated into a range of manual or automated RNA workflows to provide superior RNA recovery and quality for downstream applications.
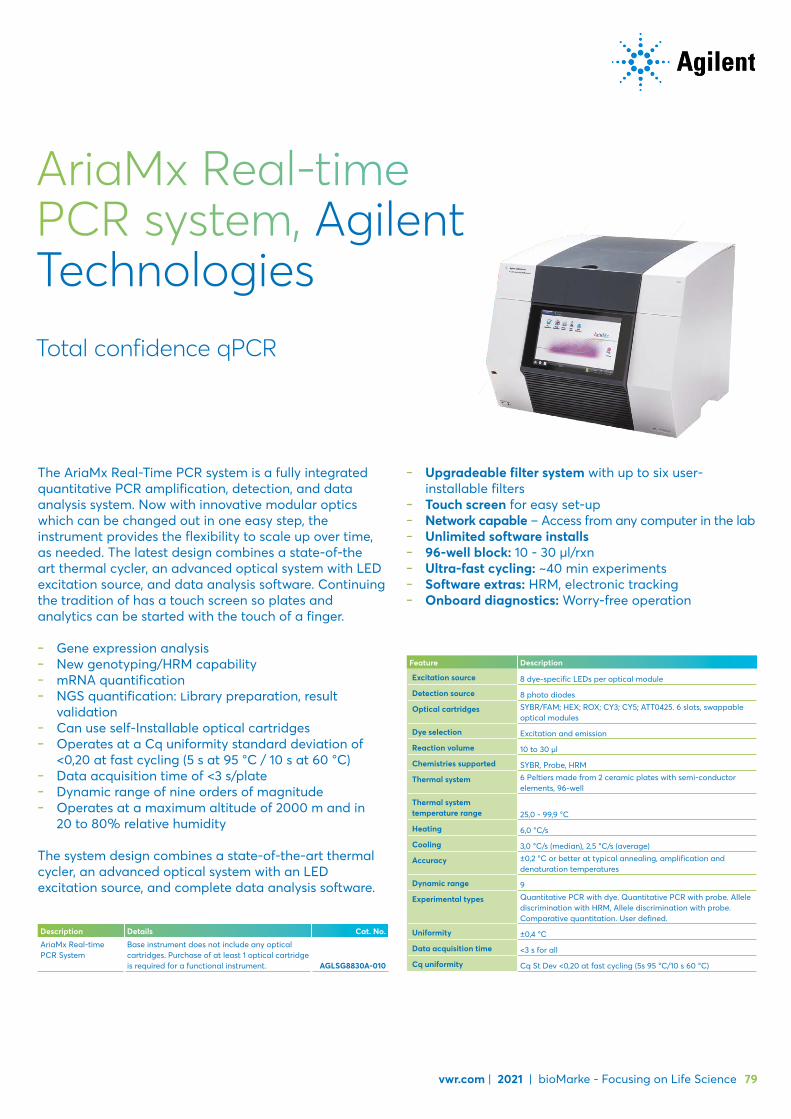
vwr.com | 2021 | bioMarke - Focusing on Life Science 79
Description Details Cat. No.
AriaMx Real-time PCR System
Base instrument does not include any optical cartridges. Purchase of at least 1 optical cartridge is required for a functional instrument. AGLSG8830A-010
AriaMx Real-time PCR system, Agilent TechnologiesTotal confidence qPCR
The AriaMx Real-Time PCR system is a fully integrated quantitative PCR amplification, detection, and data analysis system. Now with innovative modular optics which can be changed out in one easy step, the instrument provides the flexibility to scale up over time, as needed. The latest design combines a state-of-the art thermal cycler, an advanced optical system with LED excitation source, and data analysis software. Continuing the tradition of has a touch screen so plates and analytics can be started with the touch of a finger.
– Gene expression analysis – New genotyping/HRM capability – mRNA quantification – NGS quantification: library preparation, result
validation – Can use self-Installable optical cartridges – Operates at a Cq uniformity standard deviation of
<0,20 at fast cycling (5 s at 95 °C / 10 s at 60 °C) – Data acquisition time of <3 s/plate – Dynamic range of nine orders of magnitude – Operates at a maximum altitude of 2000 m and in
20 to 80% relative humidity
The system design combines a state-of-the-art thermal cycler, an advanced optical system with an LED excitation source, and complete data analysis software.
Feature Description
Excitation source 8 dye-specific LEDs per optical module
Detection source 8 photo diodes
Optical cartridges SYBR/FAM; HEX; ROX; CY3; CY5; ATT0425. 6 slots, swappable optical modules
Dye selection Excitation and emission
Reaction volume 10 to 30 µl
Chemistries supported SYBR, Probe, HRM
Thermal system 6 Peltiers made from 2 ceramic plates with semi-conductor elements, 96-well
Thermal system temperature range 25,0 - 99,9 °C
Heating 6,0 °C/s
Cooling 3,0 °C/s (median), 2,5 °C/s (average)
Accuracy ±0,2 °C or better at typical annealing, amplification and denaturation temperatures
Dynamic range 9
Experimental types Quantitative PCR with dye. Quantitative PCR with probe. Allele discrimination with HRM, Allele discrimination with probe. Comparative quantitation. User defined.
Uniformity ±0,4 °C
Data acquisition time <3 s for all
Cq uniformity Cq St Dev <0,20 at fast cycling (5s 95 °C/10 s 60 °C)
– Upgradeable filter system with up to six user-installable filters
– Touch screen for easy set-up – Network capable – Access from any computer in the lab – Unlimited software installs – 96-well block: 10 - 30 µl/rxn – Ultra-fast cycling: ~40 min experiments – Software extras: HRM, electronic tracking – Onboard diagnostics: Worry-free operation

FIGURE 1: Sample quality is determined based on the ΔΔCq between the sample and the reference. Briefly, amplification of two differentially sized amplicons is assessed. The ΔCq of the sample is the difference between the Cq of amplicon B (123 bp) and the Cq of amplicon A (42 bp). The quality score or ΔΔCq is then calculated as the difference between the ΔCq of the sample and the ΔCq of the reference. Quantitation, on the other hand, is based on the Cq of amplicon A alone.
80 bioMarke - Focusing on Life Science | 2021 | vwr.com
Next generation sequencing, formalin-fixed, paraffin-embedded quality control with AgilentOVERVIEWFormalin-fixed, paraffin-embedded (FFPE) tissue represents a valuable sample source for molecular cancer research. These samples, which number in the hundreds of millions, provide a contextual snapshot of the tissue at a specific time point and stage of normal biology or disease. With today’s high resolution technologies, such as next generation sequencing, greater information content may be extracted from these samples, including signals from low frequency alleles that could easily be missed or dismissed as artefact. There are challenges in processing FFPE samples for this type of analysis. DNA derived from FFPE is often highly fragmented, cross-linked with protein, and has a high proportion of single-stranded DNA. These features of FFPE DNA make it challenging for adapter ligation and amplification, steps that are critical for successful preparation of sequencing libraries, impacting the overall library complexity, and in turn, decreasing the sensitivity of variant calling and increasing the rate of false negatives.
ACCURATE QUALIFICATION & QUANTITATION OF AMPLIFIABLE DNAThe Agilent NGS FFPE QC kit is a qPCR-based assay that enables functional DNA quality assessment of input DNA prior to preparation of next generation sequencing libraries and can be run using the Agilent AriaMx qPCR system. This kit enables assessment of the integrity of DNA as well as accurate quantitation of amplifiable template going into library preparation. Sample integrity is assessed using two primer pairs that generate differently sized amplicons, a 42 and a 123 bp. This difference in amplicon size allows for discrimination between samples that have sufficient intact amplifiable DNA and those that have a higher degree of fragmentation, effectively eliminating the need for agarose gel electrophoresis. In addition, since the assay is qPCR-based, functionality of the FFPE DNA as template for PCR is also assessed, allowing for the increased probability of successful preparation of next generation sequencing libraries (Figure 1).
OPTIMISED LOW INPUT LIBRARY PREP WORKFLOW FOR IMPROVED COMPLEXITY & TARGET COVERAGESample pre-qualification is not sufficient to increase the probability of successful preparation of sequencing libraries. To maximise the information output from FFPE samples, SureSelectXT protocols have been optimised, providing specific recommendations on amplification of pre-capture libraries, as well as the amount of sequencing to allocate per library based on the sample quality. These modifications ensure that there is sufficient representation of the molecules present in the starting sample going into the hybridisation step, which is critical to efficient enrichment of the targets. In addition, once these targets are enriched, the recommendations on sequencing depth should enable enough reads to ensure deep target coverage whether the starting sample is of higher or lower quality, for sensitive and accurate variantdetection (Figure 2).

FIGURE 2: The Agilent NGS FFPE QC protocol provides recommendations to optimise preparation of enriched libraries for sequencing based on the quality score (ΔΔCq). Optimisations for lower quality FFPE samples include increasing amplification cycles for the pre-capture library to ensure sufficient template molecules are introduced into the hybridisation and increasing sequencing depth to enable better target coverage.
vwr.com | 2021 | bioMarke - Focusing on Life Science 81
COMPLETE CANCER RESEARCH SOLUTIONS FROM SAMPLE TO DATAOptimised workflows are critical to providing comprehensive variant detection and reduced turnaround time from sample to data. The Agilent NGS FFPE QC kit fits perfectly into the ‘sample to sequencing’ workflow for FFPE samples along with the Agilent AriaMx qPCR system, Absolutely RNA FFPE purification kits and the Agilent qPCR NGS Library Quantification Kit.
Description Size Cat. No.
Agilent NGS FFPE QC Kit 16 reaction AGLSG9700A96 reaction AGLSG9700B
Related productsAria Real-Time PCR system Base unit AGLSG8830A-010FAM/SYBR filter 1a AGLSG8830-67001ROX filter 1 AGLSG8830-67002HEX filter 1 AGLSG8830-67003Cy3 filter 1 AGLSG8830-67004Cy5 filter 1 AGLSG8830-67005ATTO 425 filter 1 AGLSG8830-67006Absolutely RNA FFPE purification kit 50 reaction AGLSG400809Absolutely RNA FFPE purification kit (without deparaffinisation reagents) 50 reaction AGLSG400811qPCR NGS Library Quantification kit for Illumina 400 reaction AGLSG44
VWR Collection Thermal Cycler XT96
Inside the new VWR® PCR Thermal Cycler XT96, a lot of new innovative features are in place.
DISCOVER THE NEW XT96
VIDEO

FIGURE 1: Assessing effect of 8 different annealing temperatures on PCR product yield and specificity via agarose gel electrophoresis.
M 56 57 58 59 60 61 62 63
vwr.com | 2021 | bioMarke - Focusing on Life Science 83
Establishing PCRs successfully - how advanced gradient thermal cycler technology will help to achieve efficient and robust amplification
INTRODUCTIONThe importance of PCR protocol optimisation is obvious, not only during a pandemic, when there is high pressure to develop effective qPCR diagnostic kits. To achieve reliable results, emphasis is put on using high quality reagents, consumables and instruments, also primer sequences are selected carefully. Still a PCR might fail resulting in either no detectable or unspecific amplification. To succeed in establishing PCRs that robustly perform within a wider scope of template quality and quantity, optimisation of the PCR temperature protocol is crucial. Probably most important in this context is the determination of the optimal annealing temperature.
CALCULATING ANNEALING TEMPERATURE TA
Identifying an annealing temperature (Ta) that will probably work isn’t too complicated. As a common rule Ta should be about 3 to 6 °C lower than the melting temperature (Tm) of the primers 1,2 which defines the temperature at which 50% of complementary DNA strands will be dissociated. Tm depends on primer length and composition (see info box for design recommendations) and it can be calculated by rather simple equations [e.g. Tm = 2 °C * (A+T) + 4 °C * (G+C)] or more precise algorithms based on thermodynamics 3, 4.
Also, modern PCR instruments like the VWR family of thermal cyclers are equipped with software tools to calculate Tm reasonably accurately.
GENERAL RECOMMENDATIONS FOR PCR PRIMER DESIGN
– Primer length 18 to 30 bases – GC content 40 to 60% – 3' end of a primer G or C to ensure binding – ∆Tm of both primers ≤4 °C – Tm 60 to 75 °C – No ≥4 runs of one base – No relevant (≥3 bases) of intra- and inter-primer
homology to avoid self-annealing/primer dimers, especially at 3‘ end
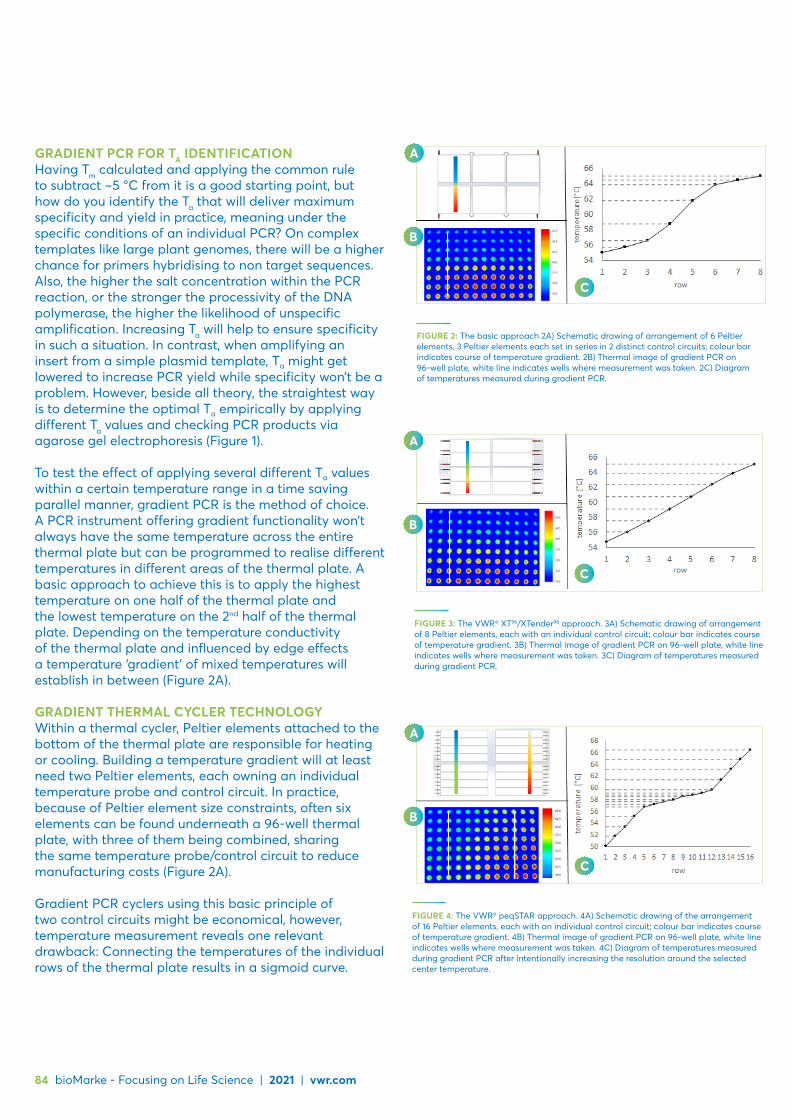
FIGURE 4: The VWR® peqSTAR approach. 4A) Schematic drawing of the arrangement of 16 Peltier elements, each with an individual control circuit; colour bar indicates course of temperature gradient. 4B) Thermal image of gradient PCR on 96-well plate, white line indicates wells where measurement was taken. 4C) Diagram of temperatures measured during gradient PCR after intentionally increasing the resolution around the selected center temperature.
A
B
C
84 bioMarke - Focusing on Life Science | 2021 | vwr.com
GRADIENT PCR FOR TA IDENTIFICATIONHaving Tm calculated and applying the common rule to subtract ~5 °C from it is a good starting point, but how do you identify the Ta that will deliver maximum specificity and yield in practice, meaning under the specific conditions of an individual PCR? On complex templates like large plant genomes, there will be a higher chance for primers hybridising to non target sequences. Also, the higher the salt concentration within the PCR reaction, or the stronger the processivity of the DNA polymerase, the higher the likelihood of unspecific amplification. Increasing Ta will help to ensure specificity in such a situation. In contrast, when amplifying an insert from a simple plasmid template, Ta might get lowered to increase PCR yield while specificity won’t be a problem. However, beside all theory, the straightest way is to determine the optimal Ta empirically by applying different Ta values and checking PCR products via agarose gel electrophoresis (Figure 1).
To test the effect of applying several different Ta values within a certain temperature range in a time saving parallel manner, gradient PCR is the method of choice. A PCR instrument offering gradient functionality won’t always have the same temperature across the entire thermal plate but can be programmed to realise different temperatures in different areas of the thermal plate. A basic approach to achieve this is to apply the highest temperature on one half of the thermal plate and the lowest temperature on the 2nd half of the thermal plate. Depending on the temperature conductivity of the thermal plate and influenced by edge effects a temperature ‘gradient’ of mixed temperatures will establish in between (Figure 2A).
GRADIENT THERMAL CYCLER TECHNOLOGY Within a thermal cycler, Peltier elements attached to the bottom of the thermal plate are responsible for heating or cooling. Building a temperature gradient will at least need two Peltier elements, each owning an individual temperature probe and control circuit. In practice, because of Peltier element size constraints, often six elements can be found underneath a 96-well thermal plate, with three of them being combined, sharing the same temperature probe/control circuit to reduce manufacturing costs (Figure 2A).
Gradient PCR cyclers using this basic principle of two control circuits might be economical, however, temperature measurement reveals one relevant drawback: Connecting the temperatures of the individual rows of the thermal plate results in a sigmoid curve.
FIGURE 2: The basic approach 2A) Schematic drawing of arrangement of 6 Peltier elements, 3 Peltier elements each set in series in 2 distinct control circuits; colour bar indicates course of temperature gradient. 2B) Thermal image of gradient PCR on 96-well plate, white line indicates wells where measurement was taken. 2C) Diagram of temperatures measured during gradient PCR.
A
B
C
FIGURE 3: The VWR® XT96/XTender96 approach. 3A) Schematic drawing of arrangement of 8 Peltier elements, each with an individual control circuit; colour bar indicates course of temperature gradient. 3B) Thermal image of gradient PCR on 96-well plate, white line indicates wells where measurement was taken. 3C) Diagram of temperatures measured during gradient PCR.
A
B
C
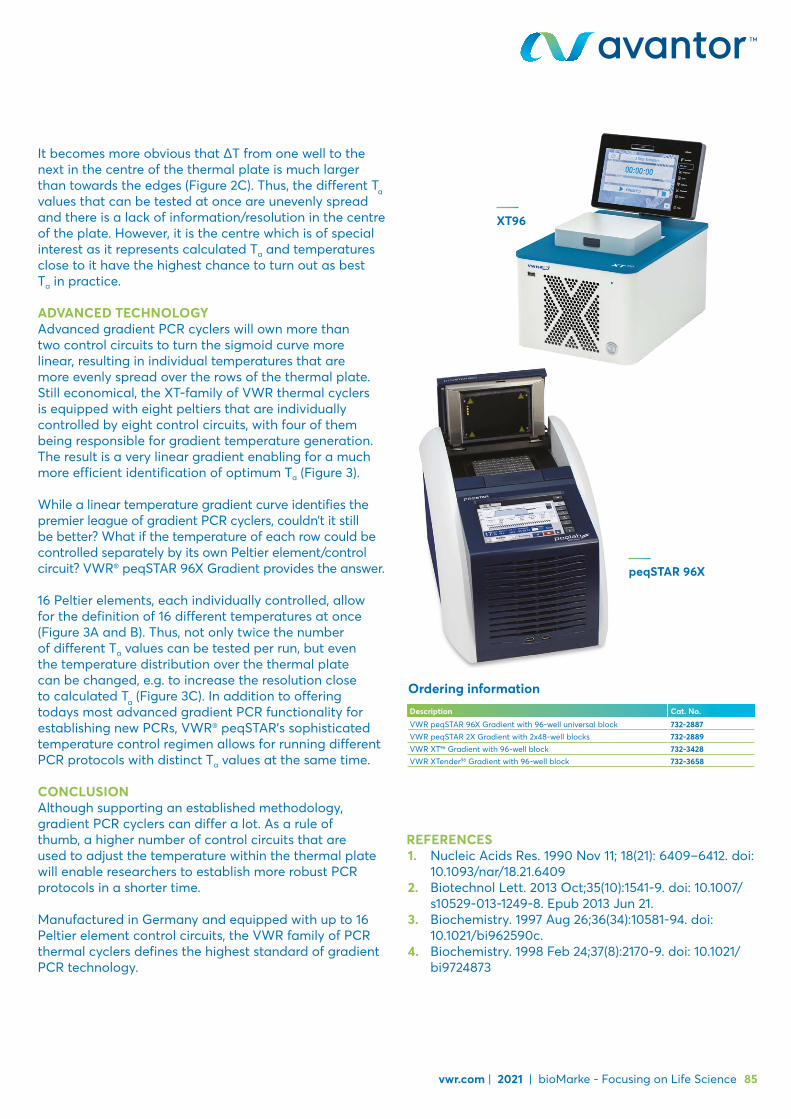
XT96
peqSTAR 96X
vwr.com | 2021 | bioMarke - Focusing on Life Science 85
It becomes more obvious that ∆T from one well to the next in the centre of the thermal plate is much larger than towards the edges (Figure 2C). Thus, the different Ta values that can be tested at once are unevenly spread and there is a lack of information/resolution in the centre of the plate. However, it is the centre which is of special interest as it represents calculated Ta and temperatures close to it have the highest chance to turn out as best Ta in practice.
ADVANCED TECHNOLOGYAdvanced gradient PCR cyclers will own more than two control circuits to turn the sigmoid curve more linear, resulting in individual temperatures that are more evenly spread over the rows of the thermal plate. Still economical, the XT-family of VWR thermal cyclers is equipped with eight peltiers that are individually controlled by eight control circuits, with four of them being responsible for gradient temperature generation. The result is a very linear gradient enabling for a much more efficient identification of optimum Ta (Figure 3).
While a linear temperature gradient curve identifies the premier league of gradient PCR cyclers, couldn’t it still be better? What if the temperature of each row could be controlled separately by its own Peltier element/control circuit? VWR® peqSTAR 96X Gradient provides the answer. 16 Peltier elements, each individually controlled, allow for the definition of 16 different temperatures at once (Figure 3A and B). Thus, not only twice the number of different Ta values can be tested per run, but even the temperature distribution over the thermal plate can be changed, e.g. to increase the resolution close to calculated Ta (Figure 3C). In addition to offering todays most advanced gradient PCR functionality for establishing new PCRs, VWR® peqSTAR's sophisticated temperature control regimen allows for running different PCR protocols with distinct Ta values at the same time.
CONCLUSIONAlthough supporting an established methodology, gradient PCR cyclers can differ a lot. As a rule of thumb, a higher number of control circuits that are used to adjust the temperature within the thermal plate will enable researchers to establish more robust PCR protocols in a shorter time.
Manufactured in Germany and equipped with up to 16 Peltier element control circuits, the VWR family of PCR thermal cyclers defines the highest standard of gradient PCR technology.
REFERENCES1. Nucleic Acids Res. 1990 Nov 11; 18(21): 6409–6412. doi:
10.1093/nar/18.21.64092. Biotechnol Lett. 2013 Oct;35(10):1541-9. doi: 10.1007/
s10529-013-1249-8. Epub 2013 Jun 21.3. Biochemistry. 1997 Aug 26;36(34):10581-94. doi:
10.1021/bi962590c.4. Biochemistry. 1998 Feb 24;37(8):2170-9. doi: 10.1021/
bi9724873
Description Cat. No.
VWR peqSTAR 96X Gradient with 96-well universal block 732-2887VWR peqSTAR 2X Gradient with 2x48-well blocks 732-2889VWR XT96 Gradient with 96-well block 732-3428VWR XTender96 Gradient with 96-well block 732-3658
Ordering information

PCR consumablesGood quality at reasonable price? Easy to find at vwr.com. Will it fit your application or PCR instrument? Use these selector tools!
Click here to select PCR tubes and strips
Click here to search for PCR plates

vwr.com | 2021 | bioMarke - Focusing on Life Science 87
Highly concentrated Taq DNA Polymerase Glycerol Free for diagnostic applicationsThe newly launched VWR Taq DNA Polymerase Glycerol Free 50 U/µl is a highly concentrated formulation of the VWR Taq DNA Polymerase Glycerol Free 5 U/µl, which has been available for several years.
Recently, the requirements from kit manufacturers and PCR testing facilities for more highly concentrated DNA polymerases have increased. This is primarily due to the need for massive amounts of diagnostic master mixes for detection of, for example, SARS-CoV-2. Furthermore, testing laboratories all around the world tend to have increased their PCR testing activities dramatically. Larger amounts of Taq DNA polymerase and PCR master mixes are, therefore, a necessity.
The highly concentrated VWR Taq DNA Polymerase Glycerol Free 50 U/µl allows for concentrated bulk
production of PCR master mixes. Concentrated bulks in glycerol-free formats are attractive when using automated pipetting robots and other applications where accurate pipetting of small volumes is crucial. Furthermore, concentrated master mixes are easier to lyophilize due to the reduced volume of the concentrated mix. Lyophilized amplification mixtures are often included in commercial PCR kits for diagnostic purposes, such as detection of pathogens, diseases and gene expression assays.
Stability of the Taq DNA Polymerase Glycerol Free is crucial; therefore, a stability study was performed.

FIGURE 1: Schematic illustration of the applied freeze-thaw protocol.
FIGURE 2: A. Freeze-thaw test. The amplification plots show the sample curves in purple, 100% activity in yellow and the rest of the standard series in black. The rectangle depicts the area where the curves are in the linear range. The right part of the Figure 2A. shows an enlargement of the depicted area of the amplification plots. B. The bars depict the estimated activity of Taq DNA Polymerase Glycerol Free after 0, 40 and 50 freeze-thaw cycles, respectively.
Product Size* Cat. No.
Taq DNA Polymerase Glycerol Free 50 U/µl
25 000 Units 733-2873250 000 Units 733-28742 000 000 Units 733-2875
Taq DNA Polymerase Glycerol Free 5 U/µl
1 000 Units 733-1817*5 000 Units 733-1999200 000 Units 733-2038
* With 10x Key buffer + 10x Extra Buffer
Storage conditionsLong-term storage at -20 °C. Storage at +4 °C for 6 months.
Applications:
– Lyophilization of PCR mixes – Kit manufacturing – Automation – HTP assays
– Detection of pathogens – DNA target detection – Gene expression analysis
88 bioMarke - Focusing on Life Science | 2021 | vwr.com
HIGH STABILITY OF VWR TAQ DNA POLYMERASE GLYCEROL FREE ESTIMATED BY A FREEZE-THAW STUDYTo verify the high stability of VWR Taq DNA Polymerase Glycerol Free during freezing and thawing, a freeze-thaw study was performed by applying 50 freeze-thaw cycles. Figure 1. The polymerase activity after 40 and 50 freeze-thaw cycles, respectively, was measured using Real-Time PCR amplification and compared to a standard curve.
Samples of VWR Taq DNA Polymerase Glycerol Free were thawed at 30 °C for 7 minutes, shortly vortexed, spun down, incubated at room temperature and then placed on ice. 30 minutes after the start of thawing, samples were placed at -20 °C for at least 1 hour before the cycle was repeated.
Initially, one sample was kept at -20 °C without any freeze-thawing to serve as reference for 100% activity and to prepare the standard series. At 40 and 50 cycles, the samples were collected and stored at -20 °C until analysis.
The samples were then diluted to a concentration, where the amount of Taq polymerase was limiting, thereby allowing the ability to monitor changes in enzyme activity. Starting with the same dilution, a standard curve for Taq DNA Polymerase activity was prepared from the sample without freeze-thaw cycles. The amplification plots for samples representing of freeze-thaw cycles; 0, 40 and 50 are shown Figure 2A. In Figure 2B the
estimated activity of DNA polymerase is plotted against numbers of freeze-thaw cycles; 0, 40 and 50, respectively.
CONCLUSIONVWR Taq DNA Polymerase Glycerol Free was exposed to very harsh conditions by exposing it to 50 freeze-thaw cycles. Even after 50 cycles the polymerase retained 90% of its activity. The estimated activity after 40 freeze-thaw cycles was slightly below 100% activity, indicating just a minor decrease in activity. These results clearly show that VWR Taq DNA Polymerase Glycerol Free is highly stable.
A B

FIGURE 1: Schematic illustration of the applied freeze-thaw protocol.
CLICK TO DOWNLOAD YOUR COPY
VWR® for PCR
Don't miss our great of PCR cyclers, workstations, consumables, reagents and complementary equipment!
Innovations and essentials for your PCR workflow.

VENDING
‒ Fully integrated ‒ Cost control down to user level ‒ Reducing costs ‒ 24/7 availability
MOBILE SCANNING
‒ Android & iOS ‒ Supports “bring your own device” strategy
‒ Inventory at your fingertips
360° DEG VISIBILITY
‒ Voice recognition driven search ‒ Walking time to nearest point-of-use stockroom
‒ Countertop deliveries
ENTERPRISE-LEVEL SCANNING
‒ Offline & online data collection ‒ Laser-sharp scanning technology ‒ Enterprise-level lean scanning methodology
RFID SELF-CHECKOUT
‒ Realtime inventory ‒ User friendly technology ‒ Lean cycle counting ‒ 24/7 availability
CHEMICAL MANAGER
‒ Fully integrated add-on module ‒ Container level tracking ‒ Regulatory compliance & reporting ‒ Full visibility ‒ End-to-end chemical tracking
INVENTORY MANAGER
‒ Optimised materials management solution ‒ Reduced overhead & waste ‒ Lean logistic flows ‒ Absolute control ‒ Automated procurement flows
INVENTORY MANAGER
Efficient inventory management system provides customers with:
— The supplies you need when and where you want them — A single, vendor agnostic solution for all your supplies — Minimised inventory investment — Reduced waste from expiration of materials or obsolescence
Avantor’s Inventory Manager helps optimise your lab operationsOur proprietary, cloud-based, global inventory management tool is designed for customers to use to manage the consumption and replenishment of their consumable inventory.
To learn more, visit:avantorsciences.com/digital-solutions
90 bioMarke - Focusing on Life Science | 2021 | vwr.com

From scientific discovery to scale-up and commercial delivery, you need mission-critical products, services and solutions on a global scale.
Avantor® offers global access to our own portfolio of trusted, quality brands and critical products through our premier delivery platform, VWR®. All of this, combined with infrastructure strategically located to help serve your specific needs, helps move science forward – fast. That’s science delivered.
Get the mission-critical scientific products and solutions you need from Avantor, delivered through VWR.
vwr.com/science-delivered
vwr.com | 2021 | bioMarke - Focusing on Life Science 91
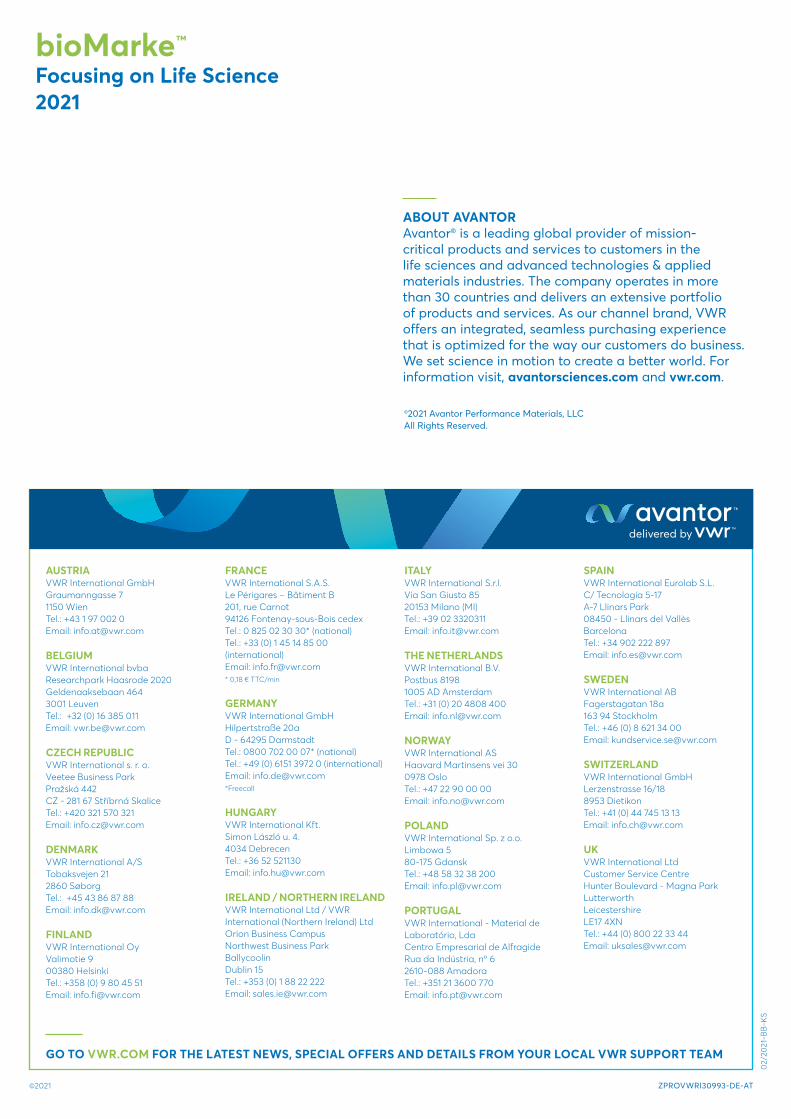
bioMarke™
Focusing on Life Science2021
FRANCE VWR International S.A.S. Le Périgares – Bâtiment B 201, rue Carnot 94126 Fontenay-sous-Bois cedex Tel.: 0 825 02 30 30* (national) Tel.: +33 (0) 1 45 14 85 00 (international) Email: [email protected] * 0,18 € TTC/min
GERMANY VWR International GmbH Hilpertstraße 20a D - 64295 Darmstadt Tel.: 0800 702 00 07* (national) Tel.: +49 (0) 6151 3972 0 (international) Email: [email protected] *Freecall
HUNGARY VWR International Kft. Simon László u. 4. 4034 Debrecen Tel.: +36 52 521130 Email: [email protected]
IRELAND / NORTHERN IRELAND VWR International Ltd / VWR International (Northern Ireland) Ltd Orion Business Campus Northwest Business Park Ballycoolin Dublin 15 Tel.: +353 (0) 1 88 22 222 Email: [email protected]
AUSTRIA VWR International GmbH Graumanngasse 7 1150 Wien Tel.: +43 1 97 002 0 Email: [email protected]
BELGIUM VWR International bvba Researchpark Haasrode 2020 Geldenaaksebaan 464 3001 Leuven Tel.: +32 (0) 16 385 011 Email: [email protected]
CZECH REPUBLIC VWR International s. r. o. Veetee Business Park Pražská 442 CZ - 281 67 Stříbrná Skalice Tel.: +420 321 570 321 Email: [email protected]
DENMARK VWR International A/S Tobaksvejen 21 2860 Søborg Tel.: +45 43 86 87 88 Email: [email protected]
FINLAND VWR International Oy Valimotie 9 00380 Helsinki Tel.: +358 (0) 9 80 45 51 Email: [email protected]
ITALY VWR International S.r.l. Via San Giusto 85 20153 Milano (MI) Tel.: +39 02 3320311 Email: [email protected]
THE NETHERLANDS VWR International B.V. Postbus 8198 1005 AD Amsterdam Tel.: +31 (0) 20 4808 400 Email: [email protected]
NORWAY VWR International AS Haavard Martinsens vei 30 0978 Oslo Tel.: +47 22 90 00 00 Email: [email protected]
POLAND VWR International Sp. z o.o. Limbowa 5 80-175 Gdansk Tel.: +48 58 32 38 200 Email: [email protected]
PORTUGAL VWR International - Material de Laboratório, Lda Centro Empresarial de Alfragide Rua da Indústria, nº 6 2610-088 Amadora Tel.: +351 21 3600 770 Email: [email protected]
SPAIN VWR International Eurolab S.L. C/ Tecnología 5-17 A-7 Llinars Park 08450 - Llinars del Vallès Barcelona Tel.: +34 902 222 897 Email: [email protected]
SWEDEN VWR International AB Fagerstagatan 18a 163 94 Stockholm Tel.: +46 (0) 8 621 34 00 Email: [email protected]
SWITZERLAND VWR International GmbH Lerzenstrasse 16/18 8953 Dietikon Tel.: +41 (0) 44 745 13 13 Email: [email protected]
UK VWR International Ltd Customer Service Centre Hunter Boulevard - Magna Park Lutterworth Leicestershire LE17 4XN Tel.: +44 (0) 800 22 33 44 Email: [email protected]
©2021 ZPROVWRI30993-DE-AT
02/2
021-
BB
-KS
ABOUT AVANTORAvantor® is a leading global provider of mission-critical products and services to customers in the life sciences and advanced technologies & applied materials industries. The company operates in more than 30 countries and delivers an extensive portfolio of products and services. As our channel brand, VWR offers an integrated, seamless purchasing experience that is optimized for the way our customers do business. We set science in motion to create a better world. For information visit, avantorsciences.com and vwr.com.
©2021 Avantor Performance Materials, LLCAll Rights Reserved.
GO TO VWR.COM FOR THE LATEST NEWS, SPECIAL OFFERS AND DETAILS FROM YOUR LOCAL VWR SUPPORT TEAM
Related Documents